Coordination Between Fission Yeast Glucan Formation and Growth Requires a Sphingolipase Activity

Food Chemistry 138 (2013) 630–637
Contents lists available at SciVerse ScienceDirect
Food Chemistry
journal homepage: www.elsevier .com/locate / foodchem
Phase behaviour of oat b-glucan/sodium caseinate mixtures varying inmolecular weight
Jacob K. Agbenorhevi a, Vassilis Kontogiorgos a,⇑, Stefan Kasapis b
a Department of Chemical and Biological Sciences, University of Huddersfield, Queensgate, Huddersfield HD1 3DH, UKb School of Applied Sciences, RMIT University, City Campus, Melbourne, Vic 3001, Australia
a r t i c l e i n f o a b s t r a c t
Article history:Received 30 May 2012Received in revised form 2 September 2012Accepted 2 October 2012Available online 12 November 2012
Keywords:b-GlucanPhase separationMixed systemsSodium caseinateRheology
0308-8146/$ - see front matter � 2012 Elsevier Ltd. Ahttp://dx.doi.org/10.1016/j.foodchem.2012.10.073
⇑ Corresponding author. Tel.: +44 1484 472488; faxE-mail address: [email protected] (V. Kon
The isothermal phase behaviour at 5 �C of mixtures of sodium caseinate and oat b-glucan isolates varyingin molecular weight (MW) was investigated by means of phase diagram construction, rheometry, fluores-cence microscopy and electrophoresis. Phase diagrams indicated that the compatibility of the b-glucan/sodium caseinate system increases as b-glucan MW decreases. Images of mixtures taken at various bio-polymer concentrations revealed phase separated domains. Results also revealed that at the state of ther-modynamic equilibrium, lower MW samples yielded considerable viscosity in the mixture. At equivalenthydrodynamic volume of b-glucan in the mixtures, samples varying in molecular weight exhibited sim-ilar flow behaviour. A deviation dependent on the protein concentration was observed for the high MWsample in the concentrated regime due to the size of b-glucan aggregates formed. Results demonstratethat by controlling the structural features of b-glucan in mixtures with sodium caseinate, informedmanipulation of rheological properties in these systems can be achieved.
� 2012 Elsevier Ltd. All rights reserved.
1. Introduction
The phase behaviour of protein–polysaccharide mixtures con-tributes significantly to the stability, structural, rheological andtextural characteristics of food products. It is well established inthe literature that phase separation depends on the molecularcharacteristics of biopolymers. The interplay of parameters suchas molecular weight, chain conformation and charge density aswell as the mixing conditions (biopolymer concentration and mix-ing ratio, temperature, cooling rate) and solvent pH and ionicstrength will determine the thermodynamics of phase separation(de Kruif & Tuinier, 2001; Doublier, Garnier, Renard, & Sanchez,2000; Perez, Carrara, Sanchez, Rodríguez Patino, & Santiago,2009; Schmitt, Sanchez, Desobry-Banon, & Hardy, 1998; Syrbe,Bauer, & Klostermeyer, 1998; Tolstoguzov, 2003; Turgeon, Beau-lieu, Schmitt, & Sanchez, 2003).
Mixed linkage (1?3)(1?4)-b-D-glucans found in cereals (oats,barley, rye and wheat) have received significant consumer and re-search attention because of their health benefits, including lower-ing cholesterol levels and glycaemic index response. b-Glucans arelinear cell wall homopolysaccharides of consecutively linked(1?4)-b-D-glucosyl units that are separated by single (1?3)bonds. The structure, molecular weight and concentration of b-glu-cans are known to influence their physical and functional proper-
ll rights reserved.
: +44 1484 472182.togiorgos).
ties in solution or when used as ingredients in variousformulated food products. These parameters as well as their phys-ical properties, applications and physiological effects have beendiscussed previously in detail (Brennan & Cleary, 2005; Lazaridou& Biliaderis, 2007; Lazaridou, Biliaderis, & Izydorczyk, 2003; Wood,2007).
Approval of oat b-glucans as functional bioactive ingredientshas stimulated new product development activity over the years(Brennan & Cleary, 2005). Incorporation of b-glucans into milk ordairy products presents a potential application of this polysaccha-ride as a delivery method so as to provide the associated healthbenefits to consumers. However, the required amount (P0.75 gper serving) for health claims, makes it difficult in the developmentof food formulations as b-glucans exhibit thermodynamic incom-patibility when mixed with milk proteins that results in phase sep-aration (Kontogiorgos, Tosh, & Wood, 2009a, 2009b; Lazaridou &Biliaderis, 2009). It is important, therefore, to understand the phasebehaviour of b-glucans with food proteins before we attempt tomake products with desired rheological properties.
Determination of phase diagrams is often employed to describethe thermodynamic compatibility of mixed biopolymer systems. Inour previous study, the phase behaviour of mixtures of b-glucanwith whey proteins under different solvent conditions was investi-gated and it was shown that a decrease of pH from 7.0 to 3.0 andsucrose addition enhanced miscibility (Kontogiorgos et al., 2009b).
The present work, builds on our previous investigation assess-ing the effect of b-glucan molecular weight in mixtures with casein

J.K. Agbenorhevi et al. / Food Chemistry 138 (2013) 630–637 631
proteins. The molecular weight and nature of biopolymers (caseinsas opposed to our previous work with whey proteins) is expectedto influence the extent of miscibility and concentration levels atwhich phase separation occurs.
This study, therefore, aims to investigate the phase behaviourand morphology of mixtures of sodium caseinate with b-glucanisolates varying in molecular weight by means of phase diagramconstruction, rheometry, electrophoresis and fluorescencemicroscopy.
2. Materials and methods
2.1. Materials and sample preparation
Sodium caseinate (90% w/w protein, 6.1% moisture, 3.7% ash,0.1% lactose), fluorescent brightener-28, rhodamine B, sodiumazide (NaN3) and trifluoroacetic acid (TFA) were purchased fromSigma–Aldrich (Poole, Dorset, UK).
The initial b-glucan isolate (denoted as OBG) was obtained byaqueous extraction from oat flour and three samples of lowermolecular weights (H05, H10 and H15) were produced from theinitial isolate by controlled acid hydrolysis and characterised as de-scribed previously in detail (Agbenorhevi, Kontogiorgos, Kirby,Morris, & Tosh, 2011). The b-glucan samples, OBG, H05, H10 andH15 had molecular weights of 2800 � 103, 252 � 103, 172 � 103
and 142 � 103 g mol�1, respectively.Stock dispersions of sodium caseinate (14% w/v) and b-glucans
(1.0% w/v OBG, 1.2 % w/v H05, 1.8 % w/v H10, 1.8 % H15) weremade using 0.1 M Sorensen’s phosphate buffer (pH 7.0) with0.02% w/v sodium azide as preservative. Sodium caseinate was dis-persed under mild heating at 40 �C in the buffer solution whereasb-glucan was dispersed at 90 �C in a sealed vial under continuousstirring for 3 h. The concentration of b-glucan stock solutions dif-fers because of the maximum concentration that could be preparedwith each isolate. Stock solutions were subsequently treated andmixed at different volume ratios as described previously (Kontog-iorgos et al., 2009b).
2.2. Phase analysis and phase diagram construction
The sodium caseinate/b-glucan mixtures were centrifuged(Alergra X-15R, Beckman Coulter, Inc.) at 3000g for 30 min at5 �C until equilibrium phase separation was reached as evidencedby the constant composition of the phases. The resulting equilib-rium phase was analysed for protein and b-glucan content.
The protein content was determined according to the Bradfordprotein assay (Bradford, 1976). The b-glucan concentration wasdetermined using a modified phenol–sulphuric acid method forphase-diagram construction (Agbenorhevi & Kontogiorgos, 2010).Briefly, 0.2 ml TFA was added in 5 ml of diluted mixtures and vor-texed immediately to precipitate the proteins out of solution. Theresulting mixture was left to stand for 40 min at room temperatureand immediately centrifuged at 6000g for 10 min. An aliquot of thesupernatant was taken and a phenol–sulphuric acid method wasthen carried out to determine the total polysaccharide concentra-tion. All mixtures were replicated at least twice and the biopoly-mer concentration in the phases was analysed in triplicates. Thisyields six replicates for each of the equilibrium phases analysedand average values are reported.
After the equilibrium phase analysis for biopolymer concentra-tion, values obtained were used to determine the phase diagram. Itis important to note that, after centrifugation the resulting mixturewas made up of one single liquid phase and a biopolymer precipi-tate. The liquid layer was analysed for biopolymer concentrationand used to determine the phase diagram. It was not possible to
determine tie lines, as systems did not yield two distinct liquidphases (a protein and polysaccharide enriched, respectively).GraphPadPrism v.5 (GraphPad Software, San Diego, USA) was usedto create the final binodal curve performing non-linear regressionon the experimental data by fitting a hyperbolic function of theform y = 1/xb. Statistical significance tests were performed on SPSS(v. 20, IBM SPSS Statistics, USA) at a = 0.05.
2.3. Viscosity measurements
The flow behaviour of the mixed systems was determined at20 �C using a Bohlin Gemini 200HR-nano rotational rheometer(Malvern Instruments, Malvern, UK) equipped with cone-and-plategeometry (55 mm diameter, cone angle 2o). The flow curves weremeasured at shear rate range of 0.01–1000 s�1 on freshly preparedsamples. Statistical significance tests were performed on SPSS (v.20, IBM SPSS Statistics, US) at a = 0.05.
2.4. Fluorescence microscopy
Fluorescence microscopy observations were carried out onfreshly prepared b-glucan/sodium caseinate mixtures pre-stainedwith fluorescent brightener-28 (0.01% w/v) and rhodamine B(0.02% w/v) using the procedure and equipment as reported previ-ously (Agbenorhevi & Kontogiorgos, 2010).
2.5. Gel electrophoresis
All chemical reagents (MES SDS buffer kit) and gels (NuPAGE�
Novex 12% Bis-Tris Gel 1.0 mm, 10 well) used for SDS–PAGE anal-ysis were purchased from Invitrogen Ltd. (Paisley, UK). Stock solu-tions of each pure casein subunit (a-, b-, j-casein), sodiumcaseinate and the various mixtures of sodium caseinate and b-glu-cans were prepared using a phosphate buffer pH 7.0 as in all otherexperiments. Sample solution (5 ll), NuPAGE� LDS sample buffer(5 ll, 4�), NuPAGE� reducing agent (2 ll, 10�) and deionisedwater (8 ll) were vortex-mixed and heated at 70 �C for 10 min.
Electrophoresis was performed using the XCell SureLock™ Mini-Cell (Invitrogen Ltd., Paisley, UK) according to the NuPAGE� Bis-Tris Mini Gel protocol. A continuous buffer system (prepared byadding 50 ml of 20� NuPAGE MES SDS running buffer to 950 mlof deionised water) was used. The various treated samples, stan-dards and the protein molecular weight markers were then loaded(10 ll) into separate wells of the gel and electrophoresis was runfor 35 min at 200 V. The Novex� Sharp Protein Standard pre-stained molecular weight marker was used comprising a mix ofproteins ranging from 3.5 to 260 kDa. After the electrophoresiswas completed, gels were stained using SimplyBlue™ Safe-Stain.
3. Results and discussion
3.1. Phase diagram and morphology of mixed systems
To investigate the concentration levels at which b-glucan of dif-ferent molecular weight in mixtures with sodium caseinate mayexhibit compatibility (co-solubility) or incompatibility (phase-sep-aration), phase diagrams were determined (Fig. 1) following theanalytical determination of the biopolymer concentrations in theequilibrium phase at 5 �C. The solid curve represents the binodal,which demarcates the compatible (one phase) from the incompat-ible (two phase) region. Thus the area below the binodal shows theconcentration levels at which the b-glucan/sodium caseinatemixtures are at equilibrium (i.e., stable) whereas the area abovethe binodal represents the concentration zones where phaseseparation occurs. Therefore, the results clearly indicate that the

0
2
4
6
8
10
12
0 0.2 0.4 0.6 0.8 1 1.2
Sodi
um C
asei
nate
(%
w/v
)
β - Glucan (% w/v)
OBG (2800)
H05 (252)
H10 (172)
H15 (142)
Sample (MW x 103 g mol -1)
Fig. 1. Phase diagram of binary mixtures of sodium caseinate and b-glucans varyingin molecular weight (MW). Solid line represents the binodal, which sets theboundaries of the compatible (below the curve) from the incompatible (above thecurve) regimes. Compatibility increases significantly (p < 0.05) with decreasingMW.
632 J.K. Agbenorhevi et al. / Food Chemistry 138 (2013) 630–637
compatibility region increases significantly as the molecularweight of b-glucan decreases in the order of OBG < H05 <H10 < H15 that shows that the molecular weight of b-glucan sam-ples has a remarkable effect on miscibility with casein proteins.
Polymer thermodynamics allow for qualitative explanationof the observed phase separation in terms of reduced entropy ofmixing. The general relationship that describes the free energy ofmixing (DGm) is given by (Sperling, 2006):
SAMPLE PROTEIN RICH PHASE
BICONTINUOUS PHASE
OBG
H05
H10
H15
Fig. 2. Typical microstructure of b-glucan/sodium caseinate mixtures at different regionsglucan only and (b) protein (sodium caseinate) only. Scale bar: 100 lm.
DGm ¼ DHm � TDSm ð1Þ
where DHm is the enthalpy of mixing and DSm the entropy of mix-ing. In the equilibrium phase of the mixtures DGm is negative lead-ing to miscibility whereas in the two-phase regime is positive andthe mixtures phase-separate. As all b-glucan samples used hereare structurally similar (glucose homopolymers) the energetic com-ponent (DHm) of equation 1 should not play dominant role on thefree energy at equivalent biopolymer concentrations. Therefore,the phase separation should be attributed to changes in the MWof b-glucans, as is the only parameter that is modified in the mix-tures. Increase of the degree of polymerisation reduces the entropyof mixing and the entropic contribution to the free energy (�TDSm)becomes negligible (Rubinstein & Colby, 2003; Sperling, 2006).
Since the experiments were performed at neutral pH, and b-glu-can is a neutral polysaccharide, variation in the thermodynamiccompatibility with sodium caseinate as a function of molecularweight could be explained by the excluded volume effect. Highmolecular weight b-glucan yields a large excluded volume, whichis inaccessible to sodium caseinate thus reducing the entropy ofmixing. In contrast, low molecular weight samples have increasedmolecular flexibility and reduced hydrodynamic volume therebycreating free volume for the protein molecules even at relativelyhigh b-glucan concentrations, resulting in extensive thermody-namic compatibility. In other words, the smaller molecular sizeof b-glucan chains in the system gives rise to increased entropyof mixing and consequently enhance the mixing stability (Doublieret al., 2000; Semenova, 2007; Syrbe et al., 1998; Tolstoguzov,1997). Furthermore, changes in MW influence the morphology ofb-glucan (Agbenorhevi et al., 2011) that may also play a significantrole on the phase separation behaviour. b-Glucan aggregation mayresult in density changes leading to further discrepancies from thetheory as it is usually assumed to be equal for the polymers in themixture (Lloyd, 2007). To seek for further evidence on the mecha-nism of phase separation of the systems in the present work, the
POLYSACCHARIDERICH PHASE
SINGLE PHASES
of the phase diagram in the out of equilibrium mixtures (above the binodal). (a) b-

kDa
16011080
605040
30
20
15
10
3.5
MW
M
aker
EqN
aCas
-OB
G
Mixed system
EqN
aCas
-H05
EqN
aCas
- H10
EqN
aCas
-H15
Equilibrium phase
Na-
Cas
NaC
as-O
BG
NaC
as-H
05
NaC
as-H
10
NaC
as-H
15
kDa(a)
(b)
160
11080
605040
30
20
15
10
3.5
MW
m
aker
1 - 0
.1
Na
-Cas
1 - 0
.2NaCas OBG (% w/v)
Equilibrium phase
2 -0
.1
2 -0
.3
2 - 0
.2
2 -0
.4
1 -0
.3
1 -0
.4
Fig. 3. Typical electrophoretic patterns of sodium caseinate/b-glucan mixtures (a) at different biopolymer concentrations and (b) different molecular weight b-glucansamples and constant protein concentration. Electrophoresis was performed under reducing conditions and NaCas denotes sodium caseinate. The symbols indicate the bandsrepresenting the various caseins: � unreduced disulphide linked casein aggregates/contaminants; s as2-casein; d as1-casein, 4 b-casein; j j-casein.
J.K. Agbenorhevi et al. / Food Chemistry 138 (2013) 630–637 633
morphology of the mixtures was probed by fluorescencemicroscopy.
Single b-glucan solutions exhibited spots of intense fluores-cence that were distributed evenly throughout the sample(Fig. 2a). On the other hand, single sodium caseinate solutionsdid not show any distinct attributes at all concentrations studied
(Fig. 2b). Fig. 2 shows images of morphology at various concentra-tion regimes (Fig. 1) typical of phase-separated biopolymer mix-tures (Fig. 2). Morphology varied depending on the concentrationand molecular weight of the biopolymers in the mixture. In theprotein-rich phase, b-glucans appear as droplets whereas in thebicontinuous regime, droplets apparently increase in number espe-

0.001
0.01
0.1
1
10(a)
(b)
0.01 0.1 1 10 100 1000
η(P
a s)
Shear rate (s-1)
Protein only (14 % w/v)
OBG only (1.0 % w/v)
65%PR-35%OBG
50%PR-50%OBG
40%PR-60%OBG
25%PR-75%OBG
Eq65%PR-35%OBG
Eq50%PR-50%OBG
Eq40%PR-60%OBG
Eq25%PR-75%OBG
0.001
0.01
0.1
1
10
0.01 0.1 1 10 100 1000
η(P
a s)
Shear rate (s-1)
H10 only (1.8%)
Protein only (14%)
80% PR - 20% H10
65% PR - 35% H10
50% PR - 50% H10
25% PR - 75% H10
Eq 80% PR - 20% H10
Eq 65% PR - 35% H10
Eq 50% PR - 50% H10
Eq 25% PR - 75% H10
Fig. 4. Flow curve of b-glucan/sodium caseinate mixtures at different biopolymer concentrations: (a) mixtures of OBG and (b) mixtures with H10. Percentage valuesrepresent the mixing ratio of the stock solutions. PR: Protein, Eq denotes the mixtures at equilibrium phase. Viscosity of mixtures differs significantly (p < 0.05) as a functionof biopolymer concentration. Mixture at equilibrium phase had significantly lower viscosity (p < 0.05) than that after mixing.
634 J.K. Agbenorhevi et al. / Food Chemistry 138 (2013) 630–637
cially for the lower molecular weight samples. In the polysaccha-ride-rich phase, b-glucan aggregates become more pronounced insize and irregularity especially for the higher molecular weightmaterials. As it can be clearly seen, there is a remarkable changein the morphology of the mixtures with decreasing b-glucanmolecular weight. High MW sample (OBG) shows distinct mor-phology from the low MW counterparts in the bicontinuous andpolysaccharide-continuous regime. Such morphology suggests thatapart from the thermodynamic considerations outlined above, thestate of aggregation should also influence the phase behaviour ofthe mixtures through density differences. It should be stressed thatthe present images were taken in freshly prepared out of equilib-rium mixtures. Therefore, kinetic considerations of b-glucanaggregation should be also regarded as it has been previouslyshown to influence phase separation in b-glucan/whey proteinmixtures varying in MW (Kontogiorgos et al., 2009a). Finally, dif-ferent b-glucan samples at equivalent concentration levels becomemore dispersed in the protein domain, form small droplets andachieve homogeneity in the equilibrium phase as MW decreases(Fig. 2).
The present results suggest that the mechanism of phase sepa-ration in these systems should be attributed to entropy changes asb-glucan MW changes as well as to the extent of polysaccharideaggregation. In order to investigate if changes of b-glucan MW alterprotein composition in the equilibrium phases, therefore, affectingthe overall thermodynamics of demixing, electrophoretic observa-tions were carried out to examine the distribution of proteins inthe respective phases.
3.2. Electrophoretic observations
Electrophoretic patterns of sodium caseinate revealed the pres-ence of all casein subunits (a-, b-, and j-casein) between �20 and�30 kDa (Fig. 3) when compared with the standards and as previ-ously reported in literature (Macierzanka et al., 2011). However,high molecular weight protein bands around 60 kDa and the faintbands around 80 kDa are probably due to unreduced disulphidelinked casein aggregates or contaminants something that has alsobeen previously observed (Macierzanka et al., 2011). Keeping b-glucan concentration constant while varying the sodium caseinateconcentration, showed that the bands become more prominent forthe respective mixtures with higher protein concentration. How-ever, by holding constant sodium caseinate concentration, butvarying the concentration of b-glucan, did not reveal any signifi-cant differences in electrophoretic patterns of the protein compo-sitions (Fig. 3a).
Therefore, changing b-glucan concentration does not influencethe protein composition while the experimental conditions (pH,temperature, etc.) are maintained. Furthermore, at the same con-centration levels of biopolymers in the mixture, but different b-glucan MW the electrophoretic patterns of both mixed systemand equilibrium phase were similar (Fig. 3b). This reveals thatvarying the MW of b-glucans in the mixture does not induce anysignificant changes to the composition of the proteins under theexperimental conditions used. Furthermore, it is probable thatthe centrifugation of the mixtures did not cause any significantprecipitation of the protein subunits since the resulting equilib-
0.001
0.01
0.1
1
0.01 0.1 1 10 100 1000
η(P
a s)
Shear rate (s-1)
5% PRO - 0.8% OBG
5% PRO - 0.4% OBG
5% PRO - 0.8% H05
5% PRO - 0.4% H05
5% PRO - 0.8% H10
5% PRO - 0.4% H10
5% PRO - 0.8% H15
5% PRO - 0.4% H15
5% PROTEIN ONLY
0.001
0.01
0.1
1
0.01 0.1 1 10 100 1000
η(P
a s)
Shear rate (s-1)
Eq 5% PRO - 0.8% OBG
Eq 5% PRO - 0.4% OBG
Eq 5% PRO - 0.8% H05
Eq 5% PRO - 0.4% H05
Eq 5% PRO - 0.8% H10
Eq 5% PRO - 0.4% H10
Eq 5% PRO - 0.8% H15
Eq 5% PRO - 0.4% H15
(a)
(b)
Fig. 5. Flow behaviour of mixed systems at same protein (PRO) level with varying concentration and MW of b-glucan samples (OBG, H05, H10, H15). (a) After mixing;viscosity increases with increasing MW and concentration of b-glucan after mixing (p < 0.05). (b) Equilibrium phase after centrifugation. ‘‘Eq’’ denotes the mixtures atequilibrium phase. At equilibrium phase, comparable samples with lower MW had higher viscosity (p < 0.05).
J.K. Agbenorhevi et al. / Food Chemistry 138 (2013) 630–637 635
rium phase exhibited similar bands as the initial mixed state. Pres-ent results reveal similarities in phase behaviour with those of aprevious study involving high molecular weight b-glucan(�1.3 � 106 g mol�1) and whey proteins (Kontogiorgos et al.,2009b). Electrophoretic profiles showed that whey proteins (a-lactalbumin, b-lactoglobulin) also do not precipitate selectively atpH 7.0. Addition of sucrose and changes in the polysaccharide con-centration did not induce any observable differences in the electro-phoretic patterns of the system. However, for the system at pH 3.0,it was shown that the concentration of a-lactalbumin and bovineserum albumin decreased in the upper phase in comparison to thatof pH 7.0 showing the remarkable influence of pH on the propertiesof mixtures. Changes in protein composition and conformationwere reported to partly account for increased miscibility at pH3.0 due to a decrease in excluded volume of the protein component(Kontogiorgos et al., 2009b). Changing pH is also expected to play arole on the phase behaviour of the present mixture as a result ofconformational changes of caseinate. However, electrophoreticpatterns under the present conditions show evidence that thephase separation mechanism of the mixed systems is dominatedby modifications in the b-glucan MW. It is clear that changes inpolysaccharide MW will play important role on the flow behaviourof the mixed systems that is discussed in the next section.
3.3. Flow behaviour of mixtures
The viscosity of sodium caseinate solutions, increases as theconcentration increases, with the flow behaviour being mainlyNewtonian at all shear rates for the concentrations (0.1–14% w/v)studied. For b-glucan solutions, viscosity also rises with increasing
concentration, and at equivalent concentration levels, viscositywas higher for the higher molecular weight samples (Agbenorheviet al., 2011). In the sodium caseinate/b-glucan mixed systems,however, the viscosity also varied depending on the concentrationof the two biopolymers. Fig. 4 shows typical flow curves of the b-glucan/sodium caseinate mixtures at different biopolymer concen-trations. In the protein-rich phase, the flow behaviour was mainlyinfluenced by the sodium caseinate whereas in the polysaccharide-rich phase, the flow behaviour was largely determined by b-glucan.
At intermediate biopolymer concentrations, a mixed flow pat-tern was evident as previously reported (Kontogiorgos et al.,2009b). Noticeably, the flow pattern remains the same but the vis-cosity of the binary mixtures at equilibrium (one-phase regime)was lower than that after mixing (two-phase regime) when thesystem was under kinetic control. This is because centrifugationcaused some protein and polysaccharide to precipitate resultingin less total biopolymer concentration in the final one-phase sys-tem, hence yielding lower viscosity. As confirmed by the micro-scopic images, mixed systems at equilibrium have finer b-glucanaggregates present, which influence the flow behaviour.
At the same protein concentration in the mixtures, the viscosityincreases with increasing MW and concentration of b-glucans(Fig. 5). This is attributed to the higher entanglement of the mole-cules and larger aggregates formation as the MW increases. How-ever, it was interesting to note that at equilibrium comparingsimilar levels in mixture, the lower MW samples yielded identicalor higher viscosity. This is also in agreement with the microscopicobservations as the lower MW samples were more dispersed in theprotein domain with smaller aggregates, hence achieving betterhomogeneity in the equilibrium phase. In other words, centrifuga-

0.001
0.01
0.1
1(a)
(b)
0.01 0.1 1 10 100 1000
η(P
a s)
Shear rate (s-1)
5% PRO -0.42% OBG
5% PRO - 1.43% H05
5% PRO - 1.67% H10
5% PRO - 1.76% H15
5% PROTEIN ONLY
0.001
0.01
0.1
1
0.01 0.1 1 10 100 1000
η(P
a s)
Shear rate (s-1)
Eq 5% PR0 - 0.42% OBG
Eq 5% PRO - 1.43% H05
Eq 5% PRO - 1.67% H10
Eq 5% PRO - 1.76% H15
5% PROTEIN ONLY
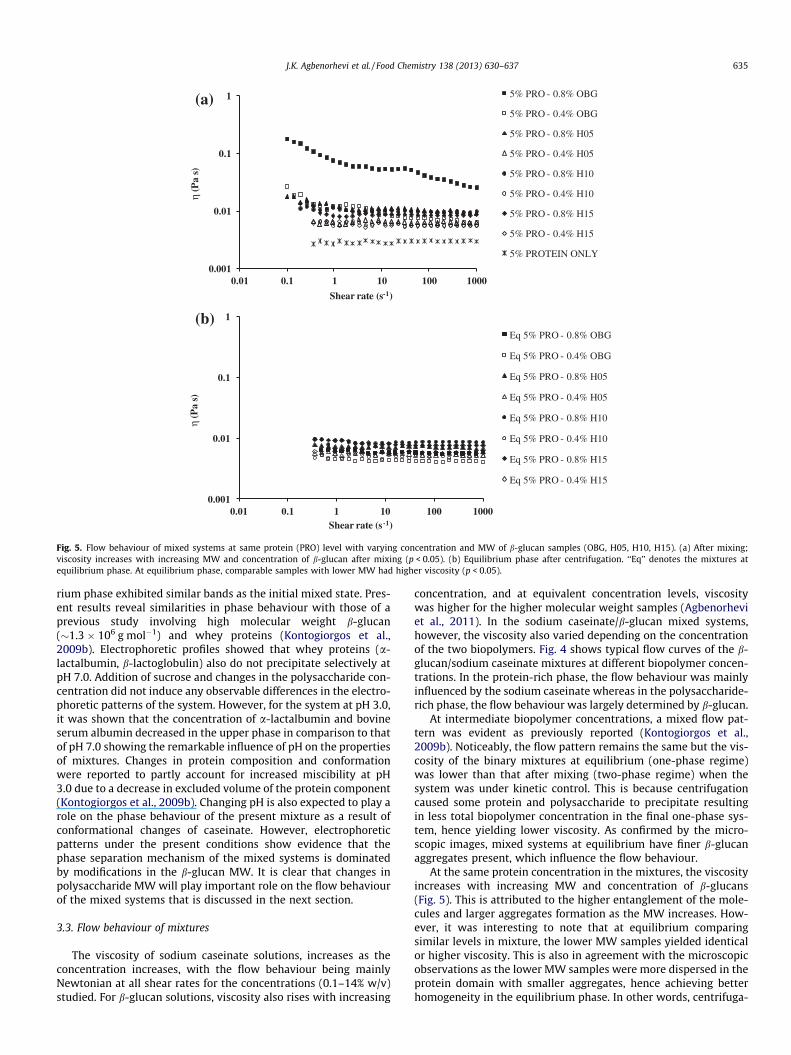
Fig. 6. The flow curve of mixtures of sodium caseinate (PRO) and b-glucan isolates (OBG, H05, H10, H15) at concentration levels of equivalent hydrodynamic volume, c[g] = 3.(a) After mixing, (b) equilibrium phase after centrifugation. ‘‘Eq’’ denotes the mixtures at equilibrium phase. Viscosity of the mixtures with lower MW b-glucan (H15, H10,H05) was significantly higher (p < 0.05) in comparison to those with high MW b-glucan (OBG).
636 J.K. Agbenorhevi et al. / Food Chemistry 138 (2013) 630–637
tion caused more aggregates of higher MW b-glucans to sedimentout resulting in a lower viscosity.
Apart from the general phenomenology of viscosity of the vari-ous mixtures, a more fundamental approach would be to investi-gate the mixtures at the same hydrodynamic volume of thepolysaccharide, as MW itself will not determine viscosity any long-er. Such a treatment will reveal if there is any specific structure–function relationship on the mechanism that b-glucan influencethe viscosity of the mixtures.
3.4. Effect of hydrodynamic volume
From our previous study, intrinsic viscosity ([g]) values of sam-ples OBG, H05, H10 and H15 are known to be 7.2, 2.1, 1.8 and1.7 dL g�1, respectively (Agbenorhevi et al., 2011). As shown inFig. 5, the viscosity of the mixed system was also higher for thehigher molecular weight samples (OBG > H05 > H10 > H15) at thesame concentration levels. Therefore, the flow behaviour wasinvestigated at the same hydrodynamic volume (the volume ofthe hydrated polymer coil in solution) to ascertain whether a sim-ilar trend is observed. In order to create b-glucan solutions ofequivalent hydrodynamic volume, the coil overlap parameter(c[g]) was used that is the product of intrinsic viscosity and con-centration and serves as an index of the total degree of volumeoccupied by the polymer in solution. The experiments were there-fore performed at concentration levels of the b-glucan that yieldequivalent hydrodynamic volume.
At the concentration levels in mixture with sodium caseinatewhere c[g] = 1 (i.e., at the same hydrodynamic volume where theconcentration is below their respective critical concentration (c⁄)(c < c⁄ for each b-glucan sample), the viscosity was similar at all
shear rates for all the samples despite the variation in molecularweight. However, when the hydrodynamic volume was increasedto c[g] = 3 (i.e., at c > c⁄), the viscosity of the out of equilibriummixtures showed an equivalent increase for the lower molecularweight samples (H05, H10 and H15) that exhibited Newtonianflow (Fig. 6a). The results for the low MW samples are in agree-ment with our previous rheological characterisation of pure b-glu-can solutions (Agbenorhevi et al., 2011) that showed increase ofspecific viscosity, which is independent of the molecular weightof b-glucan, a typical behaviour of disordered polysaccharides.However, departure from this behaviour was observed with thehigh MW sample (OBG) that showed distinct pseudoplastic behav-iour at the same c[g] as the low MW counterparts. These deviationsin flow patterns can be attributed to the formation of b-glucanaggregates that increases with increasing molecular weight, whichalso correlates with the morphology of pure b-glucan solutions aspreviously examined by atomic force microscopy (Agbenorheviet al., 2011). Furthermore, the equilibrium mixtures showed an ex-pected decrease in viscosity (Fig. 6b) as the polysaccharide is dis-tributed to the phases after centrifugation thus lowering itsoverall concentration.
As the size of the macromolecules and their aggregates change,the viscosity of the mixed systems is influenced differently. Underforce of deformation or shear stress, the larger aggregates progres-sively breakdown with increasing shear rate and hence account forthe exhibited shear thinning behaviour. It can, therefore, be statedthat the aggregate size and morphology was mainly responsible forthe variation in the rheological deviation of the mixtures contain-ing high MW b-glucans. That was the case even at constant proteinconcentration and equivalent hydrodynamic volume of b-glucansof different molecular weights. It is interesting to note that by

J.K. Agbenorhevi et al. / Food Chemistry 138 (2013) 630–637 637
keeping the hydrodynamic volume of b-glucan constant while theprotein concentration varies, results in greater viscosity as proteinconcentration increases. For instance, the viscosity of mixture with5% w/v protein was higher than that with 2.5% w/v protein, otherthings being equal (not shown). This suggests a synergistic contri-bution of the concentration of both biopolymers on the flowbehaviour of the mixed system. Thus, the higher concentration ofsodium caseinate and b-glucan, the more viscous the resultingmixture reflecting limited mobility of the biopolymer components.
The present report highlights that viscosity of b-glucan/sodiumcaseinate mixtures is largely independent of polysaccharide partic-ularly when is kept low below �300 � 103 g mol�1. Such an obser-vation may have significant technological implications in creatingnovel food formulations. This indicates that utilisation of oat b-glu-cans with a specific MW is not crucial as long as the hydrodynamicvolume is kept to the desired technologically important value. Suchan approach should help meet the recommended amount requiredfor health claims of a product while still achieving suitable bulkingeffect.
4. Conclusion
The isothermal phase behaviour at 5 �C of mixtures of sodiumcaseinate with oat b-glucan isolates varying in molecular weightwas investigated. Results showed distinct phase behaviour withvariable biopolymer concentration in mixtures. Phase diagramsdocumented that with decreasing MW of the b-glucan component,thermodynamic compatibility with sodium caseinate increases.Images of the mixtures taken at various biopolymer concentrationsrevealed phase separation in the presence of b-glucan aggregates,whose size depends on MW and concentration. Electrophoreticseparation of the mixtures did not reveal significant differenceamong the samples varying in concentration and MW of b-glucansthat indicates no significant precipitation of the protein compo-nents under the experimental conditions studied.
At equivalent hydrodynamic volume of the b-glucan componentin the mixture, all the samples exhibited similar flow behaviour. Adeviation dependent on the protein concentration was observedfor the very high MW sample in the concentrated regime due tothe size of the b-glucan aggregates formed. The study shows thatit is possible to maximise thermodynamic compatibility andachieve comparable flow behaviour of the b-glucan/sodium casei-nate mixed system by using lower MW b-glucan samples and con-trolling the hydrodynamic volume of the polysaccharide.
Acknowledgements
We are very grateful to Dr. Tim Foster for his useful suggestions.
References
Agbenorhevi, J. K., & Kontogiorgos, V. (2010). Polysaccharide determination inprotein/polysaccharide mixtures for phase diagram construction. CarbohydratePolymers, 81, 849–854.
Agbenorhevi, J. K., Kontogiorgos, V., Kirby, A. R., Morris, V. J., & Tosh, S. M. (2011).Rheological and microstructural investigation of oat-glucan isolates varying inmolecular weight. International Journal of Biological Macromolecules, 49,369–377.
Bradford, M. M. (1976). A rapid and sensitive method for the quantitation ofmicrogram quantities of protein utilizing the principle of protein–dye binding.Analytical Biochemistry, 72, 248–254.
Brennan, C. S., & Cleary, L. J. (2005). The potential use of cereal (1?3, 1?4)-b-D-glucans as functional food ingredients. Journal of Cereal Science, 42, 1–13.
de Kruif, C. G., & Tuinier, R. (2001). Polysaccharide protein interactions. FoodHydrocolloids, 15, 555–563.
Doublier, J.-L., Garnier, C., Renard, D., & Sanchez, C. (2000). Protein–polysaccharideinteractions. Current Opinion in Colloid and Interface Science, 5, 202–214.
Kontogiorgos, V., Tosh, S. M., & Wood, P. J. (2009a). Kinetics of phase separation ofoat-glucan/whey protein isolate binary mixtures. Food Biophysics, 4, 240–247.
Kontogiorgos, V., Tosh, S. M., & Wood, P. J. (2009b). Phase behaviour of highmolecular weight oat b-glucan/whey protein isolate binary mixtures. FoodHydrocolloids, 23, 949–956.
Lazaridou, A., & Biliaderis, C. G. (2007). Molecular aspects of cereal b-glucanfunctionality: Physical properties technological applications and physiologicaleffects. Journal of Cereal Science, 46, 101–118.
Lazaridou, A., & Biliaderis, C. G. (2009). Concurrent phase separation and gelation inmixed oat b-glucans/sodium caseinate and oat b-glucans/pullulan aqueousdispersions. Food Hydrocolloids, 23, 886–895.
Lazaridou, A., Biliaderis, C. G., & Izydorczyk, M. S. (2003). Molecular size effects onrheological properties of oat b-glucans in solution and gels. Food Hydrocolloids,17, 693–712.
Lloyd, M. R. (2007). Polymer blends: A comprehensive review. Munich: HanserGardner Publications.
Macierzanka, A., Bordron, F., Rigby, N. M., Mills, E. N. C., Lille, M., Poutanen, K., &Mackie, A. R. (2011). Transglutaminase cross-linking kinetics of sodiumcaseinate is changed after emulsification. Food Hydrocolloids, 25, 843–850.
Perez, A. A., Carrara, C. R., Sanchez, C. C., Rodríguez Patino, J. M., & Santiago, L. G.(2009). Interactions between milk whey protein and polysaccharide in solution.Food Chemistry, 116, 104–113.
Rubinstein, M., & Colby, R. H. (2003). Polymer physics. New York: Oxford UniversityPress Inc..
Schmitt, C., Sanchez, C., Desobry-Banon, S., & Hardy, J. (1998). Structure andtechnofunctional properties of protein–polysaccharide complexes: A review.Critical Reviews in Food Science and Nutrition, 38, 689–753.
Semenova, M. G. (2007). Thermodynamic analysis of the impact of molecularinteractions on the functionality of food biopolymers in solution and in colloidalsystems. Food Hydrocolloids, 21, 23–45.
Sperling, L. H. (2006). Introduction to physical polymer science (4th ed.). New Jersey:John Willet & Sons, Inc..
Syrbe, A., Bauer, W. J., & Klostermeyer, H. (1998). Polymer science concepts in dairysystems – An overview of milk protein and food hydrocolloid interaction.International Dairy Journal, 8, 179–193.
Tolstoguzov, V. B. (2003). Some thermodynamic considerations in food formulation.Food Hydrocolloids, 17, 1–23.
Tolstoguzov, V. (1997). Protein–polysaccharide interactions. In S. Damodaran & A.Paraf (Eds.), Food proteins and their applications (pp. 171–198). New York:Marcel Dekker, Inc..
Turgeon, S. L., Beaulieu, M., Schmitt, C., & Sanchez, C. (2003). Protein–polysaccharide interactions: Phase-ordering kinetics, thermodynamic andstructural aspects. Current Opinion in Colloid and Interface Science, 8, 401–414.
Wood, P. J. (2007). Cereal b-glucans in diet and health. Journal of Cereal Science, 46,230–238.
Copyright © 2022 FDOKUMEN