Textural characteristics, surface chemistry and activation of bleaching earth: A review
Upload
independentCategory
view
1download
0
1
Effects of roasting on barley β-glucan, thermal, textural and pasting properties 1
Paras Sharma1, Hardeep Singh Gujral 1* and Cristina M Rosell 2 2 1 Department of Food Science and Technology, Guru Nanak dev University, 3
Amritsar-143005, India. 4 2 Food Science Department, Institute of Agrochemistry and Food Technology 5
(IATA-CSIC), Valencia, Spain 6
*Corresponding author: Email: [email protected] 7
8
9

2
Abstract 10
Different hulled barley cultivars were subjected to roasting in hot sand (280ºC) and 11
the effects on β-glucan solubility, physicochemical, thermal and pasting properties were 12
studied. Grain hardness, bulk density, L/B ratio and thousand kernel weight were 13
significantly lowered upon roasting. The geometric mean diameter significantly increased, 14
the CIE L* a* b* colour values a* and b* significantly increased while L* and ∆E were 15
significantly decreased. The roasted barley flour had significantly higher water absorption, 16
water solubility and oil absorption capacity. The cultivars DWR-28 and RD-2508 had the 17
highest total β-glucan content and roasting affected in different extent the total β-glucan 18
content and extractability depending on the cultivars. Roasting significantly increased the 19
insoluble β-glucan with a concomitant decrease in the amount of soluble ß-glucan. In 20
addition, roasting significantly affected the pasting and thermal properties of the flours, 21
together with an increase in the damage starch content. Therefore, roasting induces large 22
variations in the ratio soluble to insoluble β-glucan content and also in the physical 23
characteristics of a range of hulled barley cultivars. 24
Keywords: Barley, β-glucan, Damage starch, roasting 25
1. Introduction 26
Barley (Hordeum vulgare L.) is an ancient and important cereal grain and occupies 27
about 9.4% of the total area under cereal production (FAO, 2007). The predominant type of 28
cultivated barley is hulled, having a tough fibrous husk, which is used as a malting and 29
brewing grain. The other type is the hulless or naked barley in which the hull is easily 30
removed during threshing similar to wheat. In the Western world, barley has been mainly 31
used for feed and alcohol production. However, its high content in dietary fiber has 32
motivated the interest in increasing the consumption of barley based foods. The use of 33
barley as a human food should be encouraged because it has one of the highest levels (2-34
10%) of β-glucan. The β-glucans behave as a peculiar fiber because are present in both 35
soluble and insoluble forms and around 54% of total β-glucan is soluble in water and 36
classified as soluble fiber (Anker-Nilssen et al., 2008). Therefore, ß-glucans have the health 37
benefits associated to insoluble fibers like ability to relieve constipation. Soluble ß-glucans 38
are recognized as healthy polymers due to their benefits in cholesterol lowering and 39
glycemic index reduction, effects that are beneficial in the prevention and management of 40
3
various diet related diseases, such as diabetes and cardiovascular disease (Jenkins et al., 41
2000). 42
A simple way of increasing the consumption of barley is by including barley in food 43
products with attractive sensory characteristics. However, the physiological effect of the 44
food supplemented with barley largely depends on the barley variety and the processing 45
treatments applied to the grains (Izydorczyk et al., 2000). Roasting is a simple and 46
convenient process that uses dry heat for short periods of time for improving grain 47
characteristics. Roasted grains exhibit improved texture, enhanced crispiness and volume 48
due to puffing (Hoke et al, 2007). Roasting also improves colour, extends shelf life, 49
enhances flavor and reduces the antinutrient factors of cereals and legumes (Gahalawat and 50
Sehgal, 1992). Moreover, roasting of grains leads to the gelatinization of starch and 51
denaturation of proteins thus improve the digestibility of cereals and legumes (Caldwell et 52
al, 2000). However, no information is available about the effect of roasting on thermal, 53
textural and pasting properties of barley and its effect on the ß-glucan content and the ratio 54
of the two types of ß-glucans. 55
56
It is likely that the thermal treatment of the barley grains modifies the characteristics 57
of the starches and the content and properties of the ß-glucans, which have great influence 58
in determining the utilization of barley for food purposes. The objectives of the present 59
investigation were to empirically investigate the changes during roasting of barley grains, 60
regarding the changes in physico-chemical, textural, pasting and thermal properties of 61
common hulled barley cultivars. Special attention was paid to the variation in total, soluble 62
and insoluble β-glucan content upon roasting hulled barley from different cultivars. 63
64
2. Material and methods 65
Common hulled barley cultivars (PL-172, PL-426, RD-2503, RD-2508, RD-2035, RD-66
2052, RD-2552 (six rowed) and DWR-28 (two rowed) were procured from Central State 67
Seed Farm, Sriganganagar, Rajasthan, India. All chemicals used were of analytical grade, 68
β-glucan and starch damage assay kit were provided by Megazyme International, Ireland 69
and Termamyl 120L (Thermostable α-amylase) was procured from Novozyme, Denmark. 70
4
Each test was performed in triplicates on dry weight basis. The Milli Q water (Millipore, 71
France) was used in all analytical tests. 72
2.1 Roasting of barley: 73
Hulled barley (400g) at a moisture content of 10% was roasted in hot sand at 280±5°C 74
for 20 seconds. Roasted barley after cooling was dehusked in a rice polisher (Paras and 75
Gujral, 2009) and ground in the Newport Super Mill (Newport, Australia) to pass through 76
60 (BSS) sieve to obtain roasted barley flour. 77
2.2 Physical characteristics barley: 78
The bulk density expressed as gram per liter (g/l) was evaluated by measuring the 79
weight of known volume of control and roasted barley sample. Length, breadth and width 80
of control and roasted grains were measured by the help of Vernier-caliper. 81
Puffing index = bulk density of control/ bulk density of roasted barley. 82
Geometric mean diameter (GMD) of control and roasted samples were measured using 83
Vernier Caliper. Geometric mean of the spatial dimensions (length, breadth and thickness) 84
was calculated as equivalent diameter = (L x B x T)1/3 85
2.3 Hardness of control and roasted grains 86
The hardness of the dehusked grain (control and roasted) was determined on a 87
texture analyzer (Model TA-HDi Stable Microsystem, Surrey, U.K). The barley grains 88
(control and roasted) were compressed 1mm using a probe with 25mm diameter. A 50 kg 89
load cell was used and the pre, post test and test speeds were 1.5, 10 and 1mm sec-1, 90
respectively. 91
2.4 Colour of flour 92
Colour measurement of flour was carried using a Hunter Colorimeter fitted with optical 93
sensor (Hunter Associates Laboratory Inc. Restan VA., USA ) on the basis of CIE L*, a*, 94
b* colour system. The colour difference (∆E) was calculated as: 95
∆E = [(∆ L*) + (∆ a*) + (∆ b*)] ½ 96
2.5 Water absorption capacity, water solubility index and oil absorption 97
Water absorption capacity of flour (control and roasted) was measured by the 98
centrifugation method of Anderson et al. (1969). Flour (3 g) was dispersed in 25 ml of 99
distilled water taken in pre-weighed centrifuge tubes. The dispersion was stirred for 10 min 100
followed by centrifugation for 25 min at 3000g. The supernatant was collected by allowing 101
5
the tube to stand inverted for 10 min. The supernatant obtained was dried in hot air oven for 102
24 h at 105ºC. The results were expressed as % water solubility index. 103
The oil absorption capacity was determined according to method of Lin et al. (1974). 104
Flour (0.5g) was mixed with 10 ml of refined oil (Soybean Refined Oil, Fortune brand, 105
India) in pre-weighed centrifugal tube and vortexed for 10 min. The tubes were centrifuged 106
for 25 min at 3000g. The oil was drained off by inverting for 10 min and centrifuge tubes 107
were weighed. 108
2.6 Quantification of total, insoluble and soluble β-glucan 109
The total, insoluble and soluble β-glucan was quantified according to the method 110
reported by McCleary and Glennie (1985) using ‘β-glucan assay kit’ (Megazyme 111
International Ireland Ltd.,Wicklow, Ireland). For mixed linkage total β-glucan, flour (0.5g 112
on dry weight) was taken in polypropylene tubes and 1ml of ethanol (50% v/v) was added 113
followed by sodium phosphate buffer (5ml, 20mM, pH 6.5) and mixed well with the help 114
of vortex mixer. The tubes were incubated in boiling water bath and cooled to 40°C. 115
Enzyme, lichenase (10U) was added, tubes were incubated for 1 h at 40°C with 116
intermediate vortex mixing. The volume of each tube was adjusted to 30 ml with water, the 117
content of tubes was mixed thoroughly, and centrifuged at 1000g for 10 min. Aliquot 118
(0.1ml), was transferred in three test tubes. Sodium acetate buffer (0.1 ml, 50mM, pH 4.0) 119
was added to one of these tubes (reaction blank) and in rest two tubes 0.2U β-glucosidase 120
was added and incubated at 40°C for 15 min. After incubation, 3.0 ml glucose oxidase 121
proxidase determine reagent was added in all tubes and incubated at 40°C for 20 min. The 122
absorbance was noticed at 510 nm by spectrophotometer (Shimadzu, UV-2450, Kyoto, 123
Japan). Standard glucose solution was used as standard and calculation carried out. 124
For determination of water soluble β-glucan flour was suspended in 10 ml aqueous 125
ethanol (80% v/v) and incubated in steam water bath for 5 min to inactivate enzymes. After 126
cooling the tubes to room temperature, centrifugation was done at 12000g for 10 min and 127
ethanol drained off. The pellet was suspended in 10 ml water and incubated at 65°C for 30 128
min, followed by centrifugation at 6000g for 10 min. The supernatant was recovered and 129
pellet was further extracted with 10 ml and ultimately with 5 ml water. The supernatant 130
obtained in each step were pooled and estimated for soluble β-glucan as described by 131
McCleary and Glennie (1985). The β-glucan in residues was defined as insoluble β-glucan. 132
6
2.7 β- glucan extractability 133
Extraction of β-glucan was carried out as reported by Bhatty (1995), barley flour 134
(10g) mixed with NaOH and extracted for 1h at room temperature and further centrifuged 135
at 6000g (REMI, C 24, Mumbai, India) for 15 min. The residue was again extracted with 136
NaOH for 1h and centrifuged at 6000g for 15 min. The supernatant were polled and pH 137
adjusted to 6.5 with HCl. Calcium chloride (70 mg/100 ml) and Termamyl 120L (0.1 ml/ 138
100ml) was added. The contents were incubated at 96°C for 1 h with shaking and 139
suspension was cooled to room temperature (25°C) and the pH adjusted to 4.5 with HCl. 140
The supernatant was again centrifuged at 6000g for 15 min and the pellet discarded. 141
Ethanol was added to 50% final concentration and kept overnight at 4°C, centrifuged again 142
at 6000g for 15 min. The crude gum was resuspended in water and washed with 50% 143
ethanol twice, centrifuged again, the pellet was homogenized in water and freeze dried 144
(Heto, LL 3000, Denmark). 145
2.8 Pasting properties 146
Pasting properties of flours (control and roasted) were studied using a Rapid Visco 147
Analyzer (Newport Scientific Pty Ltd., Australia) using the Standard profile 1. Flour (3g on 148
14% moisture basis) was taken in the canister and 25 ml water was added. The suspension 149
was mixed thoroughly with plastic paddle to prevent lump formation before RVA analysis 150
that involved a heating step of 50 to 95ºC at 6ºC/min, a holding phase at 95ºC for 5 min, a 151
cooling step from 95ºC to 50ºC at 6ºC/min and a holding phase at 50ºC for 2 min. The peak 152
viscosity, breakdown viscosity, final viscosity, setback viscosity, peak time and pasting 153
temperature were reported. 154
2.9 Thermal properties 155
The thermal characteristics of barley flours (control and roasted) were analyzed 156
using a Differential Scanning Calorimeter (DSC, Mettler Toledo, Switzerland) equipped 157
with a thermal analysis data station and robotic device to handle the aluminum pan. The 158
sample (5 mg, dry weight basis) was loaded into a 40 µl aluminum pan and distilled water 159
was added (flour to distilled water ratio was 1:2.3). The sample was hermetically sealed and 160
allowed to stand for1 hr at room temperature before heating in DSC. The DSC analyzer was 161
calibrated using indium and an empty aluminum pan was used as reference. The sample 162
was heated at a rate of 10ºC / min from 30 to 100 º C, onset temperatures (T0), peak 163
7
temperature (Tp), endset temperature (Tc) and enthalpy of gelatinization (∆Hgel) were 164
calculated automatically. The gelatinization range (R) was (TC - T0), the peak height index 165
(PHI) was calculated by the ratio ∆ Hgel / (TP – T0). The degree of gelatinization (DG) was 166
calculated as reported by Holm et al. (1988) and results were reported in percent degree of 167
gelatinization. 168
Degree of gelatinization (%) = [1- (∆Hgel of roasted sample/ ∆Hgel of control sample)] x 100 169
2.10 Damaged starch content 170
Starch damage was measured enzymatically using the ‘Starch Damage Assay Kit’ 171
(Megazyme International Ireland Ltd., Wicklow, Ireland). The results were reported as % 172
damage starch. 173
2.11 Statistical Analysis 174
Analysis of variance (ANOVA) was carried out and Fishers least significant 175
difference (LSD) test was used to describe means with 95% confidence. The Pearson 176
correlation coefficients were calculated by SPSS statistical software (SPSS Inc., Chicago, 177
Illinois, USA) at a probability level of p<0.05. 178
3. Result and discussion 179
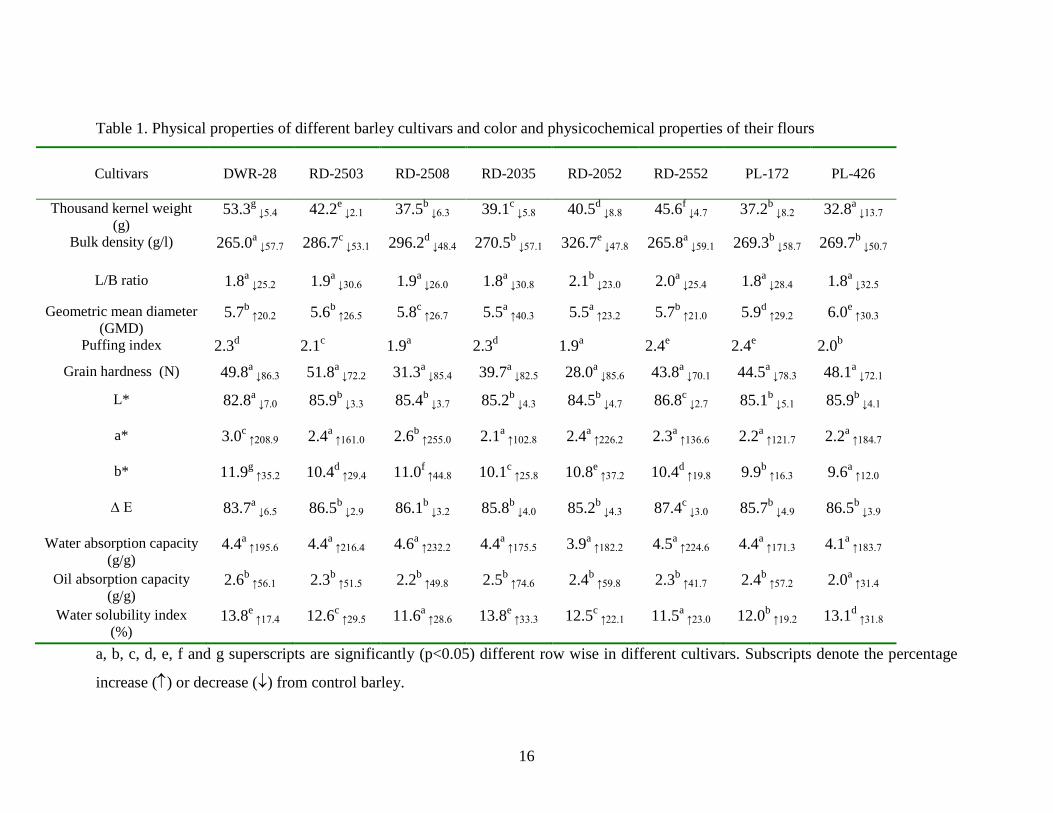
3.1. Effect of roasting on physical properties of barley 180
The thousand kernel weight (TKW) of roasted barley grain varied significantly 181
(p<0.05) among the cultivars and ranged from 32.8 to 53.3 g (Table 1). The highest and the 182
lowest TKW was observed for DWR-28 and PL-426, respectively. After roasting, the TKW 183
was significantly (p<0.05) lowered in all the cultivars. The highest and the lowest decrease 184
was observed in PL-426 and RD-2503, respectively (Table 1). Similar result was also 185
reported by Mariotti et al. (2006) for puffed barley. 186
The bulk density of roasted barley significantly varied among cultivars also after 187
roasting, being the bulk density significantly (p<0.05) lowered. The decrease in bulk 188
density after roasting can be attributed to loss of integrity between starch-starch and starch-189
protein matrix and or due to the formation of spaces in starchy endosperm (Chandrasekhar 190
and Chattopadhyay, 1990). The roasting of barley grain also significantly decreased the L/B 191
ratio, the highest and lowest decrease was observed in PL-172 and RD- 2052 cultivar, 192
respectively. A positive correlation (R= 0.60) was noticed between L/B ratio and bulk 193
density of roasted barley. 194
8
The roasting of barley significantly increased the geometric mean diameter (GMD) 195
likely due to expansion of grain derived from the disorganization of starchy endosperm and 196
expansion of cavities present in endosperm or formation of spaces in endosperm (Mariotti 197
et al., 2006). The puffing index, indicator of volume of puffed grain (Hoke et al., 2007), 198
significantly varied among cultivars and ranged from 1.9 to 2.4. The highest puffing index 199
was observed for RD-2552 and PL-172 while the lowest was observed for RD-2508 and 200
RD-2052 cultivars. A negative correlation (R= -0.78) existed between the puffing index 201
and bulk density of roasted barley. 202
3.2 Effect of roasting on grain hardness 203
The hardness is very important because energy requirement during milling depends 204
upon the hardness of grain (Moss et al., 1980). The grain hardness is influenced by the size, 205
direction of applied force, moisture content, chemical composition and heat treatment given 206
to the grain (Mridula et al., 2007). The hardness of the dehusked roasted grain significantly 207
varied among the cultivars, and it decreased significantly (p<0.05) as a consequence of the 208
roasting. Decrease in hardness upon roasting was also reported by Murthy et al. (2008) for 209
wheat. This effect could be attributed to the fact that surface gelatinization of starch took 210
place and fissures developed on the grain upon further heating, resulted in the reduced 211
hardness (Mridula et al., 2008). 212
3.3 Effect of roasting on colour characteristics of flour 213
Color parameters were significantly different among cultivars, and roasting or 214
thermal treatment affected significantly the color of the flour (Table 1). The L* value 215
indicates the lightness, 0-100 representing dark to light. The statistical analysis revealed 216
that the L* of flour significantly (p<0.05) varied among cultivars (Table 1), the highest 217
being for RD-2552 and the lowest being for DWR-28 cultivars. After the roasting of barley 218
the L* value was significantly (p<0.05) lowered. The a* value gives the degree of the red 219
green colour, with a higher positive a* value indicating more redness, whereas the b* value 220
indicates the degree of yellow blue colour, with higher positive b* value indicating more 221
yellow. The highest and the lowest a* value was observed for DWR-28 and RD-2035 222
cultivars, respectively. The roasting caused a significant (p<0.05) increase in a* and b* 223
values of all cultivars. The total colour difference (∆E) of flour significantly (p<0.05) 224
varied among cultivars and ranged from 83.7 to 87.4. The roasting of barley significantly 225

9
decreased the ∆E for all the cultivars with the highest and the lowest for DWR-28 and RD-226
2508 cultivars, respectively. This result agrees with previous finding in roasted wheat 227
(Murthy et al., 2008). A possible explanation to the results observed in the color parameters 228
(L*, a* and b*) is the Maillard reaction (Rufian-Henares et al., 2009) and browning 229
reactions that produce brown pigments with low and high molecular weight in advance 230
stage of the browning reaction (Hofmann, 1998). 231
3.4 Effect of roasting on water absorption capacity, water solubility index and oil 232
absorption capacity 233
The water absorption capacity (WAC) of roasted barley flours did not significantly 234
vary among the cultivars, but significant differences were observed on the oil absorption 235
capacity (OAC) and in the water solubility index (WSI) (Table 1). A significant (p<0.05) 236
positive correlation (R= 0.72) was exhibited by WSI and OAC. The thermal treatment 237
affected those parameters (WAC, WSI, OAC) inducing a significant increase in all the 238
cultivars studied. Mariotti et al. (2006) reported similar results for water absorption 239
capacity for puffed barley; and also Griffith and Castell-Perez (1998) reported an increase 240
in the WAC, OAC and WSI in different cereals and legume after roasting. 241
The formation of a porous structure in the endosperm and the capillaries formed 242
might be responsible of the increase in the absorption; also the presence of higher level of 243
damaged starch has been suggested as possible (Mariotti et al, 2006). Starch had the 244
tendency to become soluble after different cooking treatment (Jones et al., 2000). 245
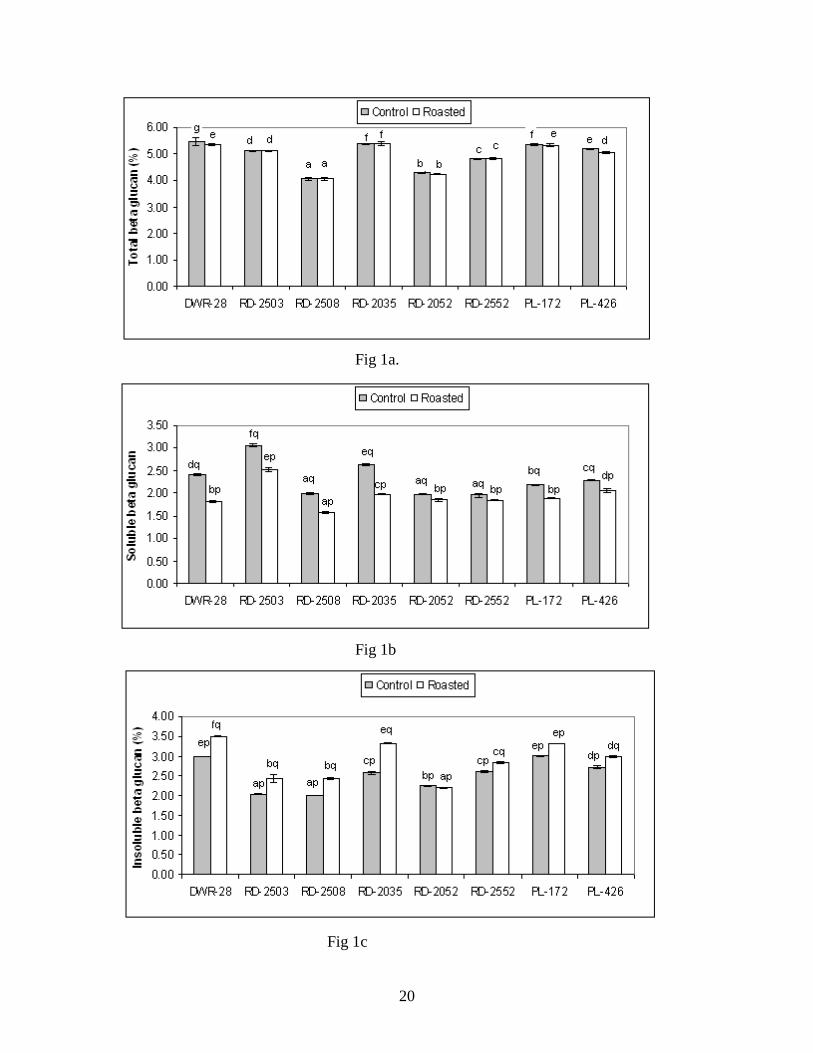
3.5 Effect of roasting on total, insoluble and soluble β-glucan 246
Roasting affected in different extent the total ß-glucan content depending on the 247
cultivar (Fig 1a), observing a significant decrease in the total ß-glucan content of some 248
cultivars. The highest total β-glucan was observed for DWR-28 (5.47%) and RD-2035 249
(5.41%) in control and roasted barley, respectively. The lowest total β-glucan was observed 250
for RD-2508 cultivar in both roasted and control barley. The soluble β-glucan ranged from 251
1.95 to 3.07% in control barley while it was significantly lowered after roasting (Fig. 1b). 252
The highest and the lowest decrease in soluble β-glucan were observed for RD-2035 253
(25.3%) and RD-2552 (4.9%) cultivars, respectively. Izydorczyk et al. (2000) reported that 254
hydrothermal treatments did not increase the amount of soluble β-glucan in different barley 255
cultivars. The insoluble β-glucan ranged from 2.0 to 3.0% in control barley flour (Fig. 1c), 256
10
the highest and the lowest being for PL-172 and RD-2508 cultivars, respectively. Roasting 257
significantly increased the insoluble β-glucan in all the barley cultivars. 258
A significant (p<0.05) positive correlation was observed between total and insoluble 259
β-glucan of control barley (R = 0.73). Upon roasting, total β-glucan exhibited a significant 260
positive correlation (R = 0.82) with insoluble β-glucan while the correlation with soluble β-261
glucan was lower (R = 0.45). 262
3.6 Effect of roasting on β-glucan extractability 263
The β-glucan extractability significantly varied among the cultivars in control and 264
roasted barley (Fig.2). The highest and the lowest β-glucan extractability were observed for 265
PL-172 and PL-426, respectively in control and roasted barley. After roasting, β-glucan 266
extractability only showed significant increase in RD-2035 and PL-172. Bhatty (1995) 267
reported similar results for β-glucan extractability in barley and oat bran. 268
ß-glucan extractability (control barley) was positively correlated with water 269
absorption capacity (R = 0.70, p<0.05). 270
3.7 Effect of roasting on pasting properties of flour 271
The pasting properties of barley flour obtained after roasting significantly varied 272
among cultivars (Table 2). A sharp decrease in peak viscosity and breakdown viscosity 273
(BDV, measurement of the cooked starch to disintegration) was noticed after roasting. 274
BDV showed a significant positive (p<0.05) correlation (R= 0.64) with puffing index. 275
The roasting of barley significantly (p<0.05) decrease the final viscosity and the 276
setback viscosity (SB), with the exception of RD-2552 that showed an increase in the SB 277
viscosity after roasting. The time required to reach peak viscosity did not vary significantly 278
among the cultivars. However, the roasting of barley significantly increased the peak time 279
(PT). In addition, roasting of barley significantly increased the pasting temperature. Similar 280
results were also reported for pasting properties in roasted oat (Cenkowski et al., 2006). 281
Therefore, it seems that starch is partially gelatinized during roasting, despite the limiting 282
water available for the starch. It has been reported that the loosely packed starch granules 283
with high level of damaged starch easily hydrate and swell more rapidly in the presence of 284
heat and consequently produce less peak viscosity (Mariotti et al., 2006), thus the increase 285
in damaged starch might explain the results obtained. 286

11
It should remark that some interesting correlations were found among physical 287
parameters and the content of ß-glucans. Total β-glucan showed significant (p<0.05) 288
positive correlation with peak and final viscosity (R = 0.74, 0.67 and 0.61, respectively). 289
Insoluble β-glucan showed a positive correlation with peak and trough viscosity (R = 0.74 290
and 0.61 respectively). After roasting the β-glucan did not show correlation with the pasting 291
parameters (peak, final and trough viscosity) as exhibited by control flour. 292
The peak viscosity, TV and breakdown showed significant (p<0.05) positive 293
correlation (R= 0.75, 0.74 and 0.72, respectively) with β-glucan extractability. Zhang et al. 294
(1998) reported that the non-starchy polysaccharide such as β-glucan affected the pasting 295
properties of barley flour. 296
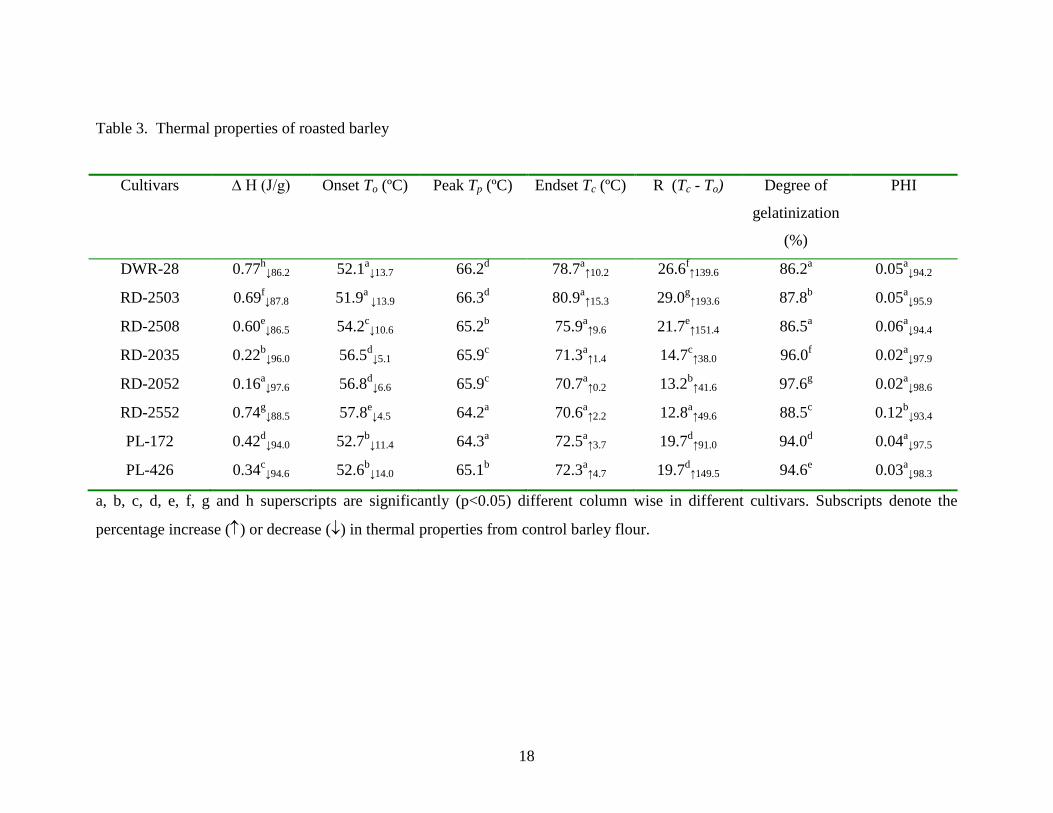
3.8 Effect of roasting on thermal properties 297
The thermal properties, onset temperature and peak temperature of barley flour 298
significantly (p<0.05) varied among cultivars (Table 3). The endset temperature (Tc) of the 299
roasted barley did not significantly vary among the cultivars. Upon roasting, significant 300
(p<0.05) decrease was observed in To among all cultivars, whereas roasting did not affect 301
the Tc significantly. 302
The enthalpy of gelatinization (∆Hgel) ranged from 0.16 to 0.74 J/g with the highest 303
being for DWR-28 and the lowest being for RD-2052. Significant decrease was observed in 304
∆Hgel when the barley was roasted. The degree of gelatinization ranged from 86.2 to 97.6% 305
in the roasted barley. Upon roasting, significant increase was observed in the gelatinization 306
range. The peak height index (PHI) significantly decreased in all the cultivar after roasting. 307
Upon roasting the barley starch was either gelatinized completely or partially 308
depending upon type and time of heat treatment and grain properties. During gelatinization 309
inter and intramolecular hydrogen bonds are broken. This results in a loosening up of the 310
compact granular structure and allows different degrees of swelling and absorption of 311
water. The roasting leads to gelatinization of the starch, which agrees with the observed 312
decrease in ∆Hgel, although the starch that remained either ungelatinized or partially 313
gelatinized showed a slight higher ∆Hgel in roasted as compared to other samples. Holm et 314
al. (1988) reported that the degree of gelatinization (DG) ranged from 22-65% for rolled 315
cereals, lower values than the ones obtained in the present study, although discrepancies 316
could be attributed to difference in thermal treatment applied to grains. In fact, differences 317

12
in the effect of thermal and hydrothermal treatments have been reported. Khunae et al. 318
(2007) reported increase in To and decrease in ∆Hgel of rice starches upon hydrothermal 319
treatment. Granfeldt et al. (2000) reported a decrease in To and ∆Hgel for roasted oat and 320
steamed barley flakes. 321
Some correlations were also established among the DSC parameters and pasting 322
properties. A significant (p<0.05) positive correlation (R= 0.64) was exhibited between 323
through viscosity and endset temperature. Moreover, peak time of RVA showed a 324
significant (p<0.05) positive correlation with To, Tc and R of DSC, (R= 0.70, 0.77 and 0.79, 325
respectively). Also, setback viscosity showed a significant positive correlation with peak 326
height index (R= 0.64) of DSC. Special attention should be paid to the correlations 327
observed with the ß-glucan extractability (control barley) that was positively correlated 328
with endset (R = 0.63, p<0.05), gelatinization temperature range (R = 0.85, p<0.01) and 329
negatively correlated with onset temperature (R = -0.81, p<0.05). Moreover, after roasting 330
these correlations were lowered. 331
3.9 Effect of roasting on starch damage 332
During the milling of grain some starch particles get mechanically damaged and the 333
level of damaged starch depends upon the texture of grain, type of seed, and force applied 334
during milling (Hoseney, 1994). The level of damage starch affects the flour characteristics 335
like water absorption capacity. The damage starch content in roasted barley is an index of 336
the extent of modification of the structure of the native starch granules by the thermal 337
processing. Therefore, the level of the damage starch in the roasted barley from different 338
cultivars was determined. The level of damage starch significantly varied among the 339
cultivars and ranged from 2.1 to 3.1% with highest and lowest being for RD-2052 and PL-340
172, respectively in control flour (Figure 3), probably the difference was due to the 341
difference in the hardness of grain. However, after roasting the damage starch ranged from 342
28.8 to 43.1%. The substantial increase in the level of damaged starch in the roasted barley 343
could be ascribed to gelatinization and bursting of starch granules due to higher 344
temperature. Mariotti et al. (2006) reported similar results for control and roasted barley. 345
346
Conclusions 347

13
The study revealed that large variations were found in the physical characteristics, 348
thermal and pasting properties of a range of barley cultivars. Roasting of barley 349
significantly affect the physical properties of barley cultivars, together with the thermal and 350
pasting properties. The thermal treatment induced partial starch gelatinization and provoked 351
a significant increase of the damage starch. 352
ß-glucan extractability remained unaffected after roasting, only two cultivars (RD-2035 and 353
PL-172) showed an increase in the extractability. Roasting affected in different extent the 354
total ß-glucan content depending on the cultivar, observing a significant decrease of the 355
total ß-glucan content in some cultivars. The greatest effect was observed on the ratio of 356
both types of ß-glucans (soluble and insoluble), since roasting induced a significant 357
increase in the insoluble ß-glucans with a simultaneous decrease in the soluble β-glucan 358
content. Therefore, roasting could be used as an strategy for modifying the ratio of soluble 359
to insoluble ß-glucans content and the grain barley properties. 360
Acknowledgement 361
We sincerely thank Megazyme International Ireland Ltd., for providing the β-glucan 362
and starch damage assay kit. 363
References 364
Anderson, R. A., Conway, H.F., Pfeifer, V.F., Griffin, E.L., 1969. Roll and extrusion 365
cooking of grain sorghum grits. Cereal Science Today 14, 372–376. 366
Anker-Nilssen, K., Sahlstrom, S., Knutsen, S.H., Holtekjolen, A.K., Uhlen, A.K., 2008. 367
Influence of growth temperature on content, viscosity and relative molecular weight 368
of water-soluble β -glucans in barley (Hordeum vulgare L.). Journal of Cereal 369
Science 48, 670-677. 370
Bhatty, R.S., 1995. Laboratory and pilot plant extraction and purification of β-glucan from 371
hullless barley and oat brans. Journal of Cereal Science 22, 163-170. 372
Cenkowski1, S., Ames, N., Muir, W.E., 2006. Infrared processing of oat grits in a 373
laboratory-scale electric micronizer. Canadian Biosystems Engineering 48, 17-25. 374
Chandrasekhar, P.R., Chattopadhyay, P.K., 1990. Studies on microstructural changes of 375
parboiled and puffed rice. Journal of Food processing and Preservation 14, 27-37. 376
FAO, 2007. http//: www.fao.org 377
14
Gahalawat, P., Sehagal, S., 1992. Phytic acid, saponin and polyphenol in weaning foods 378
prepared from oven heated green gram and cereals. Cereal Chemistry 69, 463-464. 379
Granfeldt, Y., Eliasson, A-C., Bjorck, I., 2000. An examination of the possibility of 380
lowering the glycemic index of oat and barley flakes by minimal processing. 381
Journal of Nutrition 130, 2207-2214. 382
Griffith, L.D., Castell-Perez, M.E., Griffith, M.E., 1998. Effects of blend and processing 383
method on the nutritional quality of weaning woods made from select cereals and 384
legumes. 75, 105-112. 385
Hofmann, T., 1998. Studies on the relationship between molecular weight and the color 386
potency of fractions obtained by thermal treatment of glucose amino acid and 387
glucose/protein solutions by using ultracentrifugation and colour dilution technique. 388
Journal of Agriculture and Food Chemistry 46, 3891-3895. 389
Hoke, K., Houska, M., Pruchova, J., Gabrovska, D., Vaculova, K., Paulickova, I., 2007. 390
Optimization of puffing of naked barley. Journal of Food Engineering 80, 1016-391
1022. 392
Holm J., Bjorck I., Eliasson A.C., 1988. Effects of thermal processing of wheat on starch: I. 393
Physico-chemical and functional properties. Journal of Cereal Science 8, 145-152. 394
Hoseney, R.C., 1994. In: Principles of cereal science and technology, 2nd edn. American 395
Association of Cereal Chemists, St. Paul, MN, pp 125–145. 396
Indiastat http://www.Indiastat.com/India/showdata.asp 397
Izydorczyk, M.S., Macri, L.J., MacGregor, A.W., 1998. Structure and physicochemical 398
properties of barley non-starch polysaccharides-II. Alkaliextractable β-glucans and 399
arabinoxylans. Carbohydrate Polymers 35, 259–269. 400
Izydorczyk, M.S., Storsley, J., Labossiere, D., MacGregor, A.W., Rossnagel, B.G., 2000. 401
Variation in total and soluble β-glucan content in hulless barley: effects of thermal, 402
physical, and enzymic treatments. Journal of Agricultural and Food Chemistry 48, 403
982–989. 404
Jenkins, D.J.A., Axelsen, M., Kendall, C.W.C., Augustin, L.S.A., Vuksan, V., Smith, U. 405
2000. Dietary fiber, carbohydrates and the insulin resistant diseases. British Journal 406
of Nutrition 83, 157–163. 407
15
Jones, D., Chinnaswamy, R., Tan, Y., Hanna, M., 2000. Physicochemical properties of 408
ready-to-eat breakfast cereals. Cereal Foods World 45, 164-168. 409
Khunae, P., Tran, T., Sirivongpaisal, P., 2007. Effect of heat-moisture treatment on 410
structural and thermal properties of rice starches differing in amylose content. 411
Starch-Strake 59, 593-599. 412
Lin, M.J.Y., Humbert, E.S., Sosulski, F.W., 1974. Certain functional properties of 413
sunflower meal products. Journal of Food Science 39, 368-370. 414
Mariotti, M., Alamprese, C., Pagani, M.A., Lucisano, M., 2006. Effect of puffing on 415
ultrastructure and physical characteristics of cereal grains and flours. Journal of 416
Cereal Science 43, 47-56. 417
McCleary, B.V., Glennie, H.M., 1985. Enzymatic quantification of (1→3), (1→4)-β-418
glucan-D-glucan in barley and malt. Journal of Institute of Brewing 91, 285-295. 419
Moss, R., Stenvert, N.L., Kingswood, K., Pointing, G., 1980. The relationship between 420
wheat microstructure and flour milling. Scanning Electron Microscopy 3, 613-620. 421
Mridula, D., Goyal, R.K., Manikantan, M.R., 2008. Effect of Roasting on Texture, Colour 422
and Acceptability of Pearl Millet (Pennisetum glaucum) for Making Sattu. 423
International Journal of Agricultural Research 3, 61-68. 424
Mridula, D., Goyal, R.K., Bhargav, V.K., Manikanthan, M.R., 2007. Effect of roasting on 425
texture, colour and acceptability of soyabean for making sattu. American Journal of 426
Food Technology 4, 265-272. 427
Murthy, K.V., Ravi, R., Bhat, K.K., Raghavarao, K.S.M.S., 2008. Studies on roasting of 428
wheat using fluidized bed roaster. Journal of Food Engineering 89, 336-342. 429
Paras, S., Gujral, H.S., 2009. Milling behavior of hulled barley and its thermal and pasting 430
properties. Journal of Food Engineering 97, 329-334. 431
Rufian-Henares, J.A., Delgado-Andrade, C., Morales, F.J., 2009. Assessing the Maillard 432
reaction development during the toasting process of common flours employed by 433
the cereal products industry. Food Chemistry 114, 93-99. 434
Zhang, D., Moore, W.R., Doehlert, D.C., 1998. Effect of oat grain hydrothermal treatment 435
on wheat-oat-flour properties and breadmaking quality. Cereal Chemistry 75, 602-436
605. 437
16
Table 1. Physical properties of different barley cultivars and color and physicochemical properties of their flours
Cultivars
DWR-28
RD-2503
RD-2508
RD-2035
RD-2052
RD-2552
PL-172
PL-426
Thousand kernel weight (g)
53.3g ↓5.4 42.2e
↓2.1 37.5b ↓6.3 39.1c
↓5.8 40.5d ↓8.8 45.6f
↓4.7 37.2b ↓8.2 32.8a
↓13.7
Bulk density (g/l) 265.0a ↓57.7 286.7c
↓53.1 296.2d ↓48.4 270.5b
↓57.1 326.7e ↓47.8 265.8a
↓59.1 269.3b ↓58.7 269.7b
↓50.7
L/B ratio 1.8a ↓25.2 1.9a
↓30.6 1.9a ↓26.0 1.8a
↓30.8 2.1b ↓23.0 2.0a
↓25.4 1.8a ↓28.4 1.8a
↓32.5
Geometric mean diameter (GMD)
5.7b ↑20.2 5.6b
↑26.5 5.8c ↑26.7 5.5a
↑40.3 5.5a ↑23.2 5.7b
↑21.0 5.9d ↑29.2 6.0e
↑30.3
Puffing index 2.3d 2.1c 1.9a 2.3d 1.9a 2.4e 2.4e 2.0b Grain hardness (N) 49.8a
↓86.3 51.8a
↓72.2 31.3a
↓85.4 39.7a
↓82.5 28.0a
↓85.6 43.8a
↓70.1 44.5a
↓78.3 48.1a
↓72.1
L* 82.8a ↓7.0 85.9b
↓3.3 85.4b
↓3.7 85.2b ↓4.3 84.5b
↓4.7 86.8c ↓2.7 85.1b
↓5.1 85.9b ↓4.1
a* 3.0c ↑208.9 2.4a
↑161.0 2.6b ↑255.0 2.1a
↑102.8 2.4a ↑226.2 2.3a
↑136.6 2.2a ↑121.7 2.2a
↑184.7
b* 11.9g ↑35.2 10.4d
↑29.4 11.0f ↑44.8 10.1c
↑25.8 10.8e ↑37.2 10.4d
↑19.8 9.9b ↑16.3 9.6a
↑12.0
∆ E 83.7a ↓6.5 86.5b
↓2.9 86.1b ↓3.2 85.8b
↓4.0 85.2b ↓4.3 87.4c
↓3.0 85.7b ↓4.9 86.5b
↓3.9
Water absorption capacity (g/g)
4.4a ↑195.6 4.4a
↑216.4 4.6a ↑232.2 4.4a
↑175.5 3.9a ↑182.2 4.5a
↑224.6 4.4a ↑171.3 4.1a
↑183.7
Oil absorption capacity (g/g)
2.6b ↑56.1 2.3b
↑51.5 2.2b ↑49.8 2.5b
↑74.6 2.4b ↑59.8 2.3b
↑41.7 2.4b ↑57.2 2.0a
↑31.4
Water solubility index (%)
13.8e ↑17.4 12.6c
↑29.5 11.6a ↑28.6 13.8e
↑33.3 12.5c ↑22.1 11.5a
↑23.0 12.0b ↑19.2 13.1d
↑31.8
a, b, c, d, e, f and g superscripts are significantly (p<0.05) different row wise in different cultivars. Subscripts denote the percentage
increase (↑) or decrease (↓) from control barley.

17
Table 2.Pasting properties of roasted barley flours from different cultivars
Cultivars Peak viscosity
(cP)
Breakdown
viscosity (cP)
Final viscosity
(cP)
Setback viscosity
(cP)
Peak time
(min)
Pasting
temperature (ºC)
DWR-28 523b ↓71.8 66a
↓92.0 1064d ↓50.2 644d
↓41.3 6.9a ↑12.4 94.0a
↑14.3
RD-2503 478a ↓71.1 72a
↓88.5 957b ↓53.7 552b
↓46.0 7.0a ↑12.3 91.8a
↑9.3
RD-2508 473a ↓62.5 60a
↓88.2 910a
↓44.0 496a ↓43.1 7.0a
↑13.4 88.8a ↑6.2
RD-2035 685c ↓53.0 116d
↓76.9 1072d ↓43.7 501a
↓45.7 7.0a ↑10.4 93.3a
↑9.3
RD-2052 709d ↓53.2 84b
↓81.4 1346e ↓34.9 724e
↓27.6 7.0a ↑7.6 87.9a
↑6.5
RD-2552 726d ↓54.1 101c
↓64.7 1406f ↓15.2 785f
↑123.7 7.0a ↑0.0 89.3a
↑5.1
PL-172 869e ↓58.0 131e
↓84.0 1613g ↓30.6 876g
↓18.7 7.0a ↑12.0 86.2a
↑5.7
PL-426 459a ↓78.4 70a
↓92.4 988e ↓57.3 599 c
↓46.9 7.0a ↑13.9 93.7a
↑15.5
a, b, c, d, e, f and g superscripts are significantly (p<0.05) different column wise in different cultivars. Subscripts denote the
percentage increase (↑) or decrease (↓) in pasting properties from control barley flour.
18
Table 3. Thermal properties of roasted barley
Cultivars
∆ H (J/g) Onset To (ºC) Peak Tp (ºC) Endset Tc (ºC) R (Tc - To) Degree of
gelatinization
(%)
PHI
DWR-28 0.77h↓86.2
52.1a↓13.7
66.2d 78.7a↑10.2
26.6f↑139.6
86.2a 0.05a↓94.2
RD-2503 0.69f↓87.8
51.9a ↓13.9 66.3d 80.9a
↑15.3 29.0g
↑193.6 87.8b 0.05a
↓95.9
RD-2508 0.60e↓86.5
54.2c↓10.6
65.2b 75.9a↑9.6
21.7e↑151.4
86.5a 0.06a↓94.4
RD-2035 0.22b↓96.0
56.5d↓5.1
65.9c 71.3a↑1.4
14.7c↑38.0
96.0f 0.02a↓97.9
RD-2052 0.16a↓97.6
56.8d↓6.6
65.9c 70.7a↑0.2
13.2b↑41.6
97.6g 0.02a↓98.6
RD-2552 0.74g↓88.5
57.8e↓4.5
64.2a 70.6a↑2.2
12.8a↑49.6
88.5c 0.12b↓93.4
PL-172 0.42d↓94.0
52.7b↓11.4
64.3a 72.5a↑3.7
19.7d↑91.0
94.0d 0.04a↓97.5
PL-426 0.34c↓94.6
52.6b↓14.0
65.1b 72.3a↑4.7
19.7d↑149.5
94.6e 0.03a↓98.3
a, b, c, d, e, f, g and h superscripts are significantly (p<0.05) different column wise in different cultivars. Subscripts denote the
percentage increase (↑) or decrease (↓) in thermal properties from control barley flour.
19
Figure captions
Figure 1. Effect of roasting on total, soluble and insoluble β-glucan in different barley
cultivars, mixed linkage total β-glucan (Fig.1a), soluble β-glucan (Fig.1b), insoluble β-
glucan (Fig.1c), different superscripts (a to f) show significant difference (p<0.05) within
cultivars and p, q superscripts show significant difference of roasting within a cultivar
Figure 2. Effect of roasting on extractability of β-glucan in different barley cultivars,
superscripts (a - f) are show the significant difference within cultivars and (p & q)
superscripts show significant difference of roasting within a cultivars.
Figure 3. Effect of roasting on starch damage in different barley cultivars, superscripts (a
- h) are show the significant difference within cultivars and (p & q) superscripts show
significant difference of roasting within a cultivars.
20
Fig 1a.
Fig 1b
Fig 1c

21
Figure. 1
Figure 2

22
Figure3
Copyright © 2022 FDOKUMEN