Plasma Nitroso Compounds Are Decreased in Patients With Endothelial Dysfunction
Upload
independentCategory
view
0download
0
Down-Regulation of the CSLF6 Gene Results inDecreased (1,3;1,4)-b-D-Glucan in Endospermof Wheat1[C][W]
Csilla Nemeth, Jackie Freeman, Huw D. Jones, Caroline Sparks, Till K. Pellny, Mark D. Wilkinson,Jim Dunwell, Annica A.M. Andersson, Per Aman, Fabienne Guillon, Luc Saulnier,Rowan A.C. Mitchell, and Peter R. Shewry*
Rothamsted Research, Harpenden, Hertfordshire AL5 2JQ, United Kingdom (C.N., J.F., H.D.J., C.S., T.K.P.,M.D.W., R.A.C.M., P.R.S.); School of Biological Sciences, University of Reading, Whiteknights, Reading,Berkshire RG6 6AH, United Kingdom (J.D.); Swedish University of Agricultural Sciences, SE–750 07 Uppsala,Sweden (A.A.M.A., P.A.); and INRA, UR 1268 Biopolymeres, Interactions et Assemblages, 44316 Nantes cedex03, France (F.G., L.S.)
(1,3;1,4)-b-D-Glucan (b-glucan) accounts for 20% of the total cell walls in the starchy endosperm of wheat (Triticum aestivum)and is an important source of dietary fiber for human nutrition with potential health benefits. Bioinformatic and array analysesof gene expression profiles in developing caryopses identified the CELLULOSE SYNTHASE-LIKE F6 (CSLF6) gene as encodinga putative b-glucan synthase. RNA interference constructs were therefore designed to down-regulate CSLF6 gene expressionand expressed in transgenic wheat under the control of a starchy endosperm-specific HMW subunit gene promoter. Analysis ofwholemeal flours using an enzyme-based kit and by high-performance anion-exchange chromatography after digestion withlichenase showed decreases in total b-glucan of between 30% and 52% and between 36% and 53%, respectively, in fivetransgenic lines compared to three control lines. The content of water-extractable b-glucan was also reduced by about 50% inthe transgenic lines, and the Mr distribution of the fraction was decreased from an average of 79 to 85 3 104 g/mol in thecontrols and 36 to 57 3 104 g/mol in the transgenics. Immunolocalization of b-glucan in semithin sections of mature anddeveloping grains confirmed that the impact of the transgene was confined to the starchy endosperm with little or no effect onthe aleurone or outer layers of the grain. The results confirm that the CSLF6 gene of wheat encodes a b-glucan synthase andindicate that transgenic manipulation can be used to enhance the health benefits of wheat products.
Cell wall polysaccharides account for about 10% ofthe dry weight of the mature wheat (Triticum aestivum)grain, and about 2% to 3% dry weight of the whiteflour fraction that is derived from the major storagetissue of the grain, the starchy endosperm (Stone,1996). Although they are relatively minor componentsof white flour, the cell wall polysaccharides are im-mensely important in determining the properties ofthe flour for processing (Saulnier et al., 2007a) and inhuman nutrition, forming a major source of dietaryfiber (Saulnier et al., 2007b; Topping, 2007).
Wheat endosperm cell walls comprise two majorcomponents, arabino-(1,4)-b-D-xylan (arabinoxylan[AX]) and (1,3;1,4)-b-D-glucan (b-glucan), which ac-count for about 70% and 20% of the total, respectively(Bacic and Stone, 1980). In addition about 4% cellulose[(1,4)-b-D-glucan] and 7% (1,4)-b-D-glucomannans arepresent (Bacic and Stone, 1980). This contrasts withstarchy endosperm tissues of oats (Avena sativa) andbarley (Hordeum vulgare), in which the proportions ofAX and b-glucan are reversed (Henry, 1987; Stone,1996). This is of particular interest as soluble b-glucansfrom barley and oats have benefits in reducing coro-nary heart disease that have been accepted by the U.S.Food and Drug Administration for health claims onfood products (Anonymous, 2008). It is not knownwhether these benefits are shared by b-glucan fromwheat, which differs from barley and oat b-glucans inits distribution of 1,3 and 1,4 linkages (Lazaridou andBiliaderis, 2007). Differences in Mrs of b-glucans havealso been reported, although it is difficult to concludewhether these result from true genetic differences,the effects of growth conditions, or the methods usedfor extraction and characterization (Lazaridou andBiliaderis, 2007). However, differences in linkage dis-tribution are likely to affect b-glucan solubility and
1 This work was supported by the European Commission in theCommunities Sixth Framework Programme, Project HEALTH-GRAIN (grant no. FOOD–CT–2005–514008). Rothamsted Researchreceives grant-aided support from the Biotechnology and BiologicalSciences Research Council of the United Kingdom.
* Corresponding author; e-mail [email protected] author responsible for distribution of materials integral to the
findings presented in this article in accordance with the policydescribed in the Instructions for Authors (www.plantphysiol.org) is:Peter R. Shewry ([email protected]).
[C] Some figures in this article are displayed in color online but inblack and white in the print edition.
[W] The online version of this article contains Web-only data.www.plantphysiol.org/cgi/doi/10.1104/pp.109.151712
Plant Physiology�, March 2010, Vol. 152, pp. 1209–1218, www.plantphysiol.org � 2010 American Society of Plant Biologists 1209

viscosity (Cui et al., 2000; Lazaridou and Biliaderis,2007), which are considered to be key parametersdetermining health benefits (Wood, 2007).
Despite the biological importance of plant cell walls,we know relatively little about their biosynthesis.However, it is becoming clear that members of thecellulose synthase super family are responsible for thesynthesis of the backbone of hexose polysaccharides,with cellulose itself being synthesized by enzymesencoded by the CELLULOSE SYNTHASE A (CESA)family (Richmond and Somerville, 2000) and otherpolysaccharides by enzymes encoded by genes inCELLULOSE SYNTHASE-LIKE (CSL) families desig-nated A to H and J. The latter include genes en-coding (1,4)-b-D-mannans (CSLA; Dhugga et al., 2004;Liepman et al., 2007) and the (1,4)-b-D-glucan back-bone of xyloglucan (CSLC; Cocuron et al., 2007).
Burton et al. (2006) provided convincing evidencethat the rice (Oryza sativa) CSLF genes encode b-glucansynthases, by expression in transgenic Arabidopsis(Arabidopsis thaliana) and detection of b-glucan (whichis not normally synthesized in Arabidopsis) with ahighly specific antibody. Furthermore, four of thecorresponding CSLF genes of barley were mapped toa locus on chromosome 2H corresponding to a majorquantitative trait locus (QTL) for grain b-glucan con-tent, and two other CSLF genes to loci on chromo-somes 1H and 7H that were also close to b-glucanQTLs. The seventh barley CSLF gene mapped to alocus on chromosome 5H and showed no linkage tob-glucan QTLs (Burton et al., 2008). However, morerecently Doblin et al. (2009) have shown that the barleyCSLH gene also leads to the synthesis of b-glucanwhen expressed in transgenic Arabidopsis. The au-thors concluded that both the CSLF and CSLH genefamilies contribute to b-glucan synthesis in this spe-cies, and suggested that they act independently, basedon the fact that there was no significant correlationbetween their transcripts.
We have identified the CSLF6 gene of wheat as aputative b-glucan synthase and confirmed this func-tion by RNA interference (RNAi) suppression in trans-genic wheat. This demonstrates that transgenicmanipulation can be used to modify the amountsand properties of b-glucan in wheat, to enhance thehealth benefits and improve the properties for pro-cessing and livestock feed.
RESULTS
Bioinformatic Identification of Candidate Genes
We hypothesized that candidate genes for b-glucansynthesis should be expressed in the developing cary-opsis during the early (cell division and expansion)and mid (grain filling) stages of development, whencell wall synthesis is actively occurring. Furthermore,we proposed that such genes were likely to be mem-bers of the CSL gene family. Figure 1 therefore shows
the abundances of transcripts for CSL genes represen-ted on the wheat Affymetrix GeneChip, hybridized tocDNA isolated from whole caryopses of wheatthroughout development (Wan et al., 2008; Fig. 1A)and from fractions enriched in starchy endospermtissue taken at 14 to 21 DPA (Fig. 1B). Transcripts arelabeled according to the most similar rice sequencesfollowing the naming convention for CSL genes(Hazen et al., 2002). Data are only shown for the sixmost abundant CSL transcripts in the endosperm-enriched samples; the complete list of CSL genesrepresented on the chip and their average expressionlevels are given in Supplemental Table S1. The mosthighly expressed transcripts in the endosperm-enrichedfraction (Fig. 1B) are members of the CSLD family (D2)and the CSLA family (A7-1, A7-2, A12), the latter beingimplicated in mannan synthesis (Dhugga et al., 2004;Liepman et al., 2007). The molecular function of CSLDgenes, which are the most similar to CESA, are un-known, but Arabidopsis knockout mutants for CSLDgenes have defective root tip or pollen tube develop-ment (Bernal et al., 2008). The next most abundanttranscripts in the endosperm-enriched fraction (Fig. 1B)are CSLF6 and CSLC1, implicated in b-glucan andxyloglucan synthesis, respectively (Burton et al., 2006;Cocuron et al., 2007), with both being particularlyabundant early in grain development (Fig. 1A). Theseexpression patterns are consistent with the report thatb-glucan synthesis is initiated earlier and proceedsmore actively during early grain development thanthe synthesis of AX in wheat (Philippe et al., 2006).
The relative abundances of CSL transcripts from thearray data are consistent with counts of wheat ESTsfrom grain libraries; the five transcripts identified asmost abundant in Figure 1 being in the top six rankedby EST counts (Supplemental Table S2). These ESTsindicate the presence of at least seven CSLF genes in
Figure 1. Transcript abundance of CSL genes determined on the wheatAffymetrix GeneChip. Labels indicate the closest rice CSL gene that thetranscript corresponds to; there are two wheat paralogs matching therice OsCSLA7 gene. A, Whole-grain samples isolated at 10 stages ofdevelopment in cv Hereward (each point is the average of tworeplicates; ANOVA of stages 3 genes gives a LSD 5% of 30.1 and thereare significant differences between points at P, 0.001). B, Endosperm-enriched samples isolated at 14 to 21 DPA in cv Cadenza (each bar isthe average of four replicates; ANOVA of genes gives a LSD 5% of 99.3and there are significant differences between points at P = 0.001).
Nemeth et al.
1210 Plant Physiol. Vol. 152, 2010

wheat, corresponding to the rice CSLF1, CSLF2, CSLF3,CSLF4, CSLF6, CSLF8, and CSLF9 genes. Of the CSLFtranscripts in barley, the HvCSLF6 gene, an ortholog ofTaCSLF6, is also by far the most abundant during thecell expansion phase in developing barley endosperm(Burton et al., 2008). Another barley transcript,HvCSLF9, was shown to be reasonably abundant earlyin endosperm development, but the wheat orthologhas only two associated wheat ESTs (SupplementalTable S2), compared with 30 barley ESTs, and is notrepresented on the wheat Affymetrix array.Since the CSLA genes are implicated in the synthesis
of mannans (Dhugga et al., 2004; Liepman et al., 2007)that account for only 7% of wheat endosperm cellwalls (Stone and Morell, 2009), CSLD2 and CSLF6transcripts were selected as targets for RNAi suppres-sion to generate changes in endosperm cell wall com-position. During the progress of this work, the riceCSLF genes were also implicated in the synthesis ofb-glucan by expression in transgenic Arabidopsis(Burton et al., 2006), making the CSLF6 gene thestronger candidate. Similarly, a recent study of theb-D-glucan less (bgl) mutant of barley showed cosegre-gation of the mutation with polymorphism in theCSLF6 gene, suggesting that CSLF6 encodes a b-glucansynthase (Tonooka et al., 2009).
Construction of RNAi Cassettes
Supplemental Figure S1 shows the protein sequencecorresponding to the TaCSLF6 gene cloned from cvCadenza endosperm cDNA, compared with those ofthe rice OsCSLF2 gene that was shown by Burton et al.(2006) to confer the capacity to synthesize b-glucan byexpression in transgenic Arabidopsis and the ortho-logous barley HvCSLF6 gene that is highly expressedin the endosperm (Burton et al., 2008). SupplementalFigure S2 compares the nucleotide sequence of the3# end of this gene with single nucleotide polymor-phisms present in two other forms (determined bysequencing of 15 cDNA clones covering the wholeregion shown and a further 21 covering the regionused for the RNAi construct and that are almostcertainly homoeologs) present in hexaploid cvCadenza cDNA. The fragments used for the RNAiconstructs against CSLF6 (Supplemental Fig. S2) andagainst CSLD2/CSLD4 (Supplemental Fig. S3) are alsoshown; an RNAi construct is expected to represstranscripts that contain regions of 20 bp identity ormore, so homoeologs and other closely related iso-forms will be affected. Partial CSLF6 and CSLD4cDNAs cloned from cv Cadenza were used as tem-plates to PCR amplify fragments for RNAi. Two RNAiplasmids were constructed (Supplemental Fig. S4),one designed to silence onlyCSLF6 (pHMW-Adh-Nos-f6ri/ri) and the other designed to simultaneouslysilence both CSLD2 and CSLD4 (pHMW-Adh-Nos-d4ri/ri) by using regions of CSLD4 cDNA possessinghigh similarity to CSLD2. The RNAi cassettes wereconstructed with inverted repeats flanking the maize
(Zea mays) Adh2 intron and under the control of theendosperm-specific high Mr glutenin subunit 1Dx5promoter (Lamacchia et al., 2001).
Production and Initial Screening of RNAi Lines
Two RNAi cassettes were used, both together andseparately, to generate transgenic lines of wheat (cvCadenza). A total of 29 independent transgenic T0lines were made, 13 containing the CSLF6 RNAi cas-sette, eight containing the CSLD2/4 RNAi cassette,and a further eight containing both constructs. Pres-ence of the selectable marker gene and RNAi cassettein genomic DNA from each T0 plant was confirmed byPCR. Additional evidence for the presence of trans-gene cassettes in these plants was provided usingTaqMan real-time PCR analysis performed on selectedT1 plants by iDNA Genetics.
T1 seed from 16 lines (10 containing the CSLF6 RNAicassette only, four containing the CSLD2/4 RNAicassette only, and two containing both constructs)were germinated and the T1 progeny were screenedby PCR of genomic DNA to determine the segregationratios of the transgenes. The x2 goodness of fit testindicated that the transgenes were segregating with a3:1 ratio in 12 of these lines, including line 15T thatpossessed both CSLF6 and CSLD2/4 cassettes, indica-tive of a single transgene locus containing both cas-settes (Supplemental Table S5). In two of the lines, thex2 goodness of fit test predicted a 15:1 ratio, indicatingthat a CSLF6 cassette had inserted in two unlinked loci(Supplemental Table S5). Line 22T that also containedboth CSLF6 and CSLD2/4 cassettes possessed a classic9:3:3:1 ratio of two unlinked loci, with one containingat least one copy of CSLF6 and the other, at least onecopy of CSLD2/4. The remaining line (10T) segregatedin a non-Mendelian ratio.
Enzyme fingerprinting of T1 seed of transgenicwheat plants carrying only RNAi designed againstthe CSLD genes showed no detectable differences ingrain cell wall composition from the controls. Wetherefore concluded that the CSLD genes do not con-trol the synthesis of the major groups of cell wallpolymers in wheat endosperm (b-glucan and AX). Incontrast, enzyme fingerprinting of T1 seeds of 10heterozygous transgenic lines carrying RNAi de-signed against CSLF6 showed a mean decrease inb-glucan content of over 20% (data not shown). It wastherefore decided to focus attention on the linesexpressing the CSLF6 RNAi constructs.
Five independent lines that displayed both 3:1 seg-regation of the transgene and significantly reducedb-glucan content in T1 seeds were subjected to trans-gene copy number analysis and zygosity estimationvia quantitative PCR. From each of these lines, homo-zygous T1 sublines were propagated to collect T2 seedthat were then sown to provide T3 seed for furtheranalyses. Four of these lines possessed the CSLF6RNAi cassette (lines 4T, 7T, 9T, and 21T) and onepossessed both CSLF6 and CSLD2/4 cassettes (line
Decreased b-Glucan in Wheat by RNAi Inhibition of CSLF6
Plant Physiol. Vol. 152, 2010 1211
15T). Transgene copy number ranged from one to 14copies per line (Supplemental Table S5). These fivelines were used for b-glucan analysis. The 100 grainweights of the five transgenic lines ranged from 2.96 gto 4.21 g (mean 3.75 g), which did not differ signifi-cantly (P = 0.14) from the 100 grain weights of threecontrol lines (range 2.91 g to 3.45 g, mean 3.22 g). Thisconfirms that the expression of the transgene did nothave any significant effect on grain filling.
Transgene and Endogenous CSLF6 Expression
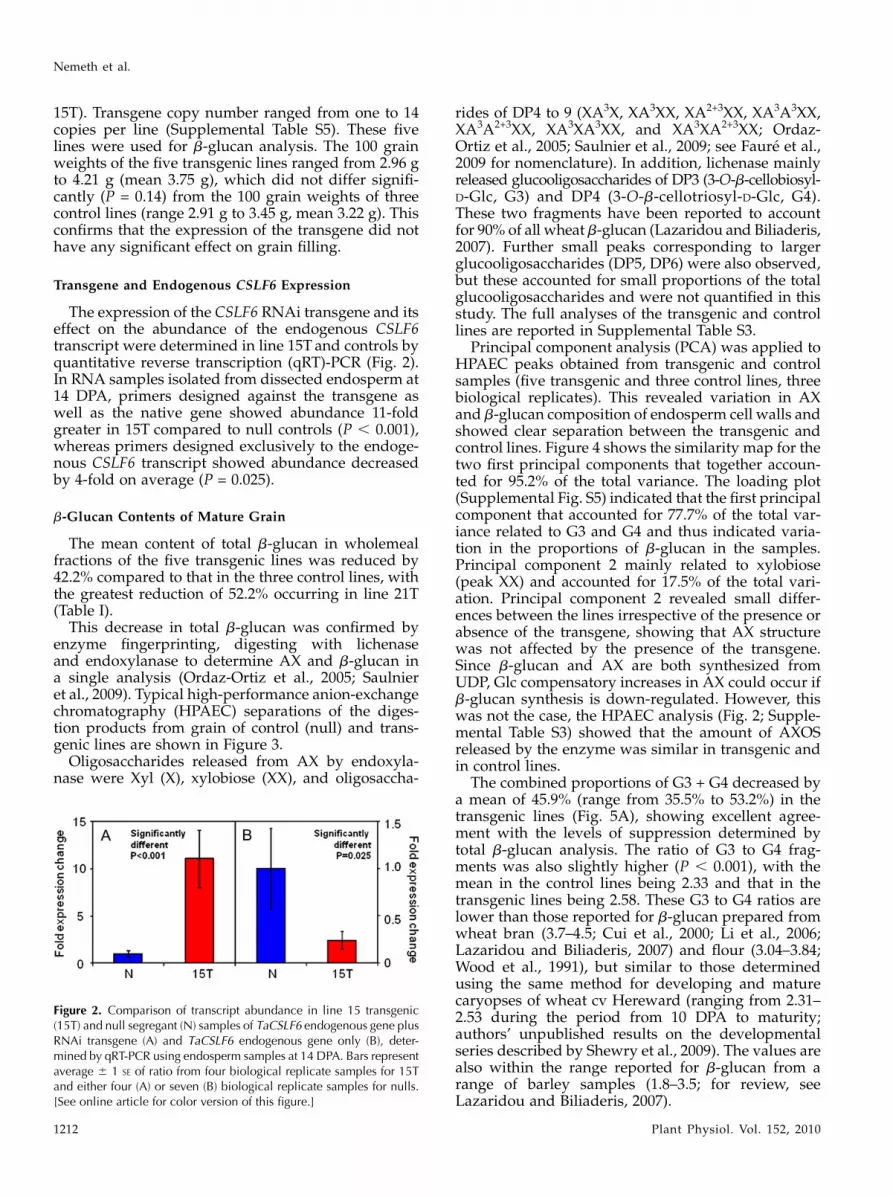
The expression of the CSLF6 RNAi transgene and itseffect on the abundance of the endogenous CSLF6transcript were determined in line 15T and controls byquantitative reverse transcription (qRT)-PCR (Fig. 2).In RNA samples isolated from dissected endosperm at14 DPA, primers designed against the transgene aswell as the native gene showed abundance 11-foldgreater in 15T compared to null controls (P , 0.001),whereas primers designed exclusively to the endoge-nous CSLF6 transcript showed abundance decreasedby 4-fold on average (P = 0.025).
b-Glucan Contents of Mature Grain
The mean content of total b-glucan in wholemealfractions of the five transgenic lines was reduced by42.2% compared to that in the three control lines, withthe greatest reduction of 52.2% occurring in line 21T(Table I).
This decrease in total b-glucan was confirmed byenzyme fingerprinting, digesting with lichenaseand endoxylanase to determine AX and b-glucan ina single analysis (Ordaz-Ortiz et al., 2005; Saulnieret al., 2009). Typical high-performance anion-exchangechromatography (HPAEC) separations of the diges-tion products from grain of control (null) and trans-genic lines are shown in Figure 3.
Oligosaccharides released from AX by endoxyla-nase were Xyl (X), xylobiose (XX), and oligosaccha-
rides of DP4 to 9 (XA3X, XA3XX, XA2+3XX, XA3A3XX,XA3A2+3XX, XA3XA3XX, and XA3XA2+3XX; Ordaz-Ortiz et al., 2005; Saulnier et al., 2009; see Faure et al.,2009 for nomenclature). In addition, lichenase mainlyreleased glucooligosaccharides of DP3 (3-O-b-cellobiosyl-D-Glc, G3) and DP4 (3-O-b-cellotriosyl-D-Glc, G4).These two fragments have been reported to accountfor 90% of all wheat b-glucan (Lazaridou and Biliaderis,2007). Further small peaks corresponding to largerglucooligosaccharides (DP5, DP6) were also observed,but these accounted for small proportions of the totalglucooligosaccharides and were not quantified in thisstudy. The full analyses of the transgenic and controllines are reported in Supplemental Table S3.
Principal component analysis (PCA) was applied toHPAEC peaks obtained from transgenic and controlsamples (five transgenic and three control lines, threebiological replicates). This revealed variation in AXand b-glucan composition of endosperm cell walls andshowed clear separation between the transgenic andcontrol lines. Figure 4 shows the similarity map for thetwo first principal components that together accoun-ted for 95.2% of the total variance. The loading plot(Supplemental Fig. S5) indicated that the first principalcomponent that accounted for 77.7% of the total var-iance related to G3 and G4 and thus indicated varia-tion in the proportions of b-glucan in the samples.Principal component 2 mainly related to xylobiose(peak XX) and accounted for 17.5% of the total vari-ation. Principal component 2 revealed small differ-ences between the lines irrespective of the presence orabsence of the transgene, showing that AX structurewas not affected by the presence of the transgene.Since b-glucan and AX are both synthesized fromUDP, Glc compensatory increases in AX could occur ifb-glucan synthesis is down-regulated. However, thiswas not the case, the HPAEC analysis (Fig. 2; Supple-mental Table S3) showed that the amount of AXOSreleased by the enzyme was similar in transgenic andin control lines.
The combined proportions of G3 + G4 decreased bya mean of 45.9% (range from 35.5% to 53.2%) in thetransgenic lines (Fig. 5A), showing excellent agree-ment with the levels of suppression determined bytotal b-glucan analysis. The ratio of G3 to G4 frag-ments was also slightly higher (P , 0.001), with themean in the control lines being 2.33 and that in thetransgenic lines being 2.58. These G3 to G4 ratios arelower than those reported for b-glucan prepared fromwheat bran (3.7–4.5; Cui et al., 2000; Li et al., 2006;Lazaridou and Biliaderis, 2007) and flour (3.04–3.84;Wood et al., 1991), but similar to those determinedusing the same method for developing and maturecaryopses of wheat cv Hereward (ranging from 2.31–2.53 during the period from 10 DPA to maturity;authors’ unpublished results on the developmentalseries described by Shewry et al., 2009). The values arealso within the range reported for b-glucan from arange of barley samples (1.8–3.5; for review, seeLazaridou and Biliaderis, 2007).
Figure 2. Comparison of transcript abundance in line 15 transgenic(15T) and null segregant (N) samples of TaCSLF6 endogenous gene plusRNAi transgene (A) and TaCSLF6 endogenous gene only (B), deter-mined by qRT-PCR using endosperm samples at 14 DPA. Bars representaverage 6 1 SE of ratio from four biological replicate samples for 15Tand either four (A) or seven (B) biological replicate samples for nulls.[See online article for color version of this figure.]
Nemeth et al.
1212 Plant Physiol. Vol. 152, 2010

These analyses were carried out on whole-grainsamples, whereas the RNAi constructs were expressedunder the control of the HMW subunit 1Dx5 genepromoter that is expressed only in the starchy endo-sperm and starting at about 10 to 12 DPA (Lamacchiaet al., 2001), with significant levels of the encodedprotein being detected from 14 DPA (Shewry et al.,2009). Hence, the true impact of the down-regulationon b-glucan content and properties would have beendiluted by the presence of the b-glucan-rich aleuronebut also by b-glucan synthesized in the young devel-oping starchy endosperm.
b-Glucan in Developing Grain
The HMW subunit 1Dx5 promoter is only expressedfrom about 10 to 12 DPA (Lamacchia et al., 2001),whereas CSLF6 expression begins earlier (Fig. 1). En-zyme fingerprinting was therefore also carried out ondeveloping caryopses of transgenic line 15 (chosen asthe only line with a single copy of the transgene), thecorresponding null segregant control line (15N), andthe wild-type control line 23 at 10 DPA, 14 DPA, and 21DPA (Fig. 5B). The results were consistent with theexpression pattern of the HMW subunit promoter,with no differences being observed between the G3 +G4 contents of the three lines at 10 DPA but withsignificant (P = 0.002; P = 0.005) decreases in theproportions of G3 + G4 fragments in the transgenicline at 14 DPA (24.06% decrease) and 21 DPA (16.79%decrease). The difference in G3 + G4 between the 15Tand 15N lines was therefore less than half as great at 21DPA (Fig. 5B) as in mature seed (Fig. 5A). A possibleexplanation for this observation is that although theabundance of the CSLF6 transcript was low after 21DPA the encoded enzyme was still active, leading togreater cumulative differences between b-glucanamounts in the mature 15T and 15N grain.No statistically significant differences were ob-
served in the ratios of G3 to G4 fragments in the threelines at 10 DPA and 14 DPA (P = 0.210 and 0.135,
respectively) while at 21 DPA the transgenic line wasnot significantly different from the wild-type controlline 23 (lowest value) but the null segregant controlline 15N (highest value) was significantly differentfrom the other two lines (P = 0.015). The ratios in thethree lines at 10 DPAwere consistent with those in themature grain samples (2.01–2.65 compared with 2.25–2.62) whereas the ratios at 14 DPA and 21 DPA werelower (1.62–1.74 and 2.13–2.08, respectively). How-ever, it is clear that these differences were not relatedto the presence of the transgene.
Table I. Contents and properties of b-glucans in wholegrain samples of the transgenic and control lines
Contents of total and hot-water-extractable (WE) b-glucans. Mrs of WE b-glucans determined by SE-HPLC using Calcofluor for detection andpercentiles describing the Mr at which 10%, 50%, and 90% of the distribution fall below that value (g/mol 3 104).
Line (n = 3)aTotal b-Glucan (g/100 g
Dry Wt; Mean 6 SD)
P , 0.001
WE b-Glucan (% Dry
Wt; Mean 6 SD)bWE b-Glucan
(% Total b-Glucan)
Mcf of b-Glucan (g/mol 3 104)
Averageb (Mean 6 SD) p10 p50 p90
9T (transgenic) 0.437 6 0.091 0.05 6 0.011 12.58 36.0 6 4.51 2.61 16.31 89.71
7T (transgenic) 0.577 6 0.092 0.06 6 0.011 9.71 43 6 6.41,2 2.91 17.61 113.41,2
21T (transgenic) 0.410 6 0.091 0.06 6 0.011 14.63 45.3 6 4.21.2 2.91 18.11 116.81,2
4T (transgenic) 0.461 6 0.091 0.06 6 0.011 13.67 47.5 6 6.11,2 2.01 15.71 128.01.2
15T (transgenic) 0.607 6 0.92 0.07 6 0.012,3 11.86 56.6 6 1.72,3 3.11,2 21.31 160.32,3
20N (control)c 0.872 6 0.043 0.16 6 0.023 18.24 84.8 6 9.54 4.93 44.52 229.14
23C (control)c 0.888 6 0.043 0.14 6 0.022,3 15.54 78 6 5.14 5.23 41.62 212.83,4
15N (control)c 0.825 6 0.043 0.11 6 0.021.2 13.57 83.9 6 2.54 4.62,3 40.42 232.44
aBiological replicates. bFigures with different superscripts within a column are significantly different from each other (P , 0.01). c15N and20N are null segregants from transformed lines. 23C is a nontransformed control line that had been subjected to the same transformation andregeneration conditions as the transformed lines.
Figure 3. HPAEC analysis of oligosaccharides produced by enzymemapping of transgenic and control lines. A trace from transgenic line 9(green) is overlaid on a trace from the null control line 15 (red).Detector response is measured in nC, retention time in minutes. G3 andG4 are glucan fragments released from b-glucan by digestion withlichenase; X and XX are Xyl and xylobiose released from AX bydigestion with endoxylanase. Peaks 1 to 7 are AXOS released from AXby digestion with endoxylanase: 1 = XA3X, 2 = XA3XX, 3 = XA2+3XX,4 = XA3A3XX, 5 = XA3XA3XX, 6 = XA3A2+3XX, and 7 = XA3XA2+3XX. Allidentified peaks were integrated (Supplemental Table S4) and used forPCA analysis (Fig. 4; Supplemental Fig. S5).
Decreased b-Glucan in Wheat by RNAi Inhibition of CSLF6
Plant Physiol. Vol. 152, 2010 1213

Effect on b-Glucan Molecular Weight
The content of hot-water-extractable b-glucan inwholemeal flour was 0.11% to 0.16% of dry matter inthe control lines, with the highest content in line 20N.The content was significantly lower (P , 0.001) in thetransgenic samples (0.05%–0.07% of dry matter), withthe highest content being in sample 15T. These values
correspond to between 9.7% and 14.6% of the totalb-glucan in the transgenic lines and between 13.6%and 18.2% of the total b-glucan in the control lines.However, the differences between the transgenic andcontrol lines were not significantly different (P =0.069).
The Mr distribution of the hot-water-extractableb-glucan was determined by high-performance size-exclusion chromatography (Fig. 6). The Mr distribu-tion in the control samples (lines 20N, 23C, and 15N)was either bimodal or polymodal (i.e. with two orthree populations of b-glucan being present). Thetransgenic samples showed clear differences in Mrdistribution, with the high Mr population of b-glucanbeing reduced to a small shoulder (lines 9T, 15T, and21T are shown in Fig. 6; lines 4T and 7T had similarpatterns and are therefore not shown).
The Calcofluor average Mr (Mcf) of the hot-water-extractable b-glucan was 79 to 85 3 104 g/mol in thecontrol samples, but was significantly lower in thetransgenic samples (36–57 3 104 g/mol; Table I).Within the transgenic lines the highest Mcf was ob-served in line 15T that had the smallest decrease inb-glucan compared to the control plants, and the Mcfdecreased with increasing reduction in b-glucan. TheMr percentiles at 10%, 50%, and 90% were also signif-icantly lower for the transgenic lines (2.0–3.1 3 104 g/mol, 16.3–21.3 3 104 g/mol, and 89.7–160.3 3 104
g/mol, respectively) than for the control samples(4.6–5.2 3 104 g/mol, 40.4–44.5 3 104 g/mol, and213–232 3 104 g/mol, respectively), with 15T againhaving the highest value of the transgenic lines. TheMr percentile at 90% also decreased with increasingdown-regulation for the transgenic samples.
Figure 4. PCA of the enzyme fingerprinting (HPAEC) results of matureseeds of five transgenic and three control lines. The loading plot (seeSupplemental Fig. S5) shows that the first principal component PC1 ismainly related to variation in G3 and G4 peaks and thus indicatedvariation in the proportions of b-glucans among samples. Samples onthe right part of the plot are depleted in b-glucans compared to sampleson the left part of the plot.
Figure 5. Areas of HPAEC peaks cor-responding to G3 + G4 fragments inmature grain (A) and developing cary-opses (B) of transgenic (4T, 7T, 9T, 15T,and 21T) and control (15N, 20N, and23C) lines. Values in bars show G3 toG4 ratios in the different lines. daa,Days after anthesis. [See online articlefor color version of this figure.]
Nemeth et al.
1214 Plant Physiol. Vol. 152, 2010

The decrease in b-glucan content determined byenzyme fingerprinting of the transgenic lines was sig-nificantly correlatedwith the decrease in the averageMr(r = 0.902, P = 0.036) and with p90 (r = 0.925, P = 0.024).
Immunolocalization of b-Glucan
Immunolocalization of b-glucan was carried out insemithin sections of mature grain (Fig. 7, A–D) anddeveloping caryopses (Fig. 7, E–J). Strong labeling ofthe aleurone layer was observed in all samples (whichis consistent with the presence of thick cell wallscomprising about 29% b-glucan; Bacic and Stone,1981) and of the pericarp and nucellar epidermis inthe developing caryopses. No differences were ob-served between the control and transgenic lines inlabeling of the starchy endosperm cell walls at 10 DPA(Fig. 7, I and J) and little difference at 14 DPA (Fig. 7, Gand H). However, clear differences were observed at21 DPA (Fig. 7, E and F) and maturity (Fig. 7, A–D)with line 9T (Fig. 7, A and E) showing reduced labelingthroughout the starchy endosperm when comparedwith the control lines and line T15 showing a less
uniform pattern of reduction in labeling (Fig. 7, C andF; being greater in the outer cells of the tissue). Theseouter endosperm cells correspond to those that areadded most recently during grain development bydivision of the aleurone cells (Bechtel and Wilson,2003). The labeling differences are consistent with thecontrol of RNAi expression by the glutenin promoterand with the amounts of b-glucan determined usingthe Megazyme kit and enzyme fingerprinting.
DISCUSSION
The amount and properties of b-glucan have im-portant impacts on the utilization of both wheat andbarley. Both cereals are widely used as feed for mono-
Figure 6. SE-HPLC profiles showing the Mr distribution of water-extractable b-glucan from wholemeal samples of mature grain oftransgenic (9T, 21T, and 15T) and control (20N, 23C, and 15N) lines ofwheat. The dotted lines represent the Calcofluor average Mrs.
Figure 7. Immunolabeling of b-glucan in mature grain (A–D) anddeveloping caryopses (E–J) of transgenic (sections on left) and control(sections on right) lines of wheat. Bars = 100 mm. al, Aleurone layer; en,starchy endosperm; ne, nucellar epidermis; pe, pericarp.
Decreased b-Glucan in Wheat by RNAi Inhibition of CSLF6
Plant Physiol. Vol. 152, 2010 1215

gastric livestock, notably pigs and poultry. In this casethe high viscosity conferred by b-glucan has negativeeffects on feed intake, feed conversion rate, and weightgain, and may result in sticky feces when used to feedchickens (Hesselman et al., 1981). Although this prob-lem may be alleviated by adding b-glucanase to de-grade b-glucan in the feed and thus lower gut viscosity(Hesselman and Aman, 1986), reducing the amountand viscosity of the b-glucan in the grain is a moreattractive option. b-Glucan content and Mr are alsoimportant in malt and beer production, where highviscosity causes problems with haze formation andwort filtration (Bamforth, 1982), and in starch produc-tion where a high content of b-glucan may reduce theyield of starch. In contrast, high contents of solubleb-glucan are favored for food products as they mayreduce serum cholesterol levels (McIntosh et al., 1991;Bourdon et al., 1999) as well as regulate blood Glc andinsulin (Cavallero et al., 2002; Wood, 2007).
We have shown that down-regulation of theTaCSLF6 gene is sufficient to reduce the amount ofb-glucan in the starchy endosperm of wheat to lessthan half of that in control lines. Expression of thetransgene did not result in any consistent effects on theratio of G3 to G4 fragments released on digestion withlichenase, suggesting that the synthesis of both 1,3 and1,4 linkages was affected. This does not necessarilyimply the encoded enzyme is capable of forming bothlinkages, as its removal could affect a multienzymecomplex or stop the production of a substrate. How-ever, the Mr of the polymer was reduced, which couldresult from the deposition of incompletely synthe-sized, and therefore shorter, polysaccharide chainsinto the wall due to limiting activity of the glucansynthase. Only one form of CSLF was expressed in thedeveloping grain at significant levels, which is consis-tent with the same enzyme catalyzing b-glucan syn-thesis in the developing starchy endosperm (the tissuestudied here) and other grain tissues.
The TaCSLF6 gene reported here is a close ortholog ofthe barley HvCSLF6 gene (Supplemental Fig. S1) thatwas shown by Burton et al. (2008) to be similarly highlyexpressed in barley endosperm. A role of this gene inb-glucan synthesis in barley grain is also implied byanalysis of the bgl mutant line (Tonooka et al., 2009).
Rice CSLF genes were shown to mediate the syn-thesis of b-glucan in transgenic Arabidopsis (Burtonet al., 2006). However, subsequent work from the samegroup showed that similar activity was displayed bytransformation with a barley CSLH gene (Doblin et al.,2009). An ortholog of this gene is present in wheat but,as was the case in barley, the transcript levels indeveloping grain were very low (too low to show inFig. 1A), which implies that it has little or no role in thesynthesis of wheat grain b-glucan. Doblin et al. (2009)also suggested that the major role of the HvCSLH1gene is the synthesis of b-glucan in secondary cellwalls, based on in situ PCR localization in leaf tissues.
We therefore conclude that TaCSLF6 plays a majorrole in mediating b-glucan synthesis in developing
grain of wheat and hence a key target for manipulationto increase or decrease total b-glucan. Furthermore,the effects of RNAi suppression on b-glucan Mr indi-cate that indirect effects onMr and viscosity may occurby altering the relationship between enzyme activityand substrate availability.
MATERIALS AND METHODS
Array Analysis
Array analysis procedures were as previously reported (Wan et al., 2008).
Wheat (Triticum aestivum) ESTs were assigned to rice (Oryza sativa) genes and
assembled into contigs using the WhETS tool (Mitchell et al., 2007). PCR
primers were designed to these sequences as the first step in cloning the CSL
transcripts from grain cDNA.
cDNA Cloning and Construction of RNAi
Expression Cassettes
Partial (CSLF6 and CSLD4) and full-length (CSLF6) cDNAwas amplified by
RT-PCR from RNA isolated from 14-DPA endosperm of cv Cadenza using PCR
primers SP for CK201603, ASP1 for RACE/F6longer, SP_CSLF6 andASP_CSLF6
(CSLF6), and SP_CSLD4 and ASP_CSLD4 (CSLD4) (Supplemental Table S4).
cDNAs were A tailed and cloned in pGEM-T Easy (Promega) and sequenced.
For construction of RNAi expression cassettes DNA fragments correspond-
ing to CSLF6 and CSLD4 were amplified using the PCR primers indicated in
Supplemental Table S4 using partial cDNA clones as the templates. The RNAi
fragment sequenceswere used to search all public domainwheat sequences and
the only sequences that had stretches of identity of 20 bp ormore were the target
genes; namely CSLF6 for the CSLF6 fragment and CSLD2 and CSLD4 for the
CSLD4 fragment. The reaction products were cloned, excised using BamHI and
BglII, and ligated as inverted repeats on either side of the maize (Zea mays) Adh2
intron in the plasmid pHMW-Adh-Nos, an RNAi expression cassette construc-
ted in pGEM-3Zf(+), under the control of the high Mr glutenin subunit 1Dx5
promoter (Supplemental Fig. S4; Lamacchia et al., 2001). The desired orientation
of the inserts was confirmed by BamHI and BglII restriction digestion, PCR
(using primers Dx5Pfwd with Adh5’rev and Adh3’fwd with Nos5’rev; Supple-
mental Table S4), and sequencing.
Production of Transgenic Wheat Lines and Analysis ofTransgene Segregation and Copy Number
Transformation was carried out by particle bombardment (PDS1000, Bio-
Rad) of immature scutella of cv Cadenza (Sparks and Jones, 2009) with RNAi
constructs being cobombarded with plasmid pCalNeo containing NptII for
plant selection. PCR of genomic DNAwas used to confirm the presence of the
transgenes and the segregation in T1 plants: using primers Neo1 with Neo2
for the NptII gene and SP_CSLF6_BglII or SP_CSLD4_BglII with Nos5’rev for
the CSLF6 and CSLD4 genes, respectively (Supplemental Table S4). The x2
goodness of fit test (with 1 degree of freedom for 3:1 ratios and 3 degrees of
freedom for 9:3:3:1 ratios) was used to separate plants into genetic classes.
Genomic DNA was subjected to quantitative PCR using TaqMan probes to
determine transgene copy number and zygosity of individual plants (Sup-
plemental Table S5; analysis performed by iDNA Genetics).
Plant Material and Growth Conditions
Plantmaterial for transformationwasproducedaccordingtoSparksand Jones
(2009). All other plant material was grown in the glasshouse with 18�C to 20�Cday and 14�C to 16�C night temperatures with a 16-h photoperiod provided by
natural light supplemented with banks of Son-T 400 W sodium lamps (Osram,
Ltd.) giving 400 to 1,000 mmol m22 s21 photosynthetically active radiation.
T2 grain from five homozygous transgenic wheat lines carrying RNAi
designed against CSLF6 (lines 9T, 7T, 21T, 4T, and 15T) and three controls
(lines 20N, 15N, and 23C) were sown to provide mature T3 grain for analyses.
For each line three 25-cm pots, with four plants per pot, were randomized and
grown in the same glasshouse compartment at the same time. Grain weight
Nemeth et al.
1216 Plant Physiol. Vol. 152, 2010

was determined using four replicate samples (except for line 7T for which
only two replicate samples were available) of grain from the main tillers of
individual plants for each of five transgenic and three control lines.
qRT-PCR
Seeds of line 15T and segregating nulls, 14 DPA, were frozen in liquid
nitrogen and stored at 280�C. For RNA extraction seeds were freeze dried and
the endosperm extracted by peeling off the outer layers. After homogenization
in a TissueLizer (Qiagen) total RNAwas extracted according toWan et al. (2008).
RT and qRT-PCR was performed as described in Pellny et al. (2008). The
expression of the native gene as well as the transgene was determined with the
primers SP_CSLF6_RNAi_2739 and ASP_CSLF6_RNAi_2828 that give an am-
plicon within the RNAi construct. To test for the down-regulation of the native
gene the sense primer was chosen to be just outside of the construct
(SP_CSLF6_RNAi_2669) with the same antisense primer amplifying an extra
30 bp at the 5# end of the RNAi construct and all but 3 bp at the 3# end. Theexpression of these amplicons was normalized against Ta2526 (prTYW19_
Ta2526_qPCR_F and prTYW20_Ta2526_qPCR_R), an EST that was shown to be
stably expressed in wheat grain development (Wan et al., 2008). Results are
displayed as relative expression of four transgenics compared to between four
and seven nulls and significant differences were calculated by ANOVA after
data transformations as proposed by Rieu and Powers (2009).
b-Glucan Analysis
For total b-glucan analysis, enzyme fingerprinting and determination of
b-glucan Mr distribution finely ground freeze-dried developing caryopses
(enzyme fingerprinting only) or wholegrain flour (all methods) was used.
Three biological replicates consisting of 30 seeds each from the main tillers of
three individual plants (a total of 90 seeds per replicate) were analyzed.
Total b-glucan was determined using a Megazyme kit. Endoxylanase (EC
3.2.1.8) from Trichoderma viridewas purchased fromMegazyme (XylanaseM1).
The activity of the enzyme preparation determined by the supplier on WE-AX
(40�C, pH 4.5) was 1,670 units/mL. pH optimum is 4.5 to 5.0. Lichenase [endo-
1,3(4)-b-D-glucanase, EC 3.2.1.73] from Bacillus subtilis was purchased from
Megazyme. The activity of the enzyme preparation on barley (Hordeum
vulgare) b-glucan (40�C, pH 6.5) determined by the supplier was 1,000 units/
mL. pH optimum is 6.5 to 7.0.
Enzyme fingerprinting samples (100 mg) weighed in an Eppendorf tube (2
mL)were treatedwith 1.5mL ethanol solution (80%, v/v) in a boilingwater bath
for 5 min. The supernatant was removed and the residue successively washed
with 1.5 mL ethanol (80%, v/v) and 1.5 mL ethanol (95%, v/v) solutions. The
supernatant was then discarded and the residue dried for 2 h in an oven at 40�C.Samples were then digested overnight (16 h) with 2 units lichenase and 16 units
endoxylanase (Ordaz-Ortiz et al., 2005; Saulnier et al., 2009). The degradation
was carried out in water at a pH 6.0 compatible with the use of both enzymes in
one run. After centrifugation, supernatant of the digested samples was diluted
with water (1/40) and 10-mL aliquots were injected on a Carbopac PA-1 (53 250
mm) analytical column (Dionex) run at 25�C with a flow rate of 1 mL/min.
AXOS and GOS were separated using the following elution conditions with
Ultrapure water (A), 1 M NaOAc (B), and 0.5 M NaOH (C): 0 min (A: 80%, C:
20%), 35 min (A: 60%, B: 20%, C: 20%); 36 min (A: 80%, C: 20%), hold up to 60
min. Detection was realized with a TSP EC2000 pulse amperometric detector
(Thermo Separation Products) using the pulse potentials E1 = +0.05 V, E2 = +0.6
V, and E3 = 20.6 V. Typical chromatograms are shown on Figure 2. Peak
identification was based on the retention times of reference compounds previ-
ously isolated (Ordaz-Ortiz et al., 2004, 2005; Saulnier et al., 2009). It was checked
that in the conditions used, GOS and especially G3 and G4 were not coeluted
with peaks generated by the endoxylanase (Saulnier et al., 2009). Overlay of
chromatogramwas realized using raw data and adjustment of the baseline to the
same level without peak normalization.
For PCA (Fig. 3; Supplemental Fig. S5) peak areas (Supplemental Table S3)
were normalized for each chromatogram as follows: SNPeaki ¼ ðSPeaki=+i¼n
i¼1SPeakiÞ3100X, with SNPeaki being the normalized area of peak i and
SPeaki the area of peak i (Ordaz-Ortiz et al., 2005; Saulnier et al., 2009).
For determination of Mr distribution, samples were extracted with boiling
water containing thermostable a-amylase and analyzed by high-performance
size-exclusion chromatography with fluorescence detection as described by
Rimsten et al. (2003), except that 0.0025% Calcofluor was used and that the pH
of the Calcofluor solution was not adjusted. This detection method is selective
for b-glucan in extracts and the fluorescence response is independent ofMr. It
will, however, excludeMrs below 104 (Munck, 1989). TheMr is therefore given
as Calcofluor average Mr (Mcf), which is the same as weight average Mr for
samples that only contain highMr b-glucan.Mcf and percentiles (p10, p50, and
p90) describing the Mr at which 10%, 50%, and 90% of the distribution fall
below were calculated by using a calibration curve established with narrow
Mr b-glucan standards (Rimsten et al., 2003). The content of b-glucan in the
extracts (content of water-extractable b-glucan) was also calculated by using
the area of the peak as described by Rimsten et al. (2003). The repeatability was
,15% for the three biological replicates analyzed. The results were evaluated
statistically with ANOVA, generalized linear model procedure, and Tukey’s
pairwise comparison (Minitab 15).
Immunomicroscopy
One-millimeter sections were fixed in 3% paraformaldehyde and 2%
glutaraldehyde in phosphate buffer (0.1 M, pH 7.2), dehydrated in a graded
aqueous ethanol series, and infiltrated with London Resin White acrylic resin.
One-micrometer sections were mounted onto multiwell glass sides and
preincubated in phosphate-buffered saline (PBS) containing 3% (w/v) bovine
serum albumin (BSA) for 30 min and then incubated for 1 h with PBS
containing 1% (w/v) BSA, 0.01% Tween 20 (PBS-BSA), and 1:1,000 dilution of
mAb anti-b-glucan (Meikle et al., 1994; Biosupplies Pty Ltd.). After extensive
washing in PBS they were incubated for 1 h in the dark with marker-
conjugated goat anti-mouse antibody labeled with Alexa Fluor 546 (Molecular
Probes, distributed by Interchim) diluted 100-fold in PBS 0.3% BSA. Nonspe-
cific staining was identified using controls omitting the primary antibody.
Sections were examined with a LEICA DMRD microscope equipped with
epifluorescence using a band-pass filter at 515 to 560 nm for excitation filters
and fluorescence detected at .570 nm.
Sequence data from this article can be found in the GenBank/EMBL data
libraries under accession number AM743080.
Supplemental Data
The following materials are available in the online version of this article.
Supplemental Figure S1. Alignment of wheat, barley, and rice CSLF6
protein sequences, with that encoded by the OsCSLF2.
Supplemental Figure S2. Sequence of 3# end of TaCSLF6 gene coding
region (accession AM743080.2).
Supplemental Figure S3. Sequence of 3# end of TaCSLD4 gene coding
region and CSLD2/4 RNAi fragment.
Supplemental Figure S4. Schematic representation of construction of
RNAi expression vectors.
Supplemental Figure S5. Loading plot for PCA of the enzyme fingerprints
of mature seeds of five control and three transgenic lines.
Supplemental Table S1. Transcript abundance for all CSL genes repre-
sented on wheat Affymetrix GeneChip.
Supplemental Table S2. Wheat EST counts for sequences mapped to rice
CSL genes.
Supplemental Table S3. Enzyme mapping of cell wall polysaccharides in
mature grain, determined by HPAEC.
Supplemental Table S4.DNA sequences and targets for PCR primers used
in this work.
Supplemental Table S5. Segregation and copy number analysis of 16
transgenic wheat lines.
ACKNOWLEDGMENT
This publication reflects the authors’ views and the European Union is not
liable for any use that may be made of the information contained in this
publication.
Received December 12, 2009; accepted January 9, 2010; published January 20,
2010.
Decreased b-Glucan in Wheat by RNAi Inhibition of CSLF6
Plant Physiol. Vol. 152, 2010 1217

LITERATURE CITED
Anonymous (2008) Final Rule on Soluble Fiber from Certain Foods and
Risk of Coronary Heart Disease (73 FR 47828). U.S. Food and Drug
Administration, College Park, MD
Bacic A, Stone BA (1980) A (1/3)- and (1/4)-linked b-D-glucan in the
endosperm cell walls of wheat. Carbohydr Res 82: 372–387
Bacic A, Stone BA (1981) Chemistry and organisation of aleurone cell wall
components from wheat and barley. Aust J Plant Physiol 8: 475–495
Bamforth CW (1982) Barley b-glucans: their role in malting and brewing.
Brewers Digest 57: 22–27
Bechtel D, Wilson JD (2003) Amyloplast formation and starch granule
development in hard red winter wheat. Cereal Chem 80: 175–183
Bernal AJ, Yoo CM,Mutwil M, Jensen JK, Hou G, Blaukopf C, Sorensen I,
Blancaflor EB, Scheller HV, Willats WGT (2008) Functional analysis of
the cellulose synthase-like genes CSLD1, CSLD2, and CSLD4 in tip-
growing Arabidopsis cells. Plant Physiol 148: 1238–1253
Bourdon I, Yokoyama W, Davis P, Hudson C, Backus R, Richter D,
Knuckles B, Schneeman BO (1999) Postprandial lipid, glucose, insulin
and cholecystokinin responses in men fed barley pasta enriched with
b-glucan. Am J Clin Nutr 69: 55–63
BurtonRA, JoblingSA,HarveyAJ,ShirleyNJ,MatherDE,BacicA, FincherGB
(2008) The genetics and transcriptional profiles of the cellulose synthase-like
HvCSLF gene family in barley. Plant Physiol 146: 1821–1833
Burton RA, Wilson SM, Hrmova M, Harvey AJ, Shirley NJ, Medhurst A,
Stone BA, Newbigin EJ, Bacic A, Fincher GB (2006) Cellulose synthase-
like CSLF genes mediate the synthesis of cell wall (1,3;1,4)-b-D-glucans.
Science 311: 1940–1942
Cavallero A, Empilli S, Brighenti F, Stanca AM (2002) High (1/3, 1/4)-
b-glucan barley fractions in bread making and their effect on human
glycemic response. J Cereal Sci 36: 59–66
Cocuron JC, Lerouxel O, Drakakaki G, Alonso AP, Liepman AH, Keegstra
K, Raikhel N, Wilkerson CG (2007) A gene from the cellulose synthase-
like C family encodes a beta-1,4 glucan synthase. Proc Natl Acad Sci
USA 104: 8550–8555
Cui W, Wood PJ, Blackwell B, Nikiforuk J (2000) Physicochemical
properties and structural characterization by two-dimensional NMR
spectroscopy of wheat beta-D-glucan—comparison with other cereal
beta-D-glucans. Carbohydr Polym 41: 249–258
Dhugga KS, Barreiro R, Whitten B, Stecca K, Hazebroek J, Randhawa GS,
Dolan M, Kinney AJ, Tomes D, Nichols S,et al (2004) Guar seed beta-
mannan synthase is a member of the cellulose synthase super gene
family. Science 303: 363–366
Doblin MS, Pettolino FA, Wilson SM, Campbell R, Burton RA, Fincher
GB, Newbigin E, Bacic A (2009) A barley cellulose synthase-like CSLH
gene mediates (1,3;1,4)-b-D-glucan synthesis in transgenic Arabidopsis.
Proc Natl Acad Sci USA 106: 5996–6001
Faure R, Courtin CM, Delcour JA, Dumon C, Faulds CB, Fincher GB, Fort
S, Fry SC, Halila S, Kabel MA, et al (2009) A brief and informationally
rich naming system for oligosaccharide motifs of heteroxylans found in
plant cell walls. Aust J Chem 62: 1–5
Hazen S, Scott-Craig SJ, Walton J (2002) Cellulose synthase-like genes of
rice. Plant Physiol 128: 336–340
Henry RJ (1987) Pentosan and (1/3),(1/4)-b-glucan concentrations in
endosperm and wholegrain of wheat, barley, oats and rye. J Cereal Sci 6:
252–258
Hesselman K, Aman P (1986) The effect of b-glucanase on the utilization of
starch and nitrogen by broiler chickens fed on barley of low- or high-
viscosity. Anim Feed Sci Technol 15: 83–93
Hesselman K, Elwinger K, Nilsson M, Thomke S (1981) The effects of
beta-glucanase supplementation, stage of ripeness, and storage treat-
ment of barley in diets fed to broiler chickens. Poult Sci 60: 2664–2671
Lamacchia C, Shewry PR, Di Fonzo N, Forsyth J, Harris N, Lazzeri PA, Napier
JA, Halford NG, Barcelo P (2001) Endosperm-specific activity of a storage
protein gene promoter in transgenic wheat seed. J Exp Bot 52: 243–250
Lazaridou A, Biliaderis CG (2007) Molecular aspects of cereal b-glucan
functionality: physical properties, technological applications and phys-
iological effects. J Cereal Sci 46: 101–118
Li W, Cui SW, Kakuda Y (2006) Extraction, fractionation, structural and
physical characterization of wheat b-D-glucans. Carbohydr Polym 63:
408–416
Liepman AH, Nairn CJ, Willats WG, Sørensen I, Roberts AW, Keegstra K
(2007) Functional genomic analysis supports conservation of function
among cellulose synthase-like a gene family members and suggests
diverse roles of mannans in plants. Plant Physiol 143: 1881–1893
McIntosh GH, Whyte J, McArthur R, Nestel PJ (1991) Barley and wheat
foods: influence on plasma cholesterol concentration in hypercholester-
olemic men. Am J Clin Nutr 53: 1205–1209
Meikle PJ, Hoogenraad NJ, Bonig I, Clarke AE, Stone BA (1994) A (1-3,1-
4)-beta-glucan-specific monoclonal-antibody and its use in the quanti-
tation and immunocyto-chemical location of (1-3,1-4)-beta-glucans.
Plant J 5: 1–9
Mitchell RAC, Castells-Brooke N, Taubert J, Verrier PJ, Leader DJ,
Rawlings CJ (2007) Wheat Estimated Transcript Server (WhETS): a
tool to provide best estimate of hexaploid wheat transcript sequence.
Nucleic Acids Res 35: W148–151
Munck L (1989) Practical experiences in development of fluorescence analyses
in an applied food research laboratory. In L Munck, ed, Fluorescence
Analyses in Foods. Longman Scientific and Technical, Harlow, UK, pp 1–32
Ordaz-Ortiz JJ, Devaux MF, Saulnier L (2005) Classification of wheat varieties
based on structural features of arabinoxylans as revealed by endoxylanase
treatment of flour and grain. J Agric Food Chem 53: 8349–8356
Ordaz-Ortiz JJ, Guillon F, Tranquet O, Dervilly-Pinel G, Tran V, Saulnier
L (2004) Specificity of monoclonal antibodies generated against arabi-
noxylans of cereal grains. Carbohydr Polym 57: 425–433
Pellny TK, Van Aken O, Dutilleul C, Wolff T, Groten K, Bor M, De Paepe
R, Reyss A, Van Breusegem F, Noctor G, et al (2008) Mitochondrial
respiratory pathways modulate nitrate sensing and nitrogen-dependent
regulation of plant architecture in Nicotiana sylvestris. Plant J 54: 976–992
Philippe S, Saulnier L, Guillon F (2006) Arabinoxylan and (1 / 3),(1/ 4)-
beta-glucan deposition in cell walls during wheat endosperm develop-
ment. Planta 224: 449–461
Richmond T, Somerville C (2000) The cellulose synthase superfamily.
Plant Physiol 124: 495–498
Rieu I, Powers SJ (2009) Real-time quantitative RT-PCR: design, calcula-
tions and statistics. Plant Cell 21: 1031–1033
Rimsten L, Stenberg T, Andersson R, Andersson A, Aman P (2003)
Extraction of cereal b-glucan and determination of molecular weight
using SEC with calcofluor detection. Cereal Chem 80: 485–490
Saulnier L, Guillon F, Sado PE (2007a) Plant cell wall polysaccharides in
storage organs: xylans (food applications). In J Kamerling, G-J Boons, Y
Lee, A Suzuki, N Taniguchi, AGJ Voragen, eds, Comprehensive Glyco-
science. Elsevier, Amsterdam, pp 653–689
Saulnier L, Robert P, Grintchenko M, Jamme F, Bouchet B, Guillon F
(2009) Wheat endosperm cell walls: spatial heterogeneity of polysac-
charide structure and composition using micro-scale enzymatic finger-
printing and FT-IR microspectroscopy. J Cereal Sci 50: 312–317
Saulnier L, Sado PE, Branlard G, Charmet G, Guillon F (2007b) Wheat
arabinoxylans: exploiting variation in amount and composition to
develop enhanced varieties. J Cereal Sci 46: 261–281
Shewry PR, Underwood C, Wan Y, Lovegrove A, Bhandari D, Toole G,
Mills ENC, Denyer K, Mitchell RAC (2009) Storage product synthesis
and accumulation in developing grains of wheat. J Cereal Sci 50: 106–112
Sparks CA, Jones HD (2009) Biolistics transformation of wheat. In HD
Jones, PR Shewry, J Walker, eds, Methods in Biotechnology. Transgenic
Wheat, Barley and Oats: Production and Characterization. Humana
Press, Totowa, NJ, pp 71–92
Stone B, Morell MK (2009) Carbohydrates. In K Khan, PR Shewry, eds,
Wheat: Chemistry and Technology, Ed 4. AACC, St. Paul, pp 299–362
Stone BA (1996) Cereal grain carbohydrates. In RJ Henry, PS Kettlewell,
eds, Cereal Grain Quality. Chapman and Hall, London, pp 250–288
Tonooka T, Aoki E, Yoshioka T, Taketa S (2009) A novel mutant gene for
(1-3,1-4)-b-D-glucanless grain on barley (Hordeum vulgare L.) chromo-
some 7H. Breed Sci 59: 47–54
Topping D (2007) Cereal complex carbohydrates and their contribution to
human health. J Cereal Sci 46: 220–229
Wan Y, Poole RL, Huttly AK, Toscano-Underwood C, Feeney K, Welham
S, Gooding MJ, Mills ENC, Edwards KJ, Shewry PR, et al (2008)
Transcriptome analysis of grain development in hexaploid wheat. BMC
Genomics 9: 121
Wood J (2007) Cereal b-glucans in diet and health. J Cereal Sci 46: 230–238
Wood PJ, Weisz J, Blackwell BA (1991) Molecular characterization of cereal
b-D-glucans: structural analysis of oat b-D-glucan and rapid structural
evaluation of b-d-glucans from different sources by high-performance
liquid chromatography of oligosaccharides released by lichenase.
Cereal Chem 68: 31–39
Nemeth et al.
1218 Plant Physiol. Vol. 152, 2010
Copyright © 2022 FDOKUMEN