Phase behaviour of oat β-glucan/sodium caseinate mixtures varying in molecular weight
Upload
independentCategory
view
4download
0
The microstructure of foamed maltodextrin/sodiumcaseinate powders: a comparative study by microscopy
and physical techniques
Annemarie Schoonman, Guy Mayor, Marie-Lise Dillmann, Chris Bisperink1,Job Ubbink*
Nestle Research Center, CH-1000 Lausanne 26, Switzerland
Received 13 February 2001; accepted 8 May 2001
Abstract
Microscopy followed by image analysis is combined with physical characterisation techniques in order to obtain informationabout the structure of solid foams consisting of maltodextrin DE12 and sodium caseinate (10–30% w/w) processed under varying
foaming conditions. Thin sections of solid foam were analysed by microscopy and image analysis for closed porosity, bubble sizedistribution and bubble connectivity. The bubble size distribution in the range up to about 25 mm was found to be largely inde-pendent of the degree of foaming. The total porosity of the solid foams, as determined by image analysis, was in very good agree-
ment with the results from helium pycnometry and a direct relationship between the porosity and surface area as measured by BETnitrogen adsorption is obtained. Mercury intrusion porosimetry was found to be of limited use for the analysis of the open porestructure because of the fragility of the powders and the overlap in size between bubbles and interstitial spaces between the powderparticles. # 2001 Elsevier Science Ltd. All rights reserved.
Keywords:Microscopy; Image analysis; Microstructure; Physical characterisation; Food powders
1. Introduction
Many food products and ingredients are porous. Theporosity of products may be open, like in a sponge, orclosed, as in a foam, or anywhere in between. Examplesof solid, porous food products are bread, cakes, break-fast cereals, instant food and beverage powders, foamedchocolate bars and waffles. The porosity has a majoreffect on a material’s mechanical properties, such astensile strength (Huang & Clayton, 1990), stiffness(Scanlon, Segall, & Cenkowski, 1999), and deform-ability (Pinthus, Weinberg, & Saguy, 1995) and onphysico-chemical properties such as dissolution char-acteristics (El Saleh & Kleinebudde, 1998), wettability(Shubert, 1980), various transport properties like ther-mal conductivity (Rahman, Chen, & Perera, 1997) anddiffusion of aromas or low molecular weight com-
pounds (Goubet, Le Quere & Voilley, 1998; Rosenberg,Kopelman, & Talmon, 1990; Voilley & Le Meste, 1985).The microstructure of solid foams may be influenced
by environmental conditions like temperature orhumidity resulting in stickiness (Downton, Flores-Luna,& King, 1982), collapse (Bellows & King, 1972; To &Flink, 1978a, 1978b, 1978c; Tsourouflis, Flink, & Karel,1976) and crystallisation (Roos & Karel, 1991; Slade &Levine, 1991). The surface area and porosity of powdersdepend strongly on the processing parameters. Accord-ing to Berlin, Kliman, and Pallansch (1966), the surfacearea of milk powder is directly proportional to thevolume of nitrogen injected into the liquid milk prior tospray drying. Good dispersibility, wettability and solu-bility are prerequisites for optimal reconstitution ofpowders (Tamsma & Kontson, 1974; Tamsma, Kont-son, & Pallansch, 1967). It is well known that these fac-tors are influenced by porosity, composition and processconditions. For Buma (1971), the existence of pores orcracks present in whole milk powder particles might berelated to the free fat content of such powders.Because of the major impact of porosity on the prop-
erties of the product, a precise characterisation of the
0963-9969/01/$ - see front matter # 2001 Elsevier Science Ltd. All rights reserved.
PI I : S0963-9969(01 )00116-8
Food Research International 34 (2001) 913–929
www.elsevier.com/locate/foodres
* Corresponding author. Tel.: +41-21-785-9378; fax: +41-21-785-
8554.
E-mail address: [email protected] (J. Ubbink).1 Present address: DMV-international, PO Box 13, 5460 BA
Veghel, The Netherlands

porosity and the pore structure is of great importance.A wide range of techniques are available for character-ising food structure. Aguilera and Stanley (1990)describe various techniques like fluorescence micro-scopy, transmission and scanning electron microscopyand Heertje and Paques (1995) describe techniques liketransmission electron microscopy, scanning electronmicroscopy and specific localisation techniques. Phy-sico-chemical techniques like powder pycnometry andmercury pycnometry are described by El Saleh andKleinebudde (1998).Scanning Electron Microscopy (SEM) and optical
microscopy are often used to determine the micro-structure of food materials (Aguilar & Ziegler, 1993;Gan, Angold, Williams, Ellis, Vaughan, & Galliard,1990; Hicsasmaz & Clayton, 1992; Kalab, Allan-Woj-tas, & Shea Miller, 1995; Moreau & Rosenberg, 1993;Rosenberg & Sheu, 1996; Tan, Zhang, & Gao, 1997) but>is limited to qualitative information. Quantitativeinformation may be obtained from image analysis(Gunasekaran, 1996; Tan et al., 1997). Gonzalez andWoods (1992), Haralick and Shapiro (1992), Loebl(1985), and Russ (1999) provide a concise presentationand discussion of various developments and techniquesin this field.A recent overview on the production of food foams,
their functionality and methods of analysis is given inthe book by Campbell, Webb, Pandiella, and Niranjan(1999). Although many techniques have been used todetermine the structure of foods, specific and quantita-tive data on the internal structure of foamed food pow-ders as obtained by image analysis have not often beenreported. Hinz and Eggers (1996) determined the parti-cle size distribution and macroscopic porosity of naturalbulk materials by image analysis and classical powder
measurement techniques. A good agreement betweenresults derived from image analysis and from pycno-metry and mercury porosimetry is reported.This work focuses on the structural characterisation of
foamed maltodextrin powders containing 10–30% w/wsodium caseinate.In Fig. 1 an illustration of the bulk volume of a typi-
cal foam-dried particle is shown. Fig. 2 is an illustrationof one cluster.Sodium caseinate is used because of its excellent emul-
sifying and film-forming abilities (Southward & Walker,1980; Fox & Mulvihill, 1983). Maltodextrins are knownto be resistant to caking, to bind flavours and fats, toact as an oxygen barrier, and to have an excellent dis-persibility and solubility (Setser & Racette, 1992).Light microscopy and image analysis are combined
with physical characterisation techniques in order toquantify structural features like particle size, apparentdensity, closed porosity, bubble connectivity, specificsurface area and bubble size distribution. In addition,qualitative information is obtained on the distribution ofconnective bubbles, open porosity, existence of voids orcracks and shape of pores. Each of the techniques usedin this study gives specific, but limited information.
Fig. 1. Illustration of bulk volume of typical foam-dried particle. 1. Solid matrix: matrix excluding both open and closed pores. 2. Voids: space or
interstices between particles. 3. Open pore or bubble: cavity or channel communicating with the surface of the solid. 4. Micropore: pore < 20 A. 5.
Closed pore or bubble: cavity not communicating with the surface. 6. Crack: volume of thin fractures inside the solid matrix. 7. Connected pore:
pore in connection with another pore or void volume.
Fig. 2. Illustration of one cluster.
Table 1
Composition of the samples used for physical and microscopic char-
acterisation
Sample Maltodextrin
DE 12 (% w/w )aSodium caseinate
(% w/w)aOverrun (%)
90/10 90 10 50, 100, 150
80/20 80 20 50, 100, 150
70/30 70 30 50, 100, 150
a Dry basis
914 A. Schoonman et al. / Food Research International 34 (2001) 913–929

However, by combining the results from the varioustechniques, a better profile of the internal structure ofpowders is obtained. The structural parameters men-tioned above are of importance in designing new pro-ducts, improving the production process or productperformance, for example shelf life, stability, recon-stitution and textural properties of powders.
2. Materials and methods
2.1. Preparation of powders
The various samples used for physical and micro-scopic characterisation are summarized in Table 1. Anaqueous solution (total solids 70% w/w) of maltodextrin
Fig. 3. Different steps in processing images by image analysis. a. Original stained image showing three clusters. b. After masking and removal of
background. c. After rebuilding cluster area and fine-tuning of cluster limits. d. After distinguishing connected pores (yellow) and non-connected
pores (pink).
A. Schoonman et al. / Food Research International 34 (2001) 913–929 915

DE 12 (Sugro AG, Switzerland) with varying percen-tages of sodium caseinate (10–30% w/w; Santis AG,Switzerland) was pre-foamed by injecting nitrogen in astandard rotor/stator whipping equipment and quen-ched in liquid nitrogen according to the proceduredescribed by Witschi (1999). The solid foam was freezedried, milled using a Frevitt miller (Frevitt, Switzerland)and sieved. The fraction used for this study had a par-ticle size between 0.4<d<0.9 mm, where d is the parti-cle diameter. The water activity aw of the powders was0.23 and was obtained by equilibration of the powder at25�2 �C in dessicators containing a saturated solutionof potassium acetate (Greenspan, 1977).The solid foams were prepared with three different
compositions and three levels of overrun (50, 100,150%). The overrun, defined by Eq. (1), determines thefinal porosity of the powder. It is influenced by chan-ging the amount of nitrogen injected in the dispersionprior to quenching and freeze-drying.The overrun is defined by
Overrun ¼�s � �f
�f�100% ð1Þ
where �s is the density of the solution (g/cm3) and �f is
the density of foam (g/cm3).
2.2. Sample preparation for microscopic analysis
The powder was fixed by crosslinking the proteins atroom temperature in a 2.5% solution of anhydrousglutaraldehyde in methanol. The fixation solution wasprepared by dilution of a 10% stock solution of glutar-aldehyde in methanol (Electron Microscopy Sciences,Ft. Washington, USA). After settling of the powder atthe bottom of the vial, the sample was stored at 4 �C for48 h. Afterwards, the powder was washed twice with100% methanol for 30 min and once with 100% ace-tone, also for 30 min. Next, the powder particles wereimmersed in a series of solutions containing acetone andSpurr solution (Electron Microscopy Sciences, Ft.Washington, USA) with increasing fraction of Spurrsolution starting from 33 vol.% Spurr and 66 vol.%acetone (immersion time 3 h at 20 �C), to 50 vol.%Spurr and 50 vol.% acetone (immersion time 12 h at4 �C), to 66 vol.% Spurr and 33 vol.% acetone(immersion time 12 h at 4 �C) and, finally, to 100 vol.%Spurr (immersion time 2 days at 4 �C). The Spurr solu-tion was renewed and the sample was polymerised for48 h at 70 �C. Semi-thin sections (thickness 1.5 mm) werecut with an Ultracut UCT 706200 (Leica, Austria) usingglass knives. Care was taken to assure homogeneoussampling throughout the polymerised samples contain-ing the powder particles. The samples were collected inultra-pure water and transferred to a microscope slidewhere they were allowed to flatten. After transfer to the
slides, the sections were stained with Toluidine bluesolution (1 min at 60 �C) and dried.No significant effect of the sample preparation proce-
dure on the sample structure is expected, because of theglassy nature of the matrix and because the fixationprocess is carried out essentially without water, which isthe main plasticiser and solvent for the samples. It isonly after polymerisation that the samples are in directcontact with water, but then the sample structure ismaintained by the polymerised resin and the crosslinkedproteins. Nevertheless, we have verified using SEM thatthe main structural details are essentially preserved uponsample preparation (results not shown). If, nonetheless,there would be, for example, any shrinkage of the speci-men, this shrinkage is bound to be small and would dis-appear in the (considerable) variations in porosity.
2.3. Light microscopy
Stained sections were analysed with an Axioplan 2microscope (Zeiss, Germany) in bright field mode asshown in Fig. 3a. The homogeneity of the staining wasverified by inspection of the specimen at low magnifica-tion. Final images were obtained with a �20 objectiveand digitised using a Progress 3008 camera (Zeiss, Ger-many) connected to a Macintosh computer. In order toobtain statistically valid results, a minimum of 29,000bubbles were analysed in the sample with 30% w/wsodium caseinate and overrun 50%. For the same sam-ple composition, but at overruns of 100 and 150%,40,000 respectively 60,000 bubbles were analysed.
2.4. Image analysis
The pictures were analysed with Object Image(Vischer, 2001), a public domain image analysis pro-gram based on NIH image (Rasband, 2001) with anextension for non-destructive object marking (Vischer,2001). A macro capable of handling batch files has beenspecifically developed in order to be able to auto-matically process hundreds of images.Our procedure for image analysis consists of three
main steps, which are performed on each image: (1)masking of the clusters, (2) identification and maskingof the bubbles, and (3) computation of numericalvalues. These steps are illustrated by Figs. 3 and 4 andwill be explained later. We essentially use three tools inorder to extract numeric information from the images.The AutoThreshold function implemented in Objectimage (Ridler & Calvard, 1978) is designed to correctlyfind the trough between the two peaks of a bimodaldistribution of grey levels. As our images present a clearbimodal distribution [one peak for the solid matrix,another for the empty parts of the slices (bubbles andspace external to the cluster)], this function efficientlyseparates these two grey level domains and will adapt
916 A. Schoonman et al. / Food Research International 34 (2001) 913–929

itself to variations in grey level. A Gaussian blur con-volution kernel [15�15 pixels; see Russ (1999) andRasband (2001)] is used for preliminary masking of theclusters and, in some cases, for edge rebuilding. A bin-ary watershed filter (Russ, 1999) detecting concavestructures is used to distinguish between connectedbubbles and non-connected bubbles.Cluster masking is done in two steps, using the Auto-
Threshold function of Object image. A copy of theimage is blurred (15�15 Gauss convolution) and a firstbinary mask is built by applying the AutoThresholdfunction. This mask will detect all clusters in the pictureand includes some of the external area outside of eachcluster (Fig. 3a, b; the masked clusters are indicated bythe red line in Fig. 3b). This will allow to individuallyaddress each cluster area in the next step. Each cluster isnow selected as a region of interest (ROI) and theAutoTreshold function is applied again, but to onecluster at a time, in order to build a second mask whichexactly corresponds to the limits of the cluster (Fig. 3c,green line). Doing this masking in two steps has thefollowing advantages: first, it is less sensitive to generalgrey-level gradients in the picture because we worklocally in each ROI. Prevention of any global gradientacross an image is always difficult, especially if relatively
large areas are imaged. Second, as we have already acoarsely closed ROI at that step, we can, if necessary,safely ‘‘force’’ the rebuilding of an artificial edge bybinary erosion/dilatation and mixing of the two con-tours. This is sometimes necessary for some powderclusters that have poorly defined edges in some parts oftheir contour.After proper cluster segmentation, we identify the
bubbles in each ROI by a segmentation method alsofounded on the AutoThreshold function. This gives us abinary mask (Fig. 4b) of bubbles that will be dividedinto two topological domains. The first domain containsonly isolated bubbles (non-connective domains, see e.g.the pink bubbles in Figs. 3d and 4d). The second onecontains all other bubbles, which touch at least oneother bubble (Figs. 3d and 4d, yellow bubbles). Con-nective bubbles are identified by the fact that they areseparated by the application of a watershed filter on abinary mask of all bubbles (Fig. 4b, c). Non-connectivebubbles are left untouched by this filter. This allows usto discriminate the connected bubbles from the non-connected bubbles by binary mask subtraction andidentification of the connector links (the blue line inFig. 4d). The connected bubbles (yellow) and non-con-nected bubbles (pink) are analysed separately (Figs. 3d
Fig. 4. Different steps in processing images by image analysis. a. After detection of connected bubbles in the original gray-level image (green arrow:
connected bubbles, red arrow: non-connected bubbles). b. After detection of connected bubbles by watershed filter on binary image. e. Watershed
filter detects concave structures and discriminates connected from non-connected bubbles by adding connector links. d. The watershed filter does not
always determine correctly (red arrows) if bubbles are connected or not. The non-connected bubbles should be pink and the connected bubbles
yellow. In this case, a quality control after the batch treatment is necessary and images which were not processed correctly are rejected before sta-
tistical analysis.
A. Schoonman et al. / Food Research International 34 (2001) 913–929 917

and 7) and provide numerical data like bubble size,bubble size distribution and connectivity of bubbles.During the development of the method and after
processing of the whole data set, quality checks assuredthat cluster and bubble boundaries as found by thealgorithm outlined earlier essentially followed the limitsthat would appear to be correct for an experiencedoperator tracing the boundaries, for example by hand.
Furthermore, for the real analysis of results, we routi-nely make an oversampling of about 5%. This allows usto discard images which are badly processed (e.g. withboundaries which could not be closed for one reason oranother).For each powder sample, a data text file is exported to
Excel for statistical analysis. The true bubble size distribu-tion is reconstructed (or unfolded) using a stereological
Fig. 5. SEM image of inner structure of powders. a. Sample 90/10 at overrun 50%. b. Sample 90/10 at overrun 100%. c. Sample 90/10 at overrun
150%. d. Sample 80/20 at overrun 50%, e. Sample 80/20 at overrun 100%. f. Sample 80/20 at overrun 150%. g. Sample 70/30 at overrun 50%. h.
Sample 70/30 at overrun 100%. i. Sample 70/30 at overrun 150%.
918 A. Schoonman et al. / Food Research International 34 (2001) 913–929
technique for transparent spheres in an opaque matrixas described by Campbell, Rielly, Fryer, and Sadd(1999). In brief, the algorithm uses a finite differencemethod to solve the integral equation relating the bub-ble size distribution to the distribution of circles in themicrographs. In the algorithm, the finite thickness of theslices is taken into consideration. The data from imageanalysis are classified into discrete size categories of cir-
cles; by taking fewer discrete size categories of bubblesin the reconstructed distribution, an overdetermined setof linear equations results, which is solved by a singlevalue decomposition method. By the use of an over-determined set of equations, the propagation of errorsupon reconstruction of the bubble size distribution isreduced. The algorithm is implemented in a Mathcadworksheet (Sadd, 2001).
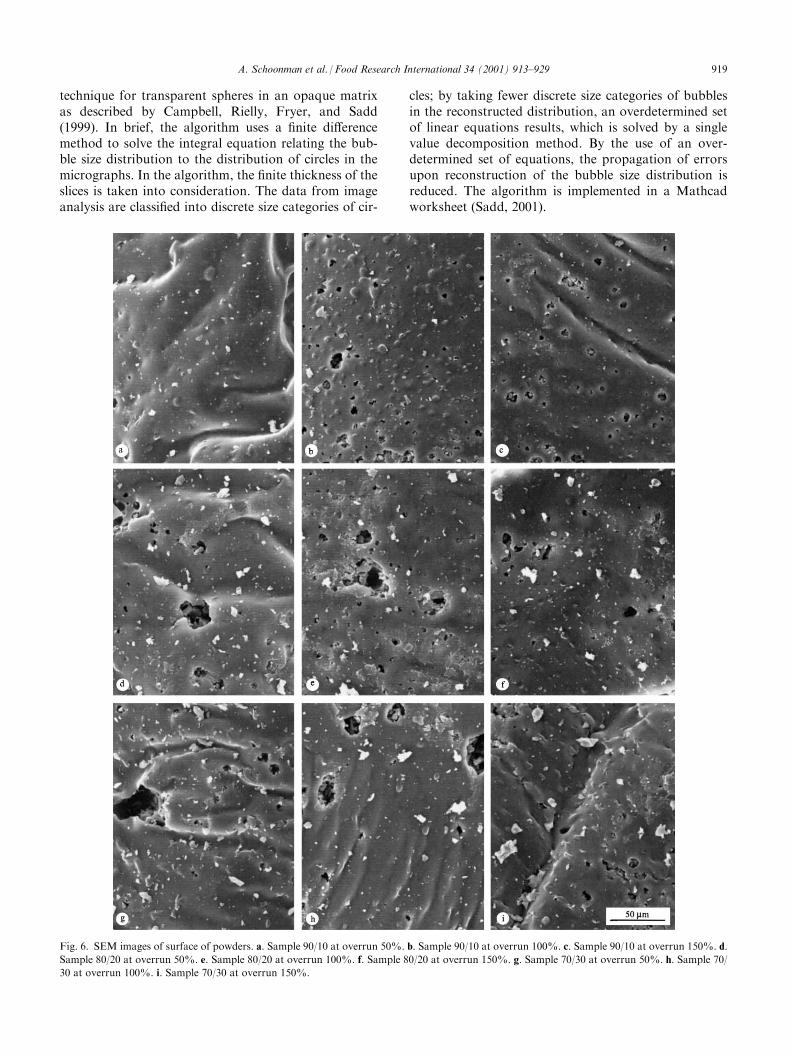
Fig. 6. SEM images of surface of powders. a. Sample 90/10 at overrun 50%. b. Sample 90/10 at overrun 100%. c. Sample 90/10 at overrun 150%. d.
Sample 80/20 at overrun 50%. e. Sample 80/20 at overrun 100%. f. Sample 80/20 at overrun 150%. g. Sample 70/30 at overrun 50%. h. Sample 70/
30 at overrun 100%. i. Sample 70/30 at overrun 150%.
A. Schoonman et al. / Food Research International 34 (2001) 913–929 919

2.5. SEM
Samples were cut and mounted on stubs with double-sided Scotch tape. Specimens were coated with a thingold layer (20 nm) in a Polaron sputter coating unit andobserved in a Philips 505 SEM (Philips, The Nether-lands) at 20 kV acceleration voltage.
2.6. Transmission electron microscopy (TEM)
Powders were embedded according to the techniquedescribed earlier. Ultra-thin sections (50–70 nm) werecut with a diamond knife (Diatome, Switzerland) andstained with uranyl acetate for 20 min and lead citratefor 5 min to increase contrast (Reynolds, 1963). Theimages were recorded with a Philips CM12 TEM (Phi-lips, The Netherlands) at 80 kV acceleration voltage.
2.7. Sample density
The apparent density of the samples was determinedby an Accupyc 1330 pycnometer at room temperature(Micromeritics, USA). Helium was used as displace-ment gas and the mean value of five runs per samplewas used. The equilibration rate of 0.4 psig/min, whichwas used, was found to give sufficiently accurate results.The closed porosity "c can be calculated from the
matrix density �m and the apparent density �a:
"c ¼�m � �a
�mð2Þ
As density units, we take (g cm�3). For the matrixdensity of maltodextrin the value of 1.53 g cm�3 formaltose was used (Handbook of Chemistry and Physics,81st ed., 2000) and for sodium caseinate the valuefor milk protein of 1.4 g cm�3 (Walstra & Jenness,1984).The density of the matrix is dependent on its compo-
sition. For two-component systems in which the volumechange upon mixing of the components may be neglec-ted, the matrix density �m is the weighted average of thedensities of the two components. For our samples, wemay approximate:
�m ¼ �MD ��MD þ �SC ��SC
¼ �MD ��MD þ 1� �MDð Þ��SC ð3Þ
where �MD and �SC are the volume fractions and �MDand �SC the densities of maltodextrin and sodium case-inate, respectively. For a mixture of a mixture showingphase separation, an approximation like Eq. (3) isusually justified. This, within the experimental accuracy,is indeed borne out by experiment (Schoonman et al.,2001).
2.8. Specific surface area measurements by gasadsorption (BET analysis)
Nitrogen adsorption data were obtained using a Tris-tar 3000 (Unit 1-S/N: 215) automated gas adsorptionanalyzer (Micromeritics, USA) in multipoint mode.Prior to the measurement, surface impurities wereremoved from the sample by purging the tube contain-ing the sample with nitrogen gas using a flowing-gasdegassing unit (20 �C, 12 h, 300 ml/min; SmartPrepDegasser, Micromeritics, USA). The nitrogen flow wascontrolled by a Veriflow 500 electronic flow meter(Humonics, USA). For all samples, the nitrogen adsorp-tion isotherm at �196 �C was determined at least twice.Specific surface areas were calculated from the nitrogenadsorption data using the BET equation (Brunauer,Emmett, & Teller, 1938; Webb & Orr, 1997). The varia-tion between two measurements is generally less than 5%.The BET equation may conveniently be written as
(Webb & Orr, 1997):
P
Va P0 � Pð Þ¼
1
VmCþC� 1ð Þ
VmC
P
P0
� �ð4Þ
where Va is the volume of gas adsorbed at pressure P,P0 the vapor pressure of the gas, Vm the apparentmonolayer volume and C a constant.According to Eq. (4), a plot of P/Va (P0�P) as a
function of (P/P0) gives a straight line with slope:
Slope ¼C� 1
VmCð5Þ
and intercept
Intercept ¼1
VmCð6Þ
The monolayer volume of adsorbed gas Vm and theBET constant C are calculated from the slope andintercept:
Vm ¼1
Slope þ Interceptð7Þ
C ¼Slope
Interceptþ 1 ð8Þ
The specific surface area of sample S (m2/g) is thencalculated from
S ¼Vm�NA
mV0ð9Þ
where � is the effective surface area occupied by anadsorbed molecule (16.2.10�20 m2 for nitrogen), Na is
920 A. Schoonman et al. / Food Research International 34 (2001) 913–929

the Avogadro constant (mol�1), m the mass of theadsorbate (g) and V0 the molar gas volume at STP (cm
3
mol�1; Webb & Orr, 1997).
2.9. Mercury porosimetry
Mercury porosimetry experiments were carried outusing a Carlo Erba 2000 high-pressure porosimeter(Carlo Erba instruments, Rodano, Italy), comprising amacro and a micropore unit. The pore size distributionwas determined using a cylindrical pore model (Webb &Orr, 1997), which, although a crude approximation tothe true pore shape in most cases (including foams), isalmost universally used (Webb & Orr, 1997). For poresof cylindrical shape, the relation between the pore dia-meter D and the applied pressure P is given by theWashburn equation (Washburn, 1921):
D ¼�4�cos�
Pð10Þ
where � is the surface tension of mercury (484 dynescm�1 at 25 �C; The Merck Index, 12th ed., 1996) and � isthe contact angle of mercury on the sample surface. Forour samples, � was determined to be 141.3� (average ofthree determinations). This is close to the value of 140�
which is often used in mercury porosimetry (Newman,1995).The intrusion experiments were carried out as follows.
About 0.2 g powder was placed in a dilatometer and themacropore unit was evacuated for 20 min. The dilat-ometer was carefully filled with mercury and thentransferred to the micropore unit. The pressure wasgradually increased to 2000 bar at a rate of 0.33 bar s�1
and the volume of intruded mercury was recorded.
2.10. Particle size distribution
The particle size of powders was measured with acomputerised particle size analyser (CPA) (Haver CPA,Haver & Boecker, Germany). The CPA operates on thebasis of a photo-optical measurement principle, wherefree falling objects are detected and registered by a CCDcamera. The CPA reconstructs the image of the particlefrom the camera signal. All particle size distributions
were determined three times and are represented interms of the cumulative percentage D of particles equalor smaller than a given size (Hunter, 1986). For ourpurpose, which is to compare various samples sievedwith the same size fractions, the representation of theparticle size distribution in terms of D[10], D[50] andD[90] suffices where the number indicates the size frac-tion in percent.
3. Results and discussion
3.1. Microstructure of powders by microscopy andimage analysis
A qualitative impression of the inner structure of thepowders is obtained from the SEM images (Fig. 5a–i).In particular in the case of sample 70/30, it appears thatthe porosity increases and the average thickness of thewalls between adjacent bubbles decreases with increas-ing overrun (Fig. 5g–i). It is clear that the size distribu-tion, shape and packing of the bubbles become moreregular with increasing caseinate fraction (compareFig. 5a–i). The bubble sizes as determined from theSEM images are generally below about 25 mm, althoughbubbles up to about 50 mm are regularly observed in thesamples with low caseinate content. Occasionally, bub-bles with diameters up to about 250 mm are found (SEMimages not shown). It is likely that the larger bubblesare formed by coalescence of the foamed solution dur-ing the foaming step.SEM images of the surface of powder with varying
protein content and overruns, show small pores(Fig. 6a–i). These pores, which represent either con-nected bubbles or cracks, are most probably formedduring the quenching step or during drying of the pow-ders. However, due to grinding of the samples afterfoaming and drying, a large fraction of the particle sur-face exhibits a structure as shown in Fig. 6a–i.Representative image-processed micrographs are
shown for powder sample with 70% w/w maltodextrinand 30% w/w protein and overrun 50, 100 and 150%(Fig. 7). Microstructural data for this sample are sum-marised in Table 2. Image analysis shows that the totalclosed porosity increases with increasing volume ofnitrogen injected in the solution prior to freeze-drying.In this respect, image analysis provides valuable quan-titative data supplementary to the qualitative informa-tion provided by the SEM images of the inner structureof the powders (Fig. 5a–i). Furthermore, it is seen thatthe percentage of connected bubbles increases rapidlywith increasing overrun, which is most likely a con-sequence of a decreasing thickness of the fluid filmbetween adjacent bubbles in the suspension before drying.From the image analysis data, the reconstructed bub-
ble size distribution is determined using stereological
Table 2
Microstructural data of sample 70/30 as obtained by image analysis
(mean value and standard deviation)
Overrun
50% 100% 150%
Porosity (vol.%) 30.5�2.3 40.2�2.6 48.5�3.1
Matrix (vol.%) 69.5 59.8 51.5
Connected bubbles (vol.%) 12.0�2.9 19.2�3.0 25.7�4.0
Non-connected bubbles (vol.%) 18.5�1.8 21.0�2.3 22.9�2.3
A. Schoonman et al. / Food Research International 34 (2001) 913–929 921

techniques (Campbell et al., 1999b). For calculating thereconstructed bubble size distribution, it is assumed thatthe bubbles are spherical because of surface tensioneffects. This is supported by the shape of the bubblesobserved in Figs. 5 and 6 (with the exception of someconnected bubbles). Real bubble size distributions forthe non-connected bubbles at overruns of 50, 100 and150% are shown in Fig. 8. The bubble size is generallybetween 2 and 30 mm, with a significant fraction ofbubbles smaller than about 4 mm. However, below thisvalue, the determination of the bubble size distribution
is likely to become less reliable because the resolutionlimit in light microscopy is approached.No clear influence of the overrun on the size dis-
tribution of non-connected bubbles is observed,although the porosity increases considerably withincreasing overrun (Fig. 8). This will be further dis-cussed in the section below on the comparison betweenmicroscopic and physical data.In powders consisting of two incompatible com-
pounds, phase separation can occur (Manoj, Kasapis, &Chronakis, 1996; Tolstoguzov, 1991). Often, mixedsolutions of chemically and/or structurally differentbiopolymers are unstable and tend to demix. In Fig. 9, aTEM image is shown of the sample with 30% w/w pro-tein in which phase separation in the matrix can beclearly observed. Although phase separation would alsobe expected at lower protein contents, we could notunambiguously determine this from our micrographs(images not shown).
3.2. Physical characterisation
From the apparent density, the closed pore volume ofthe powders [Eq. (2)] can be calculated provided thematrix density is known [Eq. (3)]. Fig. 10 shows thevolume of closed pores as a function of overrun inpowder with 30% w/w protein (overrun 50, 100 and150%). The results show that the closed pore volume inthe powders is mainly dependent on the volume ofnitrogen injected in the solution before drying and is lessdependent on the sample composition. From the imageanalysis, we know that, at high overruns, the bubbleconnectivity increases, likely because the lamellaebetween adjacent bubbles become too thin, which leadsto film rupture. At very high levels of nitrogen injection,bubble connectivity extends all the way up to the sur-face of the foam, leading to an escape of injected gasand thus to a decrease in closed pore volume in thepowder.As the particle size distribution may influence various
measurements, the powders were sieved after grindingand only one rather narrow particle size fraction(0.4<d<0.9 mm) was used for further analysis. To fur-ther ascertain the similarity of these fractions, the par-ticle size distributions were determined (Table 3). As canbe seen, the differences in particle size distribution arevery small, so that we may safely neglect the effect ofdifferences in the particle size distribution between thevarious samples.Results of the specific surface area of the powders, as
determined by BET nitrogen adsorption, show thatalmost all powders have an extensive porosity. Whereasthe measured specific surface areas are in the range of0.01–1.52 m2 g�1 (Fig. 11), the calculated (theoretical)specific surface area for non-porous powders within thesame particle size range would be around 0.01 m2 g�1. A
Fig. 7. Image-treated images of sample 70/30 at overruns 50, 100 and
150%.
922 A. Schoonman et al. / Food Research International 34 (2001) 913–929

large difference between measured and theoretical spe-cific surface area indicates a substantial open or surfaceconnected porosity or more surface roughness. Thespecific surface area is found to increase with increasingdegree of initial foaming in powders and with anincreasing fraction of protein in the powder (Fig. 11).
The same trends were found by Berlin, Howard, andPallansch (1964) and Berlin et al. (1966) for foam-driedmilk powders prepared by different drying methods.The rapid increase in specific surface area as a functionof the overrun could be an indication that the averagebubble size is not increasing much. From the specific
Fig. 9. TEM image of powder sample 70/30 at overrun 150%.
Fig. 8. Reconstructed bubble size distribution of non-connected bubbles in sample 70/30 at overruns 50, 100 and 150%. Closed bar: overrun 50%,
open bar: overrun 100%, striped bar: overrun 150%.
A. Schoonman et al. / Food Research International 34 (2001) 913–929 923
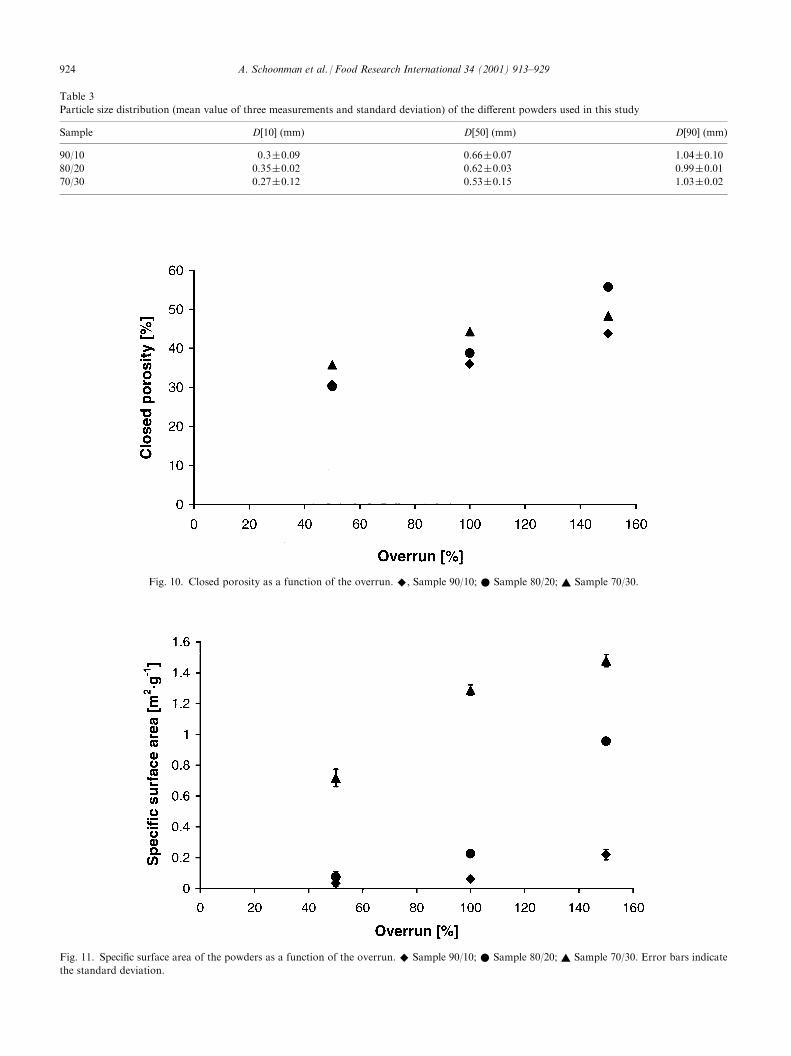
Table 3
Particle size distribution (mean value of three measurements and standard deviation) of the different powders used in this study
Sample D[10] (mm) D[50] (mm) D[90] (mm)
90/10 0.3�0.09 0.66�0.07 1.04�0.10
80/20 0.35�0.02 0.62�0.03 0.99�0.01
70/30 0.27�0.12 0.53�0.15 1.03�0.02
Fig. 11. Specific surface area of the powders as a function of the overrun. ^ Sample 90/10; * Sample 80/20; ~ Sample 70/30. Error bars indicate
the standard deviation.
Fig. 10. Closed porosity as a function of the overrun. ^, Sample 90/10; * Sample 80/20; ~ Sample 70/30.
924 A. Schoonman et al. / Food Research International 34 (2001) 913–929
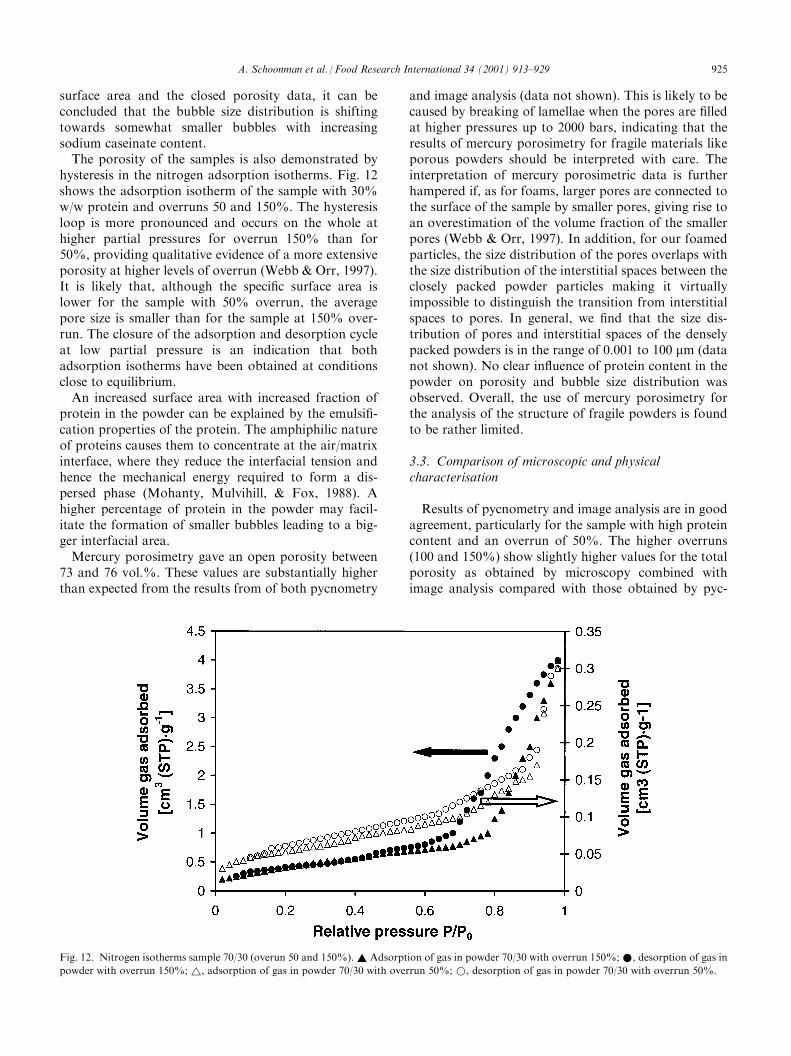
surface area and the closed porosity data, it can beconcluded that the bubble size distribution is shiftingtowards somewhat smaller bubbles with increasingsodium caseinate content.The porosity of the samples is also demonstrated by
hysteresis in the nitrogen adsorption isotherms. Fig. 12shows the adsorption isotherm of the sample with 30%w/w protein and overruns 50 and 150%. The hysteresisloop is more pronounced and occurs on the whole athigher partial pressures for overrun 150% than for50%, providing qualitative evidence of a more extensiveporosity at higher levels of overrun (Webb & Orr, 1997).It is likely that, although the specific surface area islower for the sample with 50% overrun, the averagepore size is smaller than for the sample at 150% over-run. The closure of the adsorption and desorption cycleat low partial pressure is an indication that bothadsorption isotherms have been obtained at conditionsclose to equilibrium.An increased surface area with increased fraction of
protein in the powder can be explained by the emulsifi-cation properties of the protein. The amphiphilic natureof proteins causes them to concentrate at the air/matrixinterface, where they reduce the interfacial tension andhence the mechanical energy required to form a dis-persed phase (Mohanty, Mulvihill, & Fox, 1988). Ahigher percentage of protein in the powder may facil-itate the formation of smaller bubbles leading to a big-ger interfacial area.Mercury porosimetry gave an open porosity between
73 and 76 vol.%. These values are substantially higherthan expected from the results from of both pycnometry
and image analysis (data not shown). This is likely to becaused by breaking of lamellae when the pores are filledat higher pressures up to 2000 bars, indicating that theresults of mercury porosimetry for fragile materials likeporous powders should be interpreted with care. Theinterpretation of mercury porosimetric data is furtherhampered if, as for foams, larger pores are connected tothe surface of the sample by smaller pores, giving rise toan overestimation of the volume fraction of the smallerpores (Webb & Orr, 1997). In addition, for our foamedparticles, the size distribution of the pores overlaps withthe size distribution of the interstitial spaces between theclosely packed powder particles making it virtuallyimpossible to distinguish the transition from interstitialspaces to pores. In general, we find that the size dis-tribution of pores and interstitial spaces of the denselypacked powders is in the range of 0.001 to 100 mm (datanot shown). No clear influence of protein content in thepowder on porosity and bubble size distribution wasobserved. Overall, the use of mercury porosimetry forthe analysis of the structure of fragile powders is foundto be rather limited.
3.3. Comparison of microscopic and physicalcharacterisation
Results of pycnometry and image analysis are in goodagreement, particularly for the sample with high proteincontent and an overrun of 50%. The higher overruns(100 and 150%) show slightly higher values for the totalporosity as obtained by microscopy combined withimage analysis compared with those obtained by pyc-
Fig. 12. Nitrogen isotherms sample 70/30 (overun 50 and 150%).~ Adsorption of gas in powder 70/30 with overrun 150%;*, desorption of gas in
powder with overrun 150%; ~, adsorption of gas in powder 70/30 with overrun 50%;*, desorption of gas in powder 70/30 with overrun 50%.
A. Schoonman et al. / Food Research International 34 (2001) 913–929 925

nometry (Fig. 13). The slight discrepancy is attributedto the fact that surface-connected open pores and crackspresent in the sample are differently determined by pyc-nometry and image analysis. By helium pycnometry,these internal pores are detected as open, leading to thelower values of the total porosity. In contrast, in imageanalysis, these open pores and cracks are measured asclosed porosity, because of the intrinsic difficulty ofdetermining if a cluster within a particle is connected tothe outside surface or not. This is also because our two-dimensional analysis does not take into account con-nectivity in three dimensions. However, data on bubbleconnectivity are statistically valid because of the verylarge number of bubbles analysed. Furthermore, theresolution limit in image analysis to detect if a bubble isconnected or not is about 1 mm, although connectivityclearly plays a role on length scales which are muchsmaller (down to molecular dimensions). The differencesin closed porosity could, in principle, also be caused byan artifact of the image analysis procedure. Forinstance, occasionally, the matrix contrast is so low thatsmall regions of solid matrix are inadvertently identifiedas pores. However, these artifacts do not influence thefinal results to a great extent because data from imagesaltered by artifacts are generally rejected before statis-tical analysis (see the section on image analysis).The main parameter influencing the microstructure of
the solid foams is the volume of nitrogen injected priorto drying. A higher volume of injected nitrogen gasincreases the porosity (as determined by BET analysis,pycnometry and image analysis) and the surface area ofpowder (as determined by BET analysis) and diminishesthe thickness of the walls between adjacent cells (as seen
by SEM and optical images). An increased fraction ofsodium caseinate in powders results in an increasedspecific surface area, indicating a decrease in bubble sizeat similar levels of overrun. Moreover, there is no clearinfluence of the overrun on the size distribution of non-connected bubbles, although the porosity increasesconsiderably with increasing overrun. A likely mechan-ism is that, at a protein content of 30% w/w, and pos-sible also at lower concentrations, there is an excess ofcaseinate which is dispersed in the matrix and which cantherefore easily migrate to the newly created interface.The stabilisation of the created interface by proteinresults in a virtually constant bubble size distribution.Furthermore, one may assume that, during the foamingoperation, gas bubbles leaving the orifice of the pipe bywhich the gas is introduced into the medium have areasonably similar size. Remarkably, the effect ofincreasing percentage of sodium caseinate on thevolume of closed pores in the powders does not show aclear trend. However, as discussed earlier, at the rela-tively high levels of sodium caseinate used in this study,enough interfacial area may be created and the retentionof gas in the foam is expected to be high at all proteinconcentrations.A structural parameter which is very difficult to
determine by physical characterisation methods, butwhich would be amenable to image analysis is the openporosity of food foams. Several researchers have usedmercury porosimetry to determine the pore size, struc-ture and/or pore size distribution in food powders(Chesson, Gardner, & Wood, 1997; Hicsasmaz & Clay-ton, 1992; Karathanos & Saravacos, 1993; Wester-marck, Juppo, Kervinen, & Yliruusi, 1998). Because of
Fig. 13. Comparison of porosity data by pycnometry and image analysis for powder sample 70/30 (closed bar: overrun 50%, open bar: overrun
100%, striped bar: overrun 150%). 1. Closed porosity by image analysis. 2. Fraction connected bubbles by image analysis. 3. Fraction non-con-
nected bubbles by image analysis, 4. Closed porosity by helium pycnometry.
926 A. Schoonman et al. / Food Research International 34 (2001) 913–929

both the fragility of many powders and the partialoverlap of the size distribution of pores and interstitialspaces between the particles, it is very difficult to accu-rately determine the pore size distribution of food pow-ders by mercury porosimetry. Nevertheless, forsufficiently rigid food powders, the results of mercuryporosimetry should become more accurate at smallerpore sizes. We have also found the usefulness of mer-cury intrusion porosimetry for the analysis of open porestructure and bubble size distribution to be limited.Furthermore, for materials of which the length scale ofsurface heterogeneities is of the same magnitude as thesize of the largest pores, a distinction between openporosity and particle shape remains ambiguous.Notwithstanding the considerable efforts involved,
application of microscopy combined with image analy-sis techniques to investigate food microstructure is jus-tified by the wealth of information which can beobtained from the micrographs. For instance, by usingonly physical techniques, pore size distributions andpore connectivity are either difficult or impossible todetermine accurately, whereas these quantities canusually be determined rather precisely by image analy-sis. As an example, in Fig. 13 the fraction of non-con-nected bubbles and the fraction of bubbles which areconnected but whose connectivity does not extend to thesurface of the particle are given.
4. Conclusions
A procedure developed in our laboratory for theanalysis of the microstructure of foamed food powdersby microscopy and image analysis is described. Themethod is applied to the analysis of the microstructureof dried maltodextrin/sodium caseinate foams with dif-ferent compositions prepared under varying conditions.An improved discrimination between connected andnon-connected bubbles is obtained.The main parameter influencing the microstructure of
the solid foams is the volume of nitrogen injected priorto drying. A higher volume of injected nitrogen gasincreases both the porosity and the specific surface areaof the powders and leads to a reduction in the thicknessof the lamellae between adjacent bubbles. The totalporosity as determined by image analysis comparesfavorably with the results from by pycnometry. No clearinfluence of the overrun on the size distribution of non-connected bubbles is observed, although the porosityincreases considerably with increasing overrun.An increased fraction of sodium caseinate in powders
results in an increased specific surface area, indicatingthat at similar overruns, the average bubbles sizedecreases.The usefulness of mercury intrusion porosimetry for
the analysis of open pore structure and bubble size dis-
tribution was found to be limited, because of the fragi-lity of the powders and the overlap of the sizedistributions of bubbles and interstitial spaces betweenthe powder particles.We conclude that image analysis is a useful supple-
mentary technique to quantitatively characterise pow-der structure because of the richness and complexity ofinformation which can be obtained. Much of this infor-mation is not available using other methods, forinstance physical characterisation techniques. Whenproperly carried out, the results from image analysis arein quantitative agreement with the results from classicalpowder characterisation techniques. We expect thatimage analysis will develop into an important tool torationally improve food powder functionality and sta-bility and it constitutes an important step towards adesigner approach to food powder development.
Acknowledgements
We would like to thank M.F. Clerc for performingthe SEM analysis. Dr. M. Michel is thanked for discus-sions and continuous support of this work. Weacknowledge the help of Dr. P.A. Sadd (RHM Tech-nology Ltd., High Wycombe, UK) in the bubble sizereconstructions and of C. Felix (Swiss Federal Instituteof Technology, Lausanne, Switzerland) for performingthe mercury porosimetric analyses. We are indebted toDr. E. Prior for critically reading the manuscript and tothe management of Nestec Ltd. for granting permissionto publish the work. Finally, we would like to thank ananonymous reviewer for helpful comments.
References
Aguilar, C. A., & Ziegler, G. R. (1993). Lactose crystallization in
spray-dried milk powder exposed to isobutanol. Food Structure, 12,
43–50.
Aguilera, J. M., & Stanley, D. W. (1990).Microstructural principles of
food processing and engineering. London: Elsevier.
Bellows, R. J., & King, C. J. (1972). Freeze-drying of aqueous solu-
tions: maximum allowable operating temperature. Cryobiology, 9,
559–561.
Berlin, E., Howard, N. M., & Pallansch, M. J. (1964). Specific surface
areas of milk powders produced by different drying methods. Jour-
nal of Dairy Science, 17, 132–138.
Berlin, E., Kliman, P. G., & Pallansch, M. J. (1966). Surface features
of foam-dried milk powder granules from krypton adsorption mea-
surements. Journal of Dairy Science, 50(5), 659–663.
Brunauer, S., Emmett, P. H., & Teller, E. J. (1938). Adsorption of
gases in multimolecular layers. Jorunal of American Chemistry
Society, 60, 309–319.
Budavari, S. Ed. (1996). The Merck Index, 12th ed. Whitehouse
Station: Merck & Co.
Buma, T. J. (1971). Free fat in spray-dried whole milk. The relation
between free-fat content and particle porosity of spray-dried whole
milk. Neth. Milk Dairy J., 25, 123–140.
A. Schoonman et al. / Food Research International 34 (2001) 913–929 927

Campbell, G. M., Rielly, C. D., Fryer, P. J., & Sadd, P. A. (1999b).
Reconstruction of bubble size distributions from slices. In
G. M. Campbell, C. Webb, S. S. Pandiella, & K. Niranjan (Eds.),
Bubbles in food. St. Paul: Eagan Press.
Campbell, G. M., Webb, C., Pandieila, S. S., & Niranjan, K. Eds.
(1999). Bubbles in Food, St. Paul: Eagan Press.
Chesson, A., Gardner, P. T., & Wood, T. J. (1997). Cell wall porosity
and available surface area of wheat straw and wheat grain fractions.
J. Sci. Food Agric., 75(3), 289–295.
Downtown, G. E., Flores-Luna, J. L., & King, C. J. (1982). Mechan-
ism of stickiness in hygroscopic, amorphous powders. Ind. Eng.
Chem. Fundam., 21, 447–451.
El Saleh, F., & Kleinebudde, P. (1998). Mercury-free determination of
apparent density and porosity of pellets by powder pycnometry.
Pharmaceutical Technology Europe, November issue, 18–26.
Fox, P. F., & Mulvihill, D. M. (1983) Functional properties of case-
ins,caseinates and casein-coprecipitates. In: Physico-chemical
aspects of dehydrated protein-rich milk products. Proc. IDF Symp.,
Helsingor, Denmark, pp. 188-259.
Gan, Z., Angold, R. E., Williams, M. R., Ellis, P. R., Vaughan, J. G.,
& Galliard, T. (1990). The microstructure and gas retention of bread
dough. J. Cereal Sci., 12, 15–24.
Greenspan, L. (1977). Humidity fixed points of binary saturated aqu-
eous solutions. J. Res. Natl. Bur. Stand.A., 81A, 1.
Gonzalez, R. C., & Woods, R. E. (1992). Digital image processing.
Reading, MA: Addison-Wesley.
Goubet, I., Le Quere, J. L., & Voilley, A. J. (1998). Retention of
aroma compounds by carbohydrates: influence of their physico-
chemical characteristics and of their physical state. A review. Jour-
nal of Agricultral Food Chemistry, 46, 1981–1990.
Gunasekaran, S. (1996). Computer vision technology for food quality
assurance. Trends Food Sci. Technol., 7, 245–256.
Haralick, R. M., & Shapiro, L. G. (1992). Computer and robot vision,
vol. I & II. Reading, MA: Addison-Wesley.
Heertje, I., & Paques, M. (1995). Advances in electron microscopy. In
E. Dickinson (Ed.), New physico-chemical techniques for the char-
acterization of complex food systems (pp. 1–52). Glasgow: Blackie.
Hicsasmaz, Z., & Clayton, J. T. (1992). Characterization of the pore
structure of starch based foodmaterials. Food Structure, 11, 115–132.
Hinz, T., & Eggers, R. (1996). Determination of porosity and particle
size of natural bulk materials using image analysis. Nahrung, 40(3),
116–124.
Huang, C. T., & Clayton, J. T. (1990). Relationships between
mechanical properties and microstructure of porous foods: part 1. A
review. In W. E. L. Spiess, & H. Schubert (Eds.), Engineering of
food, Vol. 1. Physical properties and process control (pp. 352–360).
London: Elsevier Applied Science.
Hunter, R. J. (1986). Foundations of colloid science, vol. I. Oxford:
Clarendon Press.
Kalab, M., Allan-Wojtas, P., & Shea Miller, S. (1995). Microscopy
and other imaging techniques in food structure analysis. Trends
Food Sci. Technol., 6, 177–185.
Karanthanos, V. T., & Saravacos, G. D. (1993). Porosity and pore size
distribution of starch materials. J. Food Eng., 18(3), 259–280.
Lide, D. R., ed. (1997). Handbook of Chemistry and Physics, 81st ed.
Boca Raton: CRC Press.
Loebl, J. (1985). Image analysis: principles and practice. Tyne & Wear,
UK: Vickers.
Manoj, P., Kasapis, S., & Chronakis, I. S. (1996). Gelation and phase
separation in maltodextrin-caseinate systems. Food Hydrocolloids,
10(4), 407–420.
Mohanty, B., Mulvihill, D. M., & Fox, P. F. (1988). Emulsifying and
foaming properties of acidic caseins and sodium caseinate. Food
Chemistry, 28, 17–30.
Moreau, D. L., & Rosenberg, M. (1993). Microstructure and fat
extractability in microcapsules based on whey proteins or mixtures
of whey proteins and lactose. Food Structure, 12, 457–468.
Newman, A. W. (1995). Micromeritics: physical characterization of
pharmaceutical solids. In H. G. Brittain (Ed.), Drugs and the phar-
maceutical sciences, 70 (pp. 253–280). New York: Marcel Dekker.
Pinthus, E. J., Weinburg, P., & Saguy, I. S. (1995). Deep-fat fried
potato product oil uptake as affected by crust physical properties.
Journal of Food Science, 60(4), 770–772.
Rahman, M. S., Chen, X. D., & Perera, C. O. (1997). An improved
thermal conductivity prediction model for fruits and vegetables as a
function of temperature, water content and porosity. J. Food Eng.,
31(2), 163–170.
Rasband, W. (2001) NIH Image, version 1.62. Available from http://
rsb.info.nih.gov/nih-image/.
Reynolds, E. W. (1963). The use of lead citrate at high pH as an elec-
tron opaque-stain in electron microscopy. Journal of Cell Biology,
17, 208–212.
Ridler, T. W., & Calvard, S. (1978). Picture thresholding using an itera-
tive selection method. IEEE Trans. Syst. Man Cyber., 8, 630–632.
Roos, Y., & Karel, M. (1991). Amorphous state and delayed ice for-
mation in sucrose solutions. Journal of Food Science, 26, 553–566.
Rosenberg, M., Kopelman, I. J., & Talmon, Y. (1990). Factors
affecting retention in spray-drying microencapsulation of volatile
materials. Journal of Agricultural Food Chemistry, 38, 1288–1294.
Rosenberg, M., & Sheu, T. Y. (1996). Microencapsulation of volatiles
by spray-drying in whey protein-based wall systems. International
Dairy Journal, 6, 273–284.
Russ, J. C. (1999). The image processing handbook. (3rd ed.). USA:
CRC Press & IEEE Press.
Sadd, P. A. (2001). Mathcad worksheet to reconstruct bubble size
distributions from two-dimensional images. High Wycombe, UK:
RHM Technology Ltd.
Scanlon, M. G., Segall, K. I., & Cenkowski, S. (1999). The stiffness versus
porosity relationship for infrared-heat treated (micronized) durum
wheat grains. In G. M. Campbell, C. Webb, S. S. Pandiella, &
K.Niranjan (Eds.),Bubbles in food (pp. 283–290). St. Paul: Eagan Press.
Schoonman, A., Ubbink, J., Bisperink, C., Le Meste, M., & Karel, M.
(2001). Solubility and diffusion of nitrogen in maltodextrin/protein
tablets. Submitted to Biotechnology Progress.
Schubert, H. (1980). Food particle technology. Part 1: properties of
particles and particulate food systems. J. Food Eng., 6, 1–32.
Setser, C. S., & Racette, W. L. (1992). Macromolecule replacers in
food products. Critical Reviews of Food Science and Nutrition, 32(3),
275–297.
Slade, L., & Levine, H. (1991). Beyond water activity: recent advances
based on an alternative approach to the assessment of food quality and
safety. Critical Reviews of Food Science and Nutrition, 30, 115–360.
Southward, C. R., & Walker, N. J. (1980). The manufacture and
industrial use of casein. N.J.Z Dairy Sci. Tech., 15, 201–217.
Tamsma, A., & Kontson, A. (1974). Preparation of a foam spray dried
whole milk type product with good sinkability, dispersibility and
solubility. Journal of Dairy Science, 57(10), 1149–1151.
Tamsma, A., Kontson, A., & Pallansch, M. J. (1967). Influence of
drying techniques on some properties of nonfat dried milk. Journal
of Dairy Science, 50(7), 1055–1060.
Tan, J., Zhang, H., & Gao, X. (1997). SEM image processing for food
structure analysis. J. Texture Stud., 28, 657–672.
To, E. C., & Flink, J. M. (1978a). Collapse, a structural transition in
freeze dried carbohydrates, I. Evaluation of analytical methods. J.
Food Technol., 13, 551–565.
To, E. C., & Flink, J. M. (1978b). Collapse, a structural transition in
freeze dried carbohydrates, II. Effect of solute composition. J. Food
Technol., 13, 567–581.
To, E. C., & Flink, J. M. (1978c). Collapse, a structural transition in
freeze dried carbohydrates, III. Prerequisite of recrystallisation. J.
Food Technol., 13, 583–594.
Tolstoguzov, V. B. (1991). Functional properties of food proteins and
the role of protein-polysaccharide interactions. Food Hydrocoll, 4,
429–468.
928 A. Schoonman et al. / Food Research International 34 (2001) 913–929

Tsourouflis, S., Flink, J. M., & Karel, M. (1976). Loss of structure in
freeze-dried carbohydrates solutions: effect of temperature, moisture
content and composition. J. Sci. Food Agric., 27, 509–519.
Vischer, N. (2001) Object Image, version 2.07. Available from: http://
simon.bio.uva.nl/object-image.html.
Voilley, A., & Le Meste, M. (1985). Aroma diffusion: the influence of
water activity and of molecular weight of the other solutes. In
D. Simatos, & J. L. Multon (Eds.), Properties of water in foods
(pp. 357–373). Dordrecht: Martinus Nijhoff.
Walstra, P., & Jenness, R. (1984). Dairy chemistry and physics. New
York: John Wiley.
Washburn, E. W. (1921). Note on a method of determining the distribu-
tion of pore sizes in a porous material. Proceedings of the National
Academy of Sciences of the United States of America, 7, 115–116.
Webb, P. A., & Orr, C. (1997). Analytical methods in fine particle
technology. Norcross, USA: Micromeritics.
Westermarck, S., Juppo, A. M., Kervinen, L., & Yliruusi, J. (1998).
Pore structure and surface area of mannitol powder, granules and
tablets determined with mercury porosimetry and nitrogen gas
adsorption. European Journal of Pharmaceutics and Biopharmaceu-
tics, 46(1), 61–68.
Witschi, F. (1999). Influence of microstructure on the drying kinetics of
a foamed amorphous model food concentrates. Dissertation ETH
No. 13336, Swiss Federal Institute of Technology, Zurich.
A. Schoonman et al. / Food Research International 34 (2001) 913–929 929
Copyright © 2022 FDOKUMEN