Phase behaviour of oat β-glucan/sodium caseinate mixtures varying in molecular weight
at SciVerse ScienceDirect
Food Hydrocolloids 34 (2014) 161e168
Contents lists available
Food Hydrocolloids
journal homepage: www.elsevier .com/locate/ foodhyd
Characterisation of gum tragacanth (Astragalus gossypinus)/sodiumcaseinate complex coacervation as a function of pH in an aqueousmedium
Sara Ghorbani Gorji a, Elham Ghorbani Gorji b, Mohammad Amin Mohammadifar a,*aDepartment of Food Science and Technology, National Nutrition and Food Technology Research Institute, Faculty of Nutrition Sciences and FoodTechnology, Shahid Beheshti University of Medical Sciences, 193954741 Tehran, IranbDepartment of Food Science and Technology, Faculty of Agriculture, Islamic Azad University, Science and Research Branch, Tehran, Iran
a r t i c l e i n f o
Article history:Received 17 May 2012Accepted 23 October 2012
Keywords:Gum tragacanthSodium caseinateComplex coacervationProtein/polysaccharide interactionParticle size measurements
* Corresponding author. Tel.: þ98 2122548120; faxE-mail addresses: [email protected] (S
gmail.com (E.G. Gorji), [email protected] (M.A. Moh
0268-005X/$ e see front matter � 2012 Elsevier Ltd.http://dx.doi.org/10.1016/j.foodhyd.2012.10.019
a b s t r a c t
The formation of electrostatic complexes between sodium caseinate and gum tragacanth (Astragalusgossypinus, A.g) as a function of pH (7.00e2.50), the biopolymer mixing ratio and the total biopolymerconcentration was studied by spectrophotometric and light scattering measurements.
This multi-methodological approach allowed us to demonstrate the critical structure-forming pHsassociated with the formation of soluble and insoluble complexes for the sodium caseinate/A.g mixture.The phase transition of sodium caseinate/A.g complexed/coacervated system was explained by moni-toring the absorbance profiles as a function of time.
Particle size measurements revealed a progressive decrease in the complex/aggregate size whilelowering the pH until reaching a minimum (pH 4) at which nanoparticles (70 nm) formed.
As the mixing ratio of protein to polysaccharide increased from 1:1 to 3:1, the critical pHs shiftedtowards higher pH values. Conversely, for a constant mixing ratio, higher levels of total concentrationresulted in an increase in the maximum turbidity but had no meaningful effect on pHC (w5.89) and pHF1
(w4.00).� 2012 Elsevier Ltd. All rights reserved.
1. Introduction
The food industry has recently demonstrated great interest infinding novel materials and techniques to develop value-addedstructures that can be employed as functional food ingredientsfor the adjustment of the texture, mouthfeel and optical propertiesof foods or as encapsulation devices for bioactive components. Inthis respect, biopolymer particles formed from proteins and poly-saccharides can meet various industrial needs to enhance thestability and viability of the active food ingredients. However, thevarious interactions between these two biopolymers play a key rolein food systems because they are responsible for the structure,stability, and rheological characteristics of various processed foods(Kilara, 2006; Samant, Singhal, Kulkarni, & Rege, 1993; Sanchez,Schmitt, Babak, & Hardy, 1997; Tolstoguzov, 1997). Thus, thecontrol or manipulation of these biomacromolecular interactions
: þ98 2122357487..G. Gorji), elham.ghorbani@ammadifar).
All rights reserved.
and a deeper understanding of the mechanisms of their interac-tions are crucial factors in the development of novel food pro-cessing methods and food products.
The interactions between proteins and polysaccharides can beeither repulsive or attractive. Complex coacervation is the asso-ciative phase separation in a solution of oppositely charged mac-roions, such as polyelectrolytes (Spruijt, Sprakel, Stuart, & van derGucht, 2010). Generally, complex coacervation involves twoprimary pH-induced structure-forming events associated with theformation of soluble and insoluble complexes. The former event(denoted as pHC) occurs at a pH corresponding to the first experi-mentally detectable increase in turbidity during a pH titration. Thisis followed by a second structure-forming event at pHF1 that isassociated with the formation of insoluble complexes. The insol-uble complexes concentrate in liquid coacervate drops, leading toa phase separation of the mixture into two liquid layers(Weinbreck, De Vries, Schrooyen, & De Kruif, 2003). Optimalcomplex formation is considered to occur at a pH where both bio-polymers reach their electrical equivalence, denoted as pHopt,which is followed by the dissolution of the complexes at a lower pH(pHF2) due to the protonation of the reactive groups on the
S.G. Gorji et al. / Food Hydrocolloids 34 (2014) 161e168162
polysaccharide backbone at lower pH, giving rise to biopolymerswith similar net charges (Liu, Elmer, Low, & Nickerson, 2010).Complex formation primarily occurs between the pka of the poly-saccharide and the isoelectric point (pI) of the protein (Ye, 2008).Since the main forces involved in associative complexation ofproteins and polysaccharides are electrostatic in nature the envi-ronmental conditions such as pH and ionic strength are the mostimportant factors influencing the formation of complexes bycontrolling the charge density of the biopolymers (Turgeon,Beaulieu, Schmitt, & Sanchez, 2003; Weinbreck, De Vries, et al.,2003).
Functionally and nutritionally important, sodium caseinate hasbeen widely used as an ingredient in food systems. Sodiumcaseinate is prepared from the addition of sodium hydroxide to acidcasein, yielding a translucent solution by dissolving easily in water,and the solution contains protein and Naþ ions (Ho &Waugh, 1965;Kilara, 2006). Therefore, the pH and salt content, which affect thenumber of negative charges along the protein chain and shieldthese ionic charges, respectively, can have considerable effects onthe sodium caseinate associates. A number of researchers havestudied the complexation of sodium caseinate and the anionic andcationic polysaccharides in relation to the importance of the pH andthe nature of the polysaccharides (Anal, Tobiassen, Flanagan, &Singh, 2008; Nash, Pinder, Hemar, & Singh, 2002; Nono, Durand,& Nicolai, 2012; Nono, Lalouette, Durand, & Nicolai, 2010;Perrechil, Braga, & Cunha, 2009; Semenova, Belyakova, Polikarpov,Antipova, & Dickinson, 2009; Tobiassen, Flanagan, & Singh, 2008;Ye, Edwards, Gilliland, Jameson, & Singh, 2011; Ye, Flanagan, &Singh, 2006). Toshiro Kobori et al. investigated the interactionsbetween xanthan gum and sodium caseinate as a function of pH.Rennet digestion clarified that xanthan gum retarded degradationof k-casein at pH 2.7. They reported that the absorbance profile ofsodium caseinateexanthan gum mixture during HCl titrationexhibited a profile distinct from that of sodium caseinate whichcould be an indication of complex formation of xanthan gum andsodium caseinate (Kobori, Matsumoto, & Sugiyama, 2009). Ye et al.studied the complexation between sodium caseinate and gumarabic, which generated stable nanoparticles in the size range from100 to 200 nm over a defined pH range depending on the ratio ofsodium caseinate to gum arabic in the mixtures and on ionicstrength (Ye et al., 2006).
Gum tragacanth is a highly complex heterogeneous anionicpolysaccharide of high molecular weight collected as the driedexudate from the stems and branches of an Asiatic species ofAstragalus (Weiping, 2000) composed of two major fractions:a water-swellable component called bassorin and a water-solublecomponent called tragacanthin (Balaghi, Mohammadifar, &Zargaraan, 2010). Gum tragacanth from different species of Astra-galus has been demonstrated to possess different chemicalcompositions, different ratios of the two fractions, and varyingphysicochemical properties; thus, different applications and func-tionalities for each species are expected (Balaghi, Mohammadifar,Zargaraan, Gavlighi, & Mohammadi, 2011). Gum tragacanth hasbeen known and used as a stabilizer, emulsifier and thickener infood products. Moreover, it has been used in the pharmaceuticaland cosmetic industries for thousands of years due to its specificcharacteristics, including its high degree of stability under strongacid conditions and its use as a bifunctional stabilizer (Weiping,2000). Interactions between milk proteins and gum tragacanthboth in real and model systems have recently been studied. It isreported that the formation of complexes between b-lg and gumtragacanth suggests an electrostatic nature of their interaction,upon which pH and ionic strength have a great impact(Mohammadifar, Musavi, Kiumarsi, & Williams, 2006). Ghorbaniet al. demonstrated that the addition of gum tragacanth [0.3% (w/
w)] to a non-fat fermented milk drink (doogh pH 3.9) preventsserum separation and improves the physical properties due to theinteraction of casein with gum tragacanth molecules (Gorji,Mohammadifar, & Ezzatpanah, 2011; Nash et al., 2002).
Characterisation of the mechanism of sodium caseinate-gumtragacanth interactions is vital to their future utilisation in realsystems. These considerations motivated us to design an experi-ment containing a model system of sodium caseinate and A.g toattain a deeper understanding of complexation and coacervationbetween these biopolymers under a range of conditions.
The aim of this work was to characterise these complexes overa wide pH range (7.00e2.50) and to determine the influence ofbiopolymer concentration and the ratio of sodium caseinate to A.gon the formation of the complexes.
2. Materials and methods
2.1. Materials
Astragalus gossypinus exudates (Iranian gum tragacanth) werecollected from plants growing in the Isfahan province of Iran. Theraw gum was ground and sieved. Powdered gum with a mesh sizebetween 200 and 500 mm was used in this study. The powdercomposition was (g/100): 12.94 þ 0.12% moisture, 0.31 þ 0.01%protein, 2.2% ash and 84.55% carbohydrate (primarily 37% gal-acturonic acid, 32% xylose and 23% fucose) (Balaghi et al., 2010).Sodium caseinate salt from bovine milk (lot 100M0130V) waspurchased from SigmaeAldrich Chemical Co. (St. Louis, MO, USA)for use in this study.
2.2. Preparation of sodium caseinate and gum tragacanth stockdispersions
Gum tragacanth dispersions were prepared by adding theknown amounts of biopolymer powders in distilled water undergentle stirring at room temperature for 2 h and the aqueous solu-tions of sodium caseinate of known amounts of biopolymerpowders were prepared by dissolving sodium caseinate in distilledwater at room temperature for 2 h then both samples were main-tained at 4 �C overnight to ensure the complete hydration of themacromolecules.
2.3. Preparation of biopolymer mixed dispersions
The sodium caseinate/A.g mixed dispersions were prepared byadding a sodium caseinate solution to an A.g dispersion at proteinto polysaccharide (Pr:Ps) weight ratios of 1:1, 2:1 and 3:1and totalbiopolymer concentrations of 0.03 wt.%, 0.045 wt.% and 0.06 wt.%.The mixtures were acidified by the careful addition of 1, 0.1, and0.01 N HCl (or 0.1 and 0.01 N NaOH, if necessary) from pHw7.00 topH w2.00. After adjustment of the mixture’s pH to the desiredvalue, samples were taken out for spectrophotometry and forparticle size analysis.
2.4. Spectrophotometry
Absorbance measurements were conducted using an SP-300PLUS Optima UV-VIS spectrophotometer (Tokyo, Japan) at a wave-length of 400 nm. The samples were placed in a 1 cm path lengthcuvette, and the absorbance (Abs) was measured at 22 � 2 �C.
For time-dependent spectrophotometric measurements,a volume of 3 ml of a sodium caseinate/A.g mixed dispersion of thedesired pH was placed in the cuvette, and the absorbance wasfollowed for 20 min with a measurement step of 30 s.
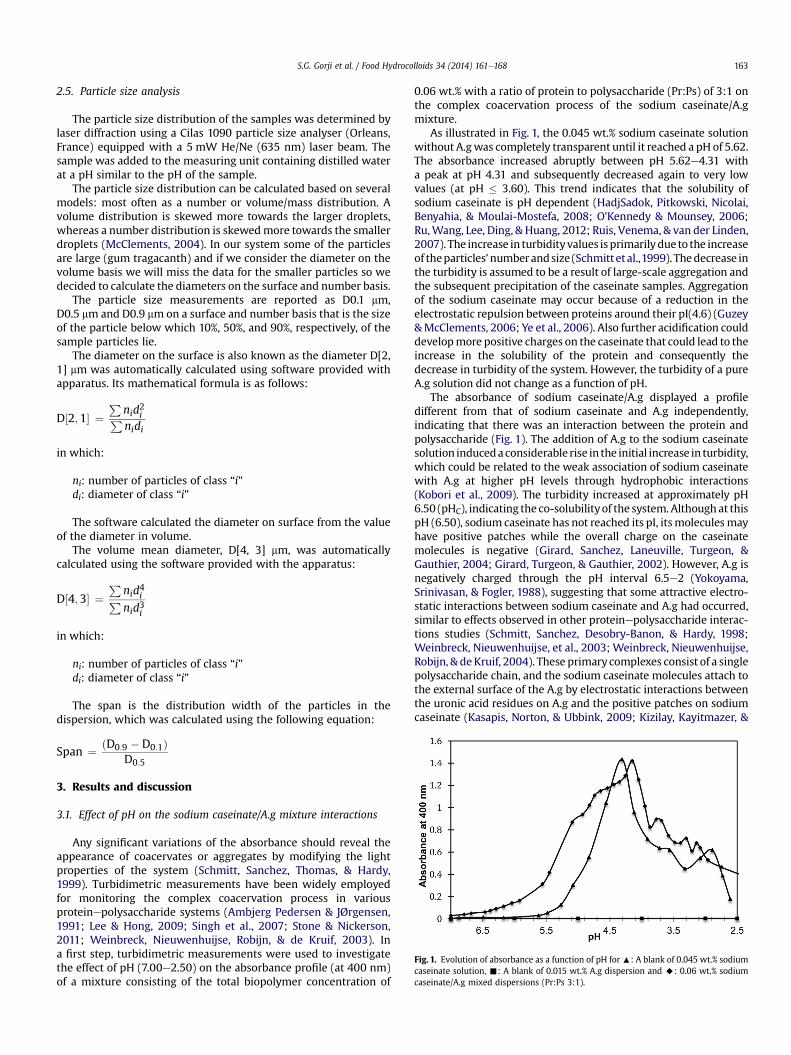
Fig. 1. Evolution of absorbance as a function of pH for:: A blank of 0.045 wt.% sodiumcaseinate solution, -: A blank of 0.015 wt.% A.g dispersion and A: 0.06 wt.% sodiumcaseinate/A.g mixed dispersions (Pr:Ps 3:1).
S.G. Gorji et al. / Food Hydrocolloids 34 (2014) 161e168 163
2.5. Particle size analysis
The particle size distribution of the samples was determined bylaser diffraction using a Cilas 1090 particle size analyser (Orleans,France) equipped with a 5 mW He/Ne (635 nm) laser beam. Thesample was added to the measuring unit containing distilled waterat a pH similar to the pH of the sample.
The particle size distribution can be calculated based on severalmodels: most often as a number or volume/mass distribution. Avolume distribution is skewed more towards the larger droplets,whereas a number distribution is skewedmore towards the smallerdroplets (McClements, 2004). In our system some of the particlesare large (gum tragacanth) and if we consider the diameter on thevolume basis we will miss the data for the smaller particles so wedecided to calculate the diameters on the surface and number basis.
The particle size measurements are reported as D0.1 mm,D0.5 mm and D0.9 mm on a surface and number basis that is the sizeof the particle below which 10%, 50%, and 90%, respectively, of thesample particles lie.
The diameter on the surface is also known as the diameter D[2,1] mm was automatically calculated using software provided withapparatus. Its mathematical formula is as follows:
D½2;1� ¼P
nid2iPnidi
in which:
ni: number of particles of class “i”di: diameter of class “i”
The software calculated the diameter on surface from the valueof the diameter in volume.
The volume mean diameter, D[4, 3] mm, was automaticallycalculated using the software provided with the apparatus:
D½4;3� ¼P
nid4iPnid3i
in which:
ni: number of particles of class “i”di: diameter of class “i”
The span is the distribution width of the particles in thedispersion, which was calculated using the following equation:
Span ¼ ðD0:9 � D0:1ÞD0:5
3. Results and discussion
3.1. Effect of pH on the sodium caseinate/A.g mixture interactions
Any significant variations of the absorbance should reveal theappearance of coacervates or aggregates by modifying the lightproperties of the system (Schmitt, Sanchez, Thomas, & Hardy,1999). Turbidimetric measurements have been widely employedfor monitoring the complex coacervation process in variousproteinepolysaccharide systems (Ambjerg Pedersen & JØrgensen,1991; Lee & Hong, 2009; Singh et al., 2007; Stone & Nickerson,2011; Weinbreck, Nieuwenhuijse, Robijn, & de Kruif, 2003). Ina first step, turbidimetric measurements were used to investigatethe effect of pH (7.00e2.50) on the absorbance profile (at 400 nm)of a mixture consisting of the total biopolymer concentration of
0.06 wt.% with a ratio of protein to polysaccharide (Pr:Ps) of 3:1 onthe complex coacervation process of the sodium caseinate/A.gmixture.
As illustrated in Fig. 1, the 0.045 wt.% sodium caseinate solutionwithout A.gwas completely transparent until it reached a pH of 5.62.The absorbance increased abruptly between pH 5.62e4.31 witha peak at pH 4.31 and subsequently decreased again to very lowvalues (at pH � 3.60). This trend indicates that the solubility ofsodium caseinate is pH dependent (HadjSadok, Pitkowski, Nicolai,Benyahia, & Moulai-Mostefa, 2008; O’Kennedy & Mounsey, 2006;Ru,Wang, Lee, Ding, & Huang, 2012; Ruis, Venema, & van der Linden,2007). The increase in turbidityvalues isprimarilydue to the increaseof theparticles’numberandsize (Schmittetal.,1999). Thedecrease inthe turbidity is assumed to be a result of large-scale aggregation andthe subsequent precipitation of the caseinate samples. Aggregationof the sodium caseinate may occur because of a reduction in theelectrostatic repulsion between proteins around their pI(4.6) (Guzey&McClements, 2006; Ye et al., 2006). Also further acidification coulddevelopmore positive charges on the caseinate that could lead to theincrease in the solubility of the protein and consequently thedecrease in turbidity of the system. However, the turbidity of a pureA.g solution did not change as a function of pH.
The absorbance of sodium caseinate/A.g displayed a profiledifferent from that of sodium caseinate and A.g independently,indicating that there was an interaction between the protein andpolysaccharide (Fig. 1). The addition of A.g to the sodium caseinatesolution inducedaconsiderable rise in the initial increase in turbidity,which could be related to the weak association of sodium caseinatewith A.g at higher pH levels through hydrophobic interactions(Kobori et al., 2009). The turbidity increased at approximately pH6.50 (pHC), indicating the co-solubilityof the system. Althoughat thispH (6.50), sodium caseinate has not reached its pI, itsmoleculesmayhave positive patches while the overall charge on the caseinatemolecules is negative (Girard, Sanchez, Laneuville, Turgeon, &Gauthier, 2004; Girard, Turgeon, & Gauthier, 2002). However, A.g isnegatively charged through the pH interval 6.5e2 (Yokoyama,Srinivasan, & Fogler, 1988), suggesting that some attractive electro-static interactions between sodium caseinate and A.g had occurred,similar to effects observed in other proteinepolysaccharide interac-tions studies (Schmitt, Sanchez, Desobry-Banon, & Hardy, 1998;Weinbreck, Nieuwenhuijse, et al., 2003; Weinbreck, Nieuwenhuijse,Robijn, & deKruif, 2004). These primarycomplexes consist of a singlepolysaccharide chain, and the sodium caseinate molecules attach tothe external surface of the A.g by electrostatic interactions betweenthe uronic acid residues on A.g and the positive patches on sodiumcaseinate (Kasapis, Norton, & Ubbink, 2009; Kizilay, Kayitmazer, &
S.G. Gorji et al. / Food Hydrocolloids 34 (2014) 161e168164
Dubin, 2011; Klemmer, Waldner, Stone, Low, & Nickerson, 2012;Mattison, Wang, Grymonpr, & Dubin, 1999; Weinbreck, De Vries,et al., 2003; Weinbreck, Tromp, & De Kruif, 2004). Furthermore, itseems that the sodium caseinate/A.g solutionwas completely stablebetween pH 6.50 and 4.30, without evidence of phase separation orprecipitation indicating that the complexes were soluble and nophase separation occurred in this pH range. On decreasing the pHbelow4.3, althougha slight instabilityof the systemwasvisible in thecuvette (which could be due to the initiation of intermolecularcomplexes), the turbidity values continued to increase, reachinga maximum turbidity value at pH 4.15 (pHopt), indicating themaximum number of complexes. Subsequently, a large decrease inthe turbidity valuewasobservedwhendecreasing thepHbelow4.15.The abrupt change of the turbidity valuesmight have arisen from thelarge phase separation and sedimentation of particles in the sodiumcaseinate/A.g dispersions. At lower pH values, the sodium caseinate/A.g dispersions demonstrated a tendency towards a monophasicsystem. Consequently, the complex coacervation was completelysuppressed at approximately pH 2.50, where the A.g did not haveenough charge to interact with the positively charged sodiumcaseinate.
The pH-dependent turbidity profile of sodium caseinate/A.gappeared skewed towards the right. In other words, addition ofgum tragacanth to sodium caseinate lowers pH values at whichsodium caseinate precipitates (Ambjerg Pedersen & JØrgensen,1991). It was hypothesised that the presence of an anionic poly-saccharide caused a sufficient electrostatic repulsion to delayprotein aggregation. This indicates that A.g has a stabilising effecton sodium caseinate solutions below and at the isoelectric pH ofcasein. Previous studies have demonstrated the same effect forother anionic polysaccharides; e.g., CMC, dextran sulphate, pectin,and gum tragacanth (Ambjerg Pedersen & JØrgensen, 1991; Gorjiet al., 2011; Ru et al., 2012). A possible structural conformationcould be based around the self-aggregation of sodium caseinateand the presence of A.g to attach to the outside of these aggregatesthrough electrostatic interactions between the negatively chargedA.g and the positive patches on the surface of the caseinateaggregates. The prevention of the self-aggregation of sodiumcaseinate could therefore be due to steric stabilisation.
3.2. Effect of pH on the stability of the sodium caseinate/A.g systemas a function of time
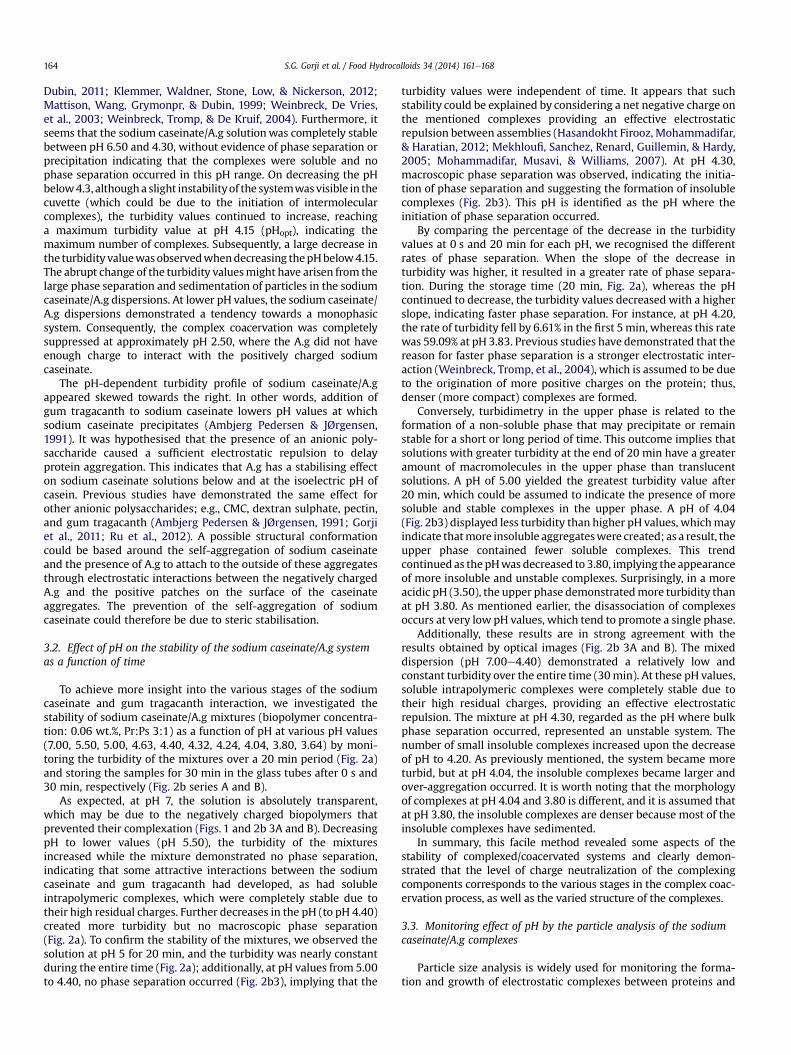
To achieve more insight into the various stages of the sodiumcaseinate and gum tragacanth interaction, we investigated thestability of sodium caseinate/A.g mixtures (biopolymer concentra-tion: 0.06 wt.%, Pr:Ps 3:1) as a function of pH at various pH values(7.00, 5.50, 5.00, 4.63, 4.40, 4.32, 4.24, 4.04, 3.80, 3.64) by moni-toring the turbidity of the mixtures over a 20 min period (Fig. 2a)and storing the samples for 30 min in the glass tubes after 0 s and30 min, respectively (Fig. 2b series A and B).
As expected, at pH 7, the solution is absolutely transparent,which may be due to the negatively charged biopolymers thatprevented their complexation (Figs. 1 and 2b 3A and B). DecreasingpH to lower values (pH 5.50), the turbidity of the mixturesincreased while the mixture demonstrated no phase separation,indicating that some attractive interactions between the sodiumcaseinate and gum tragacanth had developed, as had solubleintrapolymeric complexes, which were completely stable due totheir high residual charges. Further decreases in the pH (to pH 4.40)created more turbidity but no macroscopic phase separation(Fig. 2a). To confirm the stability of the mixtures, we observed thesolution at pH 5 for 20 min, and the turbidity was nearly constantduring the entire time (Fig. 2a); additionally, at pH values from 5.00to 4.40, no phase separation occurred (Fig. 2b3), implying that the
turbidity values were independent of time. It appears that suchstability could be explained by considering a net negative charge onthe mentioned complexes providing an effective electrostaticrepulsion between assemblies (Hasandokht Firooz, Mohammadifar,& Haratian, 2012; Mekhloufi, Sanchez, Renard, Guillemin, & Hardy,2005; Mohammadifar, Musavi, & Williams, 2007). At pH 4.30,macroscopic phase separation was observed, indicating the initia-tion of phase separation and suggesting the formation of insolublecomplexes (Fig. 2b3). This pH is identified as the pH where theinitiation of phase separation occurred.
By comparing the percentage of the decrease in the turbidityvalues at 0 s and 20 min for each pH, we recognised the differentrates of phase separation. When the slope of the decrease inturbidity was higher, it resulted in a greater rate of phase separa-tion. During the storage time (20 min, Fig. 2a), whereas the pHcontinued to decrease, the turbidity values decreased with a higherslope, indicating faster phase separation. For instance, at pH 4.20,the rate of turbidity fell by 6.61% in the first 5min, whereas this ratewas 59.09% at pH 3.83. Previous studies have demonstrated that thereason for faster phase separation is a stronger electrostatic inter-action (Weinbreck, Tromp, et al., 2004), which is assumed to be dueto the origination of more positive charges on the protein; thus,denser (more compact) complexes are formed.
Conversely, turbidimetry in the upper phase is related to theformation of a non-soluble phase that may precipitate or remainstable for a short or long period of time. This outcome implies thatsolutions with greater turbidity at the end of 20 min have a greateramount of macromolecules in the upper phase than translucentsolutions. A pH of 5.00 yielded the greatest turbidity value after20 min, which could be assumed to indicate the presence of moresoluble and stable complexes in the upper phase. A pH of 4.04(Fig. 2b3) displayed less turbidity than higher pH values, whichmayindicate thatmore insoluble aggregateswere created; as a result, theupper phase contained fewer soluble complexes. This trendcontinued as the pHwas decreased to 3.80, implying the appearanceof more insoluble and unstable complexes. Surprisingly, in a moreacidic pH (3.50), the upper phase demonstratedmore turbidity thanat pH 3.80. As mentioned earlier, the disassociation of complexesoccurs at very low pH values, which tend to promote a single phase.
Additionally, these results are in strong agreement with theresults obtained by optical images (Fig. 2b 3A and B). The mixeddispersion (pH 7.00e4.40) demonstrated a relatively low andconstant turbidity over the entire time (30min). At these pH values,soluble intrapolymeric complexes were completely stable due totheir high residual charges, providing an effective electrostaticrepulsion. The mixture at pH 4.30, regarded as the pH where bulkphase separation occurred, represented an unstable system. Thenumber of small insoluble complexes increased upon the decreaseof pH to 4.20. As previously mentioned, the system became moreturbid, but at pH 4.04, the insoluble complexes became larger andover-aggregation occurred. It is worth noting that the morphologyof complexes at pH 4.04 and 3.80 is different, and it is assumed thatat pH 3.80, the insoluble complexes are denser because most of theinsoluble complexes have sedimented.
In summary, this facile method revealed some aspects of thestability of complexed/coacervated systems and clearly demon-strated that the level of charge neutralization of the complexingcomponents corresponds to the various stages in the complex coac-ervation process, as well as the varied structure of the complexes.
3.3. Monitoring effect of pH by the particle analysis of the sodiumcaseinate/A.g complexes
Particle size analysis is widely used for monitoring the forma-tion and growth of electrostatic complexes between proteins and

Fig. 2. a. Time-dependent profiles of absorbance at various pH values obtained from 0.06 wt.% sodium caseinate/A.g mixed dispersions (Pr:Ps 3:1). - pH:6, , pH:4.97, C pH:4.23,B pH:4.18,: pH:4.13, D pH:3.83, � pH:3.5. b. Photographs of 1) a blank of 0.015 wt.% A.g dispersion, 2) a blank of 0.045 wt.% sodium caseinate solution and 3) sodium caseinate/A.gmixtures (total concentration: 0.06 wt.%, Pr:Ps 3:1, at different pH values (Left to right: pH ¼ 7, 5.5, 5, 4.63, 4.4, 4.32, 4.24, 4.04, 3.8 and 3.64) A series: after 0 s, B series: after 30 min.
S.G. Gorji et al. / Food Hydrocolloids 34 (2014) 161e168 165
S.G. Gorji et al. / Food Hydrocolloids 34 (2014) 161e168166
polysaccharides. Thus, we applied this technique to investigate theformation of sodium caseinate/A.g complexes at different pH values(Anal et al., 2008; Harnsilawat, Pongsawatmanit, & McClements,2006; Kilara, 2006; Mekhloufi et al., 2005; Tobiassen et al., 2008).The particle size measurements (Table 1a) indicate that the pureprotein tended to form large aggregates when the pH reduced to 4(d[2,1] ¼ 4.88 mme35.66 mm); moreover, it reached its maximumsize at pH 4, and further acidification led to smaller particles (at pH3.60 d[2,1] is 1.96 mm). It has been postulated that lowering the pHfrom 5.00 to 4.00 leads to the aggregation (O’Kennedy et al., 2006;Ruis et al., 2007) of caseinate, leading to the contribution of largeparticles. At pH 4.00, the isoelectric point of the casein proteins isapproached and electrostatic repulsion is decreased, and theextensive aggregation of caseinate occurs. A greater decrease in pHdevelops more positive charges on the caseinate, and because ofthe repulsion forces, large aggregates are converted into smallerones; consequently the solubility of the protein is increased and thenumber of the insoluble protein particles is decreased. Thisphenomenon explains why the particles are smaller at pH 3.60.
The D[2, 1] of the sodium caseinate/A.g complex at pH 5.00 isapproximately 138.15 mm, which is smaller than the D[2, 1] of A.g,and according to the span value, this indicates a homogenoussystem. The particle size decreased gradually with decreasing pH,but the particle size decreased drastically at pH 4.00. The decreaseof the particle size of the complex might be due to the shrinkage ofthe molecule, which became less expanded when the sodiumcaseinate interacted with the carboxylic groups of the poly-saccharide, leading to reduced intermolecular repulsion. However,when the pH reduced further (3.60), the complexation was sup-pressed, and the particles became larger. Weinbreck et al. reportedthat the size reduction of the polymer with a simultaneous increaseof the molecular weight accent the complexation of WP moleculesto the EPS B40 chain, and the increase of turbidity in the solublecomplex region can be attributed to an increase in the molecularweight of the compounds and not an increase in their size(Weinbreck, Nieuwenhuijse, et al., 2003).
It is obvious that the particle size of the sodium caseinate/A.gcomplexes was greatly affected by the presence of gum tragacanth,especially at pH 4.00. In addition, these results indicate that at thispH while the size of gum tragacanth in the absence of sodiumcaseinate is large, the presence of sodium caseinate resulted information of nanoparticles, which are even smaller than theparticles of blank sodium caseinate.
Additionally, to confirm the results from the surface, weconsidered the number values of d(0.1), d(0.5) and d(0.9) for thesodium caseinate/A.g mixture at pH 4.00, which exhibiteda significant decrease in size even to very low values outside therange of measurement and was in agreement with the surface data.
Table 1Particle size parameters of sodium caseinate (0.045 wt.%), Astragalus gossypinus (A.g) (0values: 5, 4.2, 4, 3.6.
a. Particle size parameters on surface
pH Sodium caseinate Sodium caseinate/A.g com
d(0.1)mm
d(0.5)mm
d(0.9)mm
D[2, 1]mm
D[4, 3]mm
Span d(0.1)mm
d(0.5)mm
d(0.9)mm
5 0.04 0.16 0.38 4.88 57.67 2.12 15.05 109.02 289.484.2 0.32 13.95 44.45 18.27 34.93 3.16 0.84 53.14 235.144 2.08 32.49 71.51 35.66 55.34 2.136 0.17 14.15 43.343.6 0.11 0.98 4.45 1.96 5.50 4.42 0.24 18.83 148.71
b. Particle size parameters on number at pH 4
d(0.1) mm
A.g 13.47Sodium caseinate 0.47Sodium caseinate/A.g 0.01
Our opinion is that the presence of A.g affected the size distributionof the solution, which could be related to the interaction betweenthe positively charged sodium caseinate and the negatively chargedpolysaccharides, resulting in the formation of nanoparticles(70 nm). These experiments indicate that the addition of 0.015 wt.%A.g to sodium caseinate 0.045 wt.% at pH 4.00 formed nanoparticlecomplexes of approximately 70 nm. Previous studies have reportedthe formation of nanoparticles between sodium caseinate and gumarabic below pH 5.4 over a defined pH range dependent on the ratioof sodium caseinate to gum arabic and on ionic strength, with sizesbetween 100 and 200 nm; sodium caseinate and chitosan formedparticles from 170 to 700 nm (Anal et al., 2008; Ye et al., 2006).
3.4. Effect of biopolymer concentration on the pH-absorbanceprofile of the sodium caseinate/A.g mixtures
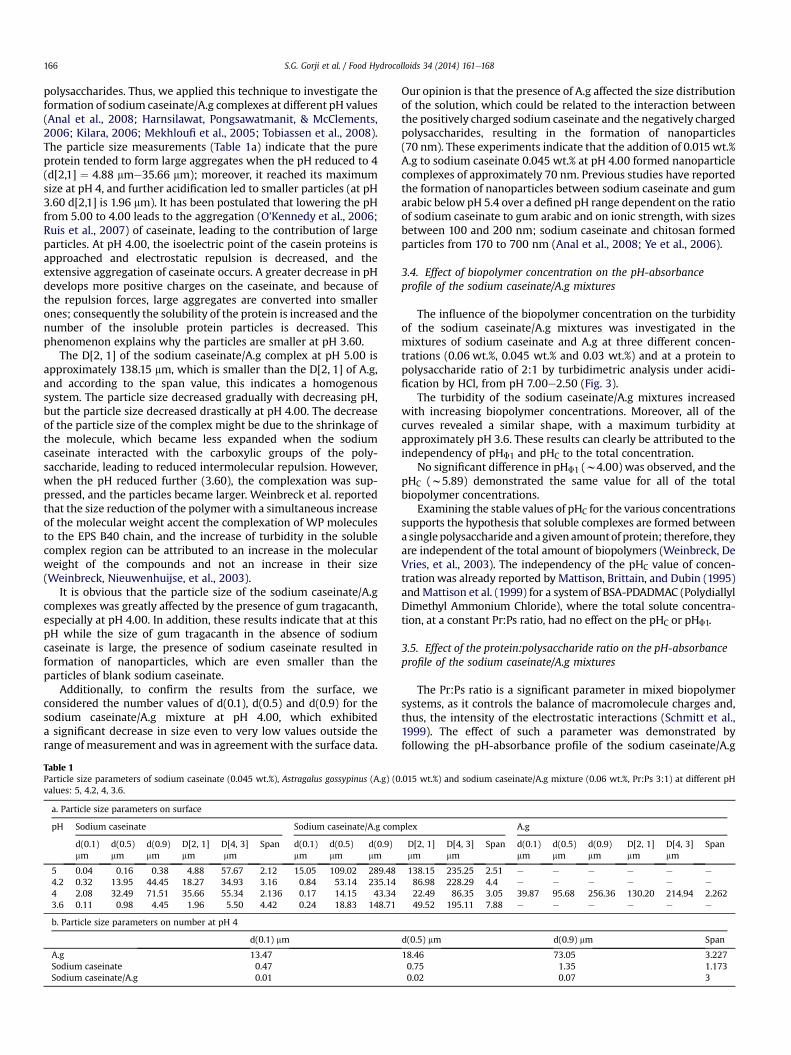
The influence of the biopolymer concentration on the turbidityof the sodium caseinate/A.g mixtures was investigated in themixtures of sodium caseinate and A.g at three different concen-trations (0.06 wt.%, 0.045 wt.% and 0.03 wt.%) and at a protein topolysaccharide ratio of 2:1 by turbidimetric analysis under acidi-fication by HCl, from pH 7.00e2.50 (Fig. 3).
The turbidity of the sodium caseinate/A.g mixtures increasedwith increasing biopolymer concentrations. Moreover, all of thecurves revealed a similar shape, with a maximum turbidity atapproximately pH 3.6. These results can clearly be attributed to theindependency of pHF1 and pHC to the total concentration.
No significant difference in pHF1 (w4.00) was observed, and thepHC (w5.89) demonstrated the same value for all of the totalbiopolymer concentrations.
Examining the stable values of pHC for the various concentrationssupports the hypothesis that soluble complexes are formed betweena singlepolysaccharide andagivenamountof protein; therefore, theyare independent of the total amount of biopolymers (Weinbreck, DeVries, et al., 2003). The independency of the pHC value of concen-trationwas already reported by Mattison, Brittain, and Dubin (1995)and Mattison et al. (1999) for a system of BSA-PDADMAC (PolydiallylDimethyl Ammonium Chloride), where the total solute concentra-tion, at a constant Pr:Ps ratio, had no effect on the pHC or pHF1.
3.5. Effect of the protein:polysaccharide ratio on the pH-absorbanceprofile of the sodium caseinate/A.g mixtures
The Pr:Ps ratio is a significant parameter in mixed biopolymersystems, as it controls the balance of macromolecule charges and,thus, the intensity of the electrostatic interactions (Schmitt et al.,1999). The effect of such a parameter was demonstrated byfollowing the pH-absorbance profile of the sodium caseinate/A.g
.015 wt.%) and sodium caseinate/A.g mixture (0.06 wt.%, Pr:Ps 3:1) at different pH
plex A.g
D[2, 1]mm
D[4, 3]mm
Span d(0.1)mm
d(0.5)mm
d(0.9)mm
D[2, 1]mm
D[4, 3]mm
Span
138.15 235.25 2.51 e e e e e e
86.98 228.29 4.4 e e e e e e
22.49 86.35 3.05 39.87 95.68 256.36 130.20 214.94 2.26249.52 195.11 7.88 e e e e e e
d(0.5) mm d(0.9) mm Span
18.46 73.05 3.2270.75 1.35 1.1730.02 0.07 3
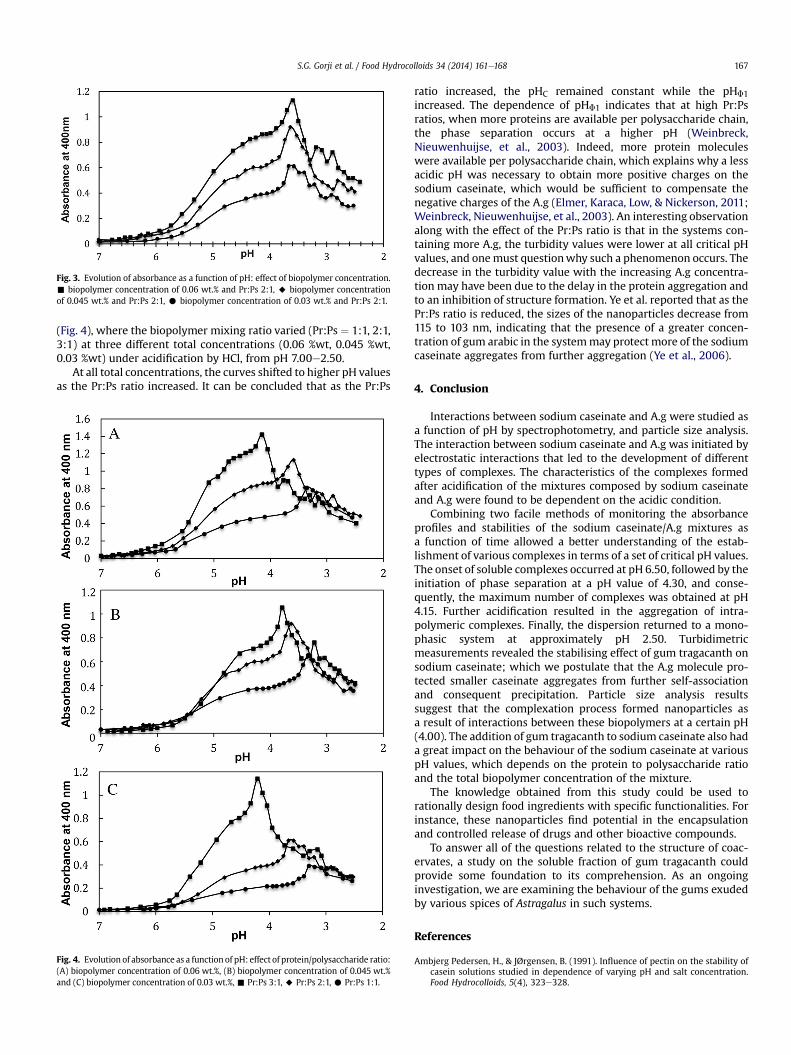
Fig. 3. Evolution of absorbance as a function of pH: effect of biopolymer concentration.- biopolymer concentration of 0.06 wt.% and Pr:Ps 2:1, A biopolymer concentrationof 0.045 wt.% and Pr:Ps 2:1, C biopolymer concentration of 0.03 wt.% and Pr:Ps 2:1.
S.G. Gorji et al. / Food Hydrocolloids 34 (2014) 161e168 167
(Fig. 4), where the biopolymer mixing ratio varied (Pr:Ps ¼ 1:1, 2:1,3:1) at three different total concentrations (0.06 %wt, 0.045 %wt,0.03 %wt) under acidification by HCl, from pH 7.00e2.50.
At all total concentrations, the curves shifted to higher pH valuesas the Pr:Ps ratio increased. It can be concluded that as the Pr:Ps
Fig. 4. Evolution of absorbance as a function of pH: effect of protein/polysaccharide ratio:(A) biopolymer concentration of 0.06 wt.%, (B) biopolymer concentration of 0.045 wt.%and (C) biopolymer concentration of 0.03 wt.%,- Pr:Ps 3:1, A Pr:Ps 2:1, C Pr:Ps 1:1.
ratio increased, the pHC remained constant while the pHF1increased. The dependence of pHF1 indicates that at high Pr:Psratios, when more proteins are available per polysaccharide chain,the phase separation occurs at a higher pH (Weinbreck,Nieuwenhuijse, et al., 2003). Indeed, more protein moleculeswere available per polysaccharide chain, which explains why a lessacidic pH was necessary to obtain more positive charges on thesodium caseinate, which would be sufficient to compensate thenegative charges of the A.g (Elmer, Karaca, Low, & Nickerson, 2011;Weinbreck, Nieuwenhuijse, et al., 2003). An interesting observationalong with the effect of the Pr:Ps ratio is that in the systems con-taining more A.g, the turbidity values were lower at all critical pHvalues, and onemust questionwhy such a phenomenon occurs. Thedecrease in the turbidity value with the increasing A.g concentra-tion may have been due to the delay in the protein aggregation andto an inhibition of structure formation. Ye et al. reported that as thePr:Ps ratio is reduced, the sizes of the nanoparticles decrease from115 to 103 nm, indicating that the presence of a greater concen-tration of gum arabic in the systemmay protect more of the sodiumcaseinate aggregates from further aggregation (Ye et al., 2006).
4. Conclusion
Interactions between sodium caseinate and A.g were studied asa function of pH by spectrophotometry, and particle size analysis.The interaction between sodium caseinate and A.g was initiated byelectrostatic interactions that led to the development of differenttypes of complexes. The characteristics of the complexes formedafter acidification of the mixtures composed by sodium caseinateand A.g were found to be dependent on the acidic condition.
Combining two facile methods of monitoring the absorbanceprofiles and stabilities of the sodium caseinate/A.g mixtures asa function of time allowed a better understanding of the estab-lishment of various complexes in terms of a set of critical pH values.The onset of soluble complexes occurred at pH 6.50, followed by theinitiation of phase separation at a pH value of 4.30, and conse-quently, the maximum number of complexes was obtained at pH4.15. Further acidification resulted in the aggregation of intra-polymeric complexes. Finally, the dispersion returned to a mono-phasic system at approximately pH 2.50. Turbidimetricmeasurements revealed the stabilising effect of gum tragacanth onsodium caseinate; which we postulate that the A.g molecule pro-tected smaller caseinate aggregates from further self-associationand consequent precipitation. Particle size analysis resultssuggest that the complexation process formed nanoparticles asa result of interactions between these biopolymers at a certain pH(4.00). The addition of gum tragacanth to sodium caseinate also hada great impact on the behaviour of the sodium caseinate at variouspH values, which depends on the protein to polysaccharide ratioand the total biopolymer concentration of the mixture.
The knowledge obtained from this study could be used torationally design food ingredients with specific functionalities. Forinstance, these nanoparticles find potential in the encapsulationand controlled release of drugs and other bioactive compounds.
To answer all of the questions related to the structure of coac-ervates, a study on the soluble fraction of gum tragacanth couldprovide some foundation to its comprehension. As an ongoinginvestigation, we are examining the behaviour of the gums exudedby various spices of Astragalus in such systems.
References
Ambjerg Pedersen, H., & JØrgensen, B. (1991). Influence of pectin on the stability ofcasein solutions studied in dependence of varying pH and salt concentration.Food Hydrocolloids, 5(4), 323e328.
S.G. Gorji et al. / Food Hydrocolloids 34 (2014) 161e168168
Anal, A. K., Tobiassen, A., Flanagan, J., & Singh, H. (2008). Preparation and charac-terization of nanoparticles formed by chitosanecaseinate interactions. Colloidsand Surfaces B, Biointerfaces, 64(1), 104e110.
Balaghi, S., Mohammadifar, M. A., & Zargaraan, A. (2010). Physicochemical andrheological characterization of gum tragacanth exudates from six species ofIranian Astragalus. Food Biophysics, 5(1), 59e71.
Balaghi, S., Mohammadifar, M. A., Zargaraan, A., Gavlighi, H. A., & Mohammadi, M.(2011). Compositional analysis and rheological characterization of gum traga-canth exudates from six species of Iranian Astragalus. Food Hydrocolloids, 25(7),1775e1784.
Elmer, C., Karaca, A. C., Low, N. H., & Nickerson, M. T. (2011). Complex coacervationin pea protein isolate chitosan mixtures. Food Research International, 44(5),1441e1446.
Girard, M., Sanchez, C., Laneuville, S. I., Turgeon, S. L., & Gauthier, S. F. (2004).Associative phase separation of [beta]-lactoglobulin/pectin solutions: a kineticstudy by small angle static light scattering. Colloids and Surfaces B: Biointerfaces,35(1), 15e22.
Girard, M., Turgeon, S. L., & Gauthier, S. F. (2002). Interbiopolymer complexingbetween [beta]-lactoglobulin and low-and high-methylated pectinmeasured by potentiometric titration and ultrafiltration. Food Hydrocolloids,16(6), 585e591.
Gorji, E. G., Mohammadifar, M. A., & Ezzatpanah, H. (2011). Influence of gumtragacanth, Astragalus gossypinus, addition on stability of nonfat Doogh, anIranian fermented milk drink. International Journal of Dairy Technology, 64(2),262e268.
Guzey, D., & McClements, D. J. (2006). Formation, stability and properties ofmultilayer emulsions for application in the food industry. Advances in Colloidand Interface Science, 128, 227e248.
HadjSadok, A., Pitkowski, A., Nicolai, T., Benyahia, L., & Moulai-Mostefa, N. (2008).Characterisation of sodium caseinate as a function of ionic strength, pH andtemperature using static and dynamic light scattering. Food Hydrocolloids,22(8), 1460e1466.
Harnsilawat, T., Pongsawatmanit, R., & McClements, D. (2006). Characterization of[beta]-lactoglobulinesodium alginate interactions in aqueous solutions:a calorimetry, light scattering, electrophoretic mobility and solubility study.Food Hydrocolloids, 20(5), 577e585.
Hasandokht Firooz, M., Mohammadifar, M. A., & Haratian, P. (2012). Self-assembly ofbeta-lactoglobulin and the soluble fraction of gum tragacanth in aqueousmedium. International Journal of Biological Macromolecules, .
Ho, C., & Waugh, D. F. (1965). Interactions of bovine caseins with divalent Cations1.Journal of the American Chemical Society, 87(4), 889e892.
Kasapis, S., Norton, I. T., & Ubbink, J. B. (2009). Modern biopolymer science: Bridgingthe divide between fundamental treatise and industrial application. AcademicPress.
Kilara, A. (2006). Interactions of ingredients in food systems: an introduction. FoodScience And Technology, 154, 1, New York: Marcel Dekker.
Kizilay, E., Kayitmazer, A. B., & Dubin, P. L. (2011). Complexation and coacervation ofpolyelectrolytes with oppositely charged colloids. Advances in Colloid andInterface Science, 167(1), 24e37.
Klemmer, K., Waldner, L., Stone, A., Low, N., & Nickerson, M. (2012). Complexcoacervation of pea protein isolate and alginate polysaccharides. Food Chem-istry, .
Kobori, T., Matsumoto, A., & Sugiyama, S. (2009). pH-Dependent interactionbetween sodium caseinate and xanthan gum. Carbohydrate Polymers, 75(4),719e723.
Lee, A. C., & Hong, Y. H. (2009). Coacervate formation of [alpha]-lactalbumin-chitosan and [beta]-lactoglobulin-chitosan complexes. Food Research Interna-tional, 42(5e6), 733e738.
Liu, S., Elmer, C., Low, N., & Nickerson, M. (2010). Effect of pH on the functionalbehaviour of pea protein isolate-gum Arabic complexes. Food Research Inter-national, 43(2), 489e495.
McClements, D. J. (2004). Food emulsions: Principles, practices, and techniques. CRC.Mattison, K. W., Brittain, I. J., & Dubin, P. L. (1995). Protein-polyelectrolyte phase
boundaries. Biotechnology Progress, 11(6), 632e637.Mattison, K. W., Wang, Y., Grymonpr, K., & Dubin, P. L. (1999). In. Micro- and macro-
phase behavior in protein-polyelectrolyte complexes, Vol. 140 (pp. 53e76). WileyOnline Library.
Mekhloufi, G., Sanchez, C., Renard, D., Guillemin, S., & Hardy, J. (2005). pH-Inducedstructural transitions during complexation and coacervation of beta-lactoglobulin and acacia gum. Langmuir, 21(1), 386e394.
Mohammadifar, M. A., Musavi, S. M., Kiumarsi, A., & Williams, P. A. (2006). Solutionproperties of targacanthin (water-soluble part of gum tragacanth exudate fromAstragalus gossypinus). International Journal of Biological Macromolecules, 38(1),31e39.
Mohammadifar, M., Musavi, S., & Williams, P. (2007). Study of complex coacervationbetween beta-lactoglobulin and tragacanthin (soluble part of gum tragacanth).Milchwissenschaft, 62(4), 389e392.
Nash, W., Pinder, D., Hemar, Y., & Singh, H. (2002). Dynamic light scatteringinvestigation of sodium caseinate and xanthan mixtures. International Journal ofBiological Macromolecules, 30(5), 269e271.
Nono, M., Durand, D., & Nicolai, T. (2012). Rheology and structure of mixtures of i-carrageenan and sodium caseinate. Food Hydrocolloids, 27(1), 235e241.
Nono, M., Lalouette, L., Durand, D., & Nicolai, T. (2010). Cluster formation and phaseseparation in mixtures of sodium [kappa]-carrageenan and sodium caseinate.Food Hydrocolloids, .
O’Kennedy, B. T., & Mounsey, J. S. (2006). Control of heat-induced aggregation ofwhey proteins using casein. Journal of Agricultural and Food Chemistry, 54(15),5637e5642.
Perrechil, F., Braga, A., & Cunha, R. (2009). Interactions between sodium caseinateand LBG in acidified systems: rheology and phase behavior. Food Hydrocolloids,23(8), 2085e2093.
Ru, Q., Wang, Y., Lee, J., Ding, Y., & Huang, Q. (2012). Turbidity and rheologicalproperties of bovine serum albumin/pectin coacervates: effect of salt concen-tration and initial protein/polysaccharide ratio. Carbohydrate Polymers, .
Ruis, H. G. M., Venema, P., & van der Linden, E. (2007). Relation between pH-inducedstickiness and gelation behaviour of sodium caseinate aggregates as determinedby light scattering and rheology. Food Hydrocolloids, 21(4), 545e554.
Samant, S., Singhal, R., Kulkarni, P., & Rege, D. (1993). Protein-polysaccharideinteractions: a new approach in food formulations. International Journal of FoodScience & Technology, 28(6), 547e562.
Sanchez, C., Schmitt, C., Babak, V., & Hardy, J. (1997). Rheology of whey proteinisolate-xanthan mixed solutions and gels. Effect of pH and xanthan concen-tration. Food/Nahrung, 41(6), 336e343.
Schmitt, C., Sanchez, C., Desobry-Banon, S., & Hardy, J. (1998). Structure and tech-nofunctional properties of proteinepolysaccharide complexes: a review. CriticalReviews in Food Science and Nutrition, 38(8), 689e753.
Schmitt, C., Sanchez, C., Thomas, F., & Hardy, J. (1999). Complex coacervationbetween [beta]-lactoglobulin and acacia gum in aqueous medium. FoodHydrocolloids, 13(6), 483e496.
Semenova, M. G., Belyakova, L. E., Polikarpov, Y. N., Antipova, A. S., & Dickinson, E.(2009). Light scattering study of sodium caseinate þ dextran sulfate in aqueoussolution: relationship to emulsion stability. Food Hydrocolloids, 23(3), 629e639.
Singh, S. S., Siddhanta, A., Meena, R., Prasad, K., Bandyopadhyay, S., & Bohidar, H.(2007). Intermolecular complexation and phase separation in aqueous solu-tions of oppositely charged biopolymers. International Journal of BiologicalMacromolecules, 41(2), 185e192.
Spruijt, E., Sprakel, J., Stuart, M. A. C., & van der Gucht, J. (2010). Interfacial tensionbetween a complex coacervate phase and its coexisting aqueous phase. SoftMatter, 6(1), 172e178.
Stone, A. K., & Nickerson, M. T. (2011). Formation and functionality of whey proteinisolate (kappa-, iota-, and lambda-type) carrageenan electrostatic complexes.Food Hydrocolloids, .
Tobiassen, A., Flanagan, J., & Singh, H. (2008). Preparation and characterization ofnanoparticles formed by chitosanecaseinate interactions. Colloids and SurfacesB: Biointerfaces, 64(1), 104e110.
Tolstoguzov, V. B. (1997). Proteinepolysaccharide interactions. Food Science andTechnology171e198, New York: Marcel Dekker.
Turgeon, S., Beaulieu, M., Schmitt, C., & Sanchez, C. (2003). Protein-polysaccharideinteractions: phase-ordering kinetics, thermodynamic and structural aspects.Current Opinion in Colloid & Interface Science, 8(4e5), 401e414.
Weinbreck, F., De Vries, R., Schrooyen, P., & De Kruif, C. (2003). Complex coacer-vation of whey proteins and gum arabic. Biomacromolecules, 4(2), 293e303.
Weinbreck, F., Nieuwenhuijse, H., Robijn, G. W., & de Kruif, C. G. (2003). Complexformation of whey proteins: exocellular polysaccharide EPS B40. Langmuir,19(22), 9404e9410.
Weinbreck, F., Nieuwenhuijse, H., Robijn, G. W., & de Kruif, C. G. (2004).Complexation of whey proteins with carrageenan. Journal of Agricultural andFood Chemistry, 52(11), 3550e3555.
Weinbreck, F., Tromp, R., & De Kruif, C. (2004). Composition and structure of wheyprotein/gum arabic coacervates. Biomacromolecules, 5(4), 1437e1445.
Weiping, W. (2000). Tragacanth and karaya. In G. Phillips, & P. Williams (Eds.),Handbook of hydrocolloids (pp. 231e246).
Ye, A. (2008). Complexation between milk proteins and polysaccharides via elec-trostatic interaction: principles and applicationsea review. International Journalof Food Science & Technology, 43(3), 406e415.
Ye, A., Edwards, P. L. B., Gilliland, J., Jameson, G. B., & Singh, H. (2011). Temperature-dependent complexation between sodium caseinate and gum arabic. FoodHydrocolloids, .
Ye, A., Flanagan, J., & Singh, H. (2006). Formation of stable nanoparticles via elec-trostatic complexation between sodium caseinate and gum arabic. Biopolymers,82(2), 121e133.
Yokoyama, A., Srinivasan, K. R., & Fogler, H. S. (1988). Stabilization mechanism ofcolloidal suspensions by gum tragacanth: the influence of pH on stability.Journal of Colloid and Interface Science, 126(1), 141e149.
Copyright © 2022 FDOKUMEN