A new breakfast cereal containing guar gum reduces postprandial plasma glucose and insulin...
11
British Journal of Nutrition (1996), 76, 63-73 63 A new breakfast cereal containing guar gum reduces postprandial plasma glucose and insulin concentrations in normal-weight human subjects BY R. M. FAIRCHILD'*, P. R. ELLIS', A. J. BYRNE3, S. D. LUZI04 AND M. A. MIR3 Food Research Group, Shefield Hallam University, Totley Hall Lane, Shefield S17 4AB ' Biopolymers Group, Division of Life Sciences, King's College London, Campden Hill Road, London W8 7AH Department of Medicine, and Diabetes Research Unit, University of Wales College of Medicine, Heath Park, Card@ CF4 4XW (Received 30 June 1995 - Revised 13 November 1995 - Accepted 27 November 1995) A new guar-containing wheafflake product was develojwd to assess its effect on carbohydrate tolerance in normal-weight, healthy subjects. The extruded wheafflake breakfast cereals containing 0 (control) or approximately 90 g guar gumkg DM were fed to ten fasting, normal-weight, healthy subjects using a repeated measures design. The meals were similar in energy (approximately 1-SMJ), available carbohydrate (78 g), protein (15 g) and fat (5.4 g) content. The guar gum content of the test meals was 6.3 g. Venous blood samples were taken fasting and at 15,30,45, 60,90,120, 150 and 240 min after commencing each breakfast and analysed for plasma glucose, insulin and C-peptide. The guar wheafflake meal produced a significant main effect for glucose and insulin at 0-60 min and 0-240 min time intervals respectively, but not for the C-peptide levels compared with the control meal. Significant reductions in postprandial glucose and insulin responses were seen following the guar wheatflake meal compared with the control meal at 15 and 60 min (glucose) and 15, 60, 90 and 120 min (insulin). The 60 and 120 min areas under the curve for glucose and insulin were significantly reduced by the guar gum meal, as was the 240 min area under the curve for insulin. Thus, it can be concluded that the use of a severe method of heat extrusion to produce guar wheafflakes does not diminish the physiological activity of the guar gum- Guar gum: Glycaemic response: Insulin The physiological properties of oral doses of guar gum in experimental animals and man, notably its effectiveness in reducing postprandial plasma glucose and insulin levels and fasting plasma LDL-cholesterol concentration, have been well documented (Jenkins et al. 1978; Morgan et al. 1979; Sambrook & Rainbird, 1985;Fuessl et al. 1986;Gatenby, 1990). Its use as a dietary supplement in the treatment of diabetes has been advocated on the basis of its beneficial effects on glycaemic control and lipid metabolism (Peterson, 1985). In view of the emerging link between hyperinsulinaemia and cardiovascular disease (Defronzo & Ferrannini, 1991), the insulin-lowering property of guar gum needs to be investigated in both non-diabetic and diabetic individuals. Guar gum in its raw form or mixed with water is extremely unpalatable (Peterson et al. 1987; Braaten et al. 1991). To improve its palatability, guar gum can easily be incorporated into foods such as bread, biscuits, pasta and snack bars (Gatti et al. 1984; Smith et al. 1985; * Present address: University of Wales Institute, Cardiff, Faculty of Business, Leisure and Food, Colchester Avenue, Cardiff CF3 7XR.
-
Upload
cardiffmet -
Category
Documents
-
view
0 -
download
0
Transcript of A new breakfast cereal containing guar gum reduces postprandial plasma glucose and insulin...
British Journal of Nutrition (1996), 76, 63-73 63
A new breakfast cereal containing guar gum reduces postprandial plasma glucose and insulin concentrations in
normal-weight human subjects BY R. M. FAIRCHILD'*, P. R. ELLIS', A. J. BYRNE3, S. D. L U Z I 0 4 AND M. A. MIR3
Food Research Group, Shefield Hallam University, Totley Hall Lane, Shefield S17 4AB ' Biopolymers Group, Division of Life Sciences, King's College London, Campden Hill Road,
London W8 7AH Department of Medicine, and Diabetes Research Unit, University of Wales College of Medicine,
Heath Park, Card@ CF4 4XW
(Received 30 June 1995 - Revised 13 November 1995 - Accepted 27 November 1995)
A new guar-containing wheafflake product was develojwd to assess its effect on carbohydrate tolerance in normal-weight, healthy subjects. The extruded wheafflake breakfast cereals containing 0 (control) or approximately 90 g guar gumkg DM were fed to ten fasting, normal-weight, healthy subjects using a repeated measures design. The meals were similar in energy (approximately 1-SMJ), available carbohydrate (78 g), protein (15 g) and fat (5.4 g) content. The guar gum content of the test meals was 6.3 g. Venous blood samples were taken fasting and at 15,30,45, 60,90,120, 150 and 240 min after commencing each breakfast and analysed for plasma glucose, insulin and C-peptide. The guar wheafflake meal produced a significant main effect for glucose and insulin at 0-60 min and 0-240 min time intervals respectively, but not for the C-peptide levels compared with the control meal. Significant reductions in postprandial glucose and insulin responses were seen following the guar wheatflake meal compared with the control meal at 15 and 60 min (glucose) and 15, 60, 90 and 120 min (insulin). The 60 and 120 min areas under the curve for glucose and insulin were significantly reduced by the guar gum meal, as was the 240 min area under the curve for insulin. Thus, it can be concluded that the use of a severe method of heat extrusion to produce guar wheafflakes does not diminish the physiological activity of the guar gum- Guar gum: Glycaemic response: Insulin
The physiological properties of oral doses of guar gum in experimental animals and man, notably its effectiveness in reducing postprandial plasma glucose and insulin levels and fasting plasma LDL-cholesterol concentration, have been well documented (Jenkins et al. 1978; Morgan et al. 1979; Sambrook & Rainbird, 1985; Fuessl et al. 1986; Gatenby, 1990). Its use as a dietary supplement in the treatment of diabetes has been advocated on the basis of its beneficial effects on glycaemic control and lipid metabolism (Peterson, 1985). In view of the emerging link between hyperinsulinaemia and cardiovascular disease (Defronzo & Ferrannini, 1991), the insulin-lowering property of guar gum needs to be investigated in both non-diabetic and diabetic individuals.
Guar gum in its raw form or mixed with water is extremely unpalatable (Peterson et al. 1987; Braaten et al. 1991). To improve its palatability, guar gum can easily be incorporated into foods such as bread, biscuits, pasta and snack bars (Gatti et al. 1984; Smith et al. 1985;
* Present address: University of Wales Institute, Cardiff, Faculty of Business, Leisure and Food, Colchester Avenue, Cardiff CF3 7XR.
64 R. M. FAIRCHILD A N D OTHERS
Ellis et al. 1988a, b), which appear also to be the most clinically effective modes of administration (Fuessl et al. 1986; Peterson et al. 1987; Fairchild et al. 1990).
Recent evidence indicates that the effect of guar gum on postprandial hyperglycaemia depends mainly on its capacity to increase the viscosity of the digesta in the small intestine (Blackburn et al. 1984; Ellis et al. 1995). The viscosity-producing component of guar gum, a seed extract of the leguminous plant Cyamopsis tetragonoloba (L.) Taub., is the galactomannan polymer. The degree of viscosity of guar gum is critically dependent on the concentration and molecular weight of this galactomannan fraction, and also on its rate of hydration, which is influenced by many factors, including the particle size of the guar gum preparation (Ellis & Morris, 1991). It is possible that the processing of foods containing guar gum, particularly the process of extrusion cooking, in which severe conditions of high pressure and temperature are employed, could lead to depolymerization of the galactomannan and, therefore, to a loss of biological activity. Thus, if new food products containing guar gum are to be developed for the treatment of diabetes then the efficacy of such products needs to be tested in clinical trials.
The present paper describes the development and physiological testing of a new extruded breakfast cereal product containing guar gum. The effect of this product on postprandial hyperglycaemia and plasma insulin levels was tested in non-diabetic subjects. The postprandial changes in plasma C-peptide levels were also measured to indicate whether guar gum reduces insulin secretion and/or increases hepatic extraction of insulin (Polonsky & Rubenstein, 1984; Polonsky et al. 1986).
A breakfast cereal was selected as a particularly suitable food vehicle for guar gum for a number of reasons. First, such a guar product is likely to decrease the post-breakfast blood glucose rise, which is often the most marked hyperglycaemic excursion of the day (Schmidt et al. 1981). Second, many of the breakfast cereals (e.g. Cornflakes, Weetabix and Puffed Wheat) are classified as high glycaemic index (GI) foods (Wolever, 1990) and are, therefore, particularly suitable vehicles for NSP. Third, in a dietary survey carried out in a diabetic clinic in Cardiff, 87% of the diabetic patients consumed breakfast on a daily basis, 98 '/o of whom consumed bread and/or a breakfast cereal daily (Fairchild, 1991).
MATERIALS AND METHODS
Selection of cereal type Originally two types of par-containing breakfast cereal and their controls were manufactured for possible inclusion in the clinical trials. However, preliminary tests indicated that the guar-containing cornflake product was not as palatable, or as similar in appearance to its control, as the guar-containing wheatflakes. Also, slight differences in the production methods resulted in a lower maximum concentration in the guar-containing cornflakes than the guar-containing wheatflake product. In addition, the dietary survey of diabetics had revealed wheat-based cereals to be the most popular products, consumed by 63 % of those who took breakfast on a daily basis (Fairchild, 1991). For these reasons the guar-containing wheatflake product was chosen for clinical testing.
Recipe formulation Control and guar-containing wheatflakes were prepared by Newtime Foods Ltd, Hastings, East Sussex (a subsidiary of Premier Brands) using a basic extrusion method (Fell, 1987). The extrusion of a breakfast cereal involves cooking the dough in a chamber which is held at a temperature of approximately 200". The cooked dough is then forced through shaping dies to produce pellets which are rolled and toasted.
The dry ingredients for the control wheatflakes were 690 g wheat flour, 120 g rice flour,
METABOLIC EFFECTS OF A G U A R - G U M CEREAL 65
Table 1. Composition of control and guar-wheatjlake meals fed to non-diabetic subjects (n 10)
NSPf (9) Amount CHO* Protein Fat Energy?
Food (g) (€9 (s) (9) (MJ) Soluble Insoluble
Control wheatflakes 64 50 5.4 0.4 098 1 .o 3.0 Gnar-wheatflakes 70 50 5.8 0 4 0.98 5.5 3.6 Semi-skimmed milk 20 1 10 8.3 5.0 0.49 0 0 Orange juice 209 18 1.3 0 0.3 1 0- 1 0 Meal totals
Control meal 414 78 15 5.4 1.8 1.1 3.0 Guar meal 480 78 15.4 5.4 1 .8 5.6 3.6
* Available carbohydrate (starch, dextrins and sugars). t Includes a value for available carbohydrate expressed as monosaccharide. $ Determined by the method of Englyst & Cummings (1984).
160 g sugar and 30 g salt plus vitamin pre-mix per kg. The flours were partly replaced by a high-molecular-weight guar-gum flour (M150, Meyhall Chemical AG, Switzerland) at a level which, after rolling and drying, produced a wheatflake with a guar gum concentration of 90 g/kg. This concentration of guar gum was selected because at the time of production it was considered that increasing the level of guar gum in the cereal would have produced a dough too sticky to extrude (P. Fletcher, personal communication).
The average molecular weight of M150 guar gum, estimated from measurements of intrinsic viscosity, is approximately 2.38 x lo6 (Ellis et al. 1991). For quality-control purposes only, the ultimate viscosities of the guar-containing and control wheatflakes were measured, in triplicate, at 20' after 24 h hydration and thorough homogenization, using a Brookfield Synchro-Lectric RVT viscometer (spindle 4, speed 20 rev./min; Brookfield Instrumentation, Stoughton, MA, USA). The ultimate viscosities of the control and guar wheatflake dispersions were 1 (SE 0) and 1560 (SE 11) mPa.s respectively. The concentration of guar gum in the wheatflake product for the viscosity measurement was approximately 10 g/kg. An equivalent concentration of a pure, fully hydrated solution of M150 guar gum produced a viscosity of approximately 5500 mPa.s under the same conditions. This suggests that the guar gum might have been partly depolymerized during the heat treatment.
Composition of wheatflakes The wheatflakes were analysed for crude fat, crude protein (N x 6*25), moisture and ash using standard methods (Egan et al. 1981) and for NSP (Englyst & Cummings, 1984). The available carbohydrate content (78 g), which was mainly starch and sucrose, was determined by difference. The composition of the wheatflake meals as fed is presented in Table 1. Whilst 70 g breakfast cereal is more than twice a cereal manufacturer's stated average serving, a preliminary study indicated that this was a manageable portion size for normal-weight, healthy young people at breakfast (R. M. Fairchild, unpublished results). The guar gum content of the test meal was 6-3 g.
Subjects and ethical approval Ten normal-weight, healthy subjects were recruited from the University of Wales. Seven of the subjects were female. Their mean BMI was 22.4 (SE 0.5) kg/m2, with a range of
66 R. M. F A I R C H I L D A N D OTHERS
19.5-24.8 kg/m2. Their mean age was 22.6 (SE 1.2) years. Ethical approval was obtained from the University Hospital of Wales ethical committee.
Experimental design and procedure Each subject received two meals (Table l), in random order, at least 5 d apart, in order to minimize any carry-over effect from the control to the guar meal or vice versa. Each meal was eaten after a 12 h overnight fast and withdrawal of an 8 ml fasting venous blood sample. All blood samples were taken from a cannula sited in the median cubital vein. The cannula was kept patent by use of a saline drip flowing through a three-way cannula. To ensure that the blood samples were not diluted by saline the first 5 ml of each blood sample was discarded. Zero time (0 min) was taken to be the point at which the breakfast was commenced, and each subject was required to finish the meal within 15 min. Further 8 ml venous blood samples were taken from each subject at 15, 30,45,60,90, 120, 150,210 and 240 min postprandially.
Biochemical assays Deproteinized plasma was assayed for glucose by a glucose oxidase (EC 1 . 1 .3.4) method using a Beckman autoanalyser (Beckman Instruments Inc., Fullerton, CA, USA). Blood samples for the insulin and C-peptide analyses were spun in tubes coated with Trayasol (Bayer, Newbury, Berks), a protease inhibitor, at 3000 rev./min for 3 min at 3" immediately after collection, before transferring into labelled storage tubes. All the samples for blood glucose, plasma insulin and C-peptide were frozen at - 20" before analysis. The analyses for insulin (Heding, 1972) and C-peptide (Heding, 1975) were carried out using double- antibody radioimmunoassays. The insulin assay used measures immunoreactive insulin, with a recovery rate of about 80% (Heding, 1972), thus the insulin levels reported may include proinsulin and split proinsulin products. C-peptide measurements were therefore carried out to give a better indication of insulin secretion. The insulin assay antibodies were guinea-pig antiporcine and rabbit antiguinea-pig which have cross reactivities of < 5 % with C-peptide. Incubation time of the assay was 72 h and separation was achieved by centrifuging and decanting the supernatant fraction before counting the precipitate. The C- peptide assay antibodies used were K6 and donkey antirabbit, which have a cross reactivity of < 5 % with insulin. Total incubation time for the assay was 26 h and separation was achieved by addition of ethanol (950 ml/l) at 4", before counting the precipitate. The intra- and inter-assay coefficients of variation were less than 9 % for each of the assays.
Statistical analysis Plasma glucose, insulin and C-peptide increments (changes relative to the fasting values) were calculated at all the postprandial times. Integrated glucose, insulin and C-peptide increments were estimated by the calculation of the area under the curve at 0-60,0-120 and 0-240min; values below the fasting level were taken as zero. Differences between the control- and guar-wheatflake meals were analysed by repeated measures ANOVA using the SAS package (Statistical Analysis Systems Institute Inc., 1985). Regression analysis of the mean integrated insulin data was carried out using the Minitab statistical package (Ryan et al. 1981). P < 0.05 was considered significant for each test.
R E S U L T S
Consumption of breakfasts The mean eating times for the subject group were 10 (SE 3.2) min and 11 (SE 3.5) min for the control- and guar-wheatflake meals respectively. No statistically significant difference (paired Student's t test) was found between the eating rates or the order of the meals.
METABOLIC EFFECTS OF A G U A R - G U M C E R E A I 67
’ .- . f’ u.3 5 . 1. - . J *.
I
O P 50 100 150 200 250 Time (min)
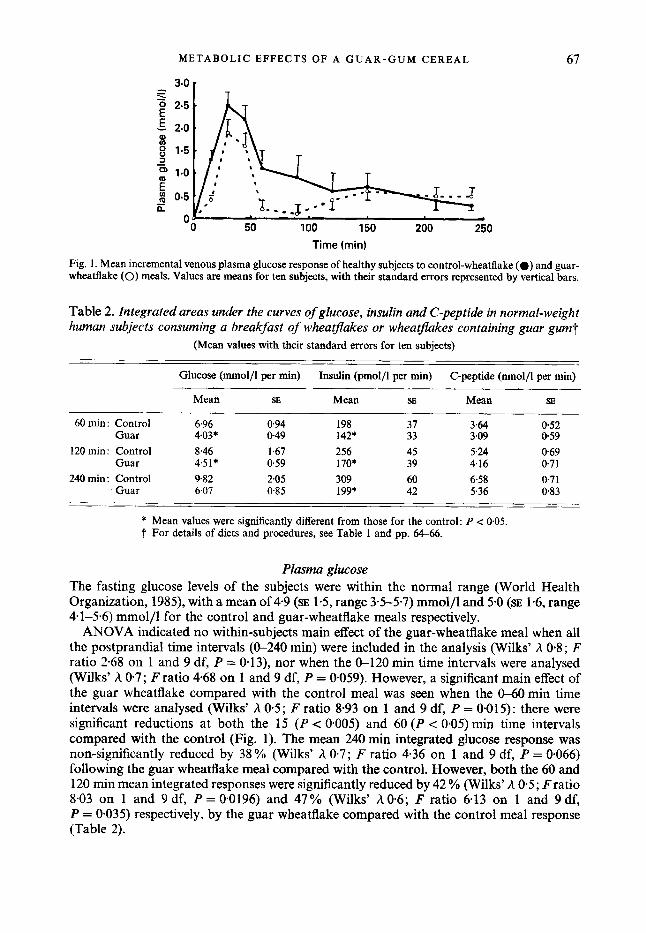
Fig. 1 . Mean incremental venous plasma glucose response of healthy subjects to control-wheatflake (0) and guar- wheatflake (0) meals. Values are means for ten subjects, with their standard errors represented by vertical bars.
Table 2. Integrated areas under the curves of glucose, insulin and C-peptide in normal-weight human subjects consuming a breakfast of whea flakes or wheatflakes containing guar gum?
(Mean values with their standard errors for ten subjects)
Glucose (mmol/l per min) Insulin (pmol/l per min) C-peptide (nmol/l per min)
Mean SE Mean SE Mean SE
60 min: Control 6.96 0.94 198 37 364 052 Guar 4.03* 0.49 142* 33 3.09 059
120 min: Control 8.46 1.67 256 45 5.24 069 Guar 4.5 1 * 0.59 170* 39 4.16 071
240 min: Control 9.82 2.05 309 60 6.58 0.71 Guar 6.07 0.85 199* 42 5.36 0.83
* Mean values were significantly different from those for the control: P c 0.05. t For details of diets and procedures, see Table 1 and pp. 64-66.
Plasma glucose The fasting glucose levels of the subjects were within the normal range (World Health Organization, 1985), with a mean of 4.9 (SE 1.5, range 33-57) mmol/l and 5.0 (SE 1-6, range 4.1-5.6) mmol/l for the control and guar-wheatflake meals respectively.
ANOVA indicated no within-subjects main effect of the guar-wheatflake meal when all the postprandial time intervals (0-240 min) were included in the analysis (Wilks’ h 0.8 ; F ratio 2.68 on 1 and 9 df, P = 0.13), nor when the 0-120 rnin time intervals were analysed (Wilks’ h 0.7; I; ratio 4-68 on 1 and 9 df, P = 0.059). However, a significant main effect of the guar wheatflake compared with the control meal was seen when the CL60min time intervals were analysed (Wilks’ h 0.5; F ratio 8-93 on 1 and 9 df, P = 0.015): there were significant reductions at both the 15 (P < 0.005) and 60 (P < 0.05) min time intervals compared with the control (Fig. 1). The mean 240 rnin integrated glucose response was non-significantly reduced by 38 % (Wilks’ h 0-7; F ratio 4.36 on 1 and 9 df, P = 0.066) following the guar wheatflake meal compared with the control. However, both the 60 and 120 min mean integrated responses were significantly reduced by 42 % (Wilks’ A 0.5; Fratio 8.03 on 1 and 9 df, P = 0.0196) and 47 YO (Wilks’ A 0-6; F ratio 6.13 on 1 and 9 df, P = 0.035) respectively, by the guar wheatflake compared with the control meal response (Table 2).
68 R. M. FAIRCHILD AND OTHERS
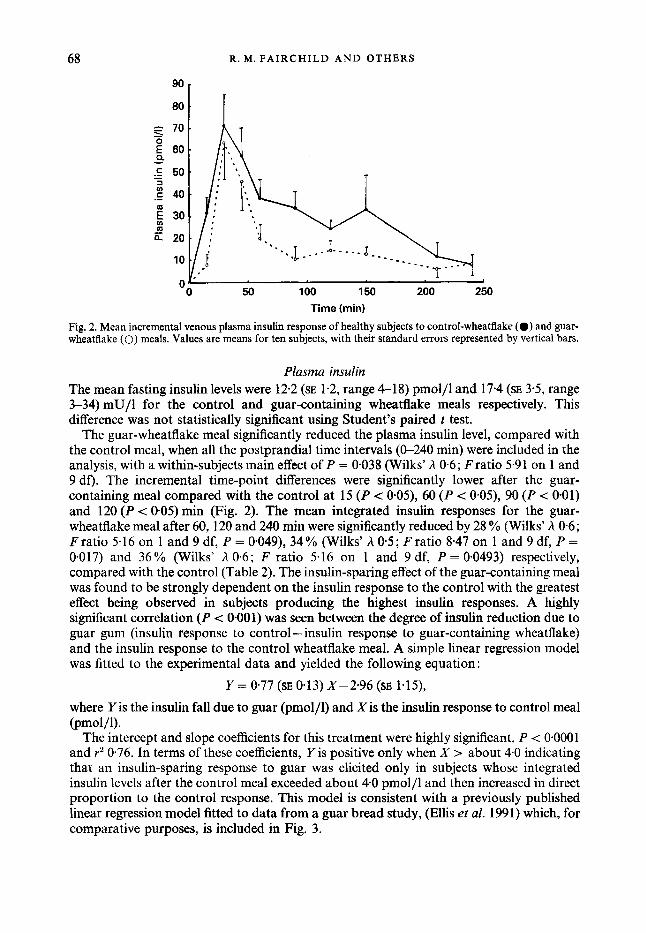
Fig. 2. Mean incremental venous plasma insulin response of healthy subjects to control-wheatflake (0) and guar- wheatflake (0) meals. Values are means for ten subjects, with their standard errors represented by vertical bars.
Plasma insulin The mean fasting insulin levels were 12.2 (SE 1.2, range 4-18) pmol/l and 17.4 (SE 3.5, range 3-34) mU/1 for the control and guar-containing wheatflake meals respectively. This difference was not statistically significant using Student’s paired t test.
The guar-wheatflake meal significantly reduced the plasma insulin level, compared with the control meal, when all the postprandial time intervals ((r240 min) were included in the analysis, with a within-subjects main effect of P = 0.038 (Wilks’ h 0.6; Fratio 5.91 on 1 and 9 df). The incremental time-point differences were significantly lower after the guar- containing meal compared with the control at 15 (P c 0*05), 60 (P < 0*05), 90 (P < 001) and 120 ( P c 005) min (Fig. 2). The mean integrated insulin responses for the guar- wheatflake meal after 60,120 and 240 min were significantly reduced by 28 % (Wilks’ h 06; F ratio 5.16 on 1 and 9 df, P = 0.049), 34 % (Wilks’ h 0.5; F ratio 8.47 on 1 and 9 df, P = 0.017) and 36% (Wilks’ h 0.6; F ratio 5.16 on 1 and 9 df, P = 0.0493) respectively, compared with the control (Table 2). The insulin-sparing effect of the guar-containing meal was found to be strongly dependent on the insulin response to the control with the greatest effect being observed in subjects producing the highest insulin responses. A highly significant correlation ( P -= 0.001) was seen between the degree of insulin reduction due to guar gum (insulin response to control -insulin response to guar-containing wheatflake) and the insulin response to the control wheatflake meal. A simple linear regression model was fitted to the experimental data and yielded the following equation :
Y = 0.77 (SE 0.13) X-2.96 (SE 1.15),
where Y is the insulin fall due to guar (pmol/l) and Xis the insulin response to control meal (pmol jl) .
The intercept and slope coefficients for this treatment were highly significant, P < 0.0001 and r2 0.76. In terms of these coefficients, Y is positive only when X > about 4.0 indicating that an insulin-sparing response to guar was elicited only in subjects whose integrated insulin levels after the control meal exceeded about 4.0 pmol/l and then increased in direct proportion to the control response. This model is consistent with a previously published linear regression model fitted to data from a guar bread study, (Ellis et al. 1991) which, for comparative purposes, is included in Fig. 3.

METABOLIC EFFECTS OF A G U A R - G U M CEREAL 69
.r 15 E % 13 P
X .0
10 15 20 25 K s i i n response to control (pmol/l per min)
Fig. 3. Fall in integrated plasma insulin value attributable to guar gum (i.e. control values minus guar-meal values; - x -). A similar fall was observed by Ellis et al. (1991) with guar-gum bread, and this is given for comparative purposes (- - -).
0 50 100 150 200 250
Time (min)
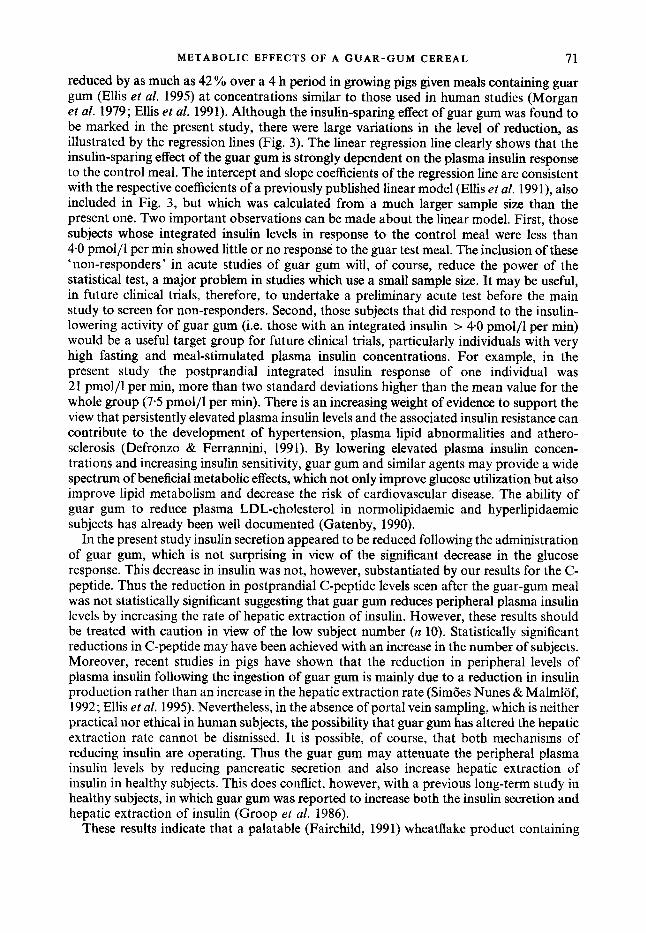
Fig. 4. Mean incremental venous plasma C-peptide response of healthy subjects to control-wheatflake (0) and guar-wheatflake (0) meals. Values are means for ten subjects, with their standard errors represented by vertical bars.
Plasma C-peptide The mean fasting C-peptide levels were 0.64 (SE 0.08, range 0-21-1.05) nmol/l for the control meal, and 0-70 (SE 0.1 1, range 0.30-1.47) nmol/l for the guar-containing wheatflake meal. T h s difference was not statistically significant using Student’s t test.
ANOVA revealed no main effect of the guar-wheatflake meal for the analysis of the 0-60, 0-120 or 0-240 min incremental time points (Wilks’ h 0.8; F ratio 1.92 on 1 and 9 df, P = 0.20, Wilks’ h 0.7; F ratio 4.3 on 1 and 9 df, P = 0.07 and Wilks’ h 0.8; F ratio 2.83 on 1 and 9 df, P = 0.13 respectively), compared with the control response (Fig. 4). However, there were significant reductions in the postprandial C-peptide level following the guar- wheatflake meal at 15 (P < 0.005) and 90 (P < 0.01) min, compared with the control (Fig. 4), when all the individual time points (0-240 min) were analysed. The mean 60, 120 and 240 min integrated C-peptide responses to the guar-wheatflake meal were non-significantly
70 R. M. F A I R C H I L D AND OTHERS
reduced by 15 %, 21 % and 19 % respectively (Table 2). The statistical analysis revealed Wilks’ A of 0-8 (Fratio 1.98, P = 0.19) for the 60 min area under the curve; 0.7 (Fratio 4.40, P = 0.07) for the 120 min area under the curve and 0.7 (F ratio 2.81, P = 0.13) for the 240 min area under the curve, all on 1 and 9 df.
DISCUSSION
The results of the present study show that the guar-containing breakfast cereal reduced the rise in postprandial plasma glucose and insulin but not C-peptide concentrations in non- diabetic subjects. In particular, the reduction in postprandial glycaemia was substantially greater in the present study than in previous studies in which either bread or biscuits containing higher doses of guar gum were administered to non-diabetic subjects (Ellis et al. 1988b, 1991). The high plasma glucose concentrations in response to the breakfast cereal may partly explain why the guar gum appears to be more effective in this product. The blood glucose rise in response to the breakfast cereal meals was approximately 50 % greater than that observed in acute tests of biscuit or bread meals containing similar amounts of available carbohydrate (Ellis et al. 1988b, 1991). Differences in the physical nature of the starch and the concentration of fat in these experimental foods could explain their widely different glycaemic responses. The wheatflake cereal meal contained only 3 % energy from fat, compared with 47 % and 27 % energy from fat in the guar biscuit and bread meals respectively (Ellis et al. 19883, 1991). A number of studies have shown that high levels of fat, when coingested in a carbohydrate meal, can attenuate postprandial hyperglycaemia in healthy subjects (Collier & O’Dea, 1983; Collier et al. 1984). Also, it is well known that the physico-chemical properties of foods are important determinants of their GI (Wolever, 1990). The type of cooking procedure employed to produce foods can significantly modify these properties. The extrusion cooking method used in the present study for producing the wheatflake cereals is known to increase significantly the GI of foods compared with traditional, oven-baked foods such as bread (Brand et al. 1985; Holm et al. 1988). Extrusion cooking involves the use of high temperature and pressure which will, in turn, affect the physical properties of starch (e.g. degree of gelatinization) possibly leading to severe disruption of the starch granules (Holm et al. 1988). Such changes are likely to change the digestibility of starch in the gastrointestinal tract resulting in an increase in postprandial glycaemia (Brand et al. 1985; Holm et al. 1988). Quality-control viscosity measurements of the ‘hydrated’ guar wheatflakes were below the values obtained for a pure solution of guar gum at approximately the same polymer concentration, suggesting that the galactomannan may have been partially depolymerized during the extrusion process. However, the low viscosity values of the guar wheatflake dispersions could be a reflection of impaired hydration of the guar gum in the cereal (Ellis & Morris, 1991).
The substantial reduction in insulin concentrations in the peripheral blood can be attributed mainly to a reduced rate of glucose absorption, probably partly medated by a reduced stimulation of the enteroinsulinar axis, notably the insulin-stimulating hormone gastric inhibitory polypeptide (GIP) (Morgan et al. 1988; Ellis et al. 1995). A recent study in pigs has shown that the glucose-lowering effect of guar gum is significantly more pronounced in the portal blood than the peripheral blood (Ellis et al. 1995). This provides a possible explanation of why guar gum does not always appear to reduce postprandial glucose in the peripheral venous blood of healthy subjects in spite of marked reductions in plasma insulin concentrations (Ellis et al. 199 1). Quantitative estimates of glucose absorption in the pig, determined from porto-arterial differences and blood flow measurements, have recently shown that we may be underestimating the effects of guar gum and similar forms of NSP (Ellis et al. 1995). Postprandial glucose absorption can be
METABOLIC EFFECTS OF A GUAR-GUM CEREAL 71
reduced by as much as 42 YO over a 4 h period in growing pigs given meals containing guar gum (Ellis et al. 1995) at concentrations similar to those used in human studies (Morgan et al. 1979; Ellis et al. 1991). Although the insulin-sparing effect of guar gum was found to be marked in the present study, there were large variations in the level of reduction, as illustrated by the regression lines (Fig. 3). The linear regression line clearly shows that the insulin-sparing effect of the guar gum is strongly dependent on the plasma insulin response to the control meal. The intercept and slope coefficients of the regression line are consistent with the respective coefficients of a previously published linear model (Ellis et al. 1991), also included in Fig. 3, but which was calculated from a much larger sample size than the present one. Two important observations can be made about the linear model. First, those subjects whose integrated insulin levels in response to the control meal were less than 4-0 pmol/l per min showed little or no response to the guar test meal. The inclusion of these ‘non-responders’ in acute studies of guar gum will, of course, reduce the power of the statistical test, a major problem in studies which use a small sample size. It may be useful, in future clinical trials, therefore, to undertake a preliminary acute test before the main study to screen for non-responders. Second, those subjects that did respond to the insulin- lowering activity of guar gum (i.e. those with an integrated insulin > 4.0 pmol/l per min) would be a useful target group for future clinical trials, particularly individuals with very high fasting and meal-stimulated plasma insulin concentrations. For example, in the present study the postprandial integrated insulin response of one individual was 21 pmol/l per min, more than two standard deviations higher than the mean value for the whole group (7.5 pmol/l per min). There is an increasing weight of evidence to support the view that persistently elevated plasma insulin levels and the associated insulin resistance can contribute to the development of hypertension, plasma lipid abnormalities and athero- sclerosis (Defronzo & Ferrannini, 199 1). By lowering elevated plasma insulin concen- trations and increasing insulin sensitivity, guar gum and similar agents may provide a wide spectrum of beneficial metabolic effects, whch not only improve glucose utilization but also improve lipid metabolism and decrease the risk of cardiovascular disease. The ability of guar gum to reduce plasma LDL-cholesterol in normolipidaemic and hyperlipidaemic subjects has already been well documented (Gatenby, 1990).
In the present study insulin secretion appeared to be reduced following the administration of guar gum, which is not surprising in view of the significant decrease in the glucose response. This decrease in insulin was not, however, substantiated by our results for the C- peptide. Thus the reduction in postprandial C-peptide levels seen after the guar-gum meal was not statistically significant suggesting that guar gum reduces peripheral plasma insulin levels by increasing the rate of hepatic extraction of insulin. However, these results should be treated with caution in view of the low subject number (n lo). Statistically significant reductions in C-peptide may have been achieved with an increase in the number of subjects. Moreover, recent studies in pigs have shown that the reduction in peripheral levels of plasma insulin following the ingestion of guar gum is mainly due to a reduction in insulin production rather than an increase in the hepatic extraction rate (Sim6es Nunes & Malmlof, 1992; Ellis et al. 1995). Nevertheless, in the absence of portal vein sampling, which is neither practical nor ethical in human subjects, the possibility that guar gum has altered the hepatic extraction rate cannot be dismissed. It is possible, of course, that both mechanisms of reducing insulin are operating. Thus the guar gum may attenuate the peripheral plasma insulin levels by reducing pancreatic secretion and also increase hepatic extraction of insulin in healthy subjects. This does conflict, however, with a previous long-term study in healthy subjects, in which guar gum was reported to increase both the insulin secretion and hepatic extraction of insulin (Groop et al. 1986).
These results indicate that a palatable (Fairchild, 1991) wheatflake product containing

72 R. M. FAIRCHILD A N D OTHERS
guar gum can be produced on a commercial scale and that the well-known physiological activity of low doses of guar gum does not appear to be diminished by extrusion cooking. The results clearly warrant studies of the clinical effects of guar wheatflakes and other such foods in both diabetic patients and individuals with hyperinsulinaemia. Moreover, such products are proving to be useful experimental tools in studies of the effects of NSP on gastrointestinal function in experimental animals (Mathers et al. 1992; Ellis et al. 1995) and humans (Ellis et al. 1991).
The authors wish to thank Mr Peter Fletcher of Newtime Foods Ltd, for preparing the control and guar-wheatflakes. We are grateful to Mrs Susan Thomas, University of Wales College of Medicine, for technical assistance and Dr Hans Englyst, Dunn Clinical Nutrition Unit, Cambridge for NSP analysis of the wheatflakes. The guar gum was kindly provided by Meyhall Chemical AG (Rh6ne-Poulenc Group), Switzerland. RMF was in receipt of a SERC studentship. This project was funded by the British Diabetic Association.
REFERENCES Blackburn, N. A,, Redfern, J. S., Jarjis, H., Holgate, A. M., Hanning, I., Scarpello, J. H. B., Johnson, I. T. &
Read, N. W. (1984). The mechanism of action of guar gum in improving glucose tolerance in man. Clinical Science 66, 329-336.
Braaten, J. T., Wood, P. J., Scott, F. W., Riedel, K. D., Poste, L. M. & Collins, M. W. (1991). Oat gum lowers glucose and insulin after an oral glucose load. American Journal of Clinical Nutrition 53, 14251430.
Brand, J. C., Nicholson, P. L., Thorburn, A. W. & Truswell, A. S. (1985). Food processing and the glycemic index. American Journal of Clinical Nutrition 42, 1192-1 196.
Collier, G., McLean, A. & ODea, K. (1984). Effect of co-ingestion of fat on the metabolic responses to slowly and rapidly absorbed carbohydrates. Diabetologia 26, 5C54.
Collier, G. & O’Dea, K. (1983). The effect of coingestion of fat on the glucose, insulin and gastric inhibitory polypeptide responses to carbohydrate and protein. American Journal of Clinical Nutrition 31, 941-944.
Defronzo, F. & Ferrannini, E. (1991). Insulin resistance: a multifaceted syndrome responsible for NIDDM, obesity, hypertension, dyslipidemia, and atherosclerotic cardiovascular disease. Diabetes Care 14, 173-194.
Egan, H., Kirk, R. S. & Sawyer, R. (1981). Pearson’s Chemical Analysis of Foods, 8th ed. Edinburgh: Churchill Livingstone.
Ellis, P. R., Burley, V. J., Leeds, A. R. & Peterson, D. B. (1988a). A guar-enriched wholemeal bread reduces postprandial glucose and insulin responses. Journal of Human Nutrition and Dietetics 1, 77-84.
Ellis, P. R., Dawoud, F. M. & Morris, E. R. (1991). Blood glucose, plasma insulin and sensory responses to guar- containing wheat breads: effects of molecular weight and particle size of guar gum. British Journal of Nutrition
Ellis, P. R., Kamalanathan, T., Dawoud, F. M., Strange, R. N. & Coultate, T. P. (1988b). Evaluation of guar biscuits for use in the management of diabetes: tests of physiological effects and palatability in non-diabetic volunteers. European Journal of Clinical Nutrition 42, 425435.
Ellis, P. R. & Morris, E. R. (1991). Importance of the rate of hydration of pharmaceutical preparations of guar gum: a new in vitro monitoring method. Diabetic Medicine 8, 378-381.
Ellis, P. R., Roberts, F. G., Low, A. G. & Morgan, L. M. (1995). The effect of high-molecular-weight guar gum on net apparent glucose absorption and net apparent insulin and gastric inhibitory polypeptide production in the growing pig: a relationship to rheological changes in jejunal digesta. British Journal of Nutrition 74,539-556.
Englyst, €1. N. & Cummings, J. H. (1984). Simplified method for the measurement of total non-starch polysaccharides by gas-liquid chromatography of constituent sugars as alditol acetates. Analyst 109,937-942.
Fairchild, R. M. (1991). The development, sensory analysis and physiological testing of guar gum containing breakfast foods for use in the treatment of diabetes mellitus. PhD Thesis, University of Wales.
Fairchild, R. M., Daniels, C. E. J., Ellis, P. R., Naqvi, S. K. M., Kwan, K. M. F. & Mir, M. A. (1990). Effect of two types of guar gum in solid and liquid foods on postprandial blood glucose, plasma insulin and C-peptide in healthy subjects. Proceedings of tRe Nutrition Society 49, 54A.
66, 363-379.
Fell, J. (1987). Extrusion: a revolution in food manufacture. Food Manufacturer January, 27-29. Fuessl, H. S., Adrian, T. E., Bacarese-Hamilton, A. J. & Bloom, S. R. (1986). Guar in NIDD: effect of different
modes of administration on plasma glucose and insulin responses to a starch meal. Practical Diabetes 3,
Gatenby, S. J . (1990). Guar gum and hyperlipidaemia - a review of the literature. In Dietary Fibre Perspectives,
Gatti, E., Catenazzo, G., Camisasca, E., Torri, A., Dengri, E. & Sirtori, C. R. (1984). Effects of guar enriched
258-260.
vol. 2, pp. 100-1 15 [A. R. Leeds, editor]. London: John Libbcy.
pasta in the treatment of diabetes and hyperlipidaemia. A;mals of Nutrition and Metabolism 28, 1-10.
METABOLIC EFFECTS OF A G U A R - G U M CEREAL 73 Groop, P. H., Groop, L., Totterman, K. J. & Fyhrquist, F. (1986). Relationship between changes in GIP
concentrations and changes in insulin and C-peptide concentrations after guar gum therapy. Scandinavian Journal of Clinical and Laboratory Investigation 46, 50S510.
Heding, L.G. ( 1 972). Determination of total serum insulin (IRI) in insulin treated diabetic patients. Diabetologia 8, 260-266.
Heding, L. G. (1975). Radioimmunological determination of human C-peptide in serum. Diabetologia 11,
Holm, J., Lundquist, I., Bjorck, I., Eliasson, A X . &Asp, N.-G. (1988). Degree of starch gelatinisation, digestion rate of starch in vitro, and metabolic response rate in rats. American Journal of Clinical Nutrition 47, 1010-1016.
Jenkins, D. J. A., Wolever, T. M. S., Leeds, A. R., Gassull, M. A., Haiseman, P., Diliwari, J., Goff, D. V., Metz, G. L. & Alberti, K. G. M. M. (1978). Dietary fibres, fibre analogues and glucose tolerance: importance of viscosity. British Medical Journal 1, 1392-1394.
Mathers, J. C., Lawlor, P. A. & Parker, D. S. (1992). Effects of guar gum supplementation of breakfast cereals on small intestinal hydrolases in the rat. Proceedings ofthe Nutrition Society 51, 2A.
Morgan, L. M., Flatt, P. R. & Marks, V. (1988). Nutrient regulation of the enteroinsular axis and insulin secretion. Nutrition Research Reviews 1, 79-97.
Morgan, L. M., Goulder, T. J., Tsiolakis, D., Marks, V. & Alberti, K. G. M. M. (1979). The effect of unabsorbable carbohydrate on gut hormones. Modification of post-prandial GIP secretion by guar. Diabetologia 17, 85-89.
Peterson, D. B. (1985). Fibre and diabetes - new perspectives. In Dietary Fibre Perspectives, vol. 1, pp. 47-60 [A. R. Leeds, editor]. London: John Libbey.
Peterson, D. B., Ellis, P. R., Baylis, J. M., Fielden, P., Ajodhia, J., Leeds, A. R. & Jepson, E. M. (1987). Low dose guar in a novel food product: improved metabolic control in non-insulin dependent diabetes. Diubetic Medicine
Polonsky, K., Frank, B., Pugh, W., Addis, A., Karrison, T., Meier, P., Tager, H. & Rubenstein, A. H. (1986). Limitations to and valid use of C-peptide as a marker of the secretion of insulin. Diabetes 35, 379-386.
Polonsky, K. S. & Rubenstein, A. H. (1984). C-peptide as a measure of the secretion and hepatic extraction of insulin. Pitfalls and limitations. Diabetes 33, 486-495.
Ryan, T. A,, Joiner, B. L. & Ryan, B. F. (1981). Minitab Student Handbook, 2nd ed. Massachusetts: Duxberry Press.
Sambrook, I. E. & Rainbird, A. L. (1985). The effect of guar gum and level and source of dietary fat on glucose tolerance in growing pigs. British Journal of Nutrition 54, 27-35.
Schmidt, M. I., Hadji-Georgopoulos, A,, Rendell, M., Margolis, S. & Kowarsi, A. (1981). The dawn phenomenon, an early morning glucose rise: implications for diabetic intraday blood glucose variation. Diabetes Cure 4, 579-585.
SimBes Nunes, C. & Malmlof, K. (1992). Effect of p a r gum and cellulose on glucose absorption, hormonal release and hepatic metabolism in the pig. British Journal of Nutrition 68, 693-700.
Smith, J . C., Levitt, N. S . & Rosman, M. S . (1985). The use of guar gum in the diabetic diet. In Advances in Diet and Nutrition, pp. 59-64 [C. Horwitz, editor]. London: John Libbey.
Statistical Analysis Systems Institute Inc. (1985). SAS User’s Guide Statistics, 5th ed. Cary, NC: SAS Institute Inc. Wolever, T. M. S . (1990). The glycemic index. World Review ofNutrition and Dietetics 61, 12C185. World Health Organization (1985). Diabetes Mellitus. Technical Report Series no. 727, p. 11. Geneva: World
541-548.
4, 111-115.
Health Organization.
Printed in Great Britain