The effect of postprandial glucose metabolism on cognition ...
317
Swansea University E-Theses _________________________________________________________________________ The effect of postprandial glucose metabolism on cognition and mood across the lifespan. Young, Hayley Anne How to cite: _________________________________________________________________________ Young, Hayley Anne (2013) The effect of postprandial glucose metabolism on cognition and mood across the lifespan.. thesis, Swansea University. http://cronfa.swan.ac.uk/Record/cronfa43174 Use policy: _________________________________________________________________________ This item is brought to you by Swansea University. Any person downloading material is agreeing to abide by the terms of the repository licence: copies of full text items may be used or reproduced in any format or medium, without prior permission for personal research or study, educational or non-commercial purposes only. The copyright for any work remains with the original author unless otherwise specified. The full-text must not be sold in any format or medium without the formal permission of the copyright holder. Permission for multiple reproductions should be obtained from the original author. Authors are personally responsible for adhering to copyright and publisher restrictions when uploading content to the repository. Please link to the metadata record in the Swansea University repository, Cronfa (link given in the citation reference above.) http://www.swansea.ac.uk/library/researchsupport/ris-support/
-
Upload
khangminh22 -
Category
Documents
-
view
0 -
download
0
Transcript of The effect of postprandial glucose metabolism on cognition ...

Swansea University E-Theses _________________________________________________________________________
The effect of postprandial glucose metabolism on cognition and
mood across the lifespan.
Young, Hayley Anne
How to cite: _________________________________________________________________________ Young, Hayley Anne (2013) The effect of postprandial glucose metabolism on cognition and mood across the
lifespan.. thesis, Swansea University.
http://cronfa.swan.ac.uk/Record/cronfa43174
Use policy: _________________________________________________________________________ This item is brought to you by Swansea University. Any person downloading material is agreeing to abide by the terms
of the repository licence: copies of full text items may be used or reproduced in any format or medium, without prior
permission for personal research or study, educational or non-commercial purposes only. The copyright for any work
remains with the original author unless otherwise specified. The full-text must not be sold in any format or medium
without the formal permission of the copyright holder. Permission for multiple reproductions should be obtained from
the original author.
Authors are personally responsible for adhering to copyright and publisher restrictions when uploading content to the
repository.
Please link to the metadata record in the Swansea University repository, Cronfa (link given in the citation reference
above.)
http://www.swansea.ac.uk/library/researchsupport/ris-support/

THE EFFECT OF POSTPRANDIAL
GLUCOSE METABOLISM ON COGNITION
AND MOOD ACROSS THE LIFESPAN
By
Hayley Anne Young BA (Hons)
Submitted to Swansea University
in fulfilment of the requirements for the
Degree of Doctor of Philosophy
2013
Department of Psychology Swansea University

P ro Q u e s t N u m b e r : 10821566
All rights reserved
INFORMATION TO ALL USERS The quality of this reproduction is dependent upon the quality of the copy submitted.
In the unlikely event that the author did not send a com p le te manuscript and there are missing pages, these will be noted. Also, if material had to be removed,
a note will indicate the deletion.
uestProQuest 10821566
Published by ProQuest LLC(2018). Copyright of the Dissertation is held by the Author.
All rights reserved.This work is protected against unauthorized copying under Title 17, United States C ode
Microform Edition © ProQuest LLC.
ProQuest LLC.789 East Eisenhower Parkway
P.O. Box 1346 Ann Arbor, Ml 48106- 1346

ABSTRACT
The aim of this thesis was to examine the effects of postprandial glycaemia on cognition and mood. Three studies provided evidence that low GL meals/drinks result in cognitive superiority. Study 1 found that Children’s (n = 75) memory and mood were improved 180 minutes after eating a breakfast (cereal, yogurt, orange flavour drink, 337kcal) sweetened with 40g isomaltulose (low GL) rather than 40g glucose (high GL).
Study 2 examined the interaction between gluco-regulatory status of older adults (n=153) and the GL of breakfast. Older adults with better, but not poorer glucose tolerance, had better memory and mood if they ate breakfast (toast, yogurt, orange flavour drink, 275kcal) sweetened with 40g isomaltulose (low GL), rather than 40g glucose (high GL) or 40g sucrose (medium GL). Conversely, older adults with poorer glucose tolerance had better memory and mood 30 minutes after glucose but not a sucrose or isomaltulose based meal. Individual differences in gluco-regulatory control also interacted with age to predict cognitive performance, cognitive decline and mood. Adults aged 61 or above, with poorer glucose tolerance, had poorer memory than those 61 or over with better glucose tolerance, or those 60 and younger with poorer glucose tolerance. In addition, in older adults with poor glucose tolerance, developing subsequent low blood glucose levels was associated with better cognitive performance, mood and less cognitive decline.
Study 3 investigated the interaction between caffeine (80mg) and the GL of its vehicle. After drinking caffeine young adults (n= 345) had poorer glucose tolerance. Caffeine, regardless of vehicle, improved young adult’s memory, reaction times and vigilance. Young adults remembered more words, after 150 minutes, if they drank milk (250ml, 155kcal, low GL), rather than glucose (250ml drink with 30g glucose, 155kcal, high GL), and had better working memory, after 90 and 150 minutes, if they drank water (250ml), or milk, rather than glucose. After 30 minutes, caffeine increased subjective energy levels, however, when caffeine was taken with water energy levels were reduced after 90 and 150 minutes. In contrast, when caffeine was consumed with milk greater energy was reported after 90 and 150 minutes. Caffeine did not affect energy levels when it was drunk with glucose.
These results were discussed in relation to an emerging understanding of the pathologies that underlie disturbed glucose homeostasis and how these relate to the brain and cognitive performance. A theoretical framework was put forward which aims to direct future research.
II

DECLARATION
This work has not previously been accepted in substance for any degree and is not being concurrently submitted in candidature for any degree.
Signed v ........................................................... (candidate)
Date................2G>. L. .......................
STATEMENT 1
This thesis is the result of my own investigations, except where otherwise stated. Where correction services have been used, the extent and nature of the correction is clearly marked in a footnote(s).
Other sources are acknowledged by footnotes giving explicit references. A bibliography is appended.
Signed candidate)
Date................2<3./..\.Z,../..!.3........................
STATEMENT 2
I hereby give consent for my thesis, if accepted, to be available for photocopying and for inter-library loan, and for the title and summary to be made available to outside organisations.
Signed _ ( (candidate)
Date.............. ..........................................................
Ill

TABLE OF CONTENTS
CHAPTER 1
The influence of postprandial glycaemia on cognition and mood: a review
of the literature.
1.1 General introduction 01
1.2 Glycaemic index and Glycaemic load 01
1.3 The relevance of peripheral glucose metabolism to
brain functioning 05
1.4 A systematic review of the effect of glycaemic load on
cognition and mood 07
1.4.1 Methodology 07
1.4.2 Results 10
1.4.2.1 The effect of GL on cognition and mood in
young children 18
1.4.2.2 The effect of GL on cognition and mood in
older children adolescents 20
1.4.2.3 The effect of GL on cognition and mood in
young adults 22
1.4.2.4 The effect of GL on cognition and mood in
older adults 23
1.4.3 Discussion and conclusions 27
1.5 Physiological factors effecting Gl and GL 30
1.5.1 Glucose tolerance and postprandial hypoglycaemia 30
1.5.2 The effect of individual differences in
glucoregulation on cognition 32
1.5.2.1 Methods 32
1.5.2.2 Glucose tolerance and cognition -
longitudinal studies 37
1.5.2.3 Glucose tolerance and cognition -
cross sectional studies 38
1.5.2.4 Glucose tolerance, cognition and glucose
consumption 40
IV

1.5.2.5 Discussion and conclusions 45
1.6 A systematic review of the effect of energy drinks, cognition
and mood. 47
1.6.1 Caffeine, energy drinks and postprandial glycaemia 47
1.6.2 Energy drinks, cognition and mood 48
1.6.2.1 Methods 49
1.6.2.2 The psychological effect of ‘whole’ EDs 51
1.6.2.3 The psychological effect of glucose, caffeine and their
combination 61
1.6.2.4 Discussion and conclusions 66
1.7 Literature review - summary 68
1.8 Specific aims of this thesis 69
CHAPTER 2
Modulating the glycaemic properties of breakfast improves school
children’s cognition and mood.
2.1 Introduction 70
2.2 Methods 71
2.2.1 Procedure 71
2.2.2 Participants 72
2.2.3 Meals 73
2.2.4 Test battery 75
2.2.4.1 Memory 75
2.2.4.2 Speed of Information Processing 75
2.2.4.3 Reaction times 75
2.2.4.4 Ability to sustain attention 76
2.2.4.5 Appetite 76
2.2.4.6 Mood 76
2.3 Statistical analysis 77
2.4 Results 78
2.4.1 Memory 78
2.4.2 Memory retention 82
V

2.4.3 Spatial memory 83
2.4.4 Speed of information processing 83
2.4.5 Reaction times 86
2.4.6 Attention (3 second delay) 86
2.4.7 Attention (12 second delay) 88
2.4.8 Appetite 90
2.4.9 Mood 91
2.5 Summary 93
2.6 Discussion 93
CHAPTER 3
Low blood glucose reduces cognitive decline and improves mood of older
adults with poorer glucose tolerance.
3.1 Introduction 101
3.2 Method 103
3.2.1 Participants 103
3.2.2 Procedure 104
3.2.3 Test Battery 105
3.2.3.1 Episodic memory 105
3.2.3.2 Semantic memory 105
3.2.3.3 Working memory 106
3.2.3.4 Cognitive impairment 106
3.2.3.5 Vigilance 107
3.2.3.6 Reaction Times 107
3.2.3.7 General Health Questionnaire (GHQ) 108
3.2.3.8 Hypoglycaemia 108
3.3 Statistical analysis 108
3.4 Results 113
3.4.1 Episodic Memory 114
3.4.2 Semantic Memory 114
3.4.3 Working Memory 114
3.4.4 Cognitive decline 116
3.4.5 Vigilance 118
3.4.6 Reaction Times 118
VI
3.4.7 General Health Questionnaire (GHQ) 118
3.4.8 Sympathetic nervous system symptoms (SNS) 121
3.4.9 Neuroglycopenic symptoms . 121
3.5 Summary 122
3.6 Discussion 122
CHAPTER 4
Modulating the glycaemic load of meals effects older adults’ cognition
and mood depending on their glucose toleriance.
4.1 Introduction 130
4.2 Methods 132
4.2.1 Participants 132
4.2.2 Procedure - Day 1 132
4.2.3 Procedure - Day 2 132
4.2.4 Breakfast 133
4.2.4.1 Test battery 135
4.2.4.2 Mood (POMS) 135
4.2.4.3 Glucoregulatory profile 135
4.2.4.4 Calculation of cognitive decline 136
4.3 Statistical analysis 137
4.4 Results - effect of meal depending on glucoregulatory profile 137
4.4.1 Episodic Memory 137
4.4.2 Semantic Memory 141
4.4.3 Working memory 142
4.4.4 Mood 142
4.4.5 Vigilance 149
4.4.6 Reaction times 150
4.5 Results - The effect of meal depending on cognitive decline 151
4.5.1 Episodic memory 151
4.5.2 Semantic memory 151
4.5.3 Working memory 151
4.5.4 Mood 152
4.5.5 Vigilance 153
4.5.6 Reaction times 153
VII

4.6 Summary 154
4.7 Discussion 154
CHAPTER 5
The glycaemic load of energy drinks interacts
with caffeine to influence young adults’ glucose tolerance,
cognition and mood.
5.1 Introduction 162
5.2 Method 162
5.2.1 Participants 162
5.2.2 Procedure 167
5.2.3 Glucose measurements 168
5.2.4 Breakfast / Drinks 168
5.2.5 Test battery 169
5.2.5.1 Arrow Flankers Test 170
5.3 Statistical analysis 170
5.4 Results 171
5.4.1 The glycaemic response to the test drinks 171
5.4.2 Mood 178
5.4.3 Episodic memory 186
5.4.4 Working memory 188
5.4.5 Focused attention 190
5.4.6 Reaction times 191
5.4.6 Vigilance 194
5.5 Summary 196
5.6 Discussion 197
CHAPTER 6
The role of endothelial dysfunction in glucose tolerance related cognitive
decline - a pathway for nutritional interventions?
6.1 introduction 207
6.2 The supply of energy to the brain 208
6.3 The role of nitric oxide 210
6.3.1 Nitric oxide may mediate neurovascular coupling 211
VIII

6.3.2 Nitric oxide may regulate neurometabolic and
neurobarrier coupling 213
6.3.3 Aging reduces NO availability and impairs
endothelial and cognitive function 215
6.3.4 Hyperglycaemia reduces NO availability and impairs
endothelial and cognitive function 219
6.4 Relevance to the present finding 221
6.4.1 The combined effects of aging and hyperglycaemia 221
6.4.2 Low blood glucose, AMPK and cognitive decline 222
6.4.3. Endothelial function, glycaemic load and cognition 224
6.4.4 Caffeine, hyperglycaemia, cognition and mood 230
6.5 Concluding remarks 234
APPENDICES 235
REFERENCES 259
IX

ACKNOWLEDGEMENTS
I would like to thank all the people that have helped and supported me through
this experience.
Firstly I would like to extend my deep gratitude to Professor David Benton who
expertly guided me through my postgraduate education and made it an
enjoyable time. None of this would have been possible without his unwavering
professional and personal support.
I would like to thank Lori Button for help with data collection, Kim Jenkins for
help with data entry and the department technicians for their technical support.
I would also like to thank Friesland Campina and Beneo for their financial
support during this time.
Last but definitely not least I am profoundly thankful to my friends and family
for their love and encouragement and for sharing with me the anxieties and
pleasures of this experience.
X

LIST OF FIGURES
Figure 1.
Blood glucose response (mmol/l) to a high compared to a low
Glycaemic index food.
Figure 2.
Flow diagram of the screening process of studies investigation
glycaemic load and cognition.
Figure 3.
Flow diagram of the screening process of studies investigating the
psychological effects of Energy Drinks.
Figure 4.
Children’s immediate memory one and three hours after breakfast.
Figure 5.
Children’s immediate memory depending on whether the test was
taken on the first or second occasion.
Figure 6.
Children’s speed of information processing depending on whether
the tests were taken on a first or second occasion.
Figure 7.
Children’s lapses of attention with a three second delay depending
on whether the tests were taken on a first or second occasion.
Figure 8.
Children’s lapses of attention with a twelve second delay depending
whether the tests were taken on a first or second occasion.

Figure 9.
Children’s mood one and three hours after breakfast. 92
Figure 10.
Oral glucose tolerance profiles of four groups of older adults. 110
Figure 11.
The effect of glucose tolerance and of staying above or falling below
baseline glucose values on working memory reaction times. 115
Figure 12.
The effect of glucose tolerance and of staying above or falling below
baseline glucose values on cognitive decline. 117
Figure 13.
The effect of glucose tolerance and of staying above or falling below
baseline glucose values on depression ratings. 120
Figure 14a.
The influence of type of meal on memory in those with better glucose
tolerance and lowest blood glucose above or below baseline. 139.
Figure 14b.
The influence of type of meal on memory in those with poorer glucose
tolerance and lowest blood glucose above or below baseline. 140
Figure 15.
The effect of Meal on agreeableness. 144
Figure 16a.
The influence of type of meal on mood in those with better glucose
tolerance and lowest blood glucose above or below baseline. 147
XII

Figure 16b.
The influence of type of meal on mood in those with poorer glucose
tolerance and lowest blood glucose above or below baseline. 148
Figure 17.
Schematic representation of the time in minutes that each testing
session took place relative to when the drink was consumed. 167
Figure 18
The effect of the vehicle on the immediate glycaemic response. 173
Figure 19.
The effect of the caffeine on the immediate glycaemic response. 174
Figure 20.
The effect of caffeine on the longer term glycaemic response. 176
Figure 21.
The effect of vehicle on the longer term glycaemic response. 177
Figure 22.
The influence of vehicle, with and without caffeine, on feeling energetic
over the morning. 180
Figure 23.
The influence of vehicle, with and without caffeine, on feeling energetic
before and after a test session.
Figure 24.
The influence of the type of drink on the number of words recalled over
test sessions. 187
182i
XIII

Figure 25.
The influence of the type of drink on the time in milli-seconds to perform
the serial sevens test.
Figure 26.
The influence of the type of drink on decision times over the morning.
Figure 27.
A schematic representation of the roles of AMPK and NOS in
neurovascular, neurometabolic and neurobarrier coupling.
Figure 28.
A schematic representation of the effect of hyperglycaemia and aging
on AMPK and NOS activity and neurovascular, neurometabolic and
neurobarrier coupling.
Figure 29.
A schematic representation of the effect of LBG on AMPK activity and
neurometabolic and neurobarrier coupling.
Figure 30.
A schematic representation of the effect of GL on AMPK and NOS
activity and neurovascular, neurometabolic and neurobarrier coupling.
Figure 31.
A schematic representation of the effect of a high GL and insulin on
AMPK and NOS activity.
Figure 32.
The effect of caffeine and hyperglycaemia on AMPK and NOS activity.
Figure 33.
The effect of caffeine and milk on AMPK and NOS activity

LIST OF TABLES
Table 1.
Studies examining the effect of modulating the GL of meals/drinks on
cognition in children, adolescents, young adults and older adults. 11
Table 2.
The ratio of significant to non-significant findings for studies of early
mid or late post prandial period for each cognitive domain. 26
Table 3.
Whole blood (mmol/l) values, 2-h post- glucose load, for diagnosis of
diabetes mellitus or impaired glucose tolerance (WHO, 1999). 31
Table 4.
Longitudinal and cross sectional studies on the association between
impaired glucose tolerance and cognition. 35
Table 5.
The effect of glucose and glucose tolerance on cognition. 41
Table 6.
Studies investigating the effects of Energy Drinks on Mood. 53
Table 7.
Studies investigating the effect of Energy Drinks on cognitive
performance. 57
Table 8.
Studies investigating the effect of ‘whole’ Energy Drinks and their
individual components on mood. 62
XV

Table 9.
Studies investigating the effect of ‘whole’ Energy Drinks and each of
their components on cognitive performance.
Table 10.
The amount of food left over in the higher and lower GL conditions.
Table 11.
The macro-nutrient content of the experimental meals.
Table 12.
Differences in blood glucose, at each time point, depending on
glucoregulatory group.
Table 13.
Demographic data for the four glucoregulatory groups.
Table 14.
Cell frequencies for each level of each factor included in the analysis.
Table 15.
Procedural timeline for the study of glycaemic load and cognition
on older adults.
Table 16.
The macro-nutrient content of the experimental meals for the study of
glycaemic load and cognition on older adults.
Table 17
Baseline mood for the four glucoregulatory groups prior to consuming
one of the three test meals.

Table 18.
Studies investigating the short term effects of glucose on cognition in
adults with better and poorer glucose tolerance. 157
Table 19.
Baseline data for each group prior to receiving one of the six drinks.
Table 20.
The immediate influence of drinks with and without caffeine on feeling
energetic.
164
183
XVII

ABBREVIATIONS
Gl Glycaemic IndexGL Glycaemic LoadCHO CarbohydratePRO ProteinKCAL KilocalorieBBB Blood Brain BarrierANOVA Analysis of VarianceANCOVA Analysis of Co-varianceMCI Mild Cognitive ImpairmentSIP Speed of Information ProcessingRT Reaction TimeST Short TermLT Long TermAUC Area under the CurveT2DM Type 2 Diabetes MellitusIGT Impaired Glucose ToleranceNGT Normal Glucose ToleranceGT Glucose ToleranceWHO World Health OrganisationOGTT Oral Glucose Tolerance TestGTT Glucose Tolerance TestPH Postprandial HypoglycaemiaMMSE Mini Mental State ExaminationPCA Principal Component analysisED Energy DrinkRCT Randomised Controlled TrialVAS Visual Analogue ScaleNART National Adult Reading TestGHQ General Health QuestionnaireSNS Sympathetic Nervous SystemLBG Lowest Blood GlucoseSGLT Sodium Dependent Glucose TransportersNO Nitric OxideNOS Nitric Oxide SynthaseENOS Endothelial Nitric Oxide SynthaseNNOS Neuronal Nitric Oxide SynthaseINOS Inducible Nitric Oxide SynthaseNADPH Nicotinamide Adenine Dinucleotide PhosphateFAD Flavin Adenine DinucleotideFMN Flavin MononucleotideBH4 T etrahydrobiopterinBH2 DihydrobiopterincGMP Cyclic Guanosine MonophosphatecGC Guanylyl CyclaseATP Adenosine TriphosphateAMPK Adenosine 3',5' Monophosphate activated Protein KinaseROS Reactive Oxygen Species
XVIII

CHAPTER 1
The influence of postprandial glycaemia on cognition and mood: a review of the literature.
1.1 General Introduction.
This first section provides a conceptual overview of the relevant scientific
background of the studies contained in this thesis. First, a description of the
concept of glycaemic index (Gl) and glycaemic load (GL) is provided, and their
potential importance to the metabolism and transport of glucose in the brain
highlighted. The literature examining the psychological effect of GI/GL in different
populations is then systematically considered. The dietary and physiological
factors that influence postprandial glycaemia are discussed, including the
consumption of caffeine, individual differences in glucose tolerance, and reactive
hypoglycaemia. Finally, the evidence supporting these factors in relation to mood
and cognition is reviewed.
1.2 Glycaemic index and Glycaemic load.
The concept of the Gl was developed by Jenkins et al (1981) to obtain a numeric
classification of carbohydrates based on their rate of digestion and absorption. Gl
defines carbohydrate (CHO) foods according to their postprandial glycaemic
impact (Jenkins et al. 1981). The Gl is calculated by measuring the glucose
incremental area under the curve (AUC) following ingestion of a test food providing
50 g of CHO, compared to the area under the curve (AUC) following 50g CHO
intake from the reference food (usually glucose or white bread) (Jenkins et al.,
1981; Brouns et al. 2005). Capillary blood samples are taken in the fasted state
and at 15 - 30 minutes intervals for 2 hours after ingestion, with all tests being
conducted on the same individual after an overnight fast (Hatonen et al. 2006;

Brouns et al. 2005). The reference value is set to be 100 and Gl is expressed by
dividing the AUC of the test food by the AUC of the reference food and multiplied
by 100. The average Gl value is calculated from data collected in at least ten
human subjects (Brouns et al. 2005). A food is said to have a high Gl if it has a
value of more than 70, a moderate Gl if it has a value of between 56 and 69, and a
low Gl if lower than 55 (Foster-Powell, 2002).
The Gl of a food depends on the rate at which the CHO is digested in the
gastrointestinal tract, and the rate of absorption into the bloodstream (Jenkins et al.
1981; Englyst et al., 1999). The postprandial insulin response is related to the
postprandial glycaemic response (Wolever and Bolognesi, 1996b), such that
quickly digested and absorbed CHOs will produce a rapid increase in plasma
glucose, which stimulates a rapid pancreatic insulin secretion. Insulin then
promotes glucose uptake to counteract the rise in plasma glucose concentrations.
An extreme insulin response will lead to reactive hypoglycaemia; that is a blood
glucose nadir that is undesirably low. In contrast, carbohydrates that have a low
Gl are absorbed at a slower rate than carbohydrates that have a high Gl, resulting
in reduced postprandial glycaemia and insulinaemia (Figure 1).
2

11
oEECl)(/)OO_DU)"OooDQ
10 Postprandialhyperglycaemia9
8
7
6
5
Postprandialhypoglycaemia
4
3
21 3 42
Time after consmption (hrs)
-^ r-H ig h Gl Low Gl
Figure 1. Blood glucose response (mmol/l) to a high compared to a low Gl
food.
3

Some, but not all, studies support an association between Gl and a range of health
benefits, such as decreased incidence of diabetes (Brand-Miller et al. 2003) and
heart disease (Barclay et al. 2008). However, Gl has been questioned on both
conceptual and methodological grounds (Brouns et al. 2005). For example, low Gl
foods may be energy dense and contain high proportions of fats that, by their
nature, delay gastric emptying. Conversely, some fruits that have high amounts of
the low Gl sugar fructose also contain a number of other potentially beneficial
nutrients. Thus health related claims based solely on Gl may not be justified. In
addition, Gl measures carbohydrate quality but not quantity and allows comparison
between similar amounts of carbohydrate, usually 50g. The methodological
requirement for the Gl determination applies solely to situations where food
servings contain only the amount of carbohydrate used. However, CHO foods are
seldom eaten alone, but rather as a part of a mixed meal. In common day-to-day
situations, the amount of CHO content ingested in foods and meals varies greatly.
Therefore, the concept of glycaemic load (GL) was introduced by Salmeron et al.
(1997). The GL is estimated by multiplying the Gl of the food with the amount of
CHO (in grams) present in a specified serving size and dividing by 100. GL is a
much better predictor of glycaemic response within the context of everyday eating
patterns (Wolever and Bolognesi, 1996; Brand-Miller et al. 2003). A low GL food is
considered to have a GL of less than 10, a medium GL food to have a GL of
between 10 and 20, whilst a high GL food is considered to have a GL of 20 or
more (Salmeron et al., 1997).
4

1.3 The relevance of peripheral glucose metabolism to brain functioning.
When it is considered that glucose is the major fuel for the brain (Magistretti et al,
2000) the importance of blood glucose homeostasis to cognitive functioning is
clear. It was reported that during cognitive demand there was a measurable drop
in peripheral blood glucose concentrations (Scholey et al. 2001). Furthermore, the
greater the decline in blood glucose the better participants performed (Perlmuter et
al. 2009). It is possible that a higher rate of decline in peripheral blood glucose
reflects greater glucose utilisation by the brain, facilitating cognition. Given these
associations any factor that disrupts peripheral glucose homeostasis may
compromise the brains functioning, and the ingestion of a meal that has a high
glycaemic GL may be one such factor. The following section provides a brief
overview of glucose transport in the brain including evidence that changes in
peripheral glucose levels can affect these processes.
Glucose is transported across the blood brain barrier (BBB) by the glucose
transporter GLUT 1, that is present on both the luminal and abluminal membranes
of the BBB endothelial cells. Contrary to the glucose transporters of muscle cells,
GLUT 1 is not dependent on insulin for glucose transport. Rather a concentration
gradient between the blood and brain compartment is necessary to facilitate
glucose transport. GLUT1 can function at less than its maximum functional
capacity under normal conditions; therefore it is viewed as less of a rate limiting
factor for brain function. However, during neuronal activation it might be necessary
for the transport parameters to be adapted to the increased glucose demand
(Leybaert, 2005; Leybaert et al. 2007), to prevent it from becoming rate-limiting.
Neuronal activation, and the resulting glucose consumption, leads to a drop in
5

brain interstitial glucose concentrations (McNay and Gold, 2001), such that
transport of glucose across the BBB needs to be increased. It has been observed
that BBB glucose transport changes under certain conditions. For example,
sustained or repeated decreases or increases in plasma glucose concentration,
that occur in poorly controlled diabetes, are known to up regulate or down regulate
BBB glucose transport respectively. Such adaptation presumably helps keep the
supply of glucose to the brain constant. (Christensen et al, 1981; Gjedde and
Crone, 1981; Hasselbalch et al, 2001b, 1995; McCall et al, 1982; Mooradian and
Morin, 1991; Pardridge et al, 1990; Pelligrino et al, 1990).
Within the brain, glucose is rapidly distributed over the intercellular and intracellular
space and taken up by the different brain cells. Specifically, neurons express
GLUT3, a high ‘affinity’ and high capacity glucose transporter compared to GLUT1
(Simpson et al. 2007). There are also reports that neurons in particular areas such
as the hippocampus express the insulin dependent GLUT4, and also GLUT8.
Astrocytes, whose end-feet surround 99% of the BBB endothelia, express several
isoforms of the GLUT family of transporters including, GLUT1, GLUT2, and to a
small extent GLUT4 (Qutub and Hunt, 2005). There is evidence that changes in
blood glucose metabolism can alter the expression of the majority of these glucose
transporters (McCall, 2005; Shah et al, 2012). For example, the neuronal glucose
transporter, GLUT 3, is upregulated following low blood glucose levels (Kumagai,
1995; Koranyi et al.1991; Boado and Pardridge,1993; Uehara et al 1997) and
these adaptations lead to increased brain glucose content (Lei and Gruetter,
2006).
6

Brain adaptations to acute and chronic changes in peripheral glucose metabolism
are necessarily studied using animal models, such that their relation to cognition
has been rarely considered. However, alterations in brain functioning, affected by
changes in peripheral glucose metabolism, are likely to have cognitive
consequences. Whether changes in brain functioning occurs in response to acute
changes in blood glucose during the postprandial period is unknown, and is an
interesting question. Nonetheless, the biological evidence supports the need for
further studies exploring the relationship between peripheral glucose metabolism
and cognitive functioning. The next section considers the evidence that altering
the GL of a meal can have cognitive consequences.
1.4 The effect of GL on cognition
A high GL provides a substantial but rather short-lived rise in blood glucose levels
which subsequently fall rapidly (Figure 1). It may be predicted that the rapid
swings in blood glucose, following a high GL, could disrupt cognition, particularly
during the late postprandial period when plasma glucose falls to very low levels.
On the other hand, a low GL, which provides a steady and consistent supply of
glucose to the brain, may provide a sustained benefit to cognition that extends into
the late postprandial period. The following section gives a critical overview of the
literature concerning GL and cognition.
1.4.1 Methodology
Online electronic databases; Medline, Google ‘scholar’, Cochrane Library,
Embase, Web of Science and psychlNFO (up until 07/02/13) were searched for
trials investigating the effects of GL/GI on cognition and mood. The following
search terms were used to search for relevant publications: ‘glycaemic index’ or

‘glycaemic load’ or ‘breakfast’ or ‘snack’ or ‘meal’ or ‘drink’ and ‘cognition’ or
‘memory’ or ‘cognitive performance’ or “mood’. To minimise publication bias
ClinicalTrials.gov was also searched and secondary references were checked.
Figure 2 shows the selection process.
Inclusion/exclusion criteria
• Studies were included that investigated the effects of GI/GL on cognition
and mood.
• Studies investigating the cognitive effects of isomaltulose, compared to
another sugar, were also included.
• Studies were excluded if their attempt at manipulating GL was unsuccessful,
or if not enough dietary information were provided for an estimate of GL to
be made.
• Studies were also excluded if they were not appropriately randomised and
counterbalanced.
• Also excluded were studies examining the cognitive effects of
macronutrients in which GL was not the focus.
• Studies on the effects of glucose vs placebo were excluded.
• All populations were included raging from school aged children to older
adults with the exception of very young infants.
• Only studies conducted on samples from industrialised countries were
included.
• Survey type studies were excluded.

Data were extracted using defined measures, including sample size, mean age of
participants, dietary manipulation given, cognitive and subjective measures
examined, time scale of measurement, study design and statistical method (Table
1). For standardisation and more direct comparison between trials, when possible
GL of each meal/snack were calculated from the information provided and Gl
provided by Foster-Powell et al. (2002).
Full paper retrieved for more information n=19
Controlled trials meeting inclusion criteria n=16
Excluded n=3
Inappropriate dietary manipulation (Mahoney et al, 2005a, 2005b; Taib et al, 2012)
Potentially relevant articles and abstract retrieved from electronic databases (Medline, Google ‘scholar’, Cochrane Library, Embase and psychlNFO) and screened n= 75
Duplicate publication n=25 Irrelevant to current study n=13 Inappropriate population n=2 Inappropriate outcome measure n=3 Inappropriate study design n=13
Cross sectional n=8 Review n=5
Excluded n=56
Figure 2. Flow diagram of the screening process, n - number.
9

1.4.2 Results
A total of seventy five articles were found on an initial search of the electronic
databases, sixteen of which were included in the final review (Table 1). Two
studies involving the effect GL on children’s cognition were excluded (Mahoney et
al, 2005a, 2005b; Taib et al, 2012) because they failed to successfully manipulate
the GL of their treatments. Three studies examined effects of GL on cognition in
primary school children (age 6-9 years) and five studied effect in older children and
adolescents (age 11- 15.6 years). All studies included both males and females.
The effects in younger children and older children are considered separately given
that after the age of about 11 hormonal changes begin to occur that may have an
impact on behaviour, and may also have an effect on blood glucose levels
(Hindmarsh et al, 1988) and hence the glycaemic response to meals. Three further
studies examined effects in young adults (age 20-23). Of these one study used
only females (Benton et al. 2003), whereas the other two used both genders. One
also examined the effect of individual differences in fasting glucose as a potential
modifier (Nabb and Benton 2006). Six studies examined the effect of modulating
GL in older adults; all included both males and females and of these five also
considered individual differences in glucose regulation.
10

c0EEo
o
5o a:c0E
u3TO0 CLo a n
o 0n CL0 _i 0uu O _2
..oC !_• $
O O)CO ® — c5 ® 0 g_0 x> E TOi= . _j 4—1 1_3 TO CO 4 -0 0-C 0 o ts CL§ O ® O ^ D -® 1 o^ E ^ LU O J5
3 TO C 0 o SZo £0 CO^ E
0JD
_ l
oL.0 )
o
(AO)c
c
! ?0 5
E o o
c
° - SO 0 0 C/5
t e CO CD SD0 ^
oCO 0
c „ 2 c
.ti o c s
R> cO 05o o
_ ®
8 = 2 WO D
TOc0
oE ^
o ° .2co ^ ° - 3-0 1! O 0 0O ^m co co
- , 0 0 TO TO
E ® E ®
0 C.S ' I13 ®■g-S
I I■g §o3
u ^ a Q) o C* - > » ’£ —I o I-0 2 gS 3 E o
CO
0
coCO u=
c c O 0
"O co
g-EO CO m ®g £8 ®° TOCO TO 0 0
'■*— o -* 3® -a £ 0
c o a c
c
TOc
0c 0
O0 o 005 0c TO UL_c 05 oo s z $
fc TO 00 0 0
s z c TO05 05
0 >05 E
> k - co Q .
0TO 0 I—3CO00E
TO0L-3CO00E
oco
N- CM10 in ooT- r- CO
I ~ s
3 - s i< CO > 2r a js _ to lo 0-i« S ^ 1 4P . q 8 co E
coQ.OCL 0 vO
CO =£oO J - p
O to '§ TOg
. yp 0 f~
E l l lCM S3 (J
0 5— ■-to TO X0 =£ ra 3 0 55 ScO) o Q- —03 C CM C £ qj
£ £ oo ro o 0
-Q - | .E 9 ° := D 5 _ £ r i fS ^
0 0 0 ^ ro 0- « ' — ■ — 0 5 Oc o £ c 0 0 o -g
r \ t \ V.CD X•F O
0 =5<4—- * F 0 c£ £
» ?$ £ — 0 CM O
05CTO X CO 05_3 J0 .0
00 O Q. XS n c cto — 5 0D 5 o CO tZ cO 0£
‘c ^ co CO
1 ° ® nc 0 ra9 O -g in f rO i s CM O
00o
0 o05 3C O)0 TOo 0505 L-
3CD n z sco > c
0 k-p ) TO
c.o
coo
I ' - O
E 0 E 2 £
S ®CO fc•q. E
c,o
c0
0coTO >
0 -j= >> O _0 _Q5 0 0
LU C - Q CO
o
E0
• •0 9 * 9 c^ 0 53 -21 E -2® 0Cl E 0 0 t i
LU 3 0 C/5 <
a) 0
£ ro rr °I - V)
o r>-
- o c o co ■?t— T- fc
O - -CD O O O C . CM 0 T p O t- t- CM fc
c0 )
’50
Q
o o)4-* 0
<
CD CD CM CO
CO
c CO
® S
CO

c0EEoo
0
J9•g
J ^ ’EC TO O 0
i_ > .0 C 0 _0 0 -g O 0 0 *4 *- tfc 0 ^ 0
CL £ =9 r x ® CL £ 0
3 0 C 0PO a 0 0 2 E
0XI_iCDL_0)$o
o 0) o E
oc0c0
3 T3 C 0P ^O £ 0 0 S E
oW 0 1_ 1- 0 0^ •
J ° d s s !
X o 0
COO)c0c
o 8t- -g> y ‘ > 0 4-<TO 3 c O° fc0 TO8 ®0 £E >*- E o
kP _co0 55 CL £
00(15 L-
0 f“ 0oX4-»
05X
Xo
c 0 00 X
0 fc ! ■
ooX
30Co
oc
"3CO C 5 X 00$
00 ■0
(1500
0 X E XE o 0m X X 0TO£ CD x
- 1 PCDto 0
I °O C 0 ^£ <= t l 005 O C Ci=
S.5c J2 2 01 1
0£ TO
o 005.2 0 t£o w 5 Sc E 0 oX Ow bCO CO 0 0 5 o
“D zi<D COc5£O- ^ c 0 C 0 O 3 O X)
0 X° £ 0 o 0 gCO 0
£ Ei ® —J "4-*
CD .2i_ 00 05 E °, E
C CM 0 t-c a= o 0 *= x0 £
i - i0 0
CD
0 (0Xn
> 00X
0k-X
0E
03 0 O0 0
_0 Xd TO05 0 XC0
c0 O4
0 ■fc 00 (15 05i_TO 0 0C (15 X
"0l_O fc
0H—E O
0 c 0 00 £ o fc
rn ® CD 0
c $0 _o^ 0 0 :5 c ■*-*3 0 X 08 I— eS 'E .— r- 00 £ c 0 0 c co 005 £
x $ ® £ CD
0
00X
oE0E
_o
| 5® ^ CD .2
TO —.2 CD t£ xO 05 § X 0 c 0Q.CD5 05 *O ce iCD E
H0
0£3CO00E
0£3CO00E
CD CO CM -i- LO i- 00 f lO CM CM
00
5= i -* fcC .X — 05 E E'°> o 5 c 3 0
O ® 0 0 c
b E E C (D <» to c 5 o —CM LO fc -
cooX00
05
x 2 8 fc 15 _Jc: Q- 2 "rn >,0 0 s is 0
b m 0 0 c oO -
CO 05 .—. 05 CM 0
£ E5 .2. _0 0505°
00 - - 0
0 0 0 0£ Xx 0
o00
0'. 35 to 05-2 g o05
8 s5!■>- 0 2 ^ c00 0 05
00
£
W <3 - 00 0 .
55 0 0 co 0 oX fc O X
CD => CO5 0O 3- 1 E ■
c 0
x Q.D5<
X 05 — X T- CO
CD
Eto3- TOcm r - z £ CD
I •!E JS o xO X CM 0
2 E^ »o 05 W o TO
I CM S X 0 _*f a)C D fcfc .2™ ® - ^ .2> o g jdX TOO x ^ lo o xCM X 00
0 TO 3 0 0
^ 3I 3 053 | “ lX c : CD CD ‘^ -9‘ - ! <
X TOC ,—* O Uj CO 3 - CM
CDX05X
2 05 0 X0
c_ E 5 ° — o ° E
X TOOo3" CO CO
1 =0 ®
E ^-a % '-o
00E
0 c 0c
C c .2O) S_3 ■§ 0 .2 .2 .2 OO C m C) S c Oco fc J5 0 0 0 0x E CD 0 3 S 0
LU o Q QC CD < X
§ § o .28 J2 eO x
oE0E
os fc0 o E .2 0 x
CD LU
00>.0
x 0
-r. CO TO *-.2 xX Oo
0
2 00
1 15 P £ 9: OO-Q S- CD CD CL
CD
0c0
0
c CD 3 <X >
0) 0 E wL= 0H 0 O O C
E
x c 0
O - ® T- 05 ^LL
C 0 0 0 CO ^
CM
cTO00Q
CD
52 CD ^ COI 1
CD CD
x ®=3 42< s .
0
0c ^ 5 Is- c °® SCD
00 • ( -
X T—.2 o
CM
7^94

c0EEo
o
•x 130)0 tn 0)■£ C- o3 0 - -P5 Q- £ o c l
oO | s l §S g S ? * 5 «® c 0 co sp - i t o 0 ® r 3 LU o 0 o fc 0
oc0c0
'l.3 T3 C 0p s=-g COO 4-1 0 0 2 E
0
0XXo
XTOX
TOc"k-3 0
P 0
o 2
a -8® 0£ c x O LU O
00i_1—3OOO0>
X - .22 0 E 0
oc0 Xc CD<35 kt—■: o' 0 o
0 0U X fc:O o 00 0 ofc Z
0TOC0c
0
0 .E ■° E £ o
1 ?
o E 0 0
8 E CD 5r- >»
■ £ 0 0
X 0
K-O
0£3000E
00
0CO Z 00 CO CM 1-
c£
CD ._L X
TO1 O )_o E00 LD — CM
00
X0
cb d° ETO_o E co in
CM CM •<-
2 ra0 LO 0_p ®
0-i§ 2> > 0TO Co cTO
- O
. 2 , 5i_ 0 o * -
3 E*4—
® JTOO 0 O > CM
fcz E J 3 § D1> fc, O) O> TO io > O ° CO 05 TO - o' 10 O t 0 -o' ^ 3 0 0 r— TO 0 m
O X fc CM > O X
.CD..0
E ^ • 2 , c
fcE
- 5 3 ^ Ol= .O 05 CD
•2 TO<§>£
1 8 N o X*—1 X 3 u, 0■*" — TO 0 0^ Z O X fc CO C >» O X
>TO
0~ T •® 0 E S co 0
CD<>1 5co
I s . *M S ' ” !0
0E
0 o0 k- ku j—‘a E ® oLU ; o O CD
0
E< CD £
g0o0
' x0 050 .E2 fc 0 § 0 5 E 0 E c
• TO 0 C0 zCD o
0
0
0
sl.3 c £ a . , 2o 0 Z E £2 g® 0 XE i <
0 0
E « l— w
oCD
- O Co o zCM t - fc
OCM
T o dO 00 Z CD t - fc
c0 CD CD X 00 CD
t- CM
C0 CD 0 X
cTO00
QCD
< 2.x 0
Z 0fc oCD LL.
04—1<D ^
I c S
• i 5CD 5fc.
34

c0EEoo
§0 Oc
0E
k—30
M— 0 CLO nO 0
n CL0H- _i 0
LU CD .0
0XxCDk_CD5o
0^ z2 l 5 c «
>, E ® ® o— o ~ '■C 0 O 0 o0 3 C O » „0 0 CL _ S& ® CL ® LU E CL £
0 .0
® 0- 0 0
oc0"c.0
3 0 C 0 O Xb £ 0 0 S E
0XXCDL .CD5o
D)C
o S g - 0 .8 CL£_■ alu CD
0xxCDL_CD£o
005C0c
0
■S ® 8O 0 o0 0 4- * 0 0 ro c CD x o fc fn a n u 0 > p
XEfc o0 O
0 05 0x S c kEo cn f - k - ( 0fc ■£ o 0CD E X
k. o ® c
k - k -0 o0 _l
c oX 0
£ o2 - X fc ® 0 fc •£ 0£ *- 0 o § g
S O X
05Xc0
X
0
CD 8 x £05 0x ro-1— M—
i i £ $ k. T3
® I■fc ro £ o> ° 5 0 O 0
X 0
f jb °0
0 0 00 01 ” 8&£. E o 0 E E
I o£ 3 X X. i ^I E 0 fX— o E 0 £ 0 _0 o 'q. -b CD 0 05
co0000CD£oE0Eo5 o z Ex 3 LU 0
05 0 X -b
fc 0 P x^ CO
S 8 o *|2 5 * 10 c O O0 E 0 -T_>• O ,n 04J5 t Q. 0 0 0 < c -o x CD 0
CD
0£3000E
00k_3000E
00k .3000E
CD 3- co x co
X X X X X z oT- CM
E 0 - c 0 0
5 ■
^ 8 8 ^ wn J"3 ®cS £ £>? 1 e
0c0X
0 0 = ®
X X X
CM 0
00k -
Xo
00oo.3CD05XX
XE
05Oo
CM
0X .05 ®
CM fc CO OL; o05 3
§ fCM £
co E
z
_0 05o
CD ^ < x°? '5X °| SP CD
+CD<CD05 X ,x CD O 2
5 o05 CM
0 5 g °X - O .
05ro r>x CD y— - X CM 0 (J 0 +
% 0 05 CD x -O O T- <f (15« 03 <
CM* CD 05 05 (2
. c 2*-2 o E 0
0 E ro _ 0
— 05 > x £ x® 12 % o fc -2 £ 3. 0CD > CD
OE0
000x0
O '0 .0 C O g 0 -0 . 2 x z
0 g ° c g 00 5 .2 0 fc xx fc x £ 0 xCD CL UJ < CL <
2k,°c ro o -
b 0 O CO ~ o q -Q0 0 £ z ®o 0 ro E.2 E oa. g x
o ' .E° E
- oO CM Z CM
0cx ro 0o -fc O T— 0 x
LU .fc t - CM Q 4-
0 0
i l lH 0
0c® o dO CM Zco v- E
o c^ E- 0 0O C X X 0 T-
oCM^ CO z co E
SU “ c =• - '0 x ®T- C C ®■sr 0 3 c x
0co 0t- >,
0 ro ■<- z t- 0 S l N >
c05’00Q
CD CD
5 ®
< 2J
0
0 — X
o o CJ
0
0 ^
l iCD

c0EEoo
-fcTO O „ 0■i - ®3 0 . ®0 D. Z
X '- D 0 -0
5 8- o 0.8°- 0 0 - 2
® 'I > 0 -p r > r to c 0 ® s p - i0 0 - 2 ^ 3 o 0 o E T5
Oc0c0
"k_3 -d C 0P -Co 0 0
^ E
00 ® X 0 0 008 x
0 — 0 3O X 3D —
-2 - I £ -5 p r - i £ TO CD •> O) t'O •>TO TO O k_c* 0 0 c 5 £ ® ® b I fc b 0
.00o
xX 0 TO O
® 0 0 ®0 E
1 =TO oTO -0 £ O 0 ® 0 Q
c c x• c - y3 0.
^ 9 r ®— T5 CL Z 8 £ 2 ® " I E §0 c P 0 3= O LU o
X0k.“5 CLO 0 .oo Q_0 0> 00 ■X TO>. C0E
3X
-p T3 C o 0 jc c o3 to 8 E b ®0 0
s 5
CDk—oo
s80
wTO_Cxc
CD0 &£ _ 0 ^
o 8X X
E n
g 5 o 8 £ 5o --J
^ £
£ 8 X oZ X
X—I 0 c = 0 0 X ° Z 0 !_ *- 0 ~oI IQ £LU OS E
X% ICl) CD0o IX -orc 0
h~ DCD LUk. >0k_ h-oo CDX L—0X <-<(I)S X
> 0 O ® -J EX ■*-’'1 I
o - 8o - S
H-CD
x c0 CO X
fc > 0 XTO■£ "O0 o0 _2 J3 0 x e-U_ X TO X 0 E
> o3 — ° E J n, s.
~o0i_3000E
OIs- T—fc" 1- X CM T- CO O
TO b O X «=
X TO T- Xu_ T
T- O
TO 0
? TO ^ TO LL O CDO
CM O
TO 0
OCO
O
TO X LL X
sico O
TOTO
Ssfc- o
X0k_X
CM«=O TOro XII O
I COO 0
1X CJ
0k. in 0!_X X CO X
k— L—TO TO X TOvl fc- roII fc- LLX coOT o O
T O_L _L
X CJ fk- O
0XX
X
TOfc-TOXTOLL
I CMoT O
J.co O
TO v* O C X -3 —-X O T3 CD 0 — 0 — 0 T- X
X .fc
^ igCD 0.—4 0CM X
o - o
0goXo
Xc0-— ' 0 T3 O
® C2= «=0 .TO .fc h— O
-2 CD
LU : o O > CD QC CL
i =0
E S • . 2 ^ - 0
10 b _0 ' x E 0LU O . Q
oE0ETOC
5o
CD
0 0 E ro
H- 0
^ 5 2 0 0 Ero ° o
DO b i TO
o' o-o x ^
8 o 0- .E S ™ x E
c5 10 X
LL C t- 000 8 T 0x ® o 0f- ^ CM >,
_ 0 CO 0 CM >k
cTO00
QCD
Xc0 c ^
X ® toX C oro ® S z do
04-4 x—sCD O
£ 5Q tM

0CD k—i
-o k_CD
>3
> . E 0 CD
3 -o O 0O 0 O 00 3O05
0ro CL 0k_
f r 0 n 0LU b 0 . X
■= . o3 CL £
^ 8 - © P - O CL Z
0) e£ "o E 5
3 ~ roo r a ®O 0 O
X 050 O J o3 CL
3 O TO 30 _i 3 0O Q_
8 ^ 05 £
30'k .
0k—o0E 3 D-
5 &30‘l.
> ro 3 ■D o k—£ CD
3 Xro — 3 a) 0 U 3 0X TO O X tb *-» 0 ro O X>-3 O o 0 u05 x ~r O oCD fc CD ro o H - _ i 1 2 CD rob 5 b Z luO E b
0X
0L-0£o
OCD
£ a? 0 £ o ~ c c0 0 fc ®
=0 0
1 8o
’0 2 O ©
Z x
OCO 0 CD' 0 o o0<eCD
0 *4 0
0ro
T3 l- 0 X
kZ $ -2 CD0 0 ® ™ k. TO0 E CD ££ 4—* ID roO L_
0 < 5> TO ©o o X CDX 0 3 TjCO 3 CD 0X "a
1 13 0ro T3
X — 0^ SPCQ .2
. ® < ^ S £0 -o1 0 :
- ro ro c — o.2 £ £ ® O -c E “ ) CL 3 —s CD k - < 3
= CD TO 0 CD O 2 fc
c ro DO ro x
oz><TO-a ro3 oCD 05i_
"0DU. T"J3 k_O Ob £r O3 k“4k- ■O— 0co CD
DO £
~ocCD
CDOx ;
= E 0 o o kb
£ co b £
01
O CD
3 ~
= O 0 Z)5 <DO CD
0If
X 0 .b x £ c 0 2w 'nI I
o 0 0 0
0 Xo CD
CD£0CDk.
T3 > . .
-£ ®° P
■£ 3CD O O 0
0 o ETO 0
± E
2CD0E3 X 0 CD 0 0 £ - 0 0 k.
X 00 ‘fc0 103 = 00 £IE E x> x
z S
£CD -
£ ^_ o 8 e -du 0 ci - r (O £ E “
§ c -2x 12 o
g o i g 5 * -
I r o . l3 0 3x ro o
TZ X 0 0 O Xx S 0
X 0
ro ro
u0
= 5 § d0 o | z ° § O <
DO kE I C7)
0'02 3 Q TO cm .2 H- -o
OCM CD t - CM
O S CM X CO r~ O
Dk h- •t- CO O
30
TO02
O•fc
O 3co aj^ - 4 CD
TOOfcCJ .w s, „ rocm
to . o xx 3
orooxTOoX
>k0k-ro
xTOox
xCD0k-
X0X§TO
OX
£ .2 "0 0 X o0 3 CD TO £ .21 T>
CD O X XX ° XO 0 « ZD X 0
| 3
0 ro E bn CD - '
£ = 5 - 2
o ?0 3x E
LU
O 0C d ?
“I0 CL o nP 0 3
» k n ~ 0
| 3 ^ CD 0) _E
T33CD
Q l - < o
.2 :§ XO 1 £0 E CD .b =x E 0 -S5 £
LU O Q Q H DO LU
~ 3o - 2
ro fc > E ro ^
111 *-C
0 0E ro
l” °h- 0
3
5 1 ro oO X TO t-
O® X C X O ZT— ■»— 3
OCD -
. 0 0 3 X O fc" Z T- T— T— 3
3 08 ^ ro£ O 0 ^ fc >k
3 0CD X 0 CD
CM 0 r-k > ,
0 ro® X 0
2 cp >
3TO'U>0Q
CO CO
CM
3 « < 2.
0k_DE ox ° 0 CMro fcZbi ro
3 .~4 CD O Q - g
* § .
3Oro co
I §Z ^ roX roro +-*
Q_ 0
MO

c0EEo
o
WD)c
c
HCD
CD
(/)a>3I/)roa)
2
a) ro£ w
H 0
cD)
'(0a>
Q
x jjT
3 -2 < 2-
CD O
■g'TJ C
o 2 ? 7 © ■§ I© ‘55 :O r ~ lu ST
t t o CD © 2 LU O CD O t
ID0L_
CLO Q_oo CL
0 0> roro
X CD>> croE
D-o
o J2
■8.2
©o roz E
£ ro ro m °ro .2 x ro ro g 5
r & -ro
| c E ro
Q . -22i_ ro ro £
o ro
s i i ?o q5 c oO > CD i s
Q" © ^ oCM © § g 0 ro E c
I - -o E £
«- o
S ®
> oC 0ro a .
X 0 — 0 1_ 1_© i
ro -a-Q }= ro© 2 0 -TOE cn
ro o _ j a . * -CD fc = j £ ra
CO■0
2 cQ O)CM roI— T3
t - CM r - co t— Tf
0O)
X OIUNO
ro_c
T—
TJOD
XO)
.05
O> ,
ro0u.X
D)03 0
C*1-
L0
00 CJ) a ) t r ro roC*) k_ CO -) CD0c
CD CDO ro >
T - LU CM > , E CO
ro
E l •■2 =5 •o ■o 0 © _ o 2 >» ro c • - w E _ro 3 {= «a E © .“ o o
XV)
ro v> roX 0 v>2 r o
CD g 3o
CD
D)0Q.XJ0
"TOO J-P ro
0 c ro
1
LU Z P Q > j O h O f f l h
T3cro o cO CM r co t- E
5 LL Q CM
CM CM fU
CO LLCO
ro0 ^> M-
o•b c c ro o 0 o -s:
roCO 0 to >J
o
£ S cd^ CD CD
ro
0t
Q . CM
® °
t 0 o '-
C Icl 2 cl ro0 * *
-y E2 gE o
wcro■i_3 ~6c 0 o X o 5 ro ro ^ E
L—0ro
0r
cTJ
c Oo k_
X 0)c n0
roro X0 c> roL-n C10 00) ow X
CD o a
CD
c_o
‘cCDOO
0X )
CDL_00
CD
CD
0X}
CD
ro0 o
3 0 CD X I
i - Q. 0 0!m c03 . roO ' =6D m 0< ^ E
03 c -
S ' S ^ 0 L.T - X
0 rox 3-ro 03 d'
^ -D —Li ro cCM X 05
. C
& ■ £ O c E 0 ro x E ror-r, ro
12 © b ro 3 0^ CD
o^ to c 0 CM •?S CM C
CM CO i - CM
roCM 0co > ,
CD
DT>
0 - $ 0 O
I I S :
% S » _1 ^ 0CD 5 - 1 2
c0
‘u_3 -dC 0o X o 2 ro ro 2 E
0x_ jCD
I E
I I CD ro
c ©
0 >, p ro o 73
i t^ o O o E « 0 x
E §D) O
.ro M_o
o ro
^ 0
>ro
0 T3 § g g(0 T ^C !=| °P ro x O ^
^ ro c 0 o ©
E - a
■g 0 2CP te\> , roro c ro
.X ' 0o c
roo ro o ro0 330 ro ro a; o> >
"o §;-2 ■— 0 CD 0
a - P T o
0r C ' D _ „C O 0 0 LOm “ U (fl ( I ) _
•- E © o 0 . 0^ t x g ro <X) 3c— lO m— — CD ^— O•> c i o ro > ro x
0ro00oo
_3D)03 /« o rolo 3 .^ oT~ X
0 X O rn 0 CO 0 ^ CD
O 0 o ro > _o ) © ©
03 "S °o © ^ " & • - CM '0 E
. c ^ • 2 ° c E roro ^E ro ™ roc - ^
■x ©2 ro
> ro 5 CD
_ X3§ ro
- O O C LO CM LO - p CO r - T - C
CM 00 •t- CM
cll ro 0 roCM 0 CD >N
CD
ro
0
i f« oz £S
D ) <MC CD3 > : O r > * ^
j 2 p j c ►-
S 58 gO ro
"O £ro u_
„ ro
c c O §
■D CD0
JC CDO 6
• - <
E cn. 9 a4-1 0
| I 8 £ = Io -S 0(/) - 9
c w. E DOk-
T 3 3"IX roCD 0(0 l o0 P0
cX
CD ^3 L L -P 5 0 X -TO> O I CD
> | 50 E 0
5 = 1 : 2 0 0 s-E E l
! i iZ ^ 2o £ - g .
0 2 o* 5 ^ -E 2 o roD . > «
^ I ^
2 ^ 1 i-1- ^ ll
c * y d.E X 0 0' . 0^-0 ro 5 o o 1*- —
Q . 1 P 3
L 0. 2 ro aJ(0 D 10
Eh -o
_ j
o
0
ro x ro ro
S E-I 3I
5 13
O ) —C ro
% E ro ro— ro3 o
T 5O roo
T>CDCD I T3 X 0« LU E
E: O 'CD - J Ll
x S o f oo ro s
ro £ 'ro x
— o «= E
0
o 0t t : ro
roX5 0 c 0 .=: CD 0 'S t o © 5 - 3 Eo 0 5 ©" ro - I -g
I h DCL O ^ CL . • §
0 x 0 b=
X 0 "O
• - ■ S o
00
s :
E 0 ro o
O ) T 3
■- CDc1 3
S - i® TO CO L. 0 0
l i ro p"TO 3 © ^ 0 .
x ' X o O 0
-TO = ) ^ ro CD ^ro - ^' 0 ^
O 0 OX o ^<■>3*■o g f i ro t * - 0 o § * 3 o
O
* 5 2 i i — E- T3
_ 0 > CQ CD -§< : ^ 5
0 g S 5 ooE0 0 35 CD ^ ( D r ©
=5 C D S
co *oc
03
_ 0 ^
X 2 3 ro 7 3
H ro
i"~-
ca
rbo
hy
dra
te,
high
fi
bre
, H
CH
F
- hi
gh
ca
rbo
hy
dra
te,
high
fi
bre
.

1.4.2.1 The effect of GL on cognition and mood in younger children.
The GL of the meal/drink varied considerably between studies raging from 3
(Benton et al. 2007) to 38 (Wesnes et al. 2003), however, the difference in GL
between the lower and the higher GL within each study were similar between
studies with the smallest difference being 15 (Benton et al. 2007) and largest being
23 (Wesnes et al. 2003). All studies manipulated breakfast after children had
abstained from food overnight. Ingwersen et al. (2007) manipulated GL by
providing two breakfast cereals that differed in GL (All Bran and Coco pops),
however, in addition to differing in GL these cereals also offered different amounts
of available carbohydrates making interpretation difficult. Similarly, Wesnes et al.
(2003) provided two breakfast cereals (Cheerios and Shreddies), however; they
did not differ significantly in GL. They also provided a highly glycaemic glucose
drink (38g) that was compared with each breakfast cereal, again the meals differed
in their degree of available carbohydrate. The cereal products were ingested with
milk, which is insulinotropic, and would probably result in lower GIs than calculated
from the individual carbohydrate components, as well as shortened blood glucose
response profiles. Benton et al. (2007) provided meals that differed in their
macronutrient content as a means of manipulating the GL. Although Benton et al.
(2007) entered the various macronutrients into a regression model to account for
their influence on cognition and mood, no study successfully matched meals on
their macronutrient content.
All studies reported a beneficial effect of a lower rather than a higher GL. Although
it has been reported that the ‘glucose facilitation effect’ has the strongest effect on
memory (Hoyland et al. 2008), the positive effect of a lower GL meal does not

appear to be limited to this domain, at least in young children. Benefits were
observed on episodic memory (Ingwersen et al. 2007; Wesnes et al. 2003; Benton
et al. 2007), selective (Ingwersen et al. 2007; Wesnes et al. 2003) and sustained
attention (Benton et al. 2007), reaction to frustration and time spent concentrating
in class (Benton et al. 2007). Lowering the GL of breakfast does not seem to
influence young children’s simple reaction times (Benton et al, 2003). The
beneficial effect of a lower GL occurred during the late rather than the early
postprandial period; young children’s performance declined over the morning after
they had eaten a higher GL breakfast (Ingwersen et al. 2007; Wesnes et al. 2003),
and this decline was prevented by the consumption of a lower GL meal. The GL of
a meal had similar effects in both boys and girls (Ingwersen et al. 2007 Benton et
al. 2007).
An important consideration is that in Benton et al (2007) study, no effects were
observed when the data were considered using a series of ANOVAs; effects only
occurred when multiple regression were used which may have been caused by
differences in the amount of breakfast children ate (they were not forced to
consume everything). Memory and attention were the domains most studied and
hence effects of GL on other cognitive domains such as executive function remain
unstudied. In addition, no study measured the blood glucose response to the
meals, presumably due to the children young age. It should be noted that although
GI/GL may be calculated or estimated from international tables of Gl values (which
are based on adult responses), it is unknown whether children and adults differ in
their glycaemic responses since Gl studies have not been conducted in children
(Hoyland et al. 2009).
19

All studies employed a within subjects (WS) design, however, only Benton et al.
(2007) considered order of meal presentation as part of their analysis. Indeed
when order was considered there was an effect of order where children’s reaction
to frustration only improved after the lower GL breakfast on day 1. Presumably this
effect occurred because by day 2 the children had learned that the task was
impossible.
1.4.2.2 The effect of GL on cognition and mood in older children and
adolescents.
Again the GL of the meal/drink varied considerably between studies. GLs ranged
from 5 to 65. Interestingly both the highest and the lowest GL were found in the
same study; Brindal et al. (2012b). The difference in GL between the lower and the
higher GL within each study also varied from 6 (Brindal et al. 2012a) to 60 (Brindal
et al. 2012b). A range of methods were used to manipulate GL. Three studies
used various combinations of different breakfast cereals (Smith and Foster 2008;
Cooper et al. 2011; Micha et al. 2011). Both studies by Brindal et al. varied the
amount of dairy in each meal/drink to manipulate GL (Table 1). All studies
examined breakfast after an over night fast. Again no study successfully matched
meals based on their macronutrient composition.
In contrast to younger children the effect of modulating GL on older children’s
cognition is less clear. Cooper et al. (2011) reported that adolescents’ working
memory and attention were better later in the morning after the lower rather than a
higher GL breakfast. Similarly, Brindal et al (2012b) found that episodic memory
was improved after the low and medium GL drink compared to the high GL drink
20

but this effect was limited to girls. In contrast, two studies (Micha et al. 2001;
Smith and Foster, 2008) reported that delayed memory and mood were improved
after a high rather than a low GL meal and a further study reported no effect of
either (Bridal et al. 2012a). In regards to Brindal et al. (2012a) their manipulation
of dairy as well as GL may have caused a significant confound. The mechanisms
involved in the effect of GL on cognition have not been determined but increasing
reports suggest that insulin itself can modulate memory (Banks et al, 2012). If the
effect of GL on memory is mediated, even in part, by an effect of insulin then the
insulinotropic nature of dairy may disguise any benefits associated with a lower
rather than a higher GL. Although in older children and adolescents more domains
were used and speed of information processing (SIP), reaction times (RT) and
appetite were measured there were no effects of GL reported (Bindal et al. 2012a;
2012b; Micha et al. 2011). Domains that appear most susceptible to modulation of
GL are memory and attention.
Again effects were strongest later in the morning (Cooper et al. 2011; Brindal et al.
2012b) and all but one study considered these longer term effects. Smith and
Foster (2008) only considered effects up until 100 minutes post consumption and
this may explain their finding that the higher GL meal was cognitively superior.
Glycaemic measurements were performed up to 90 min, and it was clear that no
significant differences in glycaemia were observed during this time. Beneficial
effects of a low GL meal tend to occur two to three hours after eating (Ingwersen et
al. 2007; Cooper et al. 2011), such that their time frame may have been too short
to capture these effects.
21

Three out of the five studies employed a cross over design (Bindal et al. 2012a;
2012b; Cooper et al. 2011), however, no study included order as a factor in their
analysis.
1.4.2.3 The effect of GL on cognition and mood in young adults.
Studies have also been performed in young healthy adults (Table 1). Again studies
have provided a range of different meals and used a variety of methods to
modulate GL. Benton et al. (2003) investigated the impact of two cereal based
breakfasts in young females. The breakfast meals contained similar carbohydrate
contents and GL characteristics (42 and 66, respectively; Table 1). Nabb and
Benton (2006) provided meals that differed in their fibre and carbohydrate content
(Cornflakes vs All Bran). Dye et al (2010) was the only study to successfully
match the macronutrient content of drinks while varying GL. They used a novel low
glycaemic sugar: isomaltulose (GL 32) and compared its cognitive effects to that of
sucrose which has a higher GL (GL 65). However, again the sugars were
consumed in a milk based drink, potentially confounding the affect of GL.
Benton et al. (2003) reported that the lower GL breakfast significantly improved
memory function, particularly in the late postprandial phase (150 and 210 min after
breakfast). However, there were no concomitant differences in blood glucose
suggesting that cognitive outcomes could not be attributed to late glycaemia per
se. On the other hand despite controlling for macronutrient composition, Dye et al
(2010) reported no beneficial effects of the low rather than the high GL drink.
Interestingly capillary and interstitial blood glucose after both isomaltulose and
sucrose had returned to or were below fasting level, respectively, after
22

approximately 95 min, which may be attributed to an enhanced insulin response
after a milk-based vehicle. If this were the case then the glycaemic differences
between the two sugars may have been ameliorated to the extent they were no
longer cognitively significant. In addition, Dye et al (2010) only studied effects up
until 115 minutes post consumption, which may not have been long enough for the
superior effects of isomaltulose to emerge, given that the Benton et al. (2003)
effects became apparent after 150 minutes.
Nabb and Benton (2006b) found that consuming more carbohydrates resulted in
more forgetting, but only in those with higher fasting blood glucose levels,
suggesting that individual differences in physiology may be important moderators.
However, higher amounts of carbohydrates improved reaction time after 90 min in
the poor regulators suggesting beneficial effects of a lower GL may be domain
specific. The lowest levels of fibre (1.5 g) were associated with poorer memory in
participants with poorer glucose tolerance. However, blood glucose responses
were not affected by dietary fibre content, indicating that the expected variation in
GL may not have been achieved. Of the studies in young adults two employed a
between subjects (Benton et al. 2003; 2006b) and one a within subjects design
(Dye et al. 2010). Dye et al. (2010) considered order as part of their analysis but
found no interaction with GL.
1.4.2.4 The effect of GL on cognition and mood in older adults.
Six studies were identified that considered the effects of meals differing in GL on
older adults’ cognition. A range of methods were used to vary the GL. Five of
these studies matched meals based on their carbohydrate content. Kaplan et al.
23

(2000) studied three test meals that provided 50 g of available carbohydrates from
pearl barley (GL = 14), potatoes (GL = 28 - 59), glucose (GL = 50), rather than a
placebo drink with no carbohydrates. Similarly, in a group of older adults with type
2 diabetes mellitus (T2DM) Papanikolaou et al. (2006) provided breakfasts
consisting of pasta (GL = 15 - 25), toasted white bread (37 - 56) or water.
Kashimur et al (2002) provided either 40g isomaltulose (GL = 12.8) or 40g sucrose
(GL = 28) taken in water, however statistical effects were condidered thus
Kashimur et al’s findings should be interpreted with causion. Nilsson et al. (2009)
provided a 50g glucose solution that was either drunk as a bolus or sipped across
the morning to mimic the glycaemic effect of a lower GL and Nilsson et al. (2012)
gave 124g of white bread with or without the addition of guar gum, which slows
absorption. In the final study GL was manipulated by comparing 438g of glucose
(Lucozade Energy Original GL - 71.3) with a standard breakfast (68g bread, 101 g
yogurt, 19g margarine, GL - 12.4) (Lamport et al. 2012). All studied the affects of
breakfast after participants had fasted overnight.
Importantly, the glucoregulatory status of the participants was considered in five
out of six studies; however, this was defined in various ways such that it is difficult
to compare studies. Both Lamport et al (2012) and Papanikolaou et al. (2006)
studied older adults with T2DM and it should be noted that, although it would be
unethical to study unmediated diabetics, in both studies participants were taking
some form of oral hypoglycaemic. Lamport et al. (2012) found no effects of high or
low GL meal in those with T2DM or healthy controls. However, it is possible that
the high GL glucose drink (Lucozade Energy Original) contained 48mg of caffeine
which may have masked any negative effects of a higher GL.
24

Papanikolaou et al. (2006) did not employ a control group of healthy volunteers
therefore it is not known whether the beneficial effects of a lower, rather than a
higher, GL meal observed in their sample of T2DM, would have occurred similarly
in a healthy sample. Kaplan et al (2000) measured B cell function, insulin
sensitivity (estimated by The Homeostasis Model Assessment (HOMA)) and
glucose area under the curve (AUC) after the 50g glucose drink to determine which
indices best predicted cognition; older adults with the poorest B cell function
appeared to benefit most from consuming 50g of carbohydrates regardless of their
composition. Nilsson et al. (2009) used blood glucose concentration 3 hours after
drinking 50g glucose as a bolus, and Nilsson et al. (2012) considered AUC after
participants ate white bread. However, both studies by Nilsson et al (2009; 2012)
failed to directly compare the effects of GL in those with better or poorer GT, thus it
is unclear how/if GT status interacts with the effect of GL in these studies. Given
the variation in definitions used to define glucose tolerance it is hard to draw any
conclusion about how the GL of a meal interacts with individual glucoregulatory
states.
Effects have been considered across a wide number of domains including
immediate and delayed episodic memory, working memory, selective and
sustained attention and executive function (Table 2). However, surprisingly
subjective measures, for example mood, remain unstudied in this population. In
addition, no study considered the effects of immediate episodic memory during the
late postprandial period (PPP) (121 minutes onwards).
25

Early PPP(0- 60min)
Mid PPP(61-120min)
Late PPP(121min +)
Total
Working memory/ executive function.
0/11 1/4 1/3 2/18
Verbal ST memory. 2/6 0/4 2/10
Spatial ST memory. 0/2 0/2 0/4
Verbal delayed memory. 0/3 1/5 2/3 3/11
Spatial delayed memory. 0/1 0/1 0/2
Attention, concentration, vigilance.
0/3 1/7 3/5 4/15
Psychomotor skill. 0/1 0/1 0/2
Total * 2/27 3/24 6/11 11/62
Table 2. The ratio of significant to non-significant findings for studies of early mid or late PPP for each cognitive domain (significant/non-significant).Only significant differences between higher and lower GL meals are reported. * Does not add up to sum of above as some tests are classified in more than one cognitive domain. PPP - post prandial period.
The majority of studies have considered effects of GL during the early to mid PPP
and Table 2displays the ratio of significant to non-significant findings for studies of
early mid or late PPP. A total of twenty seven measures of cognition were taken
within the 60 minutes post consumption and of these only two significant effects of
GL were observed (Papanikolaou et al. 2006). Similarly, twenty four measures
were taken between 60 and 120 minutes after eating and again only three
significant effects were observed (Papanikolaou et al. 2006; Kaplan et al. 2000).
Given the large number of measures during these time periods it is possible that
the small number of significant observations may have occurred by chance. During
the late postprandial period (120 minutes onwards) only eleven measures were
taken, and of these six found beneficial effects of a lower rather than a higher GL
26

(Papanikolaou et al. 2006; Nilsson et al. 2009; 2012). This suggests that the
beneficial of a lower GL may be more apparent during this time.
In conclusion, although beneficial effects of a lower GL have been noted in older
adults (Nilsson et al 2009, 2012; Papanikolaou et al, 2006; Kashimur et al 2002)
effects are far from consistent (Lamport et al, 2012; Kaplan et al, 2000). The vast
majority of cognitive measures have been taken during the early or mid PPP (up to
120 minutes) however, any beneficial effect of a lower GL meal appear stronger
during the late PPP (Table 2). Although studies have considered the moderating
influence of glucose tolerance, the variation in definitions used to define glucose
tolerance makes it hard to draw any conclusions.
1.4.3 Discussion and conclusions.
Of the sixteen studies presently considered two do not allow conclusions to be
drawn about how differences in GL influence cognition and mood (Kashimur et al.
2002; Micha et al. 2011). Of the remaining fourteen, two found no effect of GL
(Kaplan et al 2000; Dye et al. 2010 Brindal et al, 2012) but methodological
weaknesses may account for these findings; the manipulation of dairy presents a
possible confound in two of these studies (Kaplan et al 2000; Dye et al. 2010). In
addition, Dye et al (2010) ended the testing procedure slightly short of the time
frame at which the cognitive effects of GL are likely to emerge. One study reported
benefits of high GL vs low GL breakfasts (Smith and Foster, 2008) with the effect
in question occurring after 100min; during the mid rather than the late postprandial
period, again this effect may reflect the shorter time frame.
27

A total of ten studies provided evidence that a lower GL meal was cognitively
superior to a higher GL meal (Ingwersen et al. 2007; Wesnes et al. 2003; Benton
et al. 2007; Cooper et al 2011; Brindal et al. 2012b; Benton et al. 2003; Nabb and
Benton 2006; Papanikolaou et al. 2006; Nilsson et al. 2009; Nilsson et al. 2012)
but the quality of the evidence in these studies varied, and in many cases the GL
of the test breakfasts are estimates from international tables, when no actual
glycaemic profiles were provided. Most studies report effects on cognitive
outcomes in the late postprandial phase. Although benefits in cognitive function in
the late postprandial phase coincided with higher late glycaemia (Nilsson et al.
2009), such benefits are also reported with low GL breakfasts in the absence of
differences in blood glucose levels (Benton et al. 2003), suggesting that the
benefits of a lower GL may not be directly attributed to differences in the level of
blood glucose as such.
Although only three studies (Ingwersen et al. 2007; Wesnes et al. 2003; Benton et
al. 2007) met the inclusion criteria for this review effects in younger children are the
most consistent and this may reflect a very high rate of brain tissue glucose
utilisation (Chugani 1998). However, effects in older children are less consistent
with only two (Cooper et al 2011; Brindal et al. 2012b) out of four supporting the
benefits of a lower GL. It may be that older children are less vulnerable to changes
in postprandial glycaemia or that poor experimental designs could not detect
differences. The evidence in young adults is similarly unclear; while one study
reported that a low GL is cognitively better (Benton et al. 2003) another reported
no effect of either a high or a low GL (Dye et al. 2010). The third study in this
population suggested that while a lower GL may improve some tasks for some
28

people, a higher GL may improve other tasks for others (Benton et al. 2006)
making interpretation complex.
Only three out of five studies in older adults reported a benefit of a lower GL
(Papanikolaou et al. 2006; Nilsson et al. 2009; 2012). However, the available data
examining the effects of differences in GL on cognition on older adults highlights
an important issue. If lower GL meals do confer greater cognitive benefits than
higher GL meals it is important to identify potential physiological differences that
may moderate this relationship. There is evidence that individuals with poorer
glucose tolerance have poorer cognition, in particular memory, and that these
effects are exacerbated with age (see section 1.5). Five out of the six studies
conducted in older adults considered the impact of glucose tolerance and there is
some evidence for an interaction with the effects of a meal (Kaplan et al. 2000) and
possibly GL (Nilsson et al, 2009; 2012). However, given the heterogeneity in the
way GT was defined no conclusions can be made. For example, different
pathologies underlie impaired glucose tolerance and impaired fasting glucose
(Abdul-Ghani et al, 2006) and these pathologies may result in different cognitive
problems. It is critical that authors are clear about which aspect of glucose
tolerance they wish to tap if research in this area is to move forward. Furthermore,
although in both studies by Nilsson et al. (2009; 2012) an interaction between
glucose tolerance and GL was implied, comparisons between the effects of high
and low GL in those with and without poor glucose tolerance were not conducted
and as such no conclusions can be drawn.
The conclusions from studies available to date are tempered by a range of
methodological limitations, e.g. poor choice of meals ingested; the use of milk
29

products; little consideration given to the matching of meals based on their
macronutrient content; a limited range cognitive tests administered; lack of
adequate information on, or physiological confirmation of, the course of
postprandial glycaemia; insufficient duration of the time after the meal;
inappropriate statistical methods; too few participants. Taken together, the studies
generally favour LGI meals for improved memory and/or attention, particularly in
children and older adults who may be more cognitively vulnerable; the effects have
been noted most often during the late postprandial phase. Besides the glycaemic
effects no consideration has been given to underlying mechanisms. Similarly to
previous reviews (Gilsenan et al. 2009) it is concluded that more studies are
needed to better elucidate the cognitive effects of manipulating GL.
1.5 Physiological factors effecting Gl and GL.
1.5.1 Glucose tolerance and postprandial hypoglycaemia.
Physiological factors can influence the glycaemic response to a food or meal. An
individual difference in the ability to regulate blood glucose levels is one such
factor. The normal control of postprandial glucose requires the suppression of
hepatic glucose output, an increase in insulin secretion that is proportional to the
glycaemic response of the meal and adequate insulin sensitivity in the muscle and
liver for glucose uptake. Impaired glucose tolerance (IGT) is a pre-diabetic state of
hyperglycaemia in which either insulin secretion is impaired, or there is reduced
insulin sensitivity, most importantly in skeletal muscle (Ryden and Mellbin, 2012).
According to the world health organisation (WHO) a person’s glucose tolerance
should be measured using a two hour 75g oral glucose tolerance test (OGTT).
After fasting over-night, 1.75 grams of glucose per kilogram of body weight are
30

consumed, to a maximum of 75 g. Every 30 minutes for 120 minutes either
capillary or venous blood glucose is monitored. The category in which an
individual is placed depends on their blood glucose levels after 2 hours, (Table 3).
Impaired glucose tolerance (IGT) is considered a metabolic state that lies between
normal glucose homeostasis and diabetic hyperglycaemia. Although chronic
hyperglycaemia is associated with an array of negative symptoms, acute
hyperglycaemia is not easily recognisable and minor symptoms may include
increased thirst and weakness or feeling tired (O'Connor et al. 2006).
Venous Capillary
Diabetes > 10.0 >11.0
IGT 6.7-9.9 7.8-11.0
Normal < 6.7 <7.8
Table 3. Whole blood (mmol/l) values, 2-h post- glucose load, for diagnosis of diabetes mellitus or impaired glucose tolerance (WHO, 1999).
The most likely cause of impaired glucose tolerance is insulin resistance; that is a
reduced cellular response to insulin despite its presence. The usual response to
insulin resistance is compensatory hyperinsulinaemia (Polonsky et al. 2000),
therefore hyperglycaemia and glucose intolerance do not occur until insulin
secretion becomes impaired (Seino et al. 2011). However, if too much insulin is
produced blood glucose levels may fall too low. Postprandial hypoglycaemia (PH)
is a term describing recurrent episodes of symptomatic hypoglycaemia occurring
within 4 hours after a high carbohydrate meal (or oral glucose load) in people who

do not have diabetes. It is thought to represent a consequence of excessive
insulin release triggered by a carbohydrate meal (Brun et al, 2000). Individuals with
PH often suffer from an associated adrenergic hormone response which is
responsible for the major symptoms of hypoglycaemia.
The boundaries between hypoglycaemia and normoglycaemia have been the
matter of debate and there are large individual differences in the threshold at which
symptoms occur (Blackman et al, 1990; Gonder-Frederick et al, 1994). Harris
(1924) first described PH and reported that symptoms of hypoglycaemia occurred
at blood glucose values below 3.9 mmol/l, however, the blood glucose value
defining hypoglycaemia has fluctuated since this time. It has been argued that
neuroglycopenia and its associated cognitive dysfunction precede adrenal
discharge and may occur at thresholds as high as 4mmol/l (De Feo et al, 1988). In
both IGT and PH a low GL diet is indicated to help maintain glycaemic control
(Brun et al, 2000; Wolever et al, 2002; Gellar and Nansel, 2009). The following
section reviews the evidence that an impaired ability to regulate postprandial
glucose levels, the result of IGT, PH or both, may result in cognitive deficits.
1.5.2 The effect of individual differences in glucoregulation on cognition.
1.5.2.1 Methods
Literature searches were conducted for RCT using PubMed, Psych Info, and
Google Scholar with keywords that included ‘glucose tolerance’, glucose
regulation’ or ‘glucoregulation’ and ‘cognitive performance’ or ‘memory’ or ‘mood’.
Only English-language articles or abstracts were retrieved. The search primarily
sought peer-reviewed publications, but some published dissertations were also
32

evaluated. A total of 24 studies met the inclusion criteria. Of these studies fifteen
related cognition to glucose tolerance in the absence of any further dietary
manipulation (Table 4) and nine examined cognition either during the OGTT or
following a subsequent glucose drink (Table 5). Six were longitudinal and the rest
were cross sectional. Given that evidence suggests glucose consumption may
affect the relationship between glucose tolerance and cognition (Awad et al, 2002;
Messier et al, 1999; Riby et al, 2008) studies which administer glucose during
testing are distinguished from those that do not and are discussed separately.
33

eo>
’530)
Q
5
5 =^ 03 O o
— CD ~o co® O m WC ^ 03 <D
■D Q- <D —3 => p O)— > — O O) > 0 OC .2 0 - .O 7C 0 X X_J £ X 3 3
0to0
D)OO
c - .£ a;3 0 02 co —CD TO CO C -0—I CD CO
5^■O’
"to
l ^? !o 7;
>■ CD
^ -S '§ - § CD
5 t = 0 ^ 1 )— CO CO° y CDLL O X
t l> 0 £O TJ C
— - * C CD CD CO CD Qj
~ a co c
s 5 5 B) O) O _ 0 C = g > X0 ° RJ LL U CD
(AO)C
"OC
C Z. . 2 CD Q> ~ o X C
C^ CDr D O
£
CD • -
o.£ t j i- cCD Q)
CD ! "
cCDEo$
— I— CD ^
TJ& s
5 1’ * EI o S -Sc l S o Q
'■C TJ CD CC l cd
^ I—
6 S
TJ0)
0)• L. 0O XOn E
TJ00
0X 00
L_c
0 0\__ C)0
CM0
LU
LU3 ,O
O 03X X
■ 0 0
o —
0cCDQ.
'o
CDXI— CD
CD_C
0coCDX0coCDO
ffi 0
c0oI—CDx
£ cLO CM
J??t T TJ
CDc.CD "q
(D "D
i - Offi -5?
CO03CD
0 £ CD
_ CD
OC 1_0 0£>+- 0
■ I £2
2 : 5Z co ^ .E $
cCDO
O
g g.£ c E £ 0 0
CC C£® I d
-> 3 o £ 0 > 0 ^ c/30 C/3
x So ^ 0 0 3 CD CD
CD 0 "B TJ ^> 0 Eto B t f f lo 0™ a>D) —C i - |JJ
LL £ jy)CO2 CO ^_ 0 s .2 K >; a.>- 5 X 3l— o o ^ * : £ D l J to 03 0 O 35 ^ CD o
0 3 0
0 > 0 ^0 rv' o l l3 C/3CD CD
E2
- n 00 LU 2 0 c/3 E = ■<=0 0
I|03 0 H
2 £ - | X 0
I - I - U . O
ro 03 03 0XL 0c/3CO 0
O —I ® I2 & ° 0 _0 o
c t m a
£00CD
0 ® o"0 '5)| CC J2t j £ 0 75£ >\ C/3 0
— X O
CD 0
1 2
0
0 il x -7
I cO LL 0 0 0 2 C/3 — 0 CD
^ O O) h-.E 0v10 ®
CL3
— CO2 3
H- 0
= tS Ol O
0 CDX^ w 0 0> t—
00>%
LU 0C/3 ■§
TJC00
_c"000
X
toTJ0 X P 3
O 5 t O
0 — O X
< =
00 CD
C
^ 'C0 «
1 s
T3C0O 0
E 0 0 c —0 >,X o X c
1 s” 0
rn ^ X C w p 0 0 -B .E O E 0 0 o 0 > I ^ co
0Q
CDo+—
■c H 0 CD
0 01 CD
CD
0 1—£ ^ X TJ O C
o roi l
QT JC0
<- Q° ■g CM -® 0 -D
00
CD
CD
' 5 2O H- 0
l i s
CD CDO03
xh -
t=CDO03LOr -
CDOo>10
>%TJ3
“ OE M"I ei= oTJ O£ £3 LL 1- COo ~ 03
c r o
0 3^ — CO ” ® > , CD l m
II CM ® C 0' CD
d 1 0 > E 0 o £ ^
*-■ T3
£ ®2 £ >*- 0 TJ CD£ o2 ^ o c 0 0
q: dc
0i_O r 0O£
0E c0
X03
V co B CO0 T 0 N-k—CD § 0k-£ Q X U)0>1 00 cTJ O _ 03 L_ 00 <2 0 E
LL0
.2 i rE 0 0 0 X 0 o 0 _0 0
O QX-Co 03 0
^ X
528 ■O’LO TJC
11 0 CD0 Xc_ 0 35 Ok.
TJ 0) X3 k-(1) 0C/3 x U)i- HO TJO0LL
L0E
OwL>
00 30
TJ
CO
5 - gE |
■t 0 T J CD£ o1-5o c 0 0
x cn
c0 2? o ^ cO 03 0 ® S c »*- 03 E0 11
: 0 0
£ O C o> 0 L=! 0 0
s i g S’
1=11® -x ^ 0" ■§ I S I I ,0 > 11 § CD CL ^ C ^ S
O 0 x £ *■> re< S
00 E 0 3 0 0 3
0 ^ X _;£ ro 0> 0
0 p0 o0 ° v CNJa3
0 - 0 o > oc0 _j
0

c0EEo
o
~ cd 0 0
c ? H ©
- n « | ? 8
T5 9 - 0 c3 =
l ! ^o
0 0 _2
P - 0 o
iG CD 0 X0 LU
0 0 > cP
2 c° .2
O 03 0 2 O 0
0 0 5 O
003C£c
c03OO
00oO 0 3 0 *03 —■2 5
ooX
TJ0XCD
w 00 0 -0
x .2 o '>IS ® ~5 0 .£ 0 .2*- ^0 o 2.2 TJ 0 3 0 X
^ E P 0 3 E11 0 2
TJ0
0 E
“S iX ©
H O^ ooE - *0 02 0 E x
^ 03 x oa3 £0 _98 '.£ > 3 > 03 0
X
o X rc L o r3 O 0 oX o 0
r 3 0c o TJ 0o o 0 n
‘EXo
0p:0
X000TJTJ
C3 Lr 0 0
TJ 0 X0k_ o 0 o0Xki—‘cX
Q>
XooE '0 O 0
0oEc_o0o3
TJ0
■O' 0 CM 0 c
2 5
TJ0 £% £ o 0
l - S ' S
« C - Ix 2 g* < 0 o
o 0 0 0 O) — 0 TJ C 030 o 2 o0 0 CL|-0 ^ 2P r0 |
X0k_a)>o 0
00> c:03 a)5 co —
T 0uc
LU 0if ) TJ
■+—roCJ
c •4—o O
00l_> .c00
Xoc>s0E 0 0 8 0 c 0 0
K oo SE0 TJ
00 d 0
X>0 Q_0 o ~
? ■-5 2 ? . *- O 5*4— <
"8 oC- M—0 l_±5 0 0 ^ 7 O
C03Oo
I—X 0 0 iS .2 c o oo c
TJ £
03
2 2 E 0 0 0E a03 ro
o-6 oo 0 -T 0
C/3 O !> <
0 lu£ 0 X T JE >
0 !_■ ° L0 . I—i_ 0 CD
T) 9 O0 2 7
-2 X P I 0 > 0
= 1 ® 0 8 |ffl a i V
0 .5 TJ
■* «= E
03C
‘i—3TJTJ
I c0 a30 E 0 0E 1/3 c 0 o 0 0 0
I s .0 c ~ -2 0
H i1/3 2 ®
5? si ! ’e £0 X 0 8 8 ®
co
oc
£ CM mV 9O p ® 03E o.2 O® 2 X o
0 _TJ O _ _0 -x o 2£ ° t: 8 c 2 ® — .2 2 Cl CD
00>
‘cXoo
«T3 7 t S. < 2 c m co
0LU O LO CO p ™
.2 TJ C C 3 0
•“ 0 O
8*1 O . 2
C < ^ O ~
2= 0 .03 •= 0
x H
■2 8 ? CD 0 ~1 ^ 0 o £0 ^
® n — “ 3 2I c g * -
® o E^ o .03 0 - TJ5 C CD 2 CD 2 ° CL CD
LL 0 Q_
0
0 >“ X X
_ c ^ co E c 0 0 0
_3 X
1^ "® CD -2
X 00 >
> 2?CD 2
= 1 0 <
LT)m
oa
TJC0
CD
CD
ll:
® 0 0 X
CD
co ro
8= £ 3 = 1 !0 0 ro 0 . 0 P 0 0 00 .2 i- 0 co □D f - < X -c
O =
f - -p
O Q 0 "2'i— *=O TO
P
U
0■c0Xo
01 I - 5: CD
fCDOxLOr^-
E2 X -LP X 0«2 CD > , >J
X jo C/3 0 t
0 o £ O
0X
l l3 l*“ 0 -o JO
0 2 0E £ > £0 0 c
TJ £ CD C O
O
m
s 850 c> CD
EoP X 0 CD
P 73 P 0X 0
0 L ->»
_ _ w 5 CM'T 3 > ZD C/3 CM
LOr -003 0
” £ co
i I **t j 0 r- 0 <P n-E co c
> E ~
e - gM— —TJ UJ 0 C
0
— TJ 730 P 0 £ 0 E
X 00
IX
3 ®: TJ - 0 0
x ^ 0 >“- & <5 CM N
rO X-O S ^ 00 3 £ 0 II 0
D£ N £/) TJ C E
-p X C0
I ^O 0^ PCD
0 5 .
r a ®
Ss1 si E
00CM X
CMh-TJ C 0 0
h - £
S 2 ^
0 TJ"C TJ CO 0 X X
Xc o 0 o
~0 :0 — : — > 0 0 ^ Q. I 0
IO CD O
Q 0 2i
0
Is3 CM
X 0
03 LO C X
XI ^ 02C 0
I"-ooCM
41

c©EEo
o
COo>cXc
cXoo
3 0
0 E
o 0X * --p re
m ®S f .
£ o
8 11 a
11 X O 3 32 X X «-5 §E .CL
0X 20 o
8 & B 2co x
0 0 V° - Z «
X O *“2 ^ 5'0 0 £
£■ P 0. i > £
X0 J9
. 9 - 0
.2 k. ^ £
.2 -SE TJ 0 0 re 55o re>>2 X oo c
81
c0X
co
'Exoo
TJ ^s i & £
. § i0 0 P. 0 o o E £
x re c Q
1 8 P "rere o 0
d
ok_X 0 0 01
~ "0 3 0
X o '0 £ 0 E
Q »
o _0 0 ^ CO ->0 ®V
LU X . C/3 O lC — 0 0
3 0 00 I -
ll: " O .Ti
_o x CD b CO CO < <
0 0 0 0
co00
H>oc03
0 ■*£ 0 0 I— o
* - 2 .C
x Q £ 0 - 0 c 0 Q.
'g'■c 0 Q_
_ O0 0
00 -C 0 X X ^a c s £ TJ 0 '■=
V 0 g g-0 E 8 c
3Or a - * 2CO 0
- 3 0 ra ?
1 1 ^ 2 0 ^ ® .2 £ x x x cm E
x o £ o 0 £E l«c —o .2 .5
31
I'i0 x
o 0 T“ >> H in
■D C C D 0 _r 0o re 05o .2 0
p 2 c m ro. .SO Q)
DC 0 £ . 2 E
re £ :0 xC 03re 7 7
x £ 7
re> 0
> « §
$ S
0 X
1g s•x 0 0 'o 3 o x 55re 55p 0
= CMo ^
q ; ®
s ire 0 x 555s CD2 x 0 i_
o_ 0k- £0 030 X 0 0
0ro 0 0 X 0 ~0 0— X
§ 73 o 0re 52 0 0 P 0 re h
3 -12 0c 0 -=
■ t re ©to = ^0 0 3 X 5 O
0_ 52 0C O r x — o £0 J k
£ § “ ■8 0 0 ^ 8 x c cm 3■n k k 0P O 0 0S ' s * ®0 X r X
: § b g g0 r = J2 P ® 3 >
• i E 0 £
re £
8 *052 lu re co2 ^
I?£ § 3 O O XJ
*4 00 re
I— x x ® x E£ . i0 ^ 2 0 0 0 CL 52
o V © 0
0 0 x re
0r
c0
X cr X0 0
00 —C3 02 0
X0
>0
0 £0 I I Iu CO
Xc0
0£ T j0 0 E 3 0 0 P re 0 ©
E0re 2X 0
O
■it™ 0 CDre © >~ 52 x0 8 £ m w -r—0 j=! 3
X X X
I— X I- 3CD 0s 8O 73 c 03 ■0 l : x > - 0 X LO£ co CM
o a
0 4—>c0X
’o
re Sx .2 > ^ ~ L- Ore „x rere E
° 2 co £
o 0 . 2 x
i fX c o oX c
coLO TJre £x 0:3 c co 0 _0
02 E ■S, 0 C/)
L+i. o
S t I 0 ^ c X X CO0 CO T -
0
7 CO c O O 0
CJ ™
0 £
8 5_3 _0 X,
-jjj CD0 o
£ * - t l 0 © o
Xr a x1 CM
2 ^ x c o o 0
’5 - =0 xk- >% 0 co
E 0
_ Eo
^ c x 0£ E0 0
x 0 0X $
0 £
0•*-«c0E0CO
Xc0
b0E0E0
X00
bOF
X 0LU E
x
■<- Xx £ c o 0 o 0 D -
£ re re 0 E to
£ 0
CM -J=co 5 cm E
00P c x £ 0
>> re0 0 £
cXo
- X °3 c £ 0 © ore £ ^ E 0 £0 0 3
J= x 0
P coO igre S re 5?TJ CMcreo ®
07 0
p 0 O 0o 0
2 ° ©©
£ £ - - 0 0 ^ 0 © c O P o3 re -P — £ 8 ra
■ o x c 0 0 .2■S ^ ‘EX X X E c o £ 0 0
o ^2
9 « “ "
IS
XoX 0
£ w 0 0 52 OJ p £ 0
re P 52 E >® £ a
r - O
CMA
O reCM 1-
® 3 o o
c 0 0 0 > o 0
r a ' ,
? CDh- > I—CD cO £
. re ^ cO E
T T 0X
C ®O ) £ O 0o IS) ~o 0re 0
I - E
O I c E0 LLi 0 CO
£10^ 2
Co
_ro o o(/> XW re re x
0 ) 2
c re"o g
co 50 _0
= 3 53 0
*-> CO 0 ) O
7 3 ^C 05o 73 0
0xEI
H ”o
o 0o
■ D cc 2 re 0
— o
0COo
S re+ * re■ BM 03 /0 — 0 c oJ
0 o1 0 8 £
1— £ CD 0z s4-r O OT 3£ 03

1.5.2.2 Glucose tolerance and cognition - longitudinal studies
Six studies were identified that provided longitudinal data (Table 4) all of which
used the WHO criteria for the identification of participants with glucose intolerance.
All studies examined episodic memory and the majority also measured attention,
semantic fluency and the MMSE. Only 1 study (Paile-Hyvarinen et al, 2009)
examined the effects of glucose tolerance on reaction times (RT) and working
memory and one other study also measured reasoning (Kumari and Marmot 2005).
Findings from these studies vary and do not provide consistent evidence of an
association between IGT and cognitive impairment. Three studies report no
association between IGT and cognition (Scott et al. 1998; Kumari and Marmot
2005; Paile-Hyvarinen et al. 2009). The remaining studies provide some evidence
that an association may exist in some but not all participants. Vanhanen et al.
(1998) provided clear evidence that IGT was associated with poorer mini-mental
state examination (MMSE) performance and poorer long-term verbal memory over
a 3.5 year period; however, the correlation was only significant in men. In contrast,
Kanaya et al. (2004) found after 4 years a major decline (25th percentile) in verbal
fluency in females with IGT when there were no differences at baseline. The
strength of these two studies is that GT was assessed at both baseline and follow
up, allowing any participants who were no longer classified as having IGT to be
removed from the analysis. This observation may explain the lack of association
found in other longitudinal studies, for example, Scott et al (1999) gave participants
an OGTT 3 years before cognitive tests were conducted. Similarly, Paile-
Hyvarinen et al. (2009) examined cognition 2 to 3 years after GT was measured.
Given that the reproducibility of an OGTT is open to question (Balion et al., 2007),

and that some participants may no longer have been considered as having IGT at
follow-up, further longitudinal research is required in which cognition and glucose
tolerance are assessed at both baseline and follow up. It is also worth noting that
although all studies were conducted in older samples, the studies which report an
association between cognition and IGT used participants that were a decade older
than the studies that report no relationship. It is possible that some interaction
occurs between the age of the subject and their giuco-regulatory status that
negatively impacts upon cognition.
1.5.2.3 Glucose tolerance and cognition - cross sectional studies
Eight studies were identified that considered the relationship between IGT and
cognition using a cross sectional design (Table 4). All studies gave a 75g OGTT
with the exception of Donohoe and Benton (2000) who gave a 50g OGTT and
Convit et al. (2003) who gave an intravenous GTT (0.3g/kg). Most studies used
the WHO criteria to distinguish those with and without IGT again Donohoe and
Benton (2000) were the exception in that they examined the predictive value of a
number of glucose tolerance indices. A range of cognitive domains were
considered including immediate and delayed episodic memory, semantic memory,
various tests of attention and the MMSE. Only 1 study examined the effect of IGT
on RT (Donohoe and Benton 2000) and one study considered effects on working
memory (Fuh et al. 2007).
Overall, three studies did not find any association between IGT and cognition. (Fuh
et al. 2007; Hiltunen et al. 2001; Kalmijn et al. 1995). These negative findings may
be explained by the use of the insensitive MMSE to assess cognitive function,

although Fuh et al (2007) did also administer other tests (Table 4). The MMSE is
useful for distinguishing clinical conditions such as dementia but is unlikely to be
sensitive enough to distinguish small differences in cognitive function that might be
expected between those with normal glucose tolerance (NGT) and those with IGT.
A further two studies only found significant associations between glucoregulatory
status and cognition in females. Rolandsson et al. (2008) reported that 2 hour post
OGTT levels were correlated with poorer episodic and semantic memory, but only
in women. Similarly, Lu et al. (2012) found that IGT and diabetes were related to
poorer performance on the MMSE but only in females. As mentioned the MMSE
may not be a reliable indicator of small differences so this latter finding should be
viewed tentatively. One further study (Donohoe and Benton, 2000) only studied
females in their sample. They found that those with the highest peak blood
glucose values performed worse on the vigilance task, however, it should be noted
that this was the only study to use a sample of young (average 22 years) females
and all had NGT according to the WHO criterion.
Two studies report that both older males and older females with poorer GT have
poorer cognition Vanhanen et al. (1997) found that those with the highest risk of
diabetes (the higher half of a median split of glucose values 2 hours after the
OGTT) had impaired performance on a variety of tests, compared with the low risk
group. Again these participants did not necessarily have IGT according to the
WHO criterion. Convit et al. (2003) reported that 2 hour glucose, fasting glucose
and AUC all correlated inversely with memory performance. It should be noted that
both Convit et al (2003) and Vanhanen et al (1997) did not consider the effect of
gender in their analysis it is therefore not clear if the association exists in females,
39

males or both. Interestingly, in contrast to the longitudinal studies, cross sectional
studies that found no significant relationship between IGT and cognition (Hiltunen
et al. 2001; Kalmijn et al. 1995) had slightly older samples than those reporting a
relationship (Vanhanen et al. 1997; Convit et al. 2003). It is possible that duration
of IGT is important rather than age per se; more research is needed to elucidate
the interactions between age, duration of IGT and cognition.
1.5.2.4 Glucose tolerance, cognition and glucose consumption
Nine studies have examined the effect of IGT on cognition either during the OGTT
or following a subsequent glucose drink (Table 5). This approach has its
advantages and disadvantages. On one hand it is possible that testing cognition
following the consumption of glucose may ameliorate any negative effects of IGT
and negate any differences in performance between those with or without IGT. On
the other hand under these circumstances prior nutrition is controlled. The primary
aim of most of these studies was to examine the effect of a glucose drink
compared to a placebo on measures of cognition and thus the impact of GT was
considered secondary. This has led to arbitrary definitions of GT that may or may
not reflect meaningful physiological differences. Such heterogeneity also makes
comparisons between studies difficult and hinders interpretation: therefore studies
that have used similar GT definitions are grouped together.
40

005c3c
00
05C
0E
S0E
0 *E
0i_0 TJ
ID 000 0
■q . Q .0 E
TJ 00 0
c -505 05 0 0 0 >- § 3
.£ OCD CD
c0'E05oo
ooCL6 £ 0 13e l _2 _005 005 (/)o 0in $0 I- jp CD ro1- 0 B fe £ ov£ CL
c0£l_0 ■ «ti &
- 1 0® "2 c ®
E o
g l IX « C
0
5 . 10 2 ^ 3_00 0'M
s 1 1
H “ O
«- o £ 2 o> >o .ts w CL § S
^ H- ^CD o ,_ E g 0 fc E o
3 TJ 0 L_005c3o i— 5 CD
l l l eo c
TJ .® o o cL. •*—'Q. DE® CD 0 ^ o *- o ®
0 ETJ 3 _ 0 3 MO I-
CD
3-o0L.0o>c3o><c
oE0E-o00 . £ H o CD — 0 ,
£ ^ 0 o 0 Si 0 0 0 a o 3£
CD .a CD £ CD 5
§ £M o2 E3 0 0 05 P C0 c ofe 05 £ 8 — 2 = ■£ 3 05 Q Lf—
£ ® 14—° -5w 0 o C1 0 ® ■ 3 0
c TJ O C 0 0* £
OE_ 0
d . e |
■ g l -2« ® 0 O a >
0■_o0CL £1 0 C® ^ • - io >t 30 ffl
TJ 00 O 0L—O 0 OOn -C _
O_3l_ 050
TJ0>0
0sz 05_C
JT c , .0 c c
C Q. 0 "l_OO 0n TJ
L-0 ’■e 0 03 0 0 CP05 CL 0 00u . C £ TJL .OO
0.c<■q0000
Q. 0 Jt0c 0 0
."X 0 0 0$ E Ic1 -
$0 L—0 0E T : c C0 0 0 0Q. CL L-i Q.‘o — _0 ‘o’■c0Q_
0O0L .
3050u .
'-c0Cl
0001— 0<15 X3
050 OTJ 00 CLE L.E 0
<PL- 00 0O On l_n IU
11 bL-r On t
00 CL305 O0 OO EO 03 JC05 0
>,L. tn0L- CLO TJO r
a . 0
005
TJ O0 c
0T3h-CD
05oin0oa. 0
m 0 in -Q 0 0 0 ^ o c o 3 p a _ 005 0 c■0 o .2O o TJ _o _3 0 CO cn 2
05oin0oa. 0£ ~ p 0C {/,in 0 h- -o 0 00 o o_305 0 0
CL0C
o ~O TJ
TJO <_> u _o _o 0CO 05 2
05oin0oa. 0£ ~ p 0 c 0o 0CO -Q0 0 0 3 o .£= E ® 8
Q.0C 0
„ O T 3_0 _3 0 CO 05 2
05Oin0o ..CL 0£ = P ®C 0o ®CD -Q0 0 0 3o .E 2 E^ o S 0 -2 2 CD 05
£ S300 — 0 0
cD5|o o00 0 •> -c O 5 t- ® 0
■ ® s C 3 CL ® TJw o 2 S -= ro~ 0 0 33 0 t ® 0 fe E ? o
0k_o •*—»
X> 45§ S1 £ E o0 o® "HTJ C55. v_•= O CL o 0 Cl c TJ .0 CT3 0 0 TJ< 05
0 C — 0
n ®P .£ •■§ E0 o is co3 E 0 oC *i=
0 0 o o 0 ® 0 05o . p 0
0 0 3 E0 br|*i> 0 0 CLO ® O > 3 .-X C
05 O O05
TJ 00 2 si-Q 05 0
0 0 OO "o2 2< Cl
0 0 0 00 0 _ 0 _ 00 0 .E 0 .£ 00 0 1- O L- 03 3 0 3 0 305 05-g 05 -5 0505 05 O 05 O 05in O ® O 0 Ocm in c/5 10 c/5 in
0szoo0(f)
tCDO05inr-
05o 88 c o .Eo L.3 ^ 01 0513 TJo 5 0 ^ in c/5 £
0-Coo0CO
oo0C/5
0 0
050 0 .£TJ TJ "OE E pE E i =
s s ” I i i2 0 0 >, o ®-r-. t: s 0 «-IE cr .2 .-x ®O O "m 05
0
TJk_CO
o0JDTJC0TJL_0
05
0 .S5 05 0C/5 Z O _l I—
s, uP' C OE _ 0 *- Eo
C o o W £ ’cl 3® 0 0 E ® ><
8 05 ® ® - E 0E -s 2 -® o E Ct i © p ®< ^ = O
CL *- 0 W
Co"E05ooETJC0"0o0
0 ^2 E 0® E
TJ 03 055= P TJ C — 0 -_2 0O t 3 O OLU LU k- U/ -I—»D_ > Q_ Q_ > > C/5
05 ^ c8 'E E og o c co 2
^ 0 C' o > O 0 E ‘cl 30 ® g E ® j<05.® ^£ ■ 3 0 S O L :| | S
0 30 0 ^ 3 E c1 o 80 H- E® 0 0 E n 30 >< 0
1 i0 0
* E
O
0
1 >1- £ TJ 0O o 0
TJC® TJ"E c o ro 5 m0 ^ > 00 ^ 3 = -? s 0 £ 0 m0 £ - ■— ro
TJ l . 0 05
TJ0E ^
3 TJ TJ
0 O = 2 < 05"0 ? > TJ
00>inM"
005 0 0 '00
CMCO
0 LO00
3 ^O C > 0^ . _ CM t >
inL- 1 LL CM0 CD CD h -
TJ c 0 M" C 0O 0
0 t—0 0
0L_0
CM 0 T—E
0CO h > . T_ > .
coc 0 0E CM 0 - 0 0
CO 05 0 10 0 >
0
0 05
TJ 0
0 ^ ® ^ ® 0
EO CM ■c LL N
t i 00
® 00 ><oJO oE S i
003 0 05
00 ^ 0S 0
0
0 ^
^ 05 £ 05O C-
^ S .® 80 S i 0
0 p-i_ 050 0500
® Oc o 0 oQ. CM0 S 'iC 0

wo>cxc
> > 2 bC 0 2 ro x c ' ' 0
l ' E
o
® ECO 0) 0 "
d}
c E §s 16 x 5 - e 13
5 O
5 £H-‘ X2 0> CO> o
o_3• p r o ®
o5
_coCP >
_0
<p "g co i= o > o >
2 x05 03
(P 'O - * O ^ O CO "X. > CO .23
lu ro .c
> CP X .>2 3 ro o
0 X
O - SO X
2 g 0
0 X2 ro
CP
cr " oCO c 2 0
3 E
0 cE ?0 O 0 $ o
s *
2 03 g_C003 2 .c: CO 5 X0) coCO ^ O ’q )ro3 Q 03 0" 0 -X X 0
S IS Ix ^ 0 0
ro ®° - I COro 5 •j= o CC3 ^ q. CD CO x - 0 03 «=
2 Xo o3 "O cr c 0 ro CO -L.0
X CD c| c o
Z - di ! ro -
0 o
$ 1
- Ic jo ” o 00 X I
o ro0 -g £ 0
c |r o - ^
1 2O JO0 g
ro co 03 ZX (/)0 0 o o3
0X I o
oa ‘S
X I _J5 ro
■c o 0 0
5 £ " 5 = Pre «•* /—
CD
2 x ro 0 ■5 ^
0 0 >- x
0ro
xL-0>
X £ Co ro o CL -o
coo
ro $ 0
> . c
0 °O 35
- * X0 o 2 o c ° - o 0o o5 E0 x c 00 £ o £ 0 o *- t 0 0X CL t ! CO£ 2
. ro 3
2 g>0 £
£ 0 o t $ ®0 ®
X C X
x ro 0 x >o • -
i f— o0 X 0o ro o
_3O)
0ocro 0c
o
X 2 2
O ^ O )O C- 0C 0 L£ I— 1_i= o 0 „ ro ♦; t!
J5 x J5 0H 3 ■“2 03 _ ro 0 c0 £ o
0ocroI—
_03O
00Oo
_303
roE0 c1
I—CDZ
0 0 -*—»0ocro1—_0o
00oo
_DO)
I - I— CD O
Co
'EU )oo
co
0ocre
0xf -O
0c
EL_00Xo
X0030ro ■ •> 0> 0
< .9 O x 0 . .E
0x
JO -qcro>
0 >
_0
0 -J
8 '03 C
x C 0 = ^ 3 O 0 > C 0 ^
C\T
00o
Xc
30c c oo2c o
> = 0= s; cm ~0O CO
OXcro
oo_303 03 ~ 0 0 2
2 Q. ^ 0 in cl
0 0
< .9 O x
30_C
0" ° 0 *0 O CPro jo o> ro
x 0
o >0
0 o c ro
ro 0 > '0
0
0 0
2 o o o ro 0
□ . . E P ^ c o
0 0 rou.ro cc 0 2 2 roQ. X _ 0 ro cro 'Ero S
co 0
Eo
I s§1',4- 03r o o
ro ^S 'x
ro DC
x 0 0ro -o
> ro roo 5 x
x
1- £
Q. JO 3
OO g o 2C\l 03 03
t=CDO03in
03o 8
8 1 o o32 « ro03 Q x
o ’ ro gin co 2
CDO03
LO1 -
> .roL- X
O0 | 0
00 ro
O O in0 x 0 r'-3 ro >03 -g 'c t=03 ro 0 co
ro0 CD
m co 0 O
0JO
co0
03 CP
o0 C
1 ^o E CD ro co -g E ceX 03 73
■c 2 o < Q ^
xcro
x
0 u .
xcro0ro
x0EE
I ?0 ro - $ 0 3 ^
X
oXI ^ X ro>% - — CO
CO Q x
x ^ ro x 003 sc£ _ro ro cp
CL x
xcro0rox0EE
o ro 2 roO p , — .ro £ -o0 0 0 1- 1- > \o 3 co,® 03 QJ
LL U_ X
03.Eo 0C JO 0 *- 3 Cc r Op 35=
16 W % ro <- ±3E g | 0 E oP 3 ro
2 z 0
^ 0 0i - S X 0 0 J-
> -1 O
~ 0 ^ 2 O c _ o o 01 4
I *q gO CD
| 0 fc L -
2 ^ •o o
2 ® ro o x p
CO — 0
ro d x 0
CO
. ro
o
E E
x ^ CO o
■S, E03 pb S
.03 0 LL p
0 2g- 0 E E 0 c O .E
10—ro 0 o ro _j xo = °
- > 8 0ro b o x 0 0 w a: > 3
2 x £ 0 0 £ x co
Li- >» *-_ C 0 _ ;ro 2 m■E E E 80 0 3 0
> 2 z q :
Xc
'oc0
ro0 x 2 0M- >O -
0 2 2 t r 0 ro ^ l l o ro o c 3 W 5 . 2
S ro
E 2 0 .52 0
c o— o
ro ro — ^ ro DC ro ro 0~ ro g ro03 0 0 x
0
0COoo
J 3
U )
~GCre
0woo
_ 3
D )
IT)_ 0
^ 2re
H
S ® •50 x 0
5 8 5:> ® xi n LL CM
S 0 Lr> co
03 co ro
cro0 -r- E CM £- 0 CO
■M" O) 01 - ro > .
® j rro cm 0 pi, 0
ro JT
'00
IGT
-im
pa
ire
d
glu
co
se
to
lera
nc
e,
DM
-dia
be
tes
m
ell
itu
s,
MM
SE
-min
i m
en
tal
sta
te
ex
am
ina
tio
n,
IVG
TT
- in
tra
ve
no
us
g
luc
os
e
tole
ran
ce
te
st.

Riby et al. (2008), Messier et al. (1997; 1999; 2003) and Craft et al. (1994) all
defined glucose tolerance as glucose at 55-75 minutes minus fasting glucose, and
used a median split to differentiate better and poor glucoregulators. Those with the
largest increase in blood glucose were considered poorer regulators. All these
studies reported that participants with poorer GT performed worse on at least one
test, most often memory. However, how such a measure relates to other measures
of GT should be considered. For example, in the study by Messier et al (1997)
examination of the means suggested that those categorised as poorer GT actually
had lower fasting levels, leading to their incorrect classification: that is those with
lower fasting glucose may have artificially appeared to have the greatest increase
when really after 60 minutes their glucose may have still been lower than others
who had higher fasting glucose levels. All these studies employed sensitive tests
of various aspects of memory (declarative, logical, immediate and delayed verbal
memory) which may explain why effects were reported when they had not been for
the IGT studies.
Interestingly, both Riby et al. (2008), in middle aged adults, and Messier et al
(1997) in older adults, report that glucose improved performance only in those who
had better glucose regulation. On the other hand Messier et al (1999), in a sample
of undergraduates, and Messier et al (2003) in older adults, found that that glucose
improved performance only in those classified as poor glucoregulators. It is
possible that these discrepancies arise due to differences in the way of classifying
participants as having better or poorer GT. Craft et al (1994) found that drinking
glucose, rather than a placebo, improved memory in older men with better but not
poorer GT. However, glucose also improved the memory of younger men with

poorer GT but decreased the performance of younger men with better GT. It is
interesting is that older men with better GT, had GT comparable to younger men
with poorer GT; thus there could be an optimal range of GT within which glucose
has a facilitatory effect. Age may also have been an important moderator in Craft
et als(1994) effects.
Kaplan et al (2000), in a sample of older adults, used a regression analysis to
determine whether glycaemic area under the curve (AUC), B cell function or fasting
glucose levels predicted cognitive performance. Poorer glucose tolerance, as
defined by a higher AUC, was associated with poorer memory, a higher AUC was
related to a greater improvement in cognition from the placebo condition to the
glucose condition, supporting the view that those with poorer GT may benefit more
greatly from glucose. However, it should be noted that there were no differences
between placebo and glucose condition and no interactions between treatment and
glucoregulatory status when data were considered using ANOVA. Given this
inconsistency these findings should be taken tentatively.
Messier et al. (2010), in older adults, and Messier et al. (2011), in young adults,
also examined a number of GT indices, this time using principal component
analysis (PCA) to determine meaningful clusters. These clusters were then
entered into a regression equation to determine which factors best predicted
cognition. In both studies higher ‘evoked glucose levels’; that is, those that
experienced a greater rise in blood glucose after a drink had poorer episodic
memory (Messier et al. 2011) working memory and executive functioning (Messier
44

et al 2010). Neither study showed any facilitative effect of glucose relative to
placebo in better or poorer glucoregultors.
Awad et al. (2002), in a sample of undergraduates, found that nine indices of
glucose tolerance, all representatives of higher plasma glucose levels, were
related to cognition. Poorer glucoregulators had poorer immediate and delayed
paragraph recall and worse immediate word list recall after both glucose and
saccharin consumption. Reconstruction recall was the only task in which glucose
improved the worst regulators performance; there were no effects of glucose on
better regulators.
1.5.2.5 Discussion and conclusions.
Overall, the studies that have used measures of GT within a normal range provide
strong evidence of an association between GT and cognition. These studies also
show that cognition may deteriorate at very early stages of poor GT, before
individuals meet the WHO criterion for IGT. Interestingly, memory seems to be the
cognitive domain most affected by decrements in GT (Messier et al. 1997; 1999;
2010; 2011; Awad et al. 2002; Kaplan et al. 2000; Riby et al. 2008). There is also
some evidence that glucose may facilitate cognition, particularly in those with
poorer gluco-regulation (Awad et al. 2002; Kaplan et al. 2000; Craft et al. 1994;
Messier et al. 1999; 2003) although some studies have reported no effect (Messier
et al. 2010; 2011) and others that there was a negative effect of drinking glucose
(Messier et al. 1997). The research also shows that a wide range of GT indices
may be related to cognitive performance; however, there is a need for systematic
identification of which parameters are best associated with cognition. Such an
45

attempt may help to identify the mechanisms underlying the relationship between
GT and cognition.
There is a discrepancy between those studies that have considered the
relationship between poor GT and cognition using the WHO criterion to categorise
participants as having IGT and those that have considered GT using alternative
definitions, many of which fall within the normal GT range. As it is likely that the
IGT (WHO criterion) studies have recruited participants with more severe levels of
poor glucose tolerance than the NGT studies, it may be expected that there would
be a stronger relationship between poor GT and cognition in these studies
however, this was not observed. Some of this conflict may be caused by the types
of cognitive tests used, with the IGT studies more often using tests which are
unlikely to be sensitive enough to detect the small differences, for example, the
MMSE. Another explanation may be the number of indices used to define GT in
NGT studies (Table 5). Many studies used a few indices to determine which
measure best correlated with cognition and this approach is more likely to produce
significant correlations just by chance. This problem should be weighed against the
need tp identify which indices are important but indices should be chosen using
insight into the mechanisms that may underlie each index. Despite the large
number of indices used to date it is still not possible to identify which is the most
strongly related to cognition and hence more research is needed.
46

1.6. A systematic review of the effect of energy drinks, cognition and mood.
1.6.1 Caffeine, energy drinks and postprandial glycaemia.
Chronically impaired glucose intolerance develops over time; however, acute
changes in glucose tolerance also occur. For example, as previously discussed
the consumption of low GL foods has been shown to attenuate blood glucose
response during the postprandial period. In addition, positive metabolic effects can
persist well beyond this period. One of these is known as the “second-meal effect,”
whereby a previous meal affects the glycaemic response to a subsequent meal
(Jenkins et al. 1981; Nilsson et al. 2007). In addition, these acute changes in GT
may influence cognition (Lamport et al. 2011). In a similar fashion, consuming
drinks that contain caffeine reduces glucose tolerance and insulin sensitivity, as
assessed by postprandial plasma glucose concentrations (Dekker et al. 2007;
Graham et al 2001; Robinson et al 2004; Petrie et al 2004). Interestingly, alkaloid
caffeine such as that found in energy drinks (ED) may have a more pronounced
effect on blood glucose control than caffeinated coffee. For example, Battram et al
(2006) compared the effects of alkaloid caffeine, caffeinated coffee, and
decaffeinated coffee when given before an oral glucose tolerance test and found
that alkaloid caffeine elicited a 50% greater glucose area under the curve (AUC)
than placebo, whereas the glucose AUC did not differ between the caffeinated
coffee and placebo treatments.
Also noteworthy is that the effect of caffeine on glucose tolerance may be more
pronounced when it is taken with a high rather than a low GL meal. For example,
Moisey et al (2007) investigated the effect of caffeinated coffee (5mg/kg caffeine),
compared to decaffeinated coffee, given with either a high (GL 65.75) or a low
47

glycaemic load (GL 30.75) meal. They found that caffeinated coffee was
associated with a larger area under the curve (AUC) for both blood glucose and
insulin, suggesting significantly impaired glucose management after the
consumption of caffeine. Insulin sensitivity was also significantly reduced when
caffeine was taken with a high GL meal but not when it was taken with a low GL
meal. These findings raise particular concerns regarding the consumption of
caffeinated ED that typically contain a significant quantity of high glycaemic
carbohydrate. Given that poorer glucose tolerance may be related to declines in
cognitive performance, as previously discussed, there is reason to suspect a
detrimental effect of consuming caffeine and glucose simultaneously. The
following section systematically reviews the evidence relating to the psychological
effects of the co-consumption of high GL carbohydrates and caffeine in the form of
EDs. It will address the cognitive effects of ‘whole’ EDs followed by a review of
the studies that examined the interaction between individual components; glucose
and caffeine.
1.6.2 Energy drinks cognition and mood.
During the last decade the consumption of EDs has grown exponentially (Reissig
et al. 2009), with the claim that the combinations of ingredients can improve mood
and cognitive performance (Alford et al. 2001). A typical energy drink contains a
number of different ingredients, including but not limited to, glucose/sucrose and
caffeine. There is a literature assessing the effects of these individual constituents
(e.g. Smith 2002; Benton, 2002) and many randomized, placebo-controlled,
crossover studies have documented the effectiveness of EDs as cognitive aids
(Tables 6 -9). However, the predominant experimental design used to establish
48

the evidence-based support for EDs has involved a drink and placebo comparison,
although this design does not make it possible to ascribe any positive effects to a
single ingredient or to an interaction between ingredients. Recent reviews have
concluded that caffeine is the ingredient that is responsible for the majority of EDs
effects (McLellan and Lieberman 2012; van den Eynde et al. 2008). However,
there is evidence that the context in which caffeine is consumed may modulate its
effects. Caffeine may have different effects depending on whether it is consumed
with a protein or a carbohydrate based meal (Smith et al. 1994a,b). As mentioned
studies have demonstrated that an acute dose of caffeine can impair glucose
tolerance in healthy individuals (Pizziol et al. 1998) and by modifying
gastrointestinal hormone secretion altering the pattern of glucose uptake (Johnston
et al. 2003). There is a need to systematically examine the interaction between
ingredients.
1.6.2.1 Methods
For the present review, literature searches were conducted for RCT using Medline,
Google ‘scholar’, Cochrane Library, Embase, psychlNFO, and PubMed with
keywords that included ‘caffeine’, ‘glucose’, ‘energy drink’, ‘Red Bull’ and ‘cognitive
performance’ or ‘mood’. Only English-language articles or abstracts were retrieved.
The search primarily sought peer-reviewed publications, but some published
dissertations were also evaluated. Studies were included or excluded based on the
following criteria.
49

Inclusion/exclusion criteria
• Studies were included that investigated the effects of a combination of
caffeine and carbohydrate on cognition and mood.
• Studies that considered the effect of only caffeine or only glucose were
excluded.
• Studies examining the effect of a combination of carbohydrate and caffeine
on neurophysiological measures were also excluded unless
cognitive/subjective effects were simultaneously considered.
• Studies examining the effect of a combination of carbohydrate and caffeine
on physical performance were excluded. Similarly, given the confounding
influence of physical activity, studies examining effects on mood during/after
exercise were not included.
• In addition, studies looking at an interaction between energy drinks and
alcohol were excluded.
• Only studies examining affects in healthy adults were included.
• Survey type studies were excluded.
Figure 3 shows the selection process. A total of 17 studies met the inclusion
criteria. Of these 11 examined the effect of ‘whole’ EDs (a combination of caffeine
and carbohydrate) on subjective measures of mood and 12 considered cognition.
A further 5 studies examined the effect of the interaction between caffeine and
glucose on both cognitive performance and mood.
50

Controlled trials meeting inclusion criteria n=17
Potentially relevant articles and abstract retrieved from electronic databases (Medline, Google ‘scholar’, Cochrane Library,Embase, PubMed and psychlNFO) and screened n= 226 Duplicate publication n=16
Government report n = 6 Cardiovascular risk factors n= 4 Locomotor activity n= 7 Irrelevant to current study n=70 Inappropriate outcome measure n=68 Inappropriate study design n=38
Cross sectional n=28 Review n=10
Excluded n=209
Figure 3. Flow diagram of the screening process, n - number.
1.6.2.2 The psychological effect of ‘whole’ EDs.
Table 6 lists studies that have determined the subjective effects of ‘whole’ EDs
containing a combination of glucose, caffeine and other potentially psychoactive
substances. Eight studies report that EDs when compared with placebo, within the
first hour after drinking, either reduce mental fatigue (Kennedy and Scholey 2004a;
2004b; Howard and Marczinski 2010) or increase alertness (Warburton et al.
2001a; 2001b), energetic arousal (Smit and Rogers 2002; Smit et al. 2004a) and
stimulation (Howard and Marczinski 2010). However, one reported no affect on
either alertness or arousal, although the higher glucose/lower caffeine drink did
reduce stress and anxiety (Sunram-Lea et al 2012). The two final studies
examined only a single VAS; ‘mood’, and reported that participants were in a better

mood after they drank an ED rather than a carbonated mineral water. However,
the comparison to water means that it is possible that the effects could reflect
expectations associated with the drink.
52

3COa>£
>a;
Q_ ros ' s
l l3ro £ V) >CL
ro "g tn ® 3 O
TJ0)30)>ro
c*l_TJ_TO
O-E Q-
TJro3ro>ro
cTJroo
roro E —° m "f== ro cQ) O 'i-p + -oro -Q ro c c cc
LU ro ro
5 Q- ■— • c ■p V
O .!= TJ 15ro oj
X TJ
ro oA ®O TJ
co>Q.3Ol _
O’E1
CO CO
— E cB «3 +
I ICO TJ
CO>O)E
OJECOCO
d)Eco
ro -p 3 .E
•E-oro o X c ro -Qc So ro S 0.
o■Orooro
TJoo
ro3DJ
3pro c1 1S CD
TJCro
ro" oE ® E ro o" c ro co ro _ o
CD LO OJ
roc
1-1 ro E ro lo CO LO
o c
V eo o ro co co| d ? ro o oCD t— LO
O c
T eo o ro co coi d ? ro o o
00 T - LO
ro Xo I® 5 ro o c tj 0 ro
ro ~ o ro& © E»-c ro o
ro
TJCroco
h - x m t j
ro0 co > < O >
o
8 ®< 8 o c o ^ro ro ^ | o c „ Q.,® E "P
in 0
ro3, ro
roszo3CP ®ro ro
co ®
ro ro3 3OJ OJ
ro ro4— H—
CO roc cro roE E
CO CO< <> >
r o
-- E® 3 (0 c
o § o
ro
3 ) E co
ro cd
CNI
” = 2 * 5 ; roro DJ
g g - Sro ■'i ro E s q . lo a lo O
ll. roLO DJ
l l roCD OJ
© - Lro
ro t-
roO) ■
\k S o d
0 ^ 0 t- cm
ro io CJJ cm ro .
0 00co T_
CO romCO 0TJ M— 0c 0 3ro DJ DJroc
[2
bCDTt
<4—OOJ
t t 00COCJ CM CO
ro TJ0 CO c_
DJ0 ron
E 3 a>r
CO DJ hj00 n t t
LUT_ DJ O
roco tt roCM CM >
3a.’ECO
zs.oCOCD
E g lo X i"~ O
roco
S i
Q) OJ _ C LO> ■>- r>-
- i " - s l i S mLO E 0 ^ <M O ifc ^
ro .t- t- o CM
TJroroco.aroo
CD
CM CM
E o o -£JIO © CM E _ ro
cm a.
ro ro ro> > >ro ro ro
~— 1 '— '
3 3 "5 c r-TS -D s1 ®Cl) ro c
TJ c TJ c ^ 09> -CD 2 ro 2 £
8^ D)
E D> E ®> E Eco E co E T f S~■r-' ^ cd ^ LO CO^ LO ^ ^ 4— co
CM OJ CO T-
oS iroo
_ ro
Q.
ECOcd
ro3COa.roa
DJ 0
E so £
§ 87 ?ro 2c 3
0COTJcrorocOJteroCJ
0)0 C/J
nUJ CJb 3
co OJCO H—
O4— DJ
oS iroo
_ro
a_ro
_o3ro>CM
c DJ 0 C
_ I CM oj
I C TJ 3P ro si
O CO O CM
I !§> CO E J®° ro ‘EO > CO L O O
ro ■=CTJ£ 0 £DJ C DJ'c '0 C *- <£- k-® m ® > ® > O O O
O 0 . c*-* CO
5 2
ro ror o —
- m- •ti oE S
zsCOc
CO CMoCM
> .0n M- >>
- S o t )Tj -L- f—.Cro CO S C O
■q "M- 2 O TJ o O D ® r\i ■*-'
co S c o

3CAa>DC
z n
E ^ _ ■a j *
r - ~—- C ZtZ TJ "P C CD + ™ TJ '—' "O CD Q)+ ® . >
t co m_ro _ro is < O <
z cc
TJ
"C ^.E 0U. -I—*
I ?■d o ro 3 < 0
TJ S '+ .ETJ ■©
ro 0 >ro
O <
roE E ro 3(A cro lo CD D"
ro~ E ro cCA cro ld
CD tj-
ro3 CACA JD> ro
°0 co
TJ 0ro 3 -J D) TJ -2c ro o c CD <
ro3 roro .©
> © °
0 CO TJ 0ro 3 —j o> TJ .2 c ro o c CD <
CAw a,
’I |H— J CO c
o go
&&3 0 O 0 C\J te j'J'o roA O TJ
3 0 O 0C\l ^1X1 o ro A O TJ
8)8S 1CM 00 CM t-
ro TfO) CMS iO 00 CM -r-
fc 5S'- 0 ^ 05ro
3Q.
CCO
^ roO) CAE °C O O 3 CO
ZL CJ)
•i ETJ O03 ^“ CD
O © LD .E CM ^Xs ro
OJ
© g> ro" © E ro■k lo 2© ^ 3o 10 roP | Ero ID3g t e ■
— roCJ) o CM
cE •§
cd © EE > 3LD OJ >
C0 E §> CD io c c -r_E id ' ro CD
'5 .Eo j E E 2
ID ’>
LDOooTJcro CM CM ■«- CD CD
r O)CM E Ed
O) ro CM ID O)TJ b > CD CM
OJE
OroCJ
LOS--
OJE
cF
LMTJC
s .
%
X )L_J LO ro ro ZtL
CDi_n CM CM
’> c C
CDTJ
oCAro
CL)c
d
lo'CJ)E
oro" r
i—TJO)
NOo
ro'CA
bro
LUC
ID O)F
CDC
Eo3
—Ioo3
>OJ
bro
O
cd'CDCM I t
ro
LDCM
CM OJ E > m CM o T“
O)
E a )
§ E- LO
ro cm
O) E LDE 5X o ©o ra e
'§ o '®
3 O 3 O) O_ **= -=: ro
c0' ’© ca .© o c o o j
8 Eg °
lo 3
cm § 0 .E
o ? o t2 oO) ID
LOooo
O) TJE c
roID CMCDCD
CDc CM
C E CD
E LD ro cro CD > E> C O) roo j E b >b ro LO OJID > V “ b
CD
£ g>ro ^ o E0 oj - o 0)55 © °S ' CM O CDk ld .e -O 0CO 0- O) C1 CA E ”
J . O O O3 o LO roTJ W 8 £
S L? § O
CM CM OJT-
3 O CM
"o j CD
CACOLL
0 1 c CD1 .E
TJ © O ‘{jJ o ro
LL O
0 1 c CD1 .E
TJ ©° ^ o roLL O
0 1 c ro1 .E
t j © °o ro
LL O
o 0-C — — CO52
c0
= p "I") . ■«“ >>1 - O TJ ro © 0 3
ro CM CO
ct§
-E —- o -o ro © 0 ^5 ro Sco
— o© o T~ ■28 > £ - - 3<C CD "cd
T j-cr>

3(A0)DC
(ACo"(ACACDCA—CA0)I-
CAw 0)I |<4— 31= CAco c U O o
3Q.’Eco
O 0 s. —X ro
LL TJ °LD 0 CO^ S’ - Id ro’ 00
0_c
COoO)Eo00
r a t55 ©CM OLD .ECD g 3© E o o o ^
ra o id o’ 3
TJCCO
gso '5CD . CD© 5 E 55 ro4-> O
? iO 3 O © CM° — Xit- ra CD
0 1c CD1 .E
TJ ©° ^ o © ll O
— o© O CM
T3 O v b CM
< CO w
1 ? P COb $C CALU >
raoxoc
j*:c
© 3 © S> CA CA >> CA ^ a: c c X ‘l- TJ TJE g o •=
' LD 0© ^ X ’F j.roE +. o o
> E S■ TJXT roTJ X0 roo CD DD DC
- iE g tj £ o q o oLD O JQ
ro = >CO© £ C S~
£
TJ C CO
0 CO E s - .3 00' •§ CA CO E ro _ o CD co OJ
0raL—®cCA ®
'CA - >CO -Q£ © ro —
0 raL_0
_ C3 ©© ■ S 0 - - TJr- © . t ’D 0
ro O ■o © - £ t~ TJ 8 g ro | 5
ro| ^ © © | ©< © © > ro ro rao ^ 2 © J ® 5D. ro 0 3, co o i5
co CD t - 0 ID
r a . ;> co I o ^O )
B gro oCA _3a !l l£ > *= TJ
CCO
OJ 0I §^ 3
EoID
— 0 ra t
0CA CA CO o o0 3ra
it © ro — o Q.ra ro E c — id 2 E s- ro o.—- 3 IDco ra cm
E0LDCM1 ra
i_ c0 XCO
£0Z
■7- ID
TJE © — - ro ^E o o
CD X S
j*:c
OJl_0cLUIQLU
o'XI0oCO
_0CO0 ca03OJ_o0c003CA>1
CD<>■rioo
co(AC
O)L.0)c
LUH-o(/>oa>PCD0
.C)4->OCCOU)—ICA0>_c00B3*->
c o
cd_0n0
mID)

Although most often considered for their subjective benefits, energy drinks have
also been acknowledged to benefit cognitive performance (Kim, 2003). Ten out of
twelve studies presented in Table 7 reported improvements in tasks that involved
an element of RT including: simple RT (Smit et al. 2004a; Seidl et al, 2000; Smit
and Rogers, 2002), choice RT (Alford et al. 2000) sustained attention RT (Smit et
al. 2004a; Sunram-Lea et al 2012; Warburton et al. 2001; Smit and Rogers, 2002),
RT on a behavioral control task (Howard and Marcizinski, 2010) and RT on a
reasoning task (Warburton et al. 2001). Two studies reported effects on the
accuracy of attention (Kennedy and Scholey 2004a; 2004b), one reported
improvements in delayed word recall (Sunram-Lea et al. 2012) and one reported
benefits to the accuracy of working memory (Kennedy and Scholey, 2004a).
However, it should be noted that whereas every study had some measure of RT,
other domains were tested less frequently. For example, episodic memory was
only considered 50% of the time and working memory was only measured in one
study (Kennedy and Scholey 2004a).
Both mood and cognition effects were considered during the early postprandial
period that ranged from 3 minutes post consumption (Smit and Rodgers 2002) to
90 minutes after a drink (Smit et al. 2004a). Longer term effects have not been
considered.

iIIIItIII
060C0
CDO03Eo
0~COoo_o03ooin+
03E o oa 00
<U.E 2CD ^
CDE ^ o^ 3% ® 0 ^ §-E 10CD '
cCD
CD SS 8
"D0) jT' > C L£ £Z 0 .t;Q £
-id CO 0ro <fl — o D-S 0 1 = E °« 5 X 05~ O) c
10 03st=_Q Csj
.5 o roCO
t£jx:C/3_0OCDOc
oCD ^"O j£s -go
+ -*.* - c=O 'd 0 "Oi_o w O 0
0 i ,
1 IEc CD"o .E cz oC/3
0 0C£ _
9= "> 0ce >
+ -* <zO 'd 0 T3k_
O w O 030 +,
ISCDC
d c 0 o. C/3, 0
0(£ —0 = 2> 0 a: >
"D 0 0 O >. 'J= 0 0 0 E 5 E 0 0.2 6 TJ 0 =E 0 E o E 0
03Ho"b
u. £0 b ^*2 1 W0 j2— i— r:d>-2 0
■£ = 3 o 0 '■=W O CO aj c -Q (D 0 3 1: 0 ( 0
VCO0 O
l_O C03 O1O OC1
0L_O
O O0 3 >
"O 0a> JZD 0
OJO
CDd‘coc/3
co
£ *1O 03E o
0 0 0 03 E £
n "0 Id 0 — ■£•£? 0> 0 0 Q_o: > > co
cCD 0.E > *£f - t - C
0 §C/3 E0 0 00 0
~ 0 0 09= m— 1— Cu> 0 0 Q.oc: > > co
0c'0id0oCDEo
0“COoo_D0303OIO
-oC0
_oCD
03in0cooo
_o_030COoo 0 o cH= 003 ‘E in 0
CM °d 01T— t^ o CM 00
0c0id0o03ECDin0>0
0JOT3 0 1—CD
1 00
0c'0&0o03ECM
030>0
Z3JO•o0i_O)
ECDCO
CM
0c'0i t :0oCDEn-CDCO
0>0
oJO■O 0 \_CD
±£L
E■sfin
co
oJO0o_0CL03
ECDCO
in
03
0 3E
E in00
CMuo
CD 0'0“c_C '01_ t=ZJ 00 0
03 0 3E
£ 000
'1 0~j« ; c_c 0
0~o 003 0E c
0 0
in 03
CD E DO ID
= 8E 60 "O> g05 CME m
c_ E o
COCMCME
3 cm
inc
0 m CO 0 O
0
>03
CM 0
^ "03
t C 03 O 03 c0 E co c m
E ° "i.ID O g .
c tMN. c ’E “§ ® s i§ E t |O — m0 o 05 .-2 03 m b >
>CDEin
CMm
aT -E co e
8 3 0 > ° > 03
E Ec CM^ dCD -03 £
T3 O 0 0 N o§ 1
0—1 O -— - CO CM 0
00C'E0>03EID 0T s=O 0 _ om 05
E cm^ CM > T3
^ 0
O)03 EE W f ; cm§ ID<° 00' .E c 0 •iz ib zj 0 0 o 003
CDmCE0>03EID
C'o0
03Einooo■oc0CMCD
03 CO ~
J - o•E 005 0“
oc oID O
o cO 03
8 £
e °
C ID o DJ CD O Cin 05 m
- oT3 jo 03 O
! § S 3CM 0
^ “03
CM o
03 -E«3 030 d O t0 o 03 in
>03EinT—in co 0
E CDCD C
'5 E03 0E >
CM
OJO0o_0Cl
00
003DCO
CM
00
_J ^
E 5 0 2 fe ^O
C/3 0
V)c'N o ' O0 o
^ CM
0
0co
■£ O "O0 0 0
0co"C T—
E * - >>±1 0 X 3 0 O O ^ CM CO

cX
. >. S' E
8 I13 -i^ co E >
IsCO X > 0 = tr
S ix0 CO
01 0
+ c
"ro 00 -b£ 0 0X o r~> 0 ^ o
00 3TO Cg £_ o
1 IL_TJ ^
i ffc?_0Q-0_E > co o:
_c*L_
E 0i_ 0 X —1o £ , 0-*-' CO ^ 0I— CM(T Q
00c
_. o■0 00 -b£ 0 0X O
1 §g o
X0>%_00
I ? ■s 5O
> > :
00Ho— O 0
2-— E E ■i > 0 ECO OH S z o
O $LU 0111 c tM- o W o - *-- C 0 b 0 X0 t c Sro 0
^CO 0 75 0 0 0
f - CM to oh q o
oom
O)inCM 03d E
0" § § ® b |0 i-S 2T - 03CM E
£8.E o0 T“id0 o 0 *=: 03 CO
I - i 00 03
1 E — o o in
03inCM 03d E 0" og <°b I0 '1-
s i
0co -*—*o 0 o c ok_o o_ _D
CM~ 03 03
CDX0
0 CO O
OH o
T- 03 CM E
£8.E o0 T-td -0 o 00 3 '00
1 -S00 03I E
— o o m
03inCM 03d E 0" og 0b I0 1-s it— 03CM E m nf o -o d o c .E o 0 0 t-
CM
a: oCM 03 03
d
■a>,03l_0d0
■>.EEnxX0d000
0 o "m0 £03 CO >
E g o0 — 0 CO 03 O1 E o ”— 0 0 =o CD o 01:0 m 0 O_ 0 o 1=X c/3 !r0 0 0 P01 o o <
^ _ o _o ^CM 03 03 CO
Xd00COoO0 E03 o CO ID D '=-
0 -b d 0
0 080 O r *> —>
0 —
03 05E 0 in gIs*- L.
U. 0
Eoin
CM
EoinCM
0COoo_o03CO_oa.0c0l_0D03CO00d
0id0o03Einh-co'
EoinCM
in
03EoooCDI0
_d
o ai0 303 Q_ 01 0 0 0I I0 o03 0E % CO 0^"03
O0a.0o
CM
>% — X 0 O0 « x o1§<21
X Io
CO>Xo0oooCM
CMOO
0 02 0 •= 03E o co C£
00 ^ _ o x o 0 2 co

TO0C0TOOCDE
CO
zz
+ ±= oCD . - Q
I f f£ O
1 s 8 i
TO - | Q. 2i l > 3
CO CM CL oJ
cEoCO
o'COo'
cd
_c’l_■O0c0TOo
0 0E .
CD 3)
0 3— ■ ro ©TO Q. © « i— “ Q- c0 > 0 oco a: cl 8
0C/5OO
_oCD<4—oCDooCOx>cTO0c■0tt=TOO
<4—oO)E00oo
0cdoo
_oCD
<4—oCD00CD"OcTO0c0H—TOO
^ 0 O) Q*= JCco 05 ^ >c\T CO
XT■O o c oTO CM>>X
T 3 t— 0 © ^ c o A ' c -c ^ 0 o is
iL CO CO
CDoQ.
CDE0000
CL JC
I I
. TO Q_ 0
> 0 DC CL
C/5 0 E '■= ^ CD 0- o £ 0 o
o
oCDOCDXJcTO0c0teTOO<4—oCDEoooo
OL_0o
JZ0>c\T
■a o c oTO CM
■O >> CM 0 _© c oC J Z 0 O J=t
co co
> ,■Q3
0TOCD>_c't_"o_0o
—L +
■O & g>® i wo 5 w r w 0 ^ > a
fcS-eTO .p 0 C -—-g-E 9: m S §
- «• © £9= E E > 0 CO CL S
■a0
_TO 0 ^
• ° Id-o to
2 “ 0 i-.© 0
' T J CD0 i_E © E 0
CD CE .2 If5 ro^ c0 ' EO TO 3 OiS CDD 5 >E ^
CM■acTO
oxoCDLO
oo0'c
'0tt=■ TO O
OJO0OTOQ.“O0TOCo
JOl_TOO
CD>00CM
EoLOCM
CM
TO© ^ ~ OE °
CO ^
TO■■i i-2 CD TO -C
- CD
Z ©
= £ cd .2
0 | ■© tO) O .E c c ~ a3 toO =5c .2 o >° -O.2 aTO ©0 fJ
"O ! i0 >0 *
> t0”
0 J=o c c o5 o E ©E 2?0 u.
© . Q . O„ JO 0 0 > S
5 4O ) ^ O ct> CT3 C °>ow -OCO ©
JsC cc 0
. 3 CDi- 0Q fe.m O D ) c0 £ C To 111 0 u - 0
0
0 TO0 "S„ >4
a) oc TO^ 3 O) w o
C © ^J r TO
W 0 O ®«6<8 I I> TO 2.EW 0" o0 T 3 -P
3 TO A * * r - OCO co X
■ £ O h** Q- _
i - s § 8 o =O CD
©n0
H
O nLO

In conclusion, the evidence to date suggests that the consumption of a ‘whole’
EDs, compared to a placebo, can improve aspects of mood relating to
energy/alertness and reaction times (RT). The nature of these effects suggests
that caffeine may be the active ingredient as it is known to have an effect on
alertness and RT (Smith, 2002). However, the design of these experiments means
that it is not possible to elucidate the relative contribution of each component. It is
possible that only one of the ingredients produced the effect, or on the other hand
it could be that specific combinations of ingredients work together synergistically.
Indeed it is possible that the components are antagonistic and that a more positive
response may be obtained with the removal of one or more ingredient.
Furthermore, the compositions of drinks in these studies vary to the extent that it is
difficult to draw any clear comparisons between them.
The heterogeneity of the mood measures used in these studies means it cannot be
determined whether they tap similar of different feelings. For example, do
‘alertness’ ‘energetic arousal’ and ‘stimulation’ represent similar or different
dimensions? Similarly, more research is needed to determine the effect of EDs in
different cognitive domains; studies have focused mainly on reaction times with
limited attention to other domains such as executive function and memory.
Perhaps most importantly, given the high GL of EDs and the potential for blood
glucose levels to drop after 2-3 hours (Figure 1), the psychological effects of EDs
need to be considered after a longer period of time.

1.6.2.3 The psychological effect of glucose, caffeine and their combination.
To determine the relative contribution to EDs, studies that systematically compare
the individual and combined effects of each of the ingredients are needed. To date
four studies have examined the relative contribution of glucose and caffeine
(Scholey and Kennedy 2004; Smit et al. 2004b; 2004c; Adan and Serra-Grabulosa
2010; Table 8). Interestingly only two out of the four studies report a significant
benefit of ED consumption on mood. This is in contrast with the aforementioned
studies that examined the effects of ‘whole’ ED where eight out of ten studies
reported mood benefits. Smit et al. (2004b) systematically varied the composition
of experimental drinks; 75mg caffeine, 75mg caffeine plus 37.5g glucose, 37.5g
glucose alone and a placebo and found that only the caffeine fraction improved
energetic arousal. In a further study, Smit et al. (2004c) examined the contribution
that carbohydrate makes to an energy drink by removing the carbohydrate
component from one of the test drinks. This time there were no effects on reported
energy levels but the addition of carbohydrate to caffeine reduced the feelings of
tense arousal associated with taking the caffeine alone. Neither Adan and Serra-
Grabulosa (2010), nor Scholey and Kennedy (2004), reported any effect of
caffeine, glucose or their combination on measures of mood including the
dimensions of alertness and energy levels.
61

3(/>a>
a :
a)= c
co ro E
£§8 8
a>
= E0 'p c/3 c0 o
CD CO
0 - pc/3 o - JEC T3 CC0 0 0 o >;CD *4— - Q.
_ r Jjj .52 "O 0 ^ ro c fo E > C/3 0 C/3 CX C/3
_00co<
"O
0 co
< O > Q-
(/)® 5•i i•*= co 0 co S
o
> .0
o -a
V E
• Q0i_OCL0
CD 0 LO CO 03 CM —’ 0 I CM - - CO
l l —
CD 003 CM 0 CO
^ 00
co
3JO3Q .
'En
oo H— o 0 3O ) o 0 3 u—
E 0 3 E o
E LO LO LO0 3
h- h - LO
o C/3 C/3 C/3h -
LO 3 =3 =3 " O
Z Z C L CL Q .00i— i_ i— l_
0 0 0 0 0 - X 00 o
0 0
0 *0 — 0 C
£> 0 > st= £
j l 3
.— . 0 ,—.. 0"C— CM O ■ co CD 3 " O
0 ^ C 0'o ^
■ 0
0 0O 13 O ) 03
0 0 3 . E
0-03S §
S E^ o
CM £
0 C/3o o
_ 3
03 ■=O )LO
CO0
_ 3
al_0
0
c o
"O
§ a
a sCD
H0 03 m- O )
§ §
Q . g
o3 3 ^0 0 0
^ - S > i _ o— 0 .—M- D D
a ) T 3C/3oo3
C003C
03c
*L_3
03 0 O03
LOC/3C
>0N -
03 tt—
CO 0 0C/3 C 03 (13 X 3
Q - f c Ot—0 0
O 1 5
0 03E
o03
J s iC/30
LO C >0LO h - 03
x: . co 0i c
T 3 JD° t r
-C 0 -C O) C 03 C ‘CD E
0 ^ > 00 o O
c0 3
m0Q
O 0
•*-> 0 < 2-
X C/3 _
S . l ?C 0 _Q O 0 i_ CO CM
< c/ 3 C D 0
- > >> i - a® 0O c o£ D C °O c 0 S co 0 ^ Ci

0 3 0 3Ef—
000
OCO
30
OE0
CD 0 CO 03
(0 ® £
■ i i*= W 0 r -o 5
o
cU)
*5>V
O
O “fl) - c * - *-» (0
| S
c _ 0 o
£ »0 >2 0
CP c■7= 0 0 fc « 0 O °
ro oB 20 o E> 0
c -2 LLl . 1
O_ c 0 c
0
2 I ro 0B E 0 ••=0 3 j - i_ 0 0 > c o
S - O0
0 cn o 0 0 £ i t o 0 0O "O
oo0>C C
■ B e
§ oO 050 _Q_ L_ CU^ (U ( -0 0 O
0 dO 0 c3 o 0 0 X2
> £ 0 03 < O
_ O 0 3 C/3 O2 -o
0
o'jn 00 m 003 0 0
0 o5 8 -c E p —0 X 2 LLl 0 LL.
> .00*03E
CD
COCM ^
Ll T CDCO CO r - h -
oCDCO
OXo03
ID
0 3
. o -Q
CO t
CD
E ^
7 =I 0j* :E ^
' j = idX3 CM
E CD 0 >
I ^O CM
£ 0 0 o .EID 0 O CM -£ .—.0 0 CM O O
OX 3 O .903 ro
ID c
^ 8 co -2l co
= e
E CM
CO
CM
T330
LS'LDCM
I
3
ld j* : CM O
CD CO CD
c o
0 c o
e -eo coLD O CM m
03'0i t0o03E
IDh --XC
0 O g
E o |§ 03 O CM.— Is- 0 ID CO O
O 0 3 c-6 £ o fco CO
u_ O
-O
2 §E ^
C/3 0
C .5=
O j= T W t-1- 03o c £^ *TT D° S ®
0.E 0 o i~ £ O T3 0 "O 0 C/3 0 0 0
O _ 3 0
T3 0 0 O0
CO
— TO0 C C O O = 0 [2 0 OE
[® 0 ° 0 .
o +
E l
0 — : 0 c .E
'F CDE sj=O 0 03 O
03 J-C (D 0 « — 0 .2 <
o03 C— O 0 13
«= § . 2 o 0 ■£ 0 0 o o
-£ + 0 'O 0
i -8— 0
t J=CD t
5 ®o o
cE ^° 'E 03 E ^ o0 03
03o
■-3 30 o3 U= O 0
X ! 3* _ §0 t :1 0
^ o 0 i
.—. O ' ' - ' 3 3 0
E B c o 0 003 Li- I—
E 000 3 0 -_2 3 0o c
33 O 0 0 3 J=o coI ?0 ^ o =
0 O03 2 -0 03 t .E2 2 ECO C/D CO
0
~ - 7:3 3
» ° ® E
CD id " § §
o
0 0 0 E x 2
o'«= o
8 'E Q- 0 0 3 S C ® I
•§ .2 w « ^ -
O 3 0 3 O 0 E O 0 LU 0 1 — 0 CD X U_ O <
_ > O ■O
> ,0
*03E
0 CD > ,=t
< CM
CO 03 ■M- ■sf ID
03
I fN- ®1 8
e oX
u o “I 0 3 ^B *> o> N- X3E w 0 E 0“ 0o E CD LO 0 S
o CM
0 30 OE g
ID o 0
1 0^ O.E CD■o >
03-0i t0o03E
ID
3
S X iDCM CM
E O ?O 03 o ID LD 0 CM ■ >—CO CO o
0 cd 0 03 3 03
-O 'E 2 'E o 0 •+= 0 0 > > LL o O O
o0
.•X oE 0
c§ ™
■Ooo
Eco
i2c0coQ .
Eoo
"ro
~o>
cE
t -
■5 0
o
1 ^ n M
0 o
■E ©Q 20 > s pP o00 c 0
m Vo
0 =1=
■ 5 °" I ■“0 0
o0
o -5.
0 0t i i 00 8w C/30 0
s i
o > 0
.E 0_0 0
00
‘■5
■4->( 0
00
0120
H
0E3C/33o01
o
c o0

Again these four studies consistently report benefits on tasks involving RT (Table
9). Smit et al (2004b) reported that 75mg caffeine alone improved simple reaction
times. However, Smit et al (2004c) found that RT on a letter search task was faster
after the addition of 37.5g of carbohydrate to 75mg caffeine, than when
considering caffeine alone. Adan and Serra-Grabulosa (2010) found that simple
RT performance declined after drinking water but this was prevented by the
consumption of either 75g glucose, 75mg caffeine or both. Similarly, sequential
RT performance declined after water but this was only prevented by the drinking of
both caffeine and glucose. Scholey and Kennedy (2004) noted that speed of
attention only improved after the consumption of a ‘whole’ ED containing 37.5g
glucose and 75 mg caffeine but not when either ingredient was drunk alone.
Although all four studies considered effects on episodic memory only two found
any effects. Scholey and Kennedy (2004) reported that memory improved after
whole drink and when caffeine was taken alone. However, Adan and Serra-
Grabulosa (2010) found that memory only improved when both glucose and
caffeine were taken together but not when taken individually. Thus there is some
evidence of a synergistic relationship between glucose and caffeine, which
subsequently improves RT and possibly memory; although in some instances
individual components act alone.

oa)t tCDC
'co
S '_gT3©g<1) 4-Cst a)CD c
« ©© £= > CD
Ofi O
'i- ©■a >
©
© Of u + S El IJXLOo
-Q
to <u ■ai_CD
TO ^-E O
Ei n
© @ I s© cCD ©.E E *2 oO ©TO I £ C©-BC CD© eUz o TO -Q O CD O o
■a 1 CD £L ■o c r
1 §
T3CCD_3CO
CDc
CDOCO>L_
© , -4
© -E5 CO + CO ^ _ 3 i— CL O '
©© C Q. 'cD
•— CD C/3 o
3 "CO©nCL ©c© '©C St’© ©St o© ■oo©
c©
> ©L _© ©© £
+©>t
1-- COX +-ro "D
L_
X3C©_3CO
©g' ©t t©oCO>©g
' ©S t©O©_3Q._3CO+
c © © oZS JD C7 CO © © C/3 CL
i—OE©E
<4—o > . .
I IO -D
©g■ ©t t©o
o fij*:_g'u-X3_©O
_g*i_"O_©o
+ £ ' i
I I© CE & > * ©
© o-O u c ^ ■ ao j* © a c ©© -!Z C Lc/3 -a c/3
©o „c CO
1 1| iX ”f i . ©
a :
c °" • t -a D) © O ©O ©
i *
? CO to © © (DC c S.° ^ SQ . O Oe ^ EC wOo
©
CO g ‘c
© © CO © © —1 JZ — — TO © -0
■aL_o
■©4-4 ©
I— J'C'a ; J9
i— ©CL ©© T3 r~> © — t - t ©E = a c/3 I £
o
■a ©>%
_ro
- 2 -c=5 °2 TO© ©
j y TD ^
g-S: t © -
l— CL ©
co©
CO©
coro
"S c © © o -c -Q O CO © 2 CL ~
h - © C I 3 O> • £ c < 3 © CL CL CD
co2 H co CL •E ©
Q.ECO
■O©CO*L_©"3Cl
EoO
LCCO©
co.•2 > , -*—* i—(O L O D O C
I I I1 1 1 E o ro>> > ^ " ° co ~ c
— . '© 8 .9^ =3 (D Q O c/3
> , C t : O
MCO o .E "o
a)E ©
coc©
to co*4— Co ©
> ©>
o CO
CL CL C/3 C/3
ro 3 .9O 1-o © < C/3
■— 2© ©
J Z
©^ n VUm E > o © >i n
tn co <
■n ©£ ^ Q . ©
CLa © i—
n *S § Km “ - S UJ © ©- "o J= © ^^ > ,
® i - ii g -> O CD
M_ Q . iO E O
O | O i t 8 ®"* * r ° CO©TO 8© 3 3£ X3 Cp)* ^ © JLm -C . 5^ . co— z« ® (8D ) 0 3 -2
S co cW © .9 © ™ t oCO t
c E ’c
©g
’©s tro0coE
i nC"-1
.E■a O E O
^-4 N-T- CO
©c■©i t©0COEint"-
1c
EoinCNCM
OXocoin
h ico
Ic
oi nCM
co'
on©oro
oX
©c o’© COSt in© hioCOE
aic'©
CO
©~cinh-1
St©o'©ttro
LC CO ag E CO‘l_
~oinh- E
in© 1 h-o
_g g< : O
X*i—T3 ■©
EomCM
oCO
Eo1o
LO LOSX inCM
T— CO CM CO
©
^©
too
oCOEinh -co
_gCl
©ro
CM
©©oo
JOCO
‘ocoLOh -©
_gCL
©ro
co
oinh -
©"g
'©>4--->4—TOo
U--oC0|ELOh -©
J3ClJL—©
to
©g
I©oCOELO
©c
©L _ '©© Stc ©© o
© CO© E
in© h-
©t
1 CLL _ L -© ©© ©<:T— CM
CO h~_g
© ©© 3 ©O O Oo > o=5 ro 3CO n— COCO ■© COin m int -© hiCO .c CO© © ©3 3 3Q . CL CL
i—© © ©ro to ©
4—*4.CO LO
>c _ o© © ‘c m O —=5 § 1X O 9
© t—t o© CMcn ^ ■o © E o © 3
m "©ro cd -a i -< O
■sf o
X3 ° C cn
l lO c
_ c c o © C/3 iL
^ > © T3 © ' c l
"o ro® © lt 2 © Q: n ^ >
h - ^ x
<0 =sO )

1.6.2.4 Discussion and conclusions.
The moderating effect of fasting.
Evidence regarding the relative contribution to improved mood and cognition, of
each ED fraction, is lacking. However one pattern emerged; when non-fasting
participants consume a drink containing both caffeine and glucose caffeine
emerges as the dominant ingredient (e.g. Smit, Cotton et al, 2004b; Scholey and
Kennedy, 2004). In contrast, when fasting participants consume such a drink the
addition of glucose appears to become important (e.g. Smit, Cotton, et al, 2004c;
Adan, Serra-Grabulosa, et al, 2010). Although tentative, one hypothesis for these
conflicting findings is that by restricting subject’s food intake overnight, and
denying them breakfast, their endogenous glucose supply may be reduced
resulting in observable benefits when exogenous carbohydrates are consumed. It
has been reported that the optimal glucose dose to improve cognition may differ
depending on the level of depleted blood glucose resources (Owen et al, 2012). It
is plausible that different doses of carbohydrate found in EDs may have different
effects under fasting and non fasting situations; however, research is needed to
test this hypothesis.
The moderating effect o f caffeine withdrawal.
Similarly, the ‘withdrawal reversal’ hypothesis predicts that positive effects only
occur in regular caffeine consumers when they are acutely withdrawn; a
phenomenon now generally accepted to be at least partially responsible for the
observed effects of caffeine (Rogers and Smith, 2011). Furthermore, with repeated
use the effects of caffeine are reduced over time as tolerance builds (James and
Rogers, 2005). Adan and Serra-Grabulosa (2010) was the only study to consider

low caffeine consumers: it therefore remains to be established if ‘energy drinks’
exhibit the same effects as in regular consumers. Indeed recent research has
discovered associations between individual variations in the subjective anxiety
produced by the ingestion of caffeine and polymorphisms in the A1 and A2a
adenosine receptor genes (Alsene et al. 2003). This suggests that low consumers
may be the select few in the population who choose not to consume caffeine as it
exerts a negative effect. Whether habitual ‘energy drink’ consumption moderates
their effects remains an important question, considering the targeted age group for
these drinks. Individuals such as children and adolescents that do not consume
caffeine daily may be at greater risk of intoxication from energy drinks containing
high levels of caffeine than habitual caffeine consumers (Reissig et al. 2009).
The effect of dose.
It is also noteworthy that the doses of caffeine in the aforementioned studies
ranged from 22.5mg to 80mg. This is a relatively narrow range and a low dose
considering that some energy drinks can contain up to 505mg per bottle (Reissig et
al. 2008). It will be worth considering the effect of higher caffeine doses, especially
when taken in combination with other psychoactive substances.
The effect of time
Another important factor is the time scale over which the effect of energy drinks isii
studied. All the studies presented in Tables 5-9 examined only the immediate
effects of drink consumption, taking measures from 10 minutes to 1 hour post
consumption. The exception was Smit and Rogers (2002) who examined effects
up to 100 minutes and Smit et al. (2004) who examined effects up to 90 minutes.
67

Both these studies found an effect of time; improvements in energetic arousal
occurring from 30 min to 100min (Smit and Rogers, 2002) and feeling tense
reduced from 73 min to 100min (Smit and Rogers, 2002) and at 90 min (Smit et al.
2004). However this still tells us relatively little regarding the longer term effects of
consuming such drinks. The fact that no study on EDs has considered effects
beyond 90 minutes is surprising given that caffeine is absorbed in about half an
hour and has a half-life of five to six hours (Meyer et al., 1991), potentially offering
relatively long-term benefits.
Evidence from studies conducted on the effect of glucose drinks on mood
suggested that in the longer term (1h +) blood glucose has a tendency to fall
rapidly, producing a reduction in mood and increased irritability (Benton 2002). If
blood glucose levels fall too low, postprandial hypoglycaemia and its associated
sympathetic nervous system and neuroglycopaenia symptoms may be observed.
Given that caffeine has a half life of up to 6 hours and has been shown to increase
the perception of and sympathoadrenal responses to hypoglycaemia (Watson and
Kerr, 1999; Watson et al. 2000), this combination could have negative
consequences during the late postprandial period. The determination of any
longer term effects is of obvious importance.
1.7 Literature review - summary
The brain relies on a continuous supply of glucose from the periphery in order to
function. However, there are a number of factors, both dietary (high GL or caffeine)
and physiological (IGT or PH), that can disrupt plasma glucose homeostasis and
68

hence hinder cognition. The general aim of this thesis is to investigate how changes
in glycaemia affect cognition and mood.
1.8 Specific aims of this thesis
• To examine the influence of modulating the GL of meals on cognition and
mood in children (chapter 2).
• To determine the impact of age, poor glucose tolerance and low blood
glucose levels on cognitive decline, memory and mood in a sample of older
adults (chapter 3).
• To investigate the influence of modulating the GL of breakfast on cognition
and mood in older adults with or without poor glucose tolerance, low blood
glucose and cognitive decline (chapter 4).
• To consider whether different aspects of diet, in particular caffeine which is
known to cause declines in glucose tolerance, interact with the GL of a drink
to effect cognition and mood of young adults (chapter 5).
• To present a theoretical statement that account for the findings presented in
this thesis and to highlight possible areas for future research (chapter 6).
69

CHAPTER 2
Modulating the glycaemic properties of breakfast improves school children’s
cognition and mood.
2.1 Introduction
As reviewed in chapter 1 breakfasts that release glucose slowly (i.e. low glycaemic
load, GL) are associated with better cognitive functioning in the late morning. Such
effects have been reported in adults (Benton et al., 2003: Nabb & Benton, 2006a,
b), adolescents (Cooper et al, 2012) and children (Benton et al., 2007; Ingwersen
et al. 2007) but not in all instances (Dye et al. 2010). Although studies have
focused attention on the glycaemic properties of the meals, to date this has
typically been achieved by varying the type of food consumed or the nature and
amount of various macro-nutrients, such that it is unclear whether it is the
glycaemic response that is important rather than some aspect of the macro
nutrient composition of the meal. The major objective of the present study was to
consider the influence of the glycaemic load of meals that are otherwise identical in
terms of their macro-nutrient composition.
To vary the GL, while keeping the macro-nutrient composition constant, two meals
were created that were identical in all respects other than one was sweetened with
Isomaltulose and one with glucose. Isomaltulose is a disaccharide made from
sucrose by the enzymatic rearrangement of the alpha 1,2 linkage, between
glucose and fructose, to an alpha 1,6 linkage. It is fully digested and absorbed in
the small intestine and provides the same energy as other sugars. In healthy
volunteers, isomaltulose results in lower postprandial blood glucose and insulin
responses than sucrose or glucose, while producing a prolonged blood glucose
70

delivery over the proceeding 3 hours (Holub et al, 2010). Thus the Gl of
isomaltulose is 32 compared with 65 for sucrose and 100 for glucose. The use of
isomaltulose and glucose allowed the GL of the meal provided in this study to be
varied whilst keeping the macro-nutrient contents identical.
Also considered was whether children’s social background influenced the reaction
to GL. At least in developing countries there are reports that those from a poorer
background benefit more from a school breakfast programme (Pollitt and Mathews
1998; Powell et al., 1998; for a review see Hoyland et al. 2009). To date such
matters have not been examined in industrialized countries, particularly in relation
to GL. However, even in developed countries it is known that diet varies. For
example, a survey or British children found that many aspects of diet varied with
social background (Gregory & Lowe, 2000). Given the ‘second meal effect’ the
glycaemic load of food eaten previously at home could influence the glycaemic
response to the experimental breakfasts (Wolever et al. 1988; Lamport et al.
2011). The present study therefore examined whether children from a poorer
social background preferentially benefitted from a lower, rather than a higher, GL
breakfast.
2.2 Methods
2.2.1 Procedure
Children attending a school breakfast club were recruited and on two different
days, at least one week apart, ate one of two meals designed to differ in their
glycaemic load while being similar in macro-nutrient content. The procedure was
double-blind and the order in which the meals were consumed was randomly
generated. When the child had finished eating, the amount of the food items
71

remaining were recorded by weighing the plate before and after consumption,
allowing estimates to be made of the nutritional composition of the breakfasts
consumed. Breakfast was eaten between 0815 and 0845 and psychological testing
took place twice between 0900 and 0945 and 1115 and 1200. On each occasion
tests were administered on an individual basis. Initially immediate memory was
assessed, followed by the Speed of Information Processing, reaction times, the
ability to sustain attention, delayed memory, mood and appetite ratings. Due to
time constraints the only task completed prior to breakfast was the Speed of
Information Processing test.
2.2.2 Participants
Seventy-five children, aged five to eleven years, average age eight years eight
months, were recruited from four schools. There were 28 boys and 47 girls in the
sample. Their parents reported that participants were in good health and had
never experienced an adverse reaction to food. Weight was not measured but no
child was obviously over weight. Parents gave their consent to the child taking part
(see appendix 1) and the study was approved by Swansea University ethics
committee (reference number: 0402/2007/1). Irrespective of the study, all children
attended a school breakfast club on a daily basis where they consumed a meal
similar to the experimental meals: thus all habitually ate breakfast. The Welsh
Index of Multiple Deprivation describes local areas in terms of a range of indices.
Parents provided a home postcode from which an index was retrieved relating to
their degree of deprivation. The sample came from amongst the most socially
deprived areas of Wales.
72

2.2.3 Meals
The details of the meals are given in Table 11. They were designed to offer a
similar intake of energy and macro-nutrients while differing in the glycaemic load
(GL; amount of carbohydrate X glycaemic index of food items (Foster-Powell &
Brand-Miller, 2002). Children were asked to eat as much as possible of the food
provided but were not forced to eat anything they did not like or more than they
wanted to consume. When the child had finished eating, the weight of any food
remaining was recorded. In practice, all children ate the majority of their breakfast
such that the small amounts left were of limited practical significance. There were
no systematic differences between treatments in the amount of food consumed
(Table 10).
Cereal Yogurt Orange drink PHigher GL 4.3 (4.9) 3.4(18.5) 8.2 (8.9) nsLower GL 4.1 (4.0) 1.2(19.3) 6.1 (7.5) nsTable 10. The amount of food eft over in the higher and lower GL conditions.Data are amount of food left over in grams.
73

Low
er G
L
GL
14.2
6
1.05
Iop
1.14
I 8.61
I 5.12
COh-
CO
O 00 CM i CMCO
CD i IDCO i CM
CO i
Fat
0.15 LD
I O 0.25
i o I OqT-
Pro CD 00
OO I oCO
i o I OCMCD
CH
O CDOID I
oid
oCD i 23
.7I CD 73
.3
Kca
l
r- CD i oCM i LO
CD I CDh-coCO
High
er G
L
_ i0 14
.26
1.05
5.00
1.14
22.4
0
i
oocd i 59
.85
0 oo cm 100
1 CD 94.5
i 100
i i
Fat
0.15 ID
o 1 0.25
o i o iq
Pro CD CO
cd o 1CO
o i o iCMCD
CH
O
17.6 o
LDpID 1
oCD 23
.7
i CD i 73.3
Kca
l
r -CD O
C\l 1 LDCD i CD i co
CO
Cor
nfla
kes
20g
Milk
sem
i-ski
mm
ed
100
ml
Glu
cose
5g
Pala
tinos
e 5g
Low
calor
ie yo
ghur
t 10
0g
Glu
cose
sw
eete
ned
fruit
20g
Pala
tinos
e in
swee
tene
d fru
it 20
gO
rang
e dr
ink
200
ml
(glu
cose
16
g)O
rang
e dr
ink
200
ml
(isom
altu
lose
16
g)TO
TAL

2.2.4 Test battery
2.2.4.1 Memory
The approach was based on the Recall of Objects test of the British Ability Scale
(Elliott, 1996). For 40 seconds the child viewed a card with pictures of 20 objects
(Appendix 2), after which they had 60 seconds to recall as many as possible. On a
second and third occasion the child viewed the card for a further 20 seconds and
had 40 seconds to recall the items. The numbers of items recalled on the three
occasions were added and are reported as the immediate memory score. After the
third trial, spatial memory was assessed by placing a blank grid in front of the child
and asking them to put a series of pictures in the place on the grid that
corresponded to the original card. Delayed memory was assessed after
performing the other tests, about 20 minutes after the initial memory test. The
child was again asked to verbally recall as many pictures as possible. When the
blank grid was again presented the child tried for a second time to recall the
position of the 20 objects. In total four sets of objectives were presented, a
different version on each of the four occasions the test was completed.
2.2.4.2 Speed of Information Processing
The test is taken from the British Ability Scale and measures how quickly simple
mental operations can be performed. A row of circles was presented, each
containing a number of small boxes. The task involved marking the circle
containing the most boxes. On each of six pages there were five lines of circles.
The time taken to complete each of the six pages was recorded. Six comparable
forms of the test were used.

2.2.4.3 Reaction times
An auditory warning sounded and at the same time a light illuminated and a
millisecond timer started. For ten trials the child as quickly as possible pressed a
button that extinguished the light and stopped the timer. The reaction in milli
seconds was recorded.
2.2.4.4 Ability to sustain attention
The paradigm of Shakow (1962) was used. An auditory warning sounded and
after a delay of either three or twelve seconds, a light illuminated and a millisecond
timer started. When the child saw the light a button was pressed that extinguished
the light and stopped the timer. The test consisted of four blocks of six trials. The
first and third block of trials had a delay of three seconds and the second and
fourth block a delay of twelve seconds. The delay ensures that it is the ability to
sustain attention that is measured rather than simple reaction times.
2.2.4.5 Appetite
Children were asked how many sandwiches do you think you would be able to eat
‘at this moment’ using an eight point scale that ranged from 1/4 of a sandwich to 2
whole sandwiches. In all cases a higher score indicated that they were hungrier.
2.2.4.6 Mood
Children were asked how they feel ‘at this moment’ using an eight point scale of
smiley faces, that ranged from very unhappy to very happy. In all cases a higher
score reflects a worse mood.
76

2.3 Statistical analysis
The data were analyzed using appropriate analysis of variance designs using
SPSS version 19. For example: Type of Meal (glucose / isomaltulose) X One /
three hours after eating X Immediate / delayed recall X Order of testing (was
glucose / isomaltulose consumed on the first or second day of testing). The last
variable was a between subjects factor and the others within subjects factors.
Where significant interactions resulted they were further analyzed using post hoc
tests. Due to time constraints speed of information processing was the only
measure taken at baseline, and in the analysis of this one measure; baseline
performance (for day 1) was entered as a covariate, Where in the results section
higher order interactions are not mentioned it should be assumed that they were
non-significant.
Although requested not to snack during the morning children were asked if they
had in fact eaten after breakfast. The basic analysis of variance was carried out
excluding those children who said that they had snacked, to maintain the integrity
of the study that was designed to contrast two meals with identical macro-nutrient
compositions. However, in addition an ‘Intention to treat’ analysis was performed
that was identical except it used all participants, to exclude the possibility that a
systematic bias had been introduced by excluding those who subsequently
snacked. In practice, the response was similar in both the main and the ‘Intention
to Treat’ analysis so the data presented are for those who did not eat after
breakfast.
77

2.4 Results
To establish whether there was any effect of age children were split into three
groups; five to seven, eight to nine and ten to eleven years of age. Preliminary
analysis found that age influenced memory (F(2,53 ) = 12.18, p<0.001), reaction
times (F(2,57) = 21.89, p<0.001), speed of processing (F(2,54) = 27.69, p<0.001)
and the number of lapses of attention (F(2,56) = 14.84, p<0.001); those seven
years or under were poorer than those aged eight to nine and ten to eleven.
Similarly gender influenced memory (F(1,61) = 6.84, p<0.01), speed of information
processing (F(1,56) = 11.08, p<0.002) and mood (F (1,61) = 4.73, p < 0.03); girls
performed better and had a more positive mood than boys. The group was divided
into two using a median split of the deprivation scores. Those from a more
deprived background had a slower speed of information processing (F(1,69) =
12.117, p< 0.001) but did not differ in other respects. The effects of age, gender
and deprivation did not, however, influence the effect of the meal on any measure
of cognition and they are therefore not further reported.
2.4.1 Memory
When the immediate memory scores were analyzed the interaction Type of Meal X
One / three hours after eating X Order of testing was non-significant (F(1,63) =
0.44, n.s.). However, the interaction Type of Meal X One / three hours after eating
reached statistical significance (F(1,63) = 10.89, p<0.002), and Figure 4 illustrates
the interaction. When memory was assessed one hour after testing it was similar
in the two groups. However, three hours after breakfast those who consumed the
glucose based meal had poorer memories than those who ate the isomaltulose
meal (P<0.01).
78

After eating the glucose based meal memory was significantly poorer three
compared to one hour following consumption (p<0.001). That is performance
declined across the morning. However, after eating the isomaltulose based meal,
children’s memory was similar regardless of whether was tested one hour or three
hours after breakfast; in fact there was a trend for it to be slightly better later in the
morning (Figure 4).
Ten participants had either been observed or had admitted snacking during the
morning, for example eating an apple or a chocolate bar. Although they were
removed from the sample for the above analysis an ‘Intention to treat’ analysis was
carried out to exclude the possibility that bias had been introduced into the study.
The above effects were identical when this second analysis was carried out. With
the immediate memory scores the interaction Type of sugar X One / three hours
after eating reached statistical significance (F(1,73) = 12.47, p<0.001), although
the interaction Type of Meal X One / three hours after eating X Order of testing
was non-significant (F(1,73) = 0.73, n.s.).
The interaction Type of Meal X Order of testing was also significant (F(1.63) =
16.11, p<0.001). Figure 5 illustrates the phenomenon. Memory was significantly
better when the isomaltulose rather than the glucose based meal was consumed
on the second rather than first day of testing (p<0.04). The nature of the meals did
not influence memory on day 1. The ‘Intention to treat’ analysis produced a similar
significant Type of Meal X Order of testing interaction (F(1.73) = 15.57, p<0.001).
79

27.5 - i
1> 26.515oo
co 25.50Sio
<D
JQE3
24.5 -
23.5 -
22.51 hour 3 hours■ Lower GL □ Higher GL
Figure 4 - Immediate memory one and three hours after breakfast. The data are
mean number of words recalled +/- standard error. The two breakfasts did not differ
after one hour but after three hours those eating the lower GL had significantly better
memories (p<0.01). The memory significantly declined in those eating the higher
(p<0.001) but not lower GL meal.
80

29
28-■oO
Test day 1 Test day 2
■ Lower GL □ Higher GL
Figure 5 - Immediate memory depending on whether the test was taken on
the first or second occasion. The data are mean number of words recalled +/-
standard error. After eating the lower GL meal memory was significantly better
when tested for a second rather than first time (p<0.04).
81

2.4.2 Memory retention
When the possible influence of meal on the retention of memory was considered
the analysis Type of Meal X Immediate (number recalled at the third test of
immediate memory) / delayed recall (F(1,63) = 0.027, n.s.) however the interaction
Type of Meal X Immediate / delayed recall X One / three hours after eating was
significant (F(1,63) = 7.402, p<0.008). Post hoc tests revealed that children were
able to retain more words later in the morning after they has eaten the isomaltulose
based meal compared to when they had eaten the glucose based meal (p < 0.05).
Furthermore children’s ability to retain words decline significantly over the morning
when they ate glucose (-13.8 to -15.3; p<0.02) but stayed the same across the
morning when they ate isomaltulose (-14.6 to -14.0).
The interaction Type of Meals X Immediate / delayed recall X Order of meals also
reached significance (F(1,63) = 12.771, p<0.001). Post hoc tests showed that
children were able to retain more words if they ate the isomaltulose meal on day 2
compared to when they ate the glucose based meal on day 2 (p<0001). Although
there was a significant interaction involving order, post hoc comparisons also
showed that children were also able to retain more words if they ate the
isomaltulose meal on day 1 compared to if they ate the glucose based meal on day
1 (p<0.05). The glucose based meal caused more of a decline in children’s ability
to retain words if they ate it on the second day compared to if they ate it on the first
day (p<0.02). The ability of isomaltulose to prevent this decline did not differ
between days. The intention to treat analysis produced similar interactions; Typei
of Meals X Immediate / delayed recall X Order of meals (F(1,73) = 15.068,
82

p<0001) and Type of Meal X Immediate / delayed recall X One / three hours after
eating was significant (F(1,73) = 7.752, p<0.007).
2.4.3 Spatial memory
When spatial memory was considered the interaction Type of Meal X Order of
testing reached statistical analysis (F(1,63) = 4.187, p<0.04). Post hoc tests
showed that when children ate the isomaltulose based meal on day 2 their spatial
memory was better than if they ate the glucose based meal on day 2 (30.5(1.2)
compared to 28.0(1.0); p< 0.03). Children’s spatial memory did not depend on the
type of breakfast that ate on day 1 (Iso 29.0(1.3) Glu 30.0(1.4); ns). Intention to
treat analysis revealed a similar Type of Meal X Order of testing interaction (F(1,73
= 5.397, p<0.02).
2.4.4 Speed of information processing (SIP)
Prior to consuming breakfast the groups who subsequently ate one of the two
meals did not differ (F(1,61) = 0.46, n.s.) illustrating that prior to eating the groups
were well matched. However, irrespective of the order in which meals were
consumed, children’s performance improved from baseline on day 1 to baseline on
day 2 (t(64) = 4.268, p<0.001). Performance at baseline on day 2 did not depend
on which meal had been consumed on day 1 (F(1,69) = 0.009, ns). Day 1
baseline SIP was entered into the analysis and significantly predicted performance
after breakfast (F(1,63) = 7.940, p<0.006) but there were no Baseline X Treatment
interactions. After breakfast, although the Type of Meal X One / three hours after
breakfast interaction was non-significant (F(1,61) = 0.51, n.s.), the Type of Meal X
Order of testing interaction reached significance (F(1,61) = 52.97, p<0.001). The
83
nature of the interaction is illustrated in Figure 6. There was a general
improvement in performance from day one to day two (p<0.0001). There were,
however, no significant differences in speed in those eating the two meals when
tested on the first day of testing although the consumption of the isomaltulose,
rather than glucose based meal, was associated with faster performance when
tested after consuming a meal for a second time (p<0.01).
84

8.5c/>;oQ)
.1 7.5c oo
® 6 5
5.5Test day 1 Test day 2
■ Lower GL □ Higher GL
Figure 6 - Speed of information processing depending on whether the tests were
taken on a first or second occasion. The data are the times taken in seconds +/-
standard error. On the first day of testing those eating the two meals did not differ but
when tested on a second occasion those who had eaten the lower GL meal were
significantly quicker (p<0.01)
85
2.4.5 Reaction times
When simple reaction times were considered there were no significant differences
between meals or changes over time (F(1,62) = 1.12, n.s.). The Type of Meal X
Order of testing interaction (F(1,62) = 3.48, n.s) was also non-significant.
2.4.6 Attention (3 second delay)
Initial examination of the ability to sustain attention found that on occasions there
were very long delays before responding. Thus the mean response times did not
reflect the data as they were distorted by a few extreme values. It was decided to
look at the instance of long response times; that is the incidence of lapses in
attention. The median response time was about 600 ms when there was a three
second delay before the light illuminated. Therefore the number of trials were
analyzed when individual’s responses were in the bottom quintile of the
distribution, that is responses were longer than 800 ms.
Overall the number of lapses in attention was not influenced by the type of meal
eaten (Type of Meal X One/three hours after breakfast (F(1,62) = 0.02, n.s.),
however, the Type of Meal X Time after breakfast X Order of testing (F(1,62) =
6.66, p<0.01) interaction reached significance (Figure 7). Although the number of
lapses of attention were greater three rather than one hour after breakfast
(p<0.03), the meal consumed did not influence the number of lapses on the first
day of testing. However, on the second test day those who had consumed the
isomaltulose rather than the glucose based meal tended to have fewer lapses of
attention although post hoc tests did not achieve statistical significance.
86

Test day 1 Test day 2
c3 2 .25-
D. 1.75
£ 1.25
1 hour 3 hours 1 hour 3 hours
■ Lower GL □ Higher GL
Figure 7 -Lapses of attention with a three second delay depending on whether the
tests were taken on a first or second occasion. The data are the number of lapses
of attention +/- standard error. On the second test day children who had
consumed the isomaltulose rather than the glucose based meal tended to have
fewer lapses of attention.
87
2.4.7 Attention (12 second delay)
The median response time for the twelve second delay was about 750ms. Those
responses in the bottom quintile, that is more than 1000 milli-seconds, were
distinguished. When the lapses in attention associated with the longer delay were
considered, although the Type of Meal X One / three hours after breakfast
interaction (F(1,62) = 0.19, n.s.) was non-significant, the interaction Type of Meal
X Time after breakfast X Order of testing (F(1,62) = 4.46, p<0.04) (Figure 8)
reached significance. On day one of testing the number of lapses of attention was
greater three rather than one hour after breakfast (p<0.04), although the type of
breakfast consumed was not influential. However, when tested on the second
occasion there was again a trend for those consuming the isomaltulose based
meal to have fewer lapses of attention although no post hoc reached statistical
significance.

Test day 1 Test day 2
•S 1.25-
1 hour 3 hours 1 hour 3 hours
■ Lower GL □ Higher GLFigure 8 -Lapses of attention with a twelve second delay depending on whether
the tests were taken on a first or second occasion. The data are the number of
lapses of attention +/- standard error. Children consuming the isomaltulose based
meal on day 2 tended to have fewer lapses of attention.
89

The possibility that the number of lapses of attention increase during the second
half of the test (i.e. trial 7-12 rather than trial 1-6) and that the nature of the meal
may influence this effect was considered. The interaction Type of Meal X Time
after breakfast X Trials 1-6 / 7-12 also reached significance (F(1,61) = 7.61,
p<0.01). There was a trend for those eating the glucose based meal rather than
the isomaltulose meal to display more lapses of attention during the second half of
the test, although the post hoc tests failed to achieve statistical significance.
2.4.8 Appetite
The interaction Type of meal X Time after breakfast X Social background reached
significance (F(1,51) = 5.839, p < 0.02). Inspection of the means showed that
those from a poorer social background were hungrier later in the morning when
they consumed the glucose based meal. However, post hoc tests failed to find any
significant differences (p<0.2 n.s). No other effects were significant when
considering those that did not snack, however, when an intention to treat analysis
was conducted it revealed a similar of Type of meal X Time after breakfast X
Social background interaction (F(1,65) = 4.105, p < 0.05) and the interaction Type
of meal X Time after breakfast X Order reached significance (F(1.65) = 5.375,
p<0.03). Initial inspection of the means showed that those who consumed the
glucose based meal on day 2 were hungrier later in the morning than those who
ate the isomaltulose based meal on day 2. However, follow up comparisons failed
to find any significant differences (p = 0.4 n.s). There was also a main effect of
Time (F(1.68) = 49.607, p<0.0001). Children were hungrier later in the morning.
Although older children were hungrier than younger children (F(1,65) = 12.532,
90

p<0.001), and boys were hungrier than girls (F(1,65) = 11.649, p< 0.001), these
factors did not influence the reaction to the sugar consumed.
2.4.9 Mood
The interaction Type of meal X Time reached significance (F=(1,56) = 4.807, p <
0.03). Follow up tests found that when children ate the glucose based meal they
had a worse mood after 3 hours (p< 0.03) compared to when they ate the
isomaltulose based meal (Figure 9). The nature of the meal made no difference 1
hour after eating. There was also a main effect of gender (F (1,61) = 4.729, p <
0.03); girls reported better moods than boys. Intention to treat analysis showed a
similar Type of meal X Time interaction (F=(1,61) = 4.151, p < 0.05).
91

6.5 -i
V 6.2 -
1 hour ' 3 hours
■ Lower GL □ Higher GL
Figure 9 - Mood one and three hours after eating. The data are mean mood
scores +/- standard error where a higher score indicates better mood. There were
no significant differences after one hour although mood was significantly better
three hours after isomaltulose consumption
92

2.5 Summary
• Irrespective of the day on which it was consumed, a lower, rather than a
higher, GL breakfast improved children’s memory and mood during the late
postprandial period.
• A lower, rather than a higher, GL breakfast increased children’s speed of
information processing, but only if it was consumed on day 2.
• The nature of breakfast did not significantly influence children’s simple
reaction times, attention or appetite.
• Age, gender and social background did not influence the children’s
response to breakfast.
2.6 Discussion
Previously studies have varied the breakfasts of children and interpreted beneficial
influences on cognition as reflecting the glycaemic properties of the meals. On
different days Ingwersen et al. (2007) gave children two breakfast cereals that
differed in their speed of absorption (GL 15 vs 27). The lower GL breakfast was
associated with a slower decline in memory and attention throughout the morning.
Similarly, Benton (2007) found in children (5 to 8 years) that memory, attention and
the time spent on task were better in those consuming a meal with a GL of 6 rather
than 15 or 39, although the meals had a different macronutrient composition.
However, not all studies have reported a beneficial response to varying the GL of
breakfast. In 10 to 12-year-old children Brindal (2012) replaced carbohydrate with
protein (GL 18, 24, 33) and failed to find changes in cognitive functioning over a
three hour period. Whereas any positive outcomes that occurred in these studies
were interpreted as reflecting differences in GL, differences in the actual foods
93

consumed, and in the macro-nutrient composition, prevented the conclusion that
GL was necessarily the mechanism. The present findings, in contrast, reflected
differences resulting from meals that were identical in the foods consumed and the
macro-nutrient composition, although the GL differed.
Although the isomaltulose based meal benefitted memory (Figure 4) and mood
(Figure 9), regardless of the day on which it was consumed, there were effects
observed only on the second day of testing. On the second day children processed
information more quickly, and had better spatial memory later in the morning, if
they consumed the low GL breakfast. In addition where a difference was found on
the first day it was less than if it occurred on the second day of testing. These
observations suggested a possible mechanism by which isomaltulose may be
influential. It is important that although the use of a cross-over design is common
when investigating the effects of nutrition on cognition, few studies include order of
presentation in their analysis (e.g. Nabb and Benton, 2006; Cooper et al, 2012;
Ingwersen et al. 2007; Taib et al. 2012; Jones et al, 2012, Fischer et al. 2001).
Such findings are difficult to interpret as effects that occurred on only the first or
second testing occasion may have been hidden. Similarly, if a parallel design is
used, and testing occurs only once, effects may be missed if they occur only with
repeated testing.
It cannot be assumed that those taking a test battery will be similar on a second
rather than first occasion, or alternatively that repeated testing will produce results
comparable to a second testing session. When first tested the situation is novel
and attention grabbing and therefore motivation is likely to be greater; there is a
94

need to find out what is required and to develop ways of working. The effect on
mood in the present study is consistent with the pattern of results: isomaltulose
resulted in children reporting feeling happier (Figure 9). It is possible that on day
one, when children were exposed to a novel and interesting situation, they had the
motivation needed to overcome the presumed physiological disadvantage that
resulted from the glucose based meal. However, by day two when they had
become accustomed to the monotonous nature of the tasks, and were likely to be
getting a little bored, the lower GL meal was helpful. Thus a hypothesis that
accounts for the present findings is that the benefit of a lower GL meal is that it
helps an individual persevere with an uninteresting task. That is isomaltulose
improved mood and motivation with a resulting better attitude, a change that would
be less likely to be influential when the tests were novel. If this proves to be the
mechanism then a low GL meal may potentially have a greater and longer term
impact in monotonous situations, such as school, where many tasks are repeated.
In fact, if a response to a meal occurs only when a task is novel it would have little
practical importance, although it is to be demonstrated that the present effects last
longer than two days of testing. Some studies give a practice session prior to
experimentation this offers only one of a series of situations under which an
intervention needs to be assessed. The present study did not have a familiarisation
session, and it is possible that had the children had an opportunity to practise the
tasks, order effects may have been avoided.
Previous research has found benefits with very low GL values, for example Benton
et al. (2007) found a positive response to a meal that provided a GL of 6 and
benefits have been reported after meals composed entirely of fat or protein that
95

have a GL of zero (Fischer et al. 2001). In contrast, the present meals provided a
GL of 32 or 60 such that a very low GL was not necessary to observe a positive
response.
To our knowledge only two studies have examined the cognitive effects of varying
the GL within a higher range. In 11 to 14 year olds Micha (2011) investigated the
effects of four meals differing in their glycaemic properties, varying both the Gl and
GL of meals in a systematic way. They found that the greatest facilitation of
learning resulted from a low-GI (Gl=48) / high-GL (GL=41) breakfast such that both
the quantity and nature of carbohydrate were important. However, an important
consideration was that the meals that provided a low GL were much smaller (275
and 281 kcal) than those that provided a high GL (469 and 468 kcal). Given that
the physical size and caloric intake of breakfast may influence cognition (Michaud
et al. 1991) the underlying mechanism is unclear. In addition, as the macronutrient
composition of the meals in the Micha (2011) study differed, the response may not
have been due to GL. In adolescents, Cooper (2012) found that the decline across
the morning in reaction times and various measures of cognition was less after a
lower GL meal. They compared a high GL breakfast (cornflakes and white bread,
GL=54) and a low GL breakfast (muesli, apple, GL=36) that, although they
supplied the same amount of carbohydrate, differed in the amounts of other macro
nutrients consumed. The present findings, however, are consistent with a
beneficial response being to GL rather than the macro-nutrient profile of the meal.
When comparing studies the developmental stage of the children may be
important. It may be critical that the ages of the present sample varied from five to
96

eleven years, as it is this age range when the metabolic rate of the brain is twice
that of the adult (Chugani et al. 1998). Hence potentially younger children may be
more susceptible to the GL of a meal. However, although both Cooper (2012) and
Micha (2011) considered older children (13 and 12.6 years respectively), similar
benefits have been reported in those with an average age of 6 (Benton et al. 2007)
and 9 years (Ingwersen et al. 2007). The present study, that recruited children
aged 5-11, found that age did not modulate the effect of GL on cognition. That is
all children in this age range benefited from a lower GL.
Similarly, previous evidence suggests that children from a more deprived
background, who may be more cognitively or nutritionally vulnerable, preferentially
benefit from consuming breakfast (Hoyland et al. 2009). To our knowledge this is
the first study to investigate whether a lower, rather than a higher, GL breakfast
differentially affects cognition of children from more or less deprived backgrounds.
There was no evidence that this was the case; although children from a more
deprived background had slower speed of information processing, on no occasion
did the background of children interact with the nature of breakfast to affect
cognition.
The possibility remains that there is specific response to isomaltulose that is
unrelated to its glycaemic consequences, although such a possibility will be
logically impossible to exclude in any study that uses this sugar. For example,
there is evidence that consuming isomaltulose, rather than sucrose, increased the
rate of postprandial fat oxidation (van Can et al. 2009; 2012); effects attributable to
an attenuated rise in glucose and insulin concentrations. It is possible that an
97

increase in fatty acid oxidation in the periphery may result in a relative sparing of
glucose, which can subsequently be utilised by the brain. Isomaltulose has been
shown previously to improve cognitive performance. For example, Kashimura et al
(2003) found that the consumption of a drink containing 40g of isomaltulose (GL
12.8) improved middle aged adults ability to concentrate on a mathematical task
after 90 and 120 minute, however, statistical contrasts between the two sugars
were not taken and thus these findings should be interpreted with this in mind.
Similar benefits were seen following a drink of 40g of sucrose (GL 26); however,
improvement was not as great as that following isomaltulose. Much the same
effect was observed in a follow up experiment using only 5g and 10g of
isomaltulose. Although these contrasts provided indirect evidence that
isomaltulose can aid cognitive performance more than sucrose as no direct
statistical comparison was drawn between the two sugars it is not possible to
determine if isomaltulose was significantly more beneficial than sucrose.
More recently, Dye et al. (2010) examined the effects of 50 g palatinose (GL 16),
50 g of sucrose (GL 32.5) or water on measures of cognitive performance in a
group of young adults. They found that although isomaltulose produced a lower
blood glucose profile than sucrose, there were no differences observed for memory
or psychomotor performance. It may be critical that the final testing session took
place 115 minutes after the drink, whereas the present study did not observe
benefits until 180 minutes after breakfast. Taib et al (2011) conducted the only
study that investigated the effects of isomaltulose on cognitive performance in
school children (age 5-6 years). Participants received either isomaltulose enriched
milk (4.48g isomaltulose, 11 g lactose, 6.8g glucose, 2.3g sucrose GL ~ 14),
98

standard growing up milk (7.6g lactose, 12.8g glucose, 4.2g sucrose GL -20),
reformulated growing up milk (11 g lactose, 9.4g glucose, 4.2g sucrose GL - 14) or
glucose (GL - 40). They found children’s cognitive performance declined across
the morning but that after the drink containing isomaltulose, children’s focused
attention was better than after the standard milk, in addition after drinking
isomaltulose there was less of a decline in numeric memory than after the
reformulated milk or glucose. Surprisingly, after the glucose drink, spatial memory
declined less compared to all other drinks. In addition drinking glucose also
resulted in a lower decline in speed of picture recognition compared to the
reformulated milk. After drinking the reformulated milk children’s speed of spatial
working memory was better than after drinking the standard milk.
Given the inconsistency, Taib et al’s findings are not easy to interpret, but given
the relatively small dose of isomaltulose (4.48g) and the small differences in GL
(14 compared to 20) it is unlikely that these factors can account for their findings.
The present study supported the hypothesis that isomaltulose provided in
isocaloric meals with the same macro-nutrient composition, consumed in a dose
sufficient to produce a significant difference in GL may improve children’s mood
and cognition (Figures 4 and 9).
The present study compared isomaltulose with glucose rather than sucrose,
producing a relatively large difference in the GLs of the meals (32 vs 60; table 9).
In contrast, both Dye et al. (2011) and Kashimura et al. (2003) compared
isomaltulose to sucrose resulting in smaller differences in GL (16 vs 32; 12.8 vs 26;
table 1). It may be that larger differences in GL are more likely to produce
99

significant differences. In addition, Taib et al. (2012) and Dye et al. (2011) used a
milk-based vehicle, a potentially critical variable. Milk is known to increase insulin
secretion and both an insulin-induced decrease in the levels of blood glucose, and
insulin itself, are known to influence cognition (Shemesh et al. 2012). Thirdly, given
that children of the age presently tested have a higher rate of brain glucose
utilisation than adults (Chugani et al. 1998) they may be particularly vulnerable to
fluctuations in peripheral glucose levels and hence GL.
The aim of this chapter was to examine the effect of modulating the GL of meals
on cognition and mood in children. For the first time the present findings report the
beneficial responses of children to meals of an identical macro-nutrient
composition that varied in GL. It is concluded that lowering the GL of children’s
breakfast could potentially increase the ability of children to benefit from their
schooling by improving their memory and mood.
100

CHAPTER 3
Low blood glucose reduces cognitive decline and improves mood in older
adults with poorer glucose tolerance.
3.1 Introduction
As glucose is the primary fuel of the brain a continuous supply is required to
maintain cognitive functioning (Amiel, 1994), and both poorer glucose tolerance
(Lamport et al, 2009) and low blood glucose (Warren et al, 2005) are disruptive.
Furthermore both glucose intolerance (Cheng et al, 2012) and hypoglycemia
(Whitmer et al. 2009) have been related to an increased incidence of mild cognitive
impairment (MCI) and dementia. Therefore the aim of the present study was to
relate, in a healthy older sample, the ability to control blood glucose to mood,
cognitive functioning and cognitive decline.
As discussed in chapter 1, a reduced ability to regulate blood glucose is associated
with poorer attention (Donohoe et al, 2000), slower reaction times (Yaffe et al,
2012; Donohoe et al, 2000) and poorer memory (Yaffe et al, 2012; Awad et al,
2002). Furthermore these decrements in cognitive functioning, as a result of poorer
glucose tolerance, may be more pronounced in older age (Ryan and Geckle,
2000). Although the mechanism is unclear, one suggestion is that the disruption of
cognition in glucose intolerant individuals reflects a reduced ability to transport
glucose into the brain (Convit, 2005). Thus the brain is deprived of the fuel it
requires to function optimally and in the long term such deprivation may play a role
in the development of cognitive decline.

Given that reductions in cerebral glucose metabolism are often observed in
dementia, and emerge in at risk individuals even before cognitive symptoms
develop (Mosconi et al, 2007), it has been argued that reductions in brain glucose
metabolism may play an important role in the development of cognitive disease
(Costantini et al, 2008). This implies that any factor that compromises neuronal
glucose supply, such as poor glucose regulation, has the potential to exacerbate
age related cognitive decline. On the other hand any factor that increases the
supply of glucose to the brain or its utilisation may have the potential to aid
cognitive performance.
Despite much research into the effects of poor glucos,e tolerance on cognition, little
research has explored the role of glucose excursions on cognitive decline.
Individuals in the early stage of glucose intolerance often experience
hyperinsulinaemic compensation (Polonsky 2000); that is increased plasma insulin
levels. However, if too much insulin is produced blood glucose levels may fall to
low levels leading to substantial fluctuations in blood glucose levels and the
possibility of developing mild hypoglycaemia (Brun et al, 2000). Although during
frank hypoglycaemia (<3.0 mmol/L) cognition and mood suffer (McCrimmon et al,
1997; Kindgren et al, 1996), there are large individual differences in susceptibility
(Gonder-Frederick et al, 1994). One possible explanation is that in some brain
adaptations occur so that if hypoglycaemia re-occurs cognition is preserved. For
example, in animals following hypoglycaemia (2.5-3.0mmol/L) once glycaemia is
restored hippocampal glucose concentrations are increased (McNay et al, 2006).
In healthy humans Boyle (1994) used a central venous catheter to study the effects
102

of recurrent episodes of hypoglycaemia (2.9mmol/L) on the uptake of glucose by
the brain, and related this to cognition and hypoglycaemic symptoms. The rate of
glucose uptake by the brain was initially impaired when blood glucose was reduced
to 3.6 mmol/L, although after 56 hours of intermittent hypoglycaemia (3.0 mmol/L)
the normal rate of uptake of glucose by the brain was preserved, even when blood
glucose levels were reduced to 2.5mmol/L. Similarly, after exposure to recurrent
hypoglycaemia cognitive performance was preserved and hypoglycaemic
symptoms reduced when low glucose levels were experienced.
Previous studies have tended to examine these effects under, experimental
conditions that artificially lower blood glucose to levels that will rarely be found in
everyday life. As the levels of blood glucose needed to induce adaptation are
unclear one aim was to see if comparable effects occur in those whose physiology
predisposes to the development of moderately low levels of blood glucose. The
present study therefore examined for the first time, in healthy older adults, the
association between the ability to control blood glucose, in particular glucose
intolerance and the tendency for blood glucose to fall to low levels, mood and
memory. In particular we believe this to be the first study to relate a tendency to
develop moderately low levels of blood glucose to cognitive decline.
3.2 Methods
3.2.1 Participants
One hundred and fifty five adults (58 males; 97 females) aged 45 to 85 years
(average age 56 (12.3)), were recruited following an appeal in the local media.
Exclusion criteria included anyone diagnosed with type 1 or type 2 diabetes,
103

chronic liver disease, or gastrointestinal problems that may interfere with
absorption, for example Crohn’s disease. Participants who had a current diagnosis
of a mood disorder, dementia or other mental disorder that may affect cognition
were also excluded. Eyesight and hearing was normal or corrected to normal. Of
the participants 16.1% were taking drugs to control blood pressure, 3.8%
thyroxine, 3.2% statins and 2.7% asthma controlling drugs. The procedure was
followed with the approval of the Swansea University ethics committee (reference
number: 0825/2009/1) and only after the participants had given written informed
consent. (Appendix 3 and 4)
3.2.2 Procedure
After fasting over-night, 1.75 grams of glucose per kilogram of body weight was
consumed, to a maximum of 75 g. Every 30 minutes for 150 minutes blood
glucose was monitored from finger pricks using an ExacTech sensor (Medisense
Britain Limited) that used an enzymic method, coupled with microelectronic
measurement (Matthews et al, 1987). Capillary blood samples have been shown to
be sufficiently sensitive to postprandial changes in systemic glucose
concentrations (Brouns et al. 2005). In addition to the oral glucose tolerance test
(OGTT) participants completed a cognitive test battery in the order presented
below. In studies of blood glucose inevitably the food that has been eaten, and
how recently, are confounding factors. The test battery was therefore started 10
minutes after the consumption of a standard glucose drink to ensure that all
participants were comparably nourished and were tested at a time when blood
glucose levels were similar and individual differences in physiology had little time
to be influential (Figure 10). Evidence suggests that the consumption of glucose
104

may reduce the differences in cognition that are observed between those with
better or poorer glucose tolerance (Awad et al, 2002; Kaplan et al, 2000), thus it
was considered that this approach would bias against rather than in favour of
detecting differences. Participants completed the tasks in the following order;
Immediate episodic recall, Working memory, Reaction times, Sustained attention,
Delayed episodic recall, Semantic memory, NART. The cognitive test session
lasted approximately 30 minutes. Participants then sat quietly whilst they
completed the questionnaires.
3.2.3 Test Battery
3.2.3.1 Episodic memory
Episodic memory was measured by recalling a word list. Using the MRC
Psycholinguistic Database a list of thirty words was constructed matched for the
number of syllables, image-ability and the frequency with which they occur in
English (appendix 5). Using a recorder words were presented one every 2
seconds. Immediately after the presentation, as many words as possible were
written down (immediate recall). Approximately 25 min later, after completion of the
other tasks, participants again recalled the words (delayed recall).
3.2.3.2 Semantic memory
Semantic memory reflects knowledge that is unrelated to specific experiences and
the meaning of words and knowledge. Verbal fluency was assessed as a measure
of semantic memory. In a one minute period participants were asked to provide as
many words as possible beginning with a particular letter of the alphabet: words
beginning with C, F and L. In the set of letters words beginning with the first letter
105

occur frequently, with the second letter less frequently and with the third letter even
less often. The scores excluded proper nouns such as people’s names, place
names or the same word with a different suffix.
3.2.3.3 Working memory
Working memory that temporarily holds and manipulates information was
assessed with a computerized version of serial sevens. A series of numbers
between 800 and 999 was given and subject indicated whether a second number
was seven less than the previously observed number. The responses to 28
sequences were recorded and the number of errors made, and the time to respond
to the second number, was reported.
3.2.3.4 Cognitive impairment
The National Adult Reading Test (NART) (Nelson et al, 1982) estimates premorbid
intelligence (Bright et al. 2001; Maddrey et al. 1996). As the ability to recognize
words is preserved with age, phonologically irregular words that occur
progressively less frequently in English are pronounced. The NART correlates with
both premorbid episodic and working memory (Frick et al, 2011). The NART and
the memory scores were both transformed to Z scores (differences from the
population mean in terms of standard deviations). The NART Z scores were then
subtracted from the immediate memory Z scores; such that a negative value
indicated that the current memory was poorer than predicted by the intelligence
score; that is there was evidence of cognitive impairment.
106

3.2.3.5 Vigilance
A computer generated a series of digits at the rate of 100 digits per minute.
Participants pressed the space bar when they detected three consecutive odd or
consecutive even digits. Eight target sequences were presented every minute.
Following the presentation of the third consecutive digit, 1500 msec was allowed
for a correct response. Responses made at any other time were recorded as
errors. A minimum of 5 and a maximum of 30 digits separated any two target
sequences. The task was performed for five minutes. Data analysed were the
number of correct responses and reaction times for the correct responses for each
minute of the test, allowing for the detection of changes in performance over time.
3.2.3.6 Reaction Times
The reaction time procedure was based on Jensen (1987). On a panel eight lamps
were,arranged in a semicircle, each 5.5 inches from a central button (the home
key). The index finger was placed on the home key. Within one to two seconds an
auditory warning signal sounded and after a random interval of one to four seconds
one of the lamps illuminated. The subject then extinguished the light by depressing
a button directly below the lamp, using the finger initially on the home key.
All participants completed a practice session of 20 trials using all eight lamps.
Simple reaction times were then measured for 20 trials using one lamp. Choice
reaction times were then measured over three sets of 20 trials when one of 2, 4 or
8 lamps could potentially illuminate. Decision times, the time taken to lift the finger
from the home key, were analyzed. Similarly movement times, the time from the
107

hand leaving the home key to pressing the button under the illuminated light, were
considered.
3.2.3.7 General Health Questionnaire (GHQ)
The GHQ-30 (Goldberg et al, 2008) (appendix 6) identifies minor psychiatric
disorders when participants responded on a 4 point scale (not at all, same as
usual, more than usual, much more than usual). As well as an overall scale, based
on a factor analysis by Chan (1985) the questionnaire was divided into subscales
representing depression and anxiety.
3.2.3.8 Hypoglycaemia
Neuroglycopaenic and sympathetic nervous systems symptoms (SNS) were
assessed using symptoms listed by Hepburn (1991) (appendix 7). Each were
assessed using visual analogue scales where 100mm lines were anchored with
the labels ‘Exactly like me’ and ‘Not at all like me’. Seven questions made up the
neuroglycopaenic scale: for example “I have difficulty concentrating”, “I am
confused” or “I have blurred vision”. The SNS scale consisted of eight questions;
for example “I experience a pounding heart”, “I blush” or “I tremble”. The
responses were added to produce single scores for the two dimensions.
3.3 Statistical analysis
Participants were divided into two groups according to their blood glucose level
after two hours of the OGTT. To allow sufficient sample sizes in the various
groups, as near a median split as possible was made. If their blood glucose was
7.0mmol/L or higher they were described as having poorer glucose tolerance (GT)
108

and if their blood glucose was less than 7mmol/L they were described as having
better GT. Of those with poorer glucose tolerance 66% would be classified as
clinically glucose intolerant in so much that values were greater than 7.9mmol.
Individuals were also divided into two groups depending on the tendency for blood
glucose to remain above or fair below fasting values. Those whose levels fell
below baseline all had glucose levels <5.0mmol/L at the end of the test.
Importantly, 50% of these final values fell below 4.0mmol/L and 30% were
<3.6mmol (a suggested threshold for adrenal discharge in healthy humans (Auer,
2004); this variable was labelled Lowest Blood Glucose (LBG).
109

12.8
11.8
_ 10.8 oE 9.8 E,u 8.8 (0 o= 7.8O)
■§ 6.8 o“ 5.8
4.8
3.8 I T " ................ i1 i i T i0 30 60 90 120 150
Time (min)
Figure 10 - Oral glucose tolerance profiles of four groups of participants. The
data are mean blood glucose values as mmol/dl for four groups defined in terms of
poorer and better glucose tolerance (above and below 7 mmol/dl at 120 minutes)
and either staying above or falling below baseline values.
Poorer glucose tolerance - Above baseline N = 67
Poorer glucose tolerance - Below baseline N = 41
Better glucose tolerance - Below baseline N = 21
Better glucose tolerance - Above baseline N = 25
A A
?
110

To ensure the independence of each glucoregulatory group preliminary analysis
tested whether blood glucose profile differed depending on group. The interaction
Time (0, 30, 60, 90, 120 and 150 minutes) X Glucoregulatory group reached
significance (F(10.2,511.7)= 20.019, p<0.0001). Table 12 shows the significant
differences in blood glucose at each time point of the OGTT.
After 0 minutes
After 30 minutes
After 60 minutes
After 90 minutes
After 120 minutes
After 150 minutes
PGT, LBG vs BGT, LBG
ns ns ns p<0.01 p<0.0001 ns
PGT, LBG vs PGT, no LBG
ns ns ns ns p< 0.05 p<0.0001
PGT, LBG vs BGT, no LBG
p<0.001 p<0.001 p<0.001 p<0.006 p< 0.0001 p< 0.0001
BGT, LBG vs PGT, no LBG
ns ns ns p<0.001 p< 0.0001 p< 0.0001
BGT, LBG vs BGT, no LBG
p<0.003 ns ns ns p< 0.0001 p< 0.0001
PGT, no LBG vs BGT, no LBG
p<0.005 p<0.02 p<0.0001 p<0.0001 p< 0.0001 p< 0.0001
Table 12. Differences in glucoregulatory group.LBG-Lowest blood glucose.
blood glucose, at each time point, depending onPGT-Poorer glucose tolerance. BGT- Better glucose tolerance.
Table 13 shows the demographic data for the participants in each group. There
were no significant differences in BMI between any of the glucoregulatory groups
(F(3,152) = 1.736, ns). Similarly, BMI was not related to any measure of cognition
or mood and so was not considered further. Gender did not determine
glucoregulatory status x2(3) = 5.177, p = .158. Gender significantly predicted
memory (F(1,154) = 4.118, p< 0.05); females had better memory than males (M
9.4(0.4) F 10.6(0.3)). However, there were no interactions between gender and
glucoregulatory profile.
I l l

Poorer GT LBG above
baseline
Poorer GT LBG below
baseline
Better GT LBG above
baseline
Better GT LBG below
baseline
P
BMI 28.1(0.8) 29.5(1.6) 25.0(1.4) 26.8(1.0) ns
Gender M 20 17 10 11 ns
F 47 26 15 8Age 58(11.4)* ** 56.2(9.6) 53.0(10.7)* 54.2(10.8) ** * p<0.01
** p<0.005Table 13. Demographic data for the four glucoregulatory groups. Adults with better GT and LBG above baseline were significantly younger than those with poorer GT and LBG above baseline. Similarly, adults with better GT and LBG below baseline were significantly younger than those with poorer GT and LBG above baseline.
Adults with better GT and LBG above baseline were significantly younger than
those with poorer GT and LBG above baseline (p<0.01). Similarly, adults with
better GT and LBG below baseline were significantly younger than those with
poorer GT and LBG above baseline (p<0.01). It was considered whether age
should be entered in the analysis as a covariate. A premise of ANCOVA is that the
effects of the covariate should be statistically independent of the effects of group
(Miller and Chapman, 2001). The main reason for this is that if the treatments
differentially affect the covariate scores, then ANCOVA would remove from the
treatment sum of squares part of the treatment effect (Maxwell and Delaney,
1990), hence reducing rather than increasing power to detect group effects (Miller
and Chapman, 2001). Given the relationship between age (potential covariate) and
glucoregulatory status (IV) it was clear that this assumption would have been
violated. In addition, the assumption of homogeneity of slopes states that the
groups should not differ in their regression of the dependent variable on the
covariate. Given that age was not only related to glucoregulatory group but also
expected to predict cognition this assumption would also have been violated.
112

Therefore, the effects of GT and LBG were considered using appropriate analysis
of variance designs. Typically they took the form of GT (Better/poorer) X LBG
(Above/below baseline) X Age. Age was considered by distinguishing those 60
years and below from 61 years and above. This was chosen as the cut off
because it had been argued that there may be a critical period, which begins at
around 60 years, during which glucose intolerance has the greatest impact on
cognition (Biessels et al, 2008). Table 14 shows cell frequencies for each level of
each factor included in the analysis. Given the uneven sample sizes sum of
squares type III were used which uses an unweighted mean and is therefore more
robust to the effects of uneven sample sizes. Interactions were probed using
appropriate post hoc tests. Where Levene’s test for equality of variances was
significant adjusted p values were reported. Where interactions are not mentioned
it should be assumed that they were non-significant.
LBG below baseline LBG above baselineBetter GT Poorer GT Better GT Poorer GT
Younger Older Younger Older Younger Older Younger OlderN = 12 N = 9 N = 25 N = 16 N = 18 N = 7 N = 32 N = 35
Table 14. Cell frequencies for each level of each factor included in the analysis. GT-Glucose tolerance. LBG - Lowest blood glucose.
3.4 Results
3.4.1 Memory
A four way ANOVA was calculated, GT (Better/poorer) X LBG (Above/below
baseline) X Age (45 - 60 yrs / 61 - 85yrs) X Immediate / delayed recall. The
interaction GT X Age X Immediate / delayed recall reached significance (F(1,146)
= 7.02, p<0.009). Post hoc tests revealed that older participants (61 - 85yrs) with
poorer GT forgot more words (difference between immediate and delayed recall)

than both older participants with better GT (6.8(2.8) vs 5.3 (2.1); p<0.02) and
younger participants (45-60 yrs) with poorer GT (6.8 (2.8) vs 4.9 (2.3); p<0.01).
The nature of GT did not influence the forgetting of younger participants. LBG did
not affect the number of words forgotten (6.2(2.4) vs 5.9(2.3); F(1,146) = 0.56, ns).
3.4.2 Semantic Memory
Semantic memory was considered in a GT X LBG X Difficulty level (letters C, F or
L) X Age. The main effect of difficulty reached statistical significance (F(2,292) =
2.94, p < 0.05); participants retrieved fewer words with L the most difficult letter.
However, age (F(1,146) = 0.69), ns), GT (F(1,146) = 0.04 , ns) and LBG (F(1,146)
= 1.41, ns) did not influence semantic memory.
3.4.3 Working Memory
When the response times with the serial sevens test were examined the interaction
GT X LBG reached significance (F(1,139) = 5.57, p<0.02). Post hoc tests showed
that with those with better GT responses did not differ depending on LBG.
However, in those with poorer GT, if LBG fell below baseline, mental arithmetic
was performed more quickly (p<0.02). No other post hoc tests reached
significance (Figure 11). When the number of correct responses was examined
the GT X LBG X Age interaction was not significant (F(1,139) = 0.326 ns). All main
effects and other interactions were similarly non-significant.
!ij
114

3300
3100'in£ 2900tn| 2700
F
§ 2500
8 2300 £
2100
1900■
Better GT Poorer GT■ LBG below beseline OLBG above baseline
Figure 11. The effect of glucose tolerance and of staying above or falling
below baseline glucose values on working memory reaction times. Data are
the mean (standard error) in milliseconds (ms) for working memory reaction times
in those with better or worse GT and LBG above or below baseline. A lower score
indicates better performance. Those with poorer GT and a LBG below baseline
had significantly faster responses than those poorer GT and LBG above baseline *
p< 0.02).
115

3.4.4 Cognitive decline
There was a main effect of age on cognitive decline (F(1,147) = 7.961, p < 0.002).
Participants over the age of 61 showed greater cognitive decline than those aged
60 or under (-0.86(0.268) vs + 2.32(1.78)), however, the effect of age did not
influence the effect of either GT or LBG. When a three way analysis was
calculated, GT X LBG X Age, the GT X LBG interaction achieved statistical
significance (F(1,147) = 7.331, p<0.008; Figure 12).
When participants who’s LBG fell below baseline were considered, those that had
poorer GT had less cognitive impairment than those with better GT (p<0.05).
However, when those who’s LBG remained above baseline were examined, a
poorer GT was associated with greater cognitive impairment than with those with
better GT (p<0.006). When those with poorer GT were considered, those with a
LBG above baseline had significantly greater cognitive decline than those LBG fell
below the baseline (p<0.0001). When those with good GT were considered there
were no differences depending on LBG. Thus in those with poorer GT the
tendency for LBG to fall below baseline was associated with less cognitive decline.
116

Better GT Poorer GT1 -i
a>
= 0.5 H o <ua® 0
■ mm
| -0.5 O
-1 J
T
LBG below baseline DLBG above baseline
Figure 12. The effect of glucose tolerance and of staying above or falling
below baseline glucose values on Cognitive decline. Data are the mean
(standard error) for level of cognitive impairment in those with better or worse GT
and with LBG above or below baseline. A negative score indicates more
impairment. Those with poorer GT and LBG above baseline had significantly more
cognitive decline than those poorer GT and LBG below baseline * p< 0.001.
117

3.4.5 Vigilance
When the number of correct responses were analyzed the interaction GT X LBG X
Age X Min of test was non-significant (F(4,528)=0.642, ns) and similarly all main
effects and other interactions failed to reach statistical significance. Similarly with
the speed of responding the GT X LBG X Age X Min of test was non-significant
(F(4,536)=1.01, n.s.).
3.4.6 Reaction Times
With decision times the GT X LBG X Age X Number of lamps interaction was
significant (F(3,432) = 2.84, p <0.03). There were, however, no differences when
those under the age of 60 were selected (F(3,171) = 0.17, n.s.). However, in the
older individuals there was a main effect of GT (F(1,57) = 12.90, p< 0.001); the
responses of those with poorer GT were slower (1266.9(84.6) vs 843.8 (81.9)).
LBG did not influence decision times (1019.1(92.2) vs 991.7(73.22); ns). In
contrast, with decision times, movement times were not influenced by either GT or
LBG.
3.4.7 GHQ
With the overall GHQ score there were no interactions involving either GT
(F(1,146) = 0.23, n.s.) or LBG (F(1,146) = 0.30, n.s.). However, there was a main
effect of age (F(1,146) = 5.030, p<0.02); participants over rather than under the
age of 61 reported poorer mental health (58.3(1.24) vs 53.2(1.88)).
i\
118

However, with the depression sub-scale there was a significant GT X LBG
interaction (F(1,146) = 7.039, p< 0.009; Figure 13). When a LBG that fell below
baseline was combined with poorer GT, depression was less than when it was
combined with better GT (p<0.02). However, when those with LBG above baseline
were considered those with poorer GT were more depressed than those with better
GT (p<0.01). When those with poorer GT were selected, those with LBG below
the baseline had a less depressed mood than those without that tendency
p<0.007). When those with better GT were selected, those with a LBG below
baseline had a more depressed mood than those whose values remained above
baseline (p<0.04). Thus, a LBG below baseline was associated with less
depression in those with poor GT, whereas it increased the depression of those
with better GT. Age did not influence levels of depression (F(1,146) = 0.30, n.s.).
119

Better GT ' Poorer GT ■ LBG below baseline DLBG above baseline
Figure 13. The effect of glucose tolerance and of staying above or falling
below baseline glucose values on depression ratings. Data are the mean
(standard error) for level of depression in those with better or worse GT and with
LBG above or below baseline. A higher score indicates more depression. Those
with poorer GT and LBG above baseline had a more depressed mood than those
with poorer GT and LBG below baseline (P<0.007). Those with better GT and LBG
above baseline had a less depressed mood than those with better GT and LBG
below baseline (p<0.04). Those that had LBG below baseline and had better GT
had a more depressed mood than those that had LBG below baseline and had
poorer GT (p<0.02). Those that had LBG above baseline and had better GT had a
less depressed mood than those that had LBG below baseline and poorer GT

When the anxiety subscale was similarly considered the interaction GT X LBG was
non-significant (F(1,146) = 0.29, n.s.) and there was no effect of age (F(1,146) =
1.03, n.s.). However, the main effect of GT reached significance (F(1,146) = 4.67,
p< 0.03), those with poorer rather than better GT were more anxious (22.2 (0.53)
vs 20.7(0.51)).
3.4.8 Sympathetic nervous system symptoms (SNS)
There were no effects of LBG on SNS symptoms (F(1,146) = 0.56, n.s.). However,
the interaction GT X Age reached significance (F(1,146) = 9.38, p<0.003). In
participants under 60 years there were no differences in SNS symptoms
depending on better or poorer GT. However, in those over the age of 61, poorer
compared with better GT, was associated with more SNS symptoms (p<0.003);
327.62 (148.92) vs 206.52 (135.92)). In addition, when those with poorer GT were
selected there were no differences between older or younger participants.
However, when those with better GT were considered, those over the age of 61
reported fewer symptoms than those under 60 years (p<0001); 206.50 (135.9) vs
360.59 (159.60)).
3.4.9 Neuroglycopenic symptoms
With neuroglycopenic symptoms the interaction GT X Age approached significance
(F(1,146) = 2.92, p < 0.07). There were no differences in neuroglycopenic
symptoms, depending on GT, in those 61 years or over. In contrast those under
the age of 60 with poorer rather than better GT reported more neuroglycopenic
symptoms (492.2(168.4) vs 416.3(161.0); p<0.04). LBG did not effect
neuroglycopenic symptoms (F(1,146) = 0.08, ns).
121

3.5 Summary
• Older adults’ aged 61 years or over, who had poorer, rather than better, GT
had poorer memory, slower decision times, and more SNS symptoms.
• Older adults’ with poorer GT and LBG below baseline had less cognitive
decline, rated themselves less depressed, and had faster working memory
than those with poorer GT and no LBG (Figures 12 and 13).
3.6 Discussion
The pattern of findings is consistent with the literature dealing with the effects of
aging on cognitive performance (Verhaeghen et al, 1997). Those 61 years or over
had poorer episodic memory, greater cognitive decline, slower decision times and
poorer mental health although vigilance and semantic memory did not differ. In
addition, the negative effects of poor GT were more pronounced in those over 61
years; in older rather than younger individuals, poorer GT was associated with
slower decision times, forgetting more words and a higher frequency of SNS
symptoms. Although previously those considering the relationship between GT and
cognition have tended to report a stronger association in older (Messier et al, 2003;
Convit et al, 2003; Kaplan et al, 2000) rather than young adults (Lamport et al,
2009; Awad et al, 2002; Kaplan et al, 2000; Messier et al, 1999; Yaffe et al, 2004),
this is the first study to directly compare younger and older adults with a similar
level of impaired GT. Although the exact mechanism is to be determined, the
present data supported the idea of a synergistic interaction between age-related
changes in the brain and the metabolic consequences of impaired GT (Ryan and
Geckle, 2000).
122

However, given the relationship between glucose tolerance and age (Tables 13
and 14) and the use of dichotomisation the present findings should be interpreted
cautiously. Median splits are highly sample dependant and thus present difficulties
in generalisation. In addition, they are unrealistic, with individuals close to but on
opposite sides of the cutpoint characterized as having very different rather than
very similar outcome. Further, the central tendencies of two dichotomised groups
may be artificially shifted further apart by a small number of extreme observations
at either end of a continuous measure. This latter point has the potential to strongly
bias results. In fact, it has been argued that dichotomizing continuous predictor
measures may lead to overestimates of strength of relationship accompanied by
an increase in Type I errors (Maxwell and Delaney 1993). This is particularly true
when testing for interactions and may be partially explained by an inability to
distinguish nonlinear effects from interaction effects when artificially dichotomizing
variables (Maxwell and Delaney, 1993).
On the other hand, as discussed by Cohen (1983), dichotomization can lead to a
loss of one-fifth to two-thirds of the variance that may be accounted for by the
original continuous variables, and a concomitant loss of power equivalent to that of
discarding one-third to two-thirds of the sample; thus it is possible that the present
approach is a conservative one that would likely bias against significant results.
An alternative approach is to consider the interaction between two continuous
variables using moderated regression (aka simple slopes). Essentially, the effect of
an IV on a DV is not a single number but, rather, a function of a MV (moderator
123

variable). However, the creation of a cross-product term may result in substantial
collinearity with its constituent parts, making it difficult to detect main and
interaction effects and increasing the chances of type 2 errors. The commonplace
response to this problem is to mean-center (Aiken and West, 1991), however, it
has been illustrated that this is not always successful (Echambadi and Hess 2004).
In fact, a comparison of centered and raw score analyses demonstrated the two
methods to be equivalent; yielding identical hypothesis tests associated with the
moderation effect and regression equations (Kromrey and Foster-Johnson 1998).
Given evidence of interaction between IV and MV, investigators typically probe that
interaction by estimating the conditional effect of IV at various values of MV, and
testing whether it is statistically different from zero (Aiken & West, 1991). If MV is
continuous, the dominant approach is to set MV to various values that represent
low, medium, and high, such as a standard deviation below the mean, the mean,
and a standard deviation above. This approach, has been coined the ‘pick-a-point’
approach (Bauer & Curran 2005) due to its arbitrary nature and falls pray to many
of the criticisms of artificial dichotomisation.
The Johnson-Neyman technique for probing interactions avoids the need to
arbitrarily select values of the moderator at which to estimate the conditional
effects of IV and identifies the value or values within the measurement range of the
moderator where the conditional effect of IV transitions between statistically
significant and not (Hayes 2012). These values identify the boundary or
boundaries of regions of significance. However, determining the significance region
involves comparing the slopes at each unique predictor value, thus yielding
statistical tests for each IV value. It is well-known that if each null hypothesis is
124

tested at nominal level a, the overall Type I error rate will be substantially inflated
(Lazar and Zerbe 2011).
In order to confirm the present findings a slope analysis was conducted as detailed
above using the SPSS macro PROCESS (Hayes 2012). Memory was entered as
the dependant variable, age as the independent variable and blood glucose levels
after two hours as the moderator; all variables were continuous. As expected both
age ((3 = 0.2, p<.01) and glucose tolerance (p= 2.0, p<.003) predicted memory.
The interaction was also significant ((3 = 0.03., p<.002) (see appendix 8 for a table
and scatter plot of these effects). The Johnson-Neyman technique identified 7.2
mmol/l as the region of significance; age predicted memory in those with blood
glucose greater than 7.2mmol/l, therefore supporting the validity of our median split
(7mmol/l) for this factor. Similar effects occurred when decision times were plotted
against age for those with better or poorer GT (Appendix 9).
The most noteworthy finding of the present study was that in those with poorer GT,
having blood glucose that fell below baseline values was associated with reduced
cognitive decline (Figure 11), improved working memory (Figure 12) and
decreased depression (Figure 13). Although the brain adaptation to low levels of
blood glucose has been little considered in the context of the cognitive decline of
healthy humans, similar phenomena have been described in diabetics and animal
studies. In animals low blood sugar levels (2.5 - 3.0mmol/l) have been reported to
induce brain adaptation such that subsequently cognitive functioning was improved
(Jacob et al, 1999; McNay and Sherwin, 2004; McNay et al, 2006 Fruehwald-
Schultes et al, 2000; Mellman et al, 1994; Boyle et al, 1994). For example studies
125

have reported that a single episode of low blood glucose resulted in increased
hippocampal interstitial glucose concentrations (Jacob et al, 1999; McNay and
Sherwin, 2004; McNay et al, 2006; Oz et al, 2009; Criego et al, 2005; Boyle et al,
1994). You can speculate that this increase in brain glucose levels may enhance
subsequent cognitive performance by providing a greater supply of glucose during ,
periods of demand. For example, maze learning by rats, a task that is associated
with a drop in hippocampal interstitial glucose levels (McNay et al, 2000; 2001),
was performed better after three days of exposure to hypoglycaemia (McNay and
Sherwin, 2004): there were smaller falls in interstitial glucose than when animals
had not been exposed to hypoglycaemia.
Although the mechanisms underlying these findings remains unclear, GLUT 1 at
the endothelium and the neuronal glucose transporter GLUT 3 are both up
regulated following hypoglycaemia (Kumagai, 1995; Koranyi et al.1991; Boado and
Pardridge,1993; Uehara et al 1997) and these adaptations lead to an increased
level of brain glucose (Lei and Gruetter, 2006). The glucose transporter GLUT 1,
that transports glucose across the BBB, is highly expressed in the vascular
endothelial cells (Poitry-Yamate et al, 2009) and maintains a constant glucose
concentration gradient from blood to brain; (approximately 5-1 during euglycemia)
(Lund-Andersen, 1979). Thus factors that compromise the integrity of the BBB are
likely to have a significant impact on glucose concentrations within the brain.
Endothelial dysfunction is a commonly observed in those with hyperglycemia and
insulin resistance (Cohen, 1993; Johnstone et al, 1993; Caballero 2012) and
reduced endothelial vasodilatation may decrease the number of GLUT 1
transporters in contact with the blood. Convit (2005) proposed that endothelial
126

dysfunction may lead to a state of ‘functional hypoglycaemia’ within the brain; that
is region specific low levels of glucose develop during times of increased
activation. It is interesting that localized drops in brain interstitial glucose during4
activation have been reported to be greater, and to last longer, in aged rather than
young animals (McNay and Gold, 2000) and that exposure to hypoglycaemic
episodes modified the effects of aging on cognitive decline (McNay, 2005).
These observations suggest possible mechanisms that may underlie the present
finding that older adults were more susceptible to the deleterious effects of
impaired glucose tolerance. If similar mechanisms as those found in rats occur in
humans, periods of low levels of blood glucose may stimulate adaptations that
compensate for the impaired glucose transport across the blood brain barrier
(BBB) seen in people with poor GT. In this way ‘functional hypoglycaemia’ could
be alleviated leading to improved memory and reduced cognitive decline.
It is also interesting that the tendency for blood to fall below baseline values had
few effects in the absence of poor GT. It is possible that the beneficial effects
associated with LBG are more easily demonstrated in those with poorer GT
because performance had already deteriorated; a reflection of lower levels of brain
glucose. Consistent with this analysis the SNS and neuroglycopaenic symptoms
were related to GT rather than LBG. It may be hypothesised that if LBG leads to
an adaptive response that increases cerebral interstitial glucose, then those with a
tendency for LBG would have fewer neuroglycopaenic symptoms than those
without this tendency, a phenomenon only observed in those with poorer GT.
127

The question arises as to why the blood glucose levels of some with poor GT
remained high while in others there was a sharp decline after 120 and 150 minutes
(Figure 8): it was this fall in blood glucose that was beneficial (Figures 10-13). It is
probable that this effect reflected increased late insulin secretion in those with the
tendency for blood glucose to fall below baseline levels. Glucose induces insulin
secretion in a biphasic pattern; the first phase is a rapid release that lasts only a
few minutes followed by a much more steady sustained secretion (second phase;
Seino et al, 2011). The usual response to insulin resistance is compensatory
hyperinsulinaemia (Polonsky, 2000), therefore hyperglycaemia and glucose
intolerance do not occur until insulin secretion is impaired (Seino et al, 2011). The
first phase of insulin secretion is attenuated in those with poor GT, while the
second phase is only usually reduced when diabetes ensues (Luzi et al, 1989;
Seino et al, 2011; Triplitt, 2012; Weir et al, 2004). Thus it is possible that the
adults with poorer GT whose blood glucose values subsequently fell may have
developed hyperinsulinaemia to compensate for insulin resistance. In contrast
those with poorer GT whose values did not subsequently fall rapidly, appeared not
to have developed hyperinsulinaemia and therefore lacked the ability to
compensate for poor GT. This consideration of the role played by insulin in
controlling blood glucose in those with poor GT raises the question as to whether it
may more directly play a part in improving the cognitive function of those with
poorer GT whose levels fell below baseline values. Although the current
consensus is that glucose transport into the brain is not dependent on insulin, the
hormone does cross the BBB (Banks et al 2012) and is thought to modulate
memory (McNay, 2010; Benedict et al, 2004; Zhao et al, 2004). As such
128

differential rates of insulin secretion could be part of the mechanism underlying the
association between falling blood glucose and enhanced cognitive functioning.
Poorer GT was also related to higher levels of anxiety, regardless of age. People
with glucose intolerance show hyperactivity of the hypothalamic-pituitary-adrenal
(HPA) axis (Anagnostis et al, 2009) and increased tissue sensitivity to cortisol
(Andrews et al, 2002). Cortisol profiles that deviate from the ‘normal’ pattern of
release have been associated with higher levels of stress and anxiety (Vedhara et
al, 2003); responses that potentially underlie the association between have poor
GT and being more anxious. In addition, at least in those over the age of 61,
poorer GT was associated with more SNS symptoms. Future studies in this area
would thus benefit from monitoring the cortisol response.
In conclusion, this chapter sought to determine the effect of poor glucose tolerance
and low blood glucose levels on cognitive decline, memory and mood in a sample
of older adults. Findings include that older rather than younger adults with poor GT
had poorer cognitive performance. In addition, the tendency to develop LBG was
associated with better cognitive performance and mood in those with poorer
glucose tolerance. This observation was obtained in a sample without diabetes
and extends to an earlier stage than previous observations that diabetes increases
the chances of developing dementia (Cheng et al, 2012). As those differing in their
GT have previously been found to response differentially to meals differing in their
glycaemic load (Nabb and Benton, 2006a,b) the question arises as to whether
cognitive decline in older adults may be influenced by dietary interventions. This
question is addressed in the next chapter.
129

CHAPTER 4
Modulating the glycaemic load of meals affects older adults’ cognition and
mood depending on their glucose tolerance.
4.1 Introduction
In chapter 3 it was reported that an inability to control the level of postprandial
blood glucose is related to cognitive decline, particularly in adults over the age of
60; those with glucose intolerance have poorer cognitive performance and mood.
In addition, a tendency to develop LBG was related to having a better mood, more
accurate working memory and less cognitive decline (Figures 11 to 13), however, it
is not clear whether such benefits are maintained during subsequent LBG. Acute
LBG, as sometimes occurs following a high GL meal (Figure 1), is associated with
temporary decrements in performance and mood (Taylor and Rachman, 1988); a
lower GL meal may avoid this consequence. However, how previous LBG
interacts with the GL of a meal has not been examined. The present study
compared the influence of three breakfasts that differed in the speed with which
they release glucose into the blood stream on the cognitive functioning and mood
of older adults. In addition, the interaction between manipulating the GL of meals
and pre-existing LBG was examined.
The evidence supporting benefits to older adult’s cognition of consuming a low GL
meal is limited and inconsistent (Gilsenan et al. 2009). As discussed in chapter 1
one possibility is that the response to a meal depends on pre-existing individual
differences in glucose tolerance (GT). Glucose tolerance becomes poorer with
age and it has been" argued that meals with a lower rather than a higher GL may
“reduce the cognitive differences between better and worse glucoregulators”
130
(Lamport et al, 2009. p. 408). Thus the hypothesis presently tested was that those
with poorer rather than better GT would differentially respond to meals differing in
GL.
An important consideration is the time scale over which effects were examined, a
dimension that has varied considerably (Table 1, 2 and 5). Although there may or
may not be a transient benefit from consuming a high GL within the first hour, high
GL meals may generate a hypoglycaemic reaction two to three hours later that
disrupts cognitive functioning. Alternatively, a lower GL meal that releases glucose
more slowly may not confer an immediate benefit but may prevent a decline later
on. The finding that a low GL meal did not benefit the memory of children up to
sixty minutes after consumption, but it did particularly after three hours (Chapter 2),
illustrates the need to examine the prolonged response to a meal. This study
therefore examined the cognitive effects of meals differing in GL up to one hundred
and eighty minutes post consumption.
Although there is a relationship between poor glucose regulation and cognitive
decline, particularly in adults over the age of sixty (Chapter 1 and 3), the
mechanisms mediating this relationship remain to be determined. Interestingly the
disruption of cerebral glucose metabolism that is observed in dementia also occurs
in at risk individuals before cognitive symptoms develop (Mosconi et al, 2007).
Therefore, any factor that compromises neuronal glucose supply has the potential
to exacerbate the problem. Conversely any factor that increases the supply of
glucose to the brain or its utilisation could aid cognitive performance. Thus this
study also tested whether a lower rather than a higher GL meal, that provides a
131
consistent supply of energy, may benefit cognition in older adults with early
cognitive decline, especially during the late postprandial period.
4.2 Methods
4.2.1 Participants
As described in section 3.2.1.
4.2.2 Procedure - Day 1
As described in section 3.2.2
4.2.3 Procedure - Day 2
On a second testing day, a minimum of three days later, after again fasting
overnight, participants completed a baseline mood measure and randomly
consumed one of the three test meals (0830-0900) and took the test battery on
three occasions 0930-1000; 1045-1130; 1215-1245 (Table 15). Different but
comparable versions of each test were used at each session. Participants were
previously exposed to the tests (different versions where appropriate), on an earlier
day, and thus had an opportunity to practise. These data were analysed separately
(see chapter 3) and were not entered as covariates due to their statistical
relationship with glucoregulatory group (Miller and Chapman, 2001) (see section
3.4). They consumed the entire breakfast and did not consume any other food
throughout the morning, although water was consumed if requested. Each test
132

battery included the tests in the same order: mood, immediate recall of words,
serial sevens, reaction times, sustained attention, delayed recall of word list, mood.
08:30-09:00 (0 min).
Moods measured / eat breakfast.
09:30-10:00(+30min).
1st testing session.• Mood - 2 minutes.• Immediate recall of word list - 5 minutes.• Serial sevens - 3 minutes.• Reaction times / sustained attention - 15 minutes.• Delayed recall of word list - 2 minutes.• Mood - 2 minutes.
10:45-11.15 (+105 min).
2nd testing session (as above).
12:15-12:45 (+195 min).
3rd testing session (as above plus verbal fluency).
Table 15. Procedural timeline for the study of GL and cognition on older adults
4.2.4 Breakfast
Each meal consisted of two small slices of whole meal toast (60 kcal) topped with
reduced sugar jam, 100g of plain low fat yogurt that was sweetened with either 30g
of glucose, sugar or isomaltulose. Participants also received an orange flavoured
drink that was sweetened with 25g of one of the three sugars; Sucrose, Glucose or
Isomaltulose. Table 16 presents the nutritional composition of the three test meals
that were identical in terms of macro-nutrients but produced a GL of 24.3, 34.9 or
45.4.
133

Low
er G
L
GL
COCO * 1.
14
I iCO
I i 5.12
CO
CM
O
69
*CD
I ICMCO I i 32 i
Fat
1.2
000 0.
25
I i o I i o 1.45
Pro
5.0
0.2 CO
I I o l i o 9.3
CH
O
19.4
2.4 o
CD I iLO
I iCD CD
LO
Kca
l
110
- 'nT I i
09
I i 64 275
Medi
um
GL
GL
13.3 *
1.14
I
oo
1 l 10.7
l 34.9
0
69
*CD
I 67 1 i 67 l l
Fat CNJ
T™
000 0.25
I o 1 I o I 1.45
Pro
5.0 0.2 CO
i o 1 I o l 9.3
CH
O
19.4 2.4 o
CD ILO
1 ICDx— l 56
.4
Kca
l
110
T“ Xt" i 60 1 I 64 l 275
GL
13.3
* 1.14 LO
1 ■CO
I l 45.4
O
69 * CD 100
1 1 100
I I l
- j
Fat
1.2 oo
o 0.25
o 1 1 o I l 1.45
0J=o>jX
Pro
5.0
0.2
4.3
o 1 1 o i l 9.3
OH
O
19.4
c\joCD
LO1 1
CDX— I I
CDLO
Kca
l
110
■sf 60 1 1 64 I I 275
2 sli
ce
who
lem
eal
brea
d.Lo
w ca
rboh
ydra
te
jam
* 25
gLo
w ca
lorie
yo
ghur
t 10
0g15
g gl
ucos
e.
15g
sucr
ose.
15g
isom
altu
lose
.
Drink
25
g G
luco
se.
Drink
25
g S
ucro
se.
Drink
25
g Is
omal
tulo
se.
_j<1-O1-
£ O3 W0 w o0 xrj-0 ’E «£ o -J2u co m O O 0
■D L_0 *o E 2
0-Q
0 O O .t=CS. °0 w£ -o § O> -QE © .© £.2 £ 2 c_g* o o 73
_Q C 0 v;© O£ -Q O
0 gi_ <n
o<50
0 oo ©>4->X o© o 0 © "o 0
0JO0 VE■s © 0
0 3 c _.2 H.t=: 0.b o0 -Q C 0■a -a0 0l = gE 0 E 03 > 0 0
m ©C IQ) 0E "0’? °0 H=X ^5 ©<D ©JZz ©O ? c 21 s § »0
0 -0 “ 01 sc ■*—1• 0 o 0o0E0■C
C -Q — 0 ■a -gf i.2 x o 0.2 oo SC -C 0 .□>E E_0 (/)0 u_c■*"* -Q O 3 0 0C =£ ©0 >,C -Q
1 s_I0 © 0E co 0 ©
0 01“ JD SZ 0CO 0
-b 0 0S E 0 oH J=
O „o I
£ l

4.2.4.1 Test battery
The test battery included the following tests administered in the order; Mood,
Episodic Memory - Word list recall (immediate and delayed), Working memory -
Serial sevens, Vigilance - Sustained attention, Simple and Choice Reaction Times,
Semantic memory - Verbal fluency (letters P, R and W, only administered during
the last testing session; after 180 minutes), Mood. Participant also took the
National adults reading test. These tests are described in section 3.2.3.
4.2.4.2 Mood (POMS)
Participants were asked to report how they felt "at this moment" using visual
analogue scales with pairs of adjectives at the ends of 100 millimetre lines;
Composed / Anxious; Hostile / Agreeable; Elated / Depressed; Unsure / Confident;
Energetic / Tired; Confused / Clearheaded. Mood was measured both before and
after each of the three testing sessions (appendix 10).
4.2.4.3 Glucoregulatory profile
As those with both poorer glucose tolerance (GT) are more likely to display mild
cognitive decline and those with the tendency to develop lower blood glucose
levels (LBG) are less likely to display mild cognitive decline (Chapter 3), the
sample was distinguished depending on the results of the day one OGTT.
Participants were divided into four groups according to their blood glucose levels
after 120 and 150 minutes.
To allow a sufficient sample size, if their blood glucose was 7.0mmol/l or higher
they were considered to have poorer GT; if their blood glucose was less than

7mmol/l they were considered to have better GT. The lowest blood glucose value
(LBG) was determined and individuals were divided into two further groups,
according to whether at any point during the test they either fell, or not fall, below
the fasting blood glucose value. Those whose blood glucose fell below fasting
values all had capillary glucose levels <5.0mmol/l by the end of the test (after 150
min). Importantly, 50% fell below 4.0mmol/l and 30% had glucose levels
<3.6mmol, the level about which an adrenal discharge begins to be observed in
healthy humans (Auer, 2004).
By classifying participants depending on whether they had poorer or better GT and
whether the LBG did or did not fall below the baseline value, four Glucoregulatory
groups were created: better GT and LBG above baseline (N=25); better GT and
LBG below baseline (N=21); poorer GT and LBG above baseline (N=67); poorer
GT and LBG below baseline (N=41) (Figure 10).
4.2.4.4 Calculation of cognitive decline
Older adults experiencing the early stages of cognitive impairment have marked
disruption in cerebral glucose metabolism (Mosconi et al, 2007) and hence it was
predicted that they might differentially react to the GL of meals. The NART scores
and the memory scores during baseline testing were transformed to Z scores (a
score transformed into differences from the population mean in terms of a standard
deviation). The NART Z scores were then subtracted from the day one memory Z
scores. A negative value indicated that the current memory was poorer than that
predicted by the intelligence score. This continuous measure was then divided
according to whether performance was less or more than would be predicted by
their NART score. This measure of cognitive decline was then entered into the
136

analysis of co-variance as a between participants factor. According to this
definition 53.4% of the sample had poorer memory scores than would be
predicted by the NART.
4.3 Statistical analysis
The data were examined using appropriate analysis of variance designs (ANOVA)
with performance on the first day of testing as the covariate. Typically they took
the form of Meal (Glucose, Sucrose, Isomaltulose) X Time (Test session 1-3) X
Glucoregulatory group (Poorer GT and LBG below baseline / Better GT and LBG
below baseline / Poorer GT and LBG above baseline / Better GT and LBG above
baseline). For clarity follow up tests are grouped according to glucoregulatory
profile (Figure 10). If on occasion a glucoregulatory group is not mentioned it
should be assumed that all follow up tests for that group were not significant. As an
alternative the third factor was Cognitive decline (Memory below or above the level
predicted by NART). When interactions were significant appropriate post hoc tests
were conducted to determine the nature of the interaction.
4.4 Results - effect of meal depending on glucoregulatory profile.
4.4.1 Episodic Memory
The data were analysed using a four-way ANOVA; Meal (Glucose, Sucrose,
Isomaltulose) X Short or Long term memory (ST/LT) X Time (Session 1-3) X
Glucoregulatory Group. Mauchly's Test of Sphericity indicated that the assumption
of sphericity had not been violated, x2(2) = 2.707, p = .258 (for time) and x2(2) =
1.362, p = .506 (for time X ST/LT). There was a significant Meal X Time X
137

Glucoregulatory group interaction (F(12,280) = 2.23, p < 0.01; Figures 14a and
14b).
138

Bette
r GT
/LBG
be
low
base
line
Bette
r GT
/LBG
ab
ove
base
line - c
- c
- c
0)t/>o
COEo(0
Q) 0)c (/> .± o
b3CO
0(0oo3
<D_C"a>w0.Q£O0JQ
<D>OSIreOm_iT3CreH’oL.Q>0 I— Si O
£ 0*5 00 ^0 _C1 1 — 0
■ I
0oE"D0L_0SIE0E0
0_c"000-Q0>O
_q0ODQ“Oc0
L-oE0Eco
3"D0i_0
o■000_QE0
0□L
0oc03
0S.
0
0-O
o£
pajaquiaiuai sp jo M jo jaqtunN
0StE3CC00E0
0 0
3 0W 0U_ Q
o0 -I—>0JD
0 i t 1_C 0 _c
ino
CNJoovQ.
0 .£=3
T 30
0~ o
inodvQl
inO)"Oc0
cn'oovo.ino
04000OO
J 3CD0■*—*0>*0
0
000Oo30
0 -i—i0>%0S
c0s-t-J00_o3
0Eo0
0<4—*00
0T5i_O£
■O0L_0SiE0E0
0_C*000JD0>OSi0
OCD
OE0E0i_ooQ.U0JZ00oo
_ 3CD0 4—•0Osz
0_c■000
S i
_o0-QOCO
0 E.§ q3
o
0 4—'0>.0
s z
0TJ
0S i
0
3"D0i_0■D
COqdvQ_
inO)~oc0■"frqdvQ.
afte
r 19
5 mi
n co
mpa
red
to th
ose
that
ate
sucr
ose
(p<0
.01)
and
th
ose
that
ate
isom
altu
lose
(p
<0.0
04).

Poor
er G
T/LBG
be
low
base
line
Poor
er G
T/LBG
ab
ove
base
line
LOo>
in
cILO
CEino>
cmE
LOO
c1LO
CO
p a ja q iu a iu a j
s p jO M j.o ja q iu n fs i
Q)Eh-
0COO
□0COoo3CO□0COoo
O
£o0o
03"D03
0>on00CD
■OcTOH0
0CO03-Q0>o
j D0CDCD
"DC0
^ in CD0E oCO
0ooa
0U_ooCl
O0OJ=
>»oE0Eco"re0E
03~o0
0T3
n■a0i_0nE0E01_
0T3
0jD
E3C0_CHQ)0_o3
-4—'
0Eo0o -
■a0&_0_QE0E00■a
0 k_a. o& * - +* 0u_ JD° E
3 cc 0 0E000
•4—<0 a
T“ 0o .E
0Oc03
0HJ2
00i_
00OO_3D)■D0
0JZ
cE
LO
L .0M—0>%oE0EL_0
with
poor
er G
T an
d LB
G be
low
base
line
did
not
depe
nd
on the
typ
e of
mea
l the
y ha
d ea
ten.

Better GT and LBG above baseline
When those with better GT and LBG above the baseline were considered those
who ate isomaltulose had better memories after 30 minutes (p<0.02), 105 minutes
(p<0.04) and 195 minutes (p<0.03) compared to those that had eaten sucrose.
Those who consumed isomaltulose also had better memories compared to those
who ate glucose after 105 (p<0.03) and 195 minutes (p<0.05), but not earlier
(Figure 14a).
Better GT and LBG below baseline
When those with better GT and LBG below the baseline were examined, those that
ate glucose had poorer memories after 195 minutes compared to those that had
eaten sucrose (p<0.01) and isomaltulose (p<0.004). There were, however, no
effects of meal after 30 or 105 minutes (Figure 14a).
Poorer GT and LBG above baseline
With the group with poorer GT, and LBG above the baseline, the consumption of
glucose rather than isomaltulose resulted in better memories after 30 minutes
(p<0.02), although not during the two later testing sessions. There were no
differences between those who consumed sucrose and those who ate isomaltulose
at any time. Similarly there were no differences in those eating glucose or sucrose
(Figure 14b).
4.4.2 Semantic MemoryiI The analysis Meal (Glucose, Sucrose, Isomaltulose) X Glucoregulatory Group was
non-significant (F(6,140) = 1.62, n.s.).
141

4.4.3 Working memory
Incorrect responses
Mauchly's Test of Sphericity indicated that the assumption of sphericity had not
been violated, x2(2) = 3.697, p = .158 (Time). The Meal (Glucose, Sucrose,
Isomaltulose) X Time (Sessions 1-3) X Glucoregulatory Group interaction was not
significant (F(12,264) = 0.624, n.s.). However, the interaction Meal X
Glucoregulatory Group approached significance (F(6,136) = 1.98, p<0.06
Better GT and LBG above baseline
Older adults with better GT, and LBG above the baseline, that ate glucose rather
than isomaltulose made more errors after 195 minutes (p<0.05). There was a
similar pattern of results after 105 minutes (6.2(7.1) vs 1.8(0.7)) and after 30
minutes (6.7(5.1) vs 2.5(2.1), however, these effects just missed statistical
significance.
Reaction times
Mauchly's Test of Sphericity indicated that the assumption of sphericity had been
violated, x2(2) = 52.725, p < .001 (time) therefore epsilon was estimated and the
degrees of freedom were adjusted using the Greenhouse-Geisser correction. The
analysis Meal (Glucose, Sucrose, Isomaltulose) X Time (Sessions 1-3) X
Glucoregulatory Group was not significant (F(7.829,177.457) = 1.10, ns).
4.4.4 Mood
Mood was measured upon arrival, prior to consumption of breakfast (baseline).
Initially baseline values (for total mood) were checked to ensure no significant
142

differences at baseline; The interaction Meal X Glucoregulatory group was not
significant (F(6,140) = 1.025 ns) and neither were the main effects of Meal
(F(2,140)=1.603, ns) and Glucoregulatory group (F(3,140)=0.939, ns) (Table 17).
Mood was also measured before and after each of the three testing sessions. To
determine the effect of the type of meal on mood, change from baseline scores
were calculated by subtracting the mood ratings at baseline from subsequent
scores. A positive score indicated an improvement in mood and a negative score
indicated a decline in mood from baseline. These scores were then entered in the
analysis Meal (Glucose, Sucrose, Isomaltulose) X Time (Session 1-3) X
Glucoregulatory Group X Before/after testing. Where Mauchly's Test of Sphericity
was significant Greenhouse-Geisser correction was reported.
Agreeable/Hostile
Clearheaded/Confused
Composed/Anxious
Elated/Depressed
Confident/Unsure
Energetic/Tired
BetterGT,LBG
GLUSUCISO
58.0(7.6)78.4(8.3)88.8(7.6)
73.1(8.3)77.4(9.0)81.8(8.3)
75.1(8.8)75.0(9.6)87.1(8.8)
55.8(7.7)60.6(8.5)73.5(7.7)
71.3(8.6)66.0(9.4)85.1(8.6)
53.6(9.9)60.8(10.9)70.5(9.9)
PoorerGT,LBG
GLUSUCISO
78.3(4.9)76.9(5.4)87.5(5.3)
75.2(5.4)70.1(4.9)75.3(5.8)
74.5(5.7)69.7(5.2)83.5(6.2)
62.7(5.1)57.7(4.6)66.5(5.5)
72.5(5.6)68.2(5.1)81.2(6.1)
66.0(6.5)51.2(5.9)65.0(7.0)
Poorer GT, No LBG
GLUSUCISO
74.2(3.9)83.0(4.2)80.9(3.6)
70.6(4.3)77.8(4.6)70.6(3.9)
67.7(4.5)71.8(4.9)77.4(4.3)
60.4(4.0)61.2(4.3)58.5(3.7)
72.1(4.5)70.4(4.8)72.1(4.1)
56.5(5.2)56.9(5.5)60.1(4.7)
Better GT, No LBG
GLUSUCISO
77.0(6.2)86.2(6.2)73.4(7.0)
76.2(6.7)74.0(6.7)63.7(7.6)
73.7(7.1)72.0(7.1)75.0(8.1)
57.5(6.3)59.2(6.3)56.7(7.2)
72.8(7.0)66.4(7.0)71.1(8.0)
62.0(8.1)53.3(8.1)56.7(9.2)
Table 17 Baseline mood for the four glucoregulatory groups prior to consuming one of the three test meals. Data are mean (standard error) for the six VAS mood scales taken at baseline. GT - Glucose Tolerance. LBG - Lowest Blood Glucose. GLU - Glucose based meal. SUC - Sucrose based meal. ISO- Isomaltulose based meal.
Initially the six mood dimensions were considered independently, resulting in one
main effect of the influence of the type of sugar. With the Agreeable - Hostile
dimension there was a main effect of Meal (F(2,140) =2.88, p<0.05). Those who
consumed isomaltulose (Isomaltulose) were more agreeable than those who
143
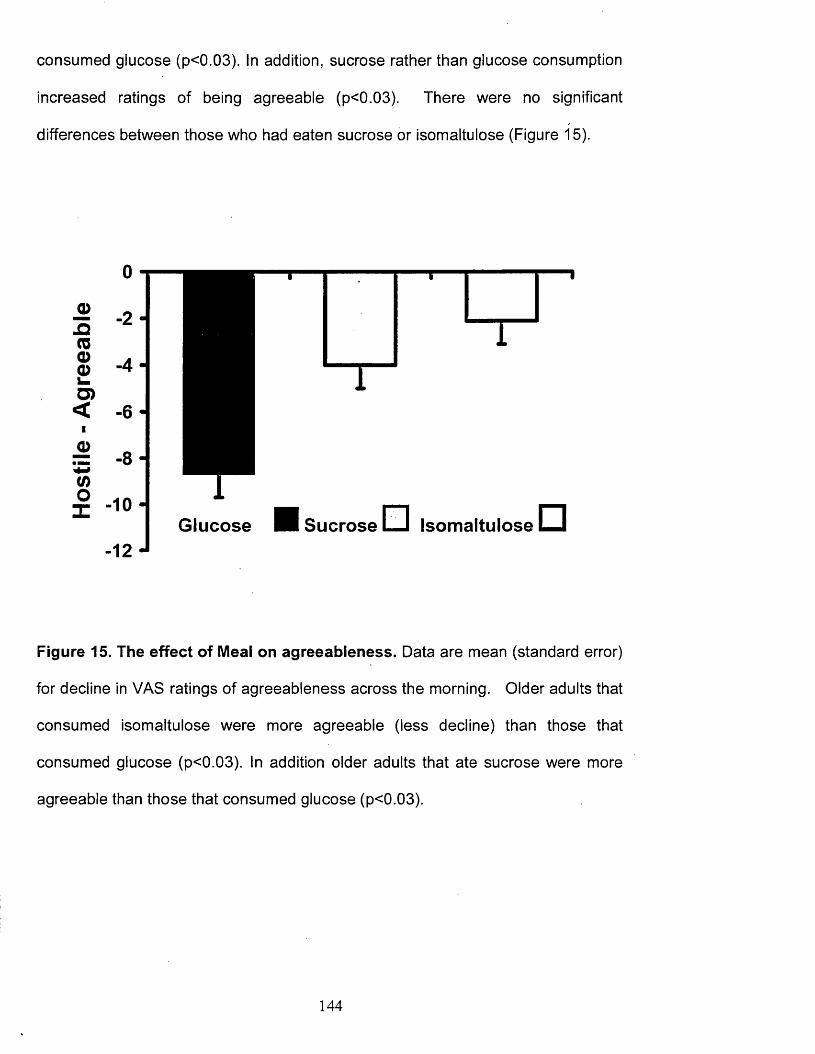
consumed glucose (p<0.03). In addition, sucrose rather than glucose consumption
increased ratings of being agreeable (p<0.03). There were no significant
differences between those who had eaten sucrose or isomaltulose (Figure 15).
□
I
Sucrose i_ i Isomaltulose □
Figure 15. The effect of Meal on agreeableness. Data are mean (standard error)
for decline in VAS ratings of agreeableness across the morning. Older adults that
consumed isomaltulose were more agreeable (less decline) than those that
consumed glucose (p<0.03). In addition older adults that ate sucrose were more
agreeable than those that consumed glucose (p<0.03).
144

There were also a series of significant interactions, for example, with Clearheaded
- Confused (F(11.4,266.3) = 2.33, p<0.009) and Elated - depressed
(F(11.4,266.2)=2.65, p<0.05) the Meal X Glucoregulatory group X Time interaction
reached statistical significance. The effects of the type of sugar were, however,
similar with the different mood dimensions. Rather than generating considerable
complexity by reporting a series of three way interactions for the six mood
dimensions, for brevity and clarity all six were added to produce an overall mood
score that illustrates the effects that were observed (see appendix 11) for the
interactions for each individual mood scales). The interaction Meal X
Glucoregulatory group X Time was statistically significant (F(10.8, 254.2)=2.177
p<0.02) (Figure 16a and 16b) and is representative of the types of effects found
with specific mood dimensions. Post hoc tests found a series of differences in the
response to meal.
Better GT and LBG above baseline
A profile of better GT with no LBG was associated with differential responses to the
type of meal. After both 105 (p<0.003) and 195 minutes (p<0.001) having
consumed sucrose was associated with a better mood than after a glucose
containing meal. The consumption of isomaltulose, rather than sucrose, resulted
after 105 minutes in a better mood (p<0.01). Similarly, after 195 minutes the
isomaltulose rather than glucose meal resulted in a more positive mood (p<0.03).
Poorer GT and LBG below baseline
Those with the poorer GT and LBG profile again responded to the nature of sugar
consumed. After 105 minutes having eaten the glucose containing meal resulted
145

in a poorer mood than when sucrose (p<0.04) was eaten with a trend for difference
between glucose and isomaltulose (p<0.07).
Poorer GT and LBG above baseline
When those with poorer GT and LBG above baseline were considered those that
ate glucose rather than isomaltulose (p< 0.05) reported better moods after 30
minutes. There was a similar trend for those who ate glucose rather then sucrose
(p<0.07) to report better moods after 30 minutes but this just missed significance.
146

Bette
r GT
/LBG
be
low
base
line
Bette
r GT
/LBG
ab
ove
base
line
3
I— S— I— I— Io o o o o o o o o © m LO O LO O LO o<r- 1 r - CM CM CO
i i i i i
o>c0</>TO-Q£_00.Q
0>o_QTOOCD
~oc
O0«♦-»0ja.c
0(0o.c
■oooEco150E
0a>*
0Oc03
0
TOCDT“0i_3O)
0 I— LO■Oo 0 CDo "O
cE 0L_ 0 00 X3 ^ v£2 CO0 x: o
X21
o■D oCD 0 V
XI CL0_C
3"O0 C
*0 s_ ECDCD
0•D LO
oJD o0> 0O oT
ooV
p iX)CD0
000p\
CO D . l__ l "—' O■D C 30c0 E 0
I— 0
LOCDV“
0
00 -ac
0
JZ■*->
0JD cCO 0JZ■*—> q £
> dVQ.
00o
"5 LO 3TJ o0 0i_ l_ E0 0 o"O cP 0
O 0 00
00o
0> .
o 0"0 3 XI00 CD -4—'
v -_Q 0 0Eol_
0 T3>%0
OO
H— XI E■D L_O 0OEc
d0x:
0X)
*—« T30 0 0CD 0 XIC _o 00 3 _cxz >o 0 *0c00
Eo0
00
JDp *■*" 0
0 >0 0 O
X20 > 00 0_c 00 CDQ _l
pooiu jeueg / pootu jajoog
min
(p<0
.001
). Th
e na
ture
of
the
mea
l co
nsum
ed
did
not
affe
ct
the
moo
d of
olde
r ad
ults
wi
th be
tter
GT
LBG
belo
w
base
line.

Poor
er G
T/LBG
be
low
base
line
Poor
er G
T/LBG
ab
ove
base
line
= O .E£
EinO
£
EID©
£
EoCO
£ ■ M
EtoO)
£
E1 0o
oCO
o o o o o o o o o O in LO O LO O LO o<r- 1 r r CM CM CO
a>c~o(/)reA5o0J2
0>0-Q0oCD
0(0oo_30)0
-4—*00
00ECDC'c 00 c
000A0>OA0
Coo00oo
_ 3
O)0
000
A
O0
A
0CD
■o 0C CD 0 _l
0 I—g 0h-00i .00Q.
00O£T3O0Eco*00E
> 0A0 03
0 .E o Ea g
“0c0I— 0
— o0 a >*
0Oc= IE I
0
I I
0 -t—»
3TJ0L_0Ao0o"000
A
Eo■0OOE
0CDC0
AO£ C 1“ 0■ 0 •° ECD cT“ 0 0 0
3 0.5 ? ro a. Q
0
<0*aooEL_0•*->0-Q■00>i_oCL0
ino
0ooCl
0
3T 30i_0AO
OoVQ.00OL .o30C0
V Q.0 0 _o3 i_H 0
C0_c
AOOE
0Eo0c0
A-4—4L—0
_C0
OOCL0C■00
300
pootu Jewag I pootu jajoog

4.4.5 Vigilance
Reaction times
Mauchly's Test of Sphericity for the factor min (1st, 2nd, 3rd, 4th, and 5th minute of
the test) indicated that the assumption of sphericity had not been violated, x2(2) =
0.540, p ns (Time), x2(9) = 8.164, p ns (Min), x2(35) = 36.045, p ns (Time X Min).
The interaction Meal (Glucose, Sucrose, Isomaltulose) X Time (Sessions 1-3) X
Glucoregulatory Group X Min (1st, 2nd, 3rd, 4th, and 5th minute of the test) was not
significant (F(48,1016)=0.85, n.s.). The interaction Time X Minute X Group
reached significance (F(24,1016)=1.95, p<0.004), however, follow up testing
showed no clear pattern and given the number of contrasts this effect was
considered to be the result of chance variation in a particular cell.
Accuracy
Mauchly's Test of Sphericity for the factor min (1st, 2nd, 3rd, 4th, and 5th minute of
the test) indicated that the assumption of sphericity had been violated , x2(9) =
33.918, p < .0001 therefore epsilon was estimated and the degrees of freedom
were adjusted, for interactions involving min, using the Greenhouse-Geisser
correction. Mauchly's Test of Sphericity for the factor Time (Session 1-3) indicated
that the assumption of sphericity had not been violated, x2(2) = 3.125, p ns.
Similay, Mauchly’s Test of Sphericity for the interaction Time X Min was not
significant, x2(35) = 40.366, p ns. When the accuracy during the vigilance task
was considered again the meal was without effect (Meal X Time (Sessions 1-3) X
Glucoregulatory Group X Minute, (F(7.4, 1003.6)=1.06, n.s.).
149

4.4.6 Reaction times
Decision times
Mauchly's Test of Sphericity indicated that the assumption of sphericity had been
violated, x2(20) < 79.203, p < .0001 (time X lamps) and x2(5) < 74.977, p < .0001
therefore epsilon was estimated and the degrees of freedom were adjusted using
the Greenhouse-Geisser correction. The interaction Meal (Glucose, Sucrose,
Isomaltulose) X Time (Sessions 1-3) X Glucoregulatory Group X Number of lamps
(1.2.4.8) was not significant (F(30.037,670.817)= 0.70, n.s.). The interaction Meal
X Time reached significance (F(3.747,5.620)=2.71, p<0.03), however, post hoc
tests failed to find any significant differences between meals at any time.
Movement times
Mauchly's Test of Sphericity indicated that the assumption of sphericity had been
violated, x2(20) = 58.802, p < .0001 (time X lamps) and x2(5) = 71.013, p < .0001
therefore epsilon was estimated and the degrees of freedom were adjusted using
the Greenhouse-Geisser correction. The interaction Meal (Glucose, Sucrose,
Isomaltulose) X Time (Sessions 1-3) X Glucoregulatory Group X Number of lamps
(1.2.4.8) was not significant (F(31.288,698.771 )= 1.02, n.s.).
150
4.5 Results - The effect of meal depending on cognitive decline.
4.5.1 Episodic memory
Mauchly's Test of Sphericity indicated that the assumption of sphericity had not
been violated, x2(2) = 4.775, p = .092 (Time) and x2(2) = 0.979, p = 0.613 (time X
ST/LT). . The interaction Meal (Glucose, Sucrose, Isomaltulose) X Short or Long
term memory (ST/LT) X Time (Sessions 1-3) X Cognitive decline (yes/no) was not
significant (F(4,286)=0.66, n.s.). However, there was a main effect of Cognitive
decline (F(1,143) = 8.79, p<0.004); older adults with cognitive decline remembered
fewer words than those with no cognitive decline (4.4 (0.1) vs 5.2 (0.1)).
4.5.2 Semantic memory
The analysis Meal (Glucose, Sucrose, Isomaltulose) X Time (Session 1-3) X
Cognitive decline (yes/no) X Difficulty (three letters of increasing difficulty) was not
significant (F(4,286) = 0.22, n.s.).
4.5.3 Working memory
Reaction times
Mauchly's Test of Sphericity indicated that the assumption of sphericity had been
violated, x2(2) = 58.504, p < .0001 (time) therefore epsilon was estimated and the
degrees of freedom were adjusted using the Greenhouse-Geisser correction. The
analysis Meal (Glucose, Sucrose, Isomaltulose) X Time (Session 1-3) X Cognitive
decline (yes/no) was not significant (F(2.5,179.9) = 1.017, n.s.).
151

Accuracy
Mauchly's Test o'f Sphericity indicated that the assumption of sphericity had not
been violated, x2(2) = 3.288, p = .267 (Time). The analysis Meal (Glucose,
Sucrose, Isomaltulose) X Time (Session 1-3) X Cognitive decline (yes/no) was not
significant (F(4,278) = 2.17, n.s.). There was, however, a significant Time X
Cognitive decline interaction (F(2,278) = 5.08, p<0.007). Those with cognitive
decline had a larger increase in errors across the morning (-0.2(3.7) vs -1.7 (4.0)).
To determine whether the nature of the meal effected decline in performance, in
those with and without cognitive decline, a two way ANOVA was conducted, Meal
X Cognitive decline, with changes in the number of errors produced from 30 to 180
minutes as the dependent variable. This interaction was significant; (F (2,144) =
3.01, p<0.05). Inspection of the means found a trend for those without cognitive
decline to have a smaller increase in errors if they had a lower rather than a higher
GL meal, although no comparisons achieved statistical significance.
4.5.4 Mood
Mauchly's Test of Sphericity indicated that the assumption of sphericity, for the
factor Time, had been violated, x2(2) = 12.789, p < 0.0001. When the overall mood
score was examined the interaction Meal X Glucoregulatory group X Before/after
testing X Cognitive decline was non-significant (F(3.9,278.8) = 0.76, n.s.).
152

4.5.5 Vigilance
Reaction times
The interaction Meal (Glucose, Sucrose, Isomaltulose) X Minute (1-5 minute of
test) X Time (Session 1-3) X Cognitive decline (yes/no) was not significant
(F(14.9,976.4)=0.77, n.s.).
Accuracy
Mauchly's Test of Sphericity indicated that the assumption of sphericity, for the
interaction Time X Min, had been violated, x2(35) = 55.679, p < 0.01. The
interaction Meal (Glucose, Sucrose, Isomaltulose) X Minute (1-5 minute of test) X
Time (Session 1-3) X Cognitive decline (yes/no) was not significant
(F(14.6,958.2)=1.00, n.s.).
4.5.6 Reaction times
Decision times
Mauchly's Test of Sphericity indicated that the assumption of sphericity had been
violated, x2(20) = 61.635, p < .0001 (time X lamps) and x2(5) < 74.319, p = .0001
therefore epsilon was estimated and the degrees of freedom were adjusted using
the Greenhouse-Geisser correction. The interaction Meal (Glucose, Sucrose,
I Isomaltulose) X Lamps (1, 2, 4, or 8 lamps) X Time (Session 1-3) X CognitiveIl| decline (yes/no) was not significant (F(10.4,712.4)=1.91, n.s.).?[
Movement times
Mauchly's Test of Sphericity indicated that the assumption of sphericity had been
violated, x2(20) = 77.442, p < .0001 (time X lamps) and x2(5) < 79.551, p = .0001
153

therefore epsilon was estimated and the degrees of freedom were adjusted using
the Greenhouse-Geisser correction. The interaction Meal (Glucose, Sucrose,
Isomaltulose) X Lamps (1, 2, 4, or 8 lamps) X Time (Session 1-3) X Cognitive
decline (yes/no) was not significant (F(10.0,688.5)=0.105, n.s.).
4.6 Summary
• The influence of meals differing in GL depended on pre-existing individual
differences in glucose tolerance.
• Although it has been assumed previously that it was those with poor
glucose tolerance that would benefit from a low GL meal, it was those with
better glucose tolerance who responded to a meal containing isomaltulose
with better mood and memory.
• It has been suggested that a tendency to develop low levels of blood
glucose will disrupt neural functioning, a phenomenon that can be reduced
by consuming low GL meals. However, no evidence of this mechanism was
found as there was no interaction between the nature of the meal and a pre
existing tendency for blood glucose to fall to low values.t
• There was no evidence that those with the early signs of cognitive decline
differentially responded to meals that varied in GL.
4.7 Discussion
The major finding of this paper is that on a number of occasions individual
glucoregulatory status interacted with the type of meal that was consumed (Figures
14 and 16). Interestingly, older adults with better GT and no tendency for blood
glucose to fall below baseline value, which is those who were best able to manage
154

their blood glucose levels, benefited most from consuming a lower rather than a
higher GL meal. In particular, those that ate the isomaltulose based meal
performed mental arithmetic more accurately, were able to remember more words
and had a better mood. These effects are consistent with the findings in chapter 1
and chapter 2 that suggested that a lower rather than a higher GL meal may
improve cognitive performance and mood in children, adolescents and young
adults. Given their young age, it is reasonable to assume that such populations
would have relatively better GT compared to older adults. It may be the case that
the inconsistencies in the literature dealing with older adults (summarised in
chapter 1) reflects a failure to establish their prior ability to regulate blood glucose
levels.
From this perspective it may not be surprising that the literature addressing the
effects of GL on mental performance in older adults, with or without poor GT, is
limited and the findings inconsistent. On one hand Papanikolaou et al (2006)
reported in older diabetics that a lower GL (50g pasta), rather than a higher GL
meal (50g white bread) improved cognition sixty to one hundred and forty minutes
after consumption. However, it was unclear whether poor glycaemic state
interacted with the nature of the meals as there was no healthy control group. Also
the majority of participants were taking oral hypoglycaemic medication (metformin
or sulphonylureas) that are known to influence insulin secretion, insulin resistance
and gluconeogenesis such that medication may interact with the GL of a meal.
Similarly, Nabb and Benton (2006) found that meals that were low in
carbohydrates and high in fibre resulted in better memory thirty and one hundred
and five minutes after consumption; an effect that was only observed among those
155

with higher fasting glucose levels. However, when interpreting these findings one
must consider that although impaired fasting glucose and impaired glucose
tolerance are correlated they are not synonymous and represent different
underlying pathologies. On the other hand, Lamport at el (2012) reported that
neither diabetics, nor older adults with better GT, benefited from a low (toast and
yogurt) rather than high GL meal (glucose drink) after thirty or one hundred and
twenty minutes. However, given the small number of control participants (n = 10)
this study may have lacked the power to detect differences between meals.
Although in the present study a low GL meal did not generally influence cognition
or mood in older adults with poorer GT, it is interesting that on a number of
occasions they selectively benefitted from a higher GL meal during the immediate
postprandial period. Specifically, those with poorer GT had better memory and
more positive moods thirty minutes after eating if they had consumed glucose,
rather than sucrose or isomaltulose based meals. Similar short term effects have
been reported previously. Table 18 shows the studies investigating the short term
effects of glucose on cognition in older adults with better and poorer glucose
tolerance.
156

Reference. N (average age).
GlucoregulatoryStatus.
Effect of glucose on episodic memory.
Messier et al. (2003).
11M46F (72years)
Better nsPoorer +
Kaplan (2000) 10M 10F (72 years)
Better nsPoorer +
Messier et al. (2010)
9 M, 6 F (70 years)
Better nsPoorer +
Messier et al. (1997)
19M74F (62 years)
Better + (males)Poorer - (males)
Riby et al. (2008) 33 M 34 F (45 years)
Better +Poorer ns
Craft et al. (1994) 27 M Younger (23.5 years)32 M Older (67.5 years)
Better + (older) - (younger)Poorer + (younger) ns (older)
Table 18. Studies investigating the short term effects of glucose on cognition in older adults with better and poorer glucose tolerance. +, significant beneficial effect, ns, not significant. significant negative effect.
Messier et al. (2003) found that drinking 50g of glucose, rather than a placebo,
attenuated the deficits observed in older adults with poor GT, and reduced the
difference between better and poorer gluco-regulators in memory in the period up
to forty-five minutes after consumption. In a subsequent study Messier et al. (2010)
confirmed these findings; 50g of glucose reduced the association between glucose
regulation and cognition by improving performance in those with the poorest GT.
Similarly Kaplan et al (2000) gave older adults meals that provided 50g of
carbohydrate that differed in the speed of absorption (glucose drink, potato and
barley). Although those with poorer glucoregulation had greater improvements in
memory after all three meals (tested up to one hundred and five minutes) the
nature of the carbohydrate was not important. However, these effects have not
always been confirmed; Riby et al (2008) found that 50g, but not 25g, improved
performance of better but not poorer glucoregulators. Interestingly, a study by
Craft et al (2004) found that drinking 50g of glucose, rather than a placebo,
157

improved memory in older men with better but not poorer GT. However, glucose
also improved the memory of younger men with poorer GT but in contrast
decreased the performance of younger men with better GT. It is interesting that
older men with better GT were comparable to younger men with poorer GT, in
terms of GT, thus there could be an optimal range of GT within which glucose
facilitates memory. However, in this range of studies there was substantial
variation in the definition used to classify those having better or poorer GT, such
that a range of mechanisms may be influential that could differentially interact with
a meal.
Although the mechanisms mediating the effect of GT on cognitive decline are yet
to be elucidated Convit (2005) proposed that individuals with glucose intolerance
have poorer cognitive performance because they have endothelial dysfunction and
are less able to transport glucose across the BBB into the brain. It is interesting
that our sample of older adults with poorer GT benefitted in the short-term from a
higher rather than a lower GL. It is possible that those with impaired GT may
require higher blood glucose and insulin responses to drive glucose utilization by
the brain. Although the transport of glucose into the brain is not thought to be
insulin dependent, insulin may act as a vasodilator (Muniyappa and Sowers, 2013)
and thus increased insulin (as a result of a glucose load) may improve endothelial
function and indirectly aid transport of glucose across the BBB. Consistent with
this, Hirvonen et al. (2011) found that a higher concentration of insulin was
required to stimulate cerebral glucose metabolism in those with poorer GT
compared to healthy controls. Clearly, more research is required.
158

A further finding from the present study was that the tendency to develop lower
levels of blood glucose did not moderate the effect of glycaemic load on cognitive
performance. If anything the tendency to develop a LBG below baseline values
seemed to reduce the benefits observed in those with better GT. For example,
those with better GT, and LBG above baseline values, had better memory
throughout the entire morning after eating isomaltulose. However, those with
better GT and the tendency for a lower LBG only benefitted from a lower GL during
the late postprandial period (180 minutes) (Figure 16a).
In chapter 3 it was reported that a tendency to develop low blood glucose levels
benefitted those with poor glucose tolerance. Similarly, it is well documented that
some insulin treated diabetics, after re-current hypoglycaemic episodes, develop
‘hypoglycemia unawareness’ (Bakatselos, 2011). This not only involves a
reduction in sympathetic nervous system symptoms (Cryer, 2005) but also a
reduction in cognitive dysfunction during subsequent hypoglycaemic episodes
(Mellman et al, 1994; Fruenwald-Schultes et al, 2000). The mechanisms involved
in this process are not yet determined, however, there is evidence that brain
adaptation can result from exposure to hypoglycaemia. For example, in animals
that previously had experienced hypoglycaemia hippocampal glucose
concentrations were subsequently higher under normal glycaemic conditions
(McNay et al. 2006). In healthy humans’ experimental exposure to recurrent
hypoglycaemia resulted in the preservation of cognitive performance and the
uptake of glucose by the brain when on later occasion’s low glucose levels were
again experienced (Boyle et al., 1994). It is possible that the older adults in our
sample that had a tendency for LBG to fall below baseline did not benefit from the
159

lower GL meal and sustained supply of glucose from the periphery because they
had already developed compensatory mechanisms (i.e. increased brain interstitial
glucose levels) to deal with a transient shortage in peripheral energy supply.
Chronic hyperglycaemia, that is characteristic of glucose intolerance, is thought to
contribute to cognitive decline (Ravona-Springer et al, 2012), however, to our
knowledge this is the first study to consider the acute effect of the GL of a meal on
the cognitive performance of older adults with cognitive decline. Small et al (2006)
found improvements in memory and cerebral metabolism after a fourteen day
healthy lifestyle program that incorporated a low GL diet. However, as this
program also involved relaxation, physical and mental exercise the role of diet was
unclear. The present study tested whether older adults with early signs of cognitive
decline may benefit from a lower rather than a higher GL meal. Reductions in
cerebral glucose metabolism are evident even at the early stages of cognitive
decline (Landau et al, 2012) and may precede the onset of cognitive symptoms
(Mosconi et al, 2007). Given our participants displayed only a very mild degree of
impairment it was possible that providing a steady supply of glucose to the brain
may have aided their performance. The evidence from the present study was,
however, very clear. Although there was evidence that the measure of cognitive
decline used was associated with both poorer episodic and working memory, on no
occasion did the nature of the meal consumed benefit either the mood or cognition
of those whose memory was poorer than predicted by NART.
Alterations in brain glucose metabolism that correlate with cognitive decline
(Landau et al, 2012), may potentially reflect a range of underlying pathologies:
160

defects in brain glucose transport; a disruption of glycolysis; impaired insulin
signalling; mitochondrial dysfunction; neuronal atrophy (Cunnane et al, 2011;
Correia et al, 2011). It appears, however, that even at this early stage of cognitive
decline changes in the nature of glucose provision is no longer sufficient to
enhance cognition, presumably a reflection of the malfunctioning of one of the
above, or similar, mechanisms. It is possible that alternative approaches that aim
to either correct the disruption in cerebral glucose metabolism or bypass
deteriorating brain glucose metabolism altogether (e.g Ketonemia) (Cunnane et al,
2011) may prove more beneficial.
The aim of this chapter was to examine the effect of modulating the GL of
breakfast on cognition and mood of older adults and determine whether GL
interacts with glucoregulatory status and cognitive decline. A lower rather than a
higher GL meal improved cognition and mood in healthy older adults with better
GT. These effects were strongest during the late postprandial period (105 -
180min post meal). A lower GL meal did not benefit older adults with poorer GT or
older adults with cognitive decline; although a higher GL meal may improve
memory and mood in those with poorer GT after 30 minutes. It is possible that
defects in the brain glucose metabolism/transport may help explain why older
adults with poorer GT or cognitive decline are unable to benefit from a lower GL
meal in the same way as healthy older adults. More research is required to
determine the pathologies that underlie glucose intolerance related cognitive
decline which in turn may help in the development of alternative interventions.
161

CHAPTER 5
The glycaemic load of Energy Drinks interacts with caffeine to influence
young gdult’s glucose tolerance, cognition and mood.
5.1 Introduction
Although most dietary caffeine is consumed in the form of tea and coffee, recently
the market for caffeinated beverages such as energy drinks has grown
substantially (Heckman et al, 2010). Manufacturers claim that energy drinks
improve physical endurance, reaction times and concentration. Supposedly, the
interaction between the various ingredients is critical; however, as reviewed in
chapter 1 there is insufficient evidence to support this claim. Indeed as previously
discussed there is reason to believe that the consumption of caffeine and a highly
glycaemic carbohydrate simultaneously may be undesirable. This study
investigates the psychological effects of the interaction between the caffeine and
GL of its vehicle in a sample of young adults.
5.2 Method
5.2.1 Participants
Three hundred and forty-five undergraduates were recruited when they responded
to a circular email and were randomly and blindly allocated to one of the six
conditions. 175 were male and 162 female with a mean age 21.78 years (SD
3.508). Participants were excluded if they were diabetic, suffered from any food
allergies/intolerances or if their BMI was outside the healthy range (18.5-25.0).
162
Table 19 shows the baseline data for each group prior to receiving one of the six
drinks.
163

a *CAC CAc cac cac COc (Ac COc (AC V )c COc CAc CAc CAc V )c V )c
Wat
erC
affe
ine
CDCN N-CM
21.1
(3.4
)
132
mg
(20.
0)
48.1
(27.
3)
46.9
(25.
5)
50.6
(41.
2)
49.7
(35.
8)
49.6
(4.3
.9)
46.9
(37.
1)
40.6
(41.
4)
40.1
(38)
40.2
(30)
41.0
(28)
45.8
(31)
43.0
(28)
Glu
cose
Caf
fein
e
T-CO OCO
21.2
(3.4
)
126
mg
(24.
5)
. 44
.3(2
6.4)
44.7
(24.
4)
44.1
(39.
2)
42.7
(34.
1)
44.6
(41.
5)
43.9
(35.
0)
44.1
(41.
1)
39.1
(39.
7)
44.3
(28.
9)
45.6
(28.
4)
44.2
(29.
1)
44.6
(29.
0)
Milk
Caf
fein
e
COCMCOCM
22.5
(3.4
)
179
mg
(35.
0).
44.4
(27.
2)
46.2
(25.
8)
48.4
(40.
9)
43.1
(35.
6)
42.4
(43.
0)
43.8
(37.
1)
48.2
(40.
5)
46.1
(38.
9)
45.7
(29.
1)
CO*CM,cfCO 44
.1(3
8.4)
49.6
(38.
7)
Wat
er 1"'-CM00CM
21.5
(3.4
)
155
mg
(29.
0)
45.9
(27.
6)
47.6
(25.
0)
42.8
(41.
1)
45.5
(35.
5)
40.8
(44.
1)
41.4
(38)
42.8
(41)
39.9
(40)
41.6
(30)
47.3
(29)
42.6
(39)
47.3
(29)
Glu
cose
oCO N-CM
21.5
(3.4
)
134
mg
(24.
7)
45.3
(25.
5)
47.1
(24.
1)
44.4
(41.
4)
44.4
(35.
5)
44.0
(43.
1)
43.9
(33.
3)
44.4
(37.
5)
42.5
(32.
9)
48.5
(29.
4)
44.9
(28.
2)
46.6
(35.
8)
42.9
(35.
6)
Milk CMCO00CM
22.2
(3.4
)
108
mg
(17.
5)
45.8
(26.
3)
44.5
(24.
3)
45.5
(39.
6)
45.4
(34.
1)
42.7
(41.
4)
42.5
(36.
1)
45.5
(37.
6)
43.5
(35.
8)
41.4
(28.
9)
43.5
(27.
1)
40.9
(37.
2)
45.5
(29.
0)
I G
ende
r 1
2 LL
Age
Hab
itual
caf
fein
e in
take
Dep
ress
ed/E
late
dbe
fore
te
stin
gD
epre
ssed
/Ela
ted
Afte
r te
stin
gA
nxio
us/C
ompo
sed
Befo
re
test
ing
Anx
ious
/Com
pose
dAf
ter
test
ing
Agr
eeab
le/H
ostil
eBe
fore
te
stin
gA
gree
able
/Hos
tile
Afte
r te
stin
gC
onfid
ent/
Uns
ure
Befo
re
test
ing
Con
fiden
t/ U
nsur
eAf
ter
test
ing
Ene
rget
ic/
tired
Befo
re
test
ing
Ener
getic
/ tir
edAf
ter
test
ing
Cle
arhe
aded
/ C
onfu
sed
befo
re
test
ing
Cle
arhe
aded
/ C
onfu
sed
afte
r te
stin
g

ns
ns
ns
ns
ns
ns
ns
ns
ns
ns
ns
ns
ns
ns
ns
ns
ns
T” N-CO
SCDCOCM
COr~COT-
S 'S
pCMoCM
odtoCM
S 'T“
S'T-
CO ST S'S 'idco_
SdCO
pd
S'COto
S 'SCO
coCO
CMCD
M’CDCOCO
T-
COCO
p
COto
CO©00to
00
oCO
PS
PS
pcd S
pcd
pcdoCO
pdCMCO
pdCOCO
00
CO0000T“
SSCO
S
00
S'StoT“
SCO00
CDsoCM
S'o00T—
o 'CM
o 'CM
00 S'T—
S'r—
scdCO
S'cd
T-cd 00CD
S'00to
r~-CO
T—CD CM
COCOCO
00CMto
COdoCO
PCOtoCO
SpS cd
CMS
0>cd oCO
toCMCO
pd
CO
pr tCDCO
S00T“
Sd
5TCO
T-
o>T“
SCO00
S 'COCOT“
COCO00T—
o ’CDT-CM
STT-
sT—
S ' S ' 00r—
tosCO,
dS s
CM 00to
pCO
CMCD
CMCO1".in
pT—COCO
CO
COto
COs
COoO)to
CMS
p"O’
pcd
ps
OS
p00cd
odCMCO
pT”
COidtoCO
pcda>T—
N S 'CO
CDCOS ’COinT"
STd00
ST00r .
S 'CMCOCM
S ' S 'T“
S ' S 'T-
S 'T-cdCO
S 'S2 ,
sd
T-cdCD
T~00
©CO
h-td
poCOCD
COCOCMCO
toCMCOto
COCDCO
COidoCO
pS
COs
COcd
OS
pcd
poT-CO
psCMCO
pcdtoCO
00CDCO
o00o>T“
coM-
sCO
00oCM
S
COpT“TfCM
0000O)CM
o 'StoCM
o 'CM
sT—
S' 00T-
S 'sCDCO
S 'T-
S ' 00s
©00
h-td
OCOCO
ptdCOCO
oCOCOto
p5>to
CM
CO
T—S
OS
CMcd
pcd
pcd
T-cdT-CO
ph-‘CMCO
toto
CO
pdCOCO
ptooCM
c\TM- co
p"h~-cr>
00COtoV
S 'id00T-
S '00
CM
SCO00T—
00r—
00T—
S ' S'T-
S 'T-
S'T-CO
S'S
S 'T-
CO S 'SCD_
TfCO
©CD
pCOCO
pidoCO
o>O)COto
CD
CO
CMd
CO
pS
COs cd S
Ocd
sdoCO
pdCMCO
pdcoCO
to
CO00o
Imm
edia
te
mem
ory
Dela
yed
mem
ory
Vigi
lanc
e R
T1s
t m
in cE
7DCCM 3rd
min
4th
min
5 m
in
Vigi
lanc
e ac
cura
cy1s
t m
in cE
ocCM
cE
pCO 4t
h m
in
r-th
?5
min
Deci
sion
tim
es1
lam
p2
lam
p
4 la
mp
8 la
mp
Mov
emen
t tim
es1
lam
p

^© © ©© O CM© © ©© © "Ct
©© C O ©T— T — T~
.© ©cd id cd© © ©pS cd CM© © ©T” T_ CM
© © ©cd © cd© © ©s—© © T—
id CM© © ©T” T" CM
oCOo>©oCM
CLEJ5CM
reore©idoCM
_
© © CM© CM© © ©© © ©© CO O© © ©T” T“ CM
_T“ © ©© 'P“ ©© © ©© © ©h~- CM ©T“ re ©T” T“ T“
h-CO
cdoCM
C l
Emco
dco
pCDTf©
CMco10T-00
s©
idcoM-
ID©
COCDIDCOT—CO
Sr—©
COidT—IDT-Sfs©CM
SCM
co©©
COidpcd
pidpcd
p
coco
p
pcd
pid
pid
co
ooid10
aoooID
oid©
pcd©to
p©
©oto
pT-to
pd©
p©©©©
pcd©T“Ps©©
pcd©CM
CO©CM
pcdrCM
©cdpCM
©cd©CM
pcdh-CM
oCDOcCD
EotCDCL
cCDO‘cO)C/5ocCDL_0
tn_c'Z■O><
'tn<D
0CoO)c>0O0
aQ.3Ou.TOJ=oCO0L_oH-co(0■U0JO"0tn 0 <0 .EQQ 0
. 1/3 <3 j§
0 . 0-Q o 0 oI - E
voV O

5.2.2 Procedure
The procedure was followed with the approval of the Swansea University ethics
committee (reference number: 0825/2010/1) and only after the participants had
given written informed consent (Appendix 12). At 0800 after fasting overnight
participants came to the laboratory and had their fasting blood glucose levels
measured. They then consumed a standard breakfast. After ninety minutes they
consumed an experimental drink but no other food throughout the morning. The
test battery was administered on four occasions, once before the drink, and after
breakfast, when all participants were nutritionally equal (which gave participants an
opportunity to practise). Then testing took place three times after participants had
consumed the drink. Figure 17 outlines the experimental procedure.
PracticeBreakfast ^est Rest Rest Test Rest Test Rest Test
session session 2 session 3 session 4I I I I I I I I I
■ ,/'■:
-9 0 - 60 -3 0 1 + 10 + 30 + 60 + 90 + 120 + 150•• • ' : - 7
‘> .■ '■ ''7 : 7.; ; '
' ■'
. J
Time (min)
Figure 17. Schematic representation of the time in minutes that each testing session took place relative to when the drink was consumed.
167

5.2.3 Glucose measurements
Most studies investigating the effect of differences in postprandial glucose on
cognition utilise intermittent finger prick blood glucose measurements (e.g Benton
et al, 1998; 2003). However, this approach has the potential to miss a large
amount of information regarding fluctuations in glycaemia. Therefore a sub portion
of the participants (N=38) attended the laboratory the day prior to the experiment
and were fitted with an interstitial glucose monitor (Medtronic I pro continuous
glucose monitoring system; Medtronic Ltd, Watford, UK) which they wore
throughout the test procedure the following day. A small glucose sensor was
inserted under the subject’s skin and this enabled glucose levels to be recorded
every 5 minutes for the duration of the study. This approach has been recently
validated against arterialised venous blood, the best available proxy for blood
glucose delivery to the brain, and capillary samples, measured by finger prick (Dye
et al. 2010). In addition, the entire sample had their capillary blood glucose
monitored from finger pricks using an ExacTech sensor (Medisense Britain
Limited) that uses an enzymic method, coupled with microelectronic measurement,
and has been shown to be accurate (Matthews et al. 1987).
5.2.4 Breakfast / Drinks
All participants consumed a breakfast of Cornflakes (30g) with 120ml of skimmed
milk. In total this amounted to 151 kcal and offered 32g of carbohydrate. In
addition a decaffeinated drink of either tea or coffee was consumed.
The sample was randomly divided into six groups (n) that mid-morning consumed
one of the following 250ml drinks.
168

1) Milk-based product (GL 3.6) with no added caffeine (60)
2) Milk-based product (GL 3.6) with 80mg caffeine (56)
3) 30g glucose (GL 30) with no added caffeine (57)
4) 30g glucose (GL 30) with 80mg caffeine (61)
5) Flavoured water with no caffeine (55)
6) Flavoured water with 80mg caffeine (56)
Variants 1-4 contained 155 kcal and all drinks were flavoured orange. The water
based drinks were artificially sweetened using sucralose so that they matched the
sweetness of the glucose based drinks. All the drinks were provided in opaque
plastic bottles labelled A - F. Participants were blind as to the nature of the drink
that they were consuming and were unaware that their drinks may have differed
from others. The researcher was blind as to the nature of the drinks. The
participants were given a maximum of ten minutes to consume the drink after
which they sat quietly reading or watching television.
5.2.5 Test battery
The test battery was completed on four occasions always in the following order. 1)
Mood, 2) Memory - immediate recall of word list, 3) Serial sevens - working
memory, 4) Arrow Flankers - selective attention, 5) Simple and Choice reaction
times, 6) Vigilance - sustained attention, 7) Memory - delayed recall of word list,
8) Mood.
169

The tests of Memory, Working memory, Simple and Choice reaction times, and
Vigilance described in section 3.2.3. Mood was described in section 4.2.4.2.
5.2.5.1 Arrow Flankers Test
A modified version of the Eriksen and Eriksen (1974) flanker task was used to
measure selective attention as it has been reported to be susceptible to caffeine
administration (Addicott & Laurienti. 2009). Each trial presents five arrows that are
either congruent ( » » > ) , incongruent ( » < » ) , neutral (□□<□□). The task is to
indicate whether the middle arrow is pointing to the right or left and the reaction
times and accuracy are recorded. On occasion crosses (xx<xx) are also
presented that indicate to participants that they should not respond at all. The
Arrow Flankers test measures the ability to direct attention and ignore peripheral
information. There is a tendency to respond to the distracting flankers meaning the
subject had to inhibit this inclination. There was a randomly varying inter-stimulus
interval of between 1 and 3 s. Outcomes were accuracy (% incorrect) and reaction
time in milliseconds.
5.3 Statistical analysis
Preliminary tests found that there were no significant differences at baseline
suggesting that randomisation had been successful. Baseline data are shown in
table 19. Initial analysis considered whether gender influenced participants’
response to the drinks. There was a main effect of gender on movement times
(F(2,318) = 17.785, p< 0.0001); males were faster than females. Although there
were occasional higher order interactions (see appendix 13) these represented no
consistent pattern and therefore were considered to be chance variations. Gender
170

was therefore not further reported. The habitual level of caffeine consumption was
estimated from reports of the level of daily intake of caffeine-containing beverages
such as tea, coffee, cola and EDs. The daily intake was on average 139 (147) mg
and the habitual caffeine intake did not differ between groups (Table 19). The data
were analysed using appropriate Analysis of Variance designs. The basic
approach involved the Vehicle (Milk, Glucose, Water) X Caffeine (0 or 80mg) X
Test session (30min, 90min, 150min). Only outcomes that involved the vehicle (i.e.
milk, glucose, water) or caffeine are reported and where higher order interactions
are not mentioned it can be assumed that they were non-significant.
5.4 Results
5.4.1 The glycaemic response to the test drinks
Data are presented from thirty-eight young adults who wore an interstitial glucose
monitor (Medtronic I pro continuous glucose monitoring system; Medtronic Ltd,
Watford, UK) for the duration of the experiment. Data are reported in successive
five minute periods. For clarity of presentation the data are separated into three
time periods that are of interest. The response to breakfast (-90 min to 0 min, with
0 min being the point where the drink was consumed); the short term response to
drink (0 min to +90 min) and the longer term response to the drink (+90 min to +
165 min). Analysis of variance was calculated for each of these time periods, with
the vehicle and whether caffeine was consumed as the between subject factor and
time as a within subject factor. Where Mauchly's Test of Sphericity was significant
Greenhouse-Geisser correction was reported.
171

The response to breakfast
When considering the effect of breakfast (-90 min to 0 min); there was a significant
effect of time (F (2.5, 5.024) = 91.731, p<0.0001), interstitial glucose rose quickly
immediately following consumption until - 60min when it began to fall, reaching
baseline scores by 0 min (time of drink). There were no significant effects of
whether caffeine was subsequently consumed (F (1,32) = 2.749, p = .104) or the
Vehicle that was subsequently drunk (F (2,32) = .143, p = .867). It was clear that
prior to a drink the six experimental groups responded in a similar manner to their
breakfast, that is in terms of their glycaemic response they were well matched.
Glucose response to breakfast can be seen in appendix 14.
The response to drink
When considering the immediate effect of the drinks (0 min to +90 min) the effect
of caffeine and vehicle were considered using a three way analysis Vehicle X
Caffeine X Time. The interactions Vehicle X Time (F(5.7, 92.2) = 9.94, p<0.001;
Figures 18) and Caffeine X Time (F(2.8, 92.2) = 8.43, p<0.001; Figures 19)
reached statistical significance. The consumption of glucose as expected resulted
in a marked increase in blood glucose values. Similarly caffeine consumption
resulted in higher blood glucose values towards the end of the time period.
172

1.4
0.9
0 - 0.6
- 1.6<3 A ffy rfy A <£> 6<D o<D J 6
Time (min)
Water -c~ Giucose Milk
Figure 18. The effect of the vehicle on the immediate glycaemic
response. The data presented are average changes every five minutes
in interstitial glucose (mmol/L), from the value immediately prior to
consuming the drink. Those who drank glucose experienced a greater
glycaemic response than those who drank milk or water.
173

o£E
<DV)oo
_3
o
-1.54> <£ A*5 <£> <£ .<£
Time (min) Caffeine - - No caffeine
Figure 19. The effect of the caffeine on the immediate glycaemic
response. The data presented are average changes in interstitial
glucose, as mmol/L, from the value immediately prior to consuming the
drink. Those who drank caffeine had higher interstitial glucose levels
after 35 minutes than those who did not consume caffeine. The effect
occurred irrespective of the vehicle with which it was consumed.
174

When in the longer term (+90 min to + 165 min) interstitial glucose levels were
considered the main effect of caffeine was again significant (F(1,32) = 19.30,
p<0.001; Figure 20) whereas the Vehicle was not (F(2,32) = 1.03, n.s; Figure 21).
Thus the addition of caffeine, irrespective of the nature of the drink, was associated
with higher levels of interstitial glucose from 30 minutes until the end of the
experiment (150 minutes post consumption).
175

£ -0.4
o -0.9
-1.4
Time (min) -♦-C affeine - - No caffeine
Figure 20. The effect of caffeine on the longer term glycaemic response.
The data presented are average changes in interstitial glucose, as mmol/L,
from the value immediately prior to consuming the drink. Those that drank
caffeine had higher interstitial glucose levels at the end of the morning than
those that did not consume caffeine.
176

- 0.1
-0.3
^ -0.5
| -0.7
«=• -0.9CD
o -1.1O= -1.3
0
-1.7
-1.9
Time (min) -♦-W ater - i - Glucose - ‘ - Milk
Figure 21. The effect of vehicle on the longer term glycaemic
response. The data presented are average changes in interstitial
glucose, as mmol/L, from the value immediately prior to consuming the
drink. Those who drank milk maintained a higher interstitial glucose level
at the end of the morning than those who drank glucose or water.
177

Finger prick measures of glucose
The remainder of the participants (as well as those fitted with an interstitial glucose
monitor) had their blood glucose measured from finger pricks at -90 min, -30 min,
0 min, +30 min, +90 min and +150min. The patterns of results were the same as
the interstitial glucose measurements and therefore not reported.
5.4.2 Mood
All dimensions of mood were analysed using a four way analysis of variance:
Vehicle (Milk, Glucose, Water) X Caffeine (0 or 80mg) X Before / after cognitive
testing X Test session (30, 90 and 150 min post drink). In all cases a higher rating
was more positive. Where Mauchly's Test of Sphericity was significant
Greenhouse-Geisser correction was reported.
Energetic / Tired
The interaction Vehicle X Caffeine X Test session reached statistical significance
(F(3.9, 640.2) = 2.65, p<0.04) and is reported in Figure 22. Caffeine had a
different influence depending on the nature of the drink. With water based drinks
those who consumed caffeine felt more tired in the late morning, whereas with the
milk-based drink caffeine made participants significantly more energetic. In
contrast caffeine had little influence when a glucose containing drink was
consumed. Post hoc tests failed to find any difference when caffeine had not been
consumed. However, when taking the milk-based drink those who received
caffeine were more energetic after 90min (p<0.02) and there was a similar trend
after 150 minutes (p<0.06) compared to those who did not receive caffeine. With
the water based drinks, at both 90 minutes (p<0.008) and 150 minutes (p<0.002),
178

those receiving caffeine reported being more tired than those without. When
participants drank glucose there were no differences depending on whether or not
they received caffeine.
Milk-based rather than glucose-based drinks resulted in feeling more energetic
after 90 minutes (p<0.03) but only in those who received caffeine. Similarly a milk-
based rather than water-based drink resulted in greater energy after 90 minutes
(p<0.0001) and 150 minutes (p<0.0001) but again only in those who received
caffeine. Also at both 90 (P<0.005) and 150 minutes (p<0.002) glucose rather
than water resulted in feeling more energetic but again only in those who received
caffeine. There were no differences at 30 minutes post consumption. All effects
occurred later in the morning suggesting that the time scale over which effects are
examined is important.
179

Caffe
ine
No ca
ffein
e
04-»(0
0(0oo3
E O
□
a a • 1h- CM h- CMlO IO CO
D jie S ja u g /p d J i i
c/) 0 ^0 m ^1 Q} r8 5 §C/D 0 - Q
CO
c00©1—CL0i_
JZ • CL
O) 0. E DD
E 0O -c
£i©f © *■» "O>— 'co 0)> iCo .©0 0 *■* .=® i— orL_0c in0 •"St _ CO O)C II” c0
&co0"c‘00 0 0 0 *-»3 J Z O O £ © *-> 0
"Oc0
5 0 f= £ •d 0| g
0 "D 0 0 0 E0 z§
1 gc o 0 o© C/D5 g0 >0 0
s= 00 1o CD C °0 c -E ©00 01=5 0O ZJ0 c i2 E0 O 0 0 *-Q. ^0*“ ~o 0 0 2 E0 ZJ
- 1 ,s> 80 O .c c
■D 0 ~G 0 C 0E 0 ^Z30 0 0 C ° £0 IS 0 0 0S ■*= 0m *-* -C © 0 -Ci r ^
T 3 ~ c0 0 3 0 ± =
© £ 0 C ~ 0 © -o £
©0 E ^ 0 3 'F( - 0 t
© § c | 8 00 § §
3 £0 1- 0 .E 0 0
E | gO CD LO C O"" j? 0T 3 ^ > C < 0 0 - 0
0 ^ oOD 0 00 > -D
^ T 3 0
8 | l < 13
000O
0 = _c 0 0 "
o 0
0JZ£ .a
00 OD
0 0
■5 §
©O i~C £ © _
■DC0
~o0EZ3
_3H -c©
H
0 _c
£ g 8
8 § »-sI 5> 00 .EE 0 ■© in y= ©0 >O
,= 0 0 0c 0 0
N E CM 0© 0 1—3 0
.S> 0LL Q
> 0 0 -Q0 0 — 01 => 0O it? 0 ±E0 "D
8 ra £ o r d o ci— 0 'c
c jdO C 1- LO g 0 T- s— C
T3 0 "O
0 0 0
£ o o0 E
0 £ 0-= © "o
0 © '-^
£ 8 0S = p*0 DD
© C cE E ©0 -O 0 © ^ ~ o 0 E»° r . O ) c 0
© m ©I— ^ L-© O © £ £ £ ca
ffein
e we
re
more
ener
getic
tha
n th
ose
with
out.

There was also a Vehicle X Caffeine X Before / after test session interaction (F(2,
318) = 3.33, p<0.04). Figure 23 illustrates the effect. Again the combination of a
water-based drink and caffeine resulted in reports of feeling tired after, rather than
before, the testing session (p<0.02). When glucose was consumed there were no
differences between those who consumed caffeine and those who did not,
however, when milk was consumed participants who had caffeine reported feeling
more energetic after a test session (p<0.02) compared to those who consumed
milk with no caffeine. Irrespective of the testing session those who drank glucose
reported feeling less tired after testing than those consuming water (p<0.03) but
only if they consumed caffeine. Similarly those who drank milk reported feeling less
tired after testing than those consuming water (p<0.0001) but only if they
consumed caffeine. There was a trend (p<0.07) for those consuming milk and
caffeine to be more energetic following a test session than those consuming
glucose and caffeine (milk + caffeine 18.1 (33.4) glucose + caffeine 7.0 (35.2).
There were no differences in the response to the vehicles in those who did not
consume caffeine.
181

Caffeine No caffeine
p<0.02
p<0.0001
p<0.02
p<0.03
Before After Before After Before/After a test session
□ Milk ■ Glucose □ Water
Figure 23. The influence of vehicle, with and without caffeine, on feeling
energetic before and after a test session. Data are mean rating for energetic /
tired before and after each testing session (n = 345). The left side of the graph
represents scores for each vehicle when caffeine was consumed and the right side
when it was not consumed. There were no differences between vehicles when
caffeine was not consumed. When caffeine was consumed those that drank milk
rather than water were more energetic after a testing session. When caffeine was
consumed those that drank glucose rather than water were more energetic. When
water was consumed those that had caffeine were significantly more tired after a test
session than those that did not. When milk was consumed those that had caffeine
were more energetic than those who had not.
182

Given the unexpected response to caffeine in water-based drinks the immediate
influence of caffeine 30 minutes post consumption, before taking any tests, was
considered. Ratings of being energetic / tired were examined by subtracting ratings
before a drink was consumed from the ratings half an hour later, but before a test
battery was performed. The main effect of caffeine was not significant (F(1,331) =
0.002, ns), however, the interaction Vehicle X Caffeine reached statistical
significance (F(2,331) = 3.21, p<0.04). Table 20 reports the interaction with a
positive score indicating feeling more energetic and a negative score feeling more
tired. Those who drank caffeine in combination with water reported being
significantly more energetic than those who drank caffeine with glucose (p<0.03) or
milk (p<0.03). There were no differences between the glucose and milk conditions
when caffeine was taken. There were also no significant differences between the
three drinks in those consuming no caffeine (F(2,165) = 0.52, n.s.). That is there
was a short term benefit of consuming caffeine when it was taken with water.
No caffeine Caffeine
Milk-based +2.26 +/- 2.59 - 2.30 +/- 2.68
Glucose-based +1.13+/- 2.64 - 2.25 +/ 2.55
Water based -1.19+/- 2.68 +6.46 +/- 2.66*
Table 20. The immediate influence of drinks with and without caffeine on
feeling energetic. Data are mean changes from ratings before a drink was
consumed to the ratings half an hour later, but before a test battery was performed
.When water was consumed those that had caffeine were significantly more
energetic 30 minutes later than those that did not have caffeine. There were no
differences when milk or glucose had been drunk. * Differs from the no caffeine
condition p<0.04.
183

Elated/ Depressed
Ratings of feeling elated rather than depressed were not influenced by the nature
of the drink. Neither the Vehicle (F(2, 315) = 0.64, n.s), whether caffeine was
consumed (F(1, 315) = 1.03, n.s ), nor did the interaction between these factors
achieved statistical significance (F(2, 315) = 0.95, n.s).
Anxious/ Composed
Similarly when ratings of being composed / anxious were examined the Vehicle
(F(2, 316) = 1.15, n.s) and Caffeine main effects (F(1, 316) = 1.19, n.s ) were not
significant, and neither were the interaction between these factors (F(2, 316) =
2.20, n.s).
Confident/ Unsure
With ratings of being Confident / unsure there was a four way interaction (F(3.9,
629.9) = 2.51, p<0.04), but as these higher order interactions appeared to reflect
chance differences in one cell, it was not further considered.
Agreeable/ Hostile
With ratings of being Agreeable / hostile the interaction Vehicle X Caffeine X Test
session reached statistical significance (F(3.0,507.2) = 4.07, p<0.004). Post hoc
tests, however, failed to find any significant differences between conditions.
However, caffeine appeared to have a different influence depending on the nature
of the drink. In particular there was a trend for there to be a negative influence of
caffeine when taken with a water based drink later in the morning (Water + caffeine
39.1(2.3); glucose + caffeine 47.4(2.2); milk + caffeine 49.2(2.3).
184

There was also a Vehicle X Caffeine X Before / after test session interaction (F(2,
321) =7.32, p<0.02). When water was consumed those who received caffeine
rated themselves as more hostile following a test session than those who did not
receive caffeine (p<0.007). Caffeine had no effect in those who drank glucose or
milk. Those who consumed water rated themselves as less agreeable than those
who consumed glucose (p<0.02) and those who consumed milk (p<0.008), but
only if they had also consumed caffeine. As the vehicle did not influence ratings of
agreeableness when caffeine was not drunk, this effect therefore appeared to
reflect a negative reaction to caffeine in water based drinks.
Clearheaded / Confused
When reports of feeling Clearheaded / confused were examined the interaction
Vehicle X Caffeine X Test session reached statistical significance (F(3.1,507.8) =
3.47, p<0.007). Again there was a trend (p<0.07) for caffeine to increase feelings
of being confused as opposed to clearheaded, when it was consumed with a water
based drink 150 minutes after consumption (water + caffeine 43.2(3.4); glucose +
caffeine 50.6(2.2); milk + caffeine 50.6(2.3). Post hoc tests, however, failed to find
any statistically significant differences.
There was again a Vehicle X Caffeine X Before / after test session interaction (F(2,
317) = 3.17, p<0.04). When water was drunk caffeine increased ratings of being
confused as opposed to clearheaded (p<0.02), however, when milk or glucose
were drunk caffeine had no significant effect. When caffeine was not consumed
there were no effects of the vehicle on ratings of being clearheaded. When
caffeine was consumed a milk based drink rather than a water based drink
185

increased clear-headedness (p<0.02). Again this effect reflected a negative
reaction to caffeine in water based drinks.
5.4.3 Episodic memory
Mauchly's Test of Sphericity indicated that the assumption of sphericity had been
violated, x2(2) = 9.897, p < 0.007 (Time), therefore, epsilon was estimated and the
degrees of freedom were adjusted using the Greenhouse-Geisser correction. The
data were considered in a four-way analysis of variance; Vehicle X Caffeine X
Short term/ Long term Memory X Test Session. There was a main effect of
Caffeine. Those who consumed caffeine recalled significantly more words than
those who did not (F(1, 341) = 5.02, p<0.03: 6.3 words +/- 0.91 c.f. 6.94 +/- 0.19).
The interaction Vehicle X Test session was also significant (F(3.8,664.9) = 2.61,
p<0.03; Figure 24) The Vehicle did not influence memory 30 or 90 minutes after a
drink, but after 150 minutes those consuming milk-based products tended to
perform better than those consuming either glucose or water based drinks (6.5 +/-
0.26 c.f. 5.8 +/- 0.26 glucose and 5.9 +/- 0.26 water). Although the difference
between milk and water based drinks was not significant the difference between
the milk and glucose based drinks approached statistical significance (F(1,226) =
3.27, p<0.07).
186
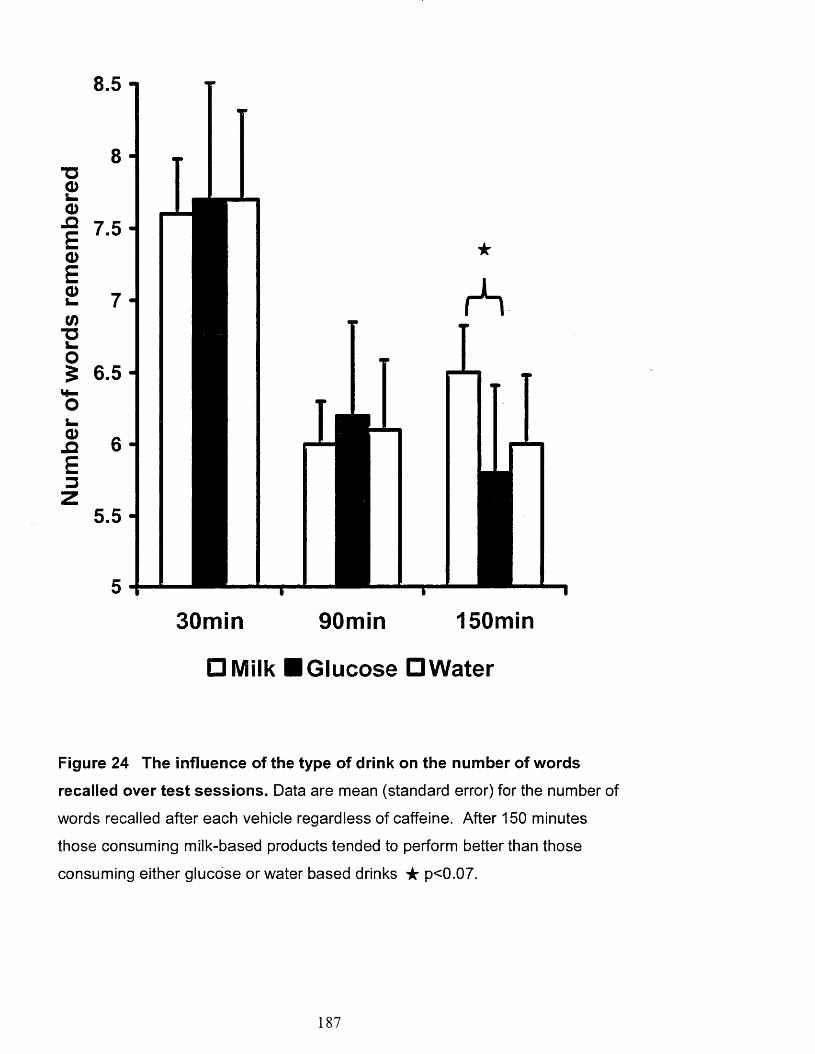
8.5 -
8 -~a
30min 90min 150min
□ Milk ■ Glucose □ Water
Figure 24 The influence of the type of drink on the number of words
recalled over test sessions. Data are mean (standard error) for the number of
words recalled after each vehicle regardless of caffeine. After 150 minutes
those consuming milk-based products tended to perform better than those
consuming either glucose or water based drinks ★ p<0.07.
187

5.4.4 Working memory
Accuracy
The data were considered using a three way analysis of variance: Vehicle X
Caffeine X Test session. Mauchly's Test of Sphericity indicated that the
assumption of sphericity had been violated, y2{2) = 312.697, p < 0.001 (Time),
therefore epsilon was estimated and the degrees of freedom were adjusted using
the Greenhouse-Geisser correction. When the number of incorrect responses were
examined Caffeine (F(1,329) = 0.24, n.s), the Vehicle (F(2,329) = 0.57, n.s) and
the interaction between these two variables (F(2,329) = 1.50, n.s) were all non
significant.
Reaction times
Mauchly's Test of Sphericity indicated that the assumption of sphericity had not
been violated, y2(2) = 2.690, p = .261 (Time). Although accuracy was not
influenced the speed of doing the test was affected. Those who consumed
caffeine performed the task faster than those that did not (F(1,329) = 3.88,
p<0.001; 1319 seconds +/- 27.0 c.f. 1244 +/- 26.6). The Vehicle just missed
statistical significance (F(1,329) = 2.79, p<0.06). However, post hoc tests found
that the consumption of glucose based drinks at 90 minutes (p<0.03) and 150
minutes (p<0.04), but not the 30 minutes, were associated with taking longer to
perform mental arithmetic than after a milk-based product. Similarly water based
rather than glucose based drinks were associated with quicker responding in the
second (p<0.05) and third (p<0.05) testing sessions. Those consuming milk
tended to be faster than those who drank water based drinks although this was not
statistically different (Figure 25).
188
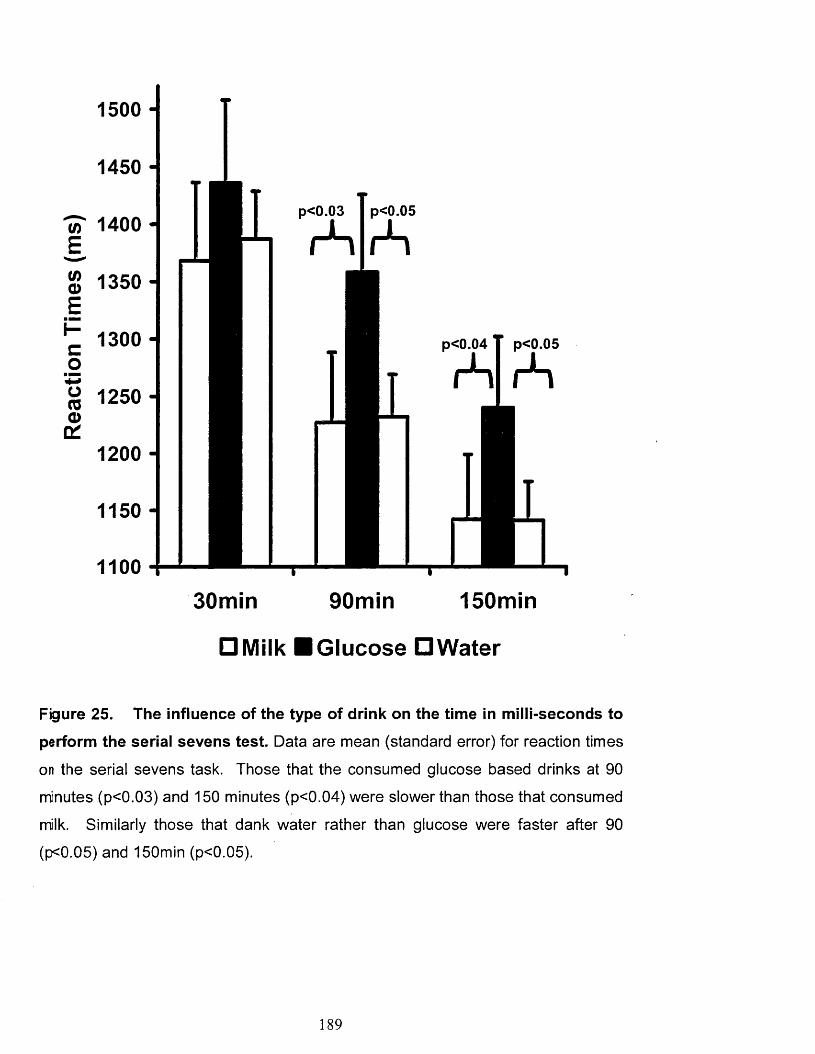
1500
p<0.05p<0.G3c/) 1 4 0 0 rS
g 1 2 5 0
p<0.04 p<0.05
rS rS
30min 90min 150min
□ Milk ■ Glucose □ Water
Figure 25. The influence of the type of drink on the time in milli-seconds to
perform the serial sevens test. Data are mean (standard error) for reaction times
on the serial sevens task. Those that the consumed glucose based drinks at 90
minutes (p<0.03) and 150 minutes (p<0.04) were slower than those that consumed
milk. Similarly those that dank water rather than glucose were faster after 90
(p<0.05) and 150min (p<0.05).
189
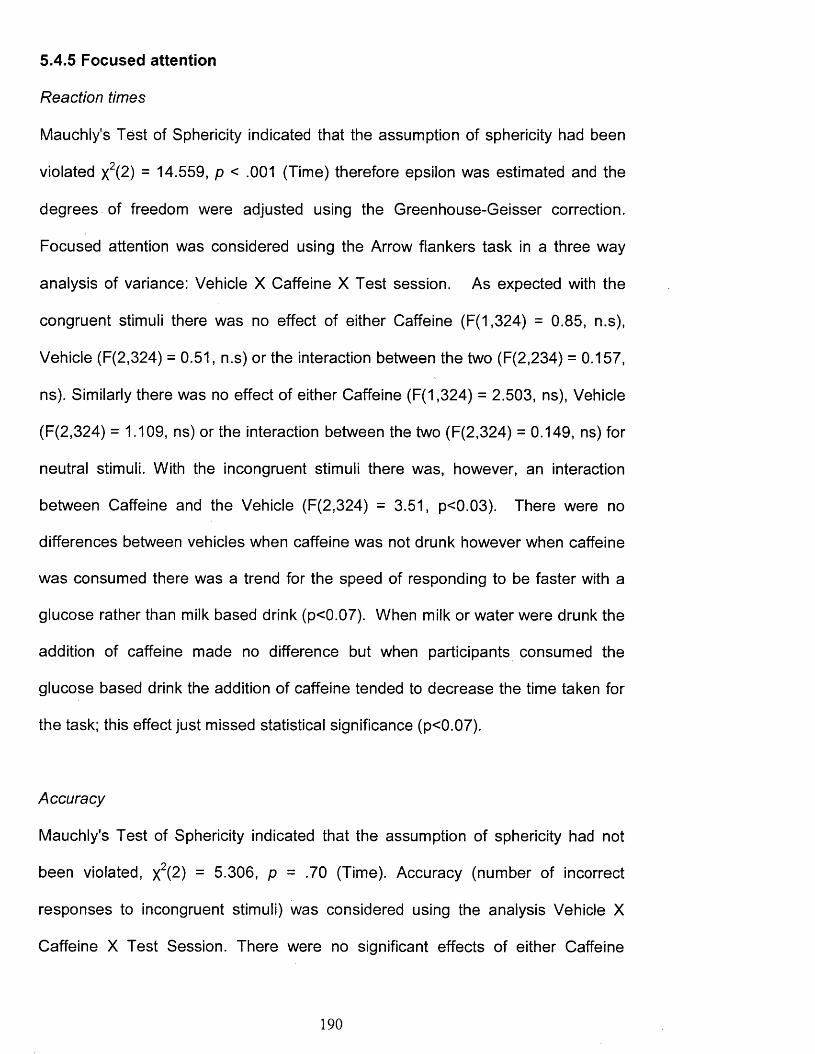
5.4.5 Focused attention
Reaction times
Mauchly's Test of Sphericity indicated that the assumption of sphericity had been
violated x2(2) = 14.559, p < .001 (Time) therefore epsilon was estimated and the
degrees of freedom were adjusted using the Greenhouse-Geisser correction.
Focused attention was considered using the Arrow flankers task in a three way
analysis of variance: Vehicle X Caffeine X Test session. As expected with the
congruent stimuli there was no effect of either Caffeine (F(1,324) = 0.85, n.s),
Vehicle (F(2,324) = 0.51, n.s) or the interaction between the two (F(2,234) = 0.157,
ns). Similarly there was no effect of either Caffeine (F(1,324) = 2.503, ns), Vehicle
(F(2,324) = 1.109, ns) or the interaction between the two (F(2,324) = 0.149, ns) for
neutral stimuli. With the incongruent stimuli there was, however, an interaction
between Caffeine and the Vehicle (F(2,324) = 3.51, p<0.03). There were no
differences between vehicles when caffeine was not drunk however when caffeine
was consumed there was a trend for the speed of responding to be faster with a
glucose rather than milk based drink (p<0.07). When milk or water were drunk the
addition of caffeine made no difference but when participants consumed the
glucose based drink the addition of caffeine tended to decrease the time taken for
the task; this effect just missed statistical significance (p<0.07).
Accuracy
Mauchly's Test of Sphericity indicated that the assumption of sphericity had not
been violated, x2(2) = 5.306, p = .70 (Time). Accuracy (number of incorrect
responses to incongruent stimuli) was considered using the analysis Vehicle X
Caffeine X Test Session. There were no significant effects of either Caffeine
190

(F(1,324) = 1.23, n.s), Vehicle (F(2,324) = 1.05, n.s) or the interaction between the
two (F(2,234) = 0.99, ns).
5.4.6 Reaction times
Mauchly's Test of Sphericity indicated that the assumption of sphericity had been
violated x2(2) = 366.965, p < .0001 (Lamps) and x2(5) = 160.453, p < .0001 (Time)
and x 2(2 0 ) = 1308.357, p < .0001 (Time X Lamps) therefore epsilon was estimated
and the degrees of freedom were adjusted using the Greenhouse-Geisser
correction. Decision times and movement times were considered separately. The
decision times were examined with Vehicle X Caffeine X Test session X Number of
lamps (1, 2, 4 or 8 lamps) design. The interaction Vehicle X Caffeine X Test
session reached statistical significance (F(2.5,402.8) = 2.46, p<0.05). Caffeine
quickened decision times after 30 (p<0.008), 90 (p<0.001) and 150 minutes
(p<0.0001) in water based drinks. Although adding caffeine to glucose based
drinks produced slightly quicker decision times, the effects were non-significant
and caffeine made little difference when added to milk. When participants
consumed caffeine their decision times were significantly faster with water rather
than milk at 30 (p<0.05), 90 (p<0.03) and 150 (p<0.02) minutes and significantly
faster with water rather than glucose 90 (p<0.009) and 150 (p<0.007) minutes post
ingestion. There were no significant differences between milk and glucose when
caffeine was consumed. Although there was a trend for decision times to be faster
after drinking milk when compared to either glucose or water, when caffeine was
not consumed these effects were not significant. The general pattern of results
showed that decision times became slower over the morning when water or
glucose had been drunk and that caffeine prevented this decline, more so when
191

taken with water. Reactions did not slow over the morning when milk was
consumed and the addition of caffeine did not affect this. The effects are illustrated
in Figure 26.
192

Wat
er
Gluc
ose
Milk
ir O O 0£ co tn cd
1 • — fi— • 1 iin o in o in o m
CO CO CM CM T“CO CO CO CO CO CO CO
0)csItCOO
0)cI(0
o□
(SUl) S3UII) UO1SIO0Q
? "® E ^ o03TJCCO
"OCD
g.c E § 8
^ D "D C§ E§8O T_o "o v cQ . CO
EQ)i_CO
CD4—«03 £
CO -c4 -i 4-4CO •>Q s
L_ ■ 0)c w.= 03C H-
ooovQ.
O CD
"D ^ 0 CO O OCO Q.
E ° o o
VCL
cn 0
_ E 0) '•*->
o . lW 0 0 OE 0-o
0
wo ®Q) •— ■O jgc 0 o o
cT30
0 Oeo ws 0jz1 roi_ 0q3 CD •*-> c 0 .ECO
>4—
s iC 0
8 g
CD ~o'0 0 ^ cT3 0S -*co o
DCT
0 a >» o
00 S '5 g‘o c00 -C
0= 0
ISE ®^ 3 =CM 0q O dv cS •— 0 — -*-•° 8 i= S2 8>~
00 0 E
4—<
c o5 IssO) °0
l l -a
coCM0
• c ^ ~o ~oC 00 0 0 ^ O 0 oo co. -Q9 0 ft o 0 *-V 3 §S C ^ o E ■-05 p~ P 5LO O Oq o oo d d v v vQ . CL Q .
202

Mauchly's Test of Sphericity indicated that the assumption of sphericity had been
violated x2(2) = 17.537, p < .0001 (Lamps) and x2(5) = 19.646, p < .0001 (Time)
and x 2(2 0 ) = 155.443, p < .0001 (Time X Lamps) therefore epsilon was estimated
and the degrees of freedom were adjusted using the Greenhouse-Geisser
correction. When movement times were examined the interaction Vehicle X
Caffeine X Test session reached statistical significance (F(3.7,593.9) = 3.018,
p<0.02). In general movement times were faster with caffeine although the only
significant difference occurred in the second test session in water based drinks
(p<0.02).
5.4.6 Vigilance
Mauchly's Test of Sphericity indicated that the assumption of sphericity had been
violated x2(2) = 8.362, p < .02 (Min) and x2(9) = 20.948, p < .02 (Time) therefore
epsilon was estimated and the degrees of freedom were adjusted using the
Greenhouse-Geisser correction. The number of sequences correctly identified was
considered with a Vehicle X Caffeine X Test Session X Minute of test design.
There was a significant interaction Caffeine X Minute of test (F(3.8,1251.5) = 4.73,
p<0.001) as well as a main effect of caffeine (F(1,323) = 5.777, p<0.02) Post hoc
test revealed that participants who consumed caffeine correctly identified more
sequences during the first (p<0.03), second (p<0.005), forth (p<0.01) and fifth
(p<0.002) minute of the test. The third minute of testing just missed statistical
significance (p<0.06), but as it was considered to be the result of a chance
variation in one cell, the main effect of caffeine is reported (p<0.004). Participants
who consumed a caffeinated drink identified more sequences correctly. There
were no effects involving Vehicle.
194

Next the reaction times when correct sequences had been identified were
examined. This analysis required the removal of participants who had failed to
identify any of the correct sequences in any testing period. There was no evidence
that the number of such incidences differed according to which drink participants
had consumed. Mauchly's Test of Sphericity indicated that the assumption of
sphericity had been violated x2(9) = 38.501, p < .0001 (Time) and x2(35) = 80.119,
p < .0001 (Time X Min) therefore epsilon was estimated and the degrees of
freedom were adjusted using the Greenhouse-Geisser correction. There was a
significant main effect of caffeine (F(1,288) = 7.62, p<0.006), the responses were
quicker when caffeine had been consumed (583.59+/- 6.01 c.f. 560.73 +/- 5.69).
The interaction Vehicle X Minute of test was also significant (F(7.5,1217.6) = 3.24,
p<0.04). Post hoc tests revealed that when glucose was consumed reaction times
were significantly slower towards the end of the testing period. Participants who
consumed water had faster reactions than those who consumed glucose during
the third (p<0.008), fourth (p<0.001) and fifth (p<0.005) minute of the test.
Similarly, participants who consumed milk had faster reactions than those who
consumed glucose during the fourth (p<0.005) and fifth (p<0.05) minute of the test.
There were no significant differences between those who consumed milk and
those who consumed water. Thus the consumption of glucose slowed reaction
times towards the end of the task.
195

5.5 Summary
Blood glucose
• Young adults’, who consumed glucose, rather than milk or water, had
higher interstitial glucose levels during the early postprandial period.
Similarly, those that drank caffeine had higher glucose levels during the
early postprandial period.
• Young adults’ that drank caffeine had higher interstitial glucose levels
during the later postprandial period.
Mood
• 30 min after consumption caffeine, when taken with water but not milk or
glucose, increased ratings of feeling energetic.
• With the water-based drinks, at both 90 min and 150 min, those receiving
caffeine reported being more tired.
• However, in those consuming the milk-based drink, the addition of caffeine
increased reports of energy at 90 min and 150 min.
• Caffeine, when added to the glucose-based drink, did not influence ratings
of energy at any stage throughout the morning.
• A similar pattern of results were observed for ratings of clearheaded-
confused and agreeable-hostile.
Cognition
• Young adults’, who drank milk, rather than glucose or water, had quicker
working memory responses after 90 and 150 minutes and there was a
similar trend for episodic memory.
196

• Reaction times on the vigilance task were faster during the forth, and fifth,
minute of the test if participants drank milk rather than glucose.
• Young adults’, who consumed caffeine recalled more words, had quicker
choice reaction times, faster working memory, and better and quicker
responses on the vigilance task.
5.6 Discussion
The Effect of Vehicle
As predicted the present study found that the participants who consumed milk
rather than glucose based drinks had a more gradual increase in blood glucose
and tended to experience less of a decline towards the end of the morning (Figures
18 and 21). Presumably participants were provided with a steadier and more
consistent supply of energy if they had drunk milk than if they had drunk glucose.
The consumption of water did not affect participants interstitial or blood glucose
levels as it did not provide participants with a source of energy.
Since low GL meals have been associated with better cognitive functioning and
mood in the late morning (Benton et al. 2003, 2007), it was predicted that a low GL
milk based drink would improve both mood and cognitive functioning two to three
hours after consumption compared to the high GL glucose or water. There were in
fact several findings that the response to glucose and milk differed. In the second
and third testing session the consumption of milk with caffeine, rather than glucose
or water with caffeine, resulted in reports of increased energy (Figure 22). The time
required to do mental arithmetic was longer in the serial sevens test 90 and 150
minutes after a drink when glucose or water, rather than milk, was consumed
197

(Figure 25). Reaction times on the vigilance task were faster during the forth and
fifth minute of the test if participants drank milk rather than glucose. There was
also a trend for more words to be recalled after 150 minutes when milk rather than
glucose had been consumed (Figure 24).
Many studies have reported similar decrements when examining the effects of a
glucose drink on mood and cognitive performance. In general previous findings
suggests that even if the consumption of glucose is initially beneficial, after two or
three hours the subsequent fall in blood glucose may have negative consequences
for both mood (Donohoe and Benton, 1999a) and memory (Donohoe and Benton
1999b, 2000; Benton et al., 2003). Thus if consuming glucose has longer term
negative consequences the possibility arises that other types of nutrition that
sustain blood glucose homeostasis may have a longer benefit. This expectation
was confirmed by the present study; energy provided in the form of milk rather than
glucose benefited in aspects of mood and cognition in the late morning (Figures 21
to 25).
Although the benefits of a low compared with high GL meals or snacks are often
interpreted as a consequence of changes in- postprandial blood glucose levels
actual blood glucose measurements have not been consistently found to correlate
with performance (Fischer et al, 2001; Benton et al, 2003; Benton and Nabb,
2004). A change in blood glucose level has various metabolic consequences,
both centrally and peripherally: for example, changes in levels of acetylcholine,
serotonin, glutamate, insulin, glucagon and cortisol (Hoyland et al, 2008). The
198

mechanism by which low GL benefits cognition and mood thus may involve one or
many correlates of blood glucose.
The effect of caffeine
It is now commonly accepted that caffeine can improve certain aspects of cognition
and mood, however, negative effects of caffeine on glucose homeostasis have
been previously reported. In the present study the addition of caffeine, irrespective
of vehicle, was associated with higher levels of glucose. This effect of caffeine has
been documented previously. For example Pizziol et al (1998) in a placebo-
controlled study found that 200mg caffeine increased blood glucose levels during
the third and fourth hour of an ora! glucose tolerance test (OGTT) that involved the
consumption of 75g of glucose. In addition Graham et al, 2001 reported that after
the consumption of 5mg/kg caffeine (average of 325mg) participants had a 24%
greater area under the curve (AUC) for blood glucose and a 60% greater AUC for
serum insulin during the last 90 minutes of an OGTT. In a similar fashion, Moisey
et al (2007) investigated the effect of caffeinated coffee (5mg/kg caffeine),
compared to decaffeinated coffee, given with either a high (GL 65.75) or a low
glyceamic load (GL 30.75) meal. They found that caffeinated coffee was
associated with a larger .area under the curve (AUC) for both blood glucose and
insulin, suggesting significantly impaired glucose management after the
consumption of caffeine. Insulin sensitivity was also significantly reduced when
caffeine was taken with the high GL meal but not when it was taken with the low
GL meal. Although these findings are relevant, the studies used fairly high doses of
caffeine (200-350mg), higher than what would be found in a standard cup or coffee
or most energy drinks. However the present study demonstrates that the ingestion
199

of a smaller dose (80mg) of caffeine similarly impairs glucose tolerance and results
in a disruption of blood glucose homeostasis.
In regards to cognition, when participants consumed caffeine it produced a series
of changes in performance of the type that would be expected from previous
research. Its consumption resulted in recalling more words, quicker reaction times
in the choice reaction time test and the working memory task, and better and
quicker responses on the vigilance task. Subjective energy levels were also
increased 30 minutes after consumption when taken with water (Table 20). These
effects of caffeine have been frequently reported and reviewed (Smith, 2002;
Glade, 2010; Nehlig, 2010) and are probably the result of caffeine’s antagonistic
actions at the A i and A 2a subtypes of the adenosine receptors (Lorist and Tops,
2003).
Although there was consistent evidence that caffeine speeded reaction times there
was an interesting failure to find a consistent change in subjective mood over the
morning: rather the response depended on the vehicle to which it was added
(Figures 22 and 23). Later in the morning the addition of caffeine to milk-based
drinks increased subjective energy. In contrast, caffeine made little difference to
ratings of energy when combined with glucose. Later in the morning caffeine
resulted in feeling more tired if it was combined with water, a novel finding as
reviews of the topic have suggested that in “low to moderate doses, caffeine have
been quite consistently shown to increase positive affect” (Smith et al., 2004).
Similarly, Rogers et al. (2011) concluded that “a clear result is that caffeine
compared with placebo increases alertness”. Although such comments are
200

received wisdom they reflect mostly studies of the short-term response to
consumption rather than the effect after two to three hours. To date the longer
term effects of caffeine consumption have been considered less frequently.
Furthermore, there has been only limited attempts to consider the nature of the
drink in which caffeine was administered. To our knowledge only six studies have
systematically examined the effect of different vehicles in combination with caffeine
and their effects on mood or cognition. Such vehicles have included tea (Smith,
Sturgess, et al, 1999; Quinlan, Lane, et al, 1997;1999), coffee (Liguori, Hughes, et
al, 1997; Smith, Sturgess, et al, 1999; Quinlan, Lane, et al, 1997;1999; Hindmarch,
Rigney, et al, 2000), diet cola (Liguori, Hughes, et al, 1997; Smith, Sturgess, et al,
1999), cola (Smith, Sturgess, et al, 1999), water (Quinlan et al, 1999) and the
effect of adding milk to tea or coffee (Quinlan, Lane et al, 1997). All reported a
main effect of caffeine on measures of mood regardless of the vehicle. Although
drinks such as tea and coffee contain different phytonutrients they are similar in
their macronutrient content to the extent that these studies essentially examined
the effect of caffeine when taken with a water based drink. In addition, most of
these studies only examined effects up to 90 minutes after consumption. With this
in mind previous reports are not inconsistent with the present finding that after half
an hour the consumption of caffeine was associated with reports that participants
felt more energetic, but only if it was provided in a water-based drink (Table 20).
The only other context that has examined caffeine in combination with other
ingredients is ‘energy drinks’(ED). There are reports that EDs (glucose, caffeine
and a range of other ingredients) increase alertness (Alford et al., 2001; Reyner
201

and Horne, 2002; Kennedy and Scholey, 2004; Smit et al., 2004), attention (Alford
et al., 2001; Kennedy and Scholey 2004; Reyner and Horne, 2002; Warburton et
al. 2001) and reaction times (Alford et al., 2001; Horne and Reyner, 2001). It has
been concluded that caffeine is the component that is responsible for the beneficial
effects of EDs (Van den Eynde et al, 2008). However, most often studies such as
these have examined a ‘whole’ ED containing both glucose and caffeine and
compared it to a placebo (usually water), making it impossible to determine the
relative contribution of each ingredient. In addition, participants typically were
tested 30 - 60 minutes after consumption providing only limited information on the
time scale of such results. Interestingly, the present study found that those who
drank a combination of caffeine and glucose rated themselves similar in energy to
those that consumed only water at 30 minutes after consumption. It was only when
considering the components individually that significant differences emerged. As
expected caffeine when taken with water, when compared with water alone,
increased reported energy after 30 minutes. However when caffeine was
combined with glucose no such benefit was observed. This suggested that the
consumption of glucose may have antagonised the effect of caffeine.
To our knowledge few studies have tried to distinguish the relative influence of
caffeine and glucose. Scholey and Kennedy (2004) gave participants glucose,
caffeine, a combination of both, or a placebo and found that compared to the
placebo only the combination of glucose and caffeine improved memory and speed
of attention. There were no effects on mood. They concluded that the pattern of
results would not be predicted from the effects of glucose and caffeine in isolation
and that there was some degree of synergy between the two. However, only the
combination of glucose and caffeine differed significantly from the placebo and as
202

comparisons were not made with caffeine or glucose alone, the interaction
between the two ingredients can not be determined. Adan and Serra-Grabulosa
(2010) found that a combination of caffeine and glucose improved reaction times
but only when compared with water, however both caffeine and glucose when
taken alone also speeded reaction times compared with water. Adan and Serra-
Grabulosa (2010) also reported that memory was improved after a combination of
glucose and caffeine rather to water, caffeine alone or glucose alone, suggesting
that there may be a synergistic interaction between the two ingredients. Adan and
Serra-Grabulosa (2010) findings contrast with the present finding that only caffeine
increased the number of words that could be recalled; there was no interaction with
glucose, and glucose did not differ significantly from water. Similarly to Scholey
and Kennedy (2004), Adan and Serra-Grabulosa (2010) found that there was no
effect of either glucose or caffeine on mood. In both studies participants were
tested 30 minutes after the drink and as the present study demonstrated that
effects on mood may occur at a later stage this needs to be further considered.
Smit, et al, (2004) systematically studied the effects of glucose and caffeine
taken alone, or together, and a placebo up to 90 minutes after consumption.
Similar to the present results they found that caffeine speeded reaction times and
that in the absence of caffeine perceived energy decreased over time. The
decrease in energy over time meant that significant benefits of caffeine were seen
after 60 minutes; glucose had no effect. Although this supports the notion that
effects on mood may appear at a later stage Smit et al. (2004) found that caffeine
improved energy irrespective of glucose. In contrast, the present study suggested
that the effect of caffeine may be dependant on the vehicle with which it is
consumed. Ninety minutes following the drink caffeine only increased energy in
203

those that consumed it with milk (Figures 22 and 23). Although those that drank
glucose and caffeine rated themselves as more energetic than those that
consumed water and caffeine, this reflected a negative response: participants
became more tired if they drank caffeine with water.
To our knowledge only one study has so far examined the effect of ED
components longer than 90 minutes post consumption. Giles et al (2012) studied
the effects of 200mg caffeine, with or without taurine, in participants who did or did
not consume glucose (50g) up to 120 min post consumption. Similar to the present
findings caffeine improved attention and speeded up reaction times. In addition
glucose (regardless of caffeine) slowed down reaction times. Furthermore, in line
with the present finding, that caffeine when taken with water reduced ratings of
energy 90 and 150 minutes after a drink, Giles et al. (2012) reported that between
0 (time of drink) and 60 minutes caffeine reduced fatigue, however, when caffeine
was taken with taurine fatigue increased between 0 and 120 minutes. These
findings support the notion that over time, under certain circumstances, caffeine
may reduce reported energy levels. Also consistent with the present finding Giles
et al. (2012) found no effect of glucose on any measure of mood.
Given the present observation that caffeine impaired glucose tolerance, and that
participants who consumed milk had a steadier interstitial glucose response, it is
possible that alterations in blood glucose homeostasis may mediate interactions
between caffeine and vehicle. Indeed it was clear that of the participants who had
drunk caffeine and water, those who rated themselves the most tired, had the
highest glucose Jevels at the end of the morning (Appendix 15 and 16). Impaired
204

glucose tolerance has been related to poorer cognition (Donohoe and Benton,
2000) and mood (Nabb and Benton, 2006a,b) As potentially a similar decrement
may occur when an artificial state of impaired glucose tolerance is produced by the
consumption of caffeine this possibility should be further examined.
The present results should not, however, be over-interpreted or over-generalized.
The results of any study potentially reflect specific aspects of the design. The
generality of the findings need to be established and critical parameters
established. It is possible that the negative response to caffeine and water,
observed in this study, reflected the consumption of the high Gl breakfast that was
followed by no additional food consumption. Participants’ blood glucose were
already declining at the time of the drinks. It is possible that the consumption of
caffeine without additional energy further compromised blood glucose homeostasis
resulting in the decline in subjective energy. It is possible that a low GL breakfast
might have produced a different pattern of results. Many previous reports of a
positive response to energy drinks and caffeine used participants who had fasted
overnight, a condition that is not likely to occur typically in everyday life. Fasted
participants are also caffeine deprived. To what extent have the phenomena
presently reported been a reflection of the reversal of withdrawal effects? The
highly demanding, long and monotonous testing procedure may also have
contributed to an increased level of tiredness, after drinking caffeine and water. It is
unclear whether similar levels of tiredness would have been reported in the
absence of these conditions. These methodological differences need to be further
considered.
205

The aim of this chapter was to determine whether caffeine, which causes glucose
intolerance, interacts with the GL that it is consumed with, to affect cognition and
mood. Caffeine when taken with water reduced energy levels 90 and 150 minutes
later. In contrast, taking caffeine with milk (low GL) increased energy levels during
this time. Although taking caffeine with glucose (high GL) prevented the decline in
energy seen when caffeine was taken with water, an increase in energy was not
observed following this combination (Figures 22 and 23). Interesting questions
emerge from the present study. If an adverse response to adding caffeine to water
based drinks is confirmed there are obvious implications. Would comparable
findings result from the consumption of coffee, tea, cola-type or ED? This is an
important issue as coffee, for example, is widely consumed with the anticipation
that it will decrease tiredness or to maintain alertness when driving. The current
data suggest that this effect may be short lived and in the longer-term even
detrimental. So far the questions have been mostly ignored as to whether the
effect of caffeine depends on the macronutrients with which it is consumed and the
time scale over which it is measured.
206

CHAPTER 6
The role of endothelial dysfunction in glucose tolerance related cognitive
decline - a pathway for nutritional interventions?
6.1 Introduction
In summary, the data presented found that older adults with poorer GT had a
greater degree of amnesic cognitive decline and rated themselves more anxious
and depressed than those with better GT (Figures 12 and 13). It is note worthy
that these effects were stronger in those aged 61 or above. Interestingly, a
tendency for LBG to fall below baseline was not related to poorer cognition, in fact
older adults with poorer GT and LBG below baseline had less cognitive decline
and depression than those with poorer GT and no LBG (Figures 12 and 13). In
both children and healthy older adults a lower rather than a higher GL meal
improved cognition and mood, most notably during the late postprandial period
(Figures 4-9 and 14-16). This, however, was not the case for older adults with
poorer GT, or those with early signs of cognitive decline. Although older adults
with poorer GT had a transient improvement in memory and mood following a high
GL meal, this was limited to the first 30 minutes after consumption (Figures 14 -
16). In young adults caffeine induced a mild degree of glucose intolerance (Figures
19 and 20). Although caffeine (taken with water) increased subjective energy after
30 minutes, it resulted in decreased energy levels later in the morning (Figure 22.
However, caffeine taken with milk was associated with an increase in subjective
energy after 90 and 150 minutes (Figure 22). There were no effects of caffeine on
ratings of energy when it was taken with glucose. Drinking a lower GL drink (milk
207

or water rather than glucose), regardless of caffeine, improved young adults
episodic and working memory 150 minutes later.
This chapter presents a theoretical overview that attempts to account for these
findings and highlights possible areas for future research. First glucose uptake and
metabolism in the brain are reviewed in greater detail than in chapter 1; a particular
emphasis is placed on the role of the epithelial cells of the BBB. This is followed by
a detailed account of the evidence that suggests nitric oxide plays a critical role not
only in epithelial - mediated vasodilatation, and hence cerebral blood flow, but also
in glucose uptake and utilisation by the brain. Next it is argued that these vital
mechanisms are impaired in both aging, and those with glucose intolerance, and
may help account for the cognitive deficits that occur when these conditions
combine. With this backdrop it is explained how this perspective can account for
many of the findings of this thesis. Finally, areas of future research based on this
theoretical perspective are suggested.
6.2 The supply of energy to the brain.
Due to the relative lack of stored brain carbohydrate (except a small amount of
glycogen, mostly in astrocytes) the brain relies upon continuous cerebral blood
flow and the passage of glucose across the BBB to meet its energy needs.
GLUT1, the main glucose transporter, is found at the luminal and abluminal
membranes of the BBB endothelial cells and plays an essential role in the
facilitated diffusion of glucose across the membrane (Farrell et al, 1991). Additional
glucose transporters have also been identified at BBB endothelial cells; GLUT3
(Gerhart et al, 1992), GLUT4 (Ngarmukos et al, 2001) SGLT1 (sodium-dependent
208

glucose transporters) (Matsuoka et al, 1998) and SGLT2 (Martin et al, 2006) but at
much lower levels than the GLUT1 protein (Shah et al, 2012).. Thus any changes
affecting GLUT 1 function and expression will dramatically affect brain glucose
homeostasis and brain functioning. An excellent example of this is a rare disorder
De Vivo disease; an autosomal dominant developmental disorder associated with
a deficiency of GLUT 1 which is characterized by a low glucose cerebrospinal fluid
concentration (hypoglycorrhachia), a type of neuroglycopenia, that results from
impaired glucose transport across the BBB (Lankford et al. 2012).
As would be expected regional glucose use and consumption in the brain is
strongly related to local blood flow (Clarke and Sokoloff, 1999), thereby linking
neuronal activity, metabolic rate, and blood flow. Upon the activation of local
cortical and subcortical networks, during cognitive demand, there is an increase in
energy consumption, followed by a drop in local interstitial glucose, resulting in an
increased need for energy substrate delivery and transport (McNay et al, 2000;
2001). This localized drop in glucose levels within the brain increases the
transbarrier concentration difference and thus, via GLUT1, drives glucose entry
into the brain interstitium (Leybaert et al, 2007). The supply of blood and nutrients
to meet the local needs of the brain cells also relies upon the process of
neurovascular coupling, that is, the coupling of vessel diameter and thus blood
flow, to neuronal activity (Harder et al, 1998; Kuschinsky, 1997). This process is
highly, although not exclusively, dependent on the ability of brain endothelium to
induce vasodilatation (Girovard and Ladecola, 2006; Toda et al, 2010).
209

6.3 The role of nitric oxide
Nitric oxide (NO) is a small inorganic, labile, gaseous molecule, which is produced
by the endothelium and mediates the relaxation of blood vessels (Furchgott and
Zawadzki, 1980). NO and l-citrulline are synthesized by the enzyme nitric oxide
synthase (NOS) through a two-step conversion process from l-arginine and the
intermediate N-hydroxy-l-arginine. This enzymatic reaction requires l-arginine,
oxygen, and NADPH as co-substrates (equation 1). The guanidino nitrogen in I-
arginine and oxygen provide the nitrogen and oxygen atoms in NO, respectively.
The co-factors involved in the reaction are flavin adenine dinucleotide (FAD), flavin
mononucleotide (FMN), and tetrahydrobiopterin (BH4). Calmodulin and heme are
the prosthetical groups involved in the reaction (Knowles, 1997). In vivo NO has a
half-life of only 1-2ms, however, it can be oxidised to nitrate and nitrite that have
half-lives of 5-8hrs and 1-20min respectively (Lidder and Webb 2013). These
molecules are transported in the blood, accumulate in tissue and have the potential
to be converted back to NO under particular physiological and pathological
conditions, for example, during hypoxia when the oxygen dependent NOS is
compromised (Lundberg et al, 2008).
Equation 1
2 L-arginine + 3 NADPH + 4 0(2) ^ 2 L-citrulline + 2 nitric oxide + 3NADP(+) + 4 H(2)0
There are three isoforms of NOS, the genetic sequence of each residing on three
distinct chromosomes: endothelial (ENOS), neuronal (NNOS), and inducible
(INOS), however, it is now known that NNOS and ENOS are also expressed in
210

other tissues, for example, the mitochondria (also known as mtNOS) (Law et al,
2001). ENOS is responsible for NO-endothelial mediated vasodilatation.
6.3.1 Nitric oxide may mediate neurovascular coupling.
NO formed via endothelial NO synthase (eNOS) induces vasodilatation, blood flow
increase, and reduces blood pressure; effects that are mediated by the binding of
NO to soluble guanylyl cyclase (cGC) and the subsequent production of cyclic
guanosine monophosphate (cGMP) (Toda et al, 2010). In the brain, relationships
have been observed between neuronal activation, NO production and blood flow
(Okamura et al, 2002). Indeed, although the quest for mediators is ongoing, it has
been argued that NO itself might directly mediate the neurone to vessels
communication and thus has an important role to play in the coupling of neuronal
activity and increased blood supply aka neurovascular coupling (Girovard and
ladecola, 2006; Laranjinha et al, 2012). There is evidence that the vasoactive
actions of glutamate were reduced by nitric oxide synthase (NOS) inhibitors (e.g.
N-nitro-L-arginine) (Lovick et al, 1999; Meng et al, 1995; Dirnagl et al, 1993) and
that local application of NOS inhibitors suppressed the activity-dependent
vasodilatation by about 50% (Duchemin et al, 2012). Interestingly both eNOS and
nNOS derived NO appear to be important (Toda et al, 2009). For example, it has
been argued that the release of nNO from interneurons upon activation initiates the
vascular response to neuronal stimulation (Duchemin et al, 2012), although more
research is needed to confirm if this is the case. Whether NO mediates neurone to
vessel communication, or not, there is no doubt that NO plays crucial roles in the
regulation of blood flow in various organs including the brain (Toda et al, 2010).
211

The relationship between NO and neurovascular coupling is illustrated in Figure
29 .
GLUT translocation> G lucose
uptake
Neuronalactivation
AMP
GLUTTranslocationAM PK
* NO * Vasodilation
ArginineBH4
Figure 27. A schematic representation of the roles of AMPK and NOS in
neurovascular, neurometabolic and neurobarrier coupling. Upon neuronal
stimulation energy is consumed and hence AMP is increased. The increase in
AMP increases AMPK activity which enhances GLUT translocation and
increases glucose uptake. Simultaneously, neuronal activation, both directly
and indirectly via AMPK, activates NOS, increasing NO, leading to vasodilation.
212

6.3.2 Nitric oxide may regulate neurometaboiic and neurobarrier coupling.
Interestingly, eNO activity also appears to be intimately related to that of
adenosine-3',5'-monophosphate-activated protein kinase (AMPK) (Chen et al,
2000; Shearer et al, 2004; Zou et al, 2004) which suggests that eNO may play a
vital role in the regulation of the metabolism of energy substrates. The overall
effect of AMPK, via a number of mechanisms, is to switch off the ATP-consuming
pathways such as lipogenesis or gluconeogenesis while switching on the ATP-
producing pathways such as fatty acid and glucose oxidation (Jobgen et al, 2006).
Previous studies have revealed that AMPK promotes the production of
endothelium-derived NO (Chen et al, 2009; Schulz, 2009). For example,
experiments with aortic rings in mice lacking AMPK showed reduced eNOS
phosphorylation and AMPK knockout mice displayed decreased eNOS-mediated
NO production (Chen et al, 2009). Interestingly, NO itself can activate AMPK
(Zhang et al, 2008); AMPK-mediated eNOS activation might lead to a sustained
NO release owing to a positive feedback loop (Figure 29). It appears that eNO may
mediate AMPK stimulated glucose uptake. For example, NOS inhibitors
diminished AMPK-stimulated glucose uptake (Fryer et al, 2000; Li et al, 2004).
Stimulation of AMPK activity increased glucose uptake by GLUT 4 in skeletal and
cardiac muscle during exercise (McConell and Kingwell, 2006; Hayashi et al, 1998;
Li et al, 2004) via an insulin independent mechanism. In the brain AMPK activation
caused an increase in the surface expression of the neuronal glucose transporter
GLUT3 (Weisova et al, 2009) and similar observations have been made regarding
GLUT1 transporters in the plasma membrane (Abbud et al, 2000; Barnes et al,
2002). As mentioned previously, GLUT 1 is the glucose transporter that is found in
213

the epithelial cells of the BBB. Thus NO could modulate the transport of glucose by
GLUT 1 and hence brain interstitial glucose levels. It has been argued that in the
brain AMPK is a crucial mediator that couples increased energy demands with
neuronal activity and glucose uptake (Amato and Man, 2011), and there is
evidence that eNO is at least partially responsible for this effect (McConell and
Kingwell, 2006; Cidad et al, 2004). Taken together these findings suggest that eNO
may play a vital role in the uptake of glucose in the brain. It is possible that AMPK-
eNOS-mediated vasodilatation and GLUT expression provides a means to
increase blood, and hence glucose supply, to neurons during metabolic demand,
providing a link between metabolism and blood perfusion (Schulz, 2009).
In the periphery NO may also play a vital role in insulin stimulated glucose
transport in skeletal muscle and adipose tissue and hence affects gluco-regulatory
ability. Inhibition of NOS impairs glucose tolerance in rats (Roy et al, 1998) and
humans (Baron et al, 1995). Dietary supplementation of arginine (NOS substrate)
has been shown to reduce plasma glucose levels in streptozotocin-induced
diabetic rats (Kohli et al, 2004) and Zucker diabetic fatty rats (Fu et al, 2005).
These latter effects may be mediated by an increase in blood flow and hence
glucose delivery to muscle and adipose tissue (Baron et al, 1995), an increase in
insulin receptor sensitivity, or an increase in the surface expression of GLUT 4.
Therefore any factor that affects the bioavailability or production of NO may
simultaneously impair endothelial functioning, glucose tolerance, the supply of
energy to the brain, glucose metabolism within the brain and cognitive function.
Indeed a growing body of research implicates both eNOS and nNOS derived NO in
the modulation of learning and memory in experimental animals (Bohme et al,
214

1991; Haley et al. 1992; Chapman etal, 1992; Rickard etal, 1988; 1999; Bernabeu
et al, 1995).
6.3.3 Aging reduces NO availability and impairs endothelial and cognitive
function.
Aging is associated with changes in cerebrovascular structure and functioning
which may contribute to cognitive decline (Sonnteg et al, 2007). For example,
fMRI studies have demonstrated a reduction of cerebral activation in older
participants, which may be associated with age-related changes in the mechanism
that links neuronal activity to vascular changes (Nielson et al, 2004; Taoka et al,
1998). Similarly, a recent review of transcranial doppler ultrasonography studies
concluded that aging was associated with a slowing of blood flow velocity (Keage
et al. 2012). These changes may, at least in part, be attributed to age related
endothelial dysfunction (Figure 30).
215

GLUT translocation
AMP < £
\A M PK
Arginine
% ROS
Neuronalactivation
£Hypergiycaemia
Glucoseuptake
t
A a e m
GLUTTranslocation
► NO V asodilation
Figure 28. A schematic representation of the effect of hyperglycaemia and
aging on AMPK and NOS activity and neurovascular, neurometabolic and
neurobarrier coupling. In both aging and hyperglycaemia there is an increase in
reactive oxygen species (ROS) that leads to NOS uncoupling due to the oxidation
of BH4 to BH2. As a result less NO is available thus vasodilation, AMPK activity,
GLUT translocation and glucose uptake are reduced. Hyperglycaemia also
directly inhibits AMPK activity further reducing neuronal glucose availability.
216

When we are young and healthy, the endothelial production of NO is effective and
sufficient, however, as we age we lose our ability to synthesize endothelial derived
NO (Torregrossa et al, 2011). For example, Taddei et al (2001) studied
endothelium dependent forearm blood flow and concluded that dysfunction of the
NO system contributed towards reductions in endothelium functioning in older
adults. Similarly, Egashira et al (1993) reported that there may be up to a 75%
loss of endothelium-derived nitric oxide in 70-80 year olds compared to 20 year
olds. In regards to cerebral blood flow Okamoto et al (2001) reported that the
administration of L-arginine (NO substrate) increased cerebral blood flow velocity
to a lesser extent in older participants (average 70 years of age) than younger
participants (average 29 years of age), suggesting a diminished NOS activity, or
NO availability, and hence reduced NO-mediated cerebral vasodilatation in aging
participants. Similar effects have also been observed in aged rats, for example
Mayhan et al, (2008) found that NO dependant dilatation of cerebral arterioles was
impaired in aged compared to younger adult rats. Similarly, Geary and Buchholz
(2003) noted that aging increased cerebral artery tone and reduced NO dependant
dilatation in male rats. Taken together these findings suggest that with aging
cerebral blood flow reactivity is reduced, possibly the result of diminished NO -
mediated vasodilatation.
Age related reductions in NO could also alter BBB transport of glucose via GLUT 1
(de al Torre and Stefano, 2000). Emerging studies indicate that the
responsiveness of AMPK signalling declines with aging, impairing metabolic
regulation. For example, Reznick et al (2007) found that acute stimulation of AMPK
activity (by 5'-aminoimidazole-4-carboxamide-1-p-D-ribofuranoside) was reduced
217
in aged rats. Similarly, Ljubicic and Hood (2009) demonstrated that the activation
of AMPK, induced by muscle contractions, was reduced in the muscles of older
individuals. Given that NO is thought to mediate AMPK stimulated glucose uptake
(Fryer et al, 2000; Li et al, 2004), reduced NO availability may account for these
findings. In line with this Deshmukh et al (2010) found that treatment of skeletal
muscle with a NO donor increased AMPK mediated glucose uptake. As previously
mentioned AMPK activation causes an increase in the surface expression of the
neuronal glucose transporter GLUT3 (Weisova et al, 2009) and GLUT 1 in the
plasma membrane (Abbud et al, 2000; Barnes et al, 2002). Thus it is possible that
a decline in AMPK signalling may inhibit glucose transport across the BBB and into
neurons when needed. Consistent with this, is evidence in rodents that suggests
that the drop in interstitial glucose levels, associated with neuron activity, is deeper
and lasts longer in older animals suggesting a reduced ability to adapt to the
depletion of interstitial glucose (McNay and Gold, 2001). This diminished supply of
fuel produces a less than perfect environment for neuronal functioning which may
contribute to age-related deficits in learning and memory. These findings may also
help explain the lower brain glucose metabolism observed with PET scans in older
participants (Bentourkia et al, 2000; Kalpouzos et al 2009), MCI (Mosconi et al,
2005; 2009) and those with dementia (Drzezga et al, 2003; Mosconi et al, 2005;
2009). Given the hippocampus’s vulnerability to damage (Mattson et al, 1989;
McEwen, 1997) it is possible that over time a combination of reduced blood flow
reactivity, and diminished glucose transport, could lead to neuronal death and a
loss of hippocampal volume.
218

There are probably many mechanisms underlying age related reductions in NO
availability. It has been suggested that age associated superoxide production may
be responsible for reducing available NO (Mayhan et al, 2008; van der Loo et al,
2000). Superoxide can react with NO to produce peroxynitrite (van de loo et al,
2000), which, in turn, can oxidize tetrahydrobiopterin (BH4) (the co-factor of eNOS)
to dihydrobiopterin (BH2), thus reducing its availability to eNOS (Pitocco et al,
2010). In the presence of reduced concentrations of BH4, eNOS becomes
uncoupled and transfers electrons to molecular oxygen instead of L-arginine to
produce superoxide, rather than NO, thus promoting a perpetuating decline in NO
availability and endothelial dysfunction. The relationships between aging,
superoxide formation, NO, AMPK, vasodilatation and glucose uptake can be seen
in Figure 30.
6.3.4 Hyperglycaemia reduces NO availability and impairs endothelial and
cognitive function.
Type two Diabetes mellitus (T2DM) has been associated with both vascular and
Alzheimer’s dementia (Craft, 2009). Furthermore, in those without diabetes a
reduced ability to regulate blood glucose is associated with poorer attention
(Donohoe et al, 2000), slower reaction times (Yaffe et al, 2012; Donohoe et al,
2000) and poorer memory (Yaffe et al, 2012; Awad et al, 2002), changes in
functioning that are more pronounced in older age (Ryan and Geckle, 2000).
Currently one in every 10-15 cases of dementia can be attributed to T2DM
(Kloppenborg et al, 2008). There is evidence that the age-related reduction in
cerebral blood flow may be accelerated in T2DM (Wakisaka et al, 1990). Similarly,
cerebral artery reactivity has been reported to be reduced in T2DM compared to
219

controls (Moghaddasi et al, 2010). Therefore it appears that the natural changes
that occur with age may be exacerbated further by conditions such as T2DM. It
has been documented in human studies that endothelial cells in T2DM fail to
produce sufficient amount of NO, thus smooth muscle cells fail to relax in response
to endothelium-dependent vasorelaxants (e.g. acetylcholine, bradykinin, shear
stress, etc.) (Avogaro et al, 2006 for a review). The development of diabetes
mellitus is characterized by high serum glucose levels. Glucose is a prooxidant
molecule that can lead to the overproduction of reactive oxygen species (ROS)
such as superoxide and hydrogen peroxide. The mitochondrion represents an
important source of reactive oxygen species in the diabetic endothelium. During
hyperglycaemia there is an overproduction of electron donors from the tricarboxylic
acid cycle and this causes the mitochondrial proton gradient to increase. It is
suggested that there is a threshold over which the life of superoxide-generating
electron transport intermediates is prolonged (Nishikawa et al, 2000), once this
threshold is exceeded superoxide production is markedly increased (Korshunov et
al, 1997). Thus an overproduction of oxidant molecules in T2DM may reduce the
bioavailability of NO, cause endothelial dysfunction and hence reduce cerebral
blood flow.
AMPK signalling is also negatively regulated by chronic exposure to high levels of
glucose. For example, incubation of epithelial cells with high glucose
concentrations reduces AMPK activity (Ido et al, 2002) and therefore reduces
glucose uptake by all cells (Viollet et al, 2010), including neurons (Weisova et al,
2009) and the plasma membrane (Abbud et al, 2000; Barnes et al, 2002). In
addition, studies show that GLUT 1 is down regulated in animals with diabetes,
220

possibly as a result of chronically elevated blood glucose levels (Pardridge et al,
1990). This suggests that glucose transport across the BBB is likely to be reduced
in those with poorer GT. Figure 30 illustrates the relationships between
hyperglycemia, superoxide formation, NO, AMPK, vasodilatation and glucose
uptake.
6.4 Relevance to the present findings.
This thesis presented a number of findings that may be explained by the theory
presented above.
6.4.1 The combined effects of aging and hyperglycaemia.
In chapter 3 it was reported that adults 61 years and over with poorer GT had
poorer memory than younger participants with poorer GT or older participants with
better GT. In fact it is commonly observed that glucose intolerance associated
cognitive decline is more pronounced after age 60 (Convit et al, 2003; Ryan and
Geckle, 2000; Lamport et al, 2009). Both aging and hyperglycaemia lead to an
increased production of oxidative species and hence a reduction in the
bioavailability of NO and endothelial dysfunction. It is possible that this combined
deleterious effect of hyperglycaemia and aging is enough to result in a marked
reduction in cerebral blood flow and glucose transport across the BBB, which in
turn deprives neurons of their fuel supply and consequently results in cognitive
decline (Figure 30).
221

6.4.2 Low blood glucose, AMPK and cognitive decline.
The novel finding that older adults with poorer GT and LBG had less cognitive
decline and depression, than those with poorer GT and LBG above baseline, was
presented in chapter 3. To our knowledge the effects of low levels of blood
glucose on brain adaptation and cognitive decline in humans has not been
considered. However, similar effects have been observed in diabetics (Lobmann et
al, 2000) and animals (McNay et al, 2006; Boyle et al, 1994; Jacob et al, 1999;
McNay and Sherwin, 2004). For example, animals exposed to low blood sugar
levels (2.5-3.0mmol/l) have increased hippocampal interstitial glucose
concentrations (McNay et al, 2006; McNay and Sherwin, 2004); an effect that
subsequently enhances cognition and learning (McNay et al, 2006; McNay and
Sherwin, 2004). Similarly, in humans Boyle et al. (1994) found that cognition was
preserved during episode low blood glucose, if previous exposure had occurred. It
is possible that this increase in brain glucose levels is enough to compensate for
reduced glucose transport across the BBB in those with poor GT.
Although the mechanisms underlying these findings remain unclear falling glucose
levels result in an increase in the AMP: ATP ratio and thus activate AMPK and
eNOS (McCrimmon, 2008). As mentioned eNOS derived NO increases cerebral
blood flow and AMPK results in increased glucose uptake via GLUT transporters.
In line with this GLUT 1 at the endothelium (Boado et al, 1993; Kumagai et al,
1995), the neuronal glucose transporter GLUT 3 (Uehara et al, 1997) are both up
regulated following hypoglycaemia, and these adaptations lead to an increased
level of brain glucose (Lei et al, 2006). It is possible that our sample of older adults
with poor GT and the tendency for LBG may have developed adaptations to
222

previously experienced LBG and that these adaptations were able to compensate
for the deleterious effect of poor GT on cerebral blood flow and glucose transport
(Figure 31).
GLUT translocation
Neuronalactivation
AMP ^
AM PK
A rgin ine
Ageing
Glucoseuptake
L
GLUTTranslocation
* NO V asodilation
Hyperglycaem ia
Figure 29. A schematic representation of the effect of LBG on AMPK
activity and neurometabolic and neurobarrier coupling. LBG stimulates
AMPK activity and increases GLUT transiocation and glucose uptake. In turn the
increase in AMPK activity stimulates NOS, increasing NO availability and
vasodilation.

6.4.3. Endothelial function, glycaemic load and cognition.
In both children (chapter 2) and healthy older adults (chapter 4) a lower rather than
a higher GL meal improved cognition and mood, most notably during the late
postprandial period. As previously noted, chronic hyperglycaemia impairs
endothelial function and there is also plenty of evidence suggesting that this is also
the case during acute hyperglycaemia (Mah and Bruno, 2012 for a review). For
example, it was found that blood flow to the forearm following compression is
reduced by 20-42%, 30 - 90 minutes after an OGTT (Mah et al, 2011), and this
effect remained for a period of time after blood glucose had returned to normal
(Suzuki et al, 2012). Interestingly, the consumption of a lower rather than higher
GL meals ameliorate these reductions in blood flow observed following a higher GL
meal (Buscemi et al, 2012; Lavi et al, 2009). Brain imaging studies involving GL
are few and to our knowledge there are none that have considered areas involving
memory. A logical next step would be to examine the effect of GL on cerebral
blood flow and glucose uptake/utilisation, and relate these to changes in
endothelial functioning that occur in the periphery. There is also evidence that
AMPK activity is increased after foods with a lower GL and decreased during
hyperglycemia (Jun et al. 2011). These changes in AMPK activity may have
implications for brain glucose uptake and metabolism. It is possible that changes
in endothelial function and/or AMPK activity may mediate the effect of GL on
cognitive performance. Figure 32 illustrates the relationship between GL, AMPK
activity, endothelial function and glucose uptake in children and older adults with
better glucose control.
224

GLUT translocation
Neuronalactivation
AMP ^
A M PK
A rgin ine
Hypergiycaemia
iiG H G L
G lucoseuptake
t
GLUTTranslocation
► NO Vasodilation
GLUT translocation„ G lucose
uptake
Neuronalactivation
AMP <
GLUTTranslocationA M PK
NOSA rgin ine ► NO Vaso
dilationBH4
Figure 30. A schematic representation of the effect of GL on AMPK and NOS activity and neurovascular, neurometabolic and neurobarrier coupling.Meals that have a high GL result in hyperglycaemia which inhibits both NOS and AMPK and in turn reduces vasodilation, GLUT translocation and glucose uptake. However, meals that have lower GL’s avoid hyperglycaemia allowing AMPK and NOS to function optimally. In addition meals with lower GL directly stimulate AMPK enhancing glucose uptake.
225

It was interesting that older adults with poorer GT did not benefit from a low rather
than a high GL (chapter 4). One might predict that given their poor GT they may
have some degree of endothelial dysfunction (Figure 30). Thus moderating the GL
may prove beneficial for endothelial functioning and hence improve cognitive
performance. However, endothelial dysfunction that occurs in such populations is
a cumulative outcome that has occurred over an extended period of time. Thus it
is unlikely that a single low GL meal will be enough to alter endothelial function
significantly. It is possible that longer term low GL diet may prove beneficial, for
example, Buscemi et al (2012) allocated obese participants to either a high or a
low GL diet for three months. The low GL diet was associated with improvements
in endothelial function and glycaemic variability. However, these participants were
not diabetic and whether these vascular improvements translate into cognitive
gains needs to be explored.
Of note was that older adults with poorer GT had a transient improvement in
memory and mood 30 minutes after a high GL meal (chapter 4). Glucose
intolerance is either the result of impaired insulin release from the pancreatic B
cells, or a resistance to the effect of insulin by tissue receptors. The usual
response to a rise in insulin resistance is compensatory hyperinsulinemia
(Polonsky et al, 2000). Although we did not measure insulin it is possible that an
increase in insulin levels following the high GL meal may have in some way been
beneficial. Although the transport of glucose into the brain is not thought to be
insulin dependent, insulin does modulate cognition (Shemesh et al. 2012) and acts
as a vasodilator by increasing NOS activity (Muniyappa and Sowers, 2013). It is
possible that an increase in insulin may in some way improve cognition in those
226

with poorer GT, perhaps though improved endothelial function (Figure 33). In
support of this, Shimabukuro et al. (2004) found that although an OGTT impaired
endothelial function in T2DM patients, this effect was ameliorated by a prior use of
nateglinide (an insulin secretagogue). In addition, Hirvonen et al. (2011) found that
a higher concentration of insulin was required to stimulate cerebral glucose
metabolism in those with poorer GT, compared to healthy controls. Thus it is
possible that the benefit of a high GL meal, to older adults with poorer GT, may not
be attributed to an increase in plasma glucose per se but a simultaneous increase
in insulin levels. Whether a beneficial effect of insulin is great enough to offset the
negative effects of hyperglycaemia needs to be explored.
227

GLUT translocation
Neuronalactivation
AMP
AM PK
Arginine
Hyperglycaemia
IBrain G L 1
JU BH4
Insuiin
Glucoseuptake
GLUTTranslocation
"► NO Vasodilation
Figure 31. A schematic representation of the effect of a high GL and insulin
on AMPK and NOS activity. Meals that have a high GL result in hyperglycaemia
which inhibits both NOS and AMPK and in turn reduces vasodilation, GLUT
translocation and glucose uptake. However, high GL’s also increase insulin levels
which increases NO production and vasodilation via the stimulation of NOS.
228

Glucose has also been shown to improve memory in older adults with cognitive
decline (Riby et al, 2008), however, we did not observe this to be the case (chapter
4). Alterations in brain glucose metabolism are apparent in those with cognitive
deterioration (Mosconi, 2007) and correlate with cognitive decline (Landau et al.
2012). These changes may potentially reflect a range of underlying pathologies:
defects in brain glucose transport across the BBB; reduced cerebral ‘blood flow, a
disruption of glycolysis; impaired insulin signalling; mitochondrial dysfunction;
neuronal atrophy (Cunnane et al, 2011; Correia et al, 2011). It appears, however,
that even at this early stage of cognitive decline changes in the nature of glucose
provision are no longer sufficient to enhance cognition, presumably a reflection of
the malfunctioning of one of the above, or similar, mechanisms.
If indeed endothelial dysfunction has a role to play in glucose intolerance related
cognitive decline it may not necessarily have a role to play in cognitive decline per
se. There are many pathways to cognitive decline and only when a major cause
specific to that individual is identified can there be hope of treatment.
Unfortunately, much current research focuses on ‘dementia’, ‘AD’ or ‘MCI’ as if
they are homogeneous groups; they are not. More research is needed that
focuses on particular groups of individuals who are identified as ‘at risk’ due to a
specific pathology such as glucose intolerance. In this way an intervention can
become more individualised and potentially more effective.
229

6.4.4 Caffeine, hyperglycaemia, cognition and mood.
The final significant finding was that caffeine, when taken with water, increased
subjective energy after 30 minutes but decreased energy levels later in the
morning. However, when caffeine was taken with milk it was associated with an
increase in energy after 90 and 150 minutes (chapter 5). When taken acutely
caffeine induces glucose intolerance (Pizziol et al. 1998; Graham et al. 2001).
Indeed we also reported that young adults who consumed caffeine had
significantly higher blood glucose levels and that this persisted until the end of the
study period (~ 180minutes) (Figure 21). How caffeine produces this effect is not
clear, however, it may be mediated by an increase in the release of epinephrine
(Thong and Graham, 2002). Epinephrine is known to both increase hepatic
glycogenolysis and reduce glucose uptake by tissues (Vicini et al. 2002). In
addition, because caffeine blocks the adenosine receptors it stimulates a reflex
activation of the sympathetic system which leads to an increased heart rate and
possibly increased arterial pressure (Marlies et al. 2005). These vasoconstrictor
properties of caffeine also lead to reduced cerebral blood flow (Chen et al. 2009).
However, at least in healthy participants, there appears to be a compensatory
increase in oxygen extraction (Chen et al. 2009; Perthen et al. 2008) which
represents the uncoupling of blood flow and oxygen metabolism in order to
maintain cerebral metabolism. There is also evidence that cerebral glucose
metabolism is increased despite reduced cerebral blood flow (Grome and
Stefanovich, 1986). Interestingly evidence suggests that caffeine consumption
also increases the production of NO (Echeverri et al, 2010) and AMPK activity
(Egawa et al. 2009), which as previously mentioned have a powerful influence on
glucose uptake and metabolism although caffeine induced hyperglycaemia is likely
230

to ameliorate this effect. It appears that the net effect of these mechanisms may
be positive, or negative, depending on the circumstances (Figure 34).
GLUT translocationGlucose
uptake
Neuronalactivation
GLUTTranslocationA M PK
► NO *► VasodilationBH4
Figure 32. The effect of caffeine and hyperglycaemia on AMPK and NOS
activity. Caffeine causes hyperglycaemia which inhibits both NOS and AMPK
and in turn reduces vasodilation, GLUT translocation and glucose uptake.
Flowever, caffeine also activates NOS and AMPK which increases NO production,
vasodilation GLUT translocation and glucose uptake.

The above mechanisms may help explain the findings observed in chapter 5. Our
sample of young adults consumed a relatively small but high GL breakfast at
8.30am (cornflakes) and by the time they consumed their drink at 10am their blood
glucose levels had already begun to drop. Those that consumed caffeine
experienced a mild degree of glucose intolerance, suggesting a reduced uptake of
glucose by the tissues. Caffeine may also have caused minor vasoconstriction
and reduced cerebral perfusion. However, caffeine also increases glucose
metabolism in the brain which may improve mood and cognition in the short term
(as observed after 30min) (Table 12) but also heightens the need for delivery,
especially when faced with ongoing demanding cognitive testing. Given that
during neuronal activation there are localised drops in brain interstitial glucose
levels, caffeine induced glucose intolerance and cerebral hypoperfusion may have
prevented the timely delivery of energy, resulting in increasing fatigue as the
morning progressed.
Importantly, when young adults consumed caffeine in a milk based drink they
reported higher energy levels: participants were more energetic after 90 and 150
minutes. It is known that the consumption of milk produces a disproportionally high
insulin response (Hoyt et al. 2005). As previously mentioned insulin may act as a
vasodilator (Muniyappa and Sowers, 2013) and therefore may improve cerebral
blood flow (Figure 35). In fact there was a much smaller difference in blood
glucose levels towards the end of the morning in those that drank milk, and those
who had drunk milk plus caffeine (~0.05mmol/l), than there was between those
that drank water and those that drank water plus caffeine (~1.3mmol/l), suggesting
that the consumption of milk (and possibly raised insulin levels) may have been
232

able to somewhat overcome the impaired glucose tolerance. The low Gl of milk
would also have provided a steady and consistent supply of energy over the
morning, helping to prevent declines in mood and performance. Further work is
needed to replicate this study and also test the effect of GL and caffeine over time
under a range of circumstances, for example, after a low rather than a high GL
breakfast.
GLUT translocation„ G lucose
uptake
Neuronalactivation
AMP <
GLUTTranslocationA M PK
NOSA rgin ine ■
yperglycaemi
► NO VasodilationBH4 A,
insulin
Figure 33. The effect of caffeine and milk on AMPK and NOS activity.
Caffeine causes hyperglycaemia which inhibits both NOS and AMPK and in turn
reduces vasodilation, GLUT translocation and glucose uptake. However, caffeine
also activates NOS and AMPK which increases NO production, vasodilation
GLUT translocation and glucose uptake. Milk causes an increase in insulin levels
which increases NO production and vasodilation via the stimulation of NOS.
233

6.5 Concluding remarks
In summary, this thesis supports the conception that glucose tolerance is related to
cognitive performance and mood, however, the relationship is affected by a
number of factors including the age of the subject and the tendency to develop
LBG. This thesis also provides evidence that under particular circumstances, such
as prolonged periods of cognitive testing, caffeine-induced glucose intolerance can
also lead to a decline in energy levels. Although caffeine induced glucose
intolerance and fatigue may be ameliorated by the co-consumption of energy from
foods; most notably in the form of low Gl milk, cognitive decline caused by
pathological reductions in glucose tolerance, cannot be altered by a low GL
breakfast. However, both children and healthy older adults had better memory and
mood after eating a low rather than a high GL meal, opening the possibility that
modulation of GL maybe a useful preventative strategy in the longer term. Further
research is planned to test the postulations put forward in this final chapter.
234

APPENDICES
Appendix 1. Parental consent form.
Breakfast studyDear Parent,
We are w riting because your child attends the breakfast club o f_________ School. SwanseaUniversity is interested in finding out i f what your child eats helps his or her school work. As you know i f you miss breakfast you do not work as well during the morning. However, it is not known is whether some breakfasts are better than others. We are trying to find the best breakfast for children. To do this we are asking i f your child can take part in a simple study. They w ill need to come to the club on two days, a week apart, without first eating at home. I f you are happy for them to take part then please sign the next sheet.
Your son/daughter w ill attend the breakfast club as normal but on two days they w ill receive a breakfast o f cornflakes w ith m ilk and sugar, a yogurt and a drink. Although they w ill look and taste the same, one w ill release energy quickly and the other more slowly. They contain different naturally occurring sugars. I f your child has a mid-morning snack, this w ill be given towards the end o f the morning.
They w ill then attend class as normal but twice they w ill be asked to take some simple tests that w ill be presented as games. For example a test o f memory by trying to remember some objects and how quickly they can push a button when a light comes on.
Naturally i f your child is unhappy they w ill be free to drop out at any point. Nobody is going to try to make them eat something they do not like. They w ill only be asked to do what they are happy to do.
The information gathered is not o f a sensitive nature but the results w ill not be made available to the school.
Should you wish further information we would be pleased to arrange a meeting or alternatively you could c a ll---------------------------- or em ail------------------------------------
It is very important that i f you believe that your child reacts badly to the foods listed above, for example they suffer w ith a food allergy, they should not take part.
I f it is appropriate we hope that you w ill allow your son or daughter to take part. Only studies such as this one can help us find out what is best for a child. I f you would like to help please f i l l in the next page and return it to the school.
Yours fa ith fu lly
David Benton Hayley Young

PERMISSION FOR M Y C HILD TO TAKE PART IN A BREAKFAST STUDYYES NO
1) I have read about the study and any questions have been answered | | | |
2) I have enough information to allow me to say whether my child should take part
3) I understand that my child does not need to take part and can withdraw at any time and this w ill not affect their education
□ □□ □
4) I understand that my child’s results w ill not be given to the school j | | j
5) It is safe fo r my child to eat all the foods listed on the information ,— . ,— .sheet (that there is no medical reason to avoid these foods) |___ | |___|
5) M y child has never had an allergic or other reaction to food | |
IF YOU HAVE ANSWERED YES TO A LL THE ABOVE AND ARE HAPPY FOR
YOUR CHILD TO TAKE PART PLEASE F ILL IN THE DETAILS BELOW
Name of child.........................................................
Signed Parent / Guardian
Address ........................................................... Phone........................................
On the days of the testing breakfast will be eaten from 8 o’clock to half past 8. Please list dates when it will be convenient for your child to arrive early
236

App
endi
x 2.
The
reca
ll of
obje
cts
task
. C
hild
ren
viewe
d the
ca
rd
for
40 se
cond
an
d wh
en
the
card
wa
s re
mov
ed
had
60
seco
nds
to re
mem
ber
as m
any
obje
cts
as po
ssib
le.
LiZ

Appendix 3 - Older adults’ participant information sheet.
Breakfast Study
Dear Sir / Madam
We are very grateful that you have decided to take part in our study about the benefits o f
eating breakfast. This letter is just to give you a little more information about what you w ill be
asked to do during your time at the University.
As we age we may start to notice subtle flaws in our memory. Eating breakfast has been
shown to help mental performance; however, some breakfasts may be more helpful than
others. The broad aim o f this study is to determine i f by changing what people eat for breakfast
we can help improve memory.
The study w ill take place on two mornings between 8.45am and 1.00pm. You w ill need to
arrive at the University having not eaten or drink anything other than water fo r the preceding
12 hours, that is from 8.45 the evening before. This includes tea and coffee.
DAY 1
On arrival you w ill be asked to give a blood glucose reading that involves a small finger prick.
This should cause only m inor discomfort. This procedure w ill take place across the morning
at 30 min intervals to track changes in your blood glucose.
You w ill be asked to consume a lemon flavoured drink containing glucose. This procedure is
called a glucose tolerance test and w ill allow us to determine how well your body controls its
glucose levels, an important predictor o f future health. In case o f any problem we w ill inform
you so that you can discuss the matter w ith you doctor.
Three times throughout the morning you w ill also take a test battery that includes measures o f
memory, attention, reaction times and mood. You w ill also be asked to f ill out some
questionnaires to do w ith personality and lifestyle.
238

At the end o f the morning you will be provided with a light lunch.
Day 2
On a second day you w ill consume a breakfast o f toast w ith jam, a low fat yogurt and an
orange drink. Again you w ill complete the test battery on three occasions throughout the
morning and w ill be offered lunch at the end o f the study. Measures o f height, weight and
other general health checks w ill also take place on this day.
You may also bring something to read whilst you are in the lab as you w ill be sitting and
waiting in between testing. You w ill be reimbursed for any expenses occurred during your
travel/stay at the University. I f you have any packing receipts then please keep them.
I f you require any additional information regarding the study please contact Hayley Young at -
-------------------------or phone-----------------------. In addition i f you know anyone else who may be
interested in taking part in this study please te ll them to contact us.
Your help in these matters is greatly appreciated. It is only with the help o f people like you
that research can proceed, hopefully in the long term to the greater good.
Yours fa ith fu lly
*2)<i/B id
Hayley Young David Benton
239

Appendix 4. Older adults informed consent form.
Informed consent - breakfast study
Swansea University requires that all persons who participate in research studies give their
w ritten consent to do so. Please read the fo llow ing and answer the questions below then
sign it i f you agree w ith what it says.
I freely and voluntarily consent to be a participant in the research project about the benefits
o f breakfast to be conducted by Hayley Young as principal investigator, who is a
postgraduate student in the School o f Human Sciences at Swansea University under the
supervision o f Professor David Benton. The broad goal o f this research study is to explore
the effect o f different breakfasts on memory across the morning. Specifically, I have been
asked to attend Swansea university on two occasions, consume breakfast that w ill be
provided for me, provide finger prick samples o f blood and complete some memory tasks
and some questionnaires. I understand that I w ill be required on both occasions for the fu ll
duration o f the morning.
I have been told that my responses w ill be kept strictly confidential. I also understand that
my participation in this study is completely voluntary and that i f at any time during the
study I feel unable or unw illing to continue, I am free to leave. In addition, should I not
wish to answer any particular question or questions, I am free to decline. M y name w ill not
be linked w ith the research materials, and I w ill not be identified or identifiable in any
report subsequently produced by the researcher.
I have been informed that i f I have any general questions about this project, I should feel
free to contact Hayley Young a t-----------------------o r -------------------------------- .
Please turn over and answer the follow ing questions.
240

1)1 have read about the study and any questions have been answered YES NO
2) I have enough information to decide whether to take part YES NO
3)1 understand that my participation is voluntary and that I am free toto withdraw at any time YES NO
4) There is no medical reason for me to avoid any foods YES NO
5)1 have never had an allergic or other adverse reaction to food YES NO
6) I have normal or corrected to normal vision and hearing YES NO
7) I do not have any digestive difficulties such as Crohn’s disease YES NO
8) Are you currently taking any medications? YES NO
IF YES PLEASE SPECIFY
I f you agree to take part in this study please provide the information below.
Participant’s Signature__________
PRINT NAME____________________________________________ DateAddress
POST CODE Phone
I have explained and defined in detail the research procedure in which the respondent has consented to participate. Furthermore, I w ill retain one copy o f the informed consent form for my records.
Researcher signature Date

Appendix 5. Words lists that were used for the episodic memory task. A. List used in chapter 3. B. list used in chapter 4 and 5 (1st test battery). C. list used in chapter 4 and 5 (2nd test battery). D. list used in chapter 4 and 5 (3rd test battery).
A. Pedal Globe DaisyBrick Flute LinenSpike Paste BeardShark Prune CedarTooth Ankle QueenChart Plane BellyOrgan Arrow CryptMixer Honey RiverTrunk Couch RulerIvory Spade Elbow
B. Beach Thick TableMeant Rifle ForceEarth B rief HorseClear Chain ReachPaper Least WomanOrder Shore GuessDrink Eight GlassIssue Coast ThinkTruck Worse ChildQuick Staff Value
C. Chest Whole RiverMoral Light QuietBlood Claim MetalUnder Smile DozenPhone Right FrameExtra Uncle SouthWheel A llow KnifeLeam Crowd RuralHeart Truth TeethApart Court Proud
D. Spoke Power CoverPhase Radio AloneJudge Short FleshMinor Bible IdealMoney Happy StoneWrote Hotel CarryWater Might NovelEmpty China EventPlant Break DressTheme Board Style
(Lists were recorded as follows: Pedal, Globe, Daisy, Brick, Flute, Linen )
242

GENERAL HEALTH J QUESTIONNAIRE NFER-NELSON
tNfORMING YOUR DECIJIORl
Please read this carefully:
We should like to know if you have had any medical complaints, and how your health has been in general, ove r the pastJmrweekm Please answer ALL the questions on the following pages simply by underlining the answer which you think most nearly applies to you. Remember that we want to know about present and recent complaints, not those you had in the past. It is important that you try to answer ALL the questions.
Thank you very much for your co-operation.
HAVE YOU RECENTLY:
been able to concentrate on whatever youfre doing?
Better than usual
Same as usual
Lessthan usual
Much less -than usual
lost much sleep over worry? Not a t all r ;No more than usual
Rather more than usual
Much more
than usual
been having restless, disturbed nights? Not at all
No more than usual
Rather more than usual
Much more than usual
been managing to keep yourself busy and occupied?
More so than usual
Same as usual
Rather less than usual
Much less than usual
been getting out of the house as much as usual?
More so than . usual
Same as usual
Lessthan usual
Much less than usual
been managing as well as most people would in your shoes?
Better than most
About the same
Rather less well
Much less well
fe lt on the whole you were doing things well?
Better than-usual
About the same
Less well than usual
Much less well
been satisfied w ith the way you've carried out your task?
Moresatisfied
About same as usual
Less satisfied than usu£l
Muchless satisfied
been able to feel warmth and affection for those near to you?
Better than usual
About same as usual
Less well than usual
Much less well
been finding it easy to get on with other people?
Better than usual
About same as usual
Less well than usual
Much •less well
spent much time chatting with people? More time than usual
About same as usual
Less time than usual
Much less than usual
fe lt that you are playing a useful part in things?
More ^ 0
than usualSame as usual
Less useful than usual
Much less useful
fe lt capable of making decisions about things?
More so than usual
Same as usual
Less so than usual
Much less capable
PLEASE TURN OVER

HAVE YOU RECENTLY:
14- - - - felt constantly under strain?.____________ Not.___ _____ No more___ . Rather_more Muchmor^at all than usual than usual than usual
15 — fe lt you couldn't overcome your Not No more Rather more Much moredifficulties? at a ll than usual than usual than usual
16 _ been finding life a struggle all the time? Not No more ■Rather more Much moreat all than usual than usual than usual
17 _ been able to enjoy your normal More so Same Less so Much lessday-to-day activities? than usual as usual than usual than usual
IB — been taking things hard? Not No more Rather more Much moreat all than usual than usual than usual
19 _ been getting scared or panicky for Not No more Rather more Much moreno good reason? at all than usual than usual than usual
20 _ been able to face up to your problems? More so Same Less able Much lessthan usual as usual than usual able
21 — found everything getting on top Not No more Rather more Much moreof you? at all than usual than usual than usual
22 _ been feeling unhappy and depressed? Not No more Rather more Much moreat all than usual than usual than usual
23 _ been losing confidence in yourself? Not No more Rather more Much moreat all than usual than usual than usual
24 _ been thinking of yourself as 8 Not No more Rather more Much moreworthless person? at all than usual than usual than usual
25 _ fe lt that life is entirely hopeless? Not No more Rather more •Much moreat all than usual than usual than usual
26 _ been feeling hopeful about your own More so About same Less so Much lessfuture? than usual as usual than usual hopeful
27 _ been feeling reasonably happy, all More so About same Less so Much lessthings considered? than usual as usual than usual than usual
28 ___ been feeling nervous and strung-up Not No more Rather more Much moreall the time? at all than usual than usual than usual
29 _ fe lt that life isn't worth living? Not No more Rather more Much moreat all than usual than usual than usual
30 _ found at times you couldn't do Not No more Rather more Much moreanything because your nerves were at all than usual than usual than usualtoo bad?
Published by The NFER-NELSON Publishing Company,Darville House, 2 Oxford Road East, Windsor, SL4 1DF, Berks.All rights reserved. This work may not be reproduced by any means, even within the terms of a Photocopying Licence, without the written permission of the publisher.First published 1978..© David Goldberg, 1978.1 (6.B7)Printed in Great Britain by Thanet Press Ltd, Margate, Kent Code 4075 03 4

Appendix 7. Hypoglycaemia symptoms questionnaire.
Instructions: Place one cross on each line to indicate how much each statement applies to you during the last week. Please use the entire line to indicate the degree to which each statement is true.
I eat when nervous Exactly like me__
My tiredness is relieved by eating Exactly like me______________
I get shaky when hungry Exactly like me_______
I am often eating something Exactly like me_________
I tend to snack late morning Exactly like me_________
I often choose not to eat breakfast Exactly like me
I feel faint i f I haven’t eaten in a while Exactly like me__________________
I prefer to eat little and often Exactly like me__________
I often experience hunger pangs Exactly like me_____________
I tend to snack mid afternoon Exactly like me__________
I put on weight easily Exactly like me____
I often experience food cravings Exactly like me_____________
I can be irritable i f I do not eat Exactly like me___________
In the late afternoon I lack energy Exactly like me______________
I need to eat regularly Exactly like me_____
Not at al
Not at al
Not at al
Not at al
Not at al
Not at al
Not at al
Not at al
Not at al
Not at al
Not at al
Not at al
Not at al
Not at al
Not at al
like me
like me
like me
like me
like me
like me
like me
like me
like me
like me
like me
like me
like me
like me
like me
245

I tend to snack in the eveningExactly like m e Not at all like me
I snack to reduce tirednessExactly like me Not at all like me
Sometimes my heart pounds for no reasonExactly like me Not at all like me
I often find it hard to concentrateExactly like me Not at all like me
Sometimes my thinking is confusedExactly like me Not at ail like me
Sometimes my vision is blurredExactly like me Not at all like me
I tend to become anxiousExactly like me Not at all like me
My memory is poorExactly like me Not at all like me
I have difficulty making decisionsExactly like me_____________________________________________ Not at all like me
Sometimes I feel dizzy or light headedExactly like me_____________________________________________ Not at all like me
There are times when I feel too warm for no apparent reasonExactly like me_____________________________________________ Not at all like me
Sometimes I run on ‘autopilot’Exactly like me_____________________________________________ Not at all like me
I often blushExactly like me_____________________________________________ Not at all like me
I tend to have cold hands and feetExactly like me_____________________________________________ Not at all like me
I often sweatExactly like me__________________________________________ Not at all like me
Sometimes my legs feel wobbly and I have to sit downExactly like me______________________________________________Not at all like me
Sometimes my hands trembleExactly like me______________________________________________Not at all like me
246

Appendix 8. Slope analysis for the effects of glucose tolerance and age on memory.
Coefficient Standarderror
t P
Glucose Tolerance. *
2.0397 0.6521 2.9767 0.003
Age (years) 0.2009 0.0791 2.5389 0.01
Age*GiucoseTolerance.
-.0347 0.0115 -3.0239 0.002
The effect of Glucose tolerance, Age and their interaction on memory. *Glucose tolerance is mmol/1 2 hours after OGTT.
o>O)re
glucose_tolerance
90.00"
80.00“
70.00-
60.00-
50.00-
40.00“
3 0 .0 0 — r10.00 15.00
S T _ m e m o ry
20 .0 0 . 25.00
^ 1.00 2.00
Glucose < 7.2mmol/l after 2 hours Glucose >= 7.2m m ol/l after 2 hours
The effect of age on memory at glucose levels above and below 7.2mmol/l.
247

Appendix 9. Scatter plot showing the effect of age on decision times in those with better or poorer glucose tolerance.
glucose_tolerance
"S - 1.00 "v,. 2.0090.00-
80.00“
70.00“
r> o05(0
60.00“
50.00"
O CO o o40.00-
30.00-.00 500.00 1500.00 2000.00 2500.001000.00
Decision times
1 = glucose < 7.2 after 2 hours 2 = glucose > or the same as 7.2 after 2 hours
The effect of age on decision times at glucose levels above and below 7.2mmol/l.
248

Appendix 10. Mood VAS that was used for measuring mood in chapter 4 and 5.
Please place one cross on each line to indicate the way you feel at the moment For example if neither adjective describes you then put a mark in the middle; if you tend towards one end of the line then place the cross towards that end to the extent that the adjective describes you.
EXAMPLE
Happy ________________________________________ SadI am neither happy nor sad
Happy SadI am very happy
Happy SadI am a little sad
Now please complete the following:
Agreeable _________________________________________ Hostile
Clearheaded _________________________________________ Confused
Composed _________________________________________ Anxious
Elated _________________________________________ Depressed
Confident _________________________________________ Unsure
Energetic _________________________________________ Tired
249

Ener
getic
/Ti
red
7.5(
11.1
)
00c71 -7
.4(1
2.9)
-30.
2(20
.7)
-12.
4(20
.2)
-3.4
(16.
7)17
.9(2
0.1)
13.3
(19.
1)1.
7(13
.2)
3.5(
13.2
)3.
1(20
.5)
-2.9
(10.
4)9.
1(17
.6)
-0.6
(10.
5)-4
.0(2
0.2)
-13.
3(20
.5)
-9.6
(17.
6)-1
3.3(
16.7
)-1
.6(2
0.5)
-9.1
(20.
6)-5
.1(2
0.3)
-12.
5(20
.3)
-8.6
(20.
3)-5
.8(2
0.1)
0.3(
21.3
)-7
.5(2
3.3)
-7.0
(23.
5)
Con
fiden
t/U
nsur
e 6-7
in
-3.2
(14.
2)1.
7(11
.3)
-24.
9(20
.3)
-15.
5(23
.1)
-4.9
(12.
0)12
.2(2
0.4)
5.2(
11.2
)
o'CN -2
.2(1
5.7)
1.6(
20.5
)2.
6(17
.5)
10.0
(16.
0)-4
.4(1
7.5)
7.7(
10.4
)-0
.7(1
1.4)
3.0(
12.6
)3.
2(12
.6)
1.1(
18.7
)-9
.4(1
9.6)
-1.6
(19.
4)-1
2.5(
17.0
)-1
1.6(
20.1
)-8
.4(2
0.5)
-0.2
(20.
8)-1
0.7(
20.6
)-3
.9(1
8.6)
Ela
ted/
Dep
ress
ed
00CNVO 1.
9(8.
2)-1
.4(9
.8)
-19.
5(20
.8)
-14.
2(18
.7)
4.5(
15.7
)9.
0(20
.2)
5.6(
16.2
)8.
4(22
.3)
6.8(
17.5
)-1
.2(2
0.1)
2.6(
16.4
)4.
5(12
.0)
-6.5
(18.
6)(o
'ii)ro- -9
.0(1
4.6)
2S00in1 -9
.1(1
0.5)
4.9(
22.4
)-7
.3(2
0.5)
0.4(
20.2
)-6
.5(2
0.1)
-1.9
(20.
5)0.
8(21
.0)
-5.7
(20.
2)-4
.7(1
9.5)
-4.2
(16.
8)
Com
pose
d/A
nxio
us1.
8(10
.6)
m
rn1 -4.5
(12.
3)-1
4.6(
20.6
)-1
5.5(
20.3
)
CMOn,00K1 20
.0(1
5.9)
12.0
(12.
1)7.
0(10
.1)
4.2(
15.1
)3.
6(12
.2)
7.0(
13.1
)5.
5(14
.1)
-4.1
(5.5
)
c6O;O
invdc7co
00o\
01 -6.5
(10.
3)-4
.0(1
0.2)
-6.0
(19.
7)-3
.0(1
8.7)
-9.2
(20.
5)-4
.3(1
8.5)
-7.2
(20.
3) r-70
01 -2.7
(20.
2)-8
.8(1
7.3)
Cle
arhe
aded
/C
onfu
sed
00
1 -2.2
(10.
7)-3
.0(1
5.0)
-16.
0(22
.9)
-15.
2(20
.1)
o7On O\ in1 21
.1(2
0.9)
7.7(
22.0
)7.
5(12
.4)
-1.7
(19.
1)2.
3(19
.7)
-0.7
(13.
0)9.
9(18
.5)
-1.4
(13.
9) <77cK77in 1.
2(10
.9) in
0a70
cn00r701 -1
.0(2
0.2)
-10.
0(19
.7)
-4.6
(19.
3)-1
0.1(
20.9
)-4
.9(2
2.5)
-6.0
(22.
2)-0
.4(1
7.6)
-2.0
(17.
2)1.
5(13
.6)
Agr
eeab
le/
Hos
tile
-2.7
(19.
6)-4
.9(1
3.7)
-1.5
(15.
9)-2
3.2(
31.6
)-1
8.0(
19.2
)-9
.7(1
0.2)
-3.2
(17.
8)6.
1(9.
3) O) 00
0)CN -5
.9(1
6.8)
-1.5
(12.
9)91
.5(8
.8)
3.1(
5.1)
0.3(
8.3) 0
00
01
S)in00
0
-10.
6(16
.1)
-7.8
(17.
7)-3
.2(1
7.8)
-8.0
(19.
9)-3
.2(1
2.1)
-8.2
(18.
9)-6
.9(1
8.3)
-5.7
(18.
6)1.
5(10
.9)
-2.0
(13.
5)-0
.3(1
2.1)
GLU
sue
ISO
GL
U
sue
Bet
ter
GT
LBG
Poor
erG
TLB
G

c4s>6N1 -2
0.7
(27
.4)
-17
.4(2
9.6
)
13
.0(2
0.5
)
0.4
(28
.4)
-0.7
(21
.2)
-9.4
(24
.7)
-3.5
(21
.5)
-11
.8(2
8.3
)
6.5
(11
.7)
2.6
(14
.8)
-6.1
(13
.5)
-18
.1(1
9.5
)
-16
.9(2
9.4
)
-24
.5(2
5.1
)
-4.1
(18
.3)
-3.6
(20
.9)
-12
.5(1
6.2
)
-15
.6(2
0.5
)
-10
.9(2
0.9
)
-13
.8(2
8.3
)
2.1
(24
.0)
-2.8
(20
.9)
-7.7
(24
.4)
-17
.9(2
8.2
)
-17
.5(3
1.9
)
-9.3
(21
.3)
-3.3
(23
.8)
-8.3
(18
.7)
E>
r>N
i -11
.6(2
0.1
)
-8.1
(20
.5)
4.5
(14
.1)
-0.9
(20
.9)
2.4
(15
.8)
-4.3
(16
.5)
-0.5
(18
.7)
-9.8
(19
.3)
3.0
(13
.0)
-6.2
(14
.5) o
oC
CcTIX )
i -13
.1(1
4.0
)
-9.8
(20
.8)
-9.8
(20
.4)
-1.8
(16
.9)
-8.2
(18
.2)
-8.8
(20
.8)
-15
.5(2
1.7
)
-3.2
(20
.4)
-10
.2(3
0.5
)
1.0
(14
.5)
-6.5
(20
.2)
0.2
(19
.2)
-11
.3(2
0.3
)
-7.4
(20
.3)
-9.7
(20
.3)
-3.8
(13
.0)
-10
.2(1
1.0
)
-I^
UU
.37
-10
.7(2
0.7
)
-4.8
(20
.7)
1.4
(10
.6)
-2.5
(20
.2)
-1.9
(18
.0)
-3.1
(19
.5)
-6.4
(19
.5)
-6.3
(20
.0)
0.3
(15
.2)
-6.4
(16
.8)
-9.0
(21
.1)
-9.5
(16
.3)
-13
.2(2
0.7
)
-12
.4(2
0.6
)
-0.5
(11
.0)
-3.2
(10
.0)
-2.6
(20
.8)
-4.8
(20
.2)
-2.8
(19
.8)
-3.0
(20
.4)
rNd
v q
d -2.7
(15
.4)
d
o
o -3.7
(19
.0)
-7.6
(18
.1)
-1.5
(17
.6)
-7.8
(12
.1)
-7.5
(12
.4)
r>
—X
i -9.4
(18
.8)
-12
.7(2
0.3
)
3.5
(11
.6)
-2.1
(21
.3)
0.5
(16
.4)
6.5
(15
.1)
-5.5
(16
.3)
-8.6
(15
.6)
o
ONIX,0 4
57oC
ro
-3.0
(18
.5)
-2.3
(22
.5)
-8.9
(20
.9)
-9.4
(22
.1)
-1.0
(11
.6)
-10
.5(2
0.2
)
•drn
d1 -9.5
(20
.4)
-1.4
(26
.1)
dmo7
i 0.4
(11
.6)
-7.9
(18
.2)
-4.3
(20
.4)
-8.7
(19
.5)
-1
1.6
(13
.6)
-5.8
(17
.5)
-6.4
(12
2.9
)
XdXXi
‘T,N
Xd1 -2
.3(1
5.3
)
-5.9
(18
.4)
9.5
(14
.2)
-5.7
(20
.8)
3.1
(13
.0)
-7.8
(15
.5)
-4.6
(13
.3)
-9.2
(22
.5)
11
.2(1
7.3
)
-2.8
(21
.2)
-1.0
(20
.6)
-7.0
(20
.2)
x o6
ooo1 -2
3.6
(20
.2)
6.4
(20
.2)
1.9
(20
.3)
-4.3
(19
.5) r -
c7Xvd
i -4.2
(22
.3)
-9.1
(20
.3)
1.4
(17
.4)
-12
.6(1
6.5
)
-4.5
(26
.3)
-13
.7(2
1.0
)
-1 1
.7(2
2.3
)
-8.1
(22
.5)
-3.3
(15
.8)
-6.6
( 16
.3)
X)
X iX1 -3
.0(1
5.0
)
-4.9
(17
.2)
IX,
cKCo'sr -4
.0(1
1.3
)
-0.2
(10
.3)
-3.4
(10
.2)
-4.3
(12
.0)
-7.8
(19
.9)
1.2
(11
.2)
-8.2
(15
.1)
cd
ooo
i -7.7
(14
.0)
-17
.6(2
2.2
)
-8.1
(16
.8)
-5.2
(17
.6)
X<dc7rn
i
-13
.5(2
5.3
)
-9.5
(16
.6)
-6.3
(16
.2)
-11
.3(1
9.1
)
-2.4
(12
.2)
-6.7
(17
.0)
-1.0
(15
.0)
-4.6
(16
.2)
-9.0
(20
.0)
-5.7
(18
.2)
-8.8
(14
.1)
-5.5
(9.0
)
ISO
GLU
sue
ISO
GLU
Poo
rer
GT
No
LBG
Bet
ter
GT

o
On
a,p
5X
15o
CD
CNCDd
co Ag y0 v Q.
d j? LO O01 S2
C O
DCO03
O o ,3pHb
D cd q -1o
220
1D —1aaiIXoo
_3
a03O
_o22
o22-Jajoc3<uo
o_3
a
ONNO
r -p
ax15Cj
j l^CDdCDCN
_ O
^ Ag d 9 DO CO V 03CL P
or-1—Ht/ }o O r-*3(i> O5)(*) X)
D 22 O-J u. mo d D
o X IX,— < d (Nr— < — -> — —___X a ^ Xr - o Xo rd d—■ — CN
(N
Cl.I5p5X —
y-v A o ^cn rd s c
J CD o ^ IX)= CD ■ -d On CjO CN O co — s_
■ “ - V <uw ^ Q- ^
03
cr - d '—• cd O j X = d cn 22 O
w OD C2 -J «-
33O3 )
a22_J
osLiCS
3c*t/5o
X
<Nr -
CN
soLa
D
COCDCDCN
L-
X
COCOCNII
Ao © 2 dDs D CD Og Ad 9v DCL CO
o5
IX )ON
Oa
O5b
O<u 22
22 -J
O 150) =
.5-33 O0) X (X Cu 03 x >
o1 00
l l0 3 03o p2 5S 1/3
» oso cflr - *—13 _;
"o o, r -
L—i -oA--s OQ 3CO -C~ d> 33 X 03 O<L> Ue cj
IX,CN~ m XO n o - oa—a —CN X XX) CO OJ
XXCNjl^oo-
CN
Ua
A
O D> 22 D
D A
V 23Oa CO
UDCO
Oto
— wsic£
co *3
p COc5 I<3 (J3 DQ co

Appendix 12. Young adult consent form.
Study Title: The effect of consuming a novel food item on cognition and mood.
Thank you for deciding to take part in our study about the benefits o f consuming a novel
food item. This letter is just to give you a little more information about what you w ill be
asked to do during the experiment.
The food we eat can potentially affect the way we think and feel. The broad aim o f this study
is to determine i f supplementing a new food item at breakfast can improve mental
performance and blood flow.
The study w ill take place on one morning between 8.30 am and 1pm. You w ill need to attend
for the duration o f this time slot. You w ill be asked to fast for at least 12 hours (overnight)
and refrain from drinking anything other than water. Upon arrival at the University laboratory
you w ill be provided a small breakfast (Cornflakes w ith m ilk) and a choice o f tea or coffee
which you w ill be required to consume in its entirety. You w ill also be given a drink at
10am; again you w ill need to drink it all.
Throughout the morning you w ill be required to give a number o f capillary blood samples.
This involves a small prick on you finger and may cause m inor discomfort. You w ill also
complete a number o f mental tasks that test your memory, attention and reaction times. You
w ill f i l l out some questionnaires about how you are feeling as the morning progresses.
You w ill be paid by direct debit into your bank account. Payments are sent at the end o f
each month. Please note that due to cost and sample size we are unable to pay cash.
I f you require any additional information regarding the study please contact Hayley Young at
----------------------or phone-------------------. In addition i f you know anyone else who may be
interested in taking part in this study please te ll them to contact us.
Please turn over and answer the follow ing questions.
253

1) I have read about the study and any questions have been answered YES NO
2) I have enough information to decide whether to take part YES NO
3)1 understand that my participation is voluntary and that I am free toto withdraw at any time YES NO
4) There is no medical reason for me to avoid any foods YES NO
5) I have never had an allergic or other adverse reaction to food YES NO
6) I have normal or corrected to normal vision and hearing YES NO
7) I do not have any digestive difficulties such as Crohn’s disease YES NO
8) Are you currently taking any medications? YES NO
IF YES PLEASE SPECIFY ______________________________
I f you agree to take part in this study please provide the information below.
Participant’ s Signature__________
PRINT NAM E_____________________________________________ DateAddress
POST CODE Phone
254

Appendix 13. Higher order interaction involving gender.
DV Higher order interactions (not otherwise reported in the text)
Depressed/Elated n/a
Anxious/Composed n/a
Agreeable/Hostile n/aConfident/ Unsure n/a
Energetic/ tired n/a
Clearheaded/ Confused Time X Caffeine X Gender (F(1.3, 496.0) = 3.854 p<0.03). No significant follow up tests.
Episodic memory Time X Gender X Vehicle X Caffeine (F(3.8,654.7) = 3.359, p<0.05). No significant follow up tests.
Working memory Time X Gender X Vehicle X CaffeineReaction times (F(3.9,659.3) = 2.795, p<0.02). No
significant follow up tests.Working memoryAccuracy
n/a
Vigilance M inute o f test X Gender X VehicleReaction times (F(7.5,l 194.5) = 2.450, p<0.02). Males
were quicker than females after m ilk during the 4th minute o f the test. No other significant effects.
VigilanceAccuracy
ns
Focused attentionReaction times
n/a
Focused attentionErrors
n/a
Decision times n/aMovement times Time X Lamps X Gender (F(10.2,
790.0)= 2.178). Males were faster than females during the last testing session on the eight lamp task.
255

Glu
cose
(m
mol
/l)
Appendix 14. The glycaemic response to breakfast.
2 -I
1.5 -
1 -
0.5 -
0 -
0.5 -
Drink
n
“1 ( k i l l I I I I I i k i l l l l l i l l
# £ > < £ & < $ < $ &* * / / r /
Time (min)
Drink A - W ater no caffeine. Drink B - Glucose no caffeine. Drink C - Glucose caffeine. Drink D - Milk caffeine. Drink E - Milk no
caffeine. Drink F - W ater caffeine.
The effects o f breakfast on in terstitia l glucose levels. Data are average
changes in interstitial glucose, as mmol/L, from the value immediately prior to
consuming breakfast.
256
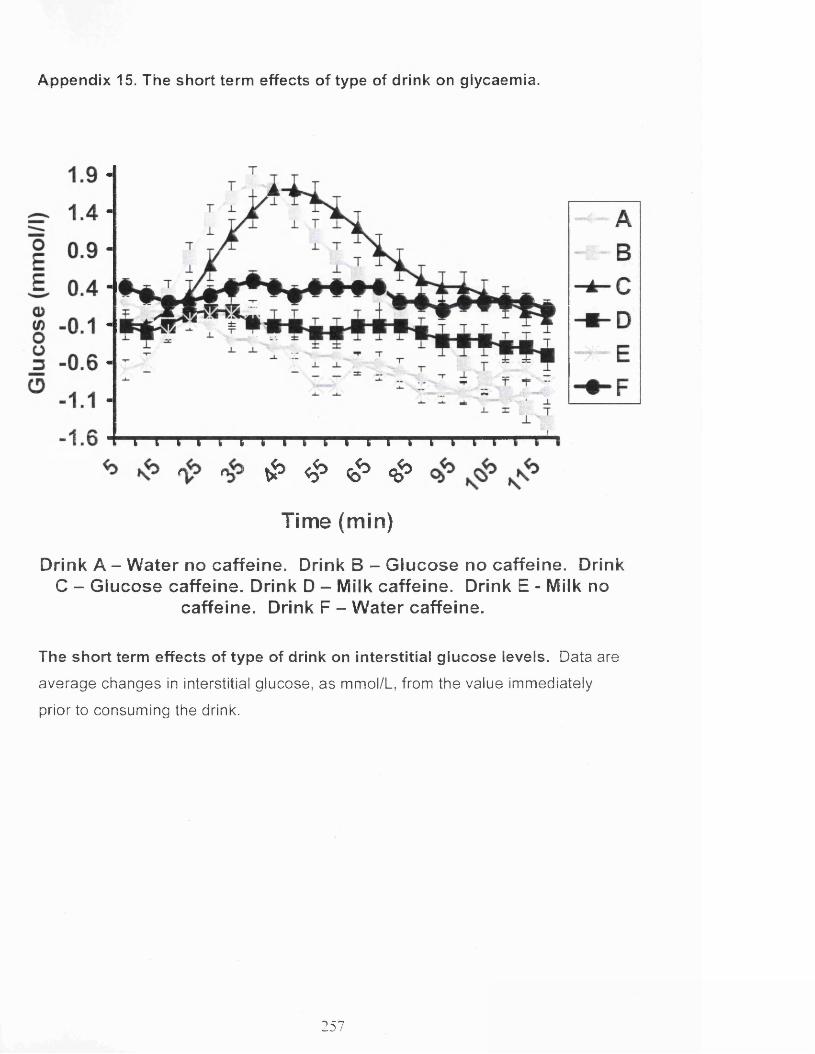
Appendix 15. The short term effects of type of drink on glycaemia.
* & $ > r$>£ 4 > & <£>
Time (min)
Drink A - W ater no caffeine. Drink B - Glucose no caffeine. Drink C - Glucose caffeine. Drink D - Milk caffeine. Drink E - Milk no
caffeine. Drink F - W ater caffeine.
The short term effects of type of drink on in te rstitia l glucose levels. Data are
average changes in interstitial glucose, as mmol/L, from the value immediately
prior to consuming the drink.
257
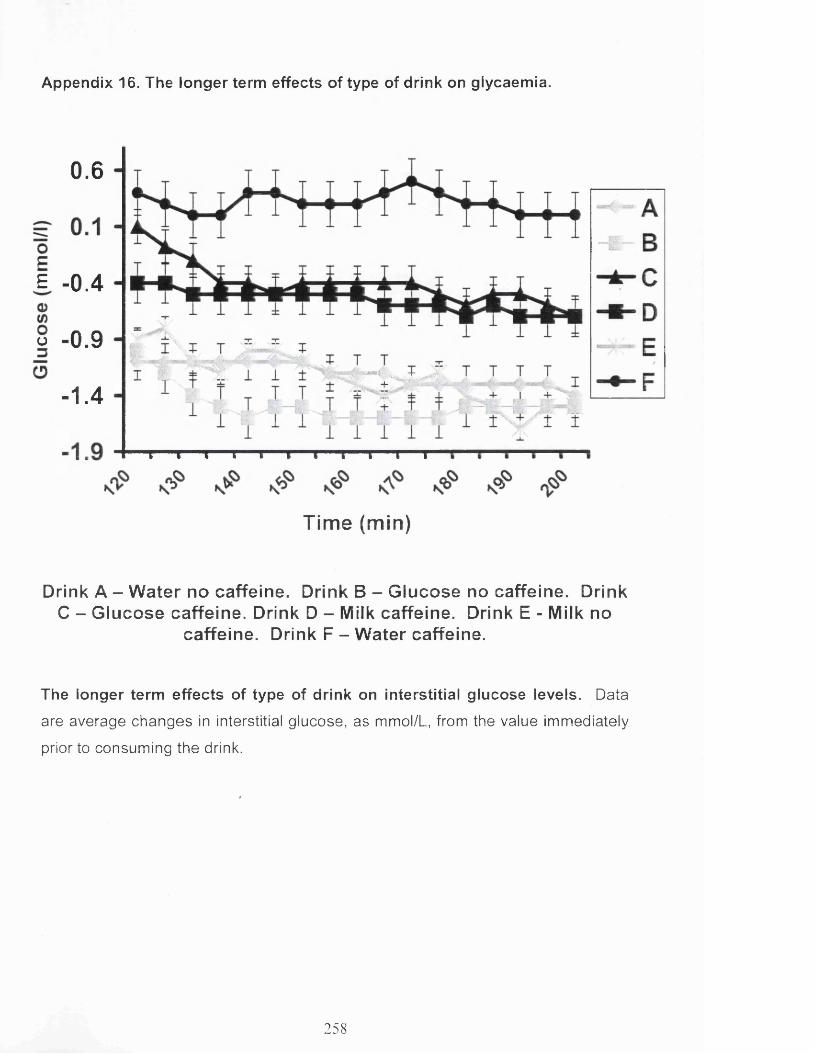
Appendix 16. The longer term effects of type of drink on glycaemia.
0.6
£ -0.4
o -0.9'“ L -'-.fe rS
-1.4
Time (min)
Drink A - W ater no caffeine. Drink B - Glucose no caffeine. Drink C - Glucose caffeine. Drink D - Milk caffeine. Drink E - Milk no
caffeine. Drink F - W ater caffeine.
The longer term effects o f type of drink on in terstitia l glucose levels. Data
are average changes in interstitial glucose, as mmol/L, from the value immediately
prior to consuming the drink.
258

REFERENCES
Abbud, W., Habinowski, S., Zhang, J., Kendrew, J., Elkairi, F., Kemp, BJsmail-
Beigi, F. (2000). Stimulation of AMP-activated protein kinase (AMPK) is associated
with enhancement of Glutl-mediated glucose transport. Archives of Biochemistry
and Biophysics, 380(2), 347-352.
Abdul-Ghani, M., Jenkinson, C., Richardson, D., Tripathy, D., and DeFronzo, R.
(2006). Insulin secretion and action in subjects with impaired fasting glucose and
impaired glucose tolerance results from the veterans administration genetic
epidemiology study. Diabetes, 55(5), 1430-1435.
Adan, A. and Serra-Grabulosa, J. (2010). Effects of caffeine and glucose, alone
and combined, on cognitive performance. Human Psychopharmacology 25(4),
310-317.
Addicott, M. and Laurienti, P. (2009). A comparison of the effects of caffeine
following abstinence and normal caffeine use. Psychopharmacology (Berl), 207(3),
423-431.
Aiken, L. S., and West, S. G. (1991). Multiple regression: Testing and interpreting
interactions. Sage.
Alford, C., Cox, H. and Wescott, R. (2001). The effects of red bull energy drink on
human performance and mood. Amino Acids, 21(2), 139-150.
Alsene, K., Deckert, J., Sand, P., and de Wit, H. (2003). Association between A2a
receptor gene polymorphisms and caffeine-induced anxiety.
Neuropsychopharmacology, 28(9), 1694-1702.
Amato, S., and Man, H. (2011). Bioenergy sensing in the brain: The role of AMP-
activated protein kinase in neuronal metabolism, development and neurological
diseases. Cell Cycle, 10(20), 3452-3460.
259

Amiel, S. A. (1994). Nutrition of the brain: macronutrient supply. Prococedings
Nutrition Society, 53(2), 401-405.
Andrews, R., Herlihy, O., Livingstone, D., Andrew, R., and Walker, B. (2002).
Abnormal cortisol metabolism and tissue sensitivity to cortisol in patients with
glucose intolerance. Journal Clinical Endocrinolology and Metabolism, 87(12),
5587-5593.
Auer R. (2004). Hypoglycemic brain damage. Forensic Science, 146, 105-110.
Awad, N., Gagnon, M., Desrochers, A., Tsiakas, M., and Messier, C. (2002).
Impact of peripheral glucoregulation on memory. Behavioural Neuroscience,
116(4), 691-702.
Avogaro, A., Fadini, G., Gallo, A., Pagnin, E., and de Kreutzenberg, S. (2006).
Endothelial dysfunction in type 2 diabetes mellitus. Nutrition, metabolism and
cardiovascular diseases, 16, 39-45.
Bakatselos, S. (2011). Hypoglycemia unawareness. Diabetes Research and
Clinical Practice, 93(1), 92-96.
Balion, C., Raina, P., Gerstein, H., Santaguida, P., Morrison, K., Booker, L., and
Hunt, D. (2007). Reproducibility of impaired glucose tolerance (IGT) and impaired
fasting glucose (IFG) classification: a systematic review. Clinical Chemical
Laboratory Medicine, 45(9), 1180-1185.
Barclay, A. W., Petocz, P., McMillan-Price, J., Flood, V. M., Prvan, T., Mitchell, P.,
& Brand-Miller, J. C. (2008). Glycemic index, glycemic load, and chronic disease
risk— a meta-analysis of observational studies. The American Journal of Clinical
Nutrition, 87(3), 627-637.
Barnes, K., Ingram, J., Porras, O., Barros, L., Hudson, E., Fryer, L., and Baldwin,
S. (2002). Activation of GLUT1 by metabolic and osmotic stress: potential
260

involvement of AMP-activated protein kinase (AMPK). Journal of cell science,
115(11), 2433-2442
Battram, D., Arthur, R., Weekes, A., and Graham, T. (2006). The glucose
intolerance induced by caffeinated coffee ingestion is less pronounced than that
due to alkaloid caffeine in men. The Journal of nutrition, 136(5), 1276-1280.
Bauer, D. J., & Curran, P. J. (2005). Probing interactions in fixed and multilevel
regression: Inferential and graphical techniques. Multivariate Behavioral Research,
40(3), 373-400.
Benton, D. and Donohoe R. (2001). The influence of breakfast and a snack on
psychological functioning. Physiology and Behaviour 74(4-5), 559-571.
Benton, D., and Parker, P. (1998). Breakfast, blood glucose, and cognition.
American Journal of Clinical Nutrition. 959,167-179.
Benton, D. (2002). Carbohydrate ingestion, blood glucose and mood.
Neuroscience and Biobehavioral Reviews, 26(3), 293-308.
Benton, D. and Nabb, S. (2003). Carbohydrate, memory, and mood. Nutrition
Reviews, 61(5 Pt 2), 61-67.
Benton, D., Ruffin, M., Lassel, T., Nabb, S., Messaoudi, M., Vinoy, S., Desor, D.,
Lang, V. (2003). The delivery rate of dietary carbohydrates affects cognitive
performance in both rats and humans. Psychopharmacology. 166, 86-90.
Benton, D. and Nabb, S. (2004). Breakfasts that release glucose at different
speeds interact with previous alcohol intake to influence cognition and mood
before and after lunch. Behavioural Neuroscience. 118(5), 936-943.
Benton, D., Maconie, A., and Williams, C. (2007). The influence of the glycaemic
load of breakfast on the behaviour of children in school. Physiology and Behaviour.
92(4), 717-724.
261

Benton, D., Jarvis, M. (2007). The role of breakfast and a mid-morning snack on
the ability of children to concentrate at school. Physiology and Behaviour. 90, 382-
385.
Bernabeu, R., de Stein, M., Fin, C., Izquierdo, I., and Medina, J. (1995). Role of
hippocampal NO in the acquisition and consolidation of inhibitory avoidance
learning. Neuroreport. 6(11), 1498-1500.
Biessels, G., Deary, I., and Ryan, C. (2008). Cognition and diabetes: a lifespan
perspective. Lancet Neurology. 7(2), 184-190.
Blackman, J., Towle, V., Lewis, G., Spire, J., and Polonsky, K. (1990).
Hypoglycmic Thresholds for Cognitive Dysfunction in Humans. Diabetes. 39(7),
828-835.
Boado, R. and Pardridge, W. (1993). Glucose deprivation causes
posttranscriptional enhancement of brain capillary endothelial glucose transporter
gene expression via GLUT1 mRNA stabilization. Journal of Neurochemistry. 60(6),
2290-2296.
Bohme, G., Bon, C., Stutzmann, J., Doble, A., and Blanchard, J. (1991). Possible
involvement of nitric oxide in long-term potentiation. European journal of
pharmacology. 1999(3), 379-381
Bol, A., Ivanoiu, A., Labar, D., Sibomana, M., Coppens, A., Michel, C., and De
Voider, A. (2000). Comparison of regional cerebral blood flow and glucose
metabolism in the normal brain: effect of aging. Journal of the neurological
sciences. 181(1), 19-28.
Boyle, P., Nagy, R., O'Connor, A., Kempers, S., Yeo, R., and Gualls, C. (1994).
Adaptation in brain glucose uptake following recurrent hypoglycemia. Proceedings
of the National Acadamy of Science U S A . 91(20), 9352-9356.
262

Brand□ Miller, J. (2003). Glycemic load and chronic disease. Nutrition reviews.
61 (s5), S49-S55.
Brand-Miller, J., Hayne, S., Petocz, P., and Colagiuri, S. (2003). Low-Glycemic
Index Diets in the Management of Diabetes A meta-analysis of randomized
controlled trials. Diabetes care, 26(8), 2261-2267.
Brindal, E., Baird, D., Danthiir, V., Wilson, C., Bowen, J., Slater, A., Noakes M.
(2012). Ingesting breakfast meals of different glycaemic load does not alter
cognition and satiety in children. European Journal of Clinical Nutrition. 66,1166-
1171.
Brindal, E., Baird, D., Slater, A., Danthiir, V., Wilson, C., Bowen, J., and Noakes,
M. (2012). The effect of beverages varying in glycaemic load on postprandial
glucose responses, appetite and cognition in 10-12-year-old school children.
British Journal of Nutrition, 1-9.
Brouns et al (2005) Glycaemic index methodology. Nutrition Research Reviews.
18(1): 145-71.
Brun, J., Fedou, C., and Mercier, J. (2000). Postprandial reactive hypoglycemia.
Diabetes and metabolism, 26(5), 337
Buscemi, S., Cosentino, L., Rosafio, G., Morgana, M., Mattina, A., Sprini, D., and
Rini, G. (2012). Effects of Hypocaloric Diets with Different Glycemic Indexes on
Endothelial Function and Glycemic Variability in Overweight and in Obese Adult
Patients at Increased Cardiovascular Risk. Clinical Nutrition. 32(3), 346-52.
Chan, D. (1985). The Chinese version of the General Health Questionnaire: does
language make a difference? Psychological Medicine. 15, 147-155.
Chapman, P., Atkins, C., Allen, M., Haley, J., and Steinmetz, J. (1992). Inhibition of
nitric oxide synthesis impairs two different forms of learning. Neuroreport, 3(7),
567-570.
263

Chen, Z., McConell, G., Michell, B., Snow, R., Canny, B., and Kemp, B. (2000).
AMPK signaling in contracting human skeletal muscle: acetyl-CoA carboxylase and
NO synthase phosphorylation. American Journal of Physiology-Endocrinology and
Metabolism, 279(5), 1202-1206
Chen, Y., and Parrish, T. (2009). Caffeine's effects on cerebrovascular reactivity
and coupling between cerebral blood flow and oxygen metabolism. Neuroimage,
44(3), 647-652.
Chen, Z., Peng, I., Sun, W., Su, M., Hsu, P., Fu, Y., and Shyy, J. (2009). AMP-
activated protein kinase functionally phosphorylates endothelial nitric oxide
synthase Ser633. Circulation research, 104(4), 496-505.
Cheng, G., Huang, C., Deng, H., and Wang, H. (2012). Diabetes as a risk factor for
dementia and mild cognitive impairment: a meta-analysis of longitudinal studies.
International Medical Journal, 42(5), 484-491.
Christensen, T., Diemer, N., Laursen, H., and Gjedde, A. (1981). Starvation
accelerates blood□ brain glucose transfer. Acta Physiologica Scandinavica, 112(2),
221-223.
Chugani, H. (1998). A critical period of brain development: studies of cerebral
glucose utilization with PET. Preventative Medicine. 27:184-188.
Cidad, P., Almeida, A., and Bolahos, J. (2004). Inhibition of mitochondrial
respiration by nitric oxide rapidly stimulates cytoprotective GLUT3-mediated
glucose uptake through 5'-AMP-activated protein kinase. Biochemical Journal,
384(3), 629
Clarke, D,. Sokoloff, L. (1999). Circulation and Energy Metabolism. In Siegel, G,.
Agranoff, B,. Albers, R,. Fisher, S,. and Uhler, M. (eds) Basic Neurochemistry:
Molecular, Cellular and Medical Aspects: Lippincott Williams and Wilkins, 638-669.
264

Cohen J. The cost of dichotomization. Applied Psychological Measurement
1983;7:249-253
Convit, A., Wolf, O,. Tarshish, C., and De Leon, M. (2003). Reduced glucose
tolerance is associated with poor memory performance and hippocampal atrophy
among normal elderly. Proceedings of the National Academy of Sciences, 100(4),
2019-2022.
Convit, A. (2005). Links between cognitive impairment in insulin resistance: an
explanatory model. Neurobiology of Aging, 26 Suppl 1, 31-35.
Cooper, S., Bandelow, S., Nute, L., Morris, G., and Nevill, E. (2012). Breakfast
glycaemic index and cognitive function in adolescent school children. British
Journal of Nutrition, 107(12), 1823-1832.
Correia, S., Santos, R., Perry, G., Zhu, X., Moreira, P., and Smith, A. (2011).
Insulin-resistant brain state: The culprit in sporadic Alzheimer's disease?. Ageing
research reviews, 10(2), 264-273.
Costantini, L., Barr, L., Vogel, J., and Henderson, S. (2008). Hypometabolism as a
therapeutic target in Alzheimer's disease. BMC Neuroscience, 9 Supplement 2,
S16.
Craft, S., Murphy, C., and Wemstrom, J. (1994). Glucose effects on complex
memory and nonmemory tasks: The influence of age, sex, and glucoregulatory
response. Psychobiology. 22(2), 95-105.
Craft, S. (2009). The role of metabolic disorders in Alzheimer disease and vascular
dementia: two roads converged. Archives of Neurology, 66(3), 300.
Cryer, P. (2005). Mechanisms of hypoglycemia-associated autonomic failure and
its component syndromes in diabetes. Diabetes, 54(12), 3592-3601.
265

Cunnane, S., Nugent, S., Roy, M., Courchesne-Loyer, A., Croteau, E., Tremblay,
S., and Rapoport, S. (2011). Brain fuel metabolism, aging, and Alzheimer’s
disease. Nutrition, 27(1), 3-20.
De la Torre, J. and Stefano, G. (2000). Evidence that Alzheimer’s disease is a
microvascular disorder: the role of constitutive nitric oxide. Brain research reviews,
34(3), 119-136.
Dekker, M., Gusba, J., Robinson, L., and Graham, T. (2007). Glucose homeostasis
remains altered by acute caffeine ingestion following 2 weeks of daily caffeine
consumption in previously non-caffeine-consuming males. British Journal of
Nutrition, 98(03), 556-562.
De Feo, P., Gallai, V., Mazzotta, G., Crispino, G., Torlone, E., Perriello, G and
Bolli, G. (1988). Modest decrements in plasma glucose concentration cause early
impairment in cognitive function and later activation of glucose counterregulation in
the absence of hypoglycemic symptoms in normal man. Journal of Clinical
Investigation, 82(2), 436.
Deshmukh, A., Long, Y., de Castro Barbosa, T., Karlsson, H., Glund, S.,
Zavadoski, W., and Zierath, J. (2010). Nitric oxide increases cyclic GMP levels,
AMP-activated protein kinase (AMPK) a1-specific activity and glucose transport in
human skeletal muscle. Diabetologia, 53(6), 1142-1150
Dirnagl, U., Lindauer, U., and Villringer, A. (1993). Role of nitric oxide in the
coupling of cerebral blood flow to neuronal activation in rats. Neuroscience letters,
149(1), 43-46.
Donohoe, R,. and D. Benton, D. (1999). Cognitive functioning is susceptible to the
level of blood glucose. Psychopharmacology (Berl) 145(4): 378-385.
Donohoe, R,. and D. Benton, D. (2000). Glucose tolerance predicts performance
on tests of memory and cognition. Physiology and Behaviour 71(3-4): 395-401.
266

Drzezga, A., Lautenschlager, N., Siebner, H., Riemenschneider, M., Willoch, F.,
Minoshima, S., and Kurz, A. (2003). Cerebral metabolic changes accompanying
conversion of mild cognitive impairment into Alzheimer's disease: a PET follow-up
study. European journal of nuclear medicine and molecular imaging, 30(8), 1104-
1113.
Duchemin, S., Boily, M., Sadekova, N., and Girouard, H. (2012). The complex
contribution of NOS interneurons in the physiology of cerebrovascular regulation.
Frontiers in neural circuits, 6,51-54.
Dye, L., Mansfield, M., Lasikiewicz, N., Mahawish, L., Schnell, R., Talbot, D.,
Chauhan, FI., Croden, F., Lawton, C.L. (2010). An exploratory study to validate an
ambulatory interstitial glucose monitoring device against arterialized blood glucose
using an oral glucose tolerance test in healthy volunteers. British Journal of
Nutrition, 103, 134-140.
Dye, L,. Gilsenan, M,. Quadt, F,. Martens, V., Bot, A., Lasikiewicz, N., Camidge,
D., Croden, F., and Lawton, C. (2010). Manipulation of glycemic response with
isomaltulose in a milk-based drink does not affect cognitive performance in healthy
adults. Molecular Nutrition and Food Research. 54,506-515.
Echambadi, R., and Hess, J. D. (2004). Mean-Centering Does Nothing for
Moderated Multiple Regression. Journal of Marketing Research, 2-16.
Echeverri, D., Montes, F., Cabrera, M., Galan, A., and Prieto, A. (2010). Caffeine's
vascular mechanisms of action. International journal of vascular medicine. Article
ID 834060. doi:10.1155/2010/834060.
Egashira, K., Inou, T., Hirooka, Y., Kai, H., Sugimachi, M., Suzuki, S., and
Takeshita, A. (1993). Effects of age on endothelium-dependent vasodilation of
resistance coronary artery by acetylcholine in humans. Circulation, 88(1), 77-81.
Egawa, T., Hamada, T., Kameda, N., Karaike, K., Ma, X., Masuda, S., and
Hayashi, T. (2009). Caffeine acutely activates 5' adenosine monophosphate-
267

activated protein kinase and increases insulin-independent glucose transport in rat
skeletal muscles. Metabolism. 58(11), 1609-1617.
Englyst, K., Englyst, H., Hudson, G., Cole, T., and Cummings, J. (1999). Rapidly
available glucose in foods: an in vitro measurement that reflects the glycemic
response. The American journal of clinical nutrition, 69(3), 448-454.
Eriksen, B., Eriksen, C., (1974). Effects of noise letters upon the identification of a
target letter in a nonsearch task. Perception and Psychophysics. 16,143-149.
Farrell, C., Catherine, L., William, M. and Pardridge, W. (1991). Blood-brain barrier
glucose transporter is asymmetrically distributed on brain capillary endothelial
lumenal and ablumenal membranes: an electron microscopic immunogold study.
Proceedings of the National Academy of Sciences. 88(13), 5779-5783.
Fischer, K., Colombani, Langhans, W., and Wenk, C. (2001). Cognitive
performance and its relationship with postprandial metabolic changes after
ingestion of different macronutrients in the morning. British Journal of Nutrition.
85(3), 393-405.
Foster-Powell, K., Holt, S., and Brand-Miller, J. (2002). International table of
glycemic index and glycemic load values: 2002. The American journal of clinical
nutrition. 76(1), 5-56
Frick, A., Wahlin, T., Pachana, N., and Byrne, G., (2011). Relationships between
the National Adult Reading Test and memory. Neuropsychology. 25, 397-403.
Fruehwald-Schultes, B., Born, J., Kern, W., Peters, A., and Fehm, H. (2000).
Adaptation of cognitive function to hypoglycemia in healthy men. Diabetes Care.
23(8), 1059-1066.
Fryer, L., Hajduch, E., Rencurel, F., Salt, I., Hundal, H., Hardie, D., and Carling, D.
(2000). Activation, of glucose transport by AMP-activated protein kinase via
stimulation of nitric oxide synthase. Diabetes. 49(12), 1978-1985
268

Fu, W., Haynes, T., Kohli, R., Hu, J., Shi, W., Spencer, T., and Wu, G. (2005).
Dietary L-arginine supplementation reduces fat mass in Zucker diabetic fatty rats.
The Journal of nutrition. 135(4), 714-721
Fuh, J., Wang, S., Hwu, C., and Lu, S. (2007). Glucose tolerance status and
cognitive impairment in early middleDaged women. Diabetic medicine. 24(7), 788-
791.
Furchgott, R. and Zawadzki, J. (1980). The obligatory role of endothelial cells in
the relaxation of arterial smooth muscle by acetylcholine. Nature. 288, 373-376.
Geary, G., Buchholz, J., and Pearce, W. (2003). Maturation depresses mouse
cerebrovascular tone through endothelium-dependent mechanisms. American
Journal of Physiology-Regulatory, Integrative and Comparative Physiology, 284(3),
R734-R741.
Gellar, L., and Nansel, T. (2009). High and low glycemic index mixed meals and
blood glucose in youth with type 2 diabetes or impaired glucose tolerance. The
Journal of pediatrics. 154(3), 455-458
Gerhart, D. and David, Z. (1992). Neurons and microvessels express the brain
glucose transporter protein GLUT3. Proceedings of the National Academy of
Sciences. 89(2), 733-737.
Ngarmukos, C., Baur, E., and Kumagai, A. (2001). Co-localization of GLUT1 and
GLUT4 in the blood-brain barrier of the rat ventromedial hypothalamus. Brain
research. 900(1), 1-8.
Giles, G., Mahoney, C., Brunye, T., Gardony, A., Taylor H., and Kanarek R. (2012).
Differential cognitive effects of energy drink ingredients: Caffeine, taurine, and
glucose. Pharmacological and Biochemical Behaviour. 102(4), 569-577.
Gilsenan MB, de Bruin EA and Dye L. (2009). The influence of carbohydrate on
cognitive performance - a critical evaluation from the perspective of glycaemic
load. British Journal of Nutrition 101(7):941-9
269

Girouard, H., and ladecola, C. (2006). Neurovascular coupling in the normal brain
and in hypertension, stroke, and Alzheimer disease. Journal of Applied Physiology.
100(1), 328-335
Gjedde, A., and Crone, C. (1981). Blood-brain glucose transfer: repression in
chronic hyperglycemia. Science, 214(4519), 456-457.
Glade, M. (2010). Caffeine-Not just a stimulant. Nutrition, 26(10): 932-938.
Gonder-Frederick, L., Cox, D., Driesen, N., Ryan, C., and Clarke, W. (1994).
Individual differences in neurobehavioral disruption during mild and moderate
hypoglycemia in adults with IDDM. Diabetes, 43(12), 1407-1412.
Goldberg D, and Williams P. (2008). A user’s guide to the general health
questionnaire. Windsor: NFER-Nelson.
Graham, T., Sathasivam, P., Rowland, M., Marko, N., Greer, F., and Battram, D.
(2001). Caffeine ingestion elevates plasma insulin response in humans during an
oral glucose tolerance test. Canadian journal of physiology and pharmacology,
79(7), 559-565.
Grome, J., and Stefanovich, V. (1986). Differential effects of methylxanthines on
local cerebral blood flow and glucose utilization in the conscious rat. Naunyn-
Schmiedeberg's archives of pharmacology, 333(2), 172-177.
Haley, J., Wilcox, G., and Chapman, P. (1992). The role of nitric oxide in
hippocampal long-term potentiation. Neuron, 8(2), 211-216.
Hasselbalch, S., Knudsen, G., Jakobsen, J., Hageman, L., Holm, S., and Paulson,
O. (1994). Brain metabolism during short-term starvation in humans. Journal of
Cerebral Blood Flow and Metabolism, 14(1), 125-131.
Hasselbalch, S., Knudsen, G., Capaldo, B., Postiglione, A., and Paulson, O.
(2001). Blood-brain barrier transport and brain metabolism of glucose during acute
270

hyperglycemia in humans. Journal of Clinical Endocrinology and Metabolism,
86(5), 1986-1990.
Hatonen, K., Simila, M., Virtamo, J., Eriksson, J., Hannila, M., Sinkko, H. and
Valsta, L. (2006). Methodologic considerations in the measurement of glycemic
index: glycemic response to rye bread, oatmeal porridge, and mashed potato. The
American journal of clinical nutrition, 84(5), 1055-1061.
Harder, D., Alkayed, N., Lange, A., Gebremedhin, D., Roman, R. (1998).
Functional hyperemia in the brain: hypothesis for astrocyte-derived vasodilator
metabolites. Stroke, 29,229-234.
Harris, S. (1924). Hyperinsulinism and dysinsulinism. Journal of the American
Medical Association 83, 729.
Hayashi, T., Hirshman, M., Kurth, E., Winder, W., and Goodyear, L. (1998).
Evidence for 5' AMP-activated protein kinase mediation of the effect of muscle
contraction on glucose transport. Diabetes, 47(8), 1369-1373.
Hayes, A. F. (2012). PROCESS: A versatile computational tool for observed
variable mediation, moderation, and conditional process modelling [White paper].
Retrieved from http://www.afhayes.com/public/process2012.pdf
Heckman, M., Weil, A., and Gonzalez de Mejia, E. (2010). Caffeine (1, 3, 7-
trimethylxanthine) in foods: a comprehensive review on consumption, functionality,
safety, and regulatory matters. Journal of Food Science, 75(3): R77-87.
Helkala, E., Lakka, T., Vanhanen, M., Tuomainen, T., Ehnholm, C., Kaplan, G.,
and Salonen, J. (2001). Associations between apolipoprotein E phenotype,
glucose metabolism and cognitive function in men. An explorative study in a
population sample. Diabetic medicine, 18(12), 991-997.
Hepburn, D., Deary, I., Frier, B., Patrick, A., Quinn, J., Fisher, M. (1991).
Symptoms of acute insulin-induced hypoglycemia in humans with and without
271
IDDM? Factor-analysis approach. Diabetes Care, 14, 949-957.
Hiltunen, L., Keinanen-Kiukaanniemi, S., and Laara, E. (2001). Glucose tolerance
and cognitive impairment in an elderly population. Public Health, 115(3), 197-200.
Howard, M., and Marczinski, C. (2010). Acute effects of a glucose energy drink on
behavioral control. Experimental and clinical psychopharmacology, 18(6), 553.
Hindmarsh, P., Silvio, L., Pringle, P., Kurtz, A., and Brook, C. (1988). Changes in
serum insulin concentration during puberty and their relationship to growth
hormone. Clinical endocrinology, 28(4), 381-388.
Hindmarch, I., U. Rigney, U., Stanley, N., Quinlan, P., Rycroft, J., and Lane, J.
(2000). A naturalistic investigation of the effects of day-long consumption of tea,
coffee and water on alertness, sleep onset and sleep quality. Psychopharmacology
(Berl), 149(3), 203-216.
Hirvonen, J., Virtanen, K., Nummenmaa, L., Hannukainen, J., Honka, M., Bucci,
M., and Nuutila, P. (2011). Effects of insulin on brain glucose metabolism in
impaired glucose tolerance. Diabetes, 60(2), 443-447.
Holub, I., Gostner, A., Theis, S., Nosek, L., Kudlich, T., Melcher, R., Scheppach,
W. (2010). Novel findings on the metabolic effects of the low glycaemic
carbohydrate isomaltulose (Palatinose). British Journal of Nutrition, 103,1730-
1737.
Hoyland, A., Lawton, C., and Dye, L. (2008). Acute effects of macronutrient
manipulations on cognitive test performance in healthy young adults: a systematic
research review. Neuroscience and Biobehavioral Reviews, 32(1), 72-85.
Hoyland A, Dye L & Lawton CL. (2009). A systematic review of the effect of
breakfast on the cognitive performance of children and adolescents. Nutrition
Research Reviews, 22, 220-243
272

Hoyt, G., Hickey, M., and Cordain, L. (2005). Short Communication Dissociation of
the glycaemic and insuiinaemic responses to whole and skimmed milk. British
Journal of Nutrition, 93, 175-177.
Ido, Y., Carling, D., and Ruderman, N. (2002). Hyperglycemia-Induced Apoptosis
in Human Umbilical Vein Endothelial Cells Inhibition by the AMP-Activated Protein
Kinase Activation. Diabetes, 51(1), 159-167.
Ingwersen, J., Defeyter, M., Kennedy, D., Wesnes, K., Scholey, A. (2007). A low
glycaemic index breakfast cereal preferentially prevents children's cognitive
performance from declining throughout the morning. Appetite, 49, 240-244.
Jacob, R., Dziura, J., Blumberg, M., Morgen, J., and Sherwin, R. (1999). Effects of
recurrent hypoglycemia on brainstem function in diabetic BB rats: protective
adaptation during acute hypoglycemia. Diabetes, 48(1), 141-145.
James, J., and Rogers, P. (2005). Effects of caffeine on performance and mood:
withdrawal reversal is the most plausible explanation. Psychopharmacology,
182(1), 1-8.
Jenkins, D., Woiever, T., Taylor, R., Barker, H., Fielden, H., Baldwin, J., and Goff,
D. (1981). Glycemic index of foods: a physiological basis for carbohydrate
exchange. The American journal of clinical nutrition, 34(3), 362-366
Jensen R. (1987). Individual differences in the Hick paradigm. In: Vernon PA,
editor. Speed of information-processing and intelligence. New Jersey, Ablex, 101-
175.
Jessica, S. and Peter, R. (2011). Theanine, Mood and Behaviour. London, CRC.
Johnston, K., Clifford, M., and Morgan, L. (2003). Coffee acutely modifies
gastrointestinal hormone secretion and glucose tolerance in humans: glycemic
effects of chlorogenic acid and caffeine. The American journal of clinical nutrition,
78(4), 728-733.
273

Jobgen, W., Fried, S., Fu, W., Meininger, C., and Wu, G. (2006). Regulatory role
for the arginine-nitric oxide pathway in metabolism of energy substrates. The
Journal of nutritional biochemistry, 17(9), 571.
Jones, E., Sunram-Lea, S., Wesnes, K. (2012). Acute ingestion of different
macronutrients differentially enhances aspects of memory and attention in healthy
young adults. Biological Psychology, 89,477-486.
Jun, H., Choi, Y., Hoang, M., Jia, Y., Lee, J., and Lee, S. (2011). Red yeast barley
reduces plasma glucose levels and activates AMPK phosphorylation in db/db mice.
Food Science and Biotechnology, 20(5), 1265-1270.
Kalmijn, S., Feskens, E., Launer, L., Stijnen, T., and Kromhout, D. (1995). Glucose
intolerance, hyperinsulinaemia and cognitive function in a general population of
elderly men. Diabetologia, 38(9), 1096-1102.
Kalpouzos, G., Chetelat, G., Baron, J., Landeau, B., Mevel, K., Godeau, C., and
Desgranges, B. (2009). Voxel-based mapping of brain gray matter volume and
glucose metabolism profiles in normal aging. Neurobiology of aging, 30(1), 112-
124.
Kanaya, A., Barrett-Connor, E., Gildengorin, G., and Yaffe, K. (2004). Change in
cognitive function by glucose tolerance status in older adults: a 4-year prospective
study of the Rancho Bernardo study cohort. Archives of Internal Medicine, 164(12),
1327.
Kaplan, R., Greenwood, C., Winocur, G., and Woiever, T. (2000). Cognitive
performance is associated with glucose regulation in healthy elderly persons and
can be enhanced with glucose and dietary carbohydrates. American Journal of
Clinical Nutrition, 72(3), 825-836.
Kashimura, J., Nagai, Y., Ebashi, T., (2003). The effect of palatinose on mental
concentration in humans. Journal of Nutrition Science and Vitaminology (Tokyo),
49, 214-216.
274

Keage, H., Churches, O., Kohler, M., Pomeroy, D., Luppino, R., Bartolo, M., and
Elliott, S. (2012). Cerebrovascular Function in Aging and Dementia: A Systematic
Review of Transcranial Doppler Studies. Dementia and Geriatric Cognitive
Disorders Extra, 2(1), 258-270.
Kennedy, D., and Scholey, A. (2004). A glucose-caffeine 'energy drink' ameliorates
subjective and performance deficits during prolonged cognitive demand. Appetite,
42(3), 331-333.
Kim, W. (2003). Debunking the effects o f taurine in Red Bull energy drink. Nutrition
Bytes, 9(1).
Kloppenborg, R., van den Berg, E., Kappelle, L., and Biessels, G. (2008). Diabetes
and other vascular risk factors for dementia: which factor matters most? A
systematic review. European journal of pharmacology, 585(1), 97-108.
Knowles, R. (1997). Nitric oxide biochemistry. Biochemical Society transactions,
25(3), 895.
Kohli, R., Meininger, C., Haynes, T., Yan, W., Self, J., and Wu, G. (2004). Dietary
L-arginine supplementation enhances endothelial nitric oxide synthesis in
streptozotocin-induced diabetic rats. The Journal of nutrition, 134(3), 600-608.
Koranyi, L., Bourey, R., James, D., Mueckler, M., Fiedorek Jr, F., and Permutt, M.
(1991). Glucose transporter gene expression in rat brain: Pretranslational changes
associated with chronic insulin-induced hypoglycemia, fasting, and diabetes.
Molecular and Cellular Neuroscience, 2(3), 244-252.
Korol, D. (2002). Enhancing cognitive function across the life span. Ann N Y
Proceedings of the National Academy of Sciences, 959: 167-179.
Korshunov, S., Skulachev, V., and Starkov, A. (1997). High protonic potential
actuates a mechanism of production of reactive oxygen species in mitochondria.
FEBS letters, 416(1), 15-18.
275

Kromrey, J. D., & Foster-Johnson, L. (1998). Mean centering in moderated multiple
regression: Much ado about nothing. Educational and Psychological Measurement,
58(1), 42-67.
Kumari, M., and Marmot, M. (2005). Diabetes and cognitive function in a middle-
aged cohort Findings from the Whitehall II study. Neurology, 65(10), 1597-1603.
Kumagai, A., Kang, Y., Boado, R., and Pardridge, W. (1995). Upregulation of
blood-brain barrier GLUT1 glucose transporter protein and mRNA in experimental
chronic hypoglycemia. Diabetes, 44(12), 1399-1404.
Kuschinsky, W. (1997). Neuronal-vascular coupling. A unifying hypothesis.
Advances in Experimental Medical Biology. 413, 167-176.
Lamport, D., Lawton, C., Mansfield, M., and Dye, L. (2009). Impairments in glucose
tolerance can have a negative impact on cognitive function: a systematic research
review. Neuroscience Biobehavioural Reviews, 33(3), 394 413.
Lamport, D., Hoyle, E., Lawton, C., Mansfield, M., and Dye, L. (2011). Evidence for
a second meal cognitive effect: Glycaemic responses to high and low glycaemic
index evening meals are associated with cognition the following morning.
Nutritional neuroscience, 14(2), 66-71.
Lamport, D., Dye, L., Mansfield, M., and Lawton, C. (2012). Acute glycaemic load
breakfast manipulations do not attenuate cognitive impairments in adults with type
2 diabetes. Clinical Nutrition. 32 (2). 265-272.
Landau, S., Mintun, M., Joshi, A., Koeppe, R., Petersen, R., Aisen, P. Jagust, W.
(2012). Amyloid deposition, hypometabolism, and longitudinal cognitive decline.
Annals of Neurology, 72(4), 578-586.
Lankford, J., Butler, I., and Koenig, M. (2012). Glucose Transporter Type I
Deficiency Causing Mitochondrial Dysfunction. Journal of Child Neurology, 27(6),
796-798.
276

Lavi, T., Karasik, A., Koren-Morag, N., Kanety, H., Feinberg, S., and Shechter, M.
(2009). The acute effect of various glycemic index dietary carbohydrates on
endothelial function in nondiabetic overweight and obese subjects. Journal of the
American College of Cardiology, 53(24), 2283-2287.
Law, A., Gauthier, S., and Quirion, R. (2001). Say NO to Alzheimer’s disease: the
putative links between nitric oxide and dementia of the Alzheimer’s type. Brain
Research Reviews, 35(1), 73-96.
Lazar, A. A., & Zerbe, G. O. (2011). Solutions for Determining the Significance
Region Using the Johnson-Neyman Type Procedure in Generalized Linear (Mixed)
Models. Journal of Educational and Behavioral Statistics, 36(6), 699-719.
Lei, H., and Gruetter, R. (2006). Effect of chronic hypoglycaemia on glucose
concentration and glycogen content in rat brain: A localized 13C NMR study. J
Neurochem, 99(1), 260-268.
Laranjinha, J., Santos, R., Lourengo, C., Ledo, A., and Barbosa, R. (2012). Nitric
oxide signaling in the brain: translation of dynamics into respiration control and
neurovascular coupling. Annals of the New York Academy of Sciences, 1259(1),
10-18.
Leybaert, L., (2007). Neurobarrier coupling in the brain: adjusting glucose entry
with demand. Journal of neuroscience research, 85(15), 3213-3220.
Leibson, C., Rocca, W., Hanson, V., Cha, R., Kokmen, E., O'Brien, P., and Lazar,
A. A., & Zerbe, G. O. (2011). Solutions for Determining the Significance Region
Using the Johnson-Neyman Type Procedure in Generalized Linear (Mixed)
Models. Journal of Educational and Behavioral Statistics, 36(6), 699-719.
Leybaert, L. (2005). Neurobarrier coupling in the brain: a partner of neurovascular
and neurometabolic coupling? Journal Cerebral Blood Flow and Metabolism, 25,
2-16.
277

Li, J., Hu, X., Selvakumar, P., Russell, R., Cushman, S., Holman, G., and Young,
L. (2004). Role of the nitric oxide pathway in AMPK-mediated glucose uptake and
GLUT4 translocation in heart muscle. American Journal of Physiology-
Endocrinology And Metabolism, 287(5), 834-841.
Lidder, S., and Webb, A. (2013). Vascular effects of dietary nitrate (as found in
green leafy vegetables and beetroot) via the nitrate-nitrite-nitric oxide pathway.
British Journal of Clinical Pharmacology, 75, 677-696.
Liguori, A. and Hughes, J. (1997). Caffeine self-administration in humans: 2. A
within-subjects comparison of coffee and cola vehicles. Experimental Clinical
Psychopharmacology 5(3), 295-303.
Liguori, A., Hughes, J. and Grass, J. (1997). Absorption and subjective effects of
caffeine from coffee, cola and capsules. Pharmacology Biochemistry and
Behaviour. 58(3), 721-726.
Liguori, A., Hughes, J. and Oliveto, A. (1997). Caffeine self-administration in
humans: 1. Efficacy of cola vehicle. Experimental Clinical Psychopharmacology
5(3), 286-294.
Lina, B., Jonker, D., and Kozianowski, G. (2002). Isomaltulose (Palatinose): a
review of biological and toxicological studies. Food Chemical Toxicology, 40(10),
1375-1381.
Lindgren, M., Eckert, B., Stenberg, G., and Agardh, C. (1996). Restitution of
neurophysiological functions, performance, and subjective symptoms after
moderate insulin-induced hypoglycaemia in non-diabetic men. Diabetes Medicine.
13(3), 218-225.
Ljubicic, V., and Hood, D. (2009). Diminished contraction□ induced intracellular
signaling towards mitochondrial biogenesis in aged skeletal muscle. Aging cell,
8(4), 394-404.
278

Lobmann, R., Smid, H., Pottag, G., Wagner, K., Heinze, H., and Lehnert, H.
(2000). Impairment and recovery of elementary cognitive function induced by
hypoglycemia in type-1 diabetic patients and healthy controls. Journal of Clinical
Endocrinology and Metabolism, 85(8), 2758-2766
Loke, W. (1988). Effects of caffeine on mood and memory. Physiology and
Behaviour. 44(3): 367-372.
Lorist, M. and Tops, M. (2003). Caffeine, fatigue, and cognition. Brain Cognition.
53(1), 82-94.
Lovick, T., Brown, L., and Key, B. (1999). Neurovascular relationships in
hippocampal slices: physiological and anatomical studies of mechanisms
underlying flow-metabolism coupling in intraparenchymal microvessels.
Neuroscience, 92(1), 47-60.
Lu, Y., Lu, J., Wang, S., Li, C., Liu, L., Zheng, R., and Pan, C. (2012). Cognitive
function with glucose tolerance status and obesity in Chinese middle-aged and
aged adults. Aging and Mental Health, 16(7), 911-914.
Lundberg, J., Weitzberg, E., and Gladwin, M. (2008). The nitrate-nitrite-nitric
oxide pathway in physiology and therapeutics. Nature Reviews Drug Discovery,
7(2), 156-167.
Magistretti, P. (2000). Cellular bases of functional brain imaging: insights from
neuron-glia metabolic coupling. Brain research, 886(1), 108-112.
Mah, E., and Bruno, R. (2012). Postprandial hyperglycemia on vascular endothelial
function: mechanisms and consequences. Nutrition research (New York, NY),
32(10), 727.
Mah, E., Noh, S., Ballard, K., Matos, M., Volek, J., and Bruno, R. (2011).
Postprandial hyperglycemia impairs vascular endothelial function in healthy men
279

by inducing lipid peroxidation and increasing asymmetric dimethylarginine:
arginine. The Journal of nutrition, 141(11), 1961-1968.
Martin, P., (2006). Identity of SMCT1 (SLC5A8) as a neuronDspecific
Na+Dcoupled transporter for active uptake of Inlactate and ketone bodies in the
brain. Journal of neurochemistry, 98(1), 279-288.
Matsuoka, T., Nishizaki, T. and Kisby G. (1998). Na+DDependent and
PhlorizinDInhibitable Transport of Glucose and Cycasin in Brain Endothelial Cells.
Journal of neurochemistry, 70(2), 772-777.
Mattson, M., Guthrie, P., and Kater, S. (1989). Intrinsic factors in the selective
vulnerability of hippocampal pyramidal neurons. Progress in clinical and biological
research, 317, 333-351.
Matthews, D., Holman, R., Bown, E., Steenson, J., Watson, A., Hughes, S. (1987).
Pen-sized digital 30-second blood glucose meter. Lancet. 1, 778-779.
Maxwell, S. E., & Delaney, H. D. (1990). Designing experiments and analyzing
data: A model comparison approach. Belmont, CA: Wadsworth.
Maxwell, S. E., & Delaney, H. D. (1993). Bivariate median splits and spurious
statistical significance. Psychological Bulletin, 113(1), 181.
Mayhan, W., Arrick, D., Sharpe, G., and Sun, H. (2008). AgeDRelated Alterations
in Reactivity of Cerebral Arterioles: Role of Oxidative Stress. Microcirculation,
15(3), 225-236.
McCall, A., Millington, W., and Wurtman, R. (1982). Metabolic fuel and amino acid
transport into the brain in experimental diabetes mellitus. Proceedings of the
National Academy of Sciences, 79(17), 5406-5410.
McCall, A. (2005). Altered glycemia and brain— update and potential relevance to
the aging brain. Neurobiology of aging, 26(1), 70-75.
280

McCance and Widdowson's the Composition of Foods: 6th Edition (2002)
Royal Society of Chemistry, London
McConell, G., and Kingwell, B. (2006). Does nitric oxide regulate skeletal muscle
glucose uptake during exercise?. Exercise and sport sciences reviews, 34(1), 36-
41.
McCrimmon, R., Deary, I., and Frier, B. (1997). Auditory information
processing during acute insulin-induced hypoglycaemia in non-diabetic human
subjects. Neuropsychologia, 35(12), 1547-1553.
McCrimmon, R., Deary, I., Huntly, B., MacLeod, K., and Frier, B. (1996). Visual
information processing during controlled hypoglycaemia in humans. Brain, 119( 4),
1277-1287.
McCrimmon, R. (2012). Update in the CNS response to hypoglycemia. J Clin
Endocrinology and Metabolism, 97(1), 1-8.
McCrimmon, R., Shaw, M., Fan, X., Cheng, FI., Ding, Y., Vella, M., and Sherwin, R.
(2008). Key role for AMP-activated protein kinase in the ventromedial
hypothalamus in regulating counterregulatory hormone responses to acute
hypoglycemia. Diabetes, 57(2), 444-450.
McEwen, B. (1997). Possible mechanisms for atrophy of the human hippocampus.
Molecular psychiatry, 2(3), 255-262.
McLellan, T., and Lieberman, FI. (2012). Do energy drinks contain active
components other than caffeine? Nutrition reviews, 70(12), 730-744.
McNay, E. (2005). The impact of recurrent hypoglycemia on cognitive function in
aging. Neurobiology of Aging, 26 Suppl 1, 76-79.
McNay, E., and Cotero, V. (2010). Mini-review: impact of recurrent hypoglycemia
on cognitive and brain function. Physiology and Behaviour, 100(3), 234-238.
281

McNay, E., Fries, T., and Gold, P. (2000). Decreases in rat extracellular
hippocampal glucose concentration associated with cognitive demand during a
spatial task. Proceedings of the National Academy of Science U S A , 97(6), 2881-
2885.
McNay, E., and Gold, P. (2001). Age-related differences in hippocampal
extracellular fluid glucose concentration during behavioral testing and following
systemic glucose administration. Journal of Gerontology Aging Biological Science
and Medical Science, 56(2), 66-71.
McNay, E., McCarty, R., and Gold, P. (2001). Fluctuations in brain glucose
concentration during behavioral testing: dissociations between brain areas and
between brain and blood. Neurobiology of Learning and Memory, 75(3), 325-337.
McNay, E. C., and Sherwin, R. S. (2004). Effect of recurrent hypoglycemia on
spatial cognition and cognitive metabolism in normal and diabetic rats. Diabetes,
53(2), 418-425.
McNay, E., Williamson, A., McCrimmon, R., and Sherwin, R. (2006). Cognitive and
neural hippocampal effects of long-term moderate recurrent hypoglycemia.
Diabetes, 55(4), 1088-1095.
Mellman, M., Davis, M., Brisman, M., and Shamoon, H. (1994). Effect of
antecedent hypoglycemia on cognitive function and on glycemic thresholds for
counterregulatory hormone secretion in healthy humans. Diabetes Care, 17(3),
183-188.
Meng, W., Tobin, J., and Busija, D. (1995). Glutamate-induced cerebral
vasodilation is mediated by nitric oxide through N-methyl-D-aspartate receptors.
Stroke, 26(5), 857-863.
Merbis, M., Snoek, F., Kane, K., and Heine, R. (1996). Hypoglycaemia induces
emotional disruption. Patient Education and Counselling, 29(1), 117-122.
282

Messier, C., Tsiakas, M., Gagnon, M., Desrochers, A., and Awad, N. (2003). Effect
of age and glucoregulation on cognitive performance. Neurobiology of Aging,
24(7), 985-1003.
Messier, C., Desrochers, A., and Gagnon, M. (1999). Effect of glucose, glucose
regulation, and word imagery value on human memory. Behavioral Neuroscience,
113(3), 431.
Messier, C., Awad-Shimoon, N., Gagnon, M., Desrochers, A., and Tsiakas, M.
(2011). Glucose regulation is associated with cognitive performance in young
nondiabetic adults. Behavioural Brain Research, 222(1), 81-88.
Messier, C., Tsiakas, M., Gagnon, M., and Desrochers, A. (2010). Effect of age
and glucoregulation on cognitive performance. Journal of Clinical and Experimental
Neuropsychology, 32(8), 809-821.
Messier, C., Gagnon, M., and Knott, V. (1997). Effect of glucose and peripheral
glucose regulation on memory in the elderly. Neurobiology of Aging, 18(3), 297-
304.
Meyer, F., Canzler, P., Giers, H., and Walther, H. (1991). Time course of inhibition
of caffeine elimination in response to the oral depot contraceptive agent
Deposiston. Hormonal contraceptives and caffeine elimination. Zentralbl Gynakol
113(6): 297-302.
Micha, R., Rogers, P., and Nelson, M. (2011). Glycaemic index and glycaemic load
of breakfast predict cognitive function and mood in school children: a randomised
controlled trial. British Journal of Nutrition. 106(10), 1552-1561.
Michaud, C., Musse, N., Nicolas, J., Mejean, L. (1991). Effects of breakfast-size on
short-term memory, concentration, mood and blood glucose. Journal of
Adolescents Health, 12, 53-57.
283

Miller, G. A., & Chapman, J. P. (2001). Misunderstanding analysis of covariance.
Journal of abnormal psychology, 110( 1), 40.
Moghaddasi, M., Mamarabadi, M., and Habibi, A. (2010). A comparison of
cerebral vasomotor reactivity in diabetic and nondiabetic Iranian patients. Journal
of Research in Medical Sciences: The Official Journal of Isfahan University of
Medical Sciences, 15(1), 50-53.
Moisey, L., Robinson, L., and Graham, T. (2010). Consumption of caffeinated
coffee and a high carbohydrate meal affects postprandial metabolism of a
subsequent oral glucose tolerance test in young, healthy males. British Journal of
Nutrition, 103(6), 833-841.
Moisey, L., Kacker, S., Bickerton, A., Robinson, L., and Graham, T. (2008).
Caffeinated coffee consumption impairs blood glucose homeostasis in response to
high and low glycemic index meals in healthy men. The American Journal of
Clinical Nutrition, 87(5), 1254-1261.
Mooradian, A., and Morin, A. (1991). Brain uptake of glucose in diabetes mellitus:
the role of glucose transporters. The American Journal of the Medical Sciences,
301(3), 173-177.
Mosconi, L., Brys, M., Glodzik-Sobanska, L., De Santi, S., Rusinek, H., and de
Leon, M. (2007). Early detection of Alzheimer's disease using neuroimaging.
Experimental Gerontology, 42(1-2), 129-138.
Mosconi, L., Brys, M., Switalski, R., Mistur, R., Glodzik, L., Pirraglia, E, de Leon, M.
(2007). Maternal family history of Alzheimer's disease predisposes to reduced
brain glucose metabolism. Proceedings from the National Academy of Science U S
A, 104(48), 19067-19072.
Mosconi, L., Mistur, R., Switalski, R., Tsui, W., Glodzik, L., Li, Y., and de Leon, M.
(2009). FDG-PET changes in brain glucose metabolism from normal cognition to
284
pathologically verified Alzheimer's disease. European Journal of Nuclear Medicine
and Molecular Imaging, 36(5), 811-822.
Mosconi, L., Berti, V., Glodzik, L., Pupi, A., De Santi, S., and de Leon, M. (2010).
Pre-clinical detection of Alzheimer's disease using FDG-PET, with or without
amyloid imaging. Journal of Alzheimers Disease, 20(3), 843-854.
Mosconi, L. (2005). Brain glucose metabolism in the early and specific diagnosis of
Alzheimer’s disease. European Journal of Nuclear Medicine and Molecular
Imaging, 32(4), 486-510.
Mosconi, L., Mistur, R., Switalski, R., Brys, M., Glodzik, L., Rich, K., and De Leon,
M. (2009). Declining brain glucose metabolism in normal individuals with a
maternal history of Alzheimer disease. Neurology, 72(6), 513-520.
Muniyappa, R., and Sowers, J. (2013). Role of insulin resistance in endothelial
dysfunction. Reviews in Endocrine and Metabolic Disorders, 14(1), 5-12.
Nathan, D., Davidson, M., DeFronzo, A., Heine, R., Henry, R., Pratley, R. (2007).
Impaired Fasting Glucose and Impaired Glucose Tolerance. Implications for care.
Diabetes Care, 30, 753-759.
Nabb, S., Benton, D. (2006). The effect of the interaction between glucose
tolerance and breakfasts varying in carbohydrate and fibre on mood and cognition.
Nutritional Neuroscience, 9,161-168.
Nabb, S., Benton, D. (2006). The influence on cognition of the interaction between
the macro-nutrient content of breakfast and glucose tolerance. Physiology and
Behaviour, 87,16-23.
Nehlig, A. (2010). Is caffeine a cognitive enhancer? Journal of Alzheimers Disease.
20 Suppl 1: 85-94.
Nelson, H. (1982). National Adult Reading Test: Test Manual. Windsor, Berks:
285

NFER-Nelson.
Nielson, K., Langenecker, S., Ross, T., Garavan, H., Rao, S., and Stein, E. (2004).
Comparability of functional MRI response in young and old during inhibition.
Neuroreport, 15(1), 129-133.
Nilsson, A., Ostman, E., Preston, T., and Bjorck, I. (2007). Effects of Gl vs content
of cereal fibre of the evening meal on glucose tolerance at a subsequent
standardized breakfast. European journal of clinical nutrition, 62(6), 712-720.
Nilsson, A., Radeborg, K., and Bjorck, I. (2007). Effects of differences in
postprandial glycaemia on cognitive functions in healthy middle-aged subjects.
European Journal of Clinical Nutrition, 63(1), 113-120.
Nilsson, A., Radeborg, K., and Bjorck, I. (2012). Effects on cognitive performance
of modulating the postprandial blood glucose profile at breakfast. European
Journal of Clinical Nutrition, 66, 1039-1043.
Nishikawa, T., Edelstein, D., Du, X., Yamagishi, S., Matsumura, T., Kaneda, Y.,
and Brownlee, M. (2000). Normalizing mitochondrial superoxide production blocks
three pathways of hyperglycaemic damage. Nature, 404(6779), 787-790.
O’Connor, P., Gregg, E., Rush, W., Cherney, L., Stiffman, M., and Engelgau, M.
(2006). Diabetes: how are we diagnosing and initially managing it?. The Annals of
Family Medicine, 4(1), 15-22.
Okamura, T., Ayajiki, K., Fujioka, H., Shinozaki, K., and Toda, N. (2002).
Pharmacology and Physiology of Perivascular Nerves Regulating Vascular
Function. Neurogenic Cerebral Vasodilation Mediated by Nitric Oxide. The
Japanese Journal of Pharmacology, 88(1), 32-38.
Okamoto, M., Etani, H., Yagita, Y., Kinoshita, N., and Nukada, T. (2001).
Diminished reserve for cerebral vasomotor response to L-arginine in the elderly:
evaluation by transcranial Doppler sonography. Gerontology, 47(3), 131-135.
286

Owen, L., Scholey, A., Finnegan, Y., Hu, H., and Sunram-Lea, S. (2012). The
effect of glucose dose and fasting interval on cognitive function: a double-blind,
placebo-controlled, six-way crossover study. Psychopharmacology, 220(3), 577-
589.
Paile-Hyvarinen, M., Raikkonen, K., Kajantie, E., Darby, D., Yliharsila, H., Salonen,
M. and Eriksson, J. (2009). Impact of glucose metabolism and birth size on
cognitive performance in elderly subjects. Diabetes research and clinical practice,
83(3), 379-386.
Palumbo, P. (1997). The risk of dementia among persons with diabetes mellitus: a
population-based cohort study. Annals of N Y Academy of Science, 826, 422-427.
Papanikolaou, Y., Palmer, H., Binns, M., Jenkins, D. J., and Greenwood, C.
(2006). Better cognitive performance following a low-glycaemic-index compared
with a high-glycaemic-index carbohydrate meal in adults with type 2 diabetes.
Diabetologia, 49(5), 855-862.
Pardridge, W., Triguero, D., and Farrell, C. (1990). Downregulation of blood-brain
barrier glucose transporter in experimental diabetes. Diabetes, 39(9), 1040-1044.
Pelligrino, D., Segil, L., and Albrecht, R. (1990). Brain glucose utilization and
transport and cortical function in chronic vs. acute hypoglycemia. American Journal
of Physiology-Endocrinology and Metabolism, 259(5), 729-735.
Perthen, J., Lansing, A., Liau, J., Liu, T., and Buxton, R. (2008). Caffeine induced
uncoupling of cerebral blood flow and oxygen metabolism: A calibrated-BOLD fMRI
study. Neuroimage, 40(1), 237-247.
Petrie, H., .Chown, S., Belfie, L., Duncan, A., McLaren, D., Conquer, J., and
Graham, T. (2004). Caffeine ingestion increases the insulin response to an oral-
glucose-tolerance test in obese men before and after weight loss. The American
Journal of Clinical Nutrition, 80(1), 22-28.
287

Phillips-Bute, B. and Lane, J. (1997). Caffeine withdrawal symptoms following brief
caffeine deprivation. Physiol Behav, 63(1), 35-39.
Pitocco, D., Zaccardi, F., Di Stasio, E., Romitelli, F., Santini, S., Zuppi, C., and
Ghirlanda, G. (2010). Oxidative stress, nitric oxide, and diabetes. The review of
diabetic studies: Regional Development Studies, 7(1), 15-25.
Pizziol, A., Tikhonoff, V., Paleari, C., Russo, E., Mazza, A., Ginocchio, G., and
Pessina, A. (1998). Effects of caffeine on glucose tolerance: a placebo-controlled
study. European Journal of Clinical Nutrition, 52(11), 846-849.
Polonsky, K. (2000). Dynamics of insulin secretion in obesity and diabetes. Int J
Obesity and Related Metabolic Disorders, 24 Suppl 2, S29-31.
Quinlan, P., Lane, J. and Aspinall, L. (1997). Effects of hot tea, coffee and water
ingestion on physiological responses and mood: the role of caffeine, water and
beverage type. Psychopharmacology (Berl), 134(2), 164-173.
Quinlan, P., Lane, J., Moore, K., Aspen, J., Rycroft, J., and O'Brien, D. (2000). The
acute physiological and mood effects of tea and coffee: the role of caffeine level.
Pharmacology Biochemistry and Behaviour, 66(1), 19-28.
Qutub, A., and Hunt, C. (2005). Glucose transport to the brain: a systems model.
Brain research reviews, 49(3), 595-617.
Ravona-Springer, R., Moshier, E., Schmeidler, J., Godbold, J., Akrivos, J., Rapp,
M., Beeri, M. (2012). Changes in glycemic control are associated with changes in
cognition in non-diabetic elderly. Journal of Alzheimers Disease, 30(2), 299-309.
Reissig, C., Strain, E., and Griffiths, R. (2009). Caffeinated energy drinks— a
growing problem. Drug and alcohol dependence, 99(1), 1-10.
Reyner, L. and Horne, J. (2002). Efficacy of a 'functional energy drink' in
288

counteracting driver sleepiness. Physiology and Behaviour, 75(3): 331-335.
Reznick, R., Zong, H., Li, J., Morino, K., Moore, I., Yu, H., and Shulman, G. (2007).
Aging-associated reductions in AMP-activated protein kinase activity and
mitochondrial biogenesis. Cell metabolism, 5(2), 151-156.
Riby, L., Marriott, A., Bullock, R., Hancock, J., Smallwood, J., and McLaughlin, J.
(2008). The effects of glucose ingestion and glucose regulation on memory
performance in older adults with mild cognitive impairment. European Journal of
Clinical Nutrition, 63(4), 566-571.
Riby, L., McLaughlin, J., and Riby, D. (2008). Lifestyle, glucose regulation and the
cognitive effects of glucose load in middle-aged adults. British Journal of Nutrition,
100(5), 1128-1134.
Rickard, N., Ng, K., and Gibbs, M. (1998). Further support for nitric oxide-
dependent memory processing in the day-old chick. Neurobiology of Learning and
Memory, 69(1), 79-86.
Rickard, N., Gibbs, M., and Ng, K. (1999). Inhibition of the endothelial isoform of
nitric oxide synthase impairs long-term memory formation in the chick. Learning
and Memory, 6(5), 458-466.
Robinson, L., Savani, S., Battram, D., McLaren, D., Sathasivam, P., and Graham,
T. (2004). Caffeine ingestion before an oral glucose tolerance test impairs blood
glucose management in men with type 2 diabetes. The Journal of Nutrition,
134(10), 2528-2533.
Rolandsson, O., Backestrom, A., Eriksson, S., Hallmans, G., and Nilsson, L. G.
(2008). Increased glucose levels are associated with episodic memory in
nondiabetic women. Diabetes, 57(2), 440-443.
289

Roy, D., Perreault, M., and Marette, A. (1998). Insulin stimulation of glucose
uptake in skeletal muscles and adipose tissues in vivo is NO dependent. American
Journal of Physiology-Endocrinology and Metabolism, 274(4), 692-699.
Ryan, C., and Geckle, M. (2000). Why is learning and memory dysfunction in Type
2 diabetes limited to older adults?. Diabetes/Metabolism Research and Reviews,
16(5), 308-315.
Ryden, L., and Mellbin, L. (2012). Glucose perturbations and cardiovascular risk:
Challenges and opportunities. Diabetes and Vascular Disease Research, 9(3),
170-176.
Salmeron, J., Ascherio, A., Rimm, E., Colditz, G., Spiegelman, D., Jenkins, D. J.
and Willett, W. (1997). Dietary fiber, glycemic load, and risk of NIDDM in men.
Diabetes care, 20(4), 545-550.
Scholey AB, Harper S, Kennedy DO. (2001). Cognitive demand and blood glucose.
Physiology and Behaviour. Jul;73(4):585-92.
Scholey, A., and Kennedy, D. (2004). Cognitive and physiological effects of an
“energy drink”: an evaluation of the whole drink and of glucose, caffeine and herbal
flavouring fractions. Psychopharmacology, 176(3-4), 320-330.
Schulz, E., Schuhmacher, S., and Munzel, T. (2009). When Metabolism Rules
Perfusion AMPK-Mediated Endothelial Nitric Oxide Synthase Activation.
Circulation Research, 104(4), 422-424.
Scott, R., Kritz-Silverstein, D., Barrett-Con nor, E., and Wiederholt, W. (1998). The
association of non-insulin-dependent diabetes mellitus and cognitive function in an
older cohort. Journal of the American Geriatrics Society, 46(10), 1217-1222.
Seidl, R., Peyrl, A., Nicham, R., and Hauser, E. (2000). A taurine and caffeine-
containing drink stimulates cognitive performance and well-being. Amino acids,
19(3-4), 635-642.
290

Seino, S., Shibasaki, T., and Minami, K. (2011). Dynamics of insulin secretion and
the clinical implications for obesity and diabetes. Journal of Clinical Investigations,
121(6), 2118-2125.
Shah, K., DeSilva, S., and Abbruscato, T. (2012). The Role of Glucose
Transporters in Brain Disease: Diabetes and Alzheimer’s Disease. International
Journal of Molecular Sciences, 13(10), 12629-12655.
Shearer, J., Fueger, P., Vorndick, B., Bracy, D., Rottman, J., Clanton, J., and
Wasserman, D. (2004). AMP kinase-induced skeletal muscle glucose but not long-
chain fatty acid uptake is dependent on nitric oxide. Diabetes, 53(6), 1429-1435.
Simpson, I., Carruthers, A., and Vannucci, S. (2007). Supply and demand in
cerebral energy metabolism: the role of nutrient transporters. Journal of Cerebral
Blood Flow and Metabolism, 27(11), 1766-1791.
Shemesh E, Rudich A, Harman-Boehm I, Cukierman-Yaffe T. (2012). Effect of
intranasal insulin on cognitive function: a systematic review. Journal of Clinical
Endocrinology and Metabolism , 97: 366-376.
Shi.mabukuro, M., Higa, N., Takasu, N., Tagawa, T., and Ueda, S. (2004). A single
dose of nateglinide improves postnchallenge glucose metabolism and endothelial
dysfunction in Type 2 diabetic patients. Diabetic Medicine, 21(9), 983-986.
Small, G., Silverman, D., Siddarth, P., Ercoli, L., Miller, K., Lavretsky, H., Phelps,
M. (2006). Effects of a 14-day healthy longevity lifestyle program on cognition and
brain function. Americal Journal of Geriatric Psychiatry, 14(6), 538-545.
Smit, H., Cotton, J., Hughes, S., and Rogers, P. (2004). Mood and cognitive
performance effects o f' energy" drink constituents: caffeine, glucose and
carbonation. Nutritional Neuroscience, 7(3), 127-139.
291

Smith, A., Kendrick, A., Maben, A., and Salmon, J. (1994). Effects of breakfast and
caffeine on cognitive performance, mood and cardiovascular functioning. Appetite,
22(1), 32-55.
Smith, A. (2002). Effects of caffeine on human behavior. Food and Chemical
Toxicology, 40(9), 1243-1255.
Smith. A., Sturgess, W,. and Gallager, J., (1999). Effects of a low dose of caffeine
given in different drinks on mood and performance. Human Psychopharmacology:
Clinical and Experimental, 14(7), 473-482.
Smith, B., Amanda, O., Mark, A., Heather, J., and Thom, W. (2004). Arousal and
Behavior: Biopsychological Effects of Caffeine. Coffee, Tea, Chocolate and the
Brain. N. Astrid. London, CRC. volume 2: 35-53.
Smith, M., Foster, J., (2008). Glucoregulatory and order effects on verbal episodic
memory in healthy adolescents after oral glucose administration. Biological
Psychology, 79,209-215.
Smith, M., and Foster, J. (2008). The impact of a high versus a low glycaemic
index breakfast cereal meal on verbal episodic memory in healthy adolescents.
Nutritional Neuroscience, 11(5), 219-227.
Sonntag, W., Eckman, D., Ingraham, J., and Riddle, D. (2007). Regulation of
cerebrovascular aging. Brain Aging: Models, Methods, and Mechanisms. R.
Riddle. London, CRC. 270-353.
Steinberg, H., Brechtel, G., Johnson, A., Fineberg, N., and Baron, A. (1994).
Insulin-mediated skeletal muscle vasodilation is nitric oxide dependent. A novel
action of insulin to increase nitric oxide release. Journal of Clinical Investigation,
94(3), 1172- 1179.
292

Sunram-Lea, S., Owen-Lynch, J., Robinson, S., Jones, E., and Hu, H. (2012). The
effect of energy drinks on cortisol levels, cognition and mood during a fire-fighting
exercise. Psychopharmacology, 219(1), 83-97.
Suzuki, K., Watanabe, K., Futami-Suda, S., Yano, H., Motoyama, M., Matsumura,
N. and Oba, K. (2012). The effects of postprandial glucose and insulin levels on
postprandial endothelial function in subjects with normal glucose tolerance.
Cardiovascular Diabetology, 11, 98 doi: 10.1186/1475-2840-11-98.
Taddei, S., Virdis, A., Ghiadoni, L., Salvetti, G., Bernini, G., Magagna, A., and
Salvetti, A. (2001). Age-related reduction of NO availability and oxidative stress in
humans. Hypertension, 38(2), 274-279.
Taib, M., Shariff, Z., Wesnes, K., Saad, H., Sariman, S. (2012). The effect of high
lactose-isomaltulose on cognitive performance of young children. A double blind
cross-over design study. Appetite, 58,81-87.
Taoka, T., Iwasaki, S., Uchida, H., Fukusumi, A., Nakagawa, H., Kichikawa, K.,
and Ohishi, H. (1998). Age correlation of the time lag in signal change on EPI-
fMRI. Journal of Computer assisted Tomography, 22(4), 514-517.
Taylor, L., and Rachman, S. (1988). The effects of blood sugar level changes on
cognitive function, affective state, and somatic symptoms. Journal of Behavioural
Medicine, 11(3), 279-291.
Thong, F., and Graham, T. (2002). Caffeine-induced impairment of glucose
tolerance is abolished by p-adrenergic receptor blockade in humans. Journal of
Applied Physiology, 92(6), 2347-2352.
Torregrossa, A., Aranke, M., and Bryan, N. (2011). Nitric oxide and geriatrics:
Implications in diagnostics and treatment of the elderly. Journal of Geriatric
Cardiology: JGC, 8(4), 230-242.
293

Toda, N., Imamura, T. and Okamura, T. (2010). Alteration of nitric oxide-mediated
blood flow regulation in diabetes mellitus. Pharmacology and therapeutics, 127(3),
189-209.
Toda, N., Ayajiki, K., and Okamura, T. (2009). Cerebral blood flow regulation by
nitric oxide: recent advances. Pharmacological Reviews, 61(1), 62-97.
Triplitt, C. (2012). Examining the mechanisms of glucose regulation. American
Journal Managed Care, 18(1), 4-10.
Uehara, Y.., Nipper, V., and McCall, A. (1997). Chronic insulin hypoglycemia
induces GLUT-3 protein in rat brain neurons. American Journal of Physiology-
Endocrinology and Metabolism, 272(4), 716-719.
van Can JG, Ijzerman TH, van Loon LJ, Brouns F, Blaak EE. (2009). Reduced
glycaemic and insulinaemic responses following isomaltulose ingestion:
implications for postprandial substrate use. British Journal of Nutrition. 102: 1408-
1413
van den Eynde, F., van Baelen, P., Portzky, M. and Audenaert, K. (2008). [The
effects of energy drinks on cognitive performance]. Tijdschr Psychiatrie. 50(5):
273-281.
van der Loo, B., Labugger, R., Skepper, J., Bachschmid, M., Kilo, J., Powell, J.,
and Luscher, T. (2000). Enhanced peroxynitrite formation is associated with
vascular aging. The Journal of Experimental Medicine, 192(12), 1731-1744.
Vanhanen, M., Koivisto, K., Kuusisto, J., Mykkanen, L., Helkala, E., Hanninen, T.,
and Laakso, M. (1998). Cognitive function in an elderly population with persistent
impaired glucose tolerance. Diabetes Care, 21(3), 398-402.
Vanhanen, M., Koivisto, K., Karjalainen, L., Helkala, E., Laakso, M., Soininen, H.,
and Riekkinen Sr, P. (1997). Risk for non-insulindependent diabetes in the
294

normoglycaemic elderly is associated with impaired cognitive function.
Neuroreport, 8(6), 1527-1530.
Verhaeghen, P., and Salthouse, T. (1997). Meta-analyses of age-cognition
relations in adulthood: estimates of linear and nonlinear age effects and structural
models. Psychological Bulleting, 122(3), 231-249.
Vicini, P., Avogaro, A., Spilker, M., Gallo, A., and Cobelli, C. (2002). Epinephrine
effects on insulin-glucose dynamics: the labeled IVGTT two-compartment minimal
model approach. American Journal of Physiology-Endocrinology and Metabolism,
283(1), 78-84.
Viollet, B., Horman, S., Leclerc, J., Lantier, L., Foretz, M., Billaud, M., and
Andreelli, F. (2010). AMPK inhibition in health and disease. Critical Reviews in
Biochemistry and Molecular Biology, 45(4), 276-295.
Wakisaka, M., Nagamachi, S., Inoue, K., Morotomi, Y., Nunoi, K., and Fujishima,
M. (1990). Reduced regional cerebral blood flow in aged noninsulin-dependent
diabetic patients with no history of cerebrovascular disease: Evaluation by single
photon emission computed tomography. Journal of Diabetic Complications, 4(4),
170-174.
Watson, J., and Kerr, D. (1999). The best defense against hypoglycemia is to
recognize it: is caffeine useful?. Diabetes Technology and Therapeutics, 1(2), 193-
200 .
Watson, J., Jenkins, E., Hamilton, P., Lunt, M., and Kerr, D. (2000). Influence of
caffeine on the frequency and perception of hypoglycemia in free-living patients
with type 1 diabetes. Diabetes Care, 23(4), 455-459.
Warburton, D., Bersellini, E. and Sweeney, E. (2001). An evaluation of a
caffeinated taurine drink on mood, memory and information processing in healthy
volunteers without caffeine abstinence. Psychopharmacology (Berl) 158(3), 322-
328.
295

Warren, R., and Frier, B. (2005). Hypoglycaemia and cognitive function. Diabetes
Obes Metab, 7(5), 493-503.
Weisova, P., Concannon, C., Devocelle, M., Prehn, J., and Ward, M. (2009).
Regulation of glucose transporter 3 surface expression by the AMP-activated
protein kinase mediates tolerance to glutamate excitation in neurons. The Journal
of Neuroscience, 29(9), 2997-3008.
Wesnes, K., Pincock, C., Richardson, D., Helm, G., and Hails, S. (2003). Breakfast
reduces declines in attention and memory over the morning in schoolchildren.
Appetite, 41(3), 329-331.
Wolever, T., and Bolognesi, C. (1996). Prediction of glucose and insulin responses
of normal subjects after consuming mixed meals varying in energy, protein, fat,
carbohydrate and glycemic index. The Journal of Nutrition, 126(11), 2807-2812.
Wolever, T., and Mehling, C. (2002). High-carbohydrate-low-glycaemic index
dietary advice improves glucose disposition index in subjects with impaired
glucose tolerance. British Journal of Nutrition, 87(5), 477-487.
World Health Organisation, (1999). Definition, Diagnosis and Classification of
Diabetes Mellitus and its Complications. World Health Organisation.
World Health Organization, (2006). Definition and Diagnosis of Diabetes and
Intermediate Hyperglycaemia. World Health Organisation.
Yaffe, K., Falvey, C., Hamilton, N., Schwartz, A., Simonsick, E., Satterfield, S.,
Harris, T. (2012). Diabetes, glucose control, and 9-year cognitive decline among
older adults without dementia. Arch Neurol, 69(9), 1170-1175. doi: 1183076
Zhang, J., Xie, Z., Dong, Y., Wang, S., Liu, C., and Zou, M. (2008). Identification of
nitric oxide as an endogenous activator of the AMP-activated protein kinase in
vascular endothelial cells. Journal of Biological Chemistry, 283(41), 27452-27461.
296

Zhao, W., Chen, H., Quon, M., and Alkon, D. (2004). Insulin and the insulin
receptor in experimental models of learning and memory. European Journal of
Pharmacology, 490(1-3), 71-81.
Zou, M., Kirkpatrick, S., Davis, B., Nelson, J., Wiles, W., Schlattner, U., and
Goldman, M. (2004). Activation of the AMP-activated protein kinase by the anti
diabetic drug metformin in vivo role of mitochondrial reactive nitrogen species.
Journal of Biological Chemistry, 279(42), 43940-43951.
297