Nutritional quality of Australian breakfast cereals. Are they improving?

Are Lower-Income Shoppers as Price Sensitive asHigher-Income Ones?:A Look at Breakfast Cereals
Eugene Jones; Wen S. Chern; and Barry K. Mustiful
Scanner data for breakfast cereals are used to estimate demand elasticities for six supermarket stores in two distinct socio-economic areas. Three stores are in low-income locations and three are in high-income locations. A time series cross-sectionmodel is estimated for five product categories across six cross sectionsover forty-twoweeks. Results show lower-incomeshoppers to have more elastic demands for four of the five product categories: private label cold cereals, the top ten brandsof cold cereals, all other brands of cold cereals, and hot cereals. Price is not statistically significant for a fitlh product cabgory, snack ce&als.
Introduction
Several studies have addressed the issue of whetherlower-income shoppers face food prices which arehigher than those faced by higher-income shoppers(Kunrethe~ MacDonald and Nelson; Narasimhan; andGerstner and Hess). Most frequently, these studieshave looked across fixed market baskets and focused onfactors such as store location, size, and type. Invari-ably these studies have concluded that prices in centralcity stores are higher than those in suburban stores;prices in smaller stores are higher than those in largerstores; and prices in independent stores are higher thanthose in chain stores. 1 Such price differentials have apronounced effect on lower-income shoppers becausea disproportionate number of lower-income peoplereside in central cities with large numbers of small andindependent stores. Factors in these price differentialsinclude differences in operating costs, economies ofscale, market power, breadth of products and services,search costs, and demand elasticities.
While the aforementioned studies are quiteinformative regarding price differences by store size,type and location, they are not very informative aboutthe behavior of different socioeconomic groups ofshoppers facing the same set of prices. This studyextends the research methodology on consumer shop-ping behavior by addressing the issue of whether, whenconfronted with uniform prices, lower-income shoppersshow higher, lower, or similar price elasticities ofdemand. More specifically, this study provides esti-
Eugene Jones, Wen S. Chem, and Barry K. Mustiful arewith the Department of Agricultural Economics, Ohio StateUniversity, Columbus, Ohio.
mates of price elasticities for two distinct socio-economic areas: one consisting of three stores inlower-income locations, and the other consisting ofthree stores in higher-income locations. All stores arein a single price zone. 2 While there are distinct differ-ences in income, education and other socioeconomicfactors by store location (Table 1), the supermarketchain providing the data for this study has not usedthese differences to develop a store-specific pricingstrategy. Instead, the chain has employcxl zone pricingas its competitive strategy. Since consumers areknown to shop within a narrowly defined geographicarea, it seems plausible to characterize shoppersaccording to the socioeconomic factors surrounding agiven store location (Cox and Foster).
Cereals are the focus of this study because oftheir high economic value ($7.7 billion in 1991) andtheir widespread use among households (Gibson;Weinstein). During the past twenty years, per capitaconsumption of breakfast cereals has risen by 45 per-cent, climbing from 10.3 pounds in 1970 to 15.0pounds in 1991. The development of health-orientedbran and oats-based cereals coupled with high levels ofpromotion are factors which have helped to spur thisgrowth in consumption (Best; Turcsik). Manufacturersissue coupons which are redeemed for up to 50 percentof cereal sales, and they offer extensive trade deals toretailers (McCallum). Additionally, considerable pro-motion is done through media advertising, From 1975to 1990, the advertising-sales ratio for cold cerealsincreased from 7.2 percent to 13.1 percent(LNA/Arbitron). These factors speak to the economicvalue of cereals and they help to define the researchimportance of cereal products.
February 941page 82 Journal of Food Distribution Research

(/i
I-CN00.
m
m00J
w
v)u-l 1-
1%
C-4
eim
0 .
m Gm m
00
(4m
i-i
w w0! 0!
w wm 0?m@a
Journal of Food Distribution Research

Demographic and Income Informationby Store Locations
Important demographic and income data for six storesseleeted from the Columbus (Ohio) metropolitan areaare shown in Table 1. This table represents a combi-nation of 1990 census data and store-level data bylocation. Census tract data are used to characterizestore locations because the supermarket chain could notprovide its market studies for store locations. Besides,the most detailed market studies conducted by the chainoeeurred during the deeision-making periods for storelocations. Recently released census data are far themost current and comprehensive.
Stores 1, 2 and 3 are located in higher-incomesuburban areas, but within close proximity of the cen-tral city of Columbus. The farthest distance betweenany two of the six stores is roughly 15 miles, orapproximately 25 minutes of travel time by car. Aver-age family income in the higher-income areas is morethan twice that in lower-income areas, Store sales inthe higher-income area average about 13 percent abovethose for the lower-income area. Cereal sales, as apercentage of store sales, are also highest for thehigher-income areas. For all stores, cereal sales aver-age just above three percent of store sales. Store-leveldata reflect the period of February 4, 1990 throughFebruary 16, 1991, However, cereal sales wereunavailable for one of the six stores during the 12weeks behveem July 22, 1990 and October 20, 1990.Forty-two weeks of comparable observations across allstores were available.
As shown in Table 1, store five of the lower-income stores would appear to be a higher-income storebaaed on average consumer purchases. However,census data confirm that this store is located in alower-income area and the unusually high purchasesper customer is undoubtedly due to its urbadmralbase. That is, the store is located on the fringe of arural community, and it draws shoppers from bothurban and rural areas. High purchases per customerfor this store, compared to the other lower-incomestores, suggest that rural residents make fewer shop-ping trips and larger purchases per trip than their urbancounterparts.
A very pronounced educational disparity isrevealed for the two-income areas. Given the sup-posedly positive relationship between incomekducationand coupon redemption, it might be postulated thatstores in the higher-income areas are likely to receivea greater proportion of coupons than their lower-income counterparts (Bawa and Shoemaker; Levedahl;Nielsen). Moreover, the mix of products purchasedshould vary considerable among the stores within thetwo-income areas if coupon availability reflects the
purchasing preferences of higher-income, higher-edu-cated consumers.
Data Description
A national supermarket chain with significant marketshares in the Columbus metropolitan area (more than25%) provided the cereal scanning data for this study.Each store carried approximately 175 different cerealproducts, or an average of 455 products when enumer-ated by brands, sizes and flavors. Weekly observationsran from Sunday through Saturday. No advertisingexpenditures were available, but the data did include acode indicating whether a product was promoted duringa given week. This accounted for media advertising,merchandising, price reductions, or some combinationof tsvo or more of these activities.
With 42 weeks of usable data on an average of455 products per store, approximately 19,110 dataentries are available per store. To make these dataentries manageable, cereal products are classified intoproduct groups. Five product groups are identified: 1)private label cold cereals; 2) top ten brands of coldcereals; 3) all other brands of cold cereals (OBRD); 4)instant hot cereals; and 5) snack-related cereals. Thetop ten brands represent those brands with the highestmarket shares as measured by dollar sales for 1989.For example, Cheerios was the leading brand with amarket share of 4.8 percent; Kellogg’s Frosted Flakeswas second with a market share of 4,6 percent; etc. Itshould be emphasized that Chex cereals, the seventhleading brand in 1989, includes many product varieties:Bran Chex, Corn Chex, Rice Chex, etc. Under thedelineated classification system, product distributionsfor the five groups are 4.0, 10.5, 38.0, 16.2 and 31.2pereent respectively. That is, private label cerealsconstituted 4.0 percent of cereal items sold, or roughly758 of the 19,110 items sold. This classification sys-tem, however, should not be confused with expendi-tures per product category or quantities (measured inounew) per product category.
Model Development and Estimation Procedures
Because this research focuses on the measurement ofprice elasticities for higher and lower-income shopperswith respect to space and time, a time series cross-section model is the most appropriate (Pindyck andRubinfeld). Alternative model specifications are possi-ble, but the error components model has been shown tobe the most robust (Fuller and Bat@e). The generalform of this model is:
February 941page 84 Journal of Food Distribution Research

v(1) ‘qr=~~l ‘W’. + ‘qr ~
9= 1,2,...,~; ~= 1,2,..., T
where N is the number of cross sections, and T is thelength of the time series for each cross section.
Six cross sections and 42 observations per crosssection are included in the specified model for thisstudy. Five equations are specified and estimated usingthe time series cross-section regression (TSCSREG)procedure in SAS. The equations and included vari-ables are specified as follows:
(2) Qw = f@h, pjh’s, P*, SDUMh, HOL, PAY,
TBXPM, PROMk, GRWE, Q~.1),
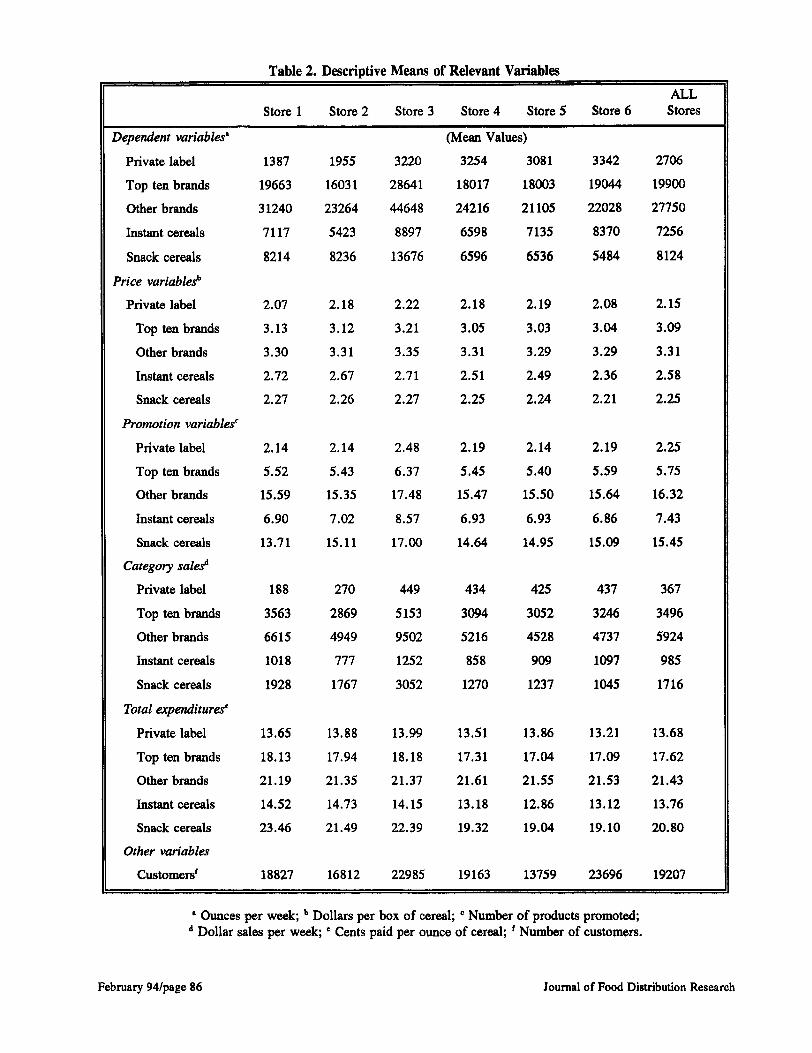
where Qti is total ounces of product group i for storekin week t, i = 1,...,5, k = 1,...,6, t = 1,...,42; Ptiis a weighted-average price of product group i for storekin week t; PJb’srepresent weighted-average prices forcompeting product groups for store k in week t; P* isidentical to PM for lower-income stores 3, 4, and 5, butO for all other stores (which is intended to capture priceelasticity differences for higher and lower-incomestores); SDUMM’S are zero-one dummy variablesintended to capture store differences; HOL is a zero-one variable for calendar holidays; PAY is a zero-onevariable measuring nearness to payday (PAY = 1 forweeks including the 1st or 15th of each month; Oother-wise); TEXPM represents total expenditures on cerealproducts for store kin week t (intended as a proxy forconsumer income); PROW reflects the number ofpromoted products within group i for store k duringweek t; GRWk is a trend variable for store k expressedfrom 1 to 42, intended to capture growth of cerealsales; and Qh.l is total ounces of product group i pur-chased in store k during the previous week. Descrip-tive statistics for prices, expenditures and promotionsare provided in Table 2.
Prices are determined by expressing each prod-uct aale as a ratio of all product sales within a givenproduct group. Specifically, weighted price for prod-uct group i in each time period is:
(3) Pi = xjwijpij, where Wti = (pij QiJ/( Xjpu QiJ
and j denotes the products in the same group. Becauseeach product group is a potential substitute for or com-plement with other product groups, all product groupsare included in each equation. Because of 12 weeks ofmissing observations in the middle of the data set, thefirst observation immediately following the missingtime period (twenty fifth observation) is omittcxi to
properly align current and lagged values of the depen-dent variables.
Because price elasticities of demand are theprimary focus of this analysis, each equation is speci-fied in its double logarithmic functional form to givedirect demand elasticities. Since previous studies haveindicated a link between demographics and cereal sales,it is hypothesized that cold cereal products will showmore price sensitivity in lower-income stores that thesesame products show in higher-income stores (Bawa andShoemakeC Wolfe). That is, demand for cold cerealsis likely to be more price inelastic in higher-incomeareas than it is in lower-income areas. Further, it ishypothesized that stores in lower-income areas willshow a stronger propensity toward the consumption ofprivate label and hot cereals than stores in higher-income areas. With many of the health-related branand oats-based cereals included in the “other brands”category, it is hypothesized that higher-income areaswill show a stronger propensity toward the consump-tion of these products.
Empirical Results
Tables 3, 4 and 5 provide the estimated results for thefive categories of breakfast cereals. Although priceelasticity differences are the focus of this analysis,results are shown for all variables. Statistically signifi-cant results are shown for most variables in four of thefive equations, with the snack cereal equation being anexception. Statistically significant differences arefound among the stores and own price is shown to havea negative and statistically significant impact on quan-tity purchased for all cereal categories except snackcereals. This latter category of cereals, consisting ofproducts such as Nutri-Grain Bars, Granola Bars, FruitRollups, etc., is likely to reflect impulse buying.
With respect to price elasticity differences forhigher- and lower-income shoppers, Table 3 showslower-income shoppers to have a price elasticity ofdemand for private label cereals more than twice thatof higher-income shoppers (-1.55 versus -.59). Con-siderable confidence can be placed in this price elasti-city difference for higher- and lower-income shoppersbecause the parameter estimate is statistically signifi-cant at the .01 level. These elasticity differences sug-gest that private label cereals undoubtedly represent alarge enough proportion of lower-income shoppers’total cereal purchases to make them quite cognizant ofprice changes. Indeed careful analyses of the datashow that private label cereals constitute 4.12 percentof cereal sales in lower-income stores as compared to2.09 percent in higher-income store-s. These higherexpenditure proportions for lower-income shopperschallenge some researchers’ argument that poorer
Journal of Food Distribution Research February 941page 85
. -w.. -. ---- . ~.. . w ..-—.- .,. ----- . . . . . - . . . . .
ALLStore 1 Store 2 Store 3 Store 4 Store 5 Store 6 Stores
Dependent variableti (Mean Values)
Private label 1387 1955 3220 3254 3081 3342 2706
Top ten brands 19663 16031 28641 18017 18003 19044 19900
Other brands 31240 23264 44648 24216 21105 22028 27750
Instant cereals 7117 5423 8897 6598 7135 8370 7256
Snack cereals 8214 8236 13676 6596 6536 5484 8124
Price variables
Private label 2.07 2.18 2.22 2.18 2.19 2,08 2.15
Top ten brands 3.13 3.12 3.21 3.05 3.03 3.04 3.09
Other brands 3.30 3.31 3.35 3.31 3.29 3.29 3.31
Instant cereals 2.72 2.67 2.71 2.51 2.49 2.36 2.58
Snack cereals 2.27 2,26 2.27 2.25 2.24 2.21 2.25
Promotion variables’
Private label 2,14 2.14 2.48 2.19 2.14 2.19 2.25
Top ten brands 5.52 5.43 6,37 5.45 5.40 5.59 5,75
Other brands 15.59 15.35 17.48 15.47 15.50 15.64 16.32
Jnstant cereals 6.90 7.02 8.57 6,93 6,93 6.86 7.43
Snack cereals 13.71 15.11 17.00 14.64 14.95 15.09 15.45
Category sale.+
Private label 188 270 449 434 425 437 367
Top ten brands 3563 2869 5153 3094 3052 3246 3496
Other brands 6615 4949 9502 5216 4528 4737 5924
Instant cereals 1018 777 1252 858 909 1097 985
Snack cereals 1928 1767 3052 1270 1237 1045 1716
Total tzrpenditurese
Private label 13.65 13.88 13.99 13.51 13.86 13.21 13.68
Top ten brands 18.13 17.94 18.18 17.31 17.04 17.09 17.62
Other brands 21.19 21.35 21.37 21.61 21.55 21.53 21.43
Instant cereals 14.52 14.73 14.15 13.18 12.86 13.12 13.76
Snack cereals 23.46 21.49 22.39 19.32 19.04 19.10 20.80
Other variables
Customersf 18827 16812 22985 19163 13759 23696 19207
‘ Ounces per week; b Dollars per box of cereal; “ Number of products promoted;d Dollar sales per week; ‘ Cents paid per ounce of cereal; f Number of customers.
February 941page 86 Journal of Food Distribution Research

Table 3. Empirical Results for Time Series Cross-Section Regression:Private Label and The Top Ten Brands
Private Label Cereals
Parameter StandardVariable Estimate Error T-RatioPrice Variabks
Private Label A@Private Label B&Top Ten BrandsOther BrandsInstant Cereals
Store VariablesStore 2Store 3store 4Store 5Store 6
Other VariabksPromotion PlabPaydayHolidayLagged Quantity PlabGrowthCereal Expenditures
Price VariabksTop Ten Brands A@Top Ten Brands B&Private LabelOther BrandsInstant Cereals
Store VariablesStore 2Store 3Store 4Store 5Store 6
Other VariabksPromotion TtenPaydayHolidayLagged Quantity TtenGrowthCereal Expenditures
-().5963**-0.9498*0.56463.0815*
-0.1532
0.5455*0.5068*1.7615*1.8123*1.7647*
-0.0004
0.01410.05660.0226
-0.04480.81 84*1.3076**
Top Ten Brands
-0.6996*-0.6698*-4).0166-0.10110.0134
-0.00630.0428**0.8172*0.8738*0.9033*
-0.00160.0396
-0.0193-0.00140.04030.9213*8.3033*
@ Indicates the price elasticity estimate for all stores.
0.27480.32240.40260.57380.2208
0.03920.04580.24770.24870.2403
0.00510.03200.04370.01420.03040.08300.7088
0.24540.15680.11310.38140.1166
0.01810.02190.18180.18230.1823
0.00170.03240.04320.01120.02740.04460.5137
& Indicates tbe difference between the price elasticity for lower income stores and* Indicates statistical significance at the .01 level.** Indicates statistical significance at the .10 level.
all
-2.1696-2.94611.40245.3700
-0.6936
13.926011.06727.10997.28717.3452
-0.07300.44221.29431.5897
-1.47409.86481.8448
-2.8507+,2712-0.1471-0.26500.1152
-0,34611.95834.49404.79464.9543
-0.94091.2220
-0.4471-0.12461.4702
20.642316.1633
Journal of Food Distribution Research February 94/page 87
shoppers are more inclined to purchase establishedbrands because they have more to lose from making amistake on unknown or little known brands.
For the top ten brands of cold cereals, lower-income shoppers are shown to have a price elasticity ofdemand which is almost twice the magnitude of that forhigher-income shoppem Indeed, just as indicated forprivate label cereals, lower-income shoppers are shownto have an elastic demand for the top ten brands ofcereals while higher-income shoppers are shown tohave an inelastic demand. This finding is particularlyrevealing because it shows a differential response evenwhen there is no reasonable substitute for the productcategory in question, as is the case for the top tenbrands. It suggests that lower-income shoppers areprice selective both within and among product catego-ries.
The own price elasticity for the reasonably largeclass of other brands of cereals shows, consistent withconsumer demand theory, a more elastic demand forboth higher- and lower-income shoppers. Higher-income shoppers are shown to have an elastic demandfor these products, but lower-income shoppers areshown to be even more price sensitive. These elasticitydifferences clearly support the notion that price is arelevant factor in guiding consumer buying decisions.Also, because many of the higher-priced products arewithin this product category and there are a dispropor-tionate number of coupons issued for higher-pricedproducts, these elasticities support the argumentadvanced by Bawa and Shoemaker that coupon-proneconsumers are less likely to be brand loyal.
As shown in Table 4, instant cereals show amore elastic demand than any other cereal category.Yet, despite the highly elastic demand shown forhigher-income shoppers, lower-income shoppers areshown to be even more price sensitive. Again, theseestimates are consistent with consumer demand theorywhich emphasizes the importance of income and pricesin guiding consumption decisions. The higher priceelasticities of demand for this product category, relativeto snack and cold cereals, could reflect the role ofconvenience in influencing consumption decisions. Hotcereals generally require some preparation time,thereby are perceived as less convenient than coldcereals. This product attribute deficiency of hot cerealsundoubtedly weakens the preference function of allconsumers, but the price elasticity estimates show thatlower-income consumers have a preference functionmore sensitive to product prices for this cereal cat-egory.
As shown in Table 5, own price is not a statisti-cally significant determinant of snack cereal purchases.As a snack product, it is likely that impulse plays alarger role than price in determining consumer pur-
chases. Moreover, many of the items included in thisproduct category, such as Nutri-Grain Bars, GranolaBars and Fruit Rollups, are not exclusively breakfastproducts. Therefore, they are likely to represent justone of a variety of snacks competing for a share of theconsumer snack dollar. Despite the insignificance ofprice as a determinant of consumer snack cereal pur-chases, Table 2 shows that lower-income consumerspurchase the lower-priced products within this productcategory (unit purchase price averages 19.15 cents perounce for lower-income shoppers as compared to 22.45cents for higher-income ones). Additionally, carefidanalysis of the data shows that lower-income shoppersspend a relatively smaller proportion of their cerealexpenditures on snack cereals. During the 42 weeks ofthis study period, snack cereals represented an averageof 11.21 percent of total cereal expenditures for lower-income shoppers, compared to 15.55 percent forhigher-income shoppers.
Summary and Conclusion
The objective of this study was to determine if higher-and lower-income shoppera display similar or dissimilarprice elasticities of demand for breakfast cereals whenconfronted with uniform prices. To accomplish thisobjective, a time series cross-section model was speci-fied and estimated for five product categories across sixcross sections and over 42 time periods (weeks). Theresults showed lower-income shoppera to have moreelastic demands for four of five product categories:private label cold cereals; the top ten brands of coldcereals; other branda of cold cereals; and hot cereals.Price was shown to be statistically insignificant for afifth product category, snack cereals.
The findings of this study suggest that lower-income shoppers make rational purchase decisions asdefined by consumer demand theory. That is, pur-chases for lower-income shoppers are guided by theirincome and product prices. With private label cereals,the findings do not support the argument advanced bysome researchers that lower-income shoppers, becauseof their desire to minimize risk, are reluctant to pur-chase lesser-known brands. These findings wouldsuggest that lower-income shoppers either find similarquality attributes across national and private labelbrands or they find the price differential to be of suffi-cient magnitude to more than compensate for anyquality differences.
The findings for this study also show that lower-income shoppers not only have higher price elasticitiesacross product categories, but they tend to purchase thelowest-priced products within a given product category.For example, within the top ten brands of cold cereals,lower-income shoppers paid an average of 17.15 cents
Februaxy 941page 88 Journal of Food Distribution Research

Table 4. Empirical Results for Time Series Cross-SectionRegression: Other lhands and Instant Cereals.
Other Brands
Parameter StandardVariable Estimate Error T-RatioPrice Variables
Other Brands A@Other Brands B&Private LabelTop Ten BrandsInstant Cereal
Store VariablesStore 2Store 3Store 4Store 5Store 6
Other VariablesPromotion ObrdPaydayHolidayLagged Quantity ObrdGrowthCereal ExpendituresConstant
Price VariablesInstant Cereals A@Instant Cereals B&Private LabelTop Ten BrandsOther Brands
Store VariablesStore 2Store 3store 4Store 5Store 6
Other VariablesPromotion InstPaydayHolidayLagged Quantity InstGrowthCereal ExpendituresConstant
-1.4850*-0.2440**0.09790.01530.1391**
-0.0620*-0.01690.2532**0.17590.1928
-0.0006-0.0441**0.00400.0117
-0.01791.0097*9.2472*
Instant Cereals
-2.3616*-0,4692**-1.0871*0.02512.8873*
-0.0376-0.1301*0.38470.5935*0.5142**
0.0052*-0.04380.03790.0051
-0.00191.0978*5.5507*
0.28550012010.07400.14280.0751
0.01150.01380.14670014710.1468
0.00050.02370.03130.00770.01930.02810.3583
0.22490.24900.22390.37790.6366
0.04020.04480.23920.23700.2289
0.00180.03600,05120,01510.03940.08810.7937
-5.2011-2.03091.32200.10701.8515
-5.3957-1.22701.72631.19591.3130
-1.2621-1.86140.12711.5200
-0.926235.893425.8063
-10.5024-1.8840-4.85550.06654.5355
-0.9350-2.90581.60832.50402.2464
2.9233-1,21640.73920.3400
-0.047712.46346.9938
63 Indicates the price elasticity estimate for all stores.& Indicates the difference beheen the price elasticity for lower income stores and all stores.* Indicates statistical significance at the .01 level.** Indicates statistical significance at the ,10 level.
Journal of Food Distribution Research February 941page 89

Table 5. Empirical Results for Time Series Cross-Section Regression:Snack Cereals.
Snack Cereals
Parameter StandardVariable Estimate Error T-Ratio
Price VariablesSnack Cereal A@Snack Cereal B&Private LabelTop Ten BrandsOther BrandsInstant Cereals
Store VariablesStore 2Store 3Store 4Store 5Store 6
Other VariablesPromotion BsnkPaydayHolidayLagged Quantity BsnkGrowthCereal ExpendituresConstant
-0.1941-0.17470.04260.0133
-0.17100.0933
0.2555*0.0493**0.15700.2238
0.0057
0.0018**-0.0392-0.0783**0.0257**
-0.0535**1. 1507*6.1863*
0.28560.22050.13520.25570.43440.1344
0.02050.02590.18750.18860.1870
0.00080.03400,04500.01270.02940.05040.5865
-0.6796-0.79190.31490.0519
-0.39370.6946
12.43651.90230.83731.18680.0307
2.2085-1.1538-1.73812.0330
-1.820622.815710.5481
@ Indicates the price elasticity estimate for all stores.
& Indicates the difference between the price elasticity for lower income stores and all stores.
* Indicates statistical signifkxuw at the .01 level.
** Indicates statistical significance at the .10 level.
February 941page 90 Journal of Food DistributionResearch

per ounce of purchase as compared to 18.08 cents perounce for higher-income shoppers. Additionally, eventhough price is not a statistically significant determinantof product purchases for snack cereals, lower-incomeshoppers paid an average of 19.15 cents per ounce ascompared to 22.45 cents per ounce for higher-incomeshoppers. In sum, lower-income shoppers are shownto be quite rational, showing higher price elasticities ofdemand and purchasing the least expensive productswithin a given product category.
Endnotea
1. Cotterill found independent grocery stores to havehigher prices than supermarket chain stores. However,within central cities, MacDonald and Nelson foundstatistically insignificant price differences for indepen-dents and chains.
2. Zone pricing is a type of geographic pricing inwhich all buyers within a given geographic area faceuniform prices.
References
Bawa, K. and R. W. Shoemaker. “The Coupon-ProneConsumen Some Findings Based on PurchaseBehavior Across Product Classes. ” Journal ofMarketing, 51(1987):99-110.
Best, D. “Breakfast Cereals: What Comes AfterFiber?” Prepared Foods New Products Annual19%2 159 (August 1990): 101-102.
Bureau of the Census. 1990 Census of Population andHousing: Census Tracts Data on CD-ROM.Columbus, Ohio, Standard Metropolitan Statisti-cal Area, U.S. Department of Commerce, 1992.
Capps, O., Jr. “Utilizing Scanner Data to EstimateRetail Demand Functions for Meat Products. ”American Journal of Agricultural Economics,71(1989): 750-760.
Capps, 0,, Jr., and R. Nayga, Jr. “Demand for FreshBeef Products in Supermarkets: A Trial withScanner Data. ” Agribusine.rs, 7(1991):241-251.
Carmen, H, F., and E. E. Figueroa. “An Analysis ofFactors Associated with Weekly Food StoreSales Variation. ” Agribusiness. 2(1986):375-390.
Cotterill, R. W. “Market Power in the Retail FoodJndustry: Evidence From Vermont. ” Review ofEconomics and Statistics. 68(1986):379-86.
Cox, C. and R. Foster. *What’s Ahead for the U. S.Food Processing Industry?: Discussion. ”American Journal of Agricultural Economics,67(1985):1 155-1157.
Dussere, S. Edible TV: Your Child and FoodCommercial. In Hearings by Senate SelectCommittee on Nutrition and Human Needs.Washington, D. C.: U.S. Government Printingoffice, 1977.
Fuller, W. A. and G. E. Battese. “Estimation ofLinear Models With Crossed-Error Structure, ”Journal of Econometrics, 2(1974):67-78.
Gerstner, E. and J. D. Hess. “Quantity Surcharges:Axe They Important in Choosing a ShoppingStrategy?” Journal of Consumer Affairs.18(1984):287-95.
Gibson, R, “Cereal Giants Battle over Market Share. ”l’he Wall Street Journal (December 16, 1991),Section B, column 3.
Hall, D. “Scanning Benefits Not Maximized.” Super-market Nws (February 8, 1988), p. 44.
Hams, B. F. Shared Monopoly and the Cereal Indus-try: An Empirical Investigation of the Effects ofthe FTC’s Antitrust Proposak. EastLansing,Michigan, 1979.
Holdren, B. R. IZe Structure of a Retail Market andthe Market Behavior of Retail Units. Prentice-Hall, Inc., Englewood Cliffs, New Jersey,1960,
Howell, J. ‘Potential Profitability and DecreastxlConsumer Welfare Through Manufacturers’Cents-Off Coupons. ” lhe Journal Of ConsumerA@airs, 25(1991):165-84.
Jourdan, D. K. “Elasticity Estimates for IndividualRetail Beef Cuts Using Electronic ScannerData. w M.S. Thesis, Texas A&M University,August, 1981.
Kunreuther, H. “Why the Poor May Pay More forFood: Theoretical and Empirical Evidence. ”Journal of Business, 46(1973):368-80.
Journal of Food Distribution Research February 941page91

LNA/Arbitron. Cluss/Brand $. LNAIArbitron Pub-lishers Information Bureau, Inc., New York,Annual Series, 1972-92.
Lewdahl, J. W. “Coupon Redeemers: Are TheyBetter Shoppers?” lhe Journal of ConsumerAffairs, 22(1988):264-283.
MacDonald, J. M. and P. E. Nelson, Jr. “Do thePoor Still Pay More? Food Price Variations inLarge Metropolitan Areas. ” Journal of UrbanEconomics, 30(1991):344-359.
Margulis, R. A. “Share Race Heats Up in the ColdCereal Market. ” U.S.Distribution Journal,216(Dwember 1989):15.
McCallum, Matt. ‘Why Are Cereal Prices Rising?Batde Creek Enquirer, June 28, 1992, p. lD.
McLaughlin, E. and W. Lesser. “Experimental PriceVariability and Consumer Response: TrackingPotato Sales with Scanners. ” AgriculturalEconomics Stafl Paper, No. 86-28, CornellUniversity, September, 1986.
Naraaimhan, C. “Pricing Alternative Package Sizes:An Illustration of Nonlinear Pricing. ” WorkingPaper, Graduate School of Business, Universityof Chicago, 1983.
Nielsen, A. C. Coupons, The Consumer Speakr Out.A. C. Nielsen Company, Northbrook, Illinois,1980.
Pindyck, R. R. and D. O. Rubinfeld. EconometricModeb andEconomicForecasts. McGraw-Hill,New York, New York, 1981.
Turcsik, R. “Store Prices For Cereal May Climb. ”Supermarket News, (January 18, 1993), pp. 29and 40,
Ward, R. W., J. Chang and S. Thompson.“Commodity Advertising: Theoretical IssuesRelating to Generic and Brand Promotions. ”Agribusiness: An International Journal,1(1985):270-76.
Weinstein, S. “The 1991 Supermarket Sales Manual. ”July, 1991, pp. 50-53.
Wolfe, M. J. “New Way to Use Scanner Data andDemographics Aids Local Marketers. ”Marketing News. 23(September 11, 1989):8.
February 941page 92 Journal of Food Distribution Research
Copyright © 2022 FDOKUMEN