Influence of Water Activity and System Mobility on Peroxidase Activity in Maltodextrin Solutions
7
SPECIAL ISSUE ARTICLE Influence of Water Activity and System Mobility on Peroxidase Activity in Maltodextrin Solutions Lilia Neri & Paola Pittia & Gianni Bertolo & Danila Torreggiani & Giampiero Sacchetti Received: 9 September 2010 / Accepted: 17 March 2011 / Published online: 6 April 2011 # Springer Science+Business Media, LLC 2011 Abstract Maltodextrins influenced the enzymatic activity in aqueous solutions by affecting the water activity (a w ) and mobility as described by viscosity and T’g. In diluted solutions, viscosity being equal, (1) maltodextrin with dextrose equivalents (DE) of 33 was more effective than glucose in limiting horseradish peroxidase (HRP) activity; (2) an increase in the maltodextrin chain length from DE 33 to DE 8.7 did not further limited enzymatic activity; (3) the maltodextrin with the highest chain length (DE 2.5) determined the highest enzyme inhibition. In general, the increase of molecular weight negatively affected the HRP activity by increasing the viscosity and T’g (decreasing molecular mobility) but it positively affected the a w and, in some cases, this compensated the HRP activity inhibition. In concentrated solutions (apparent viscosity ≈ 40 mPa s) the HRP activity decreased with the increase of the maltodextrin molecular weight, and it showed a dependence on T’g which could be described by a William, Landel and Ferry (WLF)-type equation. On the contrary, in the solution added with the maltodextrin with the highest chain length (DE 2.5) the HRP activity was much higher than that predicted by the WLF-type equation. The maltodextrin with DE 2.5 contains intact starch fragments and in water forms a suspension. In such a discontinuous system, the viscosity in the vicinity of the protein is lower than the bulk viscosity, and thus, the enzyme activity is higher than expected. Moreover, since T’g is a property of the soluble phase, it does not explain the mobility in discontinuous systems. Keywords Enzyme activity . Horseradish peroxidase . Glucose . Maltodextrin . Molecular weight . Water activity . Viscosity . Glass transition temperature Introduction Water represents one of the most critical components in foods because both water amount and availability affect several physico-chemical properties of food systems with effects on their chemical and enzymatic stability. 1 Water availability in foods has been often described by water activity (a w ), whereby water ‘freedom’ in a system is expressed in terms of relative water vapour pressure. 2 Water activity affects the rate of many chemical reactions and enzymatic processes which occur in food systems as described by the ‘food stability map’, 3 which is widely used for food quality control and shelf life prediction. The rate of enzymatic reactions is influenced by water activity; however, in studies carried out on dry solid foods, in which a w was modulated by water sorption, an a w increase always resulted in the enhancement of enzymatic activity, whilst in studies carried out on liquid models, in which a w was modulated by adding solutes, the enzymatic activity was not strictly dependent on a w. 4 – 8 This happens because the lowering of water activity by solute addition affects both the water content of the system and the soluble phase composition. The inhibition of enzymatic activity that occurs in concentrated food systems has been explained in terms of This work was presented in part at the International Conference: Frontiers in Water Biophysics, 23–26 May 2010, Trieste, Italy. L. Neri : P. Pittia : G. Sacchetti (*) Department of Food Science, University of Teramo, Via C.R. Lerici 1 Mosciano S. Angelo, 64023 Teramo, Italy e-mail: [email protected] G. Bertolo : D. Torreggiani CRA, Via Giacomo Venezian 26, 20133 Milan, Italy Food Biophysics (2011) 6:281–287 DOI 10.1007/s11483-011-9218-z
Transcript of Influence of Water Activity and System Mobility on Peroxidase Activity in Maltodextrin Solutions

SPECIAL ISSUE ARTICLE
Influence of Water Activity and System Mobilityon Peroxidase Activity in Maltodextrin Solutions
Lilia Neri & Paola Pittia & Gianni Bertolo &
Danila Torreggiani & Giampiero Sacchetti
Received: 9 September 2010 /Accepted: 17 March 2011 /Published online: 6 April 2011# Springer Science+Business Media, LLC 2011
Abstract Maltodextrins influenced the enzymatic activityin aqueous solutions by affecting the water activity (aw) andmobility as described by viscosity and T’g. In dilutedsolutions, viscosity being equal, (1) maltodextrin withdextrose equivalents (DE) of 33 was more effective thanglucose in limiting horseradish peroxidase (HRP) activity;(2) an increase in the maltodextrin chain length from DE 33to DE 8.7 did not further limited enzymatic activity; (3) themaltodextrin with the highest chain length (DE 2.5)determined the highest enzyme inhibition. In general, theincrease of molecular weight negatively affected the HRPactivity by increasing the viscosity and T’g (decreasingmolecular mobility) but it positively affected the aw and, insome cases, this compensated the HRP activity inhibition.In concentrated solutions (apparent viscosity!40 mPa s) theHRP activity decreased with the increase of the maltodextrinmolecular weight, and it showed a dependence on T’gwhich could be described by a William, Landel and Ferry(WLF)-type equation. On the contrary, in the solutionadded with the maltodextrin with the highest chain length(DE 2.5) the HRP activity was much higher than thatpredicted by the WLF-type equation. The maltodextrin withDE 2.5 contains intact starch fragments and in water forms asuspension. In such a discontinuous system, the viscosity in
the vicinity of the protein is lower than the bulk viscosity,and thus, the enzyme activity is higher than expected.Moreover, since T’g is a property of the soluble phase, itdoes not explain the mobility in discontinuous systems.
Keywords Enzyme activity . Horseradish peroxidase .
Glucose .Maltodextrin .Molecular weight .Water activity .
Viscosity . Glass transition temperature
Introduction
Water represents one of the most critical components infoods because both water amount and availability affectseveral physico-chemical properties of food systems witheffects on their chemical and enzymatic stability.1
Water availability in foods has been often described bywater activity (aw), whereby water ‘freedom’ in a system isexpressed in terms of relative water vapour pressure.2 Wateractivity affects the rate of many chemical reactions andenzymatic processes which occur in food systems asdescribed by the ‘food stability map’,3 which is widelyused for food quality control and shelf life prediction.
The rate of enzymatic reactions is influenced by wateractivity; however, in studies carried out on dry solid foods,in which aw was modulated by water sorption, an awincrease always resulted in the enhancement of enzymaticactivity, whilst in studies carried out on liquid models, inwhich aw was modulated by adding solutes, the enzymaticactivity was not strictly dependent on aw.
4–8 This happensbecause the lowering of water activity by solute additionaffects both the water content of the system and the solublephase composition.
The inhibition of enzymatic activity that occurs inconcentrated food systems has been explained in terms of
This work was presented in part at the International Conference:Frontiers in Water Biophysics, 23–26 May 2010, Trieste, Italy.
L. Neri : P. Pittia :G. Sacchetti (*)Department of Food Science, University of Teramo,Via C.R. Lerici 1 Mosciano S. Angelo,64023 Teramo, Italye-mail: [email protected]
G. Bertolo :D. TorreggianiCRA, Via Giacomo Venezian 26,20133 Milan, Italy
Food Biophysics (2011) 6:281–287DOI 10.1007/s11483-011-9218-z
molecular mobility since in such systems the rate ofchemical reactions may become diffusion limited; in thiscase, the ability for reacting molecules to diffuse towardseach other, rather than the activation energy of the activatedcomplex, is the rate limiting factor.9
–13
Enzymatic reactions are mainly controlled by diffusionin high viscosity aqueous solutions, and the concentrationof co-solutes was proven to influence the catalysis viachange in the physical properties of the system.9,14
On this basis, it is evident that water activity is not theonly factor that influences the enzymatic activity in lowmoisture conditions, but other physical parameters, such asviscosity and glass transition temperature (Tg), whichscales the molecular mobility within a system, should betaken into account.1,13
The most common correlation between viscosity andmolecular mobility of a solute is provided by the Stokesrelationship, where solute translational diffusion (D) isidentified. The extension of the reaction rate concepts tocoupling protein conformational dynamics and solventmobility led to the early Kramers’ theory.15 The exactapplication of this theory has been perhaps abused over theyears inasmuch bulk macroviscosity and local microviscosityare not necessarily equal especially when the solvent is notcontinuous and its motion may not be assumed infinitely fastcompared to that of the solute.14,16,17
At very high viscosities, protein dynamics are oftendiscussed in terms of Tg1,11
–14,18,19 which, in an aqueoussystem, corresponds to the temperature at which thesupercooled liquid loses its translational mobility and themolecules become ‘frozen’ and may exhibit only rotationalmotions and vibrations. Below Tg, chemical and biologicalreaction are retained to be impeded whilst above Tg,molecules become mobile and diffusion-limited reactionscould occur.20,21
Even if the complete inhibition of enzyme activity has notalways been achieved below Tg,22,23 Tg dictated mobilityseems to influence the rate of enzymatic reactions.23,24 Thus,the William–Landel–Ferry (WLF) equation25 which accuratelydescribes viscosity changes due to the temperature shiftbetween Tg and Tg+100 °C has been used to describe thechemical and enzymatic activity changes above Tg in systemsat constant composition. The enzyme activity showed a WLF-type exponential relation with T–Tg18,26 or T–T’g11,12,26 withT’g being the Tg of the maximally freeze-concentratedsolution.
Many authors1,27 suggested that reactant mobility anddiffusion within a matrix could be related to both solventcharacteristics, described by aw, and system mobility interms of Tg and viscosity. However, the studies on theeffect of water activity and molecular mobility on enzymeactivity are still scarce, and the individual effect of thesevariables has not been disclosed. This is because the effect
of system mobility on enzymatic activity has been studiedeither in supercooled systems with an equilibrium icephase,11,12,18 where the water activity is solely determinedby the storage temperature, or in highly concentratedsystems above Tg,13,21
–23,28 where the water content hasbeen varied and in the latter experimental condition aw andTg show a negative relationship among them.
In the food field, the study of the enzymatic activity inconcentrated solutions is of a particular interest for productslike non-pasteurized sauces or fermented products wherethe enzymes are still active. Previous studies showed thatboth water activity and T’g influenced enzymatic activity inconcentrated carbohydrate solutions, and that in complexsystems, a water activity lowering reached through soluteaddition could even result in an increase of enzymaticactivity when it caused a T’g decrease.29
The aim of this study was to investigate the effect ofwater activity, bulk viscosity and T’g on the activity ofhorseradish peroxidase (HRP) in buffered concentratedsolutions of maltodextrins. Maltodextrins were chosen asbeing common thickening agents in the food industry, andperoxidase was chosen as the target enzyme since it occursnaturally in nearly all plants and animals and, due to itsnonspecific action, shows a detrimental effect on manybiological systems and foods, where it is amongst the maincauses of off-colours and off-flavours formation.30
–32
Materials and Methods
Materials
Potassiumphosphate, glucose (analytical grade) and horseradishperoxidase were purchased from Sigma (Steinheim, Germany).Maltodextrins with dextrose equivalents (DE) of 2.5 and 7.5–9and with average weighed molecular weights (MW ) of 243,500and 30,000 were purchased from Cargill (Milan, Italy).Maltodextrins with DE of 17, 21 and 33 and MW of 9,000,6,300 and 2,300, respectively were purchased from Roquette(Paris, France).
Determination of Amylose
Amylose content of maltodextrin was estimated from thecolorimetric measurement of starch–iodine complexesformed in aqueous suspension of starch.33 Samples (2 g)were homogenized with deionised water (100 ml) on avortex shaker for 1 min, then duplicate aliquots (1 ml) werediluted with water to 10 ml; one was treated with iodinesolution (0.1 ml) containing potassium iodide (4 g) andiodine (1 g) in 100 ml of distilled water and the other wasused as the blank solution. Absorbance was measuredbetween 400 and 700 nm by a Perkin Elmer (Boston, MA)
282 Food Biophysics (2011) 6:281–287
Lambda Bio 20 spectrophotometer. The absorbance valueswere maintained below 1.2 by diluting the samples, 1:10.
Solution Preparation
All the solutions were prepared using 0.1 M potassiumphosphate buffer (pH 6.5). Glucose and maltodextrins wereadded to the phosphate buffer solutions in increasingamounts (Table 1) until a maximum viscosity of 32.0±1.610"6 m2s"1 (!40 mPa s) was reached.
The systems were prepared at 25 °C. When heating wasnecessary for solubilization, the solutions were reweighed, andthe amount of evaporated water was re-added.34 Preheatedsolutions were equilibrated to 25 °C before the analysis.
The pH of the solution was measured by a pH metre(MP220, Mettler Toledo International Inc., Zurich, CH).
The turbidity of the solutions was tested by a turbidimeter(model 6035, Jenway Ltd., London, UK) and expressed asnephelometric turbidity units.
Peroxidase Assay
Peroxidase activity was tested according to Morales-Blancaset al.35 with slight modifications. The HRP substrate was dailyprepared by mixing 0.1 ml of 99.5% guaiacol, 0.1 ml of 30%
hydrogen peroxide and 99.8 ml of 0.1 M potassium phosphatebuffer (pH 6.5). When the HRP activity in different modelsystems had to be tested, the phosphate buffered solutions atdifferent concentrations (Table 1) of glucose and maltodextrinwere used to prepare the HRP substrate.
The enzymatic activity was evaluated by adding 120 μlof phosphate buffer diluted horseradish peroxidase to3.48 ml of substrate solution in 10-mm path length glasscuvettes. The solution was mixed with a vortex for 3 s andby overturning the cuvette three times. The HRP activitywas measured at 25 ° C by monitoring the increase inabsorbance at 470 nm using a Perkin Elmer (Boston, MA)Lambda Bio 20 spectrophotometer. The reaction rate wascomputed from the slope (ΔA per minute) of the initiallinear portion of the plot of absorbance vs time. A blankwas prepared with 120 μl of phosphate buffer and 3.48 mlof HRP substrate solution. The relative enzymatic activitywas calculated as A/A0!100, where A is the enzymaticactivity of the model systems and A0 is the enzymaticactivity in the buffer solution.
Water Activity
Water activity was measured at 25 °C using a dew pointhygrometer AquaLab CX 2 (Aqualab Scientific Pty Ltd.,
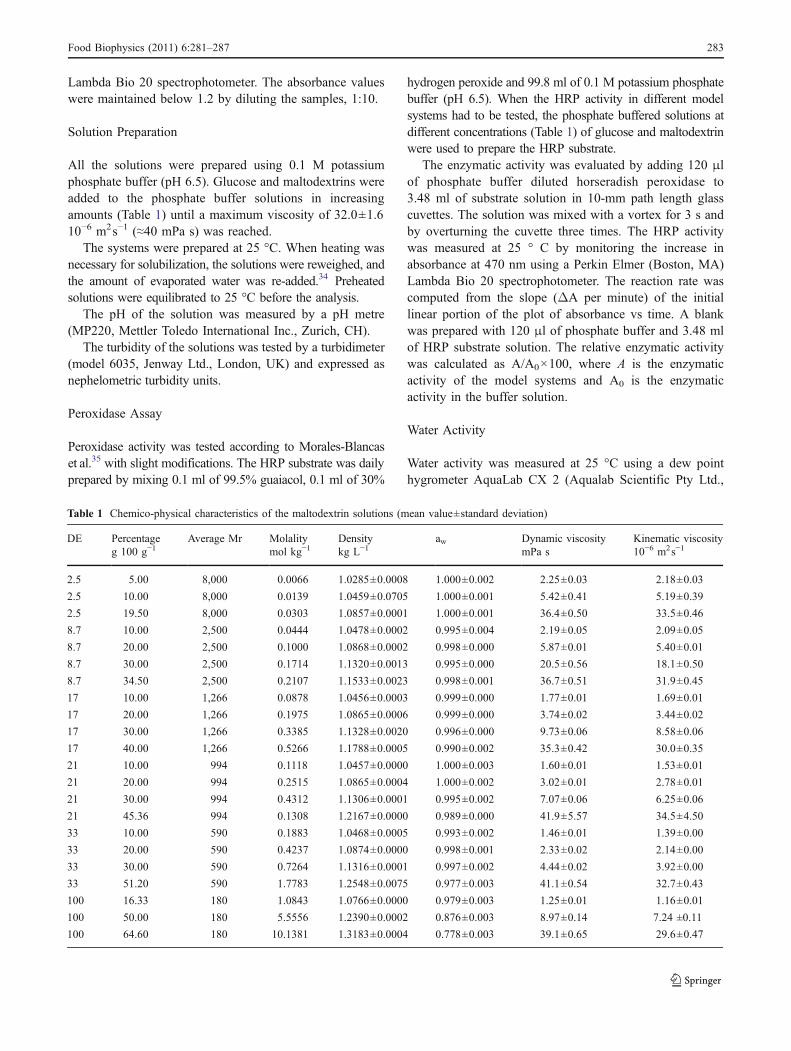
Table 1 Chemico-physical characteristics of the maltodextrin solutions (mean value±standard deviation)
DE Percentage Average Mr Molality Density aw Dynamic viscosity Kinematic viscosityg 100 g"1 mol kg"1 kg L"1 mPa s 10"6 m2s"1
2.5 5.00 8,000 0.0066 1.0285±0.0008 1.000±0.002 2.25±0.03 2.18±0.03
2.5 10.00 8,000 0.0139 1.0459±0.0705 1.000±0.001 5.42±0.41 5.19±0.39
2.5 19.50 8,000 0.0303 1.0857±0.0001 1.000±0.001 36.4±0.50 33.5±0.46
8.7 10.00 2,500 0.0444 1.0478±0.0002 0.995±0.004 2.19±0.05 2.09±0.05
8.7 20.00 2,500 0.1000 1.0868±0.0002 0.998±0.000 5.87±0.01 5.40±0.01
8.7 30.00 2,500 0.1714 1.1320±0.0013 0.995±0.000 20.5±0.56 18.1±0.50
8.7 34.50 2,500 0.2107 1.1533±0.0023 0.998±0.001 36.7±0.51 31.9±0.45
17 10.00 1,266 0.0878 1.0456±0.0003 0.999±0.000 1.77±0.01 1.69±0.01
17 20.00 1,266 0.1975 1.0865±0.0006 0.999±0.000 3.74±0.02 3.44±0.02
17 30.00 1,266 0.3385 1.1328±0.0020 0.996±0.000 9.73±0.06 8.58±0.06
17 40.00 1,266 0.5266 1.1788±0.0005 0.990±0.002 35.3±0.42 30.0±0.35
21 10.00 994 0.1118 1.0457±0.0000 1.000±0.003 1.60±0.01 1.53±0.01
21 20.00 994 0.2515 1.0865±0.0004 1.000±0.002 3.02±0.01 2.78±0.01
21 30.00 994 0.4312 1.1306±0.0001 0.995±0.002 7.07±0.06 6.25±0.06
21 45.36 994 0.1308 1.2167±0.0000 0.989±0.000 41.9±5.57 34.5±4.50
33 10.00 590 0.1883 1.0468±0.0005 0.993±0.002 1.46±0.01 1.39±0.00
33 20.00 590 0.4237 1.0874±0.0000 0.998±0.001 2.33±0.02 2.14±0.00
33 30.00 590 0.7264 1.1316±0.0001 0.997±0.002 4.44±0.02 3.92±0.00
33 51.20 590 1.7783 1.2548±0.0075 0.977±0.003 41.1±0.54 32.7±0.43
100 16.33 180 1.0843 1.0766±0.0000 0.979±0.003 1.25±0.01 1.16±0.01
100 50.00 180 5.5556 1.2390±0.0002 0.876±0.003 8.97±0.14 7.24 ±0.11
100 64.60 180 10.1381 1.3183±0.0004 0.778±0.003 39.1±0.65 29.6±0.47
Food Biophysics (2011) 6:281–287 283

Castle Hill, NSW). Calibration with different saturated saltsolutions having different equilibrium relative humidity wasperformed prior to analysis.
Viscosity
Viscosity was measured at 25 °C using a Haake (Karlsruhe,Germany) Thermo type C falling ball viscometer. Themeasurements were carried out using two boron silica glassballs with a density of 2.221 and 2.224 gcm"3 and k valuesof 0.00695 and 0.0812 mPa scm3 g"1s"1, respectively.
The apparent dynamic viscosity (millipascal second) wasmeasured using the following equation:
h ! k r1 " r2# $ % t #1$
where k=ball constant in millipascal second cube centimetreper gram per second; !1=density of the ball in gram per cubecentimetre; !2=density of the liquid to be measured at themeasuring temperature in gram per cube centimetre;t=falling time of the ball in seconds.
The density of the solutions was measured at 25 °C byusing a Gibertini (Milan, Italy) hydrostatic balance. Thekinematic viscosity was calculated as the viscosity todensity ratio.
Differential Scanning Calorimetry
A Perkin Elmer (Boston, MA) differential scanningcalorimetry DSC-6 was used for the thermal analyses. Thecooling and heating rates were 10 °C min"1. Thermaltreatments were performed to obtain maximally freeze-concentrated samples; in particular, after cooling to "100 °Cthe samples were heated up to a temperature just above theglass transition of the unfrozen phase and, after 10 min,cooled again to "100 °C. The second scan up to 30 °C wasconsidered to correspond to a stabilised sample.36 Due to thethermogram complexity, the temperatures of all the thermalevents were taken into account. There is no agreement as tothe precise definition of T’g value, which could characterizethe glass transition of the maximally freeze-concentratedfraction because it appears as a two-step transition in DSCanalysis, particularly for sugar-rich systems. Therefore, threetemperatures were used, the onset temperature Tg0 and themiddle point of each step Tg1 and Tg2. In the present study,only the Tg2 was reported since it represents a generally usedtemperature to define T’g.37
Statistical Analyses
All analyses were performed in duplicate on three experimentalrepetitions. Data were reported as means and standarddeviations. Linear and non-linear regression analyseswere carried out on data, and the goodness of fit was
checked by the determination coefficient R2. Non-linearregression was used to calculate power law equations.Statistical analyses were conducted using the Statistica forWindows (Statsoft, Tulsa, OK) package.
Results and Discussion
Concentrated aqueous solutions were obtained using glu-cose and maltodextrins with different average molecularweight (Mr) (Table 1). Glucose (DE 100) was chosen sinceit is the monomeric unit whilst a maltodextrin with DE 2.5and a molecular weight of 8,000 was used as the limitmaltodextrin. Maltodextrins are starch hydrolyzates charac-terized by a wide distribution of molecular weights, thus,since the maltodextrin with the lowest DE presented ahighly heterogeneous molecular weight distribution (highratio between MW and average Mr), the presence of intactamylose or amylopectin structures was investigated bymeans of colorimetric analysis (Figure 1).
The absorbance spectrum of maltodextrin with DE 2.5showed the typical pattern of starch structure with amaximum peak at 565 nm between the maximum absorbancepeaks of amylopectin (550 nm) and amylose (600 nm),33
whilst the other maltodextrins did not show any maximum ofabsorbance in this range of wavelengths. The maltodextrinwith DE of 2.5 contained large intact starch fragmentswith preserved native amylose and amylopectin structures,thus the solutions obtained with this maltodextrin shouldnot be considered as ideal solutions but physical dispersions(suspensions) of partially crystalline macromoleculesin water.
The concentration of solutes in the buffered solutionswas modulated by the addition of glucose and maltodextrinso as to reach the viscosity value of about 40 mPa s(Table 1). This limiting value was chosen in order tooperate in all cases with solutions (or suspensions) whichwere stable along all the time of analysis (stability waschecked by turbidimetric analysis).
Fig. 1 Absorbance spectra of glucose and maltodextrins after areaction with an iodine–potassium iodide solution
284 Food Biophysics (2011) 6:281–287
Glucose was the smallest among the tested solutes andthe strongest osmotic agent, thus its addition to buffersolution lowered the aw and determined an increase of thesystem viscosity (Table 1) as well as the T’g of the bufferwhich was below the instrumental temperature limit("100 °C) (Table 2).
In this study, the T’g parameter was used instead of Tgbecause the latter is correlated to the water content, whichin turn affects both the aw and viscosity of the solution,whilst T’g is independent of viscosity since it is exclusivelyrelated to the physical characteristics (mostly the molecularweight) of the solute.20,34 The T’g parameter could thusenable the investigation of specific solute effects on enzymekinetics in systems with the same viscosity.37 In this study,T’g was measured only on the most concentrated solutionssince it is dependent only on the type of solute and not onits concentration.20,29,34
The addition of maltodextrin determined an exponentialincrease of the system viscosity and increased the T’g ofthe system by only slightly affecting its water activity(Tables 1 and 2) and, in particular, the addition ofmaltodextrin with DE of 2.5 dramatically shifted the T’gvalue to "4.2 °C.
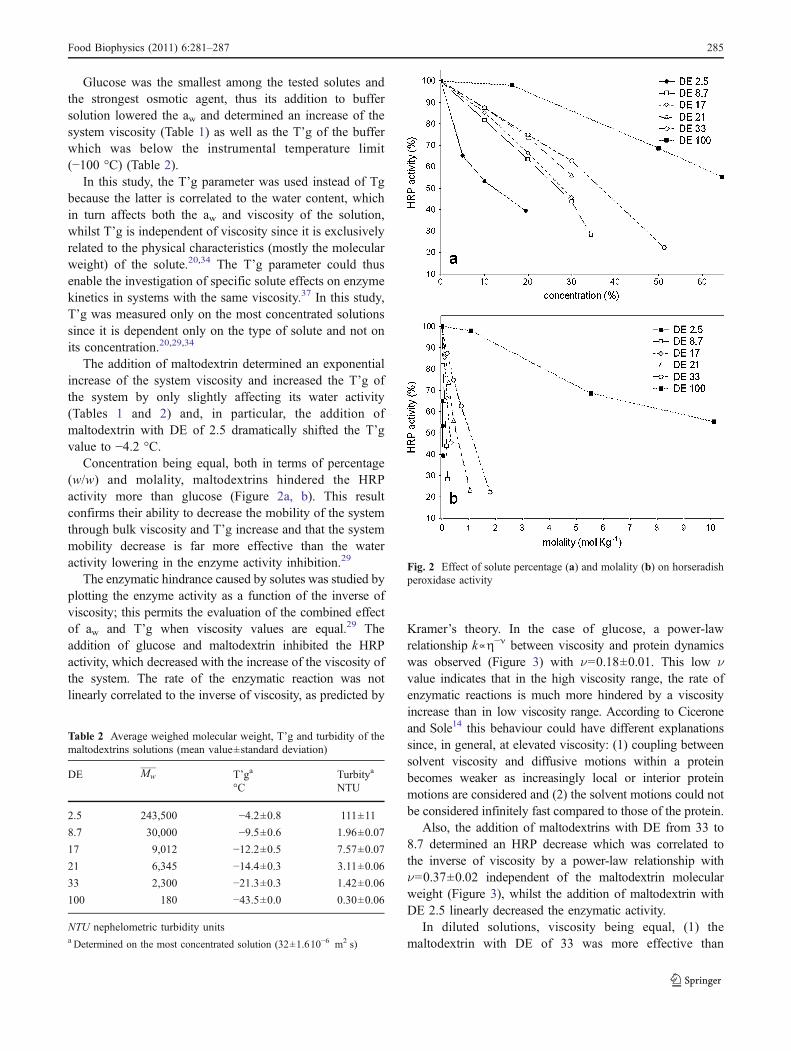
Concentration being equal, both in terms of percentage(w/w) and molality, maltodextrins hindered the HRPactivity more than glucose (Figure 2a, b). This resultconfirms their ability to decrease the mobility of the systemthrough bulk viscosity and T’g increase and that the systemmobility decrease is far more effective than the wateractivity lowering in the enzyme activity inhibition.29
The enzymatic hindrance caused by solutes was studied byplotting the enzyme activity as a function of the inverse ofviscosity; this permits the evaluation of the combined effectof aw and T’g when viscosity values are equal.29 Theaddition of glucose and maltodextrin inhibited the HRPactivity, which decreased with the increase of the viscosity ofthe system. The rate of the enzymatic reaction was notlinearly correlated to the inverse of viscosity, as predicted by
Kramer’s theory. In the case of glucose, a power-lawrelationship k#η"ν between viscosity and protein dynamicswas observed (Figure 3) with "=0.18±0.01. This low "value indicates that in the high viscosity range, the rate ofenzymatic reactions is much more hindered by a viscosityincrease than in low viscosity range. According to Ciceroneand Sole14 this behaviour could have different explanationssince, in general, at elevated viscosity: (1) coupling betweensolvent viscosity and diffusive motions within a proteinbecomes weaker as increasingly local or interior proteinmotions are considered and (2) the solvent motions could notbe considered infinitely fast compared to those of the protein.
Also, the addition of maltodextrins with DE from 33 to8.7 determined an HRP decrease which was correlated tothe inverse of viscosity by a power-law relationship with"=0.37±0.02 independent of the maltodextrin molecularweight (Figure 3), whilst the addition of maltodextrin withDE 2.5 linearly decreased the enzymatic activity.
In diluted solutions, viscosity being equal, (1) themaltodextrin with DE of 33 was more effective than
Fig. 2 Effect of solute percentage (a) and molality (b) on horseradishperoxidase activity
Table 2 Average weighed molecular weight, T’g and turbidity of themaltodextrins solutions (mean value±standard deviation)
DE Mw T’ga Turbitya
°C NTU
2.5 243,500 "4.2±0.8 111±11
8.7 30,000 "9.5±0.6 1.96±0.07
17 9,012 "12.2±0.5 7.57±0.07
21 6,345 "14.4±0.3 3.11±0.06
33 2,300 "21.3±0.3 1.42±0.06
100 180 "43.5±0.0 0.30±0.06
NTU nephelometric turbidity unitsa Determined on the most concentrated solution (32±1.610"6 m2 s)
Food Biophysics (2011) 6:281–287 285

glucose in limiting HRP activity; (2) an increase in themaltodextrin chain length from DE 33 to DE 8.7 did notfurther limit the enzymatic activity; (3) the maltodextrinwith the highest chain length (DE 2.5) determined thehighest enzyme inhibition (Figure 3). In general, theincrease of molecular weight negatively affected the HRPactivity, since it decreased the molecular mobility byincreasing the viscosity and T’g, but it positively affectedthe aw and, in some cases, this compensated the HRPactivity inhibition. This result seems to confirm thehypothesis of Kouassi and Roos22 which suggested thatmolecular mobility is an important factor for the regulationof enzyme activity at high water activities.
At the highest viscosity (!40 mPa s) glucose inhibitedthe HRP activity less than maltodextrins, and a decrease ofHRP activity with the increase of T’g was observed fromDE 100 to DE 8.7 (Figure 4) despite of the aw increase (see
Table 1). In this DE range, the HRP activity showed aWLF-like dependence on T’g. In concentrated systems,when viscosity is equal, the decreased molecular mobilityassociated to T’g increase became the main rate controllingfactor for the enzymatic activity. This result supports theconclusion previously drawn from other studies.29
At the highest viscosity, the maltodextrin with the lowestDE was the least effective in limiting the HRP activity(Figure 4); as previously discussed, this maltodextrincontains large intact starch fragments which do not form areal solution in water but a physical dispersion (Figure 1).In such a discontinuous system, there is a discrepancybetween the bulk viscosity (which is affected by thedispersed phase) and the viscosity in the vicinity of theprotein which is lower since it is influenced by the solublephase, thus the observed enzyme activity is higher thanexpected. T’g could explain the effect of the soluble phasecomposition on enzymatic activity only when the viscosityin the vicinity of the protein is equal.
On the basis of these results it is possible to state that, eventhough viscosity and aw were proven to limit the enzymaticactivity in solution, the effect of different solutes on T’g couldaffect the enzymatic activity when viscosity values are equal.
Conclusions
In glucose and maltodextrin solutions, the most importantkinetic factor in hindering enzyme activity is viscosity, buta differential effect of solutes was observed with referenceto T’g. At low viscosity, water activity seems to take part inthe regulation of enzyme catalysis whilst in highlyconcentrated solutions, the Tg-dictated mobility is the mostimportant factor in the inhibition of enzymatic activity.
Since these physical stability factors were proven to playa key role on the regulation of enzymatic activity in
Fig. 3 Horseradish peroxidase activity of different maltodextrinsystems as a function of the inverse of kinematic viscosity
Fig. 4 Horseradish peroxidaseactivity as a function of T’g inhighly concentrated maltodextrinsystems (32.0±1.610"6 m2s"1)
286 Food Biophysics (2011) 6:281–287

solutions, a deeper understanding of their importance isneeded to investigate better the enzyme activity andstability of biological systems. Moreover, investigationson the effect of ingredients or additives, which could beused as stabilisers and thickeners in the food industry, onthe enzymatic inhibition could find practical application informulated foods, in order to achieve enzymatic stabilitythroughout their shelf life.
Acknowledgements The work of L.N. was funded by the ProjectPOR 2007–2008 financed by the Region Abruzzo.
The authors are grateful to Dr. Federico Di Fabio for his technicalassistance.
References
1. L.N. Bell, Moisture effects on food’s chemical stability, in Wateractivity in foods. Fundamentals and applications, ed. by G.V.Barbosa-Cánovas, A.J. Fontana Jr., S.J. Schmidt, T.P. Labuza(Blackwell, Oxford, 2007), pp. 173–198
2. D.S. Reid, Water activity: fundamentals and relationships, inWater activity in foods. Fundamentals and applications, ed. by G.V. Barbosa-Cánovas, A.J. Fontana Jr., S.J. Schmidt, T.P. Labuza(Blackwell, Oxford, 2007), pp. 15–28
3. T.P. Labuza, S.R. Tannenbaum, M. Karel, Food Technol 24, 543–550 (1970)
4. L. Acker, Enzyme activity at low water contents, in Recentadvances in food science, ed. by J.M. Leitch, D.N. Rhodes, 3rdedn. (Butterworths, London, 1963), pp. 239–347
5. L. Acker, Food Technol 23, 1257–1270 (1969)6. D. Tome, J. Nicolas, R. Drapron, Lebensm Wiss u Technol 11,
38–41 (1978)7. S. Schwimmer, Food Technol 34(5), 64–74 (1980). 82, 838. S.B. Lee, K.J. Kim, J Ferment Bioeng 79, 473–478 (1995)9. R.W. Farwell, E. Ackerman, Biophys J 86, 479–491 (1963)
10. M. Silver, M. Karel, J Food Biochem 5, 283–311 (1981)11. M.H. Lim, D.S. Reid, Studies of reaction kinetics in relation to the
T’g of polymers in frozen model systems, in Water relationshipsin food, ed. by L. Slade, H. Levine (Plenum, New York, 1991), pp.102–122
12. W.L. Kerr, M.H. Lim, D.S. Reid, H. Chen, J Sci Food Agric 61,51–56 (1993)
13. K. Kouassi, Y.H. Roos, J Agric Food Chem 48, 2461–2466(2000)
14. M.T. Cicerone, C.L. Soles, Biophys J 86, 3836–3845 (2004)15. H.A. Kramers, Physica 7, 284–304 (1940)16. A.C. Ansari, C.M. Jones, E.R. Henry, J. Hofrichter, W.A. Eaton,
Science 256, 1796–1798 (1992)17. S.J. Hagen, J. Hofrichter, W.A. Eaton, Science 269, 959–962
(1995)18. L. Manzocco, M.C. Nicoli, M. Anese, A. Pitotti, E. Maltini, Food
Res Int 31, 363–370 (1999)19. J. Buitnik, I.J. van den Dries, F.A. Hoekstra, M. Alberda, M.A.
Hemminga, Biophys J 79, 1119–1128 (2000)20. L. Slade, H. Levine, Crit Rev Food Sci Nutr 30, 115–360 (1991)21. Y.H. Roos, Water activity and glass transition, in Water activity in
foods. Fundamentals and applications, ed. by G.V. Barbosa-Cánovas, A.J. Fontana Jr., S.J. Schmidt, T.P. Labuza (Blackwell,Oxford, 2007), pp. 173–198
22. K. Kouassi, Y.H. Roos, Food Res Int 34, 895–901 (2001)23. Y.H. Chen, J.L. Aull, L.N. Bell, J Agric Food Chem 47, 504–509
(1999)24. K. Kouassi, Y.H. Roos, J Food Sci 67, 3402–3407 (2002)25. M.L. Williams, R.F. Landel, J.D. Ferry, J Am Chem Soc 77,
3701–3707 (1955)26. N.S. Terefe, A. Van Loey, M. Hendrickx, Innov Food Sci Emerg
5, 335–344 (2004)27. K.A. Nelson, T.P. Labuza, J Food Eng 22, 271–289 (1994)28. Y.H. Chen, J.L. Aull, L.N. Bell, Food Res Int 32, 467–472 (1999)29. L. Neri, P. Pittia, G. Bertolo, D. Torreggiani, G. Sacchetti, J Food
Eng 101, 289–295 (2010)30. F.S. Burnette, J Food Sci 42, 1–6 (1977)31. F. Pizzocaro, R. Aggujaro, G. Bertolo, Riv Sci Aliment 22(3),
279–284 (1993)32. L.M.M. Tijskens, P.S. Rodis, M.L.A.T.M. Hertog et al., J Food
Eng 34, 355–370 (1997)33. P.C. Williams, F.D. Kuzina, I. Hlynka, Cereal Chem 47, 411–420
(1970)34. Y. Roos, M. Karel, Biotechnol Progr 7, 49–53 (1991)35. E.F. Morales-Blancas, V.E. Chandia, L. Cisneros-Zevallos, J Food
Sci 67, 146–154 (2002)36. G. Blond, D. Simatos, Cryo Lett 10, 299–308 (1998)37. D. Torreggiani, E. Forni, I. Guercilena et al., Food Res Int 32,
441–446 (1999)
Food Biophysics (2011) 6:281–287 287