Thermal stability of peroxidase from Chamaerops excelsa palm tree at pH 3
30
Accepted Manuscript Title: Thermal stability of peroxidase from Chamaerops excelsa palm tree at pH 3 Authors: Laura S. Zamorano, Susana Barrera Vilarmau, Juan B. Arellano, Galina G. Zhadan, Nazaret Hidalgo Cuadrado, Sergey A. Bursakov, Manuel G. Roig, Valery L. Shnyrov PII: S0141-8130(09)00018-X DOI: doi:10.1016/j.ijbiomac.2009.01.004 Reference: BIOMAC 2407 To appear in: International Journal of Biological Macromolecules Received date: 18-12-2008 Revised date: 15-1-2009 Accepted date: 16-1-2009 Please cite this article as: L.S. Zamorano, S.B. Vilarmau, J.B. Arellano, G.G. Zhadan, N.H. Cuadrado, S.A. Bursakov, M.G. Roig, V.L. Shnyrov, Thermal stability of peroxidase from Chamaerops excelsa palm tree at pH 3, International Journal of Biological Macromolecules (2008), doi:10.1016/j.ijbiomac.2009.01.004 This is a PDF file of an unedited manuscript that has been accepted for publication. As a service to our customers we are providing this early version of the manuscript. The manuscript will undergo copyediting, typesetting, and review of the resulting proof before it is published in its final form. Please note that during the production process errors may be discovered which could affect the content, and all legal disclaimers that apply to the journal pertain.
Transcript of Thermal stability of peroxidase from Chamaerops excelsa palm tree at pH 3
Accepted Manuscript
Title: Thermal stability of peroxidase from Chamaeropsexcelsa palm tree at pH 3
Authors: Laura S. Zamorano, Susana Barrera Vilarmau, JuanB. Arellano, Galina G. Zhadan, Nazaret Hidalgo Cuadrado,Sergey A. Bursakov, Manuel G. Roig, Valery L. Shnyrov
PII: S0141-8130(09)00018-XDOI: doi:10.1016/j.ijbiomac.2009.01.004Reference: BIOMAC 2407
To appear in: International Journal of Biological Macromolecules
Received date: 18-12-2008Revised date: 15-1-2009Accepted date: 16-1-2009
Please cite this article as: L.S. Zamorano, S.B. Vilarmau, J.B. Arellano, G.G. Zhadan,N.H. Cuadrado, S.A. Bursakov, M.G. Roig, V.L. Shnyrov, Thermal stability ofperoxidase from Chamaerops excelsa palm tree at pH 3, International Journal ofBiological Macromolecules (2008), doi:10.1016/j.ijbiomac.2009.01.004
This is a PDF file of an unedited manuscript that has been accepted for publication.As a service to our customers we are providing this early version of the manuscript.The manuscript will undergo copyediting, typesetting, and review of the resulting proofbefore it is published in its final form. Please note that during the production processerrors may be discovered which could affect the content, and all legal disclaimers thatapply to the journal pertain.
Page 1 of 29
Accep
ted
Man
uscr
ipt
Thermal stability of peroxidase from Chamaerops excelsa palm
tree at pH 3.
Laura S. Zamorano a,1, Susana Barrera Vilarmau a,1,2, Juan B. Arellano b,
Galina G. Zhadan c, Nazaret Hidalgo Cuadrado a, Sergey A. Bursakov d,
Manuel G. Roig a,*, Valery L. Shnyrov c,*
a Departamento de Química Física, Facultad de Ciencias Químicas, Universidad de
Salamanca, 37008 Salamanca, Spainb Instituto de Recursos Naturales y Agrobiologia (IRNASA-CSIC), Apdo. 257, 37071
Salamanca, Spainc Departamento de Bioquímica y Biología Molecular, Universidad de Salamanca,
37007 Salamanca, Spaind Departamento de Protección Ambiental, Estacion Experimental del Zaidin (EEZ-
CSIC), 18008 Granada, Spain
1These authors contributed equally to this work.2Present address: Departamento de Ciencia de Proteinas, Centro de
Investigaciones Biológicas, 28040 Madrid
Abbreviations: CEP, palm tree - Chamaerops excelsa - peroxidase; CD, circular
dichroism; DSC, differential scanning calorimetry.
* Corresponding authors. Tel.: +34 92 329 4465; fax: +34 92 329 4579.
E-mail address: [email protected] (V.L. Shnyrov); [email protected] (M.G. Roig)
* Manuscript

Page 2 of 29
Accep
ted
Man
uscr
ipt
2
Abstract
______________________________________________________________________
The structural stability of a peroxidase, a dimeric protein from palm tree
Chamaerops excelsa leaves (CEP), has been characterized by high-sensitivity
differential scanning calorimetry, circular dichroism and steady-state tryptophan
fluorescence at pH 3. The thermally induced denaturation of CEP at this pH value is
irreversible and strongly dependent upon the scan rate, suggesting that this process is
under kinetic control. Moreover, thermally induced transitions at this pH value are
dependent on the protein concentration, leading to the conclusion that in solution CEP
behaves as dimer, which undergoes thermal denaturation coupled with dissociation.
Analysis of the kinetic parameters of CEP denaturation at pH 3 was accomplished on
the basis of the simple kinetic scheme DNk
, where k is a first-order kinetic constant
that changes with temperature, as given by the Arrhenius equation; N is the native state,
and D is the denatured state, and thermodynamic information was obtained by
extrapolation of the kinetic transition parameters to an infinite heating rate.
Key words: Palm peroxidase; Protein stability; Differential scanning calorimetry;
Circular dichroism; Fluorescence.
______________________________________________________________________
Page 3 of 29
Accep
ted
Man
uscr
ipt
3
1. Introduction
Peroxidases (EC 1.11.1.7; donor: hydrogen peroxide oxidoreductase) are
enzymes that are widely distributed in the living world and that are involved in many
physiological processes. Although the function of peroxidases is often seen primarily in
terms of effecting the conversion of H2O2 to H2O, this should not be allowed to obscure
their wider participation in other reactions, such as cell wall formation, lignification, the
protection of tissues from pathogenic microorganisms, suberization, auxin catabolism,
defense, stress, etc [1].
Peroxidases are important for various biotechnological purposes. This group of
enzymes, in particular those from plants, enjoys widespread use as catalysts for
phenolic resin synthesis [2,3], as indicators for food processing and diagnostic reagents
[4,5] and as additives in bioremediation [6,7]. Under specific conditions the radicals
formed can break bonds in polymeric materials resulting in their destruction, for
instance, in lignin biodegradation [8]. Peroxidase has found an important application in
the production of conducting polymers such as polyaniline [9,10]. Synthesis of
polyaniline can occur in the presence of peroxidase, hydrogen peroxide as a reducing
substrate, and sulfonated polystyrene and poly(vinyl-phosphonic acid) as polymeric
templates at acidic (below 4) pH values [11]. Consequently, for the development of
such biotechnological processes, it is of interest to find and characterize peroxidases
that are stable under acidic conditions.
As with many enzymes, poor thermal and environmental stability limits the
large-scale use of catalysis by peroxidases. This is particularly true in bioremediation
and polyelectrolyte synthesis. Accordingly, the identification of highly stable and active
peroxidases should be the first step in the development of a catalyst with broad
Page 4 of 29
Accep
ted
Man
uscr
ipt
4
commercial and environmental appeal. Recently, peroxidases from the leaves of some
tropical palm trees have been isolated and characterized [12-15]. These enzymes
showed very high stability at elevated temperatures, within broad range of pH values, in
the presence of hydrogen peroxide and chemical denaturants [16-18], that make them
intriguing catalysts for industrial applications. Here we describe a detailed investigation
of the thermal stability of peroxidase purified from leaves of cold-resistant palm tree
Chamaerops excelsa at pH 3, by using different independent methods, such as
differential scanning calorimetry (DSC), circular dichroism (CD), intrinsic fluorescence
and enzymatic activity assays.
2. Materials and methods
2.1. Materials
Analytical or extra-pure grade polyethyleneglycol (PEG), guaiacol (2-methoxyphenol),
ammonium sulfate, sodium phosphate and Tris-HCl were purchased from Sigma
Chemical Co. (St. Louis, MO, USA) and were used without further purification. H2O2
was from Merck (Darmstadt, Germany). Superdex-200 columns and Phenyl-Sepharose
CL-4B were from GE Healthcare Bio-Sciences AB (Uppsala, Sweden). Toyopearl
DEAE-650 M was purchased from the Tosoh Corporation (Tokyo, Japan). Cellulose
membrane tubing for dialysis (avg. flat width 3.0 in.) was purchased from Sigma
Chemical Co.; slide-A-lyzer dialysis cassettes (extra-strength, 3-12 mL capacity, 10.000
MWCO) were from Pierce Biotechnology, Inc. (Rockford, IL, USA), and centrifuge
filter devices (Amicon Ultra Cellulose 10.000 MWCO, 15 mL capacity) were from
Millipore Corp. (Billerica, MA, USA). All other reagents were of the highest purity
Page 5 of 29
Accep
ted
Man
uscr
ipt
5
available. The water used for preparing the solutions was double-distilled and then
subjected to a de-ionisation process.
2.2. Enzyme Preparation
CEP was purified from palm tree Chamaerops excelsa leaves as described
earlier [14].
The purity of the CEP was determined by SDS-PAGE, as described by
Fairbanks et al. [19], on a Bio-Rad minigel device, using a flat block with a 15 %
polyacrylamide concentration; by gel-filtration, performed using a Superdex 200 10/30
HR column connected to an ÄKTA-purifier system (GE Healthcare Bio-Sciences AB,
Uppsala, Sweden) and by UV-visible spectrophotometry (RZ ≡ A403/A280 = 2.9±0.1).
Analytical isoelectrofocusing was performed on a Mini IEF cell model 111 (Bio-Rad
Laboratories, Hercules, CA) using Ampholine PAG-plates, pH 3.5-9.5 (GE Healthcare
Bio-Sciences AB, Upsala, Sweden). Electrophoretic conditions and Coomassie brilliant
blue R-250 staining were as recommended by the manufacturer. The standards used
were from a broad-range pI calibration kit (pH 4.45-9.6) from Bio-Rad Laboratories
(Hercules, CA).
Protein concentrations were determined spectrophotometrically, using the
experimentally determined extinction coefficient value at 403 nm for the protein
monomer of 48.0 ± 0.5 mM-1cm-1.
Peroxidase activity toward guaiacol was measured spectrophotometrically at 25
°C. An aliquot of enzyme solution was added to a 1-cm spectral cuvette containing 18.1
mM guaiacol and 4.9 mM H2O2 in 20 mM sodium phosphate buffer, pH 6.0, in a final
volume of 2 mL. The rate of change in absorbance due to substrate oxidation was
Page 6 of 29
Accep
ted
Man
uscr
ipt
6
monitored at 470 nm. Peroxidase activities were calculated using a molar absorption
coefficient of 5200 M-1cm-1 at 470 nm for the guaiacol oxidation product [20].
In titration experiments, pH values were adjusted by means of a polyethylene
rod moistened with either 0.1 M HCl or 0.1 M NaOH.
2.3. Differential Scanning Calorimetry
Calorimetry scans were performed on a MicroCal MC-2D differential scanning
microcalorimeter (MicroCal Inc., Northampton, MA, USA) with cell volumes of 1.22
mL as described previously [18,21,22,]. All solutions were degassed by stirring under a
vacuum prior to scanning. An overpressure of 2 atm of dry nitrogen was always kept
over the liquids in the cells throughout the scans. The reversibility of the thermal
transitions was checked by examining the reproducibility of the calorimetric trace in a
second heating of the sample immediately after cooling from the first scan. The molar
excess heat capacity curves obtained by normalization with the protein concentrations
and volume of the calorimeter cell were smoothed and plotted using the Windows-based
software package (ORIGIN) supplied by MicroCal Inc. (Northampton, MA, USA).
Analysis of the data was accomplished on the basis of:
1. The simple two-state irreversible model, DNk
2 , where N2 is the native
dimer, D is the denatured monomer and k is the effective rate constant for the
denaturation that changes with temperature, as given by the Arrhenius equation: k =
exp[EA(1/T*-1/T)/R], where EA is the energy of activation, and T* is the temperature at
which the rate constant equals 1 min-1. In this case the excess heat capacity Cpex is given
by the following equation [23]:
Page 7 of 29
Accep
ted
Man
uscr
ipt
7
dT
TTR
E
TTR
EHC
T
T
AAexp
o
11exp
1exp
11exp
1 (1)
where ν = dT/dt (K min-1) is a scan rate value and ΔH is the enthalpy difference between
the denatured and native states.
2. The two-state folding/unfolding reaction coupled with the model that
corresponds to a situation in which the oligomeric protein made up of identical subunits
obeys the equilibrium: N2 K
2D, where K is the equilibrium constant (see for details
[18]).
2.4. Circular Dichroism
The far-UV CD spectra (190-250 nm) of CEP were recorded on a Jasco-715
spectropolarimeter (JASCO Inc., Easton, MD, USA) using a spectral band-pass of 2 nm
and a cell path length of 1 mm. Protein concentrations of 0.1 to 0.2 mg mL-1 were used
in these measurements. Five spectra were scanned for each sample at a scan rate of 50
nm min-1 and were then averaged. All spectra were background-corrected, smoothed,
and converted to mean residue ellipticity = 10 Mres obs l-1 p-1, where Mres = 105 is
the mean residue molar mass, obs is the ellipticity (degrees) measured at wavelength -
, l is the optical path-length of the cell (dm), and p is the protein concentration
(mg/ml).
Thermal stability experiments were performed between 25 and 80 °C with a
constant heating rate of 1 K min-1 using a Neslab RT-11 programmable water bath
(Thermo Fisher Scientific, Inc., Waltham, MA, USA), and were followed by continuous
measurements of ellipticity at 222 nm. Denaturation curves were transformed into the
fractional degree of denaturation by the following equation, using a non-linear least
Page 8 of 29
Accep
ted
Man
uscr
ipt
8
squares algorithm: θ = θN (1 - α) + θD α, where θN = a1 + a2 x and θD = b1 + b2 x
represent the mean values of ellipticity for the native and denatured conformations,
respectively, obtained by linear regression of pre- and post-transitional baselines; x is
the variable parameter.
2.5. Intrinsic Fluorescence
Steady-state fluorescence measurements were performed on a Hitachi F-4010
spectrofluorimeter (Hitachi Co., Ltd. Tokyo, Japan). Excitation was performed at 296
nm (with excitation and emission slit widths of 5 nm). The fluorescence measurements
of CEP were carried out on protein solutions with an optical density of less than 0.2 at
280 nm to avoid the inner filter effect. All emission spectra were corrected for
instrumental spectral sensitivity. The temperature dependence of the fluorescence
intensity change at 360 nm with a heating rate of 1.8 K min-1 was investigated using
thermostatically-controlled water circulating in a hollow brass cell-holder. Temperature
in the sample cell was monitored with a thermocouple immersed in the cell under
observation. Melting curves were transformed into the fractional degree of denaturation,
as in the case of the CD measurements.
3. Results and discussion
3.1. Enzyme purification
CEP was purified to homogeneity with a high yield from palm tree Chamaerops
excelsa leaves. The purification steps and their efficiencies are summarized in Table 1.
Page 9 of 29
Accep
ted
Man
uscr
ipt
9
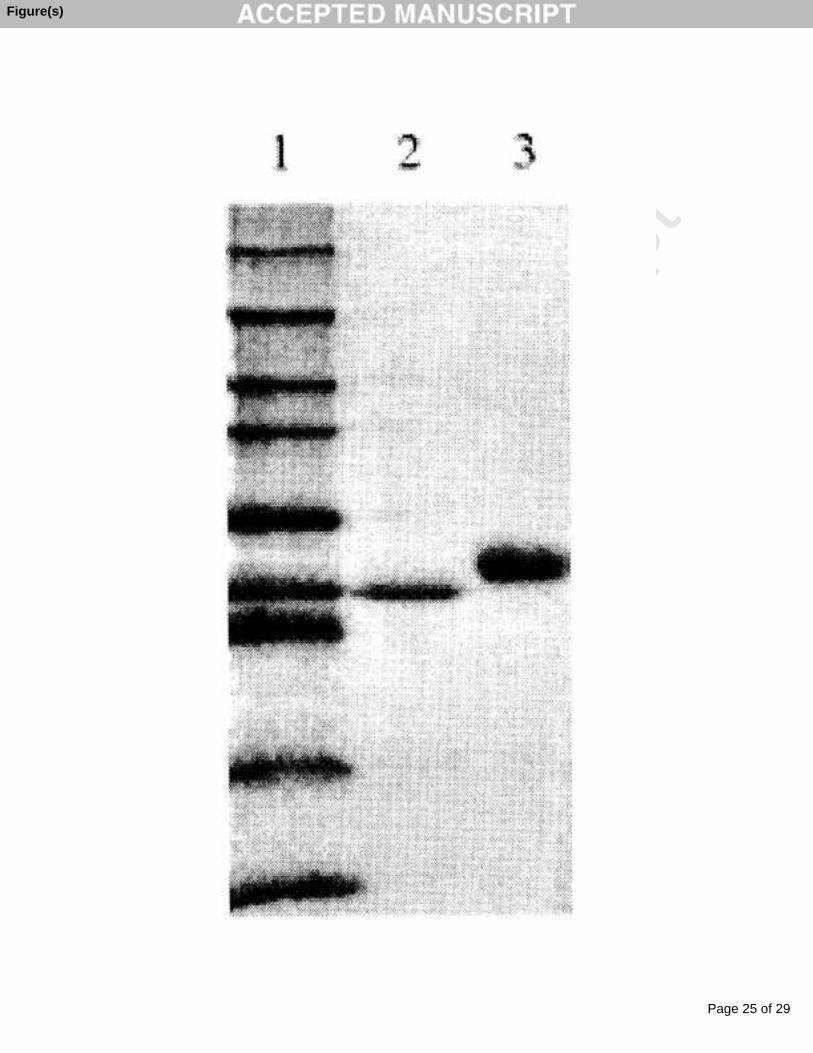
Purified peroxidase migrated in SDS-PAGE as a single band corresponding to a
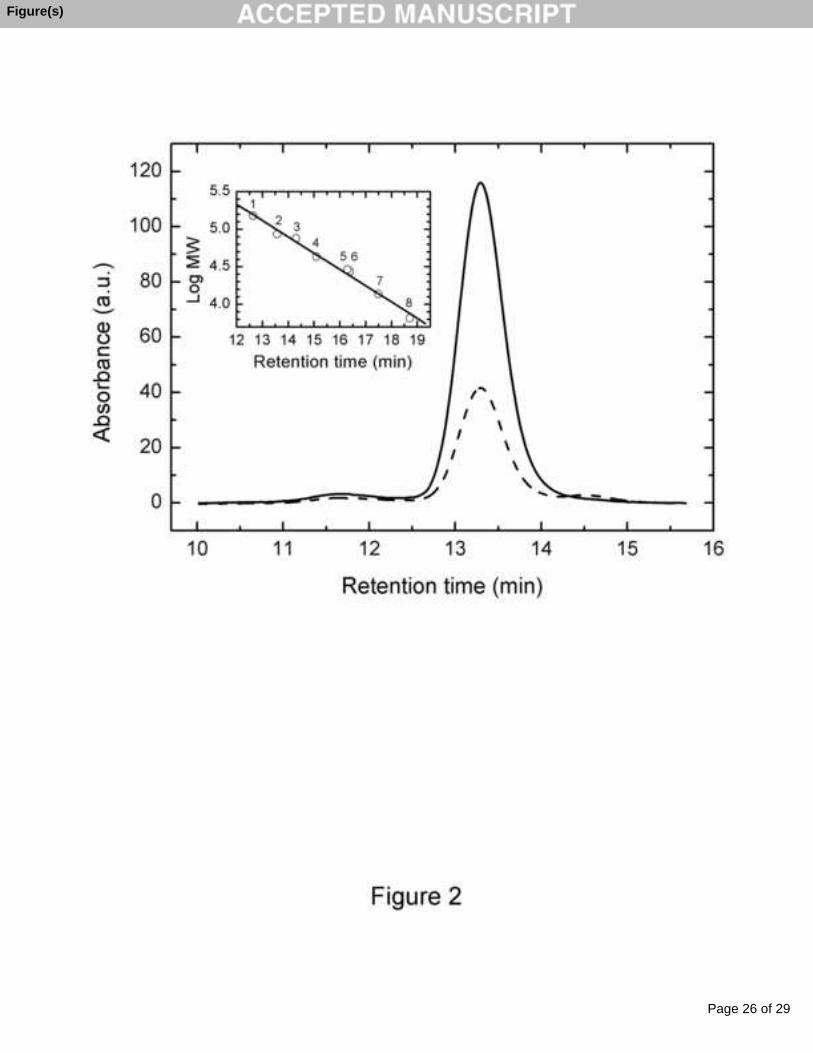
molecular weight of 50 ± 2 kDa (Fig. 1). The retention time of the elution of the protein
from the size-exclusion column indicates that the enzyme forms dimers in solution with
an approximate molecular weight of 109 ± 3 kDa (Fig. 2).
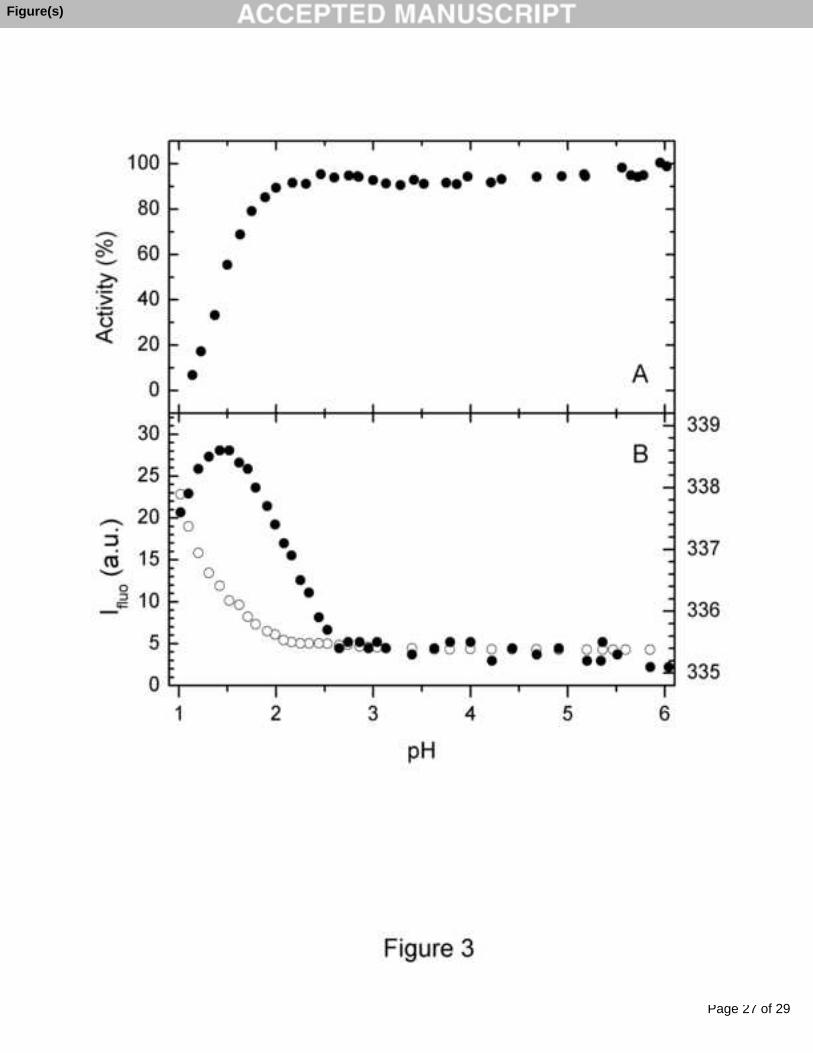
3.2. pH Dependence
To choose the most suitable pH conditions for stability studies, here we
measured the pH dependence of the enzymatic activity and tryptophan fluorescence of
CEP (Fig. 3). It is seen that CEP is a highly stable enzyme over a pH-range - from pH
2.5 to 6.0 - without any significant changes in the enzymatic activity and fluorescence
parameters. Thus, one of the most useful parameters of the protein fluorescence
spectrum - its maximum position, which reflects the degree of accessibility of the
chromophores to solvent molecules [24] - remains constant (variation in limits of ± 0.2
nm) within a pH-range from about 2.8 to 6. This implies that the accessibility of the
CEP tryptophan side chains to water molecules remains essentially invariant in this pH
range. Furthermore, the fluorescence intensity did not change, indicating the absence of
changes in the fluorescence quenching properties of the tryptophan environment in this
pH-range. Thus, the pH range from 3 up to 6, characterized by the absence of evident
pH-dependent fluorescence changes, seems to be the correct range of choice for the
physico-chemical characterization of CEP. Acidification of the protein solution down to
a pH below 2 caused a 3.6 nm red shift in the fluorescence spectrum, followed by a blue
shift below pH 1.5, brought about by protein aggregation and a marked (more than four-
fold) increase in fluorescence intensity. Comparison of these changes with the changes
in enzymatic activity indicates that only the fluorescence intensity reflects acidic
Page 10 of 29
Accep
ted
Man
uscr
ipt
10
denaturation of CEP, while the position of the fluorescence spectrum, reflecting the
polarity of the tryptophan side chain environment, shows that polarity is not relevant for
the enzymatic function of CEP.
3.3. DSC
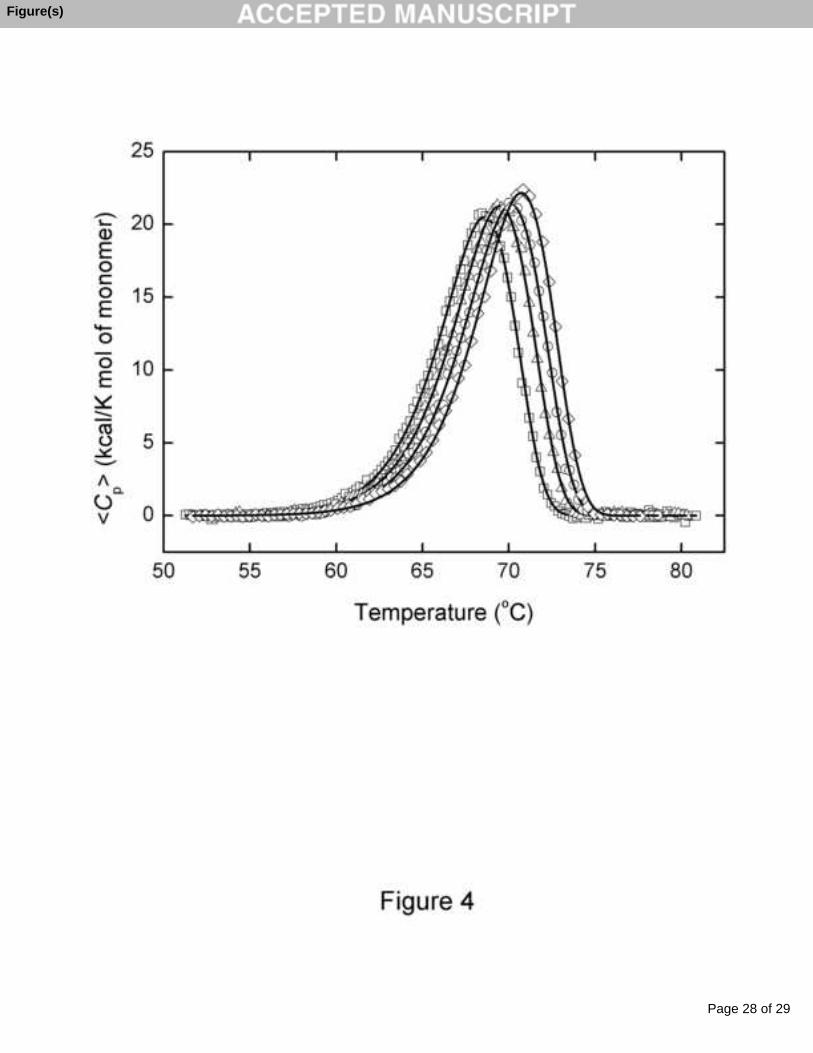
The thermal denaturation of CEP at pH 3.0 gave rise to well defined DSC
transitions whose values of temperatures of the excess heat capacity maximum (Tm)
were dependent on the temperature scan rate. This effect can be seen in Fig. 4, which
shows the thermal transitions for CEP at four different scan rates. The thermal
denaturation of CEP under these experimental conditions was always calorimetrically
irreversible since in a second heating of the enzyme solution no thermal effect was
observed. All this clearly indicates that the observed thermal transitions characterize an
irreversible, kinetically controlled process. Since, following the data of size exclusion
chromatography, CEP forms dimers in solution, thermally induced denaturation should
be accompanied by its dissociation into subunits, which should produce a concentration
dependence of Tm [25-27]. In fact, the Tm and ΔHcal values for the thermal denaturation
of CEP at pH 3.0 were found to be dependent on the protein concentration within the
0.4 – 2.6 mg mL-1 range (data not shown), Tm increasing up to 1.1 degrees, and ΔHcal up
to 2%. The ratio of the van ’t Hoff and calorimetric enthalpies obtained at different
concentrations and different scan rates averaged 1.36 ± 0.08, fairly close to the value
calculated with equation: VH
m
H 2·n
H( T ) n 1
, which is valid for the case when the
denaturation of oligomeric proteins is coupled to their dissociation into monomers [26]:
i.e., 1.333 for dimer. Accordingly, despite a very small variation in the kinetic
parameters of CEP denaturation with concentration, in all the experiments performed at
Page 11 of 29
Accep
ted
Man
uscr
ipt
11
this pH we used the same concentration of protein to be sure that results obtained in
different experiments would be concentration independent. Analysis of the DSC
transitions under these conditions was accomplished on the basis of a simple two-state
irreversible model DNk
2 (see Materials and Methods). It should be noted that a
realistic model of protein denaturation in this case should include two steps: reversible
unfolding and irreversible alteration of the unfolded state to produce the final denatured
state, which is unable to fold back to the native protein. This scheme, usually known as
the Lumry-Eyring model [28] in case of dimeric proteins, can be depicted as:
d1
1
2 2kk
N U Dk
, where N2 is the native dimer, U is the unfolded monomer, D is the
irreversibly denatured monomer, k1 and k-1 are the rate constants for the forward and
reverse unfolding process with concomitant dissociation, and kd is the rate constant for
the denaturation of the monomers. However, use of the whole Lumry-Eyring model for
the quantitative description of thermally induced transitions is difficult because the
corresponding system of differential equations does not have an analytical solution at
varying temperatures. It is therefore necessary to evaluate simpler mathematical models
that are particular cases of the whole Lumry-Eyring model. In the present work we used
the model that includes only one irreversible step, assuming that monomer denaturation
is rapid in comparison with the dissociation of the dimer and the association of
monomers, i. e. kd » k1 and kd » k-1. This means that the thermally induced disruption of
the quaternary structure of the dimer adheres kinetically to the “all-or-not” law:
DNk
2 .
The excess heat capacity functions obtained for CEP in this case were analyzed
by fitting the data to the two-state irreversible model - equation (1) - either individually
or globally, using scan rate as an additional variable. The results of the fitting are shown
Page 12 of 29
Accep
ted
Man
uscr
ipt
12
in Fig. 4 (solid lines) and in Table 2. As can be seen, when fitting was carried out both
separately on the individual experimental curves and simultaneously on all the curves, a
good approximation was achieved. Attempts to include different irreversible models for
CEP denaturation - the Lumry-Eyring model, with a fast equilibrating first step, and the
model that includes two consecutive irreversible steps [29,30] - did not improve the
goodness of the fit, indicating that the two-state irreversible model is sufficient to
quantitatively describe the kinetics of CEP denaturation. This conclusion was further
confirmed by our spectral investigation on the thermal denaturation of this enzyme.
It is clear that equilibrium thermodynamics cannot be applied directly in the
analysis of CEP denaturation at pH 3 because of its kinetically controlled nature.
However, it is possible to obtain useful thermodynamic information upon extrapolation
of the transition parameters to the infinite heating rate [31]. The thermodynamic
parameters obtained in this manner for the thermal denaturation of CEP at pH 3 are
shown in Table 2. If it is taken into account that in the acid pH range ion pairs, which
are known to be important for the stability of haeme-containing class III peroxidases
[32], have disappeared due to protonation that it may be assumed that value of the
standard free energy change for CEP at neutral pH may be 5 – 10 kcal mol-1 higher
[18,33] demonstrating that this enzyme is extremely stable.
3.4. CD Experiments
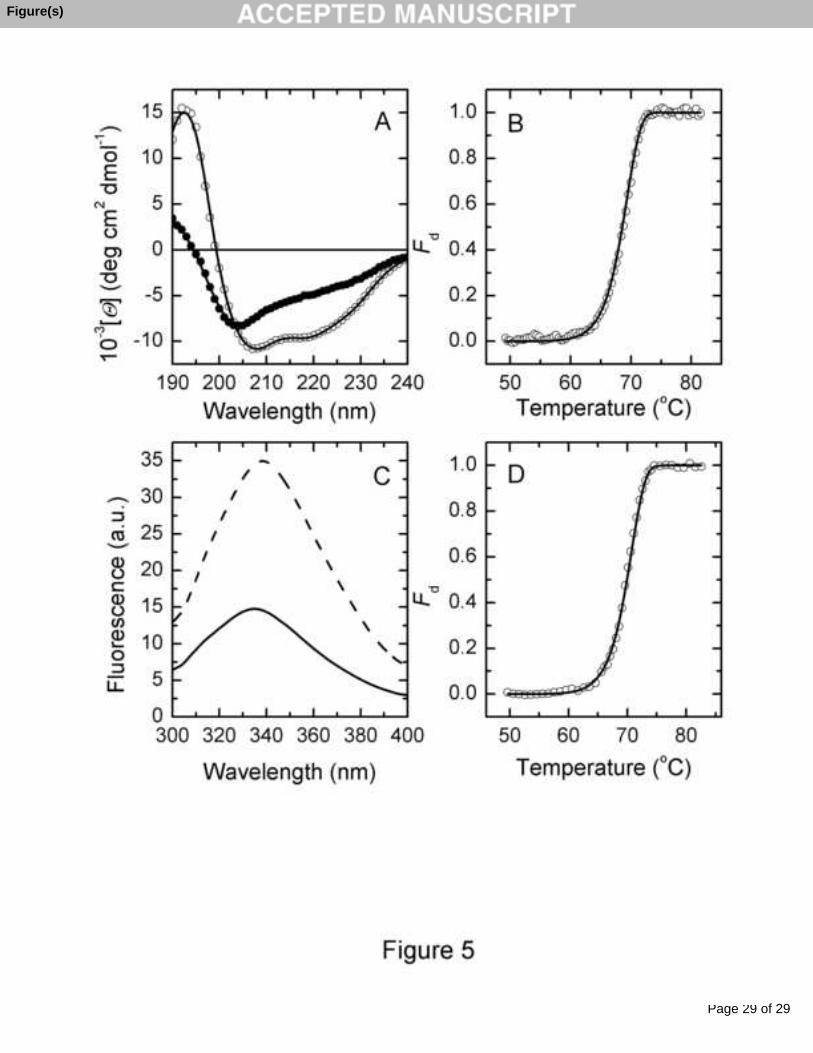
The CD spectra of intact and thermally denatured CEP at pH 3 are shown in Fig.
5A. A detailed secondary structure analysis of the CD spectra was performed using the
CDPro software package [34]. The experimental data in 190-240 nm range were
subjected to treatment by three programs included in this software package -
Page 13 of 29
Accep
ted
Man
uscr
ipt
13
SELCON3, CDSSTR, and CONTINLL - using the SP43 (for intact proteins) and
SDP48 (for denatured proteins) reference sets. The lowest root mean square deviation
(RMSD) between the experimental data and the theoretical curves produced by the
programs with these reference sets was obtained with CDSSTR, and hence the results
obtained with SELCON3 and CONTINLL were omitted. The results of this analysis are
given in Table 4. The values thus obtained for intact CEP are typical of different heme
peroxidases [35]. It should be noted here that the estimates for the β-sheet and β-turn are
usually worse than the estimate for the α-helix because the intensities of the β structure
elements are lower than those of the α-helix [36].
Upon heating the CEP up to the denaturation temperature, the shape of the
spectrum changed, pointing to an increase in the unordered structure, mainly at the
expense of the α-helical structure (see Table 4). The increase in the quantity of β-strands
that also occurred in denatured CEP indicates that this form of the enzyme undergoes
some aggregation, most probably with an intramolecular character, because we failed to
detect an increase in turbidity in the denaturation process.
The thermal denaturation of CEP was monitored by following the changes in
molar ellipticity at 222 nm since at this wavelength the changes in ellipticity are
significant upon enzyme denaturation. With increasing temperature (Fig. 5B), an
irreversible cooperative transition to the denatured state occurred, which was analyzed
by using a non-linear least squares fitting to Eq. (2) (see line through the data points):
o
Ad
1 1 11 exp exp
T
T
EF dT
R T T
(2)
where Fd refers to the denatured fraction [23]. This fitting affords the T* parameter and
the activation energy for CEP. These values are 344.4±0.3 K and 103.2 ± 1.7 kcal mol-1,
Page 14 of 29
Accep
ted
Man
uscr
ipt
14
respectively, which are similar to those observed for the same parameters obtained by
DSC (Table 2).
3.5. Fluorescence Experiments
Environmental changes in aromatic side chains resulting from conformational
changes in the tertiary structure of proteins were measured by intrinsic fluorescence
spectroscopy. Fig. 5C shows the fluorescence spectra of intact (solid line) and thermally
denatured (dashed line) CEP at pH 3.0, excited at 296 nm. The fluorescence emission of
the intact CEP has a very low quantum yield due to energy transfer to the heme which,
as can be seen in Fig. 5C, essentially increases in the denatured enzyme owing to a
change in the relative orientation or distance between the heme and the tryptophan
residue(s) [37]. In view of these results, we used the changes in fluorescence intensity to
analyze the effect of heating on the CEP denaturation process. On increasing
temperature (Fig. 5D), an irreversible cooperative transition to the denatured state
occurred, which was analyzed by non-linear least squares fitting to the equation (2).
This fitting (solid line in Fig. 5D) afforded values of T* = 343.9 ± 0.4 K and EA =
102.9±2.3 kcal mol-1, which are in satisfactory agreement with the values obtained from
DSC and CD experiments (see above).
4. Conclusions
On comparing the kinetic parameters of CEP stability at pH 3 with those of other
peroxidases [17,18,21,22], it is evident that that the thermostability of CEP is
substantially greater than that of horseradish peroxidase isoenzyme c (HRPc) and
anionic peanut (Arachis hypogaea L.) peroxidase (aPrx), and is practically the same as
Page 15 of 29
Accep
ted
Man
uscr
ipt
15
the stability of peroxidase from the African oil palm tree Elaeis guineensis (AOPTP)
and peroxidase from royal palm tree Roystonea regia (RPTP). Thus, the Tm for CEP at a
scan rate of 60 K h-1 is 70.1 ± 0.2 °C while for aPrx this value is 39.4 ± 0.2 °C; for
HRPc it is 60.2 ±0.2 °C; for AOPTP it is 72.3 ± 0.2 °C and for RPTP it is 72.3 ± 0.2 °C.
In row of the Arrhenius energy of activation values CEP (105.1 ± 1.7 kcal mol-1) close
to AOPTP (103 ± 6 kcal mol-1) being lower RPTP (129.1 ± 0.8 kcal mol-1) and
significantly higher in comparison those of HRPc (38.2 ± 0.5 kcal mol-1) and aPrx (67.9
± 0.5 kcal mol-1). Obviously leaves of palm trees are the best source of the most
structurally and functionally stable peroxidases pointing to their great potentiality for
different biotechnological applications.
Acknowledgments
This work was partially supported by projects SA-06-00-0 ITACYL-
Universidad de Salamanca and SA 129A07 (Junta de Castilla y León) and BFU2004-
01432 and BFU2007-68107-C02-02/BMC (Ministerio de Educación y Ciencia) Spain.
L.S.Z was fellowship holders from the Junta de Castilla y León, Spain (Ref.
EDU/1490/2003).
Page 16 of 29
Accep
ted
Man
uscr
ipt
16
References
1. C. Penel, T. Gaspar, H. Greppin, Plant Peroxidases 1980-90. Topics and
Detailed Literature on Molecular, Biochemical, and Physiological Aspects.
University of Geneva, Switzerland 1992.
2. J.S. Dordick, M.A. Marletta, A.M. Klibanov, Biotechnol. Bioeng. 30 (1987) 31-
36.
3. J.A. Akkara, K.J. Senecal, D.L. Kaplan, J. Polym. Sci: Part A: Polymer
Chemistry 29 (1991) 1561-1574.
4. Q.R. Thompson, Anal. Chem. 59 (1987) 1119-1121.
5. Z. Weng, M. Hendrickx, G. Maesmans, P. Tobback, J. Food Sci. 56 (1991) 567-
570.
6. D. Arseguel, M. Baboulène, J. Chem. Technol. Biotechnol. 61 (1994) 331-335.
7. P.R. Adler, R. Arora, A. El Ghaouth, D.M. Glenn, J.M. Solar, J. Environ. Qual.
23 (1994) 1113-1117.
8. D. Cullen, P.J. Kersten, Enzymology and molecular biology of lignin
degradation, in: The Micota III – Biochemistry and Molecular Biology (R.
Brambl and G.A. Mazzluf, eds) pp. 249-273, Springer-Verlag, Berlin-
Heidelberg, 2004.
9. A.V. Caramyshev, E.G. Evtushenko, V.F. Ivanov, A. Ros Barceló, M.G. Roig,
V.L. Shnyrov, R.B. van Huystee, I.N. Kurochkim, A.K. Vorobiev, I.Y.
Sakharov, Biomacromolecules 6 (2005) 1360-1306.
10. A.V. Caramyshev, V.M. Lobachev, D.V. Selivanov, E.V. Sheval, A.K.
Vorobiev, O.N. Katasova, V.Y. Polyakov, A.A. Makarov, I.Y. Sakharov,
Biomacromolecules 8 (2007) 2549-2555.

Page 17 of 29
Accep
ted
Man
uscr
ipt
17
11. W. Liu, J. Kumar, S. Treipathy, K.J. Senecal, L. Samuelson, J. Am. Chem. Soc.
121 (1999) 71-78.
12. I.Y. Sakharov, J. Castillo Leon, J.C. Ariza, I.Y. Galaev, Bioseparation 9 (2000)
125-132.
13. I.Y. Sakharov, M.K. Vesga, I.Y. Galaev, I.V. Sakharova, O.Y. Pletjushkina,
Plant Sci. 161 (2001) 853-860.
14. L. Watanabe, A.S. Nascimento, L.S. Zamorano, V.L. Shnyrov, I. Polikarpov,
Acta Cryst. F63 (2007) 780-783.
15. G.H. Onsa, N. bin Saari, J. Selamat, J. Bakar, Food Chem. 85 (2004) 365-376.
16. I.Y. Sakharov, I.V. Sakharova, Biochim. Biophys. Acta 1598 (2002) 108-114.
17. A. Rodríguez, D.G. Pina, B. Yélamos, B., J.J. Castillo Leon, G.G. Zhadan, E.
Villar, F. Gavilanes, M.G. Roig, I.Y. Sakharov, V.L. Shnyrov, Eur. J. Biochem.
269 (2002) 2584-2590.
18. L.S. Zamorano, D.G. Pina, J.B. Arellano, S.A. Bursakov, A.P. Zhadan, J.J.
Calvete, L. Sanz, P.R. Nielsen, E. Villar, O. Gavel, M.G. Roig, L. Watanabe, I.
Polikarpov, V.L. Shnyrov, Biochimie 90 (2008) 1737- 1749.
19. G. Fairbanks, T. Steck, D.F.N. Wallach, Biochemistry 10 (1971) 2606-2617.
20. A. Lindgren, T. Ruzgas, L. Gorton, E. Csöregi, G.B. Ardila, I.Y. Sakharov, I.G.
Gazaryan, Biosens. Bioelectron. 15 (2000) 491-497.
21. D.G. Pina A.V. Shnyrova, F. Gavilanes, A. Rodríguez, F. Leal, M.G. Roig, I.Y.
Sakharov, G.G. Zhadan, E. Villar, V.L. Shnyrov, Eur. J. Biochem. 268 (2001)
120-126.
22. L.S. Zamorano, D.G. Pina, F. Gavilanes, M.G. Roig, I.Y. Sakharov, A.P. Jadan,
R.B. van Huystee, E. Villar, V.L. Shnyrov, Thermochim. Acta 417 (2004) 67-
73.

Page 18 of 29
Accep
ted
Man
uscr
ipt
18
23. B.I. Kurganov, A.E. Lyubarev, J.M. Sanchez-Ruiz, V.L. Shnyrov, Biophys.
Chem. 69 (1997) 125-135.
24. E.A. Permyakov, Luminescent spectroscopy of proteins. Boca Raton: CRC
Press, 1993.
25. S.P. Manly, K.S. Matthews, J.M. Sturtevant, Biochemistry 24 (1985) 3842-
3846.
26. E. Freire, Comm. Mol. Cell. Biophys. 6 (1989) 123-140.
27. J.M. Sanchez-Ruiz, Biophys. J. 61 (1992) 921-935.
28. R. Lumry, H. Eyring, J. Phys. Chem. 58 (1954) 110-120.
29. A.E. Lyubarev, B.I. Kurganov, Biochemistry (Moscow) 63 (1998) 434-440.
30. A.E. Lyubarev, B.I. Kurganov, Biochemistry (Moscow) 64 (1999) 832-838.
31. P.L. Privalov, S.A. Potekhin, Methods Enzimol. 131 (1986) 4-51.
32. J.W. Tams, K.G. Welinder, Biochemistry 35 (1996) 7573-7579.
33. M. Sawano, H. Yamamoto, K. Ogasahara, S. Kidokoro, S. Katoh, T. Ohnuma,
E. Katoh, S. Yokoyama, K. Yutani, K. Biochemistry 47 (2008) 721-730.
34. N. Sreerama, S.Y. Venyaminov, R.W. Woody, Protein Sci. 8 (1999) 370-380.
35. L. Banci, J. Biotechnol. 53 (1997) 253-263.
36. S.Y. Venyaminov, J.T. Yang, Determination of protein secondary structure, in:
Circular Dichroism and the Conformational Analysis of Biomolecules (G.D.
Fasman, ed) pp. 69-107, Plenum Press, New York, 1996.
37. B.C. Hill, P.M. Horowitz, N.C. Robinson, Biochemistry 25 (1986) 2287-2292.
Page 19 of 29
Accep
ted
Man
uscr
ipt
19
Figure legends
Fig. 1. SDS-PAGE analysis of CEP (lane 3). Lane 2 contains for comparison royal palm
tree peroxidase [18] and lane 1 contains molecular-weight markers from Novex Sharp
Pre-Stained Standards (Invitrogen Co.) - from top to bottom: 260 kDa, 160 kDa, 110; 80
kDa, 60 kDa, 50 kDa, 40 kDa, 30 kDa, and 20 kDa.
Fig. 2. High-performance gel filtration of CEP on Superdex 200 HR 10/30 at a flow rate
of 0.4 ml min-1. The solid line is the absorbance at 403 nm and the dashed line is that at
280 nm. The insert shows calibration line for the standard proteins from LMW
Calibration Kit (GE Healthcare) on Superdex 200 10/30 HR column: 1 – dimer of
conalbumin (150 kDa), 2 – dimer of ovalbumin (86 kDa), 3 – conalbumin (75 kDa), 4 –
ovalbumin (43 kDa), 5 – carbonic anhydrase (29 kDa), 6 – dimer of ribonuclease A
(27.4 kDa), 7 – ribonuclease A (13.7 kDa) and 8 – aprotinin (6.5 kDa).
Fig. 3. pH-dependence of enzymatic activity (A) and fluorescence parameters (B) of
CEP at 25 °C. Measurements were performed in 10 mM universal buffer (CH3COOH,
H3PO4, H3BO3-NaOH) with a protein concentration of ca. 10 μM. Activity was
measured toward guaiacol. Open circles in (B) represent fluorescence intensity
(arbitrary units) at 350 nm, which is proportional to the fluorescence quantum yield, and
closed circles correspond to the position of the maximum of the fluorescence spectrum
λmax. The excitation wavelength was 296 nm.
Fig. 4. Temperature dependence of the excess molar heat capacity of CEP at scan rates
of 29.7 K h-1 (squares), 45.5 K h-1 (triangles), 59.3 K h-1 (circles) and 87.5 K h-1
Page 20 of 29
Accep
ted
Man
uscr
ipt
20
(diamonds) in 20 mM citrate buffer, pH 3.0. Solid lines represent the best fit to each
experimental curve using equation (1). The protein concentration was 23.9 μM.
Fig. 5. Thermally induced denaturation of CEP studied by optical spectroscopy. (A)
Far-UV CD spectra of intact CEP at 25 °C (open circles) and thermally denatured CEP
at 80 °C (closed circles) at pH 3.0 and protein concentration of 10.2 μM. The solid lines
through the symbols are the best fits to the experimental data with the CDSSTR
program, using SP43 for the intact and SDP48 for denatured protein as reference sets.
(B) Fractional degree of thermal unfolding of CEP as a function of temperature, at pH
3.0, monitored by the changes in ellipticity at 222 nm, obtained upon heating at a
constant scan rate of 60.3 K h-1. The solid line represents the theoretical curve resulting
from fitting the experimental data to the two-state irreversible model using Eq. (2). (C)
Fluorescence spectra of intact - at 25 °C (solid line) and thermally denatured at 80 °C
(dashed line) - CEP at pH 3.0 and protein concentration of 17.9 μM. The excitation
wavelength was 296 nm. (D) Fractional degree of thermal unfolding of CEP as a
function of temperature monitored by the changes in fluorescence intensity at 360 nm at
pH 3.0, obtained upon heating at a constant scan rate of 108.3 K h-1. The solid line
represents the best fit obtained using Eq. (2).

Page 21 of 29
Accep
ted
Man
uscr
ipt
Table 1
Purification steps of CEP
Procedure Volume
(ml)
Protein
(mg)
Total
activitya
(U)
Specific
activitya
(U mg-1)
Purification Yield
(%)
Homogenate 6020 27515 211469 7.7 1 100
PEG + (NH4)2SO4 2750 9466 199898 21.1 3 95
Phenyl-Sepharose54 662 138230 209.9 27 66
DEAE-Toyopearl2.5 27 79879 2925.9 380 38
Superdex 20020 11 69231 6293.7 817 33
a The enzyme activity was measured toward guaiacol
Table(s)
Page 22 of 29
Accep
ted
Man
uscr
ipt
2
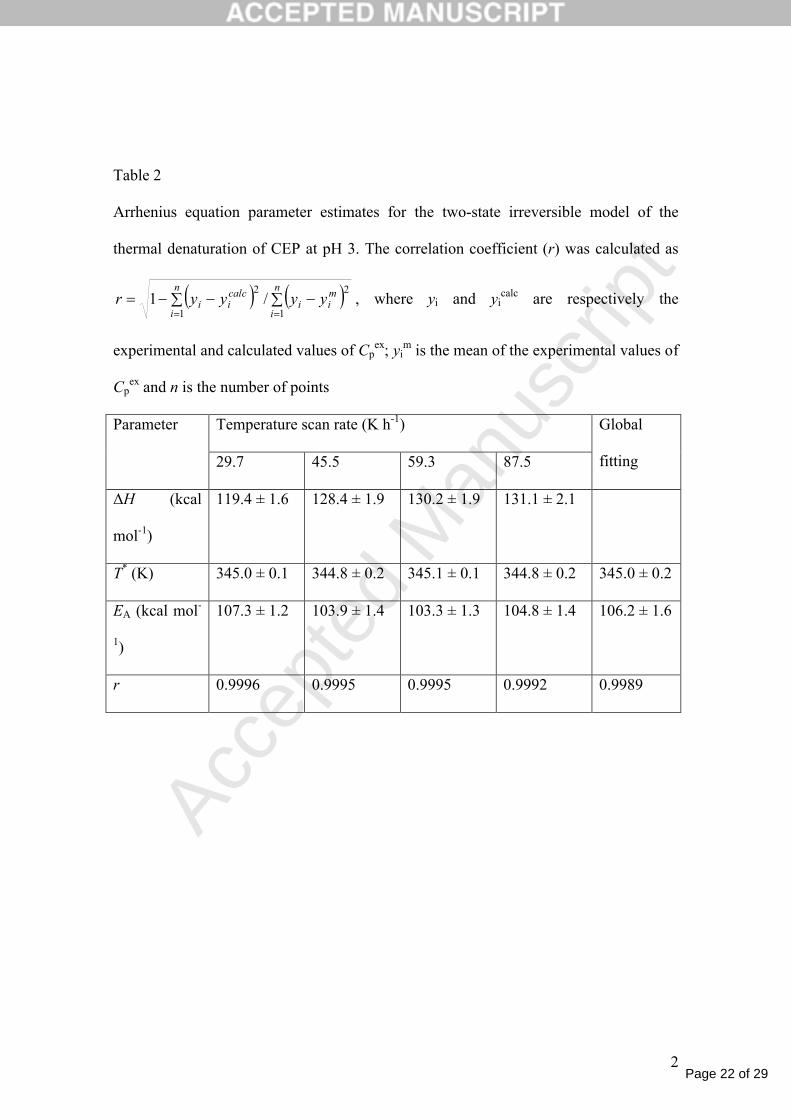
Table 2
Arrhenius equation parameter estimates for the two-state irreversible model of the
thermal denaturation of CEP at pH 3. The correlation coefficient (r) was calculated as
n
i
n
i
mii
calcii yyyyr
1 1
22/1 , where yi and yi
calc are respectively the
experimental and calculated values of Cpex; yi
m is the mean of the experimental values of
Cpex and n is the number of points
Parameter Temperature scan rate (K h-1) Global
fitting29.7 45.5 59.3 87.5
ΔH (kcal
mol-1)
119.4 ± 1.6 128.4 ± 1.9 130.2 ± 1.9 131.1 ± 2.1
T* (K) 345.0 ± 0.1 344.8 ± 0.2 345.1 ± 0.1 344.8 ± 0.2 345.0 ± 0.2
EA (kcal mol-
1)
107.3 ± 1.2 103.9 ± 1.4 103.3 ± 1.3 104.8 ± 1.4 106.2 ± 1.6
r 0.9996 0.9995 0.9995 0.9992 0.9989
Page 23 of 29
Accep
ted
Man
uscr
ipt
3
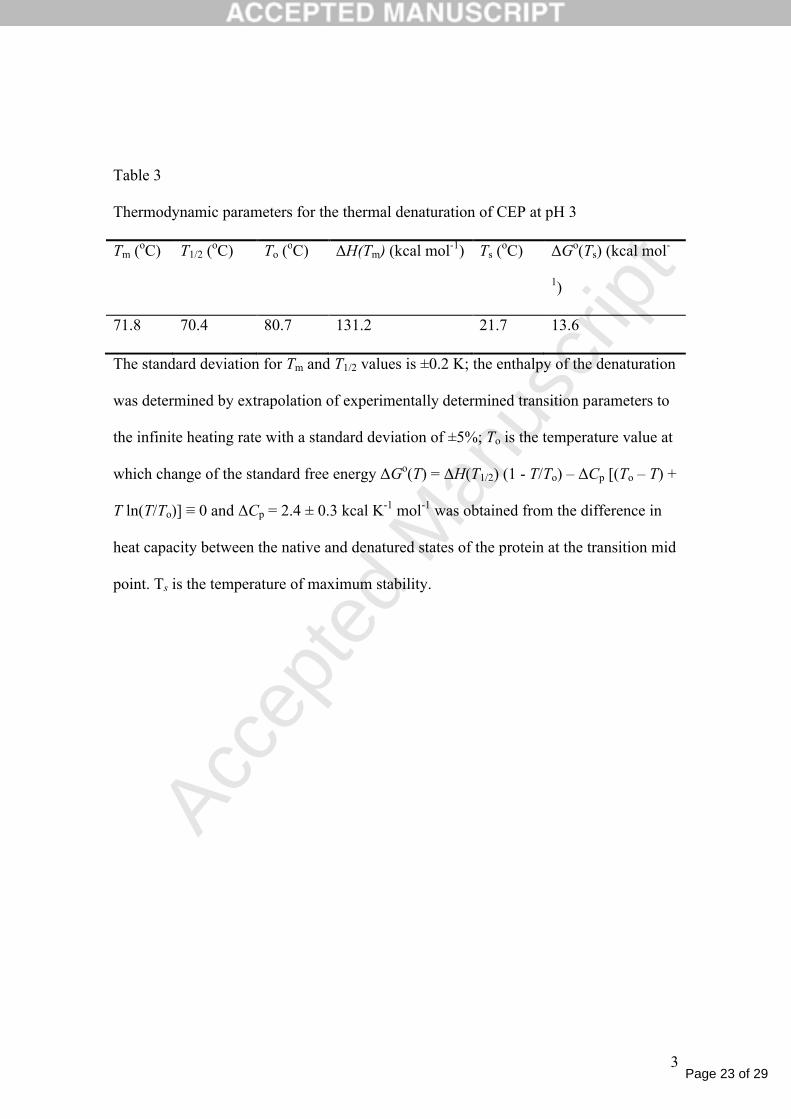
Table 3
Thermodynamic parameters for the thermal denaturation of CEP at pH 3
Tm (oC) T1/2 (oC) To (oC) ΔH(Tm) (kcal mol-1) Ts (oC) ΔGo(Ts) (kcal mol-
1)
71.8 70.4 80.7 131.2 21.7 13.6
The standard deviation for Tm and T1/2 values is ±0.2 K; the enthalpy of the denaturation
was determined by extrapolation of experimentally determined transition parameters to
the infinite heating rate with a standard deviation of ±5%; To is the temperature value at
which change of the standard free energy ΔGo(T) = ΔH(T1/2) (1 - T/To) – ΔCp [(To – T) +
T ln(T/To)] ≡ 0 and ΔCp = 2.4 ± 0.3 kcal K-1 mol-1 was obtained from the difference in
heat capacity between the native and denatured states of the protein at the transition mid
point. Ts is the temperature of maximum stability.

Page 24 of 29
Accep
ted
Man
uscr
ipt
4
Table 4
Secondary structure elements (%) determined from analysis of the CD spectra for intact
and denatured CEP at pH 3
Protein α-Helix β-Strand β-
Turn
Unordered
Regular Distorted Total Regular Distorted Total
Intact 20 18 38 0 7 7 22 33
Denatured 4 6 10 19 9 28 15 47
Page 25 of 29
Accep
ted
Man
uscr
ipt
Figure(s)
Page 26 of 29
Accep
ted
Man
uscr
ipt
Figure(s)
Page 27 of 29
Accep
ted
Man
uscr
ipt
Figure(s)
Page 28 of 29
Accep
ted
Man
uscr
ipt
Figure(s)
Page 29 of 29
Accep
ted
Man
uscr
ipt
Figure(s)