city of palm springs, california
393
CITY OF PALM SPRINGS, CALIFORNIA TABLE OF CONTENTS………………………………………………………………………………… I READER'S GUIDE TO THE BUDGET……………………………………………………………… i BUDGET SUMMARY 1-1 Budget Message……………………………………………………………………………… 1-1 BUDGET OVERVIEW 2-1 Budget Process……………………………………………………………………………… 2-1 Budget Roles and Responsibilities………………………………………………………… 2-2 Explanation or Revenue Sources…………………………………………………………… 2-3 Budget Summary - Operating Funds……………………………………………………… 2-4 Revenues - Operating Funds (Graph)……………………………………………………… 2-5 Appropriations - Operating Funds (Graph)………………………………………………… 2-6 Fiscal Year comparison of Operating Funds (Graph)…………………………………… 2-7 Appropriation Summary - All Funds………………………………………………………… 2-8 Appropriation Detail - All Funds……………………………………………………………… 2-9 Appropriation by Fund - Internal Service Fund (Graph)………………………………… 2-13 Authorized Positions by Service Area (Graph)…………………………………………… 2-14 FY 2013-14 Budget Calendar…………………………………………………………….. 2-15 CITY INFORMATION 3-1 City Government……………………………………………………………………………… 3-1 City Organization Chart……………………………………………………………………… 3-5 Vision & Mission Statement………………………………………………………………… 3-6 MANAGEMENT & BUDGET POLICIES 4-1 Legal Requirements Regarding Annual Budget…………………………………………… 4-2 Budgetary Controls/Accounting Basis……………………………………………………… 4-2 Description of Reporting Entities…………………………………………………………… 4-3 General Management and Budget Policies………………………………………………… 4-6 Revenue Policy……………………………………………………………………………… 4-7 Reserves Policy……………………………………………………………………………… 4-7 Capital Improvement Program Policy……………………………………………………… 4-7 Investment Policy……………………………………………………………………………… 4-8 Debt Administration and Policies…………………………………………………………… 4-17 Grant Administration Policy………………………………………………………………… 4-19 Cost Accounting Application………………………………………………………………… 4-19 Article XIIIB Appropriations Limit…………………………………………………………… 4-19 Source of Funds by Departments…………………………………………………………… 4-21 FUND SUMMARIES 5-1 Summary of Funds…………………………………………………………………………… 5-1 General Fund - Revenue…………………………………………………………………… 5-3 General Fund - Expenditures………………………………………………………………… 5-4 Community Promotion Fund………………………………………………………………… 5-5 City Leased Property Fund…………………………………………………………………… 5-6 Economic Recovery Plan Fund……………………………………………………………… 5-7 Forfeited Asset Fund………………………………………………………………………… 5-8 Safety Augmentation Fund…………………………………………………………………… 5-9 TABLE OF CONTENTS I
-
Upload
khangminh22 -
Category
Documents
-
view
0 -
download
0
Transcript of city of palm springs, california

CITY OF PALM SPRINGS, CALIFORNIA
TABLE OF CONTENTS………………………………………………………………………………… I
READER'S GUIDE TO THE BUDGET……………………………………………………………… i
BUDGET SUMMARY 1-1 Budget Message……………………………………………………………………………… 1-1
BUDGET OVERVIEW 2-1Budget Process……………………………………………………………………………… 2-1Budget Roles and Responsibilities………………………………………………………… 2-2Explanation or Revenue Sources…………………………………………………………… 2-3Budget Summary - Operating Funds……………………………………………………… 2-4Revenues - Operating Funds (Graph)……………………………………………………… 2-5Appropriations - Operating Funds (Graph)………………………………………………… 2-6Fiscal Year comparison of Operating Funds (Graph)…………………………………… 2-7Appropriation Summary - All Funds………………………………………………………… 2-8Appropriation Detail - All Funds……………………………………………………………… 2-9Appropriation by Fund - Internal Service Fund (Graph)………………………………… 2-13Authorized Positions by Service Area (Graph)…………………………………………… 2-14FY 2013-14 Budget Calendar…………………………………………………………….. 2-15CITY INFORMATION 3-1City Government……………………………………………………………………………… 3-1City Organization Chart……………………………………………………………………… 3-5Vision & Mission Statement………………………………………………………………… 3-6MANAGEMENT & BUDGET POLICIES 4-1Legal Requirements Regarding Annual Budget…………………………………………… 4-2Budgetary Controls/Accounting Basis……………………………………………………… 4-2Description of Reporting Entities…………………………………………………………… 4-3General Management and Budget Policies………………………………………………… 4-6Revenue Policy……………………………………………………………………………… 4-7Reserves Policy……………………………………………………………………………… 4-7Capital Improvement Program Policy……………………………………………………… 4-7Investment Policy……………………………………………………………………………… 4-8Debt Administration and Policies…………………………………………………………… 4-17Grant Administration Policy………………………………………………………………… 4-19Cost Accounting Application………………………………………………………………… 4-19Article XIIIB Appropriations Limit…………………………………………………………… 4-19Source of Funds by Departments…………………………………………………………… 4-21FUND SUMMARIES 5-1Summary of Funds…………………………………………………………………………… 5-1General Fund - Revenue…………………………………………………………………… 5-3General Fund - Expenditures………………………………………………………………… 5-4Community Promotion Fund………………………………………………………………… 5-5City Leased Property Fund…………………………………………………………………… 5-6Economic Recovery Plan Fund……………………………………………………………… 5-7Forfeited Asset Fund………………………………………………………………………… 5-8Safety Augmentation Fund…………………………………………………………………… 5-9
TABLE OF CONTENTS
I

CITY OF PALM SPRINGS, CALIFORNIAFUND SUMMARES (continued)Indian Gaming Special Distribution Fund………………………………………………… 5-10Special Development Fund………………………………………………………………… 5-11CSA 152 Fund……………………………………………………………………………… 5-12Recycling Fund……………………………………………………………………………… 5-13Palm Springs Villagefest…………………………………………………………………… 5-14Neighborhood Involvement Fund………………………………………………………… 5-15Business Improvement District…………………………………………………………… 5-16Energy Efficient Loan Program…………………………………………………………… 5-17Parking Fund………………………………………………………………………………… 5-18Parking Capital Fund……………………………………………………………………… 5-19Gas Tax Fund……………………………………………………………………………… 5-20Measure "A" Fund………………………………………………………………………… 5-21Drainage Fund……………………………………………………………………………… 5-22Emergency Response Fund……………………………………………………………… 5-23Community Development Block Grant Fund…………………………………………… 5-24Sustainability………………………………………………………………………………… 5-25Master Lease Fund………………………………………………………………………… 5-26CFD Public Safety #1……………………………………………………………………… 5-27Land/Lite/Park Maintenance District……………………………………………………… 5-28Air Quality Management Fund…………………………………………………………… 5-29Public Arts Fund…………………………………………………………………………… 5-30Library Trust Fund………………………………………………………………………… 5-31Quimby Act Fees Fund…………………………………………………………………… 5-32Special Projects Fund (160)..……………………………………………………………… 5-33Special Grants Fund……………………………………………………………………… 5-34Measure J Sales Tax…………………………………………………………………….. 5-35Capital Projects Fund……………………………………………………………………… 5-36General Debt Service Fund……………………………………………………………… 5-37Assessment District Fund………………………………………………………………… 5-38Airport CFC Fund…………………………………………………………………………… 5-39Airport PFC Fund…………………………………………………………………………… 5-40Airport Fund (415)………………………………………………………………………… 5-41Airport Fund (416)………………………………………………………………………… 5-42Wastewater Fund…………………………………………………………………………… 5-43Golf Course Fund…………………………………………………………………………… 5-44Motor Vehicles Replacement Fund……………………………………………………… 5-45Facilities Maintenance Fund……………………………………………………………… 5-46Employee Retirement Benefit Fund……………………………………………………… 5-47Risk Management Fund…………………………………………………………………… 5-48Retiree Health Insurance Fund…………………………………………………………… 5-49Cogeneration Fund………………………………………………………………………… 5-50
TABLE OF CONTENTS (page two)
II

CITY OF PALM SPRINGS, CALIFORNIADEPARTMENT SUMMARIES
Administration………………………………………………………………………………………… 6-1City Council (001-1010)……………………………………………………… 6-1City Manager (001-1100)……………………………………………………… 6-2Development Services (001-1113)…………………………………………… 6-3Neighborhood Involvement (001-1114)……………………………………… 6-4Information Technology (001-1120)………………………………………… 6-5City Clerk / Chief of Staff (001-1150)………………………………………… 6-6Human Resources (001-1160)………………………………………………… 6-7Rent Control (001-1180)……………………………………………………… 6-8City Attorney (001-1200)……………………………………………………… 6-9Unallocated Compensation (001-1220)……………………………………… 6-10Salary Savings - Offsets (001-1221)………………………………………… 6-11Public Affairs/PSCTV (001-1231)…………………………………………… 6-12Document Management (001-1261)………………………………………… 6-13Finance & Treasury (001-1300)……………………………………………… 6-14Procurement (001-1330)……………………………………………………… 6-15Appropriation for Contingencies (001-9001)………………………………… 6-16
Growth Management………………………………………………………………………………… 6-17Community & Economic Development (001-1400)………………………… 6-17Econ Recovery/Development Plan (001-2021)……………………………… 6-18Homeless Program (001-1402)……………………………………………… 6-19Planning Services (001-4151)………………………………………………… 6-20Building & Safety (001-4161)………………………………………………… 6-21Community Development Block Grant (137-4815)………………………… 6-22Sustainability (138-1270)……………………………………………………… 6-23Recycling/Franchise Administration (125-1280)…………………………… 6-24Land/Lite/ Park Maintenance District (141-4310)…………………………… 6-25Air Quality Management (149-4609)………………………………………… 6-26Art Acquisitions (150-4408)…………………………………………………… 6-27
Quality of Life………………………………………………………………………………………… 6-28Parks Maintenance (001-2451)……………………………………………… 6-28Recreation Program (001-2510)……………………………………………… 6-29Tennis Center (001-2511)……………………………………………………… 6-30Palm Springs Skate Park (001-2512)………………………………………… 6-31Swim Center (001-2515)……………………………………………………… 6-32Demuth Community Center (001-2516)……………………………………… 6-33James O. Jessie Desert Highland Unity Center (001-2516)……………… 6-34Library (001-2710)……………………………………………………………… 6-35Palm Springs Villagefest (127-2550)………………………………………… 6-36Library Trust (151-2752)……………………………………………………… 6-37Quimby Park & Recreation (152-2460)……………………………………… 6-38
TABLE OF CONTENTS (page three)
III

CITY OF PALM SPRINGS, CALIFORNIADEPARTMENT SUMMARIES (continued)
Public Safety…………………………………………………………………………………………… 6-39Police Admin (001-3010)……………………………………………………… 6-39Jail Operations (001-3011)…………………………………………………… 6-40Downtown Experience - Police (001-3019)………………………………… 6-41Recovery Act COP Match (001-3020)……………………………………… 6-42Police Special Distribution Fund (001-3027)………………………………… 6-43Animal Control (001-3304)…………………………………………………… 6-44Animal Shelter (001-3305)…………………………………………………… 6-45Dispatch Center (3400)………………………………………………………… 6-46911 Emergency Response (136-1291)……………………………………… 6-47Forfeited Assets - Police (120-3012)………………………………………… 6-48Safety Augmentation - Police (121-3013)…………………………………… 6-49Police Special Distribution Fund( 122-3025)………………………………… 6-50Community Facilitities - Police (140-3026)………………………………… 6-51Police Special Projects (160-4509)…………………………………………… 6-52Recovery Act COPS (170-3220)……………………………………………… 6-53Police AB 109 (170-3212)……………………………………………………… 6-54PAL Officer (170-3221)………………………………………………………… 6-55Fire Admin (001-3520)………………………………………………………… 6-56Disaster Preparedness (001-3522)…………………………………………… 6-57Fire - Safer Grant (001-3521)………………………………………………… 6-58Fire Special Distribution Fund (001-3527))………………………………… 6-59Safety Augmentation - Fire (121-3523)……………………………………… 6-60Fire Special Distribution Fund (122-3525)…………………………………… 6-61Community Facilities District - Fire (140-3526).…………………………… 6-62Parking Control (134-4461)…………………………………………………… 6-63
Public Works & Engineering………………………………………………………………………… 6-64Engineering (001-4171)……………………………………………………… 6-64Street Maintenance (001-4201)……………………………………………… 6-65Downtown Experience - Maintenance (001-4210)………………………… 6-66Street Cleaning (001-4240)…………………………………………………… 6-67Street Lighting (001-4301)…………………………………………………… 6-68Railroad Station (001-4471)…………………………………………………… 6-69CSA 152 & NPDES (124-4242)……………………………………………… 6-70Parking Projects & Programs (132-4462)…………………………………… 6-71Structure Maintenance (131-4464)…………………………………………… 6-72Land Lite Park Maintenance District (141-4310)…………………………… 6-73Special Projects (160-4501 thru 4524)……………………………………… 6-74
Marketing & Tourism………………………………………………………………………………… 6-75Visitor Information Center (001-2116)……………………………………… 6-75Tourism (001-2117)…………………………………………………………… 6-76
TABLE OF CONTENTS (page four)
IV

CITY OF PALM SPRINGS, CALIFORNIADEPARTMENT SUMMARIES (continued)
Marketing & Tourism (Continued)………………………………………………………………… 6-77Special Events (001-2118)…………………………………………………… 6-77Special Contributions (001-2119)…………………………………………… 6-78Event Sponsorship (001-2120)……………………………………………… 6-79
Master Lease…………………………………………………………………………………………… 6-80
Debt Service…………………………………………………………………………………………… 6-81Cal Energy Loan (301-7850)………………………………………………… 6-81Convention Center (301-7852)……………………………………………… 6-82COPS 2007 (301-7868).……………………………………………………… 6-83Parking Structure (301-7872)………………………………………………… 6-84Measure J Debt (301-7878)…………………………………………………… 6-85
Assessment Districts………………………………………………………………………………… 6-86A.D. 143 (311-7857)…………………………………………………………… 6-86A.D. 146 (313-7859)…………………………………………………………… 6-87A.D. 155 Debt Service (315-7861)…………………………………………… 6-88A.D. 159 (322-7876)…………………………………………………………… 6-89A.D. 157/158 Refinance (324-7870)………………………………………… 6-90A.D. 161 (325-7871)…………………………………………………………… 6-91A.D. 162 (326-7874)…………………………………………………………… 6-92A.D. 164 (327-7875)…………………………………………………………… 6-93
Airport…………………………………………………………………………………………………… 6-94Airport Customs Facility (405-6003)………………………………………… 6-94PFC Administration (405-6001)……………………………………………… 6-95Airport Series 2006 Debt (410-6277)………………………………………… 6-96Airport Series 2008 Debt (410-6278)………………………………………… 6-97Airport Administration (415-6002)…………………………………………… 6-98Corporate Yard Property (415-6010)………………………………………… 6-99Airside Security (415-6022)…………………………………………………… 6-100Airport Operations (415-6050)………………………………………………… 6-101Airport Rescue Firefighting (415-6075)……………………………………… 6-102Landside Operations (415-6100)……………………………………………… 6-103Airport Grounds Maintenance (415-6175)…………………………………… 6-104Terminal Building Operations (415-6200)…………………………………… 6-105Control Center Operations (415-6225)……………………………………… 6-106Customs (415-6250)…………………………………………………………… 6-107
TABLE OF CONTENTS (page five)
V

CITY OF PALM SPRINGS, CALIFORNIADEPARTMENT SUMMARIES (continued)
Airport (Continued)……………………………………………………………………………………………Airport Development (416-6401)……………………………………………… 6-108Special Capital Projects (416-6501)………………………………………… 6-109Federal Grants (416-6601)…………………………………………………… 6-110
Wastewater…………………………………………………………………………………………… 6-111Wastewater Administration (420-6800)……………………………………… 6-111
Golf Course…………………………………………………………………………………………… 6-112Resort Golf Course Maintenance & Operations (430-7021)……………… 6-112Resort Course Debt Service (430-7056)…………………………………… 6-113
Motor Vehicle Replacement………………………………………………………………………… 6-114Fleet Operations (510-5470)………………………………………………… 6-114MVR Reserves (510-5475)…………………………………………………… 6-115
Facilities Maintenance (520-5641)………………………………………………………………… 6-116
Employee Retirement Benefits (530-5701)……………………………………………………… 6-117
Risk Management …………………………………………………………………………………… 6-118Employee Benefits (540-5902)……………………………………………… 6-118Workers Compensation (520-5903)………………………………………… 6-119Liability Insurance (520-5904)………………………………………………… 6-120Property Insurance (540-5905)……………………………………………… 6-121Unemployment (540-5919)…………………………………………………… 6-122
Retiree Health (541-5912)…………………………………………………………………………… 6-123
Energy…………………………………………………………………………………………………… 6-124Energy Administration (550-5805)…………………………………………… 6-124Sunrise Plaza Cogen (550-5806)…………………………………………… 6-125Municipal Complex Cogen (550-5807)……………………………………… 6-126Energy Development (550-5812)…………………………………………… 6-127
Contractual Obligations……………………………………………………………………………… 6-128GPSCVB (001-2101)…………………………………………………………… 6-128International Film Festival (001-2120)……………………………………… 6-129Convention Center (001-2180)……………………………………………… 6-130Plaza Theatre (001-2197))…………………………………………………… 6-131City Leased Property (113-2199)…………………………………………… 6-132
TABLE OF CONTENTS (page six)
VI

CITY OF PALM SPRINGS, CALIFORNIAREDEVELOPMENT AND SUCCESSOR AGENCY 7-1
Redevelopment Program Summary………………………………………… 7-1Successor Agency Program Summary……………………………………. 7-2Merged Area #1………………………………………………………………… 7-3Merged Area #2………………………………………………………………… 7-4Low & Moderate Housing……………………………………………………… 7-5Merged #1 CAP Successor………………………………………………….. 7-6Merged #2 CAP Successor………………………………………………….. 7-7Successor Area Debt #1……………………………………………………… 7-8Successor Area Debt #2……………………………………………………… 7-9Housing Successor…………………………………………………………… 7-10Successor Debt Service……………………………………………………… 7-11
CAPITAL IMPROVEMENTS 8-1Program Summary……………………………………………………………… 8-1Program Detail………………………………………………………………… 8-3Enterprise Funds……………………………………………………………… 8-4Measure J Funds……………………………………………………………… 8-5
APPENDIXAuthorized Personnel…………………………………………………………………………………… A-1Benefits Rate Sheet 2013……………………………………………………………………………… B-1Resolutions……………………………………………………………………………………………… C-1Division of Property Taxes…………………………………………………………………………… D-1GANN Appropriations Limit…………………………………………………………………………… E-1Comparison of Surrounding Cities…………………………………………………………………… F-1Population & Statistics………………………………………………………………………………… G-1Palm Springs Demographic Overview……………………………………………………………… H-1Economic Overview…………………………………………………………………………………… I-1Performance Measure Indicators………………………………………………………………….. J-1Most Frequently Asked Questions…………………………………………………………………… K-1Glossary………………………………………………………………………………………………… L-1Acronyms………………………………………………………………………………………………… M-1
TABLE OF CONTENTS (page seven)
VII

i
READER’S GUIDE TO THE BUDGET DOCUMENT This budget document is divided into nine tabbed sections. The following information will explain the content and purpose of each section: Budget Summary This first section of the budget document contains the budget message, which highlights the fiscal outlook and strategies to be implemented for this budget year. The budget message also summarizes the final budget results regarding revenues, expenditures, transfers in and out, personnel changes, capital projects, and the enterprise funds. Also in this section is the City’s Vision, Mission Statement and any budget awards the City has received. Budget Overview The Budget Overview section contains both general budget information and summarized financial information. The summarized financial information first concentrates on reporting the “operating” revenue and expenditure balances both in report and graph formats. In Palm Springs, operating funds include the General Fund. The Budget Summary-Operating Funds report shows the final budgeted operating revenues and expenditures, transfers in and out, and any projected savings. This report also identifies any surplus or deficit. The operating revenue graph is categorized by eleven major revenue sources, such as property taxes and sales/use taxes. The operating expenditures graph is summarized by seven service area categories, such as administration, growth management, and public safety. Following the operating report and graphs is the Appropriation Summary - All Funds. This report is a summary of all appropriations (exclusive of the Redevelopment Agency, which has its own section) and is categorized by five fund groupings and various service area categories. The five fund groupings include the operating, special revenue, enterprise, internal service, and debt service fund categories. An Appropriations Detail report follows the above report and identifies the appropriations at the departmental level. The information on the Appropriations Detail report further ties to the individual department sheets located in the Department Summaries section. Concluding the Budget Overview section is a graph showing the breakdown of the internal service funds and a graph showing the distribution of authorized positions by service area. City Information This City Information section contains general city information along with the City’s organizational chart. The Vision and Mission Statement are also included in this section. Management & Budget Policies The Management & Budget Policies section contains various city policies such as the legal requirements regarding the annual budget, controls and accounting basis, description of reporting entities, general management and budget policies, the revenue and reserves policies, capital improvement policy, investment policy, debt and grant administration policies, cost accounting policy, the Articles XIIIB Appropriations Limit and the source of funds by department. Fund Summaries The Fund Summary section begins with a combined summary of revenues, expenditures, transfers & fund balances for all Fiscal Year 13-14 funds within the city (exclusive of the Successor Agency.) This combined fund summary report is followed by summaries of each individual fund. The Individual Fund Summaries shows the sources (revenues) and uses (expenditures) detail for each fund within the City. The fund title and account number are identified at the top of each fund sheet. These sheets also identify the transfers in and out as well as the ending balance for each fund and also provide a 5- year picture of each fund.

ii
Department Summaries The Department Summaries section explains the purpose and task of each department, identifies the department’s objectives and prior year’s accomplishments, reports the current year’s approved expenditure budget and shows the prior two years’ budget and actual expenditures for comparison purposes, and concludes with identifying the authorized employee positions for that department. The Redevelopment Agency is excluded from this section. The current year adopted budget information ties to the Appropriations Detail report located in the Budget Overview section and the employee positions tie to the allocated position report located in the Appendix section. Successor Agency This section reports the departmental information as identified above for the late Redevelopment Agency and the newer areas of the Successor Agency. Capital Improvements / Measure J Capital The Capital Improvement section identifies those specific projects that were approved in this year’s budget. This section includes the City’s Measure J Funds as well. Appendix The Appendix section contains population, statistical, demographical, and general City information. Examples of items covered in this area include an authorized personnel report, Benefit Rate sheet, budget resolutions; property tax distribution graphics, GANN appropriations limit information, various City statistics, frequently asked questions, a glossary and acronyms listing.

2-1
BUDGET OVERVIEW BUDGET PROCESS The budget process is the key to the development of Palm Springs’ strategic plan – allowing departments the opportunity to reassess goals and objectives and the means for accomplishing them. Though the budget is reviewed by the Council in late March and adopted as early as May but not later than June 30, its preparation begins several months prior, with projection of City reserves, revenue and expenditure forecasts, and citizen commissions and departmental needs assessment. It is with this groundwork that departmental expenditure requests are made and subsequently reviewed. At the middle of December in the prior year through January, each department assesses its current activities and reviews its spending records provided through the City’s Finance department. This information is used as a base for developing the following year’s plan. Department Heads confer with their staff to develop a work plan and to estimate necessary financing. Revenue estimates are developed by the Finance Department, with the help of other departments that generate fees and/or charges. In early February, the departmental budget assessments are returned to the Finance Department for review and compilation. During the month of February, the Finance Director, meets with the department directors to discuss their requests and gather additional budget information. This information is then compiled into a rough draft assessment for each department. These assessments are then taken to the Budget Committee, consisting of the City Manager, Chief of Staff, Finance Director, and the Human Resources Director, for review. Also in January, the departments return the Capital Improvement Budget requests to the Finance Department for review and compilation. These requests consist of the Measure J and Other Capital Budget Worksheets. Requests are also then taken to the Budget Committee, which meets every Tuesday during the January-June budget preparation period, for review. After the Budget Committee has reviewed each departmental budget and the Capital Improvement Budget, the desired changes are then incorporated into the preliminary budget document in mid-March. The Preliminary Budget document is then submitted to the City Council at the first study session in April. Budget documents are available to the general public and the citizens of Palm Springs on the City’s website, in the City Clerks’ office and the City Library. Throughout the months of April and May, the Finance Department conducts Council Meetings and Study Sessions on the departmental budgets and the Capital Improvement Budget for the Public and the City Council. All Council and City Manager changes are then incorporated into the Proposed Budget document. The Proposed Budget document is then presented to City Council as early as May but no later than the first City Council meeting in June, where a public hearing is conducted. After receiving citizen input, and any additional Council input, the budget is adopted at this meeting or a subsequent meeting prior to June 30. At each step of the budget process, the information is stored through the City’s electronic data processing system. Changes can be made easily and the remaining information stored for the next budget cycle. After approval of the budget, the adopted revenue and appropriations are automatically posted in the City’s accounting ledgers. All City departments are required to monitor their budgets and spend only amounts allocated by the City Council. However, during the year, unforeseen costs arise which cannot be accommodated within the original adopted budget. For these circumstances, the City Manager may recommend budget modifications to the City Council. The City Council may approve budget modification resolutions to make the necessary changes. At any meeting after the adoption of the budget, appropriations may be modified and/or transferred by adoption of a resolution by Council.

2-2
BUDGET OVERVIEW BUDGET ROLES AND RESPONSIBILITIES Every employee plays a role in budgeting – whether in its formulation, preparation, implementation, administration or evaluation. Ultimately, of course, each Department head, through the City Manager, is accountable to the City Council for the performance of departmental personnel in meeting specific objectives within allocated resource limits. Actual budget responsibility can be identified more specifically:
The Finance Department and its Audit and Budget division staff are responsible for preparing an estimate of
remaining cost requirements for the current fiscal year, projecting the base budget requirements for the next fiscal year and developing other requests that change or revise the program so that it will be more effective, efficient, productive and economical.
The Senior Financial Analyst serves as a vital role in the budget preparation. Responsible for coordinating
information, making sure all the necessary documentation is submitted, monitoring the internal review process to meet timelines, and serving as a troubleshooter for problems throughout the budget process.
The Capital Improvement Plan (CIP) for the City is compiled by the budget review committee from the
Departmental Requests at the same time as the Departmental Budget. The committee is comprised of the City Manager, Chief of Staff, and Finance Director. The committee is responsible for reviewing all capital projects for timing and cost considerations and preparing a preliminary capital improvement plan recommendation for review and revision by the Department Directors and City Council.
Department Directors are responsible for reviewing historical performance, anticipating future problems and
opportunities, considering alternative solutions, and modifying and assembling their departmental data into a cohesive budget information package. Department Directors critically evaluate all requests, prioritize and submit a budget plan including only those requests that support Council policies, City Manager and administrative direction and departmental mission.
The Finance Director, Assistance Finance Director and Audit & Budget staff within the Finance department are
responsible for preparing short-range and long-range revenue and expenditure forecasts, calculating departmental budget targets, assisting departments, reviewing departmental budgets with Department Directors or staff, collating, analyzing, and summarizing departmental requests and preparing budget review materials for the Budget Committee and City Council.
The Budget Committee’s key role is translating City Manager and City Council goals and objectives for the City
into recommended funding decisions. They are responsible for reviewing the departmental operating and CIP requests and submitting their recommendations for review by the City Council.
The City Manager is responsible for reviewing the total financial program and submitting it to the City Council.
The City Council is responsible for the review of the proposed budget and adoption of the final budget.

2-3
BUDGET OVERVIEW EXPLANATION OF REVENUE SOURCES The City of Palm Springs receives funding from multiple sources. Various staff members from Engineering, Planning, Building, Fire, Police, Library, Public Works, Parks & Recreation and the Airport worked in concert with the Budget staff to develop revenue projections for the coming fiscal year. The projections reflect a somewhat conservative approach due to the uncertainties of the State’s budget and the overall state of the economy. Staff considered both the qualitative and quantitative methods of forecasting and used techniques such as trend analysis, economic indicators, and professional judgment to arrive at a consensus as to the forecasted revenue. Revenue forecasting is one of the most challenging aspects in the budget process, as many unknown variables including economic changes, over which the City has no control, affect the ultimate amount of monies going into the City’s treasury. These variables include the impact of fluctuations in the local, regional and overall economy, consumer habits and demands, and legislative acts. The schedules in the Budget Overview section summarize both the Operating Funds and the various departmental costs covering all the departments exclusive of the Redevelopment Agency. The schedules in the financial summaries section include specific details for all funds and departments, again exclusive of the Redevelopment Agency. Listed below is a brief description of each City funding source: Operating Funds – The City of Palm Springs historically combined the General Fund and the Community Promotion Fund into
“Operating Funds”. In Fiscal Year 2010-11, the City blended its Community Promotion Fund into the General Fund to create one Fund. The General Fund now accounts for all the general revenue of the City including revenues related to the promotional efforts of the City with regards to tourism and related activities. The top three operational fund revenues for the City of Palm Springs are:
Property Tax – The City receives Property Tax revenues in the form of Secured, Unsecured, Supplemental, Homeowners’
Exemption, Interest and Penalties, and Real Property Transfer Taxes. In accordance with State law, property is assessed at actual full cash value and the maximum tax is 1% of the assessed valuation. Increases in the assessed valuation are limited to 2% per year unless there is a change in property ownership or improvements to the property.
Transient Occupancy Tax (TOT) – is a tax assessed per room night on guests staying in City hotels or other boarding
type facilities. The Tax applies only to Transients. A Transient is a guest who stays 28 consecutive days or less. The TOT rate was increased effective Jan. 1, 2004 from 12.5% to 13.5% for Group Meeting Hotels (generally hotels more than 125 units). The rate remains at 11.5% for all other hotels and boarding facilities.
Sales Tax – The 8.75% Sales and Use Tax is collected by the State Board of Equalization. The City receives 1% of the total based on sales within its jurisdiction. See Appendix D for a full look of the distribution of sales tax.
Measure J Funds – A local 1% sales and use tax revenue to maintain local community services and economically revitalize
the downtown area. This Sales and Use Tax was approved by the voters of the City of Palm Springs on November 8, 2011 and is in place for 25 years.
Special Revenue Funds – These funds are used to account for specific revenues that are legally restricted to expenditures for particular purposes.
Enterprise Funds – These funds are used to account for operations that are financed and operated in a manner similar to
private business enterprises. The intent of the governing body is that the costs of providing goods or services to the general public be financed or recovered primarily through user charges.
Internal Service Funds – These funds are used to account for the financing of goods or services provided by one department
or agency of the City to other departments or agencies on a cost reimbursement basis. Debt Service Funds – These funds are used to account for the accumulation of resources for, and the payment of, general
long-term debt principal and interest.

2-4
BUDGET OVERVIEW BUDGET SUMMARY-OPERATING FUNDS*ADOPTED
2013-14
FUNDS AVAILABLE Revenue Property Tax 16,697,508 TOT 18,600,000 Sales Tax ** 10,999,353 Measure J Sales Tax 9,300,000 Utility Users Tax 7,000,000 Franchise Fees 3,000,000 Motor Vehicle License Fees *** 3,481,240 Administrative Service Charges 1,639,079 Business License 875,000 Building Permits 900,000 New Development Tax 120,000 All Other 5,527,449 Total Revenue 78,139,629 Transfers In From: Gas Tax (133) 600,000 Airport General Operations (415) 287,500 Total Transfer In 887,500 Total Operating Funds Available 79,027,129
FUNDS REQUIRED
Appropriations 72,550,399
Transfer Out To: Debt Service - Police Building 52,543 Parking Structure 411,000 Total Transfers for Debt 463,543 Master Lease (139) 363,472 Public Safety - CFD (140) 270,102 Parking Fund - Operations (131) 213,462 Emergency Response Fund (136) 321,424 Capital Projects - Measure J 9,300,000 Golf Course (430) 457,218 Total Transfer Out 11,389,221 Total Operating Funds Required 83,939,620 Operating Surplus (Deficit) (4,912,491)
(*Operating Funds include General Fund 001 in FY 2013-14)(**Sales Tax includes Triple Flip ERAF Reimbursement of $2,350,000.)(***Motor Vehicle License Fees includes In Lieu Property Tax (MVIL) of $3,481,240.)

2-5
BUDGET OVERVIEW REVENUES – OPERATING FUNDS
MAJOR OPERATING FUND REVENUES
The following graph and schedule identify the major sources of revenue for the 2013-14 adopted operating budget.
2013-14 Revenue Comparison of Percent of Total
ADOPTED ADOPTED ADOPTED % CATEGORY 2011-12 2012-13 2013-14 CHANGE
Property Taxes 17,043,345$ 16,757,221$ 16,697,508$ -0.4%Sales & Use Taxes** 9,025,000 10,599,525 10,999,353 3.8%Transient Occupancy Tax (TOT) 14,300,000 17,500,000 18,600,000 6.3%Measure J Sales Tax 0 8,000,000 9,300,000 16.3%Utility Users Tax 6,525,000 6,525,000 7,000,000 7.3%Franchise Fees 3,000,000 3,000,000 3,000,000 0.0%Motor Vehicle In Lieu Tax * 3,922,000 3,481,240 3,481,240 0.0%New Development Tax*** 120,000 120,000 120,000 0.0%Administrative Charges 1,673,138 1,672,445 1,639,079 -2.0%Business License 800,000 900,000 875,000 -2.8%Building Permits 675,000 900,000 900,000 0.0%All Other Sources 5,717,950 6,085,344 5,527,449 -9.2%TOTALS 62,801,433$ 75,540,775$ 78,139,629$ 3.4%
MAJOR OPERATING FUND REVENUES
* includes Backfill Reimbursement ** Includes Triple Flip ERAF Reimbursement. Effective FY 2004-05
New Development percentage too small to show on graph
Property Taxes 21%
Sales & Use Taxes** 14%
Transient Occupancy Tax (TOT)
23%
Measure J Sales Tax 11%
Utility Users Tax 9%
Franchise Fees 4%
Motor Veh In Lieu Tax 5%
New Develop
.01%
Administrative Charges
2%
Business License
1%
Building Permits 1%
Other Sources 9%

2-6
BUDGET OVERVIEW APPROPRIATIONS - OPERATING FUNDS
OPERATING FUND APPROPRIATIONS
operating budget.
ADOPTED ADOPTED ADOPTED %CATEGORY 2011-12 2012-13 2013-14 CHANGE
Administration 8,866,585$ 8,702,895$ 9,360,645$ 7.6%Growth Management 3,460,916 4,365,313 4,642,534 6.4%Quality of Life 8,118,278 9,549,099 9,181,277 -3.9%Public Safety 29,090,702 31,542,469 33,920,892 7.5%Public Works & Engineering 4,653,538 4,114,186 5,577,487 35.6%Marketing & Tourism 2,155,633 2,318,550 2,274,684 -1.9%Contractual Obligations** 7,495,024 7,533,902 7,592,880 0.8%TOTALS 63,840,676$ 68,126,514$ 72,550,399$ 6.5%
** Debt Service included in Convention Center (2180)
OPERATING FUND APPROPRIATIONS
The following graph and schedule identify the major appropriations or expenditures for the 2013-14 adopted
Administration 13%
Growth Management
6%
Quality of Life 13%
Contractual Obligations
10%
Marketing & Tourism
3%
Public Works & Engineering
8%
Public Safety 47%

2-7
BUDGET OVERVIEW FISCAL YEAR COMPARISON OF OPERATING FUNDS
Fiscal Adopted InflationYear Budget Trend CPI
2004-05 53,877,394 50,351,645 200.72005-06 57,076,147 53,682,991 211.12006-07 59,329,226 54,191,594 217.22007-08 64,047,325 58,243,375 229.02008-09 67,554,078 58,997,887 223.92009-10 58,775,538 56,939,573 225.92010-11 60,629,299 57,440,801 232.32011-12 63,840,676 59,058,411 236.02012-13 68,126,514 59,252,188 239.3 *2013-14 72,550,399 61,032,297 240.0 *** May 2013 Used, ** Estimated
June - Los Angeles Riverside Orange Co Ca (CPI-U)http://data.bls.gov/cgi-bin/surveymost
Insert - Panorama Palm Springs California postcard by The POSTCARDDEPOT
The Operating Funds consist of the General Fund and the operations portion of the Convention Center. The amounts above are from the original Adopted Budgets. This graph represents a 10-Year Comparison.
$30,000,000
$35,000,000
$40,000,000
$45,000,000
$50,000,000
$55,000,000
$60,000,000
$65,000,000
$70,000,000
$75,000,000
04-05 05-06 06-07 07-08 08-09 09-10 10-11 11-12 12-13 13-14
Adopted Budget Inflation Trend

2-8
BUDGET OVERVIEW APPROPRIATION SUMMARY - ALL FUNDS
SPECIAL INTERNAL DEBTOPERATING REVENUE ENTERPRISE SERVICE SERVICE
ACTIVITY NAME FUNDS FUNDS FUNDS FUNDS FUNDS TOTAL
Administration 9,360,645 9,360,645 Growth Management 4,642,534 3,032,459 7,674,993 Quality of Life 9,181,277 1,825,870 11,007,147 Public Safety 33,920,892 1,817,051 35,737,943 Public Works & Engineering 5,577,487 705,317 6,282,804 Marketing & Tourism 2,274,684 2,274,684 Debt Service 8,106,844 8,106,844 Assessment Districts 753,334 753,334 Master Lease 1,635,649 1,635,649 Airport 36,012,214 36,012,214 Wastewater Treatment Plant 6,424,601 6,424,601 Golf Course 5,553,533 5,553,533 Motor Vehicle Replacement 3,270,772 3,270,772 Facilities Maintenance 3,970,214 3,970,214 Retirement Benefits 13,453,836 13,453,836 Risk Management 12,146,875 12,146,875 Retiree Health Insurance 2,329,759 2,329,759 Energy 2,753,803 2,753,803 Contractual Obligations 7,592,880 7,592,880 Capital Projects 12,598,937 12,598,937
Total Appropriation Summary 72,550,399 19,979,634 47,990,348 37,925,259 10,495,827 188,941,467
This summary covers all City funds with the exception of the Successors Agency, which is reported in its owns section of this budget document.

2-9
BUDGET OVERVIEW APPROPRIATION DETAIL - ALL FUNDSSPECIAL INTERNAL DEBT
OPERATING REVENUE ENTERPRISE SERVICE SERVICEACTIVITY # - NAME FUNDS FUNDS FUNDS FUNDS FUNDS TOTALAdministration1010 City Council 627,539 627,5391100 City Manager 653,315 653,3151113 Development Services 0 01114 Neighborhood Involvement 175,644 175,6441120 Information Technology 1,159,826 1,159,8261150 City Clerk 953,634 953,6341160 Human Resources 423,417 423,4171180 Rent Control 42,400 42,4001200 City Attorney 706,351 706,3511220 Unallocated Compensation 1,060,000 1,060,0001231 Public Affairs/PSCTV 284,328 284,3281261 Document Management 166,962 166,9621300 Finance 2,595,272 2,595,2721330 Procurement 511,957 511,9579001 Appropriations for Contingencies 0 0
Subtotal 9,360,645 9,360,645Growth Management1400 Community & Economic Dev. 1,203,870 1,203,8701402 Homeless Program 103,000 103,0002122 Economic Recovery/Dev Plan 0 04151 Planning Services 1,203,933 1,203,9334161 Building & Safety 2,131,731 2,131,7311270 Sustainability 1,091,615 1,091,6151280 Recycling 1,145,000 1,145,0004815 Community Dev Block Grant 311,205 311,2054609 AQMD 55,000 55,0004408 Art Acquisitions 429,639 429,639
Subtotal 4,642,534 3,032,459 7,674,993Quality of Life1291 Emergency Response 1,361,424 1,361,4242451 Parks Maintenance 3,332,405 3,332,4052510 Recreation 1,732,010 1,732,0102511 Tennis Center 22,500 22,5002512 Palm Springs Skate Park 160,000 160,0002515 Swim Center 640,944 640,9442516 Demuth Community Center 228,474 228,4742590 James O. Jessie DHUC 637,609 637,6092710 Library 2,427,335 2,427,3352550 VillageFest 433,346 433,3462752 Library Trust 31,100 31,100
Subtotal 9,181,277 1,825,870 11,007,147Public Safety3010 Police 18,064,653 18,064,6533011 Jail Operations 186,403 186,4033019 Downtown Experience - Police 755,750 755,7503220 Recovery Act COPS 28,464 28,4643212 Police AB 109 200,000 200,0003027 Police SDF 655,193 655,1933304 Animal Control 452,304 452,3043305 Animal Shelter 1,012,763 1,012,7633400 Dispatch Center 1,209,921 1,209,9213012 Forfeit Assets-Police 2,000 2,0003013 Safety Aug-Police 415,381 415,3814461 Parking Control 143,985 143,9853026 CFD -Police 361,100 361,1004509 Police Special Charges 100,000 100,0003520 Fire 10,991,947 10,991,9473522 Disaster Preparedness 136,093 136,0933523 Safety Aug-Fire 321,503 321,5033527 Fire-SDF Indian Gaming 455,865 455,8653526 CFD -Fire 244,618 244,618
Subtotal 33,920,892 1,817,051 35,737,943

2-10
BUDGET OVERVIEW APPROPRIATION DETAIL - ALL FUNDSSPECIAL INTERNAL DEBT
OPERATING REVENUE ENTERPRISE SERVICE SERVICEACTIVITY # - NAME FUNDS FUNDS FUNDS FUNDS FUNDS TOTALPublic Works & Engineering4171 Engineering 1,923,811 1,923,8114201 Street Maintenance 1,308,716 1,308,7164210 Downtown Experience Maint. 1,168,795 1,168,7954240 Street Cleaning 27,000 27,0004301 Street Lighting 1,078,985 1,078,9854310 Land/Lite/Park Maint Dist 199,700 199,7004471 Railroad Station 70,180 70,1804242 CSA-152 385,906 385,9064462 Parking Project & Programs 4,000 22,2094464 Structure Maintenance 115,711 115,711
Subtotal 5,577,487 705,317 6,301,013Marketing & Tourism2116 Visitor Info Center 5,000 5,0002117 Tourism 1,950,000 1,950,0002118 Special Events 233,684 233,6842119 Special Contributions 86,000 86,0002120 Event Sponsorship-see Pg 2-11 0 0
Subtotal 2,274,684 2,274,684Debt Service7850 Cal Energy Loan 0 07852 Convention Center 4,343,301 4,343,3017868 COP 2007 152,543 152,5437872 Parking Structure Debt 411,000 411,0007877 ERICA Motorola 2008 0 07878 Measure J Debt Service 3200000 3200000
Subtotal 8,106,844 8,106,844Assessment District7870 A.D. 157/158 Refinance 15,000 15,0007871 A.D. 161 344,668 344,6687874 A.D. 162 109,228 109,2287875 A.D. 164 Mountain Gate II 284,438 284,438
Subtotal 753,334 753,334Master Lease7851 Master Lease 1,635,649 1,635,649
Subtotal 1,635,649 1,635,649Airport6003 CFC Airport 480,000 480,0006001 PFC Admin 1,470,289 1,470,2896277 Series 2006 Debt Service 1,354,210 1,354,2106278 Series 2008 Debt Service 963,415 963,4156002 Airport Admin 2,973,661 2,973,6616010 Corporate Yard Property 142,489 142,4896022 Airport Security 1,312,869 1,312,8696050 Airside Operations 656,566 656,5666075 Airport Rescue- Fire 2,742,339 2,742,3396100 Landside Operations 1,448,790 1,448,7906175 Grounds Maintenance 223,415 223,4156200 Terminal Bldg Ops 4,527,371 4,527,3716225 Control Center Ops 3,210,470 3,210,4706250 Customs 209,580 209,5806401 Airport Development 1,176,250 1,176,2506501 Special Capital Projects 1,358,000 1,358,0006601 Federal Grants 11,762,500 11,762,500
Subtotal 36,012,214 36,012,214

2-11
BUDGET OVERVIEW APPROPRIATION DETAIL - ALL FUNDS
SPECIAL INTERNAL DEBTOPERATING REVENUE ENTERPRISE SERVICE SERVICE
ACTIVITY # - NAME FUNDS FUNDS FUNDS FUNDS FUNDS TOTAL
Wastewater Treatment Plant6800 Administration 6,424,601 6,424,601
Subtotal 6,424,601 6,424,601
Golf Course7021 Resort Course Maint 4,610,457 4,610,4577056 Debt Service 943,076 943,076
Subtotal 5,553,533 5,553,533
Motor Vehicle Replacement5470 Fleet Operations 2,815,772 2,815,7725475 MVR Reserves 455,000 455,000
Subtotal 3,270,772 3,270,772
Facilities Maintenance5641 Administration & Operations 3,970,214 3,970,214
Subtotal 3,970,214 3,970,214
Retirement Benefits5701 PERS & Medicare 13,453,836 13,453,836
Subtotal 13,453,836 13,453,836
Risk Management5902 Employee Benefits 7,285,174 7,285,1745903 Workers Comp 3,011,492 3,011,4925904 Liability Insurance 563,700 563,7005905 Property Insurance 1,033,759 1,033,7595919 Unemployment Insurance 252,750 252,750
Subtotal 12,146,875 12,146,875
Retiree Health Insurance5912 Retiree Health Insurance 2,329,759 2,329,759
Subtotal 2,329,759 2,329,759
Energy5805 Adminstration 4,000 4,0005806 Sunrise Plaza Cogen 855,186 855,1865807 Muni Complex Cogen 1,740,917 1,740,9175812 Energy Development 153,700 153,700
Subtotal 2,753,803 2,753,803
Contractual Obligations2101 GPSCVB 400,000 400,0002180 Convention Center Oper 6,788,990 6,788,9902199 Plaza Theatre 53,8902120 Int’l Film Festival 350,000 350,000
Subtotal 7,592,880 7,538,990

2-12
BUDGET OVERVIEW APPROPRIATION DETAIL - ALL FUNDS
SPECIAL INTERNAL DEBTOPERATING REVENUE ENTERPRISE SERVICE SERVICE
ACTIVITY # - NAME FUNDS FUNDS FUNDS FUNDS FUNDS TOTAL
Capital ProjectsGas Tax:
4298 Special Gas Tax-Improv 2106 798,078 798,078Measure A:
4497 Regional Measure A 0 04498 Local Measure A 1,854,000 1,854,000
Measure J:1396 Measure J Admin 275,000 275,0004500 Measure J 9,409,459 9,409,459
Drainage:4370 North Zone Drainage 13,000 13,0004371 Central Zone Drainage 10,000 10,0004372 South Zone Drainage 0 04373 East Zone Drainage 0 04374 Southeast Zone Drainage 0 04375 Eagle Canyon Drainage 0 04377 South Palm Canyon Drainage 0 0
Quimby:2460 Quimby - Park & Recreation 239,400 239,400
Subtotal 12,598,937 12,598,937
Total Detail 72,550,399 19,979,634 47,990,348 37,925,259 10,495,827 188,941,467

2-13
BUDGET OVERVIEW INTERNAL SERVICE FUND APPROPRIATIONS
AdoptedFY 13-14
Energy 2,753,803Motor Vehicle 3,270,772Facilities Maintenance 3,970,214Retirement Benefits 13,453,836Risk Management 12,146,875Retiree Health Insurance 2,329,759
Total Adopted Internal Service Funds $37,925,259
2,753,803 3,270,772
3,970,214
13,453,836
12,146,875 2,329,759
2013-14 Internal Service Funds

2-14
BUDGET OVERVIEW AUTHORIZED POSITIONS BY SERVICE AREA
Administration 36.25Growth Management 22.60Quality of Life 43.00Public Safety 170.50Public Works & Engineering 31.00Airport 67.50Motor Vehicle 7.00Facilities Maintenance 13.50Risk Management 3.25Low & Moderate Income Housing 3.40
Total Authorized Positions 398.00
36.25 22.60
43.00
170.50
31.00
67.50
7.00 13.50 3.25
3.40
2013-14 Authorized Positions

12/13/2012 2-15 Budget Calendar FY 2013-14
City of Palm Springs Department of Finance and Treasury
Budget Calendar for FY 2013/14
12/5/2012 1st Quarter Financial Review and Prior-Year Recap 12/20/2012 Special Funds Budget Worksheets issued by Finance Department – Due 1/17/2013 (Facilities, Fleet, Cogen, Worker’s Comp, Risk, Golf, Convention Center) 1/2/2013 Department, Measure J & Other Capital Budget Worksheets issued by Finance
Department – Due 2/14/2013 1/17/2013 Department & Special Funds Budget Worksheets due to Finance Department 1/31/2013 Department Measure J & All Other Capital requests due to Finance Department 2/4/2013 – Meetings with Department Heads to review Measure J Requests 2/14/2013 (City Manager, Chief of Staff & Finance Director) 2/14/2013 Department increases & Staffing change requests reviewed by City Manager (Material, Supplies and Services and Personnel Requests) 2/20/2013 Mid-Year Budget Review 2/21/2013 Staff recommended high priority capital projects list provided to Measure J Capital
Commission 2/21/2013 Preliminary Revenue Estimates completed and entered into budget system 2/25/2013 – Meetings with the Department Heads to review Department Budget Requests 3/14/2013 (City Mgr., Chief of Staff & Finance Director) 3/14/2013 – Preliminary Recommendations incorporated into budget system by Finance and 4/11/2013 update of Revenue Estimates 4/11/2013 Preliminary Operating Fund Budget distributed to City Council by Finance 4/17/2013 City Council – Presentation of Preliminary Budget – Operating Funds & Special Events 5/1/2013 City Council - Presentation of Enterprise Funds and Other Funds 5/15/2013 City Council – Presentation of Measure J, Capital Projects and All Other Funds 6/5/2013 Public Hearing and Adoption of Budget for Fiscal Year 2013/14

3-1
City of Palm Springs
General Background Palm Springs lies on the western edge of the Coachella Valley in central Riverside County approximately 107 miles east of Los Angeles. It is within the ecological area known as the Colorado Desert and is 487 feet above sea level. Rising behind the City’s downtown business district is the impressive Mt. San Jacinto, elevation 10,831 feet. Palm Springs covers a geographical area of 96 square miles with well-established neighborhoods. Because it is only a two-hour drive from Los Angeles, Orange and San Diego counties, there are a large number of second homes in Palm Springs. The permanent population is estimated around 47,601 (2010), with another 27,000 to 30,000 people living in the City in the winter, bringing the total population to almost 75,000 residents during the winter season. Approximately 1 million tourists stay in hotels in Palm Springs annually while another 600,000 visitors stay in non-hotel accommodations. They are no doubt attracted by the weather, which includes some 350 days of sunshine. The City enjoys a dry, semi-arid climate. Rainfall averages three inches per year, and the average yearly temperature is 75 degrees Fahrenheit. The City offers a host of unparalleled recreational and cultural opportunities. More than 8,856 pools offer year-round swimming, and minutes from any location in town are bike paths, hiking and equestrian trails, parks, tennis courts and golf courses, including one of the best municipal golf courses in the country. Culturally, the City is home to several acclaimed museums including The Palm Springs Arts Museum, the most significant art museum between Los Angeles and Phoenix. The Palm Springs Art Museum (formerly the Palm Springs Desert Museum) is at the base of Mt. San Jacinto. Founded in 1938, the Palm Springs Art Museum is an educational institution that promotes a greater understanding of art and performing arts through collections, exhibitions and programs. The Museum's permanent art collection features 19th, 20th, and 21st century works focusing on contemporary California art, classic western American art, Native American art; Pre-Columbian art, Mexican art, and European modern art; glass studio art, American mid-twentieth century architecture, and American photography. In addition, the Museum’s 400-seat Annenberg Theater keeps an eclectic calendar from ballet to modern dance, opera to jazz, and comedy to drama. The new Agua Caliente Cultural Museum will be located on Tahquitz Canyon Way. The new museum, which has not yet been built, is being designed by the architectural firm of Jones & Jones, one of the principal architects for the Smithsonian Institution’s new National Museum of the American Indian in Washington, D.C. The Museum will also be a Smithsonian Affiliate, which will

3-2
allow it to bring world-acclaimed exhibitions from the vast Smithsonian Collection to Palm Springs. The museum recently received “conformity” approval by the Palm Springs City Council and will move forward on Construction in the next 12 months. Located in the downtown district is the Fabulous Palm Springs Follies, which sells out the 800-seat Plaza Theatre eight shows a week from early November to Memorial Day. The Follies, which features Las Vegas-style showgirls in full costume (all over the age of 55) in 1940’s-style revue, has been featured on ABC’s 20/20, The Today Show, The New York Times, and other national and international publications since its founding in 1991. It was also the subject of an Oscar®-nominated short film. Located in a historic building at the north end of downtown, the Palm Canyon Theatre is a 206-seat live theatre venue which remains the only Actors Equity Theater in the desert. The theater runs a full season from late September to May, and has entered into a partnership with the Palm Springs International Film Festival. The Agency partnered with the Film Festival to fund renovation of the building. Improvements included building out the projection booth, painting, theater seating, lighting, electrical, marquee sign, bathrooms and other improvements. The Agency has contributed $300,000 with an additional $300,000 funded by the Film Festival. The project was completed in 2008. The Camelot Theatres are currently a three-screen “art house” cinema located on Baristo Road across from Palm Springs High School. The theater owners have submitted plans to expand the facility by two screens, as well as add a small Cultural Center building that could house other cultural activities and groups. Located in the heart of downtown Palm Springs, the Village Green includes the Historical Society Museum, the Agua Caliente Museum and Ruddy’s General Store Museum. Memorable among the City’s natural attractions are the Indian Canyons, one of the world’s few remaining California fan palm oases. The Palm Springs Aerial Tramway, the world’s largest single-span lift, transports riders to San Jacinto Wilderness State Park, where visitors can enjoy hiking and equestrian trails in the summer and cross-country skiing in the winter. The City features a number of annual special events, including the Annual Veteran’s Day Parade, the Palm Springs International Film Festival, and the Festival of Lights Parade, all of which draw visitors from around the world. In addition, the Agua Caliente Band of Cahuilla Indians has established a casino within the City’s downtown area.

3-3
HISTORICAL PERSPECTIVE To understand Palm Springs, one has to know a little about its history. Starting out as an Indian Village, the town became a health resort in the early 1900s. During the 1920s and 1930s, it was discovered by Hollywood and American captains of industry, catapulting it into a resort of worldwide reputation. By the 1980s, new developments to the east of Palm Springs were competing for much of its energy. By the mid 1990s, Palm Springs had been rediscovered and is currently experiencing a true economic boom. At the same time, this economic growth is posing new challenges to the community as many residents new and old have become concerned about their quality of life. Specifically, the issues revolve around protecting this unique man-made environment, which include a distinctive architectural tradition ranging from the mission revival style to mid-century modern, restrained commercial signage, soft lighting and quiet neighborhoods. Because of its sleepiness during the last few decades, there is a general feeling of a time warp which, along with its architectural traditions, has been the subject of numerous national magazine articles in the last few years. This, in turn, has been attracting new tourists and residents alike. Unlike the other desert resorts in the Coachella Valley, Palm Springs has a true walking downtown Village which has contributed greatly to its newfound popularity. It also has a wealth of newly restored, small historic inns and boutique hotels, as well as major national chain hotels and mid-size hotels. THE CITY GOVERNMENT Palm Springs was incorporated as a general law City in 1938, with a council-manager form of government established in 1942. The City adopted a charter in 1994. The City Council consists of four residents who are elected at large to four-year staggered terms. The Mayor is directly elected to a four-year term and serves as the fifth member of the City Council. The City Council appoints the City Manager and the City Attorney, enacts ordinances and resolutions, establishes policy direction for management staff, and reviews and approves the annual budget expenditures for the City. The Council also serves as the Community Redevelopment Agency, Housing Authority, Financing Authority and Public Facilities Authority, and individual members of the Council represent the City on a number of area-wide intergovernmental agencies and committees. The City operates and maintains a full range of municipal services, including a public library, a police department, a fire department, an international airport, a parks and recreation program and wastewater treatment plant.

3-4
WORKING WITH YOUR CITY COUNCIL
A variety of business comes before the City Council at its meetings. The City Council holds regular meetings on the first and third Wednesdays of the month beginning at 6 p.m. The Council holds Study Sessions the second and fourth Wednesdays, also starting at 6 p.m. A primary difference between the two types of meetings is that no decisions are made or action taken at Study Sessions.
The City Council welcomes your participation at its meetings. The public may address the City Council on any item during the public comment period at the beginning of the meeting. Those wishing to address the Council are asked to first complete a speaker’s card and give it to the City Clerk so the City has a formal record of individuals who speak. Speakers are called upon by the Mayor and those wishing to address an item on the agenda listed as a public hearing will be called when that item comes up. Public comment is limited to three minutes per person or five minutes if the item is a public hearing.
Televised coverage of all City Council meetings is presented live on local cable TV Channel 17.
OUR CITY MANAGER The City Manager serves as Chief Executive Officer of the City and the Executive Director of the Successors Agency. He serves as an advisor to the City Council on policy items impacting the community and the City organization. The City Manager appoints the City's department heads and is responsible for ensuring that city services are performed to the highest standard in accordance with Council policies. The City Manager is responsible for the submission of the City's budget and implementation in support of City Council goals.

r----:1 City Attorney J
City Council
~ City Manager J----1! Special Projects I 1_~~~=;;;;!.1
- Chief of Staff/ City Clerk
/'. : :- .· ·.-.·.·.- ·.·. . :<·: :-:: : . . . ... .. ·.·.: ·~ . ·.- .· .·.·.· . . . . . . . . . . . . . . ............. ...... . . . . . . . . . . . . ....... .
. 9(jiJ1(1j~flitJI:"~~ttO.~C:~rtl:e.h:t . • • • • • •: •. • • a~cr IJ~ft:eloJ'itJ~nt • •. •: •:: ·: · ·
Economic and - Police I-- Community -IL City Clerk
1- - Development __.
- Fire/Paramedic I - Finance/Treasury
~ Convention Center & I Tourism
Emergency - Human Resources -Preparedness ~Downtown~ U~town Design I
DIStrict
- Procurement I-- Sustainability
~ Information
I-- Airport _I Technology
1-
- Public Information I-- Parks and Rec
I-- Library
I-- Planning J
I-- Public Works I
I--Building Safety &
Code Enforcement
'-- Neighborhoods

3-6
VISION STATEMENT
Palm Springs aspires to be a unique world class desert community, where residents and visitors enjoy our high quality of life and a relaxing experience.
We desire to balance our cultural and historical resources with responsible,
sustainable economic growth and to enhance our natural desert beauty.
We are committed to providing responsive, friendly and efficient customer service in an environment that fosters unity among all our citizens.
OUR MISSION
Our purpose in the City of Palm Springs, a
municipal corporation, is to enhance the quality of life.
We work in harmony with the community to plan and provide services at a level of excellence that fosters
an improving environment for all constituents, including residents, visitors and property owners.
Our primary objective is to be the best in
our job of providing municipal services, at the same time retaining Palm Springs’ position as America’s foremost
desert resort and retaining an ideal environment for living. Our rewards for achieving these objectives are
social harmony, respect from the public, satisfied constituents, pleasing environment and
a healthy local economy.
We provide responsible fiscal management and skilled and motivated employees whose personal growth is encouraged by a creative work environment. We respect the uniqueness of individuals and provide
opportunities for them to express and fulfill their needs. Services provided by the municipality are consistent
with these needs but are also reliant on the availability of resources.
The city functions as the governmental unit
closest to the people. It is the cornerstone of local government and the foundation of our free and
democratic society.

4-1
City of Palm Springs Management and Budget Policies
Fiscal Year 2013-14
Management and Budget Policies are developed and maintained to set forth the framework for not only the development of the budget for the upcoming year, but the ongoing operations and future needs of the citizens of Palm Springs. The following policies are the foundation that supports the services that our citizens expect and deserve.
1. Legal Requirements Regarding Annual Budget
2. Budgetary Controls/Accounting Basis
3. Description of Reporting Entities
4. Budgetary Fund Structure
5. General Management and Budget Policies
6. Revenue Policy
7. Reserves Policy
8. Capital Improvement Program Policy
9. Investment Policy
10. Debt Administration and Policies
11. Grant Administration Policy
12. Cost Accounting Application
13. Article XIIIB Appropriations Limit
14. Source of Funds by Departments
4-2
1. LEGAL REQUIREMENTS REGARDING ANNUAL BUDGET
City of Palm Springs Municipal Code Section 2.08.010, Ordinance 116, establishes the City Manager’s responsibility to prepare and submit to the City Council the annual budget. The City Manager is also charged with keeping the City Council at all times fully advised as to the financial condition and needs of the City.
The annual budget adopted by the City Council serves as a guideline for operations of the City and the Palm Springs Redevelopment Agency. From the effective date of the budget, the date of formal adoption by City Council, expenditure amounts as proposed are appropriated to departments for the respective expenditure objects and purposes named or described.
2. BUDGETARY CONTROLS/ACCOUNTING BASIS
The adopted budget of the City consists of a resolution specifying the total appropriation for each department activity, (e.g., Police Administration, Airport Administration, Street Maintenance, etc.)
Total appropriations for each fund may only be increased or decreased by the City Council by passage of a resolution amending the budget, with the exception of budget adjustments which involve offsetting revenues and expenditures. In cases involving offsetting revenues and expenditures, the Finance Director is authorized to increase or decrease an appropriation for a specific purpose where said appropriation is offset by unbudgeted revenue which is designated for said specific purpose.
The City Manager has authority to adjust the amounts appropriated between the departments and activities of a fund, objects which each departmental activity and between accounts within the objects, provided, however, that the total appropriations for each fund may not exceed the amounts provided in the budget resolution.
The level on which expenditures may not legally exceed appropriations is the fund level. Appropriations that are unspent at the end of a fiscal year may be continued to the next fiscal year at the discretion of the City Manager.

4-3
Budgets for the various funds are adopted on a basis consistent with generally accepted accounting principles (GAAP). Annual appropriated budgets are legally adopted for the general, special revenue, debt service, capital, and proprietary fund types.
3. DESCRIPTION OF REPORTING ENTITIES
a. Description of Reporting Entity
The City of Palm Springs was incorporated in 1938 under the general laws of the State of California. Effective July 12, 1994, the City of Palm Springs became a Charter City which was approved by the citizens of the City of Palm Springs on June 7, 1994. The City operates under the Council-Manager form of government.
As required by generally accepted accounting principles, the financial statements of the City of Palm Springs include the financial activities of the City (the primary government), the Community Redevelopment Agency (Agency) of the City of Palm Springs, and the Palm Springs Financing Authority (Authority). These blended component units are discussed below and are included in the reporting entity because of the significance of their operation and financial relationship with the City.
Blended Component Units:
Community Redevelopment Agency of the City of Palm Springs
The Community Redevelopment Agency’s financial activity commenced in September, 1972. The primary purpose of the Agency is to eliminate blighted areas encouraging development of residential, commercial, industrial, recreational and public facilities. The City Council appoints the Agency director and has full accountability for the Agency’s fiscal matters. The Agency’s financial data and transactions are included with the special revenue fund type, debt service fund type and capital projects fund type. Revenues of the Agency consist primarily of property tax allocations on the incremental increase of property values in the redevelopment area and interest income.
Successor Agency of the City of Palm Springs
In January 2011, the Governor proposed ending the 425 local redevelopment agencies in California, in a move to secure $1.7 billion in local property taxes to be used to patch the State’s $25 billion budget deficit. The Legislature passed AB1X 16, which was intended to abolish redevelopment agencies by October 1, 2011: it required that all agency activities be terminated, except for the implementation of existing obligations.

4-4
The unwinding of a redevelopment agency would be overseen by a successor entity designed to liquidate the Agency’s assets as rapidly as possible. This bill and the related AB1X 27 were challenged by the California Redevelopment Association and the League of California Cities.
On December 29, 2011, the California Supreme Court upheld AB1X 26, which dissolves all of the redevelopment agencies in the State, and struck down ABX1 27, which allowed redevelopment agencies to remain in existence if such agency opted to a “Voluntary Alternative Redevelopment Program” (“VARP”).
In the California Supreme Court decisions, the date of dissolution was moved from October 1, 2011 to February 1, 2012.
Under the Law, all accounts of the former Redevelopment Agency (RDA) transfer to the Successor Agency. To preserve the limited liability of the Successor Agency provided in AB1X 26, the Successor Agency holds all former RDA accounts separately from its other.
City of Palm Springs Financing Authority
The City of Palm Springs Financing Authority was created by a joint exercise of joint powers agreement between the City of Palm Springs and the Community Redevelopment Agency of the City of Palm Springs on February 1, 1991. The purpose of the Authority is to provide, through the issuance of debt, financing necessary for various capital improvements. The Authority is administered by the Board who are the members of the City Council and the Mayor. The Authority’s sole source of income is installment sale, loan and lease payments received from the City and Community Redevelopment Agency which are used to meet the debt service requirements on debt issues. The Authority is blended into various funds of the City.
4. BUDGETARY FUND STRUCTURE
The City of Palm Springs reports the following major governmental funds:
General Fund – This is the primary operating fund of the City. It accounts for all activities of the general government, except those required by be accounted for in another fund.
Special Assessment Debt Service Fund – This debt service fund is used to account for the payment of principal and interest on 1915 Act Assessment District Bond issues.

4-5
Community Redevelopment Agency Debt Service Fund – This fund is used to account for the payment of principal and interest on general long-term debt of the Community Redevelopment Agency.
Community Redevelopment Agency Capital Projects Fund – To account for the economic realization and redevelopment of the City through acquisition and development of City property determined to be in a declining condition.
The City of Palm Springs reports the following major enterprise funds:
Airport Fund – This fund is used to account for operations of the City’s international airport.
Wastewater Fund – This fund is used to account for operation of the City’s wastewater treatment plant and related capital expenditures, such as trunk lines.
Golf Course Fund – This fund is used to account for operations of the City’s two municipal golf courses.
Additionally, the City of Palm Springs reports the following fund types:
Special Revenue Funds – Their funds are used to account for proceeds of specific revenue sources that are legally restricted or otherwise designated for specific purposes.
General Debt Service Fund – To account for the payment of principal and interest on the City’s general debt issues.
Capital Projects Funds – Capital Projects Funds are used to account for the purchase or construction of major capital facilities which are not financed by proprietary funds. Capital projects funds are ordinarily not used to account for the acquisition of furniture, fixtures, machinery, equipment, and other relatively minor or comparatively short-lived capital assets.
Internal Funds – These funds are used to account for motor vehicle replacement, facilities maintenance, employee benefits, risk management, retiree health insurance and the City’s cogeneration plant. Departments of the City are charged for the services provided or benefits received from these funds.
Fiduciary Funds:
Private-Purpose Trust Fund – This fund is used to account for monies held in trust by the City for various purposes related to the Palm Springs Historical Society.

4-6
Agency Fund – This fund is used to account for monies held for various purposes ranging from bid bonds to donations for animal shelter activities.
As a general rule the effect of inter fund activity has been eliminated from the government-wide financial statements. Exceptions to this general rule are payments-in-lieu of taxes and other charges between the government’s enterprise funds and various other governmental funds. Elimination of these charges would distort the direct costs and program revenues reported for the function concerned.
Amounts reported as program revenues include 1) charges to customers or applicants for goods, services, or privileges provided, 2) fines, forfeits and penalties, 3) grants and contributions that are restricted to meeting the operational or capital requirement of a particular function and 4) other miscellaneous revenues that directly benefit a particular function and do not fit into any other category. General revenues include all taxes.
Proprietary funds distinguish operating revenues and expenses from non-operating items. Operating revenues and expenses generally result from providing services and producing and delivering goods in connection with a proprietary fund’s principal ongoing operations. The principal operating revenues of the airport, wastewater and golf enterprise funds and internal service funds are charges to customers for sales and services. Operating expenses for enterprise funds and internal service funds include the cost of sales and services, administrative expenses, and depreciation of capital assets. All revenues and expenses not meeting this definition are reported as non-operating revenues and expenses.
Successor Agency of the Former Redevelopment Agency Fund – This fund serves as custodian for assets and liabilities of the Successor Agency Trust pending distribution to the appropriate taxing entities and the payment of enforceable obligations.
Special Deposits Agency Fund – To account for monies held in trust by the City for various purposes ranging from bid bonds to donations for animal shelter activities.
5. GENERAL MANAGEMENT AND BUDGET POLICIES
• Budgetary and accounting procedures will conform to Generally Accepted Accounting Principles (GAAP) for government agencies.
• The City is required to adopt a balanced budget for its General Fund at the beginning of each fiscal year. Current revenues must equal current expenditures.

4-7
• The City Manager and/or the Director of Finance submit reports on a quarterly basis to City Council, comparing actual revenues and expenditures to budget amounts. The City Council is also provided a midyear fiscal review which includes current status on the health of the City’s financial status. This document is updated for significant events and changes that may have occurred since the last update.
• The City’s long-term financial plan takes into account the capital improvement plan (CIPs) and financial forecast as part of its expenditure projects, revenue estimates as well as future debt.
6. REVENUE POLICY
• The City will endeavor to maintain a diversified and stable revenue base to
minimize the effects of economic fluctuations on revenue accumulation.
• The City will estimate revenue using objective, analytical processes; in cases of assumption uncertainty, conservative projections will be utilized.
• The City will fund all current expenditures from current revenues.
7. RESERVES POLICY
• The Reserve for future Capital projects and equipment replacement has been eliminated and replaced by a program to direct fund in the next fiscal year’s budget. The source of this funding is the city’s new 1% add-on Sales Tax which is generating revenue of approximately $10 million annually. This revenue tax will be in place 25 years thru March, 2037.
8. CAPITAL IMPROVEMENT PROGRAM POLICY
• The City’s Capital Improvement Plan (CIP) identifies each proposed project, the year the project will start, and the proposed method of financing.
The City will actively pursue grant and other outside funding sources for all capital improvement projects.

4-8
9. INVESTMENT POLICY
1.0 POLICY
WHEREAS; The Legislature of the State of California has declared that the deposit and investment of public funds by local officials and local agencies is an issue of statewide concern (California Government Code Sections 53600.6 (CGC §53600.6) and 53630.1); and
WHEREAS; the legislative body of a local agency may invest surplus monies not required for the immediate necessities of the local agency in accordance with the provisions of California Government Code Sections 53601 et seq; and
WHEREAS; the Treasurer of the City of Palm Springs shall annually prepare and submit a statement of investment policy and such policy, and any changes thereto, shall be considered by the legislative body at a public meeting; (CGC §53646 (a); now
THEREFORE; it shall be the policy of the City of Palm Springs to invest funds in a manner which will provide the highest investment return with the maximum security while meeting the daily cash flow demands of the entity and conforming to all statutes governing the investment of City of Palm Springs funds.
2.0 SCOPE
This investment policy applies to all financial assets of the City of Palm Springs and its component units. These funds are accounted for in the Comprehensive Annual Financial Report and include, but are not limited to:
General Fund
Special Revenue Funds

4-9
Capital Projects Fund
Debt Service Fund
Enterprise Funds
Internal Service Funds
Trust and Agency Funds
Community Redevelopment Funds
Proceeds from Bond Issues (see 8.2)
Contributions made by or on behalf of employees to Deferred Compensation accounts are not covered by this policy.
3.0 PRUDENCE
Investments shall be made with judgment and care, under circumstances then prevailing, which persons of prudence, discretion and intelligence exercise in the management of their own affairs; not for speculation, but for investment, considering the probable safety of their capital as well as the probable income to be derived. The standard of prudence to be used by investment officials shall be the "prudent investor" standard (CGC §53600.3) and shall be applied in the context of managing an overall portfolio. Investment officers acting in accordance with written procedures and the investment policy and exercising due diligence shall be relieved of personal responsibility for an individual security's credit risk or market price changes, provided deviations from expectations are reported in a timely fashion and appropriate action is taken to control adverse developments.
4.0 OBJECTIVES
As specified in CGC §53600.5, when investing, reinvesting, purchasing, acquiring, exchanging, selling and managing public funds, the primary objectives, in priority order, of the investment activities shall be:

4-10
1. Safety: Safety of principal is the foremost objective of the investment program. Investments of the City of Palm Springs shall be undertaken in a manner that seeks to ensure the preservation of capital in the overall portfolio. To attain this objective, diversification is required in order that potential losses on individual securities do not exceed the income generated from the remainder of the portfolio.
2. Liquidity: The investment portfolio will remain sufficiently liquid to enable the City of Palm Springs to meet all operating requirements which might be reasonably anticipated.
3. Return on Investments: The investment portfolio shall be designed with the objective of attaining a market rate of return throughout budgetary and economic cycles, taking into account the investment risk constraints and the cash flow characteristics of the portfolio.
5.0 DELEGATION OF AUTHORITY
Authority to manage the investment program is derived from California Government Code Sections 53600 et. seq. Management responsibility for the investment program is hereby delegated to the Treasurer, who shall establish written procedures for the operation of the investment program consistent with this investment policy. Procedures should include references to: wire transfer agreements, and collateral / depository agreements, as appropriate. Such procedures shall include explicit delegation of authority to persons responsible for investment transactions. No person may engage in an investment transaction except as provided under the terms of this policy and the procedures established by the Treasurer. The Treasurer shall be responsible for all transactions undertaken and shall establish a system of controls to regulate the activities of subordinate officials. Under the provisions of California Government Code 53600.3, the Treasurer is a trustee and a fiduciary subject to the prudent investor standard.
6.0 ETHICS AND CONFLICTS OF INTEREST
Officers and employees involved in the investment process shall refrain from personal business activity that could conflict with the proper execution of the investment program, or which could impair their ability to make impartial investment decisions.

4-11
7.0 AUTHORIZED FINANCIAL INSTITUTIONS AND DEALERS
The Treasurer will maintain a list of financial institutions, selected on the basis of credit worthiness, financial strength, experience and minimal capitalization, authorized to provide investment services to the City of Palm Springs. No public deposit shall be made except in a qualified public depository as established by state laws.
For broker / dealers of government securities and other investments, the City of Palm Springs shall select only broker/dealers who are licensed and in good standing with the California Department of Securities, the Securities and Exchange Commission, the National Association of Securities Dealers or other applicable self-regulatory organizations.
Before engaging in investment transactions with a broker / dealer, the Treasurer shall have received from said firm a signed Certification Form. This form shall attest that the individual responsible for the City of Palm Springs' account with that firm has reviewed the City of Palm Springs' Investment Policy and that the firm understands the policy and intends to present investment recommendations and transactions to the City of Palm Springs that are appropriate under the terms and conditions of the Investment Policy.
8.0 AUTHORIZED AND SUITABLE INVESTMENTS
The City of Palm Springs is empowered by California Government Code 53601 et seq. to invest in the following:
A. Bonds issued by the City of Palm Springs
B. United States Treasury Bills, Notes & Bonds
C. Registered state warrants or treasury notes or bonds issued by the State of California.

4-12
D. Bonds, notes, warrants or other evidence of debt issued by a local agency within the State of California, including pooled investment accounts sponsored by the State of California, County Treasurers, other local agencies or Joint Powers Agencies.
E. Obligations issued by Agencies or sponsored enterprises of the U.S. Government. Not more than 60% of surplus funds may be invested in these obligations. F. Bankers Acceptances with a term not to exceed 180 days. Not more than 40% of surplus funds can be invested in Bankers Acceptances and no more than 20% of surplus funds can be invested in the bankers’ acceptances of any single commercial bank. G. Prime Commercial Paper of U.S. Corporations with assets greater than $500 million with a term not to exceed 270 days and the highest ranking issued by Moody's Investors Service or Standard & Poor's Corp. Commercial paper cannot exceed 15% of total surplus funds.
H. Negotiable Certificates of Deposit issued by federally or state chartered banks or associations. Not more than 30% of surplus funds can be invested in negotiable certificates of deposit.
I. Medium term notes (not to exceed 5 Years) of US corporations rated "A" or better by Moody's or S&P. Not more than 20% of surplus funds can be invested in medium term notes.
J. Shares of beneficial interest issued by diversified management companies (Money Market Mutual Funds) investing in the securities and obligations authorized by Section 53601(K). Such Funds must carry the highest rating of at least two of the three largest national rating agencies. Not more than 10% of surplus funds can be invested in Money Market Mutual Funds.
K. Funds held under the terms of a Trust Indenture or other contract or agreement may be invested according to the provisions of those indentures or agreements.
L. Collateralized bank deposits with a perfected security interest in accordance with the Uniform Commercial Code (UCC) or applicable federal security regulations.
M. Any mortgage pass-through security, collateralized mortgage obligation, mortgaged backed or other pay-through bond, equipment lease-backed certificate, consumer receivable pass-through certificate or consumer receivable backed bond of a maximum maturity of five years. Securities in this category must be rated AA or better by a nationally recognized rating service. Not more than 10% of surplus funds may be invested in this category of securities.

4-13
N. The various limits on what percentage of surplus funds (the Percentage of Portfolio, or POP limits) may be invested by type or maturity shall be calculated when the investment or reinvestment is made.
Also, see CGC §53601 for a detailed summary of the limitations and special conditions that apply to each of the above listed investment securities. CGC §53601 is attached (Exhibit B) and included by reference in this investment policy.
8.1 PROHIBITED INVESTMENTS
Under the provisions of CGC §53601.6 and §53631.5, the City of Palm Springs shall not invest any funds covered by this Investment Policy in inverse floaters, dual index, stepped inverse derivatives, repurchase agreements, reverse repurchase agreements, range notes, interest-only strips derived from mortgage pools or any investment that may result in a zero interest accrual if held to maturity.
8.2 BOND PROCEEDS
In addition to the investment vehicles enumerated in Section 8, the proceeds of bond issues (including reserve funds) may be invested in long term Guaranteed Investment Contracts (GIC) or Investment Agreements (IA) that comply with the Permitted Investment restrictions of the particular bond issue.
Before soliciting bids from providers of GIC's or IA's, the Treasurer shall obtain approval from the City Council to proceed.
9.0 INVESTMENT POOLS / MONEY MARKET MUTUAL FUNDS
A thorough investigation of the pool / fund is required prior to investing, and on a continual basis. There shall be a questionnaire developed which will answer the following general questions:

4-14
- A description of eligible investment securities, and a written statement of investment policy and objectives.
- A description of interest calculations and how it is distributed, and how gains and losses are treated.
- A description of how the securities are safeguarded (including the settlement processes), and how often the securities are priced and the program audited.
- A description of who may invest in the program, how often, what size deposit and withdrawal are allowed.
- A schedule for receiving statements and portfolio listings. - Are reserves, retained earnings, etc. utilized by the pool/fund? - A fee schedule, and when and how is it assessed. - Is the pool / fund eligible for bond proceeds and/or will it accept such proceeds?
10. COLLATERALIZATION
All certificates of deposits must be collateralized by U.S. Treasury Obligations or U.S. Government Agency Securities. In order to anticipate market changes and provide a level of security for all funds, the collateralization level will be 102% of market value of principal and accrued interest. Collateral must be held by a third party trustee and valued on a monthly basis.
11. SAFEKEEPING AND CUSTODY
All security transactions entered into by the City of Palm Springs shall be conducted on a delivery-versus-payment (DVP) basis. Securities will be held by a third party custodian designated by the Treasurer and evidenced by safekeeping receipts.
12. DIVERSIFICATION AND MAXIMUM MATURITIES
The City of Palm Springs will diversify its investments by security type and institution. It is the policy of the City of Palm Springs to diversify its investment portfolio. Assets shall be diversified to eliminate the risk of loss resulting from over concentration of assets in a specific maturity, a specific issuer or a specific class of securities. Diversification strategies shall be determined and revised periodically. In establishing specific diversification strategies, the following general policies and constraints shall apply:
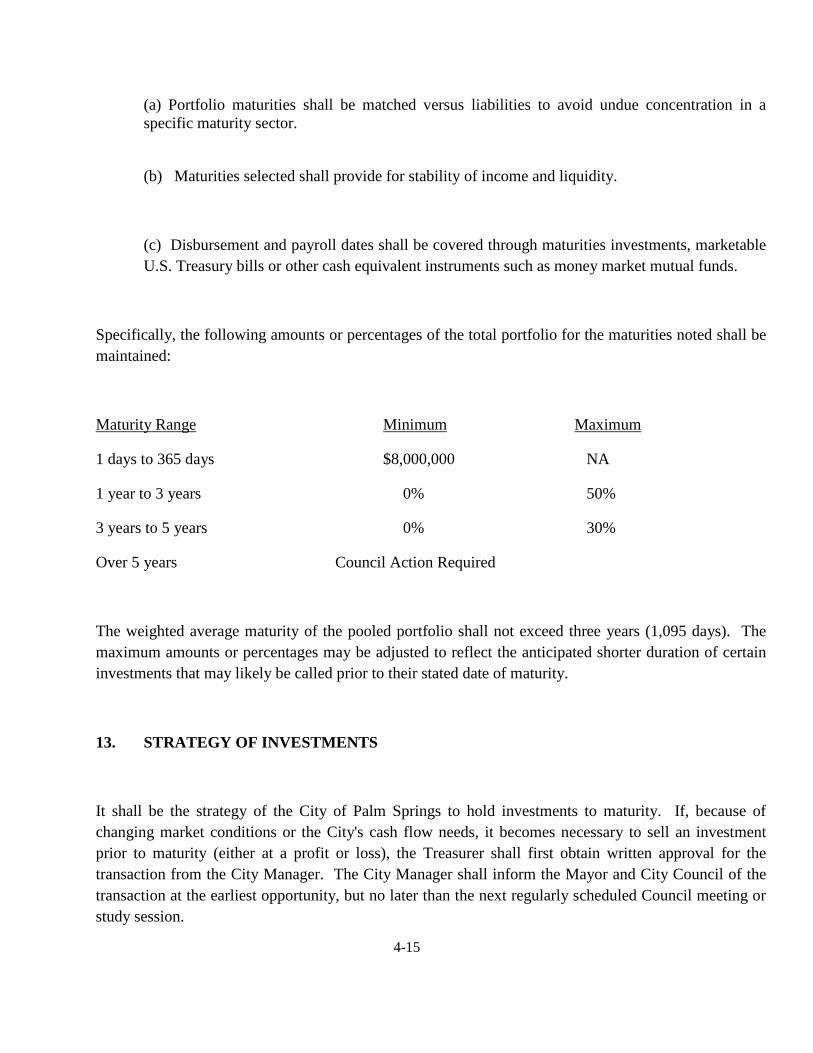
4-15
(a) Portfolio maturities shall be matched versus liabilities to avoid undue concentration in a specific maturity sector.
(b) Maturities selected shall provide for stability of income and liquidity.
(c) Disbursement and payroll dates shall be covered through maturities investments, marketable U.S. Treasury bills or other cash equivalent instruments such as money market mutual funds.
Specifically, the following amounts or percentages of the total portfolio for the maturities noted shall be maintained:
Maturity Range Minimum Maximum
1 days to 365 days $8,000,000 NA
1 year to 3 years 0% 50%
3 years to 5 years 0% 30%
Over 5 years Council Action Required
The weighted average maturity of the pooled portfolio shall not exceed three years (1,095 days). The maximum amounts or percentages may be adjusted to reflect the anticipated shorter duration of certain investments that may likely be called prior to their stated date of maturity.
13. STRATEGY OF INVESTMENTS
It shall be the strategy of the City of Palm Springs to hold investments to maturity. If, because of changing market conditions or the City's cash flow needs, it becomes necessary to sell an investment prior to maturity (either at a profit or loss), the Treasurer shall first obtain written approval for the transaction from the City Manager. The City Manager shall inform the Mayor and City Council of the transaction at the earliest opportunity, but no later than the next regularly scheduled Council meeting or study session.

4-16
14. OVERSIGHT COMMITTEE
A committee comprised of one Council member appointed by Council, the City Manager and the Treasurer, shall provide oversight of the City's investments. The Committee shall meet at least quarterly to review the City's investment activity.
15. REPORTING
In accordance with CGC §53646(b)(1), Treasurer shall submit to each member of the City Council monthly investment reports within 30 days of the end of the quarter in which the month falls. The report shall include a complete description of the portfolio, the type of investments, the issuers, maturity dates, par values and the current market values of each component of the portfolio, including funds managed for City of Palm Springs by Fiscal Agents, Deferred Compensation Plan Provider (except Deferred Comp funds held in trust) or third party contracted managers. The report will also include the source of the portfolio valuation, and the changes in the value of each investment over the last quarter. As specified in CGC §53646(e), if all funds are placed in LAIF, FDIC-insured accounts and/or in a county investment pool, the foregoing report elements may be replaced by copies of the latest statements from such institutions, including changes in value over the last quarter. The report must also include a certification that (1) all investment actions executed since the last report have been made in full compliance with the Investment Policy and, (2) the City of Palm Springs will meet its expenditure obligations for the next six months as required by CGC §53646(b)(2) and (3) respectively. The Treasurer shall maintain a complete and timely record of all investment transactions.
16. INVESTMENT POLICY ADOPTION
The Investment Policy shall be adopted by resolution of the City of Palm Springs City Council. The Policy shall be reviewed on an annual basis, and modifications approved by the City Council.
GLOSSARY - Definition of investment-related terms are listed in the Appendix Section.

4-17
10. DEBT ADMINISTRATION AND POLICIES
Legal Debt Margin Information 2012
(In Thousands of Dollars)
2012
Assessed Valuation $8,86,010
Conversion percentage 25%
Adjusted assessed valuation 2,215,253
Debt limit percentage 15%
Debit limit 332,288
Total net debt applicable to limit:
General Obligation Bonds
136,394
Legal debt Margin 195,894
Total Debt applicable to the limit as a percentage of debt limit – 41.0%
The Government Code of the State of California provides for a legal debt limit of 15% of gross assessed valuation. However, this provision was enacted when assessed valuation was based upon 25% of market value. Effective with the 1981-82 fiscal year, each parcel is now assessed at 100% of market value (as of the most recent change in ownership for that parcel). The computations shown above reflect a conversion of assessed valuation data for each fiscal year from the current full valuation perspective to the 25% level that was in effect at the time that the legal debt margin was enacted by the State of California for local governments located within the state.
DEBT POLICY
The City’s key debt management goal is to protect and enhance the viability of the General Fund and other associated operating funds to enable the City to continue to deliver quality services to the citizens of Palm Springs.

4-18
The City will comply with a policy of full disclosure on every financial report and bond prospectus. The City will maintain good communications with bond rating agencies regarding the City’s financial condition and other relevant data to the debt.
RATIOS OF OUTSTANDING DEBT BY TYPE – Last Seven Fiscal Years
Fiscal Year
Ended June 30
Pension
Obligation Bond (1)
General
Obligation Bonds
Tax Allocation
Bonds
Loans and
Leases
Total
Governmental Activities
2006 - 107,732,568 26,950,000 698,048 135,380,616
2007 19,832,588 102,319,055 26,220,000 490,125 148,861,768
2008 19,832,588 99,938,944 46,640,000 275,748 166,687,280
2009 20,328,619 97,667,830 45,860,000 3,486,462 167,342,911
2010 20,349,536 95,654,919 45,045,000 4,327,846 165,377,301
2011 20,312,658 93,372,989 44,080,000 3,854,251 161,619,898
2012 20,221,505 136,394,186 - 3,358,621 159,974,312
Fiscal Year Ended June
30
Airport
Revenue Bonds
Certificates of Participation
Leases
Total
Business- type Activities
Total
Primary Government
2006 29,113,602 11,788,191 - 40,901,793 175,718,944
2007 28,907,043 11,537,303 - 40,444,346 188,934,579
2008 29,095,000 11,846,058 - 40,941,058 207,454,231
2009 27,965,000 11,422,169 - 39,387,169 203,327,260
2010 27,305,000 10,980,081 - 38,285,081 199,399,082
2011 25,995,000 10,522,011 - 36,517,011 194,326,946
2012 25,030,000 10,045,814 238,248 35,314,062 195,288,374

4-19
11. GRANT ADMINISTRATION POLICY
To aggressively seek and apply for federal, state and other agencies grant funding to support a variety of social, recreation, public safety, and public works programs. Effectively administer grants to ensure the grants can be best integrated into the City’s service goals and financial planning.
HOW A GRANT APPLICATION IS HANDLED
The City Council and/or City Manager approve all Grant Applications. Budget not established and funds not spent or obligated until after the Grant has been approved. Each Grant is accounted for in unique, segregated accounts. Only direct employee and other costs are charged directly to any Grant.
12. COST ACCOUNTING APPLICATION
Internal Services Charges
Internal Service Funds account for goods and services provided by one department to other departments on a cost reimbursement basis. Currently, the City maintains the following Internal Services Funds; they are Motor Vehicles, Facilities Maintenance, Risk Management and Wastewater Treatment. Internal Service charges are developed as follows: Motor Vehicles based on replacement charges and maintenance operations, Facilities Maintenance based on square footage, Risk Management departments are based on budget payroll, full time employee numbers (FTE’s), claims history and actual fringe benefits insurance costs, and Wastewater Treatment based on direct costs.
The City updates internal services charges every Fiscal Year to ensure adequate charges for the City’s current costs and future liabilities.
13. ARTICLE XIIIB APPROPRIATIONS LIMIT (GANN APPROPRIATIONS LIMIT)
Article XIIIB of the California Constitution requires governmental units to establish an annual appropriations limit. Proposition 4 (Article XIIIB) which was approved by the voters in 1979 and modified by Proposition III in 1990 is commonly identified as the Gann Limit and creates a restriction on the amount of revenue which can be appropriated for expenditures in any fiscal year. The revenues which are subject to the limitation are those considered “proceeds of taxes.” Examples of tax proceeds included property, sales, and transient occupancy taxes as well as motor vehicle license fees. It is important to point out that only specific revenues and appropriations are subject to limitation. For Palm Springs, all the City’s enterprise and intergovernmental service funds as well as any Federal funds are exempt.

4-20
Palm Springs’ limit was established by using 1978-79 appropriations as the base year and allowing the base to increase in the future years by the percentage of growth in population and inflation. During any fiscal year, a city may not appropriate any proceeds of taxes it receives in excess of its limit. If the City exceeds its Gann Limit, it may avoid a tax refund if they fall sufficiently below the limit in the next fiscal year. Any fees; or, alternatively, by a majority vote, the citizens may approve an override to increase the limit. As shown below Palm Springs has not exceeded its Gann Limit.
Calculation details are as follows:
The changes proposed by Proposition 111 allow the City to annually choose among the following
options for calculating its Gann Limit: o Population growth of Palm Springs, or o Population growth within Riverside County, and o Growth in California per capita income, or o Growth in non-residential assessed valuation due to new construction in the City.
The factors used to calculate the 2013-14 limit are:
o Population growth of Palm Springs, and o Growth in California per capita income
The formula to calculate expenditure limit is outlined below: A. Prior Year (2012-13) Expenditure Limit
$127,707,125 B. Adjustment Factors
1 Palm Springs population growth converted to a ratio
1.0512
2 % growth in California per capita income converted to a ratio
1.0066
Total Adjustment ratio (B.1 x B.2)
1.05813792 C. Annual Adjustment (A x ( B-1))
7,424,627
D. Other Adjustments
0 E. Total Adjustments (C + D)
7,424,627
F. 2012-13 Expenditure Limit (A + E) or (A*B)
$135,131,752
Appropriations subject to limit and formula to calculate operating margin:
AA Current Appropriation of Proceeds of Taxes
$75,476,567 BB Exclusion
0
CC Current Appropriation of Proceeds of Taxes Subject to Limit
75,476,567 DD 2012-13 Expenditure Limit (F)
135,131,752
EE 2012-13 Over(Under) Limit (CC-DD)
($59,655,185)
The spending limit for the City of Palm Springs for 2013-14 is $135.1 million with appropriations of “proceeds of taxes” of $75.4 million. The result of the calculation
provides the City with an operating margin of $59.6 million and indicated that the City of Palm Springs is under the appropriations limit.

4-21
14. TABLE – SOURCE OF FUNDS BY DEPARTMENT
Source of Funds by Department – Fund Types
Department Groupings/Codes
G SP DS CP EN IS AD ML RDA
Administration √ √
Growth Management
√ √
Quality of Life √ √
Public Safety √ √
Public Work & Engineering
√ √ √
Measure J Capital
√ √
Capital Improvement Plan
√
Assessment Districts
√
Master Lease √
Debt Service √
Airport √
Golf Course √
Motor Vehicles √
Facilities Maintenance
√
Risk Management
√

4-22
Wastewater Treatment Plant
√
Redevelopment √
Fund Codes: General G-General Special Revenue Plaza Theatre, Forfeited Assets, Safety Augmentation, Indian Gaming
Special Distribution, Special Development, CSA 152, Recycling, Villagefest, Neighborhood Involvement, Business Improvement District, Energy Efficiency Loan Program, Parking, Parking Projects, Emergency Response, Community Development Block Grant, Sustainability, CFD Public Safety #1, Land/Lite/Park/Maint District, Air Quality Mgmt, Public Arts, Library Trust, Special Grants.
Assessment District All Assessment Districts 311,312,313,314,315,322,324,325,326,327 Master Lease Master Lease Debt Service Cal Energy Loan, Convention Center Debt, Police Building & Other,
Parking Structure Debt Capital Projects Special Gas Tax, Measure A Improvements, Drainage, Quimby Act Fees,
Capital Projects, Measure J Capital Enterprise Airport, Wastewater Treatment, Golf Course Internal Service Motor Vehicle Replacement, Facilities Maintenance, Retirement Benefits,
Risk Management, Retiree Health Insurance, Energy Redevelopment Merged Area #1, Merged Area #2, Low & Mod Income Housing

5-1
Combined Changes in Estimated Cash
Estimated Adopted Adopted Adopted Adopted EstimatedFund Description Available Cash Revenues Transfer-In Expenditures Transfer-Out Available Cash
7/1/2013 FY 13-14 FY 13-14 FY 13-14 FY 13-14 6/30/2014
CITY FUNDS:
General Fund 10,977,390 78,139,629 887,500 72,550,399 11,320,668 6,133,452
SPECIAL REVENUE FUNDS: Plaza Theatre Fund 905,500 0 0 0 0 905,500 Forfeited Assets 420,500 2,000 0 2,000 0 420,500 Safety Augmentation 51,149 736,884 0 736,884 0 51,149 Indian Gaming Special District 0 0 0 0 0 0 Special Development Fund 0 0 0 0 0 0 CSA 152 2,373 385,906 0 385,906 0 2,373 Recycling 951,500 145,000 0 1,145,000 0 (48,500) PS Villagefest 2,775 430,700 0 433,346 0 129 Neighborhood Involvement 2,000 0 0 0 0 2,000 Business Imp District 0 0 0 0 0 0 Energy Efficient Loan Program 500,000 0 0 0 0 500,000 Parking 91,500 62,000 213,462 259,696 0 107,266 Parking Capital Programs 459,386 4,000 0 4,000 0 459,386 Community Block Grant 0 311,205 0 311,205 0 0 Sustainability 502,310 435,000 1,091,615 0 (154,305) Land/Lite/Park Maintenance 243,000 199,700 0 199,700 0 243,000 CDF Public Safety #1 344,000 345,000 270,102 605,718 0 353,384 Air Quality Management 51,500 55,000 0 55,000 0 51,500 Public Arts 306,939 162,000 0 429,639 0 39,300 Library Endowment 2,991,000 31,100 0 31,100 0 2,991,000 Special Projects 1,391,000 100,000 0 100,000 0 1,391,000 Special Grants 0 228,464 0 228,464 0 0
CAPITAL PROJECT FUNDS: Special Gas Tax Improvements 395,500 1,404,078 0 798,078 600,000 401,500 Measure A Improvements 7,110,500 1,854,000 0 1,854,000 0 7,110,500 Measure J Capital 0 0 9,300,000 9,684,459 3,200,000 (3,584,459) Drainage 963,500 23,000 0 23,000 0 963,500 Emergency Response Fund 650,000 1,040,000 321,424 1,361,424 0 650,000 Quimby Park & Recreation 2,350,000 239,400 0 239,400 0 2,350,000 Capital Projects 235,000 0 0 0 0 235,000
DEBT SERVICE FUNDS: Master Lease 175,500 1,272,177 363,472 1,635,649 0 175,500 Debt Service 0 4,443,301 3,663,543 8,106,844 0 0 Assessment District 1,140,000 753,334 0 753,334 0 1,140,000
CITY OF PALM SPRINGS FY 2013-14 BUDGET

5-2
Combined Changes in Estimated Cash
Estimated Adopted Adopted Adopted Adopted EstimatedFund Description Available Cash Revenues Transfer-In Expenditures Transfer-Out Available Cash
7/1/2013 FY 13-14 FY 13-14 FY 13-14 FY 13-14 6/30/2014
ENTERPRISE FUNDS: Airport CFC 5,190,000 1,870,000 2,354,000 480,000 2,354,000 6,580,000 Airport PFC 995,000 3,797,500 0 3,787,914 0 1,004,586 Airport General Operation 12,050,000 17,447,550 0 17,447,550 1,037,500 11,012,500 Airport Capital Projects 810,500 11,762,500 750,000 14,296,750 0 (973,750) Waste Water Treatment 13,005,000 6,978,000 0 6,424,601 0 13,558,399 Golf Course (2,007,500) 5,096,315 388,665 5,553,533 0 (2,076,053)
INTERNAL SERVICE FUNDS: Motor Vehicle 2,023,000 3,270,772 0 3,270,772 0 2,023,000 Facilities Maintenance 857,500 3,970,214 0 3,970,214 0 857,500 Employee Retirement Benefit 455,000 13,453,836 0 13,453,836 0 455,000 Risk Management 2,550,000 12,146,875 0 12,146,875 0 2,550,000 Retiree Health Insurance 365,000 2,329,759 0 2,329,759 0 365,000 Cogeneration 1,100,000 2,753,803 0 2,753,803 0 1,100,000
TOTAL CITY FUNDS 70,607,322 177,680,002 18,512,168 188,941,467 18,512,168 59,345,857
CITY OF PALM SPRINGS FY 2013-14 BUDGET

5-3
GENERAL FUND (001) - REVENUE 2012-13 2012-13 2013-14FUND SUMMARIES 2009-10 2010-11 2011-12 ADOPTED ESTIMATED ADOPTEDSource of Funds ACTUAL ACTUAL ACTUAL BUDGET ACTUALS BUDGETBeginning Fund Balance - July 1 12,720,616 10,644,341 10,410,922 10,815,510 13,041,689 13,041,689 Revenues Taxes - Local CRA Pass Thru 395,472 30,373 258,252 319,670 215,989 213,500 Documentary Transfer Tax 377,945 325,540 449,180 300,000 513,329 300,000 Franchise Tax 2,906,018 2,995,503 2,536,482 3,000,000 2,549,419 3,000,000 Peg Fees - - 94,183 - 164,279 150,000 Homeowners Tax Relief 259,284 256,836 248,404 250,000 248,714 245,650 In-Lieu - Property Tax (MVIL) 3,802,568 3,578,466 3,481,240 3,481,240 3,513,005 3,481,240 New Development Tax 127,971 174,187 133,332 120,000 264,681 120,000 Parking Tax 48,631 48,305 54,395 48,000 49,050 48,000 Property Tax 17,803,811 16,743,732 15,462,933 16,161,508 15,892,855 16,186,508 Property Tax Admin Fee - - - - 68,477 68,477 Net AB 1 X 26 - - 459,056 420,713 229,366 511,000 Sales Tax 6,452,539 7,108,606 7,079,101 8,099,525 7,359,352 8,499,353 Sales Tax-ERAF Reimbursement 1,769,224 2,524,644 2,402,225 2,500,000 2,732,661 2,500,000 Measure J Sales Tax - - 1,176,933 8,000,000 10,137,045 9,300,000 Transient Occupancy Tax 5,846,323 15,662,280 18,047,961 17,640,000 19,529,645 18,996,000 TOT Hotel Incentive Program - - (188,655) (140,000) (186,000) (396,000) Utility Users Tax 6,575,901 6,936,963 6,878,551 7,000,000 7,090,370 7,000,000 Licenses, Permits, Fees & Srvs Animal Shelter Fees & Animal Licenses 74,749 66,609 84,930 92,000 39,884 0 Alarm Permits - Police 61,533 67,399 70,929 61,000 71,777 61,000 Building Permits 627,402 807,029 896,355 900,000 820,643 900,000 Building Plan Check Fees 311,086 316,902 339,041 325,000 344,246 325,000 Business License 871,402 879,205 860,973 900,000 870,198 875,000 Construction Permits 73,996 193,794 47,875 225,000 66,253 80,000 Engineering Plan Check Fees 138,628 238,865 139,416 225,000 199,897 180,000 Misc. Filing Fee 65,890 83,668 87,577 90,000 131,383 90,000 Multi-Unit Fire Inspection Fee 85,744 69,952 109,620 60,000 64,766 90,000 Fire Cert Program - - - - - 1,000 Fire CPR Program - - - - - 500 Motor Vehicle In Lieu 139,939 218,656 23,767 0 24,626 0 Nuisance Abatement Fees 16,669 113,855 36,093 25,000 46,236 25,000 Other Lic., Fees, Permits, & Serv. 731,767 958,751 355,423 343,400 456,947 346,579 Permit Issuance 93,293 109,084 110,990 110,000 135,959 110,000 Smoke Detector Inspections 93,144 102,065 102,002 90,000 111,407 90,000 General Plan Maint. Surcharge 14,463 26,864 21,908 16,000 33,927 25,000 Zoning Fees 105,942 187,843 81,012 150,000 141,371 150,000 Fines & Forfeitures Abandoned Vehicle Abatement 10,948 1,340 69,365 1,500 7,312 10,000 False Alarm Fees 165,522 125,312 113,881 125,000 80,017 100,000 Towing Fees 62,500 87,500 75,000 75,000 93,750 75,000 Vehicle Code Fines 228,661 199,076 151,572 200,000 128,718 200,000 Interest Earnings and Property Rental Building / Facilities / Land Rental 44,697 48,864 81,121 52,000 171,920 146,000 Interest Income 203,766 222,911 86,828 150,000 280,280 50,000 Interest CRA Loan 2,830,600 1,567 0 0 0 0 Other Revenue Administrative Service Charges 1,825,547 1,703,735 1,610,145 1,672,445 1,663,987 1,639,079 Casino Agreement 300,000 300,000 300,000 300,000 300,000 300,000 CRA Administrative Services 160,000 160,000 93,333 0 - 0 Grant, Contrib, & Intergov. Rev 379,780 428,146 336,450 205,724 2,280,310 196,843 Landscaping, Lighting & Parkway 8,605 26,073 20,753 3,000 29,271 0 Recreation Program/Facilities Rev 571,601 718,443 774,805 630,050 887,237 684,400 Rent Control 46,710 42,960 42,960 46,000 43,710 46,000 Rent - A - Cell 55,168 33,632 48,072 17,000 36,678 30,000 Special Police & Fire Dept. Serv. 682,358 698,668 683,773 641,000 742,155 650,500 Sale of Real or Personal Property 5,109,053 610,804 84,367 0 144,461 5,000 Tourism Contribution - Tribe 433,967 434,000 434,000 434,000 434,000 434,000 Subtotal 62,990,817 66,669,008 66,947,908 75,365,775 81,255,563 78,139,629 Transfers In 650,000 1,684,355 887,500 887,500 887,500 887,500 Prior Period Adjustment 560,000 Total Revenue & Transfers In 63,640,817 68,353,363 67,835,408 76,253,275 82,143,063 79,027,129

5-4
GENERAL FUND (001) - EXPENDITURES 2012-13 2012-13 2013-14FUND SUMMARIES 2009-10 2010-11 2011-12 ADOPTED ESTIMATED ADOPTEDUse of Funds ACTUAL ACTUAL ACTUAL BUDGET ACTUAL BUDGET City Council 570,541 481,380 525,282 567,086 546,245 627,539 City Manager 592,417 616,114 652,288 581,887 619,774 653,315 Development Services 253,570 263,647 287,182 277,484 289,089 - Neighborhood Involve 136,733 149,830 152,212 158,262 164,612 175,644 Information Technology 1,320,788 1,081,118 1,106,720 1,082,508 1,134,142 1,159,826 City Clerk 661,417 630,656 727,718 656,433 702,852 953,634 Human Resources 344,856 253,669 341,268 382,908 354,949 423,417 Rent Control 32,889 32,853 34,850 39,385 42,466 42,400 City Attorney 830,999 1,020,690 1,445,740 705,459 1,440,966 706,351 Unallocated Comp 42,298 55,572 79,084 1,060,000 79,428 1,060,000 Public Affairs/PSCTV 255,864 203,433 229,972 233,166 259,535 284,328 Document Management 434,692 202,893 154,239 173,703 157,735 166,962 Finance 2,080,863 1,980,981 2,390,346 2,325,337 2,582,245 2,595,272 Procurement 469,966 406,886 443,404 459,377 445,731 511,957 Community & Econ. Dev. 228,356 282,151 608,296 962,345 692,294 1,203,870 Homeless Program 103,000 103,000 103,000 103,000 103,000 103,000 GPSCVB - 355,587 356,613 350,000 381,196 400,000 Visitor Info Center - 7,428 5,000 5,000 5,000 5,000 Tourism - 1,650,204 1,800,732 1,950,000 1,950,000 1,950,000 Special Events - 342,098 345,050 353,530 394,665 233,684 Special Contributions - 10,000 10,000 10,000 10,000 86,000 Event Sponsorship - 350,000 350,000 350,000 350,000 350,000 Eco Recovery/Dev Plan - - 539,880 341,000 248,109 - Convention Center - 6,633,087 6,534,035 6,833,902 6,885,365 6,788,990 Leased Prop Cap Improv - - 9,615 - - - Plaza Theatre - - 54,196 - 50,389 53,890 Approp for Contingency - - 2,629 - - - Planning 1,087,336 976,532 1,026,887 1,063,298 1,082,426 1,203,933 Building & Safety 1,950,198 1,628,577 1,675,899 1,895,670 1,631,805 2,131,731 Parks & Parkways Mnt. 3,057,304 2,893,205 3,099,838 4,129,521 4,242,119 3,332,405 Recreation Programs 2,120,149 1,429,166 1,474,112 1,556,806 1,582,487 1,732,010 Tennis Center 16,500 58,002 53,500 22,500 56,500 22,500 Palm Springs Skate Park 79,589 122,056 56,345 160,000 66,540 160,000 Swim Center - 455,468 526,105 595,138 581,583 640,944 Demuth Community Center - 127,853 138,893 206,138 167,664 228,474 James O. Jessie DHUC 452,495 474,996 548,991 574,143 558,910 637,609 Library 2,057,259 1,888,595 2,052,755 2,304,932 1,981,821 2,427,335 Subtotal - General Admin. 19,180,080 27,167,726 29,942,678 32,469,918 31,841,642 33,052,020 Police 16,646,248 15,111,503 15,808,095 17,077,854 16,794,751 18,064,653 Jail Operations 900,431 174,987 136,294 166,752 167,003 186,403 Downtown Exp. - Police 875,041 663,845 659,464 770,034 769,653 755,750 Recovery Act COPS 3,423 150,003 200,461 164,467 232,454 - Police SDF - 496,879 247,914 - 630,692 655,193 Animal Control/Shelter 630,801 445,589 1,139,903 1,205,014 1,250,713 1,465,067 Dispatch Center 1,532,662 1,007,253 1,074,889 10,933,478 994,300 1,209,921 Fire 10,099,473 9,255,434 10,751,245 10,929,448 10,298,015 10,991,947 Safer Grant 520,539 485,306 42,684 - - - Fire SDF - 395,241 175,858 - 415,452 455,865 Disaster Preparedness 166,228 88,165 72,684 135,422 88,277 136,093 Subtotal - Public Safety 31,374,847 28,274,205 30,309,491 41,382,469 31,641,312 33,920,892 Engineering 1,356,993 1,467,774 1,579,047 1,754,171 1,529,081 1,923,811 Street Maintenance 1,098,552 1,103,523 1,145,004 1,197,998 1,111,710 1,308,716 Downtown Exp. Mntce. 754,921 695,467 723,251 - - 1,168,795 Street Cleaning 26,250 26,250 26,250 27,000 26,250 27,000 Street Lighting 1,000,180 981,863 1,105,686 1,064,911 949,596 1,078,985 Railroad Station 44,083 69,382 68,432 70,106 46,071 70,180 Subtotal - Transportation 4,280,980 4,344,259 4,647,670 4,114,186 3,662,708 5,577,487 Total General Fund Budget 54,835,907 59,786,191 64,899,838 77,966,573 67,145,662 72,550,399 Transfers Out 12,475,540 2,046,929 2,042,451 10,042,451 2,042,451 11,320,668 Ending Fund Balance - June 30 10,644,341 10,410,922 10,410,922 13,041,689 13,041,689 12,240,809

5-5
FUND SUMMARIES COMMUNITY PROMOTION FUND (112)
2009-10 2010-11 2010-11 2012-13 2012-13 2013-14ADOPTED ADOPTED
ACTUAL ACTUAL ACTUAL BUDGET ACTUAL BUDGET
Source of Funds
Beginning Fund Balance – July 1 555,859 699,077 (0) (0) (0) (0)
RevenuesTransient Occupancy Taxes 7,524,508 0 0 0 0 0Miscellaneous 165,151 0 0 0 0 0Subtotal 7,689,659 0 0 0 0 0
Transfer In 0 0 0 0 0 0
Total Revenues & Transfers In 7,689,659 0 0 0 0 0
Use of Funds
ExpendituresPSDRCVA Dues 1,550,203 0 0 0 0 0Tourism -Operations 545,311 0 0 0 0 0International Film Festival 400,000 0 0 0 0 0Annenberg Theatre KD Lang 0 0 0 0 0 0Senior World Series Softball 0 0 0 0 0 0Festival of Lights Parade 30,959 0 0 0 0 0Holiday Decorations 0 0 0 0 0 0Parades of Palm Springs 30,000 0 0 0 0 0Air Museum - DaVinci 0 0 0 0 0 0Easter Bowl Tennis 0 0 0 0 0 0Palm Springs Pride Parade 25,135 0 0 0 0 0Bob Hope Chrysler Classic 0 0 0 0 0 0July 4th 32,660 0 0 0 0 0Veterans Day Parade 26,250 0 0 0 0 0Veterans Day Parade-Sponsors 34,276 0 0 0 0 0Community Concerts 480 0 0 0 0 0Bike Weekend 4,341 0 0 0 0 0Mrs. American Pageant 0 0 0 0 0 0Miss Teen USA 0 0 0 0 0 0Other Special Events & Contrib. 81,277 0 0 0 0 0Senior Center Contribution 52,880 0 0 0 0 0Mounted Police Contribution 0 0 0 0 0 0Visitor's Information Center 5,000 0 0 0 0 0Convention Center – Operations 2,027,671 0 0 0 0 0Subtotal 4,846,442 0 0 0 0 0
Total Operating - Budget 4,846,442 0 0 0 0 0
Transfer Out 2,700,000 699,077 0 0 0 0
Ending Fund Balance – June 30 699,077 (0) (0) (0) (0) (0)
FOR OVERALL BUDGET PURPOSES, THE GENERAL FUND (001) AND COMMUNITY PROMOTION FUND (112) ARE COMBINED.

5-6
FUND SUMMARIES CITY LEASED PROPERTY FUND (113)
2009-10 2010-11 2011-12 2012-13 2012-13 2013-14ADOPTED ADOPTED
ACTUAL ACTUAL ACTUAL BUDGET ACTUAL BUDGET
Source of Funds
Beginning Fund Balance – July 1 0 0 0 69,512 0 0
RevenuesInterest Income 0 0 (2,072) 90,486 0 0Miscellaneous 0 0 0 0 0 0Subtotal 0 0 (2,072) 90,486 0 0
Transfer In 0 0 0 0 0 0
Total Revenues & Transfers In 0 0 (2,072) 90,486 0 0
Use of Funds
DepartmentsUtilities (1,549) 7,020 0 0Water 0 3,200 0 0Land Leases & Rental (8,400) 8,000 0 0Materials, Supplies, Services (19,469) 30,000 0 0Contractual Services (12,875) 20,000 0 0Special Charges (19,676) 22,266 0 0Capital (9,615) 0 0 0Subtotal 0 0 (71,584) 90,486 0 0
Total Operating - Budget 0 0 (71,584) 90,486 0 0
Transfer Out 0 0 0 0 0 0
Ending Fund Balance – June 30 0 0 69,512 69,512 0 0
NOTE; FUND NAME CHANGED FROM PLAZA THEATRE FUND TO CITY LEASED PROPERTY.FY 13-14 - THIS ACTIVITY WAS MOVED FROM FUND 113 TO THE GENERAL FUND 001

5-7
FUND SUMMARIES ECONOMIC RECOVERY PLAN FUND (117)
2009-10 2010-11 2011-12 2012-13 2012-13 2013-14ADOPTED ADOPTED
ACTUAL ACTUAL ACTUAL BUDGET ACTUAL BUDGET
Source of Funds
Beginning Fund Balance – July 1 0 612,159 0 0 0 0
RevenuesInterest Income 0 0 0 0 0 0Miscellaneous 0 0 0 0 0 0Subtotal 0 0 0 0 0 0
Transfer In 1,000,000 0 0 0 0 0
Total Revenues & Transfers In 1,000,000 0 0 0 0 0
Use of Funds
DepartmentsSummer Splash 14,380 0 0 0 0 0Art/Photo Vacant Store 6,139 4,009 0 0 0 0PS I-HUB Designation 6,350 94,288 0 0 0 0New Hotel Marketing 150,000 0 0 0 0 0Comm Interior Remodel 0 166,074 0 0 0 0Façade Improvement 0 100,000 0 0 0 0CVEP Econ Blueprint 0 100,000 0 0 0 0Other Misc Programs 200,000 13,912 0 0 0 0Tourism Marketing 10,972 26,561 0 0 0 0Subtotal 387,841 504,844 0 0 0 0
Total Operating - Budget 387,841 504,844 0 0 0 0
Transfer Out 0 0 0 0 0 0
Ending Fund Balance – June 30 612,159 107,315 0 0 0 0
THIS FUND WAS COMBINED INTO THE GENERAL FUND IN FY 2011-12

5-8
FUND SUMMARIES FORFEITED ASSETS FUND (120)
2009-10 2010-11 2011-12 2012-13 2012-13 2013-14ADOPTED ADOPTED
ACTUAL ACTUAL ACTUAL BUDGET ACTUAL BUDGET
Source of Funds
Beginning Fund Balance – July 1 539,812 453,136 403,752 392,217 392,217 330,327
RevenuesSeized Assets 207,380 57,857 50,658 0 24,192 0Interest Income 7,025 4,480 3,311 2,000 1,776 2,000Miscellaneous 0 0 0 0 0 0Subtotal 214,405 62,337 53,969 2,000 25,968 2,000
Transfer In 0 0 0 0 0 0
Total Revenues & Transfers In 214,405 62,337 53,969 2,000 25,968 2,000
Use of Funds
DepartmentsPolice Department 301,081 111,721 65,504 2,000 87,858 2,000Subtotal 301,081 111,721 65,504 2,000 87,858 2,000
Total Operating - Budget 301,081 111,721 65,504 2,000 87,858 2,000
Transfer Out 0 0 0 0 0 0
Ending Fund Balance – June 30 453,136 403,752 392,217 392,217 330,327 330,327

5-9
FUND SUMMARIES SAFETY AUGMENTATION FUND (121)
2009-10 2010-11 2011-12 2012-13 2012-13 2013-14ADOPTED ADOPTED
ACTUAL ACTUAL ACTUAL BUDGET ACTUAL BUDGET
Source of Funds
Beginning Fund Balance – July 1 702,645 393,880 195,536 256,228 256,228 473,139
RevenuesTax 640,839 662,370 716,829 631,865 789,707 735,884Charges for Services 8,980 2,521 33,026 0 5,090 0Fines and Penalties 14,632 45,832 0 0 28,283 0Interest Income 8,126 1,469 170 20,000 656 1,000Contributions Non-Gov. Sources 25,857 5,626 0 0 0 0Subtotal 698,435 717,818 750,025 651,865 823,736 736,884
Transfer In 0 0 0 0 0 0
Total Revenues & Transfers In 698,435 717,818 750,025 651,865 823,736 736,884
Use of Funds
DepartmentsPolice Department 585,679 516,342 446,989 413,656 372,401 415,381Police Contributions 55,581 22,310 0 0 0 0Fire Department 365,940 377,511 242,345 187,060 234,424 321,503Subtotal 1,007,200 916,163 689,333 600,716 606,825 736,884
Total Operating - Budget 1,007,200 916,163 689,333 600,716 606,825 736,884
Transfer Out 0 0 0 0 0 0
Ending Fund Balance – June 30 393,880 195,536 256,228 307,377 473,139 473,139

5-10
FUND SUMMARIES INDIAN GAMING SPECIAL DISTRIBUTION FUND (122)
2009-10 2010-11 2011-12 2012-13 2012-13 2013-14ADOPTED ADOPTED
ACTUAL ACTUAL ACTUAL BUDGET ACTUAL BUDGET
Source of Funds
Beginning Fund Balance – July 1 21,833 0 0 0 0 0
RevenuesIndian Special Distribution Fee 0 0 565,068 0 0 0Interest Income 0 0 0 0 0 0Subtotal 0 0 565,068 0 0 0
Transfer In 1,157,099 0 0 0 0 0
Total Revenues & Transfers In 1,157,099 0 565,068 0 0 0
Use of Funds
DepartmentsPolice Special Distribution Fund 590,044 0 294,889 0 0 0Fire Special Distribution Fund 588,888 0 270,179 0 0 0Subtotal 1,178,932 0 565,068 0 0 0
Total Operating - Budget 1,178,932 0 565,068 0 0 0
Transfer Out 0 0 0 0 0 0
Ending Fund Balance – June 30 0 0 0 0 0 0
This fund was combined into the General Fund in Fiscal Year 2010-2011.

5-11
FUND SUMMARIES SPECIAL DEVELOPMENT FUND (123)
2009-10 2010-11 2011-12 2012-13 2012-13 2013-14ADOPTED ADOPTED
ACTUAL ACTUAL ACTUAL BUDGET ACTUAL BUDGET
Source of Funds
Beginning Fund Balance – July 1 724,886 746,111 756,716 852,777 852,777 1,303,469
RevenuesCharges for Services 11,545 3,056 89,999 0 445,917 0Interest Income 9,680 7,550 6,062 0 4,775 0Subtotal 21,225 10,606 96,061 0 450,692 0
Transfer In 0 0 0 0 0 0
Total Revenues & Transfers In 21,225 10,606 96,061 0 450,692 0
Use of Funds
DepartmentsTract 29632 Acanto 0 0 0 0 0 0Tract 30050 El Portal 0 0 0 0 0 0Tract 30046 Monte Sereno 0 0 0 0 0 0Other Tracts 0 0 0 0 0 0Subtotal 0 0 0 0 0 0
Total Operating - Budget 0 0 0 0 0 0
Transfer Out
Ending Fund Balance – June 30 746,111 756,716 852,777 852,777 1,303,469 1,303,469

5-12
FUND SUMMARIES CSA 152 FUND (124)
2009-10 2010-11 2011-12 2012-13 2012-13 2013-14ADOPTED ADOPTED
ACTUAL ACTUAL ACTUAL BUDGET ACTUAL BUDGET
Source of Funds
Beginning Fund Balance – July 1 2,373 2,373 2,403 2,403 2,403 (21,190)
RevenuesSpecial Assessments 280,015 247,905 276,946 394,750 270,042 385,906Subtotal 280,015 247,905 276,946 394,750 270,042 385,906
Transfer In 0 0 0 0 0 0
Total Revenues & Transfers In 280,015 247,905 276,946 394,750 270,042 385,906
Use of Funds
DepartmentsStreet Cleaning 280,015 247,875 276,946 394,750 293,635 385,906Subtotal 280,015 247,875 276,946 394,750 293,635 385,906
Total Operating - Budget 280,015 247,875 276,946 394,750 293,635 385,906
Transfer Out 0 0 0 0 0 0
Ending Fund Balance – June 30 2,373 2,403 2,403 2,403 (21,190) (21,190)

5-13
FUND SUMMARIES RECYCLING FUND - AB939 (125)
2009-10 2010-11 2011-12 2012-13 2012-13 2013-14ADOPTED ADOPTED
ACTUAL ACTUAL ACTUAL BUDGET ACTUAL BUDGET
Source of Funds
Beginning Fund Balance – July 1 3,337,337 979,337 993,810 1,088,410 1,088,410 1,076,500
RevenuesInterest Income 59,176 9,488 10,326 11,000 5,262 7,000Grants 0 0 25,196 0 0 0Recycling Surcharge AB939 121,723 137,186 112,129 133,010 109,293 138,000Diversion Facility Fee 0 0 0 0 0 0Computer Collection Revenue 0 0 1,262 0 0 0Miscellaneous 0 2,958 1,021 0 (1) 0Subtotal 180,899 149,632 149,934 144,010 114,553 145,000
Transfer In 0 0 0 0 0 0
Total Revenues & Transfers In 180,899 149,632 149,934 144,010 114,553 145,000
Use of Funds
ExpendituresRecycling Programs 115,079 135,159 55,334 144,010 126,464 1,145,000Grants 0 0 0 0 0 0Subtotal 115,079 135,159 55,334 144,010 126,464 1,145,000
Total Operating - Budget 115,079 135,159 55,334 144,010 126,464 1,145,000
Transfer Out 2,423,820 0 0 0 0 0Transfer Out to Sustainability Fund 0 0 0 0 0 0
Ending Fund Balance – June 30 979,337 993,810 1,088,410 1,088,410 1,076,500 76,500

5-14
FUND SUMMARIES PALM SPRINGS VILLAGEFEST FUND (127)
2009-10 2010-11 2011-12 2012-13 2012-13 2013-14ADOPTED ADOPTED
ACTUAL ACTUAL ACTUAL BUDGET ACTUAL BUDGET
Source of Funds
Beginning Fund Balance - July 1 63,206 38,632 29,380 17,055 17,055 76,301
RevenuesLicenses & Permits 346,829 365,692 385,268 400,388 422,518 421,500Charges for Services 12,205 13,260 11,315 14,250 10,725 9,200Misc. 0 0 0 0 0 0Subtotal 359,034 378,952 396,583 414,638 433,243 430,700
Transfer In 0 0 0 0 0 0
Total Revenues & Transfers In 359,034 378,952 396,583 414,638 433,243 430,700
Use of Funds
DepartmentsPalm Springs Villagefest 383,608 388,204 408,908 431,863 373,997 433,346Subtotal 383,608 388,204 408,908 431,863 373,997 433,346
Total Operating Budget 383,608 388,204 408,908 431,863 373,997 433,346
Transfer Out 0 0 0 0 0 0
Ending Fund Balance – June 30 38,632 29,380 17,055 (170) 76,301 73,655

5-15
FUND SUMMARIES NEIGHBORHOOD INVOLVEMENT FUND (128)
2009-10 2010-11 2011-12 2012-13 2012-13 2013-14ADOPTED ADOPTED
ACTUAL ACTUAL ACTUAL BUDGET ACTUAL BUDGET
Source of Funds
Beginning Fund Balance - July 1 1,840 1,550 2,189 6,425 6,425 4,604
RevenuesInterest Income (1,421) 0 0 0 0 0Misc Income 6,605 3,775 8,505 0 7,095 0Subtotal 5,184 3,775 8,505 0 7,095 0
Transfer In 0 0 0 0 0 0
Total Revenues & Transfers In 5,184 3,775 8,505 0 7,095 0
Use of Funds
DepartmentsNeighborhood Development 5,474 3,136 4,269 0 8,916 0Subtotal 5,474 3,136 4,269 0 8,916 0
Total Operating Budget 5,474 3,136 4,269 0 8,916 0
Transfer Out 0 0 0 0 0 0
Ending Fund Balance – June 30 1,550 2,189 6,425 6,425 4,604 4,604

5-16
FUND SUMMARIES BUSINESS IMPROVEMENT DISTRICT (129)
2009-10 2010-11 2011-12 2012-13 2012-13 2013-14ADOPTED ADOPTED
ACTUAL ACTUAL ACTUAL BUDGET ACTUAL BUDGET
Source of Funds
Beginning Fund Balance - July 1 28,044 7,716 (8,986) (41,582) (41,582) (43,757)
RevenuesInterest Income 345 288 273 0 30 0Business Improvement Fee 30,951 3,176 1,650 0 450 0Subtotal 31,296 3,464 1,923 0 480 0
Transfer In 0 0 0 0 0 0
Total Revenues & Transfers In 31,296 3,464 1,923 0 480 0
Use of Funds
DepartmentsBusiness Improvement District 51,624 20,166 34,518 0 2,655 0Subtotal 51,624 20,166 34,518 0 2,655 0
Total Operating Budget 51,624 20,166 34,518 0 2,655 0
Transfer Out 0 0 0 0 0 0
Ending Fund Balance – June 30 7,716 (8,986) (41,582) (41,582) (43,757) (43,757)
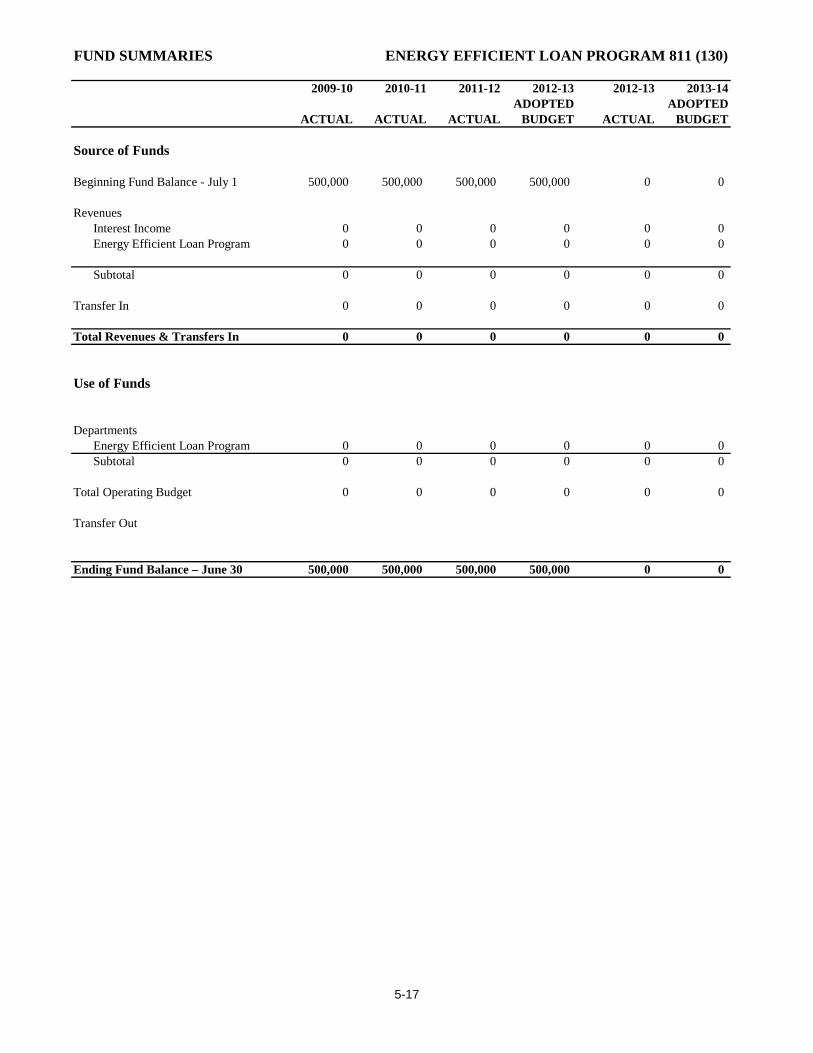
5-17
FUND SUMMARIES ENERGY EFFICIENT LOAN PROGRAM 811 (130)
2009-10 2010-11 2011-12 2012-13 2012-13 2013-14ADOPTED ADOPTED
ACTUAL ACTUAL ACTUAL BUDGET ACTUAL BUDGET
Source of Funds
Beginning Fund Balance - July 1 500,000 500,000 500,000 500,000 0 0
RevenuesInterest Income 0 0 0 0 0 0Energy Efficient Loan Program 0 0 0 0 0 0
Subtotal 0 0 0 0 0 0
Transfer In 0 0 0 0 0 0
Total Revenues & Transfers In 0 0 0 0 0 0
Use of Funds
DepartmentsEnergy Efficient Loan Program 0 0 0 0 0 0Subtotal 0 0 0 0 0 0
Total Operating Budget 0 0 0 0 0 0
Transfer Out
Ending Fund Balance – June 30 500,000 500,000 500,000 500,000 0 0

5-18
FUND SUMMARIES PARKING FUND (131)
2009-10 2010-11 2011-12 2012-13 2012-13 2013-14ADOPTED ADOPTED
ACTUAL ACTUAL ACTUAL BUDGET ACTUAL BUDGET
Source of Funds
Beginning Fund Balance - July 1 58,958 81,813 196,481 228,151 228,151 231,718
RevenuesFines & Penalties 63,473 49,967 54,180 60,500 68,188 60,500Interest Income 0 0 0 0 0 0Parking Lot/Structure Revenue 1,111 699 1,325 1,500 1,477 1,500Subtotal 64,584 50,666 55,505 62,000 69,665 62,000
Transfer In 200,000 213,333 198,087 179,962 179,962 213,462
Total Revenues & Transfers In 264,584 263,999 253,592 241,962 249,627 275,462
Use of Funds
ExpendituresParking Enforcement 6,088 4,775 8,372 16,041 8,811 11,024Materials, Supplies & Services 133,865 85,288 130,134 53,200 142,128 166,300Special Charges 101,776 59,268 83,416 50,075 95,121 82,372Subtotal 241,729 149,331 221,922 119,316 246,060 259,696
Total Operating - Budget 241,729 149,331 221,922 119,316 246,060 259,696
Transfer Out 0 0 0 0 0 0
Ending Fund Balance – June 30 81,813 196,481 228,151 350,797 231,718 247,484

5-19
FUND SUMMARIES PARKING CAPITAL PROGRAMS FUND (132)
2009-10 2010-11 2011-12 2012-13 2012-13 2013-14ADOPTED ADOPTED
ACTUAL ACTUAL ACTUAL BUDGET ACTUAL BUDGET
Source of Funds
Beginning Fund Balance - July 1 475,533 478,992 481,279 482,962 482,962 483,124
RevenuesIn Lieu Parking Fees 6,243 0 0 0 0 0Interest Income 0 4,815 3,838 0 2,276 4,000Miscellaneous 0 0 0 0 0 0Sale Real or Personal Propery 0 0 0 0 0 0Bond Proceeds 0 0 0 0 0 0Subtotal 6,243 4,815 3,838 0 2,276 4,000
Transfer In 0 0 0 0 0 0
Total Revenues & Transfers In 6,243 4,815 3,838 0 2,276 4,000
Use of Funds
ExpendituresMaterials, Supplies & Services 0 0 0 10,000 0 2,995Special Charges 2,784 2,204 2,054 2,114 2,114 1,005Debt Service 0 0 0 0 0 0Capital Projects 0 324 101 0 0 0Subtotal 2,784 2,528 2,155 12,114 2,114 4,000
Total Operating - Budget 2,784 2,528 2,155 12,114 2,114 4,000
Transfer Out 0 0 0 0 0 0
Ending Fund Balance – June 30 478,992 481,279 482,962 470,848 483,124 483,124

5-20
FUND SUMMARIES GAS TAX FUND (133)
2009-10 2010-11 2011-12 2012-13 2012-13 2013-14ADOPTED ADOPTED
ACTUAL ACTUAL ACTUAL BUDGET ACTUAL BUDGET
Source of Funds
Beginning Fund Balance - July 1 1,590,507 767,218 407,562 975,568 975,568 938,660
RevenuesInterest Income 5,001 5,887 4,145 8,000 3,612 6,000Contribution Non-Government 0 0 0 0 0 0City of Cathedral City 0 0 0 0 0 0Gas Tax Revenue - State 771,326 1,190,861 1,189,332 1,252,999 1,080,215 1,398,078Prop 1B 0 0 0 0 0 0Traffic Congestion 431,560 0 0 0 0 0Miscellaneous Revenue 0 36,483 0 0 0 0Subtotal 1,207,887 1,233,231 1,193,477 1,260,999 1,083,827 1,404,078
Transfer In 0 0 0 0 0 0
Total Revenues & Transfers In 1,207,887 1,233,231 1,193,477 1,260,999 1,083,827 1,404,078
Use of Funds
ExpendituresMaterials, Supplies & Services 76,226 1,548 1,600 1,650 1,642 1,650Street Projects 1,354,949 991,340 23,871 660,999 519,093 796,428Subtotal 1,431,175 992,888 25,471 662,649 520,735 798,078
Total Operating - Budget 1,431,175 992,888 25,471 662,649 520,735 798,078
Transfer Out 600,000 600,000 600,000 600,000 600,000 600,000
Ending Fund Balance – June 30 767,218 407,562 975,568 973,918 938,660 944,660
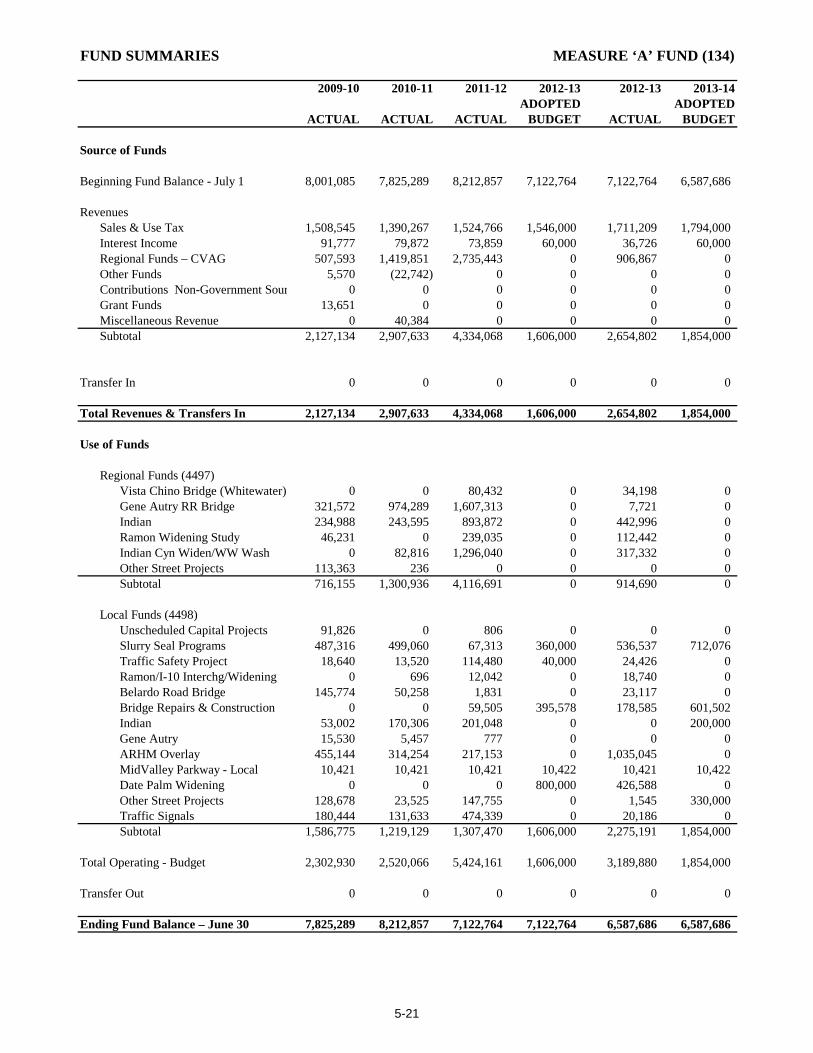
5-21
FUND SUMMARIES MEASURE ‘A’ FUND (134)
2009-10 2010-11 2011-12 2012-13 2012-13 2013-14ADOPTED ADOPTED
ACTUAL ACTUAL ACTUAL BUDGET ACTUAL BUDGET
Source of Funds
Beginning Fund Balance - July 1 8,001,085 7,825,289 8,212,857 7,122,764 7,122,764 6,587,686
RevenuesSales & Use Tax 1,508,545 1,390,267 1,524,766 1,546,000 1,711,209 1,794,000Interest Income 91,777 79,872 73,859 60,000 36,726 60,000Regional Funds – CVAG 507,593 1,419,851 2,735,443 0 906,867 0Other Funds 5,570 (22,742) 0 0 0 0Contributions Non-Government Sour 0 0 0 0 0 0Grant Funds 13,651 0 0 0 0 0Miscellaneous Revenue 0 40,384 0 0 0 0Subtotal 2,127,134 2,907,633 4,334,068 1,606,000 2,654,802 1,854,000
Transfer In 0 0 0 0 0 0
Total Revenues & Transfers In 2,127,134 2,907,633 4,334,068 1,606,000 2,654,802 1,854,000
Use of Funds
Regional Funds (4497)Vista Chino Bridge (Whitewater) 0 0 80,432 0 34,198 0Gene Autry RR Bridge 321,572 974,289 1,607,313 0 7,721 0Indian 234,988 243,595 893,872 0 442,996 0Ramon Widening Study 46,231 0 239,035 0 112,442 0Indian Cyn Widen/WW Wash 0 82,816 1,296,040 0 317,332 0Other Street Projects 113,363 236 0 0 0 0Subtotal 716,155 1,300,936 4,116,691 0 914,690 0
Local Funds (4498)Unscheduled Capital Projects 91,826 0 806 0 0 0Slurry Seal Programs 487,316 499,060 67,313 360,000 536,537 712,076Traffic Safety Project 18,640 13,520 114,480 40,000 24,426 0Ramon/I-10 Interchg/Widening 0 696 12,042 0 18,740 0Belardo Road Bridge 145,774 50,258 1,831 0 23,117 0Bridge Repairs & Construction 0 0 59,505 395,578 178,585 601,502Indian 53,002 170,306 201,048 0 0 200,000Gene Autry 15,530 5,457 777 0 0 0ARHM Overlay 455,144 314,254 217,153 0 1,035,045 0MidValley Parkway - Local 10,421 10,421 10,421 10,422 10,421 10,422Date Palm Widening 0 0 0 800,000 426,588 0Other Street Projects 128,678 23,525 147,755 0 1,545 330,000Traffic Signals 180,444 131,633 474,339 0 20,186 0Subtotal 1,586,775 1,219,129 1,307,470 1,606,000 2,275,191 1,854,000
Total Operating - Budget 2,302,930 2,520,066 5,424,161 1,606,000 3,189,880 1,854,000
Transfer Out 0 0 0 0 0 0
Ending Fund Balance – June 30 7,825,289 8,212,857 7,122,764 7,122,764 6,587,686 6,587,686

5-22
FUND SUMMARIES DRAINAGE FUND (135)
2009-10 2010-11 2011-12 2012-13 2012-13 2013-14ADOPTED ADOPTED
ACTUAL ACTUAL ACTUAL BUDGET ACTUAL BUDGET
Source of Funds
Beginning Fund Balance - July 1 1,253,350 1,142,307 1,121,744 1,099,236 1,099,236 1,108,118
RevenuesInterest Income 111,431 8,183 11,521 0 5,146 0North Zone Fees 0 40,906 1,459 13,000 27,250 13,000Central Zone Fees 0 47,166 13,368 10,000 24,692 10,000South Zone Fees 0 0 0 0 11,901 0East Zone Fees 0 54,014 0 0 40,960 0Southeast Zone Fees 0 18,063 46,003 0 1,700 0Contributions Non-Gov Sources 0 0 0 0 0 0Subtotal 111,431 168,334 72,352 23,000 111,650 23,000
Transfer In 0 0 0 0 0 0
Total Revenues & Transfers In 111,431 168,334 72,352 23,000 111,650 23,000
Use of Funds
DepartmentsNorth Zone 407 154 0 13,000 0 13,000Central Zone 187,302 5,388 0 10,000 5,111 10,000South Zone 0 24,485 0 0 89,088 0East Zone 34,200 4,071 0 0 0 0Southeast Zone 565 151,051 94,859 0 8,569 0Eagle Canyon Drainage 0 3,750 0 0 0 0South Palm Canyon Drainage 0 0 0 0 0 0Subtotal 222,474 188,898 94,859 23,000 102,768 23,000
Total Operating - Budget 222,474 188,898 94,859 23,000 102,768 23,000
Transfer Out 0 0 0 0 0 0
Ending Fund Balance – June 30 1,142,307 1,121,744 1,099,236 1,099,236 1,108,118 1,108,118

5-23
FUND SUMMARIES EMERGNECY RESPONSE FUND (136)
2009-10 2010-11 2011-12 2012-13 2012-13 2013-14ADOPTED ADOPTED
ACTUAL ACTUAL ACTUAL BUDGET ACTUAL BUDGET
Source of Funds
Beginning Fund Balance - July 1 0 612,715 431,980 177,363 177,363 242,220
RevenuesImterest Income 0 0 0 5,000 3,771 5,000911 Emergency Response Fee 1,076,286 1,017,253 998,995 965,000 1,020,528 1,035,000Subtotal 1,076,286 1,017,253 998,995 970,000 1,024,299 1,040,000
Transfer In 1,848,015 362,415 345,199 321,423 321,423 321,424
Total Revenues & Transfers In 1,076,286 1,379,668 1,344,194 1,291,423 1,345,722 1,361,424
Use of FundsSalary Savings 0 0 0 0 0 0Costshift 911 0 634,000 634,000 634,000 634,000 634,000Workers Compensation 0 0 37,784 44,009 44,009 43,266Radio Maintenance 159,963 165,117 177,420 185,000 189,920 255,743Contractual Services 0 50,458 55,994 80,000 64,521 80,000Principal 0 287,878 300,401 313,469 313,469 327,105Interest 0 134,441 121,918 108,851 108,851 95,216Airport ERICA offset 0 (73,906) (73,906) (73,906) (73,906) (73,906)Unscheduled Capital Programs 15,135 0 0 0 0 0Subtotal 175,098 1,197,988 1,253,612 1,291,423 1,280,864 1,361,424
Total Operating - Budget 175,098 1,197,988 1,253,612 1,291,423 1,280,864 1,361,424
Transfer Out 288,474 362,415 345,199 321,423 0 321,424
Ending Fund Balance – June 30 612,715 431,980 177,363 (144,060) 242,220 (79,204)
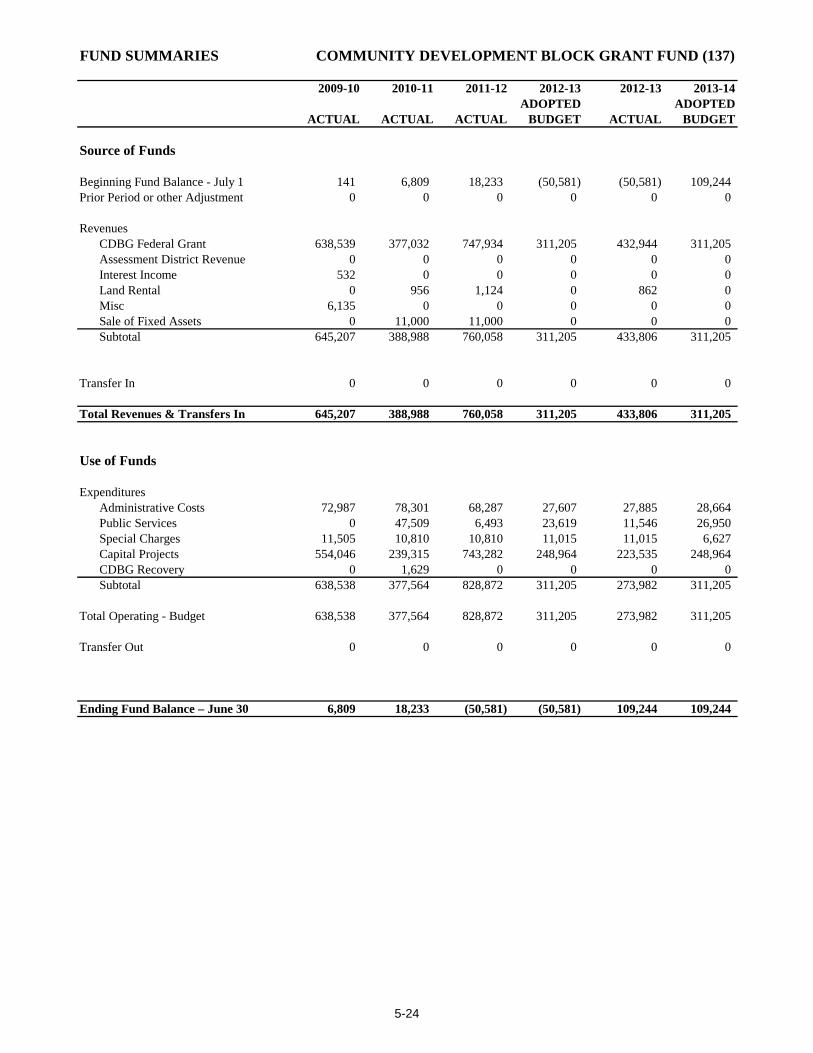
5-24
FUND SUMMARIES COMMUNITY DEVELOPMENT BLOCK GRANT FUND (137)
2009-10 2010-11 2011-12 2012-13 2012-13 2013-14ADOPTED ADOPTED
ACTUAL ACTUAL ACTUAL BUDGET ACTUAL BUDGET
Source of Funds
Beginning Fund Balance - July 1 141 6,809 18,233 (50,581) (50,581) 109,244Prior Period or other Adjustment 0 0 0 0 0 0
RevenuesCDBG Federal Grant 638,539 377,032 747,934 311,205 432,944 311,205Assessment District Revenue 0 0 0 0 0 0Interest Income 532 0 0 0 0 0Land Rental 0 956 1,124 0 862 0Misc 6,135 0 0 0 0 0Sale of Fixed Assets 0 11,000 11,000 0 0 0Subtotal 645,207 388,988 760,058 311,205 433,806 311,205
Transfer In 0 0 0 0 0 0
Total Revenues & Transfers In 645,207 388,988 760,058 311,205 433,806 311,205
Use of Funds
ExpendituresAdministrative Costs 72,987 78,301 68,287 27,607 27,885 28,664Public Services 0 47,509 6,493 23,619 11,546 26,950Special Charges 11,505 10,810 10,810 11,015 11,015 6,627Capital Projects 554,046 239,315 743,282 248,964 223,535 248,964CDBG Recovery 0 1,629 0 0 0 0Subtotal 638,538 377,564 828,872 311,205 273,982 311,205
Total Operating - Budget 638,538 377,564 828,872 311,205 273,982 311,205
Transfer Out 0 0 0 0 0 0
Ending Fund Balance – June 30 6,809 18,233 (50,581) (50,581) 109,244 109,244

5-25
FUND SUMMARIES SUSTAINABILITY (138)
2009-10 2010-11 2011-12 2012-13 2012-13 2013-14ADOPTED ADOPTED
ACTUAL ACTUAL ACTUAL BUDGET ACTUAL BUDGET
Source of Funds
Beginning Fund Balance - July 1 0 (257,257) (819,528) (993,006) (993,006) (1,188,950)
RevenuesCharges for Service 316,401 398,051 335,452 484,000 334,169 430,000Cont Non -Govt Sources 13,585 57,411 7,949 0 4,396 5,000Interest Income 23,430 66,222 53,522 30,000 (87,957) 0Subtotal 0 521,685 396,923 514,000 250,608 435,000
Transfer In 0 0 0 0 0 0
Total Revenues & Transfers In 0 521,685 396,923 514,000 250,608 435,000
Use of Funds
ExpendituresPersonnel Services 137,621 193,511 214,944 247,648 203,698 138,590Mtls, Supplies, & Services 65,782 85,531 137,863 249,200 95,736 619,062Special Charges 0 16,907 26,941 34,071 34,071 60,028Capital Projects 53,854 788,007 190,652 221,000 113,048 273,935Subtotal 257,257 1,083,956 570,400 751,919 446,552 1,091,615
Total Operating - Budget 257,257 1,083,956 570,400 751,919 446,552 1,091,615
Transfer Out 0 0 0 0 0 0
Ending Fund Balance – June 30 (257,257) (819,528) (993,006) (1,230,925) (1,188,950) (1,845,565)

5-26
FUND SUMMARIES MASTER LEASE FUND (139)
2009-10 2010-11 2011-12 2012-13 2012-13 2013-14ADOPTED ADOPTED
ACTUAL ACTUAL ACTUAL BUDGET ACTUAL BUDGET
Source of Funds
Beginning Fund Balance - July 1 1 36,918 179,241 196,841 196,841 197,167
RevenuesInterest Income 0 0 4 1,000 0 100Master Lease 1,146,252 1,397,650 1,272,077 1,272,077 1,272,077 1,272,077Subtotal 1,146,252 1,397,651 1,272,081 1,273,077 1,272,077 1,272,177
Transfer In 530,000 374,453 374,267 361,314 361,314 363,472
Total Revenues & Transfers In 1,676,252 1,772,104 1,646,348 1,634,391 1,633,391 1,635,649
Use of Funds
ExpendituresContractual Services 2,500 2,400 2,480 3,250 2,740 3,250Special Charges 751 0 0 0 0 0Debt Services
Paying Agent Fees 786 182 0 1,000 182 500Principal 202,961 206,588 213,921 226,350 226,350 237,445Interest 53,874 45,756 37,492 28,936 28,939 19,599Lease Expenses 1,378,463 1,374,855 1,374,855 1,374,855 1,374,855 1,374,855
Subtotal 1,639,335 1,629,780 1,628,748 1,634,391 1,633,065 1,635,649
Total Operating - Budget 1,639,335 1,629,780 1,628,748 1,634,391 1,633,065 1,635,649
Transfer Out 0 0 0 0 0 0
Ending Fund Balance – June 30 36,918 179,241 196,841 196,841 197,167 197,167

5-27
FUND SUMMARIES CFD PUBLIC SAFETY (140)
2009-10 2010-11 2011-12 2012-13 2012-13 2013-14ADOPTED ADOPTED
ACTUAL ACTUAL ACTUAL BUDGET ACTUAL BUDGET
Source of Funds
Beginning Fund Balance - July 1 160,660 224,865 276,387 303,465 303,465 305,324
RevenuesSpecial Assessments 347,114 327,738 310,361 308,000 321,223 345,000
Subtotal 347,114 327,738 310,361 308,000 321,223 345,000
Transfer In 260,000 245,341 267,430 278,514 278,514 270,102
Total Revenues & Transfers In 607,114 573,079 577,791 586,514 599,737 615,102
Use of Funds
DepartmentCFD-Police 289,697 301,911 328,708 343,626 353,388 361,100CFD- Fire 253,212 219,645 222,005 242,888 244,490 244,618
Subtotal 542,909 521,556 550,713 586,514 597,878 605,718
Total Operating - Budget 542,909 521,556 550,713 586,514 597,878 605,718
Transfer Out 0 0 0 0 0 0
Ending Fund Balance – June 30 224,865 276,387 303,465 303,465 305,324 314,708

5-28
FUND SUMMARIES LAND/LITE/PARK MAINT DIST (141)
2009-10 2010-11 2011-12 2012-13 2012-13 2013-14ADOPTED ADOPTED
ACTUAL ACTUAL ACTUAL BUDGET ACTUAL BUDGET
Source of Funds
Beginning Fund Balance - July 1 258,975 187,420 199,417 223,037 223,037 192,629
RevenuesCharges for Service 112,160 248,022 212,934 219,000 168,204 199,700
Subtotal 112,160 248,022 212,934 219,000 168,204 199,700
Transfer In 0 0 0 0 0 0
Total Revenues & Transfers In 112,160 248,022 212,934 219,000 168,204 199,700
Use of Funds
Expenditures
Materials & Supplies 183,715 187,620 189,313 219,000 198,613 199,700
Subtotal 183,715 187,620 189,313 219,000 198,613 199,700
Total Operating - Budget 183,715 187,620 189,313 219,000 198,613 199,700
Transfer Out 0 48,405 0 0 0 0
Ending Fund Balance – June 30 187,420 199,417 223,037 223,037 192,629 192,629

5-29
FUND SUMMARIES AIR QUALITY MANAGEMENT FUND (149)
2009-10 2010-11 2011-12 2012-13 2012-13 2013-14ADOPTED ADOPTED
ACTUAL ACTUAL ACTUAL BUDGET ACTUAL BUDGET
Source of Funds
Beginning Fund Balance - July 1 54,987 68,314 53,422 58,786 58,786 32,610
RevenuesInterest Revenue 692 590 488 500 188 500AQMD Revenue 53,897 52,320 42,516 62,500 22,181 54,500Subtotal 54,589 52,909 43,003 63,000 22,369 55,000
Transfer In 0 0 0 0 0 0
Total Revenues & Transfers In 54,589 52,909 43,003 63,000 22,369 55,000
Use of Funds
ExpenditureContractual Services 24,254 52,320 17,953 23,000 (1,191) 32,700Special Programs 17,008 15,482 19,687 40,000 49,736 22,300Subtotal 41,262 67,802 37,639 63,000 48,545 55,000
Total Operating Budget 41,262 67,802 37,639 63,000 48,545 55,000
Transfer Out 0 0 0 0 0 0
Ending Fund Balance – June 30 68,314 53,422 58,786 58,786 32,610 32,610

5-30
FUND SUMMARIES PUBLIC ARTS FUND (150)
2009-10 2010-11 2011-12 2012-13 2012-13 2013-14ADOPTED ADOPTED
ACTUAL ACTUAL ACTUAL BUDGET ACTUAL BUDGET
Source of Funds
Beginning Fund Balance - July 1 772,189 592,670 423,085 365,328 365,328 328,397
RevenuesInterest Revenue 8,572 4,703 2,750 20,000 1,680 2,000Public Art Fees 95,879 132,618 148,225 206,000 151,592 160,000Miscellaneous Income 0 9,166 295 0 2,605 0Subtotal 104,451 146,487 151,270 226,000 155,877 162,000
Transfer In 0 0 0 0 0 0
Total Revenues & Transfers In 104,451 146,487 151,270 226,000 155,877 162,000
Use of Funds
ExpendituresAdministrative Costs 119,813 148,930 111,648 167,061 132,417 329,639Art Projects 164,157 167,141 97,378 155,000 60,391 100,000Subtotal 283,970 316,072 209,026 322,061 192,808 429,639
Total Operating Budget 283,970 316,072 209,026 322,061 192,808 429,639
Transfer Out 0 0 0 0 0 0
Ending Fund Balance – June 30 592,670 423,085 365,328 269,267 328,397 60,758

5-31
FUND SUMMARIES LIBRARY TRUST FUND (151)
2008-09 2009-10 2010-11 2011-12 2011-12 2012-13ADOPTED ADOPTED
ACTUAL ACTUAL ACTUAL BUDGET ACTUAL BUDGET
Source of Funds
Beginning Fund Balance - July 1 2,769,227 2,908,305 2,656,939 2,706,679 2,706,679 2,332,295
RevenuesDonations 114,013 3,944 833 0 856 1,000Interest Income 34,143 29,296 27,562 30,000 11,541 30,000Book Sales 0 29 90 1,000 88 100Fines & Fees 0 0 0 0 0 0Miscellaneous (103) (10,921) 0 100 581 0Sale of Fixed Assets 0 0 0 0 0 0Subtotal 148,052 22,348 28,486 31,100 13,066 31,100
Transfer In 0 0 0 0 0 0
Total Revenues & Transfers In 148,052 22,348 28,486 31,100 13,066 31,100
Use of Funds
ExpendituresContingency 6,689 3,129 (13,643) 30,100 0 0Grant & Donation Expenditures 0 0 0 1,000 0 1,000Special Programs 636 412 (2,215) 0 441 0Supplemental Acquisitions 1,650 0 0 0 0 0Other Material/Supplies 0 0 0 0 0 0Capital 0 270,172 (5,397) 0 387,009 30,100Subtotal 8,975 273,713 (21,254) 31,100 387,450 31,100
Total Operating Budget 8,975 273,713 (21,254) 31,100 387,450 31,100
Transfer Out 0 0 0 0 0 0
Ending Fund Balance – June 30 2,908,305 2,656,939 2,706,679 2,706,679 2,332,295 2,332,295

5-32
FUND SUMMARIES QUIMBY ACT FEES FUND (152)
2009-10 2010-11 2011-12 2012-13 2012-13 2013-14ADOPTED ADOPTED
ACTUAL ACTUAL ACTUAL BUDGET ACTUAL BUDGET
Source of Funds
Beginning Fund Balance - July 1 2,594,384 2,267,064 2,462,278 2,680,746 2,680,746 1,889,180
RevenuesQuimby Act Fees 229,498 196,728 222,234 0 293,225 239,400Interest Income 28,957 15,182 26,546 0 12,252 0
Subtotal 258,455 211,910 248,780 0 305,477 239,400
Transfer In 0 0 0 0 0 0
Total Revenues & Transfers In 258,455 211,910 248,780 0 305,477 239,400
Use of Funds
ExpendituresLandscape Gene Autry & Vista Chn 55,871 11,195 30,312 0 (34,052) 0YMCA Purchase 410,522 0 0 0 0 0Park/Rec Master Plan 119,382 5,500 0 0 0 0Capital 0 0 0 0 1,131,095 239,400
Subtotal 585,776 16,695 30,312 0 1,097,043 239,400
Total Operating Budget 585,776 16,695 30,312 0 1,097,043 239,400
Transfer Out 0 0 0 0 0 0
Ending Fund Balance – June 30 2,267,064 2,462,278 2,680,746 2,680,746 1,889,180 1,889,180

5-33
FUND SUMMARIES SPECIAL PROJECTS (160)
2009-10 2010-11 2011-12 2012-13 2012-13 2013-14ADOPTED ADOPTED
ACTUAL ACTUAL ACTUAL BUDGET ACTUAL BUDGET
Source of Funds
Beginning Fund Balance - July 1 1,389,014 1,481,749 1,283,925 1,296,754 1,296,754 1,447,326
RevenuesSpec Police Dept Service 0 0 9,976 0 3,834 0Police Contract OT 221,155 245,780 296,887 100,000 303,446 100,000Unrealized Gain or Loss (2,080) (5,002) 3,255 0 0 0Contribution Non-Gov Sources 175,618 91,158 266,800 0 667,372 0Medical Cannabis 0 0 3,750 0 4,000 0DUI Program 0 0 8,483 0 14,212 0
Subtotal 394,693 331,936 589,150 100,000 992,864 100,000
Transfer In 0 0 0 0 0 0
Total Revenues & Transfers In 394,693 331,936 589,150 100,000 992,864 100,000
Use of Funds
DepartmentsPolice Special Charges 221,155 237,276 293,080 100,000 278,322 100,000Police Contributions 0 26,672 72,538 0 45,430 0Legal Fees 3,060 1,902 15,000 0 0 0EIR 0 37,325 0 0 16,272 0Planning/Study/Other Fees 40,331 0 0 0 0 0Assessment District #161 561 0 0 0 0 0AD 162 Assess Engineering Srvs 0 0 0 0 3,500 0Escena/P.S. Classic CFD-2 57 0 0 0 0 0Building Inspection 0 0 0 0 (3,140) 0Traffic Mitigation 6,500 134,434 24,752 0 28,343 0AD 165 Venetian Estates 0 0 0 0 0 0Professional Review 0 8,260 0 0 0 0PM 10 0 1,433 1,095 0 0 0Medical Cannabis 11,637 61,299 (1,689) 0 143 0Public Works Inspections 0 161 24,100 0 13,070 0Landscaping Inspections 12,496 20,998 26,909 0 628 0Misc 6,162 0 120,536 0 459,723 0Subtotal 301,958 529,760 576,320 100,000 842,292 100,000
Total Operating Budget 301,958 529,760 576,320 100,000 842,292 100,000
Transfer Out 0 0 0 0 0 0
Ending Fund Balance – June 30 1,481,749 1,283,925 1,296,754 1,296,754 1,447,326 1,447,326

5-34
FUND SUMMARIES SPECIAL GRANTS (170)
2009-10 2010-11 2011-12 2012-13 2012-13 2013-14ADOPTED ADOPTED
ACTUAL ACTUAL ACTUAL BUDGET ACTUAL BUDGET
Source of Funds
Beginning Fund Balance - July 1 0 (39,556) (39,556) 7,942 7,942 1,991
RevenuesOTI DUI Grant 0 157,888 77,510 0 57,826 0Stimulus Recovery Act 537,101 421,926 483,334 547,427 517,479 28,464Seatbelt Enforcement Grant 0 10,966 0 0 0 0Energy Efficiency EECBG 0 179,885 24,404 0 0 0PAL Officer Funding 0 84,623 0 0 0 0NSP (HUD/HERA) 0 42,437 97,420 0 0 0ABC Police Grant 0 0 29,676 0 0 0Ed Byrne 10/11 Academy 0 0 18,351 0 15,150 0Police AB 109 Funding 0 0 47,334 0 188,895 200,000Step Grant 12/13 0 0 0 0 18,607 0Police Safetrec FY 12/13 0 0 0 0 19,888 0Subtotal 537,101 897,726 778,031 547,427 817,844 228,464
Transfer In 0 0 0 0 0 0
Total Revenues & Transfers In 537,101 897,726 778,031 547,427 817,844 228,464
Use of Funds
DepartmentsDUI Awareness Grant 147,985 95,624 88,895 0 37,785 0Seatbelt Grant 13,428 0 0 0 0 0Recovery Act COPS 19,122 402,804 408,176 547,427 502,434 28,464PAL Officer 0 84,623 0 0 0 0Safety Personnel Cost all Grants 116,293 88,917 111,637 0 283,574 200,000Energy Efficiency 19,688 0 24,404 0 0 0NSP (HUD/HERA) 260,143 0 97,420 0 0 0Subtotal 576,658 671,969 730,532 547,427 823,794 228,464
Total Operating Budget 576,658 671,969 730,532 547,427 823,794 228,464
Transfer Out 0 0 0 0 0 0
Ending Fund Balance – June 30 (39,556) 186,201 7,942 7,942 1,991 1,991

5-35
FUND SUMMARIES MEASURE J SALES TAX (260)
2009-10 2010-11 2011-12 2012-13 2012-13 2013-14ADOPTED ADOPTED
ACTUAL ACTUAL ACTUAL BUDGET ACTUAL BUDGET
Source of Funds
Beginning Fund Balance - July 1 0 0 0 0 0 7,817,292
RevenuesInterest Revenue 0 0 0 0 21,104 0
Subtotal 0 0 0 0 21,104 0
Transfer In - Meas J 1% Sales Tax 0 0 0 8,000,000 8,000,000 9,300,000
Total Revenues & Transfers In 0 0 0 8,000,000 8,021,104 9,300,000
Use of Funds
ExpendituresMeasure J 1% Sales Tax* 0 0 0 4,700,000 203,812 9,684,459
Subtotal 0 0 0 4,700,000 203,812 9,684,459
Total Operating Budget 0 0 0 4,700,000 203,812 9,684,459
Transfer Out ** 0 0 0 3,300,000 3,300,000 3,200,000
Ending Fund Balance – June 30 0 0 0 3,300,000 7,817,292 4,232,833
* Capital Projects to be determined by the City Council** Anticapted debt service and issuance costs related to the lease revenue bond for the Downtown Revitalization Project

5-36
FUND SUMMARIES CAPITAL PROJECTS FUND (261)
2009-10 2010-11 2011-12 2012-13 2012-13 2013-14ADOPTED ADOPTED
ACTUAL ACTUAL ACTUAL BUDGET ACTUAL BUDGET
Source of Funds
Beginning Fund Balance - July 1 9,602,136 4,552,925 2,451,619 (3,560,628) (3,560,628) (2,203,818)Prior Period Adjustment 0 0 0 0 0
RevenuesTechnology Fee 81,117 105,360 109,697 0 141,737 0Interest Inc/Unrealized Gain/Loss (18,553) (21,427) 548 0 0 0Grant Revenue 2,050,116 11,843,532 16,745,135 0 4,786,867 0Contributions/Donations 0 0 0 0 1,000 0Miscellaneous 412,001 851,500 64,850 0 0 0Bond Proceeds 0 0 0 0 0 0Subtotal 2,524,681 12,778,965 16,920,230 0 4,929,604 0
Additional Revenue ReceivedTransfer In 3,174,000 0 0 0 0 0
Total Revenues & Transfers In 5,698,681 12,778,965 16,920,230 0 4,929,604 0
Use of Funds
DepartmentsCity Facility Improvements 2,241,037 1,003,711 1,122,658 0 264,981 0Police Improvements 2,443,986 374,742 0 0 0 0Police Grants 108,301 60,576 409,904 0 111,111 0Fire Improvements 542,386 288,529 37,383 0 267,942 0Street Improvements 4,995,592 12,708,910 21,348,894 0 2,906,999 0Land Acquisitions 5,391 3,150 (4,030) 0 0 0Park Improvements 29,492 66,160 0 0 8,211 0Measure Y - Park Improvements 270,036 367,174 15,281 0 13,549 0Measure Y - Library 111,671 7,319 2,389 0 0 0Library Capital Projects 0 0 0 0 0 0Federak Stimulus Park/Autry/Vista 0 0 0 0 0 0Convention Center 0 0 0 0 0 0Subtotal 10,747,892 14,880,271 22,932,478 0 3,572,794 0
Total Capital Budget 10,747,892 14,880,271 22,932,478 0 3,572,794 0
Other Adjustments 0 0 0 0 0 0Transfer Out 0 0 0 0 0 0
Ending Fund Balance – June 30 4,552,925 2,451,619 (3,560,628) (3,560,628) (2,203,818) (2,203,818)
*Capital Projects are currently being funded through the Measure J 1% Sales Tax process. Please see Fund 260.

5-37
FUND SUMMARIES GENERAL DEBT SERVICE FUND (301)
2009-10 2010-11 2011-12 2012-13 2012-13 2013-14ADOPTED ADOPTED
ACTUAL ACTUAL ACTUAL BUDGET ACTUAL BUDGET
Source of Funds
Beginning Fund Balance - July 1 6,190,607 6,570,518 6,819,211 7,037,431 7,037,431 7,558,866
RevenuesInterest Income 87,242 148,185 854,156 100,000 226,277 100,000Miscellaneous 0 0 (284,400) 4,344,526 0 4,343,301Subtotal 87,242 148,185 569,756 4,444,526 226,277 4,443,301
Transfer In * 5,494,900 601,387 572,418 3,812,573 3,812,573 3,663,543
Total Revenues & Transfers In 5,582,142 749,572 1,142,174 8,257,099 4,038,850 8,106,844
Use of Funds
ExpendituresContractual Services 0 1,535 3,677 6,600 1,805 6,600Auditing 1,000 900 930 1,000 1,000 1,000Debt Service
Principal 1,787,176 285,490 305,463 2,729,777 1,454,777 3,527,529Interest 3,026,958 122,779 108,000 5,102,722 1,920,119 4,165,715Capitalized Interest 0 0 0 0 0 0Paying Agent & Credit Fees 96,097 90,176 505,884 126,000 139,715 115,000Leases 291,000 0 0 291,000 0 291,000
Subtotal 5,202,231 500,880 923,954 8,257,099 3,517,415 8,106,844
Total Operating - Budget 5,202,231 500,880 923,954 8,257,099 3,517,415 8,106,844
Transfer Out 0 0 0 0 0 0
Ending Fund Balance – June 30 6,570,518 6,819,211 7,037,431 7,037,431 7,558,866 7,558,866
* Transfers In includes Measure J Capital 3,200,000 and General Fund 463,543

5-38
FUND SUMMARIES ASSESSMENT DISTRICT FUNDS (311 - 327)
2009-10 2010-11 2011-12 2012-13 2012-13 2013-14ADOPTED ADOPTED
ACTUAL ACTUAL ACTUAL BUDGET ACTUAL BUDGET
Source of Funds
Beginning Fund Balance - July 1 3,617,295 3,017,141 2,692,896 2,730,592 2,730,592 2,659,765
RevenuesA.D. 143 Debt Service Fund 311 720 558 447 0 266 0A.D. 143 Reserve Fund 312 5,662 4,391 3,513 0 2,093 0A.D. 146 Debt Service Fund 313 171 132 106 0 63 0A.D. 146 Reserve Fund 314 1,910 1,481 1,185 0 706 0A.D. 155 Debt Service Fund 315 170,596 981 0 0 0 0A.D. 155 Series B Debt Fund 316 0 0 0 0 0 0A.D. 155 Series A Fund 317 36 (12) 0 0 0 0A.D. 159 Debt Service Fund 322 122 94 76 0 45 0A.D. 157/158 Refinance Fund 324 363,919 125,421 97,167 97,280 12,320 15,000A.D. 161 Fund 325 395,028 401,393 358,757 342,445 344,322 344,668A.D. 162 Fund 326 119,168 117,650 110,642 111,778 105,344 109,228A.D. 164 Fund 327 325,735 320,142 278,124 286,220 268,546 284,438Subtotal 1,383,068 972,232 850,016 837,723 733,705 753,334
Transfer In 430,707 0 0 0 0 0
Total Revenues & Transfers In 1,813,775 972,232 850,016 837,723 733,705 753,334
Use of Funds
DepartmentsA.D. 143 Fund 311 0 0 0 0 0 0A.D. 143 Reserve Fund 312 0 0 0 0 0 0A.D. 146 Fund 313 0 0 0 0 0 0A.D. 146 Reserve Fund 314 0 0 0 0 0 0A.D. 155 Fund 315 428,863 314,206 0 0 0 0A.D. 155 Series B Debt Fund 316 184,860 0 0 0 0 0A.D. 155 Series A Fund 317 0 0 0 0 0 0A.D. 159 Debt Service Fund 322 0 0 0 0 0 0A.D. 157/158 Refinance Fund 324 274,813 252,040 91,562 97,280 88,097 15,000A.D. 161 Fund 325 560,000 342,727 336,136 342,445 335,807 344,668A.D. 162 Fund 326 163,798 104,723 106,965 111,778 101,719 109,228A.D. 164 Fund 327 334,942 282,782 277,658 286,220 278,909 284,438Subtotal 1,947,275 1,296,477 812,320 837,723 804,532 753,334
Total Operating - Budget 1,947,275 1,296,477 812,320 837,723 804,532 753,334
Transfer Out 466,654 0 0 0 0 0
Other Adjustments
Ending Fund Balance – June 30 3,017,141 2,692,896 2,730,592 2,730,592 2,659,765 2,659,765

5-39
FUND SUMMARIES AIRPORT CFC FUND (405)
2009-10 2010-11 2011-12 2012-13 2012-13 2013-14ADOPTED ADOPTED
ACTUAL ACTUAL ACTUAL BUDGET ACTUAL BUDGET
Source of Funds
Beginning Retained Earnings - July 1 5,692,663 7,293,933 8,895,204 10,759,499 10,759,499 12,636,044 (** includes GASB 34 Adj. to Accumulated Contrib Capital)Revenues
Interest Income 37,207 37,207 61,025 50,000 34,685 50,000Passenger Facility Charge 1,621,820 1,621,820 1,803,270 1,750,000 1,841,860 1,820,000
Subtotal 1,659,027 1,659,027 1,864,295 1,800,000 1,876,545 1,870,000
Transfer In 0 0 0 0 0 0
Total Revenues & Transfers In 1,659,027 1,659,027 1,864,295 1,800,000 1,876,545 1,870,000
Use of Funds
ExpendituresPersonnel Services 0 0 0 0 0 0Mtls, Supplies, & Services 0 0 0 0 0 0Special Charges 0 57,756 0 0 0 0Depreciation (Net) 57,757 0 0 0 0 0Capital Projects 0 0 0 0 0 480,000Subtotal 57,757 57,756 0 0 0 480,000
Total Operating Budget 57,757 57,756 0 0 0 480,000
Other Adjustments
Transfer Out 0 0 0 2,354,000 0 2,354,000
Ending Net Assets – June 30 7,293,933 8,895,204 10,759,499 10,205,499 12,636,044 11,672,044

5-40
FUND SUMMARIES AIRPORT PFC FUND (410)
2009-10 2010-11 2011-12 2012-13 2012-13 2013-14ADOPTED ADOPTED
ACTUAL ACTUAL ACTUAL BUDGET ACTUAL BUDGET
Source of Funds
Beginning Retained Earnings - July 1 (17,333,315) (16,807,047) (16,239,524) (15,060,253) (15,060,253) (13,117,715) (** includes GASB 34 Adj. to Accumulated Contrib Capital)Revenues
Interest Income 47,575 53,930 46,900 47,500 67,513 54,000Passenger Facility Charge 2,809,942 2,785,021 3,131,807 2,985,200 3,330,492 3,743,500
Subtotal 2,857,517 2,838,951 3,178,708 3,032,700 3,398,004 3,797,500
Transfer In 0 0 0 0 0 0
Total Revenues & Transfers In 2,857,517 2,838,951 3,178,708 3,032,700 3,398,004 3,797,500
Use of Funds
ExpendituresPersonnel Services 246 0 0 0 0 0Mtls, Supplies, & Services 27,366 26,716 9,900 10,500 16,500 28,500Special Charges 3,094 3,168 4,261 0 4,070 3,870Depreciation (Net) 648,368 648,368 0 0 0 0Capital Projects 0 0 0 0 0 0Debt Service
Principal 0 0 0 390,000 3,985 2,080,700Interest 1,529,975 1,475,096 1,406,831 524,765 1,361,803 1,659,844Paying Agent & Credit Fees 122,200 118,079 578,445 5,000 69,108 15,000
Subtotal 2,331,249 2,271,428 1,999,437 930,265 1,455,466 3,787,914
Total Operating Budget 2,331,249 2,271,428 1,999,437 930,265 1,455,466 3,787,914
Other Adjustments
Transfer Out 0 0 0 0 0 0
Ending Net Assets – June 30 (16,807,047) (16,239,524) (15,060,253) (12,957,818) (13,117,715) (13,108,129)
The deficit is due to the division of Bond defeasance between two Airport funds (410 & 415). The single enterprise of theAirport has historically been made up of two funds for the purpose of identifying Passenger Facility Charge (PFC) revenues. The two funds get combined for reporting purposes on the CAFR.

5-41
FUND SUMMARIES AIRPORT FUND (415)
2009-10 2010-11 2011-12 2012-13 2012-13 2013-14ADOPTED ADOPTED
ACTUAL ACTUAL ACTUAL BUDGET ACTUAL BUDGET
Source of Funds**
Beginning Retained Earnings - July 1 104,289,774 94,917,627 95,125,000 96,326,950 96,326,950 96,361,969 (** includes GASB 34 Adj. to Accumulated Contrib Capital)Revenues
Airport Security - TSA 204,108 204,108 172,188 183,700 138,181 116,800Baggage System - TSA 0 0 38,104 38,104 0 0Interest Income 137,424 137,424 109,863 108,348 43,669 99,648Insurance Recovery 0 0 4,751 0 0 4,751Sale of Fixed Assets 0 0 0 38,106 0 0Federal Grants 319,131 319,131 0 38,107 0 0Rentals & Permits 11,735,451 11,735,451 12,679,024 12,610,271 12,976,030 13,454,876Landing & Access Fees 1,972,695 1,972,695 1,909,312 1,871,805 2,001,639 1,990,300Concessions 423,671 423,671 489,995 757,565 795,370 928,955Customs Fees 179,710 179,710 142,155 197,990 222,683 142,000Advertising 179,329 179,329 303,361 325,000 310,757 333,697Miscellaneous 83,560 83,560 342,782 365,777 339,990 376,523Sale of Fixed Assets 0 0 0 38,121 0 0Capital Contributions 0 0 38,121 38,122 0 0Subtotal 15,235,079 15,235,079 16,229,656 16,611,016 16,828,318 17,447,550
Total Revenues & Transfers In 15,235,079 15,235,079 16,229,656 16,611,016 16,828,318 17,447,550
Use of Funds
ExpendituresPersonnel Services 7,464,551 7,733,197 7,995,329 8,634,654 8,401,276 9,664,307Mtls, Supplies, & Services 4,264,721 4,717,910 4,759,380 5,343,124 5,223,235 5,599,006Special Charges 2,088,604 1,888,156 1,963,611 2,111,412 2,111,412 2,156,237Capital Projects 114,074 37,860 21,886 23,000 19,877 23,000Depreciation (Net) 7,978,920 7,607,596 0 0 0 0Debt Service 0
Principal 115,400 0 0 0 0 0Interest 0 0 0 0 0 0Paying Agent & Credit Fees 0 0 0 5,000 0 5,000
Subtotal 22,026,270 21,984,719 14,740,206 16,117,190 15,755,799 17,447,550
Total Operating Budget 21,984,719 14,740,206 14,740,206 16,117,190 15,755,799 17,447,550
Transfer Out 2,622,507 287,500 287,500 1,037,500 1,037,500 1,037,500
Ending Net Assets – June 30 94,917,627 95,125,000 96,326,950 95,783,276 96,361,969 95,324,469
Note: Transfers Out includes 287,500 to the General Fund and 750,000 to Airport Special Projects Fund

5-42
FUND SUMMARIES AIRPORT FUND FEDERAL GRANTS(416)
2009-10 2010-11 2011-12 2012-13 2012-13 2013-14ADOPTED ADOPTED
ACTUAL ACTUAL ACTUAL BUDGET ACTUAL BUDGET
Source of Funds**
Beginning Retained Earnings - July 1 0 2,451,171 2,451,171 1,630,461 1,630,461 3,878,323 (** includes GASB 34 Adj. to Accumulated Contrib Capital)Revenues
Interest 0 17,248 18,602 15,000 18,593 15,000Federal Grants 0 262,744 2,139,488 11,520,000 2,101,545 11,747,500Subtotal 0 279,992 2,158,090 11,535,000 2,120,138 11,762,500
Transfer In PFC 0 0 0 3,104,000 3,104,000 3,104,000
Transfer In Others 2,622,507 0 0 0 0 0
Total Revenues & Transfers In 2,622,507 279,992 2,158,090 14,639,000 5,224,138 14,866,500
Note: Transfers In include 750,000 from Airport General Operations and 2,354,000 from Airport CFC
Use of Funds
ExpendituresPersonnel Services 0 0 0 0 0 0Mtls, Supplies, & Services 0 0 0 0 0 0Special Charges 0 0 0 0 0 0Capital Projects 171,336 212,904 2,978,800 13,655,000 2,976,276 14,296,750Depreciation (Net) 0 0 0 0 0 0Debt Service 0 0 0 0
Principal 0 0 0 0 0 0Interest 0 0 0 0 0 0Paying Agent & Credit Fees 0 0 0 0 0 0
Subtotal 171,336 212,904 2,978,800 13,655,000 2,976,276 14,296,750
Total Operating Budget 171,336 212,904 2,978,800 13,655,000 2,976,276 14,296,750
Other Adjustments
Transfer Out 0 0 0 0 0 0
Ending Net Assets – June 30 2,451,171 2,518,259 1,630,461 2,614,461 3,878,323 4,448,073
The Airport activities are covered under three funds Fund 405, 410 & Fund 415.Transfer In includes 750,000 from Airport General Operations and 2,354,000 from Airport CFC

5-43
FUND SUMMARIES WASTEWATER FUND (420)
2009-10 2010-11 2011-12 2012-13 2012-13 2013-14ADOPTED ADOPTED
ACTUAL ACTUAL ACTUAL BUDGET ACTUAL BUDGET
Source of Funds
Beginning Retained Earnings - July 1 49,036,540 49,046,371 49,383,915 46,839,658 46,839,658 48,802,750
RevenuesSewer Service Charges 5,411,064 5,492,564 5,216,397 6,400,000 6,083,513 6,400,000Sewer Connect & Mntnc. Charges 499,092 527,885 464,552 518,000 591,992 478,000Sale of Fixed Assets 8,646 4,760 0 0 0 0Miscellaneous 10,025 20,000 15,246 0 69,449 0Investment Income 207,749 155,562 131,689 350,000 (20,147) 100,000Subtotal 6,136,576 6,200,771 5,827,883 7,268,000 6,724,806 6,978,000
Transfer In 0 0 0 0 0 0
Total Revenues & Transfers In 6,136,576 6,200,771 5,827,883 7,268,000 6,724,806 6,978,000
Use of Funds
ExpendituresPersonnel Services 38,585 26,811 27,409 53,471 28,403 53,412Mtls, Supplies, & Services 3,529,337 3,366,084 3,731,413 4,403,000 3,268,123 4,429,900Special Charges 895,346 683,213 745,334 868,738 868,738 791,289Capital Projects 475,958 535,969 2,640,985 2,000,000 596,451 1,150,000Depreciation 1,187,520 1,251,149 0 0 0 0Loan W/O Extraordinary Loss 0 0 1,227,000 0 0 0Debt Service
Paying Agent/Auditing Fees 0 0 0 0 0 0Principal 0 0 0 0 0 0Interest 0 0 0 0 0 0
Subtotal 6,126,745 5,863,226 8,372,141 7,325,209 4,761,714 6,424,601
Total Operating Budget 6,126,745 5,863,226 8,372,141 7,325,209 4,761,714 6,424,601
Other Adjustment 0 0 0 0 0 0
Transfer Out 0 0 0 0 0 0
Ending Net Assets – June 30 49,046,371 49,383,915 46,839,658 46,782,449 48,802,750 49,356,149

5-44
FUND SUMMARIES GOLF COURSE FUND (430)
2009-10 2010-11 2011-12 2012-13 2012-13 2013-14ADOPTED ADOPTED
ACTUAL ACTUAL ACTUAL BUDGET ACTUAL BUDGET
Source of Funds
Beginning Retained Earnings - July 1 (7,812,842) (7,786,861) (8,134,442) (8,209,096) (8,209,096) (8,328,440)
RevenuesGreen Fees & Cart Rentals 4,687,694 4,832,305 5,046,766 4,695,405 4,867,582 5,079,315Land Rental 10,402 0 29 0 0 0Investment Income (18,233) 2 2 1,000 0 1,000Miscellaneous 0 11,399 12,181 16,000 0 16,000Subtotal 4,679,863 4,843,706 5,058,978 4,712,405 4,867,582 5,096,315
Transfer In 500,000 250,000 285,050 388,665 388,665 388,665
Total Revenues & Transfers In 5,179,863 5,093,706 5,344,028 5,101,070 5,256,247 5,484,980
Use of Funds
ExpendituresPersonnel Services 0 0 0 0 0 0Contractual Services 4,056,930 4,407,345 4,640,632 4,548,013 4,876,110 4,511,641Mtls, Supplies, & Services 0 0 0 0 0 0Special Charges 30,413 15,407 14,814 18,051 18,051 16,767Capital 0 0 0 0 0 82,049Land Rental 30,745 0 0 30,746 0 0Depreciation 485,598 485,598 0 0 0 0Debt Service
Paying Agent/Auditing Fees 1,318 1,901 3,245 6,675 4,819 5,000Principal 0 0 0 497,871 0 510,761Refinancing Costs 50,393 50,393 297,854 447,852 33,896 0Interest 498,485 480,642 462,138 0 442,714 427,315
Subtotal 5,153,882 5,441,286 5,418,682 5,549,208 5,375,590 5,553,533
Total Operating Budget 5,153,882 5,441,286 5,418,682 5,549,208 5,375,590 5,553,533
Other Adjustments Prior Year 0 0 0 0 0 0
Transfer Out
Ending Net Assets – June 30 (7,786,861) (8,134,442) (8,209,096) (8,657,234) (8,328,440) (8,396,993)
Note: The retained deficit in the Golf Course Fund is primarily the result of the financing costs of the TahquitzCreek Resort Course. It should be noted that the Legends Course is debt free and its assets are carried on thefinancial statements at the original cost less any accumulated depreciation.

5-45
FUND SUMMARIES MOTOR VEHICLE REPLACEMENT FUND (510)
2009-10 2010-11 2011-12 2012-13 2012-13 2013-14ADOPTED ADOPTED
ACTUAL ACTUAL ACTUAL BUDGET ACTUAL BUDGET
Source of Funds
Beginning Retained Earnings - July 1 7,623,412 7,494,152 6,697,115 6,400,318 6,400,318 6,042,276
RevenuesOther Charges 128,215 128,215 142,489 142,489 142,489 142,489Grants 0 0 0 0 0 0Contributions Non-Government 0 0 0 0 0 0Investment Income 39,638 23,801 32,537 40,000 13,523 40,000Service Charges 2,448,587 2,605,666 2,741,562 2,970,355 2,965,405 3,088,283Sale Real or Personal Property 0 (161,465) 0 0 0 0Contributed Capital 750,303 0 0 0 0 0Misc. 24,776 1,703 4,479 0 0 0Subtotal 3,391,520 2,597,921 2,921,067 3,152,844 3,121,417 3,270,772
Proceeds from Lease
Transfer In 0 0 0 0 0 0
Total Revenues & Transfers In 3,391,520 2,597,921 2,921,067 3,152,844 3,121,417 3,270,772
Use of Funds
ExpendituresPersonnel Services 793,490 718,606 784,440 762,698 797,485 852,389Materials, Supplies & Services 1,297,299 1,341,240 1,564,438 934,921 1,733,786 1,962,380Special Charges 153,276 100,200 97,765 112,225 112,225 113,003Debt Service 159,016 81,746 29,247 275,000 73,049 275,000Motor Vehicles 0 0 0 0 0 0Specialized Equipment & Electric Car 0 0 0 0 0 0Capital 66,175 128,992 741,973 45,000 762,914 68,000Depreciation 1,051,524 1,024,174 0 0 0 0Subtotal 3,520,780 3,394,957 3,217,864 2,129,844 3,479,459 3,270,772
Total Operating Budget 3,520,780 3,394,957 3,217,864 2,129,844 3,479,459 3,270,772
Transfer Out 0 0 0 0 0 0
Ending Net Assets – June 30 7,494,152 6,697,115 6,400,318 7,423,318 6,042,276 6,042,276

5-46
FUND SUMMARIES FACILITIES MAINTENANCE FUND (520)
2009-10 2010-11 2011-12 2012-13 2012-13 2013-14ADOPTED ADOPTED
ACTUAL ACTUAL ACTUAL BUDGET ACTUAL BUDGET
Source of Funds
Beginning Retained Earnings - July 1 337,398 623,489 628,036 648,273 648,273 637,076GASB 34 Adj. to Accum. Contrib. Cap. 0 0 0 0 0 0
RevenuesBuilding & Facilities Rental 0 0 0 0 0 0Service Charges 3,786,801 3,494,308 3,659,283 3,844,745 3,844,745 3,970,214Investment Income 0 0 0 0 0 0Subtotal 3,786,801 3,494,308 3,659,283 3,844,745 3,844,745 3,970,214
Transfer In 0 0 0 0 0 0
Total Revenues & Transfers In 3,786,801 3,494,308 3,659,283 3,844,745 3,844,745 3,970,214
Use of Funds
ExpendituresPersonnel Services 1,399,712 1,177,728 1,386,572 1,464,923 1,411,823 1,623,532Utilities 1,181,092 1,235,232 942,819 1,086,624 960,314 857,519Materials, Supplies & Services 888,851 1,013,026 1,200,503 1,170,095 1,400,702 1,412,071Special Charges 28,855 63,775 109,153 83,103 83,103 77,092Depreciation Expense 2,200 0 0 0 0 0Capital 0 0 0 0 0 0Subtotal 3,500,710 3,489,761 3,639,047 3,804,745 3,855,941 3,970,214
Expected Expenditure Savings
Total Operating Budget 3,500,710 3,489,761 3,639,047 3,804,745 3,855,941 3,970,214
Transfer Out 0 0 0 0 0 0
Ending Net Assets – June 30 623,489 628,036 648,273 688,273 637,076 637,076

5-47
FUND SUMMARIES EMPLOYEE RETIREMENT BENEFIT FUND (530)
2009-10 2010-11 2011-12 2012-13 2012-13 2013-14ADOPTED ADOPTED
ACTUAL ACTUAL ACTUAL BUDGET ACTUAL BUDGET
Source of Funds
Beginning Retained Earnings - July 1 2,399,607 2,739,865 3,102,078 3,034,124 3,034,124 3,344,718
RevenuesInterest Revenue 4,382 3,887 3,412 2,000 322 3,000Service Charges 9,768,148 9,285,036 11,211,896 11,385,230 11,118,277 13,162,681Misc 0 0 0 393,054 0 288,155Subtotal 9,772,530 9,288,923 11,215,308 11,780,284 11,118,600 13,453,836
Transfer In 0 0 0 0 0 0
Total Revenues & Transfers In 9,772,530 9,288,923 11,215,308 11,780,284 11,118,600 13,453,836
Use of Funds
ExpendituresRetirement 8,400,308 7,909,319 9,909,584 10,299,526 9,839,204 11,995,034Medicare Tax 1,250 5,515 1,283 6,000 33 6,000Loan Payments 1,030,714 1,011,875 1,372,396 1,474,758 968,769 1,452,802Subtotal 9,432,272 8,926,710 11,283,262 11,780,284 10,808,005 13,453,836
Total Operating Budget 9,432,272 8,926,710 11,283,262 11,780,284 10,808,005 13,453,836
Transfer Out 0 0 0 0 0 0
Ending Net Assets – June 30 2,739,865 3,102,078 3,034,124 3,034,124 3,344,718 3,344,718

5-48
FUND SUMMARIES RISK MANAGEMENT FUND (540)
2009-10 2010-11 2011-12 2012-13 2012-13 2013-14ADOPTED ADOPTED
ACTUAL ACTUAL ACTUAL BUDGET ACTUAL BUDGET
Source of Funds
Beginning Retained Earnings - July 1 3,311,372 4,428,659 1,424,744 2,258,844 2,258,844 2,691,090GASB 34 Adj. to Accum. Contrib. Cap 0 0 0 0 0 0
RevenuesService Charges 11,002,382 9,944,399 11,207,430 12,214,864 12,242,161 12,116,875Miscellaneous Revenue 0 4,225 0 0 15 0Investment Revenue 70,305 30,059 49,054 60,000 23,858 30,000Subtotal 11,072,687 9,978,683 11,256,484 12,274,864 12,266,034 12,146,875
Transfer In 0 0 0 0 0 0
Total Revenues & Transfers In 11,072,687 9,978,683 11,256,484 12,274,864 12,266,034 12,146,875
Use of Funds
ExpendituresAdministrative Costs 378,713 425,678 701,257 896,611 443,751 828,913Medical, Life & Health Insurance 6,454,798 6,068,802 5,573,189 6,548,914 5,965,013 6,732,003Workers Compensation 1,100,942 2,033,720 1,622,892 2,512,715 2,046,285 2,171,059Other Insurance/Programs 1,942,284 3,382,878 2,452,850 2,241,466 3,303,582 2,336,684Special Charges 78,664 71,520 72,196 75,158 75,158 78,216Capital 0 0 0 0 0 0Depreciation 0 0 0 0 0 0Subtotal 9,955,400 11,982,598 10,422,384 12,274,864 11,833,788 12,146,875
Total Operating Budget 9,955,400 11,982,598 10,422,384 12,274,864 11,833,788 12,146,875
Other Adjustments 0 0 0 0 0 0
Transfer Out 0 1,000,000 0 0 0 0
Ending Net Assets – June 30 4,428,659 1,424,744 2,258,844 2,258,844 2,691,090 2,691,090

5-49
FUND SUMMARIES RETIREE HEALTH INSURANCE FUND (541)
2009-10 2010-11 2011-12 2012-13 2012-13 2013-14ADOPTED ADOPTED
ACTUAL ACTUAL ACTUAL BUDGET ACTUAL BUDGET
Source of Funds
Beginning Retained Earnings - July 1 136,158 276,000 20,993 43,458 43,458 151,744GASB 34 Adj. to Accum. Contrib. Cap. 0 0 0 0 0 0
RevenuesRetiree Contributions 181,968 201,706 211,031 220,000 197,072 225,245Miscellaneous Revenue 0 1,221,260 1,618,659 1,887,818 1,887,818 2,104,514Investment Revenue 0 0 0 0 0 0Subtotal 181,968 1,422,966 1,829,690 2,107,818 2,084,890 2,329,759
Transfer In 1,300,000 0 0 0 0 0
Total Revenues & Transfers In 1,481,968 1,422,966 1,829,690 2,107,818 2,084,890 2,329,759
Use of Funds
ExpendituresRetiree Health Insurance 1,342,126 1,677,973 1,807,225 2,107,818 1,976,604 2,329,759Subtotal 1,342,126 1,677,973 1,807,225 2,107,818 1,976,604 2,329,759
Total Operating Budget 1,342,126 1,677,973 1,807,225 2,107,818 1,976,604 2,329,759
Transfer Out 0 0 0 0 0 0
Ending Net Assets – June 30 276,000 20,993 43,458 43,458 151,744 151,744

5-50
FUND SUMMARIES COGENERATION FUND (550)
2009-10 2010-11 2011-12 2012-13 2012-13 2013-14ADOPTED ADOPTED
ACTUAL ACTUAL ACTUAL BUDGET ACTUAL BUDGET
Source of Funds
Beginning Retained Earnings - July 1 229,710 949,292 2,118,416 2,761,648 2,761,648 3,448,015
RevenuesService Charges 3,498,974 3,352,739 3,100,427 2,838,131 3,271,593 2,721,803Sale of Electricity 12,952 89,103 30,486 40,000 42,410 32,000Interest Revenue 4,004 (4,846) 6,776 0 0 0Subtotal 3,515,931 3,436,996 3,137,689 2,878,131 3,314,003 2,753,803
Transfer In 0 0 0 0 0 0
Total Revenues & Transfers In 3,515,931 3,436,996 3,137,689 2,878,131 3,314,003 2,753,803
Use of Funds
ExpendituresEnergy Administration 3,000 3,075 3,560 8,958 4,000 3,000Sunrise Cogeneration Operations 713,547 752,787 805,959 892,423 822,078 855,186Municipal Cogeneration Operations 1,791,260 1,358,059 1,684,938 1,554,965 1,796,813 1,740,917Debt Service 163,829 153,951 0 268,085 1,046 1,000Capital/Depreciation 124,713 0 0 153,700 3,700 153,700Subtotal 2,796,349 2,267,872 2,494,457 2,878,131 2,627,636 2,753,803
Total Operating Budget 2,796,349 2,267,872 2,494,457 2,878,131 2,627,636 2,753,803
Transfer Out 50,000 0 0 0 0 0
Ending Net Assets – June 30 949,292 2,118,416 2,761,648 2,761,648 3,448,015 3,448,015

ADMINISTRATION
FY 13-14 PROGRAM OBJECTIVES
PROGRAM ADOPTED ADOPTED ADOPTEDEXPENDITURES 2011-12 2012-13 2013-14
Salaries & Benefits 351,199 376,118 423,122Contractual Services 0 0 0Materials & Supplies 119,250 119,250 129,250Special Charges 65,584 71,718 75,167Capital Outlay 0 0 0
Total $536,033 $567,086 $627,539
AUTHORIZED ADOPTED ADOPTED ADOPTEDPOSITIONS 2011-12 2012-13 2013-14
Full-Time 1 1 1Part-Time 5 5 5
Full-Time Equivalent (FTE) 6 6 6
DEPARTMENT ORGANIZATION CHART, SIGNIFICANT EXPENDITURES AND STAFFING CHANGES
> Perform ceremonial matters and make public apperances on behalf of the City as needed.
The City Council serves Palm Springs citizens as elected representatives and provides for orderly City government.
CITY COUNCIL
> Encourage community involvement through the appointment of citizens to various City Commissions and Boards.
> Act as the governing body of the City and consider matters of policy related to community services, finances, personnel, public safety and zoning.
> Formulate goals and priorities for the City and direct staff to pursue their implementation.
> Enact all laws and direct such action as required to provide for the general welfare of the community.
> Actively participate in inter-governmental discussions concerning policy development for issues of regional concern.
6-1

ADMINISTRATION
FY 13-14 PROGRAM OBJECTIVES
PROGRAM ADOPTED ADOPTED ADOPTEDEXPENDITURES 2011-12 2012-13 2013-14
Salaries & Benefits 487,335 489,803 559,211Contractual Services 7,000 7,000 7,000Materials & Supplies 11,591 11,100 11,100Special Charges 67,403 73,984 76,004Capital Outlay 0 0 0
Total $573,329 $581,887 $653,315
AUTHORIZED ADOPTED ADOPTED ADOPTEDPOSITIONS 2011-12 2012-13 2013-14
Full-Time 2 2 2Part-Time 0 0 0
Full-Time Equivalent (FTE) 2 2 2
DEPARTMENT ORGANIZATION CHART, SIGNIFICANT EXPENDITURES AND STAFFING CHANGES
001-1100
> Implement policy direction of the City Council.> Administer the affairs of the City and direct staff in implementation of the City Council's policies
The City Manager is appointed by the City Council to serve as the Chief Administrative Officer of the organization. The City Manager's office provides the overall administrative leadership necessary for the implementation of the City Council policies and programs, administration of the organization, and delivery to the citizens.
CITY MANAGER/ADMINISTRATION
City Manager 1.00 FTE
Executive Adminstrative Assistant 1.00 FTE
6-2

ADMINISTRATION
FY 13-14 PROGRAM OBJECTIVES> This Department was deleted.
PROGRAM ADOPTED ADOPTED ADOPTEDEXPENDITURES 2011-12 2012-13 2013-14
Salaries & Benefits 268,399 269,400 0Contractual Services 0 0 0Materials & Supplies 4,450 4,450 0Special Charges 2,229 3,634 0Capital Outlay 0 0 0
Total $275,078 $277,484 $0
AUTHORIZED ADOPTED ADOPTED ADOPTEDPOSITIONS 2011-12 2012-13 2013-14
Full-Time 1 1 0Part-Time 0 0 0
Full-Time Equivalent (FTE) 1 1 0
DEPARTMENT ORGANIZATION CHART, SIGNIFICANT EXPENDITURES AND STAFFING CHANGES
During FY 12-13 this department and the FTE were deleted. FY 13-14 no funding or FTE was adopted.
001-1113
The Development/Administrative Services division was set up to oversee the Development side of city government. This Division provides support services to the Building & Safety, Planning Services, Public Works & Engineering, Economic Development, Library, Convention Center, Office Neighborhood Involvement, Park & Recreation and all other departments of the City.
DEVELOPMENT SERVICES
Assistant City Manager - Development Services 0 FTE
6-3

ADMINISTRATION
FY 13-14 PROGRAM OBJECTIVES> Implement Nextdoor.com for communications to the neighborhoods.
> Coordinator the surveying of City facilities ADA compliance and prioritze work that needs to be done.
FY 12-13 ACCOMPLISHMENTS> Facilited the growth of the neighborhood program to now 33 organized neighborhoods> Successful redesign and format change of the City employee monthly newsletter
PROGRAM ADOPTED ADOPTED ADOPTEDEXPENDITURES 2011-12 2012-13 2013-14
Salaries & Benefits 141,921 142,685 160,646Contractual Services 0 0 0Materials & Supplies 11,250 13,250 12,250Special Charges 1,337 2,327 2,748Capital Outlay 0 0 0
Total $154,508 $158,262 $175,644
AUTHORIZED ADOPTED ADOPTED ADOPTEDPOSITIONS 2011-12 2012-13 2013-14
Full-Time 1 1 1Part-Time 0 0 0
Full-Time Equivalent (FTE) 1 1 1
DEPARTMENT ORGANIZATION CHART, SIGNIFICANT EXPENDITURES AND STAFFING CHANGES
> Integrate more City departments into the neighbhorhood program.
> Coordinated the 6th Annual PSNIC Picnic and Community Expo which was attended by more than 800 people - our largest event to date.
001-1114NEIGHBORHOOD INVOLVEMENT
The Department of Neighborhood Involvement (ONI) was created in the General Fund in FY 2008-2009. The Office of Neighborhood Involvement program began in April 2005.
Director of Neighborhood & Community Relations
1.00 FTE
6-4

ADMINISTRATION
FY 13-14 PROGRAM OBJECTIVES
FY 12-13 ACCOMPLISHMENTS
PROGRAM ADOPTED ADOPTED ADOPTEDEXPENDITURES 2011-12 2012-13 2013-14
Salaries & Benefits 636,961 643,648 724,602Contractual Services 22,000 21,000 20,000Materials & Supplies 279,200 287,700 280,525Special Charges 122,393 130,160 134,699Capital Outlay 0 0 0
Total $1,060,554 $1,082,508 $1,159,826
AUTHORIZED ADOPTED ADOPTED ADOPTEDPOSITIONS 2011-12 2012-13 2013-14
Full-Time 6 4 4Part-Time 0 0 0
Full-Time Equivalent (FTE) 6 4 4
DEPARTMENT ORGANIZATION CHART, SIGNIFICANT EXPENDITURES AND STAFFING CHANGES
001-1120
> Implement the replacement of all old City servers.> Implement the replacement of all old City desktop computers.
The Information Technology Division of the City Manager's Department is responsible for developing, organizing, directing, and administering a wide variety of technology tools, services and programs including: local and wide area networks, microcomputers, systems & programming, client-servers, telephone and wireless communications, project management, technology purchasing and project implementation assistance.
INFORMATION TECHNOLOGY
NOTE - (3) PC/Network Administrator FTEs are allocated/funded in the Library, Police Administration & Airport Fund
> Maintained a 99% uptime for all city applications and servers through various system hardware failures.> Installed and deployed GST Mapper for Police and Fire Departments.> Installed and implemented the new Builder Radius/BluePrince software for the Building Department.
> Implement the online Animal Control licensing program.
Information Technology
Manager 1.00 FTE
Senior Systems/Network
Administrator 1.00 FTE
Senior Systems/PC Administrator
1.00 FTE
Communications Coordinator
(Phones) 1.00 FTE
6-5

ADMINISTRATION
FY 13-14 PROGRAM OBJECTIVES
FY 12-13 ACCOMPLISHMENTS
> Completed all legally mandated functions in a timely manner.
PROGRAM ADOPTED ADOPTED ADOPTEDEXPENDITURES 2011-12 2012-13 2013-14
Salaries & Benefits 504,302 498,016 693,689Contractual Services 45,500 45,500 53,500Materials & Supplies 157,445 67,495 158,670Special Charges 38,414 45,422 47,775Capital Outlay 0 0 0Elections 0 0 0
Total $745,661 $656,433 $953,634
AUTHORIZED ADOPTED ADOPTED ADOPTEDPOSITIONS 2011-12 2012-13 2013-14
Full-Time 4 4 5Part-Time 0 0 0
Full-Time Equivalent (FTE) 4 4 5
DEPARTMENT ORGANIZATION CHART, SIGNIFICANT EXPENDITURES AND STAFFING CHANGES
001-1150 CHIEF OF STAFF/CITY CLERK
> Complete all legally mandated functions in a timely manner.
The City Clerk's Department has a commitment to finding creative solutions to developing and delivering services to the public as well as City staff. These services include: election administration, records management and public records requests, optical imaging, support for the City Council, Boards and Commissions, Municipal and Zoning Code Codification, Conflict of Interest and Campaign Disclosure filings, Domestic Partnership program, contact processing Legal notices, claims and subpoenas, and other support services.
FY 12-13 - Amendment to the Allocated Position Schedule approved by City Council - City Clerk title was changed to Chief of Staff/City Clerk. Addition of (1) FTE Executive Administrative Assistant.
> Contract Administration for Information Technology Network and User Assessment, Security Assessment and Disaster Recovery.
> Prepare report on IT Master Plan> Legal Review and Cross Reference check for the Palm Springs Municipal Code.
> Successfully conducted the November , 2011 General Municipal Election including the development of Measure "J" Sales And Use Tax.
Chief of Staff/ City Clerk 1.00 FTE
Executive Services Assistant 1.00 FTE
Deputy City Clerk 1.00 FTE
Chief Deputy City Clerk
1.00 FTE
Executive Administrative
Assistant 1.00 FTE
6-6

ADMINISTRATION
FY 13-14 PROGRAM OBJECTIVES
FY 12-13 ACCOMPLISHMENTS> Enhanced current employee resources through online services and tools.> Continued enhanced recruitment activites with focus on diversity and inclusion.> Continue effective streamlining of programs and processes to improve service.
PROGRAM ADOPTED ADOPTED ADOPTEDEXPENDITURES 2011-12 2012-13 2013-14
Salaries & Benefits 193,783 235,297 274,834Contractual Services 0 0 0Materials & Supplies 108,915 113,600 113,600Special Charges 30,325 34,011 34,983Capital Outlay 0 0 0
Total $333,023 $382,908 $423,417
AUTHORIZED ADOPTED ADOPTED ADOPTEDPOSITIONS 2011-12 2012-13 2013-14
Full-Time 1.75 1.25 1.75Part-Time 0 0 0
Full-Time Equivalent (FTE) 1.75 1.25 1.75
DEPARTMENT ORGANIZATION CHART, SIGNIFICANT EXPENDITURES AND STAFFING CHANGESFY 13-14 - Human Resources Manager added at .50 FTE. Human Resources Analyst position deleted.
> Successful diversity education delievery to all employees.
> Develop diversity educational series for all employees.
001-1160 HUMAN RESOURCES
> Maintain and enhance current programs in recruitment, employee relations, performance management and training.
> Communicate and deliver consistent policies, programs and practices in accordance with employment and labor laws, City Coucil directive and labor agreement.
Human Resources works with all City departments in the management of human resource issues. It provides a variety of services including recruitment and retention, organizational development, employee and labor relations and benefits administration including disability and retirement planning, and compliance with labor laws.
Director of Human Resources
.25 FTE
Human Resources Manager .50 FTE
Human Resources Analyst 0 FTE
Human Resources Specialist II
.50 FTE
Administrative Assistant .50 FTE
6-7

ADMINISTRATION
FY 13-14 PROGRAM OBJECTIVES
FY 12-13 ACCOMPLISHMENTS
PROGRAM ADOPTED ADOPTED ADOPTEDEXPENDITURES 2011-12 2012-13 2013-14
Salaries & Benefits 9,413 9,542 10,893Contractual Services 4,100 4,100 3,600Materials & Supplies 1,230 1,230 1,730Special Charges 23,164 24,513 26,177Capital Outlay 0 0 0
Total $37,907 $39,385 $42,400
AUTHORIZED ADOPTED ADOPTED ADOPTEDPOSITIONS 2011-12 2012-13 2013-14
Full-Time 0.1 0.1 0.1Part-Time 0 0 0
Full-Time Equivalent (FTE) 0.1 0.1 0.1
DEPARTMENT ORGANIZATION CHART, SIGNIFICANT EXPENDITURES AND STAFFING CHANGES
> Strive to continually streamline the petition process when landlords and/or tenants seek Rent Review.
> Managed efficiently the Rent Control process of annual registration.
001-1180
Rent Control is responsible for the administration of the City's rent control ordinance. The activity is supported by the fees charged to tenants and landlords. Effective July 1, 2003, administration is provided by the Department of Economic Development.
RENT CONTROL
> Improve efficiency of the statutorily required annual registration process by enhancing the information system database capabilities.
Housing Program Assistant II .10 FTE
6-8

ADMINISTRATION
FY 13-14 PROGRAM OBJECTIVES
> Provides representation and serves as the City's Risk Manager.
PROGRAM ADOPTED ADOPTED ADOPTEDEXPENDITURES 2011-12 2012-13 2013-14
Salaries & Benefits 0 0 0Contractual Services 700,500 700,500 700,500Materials & Supplies 4,700 4,700 4,700Special Charges 421 259 1,151Capital Outlay 0 0 0
Total $705,621 $705,459 $706,351
AUTHORIZED ADOPTED ADOPTED ADOPTEDPOSITIONS 2011-12 2012-13 2013-14
Full-Time 0 0 0Part-Time 0 0 0
Full-Time Equivalent (FTE) 0 0 0
DEPARTMENT ORGANIZATION CHART, SIGNIFICANT EXPENDITURES AND STAFFING CHANGESNote: This Department is Contractual. There are no Full Time Equivalents.
> Perform a full range of legal and litigation services.
> Provide legal support to City departments, including preparation of contracts and other legal documents necessary to implement programs undertaken by the City.
001-1200
The City Attorney provides legal services to the City and its subsidiary organizations. The law firm of Woodruff, Spradlin & Smar is retained by the City as the contract City Attorney.
CITY ATTORNEY
>Provide legal guidance to the City, the City's Commissions and Boards as well as serve as general counsel for the redevelopment agency.
6-9

ADMINISTRATION
FY 13-14 PROGRAM OBJECTIVES
PROGRAM ADOPTED ADOPTED ADOPTEDEXPENDITURES 2011-12 2012-13 2013-14
Salaries & Benefits 1,000,000 1,000,000 1,000,000Contractual Services 0 0 0Materials & Supplies 60,000 60,000 60,000Special Charges 0 0 0Capital Outlay 0 0 0
Total $1,060,000 $1,060,000 $1,060,000
AUTHORIZED ADOPTED ADOPTED ADOPTEDPOSITIONS 2011-12 2012-13 2013-14
Full-Time 0 0 0Part-Time 0 0 0
Full-Time Equivalent (FTE) 0 0 0
DEPARTMENT ORGANIZATION CHART, SIGNIFICANT EXPENDITURES AND STAFFING CHANGES
001-1220
> Effectively manage department by forecasting upcoming expenditures in unallocated compensation.
This department was set up to effectively budget for vacation, sick leave, and retirement cash outs. It may also provide funding for negotiated bargaining unit settlements.
UNALLOCATED COMPENSATION
6-10

ADMINISTRATION
FY 13-14 PROGRAM OBJECTIVES
PROGRAM ADOPTED ADOPTED ADOPTEDEXPENDITURES 2011-12 2012-13 2013-14
Salaries & Benefits 0 0 0Contractual Services 0 0 0Materials & Supplies 0 0 0Special Charges 0 0 0Capital Outlay 0 0 0
Total $0 $0 $0
AUTHORIZED ADOPTED ADOPTED ADOPTEDPOSITIONS 2011-12 2012-13 2013-14
Full-Time 0 0 0Part-Time 0 0 0
Full-Time Equivalent (FTE) 0 0 0
DEPARTMENT ORGANIZATION CHART, SIGNIFICANT EXPENDITURES AND STAFFING CHANGES
001-1221
> Effectively manage salary savings of offsets necessary for balacing budget.
This department was set up to effectively budget for offsets due to Union Negotiations, Current Vacancies, Placeholders for Layoffs and City Facility Closures. It may also provide funding for negotiated bargaining unit settlements.
SALARY SAVING - OFFSETS
NOTE: This Department is kept as a placeholder if needed and may by used during the budget process but not necessarily used in an annual budget capacity.
6-11

ADMINISTRATION
FY 13-14 PROGRAM OBJECTIVES
FY 12-13 ACCOMPLISHMENTS
PROGRAM ADOPTED ADOPTED ADOPTEDEXPENDITURES 2011-12 2012-13 2013-14
Salaries & Benefits 191,689 208,896 233,195Contractual Services 10,000 10,000 10,000Materials & Supplies 10,620 10,620 10,620Special Charges 2,571 3,650 4,113Capital Outlay 0 0 26,400
Total $214,880 $233,166 $284,328
AUTHORIZED ADOPTED ADOPTED ADOPTEDPOSITIONS 2011-12 2012-13 2013-14
Full-Time 1.5 1.5 1.5Part-Time 0 0 0
Full-Time Equivalent (FTE) 1.5 1.5 1.5
DEPARTMENT ORGANIZATION CHART, SIGNIFICANT EXPENDITURES AND STAFFING CHANGES
> Improved Community Outreach.
001-1231
The Public Affairs/PSCTV department serves the public via the City Manager's office by providing information to the public using various methods including the media & outreach programs. Palm Springs Community Television (PSCTV) is the City's municipal goverment access cable channel. PSCTV provides live televised coverage of the Palm Springs City Council and other public meetings that shape our community and quality of life.
PUBLIC AFFAIRS/PSCTV
> Continue to provide Public Service announcements, community forums, special events coverage, and other programs on local issues.
> To provide the informational link between City government, the Community and the Media.
Director of Communication
1.00 FTE
Broadcast Assistant .50 FTE
6-12

ADMINISTRATION
FY 13-14 PROGRAM OBJECTIVES
PROGRAM ADOPTED ADOPTED ADOPTEDEXPENDITURES 2011-12 2012-13 2013-14
Salaries & Benefits 35 0 0Contractual Services 0 0 0Materials & Supplies 144,370 131,370 123,220Special Charges 41,417 42,333 43,742Capital Outlay 0 0 0
Total $185,822 $173,703 $166,962
AUTHORIZED ADOPTED ADOPTED ADOPTEDPOSITIONS 2011-12 2012-13 2013-14
Full-Time 0 0 0Part-Time 0 0 0
Full-Time Equivalent (FTE) 0 0 0
DEPARTMENT ORGANIZATION CHART, SIGNIFICANT EXPENDITURES AND STAFFING CHANGES
001-1261
> Manage effective copier and postage costs throughout the City.
This activity provides for Management of the City's postage, mailing services and the City's copier agreement under the Department of the Chief of Staff / City Clerk (1150).
DOCUMENT MANAGEMENT
FY 2013-14 - This Department without staffing continues under the Chief of Staff / City Clerk to manage the City's postage and copier equipment maintenance agreements.
6-13

ADMINISTRATION
FY 13-14 PROGRAM OBJECTIVES
FY 12-13 ACCOMPLISHMENTS
> Awarded the California Society of Municipal Officers Operating Budget Excellence award for FY 2012-13.
PROGRAM ADOPTED ADOPTED ADOPTEDEXPENDITURES 2011-12 2012-13 2013-14Salaries & Benefits 1,784,396 1,805,961 2,039,506Contractual Services 189,650 200,000 165,800Materials & Supplies 305,504 155,604 225,804Special Charges 140,852 163,772 164,162Capital Outlay 0 0 0
Total $2,420,402 $2,325,337 $2,595,272AUTHORIZED ADOPTED ADOPTED ADOPTEDPOSITIONS 2011-12 2012-13 2013-14Full-Time 14 15 15Part-Time 0 0 0Full-Time Equivalent (FTE) 14 15 15DEPARTMENT ORGANIZATION CHART, SIGNIFICANT EXPENDITURES AND STAFFING CHANGES
> Met all requirements for processing bi-weekly accounts, payables, payroll cycle & accounts receivable.
> Monitor City budget and provide City management reports on expenditures and revenue projections.
> Awarded the Outstanding Financial Reporting award for FY 2012-13.
> Continued to provide excellent Customer Service - Business License, Cashier, Transient Occupancy Tax and Revenue Recovery areas.
> Enforce City Transient Occupancy Tax / Short Term Vacation Rental Ordinance. Perform TOT Audits.
001-1300
> Provide sound financial plan for the City through the budget process.> Prepare an Annual Operating Budget on the City's Website.
Finance & Treasury is responsible for the financial management of the City, including production of financial reports, administration of all debt financing, revenue collections, accounts payable, payroll, investment of the City's idle cash and franchise administration. This activity is responsible for preparing and monitoring the City's budget, financial trend monitoring, management analysis, auditing function, and City-wide delinquent account collections.
FINANCE & TREASURY
> Manage the City's investment portfolio within the guidelines adopted by the City investment policy.
Director of Finance & Treasurer 1.00 FTE
Account Clerk II 1.00 FTE
Administrative Assistant 1.00 FTE
Assistant Director of Finance 1.00 FTE
Accountant (underfill of Deputy City
Clerk) 1.00 FTE
Revenue Recovery Specialist/Parking
Enforcement 1.00 FTE
Accounting Suprevisor 1.00 FTE
Accountant 1.00 FTE
Payroll Coordinator 1.00 FTE
Senior Account Technician
1.00 FTE
Budget, Audit & Revenue Supervisor
1.00 FTE
Senior Financial Analyst 1.00 FTE
Financial Analyst (placeholder)
0.00
Account Specialist - BL 1.00 FTE
Account Clerk II - TOT 1.00 FTE
6-14

ADMINISTRATION
FY 13-14 PROGRAM OBJECTIVES
FY 12-13 ACCOMPLISHMENTS
PROGRAM ADOPTED ADOPTED ADOPTEDEXPENDITURES 2011-12 2012-13 2013-14
Salaries & Benefits 384,716 389,555 441,445Contractual Services 8,500 8,500 7,500Materials & Supplies 23,464 27,000 28,000Special Charges 29,949 34,322 35,012Capital Outlay 0 0 0
Total $446,629 $459,377 $511,957
AUTHORIZED ADOPTED ADOPTED ADOPTEDPOSITIONS 2011-12 2012-13 2013-14
Full-Time 3 3 3Part-Time 0 0 0
Full-Time Equivalent (FTE) 3 3 3
DEPARTMENT ORGANIZATION CHART, SIGNIFICANT EXPENDITURES AND STAFFING CHANGES
> Key RFP's: ADA Consulting, Architectural, Towing, Shelter Operator, SACS system, PSP Engineers> Key Bids: Breathing apparatus, 24 vehicles, Pavillion Security system, Airport carpet, Natural Gas.> Citywide insurance coverage premium reduction, over 1100 Purchase Orders and multiple Public Works bids.
> RFP's for City Hall security system, alarm monitoring, speed surveys, general plan, WWTP performance review.
001-1330
Procurement is responsible for procuring materials, supplies, equipment, and services to meet the operating requirements of the City in accordance with the Municipal Code and established policy.
PROCUREMENT & CONTRACTING
> Conduct multiple Public Works bids as approved by Council with Measure J funding.
> Bids for multiple pieces of large equipment (forklifts, sweepers, vacuum truck) and vehicles.
Procurement & Contracting
Manager 1.00 FTE
Procurement Specialist II
1.00 FTE
Procurement Specialist I 1.00 FTE
6-15

ADMINISTRATION
PROGRAM ADOPTED ADOPTED ADOPTEDEXPENDITURES 2011-12 2012-13 2013-14
Salaries & Benefits 0 0 0Contractual Services 0 0 0Materials & Supplies 117,138 0 0Special Charges 0 0 0Capital Outlay 0 0 0
Total $117,138 $0 $0
AUTHORIZED ADOPTED ADOPTED ADOPTEDPOSITIONS 2011-12 2012-13 2013-14
Full-Time 0 0 0Part-Time 0 0 0
Full-Time Equivalent (FTE) 0 0 0
DEPARTMENT ORGANIZATION CHART, SIGNIFICANT EXPENDITURES AND STAFFING CHANGES
001-9001APPROPRIATION FOR CONTINGENCIES
This department was created as a holding account for distributions to other departments. No expenditures are actually charged to this department.
6-16

GROWTH MANAGEMENT
FY 13-14 PROGRAM OBJECTIVES
> Continue to coordinate - College of the Desert - entitlement/approval of the West Valley Campus Development Projec
FY 12-13 ACCOMPLISHMENTS> Continue the expansion of the Foreign Trade Zone Boundaries under the U.S. Department of Commerce.
> Worked on several hotel properties - Port Lawrence, Arrive Hotel, Spanish Inn, Dolce Hotel - development.> Continued ongoing support for the Riverside County Fair Housing Council.
PROGRAM ADOPTED ADOPTED ADOPTEDEXPENDITURES 2011-12 2012-13 2013-14Salaries & Benefits 108,018 392,126 478,972Contractual Services 10,000 169,000 109,000Materials & Supplies 33,705 34,605 152,965Special Charges 74,736 106,614 123,615Capital Outlay 210,001 260,000 339,318Total $436,460 $962,345 $1,203,870
AUTHORIZED ADOPTED ADOPTED ADOPTEDPOSITIONS 2011-12 2012-13 2013-14Full-Time 1.1 2 2.3Part-Time 0 0 0
Full-Time Equivalent (FTE) 1.1 2 2.3
DEPARTMENT ORGANIZATION CHART, SIGNIFICANT EXPENDITURES AND STAFFING CHANGES
001-1400
Economic Development is responsible for the City's strategy to retain and expand business within the City. Expansion of the employment base and the revenue base are the prime focuses.
COMMUNITY & ECONOMIC DEVELOPMENT
> Support the redevelopment of Nightengald Manor by Jewish Family Services and the Housing Authority of Riverside County into permanent supportive housing for formerly homeless clients.
> Initiate Phase II of the Innovation Hub Accelerator Campus to expand services for graduating iHub clients. Prepare/submit application for $1 million grant - Department of Commerce Economic Development Agency.> Develop a collaborative strategy to promote the Foreign Trade Zones program in the jurisdictions now included in the boundary expanded under the Alternative Site Framework.
> Continue the administration of several downtown improvement programs; Downtown restrooms program and Business Improvement District, work with Public Works Department on resolving issues in the downtown area.
> Developed strategy with CVEP to initiate/launch an Accelerator Campus (a Stage II Incubator facility) on airport property formerly occupied by the Palm Springs Unified School District.
> Market existing Successor Housing Agency properties for future Low and Moderate Income development opportunities.
> Continue to manage the implementation of the Project Financing Agreement and the redevelopment of the Desert Fashion Plaza, including the management and upgrades of the parking structures, the design/construction/installation of the Event Space onsite. Continue to develop the program of comprehensive real property management for the City of Palm Springs, including leases, repairs, acquisition and disposition.
Director of Community & Economic Development
.20 FTE
Economic Developement/Downtown
Administrator .60 FTE
Community Development Adminstrator
.30 FTE
Redevelopment Coordinator .20 FTE
Economic Development Program Assistant
1.00 FTE
6-17

GROWTH MANAGEMENT
FY 13-14 PROGRAM OBJECTIVES> Department combined with Community & Economic Development Department.
PROGRAM ADOPTED ADOPTED ADOPTEDEXPENDITURES 2011-12 2012-13 2013-14
Salaries & Benefits 0 0 0Contractual Services 0 0 0Materials & Supplies 0 60,000 0Special Charges 0 0 0Capital Outlay 0 281,000 0
Total $0 $341,000 $0
AUTHORIZED ADOPTED ADOPTED ADOPTEDPOSITIONS 2011-12 2012-13 2013-14
Full-Time 0 0 0Part-Time 0 0 0
Full-Time Equivalent (FTE) 0 0 0
DEPARTMENT ORGANIZATION CHART, SIGNIFICANT EXPENDITURES AND STAFFING CHANGES
001-2122ECONOMIC RECOVERY/DEVELOPMENT PROGRAM
This Department was created to identify economic stimulus programs and ventures geared towards revitalizing the City. In concert with the City's Economic and Development Department (1400) this area has covered such capital based projects as the Foreign Trade Zone, the Downtown Restroom Program, the CVIHub, the City's property repairs/maintenance administration and incentive programs such as the Hotel and Job Creation Incentive programs. In FY 2013-14 this department's activities were moved to the base department.
6-18

GROWTH MANAGEMENT
FY 13-14 PROGRAM OBJECTIVES> Provide services that offered families and single adults in the Coachella Valley activities and the tools necessary to secure housing and successfully end their homelessness.
FY 12-13 ACCOMPLISHMENTS
PROGRAM ADOPTED ADOPTED ADOPTEDEXPENDITURES 2011-12 2012-13 2013-14
Salaries & Benefits 0 0 0Contractual Services 103,000 103,000 103,000Materials & Supplies 0 0 0Special Charges 0 0 0Capital Outlay 0 0 0
Total $103,000 $103,000 $103,000
AUTHORIZED ADOPTED ADOPTED ADOPTEDPOSITIONS 2011-12 2012-13 2013-14
Full-Time 0 0 0Part-Time 0 0 0
Full-Time Equivalent (FTE) 0 0 0
DEPARTMENT ORGANIZATION CHART, SIGNIFICANT EXPENDITURES AND STAFFING CHANGES
Roy’s Desert Resource Center, named in honor of the late Riverside County Supervisor, Roy Wilson, is the first comprehensive homeless center built in the Western Coachella Valley. Located in Palm Springs, the center offers shelter and numerous supportive services to ninety (90) homeless individuals each night. Desert SOS staff members assist clients in regaining their stability in the community, as well as securing safe and affordable housing. This regional effort has been spearheaded by the Coachella Valley Association of Governments’ (CVAG) Homelessness Committee. It is the Committee’s first goal in its Strategic Plan to End Homelessness.
The activity provides the administration of the City's $103,000 share of the $1,047,000 annual costs to fund Ray's Desert Resource Center.
001-1402HOMELESS PROGRAM
> Continue to staff screen participants, coordinate case management services for clients and successfully complete the application process for help individuals throughout the Coachella Valley.
6-19

GROWTH MANAGEMENT
FY 13-14 PROGRAM OBJECTIVES
FY 12-13 ACCOMPLISHMENTS
PROGRAM ADOPTED ADOPTED ADOPTEDEXPENDITURES 2011-12 2012-13 2013-14
Salaries & Benefits 943,784 950,333 1,080,352Contractual Services 0 0 0Materials & Supplies 24,008 24,008 33,008Special Charges 82,897 88,957 90,573Capital Outlay
Total $1,050,689 $1,063,298 $1,203,933
AUTHORIZED ADOPTED ADOPTED ADOPTEDPOSITIONS 2011-12 2012-13 2013-14
Full-Time 7 7 7Part-Time 0 0 0
Full-Time Equivalent (FTE) 7 7 70 0 0
DEPARTMENT ORGANIZATION CHART, SIGNIFICANT EXPENDITURES AND STAFFING CHANGES
> Development and implemented updated policy on time extensions for approval entitlments.> Completed entitlement review for Downtown Palm Springs tentative map and development applications.
> Prepared zoning ordinances to revise Civic Center Zone and increase number of permits for medical cannabis permits.
> Develop special analysis tools based on updated aerial images for land use, housing and planning
001-4151
> Prepare an updated General Plan Housing Element, including certification by State HCD.
Planning Services is responsible for providing the public complete information regarding community planning, historic preservation, and City permits. Program and Services include but are not limited to zoning, General Plan, development permits and assistance, sign permits, historical preservation, and environmental planning.
PLANNING SERVICES
> Provide responsive & reliable planning, zoning and historic preservation services to the Council and Community.
Director of Planning Services 1.00 FTE
Principle Planner 2.00 FTE
Associate Planner 1.00 FTE
Assistant Planner 1.00 FTE
Planning Technician 0.00 FTE
Planning Administrative
Coordinator 1.00 FTE
Senior Secretary 1.00 FTE
6-20

GROWTH MANAGEMENT
FY 13-14 PROGRAM OBJECTIVES
FY 12-13 ACCOMPLISHMENTS
> Incorporated Code Compliance into the Building permitting system.
PROGRAM ADOPTED ADOPTED ADOPTEDEXPENDITURES 2011-12 2012-13 2013-14
Salaries & Benefits 1,300,746 1,300,942 1,553,274Contractual Services 297,000 297,000 297,000Materials & Supplies 148,481 148,481 148,481Special Charges 124,540 149,247 132,976Capital Outlay 0 0 0
Total $1,870,767 $1,895,670 $2,131,731
AUTHORIZED ADOPTED ADOPTED ADOPTEDPOSITIONS 2011-12 2012-13 2013-14
Full-Time 11 11 12Part-Time 0 0 0
Full-Time Equivalent (FTE) 11 11 12
DEPARTMENT ORGANIZATION CHART, SIGNIFICANT EXPENDITURES AND STAFFING CHANGESFY 2013-14 - Addition of One (1) Building Inspector, deletion of One (1) Code Compliance Officer and addition of One (1) Senior Code Compliance Officer.
> Convert dedicated area of department for records storage.> Bring up to date and keep current the plan scanning.
> Provided two additional options for plan check services.
001-4161
> Convert microfilm to electronic files.
Building & Safety is responsible for the safety and quality standards for the design, construction, materials, use and occupancy, location, and maintenance of all buildings, structures, and certain equipment within the City.
BUILDING & SAFETY
> Continued implementation of permitting system with Fire and Public Works Department.
Director of Building and Safety 1.00 FTE
Building and Safety Supervisor 1.00 FTE
Building Inspector 4.00 FTE
Plans Examiner 1.00 FTE
Senior Code Compliance Officer
1.00 FTE
Code Compliance Officer
3.00 FTE
Administrative Secretary 1.00 FTE
6-21

GROWTH MANAGEMENT
FY 13-14 PROGRAM OBJECTIVES
FY 12-13 ACCOMPLISHMENTS
PROGRAM ADOPTED ADOPTED ADOPTEDEXPENDITURES 2011-12 2012-13 2013-14
Salaries & Benefits 59,700 27,607 28,664Contractual Services 0 17,656 20,987Materials & Supplies 38,775 5,963 5,963Special Charges 10,810 11,015 6,627Capital Outlay 436,647 248,964 248,964
Total $545,932 $311,205 $311,205
AUTHORIZED ADOPTED ADOPTED ADOPTEDPOSITIONS 2011-12 2012-13 2013-14
Full-TimePart-Time 0.5 0.2 0.2
Full-Time Equivalent (FTE) 0.5 0.2 0.2
DEPARTMENT ORGANIZATION CHART, SIGNIFICANT EXPENDITURES AND STAFFING CHANGES
137- 4813, 4814 and 4815
Community Development Block Grant (CDBG)administers and manages the programs and projects approved by Council and funded by federal grants. The 2013-2014 CDBG Budget and the 2013-2014 Annual Action Plan was approved on March 20, 2013 by City Council Action.
COMMUNITY DEVELOPMENT BLOCK GRANT
> Preserved decent safe single-family and mobile home residential units through Housing Rehabilitation Programs.> Continued to provide Fair Housing Services to Affirmatively Further Fair Housing within the City.
> Improved infrastructure to eliminate health and safety obstruction that enhanced community stability.
> Community Development funded a number of existing public and non-profit facilities improvements which included infrastructure improvements of Arnico Tract Sewer and James O. Jessie Desert Highland Unity Center Parking Lot, and energy-efficient upgrades of Desert AIDS Project Roof and Mizell Senior Center Automatic Entry-Door.
> New and expanded public services met the needs of 685 individuals within the community, such as frail elerly, severely disabled adults, persons living with HIV/ADS, and fair housing choices.> Through the Home Repair Program, 53 very-low income homeowners were provided grant assistance of up to $1,500 for minor routine maintenance, emergency repairs, and accessibility modifications to correct code violations related to health and safety items.
Community Development Administrator
.20 FTE
6-22

GROWTH MANAGEMENT
FY 13-14 PROGRAM OBJECTIVES
> Add twenty-five bike racks to city facilities and partner properties.
FY 12-13 ACCOMPLISHMENTS
>Averaged 150 residents at events thanks to increased awareness. Added film series & garden lectures.
PROGRAM ADOPTED ADOPTED ADOPTEDEXPENDITURES 2011-12 2012-13 2013-14
Salaries & Benefits 194,834 247,648 138,590Contractual Services 20,000 200,000 80,000Materials & Supplies 80,523 49,200 539,062Special Charges 26,941 34,071 60,028Capital Outlay 381,812 221,000 273,935
Total $704,110 $751,919 $1,091,615
AUTHORIZED ADOPTED ADOPTED ADOPTEDPOSITIONS 2011-12 2012-13 2013-14
Full-Time 1.5 1.5 1Part-Time 0 0 0
Full-Time Equivalent (FTE) 1.5 1.5 1
DEPARTMENT ORGANIZATION CHART, SIGNIFICANT EXPENDITURES AND STAFFING CHANGESFY 13-14 - Addition of .50 FTE Clerical Assistant. Deletion of .50 FTE Manager, Office of Sustainability to be moved to 125-1280 Recycling Department
> Added lawn buyback & edible landscape program - increased to 32 HOA lawn & 56 Residental
> Increase health / wellness activities & education per Mayor's objectives for monthly activity / education programs
138-1270SUSTAINABILITY
The City of Palm Springs has identified sustainability and the creation of a comprehensive plan as a priority for the coming year. Our quality of life is dependent upon our ability to translate that intention into a reality.
> Add three electric vehicles to the City's fleet by the end of the fiscal year - planning, code and pool car
> Completed first Mayor's Healthy Planet / You Race with 330 runners and $100K in donations.
Manager, Office of Sustainability .50 FTE
Clerical Assistant .50 FTE
6-23

GROWTH MANAGEMENT
FY 13-14 PROGRAM OBJECTIVES
FY 12-13 ACCOMPLISHMENTS
PROGRAM ADOPTED ADOPTED ADOPTEDEXPENDITURES 2011-12 2012-13 2013-14
Salaries & Benefits 0 0 111,075Contractual Services 75,000 51,550 51,550Materials & Supplies 15,400 10,100 901,133Special Charges 8,619 9,860 7,373Capital Outlay 114,000 72,500 73,869
Total $213,019 $144,010 $1,145,000
AUTHORIZED ADOPTED ADOPTED ADOPTEDPOSITIONS 2011-12 2012-13 2013-14
Full-Time 0 0 1Part-Time 0 0 0
Full-Time Equivalent (FTE) 0 0 1
DEPARTMENT ORGANIZATION CHART, SIGNIFICANT EXPENDITURES AND STAFFING CHANGES
125-1280
Recycling AB 939 handles revenues and expenditures related to the operations of the City's recycling activities. This is a contractual activity managed by the Assistant City Manager - Administration.
RECYCLING/FRANCHISE ADMINISTRATION
> create a residential compost incentive program by offering rebate for residential composter.> Plastic bag ordinance and no plastic bags by 2015. Add Big Belly Solar cans to 4 schools.
FY 13-14 - Addition of .50 FTE Clerical Assistant. Addition of .50 FTE Manager, Office of Sustainability moved from 138-1270 Sustainability Department
> Have 25 restaurants commit to switching to compostable packaging by the end of the year.
> Increased participation in sharps and medical waste recycling with free container with prepaid mailing.> Generating revenue from 24 hour electronic waste recycling program.> Added receptacles for recycling to city facilities. Increased overall City wide recycling with education.
Manager, Office of Sustainability .50 FTE
Clerical Assistant .50 FTE
6-24

GROWTH MANAGEMENT
FY 13-14 PROGRAM OBJECTIVES
PROGRAM ADOPTED ADOPTED ADOPTEDEXPENDITURES 2011-12 2012-13 2013-14
Salaries & Benefits 0 0 0Contractual Services 0 0 0Materials & Supplies 295,835 219,000 199,700Special Charges 0 0 0Capital Outlay 0 0 0
Total $295,835 $219,000 $199,700
AUTHORIZED ADOPTED ADOPTED ADOPTEDPOSITIONS 2011-12 2012-13 2013-14
Full-Time 0 0 0Part-Time 0 0 0
Full-Time Equivalent (FTE) 0 0 0
DEPARTMENT ORGANIZATION CHART, SIGNIFICANT EXPENDITURES AND STAFFING CHANGES
141-4310
> Goal to make all Districts self-supporting.
> This department was set up to oversee the Landscape, Lighting and Parkway Maintenance Districts within the city.
LAND/LITE/PARK MAINT DISTRICT
6-25

GROWTH MANAGEMENT
FY 13-14 PROGRAM OBJECTIVES
> Participate with AQMD and in stand along leaf blower buy back program
FY 12-13 ACCOMPLISHMENTS
>Added an incentive through County for employee ride share.> Created healthy eating incentives for ride share. Educated about easy walks around city facilities.
PROGRAM ADOPTED ADOPTED ADOPTEDEXPENDITURES 2011-12 2012-13 2013-14
Salaries & Benefits 0 0 0Contractual Services 23,000 23,000 32,700Materials & Supplies 40,000 40,000 22,300Special Charges 0 0 0Capital Outlay 0 0 0
Total $63,000 $63,000 $55,000
AUTHORIZED ADOPTED ADOPTED ADOPTEDPOSITIONS 2011-12 2012-13 2013-14
Full-Time 0 0 0Part-Time 0 0 0
Full-Time Equivalent (FTE) 0 0 0
DEPARTMENT ORGANIZATION CHART, SIGNIFICANT EXPENDITURES AND STAFFING CHANGES
> Increased participation in ride share program. Reported AQMD annual reports in a timely manner.
149-4609
> Increase ride share participants by a minimum of 15%
Air Quality Management was established to account for revenue received from the County for enactment of air quality improvement policies. The primary policy is an employee trip reduction plan that is administered by Human Resources.
AIR QUALITY MANAGEMENT
> Increase awareness re: air quality reports. Educating and providing incentives for proper gear for landscapers.
6-26

GROWTH MANAGEMENT
FY 13-14 PROGRAM OBJECTIVES
FY 12-13 ACCOMPLISHMENTS
> Increased Arts Education Programming in partnership with the Palm Springs Unified School District.
PROGRAM ADOPTED ADOPTED ADOPTEDEXPENDITURES 2011-12 2012-13 2013-14
Salaries & Benefits 57,202 60,280 129,390Contractual Services 4,000 4,000 4,000Materials & Supplies 83,850 86,650 179,295Special Charges 16,374 16,431 16,954Capital Outlay 122,500 155,000 100,000
Total $283,926 $322,361 $429,639
AUTHORIZED ADOPTED ADOPTED ADOPTEDPOSITIONS 2011-12 2012-13 2013-14
Full-Time 0.5 0.5 1Part-Time 0 0 0
Full-Time Equivalent (FTE) 0.5 0.5 1
DEPARTMENT ORGANIZATION CHART, SIGNIFICANT EXPENDITURES AND STAFFING CHANGESFY 13-14 - Added .50 FTE to already existing position in the department. Total = 1.00 FTE
> Opened Community Art Gallery at the Palm Springs International Airport. The Gallery is a community space reserved for artists residing in the Coachella Valley and its surrounding areas. The 2013 inaugural exhibition was held in partnership with the Palm Springs Fine Art Fair.
150-4408
The Public Arts fund was established to account for revenue and expenditures related to fees collected on new construction for purpose of procuring art objects for public benefit.
ART ACQUISITIONS
> Continue to increase art in the community through the development and implementation of temporary and permanent installations which enhance the Downtown Corridor and include the participation of local curators, artists, youth and members of the art community.
> Obtain grant funding to preserve current programming and increase community awareness.
> Develop and implement Public Art installations which focus on driving cultural tourism and highlight the City's unique environment and urban fabric.
> Increased the presence of art in the community through new sponsorships with community organizations, other commissions and educational outreach. Initiated 2 new art events in the Downtown corridor in partnership with the Black History Committee and Rotary Organization. The 3rd Annual Chalk Art Festival partnership with the Sun-Up Rotary Club drew approximately 3,000 attendees and had 120 participating artists. Was a lead Sponsor in the valley wide art event, Desertscapes through sponsorship of two art events at the Indian Canyons and the Top-of-the-Tram and concluded the month long event with a local gallery exhibition. Partnered with the Sustainability Commission to complete a redesign of the City Bike Map to include Public Art locations, developed sustainability education using the arts and participated at various sustainability events. Installed five new Artist designed Bicycle Racks in the downtown corridor in partnership with the Sustainability Commission.
Arts & Special Projects Coordinator
1.00 FTE
6-27

QUALITY OF LIFE
FY 13-14 PROGRAM OBJECTIVES> ReBid Parks maintenance contract.> Begin downtown and WWTP palm tree replacements.> Replace 18 old drinking fountains in parks.> Replace vandalized picnic tables in 4 parks.> Replace 60 rusted, damaged trash cans in parks.FY 12-13 ACCOMPLISHMENTS
> Created schedules to assign mechanics to individual parks to take ownership.> Replaced pool heaters.
PROGRAM ADOPTED ADOPTED ADOPTEDEXPENDITURES 2011-12 2012-13 2013-14
Salaries & Benefits 506,484 1,235,077 546,415Contractual Services 1,356,000 1,468,000 0Materials & Supplies 1,247,139 1,214,271 2,555,472Special Charges 186,881 212,173 230,518Capital Outlay 0 0 0
Total $3,296,504 $4,129,521 $3,332,405
AUTHORIZED ADOPTED ADOPTED ADOPTEDPOSITIONS 2011-12 2012-13 2013-14
Full-Time 5.5 15 4Part-Time 0 0 0
Full-Time Equivalent (FTE) 5.5 15 4
DEPARTMENT ORGANIZATION CHART, SIGNIFICANT EXPENDITURES AND STAFFING CHANGES
001-2451
The Parks Maintenance Division is responsible for the maintenance of the City's parks, parkways, swimming pool, equestrian and hiking trails along with the grounds maintenance, upkeep and repair of the City's Downtown and Central Business District areas.
PARKS MAINTENANCE
> Trimmed palm trees citywide.
In FY 12-13 this Department was combined with Downtown Experience Maintenance. In FY 13-14 this Department was split back out into its own department.
Parks Maintenance/Downtown
Supervisors 1.00 FTE
Maintenance Lead Worker 1.00 FTE
Maintenance Mechanic I 2.00 FTE
6-28

QUALITY OF LIFE
FY 13-14 PROGRAM OBJECTIVES
> Continue work on the Parks & Recreation Master Plan for final approval with Commission.FY 12-13 ACCOMPLISHMENTS> Secured funding for various projects through Measure J.> Continued to expand program areas in Recreation by adding new programs.
PROGRAM ADOPTED ADOPTED ADOPTEDEXPENDITURES 2011-12 2012-13 2013-14Salaries & Benefits 734,788 764,973 890,309Contractual Services 1,500 1,500 1,500Materials & Supplies 367,117 328,920 365,220Special Charges 155,651 180,040 193,608Capital Outlay 0 0 0Recreation Programs 281,373 281,373 281,373
Total $1,540,429 $1,556,806 $1,732,010
AUTHORIZED ADOPTED ADOPTED ADOPTEDPOSITIONS 2011-12 2012-13 2013-14
Full-Time 7.45 8.2 8.8Part-Time 0 0 0
Full-Time Equivalent (FTE) 7.45 8.2 8.8
DEPARTMENT ORGANIZATION CHART, SIGNIFICANT EXPENDITURES AND STAFFING CHANGES
FY 2012-2013 - Addition of .75 FTE Recreation Program AssistantFY 2013-14 - Addition of .60 FTE - .10 Director, .25 Account Clerk, .25 Recreation Program Assistant
FY 2011-12 Swim Center FTE's moved to department 2515 accounting for a 2.45 deletion to this
001-2510
The Recreation Programs activity is responsible for park development, acquisition, maintenance and capital improvements of the city parks, swimming pools, and special facilities. Recreation is also responsible for the planning, programming and supervision of sports, special events, stadium operation, adult and youth development activities and recreation programs.
RECREATION PROGRAM
> Work with Parks & Recreation Commission on Park Improvements in the city parks.> Continue work with consultant to audit all playground structures in the city for safety.
Director of Parks & Recreaation
.80 FTE
Special Events Coordinator
.25 FTE
Account Clerk 2.00 FTE
Recreation Program Aide
1.00 FTE
Recreation Program Assistant
4.75 FTE
6-29

QUALITY OF LIFE
FY 13-14 PROGRAM OBJECTIVES
PROGRAM ADOPTED ADOPTED ADOPTEDEXPENDITURES 2011-12 2012-13 2013-14
Salaries & Benefits 0 0 0Contractual Services 22,500 22,500 22,500Materials & Supplies 0 0 0Special Charges 0 0 0Capital Outlay 0 0 0Recreation Programs 0 0
Total $22,500 $22,500 $22,500
AUTHORIZED ADOPTED ADOPTED ADOPTEDPOSITIONS 2011-12 2012-13 2013-14
Full-Time 0 0 0Part-Time 0 0 0
Full-Time Equivalent (FTE) 0 0 0
DEPARTMENT ORGANIZATION CHART, SIGNIFICANT EXPENDITURES AND STAFFING CHANGES
001-2511
> To provide a top-quality facility to the residents of the City for their leisure activities.
The Tennis Center is responsibe for the operation and programming and supervision of sports, special events, and recreational programs at the Tennis Center.
TENNIS CENTER
6-30

QUALITY OF LIFE
FY 13-14 PROGRAM OBJECTIVES
> Completion of site work improvements and building improvements for Skate Park.> Final agreement signed and executed for the Operations & Management of Skate Park.
FY 12-13 ACCOMPLISHMENTS> Finalized agreement with Action Park Alliance - with City Attorney for final signatures.
PROGRAM ADOPTED ADOPTED ADOPTEDEXPENDITURES 2011-12 2012-13 2013-14
Salaries & Benefits 8,614 0 0Contractual Services 90,288 160,000 160,000Materials & Supplies 0 0 0Special Charges 5,394 0 0Capital Outlay 0 0 0Special Programs
Total $104,296 $160,000 $160,000
AUTHORIZED ADOPTED ADOPTED ADOPTEDPOSITIONS 2011-12 2012-13 2013-14
Full-Time 0 0 0Part-Time 0 0 0
Full-Time Equivalent (FTE) 0 0 0
DEPARTMENT ORGANIZATION CHART, SIGNIFICANT EXPENDITURES AND STAFFING CHANGESFY 2011-12 - 2.25 FTE positions moved to Recreation and the Swim Center during budget process.
> Worked with Architectural firm for design of exterior/interior of pro-shop building for Skate Park.
001-2512
> Work with Action Park Alliance in implementing programs/events at Skate Park.
The Palm Springs Skate Park is the newest city facility provided for the public to enjoy skateboarding. It is a popular board sport with many of the younger citizens of our city and other cities as well.
PALM SPRINGS SKATE PARK
6-31

QUALITY OF LIFE
FY 13-14 PROGRAM OBJECTIVES> Repair Swim Center Deck.> Host site for the 2013 & 2014 USA World Cup Pentathlon>
FY 12-13 ACCOMPLISHMENTS> Continued working with PS Piranhas Swim Team to bring in large swim meets.
PROGRAM ADOPTED ADOPTED ADOPTEDEXPENDITURES 2011-12 2012-13 2013-14
Salaries & Benefits 278,249 401,137 439,483Contractual Services 0 0 1,800Materials & Supplies 114,350 134,633 137,328Special Charges 44,172 48,959 51,924Capital Outlay 0 0 0Special Activities 10,409 10,409 10,409
Total $447,180 $595,138 $640,944
AUTHORIZED ADOPTED ADOPTED ADOPTEDPOSITIONS 2011-12 2012-13 2013-14
Full-Time 3.75 5.75 5.75Part-Time 0 0 0
Full-Time Equivalent (FTE) 3.75 5.75 5.75
DEPARTMENT ORGANIZATION CHART, SIGNIFICANT EXPENDITURES AND STAFFING CHANGESFY 2011-12 includes 3.75 FTEs moved from the Recreation Department to the Swim Center for properbudgeting.FY 2012-13 Addition of Two (2) FTE Lifeguard full time positions.
001-2515 SWIM CENTER
> Replace underwater lights with new LED lights for more energy efficiency.
The Swim Center features an Olympic-size swimming pool, and is open year round. Several aquatic programs are offered and suitable for all ages. Our featured programs include an aquatic exercise program,
> Improved promotion of Swim Center, but still work to be done.
Aquatics Supervisor 1.00 FTE
Lifeguard 4.75 FTE
6-32

QUALITY OF LIFE
FY 13-14 PROGRAM OBJECTIVES> Work with Neighborhood Organizations in utilizing the Facility for meetings / events.> Continue to promote the Facility - expanding programs.> Continue to work with current Contractors and their programs.
FY 12-13 ACCOMPLISHMENTS
> Continue to promote Facility to bring in more programs and participants.> Community Gardens completed and in full swing.
PROGRAM ADOPTED ADOPTED ADOPTEDEXPENDITURES 2011-12 2012-13 2013-14
Salaries & Benefits 52,895 135,207 155,557Contractual Services 0 11,700 11,700Materials & Supplies 15,000 49,029 49,029Special Charges 48,029 5,123 7,188Capital Outlay 0 0 0Special Activities 5,300 5,000 5,000
Total $121,224 $206,059 $228,474
AUTHORIZED ADOPTED ADOPTED ADOPTEDPOSITIONS 2011-12 2012-13 2013-14
Full-Time 0 1.75 1.75Part-Time 0 0 0
Full-Time Equivalent (FTE) 0 1.75 1.75
DEPARTMENT ORGANIZATION CHART, SIGNIFICANT EXPENDITURES AND STAFFING CHANGES
001-2516DEMUTH COMMUNITY CENTER
> Secure funding to repair gymnasium floor.
This activity oversees the Demuth Community Center located at the former YMCA facility in Demuth Park. The center offers variety of programs for youth and adults alike along with a fitness center.
Recreation Program Assistant 1.75 FTE
6-33

QUALITY OF LIFE
FY 13-14 PROGRAM OBJECTIVES
> Update computer network and computer hardware.
FY 12-13 ACCOMPLISHMENTS> Gymnasium acoustics on ceiling completed.> Secured funding through Measure J for outdoor lighting of softball field and basketball court.
PROGRAM ADOPTED ADOPTED ADOPTEDEXPENDITURES 2011-12 2012-13 2013-14
Salaries & Benefits 436,531 450,391 514,288Contractual Services 1,000 1,000 1,000Materials & Supplies 55,500 68,000 68,000Special Charges 36,280 44,752 44,321Capital Outlay 0 0 0Special Programs 5,000 10,000 10,000
Total $534,311 $574,143 $637,609
AUTHORIZED ADOPTED ADOPTED ADOPTEDPOSITIONS 2011-12 2012-13 2013-14
Full-Time 4.45 4.45 4.7Part-Time 0 0 0
Full-Time Equivalent (FTE) 4.45 4.45 4.7
DEPARTMENT ORGANIZATION CHART, SIGNIFICANT EXPENDITURES AND STAFFING CHANGESFY 2011-2012 Addition of .20 FTE for the Literacy Coordinator. Deletion of .05 FTE for the Assistant Director of Parks & Recreation, position deleted as part of the budget process
001-2590
> Parking lots re-done
> Continue work in providing quality programs to the residents of the community.
Desert Highland is responsible for the planning, programming and supervision of sports, special events, youth development activities, and recreational programs at the James O. Jessie Desert Highland Unity Center.
JAMES O. JESSIE DESERT HIGHLAND UNITY CENTER
Director of Parks & Recreation
.70 FTE
Special Events Coord/Villagefest
.25 FTE
Account Clerk 1.75 FTE
Recreation Program Aide
1.00 FTE
Recreation Program Assistant
4.50 FTE
6-34

QUALITY OF LIFE
FY 13-14 PROGRAM OBJECTIVES
> Create digital archive and local history documents
FY 12-13 ACCOMPLISHMENTS
> Established our "Hot off the Press" book collection of centrally-located, multiple copies of hot new releases
PROGRAM ADOPTED ADOPTED ADOPTEDEXPENDITURES 2011-12 2012-13 2013-14
Salaries & Benefits 1,395,314 1,495,119 1,712,875Contractual Services 36,000 38,000 38,000Materials & Supplies 451,670 594,091 495,929Special Charges 115,550 133,922 136,731Capital Outlay 53,300 43,800 43,800
Total $2,051,834 $2,304,932 $2,427,335AUTHORIZED ADOPTED ADOPTED ADOPTEDPOSITIONS 2011-12 2012-13 2013-14Full-Time 14.45 16.25 16.25Part-Time 0 0 0
Full-Time Equivalent (FTE) 14.45 16.25 16.25DEPARTMENT ORGANIZATION CHART, SIGNIFICANT EXPENDITURES AND STAFFING CHANGESFY 13-14 - Deletions of 1.00 FTE Circulation Manager and 1.00 FTE Senior Library Assistant. Addition of 1.00 FTE Library Operations & Collections and 1.00 FTE Librarian.
001-2710
This activity is the cost center for operations and administration of the City's Library Center. The Library is responsible for operations and administration of the City's Library Center and the Welwood Murry Memorial Library. The Library is the hub of the community, providing materials, programs, and resources to all.
LIBRARY
> Completed conversion from bar codes to radio frequency identification RFID of materials
> Continue with architectural planning for main Library remodel and re-configuration> Develop the service and partnership agreements for eventual reopening of the Welwood branch
> Installed the automated materials handling system
Director of Library Services
PC/Network Admin Library Operations and Collection
Manager
Children’s Librarian
Library Assistant (PT)
Young Adult Librarian
Library Assistant (.75 PT)
Adult Services Librarian
Library Assistant (PT)
Adult Services Librarian
Library Page- 12 hours/week Library Page- 12 hours/week
Library Assistant
Library Assistant
Library Assistant (PT)
Library Services and Public Relations Manager
Senior Library Assistant-
Accounts Payable
Library Assistant (PT)
Volunteers
6-35

QUALITY OF LIFE
FY 13-14 PROGRAM OBJECTIVES
> Finalize the update version of the VillageFest rules and regulations.
FY 12-13 ACCOMPLISHMENTS
> VillageFest marketing sub-committee is working on advertising projects. Website was upgraded.> VillageFest Board in the process of finalizing food court with input from City Council and Merchants Assoc.
PROGRAM ADOPTED ADOPTED ADOPTEDEXPENDITURES 2011-12 2012-13 2013-14
Salaries & Benefits 289,137 294,125 306,014Contractual Services 42,000 42,000 41,325Materials & Supplies 26,300 27,700 16,800Special Charges 57,201 68,038 69,207Capital Outlay 0 0 0
Total $414,638 $431,863 $433,346
AUTHORIZED ADOPTED ADOPTED ADOPTEDPOSITIONS 2011-12 2012-13 2013-14
Full-Time 1.85 1.85 1.75Part-Time 0 0 0
Full-Time Equivalent (FTE) 2.1 1.85 1.75
DEPARTMENT ORGANIZATION CHART, SIGNIFICANT EXPENDITURES AND STAFFING CHANGESFY 2013-14 - Deletion of .10 FTE Director of Parks & Recreation through the budget process.
> Research and implement an all-in one booth tracking program - not accomplished.
127-2550
> Add lighting, signage and bussing to the north end of VillageFest.
> Add two (2) new special event activities to VillageFest.
The Palm Springs Villagefest activity is responsible for the planning, programming and supervision of the Palm Springs Villagefest program.
PALM SPRINGS VILLAGEFEST
Special Events Coord/Villagefest
.75 FTE
Villagefest Aide 1.00 FTE
6-36

QUALITY OF LIFE
FY 13-14 PROGRAM OBJECTIVES
PROGRAM ADOPTED ADOPTED ADOPTEDEXPENDITURES 2011-12 2012-13 2013-14
Salaries & Benefits 0 0 0Contractual Services 0 0 0Materials & Supplies 17,000 31,100 31,100Special Charges 0 0 0Capital Outlay 0 0 0
Total $17,000 $31,100 $31,100
AUTHORIZED ADOPTED ADOPTED ADOPTEDPOSITIONS 2011-12 2012-13 2013-14
Full-Time 0 0 0Part-Time 0 0 0
Full-Time Equivalent (FTE) 0 0 0
DEPARTMENT ORGANIZATION CHART, SIGNIFICANT EXPENDITURES AND STAFFING CHANGES
151-2752
> Provide funds for major capital and/or service project to directly benefit the Library.
This activity provides funds to support capital needs of the Library Center. Funds are received from private donations only.
LIBRARY TRUST
6-37

QUALITY OF LIFE
FY 13-14 PROGRAM OBJECTIVES
PROGRAM ADOPTED ADOPTED ADOPTEDEXPENDITURES 2011-12 2012-13 2013-14
Salaries & Benefits 0 0 239,400Contractual Services 0 0 0Materials & Supplies 0 0 0Special Charges 0 0 0Capital Outlay 0 0 0
Total $0 $0 $239,400
AUTHORIZED ADOPTED ADOPTED ADOPTEDPOSITIONS 2011-12 2012-13 2013-14
Full-Time 0 0 0Part-Time 0 0 0
Full-Time Equivalent (FTE) 0 0 0
DEPARTMENT ORGANIZATION CHART, SIGNIFICANT EXPENDITURES AND STAFFING CHANGES
152-2460QUIMBY PARK & RECREATION
> Provide funds for major capital and/or service project to directly benefit the Park & Recreation Center.
FY 2013-14 - This Department is not new to the Chart of Accounts. In FY 13-14 dollars have been ear-marked for the Demuth Park redesign and the new Sports Park in the City of Palm Springs.
The goal of the Quimby Act was to require developers to help mitigate the impacts of property improvements. The act gives authority for passage of land dedication ordinances only to cities and counties. Special districts must work with cities, and/or counties to receive parkland dedication and/or in-lieu fees. The fees must be paid and land conveyed directly to the local public agencies that provide park and recreation services community-wide. This activity provides a place in the City budget for funding of Parks and Recreation projects.
6-38

PUBLIC SAFETY
FY 13-14 PROGRAM OBJECTIVES> Remodel Police Training Center.> Design Training Center layout to save contractual costs.> Compile list of necessary equipment and furnishings.FY 12-13 ACCOMPLISHMENTS> Technology Updates: Upgraded the Downtown surveillance camera system and introduce both IOS.> Revised Department Policy and General Orders Manuals (Lexipol).> Integrated Animal Control services into Police Department infrastructure.PROGRAM ADOPTED ADOPTED ADOPTEDEXPENDITURES 2011-12 2012-13 2013-14
Salaries & Benefits 13,372,819 13,737,485 15,533,573Contractual Services 260,000 260,000 260,000Materials & Supplies 437,322 437,322 457,322Special Charges 1,857,317 2,036,918 1,813,758Capital Outlay 0 0 0
Total $15,927,458 $16,471,725 $18,064,653AUTHORIZED ADOPTED ADOPTED ADOPTEDPOSITIONS 2011-12 2012-13 2013-14Full-Time 86 86 91Part-Time 0 0 0Full-Time Equivalent (FTE) 86 86 91
DEPARTMENT ORGANIZATION CHART, SIGNIFICANT EXPENDITURES AND STAFFING CHANGESFY 2013-14 - Added 5 FTE Police Officers from the Recovery Act COPS grant Department (170-3220) as the funding is completed in this fiscal year.
001-3010 POLICE ADMINISTRATION
The Police Department is responsible for the law enforcement services and activities of the City. The major activities include patrol, traffic, jail services, records and investigations.
Police Chief 1.00 FTE
Police Captain 2.00 FTE
Police Lieutenant 3.00 FTE
Police Sergeant 13.00 FTE
Police Officer 52.00 FTE
Police Officer (overhire) 3.00 FTE
Police Trainee No FTE
Administrative Assistant 1.00 FTE
Senior Secretary 3.00 FTE
Crime Analyst 1.00 FTE
Crime Scene Technician 1.00 FTE
Police Services Supervisor 1.00 FTE
Police Services Officer
6.00 FTE
Range Master 1.00 FTE
Property Records Technician 1.00 FTE
Property Technician 1.00 FTE
6-39

PUBLIC SAFETY
The Jail Operations division is responsible for operating the City's jail facility.
FY 13-14 PROGRAM OBJECTIVES
PROGRAM ADOPTED ADOPTED ADOPTEDEXPENDITURES 2011-12 2012-13 2013-14
Salaries & Benefits 202 55,000 55,000Contractual Services 52,000 5,000 5,000Materials & Supplies 100,000 100,000 125,000Special Charges 12,333 6,752 1,403Capital Outlay 0 0 0
Total $164,535 $166,752 $186,403
AUTHORIZED ADOPTED ADOPTED ADOPTEDPOSITIONS 2011-12 2012-13 2013-14
Full-Time 0 0 0Part-Time 0 0 0
Full-Time Equivalent (FTE) 0 0 0
DEPARTMENT ORGANIZATION CHART, SIGNIFICANT EXPENDITURES AND STAFFING CHANGES
001-3011
> Jail was closed as part of cost savings measures through the budget process.
JAIL OPERATIONS
FY 2013-14 - Funding in this department covers County Jail Booking fees and other items necessary for moving prisoners to County facility.
6-40

PUBLIC SAFETY
FY 13-14 PROGRAM OBJECTIVES> Remodel downtown office, update computers, printer desk space and office equipment.
> Expand our Downtown Merchant efforts to other business in the Uptown District.
FY 12-13 ACCOMPLISHMENTS
PROGRAM ADOPTED ADOPTED ADOPTEDEXPENDITURES 2011-12 2012-13 2013-14
Salaries & Benefits 622,889 622,622 672,208Contractual Services 0 0 0Materials & Supplies 12,200 12,200 12,200Special Charges 115,824 135,212 71,342Capital Outlay 0 0 0
Total $750,913 $770,034 $755,750
AUTHORIZED ADOPTED ADOPTED ADOPTEDPOSITIONS 2011-12 2012-13 2013-14
Full-Time 4 4 4Part-Time 0 0 0
Full-Time Equivalent (FTE) 4 4 4
DEPARTMENT ORGANIZATION CHART, SIGNIFICANT EXPENDITURES AND STAFFING CHANGES
> We developed an MOU with the US Marine Corp 29 Palms base to partner USMC Staff NCO's and Officers with our Downtown Experience police officers to better monitor Marines who are on liberty in our
> We continue to develop a close working relationship with the Downtown Merchants to share critical information with the businesses in a timely manner.
001-3019
> Continue to improve our networking with the Downtown Business Merchants to include safety tips and
The Downtown Experience is responsible for providing law enforcement, community policing and accessibility to the community.
DOWNTOWN EXPERIENCE - POLICE
> Through our outreach to the Aqua Caliente Tribe of Cahuilla Indians, we were able to enhance the City's sustainability program by obtaining three Segway Personal Transporters for Downtown Officers.
Police Sergeant 1.00 FTE
Police Officer 3.00 FTE
6-41

PUBLIC SAFETY
FY 13-14 PROGRAM OBJECTIVES
FY 12-13 ACCOMPLISHMENTS> Continued to manage funding until grant sunset in FY 2013- 2014.
PROGRAM ADOPTED ADOPTED ADOPTEDEXPENDITURES 2011-12 2012-13 2013-14
Salaries & Benefits 122,598 161,030 0Contractual Services 0 0 0Materials & Supplies 0 0 0Special Charges 0 3,437 0Capital Outlay 0 0 0
Total $122,598 $164,467 $0
AUTHORIZED ADOPTED ADOPTED ADOPTEDPOSITIONS 2011-12 2012-13 2013-14
Full-Time 0 0 0Part-Time 0 0 0
Full-Time Equivalent (FTE) 0 0 0
DEPARTMENT ORGANIZATION CHART, SIGNIFICANT EXPENDITURES AND STAFFING CHANGES
001-3020RECOVERY ACT COPS MATCH
CHP grants provide 100 percent funding for approved entry-level salaries and fringe benefits for three years (36 months) for newly-hired, full-time sworn officer positions, or for rehired officers who have been laid off or are scheduled to be laid off on a future date as a result of local budget cuts. Up to $298 million was appropriated for CHP in fiscal year 2010.
> To administer CHP grants match portion of this program.
FY 2013-14 - No Allocated Positions budgeted in this department. They can be found in 170-3220 but moved to the General Fund 001-3010 in this fiscal year.
6-42

PUBLIC SAFETY
FY 13-14 PROGRAM OBJECTIVES
FY 12-13 ACCOMPLISHMENTS
PROGRAM ADOPTED ADOPTED ADOPTEDEXPENDITURES 2011-12 2012-13 2013-14
Salaries & Benefits 543,314 592,217 647,898Contractual Services 0 0 0Materials & Supplies (294,889) 0 0Special Charges 11,048 13,912 7,295Capital Outlay 0 0 0
Total $259,473 $606,129 $655,193
AUTHORIZED ADOPTED ADOPTED ADOPTEDPOSITIONS 2011-12 2012-13 2013-14
Full-Time 0 0 0Part-Time 0 0 0
Full-Time Equivalent (FTE) 0 0 0
DEPARTMENT ORGANIZATION CHART, SIGNIFICANT EXPENDITURES AND STAFFING CHANGESNOTE: This Department is funded in the General Fund and separated out into its own Department for tracking purposes although the funding from the Agua Caliente Tribe of Cahuilla Indians has discontinued.
> Officers worked closely with casino staff to handle crime in the areas surrounding the casinos.
001-3027
> Continue to work for the continuance of Indian gaming Special Distribution funds to increase police > Continue to coordinate with Tribal Council and staff to provide services around the casino.
This activity accounts for the revenues and expenditures related to Indian Gaming Special Distribution fund (IGSDF). The IGSDF is funded by payments by the Indian casinos into a statewide fund, a portion of which is distributed to the counties, and eventually to local government.
POLICE SPECIAL DISTRIBUTION FUND
6-43

PUBLIC SAFETY
FY 13-14 PROGRAM OBJECTIVES
FY 12-13 ACCOMPLISHMENTS
> Continue to enforce City Ordinances related to Animal Chapter 10.
PROGRAM ADOPTED ADOPTED ADOPTEDEXPENDITURES 2011-12 2012-13 2013-14
Salaries & Benefits 533,713 235,776 391,928Contractual Services 40,300 5,000 5,000Materials & Supplies 66,299 12,966 12,966Special Charges 30,717 0 42,410Capital Outlay 0 0 0
Total $671,029 $253,742 $452,304
AUTHORIZED ADOPTED ADOPTED ADOPTEDPOSITIONS 2011-12 2012-13 2013-14
Full-Time 4.5 10.5 2.5Part-Time 0 0 0
Full-Time Equivalent (FTE) 4.5 10.5 2.5
DEPARTMENT ORGANIZATION CHART, SIGNIFICANT EXPENDITURES AND STAFFING CHANGES
Fy 2013-14 Palm Springs Animal Shelter was contracted out. Unfilled positions were eliminated thru allocated position amendment.
FY 2012-13 Reorganization of the Animal Control division was necessary due to the opening of the Palm Springs Animal Shelter. Allocated positions are being created for the Animal Shelter department by breaking out the Animal Control department into two seperate departments. Currently all of the Control & Shelter positions allocated are reflected in the Animal Control department (3304).
> Continue to enforce the various City and State animal welfare laws and leash laws.
001-3304
The Animal Regulation Division is responsible for the enforcement of animal control activities within the City of Palm Springs.
ANIMAL CONTROL
> Animal Control attempts in many ways to protect people and property from being damaged by roaming and uncontrolled animals. > Animal Control tries to protect animals and pets from the dangers that they can face while being in our urgan setting.
> Continue to respond to complaints regarding noisy animals, loose dogs and other neighborhood animal issues such as animal neglect or abuse, animal bites, animal rescues, stray, sick and/or injured animals.
Director of Animal Control 1.00 FTE
Animal Control Supervisor 1.00 FTE
Animal Shelter Assistant .50 FTE
Animal Control Officer (Placeholder)
No FTE
6-44

PUBLIC SAFETY
FY 13-14 PROGRAM OBJECTIVES
> Provide dog licensing for residents of Palm Springs.> Reduce the pet overpopulation, every animal that the shelter offers for adoption is spayed or neutered first. > Provide veterinary medical attention to the stray, sick or injured animals.
PROGRAM ADOPTED ADOPTED ADOPTEDEXPENDITURES 2011-12 2012-13 2013-14
Salaries & Benefits 0 624,731 0Contractual Services 0 56,000 995,000Materials & Supplies 0 232,633 0Special Charges 0 37,908 17,763Capital Outlay 0 0 0
Total $0 $951,272 $1,012,763
AUTHORIZED ADOPTED ADOPTED ADOPTEDPOSITIONS 2011-12 2012-13 2013-14
Full-Time 0 0 0Part-Time 0 0 0
Full-Time Equivalent (FTE) 0 0 0
DEPARTMENT ORGANIZATION CHART, SIGNIFICANT EXPENDITURES AND STAFFING CHANGES
FY 2013-14 - Appropriations in this department are for the contract to run the Animal Shelter. No personnel is allocated to the Animal Shelter .
> Provide lost and found services in an attempt to reunite owners with their pets.
> Provide humane education classes for local schools and community groups.
001-3305ANIMAL SHELTER
The Palm Springs Animal Shelter opened on October 22, 2011. The Friends of the Animal Shelter, a non-profit organization, is responsible for the Palm Springs Animal Shelter activities in the City of Palm Springs.
The 19,000 square-foot shelter is the result of more than five years of effort by the City Council and Friends of the Palm Springs Animal Shelter. More than $900,000 was raised toward the cost of this much needed new animal care facility, which replaces the outdated shelter.
> Operate shelter to house various animals, from domestic dogs and cats to various desert wildlife and exotic animals, in order to prevent the spread of diseases, every dog and cat placed into the shelter will be
> Assist in providing continuing education to the Animal Law Enforcement agencies and professionals by sponsoring several classes per year.
FY 2012-13 - A new department was created during the reorganization of the Animal Control division due to the opening of the Palm Springs Animal Shelter. Allocated positions are being created for the Animal Shelter department by breaking out the Animal Control department into two seperate departments. In October 2012, the Animal Shelter was contracted out by the City of Palm Springs. Currently the Shelter is being managed by the Friends of the Palm Springs Animal Shelter.
6-45

PUBLIC SAFETY
FY 13-14 PROGRAM OBJECTIVES
FY 12-13 ACCOMPLISHMENTS
PROGRAM ADOPTED ADOPTED ADOPTEDEXPENDITURES 2011-12 2012-13 2013-14
Salaries & Benefits 998,252 1,028,434 1,147,218Contractual Services 0 0 0Materials & Supplies 28,100 28,100 28,100Special Charges 18,546 36,944 34,603Capital Outlay 0 0 0
Total $1,044,898 $1,093,478 $1,209,921
AUTHORIZED ADOPTED ADOPTED ADOPTEDPOSITIONS 2011-12 2012-13 2013-14
Full-Time 17 17 17Part-Time 0 0 0
Full-Time Equivalent (FTE) 17 17 17
DEPARTMENT ORGANIZATION CHART, SIGNIFICANT EXPENDITURES AND STAFFING CHANGES
> Continue on the job training of Dispatchers.
> Continue to respond to 911 and other calls for service.
001-3400
The Communications Center handles all emergency calls and directs police and fire services to emergency locations.
DISPATCH CENTER
> Continue to ascertain as much information as possible from incoming calls to assist officers in the field.
Communications & Records Manager 1.00 FTE
Dispatch Supervisor 2.00
Dispatcher 14.00 FTE
6-46

PUBLIC SAFETY
FY 13-14 PROGRAM OBJECTIVES
FY 12-13 ACCOMPLISHMENTS
PROGRAM ADOPTED ADOPTED ADOPTEDEXPENDITURES 2011-12 2012-13 2013-14
Salaries & Benefits 671,784 678,009 677,266Contractual Services 80,000 80,000 80,000Materials & Supplies 170,000 185,000 255,743Debt Service 348,415 348,414 348,415Capital Outlay 0 0 0
Total $1,270,199 $1,291,423 $1,361,424
AUTHORIZED ADOPTED ADOPTED ADOPTEDPOSITIONS 2011-12 2012-13 2013-14
Full-Time 0 0 0Part-Time 0 0 0
Full-Time Equivalent (FTE) 0 0 0
DEPARTMENT ORGANIZATION CHART, SIGNIFICANT EXPENDITURES AND STAFFING CHANGES
> Established valley-wide user group for data sharing issues.> Participated in regional meetings and provided input regarding valley-wide radio system.
136-1291911 EMERGENCY RESPONSE
The Communications Center handles all emergency calls and directs police and fire services to emergency locations.
> Continue to work with other valley agencies towards a joint radio system.> Participate in the user-group of valley agencies for data sharing.> Continue to respond to 911 and other calls for service.
6-47

PUBLIC SAFETY
FY 13-14 PROGRAM OBJECTIVES
PROGRAM ADOPTED ADOPTED ADOPTEDEXPENDITURES 2011-12 2012-13 2013-14
Salaries & Benefits 0 0 0Contractual Services 0 0 0Materials & Supplies 2,000 2,000 2,000Special Charges 0 0 0Capital Outlay 0 0 0
Total $2,000 $2,000 $2,000
AUTHORIZED ADOPTED ADOPTED ADOPTEDPOSITIONS 2011-12 2012-13 2013-14
Full-Time 0 0 0Part-Time 0 0 0
Full-Time Equivalent (FTE) 0 0 0
DEPARTMENT ORGANIZATION CHART, SIGNIFICANT EXPENDITURES AND STAFFING CHANGES
120-3012
> See POLICE DEPARTMENT
This activity is the cost center for revenues and expenditures related to special narcotics investigations and seizure of assets as a result of these investigations.
FORFEITED ASSETS - POLICE
6-48

PUBLIC SAFETY
FY 13-14 PROGRAM OBJECTIVES
PROGRAM ADOPTED ADOPTED ADOPTEDEXPENDITURES 2011-12 2012-13 2013-14
Salaries & Benefits 369,354 361,121 371,143Contractual Services 0 0 0Materials & Supplies 0 0 0Special Charges 68,247 52,535 44,238Capital Outlay 0 0 0
Total $437,601 $413,656 $415,381
AUTHORIZED ADOPTED ADOPTED ADOPTEDPOSITIONS 2011-12 2012-13 2013-14
Full-Time 2 2 2Part-Time 0 0 0
Full-Time Equivalent (FTE) 2 2 2
DEPARTMENT ORGANIZATION CHART, SIGNIFICANT EXPENDITURES AND STAFFING CHANGES
121-3013
>See POLICE DEPARTMENT
This activity accounts for the revenues and expenditures related to Proposition 172, which authorized a special one-half percent sales tax to be used for safety services only.
SAFETY AUGMENTATION - POLICE
Police Officer 2.00 Fte
6-49

PUBLIC SAFETY
FY 13-14 PROGRAM OBJECTIVES
> See Police Administration
FY 12-13 ACCOMPLISHMENTS
PROGRAM ADOPTED ADOPTED ADOPTEDEXPENDITURES 2011-12 2012-13 2013-14
Salaries & Benefits 0 0 0Contractual Services 0 0 0Materials & Supplies 294,889 0 0Special Charges 0 0 0Capital Outlay 0 0 0
Total $294,889 $0 $0
AUTHORIZED ADOPTED ADOPTED ADOPTEDPOSITIONS 2011-12 2012-13 2013-14
Full-Time 0 0 0Part-Time 0 0 0
Full-Time Equivalent (FTE) 0 0 0
DEPARTMENT ORGANIZATION CHART, SIGNIFICANT EXPENDITURES AND STAFFING CHANGESFY 2011-2012 This department was moved from Fund 122-3025 to the General fund 001-3027the prior fiscal year. In order to recognize dollars from the State in Fund 122, we are using the olddepartment to priorly place the last of the funding for this activiity.FY 2011-2012 Four (4) Police Officer FTE's were moved to the Police Administration (3010).FY 2013-14 All activity, funding and personnel in General Fund (001-3010).
> Officers worked closely with casino staff to handle crime in the areas surrounding the casinos.
122-3025 POLICE SPECIAL DISTRIBUTION FUND
This activity accounts for the revenues and expenditures related to Indian Gaming Special Distribution fund (IGSDF). The IGSDF is funded by payments by the Indian casinos into a statewide fund, a portion of which is distributed to the counties, and eventually to local government.
> Continue to work for the continuance of Indian gaming Special Distribution funds to increase police > Continue to coordinate with Tribal Council and staff to provide services around the casino.
6-50

PUBLIC SAFETY
FY 13-14 PROGRAM OBJECTIVES
PROGRAM ADOPTED ADOPTED ADOPTEDEXPENDITURES 2011-12 2012-13 2013-14
Salaries & Benefits 292,070 297,392 318,745Contractual Services 10,000 10,000 2,000Materials & Supplies 0 0 6,000Special Charges 30,720 36,234 34,355Capital Outlay 0 0 0
Total $332,790 $343,626 $361,100
AUTHORIZED ADOPTED ADOPTED ADOPTEDPOSITIONS 2011-12 2012-13 2013-14
Full-Time 2 2 2Part-Time 0 0 0
Full-Time Equivalent (FTE) 2 2 2
DEPARTMENT ORGANIZATION CHART, SIGNIFICANT EXPENDITURES AND STAFFING CHANGES
140-3026
> See POLICE DEPARTMENT
The Community Facilities District division in the Police department is responsible for the expenditures and revenues within this area.
COMMUNITY FACILITIES DISTRICT - POLICE
Police Officers 2.00 FTE
6-51

PUBLIC SAFETY
FY 13-14 PROGRAM OBJECTIVES
PROGRAM ADOPTED ADOPTED ADOPTEDEXPENDITURES 2011-12 2012-13 2013-14
Salaries & Benefits 100,000 100,000 100,000Contractual Services 0 0 0Materials & Supplies 0 0 0Special Charges 0 0 0Capital Outlay 0 0 0
Total $100,000 $100,000 $100,000
AUTHORIZED ADOPTED ADOPTED ADOPTEDPOSITIONS 2011-12 2012-13 2013-14
Full-Time 0 0 0Part-Time 0 0 0
Full-Time Equivalent (FTE) 0 0 0
DEPARTMENT ORGANIZATION CHART, SIGNIFICANT EXPENDITURES AND STAFFING CHANGES
160-4509
> See POLICE DEPARTMENT
This department is responsible for contractual services overtime to both city and non-city entities.
POLICE SPECIAL PROJECTS
6-52

PUBLIC SAFETY
FY 13-14 PROGRAM OBJECTIVES
PROGRAM ADOPTED ADOPTED ADOPTEDEXPENDITURES 2011-12 2012-13 2013-14
Salaries & Benefits 537,060 547,427 28,464Contractual Services 0 0 0Materials & Supplies 0 0 0Special Charges 0 0 0Capital Outlay 0 0 0
Total $537,060 $547,427 $28,464
AUTHORIZED ADOPTED ADOPTED ADOPTEDPOSITIONS 2011-12 2012-13 2013-14
Full-Time 5 5 0Part-Time 0 0 0
Full-Time Equivalent (FTE) 5 5 0
DEPARTMENT ORGANIZATION CHART, SIGNIFICANT EXPENDITURES AND STAFFING CHANGES
170-3220RECOVERY ACT COPS
This department is responsible for the grant program that provides funding directly to state, local and tribal law enforcement agencies nationwide to hire and/or rehire full-time sworn officers to increase their community policing capacity and crime prevention efforts.
> See Police Administration
FY 2013-14 - Allocated Positions budgeted in this department during funding of this grant. All 5.00 FTE have been moved to the General Fund 001-3010 (Police Administration) in this fiscal year. Remaining funding will cover three months of 1.00 Police Officer cost.
Police Officers 5.00 FTE
6-53

PUBLIC SAFETY
FY 13-14 PROGRAM OBJECTIVES> New department in FY 2012-2014.> To seek continued funding in FY 2014-2015 as this MOU expires each fiscal year.
PROGRAM ADOPTED ADOPTED ADOPTEDEXPENDITURES 2011-12 2012-13 2013-14
Salaries & Benefits 0 167,620Contractual Services 0 0 0Materials & Supplies 0 0 32,380Special Charges 0 0 0Capital Outlay 0 0 0
Total $0 $0 $200,000
AUTHORIZED ADOPTED ADOPTED ADOPTEDPOSITIONS 2011-12 2012-13 2013-14
Full-Time 0 0 0Part-Time 0 0 0
Full-Time Equivalent (FTE) 0 0 0
DEPARTMENT ORGANIZATION CHART, SIGNIFICANT EXPENDITURES AND STAFFING CHANGESFY 2013-14 - 1.00 FTE will be allocated to this department. At the time of the adopted Budget the Allocated
170-3212POLICE AB 109
> Reduce the number of "early release" re-offenders in the City of Palm Springs.
Position Schedule listed this FTE in the Police Admin (301) department or base department. To match the Allocated Position Schedule this FTE will appear in FY 2014-15 if funding continues to be available from the
This Department is responsible for administering the Memorandum of Understanding between the County of Riverside Probation Department and the members of the Post-release Accountability and Compliance Team for the purposes of funding PACT agencies.
The City of Palm Springs in one of eleven (11) cities participating in the Public Safety Realignment Act of 2011. The Act resulted in convicted felons and parolees who were previously monitored by State Parole to be supervised by Probation. On August 20. 2011, the Community Corrections Partnership Executive Committee of Riverside County voted unanimously for the need of a county-wide law enforcement component.
6-54

PUBLIC SAFETY
FY 13-14 PROGRAM OBJECTIVES
PROGRAM ADOPTED ADOPTED ADOPTEDEXPENDITURES 2011-12 2012-13 2013-14
Salaries & Benefits 74,107 0 0Contractual Services 0 0 0Materials & Supplies 0 0 0Special Charges 0 0 0Capital Outlay 0 0 0
Total $74,107 $0 $0
AUTHORIZED ADOPTED ADOPTED ADOPTEDPOSITIONS 2011-12 2012-13 2013-14
Full-Time 1 0 0Part-Time 0 0 0
Full-Time Equivalent (FTE) 1 0 0
DEPARTMENT ORGANIZATION CHART, SIGNIFICANT EXPENDITURES AND STAFFING CHANGESFY 2011-2012 New Department for tracking PAL Officer personnel costs.FY 2012-2013 Department deleted. Allocated positions - One (1) Pal Officer position deleted.
170-3221PAL OFFICER
This department is responsible for the valley-wide program that provides funding directly for the Police Activities League - PAL Officer position. The full-time non-sworn officer is placed at the Palm Springs High School location and deals with the City's teens and youths.
> Department deleted.
6-55

PUBLIC SAFETY
FY 13-14 PROGRAM OBJECTIVES
FY 12-13 ACCOMPLISHMENTS
PROGRAM ADOPTED ADOPTED ADOPTEDEXPENDITURES 2011-12 2012-13 2013-14Salaries & Benefits 8,362,599 8,826,155 9,215,326Contractual Services 60,400 60,400 60,400Materials & Supplies 456,414 468,674 468,674Special Charges 856,435 1,053,619 1,222,547Capital Outlay 25,000 25,000 25,000
Total $9,760,848 $10,433,848 $10,991,947
AUTHORIZED ADOPTED ADOPTED ADOPTEDPOSITIONS 2011-12 2012-13 2013-14Full-Time 42.2 43.2 42.2Part-Time 0 0 0
Full-Time Equivalent (FTE) 42.2 43.2 42.2DEPARTMENT ORGANIZATION CHART, SIGNIFICANT EXPENDITURES AND STAFFING CHANGES
FY 2012-2013 - Addition of One (1) Fire Fighter Overhire position.FY 2013-14 - Moved One (1) Fire Fighter position to Safety Augmentation - Fire (121-3523).
> Engaged with PSNIC and community outreach programs.
FY 2011-12 - Deletion of Five (5) Firefighter positions, One (1) Fire Division Chief position, One (1) Fire Prevention Captain position, and Three (3) Fire Engineer positions. Additions of One (1) New Fire Deputy Chief position, Three (3) Fire Suppression Captain positions (title change) and One (1) New Disaster Preparedness Coordinator position, for a difference of Five (5) less positions during the budget process.
> Completed promotions for Deputy Chief, Battalion Chief, Captain, Engineer & hired 3 Fire Fighters.
> Completed Department Urban Search and Rescue training.
> Prepare for the replacement of the Breathing / Incident Support Unit.
001-3520
> Respond to requests for emergencies within 5 minutes 90% of the time.> Prepare for relocation of Fire Station 445.
The Fire Department provides administration of fire prevention, fire suppression, emergency medical services, and all-risk rescue response within the City.
FIRE DEPARTMENT
Fire Chief 1.00 FTE
Deputy Fire Chief 1.00 FTE
Fire Battalion Chief
3.00 FTE
Fire Prevention Captain 2.00 FTE
Fire Engineers 12.00 FTE
Fire Fighter 7.00 FTE
Fire Fighter Overhire 1.00 FTE
Fire Suppression Captain
11.20 FTE
Emergency Service Coordinator
1.00 FTE
Administrative Assistant 1.00 FTE
Senior Secretary 1.00 FTE
Paln Examiner II 1.00 FTE
6-56

PUBLIC SAFETY
FY 13-14 PROGRAM OBJECTIVES
FY 12-13 ACCOMPLISHMENTS
PROGRAM ADOPTED ADOPTED ADOPTEDEXPENDITURES 2011-12 2012-13 2013-14
Salaries & Benefits 10,596 20,694 21,365Contractual Services 21,600 21,600 21,600Materials & Supplies 84,828 93,128 93,128Special Charges 0 0 0Capital Outlay 0 0 0
Total $117,024 $135,422 $136,093
AUTHORIZED ADOPTED ADOPTED ADOPTEDPOSITIONS 2011-12 2012-13 2013-14
Full-Time 0 0 0Part-Time 0 0 0
Full-Time Equivalent (FTE) 0 0 0
DEPARTMENT ORGANIZATION CHART, SIGNIFICANT EXPENDITURES AND STAFFING CHANGES
> Emergency install at fire station 441 completed.> Mobile repeater obtained with 50% EMPG grant funding.> Provide two CERT Academies for 80 citizens.
001-3522
> CERT iinstructors to assist in the Riverside County CERT FIELD days.
The Fire Department's Disaster Preparedness Program provides for the needs of the community before, during and after a disaster. It provides disaster preparedness information, training and materials to the City and local business.
DISASTER PREPAREDNESS
> Monitor EMPG and SHSGP grant performance and submit documents to Operational Area.
> Prepare for software and hardware upgrade to Mobile Command Vehicle.
6-57

PUBLIC SAFETY
FY 13-14 PROGRAM OBJECTIVES
PROGRAM ADOPTED ADOPTED ADOPTEDEXPENDITURES 2011-12 2012-13 2013-14
Salaries & Benefits 70,072 0 0Contractual Services 0 0 0Materials & Supplies 0 0 0Special Charges 2,612 0 0Capital Outlay 0 0 0
Total $72,684 $0 $0
AUTHORIZED ADOPTED ADOPTED ADOPTEDPOSITIONS 2011-12 2012-13 2013-14
Full-Time 3 0 0Part-Time 0 0 0
Full-Time Equivalent (FTE) 3 0 0
DEPARTMENT ORGANIZATION CHART, SIGNIFICANT EXPENDITURES AND STAFFING CHANGES
001-3521
> Program ended. Personnel moved back to 001-3520 - Fire Administration for proper accounting.
This activity accounts for the revenues and expenditures related to the SAFER (Staffing for Adequate Fire and Emergency Response) Grant. The SAFER Grant was created to provide funding directly to fire departments and volunteer firefighter interest organizations in order to help them increase the number of trained, "front-line" firefighters available in their communities.
FIRE - SAFER GRANT
6-58

PUBLIC SAFETY
FY 13-14 PROGRAM OBJECTIVES
FY 12-13 ACCOMPLISHMENTS
> Provided training and Personal Protective Equipment to three Firefighters /Paramedics.
PROGRAM ADOPTED ADOPTED ADOPTEDEXPENDITURES 2011-12 2012-13 2013-14
Salaries & Benefits 396,407 465,482 426,560Contractual Services 25,000 25,000 25,000Materials & Supplies -225,000 0 0Special Charges 2,835 5,118 4,305Capital Outlay 0 0 0
Total $199,242 $495,600 $455,865
AUTHORIZED ADOPTED ADOPTED ADOPTEDPOSITIONS 2011-12 2012-13 2013-14
Full-Time 3 3 3Part-Time 0 0 0
Full-Time Equivalent (FTE) 3 3 3
DEPARTMENT ORGANIZATION CHART, SIGNIFICANT EXPENDITURES AND STAFFING CHANGES
> Special Distribution Funds paid for staffing of three Firefighter/Paramedics at Station #441.> Provided direct fire services and emergency medical services to Spa Resort Casino.
> Provide Personal Protective Equipment for three Firefighters.
001-3527
> Provide three Firefighters for direct fire protection and EMS service to the Spa Resort Casino.> Provide training for three Firefighters.
This activity accounts for the revenues and expenditures related to Indian Gaming Special Distribution fund (IGSDF). The IGSDF is funded by payments by the Indian casinos into a statewide fund, a portion of which is distributed to the counties, and eventually to local government.
FIRE - SPECIAL DISTRIBUTION FUND
Fire Fighter 3.00 FTE
6-59

PUBLIC SAFETY
FY 13-14 PROGRAM OBJECTIVES
FY 12-13 ACCOMPLISHMENTS
> Provided Personal Protective Equipment to both Firefighters.
PROGRAM ADOPTED ADOPTED ADOPTEDEXPENDITURES 2011-12 2012-13 2013-14
Salaries & Benefits 174,517 163,700 301,158Contractual Services 0 0 0Materials & Supplies 0 0 0Special Charges 39,747 23,360 20,345Capital Outlay 0 0 0
Total $214,264 $187,060 $321,503
AUTHORIZED ADOPTED ADOPTED ADOPTEDPOSITIONS 2011-12 2012-13 2013-14
Full-Time 2 1 2Part-Time 0 0 0
Full-Time Equivalent (FTE) 2 1 2
DEPARTMENT ORGANIZATION CHART, SIGNIFICANT EXPENDITURES AND STAFFING CHANGESFY 2013-14 - Added One (1) Fire Fighter position to Safety Augmentation - Fire (121-3523) from Fire Administration (001-3520).
> Staffed two Firefighter positions through Safety Augmentation funds.> Firefighters trained to exceed minimum standards.
>Provide Personal Protective Equipment for Firefighters.
121-3523
> Staff engines with two Firefighters paid for with Safety Augmentation funds.> Provide training for Firefighters.
This activity accounts for the revenues and expenditures related to Proposition 172, which authorized a special one-half percent sales tax to be used for safety services only.
SAFETY AUGMENTATION - FIRE
Fire Fighter 2.00 FTE
6-60

PUBLIC SAFETY
FY 13-14 PROGRAM OBJECTIVES
PROGRAM ADOPTED ADOPTED ADOPTEDEXPENDITURES 2011-12 2012-13 2013-14
Salaries & Benefits 0 0 0Contractual Services 200,000 0 0Materials & Supplies 70,178 0 0Special Charges 0 0 0Capital Outlay 0 0 0
Total $270,178 $0 $0
AUTHORIZED ADOPTED ADOPTED ADOPTEDPOSITIONS 2011-12 2012-13 2013-14
Full-Time 0 0 0Part-Time 0 0 0
Full-Time Equivalent (FTE) 0 0 0
DEPARTMENT ORGANIZATION CHART, SIGNIFICANT EXPENDITURES AND STAFFING CHANGES
122-3525 FIRE - SPECIAL DISTRIBUTION FUND
This activity accounts for the revenues and expenditures related to Indian Gaming Special Distribution fund (IGSDF). The IGSDF is funded by payments by the Indian casinos into a statewide fund, a portion of which is distributed to the counties, and eventually to local government.
> SEE Special Distribution Fund Department 001-3527
FY 2011-2012 - This department was combined with department 001-3527. Funding for this activity ended and positions / cost center was allocated back to the General Fund in the Fire Administration department (001-3520).
6-61

PUBLIC SAFETY
FY 13-14 PROGRAM OBJECTIVES
> Provide training to Fire Suppression Captain.> Provide Personal Protective equipment for Fire Suppression Captain.
FY 12-13 ACCOMPLISHMENTS
> Provide partial salary of one Fire Captain position with Fire Administration funding 20%> Provided training to CFD Captain.
PROGRAM ADOPTED ADOPTED ADOPTEDEXPENDITURES 2011-12 2012-13 2013-14
Salaries & Benefits 198,181 203,752 208,772Contractual Services 10,950 14,800 12,000Materials & Supplies 0 0 0Special Charges 21,459 24,336 23,846Capital Outlay 0 0 0
Total $230,590 $242,888 $244,618
AUTHORIZED ADOPTED ADOPTED ADOPTEDPOSITIONS 2011-12 2012-13 2013-14
Full-Time 0.8 0.8 0.8Part-Time 0 0 0
Full-Time Equivalent (FTE) 0.8 0.8 0.8
DEPARTMENT ORGANIZATION CHART, SIGNIFICANT EXPENDITURES AND STAFFING CHANGES
> Provided partial Fire Suppression Captain position with CFD funding 80%.
140-3526
> Pay 80% of one Fire Suppression Captain.
This activity accounts for the revenues and expenditures related to Community Facilities District in the Fire Department.
COMMUNITY FACILITIES DISTRICT - FIRE
Fire Supression Captain .80 FTE
6-62

PUBLIC SAFETY
FY 13-14 PROGRAM OBJECTIVES
PROGRAM ADOPTED ADOPTED ADOPTEDEXPENDITURES 2011-12 2012-13 2013-14
Salaries & Benefits 15,894 16,041 11,024Contractual Services 80,000 40,000 85,000Materials & Supplies 13,200 13,200 13,200Special Charges 42,456 50,075 34,761Capital Outlay 0 0 0
Total $151,550 $119,316 $143,985
AUTHORIZED ADOPTED ADOPTED ADOPTEDPOSITIONS 2011-12 2012-13 2013-14
Full-Time 0 0 0Part-Time 0 0 0
Full-Time Equivalent (FTE) 0 0 0
DEPARTMENT ORGANIZATION CHART, SIGNIFICANT EXPENDITURES AND STAFFING CHANGES
> Establish guidelines for parking permits for downtown merchants and employees. Collection of related fees.
131-4461
> Establish guideline for the issuance of "public right-of-way" and "special events" valet parking service
The Parking Control Division is responsible for the control and enforcement of the City's managed parking program. Parking lots and facilities owned by the City are monitored and patrolled by a contract agency. Effective July 1, 2003, administration is provided by the Department of Finance.
PARKING CONTROL
permits. Collections of related fees.
6-63

PUBLIC WORKS & ENGINEERING ENGINEERING
FY 13-14 PROGRAM OBJECTIVES
FY 12-13 ACCOMPLISHMENTS
PROGRAM ADOPTED ADOPTED ADOPTEDEXPENDITURES 2011-12 2012-13 2013-14
Salaries & Benefits 1,228,892 1,242,829 1,444,443Contractual Services 115,500 162,500 162,500Materials & Supplies 26,633 125,475 125,475Special Charges 183,073 223,117 191,143Capital Outlay 250 250 250
Total $1,554,348 $1,754,171 $1,923,811
AUTHORIZED ADOPTED ADOPTED ADOPTEDPOSITIONS 2011-12 2012-13 2013-14
Full-Time 11 11 11Part-Time 0 0 0
Full-Time Equivalent (FTE) 11 11 11
DEPARTMENT ORGANIZATION CHART, SIGNIFICANT EXPENDITURES AND STAFFING CHANGESFY 2011-2012 - Addition of .5 FTE for Clerical Assistant to create a whole FTE.
> Completed Belardo Bridge and Roadway.
> Completed Indian Avenue Widening through the wash.> Completed Indian / I-10 Interchange.
> Begin Indian / Railroad Bridge construction.
001-4171
> Reconstruct City Hall parking lot - FINALLY!> Begin Vista Chino / Whitewater River bridge environmental process.
The Public Works and Engineering Division is the activity center for design and construction of the City's streets, traffic signals, drainage programs and related public facilities.
Director of Public Works/City Engineer
1.00 FTE
Assistant Director of Public
Works/Assistant City Engineer 1.00 FTE
Engineering Associate 1.00 FTE
Associate Civil Engineer 1.00 FTE
Engineering Assistant 1.00 FTE
Senior Public Works Inspector 1.00 FTE
Engineering Technician (Field
INspector) 2.00 FTE
Public Works Inspector
No FTE
Public Works Administrator
1.00 FTE
Engineering Secretary/Counter
Techncian 1.00 FTE
Clerical Assistant 1.00 FTE
6-64

PUBLIC WORKS & ENGINEERING STREET MAINTENANCE
FY 13-14 PROGRAM OBJECTIVES
> Refresh curb painting downtown twice per year.
FY 12-13 ACCOMPLISHMENTS
> Responded to 43 emergency call-outs and 29 special events.
PROGRAM ADOPTED ADOPTED ADOPTEDEXPENDITURES 2011-12 2012-13 2013-14
Salaries & Benefits 752,908 773,920 825,395Contractual Services 26,500 26,500 26,500Materials & Supplies 167,385 167,385 167,385Special Charges 204,913 230,193 289,436Capital Outlay 0 0 0
Total $1,151,706 $1,197,998 $1,308,716
AUTHORIZED ADOPTED ADOPTED ADOPTEDPOSITIONS 2011-12 2012-13 2013-14
Full-Time 7.75 7.75 7.75Part-Time 0 0 0
Full-Time Equivalent (FTE) 7.75 7.75 7.75
DEPARTMENT ORGANIZATION CHART, SIGNIFICANT EXPENDITURES AND STAFFING CHANGES
> Completed 1.386 graffiti calls.> Filled 6,315 potholes.
001-4201
> Maintain 48-hour graffiti response time.> Continue sign retro-reflectivity upgraded.
This activity is responsible for the maintenance, upkeep and repair of the City's streets.
Street Maintenance Superintendent
.25 FTE
Heavy Equip. Operator & Senior Street/Traffic Maintenance Worker
1.00 FTE
Street/Traffic Maintenance Lead
Worker 2.00 FTE
Street/Traffic Maintenance Worker
4.00 FTE
6-65

PUBLIC WORKS & ENGINEERING DOWNTOWN EXPERIENCE - MAINTENANCE
FY 13-14 PROGRAM OBJECTIVES
> Continue improvement of all ballfield infields - ongoing.
PROGRAM ADOPTED ADOPTED ADOPTEDEXPENDITURES 2011-12 2012-13 2013-14
Salaries & Benefits 651,776 0 1,005,985Contractual Services 110,000 0 37,746Materials & Supplies 51,400 0 115,640Special Charges 4,790 0 9,424Capital Outlay 0 0 0
Total $817,966 $0 $1,168,795
AUTHORIZED ADOPTED ADOPTED ADOPTEDPOSITIONS 2011-12 2012-13 2013-14
Full-Time 7.5 0 11Part-Time 0 0 0
Full-Time Equivalent (FTE) 7.5 0 11
DEPARTMENT ORGANIZATION CHART, SIGNIFICANT EXPENDITURES AND STAFFING CHANGES
001-4210
This activity is responsible for the grounds maintenance, upkeep and repair of the City's Downtown and Central Business District area.
> Continue beautification of the Downtown / Uptown are (Business Improvement District - BID) - ongoing.
In FY 12-13 this Department was combined with Parks Maintenance. In FY 13-14 this Department was split back out into its own department.
6-66

PUBLIC WORKS & ENGINEERING STREET CLEANING
FY 13-14 PROGRAM OBJECTIVES
> Perform emergency clean-ups.
FY 12-13 ACCOMPLISHMENTS
> Sweep local streets monthly, thoroughfares weekly and downtown 4 times per week.
PROGRAM ADOPTED ADOPTED ADOPTEDEXPENDITURES 2011-12 2012-13 2013-14
Salaries & Benefits 0 0 0Contractual Services 20,000 27,000 27,000Materials & Supplies 0 0 0Special Charges 0 0 0Capital Outlay 0 0 0
Total $20,000 $27,000 $27,000
AUTHORIZED ADOPTED ADOPTED ADOPTEDPOSITIONS 2011-12 2012-13 2013-14
Full-Time 0 0 0Part-Time 0 0 0
Full-Time Equivalent (FTE) 0 0 0
DEPARTMENT ORGANIZATION CHART, SIGNIFICANT EXPENDITURES AND STAFFING CHANGES
> Pass through payment of state highway cleaning.
001-4240
> Continue sweeping program.
This activity is responsible for the emergency street cleaning in the City.
6-67

PUBLIC WORKS & ENGINEERING STREET LIGHTING
FY 13-14 PROGRAM OBJECTIVES
> Study & plan for signal at Sunrise / Ralph's Center.
FY 12-13 ACCOMPLISHMENTS
> Maintained all traffic signals.
PROGRAM ADOPTED ADOPTED ADOPTEDEXPENDITURES 2011-12 2012-13 2013-14
Salaries & Benefits 0 0 0Contractual Services 300,000 367,000 367,000Materials & Supplies 287,000 220,000 220,000Special Charges 452,518 477,911 491,985Capital Outlay 0 0 0
Total $1,039,518 $1,064,911 $1,078,985
AUTHORIZED ADOPTED ADOPTED ADOPTEDPOSITIONS 2011-12 2012-13 2013-14
Full-Time 0 0 0Part-Time 0 0 0
Full-Time Equivalent (FTE) 0 0 0
DEPARTMENT ORGANIZATION CHART, SIGNIFICANT EXPENDITURES AND STAFFING CHANGES
> Completed environmental studies for signal interconnect project.> Modified 3 traffic signals to protected / permissive.
001-4301
> Begin signal internconnection and traffic management center project construction.> Complete illuminated street name sign replacements.
This activity is responsible for adminsitration and maintenance needed in repairing or replacing the City's signal and street lighting systems.
6-68

PUBLIC WORKS & ENGINEERING RAILROAD STATION
FY 13-14 PROGRAM OBJECTIVES
FY 12-13 ACCOMPLISHMENTS
> Worked with Amtrak on new sign installation.
PROGRAM ADOPTED ADOPTED ADOPTEDEXPENDITURES 2011-12 2012-13 2013-14
Salaries & Benefits 0 0 0Contractual Services 49,000 49,000 49,000Materials & Supplies 10,500 10,500 10,500Special Charges 500 606 680Capital Outlay 10,000 10,000 10,000
Total $70,000 $70,106 $70,180
AUTHORIZED ADOPTED ADOPTED ADOPTEDPOSITIONS 2011-12 2012-13 2013-14
Full-Time 0 0 0Part-Time 0 0 0
Full-Time Equivalent (FTE) 0 0 0
DEPARTMENT ORGANIZATION CHART, SIGNIFICANT EXPENDITURES AND STAFFING CHANGES
< Maintained security.> Maintained landscaping.
001-4471
> Continue maintenance.> Modify access road in conjuction with Indian Avenue project.
This activity oversees the railroad station. Maintenance and future development are the main activities at this juncture.
6-69

PUBLIC WORKS & ENGINEERING CSA 152 & NPDES
FY 13-14 PROGRAM OBJECTIVES> Continue roadside clean-up program.> Continue regional sweeping.> Coordinate permit requirements with RCFC.
FY 12-13 ACCOMPLISHMENTS
> Cleaned-up City Yard and passed EPA inspection.
PROGRAM ADOPTED ADOPTED ADOPTEDEXPENDITURES 2011-12 2012-13 2013-14
Salaries & Benefits 128,075 130,121 140,773Contractual Services 167,200 189,400 170,000Materials & Supplies 23,100 25,450 25,450Special Charges 44,872 49,779 49,683Capital Outlay 0 0 0
Total $363,247 $394,750 $385,906
AUTHORIZED ADOPTED ADOPTED ADOPTEDPOSITIONS 2011-12 2012-13 2013-14
Full-Time 1.25 1.25 1.25Part-Time 0 0 0
Full-Time Equivalent (FTE) 1.25 1.25 1.25
DEPARTMENT ORGANIZATION CHART, SIGNIFICANT EXPENDITURES AND STAFFING CHANGES
> Entered into new roadside clean-up contract.> Met all NPDES requirements.
124-4242
This activity is responsible for the street sweeping in the City and National Pollution Discharge Elimination System.
Street Maintenance Superintendent .25 FTE
Field Technician (Dust Inspector) 1.00 FTE
6-70

PUBLIC WORKS
FY 13-14 PROGRAM OBJECTIVES
PROGRAM ADOPTED ADOPTED ADOPTEDEXPENDITURES 2011-12 2012-13 2013-14
Salaries & Benefits 0 0 0Contractual Services 20,000 10,000 2,995Materials & Supplies 0 0 0Special Charges 2,054 2,114 1,005Capital Outlay 0 0 0
Total $22,054 $12,114 $4,000
AUTHORIZED ADOPTED ADOPTED ADOPTEDPOSITIONS 2011-12 2012-13 2013-14
Full-Time 0 0 0Part-Time 0 0 0
Full-Time Equivalent (FTE) 0 0 0
DEPARTMENT ORGANIZATION CHART, SIGNIFICANT EXPENDITURES AND STAFFING CHANGES
> Establish guidelines for parking permits for downtown merchants and employees. Collection of related fees.
132-4462 PARKING PROJECTS & PROGRAMS
The Parking Control Division is responsible for the control and enforcement of the City's managed parking program. Parking lots and facilities owned by the City are monitored and patrolled by a contract agency. Effective July 1, 2003, administration is provided by the Department of Finance.
> Establish guideline for the issuance of "public right-of-way" and "special events" valet parking servicepermits. Collections of related fees.
6-71

PUBLIC WORKS & ENGINEERING STRUCTURE MAINTENANCE
This activity is the cost center for general administration and oversight of the Parking Structure Maintenance.
FY 13-14 PROGRAM OBJECTIVES
> Continue providing cleaning & maintenance service.
FY 12-13 ACCOMPLISHMENTS
> Installed alley speed bumps.
PROGRAM ADOPTED ADOPTED ADOPTEDEXPENDITURES 2011-12 2012-13 2013-14
Salaries & Benefits 0 0 0Contractual Services 58,000 58,000 45,000Materials & Supplies 19,000 19,600 23,100Special Charges 40,960 45,046 47,611Capital Outlay 0 0 0
Total $117,960 $122,646 $115,711
AUTHORIZED ADOPTED ADOPTED ADOPTEDPOSITIONS 2011-12 2012-13 2013-14
Full-Time 0 0 0Part-Time 0 0 0
Full-Time Equivalent (FTE) 0 0 0
DEPARTMENT ORGANIZATION CHART, SIGNIFICANT EXPENDITURES AND STAFFING CHANGES
> Continued security, elevator maintenance and sweeping services.
131-4464
> Implement new energy saving light replacement.
6-72

PUBLIC WORKS & ENGINEERING LAND LITE PARK MAINTENANCE DISTRICTS
FY 13-14 PROGRAM OBJECTIVES
> Budget to remove District #1 lights.> Bid out district maintenance contract.
FY 12-13 ACCOMPLISHMENTS> Kep districts self supporting.> Continued all landscape maintenance
PROGRAM ADOPTED ADOPTED ADOPTEDEXPENDITURES 2011-12 2012-13 2013-14
Salaries & Benefits 0 0 0Contractual Services 0 0 0Materials & Supplies 295,835 219,000 199,700Special Charges 0 0 0Capital Outlay 0 0 0
Total $295,835 $219,000 $199,700
AUTHORIZED ADOPTED ADOPTED ADOPTEDPOSITIONS 2011-12 2012-13 2013-14
Full-Time 0 0 0Part-Time 0 0 0
Full-Time Equivalent (FTE) 0 0 0
DEPARTMENT ORGANIZATION CHART, SIGNIFICANT EXPENDITURES AND STAFFING CHANGESThis department includes the following districts: Lighting Maintenance District #12, Parkway Maintenance District 6A, Parkway Maintenance District 6C,Lighting Maintenance District #7, Parkway Maintenance #8, Parkway Maintenance #9, ParkwayMaintenance #10, PMD 10 Zone 2 and Lighting Maintenance District #3 and Parkway Maintenance #11
141-4310
This activity is the cost center for general administration and oversight of the Land, Light and Park Maintenance Districts.
> Continue administering all districts.
6-73

PUBLIC WORKS & ENGINEERING SPECIAL PROJECTS
FY 13-14 PROGRAM OBJECTIVES
FY 12-13 ACCOMPLISHMENTS
PROGRAM ADOPTED ADOPTED ADOPTEDEXPENDITURES 2011-12 2012-13 2013-14
Salaries & Benefits 100,000 100,000 100,000Contractual Services 0 0 0Materials & Supplies 0 0 0Special Charges 0 0 0Capital Outlay 0 0 0
Total $100,000 $100,000 $100,000
AUTHORIZED ADOPTED ADOPTED ADOPTEDPOSITIONS 2011-12 2012-13 2013-14
Full-Time 0 0 0Part-Time 0 0 0
Full-Time Equivalent (FTE) 0 0 0
DEPARTMENT ORGANIZATION CHART, SIGNIFICANT EXPENDITURES AND STAFFING CHANGES
160-4501 thru 4524
These "Special Charges" Departments were established to efficiently and effectively track Developer deposits. Developer deposits are required to reimburse and cover costs incurred by the City on behalf of the Developer. The type of costs the Developers reimburse the City for may include such items as legal fees, environmental impact reports, building inspections and police special charges.
> To ensure that deposits match expenditures. These particular departments are grouped under the public works function.> Any unspent funds are returned to Developer.
> Maintained contact with Developers to ensure sufficient funds were deposited to cover required City
6-74

MARKETING AND TOURSIM VISITOR INFORMATION CENTER
FY 12-13 PROGRAM OBJECTIVES
PROGRAM ADOPTED ADOPTED ADOPTEDEXPENDITURES 2011-12 2012-13 2013-14
Salaries & Benefits 0 0 0Contractual Services 5,000 5,000 5,000Materials & Supplies 0 0 0Special Charges 0 0 0Capital Outlay 0 0 0
Total $5,000 $5,000 $5,000
AUTHORIZED ADOPTED ADOPTED ADOPTEDPOSITIONS 2011-12 2012-13 2013-14
Full-Time 0 0 0Part-Time 0 0 0
Full-Time Equivalent (FTE) 0 0 0
DEPARTMENT ORGANIZATION CHART, SIGNIFICANT EXPENDITURES AND STAFFING CHANGES
001-2116
> Provide visitors with information about the City of Palm Springs.> Maintenance of the building and surroundings.
This activity operates the Palm Springs Official Visitors Information Center located at the entryway of the City which was formerly the Tramway gas station. The Center provides information regarding Palm Springs accommodations, dining, shopping, museums, attractions and events.
6-75

MARKETING AND TOURISM TOURISM
FY 13-14 PROGRAM OBJECTIVES
PROGRAM ADOPTED ADOPTED ADOPTEDEXPENDITURES 2011-12 2012-13 2013-14
Salaries & Benefits 0 0 0Contractual Services 1,800,203 1,950,000 1,950,000Materials & Supplies 0 0 0Special Charges 0 0 0Capital Outlay 0 0 0
Total $1,800,203 $1,950,000 $1,950,000
AUTHORIZED ADOPTED ADOPTED ADOPTEDPOSITIONS 2011-12 2012-13 2013-14
Full-Time 0 0 0Part-Time 0 0 0
Full-Time Equivalent (FTE) 0 0 0
DEPARTMENT ORGANIZATION CHART, SIGNIFICANT EXPENDITURES AND STAFFING CHANGES
- Increased press releases and stories produced by media and journalists thru public relations effort.- Increased fulfillment and online viewing of visitor's guides
001-2117
- Website redesign
> Create and increase overall awareness and interest among consumers in targeted markets, drive intent to purchase, and promote return visitation through advertising and marketing efforts such as:
- Increased consumer and media leads
Palm Springs Bureau of Toursim directs the tourist-related activities in the City. Advertising and promotion of the City of Palm Springs are the main focuses for this activity. The City of Palm Springs Contracts with SMG to manage and operate the Tourism and Visitors Information Center activities.
6-76

MARKETING AND TOURISM SPECIAL EVENTS
FY 13-14 PROGRAM OBJECTIVES
PROGRAM ADOPTED ADOPTED ADOPTEDEXPENDITURES 2011-12 2012-13 2013-14
Salaries & Benefits 0 0 0Contractual Services 0 0 0Materials & Supplies 340,430 353,550 233,684Special Charges 0 0 0Capital Outlay 0 0 0
Total $340,430 $353,550 $233,684
AUTHORIZED ADOPTED ADOPTED ADOPTEDPOSITIONS 2011-12 2012-13 2013-14
Full-Time 0 0 0Part-Time 0 0 0
Full-Time Equivalent (FTE) 0 0 0
DEPARTMENT ORGANIZATION CHART, SIGNIFICANT EXPENDITURES AND STAFFING CHANGESAll 112 fund departments have new department numbers but the department titles remain the same.This department was 112-2018 and is now 001-2118 - Special Events.
001-2118
Special activities of the City are funded through this activity. Festival of Lights, July 4th, and Veteran's Day Parade, and the Mayor's Wellness Program are some of the annual activities used to promote the City.
> Promote the City of Palm Springs by providing high quality events and contributing to community programs through participation by the Special Events Planning team.
6-77

MARKETING AND TOURISM SPECIAL CONTRIBUTIONS
FY 13-14 PROGRAM OBJECTIVES
PROGRAM ADOPTED ADOPTED ADOPTEDEXPENDITURES 2011-12 2012-13 2013-14
Salaries & Benefits 0 0 0Contractual Services 0 0 0Materials & Supplies 10,000 10,000 86,000Special Charges 0 0 0Capital Outlay 0 0 0
Total $10,000 $10,000 $86,000
AUTHORIZED ADOPTED ADOPTED ADOPTEDPOSITIONS 2011-12 2012-13 2013-14
Full-Time 0 0 0Part-Time 0 0 0
Full-Time Equivalent (FTE) 0 0 0
DEPARTMENT ORGANIZATION CHART, SIGNIFICANT EXPENDITURES AND STAFFING CHANGESAll 112 fund departments have new department numbers but the department titles remain the same.This department was 112-2019 and is now 001-2119 - Special Contributions.
001-2119
This activity oversees the contributions on behalf of the City of Palm Springs to specific organizations or programs, such as the Boys and Girls Club, Senior Center and Well in the Desert.
> Promote the City of Palm Springs by supporting specific organizations with the help of community contributions.
6-78

MARKETING AND TOURISM EVENT SPONSORSHIP
FY 13-14 PROGRAM OBJECTIVES> To track City sponsored events.
PROGRAM ADOPTED ADOPTED ADOPTEDEXPENDITURES 2011-12 2012-13 2013-14
Salaries & Benefits 0 0 0Contractual Services 0 0 0Materials & Supplies**Special Charges 0 0 0Capital Outlay 0 0 0
Total $0 $0 $0
AUTHORIZED ADOPTED ADOPTED ADOPTEDPOSITIONS 2011-12 2012-13 2013-14
Full-Time 0 0 0Part-Time 0 0 0
Full-Time Equivalent (FTE) 0 0 0
DEPARTMENT ORGANIZATION CHART, SIGNIFICANT EXPENDITURES AND STAFFING CHANGESAll 112 fund departments have new department numbers but the department titles remain the same.This department was 112-2020 and is now 001-2120 - Event Sponsorship.
001-2120
This activity oversees the contributions for local events within the city.
**FY 2013-14 The International Film Festival event costs of $350,000 are excluded from this area and listed under the Contractual Obligations section at this end of this section, on page 6-131.
6-79

MASTERLEASE MASTERLEASE
FY 13-14 PROGRAM OBJECTIVES
FY 12-13 ACCOMPLISHMENTS
PROGRAM ADOPTED ADOPTED ADOPTEDEXPENDITURES 2011-12 2012-13 2013-14
Salaries & Benefits 0 0 0Contractual Services 750 750 750Materials & Supplies 4,500 2,500 2,500Special Charges 0 0 0Capital Outlay 0 0 0Debt Service 1,627,269 1,631,141 1,632,399
Total $1,632,519 $1,634,391 $1,635,649
AUTHORIZED ADOPTED ADOPTED ADOPTEDPOSITIONS 2011-12 2012-13 2013-14
Full-Time 0 0 0Part-Time 0 0 0
Full-Time Equivalent (FTE) 0 0 0
DEPARTMENT ORGANIZATION CHART, SIGNIFICANT EXPENDITURES AND STAFFING CHANGES
> Collect revenue from lessees on a timely basis.
139-7851
> Pay debt obligation on a timely basis.
The City holds a master lease on land adjacent to the Convention Center. This activity reflects the debt services and other costs.
6-80

DEBT SERVICE CAL ENERGY LOAN
FY 13-14 PROGRAM OBJECTIVES
PROGRAM ADOPTED ADOPTED ADOPTEDEXPENDITURES 2011-12 2012-13 2013-14
Salaries & Benefits 0 0 0Contractual Services 0 0 0Materials & Supplies 0 0 0Debt Service 23,834 23,834 0Special Charges 0 0 0Capital Outlay 0 0 0
Total $23,834 $23,834 $0
AUTHORIZED ADOPTED ADOPTED ADOPTEDPOSITIONS 2011-12 2012-13 2013-14
Full-Time 0 0 0Part-Time 0 0 0
Full-Time Equivalent (FTE) 0 0 0
DEPARTMENT ORGANIZATION CHART, SIGNIFICANT EXPENDITURES AND STAFFING CHANGES
301-7850
> Pay debt obligations on a timely basis.
This activity is responsible for payment of debt service activity for miscellaneous Cal Energy Loan financing.
6-81

DEBT SERVICE CONVENTION CENTER DEBT
FY 13-14 PROGRAM OBJECTIVES
PROGRAM ADOPTED ADOPTED ADOPTEDEXPENDITURES 2011-12 2012-13 2013-14
Salaries & Benefits 0 0 0Contractual Services 0 0 0Materials & Supplies 4,000 4,000 4,000Debt Service 4,511,263 4,344,526 4,339,301Special Charges 0 0 0Capital Outlay 0 0 0
Total $4,515,263 $4,348,526 $4,343,301
AUTHORIZED ADOPTED ADOPTED ADOPTEDPOSITIONS 2011-12 2012-13 2013-14
Full-Time 0 0 0Part-Time 0 0 0
Full-Time Equivalent (FTE) 0 0 0
DEPARTMENT ORGANIZATION CHART, SIGNIFICANT EXPENDITURES AND STAFFING CHANGES> As history, the $62.4 million Convention Center bond issue was completed in May 2004. Itrefinanced about $11 million in existing bonds & provided about $47.5 million for a major 115,000 square foot expansion of the Center. The groundbreaking was in June 2004 and the ConventionCenter remodel was completed in August 2005.
301-7852
> Pay debt obligations on a timely basis.
This activity is responsible for payment of debt service activity for the Convention Center.
6-82

DEBT SERVICE POLICE BLDG & OTHER
FY 13-14 PROGRAM OBJECTIVES
PROGRAM ADOPTED ADOPTED ADOPTEDEXPENDITURES 2011-12 2012-13 2013-14
Salaries & Benefits 0 0 0Contractual Services 0 0 0Materials & Supplies 600 600 600Debt Service 154,984 156,139 151,943Special Charges 0 0 0Capital Outlay 0 0 0
Total $155,584 $156,739 $152,543
AUTHORIZED ADOPTED ADOPTED ADOPTEDPOSITIONS 2011-12 2012-13 2013-14
Full-Time 0 0 0Part-Time 0 0 0
Full-Time Equivalent (FTE) 0 0 0
DEPARTMENT ORGANIZATION CHART, SIGNIFICANT EXPENDITURES AND STAFFING CHANGES
301-7868
>Pay debt obligation on a timely basis.
This activity is responsible for payment of debt service activity for the Police Building and Other.
6-83

DEBT SERVICE PARKING STRUCTURE DEBT
FY 13-14 PROGRAM OBJECTIVES
PROGRAM ADOPTED ADOPTED ADOPTEDEXPENDITURES 2011-12 2012-13 2013-14
Salaries & Benefits 0 0 0Contractual Services 0 0 0Materials & Supplies 3,000 3,000 3,000Debt Service 490,000 425,000 408,000Special Charges 0 0 0Capital Outlay 0 0 0
Total $493,000 $428,000 $411,000
AUTHORIZED ADOPTED ADOPTED ADOPTEDPOSITIONS 2011-12 2012-13 2013-14
Full-Time 0 0 0Part-Time 0 0 0
Full-Time Equivalent (FTE) 0 0 0
DEPARTMENT ORGANIZATION CHART, SIGNIFICANT EXPENDITURES AND STAFFING CHANGES
301-7872
> Pay debt obligations on a timely basis.
This activity is responsible for payment of debt service activity for the Parking Structure Debt.
6-84

DEBT SERVICE MEASURE J DEBT SERVICE
FY 13-14 PROGRAM OBJECTIVES
PROGRAM ADOPTED ADOPTED ADOPTEDEXPENDITURES 2011-12 2012-13 2013-14
Salaries & Benefits 0 0 0Contractual Services 0 0 0Materials & Supplies 0 0 0Debt Service 0 3,300,000 3,200,000Special Charges 0 0 0Capital Outlay 0 0 0
Total $0 $3,300,000 $3,200,000
AUTHORIZED ADOPTED ADOPTED ADOPTEDPOSITIONS 2011-12 2012-13 2013-14
Full-Time 0 0 0Part-Time 0 0 0
Full-Time Equivalent (FTE) 0 0 0
DEPARTMENT ORGANIZATION CHART, SIGNIFICANT EXPENDITURES AND STAFFING CHANGES
301-7878
This activity is responsible for payment of debt service activity for the Measure J Debt.
> Pay debt obligations on a timely basis.
6-85

ASSESSMENT DISTRICT A.D. 143 - DEBT SERVICE
FY 13-14 PROGRAM OBJECTIVES
PROGRAM ADOPTED ADOPTED ADOPTEDEXPENDITURES 2011-12 2012-13 2013-14
Salaries & Benefits 1,000 0 0Contractual Services 0 0 0Materials & Supplies 0 0 0Debt Service 0 0 0Special Charges 0 0 0Capital Outlay 0 0 0
Total $1,000 $0 $0
AUTHORIZED ADOPTED ADOPTED ADOPTEDPOSITIONS 2011-12 2012-13 2013-14
Full-Time 0 0 0Part-Time 0 0 0
Full-Time Equivalent (FTE) 0 0 0
DEPARTMENT ORGANIZATION CHART, SIGNIFICANT EXPENDITURES AND STAFFING CHANGES
311-7857
> Properly handle assessment district activity.
Assessment District A.D. 143 - Debt Service
6-86

ASSESSMENT DISTRICT A.D. 146 - DEBT SERVICE
FY 13-14 PROGRAM OBJECTIVES
PROGRAM ADOPTED ADOPTED ADOPTEDEXPENDITURES 2011-12 2012-13 2013-14
Salaries & Benefits 200 0 0Contractual Services 0 0 0Materials & Supplies 0 0 0Debt Service 0 0 0Special Charges 0 0 0Capital Outlay 0 0 0
Total $200 $0 $0
AUTHORIZED ADOPTED ADOPTED ADOPTEDPOSITIONS 2011-12 2012-13 2013-14
Full-Time 0 0 0Part-Time 0 0 0
Full-Time Equivalent (FTE) 0 0 0
DEPARTMENT ORGANIZATION CHART, SIGNIFICANT EXPENDITURES AND STAFFING CHANGES
313-7859
> Properly handle assessment district activity.
Assessment District A.D. 146 - Debt Service
6-87

ASSESSMENT DISTRICT A.D. 155 - DEBT SERVICE
FY 13-14 PROGRAM OBJECTIVES
PROGRAM ADOPTED ADOPTED ADOPTEDEXPENDITURES 2011-12 2012-13 2013-14
Salaries & Benefits 0 0 0Contractual Services 0 0 0Materials & Supplies 2,000 0 0Debt Service 3,000 0 0Special Charges 0 0 0Capital Outlay 0 0 0
Total $5,000 $0 $0
AUTHORIZED ADOPTED ADOPTED ADOPTEDPOSITIONS 2011-12 2012-13 2013-14
Full-Time 0 0 0Part-Time 0 0 0
Full-Time Equivalent (FTE) 0 0 0
DEPARTMENT ORGANIZATION CHART, SIGNIFICANT EXPENDITURES AND STAFFING CHANGES
315-7861
> Properly handle assessment district activity.
Assessment District A.D. 155 - Debt Service
6-88

ASSESSMENT DISTRICT A.D. 159 - DEBT SERVICE
FY 13-14 PROGRAM OBJECTIVES
PROGRAM ADOPTED ADOPTED ADOPTEDEXPENDITURES 2011-12 2012-13 2013-14
Salaries & Benefits 0 0 0Contractual Services 250 0 0Materials & Supplies 0 0 0Debt Service 0 0 0Special Charges 0 0 0Capital Outlay 0 0 0
Total $250 $0 $0
AUTHORIZED ADOPTED ADOPTED ADOPTEDPOSITIONS 2011-12 2012-13 2013-14
Full-Time 0 0 0Part-Time 0 0 0
Full-Time Equivalent (FTE) 0 0 0
DEPARTMENT ORGANIZATION CHART, SIGNIFICANT EXPENDITURES AND STAFFING CHANGES
322-7876
> Properly handle assessment district activity.
Assessment District A.D. 159 - Debt Service
6-89

ASSESSMENT DISTRICT A.D. 157/158 REFINANCE
FY 13-14 PROGRAM OBJECTIVES
PROGRAM ADOPTED ADOPTED ADOPTEDEXPENDITURES 2011-12 2012-13 2013-14
Salaries & Benefits 0 0 0Contractual Services 12,000 10,000 10,000Materials & Supplies 2,000 1,000 1,000Debt Service 86,660 86,280 4,000Special Charges 0 0 0Capital Outlay 0 0 0
Total $100,660 $97,280 $15,000
AUTHORIZED ADOPTED ADOPTED ADOPTEDPOSITIONS 2011-12 2012-13 2013-14
Full-Time 0 0 0Part-Time 0 0 0
Full-Time Equivalent (FTE) 0 0 0
DEPARTMENT ORGANIZATION CHART, SIGNIFICANT EXPENDITURES AND STAFFING CHANGES
324-7870
> Properly handle assessment district activity.
Assessment District A.D. 157/158 Refinance
6-90

ASSESSMENT DISTRICT A.D. 161 - DEBT SERVICE
FY 13-14 PROGRAM OBJECTIVES
PROGRAM ADOPTED ADOPTED ADOPTEDEXPENDITURES 2011-12 2012-13 2013-14
Salaries & Benefits 0 0 0Contractual Services 9,000 9,000 8,000Materials & Supplies 6,000 6,000 6,000Debt Service 332,678 327,445 330,668Special Charges 0 0 0Capital Outlay 0 0 0
Total $347,678 $342,445 $344,668
AUTHORIZED ADOPTED ADOPTED ADOPTEDPOSITIONS 2011-12 2012-13 2013-14
Full-Time 0 0 0Part-Time 0 0 0
Full-Time Equivalent (FTE) 0 0 0
DEPARTMENT ORGANIZATION CHART, SIGNIFICANT EXPENDITURES AND STAFFING CHANGES
325-7871
> Properly handle assessment district activity.
Assessment District A.D. 161 - Debt Service
6-91

ASSESSMENT DISTRICT A.D. 162 - DEBT SERVICE
FY 13-14 PROGRAM OBJECTIVES
PROGRAM ADOPTED ADOPTED ADOPTEDEXPENDITURES 2011-12 2012-13 2013-14
Salaries & Benefits 0 0 0Contractual Services 10,000 10,000 7,000Materials & Supplies 3,000 3,000 5,200Debt Service 100,458 98,778 97,028Special Charges 0 0 0Capital Outlay 0 0 0
Total $113,458 $111,778 $109,228
AUTHORIZED ADOPTED ADOPTED ADOPTEDPOSITIONS 2011-12 2012-13 2013-14
Full-Time 0 0 0Part-Time 0 0 0
Full-Time Equivalent (FTE) 0 0 0
DEPARTMENT ORGANIZATION CHART, SIGNIFICANT EXPENDITURES AND STAFFING CHANGES
326-7874
> Properly handle assessment district activity.
Assessment District A.D. 162 - Debt Service
6-92

ASSESSMENT DISTRICT A.D. 164 - DEBT SERVICE
FY 13-14 PROGRAM OBJECTIVES
PROGRAM ADOPTED ADOPTED ADOPTEDEXPENDITURES 2011-12 2012-13 2013-14
Salaries & Benefits 0 0 0Contractual Services 9,000 9,000 8,000Materials & Supplies 4,000 4,000 4,000Debt Service 272,657 273,220 272,438Special Charges 0 0 0Capital Outlay 0 0 0
Total $285,657 $286,220 $284,438
AUTHORIZED ADOPTED ADOPTED ADOPTEDPOSITIONS 2011-12 2012-13 2013-14
Full-Time 0 0 0Part-Time 0 0 0
Full-Time Equivalent (FTE) 0 0 0
DEPARTMENT ORGANIZATION CHART, SIGNIFICANT EXPENDITURES AND STAFFING CHANGES
327-7875
> Properly handle assessment district activity.
Assessment District A.D. 164 - Debt Service (Mountain Gate II)
6-93

AIRPORT AIRPORT CUSTOMS FACILITY
FY 13-14 PROGRAM OBJECTIVES
> Amend CFC application to allow increased collections as recommended by rental car operators.
FY 12-13 ACCOMPLISHMENTS
> Participated in the formulation/legislative effort for new State Regulations to increased CFC collections
PROGRAM ADOPTED ADOPTED ADOPTEDEXPENDITURES 2011-12 2012-13 2013-14
Salaries & Benefits 0 0 0Contractual Services 0 0 0Materials & Supplies 0 0 0Debt Service 0 0 0Special Charges 0 0 0Capital Outlay 307,678 0 480,000
Total $307,678 $0 $480,000
AUTHORIZED ADOPTED ADOPTED ADOPTEDPOSITIONS 2011-12 2012-13 2013-14
Full-Time 0 0 0Part-Time 0 0 0
Full-Time Equivalent (FTE) 0 0 0
DEPARTMENT ORGANIZATION CHART, SIGNIFICANT EXPENDITURES AND STAFFING CHANGES
> Managed the CFC Fund consistent with the State requirements.
405-6003
The Passenger Facility Charge (PFC) Program authorizes the collections of PFC fees up to $4.50 for every enplaned passenger at commercial airports controlled by public agencies. The fees are then used by the airports to fund FAA-approved projects that enhance safety, security, or capacity; reduce noise; or increase air carrier competition.
> Initiate preliminary plans to improve capacity for the rental car customers and on-site operations.
> Implement and authorize recommended expansion for rental counters for next bid cycle.
6-94

AIRPORT PFC ADMINISTRATION
FY 13-14 PROGRAM OBJECTIVES> Administer the Passenger Facility Charge program in accordance with FAA regulations.
> Review the potential to use additional PFC funds for Airport Grant matching share obligations.
FY 12-13 ACCOMPLISHMENTS
PROGRAM ADOPTED ADOPTED ADOPTEDEXPENDITURES 2011-12 2012-13 2013-14
Salaries & Benefits 0 0 0Contractual Services 2,000 2,000 2,000Materials & Supplies 4,000 4,000 4,000Debt Service 842,443 864,338 1,460,419Special Charges 4,261 4,070 3,870Capital Outlay 0 0 0
Total $852,704 $874,408 $1,470,289
AUTHORIZED ADOPTED ADOPTED ADOPTEDPOSITIONS 2011-12 2012-13 2013-14
Full-Time 0 0 0Part-Time 0 0 0
Full-Time Equivalent (FTE) 0 0 0
DEPARTMENT ORGANIZATION CHART, SIGNIFICANT EXPENDITURES AND STAFFING CHANGES
> Support legislative action through National organizations to justify and support increasing $4.50 collections levels.
> Administered the program in accordance with the requirements set forth for the collection and expenditure of funds.
410-6001
> Maximize the utilization of funds to pay the debt obligation of the Airport Bonds.
The Passenger Facility Charge (PFC) Program authorizes the collections of PFC fees up to $4.50 for every enplaned passenger at commercial airports controlled by public agencies. The fees are then used by the airports to fund FAA-approved projects that enhance safety, security, or capacity; reduce noise; or increase air carrier competition.
6-95

AIRPORT SERIES 2006 DEBT
FY 13-14 PROGRAM OBJECTIVES
> Work in consonsant with Bond Holder's to generate positive reports.
FY 12-13 ACCOMPLISHMENTS
> Met the PFC subordinate Debt Obligation on a timely basis.> Worked in consonant with Bond House representatives to produce positive reports.
PROGRAM ADOPTED ADOPTED ADOPTEDEXPENDITURES 2011-12 2012-13 2013-14
Salaries & Benefits 0 0 0Contractual Services 6,500 6,500 6,500Materials & Supplies 4,000 4,000 4,000Debt Service 1,026,453 919,765 1,343,710Special Charges 0 0 0Capital Outlay 0 0 0
Total $1,036,953 $930,265 $1,354,210
AUTHORIZED ADOPTED ADOPTED ADOPTEDPOSITIONS 2011-12 2012-13 2013-14
Full-Time 0 0 0Part-Time 0 0 0
Full-Time Equivalent (FTE) 0 0 0
DEPARTMENT ORGANIZATION CHART, SIGNIFICANT EXPENDITURES AND STAFFING CHANGES
410-6277
> Administer the FAA approved PFC program in accordance with regulations.> Meet the PFC subordinate Debt Obligation on a timely basis.
The Palm Springs International Airport issued bonds. This activity reflects the debt service requirements.
> Adminstered the program in accordance with the requirements set forth for the collection and expenditure of funds
6-96

AIRPORT SERIES 2008 DEBT
FY 13-14 PROGRAM OBJECTIVES
> Meet the PFC subordinate Debt Obligation on a timely basis.> Work in consonant with Bond Holder's to generate positive reports.
FY 12-13 ACCOMPLISHMENTS
> Met the PFC subordinate Debt Oligation on a timely basis.> Worked in consonant with Bond House representatives to produce positive reports.
PROGRAM ADOPTED ADOPTED ADOPTEDEXPENDITURES 2011-12 2012-13 2013-14
Salaries & Benefits 0 0 0Contractual Services 3,000 3,000 8,000Materials & Supplies 4,000 4,000 4,000Debt Service 642,125 628,748 951,415Special Charges 0 0 0Capital Outlay 0 0 0
Total $649,125 $635,748 $963,415
AUTHORIZED ADOPTED ADOPTED ADOPTEDPOSITIONS 2011-12 2012-13 2013-14
Full-Time 0 0 0Part-Time 0 0 0
Full-Time Equivalent (FTE) 0 0 0
DEPARTMENT ORGANIZATION CHART, SIGNIFICANT EXPENDITURES AND STAFFING CHANGES
410-6278
> Administer the FAA approved PFC program in accordance with regulations.
The Palm Springs International Airport issued bonds. This activity reflects the debt service requirements.
> Administered the program in accordance with the requirements set forth for the collection and expenditure of funds.
6-97

AIRPORT AIRPORT ADMINISTRATION
FY 13-14 PROGRAM OBJECTIVES
> Preserve and enhance the capacity, safety, security and general welfare of the facilities for general public.> Ensure the Airport's long term financial health.
FY 12-13 ACCOMPLISHMENTS
> Plan and implement recommendations as described in the Airport Master Plan, upon final approval.
PROGRAM ADOPTED ADOPTED ADOPTEDEXPENDITURES 2011-12 2012-13 2013-14
Salaries & Benefits 1,167,554 1,142,838 1,238,604Contractual Services 180,300 200,300 112,391Materials & Supplies 295,903 287,227 198,075Debt Service 5,000 5,000 5,000Special Charges 1,274,191 1,425,330 1,401,591Capital Outlay 18,000 18,000 18,000
Total $2,940,948 $3,078,695 $2,973,661
AUTHORIZED ADOPTED ADOPTED ADOPTEDPOSITIONS 2011-12 2012-13 2013-14
Full-Time 7 7 7Part-Time 0 0 0
Full-Time Equivalent (FTE) 7 7 7
DEPARTMENT ORGANIZATION CHART, SIGNIFICANT EXPENDITURES AND STAFFING CHANGESFY 2011-2012 - Addition of One (1) Deputy Director of Aviation/Operations & Maintenance duringthe budget process.
415-6002
The primary responsibility of the City in operating the airport is to provide an air transportation system that is comfortable, safe, secure, and efficient to accommodate the traveling public and general aviation users.
> Sustain positive and productive relationships with customers, tenants, and regulatory agencies.
> Provide the residents of the City of Palm Springs and the Coachella Valley with access to the nation's aviation system.
> Maintenance the high standards with the annual FAA certification process necessary to retain Part 139 standards.
Executive Director PS International Airport
1.00 FTE
Deputy Director of Aviation - Operations &
Maintenance 1.00 FTE
Deputy Director of Aviation/Marketing &
Development 1.00 FTE
Airport Administration Manager 1.00 FTE
Administrative Secretary 1.00 FTE
Account Specialist II 1.00 FTE
Executive Administrative Assistant 1.00 FTE
6-98

AIRPORT CORPORATE YARD PROPERTY
FY 13-14 PROGRAM OBJECTIVES
PROGRAM ADOPTED ADOPTED ADOPTEDEXPENDITURES 2011-12 2012-13 2013-14
Salaries & Benefits 0 0 0Contractual Services 0 0 0Materials & Supplies 128,215 142,489 142,489Special Charges 0 0 0Capital Outlay 0 0 0
Total $128,215 $142,489 $142,489
AUTHORIZED ADOPTED ADOPTED ADOPTEDPOSITIONS 2011-12 2012-13 2013-14
Full-Time 0 0 0Part-Time 0 0 0
Full-Time Equivalent (FTE) 0 0 0
DEPARTMENT ORGANIZATION CHART, SIGNIFICANT EXPENDITURES AND STAFFING CHANGES
415-6010
> Corporate Yard expenses offset by equal revenue payment to Airport Land Rental.
This activity is the cost center for the special charges of Land Rental from the Airport fund to the Motor Vehicles Replacement fund per City's lease agreement.
6-99

AIRPORT AIRPORT SECURITY
FY 13-14 PROGRAM OBJECTIVES
FY 12-13 ACCOMPLISHMENTS> The Airport continued to operate in a safe and efficient manner.
> Gained FAA approval for a major security fencing improvement project.
PROGRAM ADOPTED ADOPTED ADOPTEDEXPENDITURES 2011-12 2012-13 2013-14
Salaries & Benefits 948,889 964,983 1,072,320Contractual Services 0 0 0Materials & Supplies 160,720 157,310 169,837Special Charges 64,881 79,794 70,712Capital Outlay 0 0 0
Total $1,174,490 $1,202,087 $1,312,869
AUTHORIZED ADOPTED ADOPTED ADOPTEDPOSITIONS 2011-12 2012-13 2013-14
Full-Time 6 6 6Part-Time 0 0 0
Full-Time Equivalent (FTE) 6 6 6
DEPARTMENT ORGANIZATION CHART, SIGNIFICANT EXPENDITURES AND STAFFING CHANGESFY 2011-2012 - Increased One (1) FTE to correctly budget the true FTE in this department.
> Successfully addressed several requlatory changes to remain in compliance.
415-6022
> Meet all TSA regulatory requirements and effectively react to security changes.
The Airport Police Department is responsible for enforcing the TSA approved Airport Security Program and all law enforcement functions within the Airport Boundaries and City of Palm Springs limits.
> Provide a high caliber of customer service to all Airport tenants and users while fully enforcing the regulations and laws.
> Support and assist the Airport Team in successfully passing the annual FAA and TSA evalutions and certifications.
Police Officer (Aviation) 2.00 FTE
Police Officer (Aviation - TSA)
4.00 FTE
6-100

AIRPORT AIRSIDE OPERATIONS
FY 13-14 PROGRAM OBJECTIVES
FY 12-13 ACCOMPLISHMENTS
PROGRAM ADOPTED ADOPTED ADOPTEDEXPENDITURES 2011-12 2012-13 2013-14
Salaries & Benefits 0 0 0Contractual Services 139,845 92,250 120,856Materials & Supplies 230,517 276,373 370,214Special Charges 136,867 103,842 165,496Capital Outlay 0 0 0
Total $507,229 $472,465 $656,566
AUTHORIZED ADOPTED ADOPTED ADOPTEDPOSITIONS 2011-12 2012-13 2013-14
Full-Time 0 0 0Part-Time 0 0 0
Full-Time Equivalent (FTE) 0 0 0
DEPARTMENT ORGANIZATION CHART, SIGNIFICANT EXPENDITURES AND STAFFING CHANGES
> Assisted in various emergency responses to assist aircraft and customers while providing the highest standards for safety.
> Continue the training standards and employee orientations regarding security and safety.
> Accommodate the planned Terminal Apron construction activity with tenants and contractors.
415-6050
> Maintain the safe and efficient operation of airport airside activities with FAA and TSA standards.
Airside Operations is responsible for the runways, taxiways, aircraft parking positions, and related facilities; i.e., airfield security roads, gates, navigational aids, wind indicators, beacon, runway lighting, pavement
6-101

AIRPORT AIRPORT RESCUE FIREFIGHTING
FY 13-14 PROGRAM OBJECTIVES
> Provide emergency response services for all airport tenants, users and general public.> Maintenance ARFF response capabilities for Index C airport 100% of the time.
FY 12-13 ACCOMPLISHMENTS
> Completed live fire training exercises per FAA Part 139 inspection for ARFF operations.
PROGRAM ADOPTED ADOPTED ADOPTEDEXPENDITURES 2011-12 2012-13 2013-14
Salaries & Benefits 1,904,282 1,953,081 2,054,900Contractual Services 24,500 9,000 4,500Materials & Supplies 485,516 509,540 528,960Special Charges 166,696 161,813 148,979Capital Outlay 5,000 5,000 5,000
Total $2,585,994 $2,638,434 $2,742,339
AUTHORIZED ADOPTED ADOPTED ADOPTEDPOSITIONS 2011-12 2012-13 2013-14
Full-Time 9 9 9Part-Time 0 0 0
Full-Time Equivalent (FTE) 9 9 9
DEPARTMENT ORGANIZATION CHART, SIGNIFICANT EXPENDITURES AND STAFFING CHANGES
415-6075
> Meet FAA Part 139 certification requirements for Palm Springs International Airport.
The Aircraft Rescue and Firefighting Department is responsible for providing all equipment and services necessary for the Airport to comply with Federal Aviation Administration Regulation Part 139.
> Completed inspections of terminal, fuel farms, fuelers and hangars.
> Contributed to the annual FAA Part 139 inspections for ARFF operations.
Fire Engineer 9.00 FTE
6-102

AIRPORT LANDSIDE OPERATIONS
FY 13-14 PROGRAM OBJECTIVES
FY 12-13 ACCOMPLISHMENTS
PROGRAM ADOPTED ADOPTED ADOPTEDEXPENDITURES 2011-12 2012-13 2013-14
Salaries & Benefits 0 0 0Contractual Services 839,339 888,864 925,225Materials & Supplies 418,981 435,817 496,646Special Charges 38,147 32,313 26,919Capital Outlay 0 0 0
Total $1,296,467 $1,356,994 $1,448,790
AUTHORIZED ADOPTED ADOPTED ADOPTEDPOSITIONS 2011-12 2012-13 2013-14
Full-Time 0 0 0Part-Time 0 0 0
Full-Time Equivalent (FTE) 0 0 0
DEPARTMENT ORGANIZATION CHART, SIGNIFICANT EXPENDITURES AND STAFFING CHANGES
> Successfully incorporated changes in commercial courtesy vehichle staging.
> Modify and improve internal procedures that will effectuate more staff interaction with the daily activities of
415-6100
> Work in consonant with Airport Police and the contracted service provider to maintain effective traffic > Improve customer services to now an even higher caliber.
The Landside Operations Department is responsible for the monitoring and enforcement of Airport Landside related activities and services including but not limited to; public parking, ground transportation, commercial
> Implemented an improved customer service training program.> Successfully transitioned the new uniform for improved appearance and professionalism.
6-103

AIRPORT AIRPORT GROUNDS MAINTENANCE
FY 13-14 PROGRAM OBJECTIVES
FY 12-13 ACCOMPLISHMENTS
PROGRAM ADOPTED ADOPTED ADOPTEDEXPENDITURES 2011-12 2012-13 2013-14
Salaries & Benefits 0 0 6,500Contractual Services 14,000 16,000 16,000Materials & Supplies 100,800 100,500 110,665Special Charges 83,281 77,058 90,250Capital Outlay 0 0 0
Total $198,081 $193,558 $223,415
AUTHORIZED ADOPTED ADOPTED ADOPTEDPOSITIONS 2011-12 2012-13 2013-14
Full-Time 8 0 0Part-Time 0 0 0
Full-Time Equivalent (FTE) 8 0 0
DEPARTMENT ORGANIZATION CHART, SIGNIFICANT EXPENDITURES AND STAFFING CHANGES
> Assist in the conversion of landside natural grass to sustainable landscape.
> Completed major surface painting projects on the airfield.
415-6175
This department is responsible for the care and maintenance of all City owned grounds within the Airport property. This includes the maintenance of pavements that are equivalent to about seventy-five miles of
> Transitioned in the Airport's first major piece of pavement maintenance equipment.> Completed the re-landscaping of a key area damaged by a major frost event.
> Continue to implement the new-improved pavement maintenance program and do so with minimal disruption to the tenants and general public.> Maintain the landscaping and grounds in a fashion that meets the standards of a "World Class"
6-104

AIRPORT TERMINAL BUILDING OPERATIONS
FY 13-14 PROGRAM OBJECTIVES
FY 12-13 ACCOMPLISHMENTS
PROGRAM ADOPTED ADOPTED ADOPTEDEXPENDITURES 2011-12 2012-13 2013-14Salaries & Benefits 2,130,917 2,278,376 2,563,102Contractual Services 220,977 215,400 274,540Materials & Supplies 1,471,399 1,447,326 1,525,329Special Charges 127,723 151,810 164,400Capital Outlay 0 0 0
Total $3,951,016 $4,092,912 $4,527,371
AUTHORIZED ADOPTED ADOPTED ADOPTEDPOSITIONS 2011-12 2012-13 2013-14
Full-Time 24.5 24.5 24.5Part-Time 0 0 0
Full-Time Equivalent (FTE) 24.5 24.5 24.5
DEPARTMENT ORGANIZATION CHART, SIGNIFICANT EXPENDITURES AND STAFFING CHANGES
> Completed several projects "in-house" and saved expenditures as opposed to outsourcing.
415-6200
> Complete more projects "in-house" to save on expenses and improve efficiency.> Develop and implement new techniques and procedures to raise caliber of custodial services.
This department is responsible for the care and maintenance of all City owned and operated facilities within the Airport. This is equivalent of about 200,000 square feet of building space that handles over two million customers annually.
> Assisted in the completion of the new advertising equipment installation.
> Successfully carry out the replacement of automatic doors, a major recarpeting and HVAC modification with no disruption to Airport operations.
> Helped identify and resolve major HVAC system malfunctions.
Airport Maintenance Superintendent
1.00 FTE
Maintenance Electrician 1.50 FTE
Senior Airport Maintenance
Technician 1.00 FTE
Maintenance Technician II
3.00 FTE
Maintenance Technician I
2.00 FTE
Maintenance Lead Worker 1.00 FTE
Maintenance Worker I
15.00 FTE
6-105

AIRPORT CONTROL CENTER OPERATIONS
FY 13-14 PROGRAM OBJECTIVES
FY 12-13 ACCOMPLISHMENTS
PROGRAM ADOPTED ADOPTED ADOPTEDEXPENDITURES 2011-12 2012-13 2013-14Salaries & Benefits 2,201,914 2,295,376 2,728,881Contractual Services 174,268 141,400 163,678Materials & Supplies 196,600 229,000 230,617Special Charges 66,668 78,996 87,294Capital Outlay 0 0 0
Total $2,639,450 $2,744,772 $3,210,470
AUTHORIZED ADOPTED ADOPTED ADOPTEDPOSITIONS 2011-12 2012-13 2013-14
Full-Time 20 20 21Part-Time 0 0 0
Full-Time Equivalent (FTE) 20 20 21
DEPARTMENT ORGANIZATION CHART, SIGNIFICANT EXPENDITURES AND STAFFING CHANGESFY 13-14 - Delete (Four) 4 FTE Airport Operations Aide positions, Add (Three) 3 Airport Operations Specialist I positions, add One (1) Airport Operations Supervisor position.
415-6225
> Worked with Airport Team to successfully complete the FAA and TSA annual certification reviews with > Earned recognition by industry through self training programs.
> Develop and implement new procedures and methods that will adequately address changes within the aviation regulatory industry.
> Continue to provide all the necessary support and coordination for airport functions necessary to remain in full compliance with TSA, FAA regulations, Title 16 and deliver a high caliber of customer service to all
This activity is responsible for the Airport Operations Center, Airport Mobile Command Post, computerized security access control systems, fingerprinting systems, alarm monitoring, radio/telephonic console and computer communication systems, closed circuit TV systems, monitors, video badging systems, fiber optics, paging station, alert "crash phone" system, computer and equipment rooms, and energy management systems.
Airport Operations Manager 1.00 FTE
Airport Security Coordinator
1.00 FTE
Airport Operations Supervisor 4.00 FTE
Airport Operations Specialist I 13.00 FTE
Airport Operations Specialist II
1.00 FTE
P/C Network Administrator (IT)
1.00 FTE
6-106
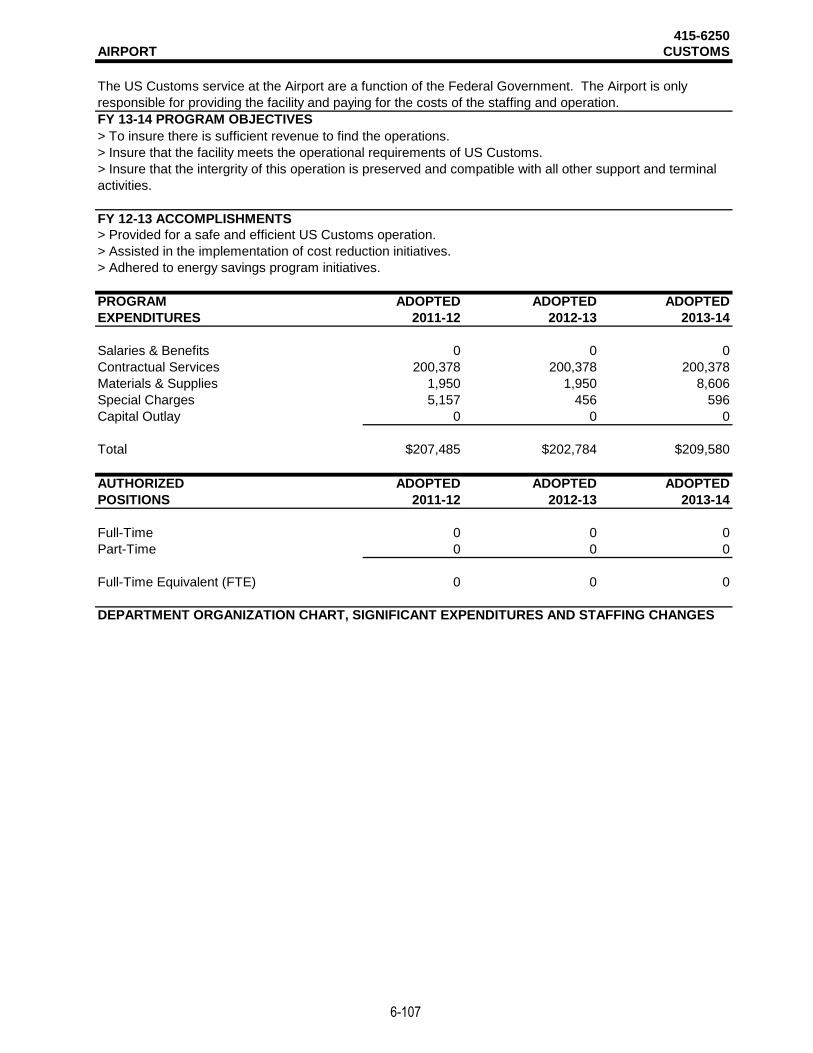
AIRPORT CUSTOMS
FY 13-14 PROGRAM OBJECTIVES
FY 12-13 ACCOMPLISHMENTS
PROGRAM ADOPTED ADOPTED ADOPTEDEXPENDITURES 2011-12 2012-13 2013-14
Salaries & Benefits 0 0 0Contractual Services 200,378 200,378 200,378Materials & Supplies 1,950 1,950 8,606Special Charges 5,157 456 596Capital Outlay 0 0 0
Total $207,485 $202,784 $209,580
AUTHORIZED ADOPTED ADOPTED ADOPTEDPOSITIONS 2011-12 2012-13 2013-14
Full-Time 0 0 0Part-Time 0 0 0
Full-Time Equivalent (FTE) 0 0 0
DEPARTMENT ORGANIZATION CHART, SIGNIFICANT EXPENDITURES AND STAFFING CHANGES
> Adhered to energy savings program initiatives.
415-6250
> To insure there is sufficient revenue to find the operations.> Insure that the facility meets the operational requirements of US Customs.
The US Customs service at the Airport are a function of the Federal Government. The Airport is only responsible for providing the facility and paying for the costs of the staffing and operation.
> Provided for a safe and efficient US Customs operation.> Assisted in the implementation of cost reduction initiatives.
> Insure that the intergrity of this operation is preserved and compatible with all other support and terminal activities.
6-107

AIRPORT AIRPORT DEVELOPMENT
FY 13-14 PROGRAM OBJECTIVES> Maximize Grant funding available for safety, security and capacity improvements.> Meet obligations to fund matching share for entitlement and sicretionary Federal Grants.> Continue to operate the airport in accordance with City's Ordinance 1693.
FY 12-13 ACCOMPLISHMENTS> Planned for and design terminal Apron project with Federal Grant funding.> Planning concepts for capacity enhancements for rental car operations in accordance with Master Plan.
PROGRAM ADOPTED ADOPTED ADOPTEDEXPENDITURES 2011-12 2012-13 2013-14
Salaries & Benefits 0 0 0Contractual Services 0 0 0Materials & Supplies 0 0 0Special Charges 0 0 0Capital Outlay 280,263 576,000 1,176,250
Total $280,263 $576,000 $1,176,250
AUTHORIZED ADOPTED ADOPTED ADOPTEDPOSITIONS 2011-12 2012-13 2013-14
Full-Time 0 0 0Part-Time 0 0 0
Full-Time Equivalent (FTE) 0 0 0
DEPARTMENT ORGANIZATION CHART, SIGNIFICANT EXPENDITURES AND STAFFING CHANGES
416-6401
The Airport Development activity is the cost center for airport development projects, including matching funds for federally funded Airport Improvement Projects (AIP).
6-108
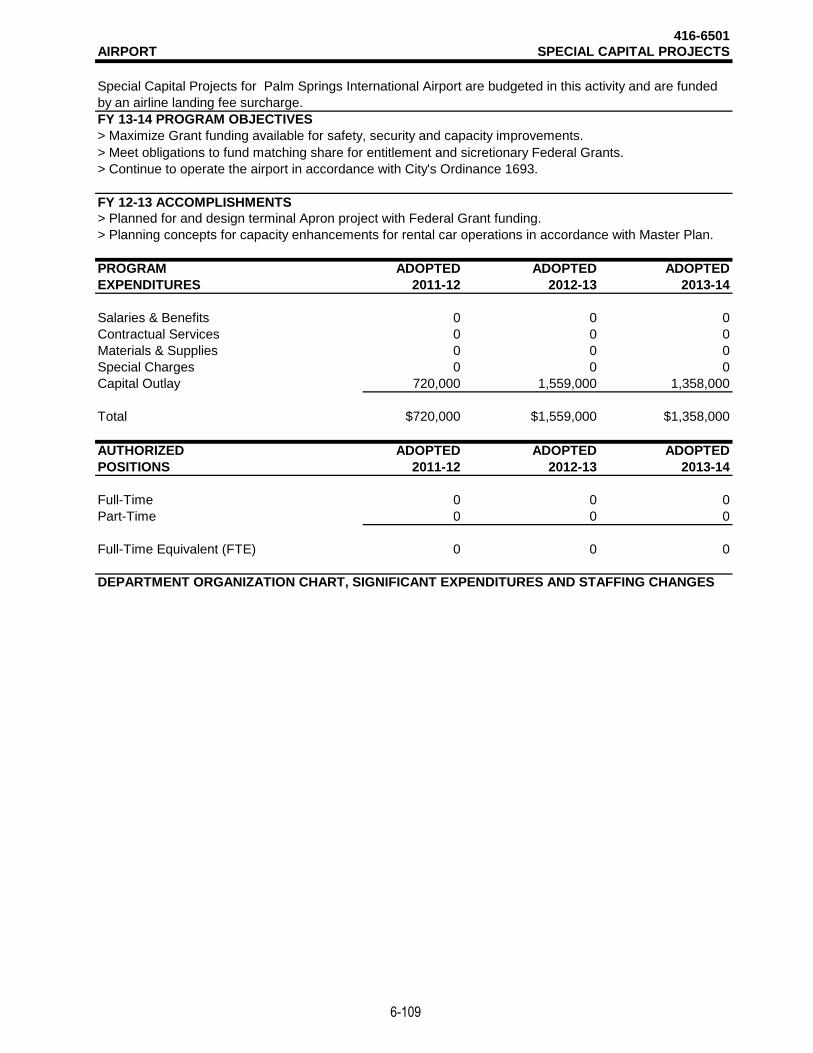
AIRPORT SPECIAL CAPITAL PROJECTS
FY 13-14 PROGRAM OBJECTIVES> Maximize Grant funding available for safety, security and capacity improvements.> Meet obligations to fund matching share for entitlement and sicretionary Federal Grants.> Continue to operate the airport in accordance with City's Ordinance 1693.
FY 12-13 ACCOMPLISHMENTS> Planned for and design terminal Apron project with Federal Grant funding.> Planning concepts for capacity enhancements for rental car operations in accordance with Master Plan.
PROGRAM ADOPTED ADOPTED ADOPTEDEXPENDITURES 2011-12 2012-13 2013-14
Salaries & Benefits 0 0 0Contractual Services 0 0 0Materials & Supplies 0 0 0Special Charges 0 0 0Capital Outlay 720,000 1,559,000 1,358,000
Total $720,000 $1,559,000 $1,358,000
AUTHORIZED ADOPTED ADOPTED ADOPTEDPOSITIONS 2011-12 2012-13 2013-14
Full-Time 0 0 0Part-Time 0 0 0
Full-Time Equivalent (FTE) 0 0 0
DEPARTMENT ORGANIZATION CHART, SIGNIFICANT EXPENDITURES AND STAFFING CHANGES
416-6501
Special Capital Projects for Palm Springs International Airport are budgeted in this activity and are funded by an airline landing fee surcharge.
6-109

AIRPORT FEDERAL GRANTS
FY 13-14 PROGRAM OBJECTIVES> Maximize Grant funding available for safety, security and capacity improvements.> Meet obligations to fund matching share for entitlement and sicretionary Federal Grants.> Continue to operate the airport in accordance with City's Ordinance 1693.
FY 12-13 ACCOMPLISHMENTS> Planned for and design terminal Apron project with Federal Grant funding.> Planning concepts for capacity enhancements for rental car operations in accordance with Master Plan.
PROGRAM ADOPTED ADOPTED ADOPTEDEXPENDITURES 2011-12 2012-13 2013-14
Salaries & Benefits 0 0 0Contractual Services 0 0 0Materials & Supplies 0 0 0Special Charges 0 0 0Capital Outlay 5,325,000 11,520,000 11,762,500
Total $5,325,000 $11,520,000 $11,762,500
AUTHORIZED ADOPTED ADOPTED ADOPTEDPOSITIONS 2011-12 2012-13 2013-14
Full-Time 0 0 0Part-Time 0 0 0
Full-Time Equivalent (FTE) 0 0 0
DEPARTMENT ORGANIZATION CHART, SIGNIFICANT EXPENDITURES AND STAFFING CHANGES
416-6601
Palm Springs International Airport applies for and receives federal grants form the FAA. This activity is the cost center for these grant funds.
6-110

WASTEWATER WASTEWATER ADMINISTRATION
FY 13-14 PROGRAM OBJECTIVES
> New Circular Primary Clarifiers with Sludge Pump Station
> New Sludge Centrifuge
> Negotiate Veolia contract extension> Continue to oversee contract and review & process payments for Operations & Maintenance.
FY 12-13 ACCOMPLISHMENTS
> Completed Electrical System Upgrade.> Repaired broken sewers on Ramon.> Oversaw contract and reviewed & processed payments for Operations and Maintenance.
PROGRAM ADOPTED ADOPTED ADOPTEDEXPENDITURES 2011-12 2012-13 2013-14
Salaries & Benefits 52,980 53,471 53,412Contractual Services 3,755,000 4,060,000 4,110,000Materials & Supplies 310,000 343,000 319,900Debt Service 0 0 0Special Charges 745,334 868,738 791,289Capital Outlay 200,000 2,000,000 1,150,000
Total $5,063,314 $7,325,209 $6,424,601
AUTHORIZED ADOPTED ADOPTED ADOPTEDPOSITIONS 2011-12 2012-13 2013-14
Full-Time 0 0 0Part-Time 0 0 0
Full-Time Equivalent (FTE) 0 0 0
DEPARTMENT ORGANIZATION CHART, SIGNIFICANT EXPENDITURES AND STAFFING CHANGESFY 2012-2013 - After review of a 20 Year Capital Repair and Rehabilitation Plan, City Council approved the funding of the Wastewater Financial Plan and Rate Study. This approval allows capital improvements to begin at the Wastewater Treatment Plan.
> Completed Performance Review.
420-6800
> Digester No. 2 Dome Replacement
> New Primary Effluent Pump Station
Wastewater Administration is responsible for the revenues and expenditures related to the administration of the City's wastewater treatment plant as it relates to all treatment, discharge, and collection requirements. This is an Enterprise fund and is not subsidized by the general operating revenues of the City and is fully privatized. The treatment plant operations were privatized in September 1999, and are managed with a contract between the City of Palm Springs and Veolia Water North America - West, LLC.
> New Headworks
6-111

GOLF COURSE RESORT GOLF COURSE MAINTENANCE & OPERATIONS
FY 13-14 PROGRAM OBJECTIVES
PROGRAM ADOPTED ADOPTED ADOPTEDEXPENDITURES 2011-12 2012-13 2013-14
Salaries & Benefits 0 0 0Contractual Services 235,815 235,815 225,000Materials & Supplies 4,117,106 4,312,198 4,286,641Special Charges 14,814 18,051 16,767Debt Service 0 0 0Capital 275,000 0 82,049Land Rental 30,746 30,746 0
Total $4,673,481 $4,596,810 $4,610,457
AUTHORIZED ADOPTED ADOPTED ADOPTEDPOSITIONS 2011-12 2012-13 2013-14
Full-Time 0 0 0Part-Time 0 0 0
Full-Time Equivalent (FTE) 0 0 0
DEPARTMENT ORGANIZATION CHART, SIGNIFICANT EXPENDITURES AND STAFFING CHANGESFY 13-14 - Budget for Overseed Equipment Lease in Capital line item.
> Provide a venue for local hotels and their guests who desire to play golf and to consistently be the leading facility within the City of Palm Springs public golf experience.
430-7021
The City built an 18-hole resort - style golf course and hired Arnold Palmer Golf Management to oversee the maintenance and operation of the facility. This activity includes salary and expenses for the Contract Administrator as well as maintenance and operational costs associated with the Resort Course.
> Operate and maintain the resort course facility at the highest possible level within the City's Financial means.
6-112

GOLF COURSE RESORT COURSE DEBT SERVICE
FY 13-14 PROGRAM OBJECTIVES
PROGRAM ADOPTED ADOPTED ADOPTEDEXPENDITURES 2011-12 2012-13 2013-14
Salaries & Benefits 0 0 0Contractual Services 0 0 0Materials & Supplies 0 0 0Debt Service 949,772 952,398 943,076Special Charges 0 0 0Capital Outlay 0 0 0
Total $949,772 $952,398 $943,076
AUTHORIZED ADOPTED ADOPTED ADOPTEDPOSITIONS 2011-12 2012-13 2013-14
Full-Time 0 0 0Part-Time 0 0 0
Full-Time Equivalent (FTE) 0 0 0
DEPARTMENT ORGANIZATION CHART, SIGNIFICANT EXPENDITURES AND STAFFING CHANGES
430-7056
> Administer and pay the City's debt obligations on a timely basis.
The City of Palm springs issued bonds in 1991 in order to build a new resort style golf course. This activity budgets for debt retirement activities.
6-113
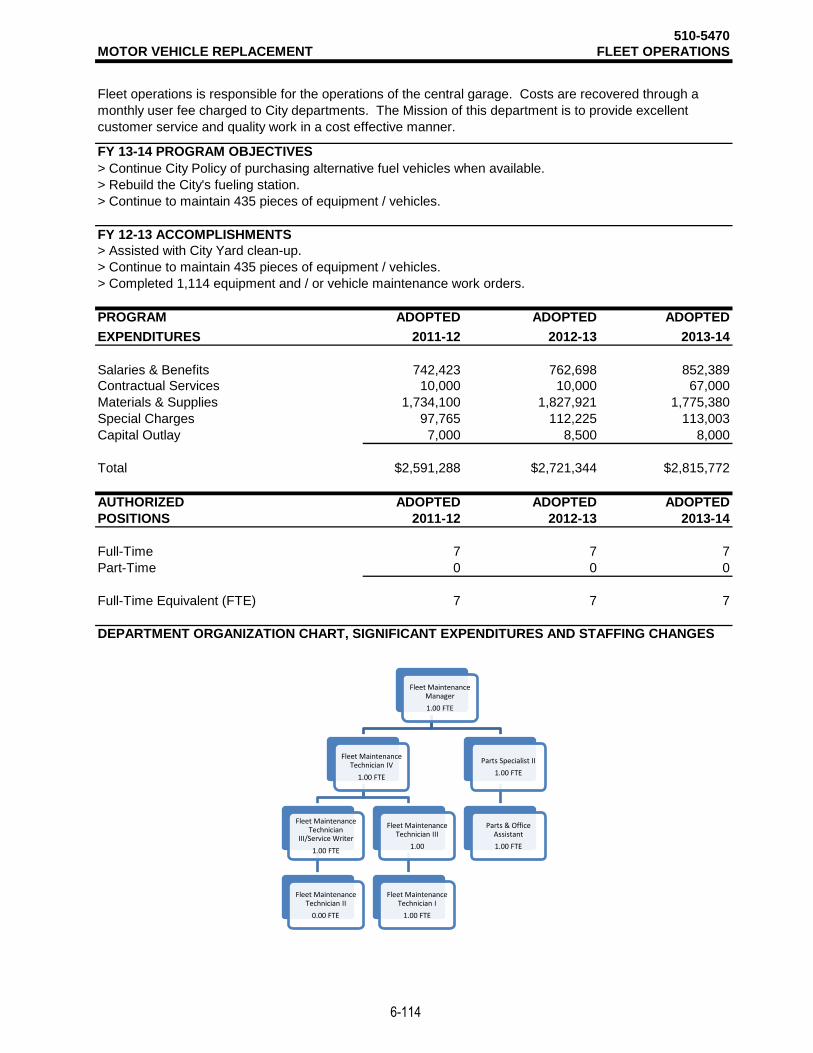
MOTOR VEHICLE REPLACEMENT FLEET OPERATIONS
FY 13-14 PROGRAM OBJECTIVES
> Continue to maintain 435 pieces of equipment / vehicles.
FY 12-13 ACCOMPLISHMENTS
> Completed 1,114 equipment and / or vehicle maintenance work orders.
PROGRAM ADOPTED ADOPTED ADOPTEDEXPENDITURES 2011-12 2012-13 2013-14
Salaries & Benefits 742,423 762,698 852,389Contractual Services 10,000 10,000 67,000Materials & Supplies 1,734,100 1,827,921 1,775,380Special Charges 97,765 112,225 113,003Capital Outlay 7,000 8,500 8,000
Total $2,591,288 $2,721,344 $2,815,772
AUTHORIZED ADOPTED ADOPTED ADOPTEDPOSITIONS 2011-12 2012-13 2013-14
Full-Time 7 7 7Part-Time 0 0 0
Full-Time Equivalent (FTE) 7 7 7
DEPARTMENT ORGANIZATION CHART, SIGNIFICANT EXPENDITURES AND STAFFING CHANGES
> Continue to maintain 435 pieces of equipment / vehicles.> Assisted with City Yard clean-up.
510-5470
> Continue City Policy of purchasing alternative fuel vehicles when available.> Rebuild the City's fueling station.
Fleet operations is responsible for the operations of the central garage. Costs are recovered through a monthly user fee charged to City departments. The Mission of this department is to provide excellent customer service and quality work in a cost effective manner.
Fleet Maintenance Manager 1.00 FTE
Fleet Maintenance Technician IV
1.00 FTE
Fleet Maintenance Technician
III/Service Writer 1.00 FTE
Fleet Maintenance Technician II
0.00 FTE
Fleet Maintenance Technician III
1.00
Fleet Maintenance Technician I
1.00 FTE
Parts Specialist II 1.00 FTE
Parts & Office Assistant 1.00 FTE
6-114

MOTOR VEHICLE REPLACEMENT MVR RESERVES
FY 13-14 PROGRAM OBJECTIVES
> Continue outfitting city vehicles to place in service.
FY 12-13 ACCOMPLISHMENTS> Purchased $1.2 million worth of replacement fleet vehicles.> Purchased 10 alternative fuel vehicles.> Outfitted 26 new vehicles to place into service.
PROGRAM ADOPTED ADOPTED ADOPTEDEXPENDITURES 2011-12 2012-13 2013-14
Salaries & Benefits 0 0 0Contractual Services 0 0 0Materials & Supplies -15,178 120,000 120,000Debt Service 255,895 275,000 275,000Special Charges 0 0 0Capital Outlay 0 36,500 60,000
Total $240,717 $431,500 $455,000
AUTHORIZED ADOPTED ADOPTED ADOPTEDPOSITIONS 2011-12 2012-13 2013-14
Full-Time 0 0 0Part-Time 0 0 0
Full-Time Equivalent (FTE) 0 0 0
DEPARTMENT ORGANIZATION CHART, SIGNIFICANT EXPENDITURES AND STAFFING CHANGES
510-5475
> Continue City Policy of purchasing alternative fuel vehicles when available.
MVR Reserve is responsible for providing vehicles for most of the City departments. Replacement costs are charged through a monthly user fee charged to City departments. The Fund is intended to be self-supporting through these Departmental assessments.
> Purchase another $1 million worth of replacement vehicles.
6-115

FACILITIES MAINTENANCE
FY 13-14 PROGRAM OBJECTIVES> Begin implementation of Chevron energy projects.> Clean air ducts at City Hall and Police Department.> Replace needed electrical system on Palm Canyon.
FY 12-13 ACCOMPLISHMENTS
> Implemented installation of new Library Materials Processing system.> Completion of 2 Emergency generator projects for fire stations.
PROGRAM ADOPTED ADOPTED ADOPTEDEXPENDITURES 2011-12 2012-13 2013-14
Salaries & Benefits 1,404,814 1,464,923 1,623,532Contractual Services 304,000 423,500 218,500Materials & Supplies 1,838,305 1,873,219 2,051,090Debt Service 0 0 0Special Charges 109,153 83,103 77,092Capital Outlay 0 0 0
Total $3,656,272 $3,844,745 $3,970,214
AUTHORIZED ADOPTED ADOPTED ADOPTEDPOSITIONS 2011-12 2012-13 2013-14
Full-Time 13.5 13.5 13.5Part-Time 0 0 0
Full-Time Equivalent (FTE) 13.5 13.5 13.5
DEPARTMENT ORGANIZATION CHART, SIGNIFICANT EXPENDITURES AND STAFFING CHANGESFY 2011-2012 - Deletion of One (1) Maintenance Electrician, Addition of One (1) Cogeneration Technicianand One (1) Maintenance Mechanic I during the budget process.
520-5641
This activity is responsible for providing administration control and quality maintenance operations for the safe and efficient use of all City-owned facilities. Operational funds are recovered through a monthly user fee charged to City departments utilizing facility maintenance services.
FACILITIES MAINTENANCE
> Cleaned-up Development Services Building / Offices after arson fire/flood, managed entire remodel effort.
Facilities Maintenance
Manager 1.00 FTE
Senior Cogeneration Technician 1.00 FTE
Cogeneration Technician 2.00 FTE
Senior Maintenance Electrician 1.00 FTE
Maintenance Electrician (HVAC)
2.00 FTE
Maintenance Electrician
.50 FTE
Senior Building Maintenance
Mechanic 1.00 FTE
Maintenance Mechanic II
1.00 FTE
Maintenance Mechanic I 2.00 FTE
Senior Secretary 1.00 FTE
Account Clerk II 1.00 FTE
6-116

EMPLOYEE RETIREMENT BENEFITS
FY 13-14 PROGRAM OBJECTIVES
> Review and explore cost saving opportunities while maintaining comprehensive benefit programs.
PROGRAM ADOPTED ADOPTED ADOPTEDEXPENDITURES 2011-12 2012-13 2013-14
Salaries & Benefits 6,000 6,000 6,000Contractual Services 1,000 2,000 3,000Materials & Supplies 10,126,915 10,297,526 11,992,034Debt Service 1,493,726 1,474,758 1,452,802Special Charges 0 0 0Capital Outlay 0 0 0Total $11,627,641 $11,780,284 $13,453,836
AUTHORIZED ADOPTED ADOPTED ADOPTEDPOSITIONS 2011-12 2012-13 2013-14Full-Time 0 0 0Part-Time 0 0 0
Full-Time Equivalent (FTE) 0 0 0
DEPARTMENT ORGANIZATION CHART, SIGNIFICANT EXPENDITURES AND STAFFING CHANGES
Listed below are the five year PERS Percentage rates from FY 2009-10 thru FY 2013-14:
Unit FY 09-10 FY 10-11 FY 11-12 FY 12-13 FY 13-14Police 33.232 33.626 39.822 41.959 43.075Fire 33.232 33.626 39.822 41.959 43.075Misc 21.906 22.910 27.430 26.800 28.494
530-5701
> Continue to provide quality service to employees for benefit programs and services.
The City is required to provide its employees with retirement benefits. Regular employees participate in the PERS retirement system. Temporary and part-time employees usually participate in the FICA/Medicare benefit package.
RETIREMENT BENEFITS
> Continue to enhance self service options and communication materials.
6-117

EMPLOYEE BENEFITS
FY 13-14 PROGRAM OBJECTIVES
> Transition electronic benefits transition to new carrier and enhance self service options.
FY 12-13 ACCOMPLISHMENTS> Successfully implemented carrier changes while maintaining coverage and reducing costs.> Enhanced communication materials and resources for employees online.> Proactive wellness and education resources provided to employees.
PROGRAM ADOPTED ADOPTED ADOPTEDEXPENDITURES 2011-12 2012-13 2013-14
Salaries & Benefits 176,775 199,114 230,550Contractual Services 38,000 25,000 25,000Materials & Supplies 6,362,271 6,833,864 7,016,953Special Charges 11,616 11,814 12,671Capital Outlay 0 0 0
Total $6,588,662 $7,069,792 $7,285,174
AUTHORIZED ADOPTED ADOPTED ADOPTEDPOSITIONS 2011-12 2012-13 2013-14
Full-Time 1.15 1.35 1.35Part-Time 0 0 0
Full-Time Equivalent (FTE) 1.15 1.35 1.35
DEPARTMENT ORGANIZATION CHART, SIGNIFICANT EXPENDITURES AND STAFFING CHANGESFY 13-14 - Deletion of One (1) FTE Human Resources Analyst. Add One (1) FTE Human Resouces Manager during budget process.
> Enhance wellness resources and programs.
540-5902
Employee Benefits is responsible for administering costs and liabilities related to health, life, dental, and disability insurance coverage paid by the City on behalf of City employees and the City operating funds. Costs are recovered via monthly charges based upon gross payroll and benefits derived from insurance coverage.
RISK MANAGEMENT
> Continue to provide quality service to employees for benefit programs and services.> Review and explore cost saving opportinuties while maintaining comprehensive benefit programs.
Director of Human Resources
.30 FTE
Human Resources Manager .20 FTE
Human Resources Specialist II
.65 FTE
Administrative Assistant .20 FTE
6-118

WORKERS COMPENSATION
FY 13-14 PROGRAM OBJECTIVES> Continue to provide quality service to employees for work related injuries and leaves.
> Review and explore cost saving opportunities while maintaining comprehensive service.
FY 12-13 ACCOMPLISHMENTS> Enhanced leave tracking to manage and control laims.> Continued successful "back to work" and "modified duty" efforts resulting in reduced loss time.> Enhanced communication materials and resources for employees online.
PROGRAM ADOPTED ADOPTED ADOPTEDEXPENDITURES 2011-12 2012-13 2013-14
Salaries & Benefits 233,308 263,263 307,457Contractual Services 0 0 0Materials & Supplies 2,536,594 2,663,421 2,741,765Special Charges 26,656 27,045 27,545Capital Outlay 0 0 0
Total $2,796,558 $2,953,729 $3,076,767
AUTHORIZED ADOPTED ADOPTED ADOPTEDPOSITIONS 2011-12 2012-13 2013-14
Full-Time 1.6 1.9 1.9Part-Time 0 0 0
Full-Time Equivalent (FTE) 1.6 1.9 1.9
DEPARTMENT ORGANIZATION CHART, SIGNIFICANT EXPENDITURES AND STAFFING CHANGES
540-5903
Workers Compensation is responsible for costs and liabilities related to the administration of City's self-insured self-administered workers' compensation insurance. Costs are recovered via monthly charges based upon gross payroll and benefits derived from insurance coverage.
RISK MANAGEMENT
> Continually strive to enhance programs to reduce work related injuries.
FY 13-14 - Deletion of One (1) FTE Human Resources Analyst. Add One (1) FTE Human Resouces Manager during budget process.
Director of Human Resources
.45 FTE
Human Resources Manager .30 FTE
Human Resources Specialist II
.85 FTE
Administrative Assistant .30 FTE
6-119

LIABILITY INSURANCE
FY 13-14 PROGRAM OBJECTIVES> Improve citywide safety and risk assessment awareness through the process of proactive loss control.
FY 12-13 ACCOMPLISHMENTS> Introduced new training programs to meet OSHA compliance City Wide.> Updated programs and polices to ensure effective complaince and training
PROGRAM ADOPTED ADOPTED ADOPTEDEXPENDITURES 2011-12 2012-13 2013-14
Salaries & Benefits 0 0 0Contractual Services 215,000 215,000 215,000Materials & Supplies 695,288 774,700 303,189Special Charges 33,924 36,299 38,000Capital Outlay 0 0 0
Total $944,212 $1,025,999 $556,189
AUTHORIZED ADOPTED ADOPTED ADOPTEDPOSITIONS 2011-12 2012-13 2013-14
Full-Time 0 0 0Part-Time 0 0 0
Full-Time Equivalent (FTE) 0 0 0
DEPARTMENT ORGANIZATION CHART, SIGNIFICANT EXPENDITURES AND STAFFING CHANGES
540-5904
> Continue to review and enhance current risk programs.
Liability Insurance accounts for costs and liabilities related to coverage for public liability insurance. Costs are recovered via monthly charges based upon gross payroll and benefits derived from insurance coverage.
RISK MANAGEMENT
6-120

PROPERTY INSURANCE
FY 13-14 PROGRAM OBJECTIVES
> Review plans for cost savings opportunities.
FY 12-13 ACCOMPLISHMENTS> Maintain effective communications to ensure enrollment accuracy.> Effectively monitored billing to verify carrier accuracy and eliminate possible coverage concerns.
PROGRAM ADOPTED ADOPTED ADOPTEDEXPENDITURES 2011-12 2012-13 2013-14
Salaries & Benefits 0 0 0Contractual Services 0 0 0Materials & Supplies 896,431 972,594 975,995Special Charges 0 0 0Capital Outlay 0 0 0
Total $896,431 $972,594 $975,995
AUTHORIZED ADOPTED ADOPTED ADOPTEDPOSITIONS 2011-12 2012-13 2013-14
Full-Time 0 0 0Part-Time 0 0 0
Full-Time Equivalent (FTE) 0 0 0
DEPARTMENT ORGANIZATION CHART, SIGNIFICANT EXPENDITURES AND STAFFING CHANGES
> Develop automation for retiree self-service and other file transfers.
540-5905
Property Insurance provides various insurance coverage on City properties. Costs are recovered via monthly charges based upon the appraised value of each facility.
RISK MANAGEMENT
> Continue to track and account for the cost of employee retiree health coverage.
6-121

UNEMPLOYMENT
FY 13-14 PROGRAM OBJECTIVES
FY 12-13 ACCOMPLISHMENTS
PROGRAM ADOPTED ADOPTED ADOPTEDEXPENDITURES 2011-12 2012-13 2013-14
Salaries & Benefits 0 0 0Contractual Services 0 0 0Materials & Supplies 402,600 252,750 252,750Special Charges 0 0 0Capital Outlay 0 0 0
Total $402,600 $252,750 $252,750
AUTHORIZED ADOPTED ADOPTED ADOPTEDPOSITIONS 2011-12 2012-13 2013-14
Full-Time 0 0 0Part-Time 0 0 0
Full-Time Equivalent (FTE) 0 0 0
DEPARTMENT ORGANIZATION CHART, SIGNIFICANT EXPENDITURES AND STAFFING CHANGES
> Maintained compliance with State and Federal requirements and reporting.
540-5919
> To fund appropriate benefits to comply with State and Federal Mandates
Unemployment provides insurance coverage paid by the City on behalf of the City's employees and the City operating funds. Costs are recovered via monthly charges based upon gross payroll and benefits derived from insurance coverage.
RISK MANAGEMENT
6-122

RETIREE HEALTH
FY 13-14 PROGRAM OBJECTIVES
> Complete automation of file transfer to carriers and PERS to eliminate duplicate entry.> Review plans for cost savings opportunities.
FY 12-13 ACCOMPLISHMENTS> Maintained effective communication to ensure enrollment accuracy.> Effectively monitored billing to verify carrier accuracy and eliminate possible coverage concerns.
PROGRAM ADOPTED ADOPTED ADOPTEDEXPENDITURES 2011-12 2012-13 2013-14
Salaries & Benefits 0 0 0Contractual Services 0 0 0Materials & Supplies 1,845,974 2,107,818 2,329,759Special Charges 0 0 0Capital Outlay 0 0 0
Total $1,845,974 $2,107,818 $2,329,759
AUTHORIZED ADOPTED ADOPTED ADOPTEDPOSITIONS 2011-12 2012-13 2013-14
Full-Time 0 0 0Part-Time 0 0 0
Full-Time Equivalent (FTE) 0 0 0
DEPARTMENT ORGANIZATION CHART, SIGNIFICANT EXPENDITURES AND STAFFING CHANGES
541-5912
> Continue to track and account for the cost of employee retiree health coverage.
Retiree Health Insurance is responsible for costs and liabilities related to the administration of City's retiree health insurance coverage.
RETIREE HEALTH INSURANCE
6-123

ENERGY ADMINISTRATION
FY 13-14 PROGRAM OBJECTIVES
PROGRAM ADOPTED ADOPTED ADOPTEDEXPENDITURES 2011-12 2012-13 2013-14
Salaries & Benefits 0 0 0Contractual Services 0 0 0Materials & Supplies 4,000 6,958 3,000Debt Service 2,000 2,000 1,000Special Charges 0 0 0Capital Outlay 0 0 0
Total $6,000 $8,958 $4,000
AUTHORIZED ADOPTED ADOPTED ADOPTEDPOSITIONS 2011-12 2012-13 2013-14
Full-Time 0 0 0Part-Time 0 0 0
Full-Time Equivalent (FTE) 0 0 0
DEPARTMENT ORGANIZATION CHART, SIGNIFICANT EXPENDITURES AND STAFFING CHANGES
550-5805
Energy Administration provides direction for the two-cogeneration plants owned by the City of Palm Springs. Costs charged to this activity are audit fees and arbitrage audit costs related to the bonds issued to build the two plants.
ENERGY
> Implement an effective Energy Management System for City Hall, Demuth Park ball field lighting, and the downtown parking lots, palm tree and decorative lighting. This system will be expanded in the future to include more facilities, parks and irrigation watering controls. The systme will reduce the energy load on the two co-generation plants, thereby reducing fuel costs associated with operating engines.
6-124

SUNRISE PLAZA COGEN
FY 13-14 PROGRAM OBJECTIVES
> Consider elimination of CoGen portion of plant in conjunction with Chevron report.
FY 12-13 ACCOMPLISHMENTS
> Recovered $70,000 in damages from SCE transformers failure.
PROGRAM ADOPTED ADOPTED ADOPTEDEXPENDITURES 2011-12 2012-13 2013-14
Salaries & Benefits 0 0 0Contractual Services 0 0 0Materials & Supplies 450,000 385,000 385,000Debt Service 133,469 133,853 85,710Special Charges 373,493 373,570 384,476Capital Outlay 0 0 0
Total $956,962 $892,423 $855,186
AUTHORIZED ADOPTED ADOPTED ADOPTEDPOSITIONS 2011-12 2012-13 2013-14
Full-Time 0 0 0Part-Time 0 0 0
Full-Time Equivalent (FTE) 0 0 0
DEPARTMENT ORGANIZATION CHART, SIGNIFICANT EXPENDITURES AND STAFFING CHANGES
> Negotiated lower costs for natural gas contract 2012-13.
550-5806
> Replace chiller.
Sunrise Plaza Cogen is responsible for accounting for the costs of the Sunrise Plaza plant located in the City. Costs are recovered through a user fee based upon electrical consumption. These fees are charged to each department on a monthly basis.
ENERGY
> Replace boiler.
> Completed normal maintanence and repairs .
6-125

MUNICIPAL COMPLEX COGEN
FY 13-14 PROGRAM OBJECTIVES
> Replace HVAC at City Hall Computer Room.
FY 12-13 ACCOMPLISHMENTS
PROGRAM ADOPTED ADOPTED ADOPTEDEXPENDITURES 2011-12 2012-13 2013-14
Salaries & Benefits 0 0 0Contractual Services 0 0 0Materials & Supplies 1,272,200 1,127,500 1,129,800Debt Service 266,938 268,085 171,430Special Charges 427,321 427,465 439,687Capital Outlay 0 0 0
Total $1,966,459 $1,823,050 $1,740,917
AUTHORIZED ADOPTED ADOPTED ADOPTEDPOSITIONS 2011-12 2012-13 2013-14
Full-Time 0 0 0Part-Time 0 0 0
Full-Time Equivalent (FTE) 0 0 0
DEPARTMENT ORGANIZATION CHART, SIGNIFICANT EXPENDITURES AND STAFFING CHANGES
> Negotiated lower costs for natural gas contracts for 2012-2013.
550-5807
> Upgrade all engines per Chevron report.
Municipal Complex Cogen is responsible for accounting for the costs of the Municipal Complex plant located in the City. Costs are recovered through a user fee based upon electrical consumption. These fees are charged to each department on a monthly basis.
ENERGY
> Investigate repair of all old underground piping.
> Completed engine repairs to keep plant running.
6-126

ENERGY DEVELOPMENT
FY 13-14 PROGRAM OBJECTIVES
FY 12-13 ACCOMPLISHMENTS
PROGRAM ADOPTED ADOPTED ADOPTEDEXPENDITURES 2011-12 2012-13 2013-14
Salaries & Benefits 0 0 0Contractual Services 0 0 0Materials & Supplies 0 0 0Debt Service 0 0Special Charges 0 0 0Capital Outlay 153,700 153,700 153,700
Total $153,700 $153,700 $153,700
AUTHORIZED ADOPTED ADOPTED ADOPTEDPOSITIONS 2011-12 2012-13 2013-14
Full-Time 0 0 0Part-Time 0 0 0
Full-Time Equivalent (FTE) 0 0 0
DEPARTMENT ORGANIZATION CHART, SIGNIFICANT EXPENDITURES AND STAFFING CHANGES
550-5812
Energy Development is responsible for accounting for the costs of investigating new energy development processes. Costs are recovered through a user fee based upon electrical consumption. These fees are charged to each department on a monthly basis.
ENERGY
> Work with Southern California Edison, the Southern California Gas Co. and the Coachella Valley Energy Task Force, to take advantage of the Sustainability Programs and the many energy saving retro-fit lighting and equipment replacement incentives being offered.
> Worked with Southern California Edison, the Southern California Gas Co. and the Coachella Valley Energy Task Force.
6-127

GPSCVB
FY 13-14 PROGRAM OBJECTIVES
PROGRAM ADOPTED ADOPTED ADOPTEDEXPENDITURES 2011-12 2012-13 2013-14
Salaries & Benefits 0 0 0Contractual Services 300,000 350,000 400,000Materials & Supplies 0 0 0Special Charges 0 0 0Capital Outlay 0 0 0
Total $300,000 $350,000 $400,000
AUTHORIZED ADOPTED ADOPTED ADOPTEDPOSITIONS 2011-12 2012-13 2013-14
Full-Time 0 0 0Part-Time 0 0 0
Full-Time Equivalent (FTE) 0 0 0
DEPARTMENT ORGANIZATION CHART, SIGNIFICANT EXPENDITURES AND STAFFING CHANGESFY 12-13 - Name change to Greater Palm Springs Convention and Visitors Bureau.
001-2101
> The GPSCVB is dedicated to promoting the eight cities of the Palm Springs Desert Resorts to
City of Palm Springs is a member of the Greater Palm Springs Convention and Visitors Bureau and the Coachella Valley Association of Governments. GPSCVB receives 0.06% of all taxable hotel room rentals (1.4% of taxable hotel room rentals from group meeting hotels).
CONTRACTUAL OBLIGATIONS
visitors planning a desert getaway to the Palm Springs, California area.
6-128

INTERNATIONAL FILM FESTIVAL
FY 13-14 PROGRAM OBJECTIVES
PROGRAM ADOPTED ADOPTED ADOPTEDEXPENDITURES 2011-12 2012-13 2013-14
Salaries & Benefits 0 0 0Contractual Services 350,000 350,000 350,000Materials & Supplies 0 0 0Special Charges 0 0 0Capital Outlay 0 0 0
Total $350,000 $350,000 $350,000
AUTHORIZED ADOPTED ADOPTED ADOPTEDPOSITIONS 2011-12 2012-13 2013-14
Full-Time 0 0 0Part-Time 0 0 0
Full-Time Equivalent (FTE) 0 0 0
DEPARTMENT ORGANIZATION CHART, SIGNIFICANT EXPENDITURES AND STAFFING CHANGESAll 112 fund departments have new department numbers but the department titles remain the same.This department was 112-2020 and is now 001-2120 - Event Sponsorship.
001-2120
>Review financial and statistical reports prepared by the Film Festival.
The City of Palm Springs helps sponsor the annual Film Festival. The City has made a commitment to the Film Festival committee to contribute $350,000 a year for fiscal year 2013-2014.
CONTRACTUAL OBLIGATIONS
6-129

CONVENTION CENTER
FY 13-14 PROGRAM OBJECTIVES
FY 12-13 ACCOMPLISHMENTS
PROGRAM ADOPTED ADOPTED ADOPTEDEXPENDITURES 2011-12 2012-13 2013-14
Salaries & Benefits 0 0 0Contractual Services 1,894,258 1,930,790 1,830,816Materials & Supplies 152,500 252,000 372,000Debt Service 4,511,263 4,344,526 4,339,301Special Charges 287,003 306,586 246,873Leases 0 0 0
Total $6,845,024 $6,833,902 $6,788,990
AUTHORIZED ADOPTED ADOPTED ADOPTEDPOSITIONS 2011-12 2012-13 2013-14
Full-Time 0 0 0Part-Time 0 0 0
Full-Time Equivalent (FTE) 0 0 0
DEPARTMENT ORGANIZATION CHART, SIGNIFICANT EXPENDITURES AND STAFFING CHANGESAll 112 fund departments have new department numbers but the department titles remain the same.This department was 112-2080 and is now 001-2180 - Convention Center.
> As history, the $62.4 million Convention Center bond issue was completed in May 2004. It refinanced about $11.3 million in existing bonds and provided about $47.5 million for a major 115,000 square foot expansion of the Center. The Convention Center was completed in August 2005.
001-2180
The City of Palm Springs contracts with SMG to manage and operate the Palm Springs Convention Center.
CONTRACTUAL OBLIGATIONS
> To continue to host a variety of meetings, conventions, exhibitions, special events and trade shows, bringing tourism to the city.
6-130

PLAZA THEATRE
FY 13-14 PROGRAM OBJECTIVES
PROGRAM ADOPTED ADOPTED ADOPTEDEXPENDITURES 2011-12 2012-13 2013-14
Salaries & Benefits 0 0 0Contractual Services 0 0 26,500Materials & Supplies 0 0 12,200Debt Service 0 0 0Special Charges 0 0 15,190Leases 0 0 0
Total $0 $0 $53,890
AUTHORIZED ADOPTED ADOPTED ADOPTEDPOSITIONS 2011-12 2012-13 2013-14
Full-Time 0 0 0Part-Time 0 0 0
Full-Time Equivalent (FTE) 0 0 0
DEPARTMENT ORGANIZATION CHART, SIGNIFICANT EXPENDITURES AND STAFFING CHANGESFY 2010-2011 The Community Promotion Fund was combined with the General Fund in this fiscal year.All 112 fund departments have new department numbers but the department titles remain the same.This department was 112-2080 and is now 001-2180 - Convention Center.FY 2011-2012 - New Fund and Department for this fiscal year.
001-2197CONTRACTUAL OBLIGATIONS
This department has been created in part to preserve the ownership of those assets in the Community's inventory in the face a determined efforts by Governor and the Legistature to eliminate redevelopment in California.
> To effectively manage a number of properties which had scheduled improvements by the Agency or capital projects underway that would have furthered the elimination of blight and effectuation of the Implementation Plan in the two merged Project Areas. These areas include - the Cork n Bottle, the Plaza Theater, Casa del Camino Property, Our Lady of Solitude Catholic Church Parking lot, Frances Stevens Park, Downtown Parking Garage, Village Green, Palm Springs Vistors Center and Palm Springs Entry sign.
6-131

CITY LEASED PROPERTY
FY 13-14 PROGRAM OBJECTIVES
PROGRAM ADOPTED ADOPTED ADOPTEDEXPENDITURES 2011-12 2012-13 2013-14
Salaries & Benefits 0 0 0Contractual Services 20,000 20,000 0Materials & Supplies 48,220 48,220 0Debt Service 0 0 0Special Charges 19,676 22,266 0Leases 0 0 0
Total $87,896 $90,486 $0
AUTHORIZED ADOPTED ADOPTED ADOPTEDPOSITIONS 2011-12 2012-13 2013-14
Full-Time 0 0 0Part-Time 0 0 0
Full-Time Equivalent (FTE) 0 0 0
DEPARTMENT ORGANIZATION CHART, SIGNIFICANT EXPENDITURES AND STAFFING CHANGESAll 112 fund departments have new department numbers but the department titles remain the same.This department was 112-2080 and is now 001-2180 - Convention Center.FY 2011-2012 - New Fund and Department for this fiscal year.Fy 2013-14 - This activity moved to the General Fund. See Plaza Theatre 2197
113-2199CONTRACTUAL OBLIGATIONS
This department has been created in part to preserve the ownership of those assets in the Community's inventory in the face a determined efforts by Governor and the Legistature to eliminate redevelopment in California.
> See New Department in General Fund - 001-2197.
6-132

7-1
COMMUNITY REDEVELOPMENT AGENCY PROGRAM SUMMARY
The Palm Springs Community Redevelopment Agency was created in 1973 for the purpose of improving, upgrading and revitalizing areas within the City that had become blighted becauseof deterioration, disuse, and unproductive economic conditions. Until February 1, 2012, the Agency was a legal and separate public body, with separate powers and a separate budget from the City. It was composed of the five City Council members who acted as Agency Board members. The City Manager served as Executive Director.
MissionTo enhance and improve the quality of life and to promote positive growth in the City of PalmSprings. Over the life of the Agency, this was accomplished by facilitating retail, hotel, cultural arts, housing and other projects that eliminated blight and produced tax revenue and jobs benefiting all city residents.
Agency PurposeThe purpose of the Agency under California Redevelopment Law was to remove blight. Generally, the definition included physical deterioration, lack of economic vitality, increases in negativesocial trends such as crime, aging infrastructure, and high business vacancies.
These blighting factors were typically addressed and resolved by cities in California formingredevelopment project areas within the City and by investing the property tax increment generated by the development back into the area.
Redevelopment was one of the last economic development tools for local government in California. Agencies were created by their City Councils, which acted as the local governing body, and whichhad the financial authority and means to reverse deteriorating trends and create a new image for the City.
Given the dissolution of redevelopment agencies in California, there are no proposed activitiesin the Redevelopment Agency. Authority has been shifted to the Successor Agency and the Oversight Board, under supervision of the California Department of Finance.

7-2
SUCCESSOR AGENCY PROGRAM SUMMARY
> Dissolution of Redevelopment in Californnia under AB 1X 26.
Under the Law, all accounts of the former Redevelopment Agency (RDA) transfer to theSuccessor Agency. To preserve the limited liability of the Successor Agency provided inAB1X 26, the Successor Agency holds all former RDA accounts separately from its other.
In January 2011, the Governor proposed ending the 425 local redevelopment agencies in California, in a move to secure $1.7 billion in local property taxes to be used to patch the State's $25 billion budget deficit. The Legistature passed AB1X 26, which was intended to abolish redevelopment agencies by October 1, 2011: it required that all agency activities be terminated, except for the implementation of existing obligations.
The unwinding of a redevelopment agency would be overseen by a successor entity designed to liquidate the Agency's assets as rapidly as possible. This bill and the related AB1X 27 were challenged by the California Redevelopment Association and the League of California Cities.
On December 29, 2011, the California Supreme Court upheld AB1X 26, which dissolves all of the redevelopment agencies in the State, and struck down AB1X 27, which allowed redevelopment agencies to remain in existence if such agency opted to a "Voluntary Alternative Redevelopment Program" ("VARP")
In the California Supreme Court decisions, the date of dissolution was moved from October 1, 2011 to February 1, 2012.

7-3
All 851COMMUNITY REDEVELOPMENT AGENCY MERGED AREA #1
FY 13-14 PROGRAM OBJECTIVES
PROGRAM ADOPTED ADOPTED ADOPTEDEXPENDITURES 2011-12 2012-13 2013-14
Administration 883,518 0 0Pass- Through Payments 7,840,752 0 0Project Development Costs 400,000 0 0Principal 1,906,785 0 0Interest Expense & Agent Fees 2,737,838 0 0
Total $13,768,893 $0 $0
AUTHORIZED ACTUAL ADOPTED ADOPTEDPOSITIONS 2011-12 2012-13 2013-14
Full-Time 1.3 0 0Part-Time 0 0 0
Full-Time Equivalent (FTE) 1.3 0 0
SIGNIFICANT EXPENDITURES AND STAFFING CHANGES
> Merged Area #1 no longer exists as an active project fund, due to the dissolution of the Agency.
811-8191
This activity report covers the capital, administration, and debt service activities for these merged projects. In Fiscal Year 2000-2001 the project areas covering the Central Business District, South Palm Canyon, Ramon Bogie, Oasis, North Palm Canyon, Highland Gateway, and Project Area #9, were restructured under one fund and identified as Merged Area #1, (Fund 811). The debt corresponding to these projects was also restructured under one fund identified as Merged Area #1 - Debt Service (Fund 851).

7-4
All 852COMMUNITY REDEVELOPMENT AGENCY MERGED AREA #2
FY 13-14 PROGRAM OBJECTIVES
PROGRAM ACTUAL ADOPTED ADOPTEDEXPENDITURES 2011-12 2012-13 2013-14
Administration 419,472 0 0Pass- Through Payments 4,068,722 0 0Project Development Costs 400,000 0 0Principal 886,318 0 0Interest Expense & Agent Fees 1,274,138 0 0
Total $7,048,650 $0 $0
AUTHORIZED ACTUAL ADOPTED ADOPTEDPOSITIONS 2011-12 2012-13 2013-14
Full-Time 1.3 0 0Part-Time 0 0 0
Full-Time Equivalent (FTE) 1.3 0 0
SIGNIFICANT EXPENDITURES AND STAFFING CHANGES
812-8192
This activity report covers the capital, administration, and debt service activities for these merged projects. In Fiscal Year 2000-2001 the project areas covering Tahquitz Andreas, Baristo-Farrell, and Canyon Project were restructured under one fund and identified as Merged Area #2, (Fund 812). The debt corresponding to these projects was also restructured under one fund identified as Merged Area #2 - Debt Service (Fund 852).
> Merged Area #2 no longer exists as an active project fund, due to the dissolution of the Agency.

7-5
COMMUNITY REDEVELOPMENT AGENCY LOW & MODERATE HOUSING
FY 13-14 PROGRAM OBJECTIVES
PROGRAM ACTUAL ADOPTED ADOPTEDEXPENDITURES 2011-12 2012-13 2013-14Administration 394,516 0 0Pass- Through Payments 0 0 0Project Development Costs 2,069,000 0 0Principal 270,000 0 0Interest Expense & Agent Fees 195,593 0 0Total $2,929,109 $0 $0
AUTHORIZED ACTUAL ADOPTED ADOPTEDPOSITIONS 2011-12 2012-13 2013-14Full-Time 1.7 0 0Part-Time 0 0 0
Full-Time Equivalent (FTE) 1.7 0 0
SIGNIFICANT EXPENDITURES AND STAFFING CHANGES
882-8382
Under Redevelopment Law, twenty percent (20%) of the revenues from the Redevelopment Agency were set aside for the development and preservation of housing for Low- and Moderate-Income households. This fund also includes the debt service activity. Under the dissolution of Redevelopment Agencies under AB 1X 26, the 20% setaside is no longer made into the Low and Moderate Income Housing Fund, and existing fund balances as of February 1, 2012 are expected to be remitted to the County for distribution to other taxing entities. On January 4, 2012, the City Council elected to have the City assume all the rights, powers, assets, liabilities, duties, and obligations associated with the housing activities of the Agency in accordance with Cal. Health and Safety Code §34176.
> Low and Moderate Income Housing no longer exists as an active project fund, due to the dissolution of the Agency.

7-6
SUCCESSOR AGENCY MERGED #1 CAP SUCCESSOR
FY 13-14 Program Objectives> Continue the dissolution activities of the former Redevelopment Agency.
FY 12-13 Accomplishments
> Completed the State Controller's Office Audit of all Assets and the Asset Transfer Report.
> Filed suit against the DOF for denying the enforceablity of that itemPROGRAM ADOPTED ADOPTED ADOPTEDEXPENDITURES 2011-12 2012-13 2013-14
Administration 0 326,456 250,000Pass- Through Payments 0 0 0Project Development Costs 0 0 0Principal 0 0 0Interest Expense & Agent Fees 0 7,500 0
Total $0 $333,956 $250,000
AUTHORIZED ACTUAL ADOPTED ADOPTEDPOSITIONS 2011-12 2012-13 2013-14
Full-Time 0 1 0.75Part-Time 0 0 0
Full-Time Equivalent (FTE) 0 1 0.75
SIGNIFICANT EXPENDITURES AND STAFFING CHANGES
870-8501
FY 13-14 - Reallocation of .05 FTE increase to Director of Community & Economic Development, decrease of .20 FTE to Economic Development / Downtown Administrator, decrease of .10 FTE Redevelopment Coordinator.
> Completed and submitted the ROPS to the Oversight Board and California Department of Finance for approval. > Completed the Housing Asset Transfer Report, the Housing Funds Due Diligence Review and Other Funds Due Diligence Review.
> Remitted the unencumbered Housing Fund Balance to the County, less $1,500,000 already expended on an enforceable Housing obligation.
This Department is responsible for the administration and management of funds after the dissolution of the City of Palm Springs Redevelopment Program.
Director of Community & Economic Development
.25 FTE
Economic Development/Downtown
Administrator .20 FTE
Redevelopment Coordinator
.30 FTE

7-7
SUCCESSOR AGENCY MERGED #2 CAP SUCCESSOR
FY 13-14 Program Objectives> Continue the dissolution activities of the former Redevelopment Agency.
FY 12-13 Accomplishments> See Merged Area #1 CAP sheet
PROGRAM ADOPTED ADOPTED ADOPTEDEXPENDITURES 2011-12 2012-13 2013-14
Administration 0 170,767 0Pass- Through Payments 0 0 0Project Development Costs 0 0 0Principal 0 0 0Interest Expense & Agent Fees 0 5,000 0
Total $0 $175,767 $0
AUTHORIZED ACTUAL ADOPTED ADOPTEDPOSITIONS 2011-12 2012-13 2013-14
Full-Time 0 1 0.75Part-Time 0 0 0
Full-Time Equivalent (FTE) 0 1 0.75
SIGNIFICANT EXPENDITURES AND STAFFING CHANGES
871-8502
Note: This department was combined with Merged #1 Cap Successor in FY 13-14. Allocated Positions remain here in FY 13-14 but will be moved to Merged #1 Cap Successor in FY 14-15. Change occurred after Allocated Positions Schedule was approved for FY 13-14.
This Department is responsible for the administration and management of funds after the dissolution of the City of Palm Springs Redevelopment Program.
Director of Community & Economic Development
.25 FTE
Economic Development/Downtown
Administrator .20 FTE
Redevelopment Coordinator
.30 FTE

7-8
SUCCESSOR AGENCY SUCCESSOR DEBT #1
FY 13-14 Program Objectives> Continue the dissolution activities of the former Redevelopment Agency.
FY 12-13 Accomplishments> See Merged Area #1 CAP sheet
PROGRAM ADOPTED ADOPTED ADOPTEDEXPENDITURES 2011-12 2012-13 2013-14
Principal 0 460,000 485,000Interest Expense & Agent Fees 0 2,631,756 2,583,321Loan Repayments 0 25,973 0Capital 0 1,314,000 2,740,000
Total $0 $4,431,729 $5,808,321
AUTHORIZED ACTUAL ADOPTED ADOPTEDPOSITIONS 2011-12 2012-13 2013-14
Full-Time 0 0 0Part-Time 0 0 0
Full-Time Equivalent (FTE) 0 0 0
SIGNIFICANT EXPENDITURES AND STAFFING CHANGES
872-8511 thru 8517
This Department is responsible for the administration and management of funds after the dissolution of the City of Palm Springs Redevelopment Program.

7-9
SUCCESSOR AGENCY SUCCESSOR DEBT #2
FY 13-14 Program Objectives> Continue the dissolution activities of the former Redevelopment Agency.
FY 12-13 Accomplishments> See Merged Area #1 CAP sheet
PROGRAM ADOPTED ADOPTED ADOPTEDEXPENDITURES 2011-12 2012-13 2013-14
Principal 0 310,000 325,000Interest Expense & Agent Fees 0 1,146,963 1,106,306Leases 0 122,892 122,892
Capital 0 305,000 0
Total $0 $1,884,855 $1,554,198
AUTHORIZED ACTUAL ADOPTED ADOPTEDPOSITIONS 2011-12 2012-13 2013-14
Full-Time 0 0 0Part-Time 0 0 0
Full-Time Equivalent (FTE) 0 0 0
SIGNIFICANT EXPENDITURES AND STAFFING CHANGES
873-8518 thru 8520
This Department is responsible for the administration and management of funds after the dissolution of the City of Palm Springs Redevelopment Program.

7-10
SUCCESSOR AGENCY HOUSING SUCCESSOR
FY 13-14 Program Objectives> Continue the dissolution activities of the former Redevelopment Agency.> Continue to monitor the affordability of units produced under the former RDA Housing Program> Work with owners of Low-Mod units on compliance and housing issues.
FY 12-13 Accomplishments> Facilitated refinancing of Sahara Mobile Home Park and Tahquitz Court Apartments.
PROGRAM ADOPTED ADOPTED ADOPTEDEXPENDITURES 2011-12 2012-13 2013-14
Administration 0 201,179 201,179Pass- Through Payments 0 0 0Project Development Costs 0 0 0Principal 0 0 0Interest Expense & Agent Fees 0 0 0
Total $0 $201,179 $201,179
AUTHORIZED ACTUAL ADOPTED ADOPTEDPOSITIONS 2011-12 2012-13 2013-14
Full-Time 0 1.7 1.9Part-Time 0 0 0
Full-Time Equivalent (FTE) 0 1.7 1.9
SIGNIFICANT EXPENDITURES AND STAFFING CHANGESFY 13-14 - Addition of .20 FTE Redevelopment Coordinator during the FY 13-14 Budget proces
874-8530
This Department is responsible for the administration and management of funds after the dissolution of the City of Palm Springs Redevelopment Program.
> Complete the remodel of Nightengale Manor in cooperation with Riverside County and Jewish Family Services.
> Completed remodel of Nightengale Manor into permanent supportive housing for formerly homeless.
Director of Community & Economic
Development .30 FTE
Community Development Administrator
.50 FTE
Redevelopment Coordinator
.20 FTE
Housing Program Assistant II
.90 FTE

7-11
SUCCESSOR AGENCY SUCCESSOR AGENCY DEBT SERVICE
FY 13-14 Program Objectives> Continue the dissolution activities of the former Redevelopment Agency.
PROGRAM ADOPTED ADOPTED ADOPTEDEXPENDITURES 2011-12 2012-13 2013-14
Principal 0 280,000 295,000Interest Expense & Agent Fees 0 181,368 167,527Loan Repayments 0 0 0Capital 0 0 0
Total $0 $461,368 $462,527
AUTHORIZED ACTUAL ADOPTED ADOPTEDPOSITIONS 2011-12 2012-13 2013-14
Full-Time 0 0 0Part-Time 0 0 0
Full-Time Equivalent (FTE) 0 0 0
SIGNIFICANT EXPENDITURES AND STAFFING CHANGES
879-8536
This Department is responsible for the administration and management of funds after the dissolution of the City of Palm Springs Redevelopment Program.

8-1
CAPITAL IMPROVEMENT PLAN (CIP) PROGRAM SUMMARY
Summary:
The Capital Budget authorizes and provides the basis for control of expenditures for the acquisition and construction of capital facilities. It is the intent of the Finance Department and City Management to have capital improvement projects completed within the scope provided by capital improvement funds. As capital improvements projects are completed, the facilities are funded in the Operating Budget. The 2013-14 City capital budget, including transfers out, totals $3,275,078 and includes projects in such programs as city facilities, street overlays, parks, traffic, and drainage.
Policy:
Capital Projects Funds are used to account for the purchase or construction of major capital facilities which are not financed by Proprietary Funds or Trust Funds. Although Capital Project Funds may be used for the acquisition of furniture, fixtures, machinery, and equipment; these funds are usually reserved for major facility construction and improvements or may be used for individual items that together form a larger project expenditure group.
Capital assets (including infrastructure) greater than $5,000 are capitalized and recorded at cost or at the estimated fair value of the assets at the time of acquisition where records have not been maintained. Contributed capital assets are valued at their estimated fair market value at the date of the contribution. The costs of normal maintenance and repairs that do not add to the value of the asset or materially extend asset lives are not capitalized. Items that are usually placed in the Capital Projects funds normally have costs in excess of the $15,000 to $20,000 range.
Capital assets which may include public domain (infrastructure) general capital assets, cover certain improvements such as roads, bridges, curbs and gutters, streets and sidewalks, medians, sewer and storm drains.
The City's Capital Improvement Plan (CIP) indentifies each proposed project, the year the project starts, and the proposed method of financing. The City will actively pursue grant and other outside funding sources for all capital improvement projects.
Depreciation has been provided using the straight-line method over the estimated useful life of the asset in the government-wide financial statements and in the fund financial statement of the proprietary funds.
Interest is capitalized on proprietary fund assets acquired with tax-exempt debt. The amount of interest to be capitalized is calculated by offsetting interest expense incurred from the date of the borrowing until completion of the project with interest earned on invested proceeds over the same period.
Revenue Sources:
General Capital Improvement Fund (Fund 261) - Projects identified under this fund cover general City improvements and receive their funding from a Transfer-in from the General Fund, Utility Users Tax, Technology Enhancement Fees, Developer Fees and various Grants. Due to the severe economic conditions occurring in FY 08-09 and continuing into FY 13-14, the FY 13-14 General Fund Transfer-in to the Capital Fund was not made. It is hoped that conditions will improve to allow the City to begin making the transfer again soon. Historical note: Prior to FY 03-04, the City practice has been to allocate 19% of sales tax revenue to assist in the funding of general city capital improvement projects (CIP); however, to help reduce the deficit, this allocation was reduced to 5% in FY 03-04 and to no (0%) sales tax dedication for FY 04-05. Starting in FY 05-06 the funding for general city capital projects came directly as a $400,000 Transfer-in from the General Fund instead of an off-set from sales tax. This was done so that sales tax would start being recorded as "actual amounts received" versus an adjustment figure net of a % transferred to capital. The $400,000 value was a match to the last 5% contribution amount presented in FY 03-04. It was hoped that as revenue improved higher levels would be made in the outgoing years. In FY 08-09 the transfer had climbed to $552,500 before being impacted, once again, by poor economic conditions. As an additional general fund cost saving measure, the $400,000 Measure Y transfer was not made in FY 09-10 and will also not be made in FY 10-11. Historical note: The annual $400,000 transfer was supported by the Utility Users Tax and was approved by voters in November 1999 as Measure Y. When economic conditions permitted, this $400,000 transfer was used to cover additional Parks, Recreation and Library projects. As we continue to come back slowly no transfer was made for this fund in FY 13-14.

8-2
CAPITAL IMPROVEMENT PLAN (CIP) PROGRAM SUMMARY
Revenue Sources (continued):
General Capital Improvement Fund (Fund 261) (Continued)
The other Fund 261 revenue sources of Technology Enhancement Fees, Developer Fees, and various Grants vary depending upon level of development activity and availability of various grant resources in each fiscal year.
Gas Tax Fund (Fund 133) - Projects under this fund cover street maintenance and street improvements only. The revenue is received from the State of California and other sources.
Measure A Improvements Fund (Fund 134) - Projects under this fund cover street maintenance and street improvements only. The revenue is received from the State of California from a special 1/2% sales tax.
Drainage Construction Fund (Fund 135) - Revenue is received from fees assessed on new construction for the purpose of building and maintaining a drainage and flood control system within the City.
Parking Fund (Fund 132) - A General Fund supported bond issue and minor miscellaneous. Parking revenue provided funding for various City parking lots and the downtown parking structure built during FY 01-02 & FY 02-03.
Quimby Act Fees (Fund 152) - Revenue is received from Quimby Act Park Fees which are intended to pay for future park and recreational facilities. As funding dollars are not always known, these projects are often not budgeted or identified until actual dollars are received.
Airport Fund/Federal Grants (Fund 416) - Revenue is received from Federal Grants (FAA) and used to rehabilitate and remodel the Palm Springs International Airport.
Wastewater Treatment Fund (Fund 420) - Revenue for this fund is not subsidized by general operating revenues of the City and is fully privatized. The treatment plant operations were privatized in September 1999, and are managed with a contract between the City of Palm Springs and Veolia Water North America - West, LLC.
Airport Fund/Special Capital Projects (Fund 416) - Special Capital Projects funding for the Palm Springs International Airport is used for capital projects related to the airport. Revenue is received from an airline landing fee surcharge. This includes equipment purchases, crack filling, furniture, fixtures and equipment for the new hold rooms, public parking control gates, road way finding signage and terminal furniture replacement.
Golf Course Fund (Fund 430) - The City operates two 18-hole golf facilities. Century Golf oversee the operations of the facility. This activity includes expenses for the Contract Administrator as well as maintenance and operational costs associated with the original City Course and the Resort Course.
Measure J 1% Sales Tax (Fund 260) - On November 8, 2011 Palm Springs voters approved Measure J, a local revenue measure to maintain local community services and economically revitalize our Downtown. Measure J is a 1% sales tax increase.

8-3
CAPITAL IMPROVEMENT PLAN (CIP) PROGRAM DETAIL
Fund 261 Fund 133 Fund 134 Fund 135 TotalNAME OF PROJECTS & REVENUE SOURCES Capital Gas Measure Drainage CIP
Improve Tax A All Plan
General Fund Transfers ($0.00) *
Measure Y Revenue- Parks ($0.00) : *
Measure Y Revenue - Library ($0.00) : *
Auditing (Required) 1,650Residential Traffic Speed Reduction 116,468Prop 42 Replacement 679,960
Asphalt Overlay (Slurry Seal) 712,076Mid-Valley Parkway (Reimbursement) 10,422Burb & Gutter - Citywide 50,000Bogert Trail Bridge Repair 601,502SB 821 Sidewalk 13-14 30,000Pavement Condition Survey 250,000North Indian Avenue Street Improvements 200000
Drainage Programs 23,000
TOTAL CAPITAL PROJECTS 0 798,078 1,854,000 23,000 2,675,078
Transfers Out: To General Fund for Street Maintenance 600,000 600,000
TOTAL CAPITAL PROJECTS INCLUDING PROJ. COVERED BY TRANSFERS OUT 0 1,398,078 1,854,000 23,000 3,275,078
The 2013-2014 City Capital Budget, including transfers out, totals $2,889,999 and may include such projects as city facilities, parks, streets overlays, traffic and drainage.
*As part of the general fund deficit reduction measures General Fund transfers to the Capital Fund and Measure Y departments were not made for FY 13-14.

8-4
CAPITAL IMPROVEMENT PLAN (CIP) ENTERPRISE FUNDSFund 420 Fund 430
Fund 416 Wastewater GolfNAME OF PROJECTS Airport Treatment Course
1 AIP 46 - (includes matching revenue) * 145,7502 AIP 50 - (includes matching revenue) ** 12,793,0003 Main Terminal Restrooms 8,0004 Internet Education Training - IET - PC Purchase 8,0005 Ground Transportation Restroom Repair & Flooring 10,0006 Flight Information Displays - FIDS Monitor Replacement 10,0007 Roofing at Trash Compactor Area 10,0008 VIP Roofing Project 15,0009 Annual Crackfilling Program 20,00010 Bono Concrete Repairs 25,00011 Halon Fire Supression IT Equipment Room 35,00012 Siemens Equipment Replacement 37,00013 Security Equipment DVR 46,00014 Evaporative Cooler 60,00015 Fire Oxygen Equipment (% of system equipment) 60,00016 Vehicle Replacement (2 Maintenance Vehicles) 89,00017 Common Use Equipment (CUTE) - Terminal Project 90,00018 USO Renovations 135,00019 Parking Capacity Improvement (capacity, paving, signage, equipment) 500,00020 Unscheduled Capital Programs 200,000 600,00021 Digester Dome 200,00022 Sludge Centrifuge 350,00023 Golf Capital Improvements - Overseed Equipment Lease 82,049
24 SUB TOTAL 14,296,750 1,150,000 82,049
25 TOTAL CAPITAL PROJECTS 14,296,750 1,150,000 82,049Transfers Out:
26 To General Fund
27 AMOUNT PROVIDED BY FEDERAL GRANT 11,762,500
28 AMOUNT PROV. BY FUND REVENUES OR RESERVES 2,534,250 1,150,000 82,049
* Master Plan Envirnomental ($132,500 + $13,250 matching Revenue = $145,750)** Construction Terminal Apron ($11,630,000 + $1,163,000 matching Revenue = $12,793,000)

8-5
CAPITAL IMPROVEMENT CIP MEASURE J FUNDS
Revenues & Transfers In Other Revenue $0 Interfund Transfer In from General Fund 9,300,000 Total Revenues & Transfers In $9,300,000
Expenditures & Transfers Out Capital Projects - TBD * 6,100,000 Interfund Transfer Out to Debt Service Fund ** 3,200,000
Total Expenditures & Transfers Out $9,300,000
Surplus / (Deficit) $0
* Capital Projects to be determined by the City Council** Anticipated debt service and issuance costs related to the lease revenue bond - Downtown Revitalization Project.
Measure J - Fund 260

8-6
CAPITAL IMPROVEMENT CIP MEASURE J FUNDS
Visit our website for the latest developments on the City of Palm Springs' revitalizion of the Desert Fashion Plaza.www.psmeasurej.com
Keeping up with Measure J
> Downtown Redevelopment Highlights - Click belowTake a look at the Palm Springs Downtown Revitalization Highlights for the old Fashion Show Plaza. Included in these highlights is information showing proposed color pallets, restaurant locations, retail spaces, the Palomar Hotel, the public plaza and pedestrian areas, courtyards and covered walkways. Street and aerial views are provided as well as the locations of the extended Andreas Road and the addition of New Main. Click here to view the PDF of highlights.
> The first portion of the Desert Fashion Plaza, the former Bank of America building was demolished on January 26, 2012. Measure J will provide funding for revitalizing the Desert Fashion Plaza, upgrading and improving downtown public parking, and providing downtown public restrooms.
> On June 6, 2012 the City of Palm Springs Financing Authority offered for sale to the public $46 million of lease revenue bonds. The bonds were being issued to finance land acquisition and public improvements associated with the first phase of the Downtown Revitalization Plan. The Plan will enhance the quality of life in Palm Springs by constructing a new pedestrian-friendly urban village complete with retail, entertainment and public spaces.
> On June 7, 2012 the Palm Springs Financing Authority successfully sold $44.9 million lease revenue bonds to the public.
> On Monday, June 11, 2012 the first meeting of the newly appointed Measure J Oversight Commission convened. These meetings can be viewed on either the Palm Springs Community Television Channel 17 or Time Warner Cable 121.
> At the November 7, 2012 Palm Springs City Council meeting, the Measure J Oversight Commission asked the City Council to consider the Oversight Commission's recommendations for Measure J Project funding. At that meeting, the City Council approved a number of project expenditures to fund in the current fiscal year with Measure J funds. See Page 8-8 for Breakout.

8-7
CAPITAL IMPROVEMENT CIP MEASURE J FUNDS
Palm Springs City Council Approved Projects for the Use of Measure J Funds Fiscal Year 2012-13
Commission City CouncilProject Expense Budget: Recommendations Approved > Street Improvements 3,000,000 3,000,000
> Capital Projects - Previously Deferred1. Pavilion Kitchen Equipment Replacement 14,000 14,0002. Desert Highland Light Poles/Fixture Replacement 80,000 80,0003. Repair Swim Center Deck 161,000 04. Ruth Hardy Park Security Path Lighting 50,000 50,0005. Desert Highland Small Parking Lot Repairs 40,000 40,0006. Dog Park Improvement 10,000 10,0007. Side Replacement in Parks Citywide 80,000 80,0008. Demuth Park - Softball Field Wiring Replacement 40,000 40,0009. Demuth Community Center - Gymnasium Floor Repairs 40,000 40,00010. Sunrise Park Water Valve Replacement 50,000 50,00011. Demuth and Ruth Hardy Parks - Parking Lot Repairs 165,000 165,00012. Stadium Fencing Repairs 20,000 20,00013. Replace 20 Trees-Palm Canyon, Indian Canyon, Sunrise Park 125,000 125,00014. Village Green - Electric Meter Panel Replacement 25,000 25,00015. Downtown / Uptown Crosswalks 150,000 150,00016. Light Poles - Raise Footings - Citywide 150,000 150,00017. Traffic Signal Installation - Sunrise @ Ralph's Center 300,000 017. Traffic Signal & Queing Study - Sunrise @ Ralph's Center 0 10,00018. Lighting - Replace Underground Electrical, Phase One 100,000 100,00019. New Fire Station #5 Site Location and Design Study 0 50,000Total Capital Projects 1,600,000 1,199,000> Commission Communications (Website, Ads) 20,000 5,000TOTAL PROJECT EXPENSE BUDGET 4,620,000 4,204,000Net Savings from Commission Recommendations 416,000
Below is a summary of the Measure J Oversight Commission's recommendations and the projects approved by the City Council on November 7, 2012

A-1
AUTHORIZED PERSONNEL/POSITIONS SUMMARY (FTE)
ADOPTED ADOPTED ADOPTED2011-12 2012-13 2013-14
Administration 34.25 35.75 36.25Growth Management 20.20 20.80 22.60Quality of Life 37.25 53.25 43.00Public Safety 172.50 178.50 170.50Public Works & Engineering 27.50 20.00 31.00Airport 66.50 66.50 67.50Motor Vehicle Replacement 7.00 7.00 7.00Facilities Maintenance 13.50 13.50 13.50Risk Management 2.75 3.25 3.25Community Redevelopment Agency 4.30 3.70 3.40
Total Authorized Full-Time Positions 385.75 402.25 398.00

A-2
AUTHORIZED PERSONNEL/POSITIONS SUMMARY (FTE)ADOPTED ADOPTED ADOPTED
2011-12 2012-13 2013-14ADMINISTRATION
1010 City CouncilExecutive Assistant Mayor/Council 1.00 1.00 1.00Total FTE 1.00 1.00 1.00
1100 City ManagerCity Manager 1.00 1.00 1.00Executive Services Administrator 1.00 1.00 1.00Total FTE 2.00 2.00 2.00
1231 Public Affairs/PSCTV Director of Communications 1.00 1.00 1.00Broadcast Assistant 0.50 0.50 0.50Total FTE 1.50 1.50 1.50
1113 Development ServicesAssistant City Manager, Development Services 1.00 1.00 0.00Total FTE 1.00 1.00 0.00
1114 Neighborhood DevelopmentDirector of Neighborhood & Comm. Relations 1.00 1.00 1.00Total FTE 1.00 1.00 1.00
1270 Office of SustainabilityManager, Office of Sustainability 1.00 1.00 0.50Clerical Assistant 0.00 0.00 0.50Arts & Special Projects Coordinator 0.50 0.50 0.00Total FTE 1.50 1.50 1.00
1280 RecyclingManager, Office of Sustainability 0.00 0.00 0.50Clerical Assistant 0.00 0.00 0.50Total FTE 0.00 0.00 1.00
1120 Information TechnologyInformation Technology Manager 1.00 1.00 1.00Senior Systems/Network Administrator 1.00 1.00 1.00Senior PC/Network Administrator 1.00 1.00 1.00Telecommunications Coordinator 1.00 1.00 1.00Total FTE 4.00 4.00 4.00Note: PC/Network Administrator positions have been allocated/funded in Library, Police Administration and Airport
1150 Chief of Staff / City ClerkChief of Staff/City Clerk 1.00 1.00 1.00Executive Administrative Assistant 0.00 0.00 1.00Chief Deputy City Clerk 1.00 1.00 1.00Deputy City Clerk 1.00 1.00 1.00Executive Services Assistant 1.00 1.00 1.00Total FTE 4.00 4.00 5.00

A-3
AUTHORIZED PERSONNEL/POSITIONS SUMMARY (FTE)
ADOPTED ADOPTED ADOPTEDADMINISTRATION 2011-12 2012-13 2013-14
1160 Human ResourcesDirector of Human Resources 0.25 0.25 0.25Human Resources Manager 0.00 0.00 0.50Human Resources Analyst 0.50 0.50 0.00Human Resources Specialist II 0.00 0.50 0.50Human Resources Specialist I 0.50 0.50 0.00Administrative Assistant 0.00 0.00 0.50Total FTE 1.25 1.75 1.75
1300 Finance & TreasuryDirector of Finance & Treasurer 1.00 1.00 1.00Assistant Director of Finance 1.00 1.00 1.00Budget, Audit & Revenue Supervisor 1.00 1.00 1.00Accounting Supervisor 1.00 1.00 1.00Senior Financial Analyst 1.00 1.00 1.00Deputy City Treasurer 1.00 1.00 1.00Revenue Recovery Specialist & Parking Enforce. 1.00 1.00 1.00Accountant 1.00 1.00 1.00Financial Analyst (unallocated) 0.00 0.00 0.00Payroll Coordinator 1.00 1.00 1.00Senior Account Technician 1.00 1.00 1.00Administrative Secretary 1.00 0.00 0.00Administrative Assistant 0.00 1.00 1.00Account Specialist 2.00 2.00 2.00Account Clerk II 1.00 2.00 2.00Total FTE 14.00 15.00 15.00
1330 Procurement & ContractingProcurement & Contracting Manager 1.00 1.00 1.00Procurement Specialist II 1.00 1.00 1.00Procurement Specialist I 1.00 1.00 1.00Total FTE 3.00 3.00 3.00
ADMINISTRATION TOTAL 34.25 35.75 36.25

A-4
AUTHORIZED PERSONNEL/POSITIONS SUMMARY (FTE)
ADOPTED ADOPTED ADOPTED2011-12 2012-13 2013-14
GROWTH MANAGEMENT
1400 Community & Economic DevelopmentDirector of Community & Economic Dev 0.10 0.30 0.20Community Development Administrator 0.00 0.30 0.30Economic Development/Downtown Administor 0.00 0.20 0.60Economic Development Program Assistant 1.00 1.00 1.00Redevlopment Coordinator 0.00 0.20 0.20Total FTE 1.10 2.00 2.30
1180 Rent Control Housing Program Assistant II 0.10 0.10 0.10Total FTE 0.10 0.10 0.10
4151 Planning Services Director of Planning Services 1.00 1.00 1.00Principal Planner 2.00 2.00 2.00Associate Planner 1.00 1.00 1.00Assistant Planner 1.00 1.00 1.00Planning Administrative Coordinator 1.00 1.00 1.00Planning Technician (unallocated) 0.00 0.00 0.00Senior Secretary 1.00 1.00 1.00Total FTE 7.00 7.00 7.00
4161 Building & SafetyDirector of Building & Safety 1.00 1.00 1.00Building Inspector Supervisor 1.00 1.00 1.00Plans Examiner 1.00 1.00 1.00Building Inspector 3.00 3.00 4.00Code Compliance Officer , Senior 0.00 0.00 1.00Code Compliance Officer 4.00 4.00 3.00Administrative Secretary 1.00 1.00 1.00Total FTE 11.00 11.00 12.00
4814 Community Development Block GrantCommunity Development Adminstrator 0.50 0.20 0.20Total FTE 0.50 0.20 0.20
4408 Arts AcquisitionsArts & Special Projects Coordinator 0.50 0.50 1.00Total FTE 0.50 0.50 1.00
GROWTH MANAGEMENT TOTAL 20.20 20.80 22.60

A-5
AUTHORIZED PERSONNEL/POSITIONS SUMMARY (FTE)
ADOPTED ADOPTED ADOPTED2011-12 2012-13 2013-14
QUALITY OF LIFE
2510 RecreationDirector of Parks & Recreation 0.70 0.70 0.80Special Events Coordinator/Villagefest 0.25 0.25 0.25Account Clerk 1.75 1.75 2.00Recreation Program Aide 1.00 1.00 1.00Recreation Program Assistant 3.75 4.50 4.75Total FTE 7.45 8.20 8.80
2516 Demuth Park Family CenterRecreation Program Assistant 0.00 1.75 1.75Total FTE 0.00 1.75 1.75
2515 Swim CenterAquatics Supervisor 1.00 1.00 1.00Lifeguard 2.75 4.75 4.75Total FTE 3.75 5.75 5.75
2590 James O. Jessie DHUCDirector of Parks & Recreation 0.20 0.20 0.20Community Center Manager 1.00 1.00 1.00Program Coordinator 1.00 1.00 1.00Literacy Coordinator 1.00 1.00 1.00Recreation Program Assistant 1.25 1.25 1.50Total FTE 4.45 4.45 4.70
2710 LibraryDirector of Library Services 1.00 1.00 1.00PC/Network Administrator** 1.00 1.00 1.00Library & Public Services Manager 1.00 1.00 1.00Library Operations & Collections Manager 0.00 0.00 1.00Circulation Manager 1.00 1.00 0.00Librarian 3.00 3.00 4.00Library Assistant, Senior 1.00 2.00 1.00Library Assistant 5.75 4.75 4.75Library Assistant (Welwood) 0.00 1.00 1.00Library Conciergo (Welwood) 0.00 1.00 1.00Library Page 0.50 0.50 0.50Total FTE 14.25 16.25 16.25

A-6
AUTHORIZED PERSONNEL/POSITIONS SUMMARY (FTE)
ADOPTED ADOPTED ADOPTED2011-12 2012-13 2013-14
2451 Park MaintenanceParks Maintenance Supervisor 0.50 1.00 1.00Downtown Maintenance Supervisor 0.00 1.00 0.00Parks Maintenance Lead Worker I 1.00 2.00 1.00Parks Maintenance Mechanic I 3.00 3.00 2.00Parks Maintenance Worker I 1.00 8.00 0.00Total FTE 5.50 15.00 4.00Park Maintenance & Downtown Experience Maintenance have been combines into one Department - Parks 2451
2550 VillagefestDirector of Parks & Recreation 0.10 0.10 0.00Special Events Coord/Villagefest 0.75 0.75 0.75Villagefest Aide 1.00 1.00 1.00Total FTE 1.85 1.85 1.75
QUALITY OF LIFE TOTAL 37.25 53.25 43.00
PUBLIC SAFETY
3010 Police Police Chief 1.00 1.00 1.00Police Captain 2.00 2.00 2.00Police Lieutenant 3.00 3.00 3.00Police Sergeant 13.00 13.00 13.00Police Officer** 50.00 50.00 55.00PC/Network Administrator* 1.00 1.00 1.00Administrative Assistant 1.00 1.00 1.00Crime Scene Technician 1.00 1.00 1.00Rangemaster 1.00 1.00 1.00Crime Analyst 1.00 1.00 1.00Police Services Supervisor 1.00 1.00 1.00Property Technician 1.00 1.00 1.00Senior Secretary 3.00 3.00 3.00Police Records Technician 1.00 1.00 1.00Police Trainee (place holder) 0.00 0.00 0.00Community Service Officer (place holder) 0.00 0.00 0.00Police Services Officer 6.00 6.00 6.00Total FTE 86.00 86.00 91.00* PC/Network Administrator positions have been allocated/funded in Library and Police Administration** Includes three (3) overhires in Fiscal Year 2011-12, FY 2012-13 & FY 2013-14

A-7
AUTHORIZED PERSONNEL/POSITIONS SUMMARY (FTE)
ADOPTED ADOPTED ADOPTEDPUBLIC SAFETY 2011-12 2012-13 2013-14
3304 Animal ControlDirector of Animal Shelter 1.00 1.00 0.00Director of Animal Control 0.00 1.00 1.00Animal Care Supervisor 0.00 1.00 0.00Animal Control Supervisor 1.00 1.00 1.00Animal Control Officer (unallocated) 1.00 0.00 0.00Animal Control Shelter Attendant 1.50 0.00 0.00Animal Shelter Attendent 0.00 5.50 0.50Executive Services Assistant 0.00 1.00 0.00Total FTE 4.50 10.50 2.50Note: This department was combined with Animal Shelter which was contracted out in FY 12-13 and FTE's were not filled.
3019 Downtown Experience - PolicePolice Sergeant 1.00 1.00 1.00Police Officer 3.00 3.00 3.00Total FTE 4.00 4.00 4.00
3400 Dispatch CenterCommunications & Records Manager 1.00 1.00 1.00Dispatch Supervisor 2.00 2.00 2.00Dispatcher 14.00 14.00 14.00Total FTE 17.00 17.00 17.00
3013 Safety Augmentation-PolicePolice Officer 2.00 2.00 2.00Total FTE 2.00 2.00 2.00
3027 Special Distribution Fund - Police -Agua CalientePolice Officer 4.00 4.00 4.00Drug Prevention Officer (non-sworn) 0.00 0.00 0.00Total FTE 4.00 4.00 4.00
3221 Special Distribution Fund - PAL - Agua CalientePal Officer (non-sworn) 1.00 0.00 0.00Total FTE 1.00 0.00 0.00This Posistion/Department deleted in FY 2012-13
3026 Community Facilities District - PolicePolice Officer 2.00 2.00 2.00Total FTE 2.00 2.00 2.00
3220 Special Grants Recovery Act COPSPolice Officer 5.00 5.00 0.00Total FTE 5.00 5.00 0.00Note: The "sunsetting" of this grant in FY 12-13 required FTE's to be moved back into Police Administration, department 3010 in FY 13-14

A-8
AUTHORIZED PERSONNEL/POSITIONS SUMMARY (FTE)
ADOPTED ADOPTED ADOPTEDPUBLIC SAFETY 2011-12 2012-13 2013-14
3520 Fire Fire Chief 1.00 1.00 1.00Fire Deputy Chief 1.00 1.00 1.00Fire Battalion Chief 3.00 3.00 3.00Fire Prevention Captain 2.00 2.00 2.00Fire Suppression Captain 11.20 11.20 11.20Disaster Preparedness Coordinator 1.00 0.00 0.00Emergency Service Coordinator 0.00 1.00 1.00Plans Examiner II 1.00 1.00 1.00Fire Engineer 12.00 12.00 12.00Fire Fighter* 8.00 9.00 8.00Administrative Assistant 1.00 1.00 1.00Senior Secretary 1.00 1.00 1.00Total FTE 42.20 43.20 42.20*Includes one (1) overhire in Fiscal Year FY 2012-13 added by Amendment #1 during FY 2011-12
3523 Safety Augmentation-FireFire Fighter 1.00 1.00 2.00Total FTE 1.00 1.00 2.00Note: Safety Augmentation funding allowed for one FTE to be moved from the General Fund to this fund for FY 13-14
3525 Special Distribution Fund - Agua Caliente - FireFirefighter 3.00 3.00 3.00Total FTE 3.00 3.00 3.00
3526 Community Facilities District - FireFire Captain 0.80 0.80 0.80Total FTE 0.80 0.80 0.80
PUBLIC SAFETY TOTAL 172.50 178.50 170.50

A-9
AUTHORIZED PERSONNEL/POSITIONS SUMMARY (FTE)
ADOPTED ADOPTED ADOPTED2011-12 2012-13 2013-14
PUBLIC WORKS & ENGINEERING
4171 Public Works & EngineeringDirector of Public Works/City Engineer 1.00 1.00 1.00Asst. Director of Public Works/Asst. City Engineer 1.00 1.00 1.00Associate Civil Engineer 1.00 1.00 1.00Engineering Associate 1.00 1.00 1.00Senior Public Works Inspector 1.00 1.00 1.00Engineering Assistant 1.00 1.00 1.00Public Works Administrator 1.00 1.00 1.00Public Works Inspector (unallocated) 0.00 0.00 0.00Engineering Field Technician 2.00 2.00 2.00Engineering Secretary/Counter Technician 1.00 1.00 1.00Clerical Assistant 1.00 1.00 1.00Total FTE 11.00 11.00 11.00
4201 Street MaintenanceStreet Maintenance Superintendent 0.75 0.75 0.75Heavy Equipment Operator/Sr. Street Maint Worker 1.00 1.00 1.00Street/Traffic Lead Maintenance Worker 2.00 2.00 2.00Street /Traffic Maintenance Worker 4.00 4.00 4.00Total FTE 7.75 7.75 7.75
4210 Downtown Experience MaintenanceParks Maintenance Supervisor 0.50 0.00 0.00Downtown Maintenance Supervisor 1.00 0.00 1.00Maintenance Worker, Lead 0.00 0.00 2.00Maintenance Worker I 6.00 0.00 8.00Total FTE 7.50 0.00 11.00Park Maintenance & Downtown Experience Maintenance have been combines into one Department - Parks 2451
4242 Street Cleaning (CSA 152)Street Maintenance Superintendent 0.25 0.25 0.25Field Technician (Dust Inspector) 1.00 1.00 1.00Total FTE 1.25 1.25 1.25
PUBLIC WORKS & ENGINEERING TOTAL 27.50 20.00 31.00

A-10
AUTHORIZED PERSONNEL/POSITIONS SUMMARY (FTE)
ADOPTED ADOPTED ADOPTED2011-12 2012-13 2013-14
AIRPORT
6002 Airport AdministrationExecutive Director Palm Springs Intern'l Airport 1.00 1.00 1.00Executive Administrative Assistant 1.00 1.00 1.00Deputy Director of Aviation - Operations & Maint 1.00 1.00 1.00Deputy Director of Aviation/Marketing & Dev 1.00 1.00 1.00Asset Manager 1.00 0.00 0.00Airport Administration Manager 0.00 1.00 1.00Administrative Secretary 1.00 1.00 1.00Account Specialist II 1.00 1.00 1.00Total FTE 7.00 7.00 7.00
6022 Airport SecurityPolice Officer 6.00 6.00 6.00Total FTE 6.00 6.00 6.00
6075 Airport Rescue FirefightingFire Engineer 9.00 9.00 9.00Total FTE 9.00 9.00 9.00
6200 Terminal OperationsAirport Maintenance Superintendent 1.00 1.00 1.00Maintenance Electrician (Airport) 1.50 1.50 1.50Maintenance Technician, Senior - Airport 1.00 1.00 1.00Maintenance Technician II - Airport 3.00 3.00 3.00Maintenance Technician I - Airport 2.00 2.00 2.00Maintenance Worker, Lead - Airport 1.00 1.00 1.00Maintenance Worker I - Airport 15.00 15.00 15.00Total FTE 24.50 24.50 24.50
6225 Control Center OperationsAirport Operations Manager 1.00 1.00 1.00Airport Security Coordinator 1.00 1.00 1.00PC/Network Administrator (Information Technology) 0.00 0.00 1.00Airport Operations Supervisor 3.00 3.00 4.00Airport Operations Specialist II 1.00 1.00 1.00Airport Operations Specialist I 10.00 10.00 13.00Airport Operations Aide 4.00 4.00 0.00Total FTE 20.00 20.00 21.00
AIRPORT TOTAL 66.50 66.50 67.50

A-11
AUTHORIZED PERSONNEL/POSITIONS SUMMARY (FTE)
ADOPTED ADOPTED ADOPTED2011-12 2012-13 2013-14
MOTOR VEHICLE REPLACEMENT
5470 Fleet OperationsFleet Maintenance Manager 1.00 1.00 1.00Fleet Maintenance Technician IV - Fleet 1.00 1.00 1.00Fleet Maintenance Tech. III/Srv. Writer - Fleet 1.00 1.00 1.00Fleet Maintenance Technician III - Fleet 1.00 1.00 1.00Fleet Maintenance Technician II - Fleet 1.00 0.00 0.00Fleet Maintenance Technician I - Fleet 0.00 1.00 1.00Parts Specialist II 1.00 1.00 1.00Parts & Office Assistant 1.00 1.00 1.00Total FTE 7.00 7.00 7.00
MOTOR VEHICLE REPLACEMENT 7.00 7.00 7.00
FACILITIES MAINTENANCE
5641 Facilities Maint. Admin & OperationsFacilities Maintenance Manager 1.00 1.00 1.00Cogeneration Technician - Senior 1.00 1.00 1.00Maintenance Electrician - Senior 1.00 1.00 1.00Maintenance Electrician (HVAC) 2.00 2.00 2.00Maintenance Mechanic, Senior - Building 1.00 1.00 1.00Maintenance Electrician 0.50 0.50 0.50Maintenance Mechanic II - Building 1.00 1.00 1.00Cogeneration Technician 2.00 2.00 2.00Maintenance Mechanic I - Building 2.00 2.00 2.00Secretary, Senior 1.00 1.00 1.00Account Clerk II 1.00 1.00 1.00Total FTE 13.50 13.50 13.50
FACILITIES TOTAL 13.50 13.50 13.50
RISK MANAGEMENT
5902 Employee BenefitsDirector of Human Resources 0.30 0.30 0.30Human Resources Manager 0.00 0.00 0.20Human Resources Analyst 0.20 0.20 0.00Human Resources Specialist I 0.20 0.00 0.00Human Resources Specialist II 0.45 0.65 0.65Administrative Assistant 0.00 0.20 0.20Total FTE 1.15 1.35 1.35

A-12
AUTHORIZED PERSONNEL/POSITIONS SUMMARY (FTE)
ADOPTED ADOPTED ADOPTED2011-12 2012-13 2013-14
RISK MANAGEMENT Continued
5903 Workers' CompensationDirector of Human Resources 0.45 0.45 0.45Human Resources & Manager 0.00 0.00 0.30Human Resources Analyst 0.30 0.30 0.00Human Resources Specialist I 0.30 0.00 0.00Human Resources Specialist II 0.55 0.85 0.85Administrative Assistant 0.00 0.30 0.30Total FTE 1.60 1.90 1.90
RISK MANAGEMENT TOTAL 2.75 3.25 3.25
COMMUNITY REDEVELOPMENT AGENCY/SUCCESSOR AGENCY
8501 Merged Area #1/Merged #1 CAP SuccessorDirector of Comm & Econonic Development 0.30 0.20 0.25Economic Development/Downtown Administrator 0.50 0.40 0.20Redevelopment Coordinator 0.50 0.40 0.30Total FTE 1.30 1.00 0.75
8502 Merged Area #2/Merged #2 CAP SuccessorDirector of Comm & Econ Development 0.30 0.20 0.25Economic Development/Downtown Administrator 0.50 0.40 0.20Redevelopment Coordinator 0.50 0.40 0.30Total FTE 1.30 1.00 0.75
8530 Low & Moderate Income Housing/New HousingDirector of Community & Economic Dev 0.30 0.30 0.30Community Development Administrator 0.50 0.50 0.50Redevelopment Coordinator 0.00 0.00 0.20Housing Program Assistant II 0.90 0.90 0.90Total FTE 1.70 1.70 1.90
COMMUNITY REDEVELOPMENT AGENCY TOTAL 4.30 3.70 3.40
GRAND TOTAL ALL DEPARTMENTS 385.75 402.25 398.00

Department of Human Resources Benefits Rates 2013 – General Unit
Word/H/Benefits/Rate Sheets/2013-Beneftis Rate Sheet General Unit Jan 2013
City Provided Health Care Benefit Plan Contribution Use this amount to select the benefit options that are best for you.
Single 2 Party Family
622.00 1220.00 1652.00
Plan Cost
Coverage Plan Single 2 Party Family
MEDICAL CIGNA HMO 500.56 1051.19 1501.69
CIGNA PPO 503.77 1057.92 1511.32
DENTAL Safeguard DMO 16.80 29.08 38.11
MetLife PPO 45.49 96.80 152.21
VISION VSP 12.41 12.41 12.41
EAP MHN City Provided
LIFE Standard $50,000 coverage City Provided
NOTES
• All rates are monthly amounts.

Department of Human Resources Benefits Rates 2013 – MAPS/EX
Word/H/Benefits/Rate Sheets/2013-Beneftis Rate Sheet Management Aug 2012
January 1, 2013 – December 31, 2013 All premium and deduction rates are based on monthly amounts
City Provided Cafeteria Plan Allowance Available only when a medical plan is selected.
Single Rate 2 Party Rate Family Rate
646.00 1262.00 1700.00
Use the City provided Cafeteria Allowance to select benefit options that are best for you.
Carrier Single Rate 2 Party Rate Family Rate
MEDICAL
Riverside County Residence
PERS Blue Shield HMO 643.93 1287.86 1674.22
PERS Kaiser HMO 558.95 1117.90 1453.27
PERS Select PPO 446.49 892.98 1160.87
PERS Choice PPO 611.30 1222.60 1589.38
PERS Care PPO 992.61 1985.22 2580.79
San Bernardino County Residence
PERS Blue Shield HMO 530.75 1061.50 1379.95
PERS Kaiser HMO 502.40 1004.80 1306.24
PERS Select PPO 429.08 858.16 1115.61
PERS Choice PPO 587.46 1174.92 1527.40
PERS Care PPO 953.90 1907.80 2480.14
DENTAL MetLife PPO 45.49 96.80 152.21
Safeguard DMO 16.80 29.08 38.11
VISION VSP 12.41 12.41 12.41
EAP MHN City Provided
LIFE Standard $50,000 coverage / City Provided
NOTES Employees can elect to opt out per MOU and receive a credit of $122/per pay period for 24 pay periods.

Department of Human Resources Benefits Rates 2013 – Police Police Management/Police Safety
Word/H/Benefits/Rate Sheets/2013-Beneftis Rate Sheet Fire/Police Jan 2013
January 1, 2013 – December 31, 2013 All rates are based on monthly amounts
PLAN CARRIER Contribution Amounts
Single Rate
2 Party Rate
Family Rate
MEDICAL Blue Shield PPO Employee 25.21 48.39 51.28
City 749.07 1437.82 1523.62
DENTAL Aetna PPO/DMO Employee 0.00 24.22 58.10
City 33.43 45.84 66.01
VISION VSP Employee 0.00 0.00 0.00
City 12.41 12.41 12.41
EAP MHN City Provided
LIFE
Standard Police Safety $50,000 coverage / City paid
Standard Police Management $20,000 coverage / City paid
NOTES • Rates above are monthly amounts.

Department of Human Resources Benefits Rates 2013 – Fire Fire Management/Fire Safety
Word/H/Benefits/Rate Sheets/2013-Beneftis Rate Sheet Fire/Police Jan 2013
January 1, 2013 – December 31, 2013 All rates are based on monthly amounts
PLAN CARRIER Contribution Amounts
Single Rate
2 Party Rate
Family Rate
MEDICAL Blue Shield PPO Employee 18.01 34.56 36.63
City 756.27 1451.65 1538.27
DENTAL Aetna PPO/DMO Employee 0.00 24.22 58.10
City 33.43 45.84 66.01
VISION VSP Employee 0.00 0.00 0.00
City 12.41 12.41 12.41
EAP MHN City Provided
LIFE
Standard Fire Safety $50,000 coverage / City paid
Standard Fire Management $35,000 coverage / City paid
NOTES • Rates above are monthly amounts.

C-1

C-2

C-3

C-4

C-5

C-6

C-7

C-8

C-9

C-10

C-11

C-12

C-13

C-14

C-15

C-16

C-17

C-18

C-19

C-20

C-21

C-22

C-23

C-24

C-25

C-26

C-27

C-28

C-29

C-30

C-31

C-32

C-33

C-34

C-35

C-36
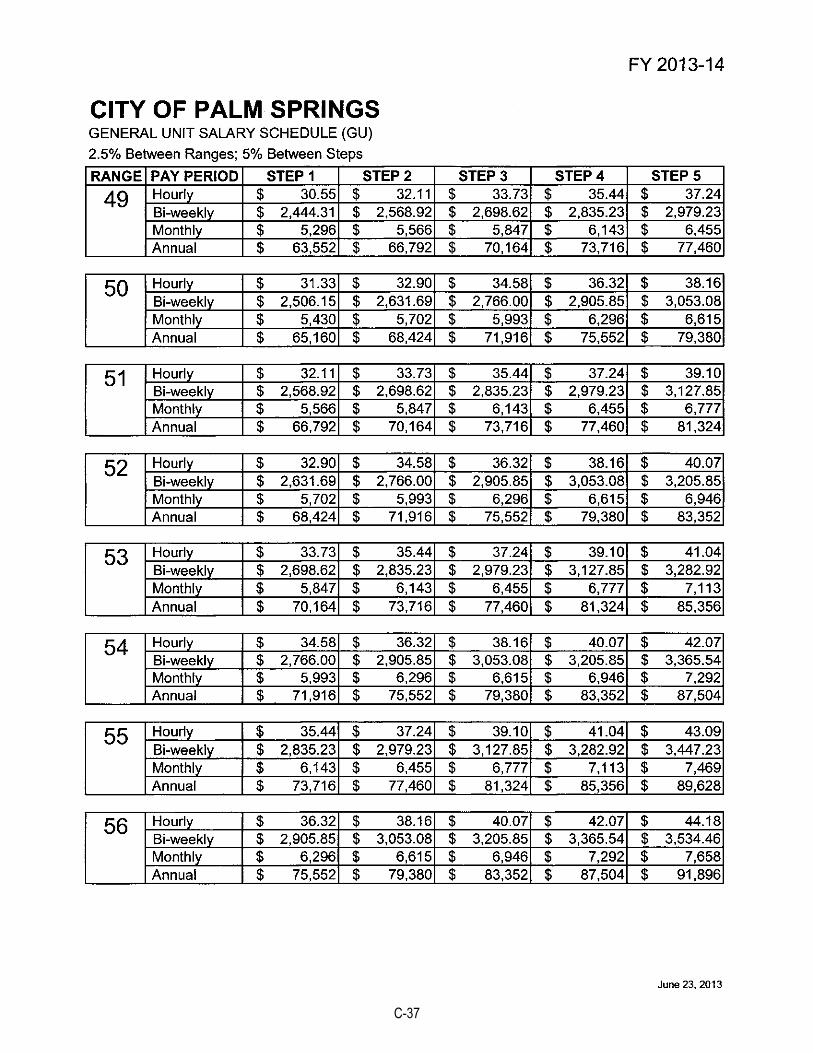
C-37

C-38

C-39

C-40

C-41

C-42

C-43

C-44

C-45

C-46

C-47

C-48

C-49

C-50

C-51

C-52

C-53

C-54

C-55

C-56

C-57

C-58

C-59

C-60

C-61

C-62

C-63

C-64

C-65

C-66

C-67

C-68

C-69

C-70

C-71

C-72

C-73

C-74

C-75

C-76

C-77

C-78

C-79

C-80

C-81

C-82

C-83

C-84

C-85

C-86

C-87

C-88

C-89

C-90

C-91

C-92

C-93

C-94

C-95

C-96

C-97

C-98

C-99

C-100

C-101

C-102

C-103

D-1
APPENDIX DIVISION OF PROPERTY TAX
This chart shows the distribution of Pre/Post ERAF of each $1,000 of property tax paid in the City of Palm Springs
Dollar Amt Pre-ERAF % Dollar Amt Post-ERAF %per @ $1000 Distribution per @ $1000 Distribution
CITY OF PALM SPRINGS 275.05 27.50% 226.85 22.68%COUNTY OF RIVERSIDE/GENERAL 267.15 26.72% 133.47 13.47%PALM SPRINGS UNIFIED SCHOOL DISTRICT 250.01 25.00% 250.01 25.00%DESERT COMMUNITY COLLEGE 71.36 7.14% 71.36 7.13%RIVERSIDE COUNTY OFFICE OF EDUCATION 38.82 3.88% 38.82 3.88%RIVERSIDE COUNTY PARKS & OPEN SPACE 4.04 0.40% 3.29 0.32%FLOOD CONTROL ADMINISTRATION 2.54 0.25% 2.23 0.22%FLOOD CONTROL ZONE 6 39.77 3.98% 34.71 3.47%PALM SPRINGS PUBLIC CEMETERY 1.48 0.15% 0.89 0.08%DESERT HOSPITAL 18.93 1.90% 18.93 1.89%COACHELLA MOSQUITO ABATEMENT 12.99 1.30% 9.27 0.92%DESERT WATER AGENCY 17.84 1.78% 10.71 1.07%ERAF 0.00 0.00% 199.45 19.94%
$1,000 100% $1,000 100%Source: County of Riverside Auditor-Controller's Office Property Tax Division, March 22, 2012 (Palm Springs TRA 11041)www.auditorcontroller.org/opencms/aboutus/division/proptax/valuations.html
27.50%
26.72% 25.00%
7.14% 3.88%
0.40% 0.25%
3.98% 0.15% 1.90%
1.30%
1.78% Pre-ERAF
22.69%
13.34%
25.00% 7.14% 3.88%
0.40%
0.22%
3.54% 0.09%
1.90%
0.93%
1.07% 19.80% Post-ERAF

E-1
CITY OF PALM SPRINGSAPPENDIX GANN APPROPRIATIONS LIMIT
Article XIIIB of the California Constitution requires governmental units to establish an annual appropriationslimit. Proposition 4 (Article XIIIB) which was approved by the voters in 1979 and modified byProposition 111 in 1990 is commonly identified as the Gann Limit and creates a restriction on the amountof revenue which can be appropriated for expenditures in any fiscal year. The revenues which are subject tothe limitation are those considered "proceeds of taxes." Examples of tax proceeds include property, sales, andtransient occupancy taxes as well as motor vehicle license fees. It is important to point out that only specific revenues and appropriations are subject to limitation. For Palm Springs, all the City's enterprise and intergovernmental service funds as well as any Federal funds are exempt.
Palm Springs' limit was established by using 1978-79 appropriations as the base year and allowing thebase to increase in the future years by the percentage of growth in population and inflation. During any fiscalyear, a city may not appropriate any proceeds of taxes it receives in excess of its limit. If the City exceeds its Gann Limit, it may avoid a tax refund if they fall sufficiently below the limit in the next fiscal year. Any excess funds remaining after the second year have to be returned to the taxpayers by reducing tax rates or fees; or, alternatively, by a majority vote, the citizens may approve an override to increase the limit. As shown below Palm Springs has not exceeded its Gann Limit.
Calculation details are as follows:
The changes proposed by Proposition 111 allow the City to annually choose among the followingoptions for calculating its Gann Limit:
o Population growth of Palm Springs, oro Population growth within Riverside County, ando Growth in California per capita income, oro Growth in non-residential assessed valuation due to new construction in the City.
The factors used to calculate the 2013-14 limit are:o Population growth of Palm Springs, ando Growth in California per capita income
The formula to calculate expenditure limit is outlined below:A. Prior Year (2012-13) Expenditure Limit $127,707,125B. Adjustment Factors
1. Palm Springs population growth converted to a ratio 1.05122. % growth in California per capita income converted to a ratio 1.0066
Total Adjustment ratio (B.1 x B.2) 1.05813792C. Annual Adjustment (A x ( B-1)) 7,424,627D. Other Adjustments 0E. Total Adjustments (C + D) 7,424,627F. 2013-14 Expenditure Limit (A + E) or (A*B) $135,131,752
Appropriations subject to limit and formula to calculate operating margin:AA. Current Appropriation of Proceeds of Taxes $75,476,567BB. Exclusion 0CC. Current Appropriation of Proceeds of Taxes Subject to Limit 75,476,567DD. 2013-14 Expenditure Limit (F) 135,131,752EE. 2013-14 Over (Under) Limit (CC - DD) ($59,655,185)
The spending limit for the City of Palm Springs for 2013-14 is $135.1 million with appropriations of "proceeds of taxes" of $75.4 million. The result of the calculation provides the City with an operating marginof $59.6 million and indicates that the City of Palm Springs is under the appropriations limit.

E-2
CITY OF PALM SPRINGSAPPENDIX GANN APPROPRIATIONS LIMIT GRAPH
Appropriations Over (Under) City'sSubject to Legal Spending % of
Limit Limit Limit Limit2009-10 58,738,748 119,324,757 (60,586,009) 49.23%2010-11 55,487,733 117,235,889 (61,748,156) 47.33%2011-12 59,889,536 121,848,991 (61,959,455) 49.15%2012-13 72,271,270 126,643,614 (54,372,344) 57.07% **2013-14 75,476,567 135,131,752 (59,655,185) 55.85%
** Currently the City is at 59.6% of its limitation and continues to not be impacted by the appropriations limit.
0
20,000,000
40,000,000
60,000,000
80,000,000
100,000,000
120,000,000
140,000,000
160,000,000
2009-10 2010-11 2011-12 2012-13 2013-14
FIVE YEAR COMPARISON GANN APPROPRIATIONS LIMIT
Appropriations Subject to Limit Appropriations Legal Limit

F-1
APPENDIX COMPARISON OF SURROUNDING CITIES
COMPARISON OF SURROUNDING CITIES
SQUARE SALES PROPERTY TRANSIENT GENERAL FUNDCITY POPULATION MILES TAX BUDGET TAX BUDGET OCCUPANCY TAX BUDGET
CATHEDRAL CITY 51,200 21.80 5,250,000 1,150,000 1,100,000 31,092,300
RANCHO MIRAGE 17,218 24.70 4,361,440 1,202,000 5,735,550 22,600,859
PALM DESERT 48,445 26.00 16,400,000 4,543,000 8,000,000 45,044,042
INDIAN WELLS 4,958 14.59 690,000 2,116,000 6,327,416 46,296,121
LA QUINTA 37,467 35.60 7,983,000 6,323,300 5,051,000 40,126,081
INDIO 76,036 29.18 6,125,000 5,025,000 2,500,000 87,651,849
PALM SPRINGS 44,468 94.98 10,599,525 16,757,221 17,500,000 68,126,514
Data based on FY 12-13 Adopted Budgets for all Cities, Census 2012 Population Search
02,000,0004,000,0006,000,0008,000,000
10,000,00012,000,00014,000,00016,000,00018,000,000
Sales Tax
Property Tax
Transient Occupancy Tax

G-1
APPENDIX STATISTICS
Year 1940 1950 1960 1970 1980 1990 2000 2012Population 3,434 7,660 13,468 20,936 32,359 40,181 42,807 44,468
Estimated Population in 2017 - 46,478Source: 2010 United States Census / Esri forecast for 2012 and 2017
Demographic EstimatesEstimate Percent
44,468Male 56.4Female 43.6Median age (years) 52.4One race 97.9White 74.8Black or African American 4.4American Indian and Alaska Native 1.0Asian 4.5Native Hawaiian and Other Pacific Islander 0.2Some other race 11.7Two or more races 3.3Hispanic or Latino (of any race) 26.4
Median AgeThe median age in Palm Springs is 52.4 year according to the U.S. Census.
Source: US Census Bureau, 2005-2009 American Community Survey / ERSI forecast for 2012 and 2017
Total Population
3,434 7,660
13,468 20,936
32,359
40,181 42,807 44,468
City of Palm Springs History of Population

H-1
Palm Springs Demographic Overview 2012 2017 PER CAPTIAL INCOME $39,312 $45,283 2012-17 Annual Rate – 2.87%
AVERAGE HOUSEHOLD INCOME $75,058 $86,972 2012-17 Annual Rate – 2.99%
MEDIAN HOUSEHOLD INCOME $48,561 $59,516 2012-17 Annual Rate – 4.15%
Households by Income Current per capita income is $39,312 in the area, compared to the U.S. per capita income of $26,409. The per capita income is projected to be $45,283 in five years, compared to $29,882 for all U.S. households. Current average household income is $75,058 in this area, compared to $68,162 for all U.S. households. Average household income is projected to be $86,972 in five years, compared to $77,137 for all U.S. households. Current median household is $48,561 in the area, compared to $50,157 for all U.S. households. Median household income is projected to be $59,516 in five years, compared to $56,895 for all U.S. households. Housing Palm Springs has a variety of housing types and values, ranging from affordable homes and condominiums to multi-million dollar estates. The median home price in the Palm Springs area stood at $187,844, compared to a median home value of $167,749 for the U.S. In five years, median value is projected to change by 2.51% annually to $212,628.
2000 Households - 20,558
2010 Households - 22,746
2012 Total Households - 23,154
2017 Households - 24,187
2000-201 Annual Rate - 1.02%
2010-2012 Annual Rate - 0.79%
2012-2017 Annual Rate - 0.88%
2012 Average Household Size - 1.90

I-1
City of Palm Springs Population and Tourism Overview
Fiscal Year 2013-14 Permanent population 44,468 Seasonal population 70,000 estimated Historical population - 2002-2012 2002 43,948 2003 44,506 2004 44,938 2005 45,878 2006 46,638 2007 46,795 2008 46,992 2009 47,653 2010 48,040 2011 45,279 2012 44,468 Source: City of Palm Springs Finance Department / CAFR FY 2012-13
TOURISM Palm Springs has an estimated two million tourist annually. Throughout the year visitors crowd the streets, coming and going every weekend. A major part of the city’s economic focus has been divided in three parts: the building of the Convention Center, which was remodeled to accommodate larger groups; the Hotel Incentive Program, where the city partnered to improve and build hotels; and the development of the Downtown / Uptown shopping districts. With all three of these parts in place, the long awaited downtown revitalization project, the demolition and rebuilding, is finally underway.
The Convention Center – Situated in America's premier desert resort, the Palm Springs Convention Center provides a casual but elegant ambience for conventions, exhibitions and trade shows year round. On forty magnificent acres just three blocks from chic downtown amenities and Palm Canyon Drive, the Center also provides a new dimension to corporate meetings and other business related functions. Easily accessible with convenient airport access, the attached Renaissance Palm Springs and surrounding glamorous hotels offer 1,800 full service resort rooms.
The Hotel Incentive Program - Palm Springs has an impressive number of refurbished high quality hotel rooms recently put into service and some new hotels in the planning process. In all, more than $200 million has been invested into hotel refurbishments from 2008 to the present through the city’s Hotel Incentive Program which enables certain types of new and renovated hotels to keep up to 50 percent of the additional transient occupancy tax (TOT) they generate. The financial incentives have helped current hoteliers renovate and/or expand their properties at a time when such major capital investments have otherwise been extremely difficult to fund.

I-2
The Downtown / Uptown Shopping Districts – Uptown
In Palm Springs lies a very special shopping district, the Palm Springs Uptown Design District. Enjoy a relaxing day walking along Palm Canyon’s Modern Art, Fashion and Design. Over the years, Palm Springs has become a world renowned destination for decorators, designers and visitors in general who seek the unique, eclectic and eccentric. Just take a walk down Palm Canyon Drive from Tachevah to Alejo and you will find a host of vintage and modern furniture stores, fashion boutiques and art galleries which celebrate the City's famed mid-century modernist roots. In addition enjoy Uptown's cafés and restaurants — each and every one offering a variety of refreshing dining experiences.
Downtown
In addition, the redevelopment of the Desert Fashion Plaza in the center of the downtown area represents a key project to the community. Located at the center of the downtown core, the Desert Fashion Plaza is a 300,000 square foot enclosed shopping center situated on 13 acres. It was largely vacant, with the street-fronting spaces leased and all of the interior spaces in the mall vacant and sealed off from the public. The plan — a several hundred million dollar mixed-use project — Designed to be pedestrian-friendly, it would be anchored by Palm Springs Art Museum to the west and split by a foot-wide street called Museum Way. Plans call for new buildings of varied heights, stepped back from Palm Canyon Drive around the central entertainment plaza. They encompass luxury condos and lofts, an upscale boutique hotel, and more than 250,000 square feet of retail space.
Vintage Palm Springs Postcard

J-1
CITY OF PALM SPRINGSPERFORMANCE MEASURE INDICATORS
FISCAL YR FISCAL YR FISCAL YR FISCAL YR FISCAL YR FISCAL YR2012 2011 2010 2009 2008 2007
POLICE:ARRESTS 3,360 3,528 4,564 4,319 4,908 4,152PARKING CITATIONS: 2,585 1,936 2,977 2,896 2,987 3,125
FIRE:# OF EMERGENCY CALLS 8,263 7,777 7,400 7,054 6,928 6,876INSPECTIONS 1,425 4,204 3,808 2,907 3,889 2,025
PUBLIC WORKS:STREET RESURFACING - SQ FT2,468,300 3,049,441 3,286,000 3,580,270 3,688,258 4,025,450
PARKS & RECREATION:# OF RECREATION CLASSES 3,229 3,171 1,755 2,001 1,331 1,055# OF FACILITY RENTALS 195 276 955 968 1,138 165
AIRPORT:PASSENGERS SERVICED 1,668,554 1,483,051 1,499,637 1,453,921 1,591,458 1,595,417FLIGHTS 58,792 61,584 68,772 68,805 77,859 93,201
SEWER:NEW CONNECTIONS 112 62 102 122 166 258DAILY SEWAGE TREATMENT 5,698 5,700 6,491 6,491 6,491 6,491
GOLF COURSE:GOLF ROUNDS PLAYED 103,653 99,592 80,699 82,966 83,705 83,979
Source: City of Palm Springs
Course: City of Palm Springs Finance Department

L-1
APPENDIX MOST FREQUENTLY ASKED QUESTIONS 1. What is the City’s total budget for fiscal year 2013-14?
The City’s total budget for all funds (excluding the Successors Agency funds) is $197,344,369. This includes the Operating Funds, the Special Revenue Funds, the Enterprise Funds, the Internal Service Funds, and the Debt Service Funds. See the overall Appropriation Summary on pages 2-8 through 2-12 for further detail. The Successor Agency is a distinct reporting agency and is covered separately under the Redevelopment and Successor Agency section of this budget document and further detail may be seen on pages 7-1 through 7-11.
2. What is the City’s operating budget for fiscal year 2013-14?
The City’s operating budget consists of the General Fund. The total operating budget for fiscal year 2013-14 is $72,550,399. See page 2-6 for a graph and schedule identifying the appropriations by service area.
3. What departments are covered in the operating budget?
There are over 50 departments that are covered under the City’s operating budget. A listing of these departments can be found in the Appropriation Summary Detail for All Funds schedule located on pages 2-8 through 2-12.
4. Where can I find the budget for a specific department?
The budgets for each City department are summarized by service area and by departments in the Appropriation Summary Detail for All Funds schedule located on pages 2-8 through 2-12. Further detail for each individual department is located in the Department Summaries starting on page 6-1.
5. What is the City’s projected operating revenue for fiscal year 2013-14?
The City has projected operating revenue for fiscal year 2013-14 at $78,139,629. See the graph on page 2-5 for more detail.
6. What is the City’s largest revenue source?
Currently, the City’s largest revenue source is Transient Occupancy Tax (TOT). Transient Occupancy Tax comprises 23% of total projected revenues for fiscal year 2013-14. This is followed by Property Tax revenue, which comprises 21% of total projected revenues for fiscal year 2013-14. A summary of the revenue sources can be seen on page 2-5. Further breakdown of the operating fund revenues may be found on the Fund Summaries for the General Fund located on pages 5-3.
7. How many employees are employed with the City of Palm Springs?
There are 398.00 authorized positions with the City of Palm Springs for fiscal year 2013-14. A graph and a summarized schedule showing the distribution of employees by service area is on page 2-14. The Authorized Personnel/Position Summary schedules located in the Appendix starting on page A-1 describe the distribution by service area, department, and position.

L-2
8. Where do my property tax dollars go?
For every $1,000 of property tax paid in the City of Palm Springs (Post ERAF), the City receives approximately $226.85 (22.69%). For a full listing of the other agencies that receive a distribution of these property tax dollars, see page D-1 in the Appendix section.
9. What does it cost to operate the Convention Center?
Fiscal year 2013-14’s adopted budget for the operating costs of the Convention Center totals $2,449,689. The total debt service and land lease payment is $4,339,301, making the total cost to the City $6,788,990. Debt Service was combined into this department in fiscal year 2011-12. See page 6-131 of the Department Summaries for more detail. All operating costs are budgeted in the General Fund.
10. Please explaining what happened to the Community Redevelopment Agency?
On December 29, 2011, the California Supreme Court upheld AB 1X 26, which dissolves all of the redevelopment agencies in the State of California, and stuck down AB 1X 27, which allowed redevelopment agencies to remain in existence if such agency opted to the “Voluntary Alternative Redevelopment Program” (VARP). Under the law, all accounts of the former Redevelopment Agency (RDA) transfer to the Successor Agency. To preserve the limited liability of the Successor Agency provided in AB 1X 26, the Successors Agency should hold all former RDA accounts separately from its other account and as the Successor Agency to the former RDA. The Community Redevelopment Agency now called the Successor Agency is a distinct reporting agency and is covered separately under the Successor Agency section of this budget document and further detail may be seen on pages 7-1 through 7-11.
11. Explain Measure J. On November 8, 2011 Palm Springs voters approved Measure J, a local revenue to maintain local community services and economically revitalize our Downtown. Measure J is a 1% Sales Tax increase. With the approval of Measure J, for each dollar spent in Palm Springs, the sales tax will increase by one cent. Sales tax is not applied to food purchases as groceries or prescription medications. Measure J is not a property tax on local residents. Out of town visitors to Palm Springs will also pay this cost. Measure J includes a “sunset” provision causing the tax to expire at the end of its specified term (25 years). Measure J also requires that the revenue will be independently audited on an annual basis with all audits requires to be made public.

GLOSSARY
M-1
Actual – Actual, as used in the department and division summaries within the budget document, represents the actual costs results of operations. This category is presented on a GAAP basis except that depreciation and amortization are not budgeted and principal payments on debt in the enterprise funds are budgeted as expense. Adopted – Adopted, as used in the fund summaries and department and division summaries within the budget document, represents the budget as approved by the City Council. Agencies - Federal agency securities and/or Government-sponsored enterprises. Appropriations – Legal authorization by Council to make expenditures and to incur obligations for specific purposes. Asked - The price at which securities are offered. Assessed Valuation – A valuation set upon real estate or other property by a government as a basis for levying taxes. Bankers’ Acceptance (BA) - A draft or bill or exchange accepted by a bank or trust company. The accepting institution guarantees payment of the bill, as well as the issuer. Basis Point - One-hundredth of one percent (i.e., 0.01%). Beginning Adjusted Cash Balance – Beginning adjusted cash balance represents prior year ending cash plus current receivables; less – current payables, reserve for encumbrances, reserve for continuing appropriations, and deferred revenue; and plus any amounts to be provided by outside funding sources not yet accrued. Beginning Balance – The beginning balance is the residual non-restricted funds brought forward from the previous fiscal year (ending balance). Bid - The price offered by a buyer of securities. (When you are selling securities, you ask for a bid). See Offer. Bonds – Bonds are debt instruments which require repayment of a specified principal amount on a certain date (maturity date), together with interest at a stated rate or according to a formula for determining the interest rate. Broker - A broker acts as an intermediary between a buyer and seller for a commission. Budget – A budget is a plan of financial operation embodying an estimate of proposed expenditures and the means of financing them. Used without any modifier, the term usually indicates a financial plan presented for adoption and other times it designates the plan finally approved. It is usually necessary to specify whether the budget under consideration is preliminary and tentative, or whether it has been approved by the appropriating body.

GLOSSARY
M-2
CalTRUST – An investment pool established by California public agencies as a Joint Powers Authority for purpose of pooling local assets for investing. It is managed by WellsCap, a wholly-owned subsidiary of Wells Fargo Bank, N.A. Capital Outlay – Expenditures resulting in the acquisition of or addition to the government’s general fixed assets. Items costing $5,000 or more and having a useful life of one year or more are designed as fixed assets. Capital Improvement Plan (CIP) – A capital improvement plan is a comprehensive plan for capital expenditures, to be incurred each year over a fixed period of years, to meet capital needs arising from the long-term work program or other capital needs. It sets forth each project or other contemplated expenditure in which the government is to have a part, and specifies the resources estimated to be available to finance the project expenditures. Certificate of Deposit (CD) - A time deposit with a specific maturity evidenced by a certificate. Large-denomination CD’s are typically negotiable. Collateral - Securities, evidence of deposit or other property which a borrower pledges to secure repayment of a loan. Also refers to securities pledged by a bank to secure deposits of public monies. Commercial Paper - Short-term, unsecured, negotiable promissory note with a fixed maturity of no more than 270 days. By statute, these issues are exempt from registration with the U.S. Securities and Exchange Commission. Comprehensive Annual Financial Report (CAFR) - The official annual financial report for the City. It includes combined statements and basic financial statements for each individual fund and account group prepared in conformity with Generally Accepted Accounting Principles (GAAP). Coupon - (a) The annual rate of interest that a bond’s issuer promises to pay the bondholder on the bond’s face value. (b) A certificate attached to a bond evidencing interest due on a payment date. Credit Risk - The risk that an obligation will not be paid and a loss will result. Debt Service – Debt service is the amount of money necessary to pay interest and principal on outstanding debt. Department – A department is the combination of divisions of the City headed by a general manager with a specific and unique set of goals and objectives, e.g., Police, Fire, Planning, Finance, Executive Services, etc. Dealer - A dealer, as opposed to a broker, acts as a principal in all transactions, buying and selling for his own risk and account or inventory. Debenture - A bond secured only by the general credit of the issuer. Delivery versus Payment - There is two methods of delivery of securities: delivery versus payment and delivery versus receipt. Delivery versus payment is delivery of

GLOSSARY
M-3
securities with an exchange of money for the securities. Delivery versus receipt is delivery of securities with an exchange of a signed receipt for the securities. Derivatives - (1) financial instruments whose return profile is linked to, or derived from, the movement of one or more underlying index or security, and may include a leveraging factor, or (2) financial contracts based upon notional amounts whose value is derived from an underlying index or security (interest rates, foreign exchange rates, equities or commodities). Direct Issuer - Issuer markets its own paper directly to the investor without use of an intermediary. Discount - The difference between the cost price of a security and its maturity when quoted at lower than face value. Security selling below original offering price shortly after sale also is considered to be at a discount. Discount Securities- Non-interest bearing money market instruments that are issued at a discount and redeemed at maturity for full face value, e.g., U.S. Treasury Bills. Diversification - Dividing investment funds among a variety of securities offering independent returns. Duration - A measure of the sensitivity of the price (the value of principal) of a fixed-income investment to a change in interest rates over a period of time. Duration is expressed by a number of years. Stagnant or falling interest rates may result in the duration of an investment being shorter than the stated date to maturity. Encumbrance – Encumbrance includes commitments related to unperformed contract for goods or services. Used in budgeting, encumbrances represent the estimated amount of expenditures ultimately to result if unperformed contracts in process are completed. Encumbrances include, but are not limited to, purchase orders and contracts. Ending Balance – The residual non-restricted funds that are spendable or available for appropriation at the end of the fiscal year. Enterprise Fund – An enterprise fund is established to account for operations financed and operated in a manner similar to private business enterprises, i.e., where the intent of the governing body is that the costs (expenses, including depreciation) of providing goods and services to the general public on a continuing basis be financed or recovered primarily through user charges. Examples of enterprise funds are those for airport, wastewater and the golf course. Expenditures – Expenditures are decreases in net financial resources. They include current operating expenses which require the current or future use of net current assets, debt services, and capital outlays. Face Value - The principal amount owed on a debt instrument. It is the amount on which interest is computed and represents the amount that the issuer promises to pay at maturity.

GLOSSARY
M-4
Fair Value - The amount at which a security could be exchanged between willing parties, other than in a forced or liquidation sale. If a market price is available, the fair value is equal to the market value. Federal Credit Agencies - Agencies of the Federal government set up to supply credit to various classes of institutions and individuals, e.g., S&L’s, small business firms, students, farmers, farm cooperatives, and exporters. Federal Deposit Insurance Corporation (FDIC) - A federal agency that insures bank deposits, currently up to $250,000 per deposit. Federal Farm Credit Bank (FFCB) - Government-sponsored institution that consolidates the financing activities of the Federal Land Banks, the Federal Intermediate Credit Banks and the Banks for Cooperatives. Its securities do not carry direct U.S. government guarantees. Federal Funds Rate - The rate of interest at which Federal funds are traded. This rate is considered to be the most sensitive indicator of the direction of interest rates, as it is currently pegged by the Federal Reserve through open-market operations. Federal Home Loans Banks (FHLB) - Government sponsored wholesale banks (currently 12 regional banks) which lend funds and provide correspondent banking services to member commercial banks, thrift institutions, credit unions and insurance companies. The mission of the FHLBs is to liquefy the housing related assets of its members who must purchase stock in their district Bank. Federal Home Loan Mortgage Corporation (FHLMC or Freddie Mac) - Established in 1970 to help maintain the availability of mortgage credit for residential housing. FHLMC finances these operations by marketing guaranteed mortgage certificates and mortgage participation certificates. Its discount notes and bonds do not carry direct U.S. government guarantees. Federal National Mortgage Association (FNMA or Fannie Mae) - FNMA was chartered under the Federal National Mortgage Association Act in 1938. FNMA is a Federal corporation working under the auspices of the Department of Housing and Urban Development (HUD). It is the largest single provider of residential mortgage funds in the United States. FNMA is a private stockholder-owned corporation. The corporation’s purchases include a variety of adjustable mortgages and second loans, in addition to fixed-rate mortgages. FNMA’s securities are also highly liquid and are widely accepted. FNMA assumes and guarantees that all security holders will receive timely payment of principal and interest. FNMA securities do not carry direct U.S. Government guarantees. Federal Reserve System - The central bank of the United States created by Congress and consisting of a seven member Board of Governors in Washington, D.C., 12 regional banks and about 5,700 commercial banks that are members of the system. Fees – Fees are charges for specific services. Fund – A fund is a fiscal and accounting entity with a self-balancing set of accounts recording cash and other financial resources together with all related liabilities and

GLOSSARY
M-5
residual equities or balances and changes therein which are segregated for the purpose of carrying on specific activities or attaining certain objectives in accordance with special regulations, restrictions, or limitations. Fund Balance – The difference between fund assets and fund liabilities of governmental and similar trust funds. Fund Summary – A fund summary, as reflected in the budget document, is a combined statement of revenues, expenditures, and changes in fund balance for the prior years actual, adopted, and the current years adopted budgets. General Fund – The general fund is used to account for all financial resources except those required to be accounted for in another fund. Generally Accepted Accounting Principles (GAAP) – GAAP are the uniform minimum standards of and guidelines to financial accounting and reporting. They govern the form and content of the basic financial statements of an entity. GAAP encompass the conventions, rules, and procedures necessary to define the accepted accounting practices at a particular time. They include both broad guidelines of general application and detailed practices and procedures. GAAP provide a standard by which to measure financial presentations. Government National Mortgage Association (GNMA or Ginnie Mae) - Securities influencing the volume of bank credit guaranteed by GNMA and issued by mortgage bankers, commercial banks, savings and loan associations, and other institutions. Security holder is protected by full faith and credit of the U.S. Government. GNMA securities are backed by the FHA, VA or FMHA mortgages. The term “pass-throughs” is often used to describe GNMAs. Intergovernmental Revenues – Revenues from other governments in the form of grants, entitlements, shared revenues or payments in lieu of taxes. Internal Service Fund – An internal service fund is used to account for the financing of goods and services provided by one department or agency to other departments or agencies of a government, or to other governments on a cost-reimbursement basis. Interest Rate Risk - The risk of gain or loss in market values of securities due to changes in interest rate levels. For example, rising interest rates will cause the market value of portfolio securities to decline. Liquidity - A liquid asset is one that can be converted easily and rapidly into cash with minimum risk of principal. Local Agency Investment Fund (LAIF) - An investment pool managed by the California State Treasurer. Local government units, with the consent of the governing body of that agency, may voluntarily deposit surplus funds for the purpose of investment. Interest earned is distributed to the participating governmental agencies on a quarterly basis. Mark To Market - Current value of securities at today’s market price.

GLOSSARY
M-6
Market Risk - Systematic risk of a security that is common to all securities of the same general class (stocks, bonds, notes, money market instruments) and cannot be eliminated by diversification (which may be used to eliminate non-systematic risk). Market Value - The price at which a security is trading and could presumably be purchased or sold. Maturity - The date upon which the principal or stated value of an investment becomes due and payable. Medium-Term Notes (MTNs) - Continuously offered notes having any or all of the features of corporate bonds and ranging in maturity from nine months out to thirty years. The difference between corporate bonds and MTNs is that corporate bonds are underwritten. Money Market - The market in which short-term debt instruments (bills, commercial paper, bankers’ acceptances, etc.) are issued and traded. Offer - The price asked by a seller of securities. (When you are buying securities, you ask for an offer.) See Asked and Bid. Open Market Operations - Purchases and sales of government and certain other securities in the open market by the New York Federal Reserve Bank as directed by the FOMC in order to influence the volume of money and credit in the economy. Purchases inject reserves into the bank system and stimulate growth of money and credit; sales have the opposite effect. Open market operations are the Federal Reserve’s most important and most flexible monetary policy tool. Operating Budget – The operating budget is the plan for current expenditures and the proposed means of financing them. The annual operating budget is the primary means by which most of the financing, acquisition, spending, and service delivery activities of a government are controlled. The use of annual operating budgets is required by law in California and is a requirement of the City of Palm Springs’ City Charter. Ordinance – An ordinance is a formal legislative enactment by the governing body of a municipality. If it is not in conflict with any higher form of law, such as a state statute or a constitutional provision, it has the full force and effect of law within the boundaries of the municipality to which it applies. Portfolio - The collection of securities held by an investor. Primary Dealer - A group of government securities dealers who submit daily reports of market activity and positions and monthly financial statements to the Federal Reserve Bank of New York and are subject to its informal oversight. Primary dealers include Securities and Exchange Commission (SEC)-registered securities broker-dealers, banks, and a few unregulated firms. Prudent Person Rule - An investment standard: The way a prudent person of discretion and intelligence would be expected to manage the investment program in seeking a reasonable income and preservation of capital.

GLOSSARY
M-7
Rate of Return - (1) The yield obtainable on a security based on its purchase price or its current market price. (2) Income earned on an investment, expressed as a percentage of the cost of the investment. Refunding – Refunding is a procedure whereby an issuer refinances an outstanding bond issue by issuing new bonds. These are generally two major reasons for refunding: to reduce the issuer’s interest costs or to remove a burdensome or restrictive covenant imposed by the terms of the bonds being refinanced. The proceeds of the new bonds are either deposited into escrow to pay the debt service on the outstanding obligations when due, or they are used to immediately retire the outstanding obligations. The new obligations are referred to as the refunding bonds and the outstanding obligations being refinanced are referred to as the refunded bonds or the prior issue. Repurchase Agreement (RP OR REPO) - A holder of securities sells these securities to an investor with an agreement to repurchase them at a fixed price on a fixed date. The security “buyer” in effect lends the “seller” money for the period of the agreement, and the terms of the agreement are structured to compensate him for this. Dealers use RP extensively to finance their positions. Exception: When the Fed is said to be doing RP, it is lending money, which is, increasing bank reserves. Reserve – Those portions of the fund balance which must be segregated for some future use and which is, therefore, not available for further appropriation or expenditure. Resolution – A special or temporary order of a legislative body; an order of a legislative body requiring less legal formality than an ordinance or statute. Safekeeping - A service to customers rendered by banks for a fee whereby securities and valuables of all types and descriptions are held in the bank’s vaults for protection. Secondary Market - A market made for the purchase and sale of outstanding issues following the initial distribution. Securities & Exchange Commission (SEC) - Agency created by Congress to protect investors in securities transactions by administering securities legislation. SEC RULE 15C3-1: See Uniform Net Capital Rule. Secondary Market - A market for the repurchase and resale of outstanding issues following the initial distribution. Securities - Investment instruments such as notes, bonds, stocks, money market instruments and other instruments of indebtedness or equity. Self Insurance – The retention by an entity of a risk of loss arising out of the ownership of property or from some other cause, instead of transferring that risk to an independent third party through the purchase of an insurance policy. Special Assessment – A compulsory levy made against certain properties to defray all or part of the cost of a specific capital improvement or service deemed to benefit primarily those properties.

GLOSSARY
M-8
Spread - The difference between two figures or percentages. It may be the difference between the bid (price at which a prospective buyer offers to pay) and asked (price at which an owner offers to sell) prices of a quote, or between the amount paid when bought and the amount received when sold. Structured Notes - Notes issued by Government Sponsored Enterprises (FHLB, FNMA, SLMA, etc.) and corporations which have imbedded options (e.g., call features, step-up coupons, floating rate coupons, and derivative-based returns) into their debt structure. Their market performance is impacted by the fluctuation of interest rates, the volatility of the imbedded options and shifts in the shape of the yield curve. Taxes – Taxes are compulsory charges levied by a government for the purpose of financing services performed for common benefit. This term does not include specific charges made against particular persons or property for current or permanent benefits such as special assessments. Neither does the term include charges for services rendered only to those paying such charges, such as water service. Tax Rate – The tax rate is the amount of tax levied for each $100 of assessed valuation. Transfers – Transfers are the authorized exchanges of cash or other resources between funds. Treasury Bill - A non-interest bearing discount security issued by the U.S. Treasury to finance the national debt. Most bills are issued to mature in three months, six months, or one year. Treasury Bond - A long-term coupon-bearing U.S. Treasury security issued as a direct obligation of the U.S. Government and having an initial maturity of more than ten years. Treasury Note - A medium-term coupon-bearing U.S. Treasury security issued as a direct obligation of the U.S. Government and having an initial maturity from two to ten years. Trust Fund – A trust fund consists of resources received and held by the government unit as trustee, to be expended or invested in accordance with the conditions of the trust. Uniform Net Capital Rule - Securities and Exchange Commission requirement that member firms, as well as nonmember broker/dealers in securities, maintain a maximum ratio of indebtedness to liquid capital of 15 to 1; also called net capital rule and net capital ratio. Indebtedness covers all money owed to a firm, including margin loans and commitments to purchase securities, one reason new public issues are spread among members of underwriting syndicates. Liquid capital includes cash and assets easily converted into cash. Utility Users Tax – Charge levied on the utility user’s bills for the purpose of financing services for the common benefit of the tax payer. Yield - The annual rate of return on an investment expressed as a percentage of the investment. Income yield is obtained by dividing the current dollar income by the current market price for the security.

GLOSSARY
M-9
Yield Curve - Yield calculations of various maturities of instruments of the same quality at a given time to observe spread differences.
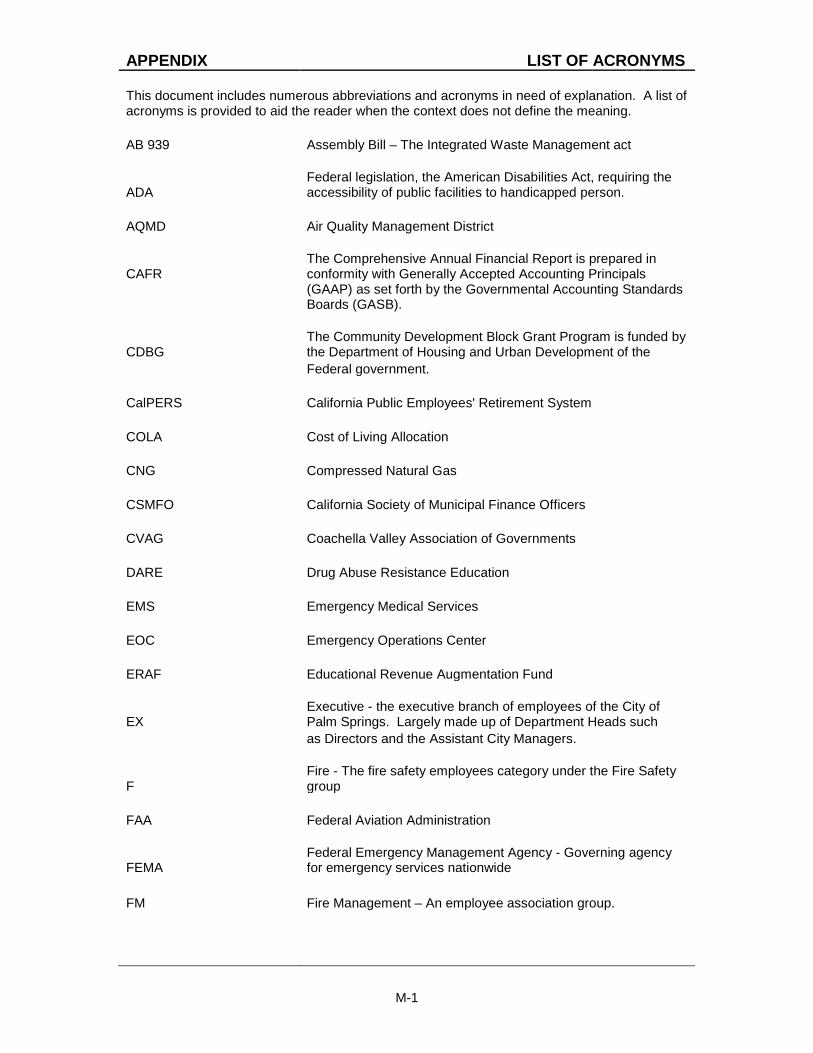
M-1
APPENDIX LIST OF ACRONYMS This document includes numerous abbreviations and acronyms in need of explanation. A list of acronyms is provided to aid the reader when the context does not define the meaning. AB 939 Assembly Bill – The Integrated Waste Management act
ADA Federal legislation, the American Disabilities Act, requiring the accessibility of public facilities to handicapped person.
AQMD Air Quality Management District
CAFR The Comprehensive Annual Financial Report is prepared in conformity with Generally Accepted Accounting Principals
(GAAP) as set forth by the Governmental Accounting Standards Boards (GASB).
CDBG The Community Development Block Grant Program is funded by the Department of Housing and Urban Development of the
Federal government. CalPERS California Public Employees' Retirement System COLA Cost of Living Allocation CNG Compressed Natural Gas CSMFO California Society of Municipal Finance Officers CVAG Coachella Valley Association of Governments DARE Drug Abuse Resistance Education EMS Emergency Medical Services EOC Emergency Operations Center ERAF Educational Revenue Augmentation Fund
EX Executive - the executive branch of employees of the City of Palm Springs. Largely made up of Department Heads such
as Directors and the Assistant City Managers.
F Fire - The fire safety employees category under the Fire Safety group
FAA Federal Aviation Administration
FEMA Federal Emergency Management Agency - Governing agency for emergency services nationwide
FM Fire Management – An employee association group.

M-2
APPENDIX cont. FTE Full Time Equivalent – usually refers to allocation count for employees
GFOA Government Finance Officers Association is a non-profit professional association serving 9,500 government finance
professionals throughout North America. Over 11,000 governments participate actively in the Association’s activities.
GIS Computer-based Geographic Information System designed to track and monitor development projects
GPS Global Positioning System GU General Unit – An employee association group. HVAC Heating, Ventilation and Air Conditioning HUD Housing and Urban Development
MAPS Management Association of Palm Springs – The administration & professional association group.
MOU Memorandum of Understanding - the employee contracts with the City.
MX Management - The management category under the MAPS group.
NPDES National Pollutant Discharge Elimination System PERS California Public Employees Retirement System
P Police - The police safety employees’ category under the Police Safety group.
PM Police Management
POST Peace Officer Standards and Training Act which regulates law enforcement standards
PS Professional Services - the professional staff category under the MAPS group.
PSC Professional Services Confidential – Employees under the MAPS group.
RDA The Redevelopment Agency of the City of Palm Springs SDF Special Distribution Fund TOT Transient Occupancy Tax UUT Utility Users Tax