Coordination Between Fission Yeast Glucan Formation and Growth Requires a Sphingolipase Activity
Upload
independentCategory
view
3download
0
High-Starch and High-3-Glucan Barley Fractions Milledwith Experimental Mills
Rolando A. Flores, 1.2 Kevin B. Hicks,' Dale W. Eustace, 3 and John Phillips'
HI
ABSTRACT Cereal Chem. 82(6):727-733
This study focused on the performance of two hulless barley cultivars(Doyce and Merlin) and one commercial husked (hulled) sample usingexperimental milling. The purpose was to use experimental milling as apreliminary indicator of the milled streams with potential use for fuelethanol production and fractions that could he used in food products.Experimental mills designed for flour production evaluation from wheatwere Chopin ('1)1 Auto, Quadrumat Sr. Buhler, and an experimental Rossroller mill walking flow. Results indicate that the shorts had the highestlevels of -glucan from all the mills. However, the (-glucan content in the
Barley has traditionally been used in the brewing and feed indus-tries. New cultivars are being developed that widen the applicationsof this crop to nontraditional food and nonfood value-added ap-plications such as ethanol production. Hulless (hull-less) or nakedcultivars present new alternatives and processing or evaluationchallenges (Bhatty 1999b). Dry milling of barley for fractionationPurposes is considered a viable process for isolating valuable com-ponents of hulless and hulled (husked) barley such as -glucan-rich streams (Sundberg and Aman 1994: Andcrsson et a! 2000:Warpala and Pandiella 2000; Wu and Doehlert 2002; lzydorczyket al 2003).
Experimental milling is a well-established tool used by millersto evaluate commercial samples before processing a batch of wheatin the flour mill (Kim eta] 1995). Most of the experimental millingtechniques are based on the utilization of a milling unit designedfor that purpose such as the Buhler. Chopin. or Quadrumat (Jr andSr) experimental mills, among other types. Alternatively, mill walk-ing flows are developed by millers to approximate the millingresults and conditions in a given flour mill using different particlereduction equipment.
As new barley cultivars are developed and new processes de-signed to use some major components of that crop, experimentalprocedures for milling the samples need to he developed to deter-mine the potential of a new cultivar based on the final applicationof the product. The fractionation of barley using dry milling is im-portant not only for the production of bread and similar productsand high 3-glucan fractions, but also for alternative utilization inethanol production. We are interested in dry fractionatin g barleyinto high and low starch fractions for fuel ethanol production andhealthy food ingredients, respectively. Experimental milling resultscould assist in the determination of the potential of a barleycultivar in ethanol production with a dry fractionation process infront of the liquefaction and saccharification.
Crop Conversion Science and Engineering Research Unit, Eastern RegionalResearch Center, Agricultural Research Service, U.S. Department of Agriculture,600 East Mermaid Lane, Wyndmoor, PA 19038. Names are necessary to reportfactually on available data: however, the USDA neither guarantees nor warrantsthe standard of the product, and the use of the name by the USDA implies noapproval of the product to the exclusion of others that may also be suitable.
2 Corresponding author. Phone: 215-233-6489. Fax: 215-233-6406. E-mail:[email protected] of Grain Science and Industry, Kansas State University. Manhattan. KS..North Atlantic Area, Agricultural Research Ser ice. U.S. Department of Agricul-ture. 600 East Mermaid Lane. Wyndmoor, PA 19038.
001: 10.1094/CC-82-0727This article is in the public domain and not copyrightable. It may be freely re-printed with customary crediting of the source. AACC International, Inc., 2005.
break flours was highest with the roller mill walking flow and the ChopinCDI for the hulless cultivars. The lowest 3-glucan content in the breakflour was found with the Buhier for Doyce. Break flour and, to a slightlylesser extent, reduction flour from all cultivars tested on all mills con-tained the highest starch content (tip to 83%) and are therefore mostappropriate for use as feedstock for fuel ethanol production. Conversely.bran and shorts from all cultivars and mills were lowest in starch (as lowas 25%), making them ideal as low-starch food ingredients.
Therefore, the objective of this study was to evaluate two hullessbarley cultivars (Doyce and Merlin) and one commercial hulledsample using three experimental milling procedures as preliminaryindicators of the milled streams with potential use for fuel ethanolproduction and fractions that could be used in food products.
MATERIALS AND METHODS
MaterialsThree barley samples, two hulless and one commercial hulled,
were used in this study. The hulless samples were I) Merlin, a two-row spring barley cultivar harvested in 2002 from Three Forks.MI: and 2) Doyce, a six-row winter barley. harvested in 2002from Mt. Holly, VA. The commercial hulled sample was a mix ofbin winter barley #3 cultivars harvested in 2003 and procured inRidgely, MD. The moisture content of the samples was 10.9. 13.9and 11 .9% (wb) for Merlin. Doyce and commercial hulled barleys.respectively.
MethodsThe clean samples were processed in experimental mills accord-
ing to the manufacturers unaltered flows: CDI Auto (Chopin.92396 Vi I leneuve-la-Garenne. France). Quadrumat Sr (Brabender.Duisburg. Germany). and MLU-202 (Buhler. Uzwil, Switzerland)with a 0,076-mm roll gap for the second break. Also, the sampleswere processed in a simplified short-walking Ross rolls flowshown in Fig. I.
Two types of runs were conducted in the Chopin CDI Autowith Merlin and commercial hulled barley. One run was identifiedas Chopin I-pass and the other run as Chopin 2-pass. In theChopin I-pass, the barley was run through the mill and resultswere recorded. In the Chopin 2-pass, the barley was run oncethrough the mill, then the reduction bran stream was run oncemore to optimize the flour extraction of the mill. The streamsproduced from the Chopin CDI were break bran, redo break bran,break flour, redo break flour, reduction flour, redo reduction flour,and redo reduction bran. These seven streams were combined intobreak flour, shorts and fine bran (now on shorts), bran (includesthe hulls when hulled barley was milled), and reduction flour.Tempering of barley samples before milling has shown anincrease in the millfeeds material and reduced the flour products(Izydorczyk et al 2003). However, to achieve better results, samplesprocessed in the Chopin CD were conditioned to 16% moisture(wb) for 20 hr before milling. An additional run was processed inthe Quadrumat Sr with Merlin barley tempered at 15.5% for 18 hr.No tempering was done with the other experimental millingprocesses. The average milling rate was 69.5 g/min in the Chopin
Vol. 82, No. 6, 2005 727

CD 1 for all samples, and 130 g/min for the hulless barley and 70g/min for the hulled barley in the Quadrumat Sr and Buhlerexperimental mills.
The moisture measurement of the grain samples was conductedaccording to Method S352.2 (ASAE 2003b). The physical andchemical analyses of the milling streams were conducted using theApproved Methods 55-10, 44-19, 08-01, 46-30, 32-32, and 76-13for test weight, moisture, ash, protein, -glucan. and starch, respec-tively (AACC International 2000). Thousand kernel weight wascalculated counting the kernels in a 40-g sample of clean andwhole barley kernels using a Count-A-Pak seed totalizer (model77, Scedburo, Chicago, IL). Lipid content of the grains was deter-mined using the accelerated solvent extraction method (Moreau etal 2003). The color measurement of the flour streams was con-ducted using a spectrophotomcter (ColorQuest XE, Hunter Associ-ates Laboratory, Reston, VA) with the CIE Lab color scale (L*,a*, and b*) . Particle size analyses of the milled streams wereconducted by determining geometric mean diameter and standarddeviation of the streams using Method S319.3 (ASAE 2003a).
Statistical AnalysesAll tests were conducted in triplicate. The data were analyzed
using analysis of variance to determine the effects and inter-actions of the experimental factors such as milling method, cultivar,and milling stream on the various measured responses. Meanseparations were performed using the Bonferroni LSD technique.The level of significance referred to in this study is a = 0.05.
RESULTS AND DISCUSSION
The researchers were interested in fractionating barley into highand low starch fractions for fuel ethanol production and healthyfood ingredients, respectively. Therefore, experimental milling isexpected to be of assistance in identifying potential cultivars andin evaluating dry milling streams.
The commercial and chemical characteristics of barley samplesstudied are shown in Table I. The commercial hulled barleysample (hulled) had a significantly lower test weight than Merlinand Doyce samples due to the lack of hull in the Merlin andDoyce samples. The highest thousand kernel weight (TKW) corres-
ponds to hulless barleys; Merlin was the highest of all (39.9 g),followed by Doyce (29.9 g), and the lowest was hulled barley(28.0 g). Also, the hulled barley had the highest ash content (2.4%db); however, it was not significantly different from that of Merlin(2.3% db). The Doyce sample had the highest starch content(66.5% db) and lowest amount of lipids (1.9% db), which wereboth significantly different from those of Merlin and hulledbarleys. The 3-glucan (6.2% db) and protein (15.2 17c dh) contentsof Merlin were significantly higher; the levels of Merlin for -glucan and protein were 1.4 and 1.8 times higher, respectively, thanthe levels of the other two samples, which were not significantlydifferent in 0-glucan and protein contents among themselves.
The characteristics under study were milling yields, moisture,ash, 0-glucan. starch, protein, color, and particle size. To evaluatethe streams from each milling procedure, the streams produced byeach experimental mill were arranged into four major streams:break flour, reduction flour, shorts, and bran.
Flour YieldTable II shows the flour yields obtained from the experimental
milling procedures. The highest amount of break flour was obtainedfrom Merlin under the walking Ross rolls flow (33%). The breakflour yield produced from Merlin was 11% more than thatproduced from Doyce when the same walking Ross rolls flow wasused for both barleys. Merlin was a plumper kernel than Doycewith very similar test weights 058 Ib/bu) but a 33% higher TKW.The hulled barley showed the lowest break flour yield with theBuhler. A comparison of the milling methods and the cultivarsshowed that the Buhler produced the largest amount of reductionflour with Doyee (45%). For shorts production, the walking Rossrolls flow produced the highest yield with Doyce (51%) and thesecond highest with hulled barley (37%). The Buhler experi-mental mill produced the largest yield of shorts from Merlin(39%), closely followed by the hulled barley (38%). The Chopin2-pass of Merlin produced a more even distribution of streamsthan the Chopin I-pass because the 2-pass redistributed the amountof bran mostly to shorts (+12%) and flours (+2%).
From a statistical point of view, the interactions of the millingmethod. cultivar, and milling stream on milling yield were notsignificantly different.
Roll Differential 2.5:1
16/16 Grinding Action Dull:Dull
.018' Roll Gap28/28
.001" Roll Gap
Shorts9 x
Break Flour
28/28T .001" Roll Gap
40W I i Shorts9 xx
Reduction Flour
Break Flour
* Bran34W
Break Flour
28/28.002" Roll Gap
34W1 Shorts
Break Flour
Fig. 1. Simplified short-walking Ross rolls flow.
728 CEREAL CHEMISTRY

For evaluation purposes, an additional run was processed in theQuadrumat Sr mill with Merlin barley tempered at 15.5% for 18hr. Comparing the untempered versus the tempered results for theMerlin samples, the break and reduction flour yields as well asthe shorts yields decreased from 19 to 17%, from 21 to 12%. andfrom 25 to 14%. respectively. In turn, the bran yield increasedfrom 35 to 63%. Thus, the tempering increased the millfeedsmaterial and reduced the flour products. This finding is consistentwith similar findings regarding other hulless cultivars previouslymilled (Bhatty 1997; Kiryluk et al 2000; Izydorczyk et al 2003).Tempering is used in wheat milling to assist in the separation ofthe bran; however in Merlin the results were not as definitive. The
increase in the bran yield could be the result of a different aleuronelayer structure of Merlin barley when compared with wheat.Because the tempered run was used for evaluation purposes, othercharacteristics of Merlin tempered streams were not evaluated;therefore, the tempering conditions need to be studied further.
Bhatty (1999a) milled Merlin barley in a Buhler mill under con-ditions similar to the ones use in this study. Bhatty indicated thatthe flour extraction was inversely proportional to the -glucancontent. Bhatty reported combined flour yield for the Merlin was45.1%, while in this study we obtained 24% for J3-glucan barleyof 6.2% dh. Bhatty reported a -glucan content of 6.4% withoutindicating dry or wet basis; nonetheless, differences in f3-glucan
L
TABLE ICharacteristics of Unprocessed Barley Samples"
BarleyTest Wt (lb/bu)1000 Kernel Wt (g)Ash (% db)-Glucan (% db) Starch (% db)Commercial (hulled)47.7 ± 0.3b28.0 ± 0.1c2.4 ± 0. 1 4.3 ± 0.1b55.3 ± 1.3bMerlin (hulless)57.8 ± 0.3a39.9 ± 0.2a2.3 ± 0.Oa6.2 ± 0.2a57.0 ± l.lhDoyce (hulless)58.4 ± 0.2a29.9 ± 0.1 b1.9 ± 0.Ob4.0 ± 0.1b66.5 ± 1.2a
Mean values ± one standard deviation. Values followed by the same letter are not significantly different (P <0.05).
Lipids (% dh) Protein (% db)
2.07 ±0.03h8.3 ± (l.lh
2.52 ± 0.09a15.2 ± 0.4a
1.87 ± 0.01c8.7 ± 0. 1 b
Barley Mill StreamMilling yields (;
DoyceBranShortsReduction flourBreak flour
MerlinBranShortsReduction flourBreak flour
Commercial hulledBranShortsReduction flourBreak flour
Moisture (%. wb)Doyce
BranShortsReduction flourBreak flour
MerlinBranShortsReduction flourBreak flour
Commercial hulledBranShortsReduction flourBreak flour
Ash (%. db)Doyce
BranShortsReduction flourBreak flour
MerlinBranShortsReduction flourBreak flour
Commercial hulledBranShortsReduction flourBreak flour
Chopin (2-pass)
20302228
2625
27
10.19.28
12.214.6
8.409.06
13.016.7
3.273.211.461.07
4.453.361.201.1)7
TABLE IfMilling Yields, Moisture, and Ash of Milled Streams
Buhier Ross RollsQuadrumat SrChopin (1-pass)
12
7
1618
SI
2845
20
3125
22
25
37
17
35
3739
7
25
18IS
43
21
209
33
19
26
26
29
23 3638
37
29 1926
14
26 2210
20
22 23
8.15
7.82
8.607.77
8.14
9.028.16
9.05
9.898.59
9.90
10.8
7.89
8.34
8.13
10.77.49
7.69
8.24
8.927.80
8.37
9.27
11.77.88
9.05
1(1.1
13.7
5.94
6.52
6.54
9.586.95
6.30
8.68
9.387.85
8.31
9.82
12.87.67
9.35
10.6
16.3
2.84
2.8
2.92.62
3.48
3.051.14
2.61
1.721.04
1.02
0.86
2.22
3.12
2.57
3.032.71
2.89
2.76
3.381.46
2.59
2.2
1.501.35
1.29
0.97
1.09
2.82
2.54
3.23
4.032.45
3.42
2.99
3.231.39
2.75
1.53
1.261.49
1.37
1.29
1.12
Vol. 82, No. 6, 2005 729
were relatively minor and the difference in the flour yield mustalso he attributed to some other factor such as the much largerTKW of Merlin barley milled by Bhatty (50.5 g) compared withthe one used in this study (39.9 g). The assertion that the 3-glucancontent negatively affects the flour yield was found herein for theBuhler and Quadrumat milling methods. In our study, the flouryield for Merlin was 46 and 16% lower than Doyce in the Buhlerand Quadrumat, respectively. Nonetheless, in the walking Rossrolls flow. Merlin had a 34% higher flour yield than Doyce as aresult of using a more flexible and adjustable milling flow whencompared with the less flexible methods in the Buhler, Quadru-mat, and Chopin. However, the Buhler and Quadrumat are lesssusceptible to operator effect and thus more suitable for uniformcomparison of barleys. To produce a wider classification of theflours, additional sieving could have been conducted on the flourstreams produced by the different milling methods but it wasoutside the scope of this study. Sundberg and Aman (1994) usedadditional sieving on flour streams produced with a similar Buhlersystem on hulless barleys to identify other components such asxylan, cellulose, and Kiason lignin in addition to 3-glucan. Also,
Izydorczyk et al (2003) developed and optimized a long millingflow that allowed them to obtain fiber-rich fractions.
MoistureMoisture distribution in the milled streams obtained from the
different milling methods is shown in Table II. Table 11 showsresults for the tempered barleys processed in the Chopin I-passand 2-pass methods. Thus, the streams with the highest moisturecontent were the ones resulting from the Chopin CD I. the moisturecontent of these streams were significantly different from the mois-ture content of all the other streams as a consequence of thetempering. The moisture range for all the other untcnipercd streamswas 6.3-10.76% (wh) for the hulled shorts and the Doyce breakflour. There was evidence that all two-factor interactions were sta-tistically significant. Excluding the stream moisture results of theChopin, the bran and shorts streams were not significantly differentwhen the milling methods are compared. However, the break andreduction flours are not significantly different between the Quadru-mat and Ross rolls and between the Ross rolls and Buhlcr methods;but significantly different between the Buhler and Quadrumat.
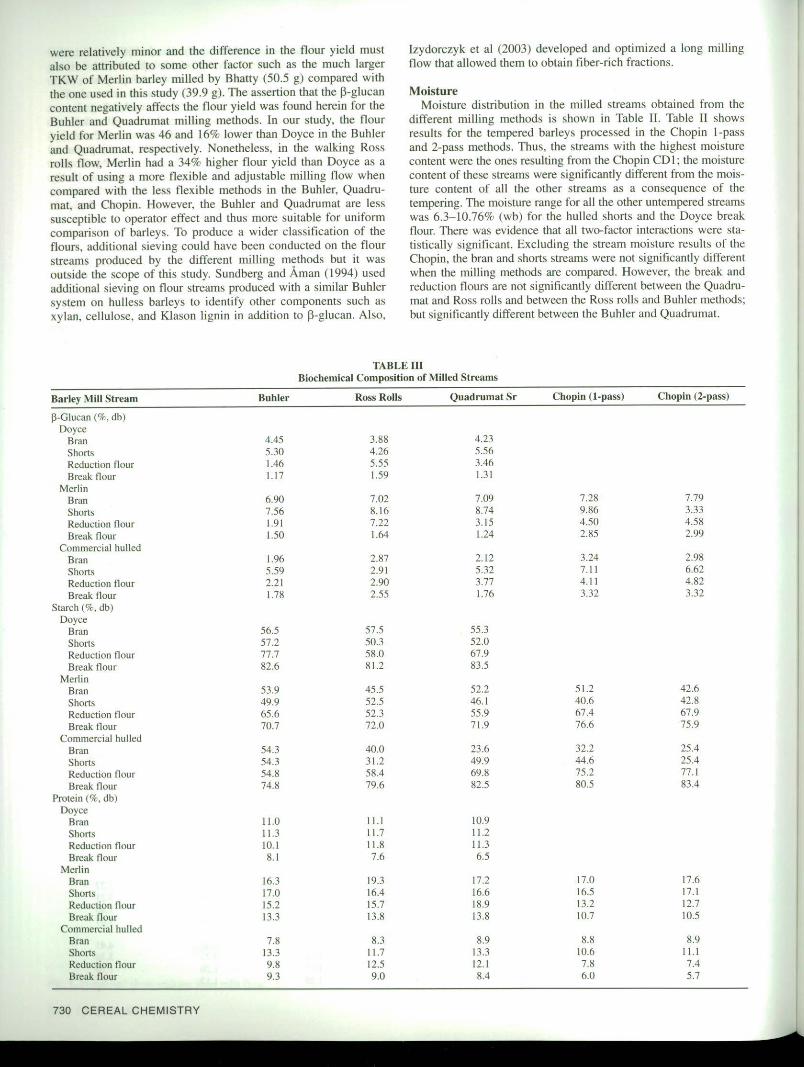
Barley Mill Stream13-Glucan (91-. db)
DoyceBranShortsReduction flourBreak flour
MerlinBranShortsReduction flourBreak flour
Commercial hulledBranShortsReduction flourBreak flour
Starch (9'r. db)Doyce
BranShortsReduction flourBreak flour
MerlinBranShortsReduction flourBreak flour
Commercial hulledBranShortsReduction flourBreak flour
Protein (%, db)Doyce
BranShortsReduction flourBreak flour
MerlinBranShortsReduction flourBreak flour
Commercial hulledBranShortsReduction flourBreak flour
TABLE IIIBiochemical Composition of Milled Streams
Buhler Ross RollsQuadrumat Sr
4.45
3.88 4.23
5.30
4.26 5.56
1.46
5.55 3.46
1.17
1.59 1.31
6.90
7.02
7.09
7.56
8.16
8.74
1.91
7.22
3.15
1.50
1.64
1.24
1.96
2.87
2.12
5.59
2.91
5.32
2.2
2.90
3.77
1.78
2.55
1.76
56.5
57.5
55.3
57.2
50.3
52.0
77.7
58.0
67.9
82.6
81.2
83.5
53.9
45.5
52.2
49.9
52.5
46.!
65.6
52.3
55.9
70.7
72.0
71.9
54.3
40.0
23,6
54.3
31.2
49.9
54.8
58.4
69.8
74.8
79.6
82.5
11.0
11.1
10.9
11.3
11.7
11.2
10.1
11.8
11.3
8.1
7.6
6.5
16.3
19.3
17.2
17.0
16.4
16.6
15.2
15.7
18.9
13.3
13.8
13.8
7.8
8.3
8.9
13.3
11.7
13.3
9.8
12.5
12.1
9.3
9.1)
8.4
Chopin (t-pass)
7.289.864.502.85
3.247.114.113.32
51.240.667.476.6
32.244.675.280.5
17.016.513.210.7
8.80.67.86,0
Chopin (2-pass)
7.793.334.582.99
2.986.624.823.32
42.642.867.975.9
25.425.477.183.4
17.617.!12.710.5
8.911.17.45.7
730 CEREAL CHEMISTRY

AshAsh content in a flour stream is an indicator of the presence of
pericarp material for hulless barley and also hulls for hulledbarley. The largest amount of ash was obtained from the branstreams (4.45% db) of the hulled barley with the Chopin 2-pass,as a result of having the hulls in these streams (Table II). Becausehulled barley has the hull attached to the kernel, the ash content isslightly larger in hulled than in hulless kernels (2.36% db). Allexperimental mill processes allocated the streams with the largestamount of ash to the shorts and bran for the hulless barleys, andto the shorts, bran and reduction flour for the hulled barleys. Thiscould indicate that some hull was ground into the reduction flourfor the hulled barley. All systems produced less ash in break flour.
The statistical evaluation of the interaction of the three factorsstudied indicated that there was no evidence of a significantcultivar effect while there was a significant milling method andmilling stream interaction effect. The bran and shorts streams hadsignificantly larger amounts of ash when compared with the flourstreams, regardless of the type of barley milled, for all millingmethods. However, on the average, the Buhler mill produced branand shorts with lower ash contents than the other mills. The ashcontent of the break flour was significantly lower only for theRoss rolls walking flow. For the other milling methods (Buhier.Chopin 1-pass and 2- pass. and Quadrumat), the ash contents ofthe break and reduction flours were not significantly different.
-GlucanFor the Doyce barley, the highest J3-glucan yielding streams
were found in the shorts of the Buhler and the Quadrumat Srmills, and in the reduction flour of the walking Ross rolls flow, allbetween 5.3 to 5.6 1/c db (Table Ill). Merlin shorts had the highestf3-glucan content for the Buhler, walking Ross rolls flow, andQuadrumat mills. However, the highest -glucan Merlin streamwas found in the shorts produced with the Chopin 1-pass (9.9%).The Chopin 2-pass redistributed Merlin fi-glucan material moreinto the bran stream, from 9.9 to 3.3% db. The milling yields ofMerlin shorts and bran streams went from 18 and 37% for theChopin 1-pass. to 30 and 20% for the Chopin 2-pass (Table 11),respectively. In the hulled barley, the streams with the highestcontent of 3-g1ucan corresponded to the shorts for the Chopin I -pass (7.1% db) and Chopin 2-pass (6.6% db). respectively.
There was no evidence of an overall significant effect of themilling method, while there was a significant cultivar and millingstream interaction effect on the 3-glucan yields. Regardless of themilling method, the -glucan content was highest in the shorts andlowest in the break flour for the interaction of all three barleys. Asimilar finding was reported by Kiryluk et al (2000) using aQuadrumat Jr. Additional grinding and air classification has beenused to increase the -glucan content of selected milling of streamsbarley and oats (Andersson et al 2000: Wu and Doehlert 2002).
StarchAs expected, the highest concentration of starch was found in
the break and reduction flours for all barleys under all processes(Table 111). For Doyce, the highest concentration of starch was ob-tained in the break flour produced with the Quadrumat Sr (83.5%db) and Buhler (82.6% db) experimental mills, followed closelyby the walking Ross rolls flow (81.1% dh). The Merlin reductionflour had a starch range for all milling processes of 52.3-67.9%(db). The bran and shorts streams produced by the Buhler hadsimilar starch level ranges; the difference went from 0.7 to 3.9%,a low difference for the magnitude of the starch recovered.
When the mean values of the experimental factors were statis-tically analyzed, it was found that there was no evidence of inter-action among the milling method, cultivar, and milling stream:however, there were significant cultivar and milling stream inter-action effects. Doyce was significantly different from hulled andMerlin barleys: this difference was a result of the original starchcontent of the unprocessed seed (Table I). The starch contents ofthe break and reduction flour streams were significantly differentamong them and were also significantly different from the bran andshorts streams: however, the bran and shorts streams were not sig-nificantly different among themselves. A coefficient of determina-tion of 0.845 was found between the ash and starch contents rela-tionship for all the milling streams.
ProteinThe protein streams were similar among all milling methods
for the shorts and bran from Doyce (Table Ill). For Doyce flourprotein content, the numbers for the reduction flour were higherfor the walking Ross rolls flow and lowest for the break flour;alternatively, the protein for Doyce flour was higher in thereduction than in the break flour with the Quadrumnat Sr. With theexception of the break flour stream, the Merlin streams with theBuhler process were evenly distributed at 15.1-17.0% (db). Withthe walking Ross rolls flow, the highest protein for Merlin wasfound in the bran stream (19.3% db). Merlin shorts and branshowed the highest concentration of protein with the Chopin 1-pass or 2-pass (16.5-17.6% db). The hulled barley had the lowestprotein levels in the break flour streams of the samples processedin the Chopin CD (6.0% db for the I-pass and 5.7% db for 2-pass, respectively).
There was no evidence of the interaction of the three maineffects, while there was a significant milling method and millingstream interaction effect and 'a significant barley and millingstream interaction effect. Therefore. the protein content for all thebarleys under all milling methods was significantly lowest in thebreak flour. However, for the hulled barley, the protein contentdifference between the bran and break flour streams was notsignificantly different. For Doyce, the bran, reduction flour, andshorts were not significantly different.
TABLE IVColor Parameters for Average Interaction Between Barley and Milling Streama
Barley Sample Milling Stream b*
Commercial hulled Bran 76.5 ± 3.6c 2.5 ± 0.4a 12.1 ±0.6aShorts 81.1 ±3.8bc 1.9 ± 0.5ab 9.5± 1.2bReduction flour 87.3 ± 3.9a-c 1.2 ± 0.6c-e 7.4± l.3hcBreak flour 88.6 ± 3.3ab 1.0 ± 0.5d-f
6.5± I.3cMerlin Bran 89.5 ± 1.5ab 1.3 ±U.2c-e 9.3± I.lh
Shorts 88.7± l.Oab 1.4 ± 0.2b-e 9.4 ± 0.7bReduction flour 90.8 ± 2.Oab 0.7 ± 0.4ef 7.7 ± 0.8heBreak flour 92.8± l.7a 0.5 ± 0.2f 6.6 ± 0.3c
Doyce Bran 76.8 ± 15,5c 1.6± 0. lb-d 9.1 ± l.4bShorts 85.0 ± I ,6a.-c 1.7 ± 0.1bc 9.1 ± 1.4bReduction flour 90.2 ± 4. lab 0.8 ± 0.5ef 7.3 ± 0.9bcBreak flour 92.6 ± USa 0.5 ± 0.lf 6.7 ± USc
a Averaged value for all milling streams and milling methods for each barley cultivar. Mean value ± one standard deviation. Values followed by the same letter arenot significantly different (P <0.05).
Vol. 82, No. 6, 2005 731

ColorThe color data shown in Table IV are the resulting averages for
the significant double interaction between the type of barley andthe milling stream for the L 5, a, and b* tristimulus parameters.The measure of lightness (L*) for Doyce and hulled bran were notsignificantly different among themselves but were significantlydifferent from the other streams and barleys. The flour Lightnesswas higher for the hulless than the hulled barley streams as aconsequence of the hull and pericarp particles present in the flour,even though this difference was not statistically significant. TheL* values found in this study are lower than the values reportedby lzydorczyk et at (2003) using a long flow roller milling withhulless barley cultivars. The level of redness (+a*) proved to be asignificantly different parameter when the bran and shorts werecompared with the flours. The level of yellowness (+b*) wassignificantly different for the hulled bran stream because of thehull presence. For the interaction of the milling stream and millingmethod, the only significant color parameter was a*. In the doubleinteraction between the barley type and milling stream, the branand shorts were significantly different from the two flour steams.The double interaction between the milling method and barleytype was significant for the a* parameter. The hulled barley wassignificantly different for all the milling methods with theexception of the Chopin 1-pass.
The relationship between the chemical characteristics of eachstream and the color parameters was investigated using all thestreams as a data source. There were correlations between the ashand starch of each stream and the color tristiniulus parameters.The coefficients of determination for ash were 0.47, 0.60, and0.71 for L 5, a 5, and b 5, respectively; and for starch they were0.49. 0.60. and 0.73 for L5, a,, and b 5, respectively.
Particle SizeThe particle size analysis was based on the determination of the
geometric mean and standard deviation for each stream. As ex-pected, the statistical analyses of the resulting data indicated thatthere was evidence of significant milling method by milling streaminteraction and cultivar by milling stream interaction. Table Vshows the geometric particle size mean diameter results (±1 SD).The geometric mean diameter was 214.5-381.1 I.tm for the shorts,330.6-385.7 .tm for bran. 69.1-224.0 pm for break flour, and88.1-262.8 j.tm for reduction flour. Even though from a statisticalpoint of view there are significant differences, the milled streamsare within close ranges. with the exception of the commercial
hulled barley break flours for the Buhler and Ross walking flows.The Quadrumat Sr produced the milled streams with lowestparticle size range for all barleys milled within a given stream.
In the identification of potential barley cultivars for ethanolproduction, the goals of the researchers are the production of highstarch fractions for fermentation and low starch fractions forhealthy food ingredients. One example, focusing on starch levelsin one of the best fractions, was the Doyce break flour from theBuhler mill. It has 83% starch, an increase of 18% over thestarting grain. The yield is 25%. The reduction flour has 78%starch and a yield of 45%. Combining these two fractions gives
70% of the original mass that contains 85% of the starch. Use ofthese fractions together for fermentation could give higherfermentable solids and higher ethanol concentrations, makingethanol production more efficient. The remaining two fractions,containing high levels of pericarp and dietary fiber and lowerstarch concentrations (56.5%) could be useful for lower carbohy-drate food ingredients. The hulled barley, which is a typical MidAtlantic cultivar, has a very low starch level of 55%, which wouldpreclude its use as an efficient feedstock for fuel ethanol. TheChopin 2-pass break flour from this hulled barley has a yield of
28% and has a remarkable starch content of 83%, an enrichmentapproaching 30%. The reduction flour from the same mill has77% starch and a yield of 22%. Combining these two fractionswould give a yield of >50% flour containing almost 81% starch.The shorts and bran fraction, containing very low levels of starch(25%) could be very useful as a low starch, high dietary fiber. 13-glucan-enriched food ingredient. As mentioned earlier, these millingsystems were developed primarily for wheat. Optimization andmodifying them for hulled and hulless barley could yield evenbetter enrichment of starch and nonstarch fractions. In this regard.the Ross rolls flow is a very flexible option for the dry fraction-ation before ethanol production.
CONCLUSIONS
The experimental milling techniques evaluated in this studyused equipment and flows that were designed for wheat flourproduction. Nonetheless, the techniques studied on the threebarley cultivars provide guidance for their application dependingon the final utilization of the barley. Ultimately, the final use of agiven barley (ethanol production in our case) is what is going todetermine which procedure is appropriate for the barley. Eventhough the tested processes were not optimized for each cultivar.
TABLE VGeometric Mean Diameter of Milled Streams (i.tm)
Milling Method and Barley Sample Bran Shorts Reduction FlourBreak FlourBuhlcr
Doyce 347 ± 2G 224 ± 2Q 160± 1 144± IXMerlin 361 ± IF
249 ± 20 171 ±2T 155 ± IVCommercial hulled 361 ± IF 215 ± 2R 150± 1W 69 ± 2g
Ross RollsDoyce 378 ± lCD 381 ± IBC 230±2P 107 ± 2dMerlin 379± IBC
375 ± ID 263 ± 2N 176 ± 2S
Commercial hulled 386 ± IA 381 ± I 224 ± 2Q 91 ± 2eQuadrumat Sr
Doyce 360± IF 318± IJ 137 ± 2h 118 ± 2bcMerlin 331 ± 2H 285 ± 2L 146± IX 138 ± IYCommercial hulled 382± lB 281 ± IM 128 ± 2Z 116 ± 2c
Chopin CD (I -pass)Merlin 386± IA 323 ± 1K 125 ± 1 Z 119± lbCommercial Hulled 386± IA 305 ± 1K
88 ± 2e 84 ± 2fChopin CD (2-pass)
Merlin 380± IBC 381 ± I 161 ± IU 224 ± 2Q
Commercial hulled 386± IA 371 ± IE 124 ± 2a 107 ± 2dMean value ± one standard deviation. Values followed by the same letter are not significantly different: capital and lowercase letters indicate significant differences(P< 0.05).
732 CEREAL CHEMISTRY

the results of this study identified that shorts had some of thehighest levels of -gJucan with all milling methods. The 3-glucancontent in the break flours was lowest with the walking flow forthe hulless cultivars versus the hulled barley. The lowest 3-glucanin the break flour was found with the Buhler for the Doyce sampleand with the Quadrumat Sr for the Merlin sample. In terms ofstarch concentration, the break flour streams produced the higheststarch concentration with the Chopin CDI for Merlin and com-mercial hulled barley and with the Quadrumat Sr for Doycehulless barley.
ACKNOWLEDGMENTS
We acknowledge the dedicated collaboration of Bob Whisler of PertenInstruments (Springfield, IL) in milling the samples in the Chopin CDIAuto, and of Karen Kohout, Mike Kurantz, and Robyn Moten of the CropConversion Science and Engineering Research Unit of the ERRC inconducting the chemical analyses.
LITERATURE CITED
AACC International. 2000. Approved Methods of the American Asso-ciation of Cereal Chemists, 10th Ed. Methods 08-01, 32-32, 44-19, 46-30. 55-10, and 76-13. The Association: St. Paul. MN.
Andersson, A. A. M., Andersson, R.. and Aman, P. 2000. Air classi-fication of barley flours. Cereal Chem. 77:463-467.
ASAF. 2003a. Method for determining and expressing fineness of feedmaterials by sieving. ANSIIASAE S319.3. Pages 589-592. The Society:St. Joseph, Ml.
ASAE. 2003h. Moisture Measurement-Unground grain and seed. ASAE
S352.2. Page 593. The Society: St. Joseph, Ml.Bhatty, R. S. 1987. Milling yield and flour quality of hulless barley.
Cereal Foods World 32:268-272.Bhatty, R. S. 1997. Milling of regular and waxy starch hull-less barleys
for the production of bran and flour. Cereal Chem. 74:693-699.Bhatty, R. S. 1999a. 3-Glucan and flour yield of hull-less barley. Cereal
Chem. 76:314-315.Bhatt y, R. S. 1999h. Review: The potential of hull-less barley. Cereal
Chem. 76:589-599.tiydorczyk. M. S.. Dexter, R. G., Dcsjardins. R. G., Rossnagel, B. 0..
Lagassc, S. L., and Hatcher. D. W. 2003. Roller milling of Canadianhull-less barley: Optimization of roller milling conditions and composi-tion of mill streams. Cereal Chem. 0:637-644.
Kim, Y. S., Flores, R. A., Deyoe, C. W.. and Chung. 0. K. 1995. Relationof physical characteristics of wheat blends and experimental milling tosome commercial milling performance parameters. Appl. Eng. Agric.11:699-706.
Kiryluk. J., Kawka, A., Gasiorowski, H., Chalcarz. A.. and Aniola. J.2000. Milling of barley to obtain -glucan enriched products. Nahrung44:238-241.
Moreau, R. A., Powell, M. J.. and Singh, V. 2003. Pressurized liquidextraction of polar and nonpolar lipids in corn and oats with hexane,methylene chloride, isopropanol. and ethanol. J. Am. Oil Chem. Soc.80:1063-1067.
Sundherg. B., and Aman. P. 1994. Fractionation of different types ofbarley by roller milling and sieving. J. Cereal Sci. 19:179-184.
Warpala, 1. W. S., and Pandiella, S. S. 2000. Grist fractionation and starchmodification during the milling of malt. Trans IChemE, Part C, FoodBioproducts Process. 78:85-89.
Wu. Y. V., and Doehlcrt. D. C. 2002. Enrichment of -glucan in oat branby fine grinding and air classification. Lebens. Wiss. Technol .35:30-33.
[Received December 28, 2004. Accepted July 13, 2005.]
Vol. 82, No. 6, 2005 733
IML, ",
Copyright © 2022 FDOKUMEN