Identification of high β-glucan oat lines and localization and chemical characterization of their...
9
Identification of high b-glucan oat lines and localization and chemical characterization of their seed kernel b-glucans Per Sikora a,⇑ , Susan M. Tosh b , Yolanda Brummer b , Olof Olsson c,d a Department of Biology and Environmental Sciences, University of Gothenburg, Box 461, SE-40530 Gothenburg, Sweden b Guelph Food Research Centre, Agriculture and Agri-Food Canada, 93 Stone Road West, Guelph, Ontario, Canada N1G 5C9 c Department of Pure and Applied Biochemistry, Lund University, Box 124, SE 22100 Lund, Sweden d CropTailorAB, c/o Department of Pure and Applied Biochemistry, Lund University, Box 124, SE 22100 Lund, Sweden article info Article history: Received 14 June 2012 Received in revised form 1 October 2012 Accepted 4 October 2012 Available online 22 October 2012 Keywords: Beta-glucan Calcofluor staining Fibre quality Histology Oat Screening abstract Oat, (Avena sativa) is an excellent source of mixed linkage b-glucans ((1 ? 3)(1 ? 4)-b-D-glucan), a die- tary fibre with cholesterol lowering properties. Using a mutagenized oat-population we screened 1700 different lines and identified ten lines that displayed b-glucan levels above 6.7% and 10 below 3.6%. The extreme values were 1.8% and 7.5%. We chose six lines with an increased- and four lines with a reduced b-glucan content for further study. By longitudinal- and cross-sections of seeds it was shown that localization of b-glucan varied between the different lines. In addition, b-glucan quality parameters like molecular weight and solubility were also determined. Although the selection was designed for quantitative differences, qualitative differences between the b-glucans from the different lines were found. The high and low b-glucan lines will now be used as a model system to study molecular regulation of b-glucan biosynthesis as well as possible links between fibre quality and biological activity. Ó 2012 Elsevier Ltd. All rights reserved. 1. Introduction As the incidence of obesity, diabetes and heart disease contin- ues to increase, the importance of a high-fibre diet is becoming apparent. For two decades now, oat (Avena sativa) has been recog- nised as a superior source of soluble dietary fibre. Oats contain mixed linkage b-glucans ((1 ? 3)(1 ? 4)-b-D-glucan), a linear poly-glucose fibre with important dietary properties (American Association of Cereal Chemists International, 2001). Due to the high amount of b-glucans in their kernels, oat and barley are the only cereal crops to carry a health claim in the EU, Canada and the United States. According to the EFSA Panel’s conclusions, there is a cause and effect relationship between the consumption of b-glucan and the reduction of blood cholesterol concentrations, provided that at least 3 g/day of b-glucan from oats, oat bran, bar- ley, barley bran, or from mixtures of non-processed or minimally processed b-glucans is consumed (EFSA Panel on Dietetic Products & Allergies, 2010, 2011). Oats also contain high levels of unsatu- rated fatty acids, galacto-lipids, essential dietary minerals and pro- teins with a favourable amino acid composition. They contain a low proportion of prolamins to globular proteins as compared to any other cereal and unique antioxidants like avenanthramides (Shewry, Piironen et al., 2008). b-Glucan is a polymer that is to some extent present in all grasses, but most prominently in oats and barley (Aaman & Graham 1987). It has also been found in some algae and patho- genic fungi as well as a few non-grass vascular plants (Burton & Fincher 2009). The fibre is made up of a chain of glucose molecules linked by (1 ? 4) bonds to form oligomers that are, in turn, linked by (1 ? 3) bonds to form longer molecules. The most common (1 ? 4) polymers in the fibre are trimers followed by tetramers, but sizes up to nonamers can readily be detected by HPLC (Lazaridou & Biliaderis, 2007). It is hypothesised that even longer stretches of 1 ? 4 links exist within the fibre structure but these have yet to be shown. The polymers are usually referred to by their degree of polymerization (DP) value and a common way of describing the structure is by gauging the ratio of trimers to tetra- mers (DP3/DP4) as it differs between different cereals (Lazaridou & Biliaderis, 2007). b-Glucans from outside the Poaceae differ in both composition and structure with either extremely high or extremely low DP3/ DP4-values (Pettolino et al., 2009; Sørensen et al., 2008) and the inclusion of sugars such as arabinose into the fibre (Popper & Fry, 2003). Within the plant, one proposed function of b-glucan is to stabilize the plant cell wall, but b-glucan may also act as an easy-to-mobilize energy deposit as hydrolysis of b-glucan into 0308-8146/$ - see front matter Ó 2012 Elsevier Ltd. All rights reserved. http://dx.doi.org/10.1016/j.foodchem.2012.10.007 ⇑ Corresponding author. Tel.: +46 702 915508; fax: +46 31 7852660. E-mail addresses: [email protected] (P. Sikora), [email protected] (S.M. Tosh), [email protected] (Y. Brummer), [email protected] (O. Olsson). Food Chemistry 137 (2013) 83–91 Contents lists available at SciVerse ScienceDirect Food Chemistry journal homepage: www.elsevier.com/locate/foodchem
-
Upload
independent -
Category
Documents
-
view
0 -
download
0
Transcript of Identification of high β-glucan oat lines and localization and chemical characterization of their...
Food Chemistry 137 (2013) 83–91
Contents lists available at SciVerse ScienceDirect
Food Chemistry
journal homepage: www.elsevier .com/locate / foodchem
Identification of high b-glucan oat lines and localization and chemicalcharacterization of their seed kernel b-glucans
Per Sikora a,⇑, Susan M. Tosh b, Yolanda Brummer b, Olof Olsson c,d
a Department of Biology and Environmental Sciences, University of Gothenburg, Box 461, SE-40530 Gothenburg, Swedenb Guelph Food Research Centre, Agriculture and Agri-Food Canada, 93 Stone Road West, Guelph, Ontario, Canada N1G 5C9c Department of Pure and Applied Biochemistry, Lund University, Box 124, SE 22100 Lund, Swedend CropTailorAB, c/o Department of Pure and Applied Biochemistry, Lund University, Box 124, SE 22100 Lund, Sweden
a r t i c l e i n f o a b s t r a c t
Article history:Received 14 June 2012Received in revised form 1 October 2012Accepted 4 October 2012Available online 22 October 2012
Keywords:Beta-glucanCalcofluor stainingFibre qualityHistologyOatScreening
0308-8146/$ - see front matter � 2012 Elsevier Ltd. Ahttp://dx.doi.org/10.1016/j.foodchem.2012.10.007
⇑ Corresponding author. Tel.: +46 702 915508; fax:E-mail addresses: [email protected] (P. Sikora), susa
[email protected] (Y. Brummer), Olof.Olsso
Oat, (Avena sativa) is an excellent source of mixed linkage b-glucans ((1 ? 3)(1 ? 4)-b-D-glucan), a die-tary fibre with cholesterol lowering properties. Using a mutagenized oat-population we screened 1700different lines and identified ten lines that displayed b-glucan levels above 6.7% and 10 below3.6%. The extreme values were 1.8% and 7.5%. We chose six lines with an increased- and four lines witha reduced b-glucan content for further study. By longitudinal- and cross-sections of seeds it was shownthat localization of b-glucan varied between the different lines. In addition, b-glucan quality parameterslike molecular weight and solubility were also determined. Although the selection was designed forquantitative differences, qualitative differences between the b-glucans from the different lines werefound. The high and low b-glucan lines will now be used as a model system to study molecular regulationof b-glucan biosynthesis as well as possible links between fibre quality and biological activity.
� 2012 Elsevier Ltd. All rights reserved.
1. Introduction
As the incidence of obesity, diabetes and heart disease contin-ues to increase, the importance of a high-fibre diet is becomingapparent. For two decades now, oat (Avena sativa) has been recog-nised as a superior source of soluble dietary fibre. Oats containmixed linkage b-glucans ((1 ? 3)(1 ? 4)-b-D-glucan), a linearpoly-glucose fibre with important dietary properties (AmericanAssociation of Cereal Chemists International, 2001). Due to thehigh amount of b-glucans in their kernels, oat and barley are theonly cereal crops to carry a health claim in the EU, Canada andthe United States. According to the EFSA Panel’s conclusions, thereis a cause and effect relationship between the consumption ofb-glucan and the reduction of blood cholesterol concentrations,provided that at least 3 g/day of b-glucan from oats, oat bran, bar-ley, barley bran, or from mixtures of non-processed or minimallyprocessed b-glucans is consumed (EFSA Panel on Dietetic Products& Allergies, 2010, 2011). Oats also contain high levels of unsatu-rated fatty acids, galacto-lipids, essential dietary minerals and pro-teins with a favourable amino acid composition. They contain alow proportion of prolamins to globular proteins as compared to
ll rights reserved.
+46 31 [email protected] (S.M. Tosh),
[email protected] (O. Olsson).
any other cereal and unique antioxidants like avenanthramides(Shewry, Piironen et al., 2008).
b-Glucan is a polymer that is to some extent present in allgrasses, but most prominently in oats and barley (Aaman &Graham 1987). It has also been found in some algae and patho-genic fungi as well as a few non-grass vascular plants (Burton &Fincher 2009). The fibre is made up of a chain of glucose moleculeslinked by (1 ? 4) bonds to form oligomers that are, in turn, linkedby (1 ? 3) bonds to form longer molecules. The most common(1 ? 4) polymers in the fibre are trimers followed by tetramers,but sizes up to nonamers can readily be detected by HPLC(Lazaridou & Biliaderis, 2007). It is hypothesised that even longerstretches of 1 ? 4 links exist within the fibre structure but thesehave yet to be shown. The polymers are usually referred to by theirdegree of polymerization (DP) value and a common way ofdescribing the structure is by gauging the ratio of trimers to tetra-mers (DP3/DP4) as it differs between different cereals (Lazaridou &Biliaderis, 2007).
b-Glucans from outside the Poaceae differ in both compositionand structure with either extremely high or extremely low DP3/DP4-values (Pettolino et al., 2009; Sørensen et al., 2008) and theinclusion of sugars such as arabinose into the fibre (Popper & Fry,2003).
Within the plant, one proposed function of b-glucan is tostabilize the plant cell wall, but b-glucan may also act as aneasy-to-mobilize energy deposit as hydrolysis of b-glucan into
84 P. Sikora et al. / Food Chemistry 137 (2013) 83–91
glucose requires fewer enzymatic steps than hydrolysis of starch.In contrast to cellulose, b-glucan is mostly water soluble and thedissolved fibres form very viscous solutions (Johansson, Karesoja,et al., 2008; Wood, Beer, et al., 2000.
Oat and barley b-glucans have been conclusively linked to cho-lesterol lowering properties and stabilization of serum glucose lev-els in humans (Brown, Rosner, et al., 1999; Davidson, Dugan, et al.,1991; Ripsin, Keenan, et al., 1992; Wood, 2007; Wood, Beer, et al.,2000). The exact mechanisms are not yet known but it is clear thatthe activity is correlated in some way to the viscosity produced bythe fibres (Tosh, Brummer, et al., 2008; Wolever, Tosh, et al., 2010).The absorption of glucose from a meal can be slowed down by theincreased viscosity of the meal bolus caused by the presence of oator barley b-glucan (Tosh et al., 2008). It has also been suggestedthat b-glucans might directly influence starch digestibility by coat-ing starch granules and thereby limiting access of starch-degradingenzymes (Brennan, Derbyshire, Brennan, & Tiwari, 2012). Choles-terol lowering effects may be a result of increased excretion of bileacids, which are then replaced by a conversion of cholesterol to bileacids (Ellegard & Andersson, 2007), decreased absorption of dietarycholesterol (Theuwissen & Mensink, 2007) and an increased pro-duction of short chain fatty acids in the colon. This downregulatescholesterol neosynthesis (Drozdowski, Reimer, et al., 2010), aloneor by a combination of the three mechanisms.
Presently oat is the seventh largest cereal crop in the world, butwith a much lower harvested yield compared to wheat, maize andrice (Food and Agricultural Organization of the United Nations,2011). Oat is grown mainly in Northern and Eastern Europe,Canada and the Northern United States, Russia, Northern Chinaand Australia (Food and Agricultural Organization of the UnitedNations, 2011). Due to its resilience and ability to grow in a widerange of soil types, oat generally survives where other more sensi-tive cereals fail to develop (Suttie & Reynolds, 2004). Thus, oat canbe grown on marginal land and help prevent soil erosion. It wouldtherefore be a positive development both for the environment andpublic health if more oat was grown and consumed. In addition, anactive promotion of healthy eating habits needs to be supported bya supply of food products with improved health properties. Re-cently, the GI-lowering effects of oat and barley b-glucan has beendemonstrated in bread and extruded snack-products (Finocchiaroet al., 2012). A high b-glucan oat would be a step in the rightdirection and would make it easier for the consumer to reach therequired 3 g of b-glucan/day, as stated in the EFSA health claim(EFSA Panel on Dietetic Products, 2010), in fewer servings.
2. Materials and methods
2.1. Screening the mutated oat population
Samples were ground for 3 min at 50 Hz using a Fritsch Pulver-isette 23 ball-mill (Fritsch GmbH, Idar-Oberstein, Germany) usingan agate cup and ball. Five seeds from each mutagenized oat linewere ground to a fine powder and the hull was removed. Approx-imately 50 mg (±5%) of the oat flour, weighed to 0.1 mg precision,was transferred into a round bottom, 12 mL plastic Falcon-tubesand the b-glucan content quantified with the Mixed Link (1–3,1–4) Beta Glucan kit (Megazyme International, Bray County, Ire-land) with the following modifications; All weights and volumeswere halved and initial extraction was extended to 1.5 min fol-lowed by vortexing and an additional 3 min in a boiling water bath.Extraction time was prolonged as per suggestions from Megazymedue to the decreased heat conductivity of plastic tubes. Glucosi-dase digestion and GOPOD staining was performed in 2 mL micro-centrifuge tubes. Glucose concentrations in all samples weremeasured using a Nanodrop-2000C (Thermo Scientific, Waltham,
MA) at 510 nm using disposable plastic cuvettes. Samples wereprocessed in batches of 25 with three controls per batch and twobatches were handled concurrently. Samples that showed high orlow amounts of b-glucan were then retested to confirm the values.
2.2. Microscopic localization of b-glucan fiber
Ten grains of each analysed oat line or variety were prepared formicroscopy. First each grain was cut from both ends. The middlepart was then fixed with 3.0% (w/v) paraformaldehyde and 1.0%(w/v) glutaraldehyde in 0.1 M Na- K phosphate buffer (pH 7.0)and dehydrated in a graded ethanol series. Finally they wereembedded in hydroxyethyl methylacrylate as recommended bythe manufacturer (Leica Historesin embedding kit, Heidelberg,Germany). Polymerized samples were sectioned (2 lm thick sec-tions) in a rotary microtome HM 355 (Microm Laborgeräte GmbH,Walldorf, Germany) using a tungsten carbide knife. All sectionswere stained with aqueous 0.1% (w/v) Acid Fuchsin (BDH Chemi-cals Ltd., Poole, Dorset UK) in 1.0% acetic acid for 1 min. After this,b-glucans were stained with aqueous 0.01% (w/v) Calcofluor WhiteR04 (Scandinavian Brewery Laboratory Plc., Copenhagen, Den-mark) for 1 min (Wood, Fulcher, et al., 1983; Parkkonen, Härkönen,et al., 1994). When submitted to excited light in a fluorescentmicroscope (excitation, 400–410 nm; emission, >455 nm) intactCalcofluor stained cell walls appear blue and proteins stained withAcid Fuchsin appear red. Starch grains are also visible as blackspots. Stained sections were examined with an Olympus BX-50microscope (Olympus Corp., Tokyo, Japan). Micrographs were ob-tained using a PCO SensiCam CCD colour camera (PCO AG, Kelheim,Germany) and the Cell^P imaging software (Olympus). Representa-tive longitudinal and cross sections of each line were imaged.
2.3. Sample preparation for the qualitative assay
Seeds were ground for 3 min at 60 Hz. using a Retsch MM-2000mixing-mill (Retsch GmbH, Haan, Germany) with stainless steelball and cup. To inactivate endogenous enzymes, the ground pow-ders were boiled in 70% ethanol at 85 �C for 2 h at a ratio of 20 mLethanol to 1 g ground material. After incubation samples were cen-trifuged for 10 min at >10000g. The resulting material was spreadevenly on a watch glass and allowed to dry in an oven overnight at60 �C. Dried samples were reground using the same mixing-milland dried for 4 h in a vacuum oven at 75 �C.
2.4. Extraction of soluble fibre using NaOH
Dried material was mixed with 0.2 M NaOH at a proportion of100 mg to 10 mL and incubated at room temperature for 90 minwith continuous stirring. After incubation, samples were spundown at >10000g for 10 min and carefully decanted. The superna-tant was then used for analysis.
2.5. Extraction of soluble fibre using dH2O
Dried material was mixed with dH2O at a ratio of 100 mg to4 mL and incubated with 75 U of thermostable a-amylase (Mega-zyme International, Bray County, Ireland) at 90 �C for 3 h. Afterincubation the samples were centrifuged at >10000g for 10 minand the supernatant carefully decanted.
2.6. Determination of soluble fibre concentration
Twenty mg of ground powder, weighed accurately, was ex-tracted using NaOH and dH2O according to above mentionedmethods. All samples were prepared in biological duplicates andloaded twice on a Flow Injection Analysis (FIA) instrument (FIAlab
P. Sikora et al. / Food Chemistry 137 (2013) 83–91 85
Instruments, Inc., Bellevue, WA) operated essentially as describedby Jørgensen with modifications as described by Tosh et al.(Jørgensen & Aastrup, 1988; Tosh, Brummer, et al., 2010). The FIAmeasures the concentration of b-glucan in solution. The b-glucanconcentration in solution was compared to the b-glucan concentra-tion in the original dried sample to determine how much of the b-glucan was soluble.
2.7. Determination of molecular weights
Approximately 100 mg of ground powder was weighed into aplastic centrifuge tube and extracted using both NaOH and dH2Oaccording to above-mentioned methods. Five hundred microlitreof NaOH-extract and 700 lL of dH2O-extract was diluted to 5 mLand was filtered through a 0.45 lm filter. The molecular weightwas measured by size exclusion HPLC as described in Tosh,Brummer, et al. (2010). All samples were loaded in duplicate.
2.8. Determination of DP3/DP4 and DP5–9 ratios
Fifty mg of ground powder, weighed accurately, was extractedusing the initial steps from the Megazyme Mixed Linkage b-Glucankit, but with all volumes halved. After the lichenase digestion step,samples were spun down at >10000g for 10 min and the superna-tant filtered through a 45 lm membrane before loading onto a Dio-nex HPLC. All samples were extracted in duplicate and eachduplicate was loaded twice onto a high-performance anion ex-change chromatography column and analysed according to theprotocol described by Tosh, Brummer et al., (2004).
3. Results
3.1. b-Glucan screening
The industry-standard Megazyme method (McCleary & Codd1991; McCleary & Glennie-Holmes., 1985) for determining b-glu-can concentration was optimised for rapid and reproducible mea-surements of a large number of low weight samples. In the finalprotocol, all reagents and sample amounts were reduced by halfwithout significant loss of reproducibility or accuracy. We recentlydeveloped an oat TILLING-population from the oat market varietySW Belinda (Chawade, Sikora, et al., 2010) and this was used toscreen for lines with altered b-glucan levels. Routinely, five seedsfrom each mutagenized line were pooled and the amount of b-glu-can was quantified with the modified assay. In all, 1700 lines werescreened. The variation between different lines was large and theb-glucan levels ranged from 7.5% to 1.8%, normally distributedaround the original level in Belinda (Fig. 1). Altogether, 10 linesabove 6.75% and 10 below 3.56% b-glucans were identified(Fig. 1). From these, the six lines that had b-glucan levels higherthan 6.8% and the four lines that had lower levels than 3.6% wereselected for further studies (Fig. 1). To investigate whether the b-glucan levels differed between individual seeds from the same line,and to directly look at the genetic segregation of the high b-glucanmarker, the assay was further optimised by increasing the weigh-ing accuracy and reducing the reagents per sample. Thus, less seedmaterial could be used for an assay. b-Glucan levels in single seedswere then quantified in the M3 generation from the line with thehighest average b-glucan levels, CT828 (data not shown). This sug-gested that the high b-glucan trait assayed was in fact an averagebetween presumed homozygotes with the highest levels (�7.8%)and heterozygotes with slightly lower levels (�7.2%).
3.2. Localization of b-glucan fibre in the seed
The localization of b-glucans within the seed can be visual-ised by first producing thin longitudinal or cross sections of cho-sen seeds, followed by calcofluor staining and counter stainingby acid-fuchsin (Parkkonen, Härkönen, et al., 1994; Wood,Fulcher et al., 1983). This gives the b-glucans a blue appearancewhen visualised in a fluorescence microscope while proteins ap-pear red and starch-grains black. Calcofluor also has an affinityto cellulose, which however is a minor component in the endo-sperm cell walls of cereal grains. Random seeds from the se-lected four low- and six high b-glucan lines and from themarket variety used as a starting point in the mutagenesis SWBelinda, as well as from two additional market varieties SW Ker-stin and SW Betania, were chosen in the analysis. Hundreds ofphotographs from both vertical and longitudinal sections fromseveral individual seeds from each line were taken and inspectedand representative pictures were selected (Figs. 2–6). The visualappearance of b-glucans in the different lines corroborated thequantitative analysis as the stain was stronger in the high linesand weaker in the low lines (Figs. 2–4). As depicted in the fig-ures, the b-glucan in SW Belinda was mainly located in the aleu-rone and subaleurone layer, although b-glucan was also visiblein the starchy endosperm. Both SW Kerstin and SW Betaniashowed a b-glucan distribution similar to that of SW Belindaalthough the presence of b-glucan in the starchy endospermwas even more pronounced (Fig. 2). When examining the mu-tated lines, it became clear that the exact distribution of b-glu-can between aleurone and endosperm varied between themutants. Thus, the high b-glucan line, CT828, showed a similardistribution to SW Belinda while line CT1498, and especially lineCT98, had disproportionally higher b-glucan levels in the aleu-rone and subaleurone layers (Figs. 3, 5 and 6). Coincidentally,the low b-glucan mutant M837 also exhibited a noticeably stron-ger protein staining than the market varieties (Figs. 4 and 5).This could be due to either a functional connexion between b-glucan and protein biosynthesis or that a secondary, unrelatedmutation has occurred in this particular line that affected pro-tein biosynthesis and/or stability.
3.3. Determination of fibre quality
After confirming that the different mutated lines indeed hadaltered levels of b-glucans we investigated whether the geneticevent that caused the alteration of the b-glucan levels had alsocaused structural changes in the b-glucan fibre. Hence, parame-ters such as molecular weight, polydispersity, solubility andDP3/DP4 ratio of the b-glucans were determined in the selectedlines. The molecular weight and solubility measurements werecarried out using either hot water (dH2O) or sodium hydroxide(NaOH) as extraction buffer. This showed that most mutantsexhibited a similar molecular weight to SW Belinda (Table 1).However CT2472 had a lower average molecular weight in bothwater and sodium hydroxide. Furthermore, CT1293 showed amarked decrease in molecular weight when water was used inthe extractions whilst CT1498 showed a small increase in molec-ular weight in water. The high b-glucan market variety SW Beta-nia contained b-glucans with the highest molecular weight,>2.3 MDa.
To get a better overview of the distribution of molecularweights as a result of the different extractions, a polydispersity in-dex (Pi) was calculated by dividing the weight distribution average(Mw) by the numerical average (Mn). This means that a perfectlyhomogenous sample will have a Pi of 1 while heterogenous sam-ples will have a Pi > >1. The data showed that the polydispersitywas similar in the different lines and that it was higher in the so-

Fig. 1. Screening of 1700 lines from the mutagenized oat population. The data is presented in an unordered (A) and ordered (B) graph.Each data point represents the b-glucanlevel in an individual line. Numbers within the circles refers to b-glucan percentage in the seed kernel. (C) The 10 CT lines with the lowest and highest b-glucan levels. Linesare ordered from left to right by increasing b-glucan content. Three market varieties from Lantmännen SW seed were also included for comparison. These are denoted withSW and their respective name. Lines marked with red were chosen for further study.
86 P. Sikora et al. / Food Chemistry 137 (2013) 83–91
dium hydroxide extracted samples. However, errors were alsomuch larger in these extractions (Table 1). The CT828 line stoodout a bit, since the b-glucans from this high line seem to containa wider range of molecular weights than the rest.
DP3/DP4-ratios were also determined both in the chosen CTlines and in the market varieties and the ratio was altered in sev-eral lines. However, none of the lines displayed a DP3/DP4-ratiolower than the starting variety. The largest standout was CT828with a DP3/DP4-ratio bordering that of barley (Table 2). Amongthe market varieties SW Kerstin was the highest and showed sim-ilar DP3/DP4-ratios to CT1685, CT832 and CT970. Also CT837,CT1293 and CT1165 were higher than the original Belinda varietyused in the mutagenesis.
The solubility of the b-glucans was also calculated. Several ofthe mutants had an increased solubility compared to SW Belinda.Thus, CT98, CT828, CT832 and CT970 all had a >5% solubility in-crease in water but only CT98 showed a similar increase when so-dium hydroxide was used. The most striking difference was foundin CT1293, where the b-glucan solubility was decreased by�12% inthe water extracted samples, indicating high levels of insoluble fi-bre (Table 2).
4. Discussion
A high b-glucan oat would be a very valuable asset in an ex-pected increased future demand for health promoting foods andfood products. Oat breeders have targeted high b-glucan a majorbreeding objective for decades, and indeed novel varieties with in-creased b-glucan levels have been developed (McMullen, Doehlertet al., 2005), although varieties with even higher levels would bedesirable. Novel breeding technologies now being developed,including marker assisted selection and mutagenized populationsdisplaying a high variation, could pave the way for such adevelopment.
Recently we developed a TILLING-population in oat, startingfrom the market variety SW Belinda. One of our early goals wasto identify lines with higher b-glucan levels than any existing vari-ety on the market (Chawade et al., 2010). TILLING relies on theintroduction of a large number of mutations to a chosen breedingline through chemical mutagenesis followed by a genetic screeningfor mutations in a priori specified sequences. By exposing thou-sands of seeds to a strong mutagen a large population with a highvariation can be produced. After self-crossing of all the mutage-

Fig. 2. Localization of b-glucan in three wildtype varieties. A–C; cross sections of whole seeds. D–F; A 10� higher magnification of the same sections. A and D; SW Belinda. Band E; SW Betania. C and F; SW Kerstin.
P. Sikora et al. / Food Chemistry 137 (2013) 83–91 87
nized lines, the M2 or later populations can be screened for usefulcharacters either at the genetic- or phenotypic levels (Sikora,Chawade, Larsson, Olsson, & Olsson, 2011). Here we screened1700 lines in the mutagenized population phenotypically, for al-tered b-glucan levels in the seeds, using the quantitative Mega-zyme b-glucan assay. We identified a number of lines that wereeither higher or lower than the 4.9% seen in the original SW Belin-da. In the screened lines, the average b-glucan level was approxi-mately 5%, similar to the starting variety. A noticeably alteredtrait was detected only in about 2% of all the screened lines. Thisfairly low frequency, despite the fact that in the mutated popula-tion every line carries one induced mutation per 30 Kb, gives a hintwhy traditional breeding has yet to reach such high levels.
To test the stability of the high b-glucan trait in the mutatedlines, the four lines with the highest levels were grown in the fieldfor one season and the seeds harvested. By assaying b-glucan levelsfrom individual seeds in the M5 generation, it became clear thatalthough the lines were segregating, the high b-glucan trait wasstable. By crossing the two highest lines with a high yielding mar-ket variety, SW Nike, and measuring the b-glucan levels in individ-ual seeds from the F2 offspring of these crosses, it became clearthat the trait is inherited in a Mendelian fashion (data not shown).Therefore, we do not foresee any problems in the crossing pro-grams required to develop commercial oat varieties from thesemutated pre-breeding lines.
Although absolute levels of b-glucans are essential, it is alsoimportant to consider the localization of the synthesized b-glucanin the seed. This is because oat bran typically consists of an en-riched fraction of the aleurone layers (Marquart, 2007). Althoughcell walls from the starchy endosperm are also present in the bran,in practise this fraction is less important in bran production. An oatvariety where the b-glucans are enriched in the outer layers willtherefore be very useful for processing and downstreamapplications.
Both vertical and longitudinal seed sections in combinationwith specific b-glucan staining and microscopic inspections were
performed to show the distribution of b-glucans in the seeds of10 selected mutated lines and three market varieties, among thosethe high b-glucan variety SW Betania. This revealed that here was alarge variation in the distribution of b-glucans within the seed,both between the market varieties and among the CT-lines. SWBetania and SW Kerstin had proportionally more of their b-glucanslocated in the starchy endosperm than SW Belinda (Fig. 2). Thehighest b-glucan line, CT828, exhibited a similar localization pat-tern to SW Betania and SW Kerstin (Fig. 3), even more clearly seenin longitudinal sections (Figs. 5 and 6). On the other hand, the sec-ond and third highest mutants in terms of b-glucan content, CT98and CT970 were more Belinda-like in this respect with enrichmentin the aleurone and subaleurone layer and less b-glucans in thestarchy endosperm (Fig. 3). This could be indicative of two differ-ent b-glucan producing pathways: one more efficient in the aleu-rone layer and one less efficient located in the endosperm.Longitudinal sections corroborate this data nicely, also addingCT2472 to the outer layer class and CT837 to the more evenly dis-tributed class (Figs. 5 and 6). It will be interesting to cross linesshowing different distribution and see if it is possible to affecthow the b-glucans are deposited.
To determine whether mutations that lead to altered b-glucanlevels also could affect the structure of the carbohydrate polymers,the selected CT lines and the three market varieties were furtheranalysed. Flow Injection Analysis, HPSEC (High Performance SizeExclusion Chromatography) and anion exchange chromatographywere used to establish solubility, molecular weight and DP3/DP4ratio of the different b-glucans, respectively. Two common meth-ods of extracting b-glucans from seeds using sodium hydroxide(NaOH) or water (dH2O) as extraction buffer were used(Immerstrand, Bergenståhl, et al., 2009; Suortti, 1993; Wood,Weisz, et al., 1991a,b). In general, the b-glucans are more solublein sodium hydroxide leading to a higher proportion of fibres beingextracted. Water extraction, on the other hand, is more akin toindustrial food processing and may therefore be the method ofchoice if the aim is to produce fibres for the food industry. The

Fig. 3. Localization of b-glucan in the six chosen high b-glucan mutants. A–C; G–I; cross sections of whole seeds. D–F; J–L; A 10� higher magnification of the same sections. Aand D; CT970. B and E; CT832. C and F; CT1165. G and J; CT1498. H and K; CT98; I and L; CT828.
88 P. Sikora et al. / Food Chemistry 137 (2013) 83–91
difference in b-glucan characteristics between extraction proce-dures confirms that different populations of molecules are ex-tracted (Tables 1 and 2). This was especially evident whenlooking at the data from CT1293 where extraction using waterlowers the estimated molecular weight values by approximately200 kDa and the solubility drops by 12%. Since cellulose is at leastpartially soluble in sodium hydroxide but insoluble in water, it isplausible that the sodium hydroxide extraction pulls out more of
the particular b-glucan fibres that have large cellulose-likedomains.
Looking at the molecular weights, SW Betania had the largest,exceeding 2.4 MDa and also had a high solubility. In the mutatedlines CT2472 stood out with a b-glucan molecular weight as lowas �1.6 MDa with water. CT1498 had the highest molecular weightof all the mutated lines, between 2.1 and 2.2 MDa, which is slightlyhigher than that of SW Belinda and close to SW Kerstin. Thus, our
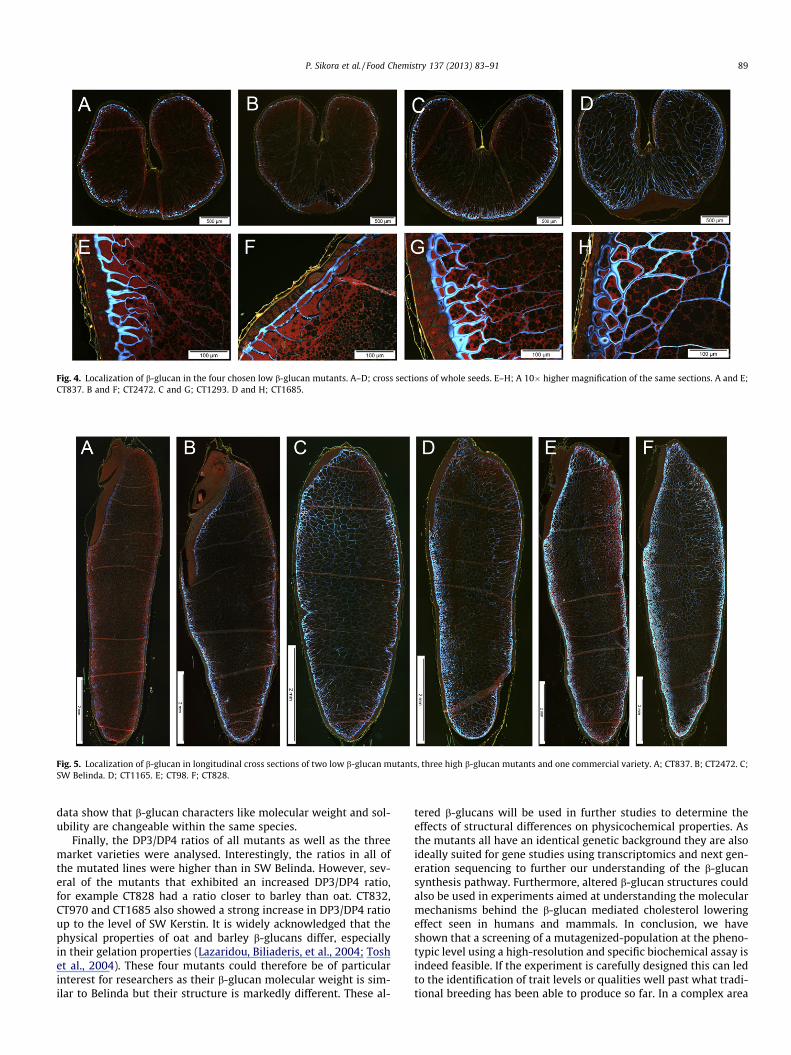
Fig. 5. Localization of b-glucan in longitudinal cross sections of two low b-glucan mutants, three high b-glucan mutants and one commercial variety. A; CT837. B; CT2472. C;SW Belinda. D; CT1165. E; CT98. F; CT828.
Fig. 4. Localization of b-glucan in the four chosen low b-glucan mutants. A–D; cross sections of whole seeds. E–H; A 10� higher magnification of the same sections. A and E;CT837. B and F; CT2472. C and G; CT1293. D and H; CT1685.
P. Sikora et al. / Food Chemistry 137 (2013) 83–91 89
data show that b-glucan characters like molecular weight and sol-ubility are changeable within the same species.
Finally, the DP3/DP4 ratios of all mutants as well as the threemarket varieties were analysed. Interestingly, the ratios in all ofthe mutated lines were higher than in SW Belinda. However, sev-eral of the mutants that exhibited an increased DP3/DP4 ratio,for example CT828 had a ratio closer to barley than oat. CT832,CT970 and CT1685 also showed a strong increase in DP3/DP4 ratioup to the level of SW Kerstin. It is widely acknowledged that thephysical properties of oat and barley b-glucans differ, especiallyin their gelation properties (Lazaridou, Biliaderis, et al., 2004; Toshet al., 2004). These four mutants could therefore be of particularinterest for researchers as their b-glucan molecular weight is sim-ilar to Belinda but their structure is markedly different. These al-
tered b-glucans will be used in further studies to determine theeffects of structural differences on physicochemical properties. Asthe mutants all have an identical genetic background they are alsoideally suited for gene studies using transcriptomics and next gen-eration sequencing to further our understanding of the b-glucansynthesis pathway. Furthermore, altered b-glucan structures couldalso be used in experiments aimed at understanding the molecularmechanisms behind the b-glucan mediated cholesterol loweringeffect seen in humans and mammals. In conclusion, we haveshown that a screening of a mutagenized-population at the pheno-typic level using a high-resolution and specific biochemical assay isindeed feasible. If the experiment is carefully designed this can ledto the identification of trait levels or qualities well past what tradi-tional breeding has been able to produce so far. In a complex area

Fig. 6. Approximately 10x higher magnification of longitudinal cross sections from two low b-glucan mutants, three high b-glucan mutants and one commercial variety. A;CT837. B; CT2472. C; SW Belinda. D; CT1165. E; CT98. F; CT828.
Table 1Molecular weight and polydispersity and DP3/DP4-ratio of extracted b-glucan fibres.b-glucans were extracted using either water or sodium hydroxide as extraction buffer,as indicated on the top of the table. ±-values indicates variation between replicatesand an asterisk indicates a statistically significant difference (p < 0.05) compared tothe starting variety, SW Belinda.
NaOH dH2O
Mw (KDa) Mw/Mn Mw (KDa) Mw/Mn
SW Kerstin 2097 ± 64 2.91 ± 0.06 2065 ± 12.8 2.71 ± 0.27SW Betania 2370 ± 107 2.72 ± 0.48 2461 ± 26.1⁄ 2.53 ± 0.08SW Belinda 2048 ± 18 3.09 ± 0.3 1917 ± 45.5 2.57 ± 0.08CT837 1888 ± 20⁄ 3.25 ± 0.4 1753 ± 6.4 2.48 ± 0.06CT2472 1739 ± 38⁄ 3.35 ± 0.36 1575 ± 32⁄ 2.78 ± 0.15CT1293 1904 ± 70 3.17 ± 0.5 1608 ± 48.8⁄ 2.99 ± 0.07CT1685 1878 ± 66 3.11 ± 0.01 1843 ± 33.5 2.71 ± 0.12CT970 2046 ± 64 3.06 ± 0.23 2033 ± 75.4 2.7 ± 0.06CT832 1943 ± 92 3.05 ± 0.5 1956 ± 91.8 2.51 ± 0.04CT1165 1897 ± 53 3.28 ± 0.19 2017 ± 18.2 2.64 ± 0.01CT1498 2117 ± 70 2.91 ± 0.05 2210 ± 4.7 2.34 ± 0.06CT98 1902 ± 102 3.15 ± 0.33 2004 ± 53.4 2.54 ± 0.09CT828 1987 ± 56 3.49 ± 0.35 2041 ± 2.4 2.44 ± 0.06
Table 2DP3/DP4-ratio and solubility of extracted b-glucan fibres. b-glucans were extractedusing either water or sodium hydroxide as extraction buffer, as indicated on the top ofthe table. In the DP3/DP4 analysis, the samples were extracted using the first threesteps of the Megazyme method. ±-values indicates variation between replicates andan asterisk indicates a statistically significant difference (p < 0.05) compared to thestarting variety, SW Belinda.
DP3/DP4-ratio Solubility (%)
NaOH dH2O
SW Kerstin 2.61 ± 0.02⁄ 49.15 ± 0.46⁄ 46.52 ± 0.46SW Betania 2.51 ± 0.02⁄ 52.15 ± 1.72 55.23 ± 0.38⁄
SW Belinda 2.39 ± 0.01 53.03 ± 0.77 50.06 ± 1.16CT837 2.48 ± 0.01⁄ 51.06 ± 1.15 47.61 ± 0.78⁄
CT2472 2.41 ± 0.02⁄ 52.33 ± 1.25 52.62 ± 0.17CT1293 2.53 ± 0.01⁄ 48.96 ± 0.37⁄ 36.45 ± 0.30⁄
CT1685 2.63 ± 0.01⁄ 51.15 ± 1.69 50.22 ± 1.91CT970 2.62 ± 0.01⁄ 53.74 ± 0.49 58.08 ± 0.47⁄
CT832 2.64 ± 0.02⁄ 51.19 ± 1.15 56.79 ± 0.49⁄
CT1165 2.47 ± 0.01⁄ 50.30 ± 0.34⁄ 52.56 ± 0.81⁄
CT1498 2.41 ± 0.02 49.98 ± 1.21⁄ 49.49 ± 0.05CT98 2.42 ± 0.02⁄ 57.16 ± 0.68⁄ 56.51 ± 0.43⁄
CT828 2.72 ± 0.03⁄ 54.46 ± 0.46 57.39 ± 0.77⁄
90 P. Sikora et al. / Food Chemistry 137 (2013) 83–91
such as mechanisms of b-glucan activity on blood serum choles-terol levels, it is important to not only focus on increasing theamount of the b-glucan, but also investigate how the molecule isdistributed in the seed and if the molecular structure somehowhas changed. All these parameters are of importance in experi-ments to further explore physiological effects of b-glucans in vari-ous mammalian model systems and ultimately humans.
Acknowledgements
This work was supported by Grants from The Swedish FarmersSupply and Crop Marketing Co-operative (SLF) and the Swedish Re-search Council for Environment, Agricultural Sciences and SpatialPlanning (FORMAS) given to O. O. The work was also supportedby donations from our industrial partners Aventure AB and Swed-ish Oat Fibre AB.
The authors would like to thank Anette Sikora and Johanna Ols-son for grinding assistance during the initial screening.
References
Aaman, P., & Graham, H. (1987). Analysis of total and insoluble mixed-linked(1 ? 3), (1 ? 4)-b-D-glucans in barley and oats. Journal of Agricultural and FoodChemistry, 35(5), 704–709.
American Association of Cereal Chemists International (2001). ‘‘The definition ofdietary fiber.’’ Cereal Foods World 46: 14.
Brennan, M. A., Derbyshire, E. J., Brennan, C. S., & Tiwari, B. K. (2012). Impact ofdietary fibre-enriched ready-to-eat extruded snacks on the postprandialglycaemic response of non-diabetic patients. Molecular Nutrition & FoodResearch, 56, 834–837.
Brown, L., Rosner, B., Willett, W. W., & Sacks, F. M. (1999). Cholesterol-loweringeffects of dietary fiber: A meta-analysis. American Journal of Clinical Nutrition,69(1), 30–42.

P. Sikora et al. / Food Chemistry 137 (2013) 83–91 91
Burton, R. A., & Fincher, G. B. (2009). (1,3;1,4)-b-D-glucans in cell walls of thepoaceae, lower plants, and fungi: A tale of two linkages. Molecular Plant, 2(5),873–882.
Chawade, A., Sikora, P., Brautigam, M., Larsson, M., Vivekanand, V., Nakash, M. A.,et al. (2010). Development and characterization of an oat TILLING-populationand identification of mutations in lignin and beta-glucan biosynthesis genes.BMC Plant Biology, 10, 86.
Davidson, M. H., Dugan, L. D., Burns, J. H., Bova, J., Story, K., & Drennan, K. B. (1991).The hypocholesterolemic effects of beta-glucan in oatmeal and oat bran. A dose-controlled study. JAMA, 265(14), 1833–1839.
Drozdowski, L. A., Reimer, R. A., Temelli, F., Bell, R. C., Vasanthan, T., & Thomson, A. B.(2010). Beta-glucan extracts inhibit the in vitro intestinal uptake of long-chainfatty acids and cholesterol and down-regulate genes involved in lipogenesis andlipid transport in rats. Journal of Nutritional Biochemistry, 21(8), 695–701.
EFSA Panel on Dietetic Products, Nutrition and Allergies (2010). Scientific opinionon the substantiation of a health claim related to oat beta glucan and loweringblood cholesterol and reduced risk of (coronary) heart disease pursuant toarticle 14 of regulation (EC) No. 1924/2006. EFSA Journal, 8(12), 15.
EFSA Panel on Dietetic Products, Nutrition and Allergies (2011). Scientific opinionon the substantiation of a health claim related to barley beta-glucans andlowering of blood cholesterol and reduced risk of (coronary) heart diseasepursuant to article 14 of regulation (EC) No. 1924/2006. EFSA Journal, 9(12), 14.
Ellegard, L., & Andersson, H. (2007). Oat bran rapidly increases bile acid excretionand bile acid synthesis: An ileostomy study. European Journal of ClinicalNutrition, 61(8), 938–945.
Finocchiaro, F., Ferrari, B., Gianinetti, A., Scazzina, F., Pellegrini, N., Caramanico, R.,et al. (2012). Effects of barley b-glucan-enriched flour fractions on theglycaemic index of bread. International Journal of Food Sciences and Nutrition,63(1), 23–29.
Food and Agricultural Organization of the United Nations. ‘‘FAOSTAT.’’ Retrieved 1220, 2011, from http://faostat.fao.org/site/567/DesktopDefault.aspx?PageID=567#ancor.
Immerstrand, T., Bergenståhl, B., Trägårdh, C., Nyman, M., Cui, S., & Öste, R. (2009).Extraction of b-glucan from oat bran in laboratory scale. Cereal ChemistryJournal, 86(6), 601–608.
Johansson, L., Karesoja, M., Ekholm, P., Virkki, L., & Tenhu, H. (2008). Comparison ofthe solution properties of (1 ? 3), (1 ? 4)-b-D-glucans extracted from oats andbarley. LWT – Food Science and Technology, 41(1), 180–184.
Jørgensen, K., & Aastrup, S. (1988). Quantification of high molecular weight(1 ? 3)(1 ? 4)-b-D-glucan using calcofluor complex formation and flowinjection analysis. II. determination of total b-glucan content of barley andmalt. Carlsberg Research Communications, 53(5), 287–296.
Lazaridou, A., & Biliaderis, C. G. (2007). Molecular aspects of cereal b-glucanfunctionality: Physical properties, technological applications and physiologicaleffects. Journal of Cereal Science, 46(2), 101–118.
Lazaridou, A., Biliaderis, C. G., Micha-Screttas, M., & Steele, B. R. (2004). Acomparative study on structure-function relations of mixed-linkage (1 ? 3),(1 ? 4) linear b-D-glucans. Food Hydrocolloids, 18(5), 837–855.
Marquart, L. (2007). Whole grains and health. Ames, Iowa: Blackwell Pub.McCleary, B. V., & Codd, R. (1991). Measurement of (1 ? 3), (1 ? 4)-b-D-glucan in
barley and oats: A streamlined enzymic procedure. Journal of the Science of Foodand Agriculture, 55(2), 303–312.
McCleary, B. V., & Glennie-Holmes, M. (1985). Enzymatic quantification of (1–3)(1–4)-b-D-glucan in barley and malt. Journal of the Institute of Brewing, 91, 285–295.
McMullen, M. S., Doehlert, D. C., & Miller, J. D. (2005). Registration of ‘HiFi’ oat. CropScience, 45(4), 1664.
Parkkonen, T., Härkönen, H., & Autio, K. (1994). The effect of baking onmicrostructure of rye cell walls and proteins. Cereal Chemistry, 71, 58–63.
Pettolino, F., Sasaki, I., Turbic, A., Wilson, S. M., Bacic, A., Hrmova, M., et al. (2009).Hyphal cell walls from the plant pathogen Rhynchosporium secalis contain (1,3/
1,6)-b-D-glucans, galacto- and rhamnomannans, (1,3;1,4)-b-D-glucans andchitin. FEBS Journal, 276, 873–882.
Popper, Z. A., & Fry, S. C. (2003). Primary cell wall composition of bryophytes andcharophytes. Annals of Botany, 91, 1–12.
Ripsin, C. M., Keenan, J. M., Jacobs, D. R., Jr., Elmer, P. J., Welch, R. R., Van Horn, L.,et al. (1992). Oat products and lipid lowering. A meta-analysis. JAMA, 267(24),3317–3325.
Shewry, P. R., Piironen, V., Lampi, A. M., Nystrom, L., Li, L., Rakszegi, M., et al. (2008).Phytochemical and fiber components in oat varieties in the HEALTHGRAINdiversity screen. Journal of Agricultural and Food Chemistry, 56(21),9777–9784.
Sikora, P., Chawade, A., Larsson, M., Olsson, J., & Olsson, O. (2011). Mutagenesis as atool in plant genetics, functional genomics, and breeding. International Journal ofPlant Genomics, 2011, 13.
Suortti, T. (1993). Size-exclusion chromatographic determination of beta-glucanwith postcolumn reaction detection. Journal of Chromatography, 632(1–2),105–110.
Suttie, J. M., & Reynolds, S. G. (Eds.). (2004). Fodder oats: A World overview. Food andAgriculture Organization of the United Nations: Plant Production and ProtectionSeries. Rome.
Sørensen, I., Pettolino, F. A., Wilson, S. M., Doblin, M. S., Johansen, B., Bacic, A., et al.(2008). Mixed-linkage (1,3), (1,4)-b-D-glucan is not unique to the Poales and isan abundant component of Equisetum arvense cell walls. The Plant Journal, 54,510–521.
Theuwissen, E., & Mensink, R. P. (2007). Simultaneous intake of beta-glucan andplant stanol esters affects lipid metabolism in slightly hypercholesterolemicsubjects. Journal of Nutrition, 137(3), 583–588.
Tosh, S. M., Brummer, Y., Miller, S. S., Regand, A., Defelice, C., Duss, R., et al. (2010).Processing affects the physicochemical properties of beta-glucan in oat brancereal. Journal of Agricultural and Food Chemistry, 58(13), 7723–7730.
Tosh, S. M., Brummer, Y., Wolever, T. M. S., & Wood, P. J. (2008). Glycemic responseto oat bran muffins treated to vary molecular weight of b-glucan. CerealChemistry Journal, 85(2), 211–217.
Tosh, S. M., Brummer, Y., Wood, P. J., Wang, Q., & Weisz, J. (2004). Evaluation ofstructure in the formation of gels by structurally diverse (1 ? 3)(1 ? 4)-b-D-glucans from four cereal and one lichen species. Carbohydrate Polymers, 57(3),249–259.
Wolever, T. M., Tosh, S. M., Gibbs, A. L., Brand-Miller, J., Duncan, A. M., Hart, V., et al.(2010). Physicochemical properties of oat beta-glucan influence its ability toreduce serum LDL cholesterol in humans: A randomized clinical trial. AmericanJournal of Clinical Nutrition, 92(4), 723–732.
Wood, P. J. (2007). Cereal b-glucans in diet and health. Journal of Cereal Science,46(3), 230–238.
Wood, P. J., Beer, M. U., & Butler, G. (2000). Evaluation of role of concentration andmolecular weight of oat beta-glucan in determining effect of viscosity onplasma glucose and insulin following an oral glucose load. British Journal ofNutrition, 84(1), 19–23.
Wood, P. J., Fulcher, R. G., & Stone, B. A. (1983). Studies on the specificity ofinteraction of cereal cell wall components with Congo Red and Calcofluor.Specific detection and histochemistry of (1 ? 3), (1 ? 4),-b-D-glucan. Journal ofCereal Science, 1(2), 95–110.
Wood, P. J., Weisz, J., & Blackwell, B. A. (1991a). Molecular Characterization of CerealBeta-D-Glucans.1. Structural-analysis of oat beta-D-glucan and rapid structuralevaluation of beta-D-glucans from different sources by high-performanceliquid-chromatography of oligosaccharides released by lichenase. CerealChemistry, 68(1), 31–39.
Wood, P. J., Weisz, J., & Mahn, W. (1991b). Molecular characterization of cereal beta-D-glucans.2. Size-exclusion chromatography for comparison of molecular-weight. Cereal Chemistry, 68(5), 530–536.