Molecular Interactions between Barley and Oat β-Glucans and Phenolic Derivatives
9
Molecular Interactions between Barley and Oat -Glucans and Phenolic Derivatives HENRIK TOFT SIMONSEN, † METTE S. NIELSEN, †,‡ NIELS J. CHRISTENSEN, ‡ ULLA CHRISTENSEN, † THOMAS V. LA COUR, † MOHAMMED SADDIK MOTAWIA, † BIRTHE P. M. JESPERSEN, ‡ SØREN B. ENGELSEN, ‡ AND BIRGER LINDBERG MØLLER* ,† Plant Biochemistry Laboratory and Laboratory for Molecular Plant Biology, VKR Research Centre Pro-Active Plants, Department of Plant Biology and Biotechnology, University of Copenhagen, Thorvaldsensvej 40, 1871 Frederiksberg, Denmark, and Quality and Technology, Department of Food Science, University of Copenhagen, Rolighedsvej 30, 1958 Frederiksberg C, Denmark Equilibrium dialysis, molecular modeling, and multivariate data analysis were used to investigate the nature of the molecular interactions between 21 vanillin-inspired phenolic derivatives, 4 bile salts, and 2 commercially available -glucan preparations, Glucagel and PromOat, from barley and oats. The two -glucan products showed very similar binding properties. It was demonstrated that the two -glucan products are able to absorb most phenolic derivatives at a level corresponding to the absorption of bile salts. Glucosides of the phenolic compounds showed poor or no absorption. The four phenolic derivatives that showed strongest retention in the dialysis assay shared the pres- ence of a hydroxyl group in para-position to a CHO group. However, other compounds with the same structural feature but possessing a different set of additional functional groups showed less retention. Principal component analysis (PCA) and partial least-squares regression (PLS) calculations using a multitude of diverse descriptors related to electronic, geometrical, constitutional, hybrid, and topological features of the phenolic compounds showed a marked distinction between aglycon, glucosides, and bile salt retention. These analyses did not offer additional information with respect to the mode of interaction of the individual phenolics with the -glucans. When the barley -glucan was subjected to enzyme degradation, the ability to bind some but not all of the phenolic derivatives was lost. It is concluded that the binding must be dependent on multiple characteristics that are not captured by a single molecular descriptor. KEYWORDS: -Glucan; barley; oat; bile salts; phenolic derivatives; -glucosides INTRODUCTION The first publication on the relationship between dietary fibers and small molecules, namely, bile salts, was published by Cooksoon et al. in 1967 (1). Since then, the health-promoting effect of dietary fibers and the influence of dietary fibers in food mixtures has been investigated in a large number of studies. The health-promoting effects of dietary fibers are now well documented (2-5). Knowledge obtained in these studies has inspired this study and has served as a platform in the investigation of the interaction of a different set of small molecules with -glucans. It has been observed in animal as well as human models that an increase in soluble, viscous nonstarch polysaccharides (e.g., -glucan) in the diet is ac- companied by an increase in fecal sterols, suggesting that these fibers interact with bile salts and cholesterol in the gastrointes- tinal (GI) tract (6, 7). Cellulose was shown not to possess any of these effects, but it was not possible to define the properties responsible for binding or retention (8). The adsorption capaci- ties of different fiber types were shown to vary, and the drug colestyramine, a bile acid sequestrant, has been adopted as a standard for these measurements (8). Eastwood et al. (9) suggested a simple method to establish strong and reversible adsorption. A linear relationship between the percentage of bile acid adsorbed and the amount of fiber used regardless of the bile acid concentration was observed. However, differences between the adsorption of different bile acids made final conclusions difficult. Dietary fibers from different sources have been tested and shown to adsorb bile salts, but the adsorption was not correlated with the ability of the fiber to alter the cholesterol level in vivo. This suggests that several factors influence the properties that account for the adsorption of the bile acids and the lowering of blood cholesterol levels (10, 11). * Corresponding author (telephone 353 33352; fax 353 33333; e-mail [email protected]). † Department of Plant Biology and Biotechnology. ‡ Department of Food Science. 2056 J. Agric. Food Chem. 2009, 57, 2056–2064 10.1021/jf802057v CCC: $40.75 2009 American Chemical Society Published on Web 02/11/2009
-
Upload
independent -
Category
Documents
-
view
0 -
download
0
Transcript of Molecular Interactions between Barley and Oat β-Glucans and Phenolic Derivatives
Molecular Interactions between Barley and Oat�-Glucans and Phenolic Derivatives
HENRIK TOFT SIMONSEN,† METTE S. NIELSEN,†,‡ NIELS J. CHRISTENSEN,‡
ULLA CHRISTENSEN,† THOMAS V. LA COUR,† MOHAMMED SADDIK MOTAWIA,†
BIRTHE P. M. JESPERSEN,‡ SØREN B. ENGELSEN,‡ AND
BIRGER LINDBERG MØLLER*,†
Plant Biochemistry Laboratory and Laboratory for Molecular Plant Biology, VKR Research CentrePro-Active Plants, Department of Plant Biology and Biotechnology, University of Copenhagen,
Thorvaldsensvej 40, 1871 Frederiksberg, Denmark, and Quality and Technology, Department of FoodScience, University of Copenhagen, Rolighedsvej 30, 1958 Frederiksberg C, Denmark
Equilibrium dialysis, molecular modeling, and multivariate data analysis were used to investigate thenature of the molecular interactions between 21 vanillin-inspired phenolic derivatives, 4 bile salts,and 2 commercially available �-glucan preparations, Glucagel and PromOat, from barley and oats.The two �-glucan products showed very similar binding properties. It was demonstrated that the two�-glucan products are able to absorb most phenolic derivatives at a level corresponding to theabsorption of bile salts. Glucosides of the phenolic compounds showed poor or no absorption. Thefour phenolic derivatives that showed strongest retention in the dialysis assay shared the pres-ence of a hydroxyl group in para-position to a CHO group. However, other compounds with the samestructural feature but possessing a different set of additional functional groups showed less retention.Principal component analysis (PCA) and partial least-squares regression (PLS) calculations using amultitude of diverse descriptors related to electronic, geometrical, constitutional, hybrid, and topologicalfeatures of the phenolic compounds showed a marked distinction between aglycon, glucosides, andbile salt retention. These analyses did not offer additional information with respect to the mode ofinteraction of the individual phenolics with the �-glucans. When the barley �-glucan was subjected toenzyme degradation, the ability to bind some but not all of the phenolic derivatives was lost. It isconcluded that the binding must be dependent on multiple characteristics that are not captured by asingle molecular descriptor.
KEYWORDS: �-Glucan; barley; oat; bile salts; phenolic derivatives; �-glucosides
INTRODUCTION
The first publication on the relationship between dietary fibersand small molecules, namely, bile salts, was published byCooksoon et al. in 1967 (1). Since then, the health-promotingeffect of dietary fibers and the influence of dietary fibers in foodmixtures has been investigated in a large number of studies.The health-promoting effects of dietary fibers are now welldocumented (2-5). Knowledge obtained in these studies hasinspired this study and has served as a platform in theinvestigation of the interaction of a different set of smallmolecules with �-glucans. It has been observed in animal aswell as human models that an increase in soluble, viscousnonstarch polysaccharides (e.g., �-glucan) in the diet is ac-companied by an increase in fecal sterols, suggesting that these
fibers interact with bile salts and cholesterol in the gastrointes-tinal (GI) tract (6, 7). Cellulose was shown not to possess anyof these effects, but it was not possible to define the propertiesresponsible for binding or retention (8). The adsorption capaci-ties of different fiber types were shown to vary, and the drugcolestyramine, a bile acid sequestrant, has been adopted as astandard for these measurements (8). Eastwood et al. (9)suggested a simple method to establish strong and reversibleadsorption. A linear relationship between the percentage of bileacid adsorbed and the amount of fiber used regardless of thebile acid concentration was observed. However, differencesbetween the adsorption of different bile acids made finalconclusions difficult. Dietary fibers from different sources havebeen tested and shown to adsorb bile salts, but the adsorptionwas not correlated with the ability of the fiber to alter thecholesterol level in vivo. This suggests that several factorsinfluence the properties that account for the adsorption of thebile acids and the lowering of blood cholesterol levels (10, 11).
* Corresponding author (telephone 353 33352; fax 353 33333; [email protected]).
† Department of Plant Biology and Biotechnology.‡ Department of Food Science.
2056 J. Agric. Food Chem. 2009, 57, 2056–2064
10.1021/jf802057v CCC: $40.75 2009 American Chemical SocietyPublished on Web 02/11/2009
Fiber-induced changes in fecal bile salt concentrations orcomposition may not be the sole mechanism involved in thelowering of serum cholesterol. No direct correlation betweenthe viscosity of the matrix and the adsorption has been observed,whereas adjustments of pH and salt strength have been observedto alter the adsorption properties of the fibers (12). Multipleadsorption mechanisms are possible, mediated by the same,partly overlapping, or different molecular parameters contribut-ing to viscosity. One major mechanism could be the formationof micelles by the bile acid and the adsorption of these withinthe fiber (13, 14).
�-Glucans are known as hydrocolloid-forming glucose poly-mers and are used as texture-enhancing additives in the foodindustry. Several studies have shown that hydrocolloids influ-ence the rate and intensity of flavor release in foods (15-17).Itisrecognizedthatviscosityaffectsoverallflavorperception(15,18).Thickened solutions of similar viscosity do not necessarily offerthe same flavor perception. This demonstrates that viscosity aswell as adsorption affects flavor release and perception (19).The molecular mechanisms that govern the functionality of�-glucans in human health and in food matrices thus remainelusive. Knowledge of the physicochemical interactions thatoccur between aroma compounds and food constituents isrequired to be able to describe the behavior of aroma and flavorcompounds in food products.
To study interactions between �-glucans and small moleculessuch as aroma compounds, phenolic derivatives, and bile salts,several different methods have been used, including staticheadspace, NMR, dynamic exponential dilution, and sizeexclusion chromatography (9, 19-22). Thus, thermodynamicand other dynamic approaches have been used to study thebehavior of aroma compounds in model complex media thatpossess different microstructure.
In equilibrium dialysis, a liquid is partitioned through asemipermeable membrane that separates a cell into two com-partments, a sample and an assay chamber, of which onecontains the dietary fiber. If the interactions that occur betweentwo components (e.g., small molecules such as aroma com-pounds and macromolecules such as dietary fiber) are strong
enough, only the nonretained small molecules will participatein the equilibrium. If the total concentration of a small compoundin the two compartments at equilibrium is known, it is possibleto calculate the quantity that is adsorbed or retained by themacromolecule matrix (23). This enables quantitative assessmentof molecular interactions between small compounds and mac-romolecular food constituents (e.g., �-glucan). Molecular af-finities and mechanisms by which �-glucans function may beelucidated by combined studies of small compound retentionin �-glucan matrices, molecular modeling, and multivariate dataanalysis. This knowledge can be correlated to the interactionsof other small molecules and �-glucans and provide ideas onhow �-glucans affect the aroma of foods and function as healthpromoters in the intestine.
The objective of the present study was to determine thepossible interaction between 21 different vanillin-inspiredphenolic derivatives, 6 glucosides of these derivatives, and 4bile salts and specific barley �-glucan (Glucagel) and oat�-glucan (PromOat) preparations using equilibrium dialysis.Differences in the �-glucan-induced retention of the smallmolecules were related to the specific physicochemical proper-ties of these molecules using molecular modeling and multi-variate data analysis.
MATERIALS AND METHODS
Phenolic Derivatives and Bile Acids. Vanillin and 20 differentrelated phenolic structures (1-21), tryptophan, and the 4 bile acidsdeoxycholic acid, glycocholic acid, taurocholic acid, and cholic acidwere obtained from Sigma-Aldrich (Copenhagen, Denmark) andselected for screening.
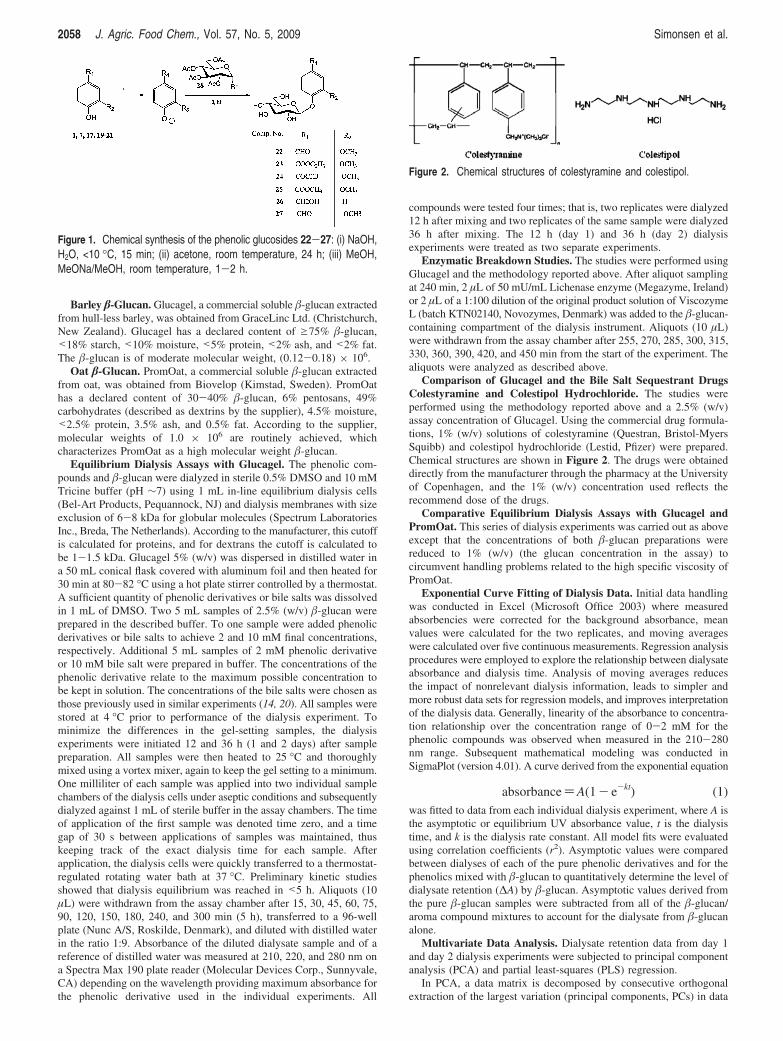
Glucosylation of Phenolic Compounds. The investigated phenolicglucosides 22-27 (Table 2) used in this study were chemicallysynthesized as shown in Figure 1.
Glucosylation of the aglycons 1, 7, 17, and 19-21 with 2,3,4,6-tetra-O-acetyl-R-D-glucopyranosyl bromide (28) was performed inaqueous organic basic media using homogeneous reaction conditionsand aqueous NaOH with acetone as the organic cosolvent (24) toprovide the related aryl O-protected-glucosides, which by Zemplendeacetylation afforded the phenolic compounds 22-27. The purity andstructural conformation was verified by NMR spectroscopy.
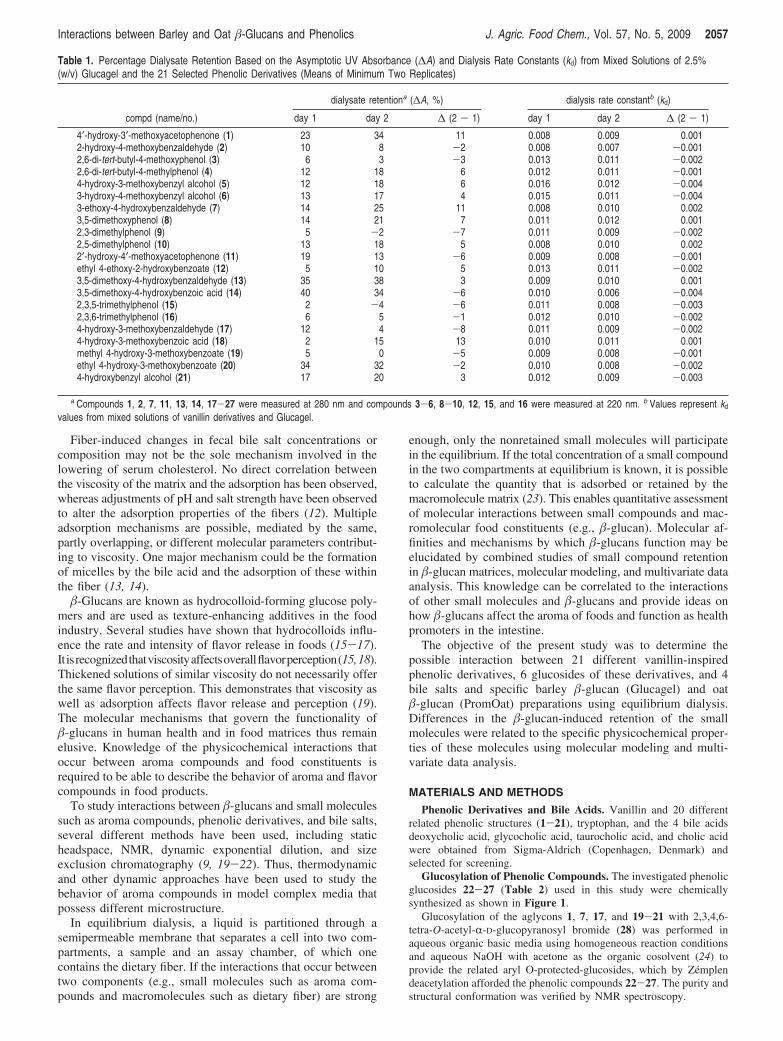
Table 1. Percentage Dialysate Retention Based on the Asymptotic UV Absorbance (∆A) and Dialysis Rate Constants (kd) from Mixed Solutions of 2.5%(w/v) Glucagel and the 21 Selected Phenolic Derivatives (Means of Minimum Two Replicates)
dialysate retentiona (∆A, %) dialysis rate constantb (kd)
compd (name/no.) day 1 day 2 ∆ (2 - 1) day 1 day 2 ∆ (2 - 1)
4′-hydroxy-3′-methoxyacetophenone (1) 23 34 11 0.008 0.009 0.0012-hydroxy-4-methoxybenzaldehyde (2) 10 8 -2 0.008 0.007 -0.0012,6-di-tert-butyl-4-methoxyphenol (3) 6 3 -3 0.013 0.011 -0.0022,6-di-tert-butyl-4-methylphenol (4) 12 18 6 0.012 0.011 -0.0014-hydroxy-3-methoxybenzyl alcohol (5) 12 18 6 0.016 0.012 -0.0043-hydroxy-4-methoxybenzyl alcohol (6) 13 17 4 0.015 0.011 -0.0043-ethoxy-4-hydroxybenzaldehyde (7) 14 25 11 0.008 0.010 0.0023,5-dimethoxyphenol (8) 14 21 7 0.011 0.012 0.0012,3-dimethylphenol (9) 5 -2 -7 0.011 0.009 -0.0022,5-dimethylphenol (10) 13 18 5 0.008 0.010 0.0022′-hydroxy-4′-methoxyacetophenone (11) 19 13 -6 0.009 0.008 -0.001ethyl 4-ethoxy-2-hydroxybenzoate (12) 5 10 5 0.013 0.011 -0.0023,5-dimethoxy-4-hydroxybenzaldehyde (13) 35 38 3 0.009 0.010 0.0013,5-dimethoxy-4-hydroxybenzoic acid (14) 40 34 -6 0.010 0.006 -0.0042,3,5-trimethylphenol (15) 2 -4 -6 0.011 0.008 -0.0032,3,6-trimethylphenol (16) 6 5 -1 0.012 0.010 -0.0024-hydroxy-3-methoxybenzaldehyde (17) 12 4 -8 0.011 0.009 -0.0024-hydroxy-3-methoxybenzoic acid (18) 2 15 13 0.010 0.011 0.001methyl 4-hydroxy-3-methoxybenzoate (19) 5 0 -5 0.009 0.008 -0.001ethyl 4-hydroxy-3-methoxybenzoate (20) 34 32 -2 0.010 0.008 -0.0024-hydroxybenzyl alcohol (21) 17 20 3 0.012 0.009 -0.003
a Compounds 1, 2, 7, 11, 13, 14, 17-27 were measured at 280 nm and compounds 3-6, 8-10, 12, 15, and 16 were measured at 220 nm. b Values represent kd
values from mixed solutions of vanillin derivatives and Glucagel.
Interactions between Barley and Oat �-Glucans and Phenolics J. Agric. Food Chem., Vol. 57, No. 5, 2009 2057
Barley �-Glucan. Glucagel, a commercial soluble �-glucan extractedfrom hull-less barley, was obtained from GraceLinc Ltd. (Christchurch,New Zealand). Glucagel has a declared content of g75% �-glucan,<18% starch, <10% moisture, <5% protein, <2% ash, and <2% fat.The �-glucan is of moderate molecular weight, (0.12-0.18) × 106.
Oat �-Glucan. PromOat, a commercial soluble �-glucan extractedfrom oat, was obtained from Biovelop (Kimstad, Sweden). PromOathas a declared content of 30-40% �-glucan, 6% pentosans, 49%carbohydrates (described as dextrins by the supplier), 4.5% moisture,<2.5% protein, 3.5% ash, and 0.5% fat. According to the supplier,molecular weights of 1.0 × 10⁶ are routinely achieved, whichcharacterizes PromOat as a high molecular weight �-glucan.
Equilibrium Dialysis Assays with Glucagel. The phenolic com-pounds and �-glucan were dialyzed in sterile 0.5% DMSO and 10 mMTricine buffer (pH ∼7) using 1 mL in-line equilibrium dialysis cells(Bel-Art Products, Pequannock, NJ) and dialysis membranes with sizeexclusion of 6-8 kDa for globular molecules (Spectrum LaboratoriesInc., Breda, The Netherlands). According to the manufacturer, this cutoffis calculated for proteins, and for dextrans the cutoff is calculated tobe 1-1.5 kDa. Glucagel 5% (w/v) was dispersed in distilled water ina 50 mL conical flask covered with aluminum foil and then heated for30 min at 80-82 °C using a hot plate stirrer controlled by a thermostat.A sufficient quantity of phenolic derivatives or bile salts was dissolvedin 1 mL of DMSO. Two 5 mL samples of 2.5% (w/v) �-glucan wereprepared in the described buffer. To one sample were added phenolicderivatives or bile salts to achieve 2 and 10 mM final concentrations,respectively. Additional 5 mL samples of 2 mM phenolic derivativeor 10 mM bile salt were prepared in buffer. The concentrations of thephenolic derivative relate to the maximum possible concentration tobe kept in solution. The concentrations of the bile salts were chosen asthose previously used in similar experiments (14, 20). All samples werestored at 4 °C prior to performance of the dialysis experiment. Tominimize the differences in the gel-setting samples, the dialysisexperiments were initiated 12 and 36 h (1 and 2 days) after samplepreparation. All samples were then heated to 25 °C and thoroughlymixed using a vortex mixer, again to keep the gel setting to a minimum.One milliliter of each sample was applied into two individual samplechambers of the dialysis cells under aseptic conditions and subsequentlydialyzed against 1 mL of sterile buffer in the assay chambers. The timeof application of the first sample was denoted time zero, and a timegap of 30 s between applications of samples was maintained, thuskeeping track of the exact dialysis time for each sample. Afterapplication, the dialysis cells were quickly transferred to a thermostat-regulated rotating water bath at 37 °C. Preliminary kinetic studiesshowed that dialysis equilibrium was reached in <5 h. Aliquots (10µL) were withdrawn from the assay chamber after 15, 30, 45, 60, 75,90, 120, 150, 180, 240, and 300 min (5 h), transferred to a 96-wellplate (Nunc A/S, Roskilde, Denmark), and diluted with distilled waterin the ratio 1:9. Absorbance of the diluted dialysate sample and of areference of distilled water was measured at 210, 220, and 280 nm ona Spectra Max 190 plate reader (Molecular Devices Corp., Sunnyvale,CA) depending on the wavelength providing maximum absorbance forthe phenolic derivative used in the individual experiments. All
compounds were tested four times; that is, two replicates were dialyzed12 h after mixing and two replicates of the same sample were dialyzed36 h after mixing. The 12 h (day 1) and 36 h (day 2) dialysisexperiments were treated as two separate experiments.
Enzymatic Breakdown Studies. The studies were performed usingGlucagel and the methodology reported above. After aliquot samplingat 240 min, 2 µL of 50 mU/mL Lichenase enzyme (Megazyme, Ireland)or 2 µL of a 1:100 dilution of the original product solution of ViscozymeL (batch KTN02140, Novozymes, Denmark) was added to the �-glucan-containing compartment of the dialysis instrument. Aliquots (10 µL)were withdrawn from the assay chamber after 255, 270, 285, 300, 315,330, 360, 390, 420, and 450 min from the start of the experiment. Thealiquots were analyzed as described above.
Comparison of Glucagel and the Bile Salt Sequestrant DrugsColestyramine and Colestipol Hydrochloride. The studies wereperformed using the methodology reported above and a 2.5% (w/v)assay concentration of Glucagel. Using the commercial drug formula-tions, 1% (w/v) solutions of colestyramine (Questran, Bristol-MyersSquibb) and colestipol hydrochloride (Lestid, Pfizer) were prepared.Chemical structures are shown in Figure 2. The drugs were obtaineddirectly from the manufacturer through the pharmacy at the Universityof Copenhagen, and the 1% (w/v) concentration used reflects therecommend dose of the drugs.
Comparative Equilibrium Dialysis Assays with Glucagel andPromOat. This series of dialysis experiments was carried out as aboveexcept that the concentrations of both �-glucan preparations werereduced to 1% (w/v) (the glucan concentration in the assay) tocircumvent handling problems related to the high specific viscosity ofPromOat.
Exponential Curve Fitting of Dialysis Data. Initial data handlingwas conducted in Excel (Microsoft Office 2003) where measuredabsorbencies were corrected for the background absorbance, meanvalues were calculated for the two replicates, and moving averageswere calculated over five continuous measurements. Regression analysisprocedures were employed to explore the relationship between dialysateabsorbance and dialysis time. Analysis of moving averages reducesthe impact of nonrelevant dialysis information, leads to simpler andmore robust data sets for regression models, and improves interpretationof the dialysis data. Generally, linearity of the absorbance to concentra-tion relationship over the concentration range of 0-2 mM for thephenolic compounds was observed when measured in the 210-280nm range. Subsequent mathematical modeling was conducted inSigmaPlot (version 4.01). A curve derived from the exponential equation
absorbance)A(1- e-kt) (1)was fitted to data from each individual dialysis experiment, where A isthe asymptotic or equilibrium UV absorbance value, t is the dialysistime, and k is the dialysis rate constant. All model fits were evaluatedusing correlation coefficients (r2). Asymptotic values were comparedbetween dialyses of each of the pure phenolic derivatives and for thephenolics mixed with �-glucan to quantitatively determine the level ofdialysate retention (∆A) by �-glucan. Asymptotic values derived fromthe pure �-glucan samples were subtracted from all of the �-glucan/aroma compound mixtures to account for the dialysate from �-glucanalone.
Multivariate Data Analysis. Dialysate retention data from day 1and day 2 dialysis experiments were subjected to principal componentanalysis (PCA) and partial least-squares (PLS) regression.
In PCA, a data matrix is decomposed by consecutive orthogonalextraction of the largest variation (principal components, PCs) in data
Figure 1. Chemical synthesis of the phenolic glucosides 22-27: (i) NaOH,H2O, <10 °C, 15 min; (ii) acetone, room temperature, 24 h; (iii) MeOH,MeONa/MeOH, room temperature, 1-2 h.
Figure 2. Chemical structures of colestyramine and colestipol.
2058 J. Agric. Food Chem., Vol. 57, No. 5, 2009 Simonsen et al.
until the variation left is unsystematic. The loading vectors can beconsidered as pure hidden profiles that are common to all measurements.Two-dimensional scatter plots of the score vectors show the covariancebetween samples, providing a characterization of data. The purpose ofPLS regression is to build a linear model enabling prediction of a desiredchemical/physical characteristic (Y) from measured data (X). Duringthe regression, X is decomposed as in PCA, but the PCs are found asthe underlying structures that covary best with the Y variable (25).
All molecular structures in this study were optimized with MM3*in MacroModel (26). A total of 234 molecular descriptors werecalculated for the phenolic derivatives and glucosides with CDK (27)and QikProp (28). CDK descriptors are divided into five major classes:electronic (atomic polarizabilities, bond polarizabilities, charged partialsurface areas, hydrogen bond acceptors, and hydrogen bond donors),geometrical (geometrical index, length over breadth, moments of inertia,and Petitjean shape indices), constitutional (AlogP, bond, element, andatom type counts, largest chain, Lipinski’s rule of five, rotable bondscount, XlogP, molecular weight), hybrid (BCUT and WHIM), andtopological (carbon types, Chi indices, eccentric connectivity index,fragment complexity, Kier and Hall molecular shape indices, topologicalpolar surface area, Wiener numbers, Zagreb index, and Moreau-Brotoautocorrelation descriptors). QikProp provides approximately 40 de-scriptors, of which several (e.g., predicted brain/blood partition coef-ficient, QPLogBB) are of pharmaceutical relevance, whereas others[e.g., PM3 calculated ionization potential, IP(eV)] are of a more generalnature. Without any a priori knowledge of the mechanisms involved,we anticipate that this diverse set of molecular descriptors capturesinformation relevant to the dialysis characteristics. To reduce the amountof noise in the descriptor matrix and improve the subsequent interpreta-tion of PCA plots and PLS regressions, a simple two-step variableselection scheme was employed. First, descriptors were deleted unlessthey assumed distinct values for at least 12 samples. Second, the Pearsonproduct moment correlation coefficient, r, between response (∆A orkd) and the descriptors was evaluated. In cases when r fell below acertain threshold (0.5 for ∆A, 0.2 for kd), the corresponding descriptorwas deleted. The lower threshold for kd was required, becauseresponse-descriptor correlations were very low in this case. Thenumber of descriptors produced by the variable selection was 62 forday 1 ∆A, 16 for day 2 ∆A, 82 for day 1 kd, and 91 for day 2 kd. Thevariables were autoscaled prior to data analysis, and full (leave-one-out) cross-validation was used. The PLS models were evaluated onthe basis of the root-mean-square error of cross-validation (RMSECV),which is the estimation of the error of the predicted values. Multivariatedata analysis was performed using Unscrambler (29), Matlab (30), andLatentix (31).
Molecular Mass Determination. The molecular mass of the�-glucans was estimated by size exclusion chromatography (SEC) usinga Superdex 200 column (16 mm × 60 cm, GE Healthcare Bio-SciencesAB, Uppsala, Sweden) fitted with a refractive index detector. Superdex200 is a cross-linked agarose and dextran material with a nominal beadsize of 13 µm, a pore size of 100-120 Å, and an optimal separationrange of 10,000-600,000 Da. The mobile phase consisted of 50 mMammonium formate and 200 mM NaCl, and the column was eluted atroom temperature at 1.6 mL/h. Dextrose standards of 5, 12, 25, 50,80, and 150 kDa (Fluka, Buchs, Switzerland) were used for calibration.
RESULTS
Vanillin and 20 other phenolic derivatives (1-21), 6 phenolicglucosides (22-27), and 4 bile salts were tested with respectto their ability to bind to Glucagel using the dialysis setup. Thephenolic derivatives can be divided into different chemicalclasses according to the functional groups present in the differentcompounds. All of them possess a central benzene ring as thecore structure. The benzene ring is substituted with a minimumof two groups, of which one would be an oxy group. Theaglycon structures may be grouped into 2 ketones (1, 11), 4aldehydes (2, 7, 13, 17), of which 2 were hydroxylated on thebenzene ring (2, 17), 10 phenols (3-6, 8-10, 15, 16, 21), ofwhich 2 had one additional hydroxyl group (5, 6), 3 esters ofeither ethyl or methyl character (12, 19, 20), and 2 aromaticacids (14, 18) (Tables 1 and 2). The molecules cover a broadrange of log P values ranging from -0.5 for the glucosides to5.1 for compound 4. With respect to their physical dimensions,the phenolic derivatives and bile salts also span a significantrange from the large bile salts (18-19 Å in diameter) to thesmallest, being compound 21 (7 Å in diameter).
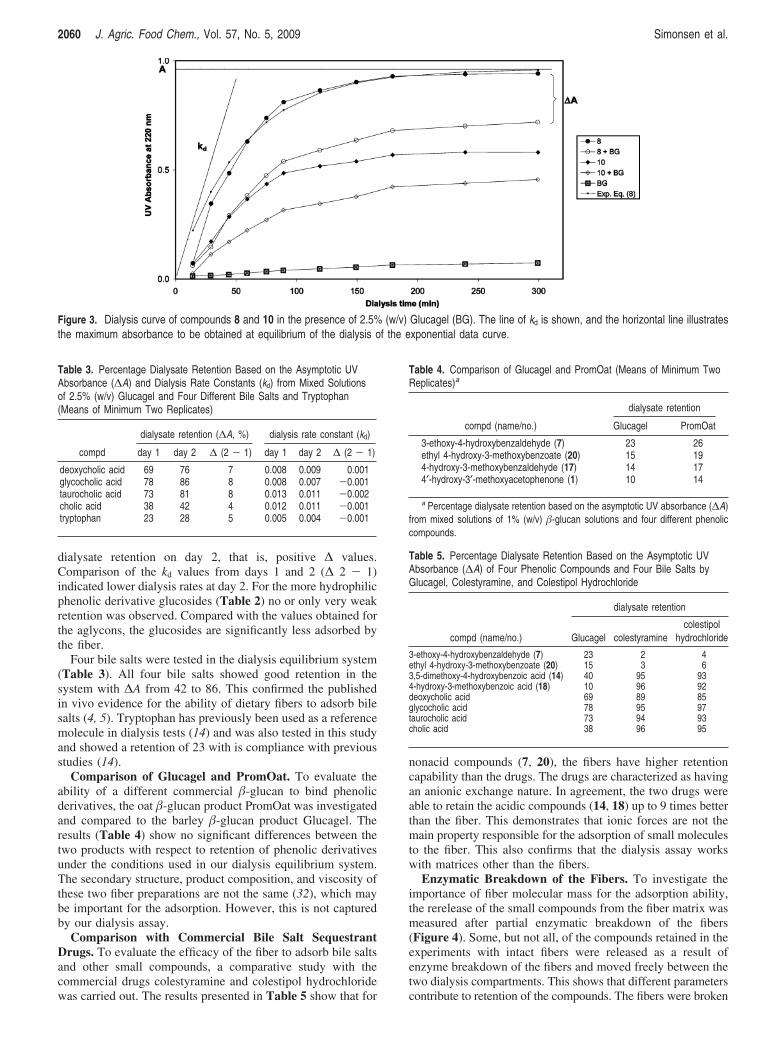
The ability of all of the compounds 1-27 to bind to Glucagelwas analyzed in dialysis experiments. Exponential curve fittingof all dialysis data was performed to fit eq 1. Dialysis curvesof 8 and 10 in the presence of 2.5% (w/v) Glucagel as well asthe exponential curve fit are presented in Figure 3 as typicalexamples. Dialysate retentions (∆A) and dialysis rate constants(kd) from the screening of all 21 phenolic derivatives arepresented in Table 1. The values represent the mean of tworeplicates. Values obtained by dialysis of �-glucan in the absenceof any added compound were subtracted from the valuesobtained with added compounds. All dialysis experimentsexhibited patterns similar to those presented in Figure 3. Thepatterns are composed of an initial steep slope during the first∼15-90 min and an asymptotic convergence toward a maxi-mum after 90-300 min. Generally, there was good agreementbetween the dialysis curve and the exponential fit. Correlationcoefficients from the curve fits were >0.95 in all dialysisexperiments. At equilibrium/asymptotic level, the absorbanceof 8 reaches a value of 0.96, whereas the asymptotic value of8 + 2.5% (w/v) Glucagel is 0.76. This gives a relative differenceof 22%, which corresponds to the retention of dialysate (8) bythe �-glucan, as seen in Table 1. The different classes ofchemical compounds within the 21 phenolic derivatives suchas ketones, aldehydes, phenols, esters, and acids did notdifferentiate significantly from each other and within the groupswith respect to being retained by the barley �-glucan. Only fourcompounds (1, 13, 14, 20) gave rise to a ∆A > 30. All fourcompounds shared the presence of a hydroxyl group at position4 and a CHO group at position 1. However, other compoundssuch as 18, 5, and 19 also possess these features and give riseto much lower ∆A values. The difference between day 1 andday 2 retentions (∆ 2 - 1) showed a weak tendency of increased
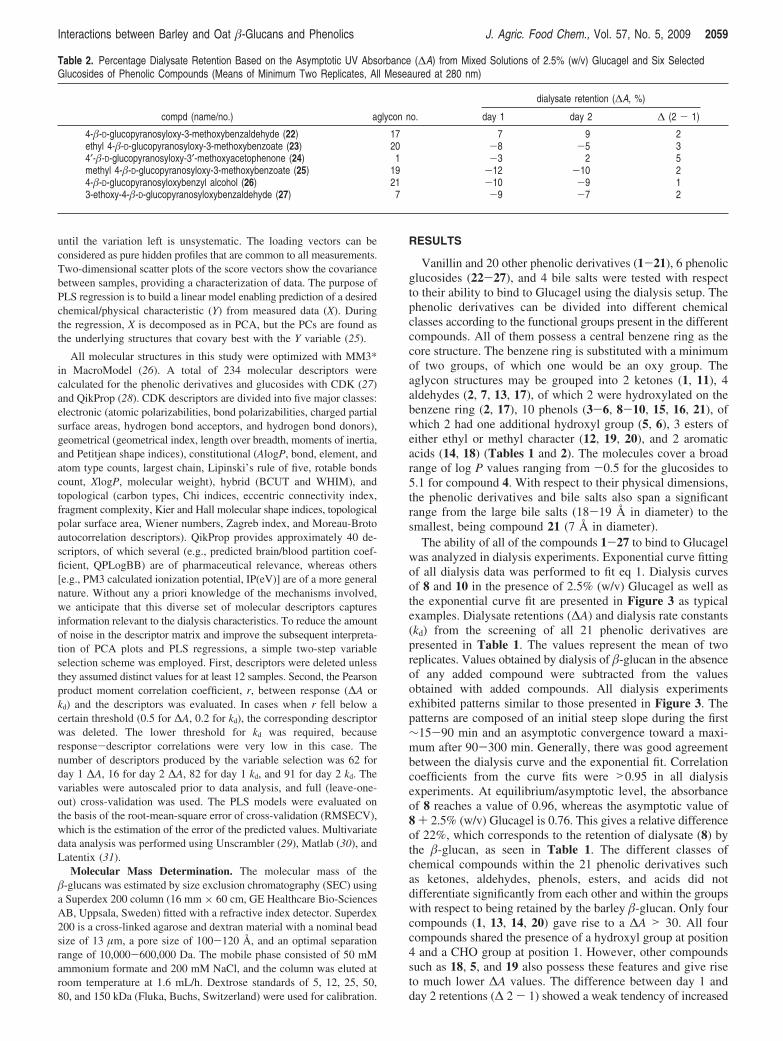
Table 2. Percentage Dialysate Retention Based on the Asymptotic UV Absorbance (∆A) from Mixed Solutions of 2.5% (w/v) Glucagel and Six SelectedGlucosides of Phenolic Compounds (Means of Minimum Two Replicates, All Meseaured at 280 nm)
dialysate retention (∆A, %)
compd (name/no.) aglycon no. day 1 day 2 ∆ (2 - 1)
4-�-D-glucopyranosyloxy-3-methoxybenzaldehyde (22) 17 7 9 2ethyl 4-�-D-glucopyranosyloxy-3-methoxybenzoate (23) 20 -8 -5 34′-�-D-glucopyranosyloxy-3′-methoxyacetophenone (24) 1 -3 2 5methyl 4-�-D-glucopyranosyloxy-3-methoxybenzoate (25) 19 -12 -10 24-�-D-glucopyranosyloxybenzyl alcohol (26) 21 -10 -9 13-ethoxy-4-�-D-glucopyranosyloxybenzaldehyde (27) 7 -9 -7 2
Interactions between Barley and Oat �-Glucans and Phenolics J. Agric. Food Chem., Vol. 57, No. 5, 2009 2059
dialysate retention on day 2, that is, positive ∆ values.Comparison of the kd values from days 1 and 2 (∆ 2 - 1)indicated lower dialysis rates at day 2. For the more hydrophilicphenolic derivative glucosides (Table 2) no or only very weakretention was observed. Compared with the values obtained forthe aglycons, the glucosides are significantly less adsorbed bythe fiber.
Four bile salts were tested in the dialysis equilibrium system(Table 3). All four bile salts showed good retention in thesystem with ∆A from 42 to 86. This confirmed the publishedin vivo evidence for the ability of dietary fibers to adsorb bilesalts (4, 5). Tryptophan has previously been used as a referencemolecule in dialysis tests (14) and was also tested in this studyand showed a retention of 23 with is compliance with previousstudies (14).
Comparison of Glucagel and PromOat. To evaluate theability of a different commercial �-glucan to bind phenolicderivatives, the oat �-glucan product PromOat was investigatedand compared to the barley �-glucan product Glucagel. Theresults (Table 4) show no significant differences between thetwo products with respect to retention of phenolic derivativesunder the conditions used in our dialysis equilibrium system.The secondary structure, product composition, and viscosity ofthese two fiber preparations are not the same (32), which maybe important for the adsorption. However, this is not capturedby our dialysis assay.
Comparison with Commercial Bile Salt SequestrantDrugs. To evaluate the efficacy of the fiber to adsorb bile saltsand other small compounds, a comparative study with thecommercial drugs colestyramine and colestipol hydrochloridewas carried out. The results presented in Table 5 show that for
nonacid compounds (7, 20), the fibers have higher retentioncapability than the drugs. The drugs are characterized as havingan anionic exchange nature. In agreement, the two drugs wereable to retain the acidic compounds (14, 18) up to 9 times betterthan the fiber. This demonstrates that ionic forces are not themain property responsible for the adsorption of small moleculesto the fiber. This also confirms that the dialysis assay workswith matrices other than the fibers.
Enzymatic Breakdown of the Fibers. To investigate theimportance of fiber molecular mass for the adsorption ability,the rerelease of the small compounds from the fiber matrix wasmeasured after partial enzymatic breakdown of the fibers(Figure 4). Some, but not all, of the compounds retained in theexperiments with intact fibers were released as a result ofenzyme breakdown of the fibers and moved freely between thetwo dialysis compartments. This shows that different parameterscontribute to retention of the compounds. The fibers were broken
Figure 3. Dialysis curve of compounds 8 and 10 in the presence of 2.5% (w/v) Glucagel (BG). The line of kd is shown, and the horizontal line illustratesthe maximum absorbance to be obtained at equilibrium of the dialysis of the exponential data curve.
Table 3. Percentage Dialysate Retention Based on the Asymptotic UVAbsorbance (∆A) and Dialysis Rate Constants (kd) from Mixed Solutionsof 2.5% (w/v) Glucagel and Four Different Bile Salts and Tryptophan(Means of Minimum Two Replicates)
dialysate retention (∆A, %) dialysis rate constant (kd)
compd day 1 day 2 ∆ (2 - 1) day 1 day 2 ∆ (2 - 1)
deoxycholic acid 69 76 7 0.008 0.009 0.001glycocholic acid 78 86 8 0.008 0.007 -0.001taurocholic acid 73 81 8 0.013 0.011 -0.002cholic acid 38 42 4 0.012 0.011 -0.001tryptophan 23 28 5 0.005 0.004 -0.001
Table 4. Comparison of Glucagel and PromOat (Means of Minimum TwoReplicates)a
dialysate retention
compd (name/no.) Glucagel PromOat
3-ethoxy-4-hydroxybenzaldehyde (7) 23 26ethyl 4-hydroxy-3-methoxybenzoate (20) 15 194-hydroxy-3-methoxybenzaldehyde (17) 14 174′-hydroxy-3′-methoxyacetophenone (1) 10 14
a Percentage dialysate retention based on the asymptotic UV absorbance (∆A)from mixed solutions of 1% (w/v) �-glucan solutions and four different phenoliccompounds.
Table 5. Percentage Dialysate Retention Based on the Asymptotic UVAbsorbance (∆A) of Four Phenolic Compounds and Four Bile Salts byGlucagel, Colestyramine, and Colestipol Hydrochloride
dialysate retention
compd (name/no.) Glucagel colestyraminecolestipol
hydrochloride
3-ethoxy-4-hydroxybenzaldehyde (7) 23 2 4ethyl 4-hydroxy-3-methoxybenzoate (20) 15 3 63,5-dimethoxy-4-hydroxybenzoic acid (14) 40 95 934-hydroxy-3-methoxybenzoic acid (18) 10 96 92deoxycholic acid 69 89 85glycocholic acid 78 95 97taurocholic acid 73 94 93cholic acid 38 96 95
2060 J. Agric. Food Chem., Vol. 57, No. 5, 2009 Simonsen et al.
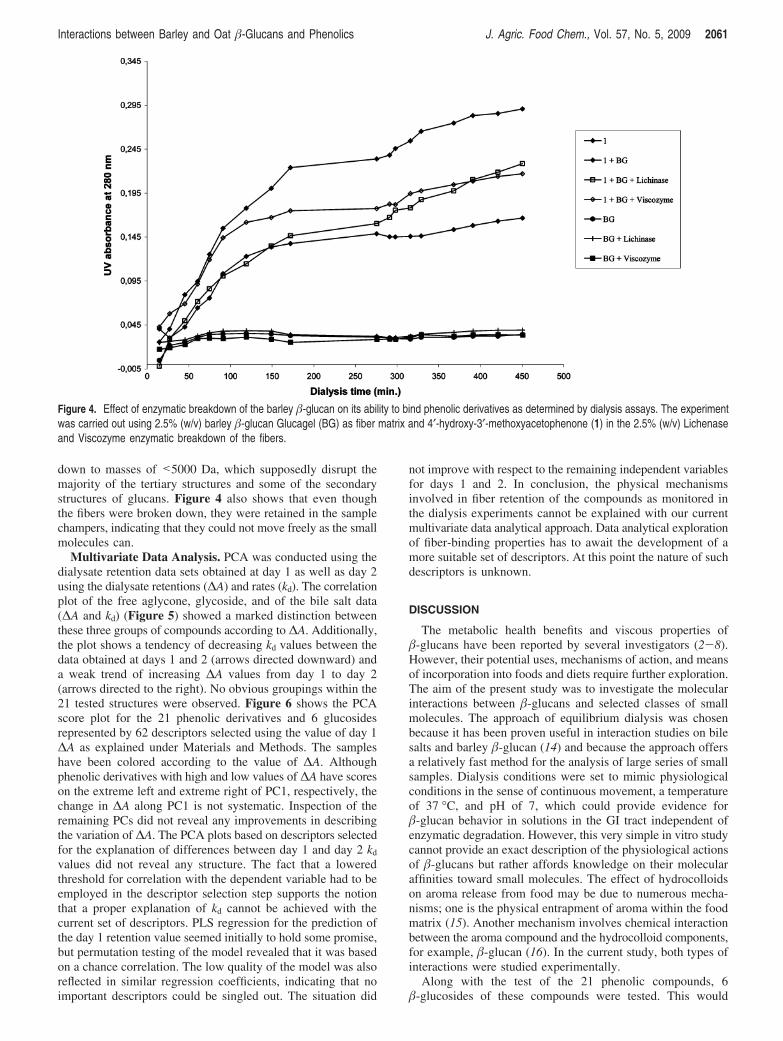
down to masses of <5000 Da, which supposedly disrupt themajority of the tertiary structures and some of the secondarystructures of glucans. Figure 4 also shows that even thoughthe fibers were broken down, they were retained in the samplechampers, indicating that they could not move freely as the smallmolecules can.
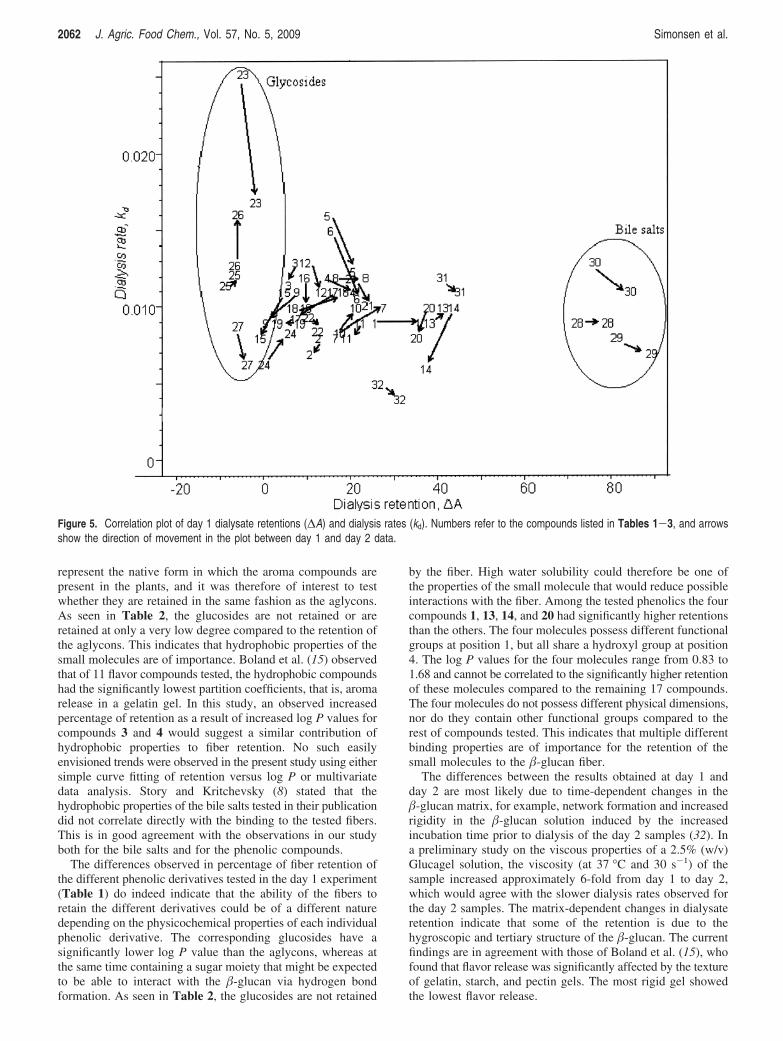
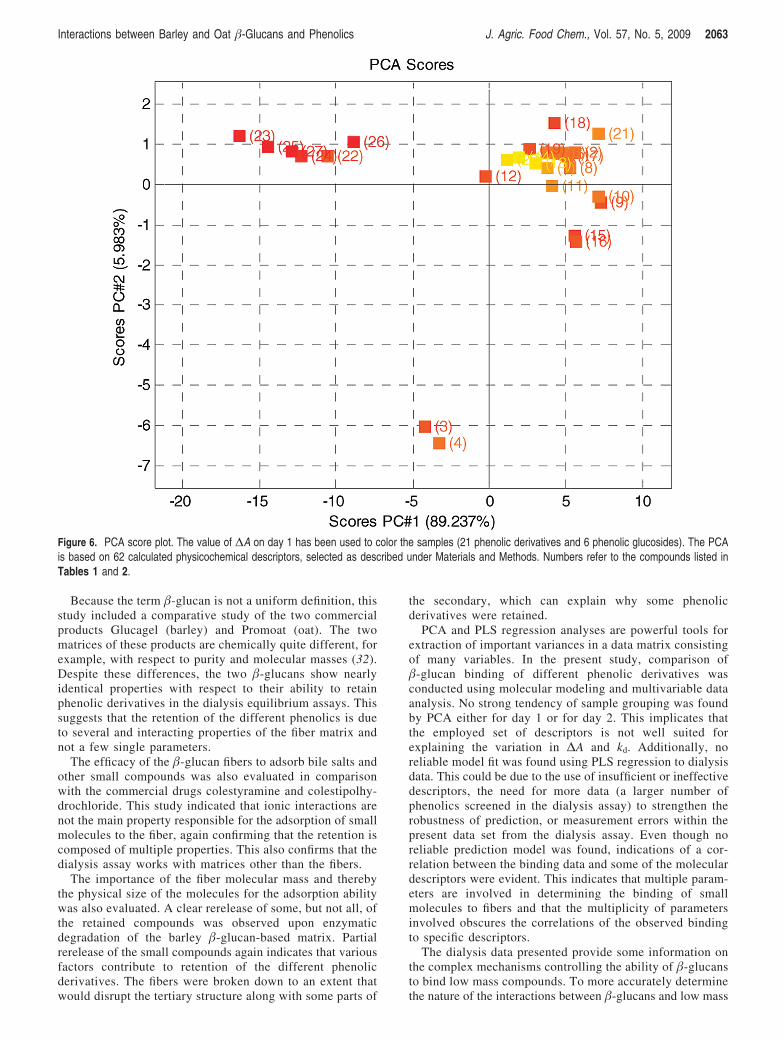
Multivariate Data Analysis. PCA was conducted using thedialysate retention data sets obtained at day 1 as well as day 2using the dialysate retentions (∆A) and rates (kd). The correlationplot of the free aglycone, glycoside, and of the bile salt data(∆A and kd) (Figure 5) showed a marked distinction betweenthese three groups of compounds according to ∆A. Additionally,the plot shows a tendency of decreasing kd values between thedata obtained at days 1 and 2 (arrows directed downward) anda weak trend of increasing ∆A values from day 1 to day 2(arrows directed to the right). No obvious groupings within the21 tested structures were observed. Figure 6 shows the PCAscore plot for the 21 phenolic derivatives and 6 glucosidesrepresented by 62 descriptors selected using the value of day 1∆A as explained under Materials and Methods. The sampleshave been colored according to the value of ∆A. Althoughphenolic derivatives with high and low values of ∆A have scoreson the extreme left and extreme right of PC1, respectively, thechange in ∆A along PC1 is not systematic. Inspection of theremaining PCs did not reveal any improvements in describingthe variation of ∆A. The PCA plots based on descriptors selectedfor the explanation of differences between day 1 and day 2 kd
values did not reveal any structure. The fact that a loweredthreshold for correlation with the dependent variable had to beemployed in the descriptor selection step supports the notionthat a proper explanation of kd cannot be achieved with thecurrent set of descriptors. PLS regression for the prediction ofthe day 1 retention value seemed initially to hold some promise,but permutation testing of the model revealed that it was basedon a chance correlation. The low quality of the model was alsoreflected in similar regression coefficients, indicating that noimportant descriptors could be singled out. The situation did
not improve with respect to the remaining independent variablesfor days 1 and 2. In conclusion, the physical mechanismsinvolved in fiber retention of the compounds as monitored inthe dialysis experiments cannot be explained with our currentmultivariate data analytical approach. Data analytical explorationof fiber-binding properties has to await the development of amore suitable set of descriptors. At this point the nature of suchdescriptors is unknown.
DISCUSSION
The metabolic health benefits and viscous properties of�-glucans have been reported by several investigators (2-8).However, their potential uses, mechanisms of action, and meansof incorporation into foods and diets require further exploration.The aim of the present study was to investigate the molecularinteractions between �-glucans and selected classes of smallmolecules. The approach of equilibrium dialysis was chosenbecause it has been proven useful in interaction studies on bilesalts and barley �-glucan (14) and because the approach offersa relatively fast method for the analysis of large series of smallsamples. Dialysis conditions were set to mimic physiologicalconditions in the sense of continuous movement, a temperatureof 37 °C, and pH of 7, which could provide evidence for�-glucan behavior in solutions in the GI tract independent ofenzymatic degradation. However, this very simple in vitro studycannot provide an exact description of the physiological actionsof �-glucans but rather affords knowledge on their molecularaffinities toward small molecules. The effect of hydrocolloidson aroma release from food may be due to numerous mecha-nisms; one is the physical entrapment of aroma within the foodmatrix (15). Another mechanism involves chemical interactionbetween the aroma compound and the hydrocolloid components,for example, �-glucan (16). In the current study, both types ofinteractions were studied experimentally.
Along with the test of the 21 phenolic compounds, 6�-glucosides of these compounds were tested. This would
Figure 4. Effect of enzymatic breakdown of the barley �-glucan on its ability to bind phenolic derivatives as determined by dialysis assays. The experimentwas carried out using 2.5% (w/v) barley �-glucan Glucagel (BG) as fiber matrix and 4′-hydroxy-3′-methoxyacetophenone (1) in the 2.5% (w/v) Lichenaseand Viscozyme enzymatic breakdown of the fibers.
Interactions between Barley and Oat �-Glucans and Phenolics J. Agric. Food Chem., Vol. 57, No. 5, 2009 2061
represent the native form in which the aroma compounds arepresent in the plants, and it was therefore of interest to testwhether they are retained in the same fashion as the aglycons.As seen in Table 2, the glucosides are not retained or areretained at only a very low degree compared to the retention ofthe aglycons. This indicates that hydrophobic properties of thesmall molecules are of importance. Boland et al. (15) observedthat of 11 flavor compounds tested, the hydrophobic compoundshad the significantly lowest partition coefficients, that is, aromarelease in a gelatin gel. In this study, an observed increasedpercentage of retention as a result of increased log P values forcompounds 3 and 4 would suggest a similar contribution ofhydrophobic properties to fiber retention. No such easilyenvisioned trends were observed in the present study using eithersimple curve fitting of retention versus log P or multivariatedata analysis. Story and Kritchevsky (8) stated that thehydrophobic properties of the bile salts tested in their publicationdid not correlate directly with the binding to the tested fibers.This is in good agreement with the observations in our studyboth for the bile salts and for the phenolic compounds.
The differences observed in percentage of fiber retention ofthe different phenolic derivatives tested in the day 1 experiment(Table 1) do indeed indicate that the ability of the fibers toretain the different derivatives could be of a different naturedepending on the physicochemical properties of each individualphenolic derivative. The corresponding glucosides have asignificantly lower log P value than the aglycons, whereas atthe same time containing a sugar moiety that might be expectedto be able to interact with the �-glucan via hydrogen bondformation. As seen in Table 2, the glucosides are not retained
by the fiber. High water solubility could therefore be one ofthe properties of the small molecule that would reduce possibleinteractions with the fiber. Among the tested phenolics the fourcompounds 1, 13, 14, and 20 had significantly higher retentionsthan the others. The four molecules possess different functionalgroups at position 1, but all share a hydroxyl group at position4. The log P values for the four molecules range from 0.83 to1.68 and cannot be correlated to the significantly higher retentionof these molecules compared to the remaining 17 compounds.The four molecules do not possess different physical dimensions,nor do they contain other functional groups compared to therest of compounds tested. This indicates that multiple differentbinding properties are of importance for the retention of thesmall molecules to the �-glucan fiber.
The differences between the results obtained at day 1 andday 2 are most likely due to time-dependent changes in the�-glucan matrix, for example, network formation and increasedrigidity in the �-glucan solution induced by the increasedincubation time prior to dialysis of the day 2 samples (32). Ina preliminary study on the viscous properties of a 2.5% (w/v)Glucagel solution, the viscosity (at 37 °C and 30 s-1) of thesample increased approximately 6-fold from day 1 to day 2,which would agree with the slower dialysis rates observed forthe day 2 samples. The matrix-dependent changes in dialysateretention indicate that some of the retention is due to thehygroscopic and tertiary structure of the �-glucan. The currentfindings are in agreement with those of Boland et al. (15), whofound that flavor release was significantly affected by the textureof gelatin, starch, and pectin gels. The most rigid gel showedthe lowest flavor release.
Figure 5. Correlation plot of day 1 dialysate retentions (∆A) and dialysis rates (kd). Numbers refer to the compounds listed in Tables 1-3, and arrowsshow the direction of movement in the plot between day 1 and day 2 data.
2062 J. Agric. Food Chem., Vol. 57, No. 5, 2009 Simonsen et al.
Because the term �-glucan is not a uniform definition, thisstudy included a comparative study of the two commercialproducts Glucagel (barley) and Promoat (oat). The twomatrices of these products are chemically quite different, forexample, with respect to purity and molecular masses (32).Despite these differences, the two �-glucans show nearlyidentical properties with respect to their ability to retainphenolic derivatives in the dialysis equilibrium assays. Thissuggests that the retention of the different phenolics is dueto several and interacting properties of the fiber matrix andnot a few single parameters.
The efficacy of the �-glucan fibers to adsorb bile salts andother small compounds was also evaluated in comparisonwith the commercial drugs colestyramine and colestipolhy-drochloride. This study indicated that ionic interactions arenot the main property responsible for the adsorption of smallmolecules to the fiber, again confirming that the retention iscomposed of multiple properties. This also confirms that thedialysis assay works with matrices other than the fibers.
The importance of the fiber molecular mass and therebythe physical size of the molecules for the adsorption abilitywas also evaluated. A clear rerelease of some, but not all, ofthe retained compounds was observed upon enzymaticdegradation of the barley �-glucan-based matrix. Partialrerelease of the small compounds again indicates that variousfactors contribute to retention of the different phenolicderivatives. The fibers were broken down to an extent thatwould disrupt the tertiary structure along with some parts of
the secondary, which can explain why some phenolicderivatives were retained.
PCA and PLS regression analyses are powerful tools forextraction of important variances in a data matrix consistingof many variables. In the present study, comparison of�-glucan binding of different phenolic derivatives wasconducted using molecular modeling and multivariable dataanalysis. No strong tendency of sample grouping was foundby PCA either for day 1 or for day 2. This implicates thatthe employed set of descriptors is not well suited forexplaining the variation in ∆A and kd. Additionally, noreliable model fit was found using PLS regression to dialysisdata. This could be due to the use of insufficient or ineffectivedescriptors, the need for more data (a larger number ofphenolics screened in the dialysis assay) to strengthen therobustness of prediction, or measurement errors within thepresent data set from the dialysis assay. Even though noreliable prediction model was found, indications of a cor-relation between the binding data and some of the moleculardescriptors were evident. This indicates that multiple param-eters are involved in determining the binding of smallmolecules to fibers and that the multiplicity of parametersinvolved obscures the correlations of the observed bindingto specific descriptors.
The dialysis data presented provide some information onthe complex mechanisms controlling the ability of �-glucansto bind low mass compounds. To more accurately determinethe nature of the interactions between �-glucans and low mass
Figure 6. PCA score plot. The value of ∆A on day 1 has been used to color the samples (21 phenolic derivatives and 6 phenolic glucosides). The PCAis based on 62 calculated physicochemical descriptors, selected as described under Materials and Methods. Numbers refer to the compounds listed inTables 1 and 2.
Interactions between Barley and Oat �-Glucans and Phenolics J. Agric. Food Chem., Vol. 57, No. 5, 2009 2063
compounds, a range of advanced spectroscopy and molecularmodeling methodologies will need to be introduced.
In conclusion, the retention of aroma compounds by�-glucan is of great interest from a food composition pointof view and from a health perspective. In recent years, theincreased health consciousness among consumers has led toextended additional use of hydrocolloids as replacements forfats. The food industry would benefit greatly from animproved understanding of the mechanisms involved in theflavor retention and release from �-glucan matrices alongwith the nature of the interactions occurring in the GI tract.Knowledge of the action of model compounds in �-glucanmatrices can provide general information on the �-glucanaffinity toward small molecules, which would be applicablein the studies of, for example, the bioavailability of naturalcompounds found in association with �-glucans and for healthclaims on �-glucan.
It was confirmed that �-glucans from barley and oat areable to adsorb bile salts, and for the first time �-glucans’ability to absorb vanillin and other phenolic compounds wasdemonstrated. The retention in our newly developed dialysisassay depends on numerous and interacting physicochemicalproperties of the small molecules. The interaction could notbe explained by simple correlation to any of the descriptorsincluded in the multivariable data analysis, and the resultscould not confirm or disprove the previously describedhydrophobic binding or micelle capture of the small mol-ecules to the �-glucan.
LITERATURE CITED
(1) Cookson, F. B.; Altschul, R.; Fedoroff, S. The effects of alfalfaon serum cholesterol and in modifying or preventing cholesterol-induced atherosclerosis in rabbits. J. Atheroscler. Res. 1967, 7,69–81.
(2) Eastwood, M. A. A molecular biological basis for the nutritionaland pharmacological benefits of dietary plants. Q. J. Med. 2001,94, 45–48.
(3) Eastwood, M. A.; Kritchevsky, D. Dietary fibre: how did we getwhere we are? Annu. ReV. Nutr. 2005, 25, 1–8.
(4) Kritchevsky, D. Cereal fibre and lipidemia. Cereal Foods World1997, 42, 81–85.
(5) Story, J. A.; Watterson, J. J.; Matheson, H. B.; Furumoto, E. J.Dietary fibre and bile acid metabolismsan update. AdV. Exp. Med.Biol. 1997, 427, 259–266.
(6) Beer, M. U.; Arrigoni, E.; Amado, R. Effects of oat gum on bloodcholesterol levels in healthy-young men. Eur. J. Clin. Nut. 1995,49, 517–22.
(7) Yang, J. L.; Kim, Y. H.; Lee, H. S.; Lee, M. S.; Moon, Y. K.Barley �-glucan lowers serum cholesterol based on the up-regulation of cholesterol 7 R-hydroxylase activity and mRNAabundance in cholesterol-fed rats. J. Nut. Sci. Vitamin. 2003, 49,381–387.
(8) Story, J. A.; Kritchevsky, D. Comparison of the binding of variousbile acids and bile salts in vitro by several types of fibre. J. Nutr.1976, 106, 1292–1294.
(9) Eastwood, M. A.; Anderson, R.; Mitchell, W. D.; Robertson, J.;Podock, S. A method to measure the adsorption of bile salts tovegetable fibre of differing water holding capacity. J. Nutr. 1976,106, 1429–1432.
(10) Kahlon, T. S.; Berrios, J. de J.; Smith, G. E.; Pan, J. L. In vitrobile acid binding capacity of wheat bran extruded at five specificmechanical energy levels. Cereal Chem. 2006, 83, 157–160.
(11) Vahouny, G. V.; Tombes, R.; Cassidy, M. M.; Kritchevsky, D.;Gallo, L. L. Dietary fibres: V. Binding of bile salts, phospholipidsand cholesterol from mixed micelles by bile acid sequestrants anddietary fibres. Lipids 1980, 15, 1012–1018.
(12) Story, J. A.; Watterson, J. J.; Matheson, H. B.; Furumoto, E. J.Dietary fibre and bile acid metabolism. AdV. Exp. Med. Biol. 1990,270, 43–48.
(13) Vahouny, G. V.; Khalafi, R.; Satchithanandam, S.; Watkins, D. W.;Story, J. A.; Cassidy, M. M.; Kritchevsky, D. Dietary fibresupplementation and fecal bile acids, neutral steroids and divalentcations in rats. J. Nutr. 1987, 117, 2009–2015.
(14) Coles, G. D.; Eady, S. L.; Coles, T. K.; Boone, D. J. J.; Furneaux,R. H. �-Glucan binds bile salts. In Cereals “96”, Proceedings ofThe 46th Australian Cereal Chemistry Conference; Wringley,C. W., Ed.; RACI Cereal Chemistry Division: Melbourne,Australia, 1996; 180-183.
(15) Boland, A. B.; Buhr, K.; Giannouli, P.; van Ruth, S. M. Influenceof gelatin, starch, pectin and artificial saliva on the release of 11flavour compounds from model gel systems. Food Chem. 2004,86, 401–11.
(16) Malkki, Y.; Heinio, R. L.; Autio, K. Influence of oat gum, guargum and carboxymethyl cellulose on the perception of sweetnessand flavor. Food Hydrocolloids 1993, 6, 525–532.
(17) Pangborn, R. M.; Gibbs, Z. M.; Tassan, C. Effect of hydrocolloidson apparent viscosity and sensory properties of selected beverages.J. Texture Stud. 1978, 9, 415–436.
(18) Juteau, A.; Cayot, N.; Chabanet, C.; Doublier, J. L.; Guichard,E. Flavour release from polysaccharide gels: different approachesfor the determination of kinetic parameters. Trends Food Sci.Technol. 2004, 15, 394–402.
(19) Yven, C.; Guichard, E.; Giboreau, A.; Roberts, D. D. Assessmentof interactions between hydrocolloids and flavour compounds bysensory, headspace, and binding methodologies. J. Agric. FoodChem. 1998, 46, 1510–1514.
(20) Bowles, R. K.; Morgan, K. R.; Furneaux, R. H.; Coles, G. D.C-13 CP/MAS NMR study of the interaction of bile acids withbarley �-D-glucan. Carbohydr. Polym. 1996, 29, 7–10.
(21) Guichard, E.; Etievant, P. Measurement of interactions betweenpolysaccharides and flavour compounds by exclusion size chro-matography: advantages and limits. Nahrung-Food 1998, 42,376–379.
(22) Langourieux, S.; Crouzet, J. Study of aroma compounds polysac-charides interactions by dynamic exponential dilution. Food Sci.Technol.-Lebensm. Wiss. Technol. 1994, 27, 544–549.
(23) Druaux, C.; Voilley, A. Effect of food composition and micro-structure on volatile flavour release. Trends Food Sci. Technol.1997, 8, 364–368.
(24) Mauthner, F. Uber neue synthetische Glucoside. J. Prakt. Chem.(Neue Folge) 1912, 85, 564–568.
(25) Martens, H.; Næs, T. MultiVariate Calibration; Wiley: Chichester,U.K., 1989.
(26) Macromodel, vers. 9.6; Schrodinger: New York, 2008.(27) Steinbeck, C.; Han, Y.; Kuhn, S.; Horlacher, O.; Luttmann, E.;
Willighagen, E. The Chemistry Development Kit (CDK): an open-source Java library for chemo- and bioinformatics. J. Chem. Inf.Comput. Sci. 2003, 43, 493–500.
(28) QikProp, vers. 2.5; Schrodinger: New York, 2005.(29) The Unscrambler, vers. 7.6.; CAMO ASA: Trondheim, Norway.(30) Matlab, vers. 5.3; MathWorks: Natick, MA.(31) Latentix, vers. 1.0; Latent5: Copenhagen, Denmark.(32) Nielsen, M. S.; Jespersen, B. M.; Karlsson, A.; Simonsen, H. T.;
Møller, B. L.; Lærke, H. N.; Larsen, F. H.; Engelsen, S. B.Comparative structural and rheological studies on barley and oat�-glucan products: Glucagel and PromOat. Cereal Chem., 2008,submitted for publication.
Received for review July 7, 2008. Revised manuscript received October14, 2008. Accepted October 25, 2008. We thank the programs BuildYour Food supported by the Danish Council for Strategic Research,Program Commission of Health, Food and Welfare, and the strategicresearch initiative BEST funded by the University of Copenhagen forfinancial support.
JF802057V
2064 J. Agric. Food Chem., Vol. 57, No. 5, 2009 Simonsen et al.