Development of gluten-free flat bread using hydrocolloids: Xanthan and CMC
Upload
independentCategory
view
1download
0
Research articleInstitute of Brewing & Distilling
Received: 26 May 2014 Revised: 15 December 2014 Accepted: 16 December 2014 Published online in Wiley Online Library
(wileyonlinelibrary.com) DOI 10.1002/jib.245
Part II: the influence of the serial repitching ofSaccharomyces pastorianus on the uptakedynamics of amino acids during thefermentation of barley and gluten-freebuckwheat and quinoa wortMatjaž Deželak,1 Mekonnen Melaku Gebremariam,2 Martin Zarnkow,2
Thomas Becker2 and Iztok Jože Košir1*
The present paper is part of a comprehensive study regarding the influence of the serial repitching of Saccharomycespastorianus TUM 34/70 on the composition of the barley, buckwheat and quinoa fermentation medium. In particular, it focuseson the uptake dynamics of amino acids during 11 successive fermentations. Samples were taken every 20h after pitching,analysed for the particular amino acid content and statistically evaluated. The term ‘completion time’ (t95), here defined asthe percentage attenuation time necessary for ~95% of the total assimilation, has been introduced. In addition, ‘the serialrepitching factor’ is used for the first time to support the visual evaluation of the influence of serial repitching. Amino acidsthat were essentially affected by serial repitching were glutamine, arginine, alanine and tryptophan in barley, aspartate,glutamate and tryptophan in buckwheat, and all in the quinoa wort fermentation. As opposed to buckwheat and quinoa, inbarley the amino acids behaved more or less independently from each other, which for buckwheat and quinoa indicates amore general systemic change in the yeast. From the amino acids point of view, buckwheat can be fully regarded as a suitablegluten-free substitute for barley beer since the amino acid assimilation was very consistent and hardly influenced by the serialrepitching, especially regarding the final amino acid assimilation. In the case of quinoa, the assimilation of all amino acidsbecame significantly affected after the sixth fermentation and quinoa is probably unsuitable for the production of beer-likebeverages. Results suggest no substitutional potential of quinoa for barley beer, but if a nutrient-rich beverage of choice fromquinoamalt is intended tobeprepared, it seems that the serial repitching is limited to six fermentationsatmost. Copyright©2015The Institute of Brewing & Distilling
Keywords: successive fermentation; gluten-free beer-like beverages; buckwheat; quinoa; Saccharomyces pastorianus TUM 34/70; aminoacid uptake
* Correspondence to: I. J. Košir, Slovenian Institute of Hop Research andBrewing, Department of Agrochemistry and Brewing, Cesta Žalskega tabora2, SI-3310 Žalec, Slovenia. E-mail: [email protected]
1 Slovenian Institute of Hop Research and Brewing, Department ofAgrochemistry and Brewing, Cesta Žalskega tabora 2, SI-3310 Žalec, Slovenia
2 Technische Universität München, Centre of Life and Food SciencesWeihenstephan, Chair of Brewing and Beverage Technology,Weihenstephaner Steig 20, DE-85354 Freising, Germany
IntroductionThis paper deals with the assimilation profile of amino acids (AAs)during the successive fermentation of barley, buckwheat andquinoa wort by the bottom-fermenting yeast strain Saccharomycespastorianus TUM 34/70. The assimilable nitrogenous compoundsin wort, that is, primarily amino acids and to a lesser extentammonium ion and di- and tripeptides (1), affect brewer’s yeastby increasing its biomass, stimulating its fermentationperformance and determining the pattern of aroma compoundsit produces (2). The importance of specific amino acids in theformation of off-flavours has already been acknowledged (3).Together with other constituents of residual beer extract, freeamino acids positively support fullness and promote the drinkabil-ity of beer (4), but beers with higher α-amino nitrogen show lowerbiological stability (5). The importance of exploring the amino acidmetabolism during brewery fermentation is therefore reasonableand essential for the optimization of process parameters andfermentation performance.
Yeast possesses many cell membrane-spanning AA transportersand most of them have a narrow substrate specificity, often
J. Inst. Brew. 2015 Copyright © 2015 The Institu
only for a single AA (6). The AA uptake is a sequential processalthough the exact order of uptake is usually determined byindividual strain preferences and particular wort properties.More than 40 years ago Jones and Pierce (7) proposed thecategorization of AAs into four groups on the basis of their as-similation patterns but after its introduction this classificationhas been the subject of many refinements (8–12) and individualAAs have often been moved from one group to another tobetter fit the experimental data. Such classifications depend
te of Brewing & Distilling

Table 1. The initial concentrations and AT50, curve slope and R2 values of Asp, Glu, Asn, Ser, Gln and Gly +His for 11 successivefermentations of barley, buckwheat and quinoa wort. The AT50, curve slope and R2 values were obtained using non-linear regression,that is, fitting of the four-parameter symmetrical sigmoidal curve to the experimental data
Wort type F Asp Glu Asn
Initialconcentration
(mg/L)
AT50(%)
Curve slope(×100)
R2
(%)Initial
concentration(mg/L)
AT50(%)
Curve slope(×100)
R2
(%)Initial
concentration(mg/L)
AT50(%)
Curve slope(×100)
R2
(%)
Barley 1 54.90 52.67 �4.69 99.64 56.60 51.52 �3.94 99.72 117.47 31.42 �5.77 99.662 54.90 45.58 �4.92 98.37 56.60 43.63 �3.59 99.64 117.47 26.17 �11.49 99.913 54.90 53.59 �4.54 97.89 56.60 52.36 �3.92 99.41 117.47 27.84 �7.75 99.594 57.54 44.31 �6.86 99.55 60.30 47.06 �4.10 99.66 111.43 27.49 �14.93 99.855 57.54 59.77 �5.24 95.94 60.30 53.27 �5.65 99.78 111.43 34.55 �4.14 99.616 57.54 55.23 �6.33 99.24 60.30 54.31 �4.33 98.83 111.43 33.99 �5.31 99.767 53.65 42.98 �7.27 99.62 52.28 33.76 �2.27 98.50 116.98 29.93 �11.17 99.598 53.65 43.29 �7.70 99.93 52.28 36.63 �3.06 98.93 116.98 28.33 �6.32 99.869 53.65 52.86 �10.23 98.79 52.28 52.71 �6.27 98.44 116.98 31.28 �6.54 99.8410 57.90 59.18 �5.74 97.19 61.60 56.00 �4.85 99.45 128.38 38.57 �4.93 99.7811 57.90 AG AG AG 61.60 47.82 �5.13 98.44 128.38 29.76 �4.96 99.06
Buckwheat 1 68.20 44.37 �9.80 99.58 113.67 47.88 �5.93 99.49 41.23 33.24 �12.53 99.562 68.20 44.24 �12.56 99.83 113.67 47.32 �9.09 99.79 41.23 31.58 �11.58 99.763 68.20 34.00 �13.81 99.10 113.67 35.60 �16.37 99.58 41.23 17.33 �8.68 99.964 68.20 39.95 �21.40 98.52 113.67 40.67 �28.10 99.84 41.23 22.80 �7.40 99.465 68.20 29.74 �18.27 98.80 113.67 28.02 �17.01 98.16 41.23 14.96 �10.45 99.986 68.20 43.36 �12.36 98.90 113.67 42.97 �8.94 97.73 41.23 31.69 �8.10 99.927 59.52 AG AG AG 92.66 47.46 �8.82 98.54 43.42 22.72 �7.00 99.658 59.52 57.14 �11.35 98.64 92.66 57.19 �9.81 96.88 43.42 27.78 �6.86 99.869 59.52 42.83 �5.26 98.69 92.66 41.01 �4.39 97.51 43.42 19.19 �6.63 99.8410 59.52 50.69 �8.02 98.47 92.66 45.90 �2.88 96.85 43.42 16.32 �11.25 99.9911 59.52 55.02 �13.58 96.56 92.66 AG AG AG 43.42 16.37 �7.37 100.0
Quinoa 1 59.16 AG AG AG 56.86 50.32 �3.32 95.97 65.93 41.18 �4.23 97.902 59.16 NC NC NC 56.86 AG AG AG 65.93 31.08 �2.43 98.763 59.16 AG AG AG 56.86 AG AG AG 65.93 12.04 �5.52 99.974 59.16 58.15 �2.68 92.50 56.86 AG AG AG 65.93 17.25 �3.97 99.355 59.16 32.85 �4.50 96.38 56.86 AG AG AG 65.93 AG AG AG6 59.16 80.46 �6.34 89.29 56.86 11.10 �62.38 87.08 65.93 46.54 �3.15 98.157 70.62 NC NC NC 57.41 46.14 �5.76 75.37 56.40 34.22 �3.21 99.398 70.62 58.63 �7.16 90.66 57.41 AG AG AG 56.40 27.42 �2.11 99.549 70.62 AG AG AG 57.41 1487.00 0.20 IR 56.40 30.11 �3.94 99.8410 70.62 AG AG AG 57.41 NC NC NC 56.40 39.40 �3.77 99.3011 70.62 AG AG AG 57.41 NC NC NC 56.40 43.57 �5.55 99.69
F, Number of successive fermentation (F1–F11); AT50, percentage of attenuation time needed to achieve 50% of the total change in theextract or ethanol content; R2, goodness of curve fit; AG, ambiguous fit; NC, fit not converged; IR, interrupted.
M. Deželak et al.Institute of Brewing & Distilling
on the criteria employed, such as the time needed for yeast toassimilate half of the initial AA content, its initial removal rate orthe so-called ‘critical time’ (Tc) (11).
In the past, the amino acid assimilation by brewer’s yeasthas been investigated as a function of various parameters, suchas the yeast strain, fermentation stirring regime, fermentationtemperature, vessel type, pitching rate and others (9–11). Inthese studies, the influence of different wort compositionswas also considered; however, the major raw material wasalways barley malt. To the best of our knowledge, no suchexperiments has been performed using the quinoa or buck-wheat malt. In addition, the amino acid uptake has not beeninvestigated as a function of serial repitching. In the past
Copyright © 2015 The Instituwileyonlinelibrary.com/journal/jib
decade, the suitability of these two pseudocereals for brewingpurposes has been the subject of detailed investigations(13–16). The changes in the yeast karyotype and protein profileowing to the successive fermentations of buckwheat and quinoaworts have recently been reported (17) where the exploration ofserial repitching was particularly justified. As opposed to buck-wheat, the quinoa wort contains much higher amounts of allAAs than barley wort but only a few of them are assimilatedsubstantially (14). Since the serial repitching is a well-knownand practically inherent procedure in commercial, industrialbeer production, its adequacy when using new raw materialsshould be understood even before performing large-scaleexperiments. In that way, substantial time- and expense-
J. Inst. Brew. 2015te of Brewing & Distilling

Table 1. (Continued)
Wort type Ser Gln Gly +His
Initialconcentration
(mg/L)
AT50(%)
Curve slope(×100)
R2 (%) Initialconcentration
(mg/L)
AT50(%)
Curve slope(×100)
R2
(%)Initial
concentration(mg/L)
AT50(%)
Curve slope(×100)
R2
(%)
Barley 49.51 32.26 �6.54 99.89 33.67 32.84 �4.38 99.97 56.35 50.58 �1.86 99.4249.51 25.96 �12.48 99.95 33.67 24.57 �7.05 98.89 56.35 31.51 �2.79 99.4249.51 30.72 �11.87 99.94 33.67 36.06 �4.80 98.65 56.35 38.13 �1.62 93.5944.40 27.68 �13.44 99.43 29.57 29.42 �13.04 99.56 50.43 45.01 �7.76 98.7944.40 37.10 �6.48 99.83 29.57 59.19 �4.03 96.14 50.43 54.94 �2.87 92.3344.40 33.04 �5.60 99.98 29.57 48.01 �2.83 96.61 50.43 61.71 �3.87 99.2250.67 29.31 �9.40 99.37 28.43 AG AG AG 57.32 44.99 �3.94 98.4550.67 26.65 �5.76 99.73 28.43 AG AG AG 57.32 49.66 �3.33 99.5150.67 30.62 �6.26 99.92 28.43 36.68 �3.31 91.80 57.32 56.44 �5.96 98.5857.84 39.00 �5.22 99.39 47.40 48.76 �3.79 97.82 65.67 63.02 �5.45 94.2857.84 29.80 �5.65 99.77 47.40 25.47 �2.07 99.22 65.67 51.51 �3.99 97.15
Buckwheat 51.06 33.88 �12.12 99.19 14.75 33.18 �5.54 99.27 55.79 46.48 �7.34 99.7951.06 31.55 �8.60 98.95 15.75 29.30 �6.80 95.05 55.79 45.62 �8.62 99.6951.06 22.60 �10.58 99.13 15.75 36.09 �4.40 97.46 55.79 34.45 �6.74 99.3751.06 25.33 �9.19 99.59 15.75 28.71 �11.22 98.84 55.79 40.57 �16.74 98.1151.06 15.37 �9.80 100.0 15.75 25.21 �7.22 96.89 55.79 34.46 �6.62 98.3751.06 32.25 �8.05 99.94 15.75 28.62 �6.86 98.95 55.79 38.71 �5.28 99.8153.61 23.58 �7.03 99.67 14.77 29.07 �7.59 99.35 57.83 47.48 �7.76 98.6553.61 27.72 �10.71 99.55 14.77 31.11 �4.34 99.64 57.83 43.08 �4.79 99.8553.61 20.46 �6.52 99.75 14.77 28.80 �9.58 99.06 57.83 38.91 �3.19 99.4453.61 17.94 �8.65 100.0 14.77 22.78 �5.98 99.22 57.83 38.54 �4.21 99.0853.61 20.66 �6.52 100.0 14.77 29.47 �6.83 99.57 57.83 43.95 �4.45 98.98
Quinoa 77.83 44.98 �5.49 99.29 23.13 AG AG AG 84.71 AG AG AG77.83 34.85 �1.87 99.18 23.13 87.33 �5.64 30.04 84.71 AG AG AG77.83 19.67 �4.60 99.58 23.13 NC NC NC 84.71 AG AG AG77.83 24.77 �4.65 99.77 23.13 NC NC NC 84.71 22.32 �2.31 93.0077.83 26.71 �4.91 99.68 23.13 NC NC NC 84.71 AG AG AG77.83 48.19 �8.17 98.01 23.13 101.70 6.78 39.85 84.71 AG AG AG85.39 34.41 �3.47 98.67 24.79 NC NC NC 90.48 13.83 �4.26 70.7885.39 31.82 �2.76 98.57 24.79 AG AG AG 90.48 AG AG AG85.39 29.57 �3.35 99.71 24.79 62.75 10.26 75.76 90.48 NC NC NC85.39 44.52 �3.31 96.71 24.79 AG AG AG 90.48 8.95 �6.60 63.6085.39 48.26 �3.26 98.53 24.79 AG AG AG 90.48 NC NC NC
Serial repitching of S. pastorianus: part IIInstitute of Brewing & Distilling
consuming complications can be avoided from the verybeginning.
In that manner, the influence of 11 serial repitchings ofS. pastorianus TUM 34/70 was explored using the wort frommalted buckwheat and quinoa in a direct comparison with wortderived from malted barley.
Materials and methods
Sample preparation
The same buckwheat and quinoa malt was used as reportedin this journal in our 2014 study, with the same malting,
J. Inst. Brew. 2015 Copyright © 2015 The Institu
mashing and hopping procedures followed as describedtherein (13). Successive fermentation design was identical tothat described in our 2014 karyotype and protein profilestudy (14). Briefly, before each fermentation, yeast viabilitywas ascertained by methylene blue staining and a cell count(microscope). The pitching volume was adjusted accordinglyto achieve a final yeast concentration of 2 × 10⁶ viable cellsper millilitre of wort, with a wort real extract of approxi-mately 10%.The wort samples, previously stored at 0°C, were frozen a
day after production. Samples from the fermentation me-dium were taken every 24 h (± 30min) and immediatelyafter the sampling, 1mL of 2 g/L sodium azide was added
te of Brewing & Distilling wileyonlinelibrary.com/journal/jib

Table 2. The initial concentrations andAT50, curve slope and R2 values of Thr, Arg, Ala, Tyr, Val andMet for 11 successive fermentations
of barley, buckwheat and quinoa wort. The AT50, curve slope and R2 values were obtained using non-linear regression, that is, fitting ofthe four-parameter symmetrical sigmoidal curve to the experimental data
Wort type F Thr Arg Ala
Initialconcentration
(mg/L)
AT50(%)
Curve slope(×100)
R2
(%)Initial
concentration(mg/L)
AT50(%)
Curve slope(×100)
R2
(%)Initial
concentration(mg/L)
AT50(%)
Curve slope(×100)
R2
(%)
Barley 1 39.55 37.21 �5.89 99.81 95.39 45.93 �4.65 99.67 135.04 60.04 �8.02 99.802 39.55 AG AG AG 95.39 34.83 �5.20 99.91 135.04 53.98 �3.99 99.893 39.55 AG AG AG 95.39 46.16 �4.70 98.57 135.04 58.35 �10.35 99.944 36.41 27.66 �11.13 99.33 87.45 54.75 �13.29 99.69 158.70 57.25 �9.34 98.215 36.41 36.34 �5.91 99.89 87.45 AG AG AG 158.70 60.39 �16.83 99.276 36.41 33.45 �4.47 99.77 87.45 59.70 �8.45 99.09 158.70 59.10 �6.46 98.877 40.19 30.67 �9.80 99.27 94.60 61.06 �13.21 98.79 165.26 23.61 �8.94 96.368 40.19 28.07 �5.30 99.67 94.60 56.19 �5.73 99.52 165.26 AG AG AG9 40.19 32.15 �5.55 99.95 94.60 59.76 �18.45 99.66 165.26 AG AG AG10 46.42 44.37 �4.34 99.16 108.51 58.49 �10.37 99.57 145.53 AG AG AG11 46.42 27.57 �3.88 99.20 108.51 57.28 �9.45 99.76 145.53 AG AG AG
Buckwheat 1 43.91 34.97 �12.51 99.66 116.78 44.58 �19.96 99.20 85.38 47.06 �8.91 99.332 43.91 34.97 �13.20 98.72 116.78 43.39 �20.36 99.43 85.38 44.75 �15.97 99.713 43.91 31.78 �10.71 99.61 116.78 39.45 �11.25 99.56 85.38 38.71 �10.09 99.764 43.91 27.57 �8.94 99.71 116.78 40.49 �17.54 98.78 85.38 39.61 �14.35 99.445 43.91 21.85 �6.35 99.18 116.78 39.55 �17.52 98.96 85.38 34.71 �7.28 99.526 43.91 34.67 �8.09 99.91 116.78 45.35 �10.64 98.72 85.38 46.86 �6.31 99.087 49.76 24.01 �6.80 99.29 103.05 46.97 �13.46 99.69 79.71 49.91 �5.74 99.368 49.76 28.36 �13.22 99.80 103.05 46.69 �10.55 99.08 79.71 46.57 �4.80 99.499 49.76 21.95 �6.25 99.83 103.05 45.68 �5.66 98.78 79.71 46.67 �3.24 99.3910 49.76 20.04 �5.57 99.87 103.05 48.08 �8.41 98.32 79.71 50.27 �5.57 98.6911 49.76 22.01 �5.00 99.94 103.05 42.32 �5.70 99.07 79.71 AG AG AG
Quinoa 1 69.99 44.35 �6.77 99.26 155.10 AG AG AG 74.26 42.95 �3.37 93.992 69.99 39.97 �3.19 99.40 155.10 NC NC NC 74.26 �402.90 �0.80 IR3 69.99 23.42 �3.40 98.90 155.10 NC NC NC 74.26 �19.98 �2.53 99.824 69.99 25.97 �9.16 99.32 155.10 AG AG AG 74.26 9.35 �2.89 96.955 69.99 27.18 �9.69 99.58 155.10 AG AG AG 74.26 10.74 �3.57 98.496 69.99 45.91 �5.80 99.58 155.10 NC NC NC 74.26 43.40 �2.20 96.347 80.29 33.72 �3.91 98.50 165.59 NC NC NC 80.66 32.91 �5.17 93.508 80.29 28.60 �2.79 99.57 165.59 NC NC NC 80.66 AG AG AG9 80.29 31.06 �3.11 99.70 165.59 NC NC NC 80.66 34.78 �4.42 98.8710 80.29 45.73 �4.17 98.72 165.59 AG AG AG 80.66 45.35 �3.93 94.4011 80.29 40.37 �3.85 99.31 165.59 NC NC NC 80.66 65.53 �4.19 97.65
F, Number of successive fermentation (F1–F11); AT50, percentage of attenuation time needed to achieve 50% of the total change in theextract or ethanol content; R2, goodness of curve fit; AG, ambiguous fit; NC, fit not converged; IR, interrupted.
M. Deželak et al.Institute of Brewing & Distilling
per 100mL of sample to stop the fermentation. Sodiumazide slows the growth of Saccharomyces cerevisiae andinduces a lag, which increases steeply with the concentration(18). After 3 h, samples were centrifuged using a laboratorycentrifuge Sigma 6K15 (Sigma, Germany) for 10min at4000g to remove the yeast. Supernatants were collectedand frozen until the analysis. On the day of analysis, thesamples were defrosted at room temperature, degassed inan ultrasonic water bath and filtered through a plain discfilter paper (diameter of 150mm) and cellulose acetatemembrane syringe filter unit (diameter of 25mm, pore sizeof 0.45 μm; LLG Labware, Germany). Reagents and solutions
Copyright © 2015 The Instituwileyonlinelibrary.com/journal/jib
were of appropriate quality and purity, and supplied bySigma-Aldrich (Germany).
Analysis of amino acids
Proteinogenic amino acidswere analysed using anHPLCapparatus(Agilent 1200 Series) equipped with a thermostatted autosampler,a reverse-phase column (Agilent Eclipse PAH, 4.6× 100mm,1.8μm) and a fluorescence detector. The analytical procedurewas based on the method optimized by the HPLC instrumentmanufacturer (19). The excitation and emission wavelengthsfor OPA derivatives were set to 340 and 450nm, respectively,
J. Inst. Brew. 2015te of Brewing & Distilling
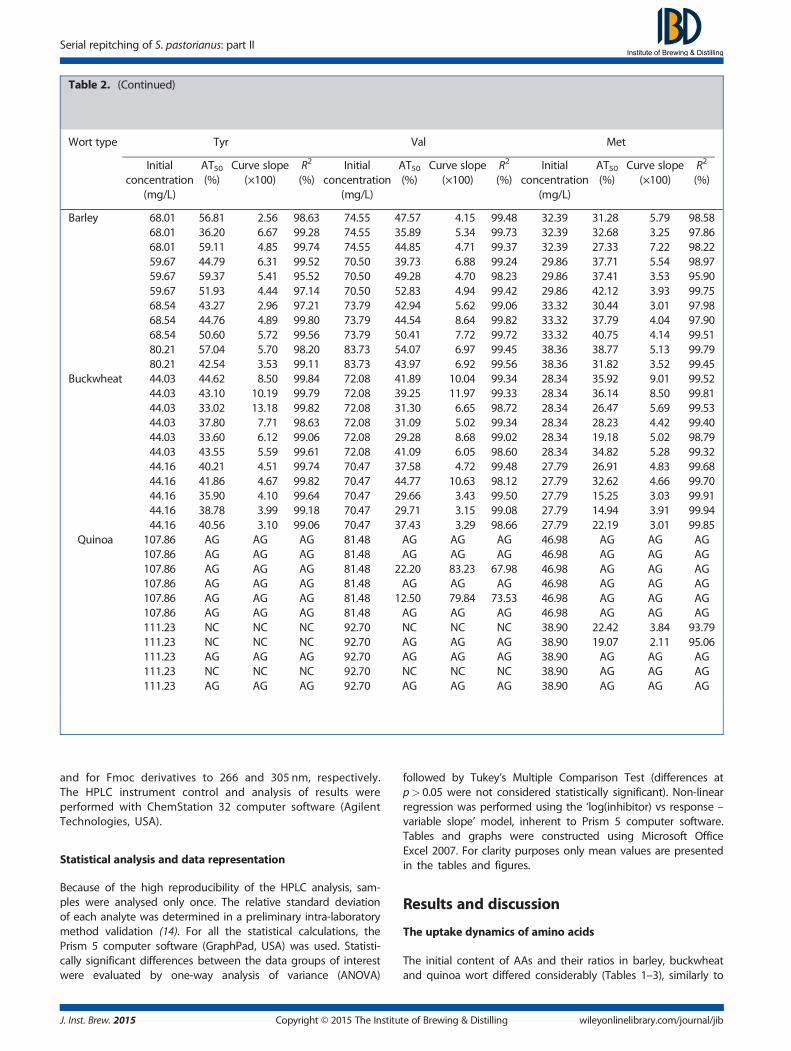
Table 2. (Continued)
Wort type Tyr Val Met
Initialconcentration
(mg/L)
AT50(%)
Curve slope(×100)
R2
(%)Initial
concentration(mg/L)
AT50(%)
Curve slope(×100)
R2
(%)Initial
concentration(mg/L)
AT50(%)
Curve slope(×100)
R2
(%)
Barley 68.01 56.81 �2.56 98.63 74.55 47.57 �4.15 99.48 32.39 31.28 �5.79 98.5868.01 36.20 �6.67 99.28 74.55 35.89 �5.34 99.73 32.39 32.68 �3.25 97.8668.01 59.11 �4.85 99.74 74.55 44.85 �4.71 99.37 32.39 27.33 �7.22 98.2259.67 44.79 �6.31 99.52 70.50 39.73 �6.88 99.24 29.86 37.71 �5.54 98.9759.67 59.37 �5.41 95.52 70.50 49.28 �4.70 98.23 29.86 37.41 �3.53 95.9059.67 51.93 �4.44 97.14 70.50 52.83 �4.94 99.42 29.86 42.12 �3.93 99.7568.54 43.27 �2.96 97.21 73.79 42.94 �5.62 99.06 33.32 30.44 �3.01 97.9868.54 44.76 �4.89 99.80 73.79 44.54 �8.64 99.82 33.32 37.79 �4.04 97.9068.54 50.60 �5.72 99.56 73.79 50.41 �7.72 99.72 33.32 40.75 �4.14 99.5180.21 57.04 �5.70 98.20 83.73 54.07 �6.97 99.45 38.36 38.77 �5.13 99.7980.21 42.54 �3.53 99.11 83.73 43.97 �6.92 99.56 38.36 31.82 �3.52 99.45
Buckwheat 44.03 44.62 �8.50 99.84 72.08 41.89 �10.04 99.34 28.34 35.92 �9.01 99.5244.03 43.10 �10.19 99.79 72.08 39.25 �11.97 99.33 28.34 36.14 �8.50 99.8144.03 33.02 �13.18 99.82 72.08 31.30 �6.65 98.72 28.34 26.47 �5.69 99.5344.03 37.80 �7.71 98.63 72.08 31.09 �5.02 99.34 28.34 28.23 �4.42 99.4044.03 33.60 �6.12 99.06 72.08 29.28 �8.68 99.02 28.34 19.18 �5.02 98.7944.03 43.55 �5.59 99.61 72.08 41.09 �6.05 98.60 28.34 34.82 �5.28 99.3244.16 40.21 �4.51 99.74 70.47 37.58 �4.72 99.48 27.79 26.91 �4.83 99.6844.16 41.86 �4.67 99.82 70.47 44.77 �10.63 98.12 27.79 32.62 �4.66 99.7044.16 35.90 �4.10 99.64 70.47 29.66 �3.43 99.50 27.79 15.25 �3.03 99.9144.16 38.78 �3.99 99.18 70.47 29.71 �3.15 99.08 27.79 14.94 �3.91 99.9444.16 40.56 �3.10 99.06 70.47 37.43 �3.29 98.66 27.79 22.19 �3.01 99.85
Quinoa 107.86 AG AG AG 81.48 AG AG AG 46.98 AG AG AG107.86 AG AG AG 81.48 AG AG AG 46.98 AG AG AG107.86 AG AG AG 81.48 22.20 �83.23 67.98 46.98 AG AG AG107.86 AG AG AG 81.48 AG AG AG 46.98 AG AG AG107.86 AG AG AG 81.48 12.50 �79.84 73.53 46.98 AG AG AG107.86 AG AG AG 81.48 AG AG AG 46.98 AG AG AG111.23 NC NC NC 92.70 NC NC NC 38.90 22.42 �3.84 93.79111.23 NC NC NC 92.70 AG AG AG 38.90 19.07 �2.11 95.06111.23 AG AG AG 92.70 AG AG AG 38.90 AG AG AG111.23 NC NC NC 92.70 NC NC NC 38.90 AG AG AG111.23 AG AG AG 92.70 AG AG AG 38.90 AG AG AG
Serial repitching of S. pastorianus: part IIInstitute of Brewing & Distilling
and for Fmoc derivatives to 266 and 305 nm, respectively.The HPLC instrument control and analysis of results wereperformed with ChemStation 32 computer software (AgilentTechnologies, USA).
Statistical analysis and data representation
Because of the high reproducibility of the HPLC analysis, sam-ples were analysed only once. The relative standard deviationof each analyte was determined in a preliminary intra-laboratorymethod validation (14). For all the statistical calculations, thePrism 5 computer software (GraphPad, USA) was used. Statisti-cally significant differences between the data groups of interestwere evaluated by one-way analysis of variance (ANOVA)
J. Inst. Brew. 2015 Copyright © 2015 The Institu
followed by Tukey’s Multiple Comparison Test (differences atp> 0.05 were not considered statistically significant). Non-linearregression was performed using the ‘log(inhibitor) vs response –variable slope’ model, inherent to Prism 5 computer software.Tables and graphs were constructed using Microsoft OfficeExcel 2007. For clarity purposes only mean values are presentedin the tables and figures.
Results and discussion
The uptake dynamics of amino acids
The initial content of AAs and their ratios in barley, buckwheatand quinoa wort differed considerably (Tables 1–3), similarly to
te of Brewing & Distilling wileyonlinelibrary.com/journal/jib

Table 3. The initial concentrations and AT50, curve slope and R2 values of Trp, Phe, Ile, Leu, Lys and sum of all AAs for 11 successivefermentations of barley, buckwheat and quinoa wort. The AT50, curve slope and R2 values were obtained using non-linear regression,that is, fitting of the four-parameter symmetrical sigmoidal curve to the experimental data
Wort type F Trp Phe Ile
Initialconcentration
(mg/L)
AT50(%)
Curve slope(×100)
R2
(%)Initial
concentration(mg/L)
AT50(%)
Curve slope(×100)
R2
(%)Initial
concentration(mg/L)
AT50(%)
Curve slope(×100)
R2
(%)
Barley 1 87.05 75.15 �14.42 99.43 83.83 42.46 �4.14 99.42 47.32 38.03 �4.72 99.942 87.05 103.80 �1.70 94.91 83.83 32.98 �7.29 99.83 47.32 30.71 �6.91 99.803 87.05 85.06 �11.06 97.90 83.83 40.84 �5.08 99.53 47.32 36.08 �8.04 99.624 80.19 70.72 �11.87 99.39 74.79 37.61 �6.67 99.84 43.45 34.66 �7.73 99.795 80.19 AG AG AG 74.79 47.85 �5.34 99.65 43.45 46.38 �6.14 99.326 80.19 71.42 �4.00 95.40 74.79 47.62 �4.35 98.75 43.45 44.00 �6.11 99.837 84.29 AG AG AG 87.42 36.94 �5.24 99.84 47.99 35.81 �7.36 99.778 84.29 70.75 �6.72 99.44 87.42 38.65 �5.63 99.14 47.99 37.63 �7.12 99.159 84.29 64.67 �7.52 98.74 87.42 42.63 �3.90 99.52 47.99 41.35 �5.08 99.8810 101.05 AG AG AG 93.66 44.21 �3.72 99.54 54.90 45.63 �5.37 99.2611 101.05 AG AG AG 93.66 39.84 �5.86 99.20 54.90 36.72 �5.80 99.03
Buckwheat 1 79.72 51.34 �15.88 99.74 47.22 38.55 �10.59 99.71 36.96 37.91 �12.36 99.842 79.72 47.64 �19.76 99.86 47.22 37.43 �10.59 99.85 36.96 36.71 �14.13 99.983 79.72 45.87 �19.67 99.90 47.22 35.12 �6.28 99.20 36.96 33.22 �6.97 99.494 79.72 42.96 �17.10 99.50 47.22 28.31 �5.38 99.58 36.96 29.13 �6.80 99.505 79.72 AG AG AG 47.22 24.61 �5.85 99.81 36.96 26.42 �6.08 99.816 79.72 52.98 �14.85 99.79 47.22 38.76 �5.46 99.92 36.96 38.18 �7.01 99.737 75.38 53.09 �8.62 99.62 47.22 35.16 �5.96 99.74 38.17 AG AG AG8 75.38 54.51 �5.99 99.06 47.22 31.70 �3.63 99.83 38.17 32.93 �4.38 99.559 75.38 57.97 �4.00 97.28 47.22 25.08 �3.30 99.90 38.17 27.18 �4.97 99.7710 75.38 AG AG AG 47.22 24.18 �3.42 99.96 38.17 25.16 �5.07 99.9211 75.38 AG AG AG 47.22 33.44 �3.42 98.84 38.17 34.62 �3.87 99.28
Quinoa 1 53.93 42.73 �4.44 91.89 103.49 AG AG 90.00 70.59 48.88 �7.31 99.712 53.93 33.05 �4.35 91.84 103.49 AG AG 88.19 70.59 27.30 �1.52 99.433 53.93 18.53 �2.12 96.27 103.49 AG AG 99.18 70.59 14.35 �4.48 99.664 53.93 AG AG AG 103.49 AG AG 83.56 70.59 31.12 �4.18 99.285 53.93 3.87 �3.96 99.19 103.49 AG AG 98.87 70.59 28.09 �4.33 99.726 53.93 53.50 �13.75 96.33 103.49 AG AG 95.14 70.59 54.74 �3.76 97.807 63.47 22.70 �6.34 74.98 114.95 AG AG 89.35 78.96 52.63 �2.52 97.978 63.47 AG AG AG 114.95 AG AG 83.82 78.96 38.02 �5.25 97.819 63.47 AG AG AG 114.95 AG AG 94.40 78.96 18.90 �0.80 97.5510 63.47 80.19 �4.54 79.93 114.95 AG AG 85.42 78.96 AG AG AG11 63.47 60.96 �9.15 96.12 114.95 AG AG 60.83 78.96 AG AG AG
F, Number of successive fermentation (F1–F11); AT50, percentage of attenuation time needed to achieve 50% of the total change in theextract or ethanol content; R2, goodness of curve fit; AAs, amino acids; AG, ambiguous fit; NC, fit not converged.
M. Deželak et al.Institute of Brewing & Distilling
the report in our previous study (14). The data regarding prolineare not shown since this AA was excluded from the discussioncompletely because (a) the proline oxidation by a mitochondrialoxidase is repressed during brewery fermentation (20) andconsequently this amino acid is not utilized significantly duringbrewery fermentation, and (b) the intra-laboratory method vali-dation revealed a high relative standard deviation of proline(14), which rendered reliable data interpretation impossible.Cysteine was excluded from the chromatographic analysis sinceit is known to form only a weakly fluorescent derivative withOPA reagent. The Gly and His derivative coeluted, thus thesum of their concentration is given. Nevertheless, the influenceof Gly on the properties of the His and Gly sum can be
Copyright © 2015 The Instituwileyonlinelibrary.com/journal/jib
practically neglected since it is present in very low amounts,and in addition, its overall assimilation is scarce (14).
In this study, the main focus was given to the uptakedynamics as a function of successive fermentation and rawmaterial type, that is, barley (Figs 1–3), buckwheat (Figs 4–6)and quinoa (Figs 7–9). Because the attenuation time, that is,the last day when a daily change in the extract contentwas ≥0.1%, was raw material- and successive fermentation-dependent (Table 1 in Part I) (21), the time axis was relati-vized throughout the entire paper. Similarly, the dependentattribute was expressed as a percentage of its content inwort because wort from two (buckwheat and quinoa) or four(barley) different brews was used and because uptake profiles
J. Inst. Brew. 2015te of Brewing & Distilling

Table 3. (Continued)
Wort type Leu Lys sum AAs
Initialconcentration
(mg/L)
AT50(%)
Curve slope(×100)
R2
(%)Initial
concentration(mg/L)
AT50(%)
Curve slope(×100)
R2
(%)Initial
concentration(mg/L)
AT50(%)
Curve slope(×100)
R2
(%)
Barley 81.39 34.53 �5.62 99.92 78.41 34.43 �6.56 99.86 1191.43 43.18 �3.12 99.9481.39 27.57 �7.66 100.0 78.41 24.54 �9.94 99.32 1191.43 31.54 �5.15 99.5181.39 31.73 �7.52 99.76 78.41 25.19 �5.58 98.87 1191.43 38.39 �3.70 99.5376.00 30.93 �8.45 99.82 69.59 30.36 �7.24 99.52 1140.28 38.66 �3.91 99.4476.00 40.58 �5.06 99.87 69.59 28.88 �6.18 99.50 1140.28 46.63 �3.95 99.2776.00 36.09 �5.29 99.85 69.59 32.08 �7.78 99.53 1140.28 44.93 �3.61 99.7881.48 33.37 �8.67 99.79 81.63 26.43 �7.65 99.64 1217.84 33.33 �3.74 99.1781.48 34.26 �6.87 99.38 81.63 24.70 �4.33 99.48 1217.84 35.86 �3.02 99.4981.48 37.35 �6.04 99.96 81.63 28.92 �4.18 99.28 1217.84 40.90 �3.29 99.4991.08 40.10 �4.72 99.78 88.40 28.07 �3.47 98.73 1350.64 43.90 �3.01 98.8691.08 35.40 �7.12 99.27 88.40 26.67 �4.52 99.61 1350.64 35.70 �3.03 99.19
Buckwheat 64.59 34.69 �12.68 99.20 44.97 32.27 �8.29 99.23 1008.68 41.41 �6.90 99.8064.59 33.63 �12.87 99.56 44.97 32.74 �17.02 99.94 1009.68 40.74 �8.28 99.8364.59 25.75 �11.05 99.73 44.97 25.05 �5.99 99.79 1009.68 33.72 �6.56 99.6664.59 AG AG AG 44.97 21.72 �6.74 99.74 1009.68 35.28 �5.90 98.6364.59 19.96 �5.88 99.86 44.97 17.54 �5.95 99.51 1009.68 28.11 �5.46 99.3664.59 37.11 �7.47 99.51 44.97 31.83 �7.60 99.80 1009.68 41.01 �5.86 99.6464.63 30.32 �5.19 99.71 46.11 18.75 �5.02 99.77 968.26 38.69 �4.19 99.4264.63 30.53 �6.24 99.27 46.11 17.14 �3.15 99.44 968.26 39.30 �3.59 99.5364.63 23.76 �6.40 99.98 46.11 16.20 �4.40 99.77 968.26 28.94 �2.80 99.8864.63 18.52 �5.40 99.96 46.11 10.81 �4.54 99.38 968.26 24.56 �2.23 99.3764.63 26.95 �3.85 99.81 46.11 16.60 �5.78 99.91 968.26 33.46 �2.64 98.92
Quinoa 114.72 49.31 �5.25 99.32 105.79 36.49 �2.66 97.83 1351.81 38.60 �2.88 96.85114.72 38.96 �1.75 98.20 105.79 AG AG AG 1351.81 AG AG AG114.72 22.20 �88.57 88.45 105.79 4.75 �2.51 99.13 1351.81 �14.54 �2.39 99.67114.72 25.75 �3.50 97.77 105.79 24.77 �3.59 98.26 1351.81 11.52 �2.70 97.95114.72 26.41 �3.84 99.12 105.79 30.56 �8.17 99.91 1351.81 16.24 �3.58 98.85114.72 56.68 �4.75 98.74 105.79 55.19 �4.71 97.82 1351.81 41.44 �2.04 96.50129.11 39.88 �4.24 99.20 121.98 34.14 �2.21 99.20 1462.93 26.76 �3.58 96.21129.11 44.98 �10.76 97.39 121.98 25.90 �2.12 96.17 1462.93 17.81 �1.98 99.25129.11 39.55 �6.16 95.85 121.98 18.67 �1.47 96.88 1462.93 20.05 �2.11 97.84129.11 56.89 �2.18 94.18 121.98 46.56 �2.53 97.85 1462.93 36.61 �2.06 98.91129.11 50.43 �4.06 99.52 121.98 44.07 �2.23 98.95 1462.93 45.24 �2.22 99.84
Serial repitching of S. pastorianus: part IIInstitute of Brewing & Distilling
based on relative values enabled us to compare different AAsfrom different sources with each other. In order to quantita-tively discuss the results, the term ‘completion time’ (t95), heredefined as the percentage attenuation time necessary for~95% of the total assimilation, has been introduced. Whereappropriate, a designation Δmax–min is used to express thedifference between the maximal and minimal value. In addition,the non-linear regression was performed fitting the four-parameter symmetrical sigmoidal curve to the experimental dataof particular AA. Three statistics, namely AT50 (the percentage ofattenuation time needed to assimilate a half of total consumedamino acid), curve slope (describes the steepness of the curve;higher absolute values belong to steeper curves) and R2
(percentage of the goodness of fit) were considered for further
J. Inst. Brew. 2015 Copyright © 2015 The Institu
discussion (Tables 1–3), but only if the R2 was 98% or higher.RSD values of these three statistics for 11 successive fermenta-tions of each raw material were calculated. Their product,termed ‘the serial repitching factor’ (SRf), was used to supportthe visual evaluation of the serial repitching and its influenceon the AA assimilation profile ( greater influence of the serialrepitching gave higher SRf values). However, in many cases,especially in quinoa, the uptake profile differed from thesigmoidal curve. Thus, the so-called ‘bad regressions’ weredesignated as ‘ambiguous fit’ (AG), ‘not converged (NC)’ or‘interrupted fit’ (IR). Although these ‘bad regressions’ cannotbe quantitatively included into the SRf calculation, theywere still considered during the data interpretation in a moreholistic way.
te of Brewing & Distilling wileyonlinelibrary.com/journal/jib

Figure 1. The assimilation profile of Asp, Glu, Asn, Ser, Gln and Gly + His for 11 successive fermentations of barley wort. For comparative purposes both scatter plot axeswere relativized to the concentration in wort and presented as their percentage values. Numbers in scatter plot legend represent numbers of particular successivefermentations.
M. Deželak et al.Institute of Brewing & Distilling
Sum AAs
In the case of barley, the overall assimilation capacity of yeastwas influenced by the serial repitching and it declined slowlyuntil F6 but later on it improved again (Fig. 3). The initial rateof total AA assimilation gradually increased over successivefermentations. On the other hand, the serial repitchinghad no influence on the total assimilation of AAs duringthe successive fermentation of buckwheat wort (Fig. 6). Overallassimilation was very fast (t95 = 50–70%) and efficacious. Theinitial rate of total AA assimilation increased over successive
Copyright © 2015 The Instituwileyonlinelibrary.com/journal/jib
fermentations even more prominently than in barley andthe overall AA assimilation became more linear (Table 3).In the case of quinoa, the total AA assimilation was consi-derably weakened. Moreover, the absolute assimilated valueswere also lower than in barley and buckwheat, despite thehigher initial concentration of AAs in wort (Table 3). Whatwas also seen in the case of quinoa was the influence ofthe serial repitching where the AA assimilation was fasterand more efficacious from F1 to F6. Later on the overall AAassimilation slowed and the total degree was practically halvedin F11.
J. Inst. Brew. 2015te of Brewing & Distilling

Figure 2. The assimilation profile of Thr, Arg, Ala, Tyr, Val and Met for 11 successive fermentations of barley wort. For comparative purposes both scatter plot axes wererelativized to the concentration in wort and presented as their percentage values. Numbers in scatter plot legend represent numbers of particular successivefermentations.
Serial repitching of S. pastorianus: part IIInstitute of Brewing & Distilling
Barley wort fermentation
In the case of barley (Figs 1–3) final assimilation, the least in-fluence of the serial repitching was observed for Asn, Ser,Thr, Ile, Leu and Lys (Δmax–min< 10% of the sum initial AAs).Seven AAs, that is, Asp, Glu, Gln, Tyr, Val, Met and Phe weremoderately influenced (Δmax–min = 10–30% of the sum initialAAs) whereas Gly +His, Arg, Ala and Trp were influencedheavily (Δmax–min> 30% of the sum initial AAs). Regarding theassimilation profile, it was the least influenced by the serialrepitching in the case of Asn, Ser, Val, Phe, Ile, Leu and Lys
J. Inst. Brew. 2015 Copyright © 2015 The Institu
(SRf<~200, no bad regressions) and the most in the case ofGln, Gly+His, Arg, Ala and Trp (SRf>~400, mostly with badregressions). Some AAs showed unique behaviour not foundin others. Gln is the only AA whose concentration in fermenta-tion medium temporarily increased after a previous decrease.Arg the was preferred AA from F1 to F3 but later on its totalassimilation declined together with the occurrence of the initiallag phase. In contrast, in the case of Ala such an initial lag phasewas observed from F1 to F6 together with a gradual decrease ofits final assimilation. With F7 the final assimilation improved subs-tantially and the initial lag phase vanished completely. The final
te of Brewing & Distilling wileyonlinelibrary.com/journal/jib

Figure 3. The assimilation profile of Trp, Phe, Ile, Leu, Lys and the total amino acids for 11 successive fermentations of barley wort. For comparative purposes both scatter plotaxes were relativized to the concentration in wort and presented as their percentage values. Numbers in scatter plot legend represent numbers of particular successivefermentations.
M. Deželak et al.Institute of Brewing & Distilling
assimilation of Trpwasmarkedby the highestΔmax–min value (~80%)but instead of a directed trend of its change, an oscillating patternwas observed for every three to four successive fermentations.In addition, Trp had the longest initial lag phase (AT = 50–80%),which in contrast to Arg and Ala was not influenced by serialrepitching.
Buckwheat wort fermentation
In the case of buckwheat (Figs 4–6), for the final assimilation therewas little influence from the serial repitching in the case of Gln,
Copyright © 2015 The Instituwileyonlinelibrary.com/journal/jib
Gly+His, Tyr, Val, Met and Lys (Δmax–min=10–20%) practicallyno influence of the serial repitching on the final assimilationwas observed for all of the other AAs. On average, Asp, Glu,Arg, Ala, Tyr and Trp were assimilated to a higher degree andonly Val to a lower degree, compared with barley. Regardingthe assimilation profile, it was the least influenced by the serialrepitching in the case of Asn, Ser, Arg, Ala and Tyr (SRf<~200,no bad regressions) and the most in the case of Asp, Glu, Trpand Lys (SRf>~400, mostly with bad regressions). As in barley,Ala, Arg and Trp were marked by an initial lag phase. Nounique properties of fermentation profiles were observed and
J. Inst. Brew. 2015te of Brewing & Distilling

Figure 4. The assimilation profile of Asp, Glu, Asn, Ser, Gln and Gly + His for 11 successive fermentations of buckwheat wort. For comparative purposes both scatter plotaxes were relativized to the concentration in wort and presented as their percentage values. Numbers in scatter plot legend represent numbers of particular successivefermentations.
Serial repitching of S. pastorianus: part IIInstitute of Brewing & Distilling
the overall assimilation dynamics were very close to the typicalone observed for barley.
Quinoa wort fermentation
The AA assimilation in the case of quinoa (Figs 7–9) was dras-tically different and the discussion using non-linear regressionstatistics was irrelevant. However, Asn, Ser, Thr, Met, Ile, Leuand Lys showed the closest resemblance to a typical AAassimilation profile familiar for barley (Tables 2–4) and theseAAs were also the most preferred by yeast. The concentration
J. Inst. Brew. 2015 Copyright © 2015 The Institu
of the other AAs showed a more or less fluctuating profileduring fermentation with no obvious pattern, which indicatesthe impairment of their uptake/release control. The final assi-milation of particular AAs was immensely influenced by the serialrepitching (Δmax–min> 25%) with the exception of Arg whose finalassimilation was scarce. The samewas true for Gln, although it wasassimilated at the beginning of each fermentation but releasedlater during the second half of fermentation. The net increasein Gln has been already observed before (22). F1–F6 weremostly marked by a more efficacious final AA assimilationtogether with a rapid initial uptake, whereas in F7 both the
te of Brewing & Distilling wileyonlinelibrary.com/journal/jib

Figure 5. The assimilation profile of Thr, Arg, Ala, Tyr, Val and Met for 11 successive fermentations of buckwheat wort. For comparative purposes both scatter plot axeswere relativized to the concentration in wort and presented as their percentage values. Numbers in scatter plot legend represent numbers of particular successivefermentations.
M. Deželak et al.Institute of Brewing & Distilling
final AA assimilation and the initial uptake decreasedsubstantially and slowly decreasing even further as succes-sive fermentations proceeded. In F10 and F11 the AA assi-milation was the slowest and least efficacious. Lower aminoacid assimilation after F6 corresponded to the decline inrelative protein concentration of the majority of the proteinbands (17).
The uptake order of amino acids
For the determination of the AA uptake order, none of thecriteria used by other researchers proved to be suitable in our
Copyright © 2015 The Instituwileyonlinelibrary.com/journal/jib
case, since they were considerably influenced by the serialrepitching and sometimes hard to define. Instead, a more ade-quate measure was introduced, that is, the so-called ‘completiontime’ (t95) to determine the AA uptake preference of yeast re-gardless of the successive fermentation. At first it was calculatedfrom the experimental data and judged visually afterwards. Thet95 parameter is somewhat similar to Tc (11); however, there aresome advantages of t95, such as the categorization of AAs ispossible using t95 solely and it can be employed also for AAs thatare not assimilated completely.
The serial repitching influenced t95 to some extent and thisinfluence was similar for all AAs, thus their division into fourgroups, named A1, A2, B1 and B2, was possible (Table 4).
J. Inst. Brew. 2015te of Brewing & Distilling
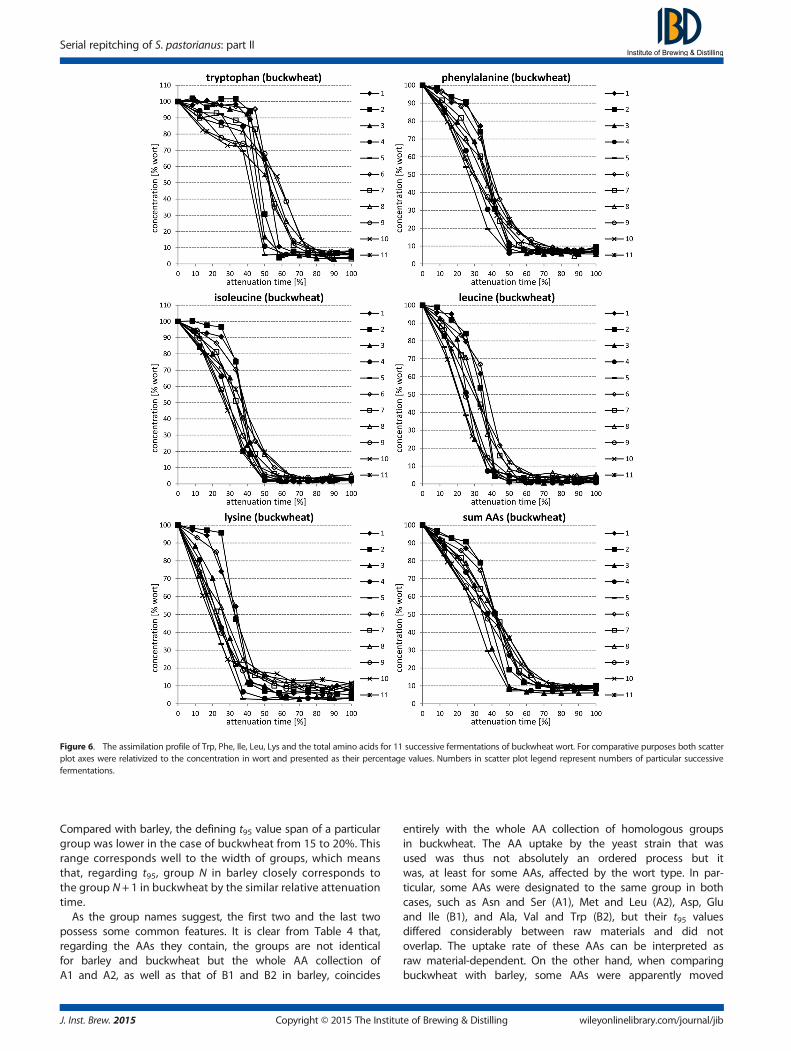
Figure 6. The assimilation profile of Trp, Phe, Ile, Leu, Lys and the total amino acids for 11 successive fermentations of buckwheat wort. For comparative purposes both scatterplot axes were relativized to the concentration in wort and presented as their percentage values. Numbers in scatter plot legend represent numbers of particular successivefermentations.
Serial repitching of S. pastorianus: part IIInstitute of Brewing & Distilling
Compared with barley, the defining t95 value span of a particulargroup was lower in the case of buckwheat from 15 to 20%. Thisrange corresponds well to the width of groups, which meansthat, regarding t95, group N in barley closely corresponds tothe group N+ 1 in buckwheat by the similar relative attenuationtime.
As the group names suggest, the first two and the last twopossess some common features. It is clear from Table 4 that,regarding the AAs they contain, the groups are not identicalfor barley and buckwheat but the whole AA collection ofA1 and A2, as well as that of B1 and B2 in barley, coincides
J. Inst. Brew. 2015 Copyright © 2015 The Institu
entirely with the whole AA collection of homologous groupsin buckwheat. The AA uptake by the yeast strain that wasused was thus not absolutely an ordered process but itwas, at least for some AAs, affected by the wort type. In par-ticular, some AAs were designated to the same group in bothcases, such as Asn and Ser (A1), Met and Leu (A2), Asp, Gluand Ile (B1), and Ala, Val and Trp (B2), but their t95 valuesdiffered considerably between raw materials and did notoverlap. The uptake rate of these AAs can be interpreted asraw material-dependent. On the other hand, when comparingbuckwheat with barley, some AAs were apparently moved
te of Brewing & Distilling wileyonlinelibrary.com/journal/jib

Figure 7. The assimilation profile of Asp, Glu, Asn, Ser, Gln and His + Gly for 11 successive fermentations of quinoa wort. For comparative purposes both scatter plot axes wererelativized to the concentration in wort and presented as their percentage values. Numbers in scatter plot legend represent numbers of particular successive fermentations.
M. Deželak et al.Institute of Brewing & Distilling
from A1 to A2, that is, Gln, Thr and Lys, and some from B1to B2, that is, Gly +His, Arg, Tyr and Phe, although they hadcomparable t95 values. This difference in group classificationmeans that their uptake rate was almost exclusively yeast-dependent with negligible influence of the raw material.
The uptake rate of single amino acids
Attention was also given to the final uptake of particular AAs inregard to the total AA uptake as a function of serial repitching(data not shown). In barley, Asn and Ala represented the
Copyright © 2015 The Instituwileyonlinelibrary.com/journal/jib
highest average share of the total assimilated AAs (>10% each),followed by Leu, Phe, Lys and Arg (5–10% each), whereas theothers represented <5% each. In general, no obvious patternof the serial repitching influence can be recognized. In thecase of buckwheat, Glu and Arg represented the highestaverage share of the total assimilated AAs (>10% each),followed by Asp, Ser, Gly, Ala, Val, Trp and Leu (5–10% each),whereas the others represented <5% each. In the case ofquinoa, Asn, Ser, Thr and Lys represented the highest shareof the total assimilated AAs (>10% each, ~50% all together),followed by Leu, Phe, Ile and Met (5–10% each), whereas theothers represented <5%.
J. Inst. Brew. 2015te of Brewing & Distilling

Figure 8. The assimilation profile of Thr, Arg, Ala, Tyr, Val and Met for 11 successive fermentations of quinoa wort. For comparative purposes both scatter plot axeswere relativized to the concentration in wort and presented as their percentage values. Numbers in scatter plot legend represent numbers of particular successivefermentations.
Serial repitching of S. pastorianus: part IIInstitute of Brewing & Distilling
In addition, the final uptake of a particular AA in regardto its initial concentration as a function of serial repitchingwas also investigated (data not shown). In barley, AAs, thatis, Asn, Ser, Leu, Ile, Lys, Phe and Thr, which on averagewere assimilated the most efficaciously (>90%), were alsoassimilated the most consistently (RSD< 5%). In general,the serial repitching influenced particular AAs differently. Inbuckwheat, only the assimilation of Val, Gln, Met, Asp andGly + His was <90%. Serial repitching had a negligible influ-ence on the AA assimilation, which is here supported by thelow RSD values (<5%). In the case of quinoa, AAs were as-similated to very distinct degrees (Fig. 7). After F6, the
J. Inst. Brew. 2015 Copyright © 2015 The Institu
assimilated share of all AAs fell markedly but for some ofthem, that is, Gly + His, Met, Ile and Lys, it increased againlater on.As a matter of interest, it is worth mentioning that in this work
a correlation was found with our previous assumption thatdifferent relative concentrations of the 30.7 kDa protein bandbetween raw materials could be due to differing expression ofMet16p, which is involved in the metabolism of sulphur-containing amino acids (17). In particular, there was a negativecorrelation observed between average relative protein concen-tration and initial concentration of Met in the barley, buckwheatand quinoa wort.
te of Brewing & Distilling wileyonlinelibrary.com/journal/jib

Figure 9. The assimilation profile of Trp, Phe, Ile, Leu, Lys and the total amino acids for 11 successive fermentations of quinoa wort. For comparative purposes both scatter plotaxes were relativized to the concentration in wort and presented as their percentage values. Numbers in scatter plot legend represent numbers of particular successivefermentations.
Table 4. The classification of wort amino acids according to their overall consumption priority by the lager yeast Saccharomycespastorianus TUM 34/70
Group Barley Buckwheat
t95 (%) AAs t95 (%) AAs
A1 40–60 Asn, Ser, Gln, Thr, Lys 25–45 Asn, SerA2 50–70 Met, Leu 35–55 Gln, Thr, Met, Leu, LysB1 60–80 Asp, Glu, Gly +His, Arg, Tyr, Phe, Ile 45–60 Asp, Glu, IleB2 70–90 Ala, Val, Trp 50–70 Gly +His, Arg, Ala, Tyr, Val, Trp, Phe
t95, Percentage attenuation time necessary for ~95% of the total assimilation.
M. Deželak et al.Institute of Brewing & Distilling
J. Inst. Brew. 2015Copyright © 2015 The Institute of Brewing & Distillingwileyonlinelibrary.com/journal/jib
Serial repitching of S. pastorianus: part IIInstitute of Brewing & Distilling
Conclusions
The work presented clearly demonstrated that both the type of rawmaterial and the number of yeast repitchings influenced the final AAuptake as well as the assimilation profile. As opposed to buckwheatand quinoa, in barley AAs behaved more or less independentlyduring the serial repitching, which for buckwheat and quinoa indi-cates amoregeneral, systemic changeof yeast andnot the influenceof a particular metabolic pathway. Based on the results, evaluationsof buckwheat and quinoa were made from two distinct points ofview, that is, (a) whether pseudocereal is convenient to be commer-cially used for serial repitching of S. pastorianus TUM34/70 per se and(b) whether this convenience also includes a substitutional potentialfor barley as a brewing raw material.
In comparison to the barley wort, it was shown that the quinoawort influenced all parameters of the uptake of all amino acidsconsiderably and in general, this influence can be regarded asnegative. The total AA assimilation was weakened, especially afterF6, both in the relative and in the absolute sense, which conse-quentlymeans that under the fermentation conditions yeast prolife-ration and biomass gain as well as the production of aromacompounds were expectedly limited. Substantail amounts of AAswere left over after fermentation, which is undoubtedly appreciatedfrom the nutritional point of view but this fact causes concerns as itcan promote the ageing of beverages and the shortening of shelf-life. To summarize, our results suggest no substitutional potentialof quinoa for barley beer when using S. pastorianus TUM 34/70. Inaddition, if a nutrient-rich beverage of choice from quinoa malt ismeant to be prepared, the above-mentioned yeast strain has onlylimited suitability for serial repitching, that is, six at most.
In buckwheat, efficacious and faster AA assimilation comparedwith barley may be regarded as a positive quality of the buckwheatwort, but a proper balancebetween thebiomass production and fer-mentation performance is typically desired. Nevertheless, in practicethe absolute AA assimilation is important and in the case of barleyand buckwheat their values did not differ significantly. Based onthese results, from the AAs point of view, buckwheat can be fullyregarded as a suitable gluten-free substitute for barley beer. In addi-tion, there was very little influence on AA assimilation by the serialrepitching, even after 11 successive fermentations.
Acknowledgements
This work was financially supported by the Slovenian ResearchAgency ( grant no. 01-1222/1-2010) and Slovene Human ResourcesDevelopment and Scholarship Fund ( grant no. 11012-1/2012-7).The authors would like to thank Centre Weihenstephan forBrewing and Food Quality (Freising, Germany) for kindly providingthe yeast strain TUM 34/70.
References1. O’Connor-Cox, E. S. C., and Ingledew,W.M. (1989)Wort nitrogenous sources
their use by brewing yeasts: A review, J. Am. Soc. Brew. Chem. 47, 102–108.2. Lei, H. J., Zhao, H. F., Yu, Z. M., and Zhao, M. M. (2012) Effects of wort
gravity and nitrogen level on fermentation performance of brewer’syeast and the formation of flavor volatiles, Appl. Biochem. Biotech.166, 1562–1574.
J. Inst. Brew. 2015 Copyright © 2015 The Institu
3. Basarova, G., and Janousek, J. (2000) Importance of amino acids in beertechnology and quality, Kvasny Prum. 46, 314–318.
4. Nagao, Y., Kodama, H., Yamaguchi, T., Yonezawa, T., Taguchi, A., andFushiki, T. (1999) Reduced urination rate while drinking beer with anunpleasant taste and off-flavor, Biosci. Biotech. Bioch. 63, 468–473.
5. Pierce, J. S. (1987) Horace Brownmemorial lecture: The role of nitrogenin brewing, J. Instit. Brew. 93, 378–381.
6. Regenberg, B., During-Olsen, L., Kielland-Brandt, M. C., andHolmberg, S. (1999) Substrate specifity and gene expression of theamino-acid permeases in Saccharomyces cerevisiae, Curr. Genet. 36,317–328.
7. Jones, M., and Pierce, J. S. (1964) Absorption of amino acids from wortby yeasts, J. Inst. Brew. 70, 307–315.
8. Basarova, G., and Cerna, I. (1972) Role of amino acids and effect ofchanging their levels in brewing, Kvasny Prum. 18, 55–58.
9. Lekkas, C., Stewart, G. G., Hill, A. E., Taidi, B., and Hodgson, J. (2007)Elucidation of the role of nitrogenous wort components in yeastfermentation, J. Inst. Brew. 113, 3–8.
10. Palmqvist, U., and Ayrapaa, T. (1969) Uptake of amino acid in bottomfermentations, J. Inst. Brew. 75, 181–190.
11. Perpète, P., Santos, G., Bodart, E., and Collin, S. (2005) Uptake of aminoacids during beer production: The concept of a critical time value,J. Am. Soc. Brew. Chem. 63, 23–27.
12. Ramos-Jeunhome, C., De Keyser, L., and Massehelein, C. A. (1979)Formation of aromatic and kinetic absorption substances from aminoacid of wort, in Proceedings of the European Brewery ConventionCongress, Berlin, pp. 505–510, IRL Press, Oxford.
13. DeMeo, B., Freeman, G., Marconi, O., Booer, C., Perretti, G., and Fantozzi,P. (2011) Behaviour of malted cereals and pseudocereals for gluten-free beer production, J. Inst. Brew. 117, 541–546.
14. Deželak, M., Zarnkow, M., Becker, T., and Košir, I. J. (2014) Processing ofbottom fermented gluten-free beer-like beverages based on buck-wheat and quinoa malt with chemical and sensory characterization,J. Inst. Brew. 120, 360–370.
15. Phiarais, B. P. N., Mauch, A., Schehl, B. D., Zarnkow, M., Gastl, M.,Herrmann, M., Zannini, E., and Arendt, E. K. (2010) Processing of a topfermented beer brewed from 100% buckwheat malt with sensoryand analytical characterization, J. Inst. Brew. 116, 265–274.
16. Zarnkow, M., Kessler, M., Burgerg, F., Kreisz, S., and Back, W. (2005)Gluten-free beer from malted cereals and pseudocereals, in Procee-dings of the European Brewery Convention Congress, Prague, FachverlagHans Carl: Nürnberg, CD ROM Contribution 104.
17. Deželak, M., Gebremariam, M. M., Čadež, N., Zupan, J., Raspor, P.,Zarnkow, M., Becker, T., and Košir, I. J. (2014) The influence of serialrepitching of Saccharomyces pastorianus on its karyotype and proteinprofile during the fermentation of gluten-free buckwheat and quinoawort, Int. J. Food Microbiol. 185, 93–102.
18. Wild, D. G., and Hinshelwood, C. (1956) The response of yeast cells tothe action of inhibitory substances. I. Sodium azide, Proc. R. Soc. Lond.B 145, 14–23.
19. Henderson, J. W. Jr. and Brooks, A. (2010) Improved amino acidmethods using Agilent ZORBAX Eclipse Plus C18 columns for a varietyof Agilent LC instrumentation and separation goals. Agilent Applica-tion Note 5990-4547EN.
20. Wang, S. S., and Brandriss, M. C. (1987) Proline utilization in Saccharo-myces cerevisiae: Sequence, regulation, and mitochondrial localizationof the PUT1 gene product, Mol. Cell. Biochem. 7, 4431–4440.
21. Deželak, M., Gebremariam,M.M., Zarnkow,M., and Košir, I. J. (2015) PartI: the influence of serial repitching of Saccharomyces pastorianus onthe uptake dynamics of metal ions and fermentable carbohydratesduring the fermentation of barley and gluten-free bubuckwheat andquinoa wort, J. Inst. Brew.
22. Gibson, B. R., Boulton, C. A., Box, W. G., Graham, N. S., Lawrence, S. J.,Linforth, R. S. T., and Smart, K. A. (2009) Amino acid uptake and yeastgene transcription during industrial brewery fermentation, J. Am. Soc.Brew. Chem. 67, 157–165.
te of Brewing & Distilling wileyonlinelibrary.com/journal/jib
Copyright © 2022 FDOKUMEN