Quality of spaghetti in base amaranthus wholemeal flour added with quinoa, broad bean and chick pea
7
Quality of spaghetti in base amaranthus wholemeal flour added with quinoa, broad bean and chick pea S. Chillo a , J. Laverse a , P.M. Falcone a , M.A. Del Nobile a,b, * a Department of Food Science, University of Foggia, Via Napoli, 25 – 71100 Foggia, Italy b Istituto per la Ricerca e le Applicazioni Biotecnologiche per la Sicurezza e la Valorizzazione dei Prodotti Tipici e di Qualita `, Universita ` degli Studi di Foggia, Via Napoli, 25 – 71100 Foggia, Italy Received 10 October 2006; received in revised form 18 April 2007; accepted 19 April 2007 Available online 3 May 2007 Abstract The quality of three gluten free spaghetti typologies, made from amaranthus flour plus the addition of quinoa (CQA), broad bean (CBA) or chick pea (CCA), was investigated. The quality of the produced spaghetti was compared to that of spaghetti made of durum semolina (CTRL). Tests were run on the samples to determine breakage susceptibility of dry spaghetti, the cooking resistance, instru- mental stickiness in cooking and over cooking, cooking loss and some sensorial attributes at the optimal cooking time. The spaghetti obtained from amaranthus flour when compared to the CTRL, had equal or lower dry breakage susceptibility and cooking resistance, higher cooking loss and visibly lower instrumental stickiness. However, these spaghetti did not demonstrate relevant sensorial differences. Ó 2007 Elsevier Ltd. All rights reserved. Keywords: Quinoa; Broad bean; Chick pea; Spaghetti; Breakage susceptibility; Cooking quality 1. Introduction Pasta has a primary role in human nutrition, thanks to its complex carbohydrate content. Due to its large diffusion in the world, extended shelf life and the food intrinsic value (Antognelli, 1980) can be used with several integrations to make important nutritional principles. This aspect mainly involves increasing protein, dietary fibre, vitamins and min- erals. The World Health Organization (WHO) and Food and Drug Administration (FDA) consider pasta a good vehicle for the addition of nutrients. Pasta was one of the first foods for which the FDA permitted vitamin and iron enrichment in the 1940s (Marconi & Carcea, 2001). Several studies have been carried out to improve the protein content of pasta by the addition of raw materials of vegetable source (Bahnassey & Khan, 1986; Breen, 1977; Haber, Seyan, & Banasik, 1978; Nielsen, Sumner, & Whalley, 1980) or animal source (Hanna, Satterlee, & Thayer, 1978; Pagani, De Noni, Resini, & Pellegrino, 1986; Resmini, Volontario, Saracchi, & Piergiovanni, 1975; Schoppet, Sinnamon, Talley, Panzer, & Aceto, 1979). Other authors studied the effect of the addition of dietary fibres, vitamins and minerals on the quality of pasta (Bahnassey, Khan, & Harrold, 1986; Knuckles, Hudson, Chiu, & Sayre, 1997). High-protein plant materials are derived mainly from soybean, pea, lupine, amaranth, qui- noa, broad bean and chick pea and can be used as isolates, flour or in their concentrated form. Amaranth was a staple food of the pre-Columbian Aztecs, which first found its way to the Americas from China. It has a protein content of 18% (Tosi et al., 2002), is recognized as lysine rich high-protein grains which have the potential to meet the world’s requirements (Ruales & Nair, 1993; Singhal & Kulkarni, 1988) and contains signif- icant amounts of calcium, iron, potassium, phosphorous, vitamins and dietary fibre (Escudero, Albarracin, Ferna ´n- dez, De Arellano, & Mucciarelli, 1999). 0260-8774/$ - see front matter Ó 2007 Elsevier Ltd. All rights reserved. doi:10.1016/j.jfoodeng.2007.04.022 * Corresponding author. Address: Department of Food Science, Uni- versity of Foggia, Via Napoli, 25 – 71100 Foggia, Italy. Tel.: +39 881 589 242; fax.: +39 881 740 242. E-mail address: [email protected] (M.A. Del Nobile). www.elsevier.com/locate/jfoodeng Journal of Food Engineering 84 (2008) 101–107
-
Upload
independent -
Category
Documents
-
view
0 -
download
0
Transcript of Quality of spaghetti in base amaranthus wholemeal flour added with quinoa, broad bean and chick pea
www.elsevier.com/locate/jfoodeng
Journal of Food Engineering 84 (2008) 101–107
Quality of spaghetti in base amaranthus wholemeal flour addedwith quinoa, broad bean and chick pea
S. Chillo a, J. Laverse a, P.M. Falcone a, M.A. Del Nobile a,b,*
a Department of Food Science, University of Foggia, Via Napoli, 25 – 71100 Foggia, Italyb Istituto per la Ricerca e le Applicazioni Biotecnologiche per la Sicurezza e la Valorizzazione dei Prodotti Tipici e di Qualita,
Universita degli Studi di Foggia, Via Napoli, 25 – 71100 Foggia, Italy
Received 10 October 2006; received in revised form 18 April 2007; accepted 19 April 2007Available online 3 May 2007
Abstract
The quality of three gluten free spaghetti typologies, made from amaranthus flour plus the addition of quinoa (CQA), broad bean(CBA) or chick pea (CCA), was investigated. The quality of the produced spaghetti was compared to that of spaghetti made of durumsemolina (CTRL). Tests were run on the samples to determine breakage susceptibility of dry spaghetti, the cooking resistance, instru-mental stickiness in cooking and over cooking, cooking loss and some sensorial attributes at the optimal cooking time. The spaghettiobtained from amaranthus flour when compared to the CTRL, had equal or lower dry breakage susceptibility and cooking resistance,higher cooking loss and visibly lower instrumental stickiness. However, these spaghetti did not demonstrate relevant sensorial differences.� 2007 Elsevier Ltd. All rights reserved.
Keywords: Quinoa; Broad bean; Chick pea; Spaghetti; Breakage susceptibility; Cooking quality
1. Introduction
Pasta has a primary role in human nutrition, thanks toits complex carbohydrate content. Due to its large diffusionin the world, extended shelf life and the food intrinsic value(Antognelli, 1980) can be used with several integrations tomake important nutritional principles. This aspect mainlyinvolves increasing protein, dietary fibre, vitamins and min-erals. The World Health Organization (WHO) and Foodand Drug Administration (FDA) consider pasta a goodvehicle for the addition of nutrients. Pasta was one of thefirst foods for which the FDA permitted vitamin and ironenrichment in the 1940s (Marconi & Carcea, 2001).
Several studies have been carried out to improve theprotein content of pasta by the addition of raw materialsof vegetable source (Bahnassey & Khan, 1986; Breen,
0260-8774/$ - see front matter � 2007 Elsevier Ltd. All rights reserved.
doi:10.1016/j.jfoodeng.2007.04.022
* Corresponding author. Address: Department of Food Science, Uni-versity of Foggia, Via Napoli, 25 – 71100 Foggia, Italy. Tel.: +39 881 589242; fax.: +39 881 740 242.
E-mail address: [email protected] (M.A. Del Nobile).
1977; Haber, Seyan, & Banasik, 1978; Nielsen, Sumner,& Whalley, 1980) or animal source (Hanna, Satterlee, &Thayer, 1978; Pagani, De Noni, Resini, & Pellegrino,1986; Resmini, Volontario, Saracchi, & Piergiovanni,1975; Schoppet, Sinnamon, Talley, Panzer, & Aceto,1979). Other authors studied the effect of the addition ofdietary fibres, vitamins and minerals on the quality of pasta(Bahnassey, Khan, & Harrold, 1986; Knuckles, Hudson,Chiu, & Sayre, 1997). High-protein plant materials arederived mainly from soybean, pea, lupine, amaranth, qui-noa, broad bean and chick pea and can be used as isolates,flour or in their concentrated form.
Amaranth was a staple food of the pre-ColumbianAztecs, which first found its way to the Americas fromChina. It has a protein content of 18% (Tosi et al., 2002),is recognized as lysine rich high-protein grains which havethe potential to meet the world’s requirements (Ruales &Nair, 1993; Singhal & Kulkarni, 1988) and contains signif-icant amounts of calcium, iron, potassium, phosphorous,vitamins and dietary fibre (Escudero, Albarracin, Fernan-dez, De Arellano, & Mucciarelli, 1999).
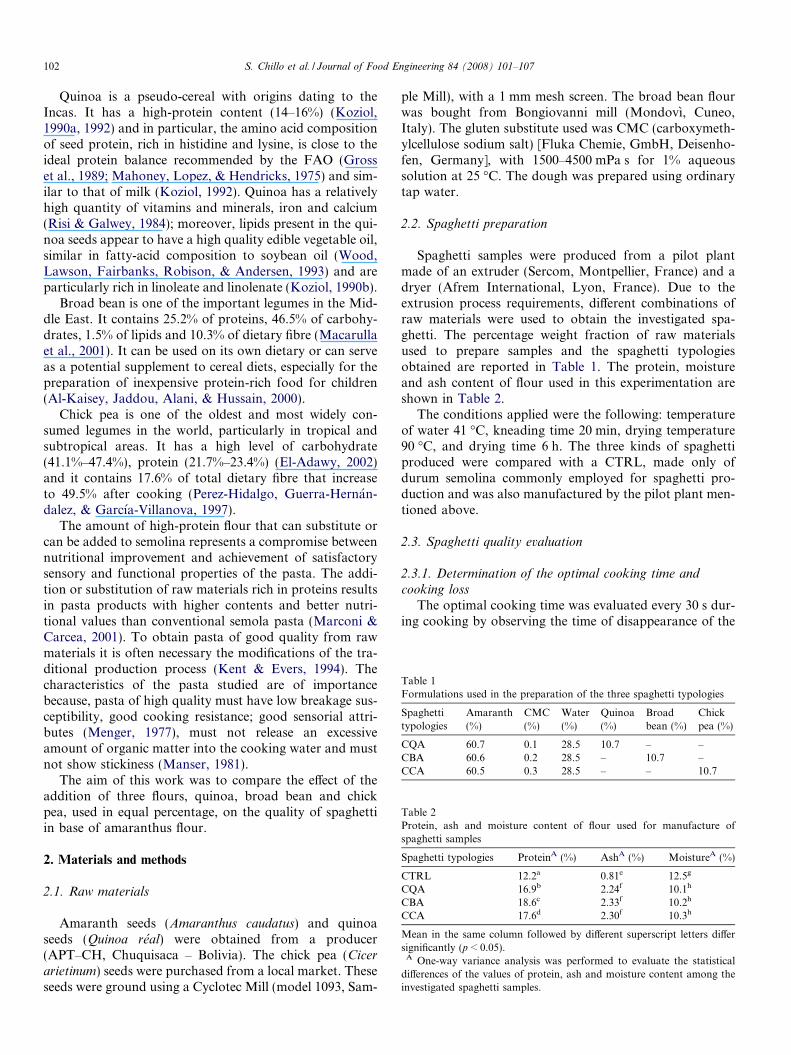
Table 1Formulations used in the preparation of the three spaghetti typologies
Spaghettitypologies
Amaranth(%)
CMC(%)
Water(%)
Quinoa(%)
Broadbean (%)
Chickpea (%)
CQA 60.7 0.1 28.5 10.7 – –CBA 60.6 0.2 28.5 – 10.7 –CCA 60.5 0.3 28.5 – – 10.7
Table 2Protein, ash and moisture content of flour used for manufacture ofspaghetti samples
Spaghetti typologies ProteinA (%) AshA (%) MoistureA (%)
CTRL 12.2a 0.81e 12.5g
CQA 16.9b 2.24f 10.1h
CBA 18.6c 2.33f 10.2h
CCA 17.6d 2.30f 10.3h
Mean in the same column followed by different superscript letters differsignificantly (p < 0.05).
A One-way variance analysis was performed to evaluate the statisticaldifferences of the values of protein, ash and moisture content among theinvestigated spaghetti samples.
102 S. Chillo et al. / Journal of Food Engineering 84 (2008) 101–107
Quinoa is a pseudo-cereal with origins dating to theIncas. It has a high-protein content (14–16%) (Koziol,1990a, 1992) and in particular, the amino acid compositionof seed protein, rich in histidine and lysine, is close to theideal protein balance recommended by the FAO (Grosset al., 1989; Mahoney, Lopez, & Hendricks, 1975) and sim-ilar to that of milk (Koziol, 1992). Quinoa has a relativelyhigh quantity of vitamins and minerals, iron and calcium(Risi & Galwey, 1984); moreover, lipids present in the qui-noa seeds appear to have a high quality edible vegetable oil,similar in fatty-acid composition to soybean oil (Wood,Lawson, Fairbanks, Robison, & Andersen, 1993) and areparticularly rich in linoleate and linolenate (Koziol, 1990b).
Broad bean is one of the important legumes in the Mid-dle East. It contains 25.2% of proteins, 46.5% of carbohy-drates, 1.5% of lipids and 10.3% of dietary fibre (Macarullaet al., 2001). It can be used on its own dietary or can serveas a potential supplement to cereal diets, especially for thepreparation of inexpensive protein-rich food for children(Al-Kaisey, Jaddou, Alani, & Hussain, 2000).
Chick pea is one of the oldest and most widely con-sumed legumes in the world, particularly in tropical andsubtropical areas. It has a high level of carbohydrate(41.1%–47.4%), protein (21.7%–23.4%) (El-Adawy, 2002)and it contains 17.6% of total dietary fibre that increaseto 49.5% after cooking (Perez-Hidalgo, Guerra-Hernan-dalez, & Garcıa-Villanova, 1997).
The amount of high-protein flour that can substitute orcan be added to semolina represents a compromise betweennutritional improvement and achievement of satisfactorysensory and functional properties of the pasta. The addi-tion or substitution of raw materials rich in proteins resultsin pasta products with higher contents and better nutri-tional values than conventional semola pasta (Marconi &Carcea, 2001). To obtain pasta of good quality from rawmaterials it is often necessary the modifications of the tra-ditional production process (Kent & Evers, 1994). Thecharacteristics of the pasta studied are of importancebecause, pasta of high quality must have low breakage sus-ceptibility, good cooking resistance; good sensorial attri-butes (Menger, 1977), must not release an excessiveamount of organic matter into the cooking water and mustnot show stickiness (Manser, 1981).
The aim of this work was to compare the effect of theaddition of three flours, quinoa, broad bean and chickpea, used in equal percentage, on the quality of spaghettiin base of amaranthus flour.
2. Materials and methods
2.1. Raw materials
Amaranth seeds (Amaranthus caudatus) and quinoaseeds (Quinoa real) were obtained from a producer(APT–CH, Chuquisaca – Bolivia). The chick pea (Cicer
arietinum) seeds were purchased from a local market. Theseseeds were ground using a Cyclotec Mill (model 1093, Sam-
ple Mill), with a 1 mm mesh screen. The broad bean flourwas bought from Bongiovanni mill (Mondovı, Cuneo,Italy). The gluten substitute used was CMC (carboxymeth-ylcellulose sodium salt) [Fluka Chemie, GmbH, Deisenho-fen, Germany], with 1500–4500 mPa s for 1% aqueoussolution at 25 �C. The dough was prepared using ordinarytap water.
2.2. Spaghetti preparation
Spaghetti samples were produced from a pilot plantmade of an extruder (Sercom, Montpellier, France) and adryer (Afrem International, Lyon, France). Due to theextrusion process requirements, different combinations ofraw materials were used to obtain the investigated spa-ghetti. The percentage weight fraction of raw materialsused to prepare samples and the spaghetti typologiesobtained are reported in Table 1. The protein, moistureand ash content of flour used in this experimentation areshown in Table 2.
The conditions applied were the following: temperatureof water 41 �C, kneading time 20 min, drying temperature90 �C, and drying time 6 h. The three kinds of spaghettiproduced were compared with a CTRL, made only ofdurum semolina commonly employed for spaghetti pro-duction and was also manufactured by the pilot plant men-tioned above.
2.3. Spaghetti quality evaluation
2.3.1. Determination of the optimal cooking time and
cooking loss
The optimal cooking time was evaluated every 30 s dur-ing cooking by observing the time of disappearance of the
S. Chillo et al. / Journal of Food Engineering 84 (2008) 101–107 103
core of the spaghetti strand on squeezing it between twotransparent glass slides.
The cooking loss (CL, the amount of solid substancelost to cooking water) was determined according to themethod described by Olfat, Yaseen, and Aziza (1993).Ten grams sample of spaghetti were placed into 300 ml ofboiling distilled water in a 500 ml beaker. The cookingwater was then collected in an aluminum vessel, placed intoan air oven at 115 �C and evaporated to dryness. The res-idue was weighed and reported as a percentage of the start-ing material.
2.3.2. Water sorption determination
Water sorption tests were run using 40 mm long sam-ples. Spaghetti strands were immersed into the test tubes,one for each tube, containing about 9 ml of distilled waterand equilibrated at 100 ± 0.6 �C in a thermostatic bath(C40 P, Haake, Vreden, Germany). Before sorption testswere run the weight and length of cut samples were evalu-ated by means of an analytical scale (HK 60, Mettler–Toledo, Greifensee, Switzerland) and a gauge with an accu-racy of 1/120 mm, respectively. At given times (each 30 sfor the first 5 min; each minute until 12 min, and each2 min until 20 min; moreover, to intensify the informationclose to the optimal cooking time tests at 7.5 min and at 8.5were also run) the samples were removed from the tube,rapidly blotted, and submitted to the evaluation of weightand length. For each sorption time, five determinationswere performed.
2.3.3. Elastic modulus
A spaghetti strand (length 25 mm), enameled at bothends to avoid hydration during cooking, was used to deter-mine the elastic modulus in tension (Ec). The sample wasimmersed into test tubes and treated as for the water sorp-tion tests. At given cooking times (5.5, 7, 7.5, 8, 8.5, 9, 10,11 and 12 min) the sample was removed from the tube,immersed in a mixture of ice and water to slow down watermigration and was then submitted to stress–strain testsusing a Dynamic Mechanical Analyzer (DMA-Q 800, TAInstruments, New Castle, DE, USA). One end of the strandwas attached to a superior mobile clamp and the other endattached to a lower fixed clamp. Tests were carried out atroom temperature, with a preload of 10�2 N and a forceramp of 0.2 N/min. Three repetitions were carried out foreach test. The elastic modulus was evaluated from the ini-tial slope of the obtained stress–strain curve. To determinethe cooking quality of the investigated spaghetti in terms ofmechanical properties, the following exponential equationwas fitted to the Ec data:
EcðtÞ ¼ Ecj1 þ ðEcj0 � Ecj1Þ � expð�k½Ec� � tÞ ð1Þ
where, Ecj1 is the spaghetti elastic modulus at infinitetime, Ecj0 is the elastic modulus a time zero, k[Ec] is thekinetics constant, it expresses the rate of change of theEc in the time and it is a measure of cooking quality ofspaghetti.
2.3.4. Instrumental stickiness
For this test, eight spaghetti strands (25 mm-length)were cooked according to the above procedure, the cook-ing times adopted were the same used for the elastic mod-ulus. After cooking, the eight strands were removed fromthe test tubes, gently blotted and submitted to the instru-mental stickiness analysis, performed by a rotational rhe-ometer (ARES, TA Instruments, New Castle, DE, USA),strain controlled and equipped with stainless steel parallelplates (25 mm-diameter). The eight samples were placedside by side on the lower plate and the superior platemoved down onto the spaghetti surface. A compressionforce of 100 gmf for 45 s was maintained to allow a perfectsurface contact between the superior plate and the strands.After which, the superior plate lifted from the sample sur-face at a rate of 0.1 mm/s. The stickiness was defined as thenormal force [N] needed to detach the plate from surface ofstrands. Three measurements for each cooking time wereperformed.
2.3.5. Sensory analysis
Optimally cooked spaghetti samples were submitted ina group at a single session, to a panel of five trainedtasters for estimation of adhesiveness, bulkiness and firm-ness on a 1–9 scale (Szczesniak, Brandt, & Friedman,1963), where 1 (extremely unpleasant) and 9 (extremelypleasant). The adhesiveness is related to the formationof a surface coating made of amylose and it was evalu-ated by placing the spaghetti in the mouth, pressing itagainst the palate and determining the force requiredto remove it with the tongue. The bulkiness is a measureof the degree of jamming among the spaghetti strandsand it has been evaluated by placing two spaghettistrands together and determining the force required fordetachment. The hardness, the resistance of cooked pastato compression by the teeth, was measured by compress-ing the spaghetti strand against the palate with thetongue.
2.3.6. Determination of dry spaghetti breakage susceptibility
The breakage susceptibility of dry spaghetti was deter-mined according to the method proposed by Del Nobileand Massera (2002), who related the spaghetti breakagesusceptibility to residual deformations released uponhydration by the spaghetti strand. To quantify the extentof residual deformations Del Nobile and Massera (2002)proposed a mathematical model, which is briefly summa-rized in the following. The model is based on theassumption that the traveling discontinuity, present inthe sample at the early stage of the hydration process(‘‘first stage”), represents the border line separating aninner core, where the local degree of crystallinity is equalto the initial one and the water concentration is zero,from an outer swollen region, where the water concentra-tion is uniform and constant and the local degree of crys-tallinity is equal to the final one. It has been furtherassumed that during the ‘‘second stage”, the water
104 S. Chillo et al. / Journal of Food Engineering 84 (2008) 101–107
concentration profile in the spaghetti is still uniform andincreases with time till the end of the ‘‘second stage”.The equations obtained to describe the evolution of thelength of the spaghetti strand during hydration arereported in the following:
LðtÞ ¼�
E1E0
L1� 1�cðtÞ
c�1
c�þqpastaqwater
� �� cðtÞ
� �2�cðtÞ
L0�ffiffiffiffiffiffiffiffiffiffiffiffiffiffiffic��qpasta
qwaterþ13
p
þ
ffiffiffiffiffiffiffiffiffiffiffiffiffiffiffiffiffiffiffiffiffiffiffiffiffiffiffiffiffiffiffiffiffiffiffiffiffiffiffiffiffiffiffiffiffiffiffiffiffiffiffiffiffiffiffiffiffiffiffiffiffiffiffiffiffiffiffiffiffiffiffiffiffiffiffiffiffiffiffiffiffiffiffiffiffiffiffiffiffiffiffiE1E0
L1� 1�cðtÞ
c�1
c�þqpastaqwater
� �� cðtÞ
� �2
þ4�cðtÞ�E1
E0
L0�ffiffiffiffiffiffiffiffiffiffiffiffiffiffiffic��qpasta
qwaterþ13
p � 1�cðtÞc�
1c�þ
qpastaqwater
s2�cðtÞ
L0�ffiffiffiffiffiffiffiffiffiffiffiffiffiffiffic��qpasta
qwaterþ13
pð2Þ
LðtÞ ¼ L0 �ffiffiffiffiffiffiffiffiffiffiffiffiffiffiffiffiffiffiffiffiffiffiffiffiffiffiffiffiffifficðtÞ �
qpasta
qwater
þ 13
rð3Þ
where, t is the hydration time; LI is the initial length of thespaghetti strand; L(t) is the length of the spaghetti strand attime t; L0 is the length that the spaghetti strand would haveat time t, if its molecules were at the equilibrium conforma-tion; qpasta is the density of the dry spaghetti; qwater is thedensity of absorbed water; c(t) is the gram of water ab-sorbed into the spaghetti strand per gram of dry sampleat the time t; c* is the water concentration in the swollenregion; and EI/E0 is the ratio between the elastic modulusof the unpenetrated inner region and the elastic modulusof the outer swollen region of the spaghetti strand. Eq.(2) is used to describe the ‘‘first stage” of the hydration pro-cess, whereas Eq. (3) to describe the ‘‘second stage”. Thefollowing relationship was proposed to determine the func-tion c(t):
cðtÞ¼A1 � 1þXn¼1n¼0
8
ð2 �nþ1Þ2 �p2� expð�A2 � ð2 �nþ1Þ2 � tA3 jÞ
" #( )
ð4Þ
where, Ai are constants that can be evaluated by fitting theexperimental data. The model’s parameters (i.e. Ai) wereobtained by first fitting Eq. (4) to the water sorption kineticdata to determine the function c(t), afterwards Eqs. (2) and(3) were fitted to the DL(t)/LI experimental data (DL(t) isL(t)–LI) to obtain the values of L0, c*, and EI/E0. Amongthe three model parameters, L0 is the most physically mean-ingful, since it is strictly related to the amount of the resid-ual deformations released (defined as LI–L0). Watersorption tests were run as described above.
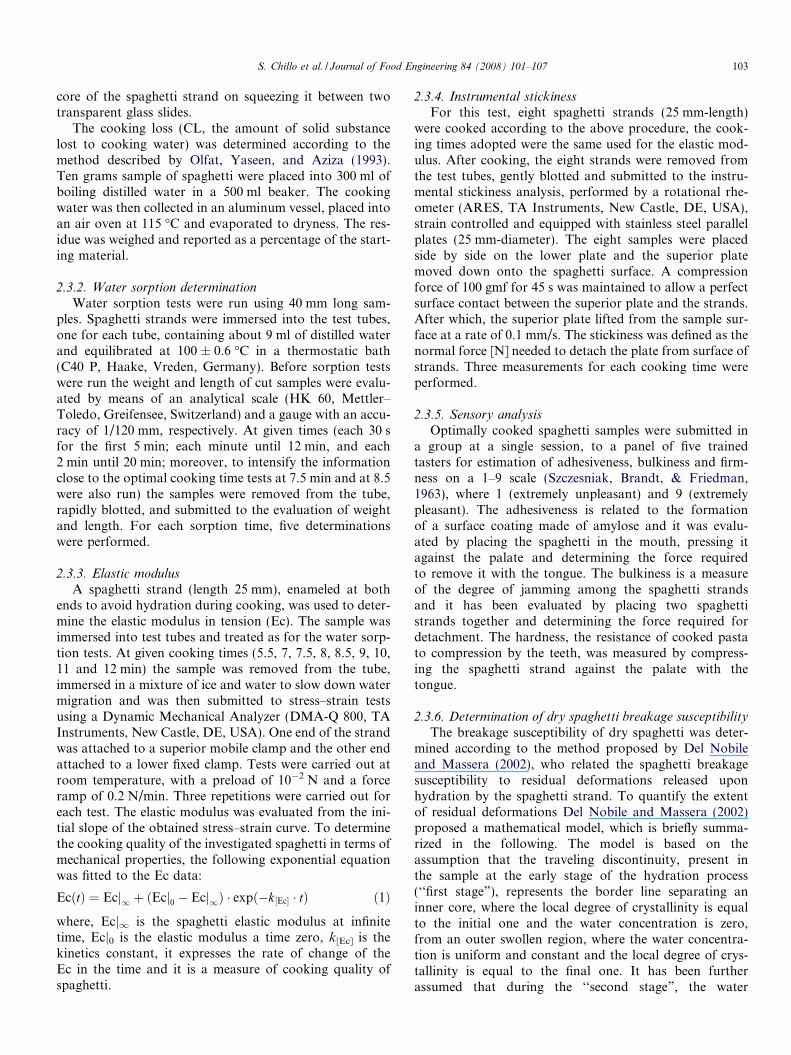
Fig. 1. Ratio between the gram of water absorbed into the spaghettistrand per gram of dry sample at the time t [c(t)] and initial weight ofspaghetti strand (P.I.) vs. cooking time at 100 �C for the CTRL sample:(d), experimental data; (- - -), best fit, for the CQA sample; (j),experimental data; (– – –), best fit, for the CBA sample; (�), experimentaldata; (——), best fit and for the CCA; (N), experimental data; (- – -), bestfit.
2.4. Statistical analysis
The results were compared by one-way variance analysis(ANOVA). A Duncan’s multiple range test, with theoption of homogeneous groups (p<0.05), was used todetermine significance between spaghetti samples. STAT-ISTICA 6.0 for Windows (StatSoft, Inc., Tulsa, OK,USA) was used for this purpose.
3. Results and discussion
3.1. Breakage susceptibility
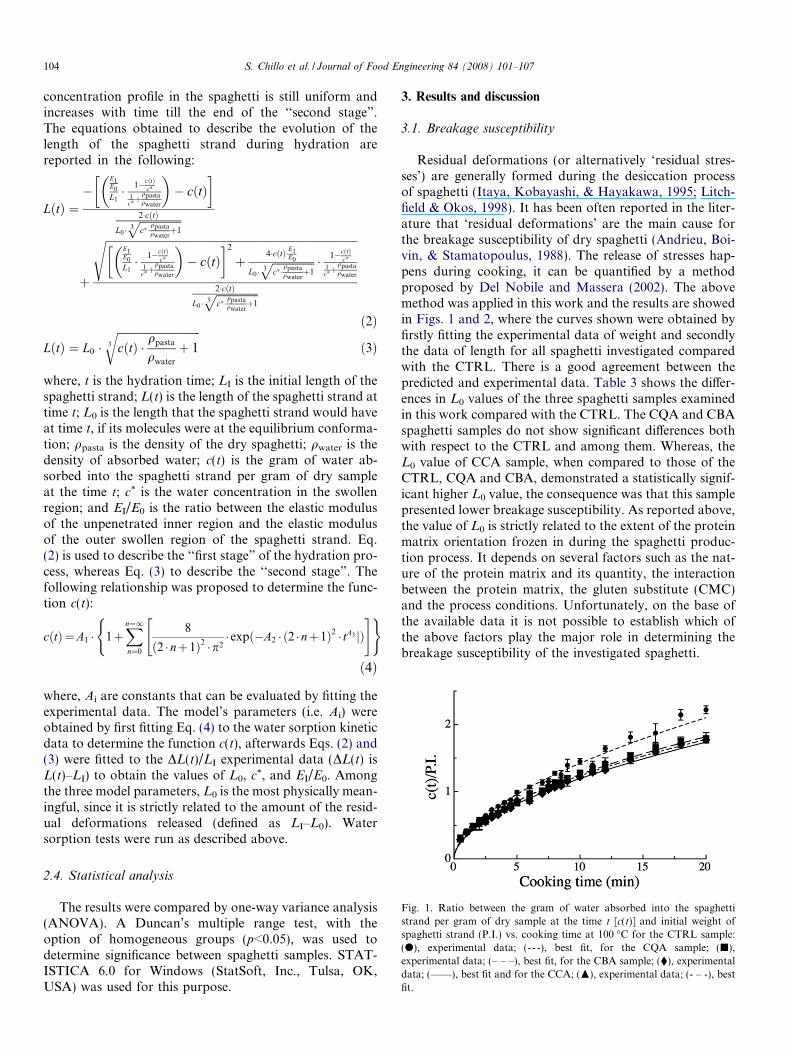
Residual deformations (or alternatively ‘residual stres-ses’) are generally formed during the desiccation processof spaghetti (Itaya, Kobayashi, & Hayakawa, 1995; Litch-field & Okos, 1998). It has been often reported in the liter-ature that ‘residual deformations’ are the main cause forthe breakage susceptibility of dry spaghetti (Andrieu, Boi-vin, & Stamatopoulus, 1988). The release of stresses hap-pens during cooking, it can be quantified by a methodproposed by Del Nobile and Massera (2002). The abovemethod was applied in this work and the results are showedin Figs. 1 and 2, where the curves shown were obtained byfirstly fitting the experimental data of weight and secondlythe data of length for all spaghetti investigated comparedwith the CTRL. There is a good agreement between thepredicted and experimental data. Table 3 shows the differ-ences in L0 values of the three spaghetti samples examinedin this work compared with the CTRL. The CQA and CBAspaghetti samples do not show significant differences bothwith respect to the CTRL and among them. Whereas, theL0 value of CCA sample, when compared to those of theCTRL, CQA and CBA, demonstrated a statistically signif-icant higher L0 value, the consequence was that this samplepresented lower breakage susceptibility. As reported above,the value of L0 is strictly related to the extent of the proteinmatrix orientation frozen in during the spaghetti produc-tion process. It depends on several factors such as the nat-ure of the protein matrix and its quantity, the interactionbetween the protein matrix, the gluten substitute (CMC)and the process conditions. Unfortunately, on the base ofthe available data it is not possible to establish which ofthe above factors play the major role in determining thebreakage susceptibility of the investigated spaghetti.
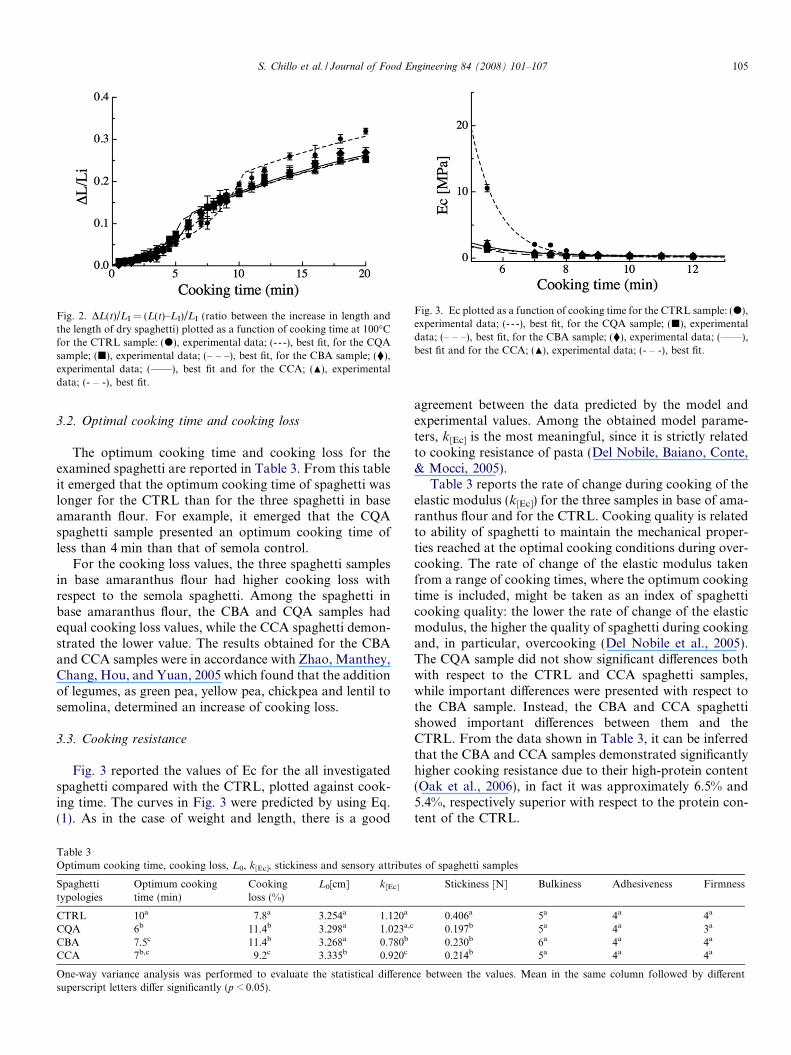
Fig. 2. DL(t)/LI = (L(t)–LI)/LI (ratio between the increase in length andthe length of dry spaghetti) plotted as a function of cooking time at 100�Cfor the CTRL sample: (d), experimental data; (- - -), best fit, for the CQAsample; (j), experimental data; (– – –), best fit, for the CBA sample; (�),experimental data; (——), best fit and for the CCA; (N), experimentaldata; (- – -), best fit.
Fig. 3. Ec plotted as a function of cooking time for the CTRL sample: (d),experimental data; (- - -), best fit, for the CQA sample; (j), experimentaldata; (– – –), best fit, for the CBA sample; (�), experimental data; (——),best fit and for the CCA; (N), experimental data; (- – -), best fit.
S. Chillo et al. / Journal of Food Engineering 84 (2008) 101–107 105
3.2. Optimal cooking time and cooking loss
The optimum cooking time and cooking loss for theexamined spaghetti are reported in Table 3. From this tableit emerged that the optimum cooking time of spaghetti waslonger for the CTRL than for the three spaghetti in baseamaranth flour. For example, it emerged that the CQAspaghetti sample presented an optimum cooking time ofless than 4 min than that of semola control.
For the cooking loss values, the three spaghetti samplesin base amaranthus flour had higher cooking loss withrespect to the semola spaghetti. Among the spaghetti inbase amaranthus flour, the CBA and CQA samples hadequal cooking loss values, while the CCA spaghetti demon-strated the lower value. The results obtained for the CBAand CCA samples were in accordance with Zhao, Manthey,Chang, Hou, and Yuan, 2005 which found that the additionof legumes, as green pea, yellow pea, chickpea and lentil tosemolina, determined an increase of cooking loss.
3.3. Cooking resistance
Fig. 3 reported the values of Ec for the all investigatedspaghetti compared with the CTRL, plotted against cook-ing time. The curves in Fig. 3 were predicted by using Eq.(1). As in the case of weight and length, there is a good
Table 3Optimum cooking time, cooking loss, L0, k[Ec], stickiness and sensory attribut
Spaghettitypologies
Optimum cookingtime (min)
Cookingloss (%)
L0[cm] k[Ec]
CTRL 10a 7.8a 3.254a 1.120a
CQA 6b 11.4b 3.298a 1.023a,c
CBA 7.5c 11.4b 3.268a 0.780b
CCA 7b,c 9.2c 3.335b 0.920c
One-way variance analysis was performed to evaluate the statistical differensuperscript letters differ significantly (p < 0.05).
agreement between the data predicted by the model andexperimental values. Among the obtained model parame-ters, k[Ec] is the most meaningful, since it is strictly relatedto cooking resistance of pasta (Del Nobile, Baiano, Conte,& Mocci, 2005).
Table 3 reports the rate of change during cooking of theelastic modulus (k[Ec]) for the three samples in base of ama-ranthus flour and for the CTRL. Cooking quality is relatedto ability of spaghetti to maintain the mechanical proper-ties reached at the optimal cooking conditions during over-cooking. The rate of change of the elastic modulus takenfrom a range of cooking times, where the optimum cookingtime is included, might be taken as an index of spaghetticooking quality: the lower the rate of change of the elasticmodulus, the higher the quality of spaghetti during cookingand, in particular, overcooking (Del Nobile et al., 2005).The CQA sample did not show significant differences bothwith respect to the CTRL and CCA spaghetti samples,while important differences were presented with respect tothe CBA sample. Instead, the CBA and CCA spaghettishowed important differences between them and theCTRL. From the data shown in Table 3, it can be inferredthat the CBA and CCA samples demonstrated significantlyhigher cooking resistance due to their high-protein content(Oak et al., 2006), in fact it was approximately 6.5% and5.4%, respectively superior with respect to the protein con-tent of the CTRL.
es of spaghetti samples
Stickiness [N] Bulkiness Adhesiveness Firmness
0.406a 5a 4a 4a
0.197b 5a 4a 3a
0.230b 6a 4a 4a
0.214b 5a 4a 4a
ce between the values. Mean in the same column followed by different
106 S. Chillo et al. / Journal of Food Engineering 84 (2008) 101–107
3.4. Instrumental stickiness
Table 3 reports the values of stickiness (N) at a cookingtime of 12 min (overcooking) of the three spaghetti samplescompared with the CTRL. From this table it emerged thatthe three spaghetti in base amaranth flour added with qui-noa, chick pea or broad bean flours presented equal sticki-ness values while they presented visibly lower values withrespect to the semola spaghetti. For example, the CQA sam-ple showed stickiness value of approximately 48% lowerthan that of the CTRL. This is probably due to the high-protein content of non-conventional flours, as reported inTable 2, capable of creating a network that blocks the leak-age of starch. The results obtained are in accordance withSisson, Egan, and Gianibelli (2005), which found that pastastickiness decreased with increasing protein content.
3.5. Sensory analysis
The sensory characteristics of cooked spaghetti deter-mined by a trained panel are reported in Table 2. Fromthe table it emerged that there are not important differencesamong the CTRL and the three spaghetti in base amaran-thus flour with the exception of the bulkiness for the CBAsample that showed a higher value and the firmness for theCQA sample that demonstrated a lower value with respectto the other spaghetti samples. Also, Kovacs, Maraz-Szabo, and Varga (2001) found that pasta in base ama-ranth flour had excellent cooking and sensory properties.
4. Conclusions
The addition of quinoa, chick pea or broad bean flourshas different effects on the quality of the amaranthus spa-ghetti. At dry state, the CCA spaghetti presented a lowerbreakage susceptibility, whereas the CQA and CBA spa-ghetti did not show particular differences with respect tothe CTRL. The cooking loss was higher in the amaranthusspaghetti with respect to the semola spaghetti. However,the cooking resistance of three examined spaghetti wasequal or inferior in spaghetti in base amaranthus flour withrespect to the CTRL, while the instrumental stickiness hasbeen visibly lower. The sensory analysis did not demon-strate relevant differences among the spaghetti samples.
In conclusions, it is possible to assert that, on the whole,the spaghetti of amaranthus wholemeal flour enriched withquinoa, chick pea and broad bean flour demonstrated goodperformances, especially in cooking.
References
Al-Kaisey, M. T., Jaddou, H., Alani, S. R., & Hussain, A. A.-K. (2000).Production of cereal based of powdered baby food. Science Journal
Iraqi Atomic Energy Commission, 2, 149–154.Andrieu, J., Boivin, M., & Stamatopoulus, A. (1988). Heat and mass
transfer modelling during pasta drying. Application to crack formationrisk prediction. In S. Bruin (Ed.), Preconcentration and Drying of Food
Materials (pp. 183–192). Amsterdam: Elsevier Science Publishers B.V.
Antognelli, C. (1980). The manufacture and applications of pasta as afood and as a food ingredient: A review. Journal of Food Technology,
15, 121–145.Bahnassey, Y., & Khan, K. (1986). Fortification of spaghetti with edible
legumes. Rheological, processing and quality evaluation studies.Cereal Chemistry, 63, 216–219.
Bahnassey, Y., Khan, K., & Harrold, R. (1986). Fortification of spaghettiwith edible legumes. Physicochemical, anti-nutritional, amino acid andmineral composition. Cereal Chemistry, 63, 210–215.
Breen, M. D. (1977). Use of various protein sources in pasta. Macaroni
Journal, 58, 26–34.Del Nobile, M. A., & Massera, M. (2002). A method to evaluated the
extent of residual deformations in dry spaghetti. Journal of Food
Engineering, 55, 237–245.Del Nobile, M. A., Baiano, A., Conte, A., & Mocci, G. (2005). Influence
of protein content on spaghetti cooking quality. Journal of Cereal
Science, 41, 347–356.El-Adawy, T. A. (2002). Nutritional composition and antinutritional
factors of chickpeas (Cicer arietinum L.) undergoing different cookingmethods and germination. Plant Foods for Human Nutrition, 57, 83–97.
Escudero, N. L., Albarracin, G., Fernandez, S., De Arellano, L. M., &Mucciarelli, S. (1999). Nutrient and anti-nutrient composition ofAmaranthus muricatus. Plant Foods for Human Nutrition, 54, 327–336.
Gross, R., Koch, F., Malaga, I., De Miranda, A. F., Schoenberger, H., &Trugo, L. C. (1989). Chemical composition and protein quality ofsome local Andean food sources. Food Chemistry, 34(1), 25–34.
Haber, T. A., Seyan, A. A., & Banasik, O. J. (1978). Functional propertiesof some high protein product in pasta. Journal of Agriculture and Food
Chemistry, 26, 1191–1194.Hanna, M. A., Satterlee, L. D., & Thayer, K. W. (1978). Sensory and
selected textural properties of pasta fortified with plant proteins andwhey. Journal of Food Science, 43, 231.
Itaya, Y., Kobayashi, T., & Hayakawa, K. (1995). Three-dimensional heatand moisture transfer with viscoelastic strain–stress formation incomposite food during drying. International Journal of Heat and Mass
Transfer, 385(7), 1173–1185.Kent, N. L., & Evers, A. D. (1994). Technology of cereals (4th ed.).
Oxford: Elsevier Science.Knuckles, B. E., Hudson, C. A., Chiu, M. M., & Sayre, R. N. (1997).
Effect of b-glucan barley fractions in high-fiber bread and pasta. Cereal
Food World, 42(22), 94–99.Kovacs, E. T., Maraz-Szabo, L., & Varga, J. (2001). Examination of the
protein-emulsifier-carbohydrate interactions in amaranth based pastaproducts. Acta Alimentaria, 30(2), 173–187.
Koziol, M. J. (1990a). Afrosimetric estimation of threshold saponinconcentration for bitterness in quinoa. Journal of the Science of Food
and Agriculture, 54, 211–219.Koziol, M. J. (1990b). Composicion quimica. In Wahli, C. (Eds.), Quinua,
hacia su cultivo commercial (pp. 137–159). Latinreco S.A., Casilla 17-110-6053, Quito, Equador.
Koziol, M. J. (1992). Chemical composition and nutritional evaluation ofquinoa (Chenopodium quinoa Willd). Journal of Food and Computa-
tional Analysis, 5, 35–68.Litchfield, J. B., & Okos, M. R. (1998). Prediction of corn kernel stress
and breakage induced by drying, tempering and cooling. Transaction
of the ASEA, 31(2), 585–594.Macarulla, M. T., Medina, C., Aranzazu De Diego, M., Chavarri, M.,
Zulet, A. M., Martınez, J. A., et al. (2001). Effects of the whole seedand a protein isolate of faba bean (Vicia faba) on the cholesterolmetabolism of hypercholesterolaemic rats. British Journal of Nutrition,
85, 607–614.Mahoney, A. W., Lopez, J. G., & Hendricks, D. G. (1975). An evaluation
of the protein quality of quinoa. Journal of Agriculture and Food
Chemistry, 23, 190–193.Manser, J. (1981). Optimale parameter fur die teigwarenherstellung am
Beispiel von Langwaren. Getreide Mehl Brot, 35(3), 75–83.Marconi, E., & Carcea, M. (2001). Pasta from non traditional materials.
Cereal Food World, 46, 522–530.
S. Chillo et al. / Journal of Food Engineering 84 (2008) 101–107 107
Menger, A. (1977). Infuenza della materia prima e del procedimento sullaqualita della pasta alimentare. Tecnica Molitoria, 28.
Nielsen, M. A., Sumner, A. K., & Whalley, L. L. (1980). Fortification ofpasta with pea flour and air-classified pea protein concentrate. Cereal
Chemistry, 57, 203–206.Oak, M. D., Sissons, M., Narelle, E., Tamhankar, S. A., Rao, S., &
Bhosale, S. B. (2006). Relationship between gluten strength and pastafirmness, in Indian durum wheats. International Journal of Food
Science and Technology, 41, 538–544.Olfat, Y. M., Yaseen, A. A. E., & Aziza, I. A. (1993). Enrichment of
macaroni with cellulose-derivative protein complex from whey andcorn steep liquor. Die Nahrung, 37(6), 544–552.
Pagani, M. A., De Noni, I., Resini, P., & Pellegrino, L. (1986).Processing and heat damage of dry pasta. Tecnica Molitoria, 47,345–361.
Perez-Hidalgo, M. A., Guerra-Hernandalez, E., & Garcıa-Villanova, B.(1997). Dietary fiber in three raw legumes and processing effect onchick peas by an enzymatic–gravimetric method. Journal of Food
Composition and Analysis, 10, 66–72.Resmini, P., Volontario, G., Saracchi, S., & Piergiovanni, L. (1975).
Caratteri chimici e nutrizionali di paste alimentari integrate conproteine non convenzionali. Rivista della Societa italiana di scienze
dell’alimentazione, 4, 321–330.Risi, J., & Galwey, N. W. (1984). The Chenopodium grains of the Andes:
Inca crops for modern agriculture. Advances in Applied Biology, 10,145–216.
Ruales, J., & Nair, P. M. (1993). Nutritional quality of the protein inquinoa seeds. Plant Foods for Human Nutrition, 42, 1–11.
Schoppet, E. F., Sinnamon, H. I., Talley, F. B., Panzer, C. C., & Aceto, N.C. (1979). Macaroni enrichment with dairy-based protein sources.Journal of Food Science, 44, 296–297.
Singhal, R. S., & Kulkarni, P. R. (1988). Amaranth: An under-utilisedresource. International Journal of Food Science and Technology, 23,125–139.
Sisson, M. J., Egan, N. E., & Gianibelli, M. C. (2005). New insights intothe role of gluten on durum pasta quality using reconstitution method.Cereal Chemistry, 82(5), 601–608.
Szczesniak, A. S., Brandt, M. A., & Friedman, H. (1963). Development ofstandard rating scales for mechanical parameters of texture andcorrelation between objective and sensory methods of texture evalu-ation. Journal of Food Science, 28, 397–403.
Tosi, E. A., Re, E. D., Masciarelli, R., Sanchez, H., Osella, C., & de laTorre, M. A. (2002). Whole and defatted hyperproteic amaranth flourstested as wheat flour supplementation in mold breads. Lebwenism Wise
u Technology, 35, 472–475.Wood, S. G., Lawson, L. D., Fairbanks, D. J., Robison, L. R., & Andersen,
W. R. (1993). Seed lipid content and fatty acid composition of threequinoa cultivars. Journal of Food and Computational Analysis, 6, 41–44.
Zhao, Y. H., Manthey, F. A., Chang, S. K. C., Hou, H. J., & Yuan, S. H.(2005). Quality characteristics of spaghetti as affected by green andyellow pea, lentil, and chickpea flours. Journal of Food Science, 70,371–376.