Studies on quinoa (Chenopodium quinoa) for novel food and ...
252
UCC Library and UCC researchers have made this item openly available. Please let us know how this has helped you. Thanks! Title Studies on quinoa (Chenopodium quinoa) for novel food and beverage applications Author(s) Mäkinen, Outi Publication date 2014 Original citation Mäkinen, O. 2014. Studies on quinoa (Chenopodium quinoa) for novel food and beverage applications. PhD Thesis, University College Cork. Type of publication Doctoral thesis Rights © 2014, Outi Mӓkinen. http://creativecommons.org/licenses/by-nc-nd/3.0/ Item downloaded from http://hdl.handle.net/10468/2018 Downloaded on 2022-09-14T16:46:04Z
-
Upload
khangminh22 -
Category
Documents
-
view
1 -
download
0
Transcript of Studies on quinoa (Chenopodium quinoa) for novel food and ...

UCC Library and UCC researchers have made this item openly available.Please let us know how this has helped you. Thanks!
Title Studies on quinoa (Chenopodium quinoa) for novel food and beverageapplications
Author(s) Mäkinen, Outi
Publication date 2014
Original citation Mäkinen, O. 2014. Studies on quinoa (Chenopodium quinoa) for novelfood and beverage applications. PhD Thesis, University College Cork.
Type of publication Doctoral thesis
Rights © 2014, Outi Mӓkinen.http://creativecommons.org/licenses/by-nc-nd/3.0/
Item downloadedfrom
http://hdl.handle.net/10468/2018
Downloaded on 2022-09-14T16:46:04Z

i
Ollscoil na hÉireann THE NATIONAL UNIVERSITY OF IRELAND
Coláiste na hOllscoile, Corcaigh UNIVERSITY COLLEGE, CORK
SCHOOL OF FOOD AND NUTRITIONAL SCIENCES
STUDIES ON QUINOA (CHENOPODIUM QUINOA) FOR NOVEL
FOOD AND BEVERAGE APPLICATIONS
Thesis presented by
Outi Mäkinen
M.Sc. Cereal Technology (University of Helsinki)
B.Sc. Food Technology (University of Helsinki)
For the degree of
Doctor of Philosophy (PhD, Food Science and Technology)
Under the supervision of
Prof. DSc. Dr. Elke K. Arendt
May 2014

ii
Table of Contents
Chapter Page
1. Introduction
1
2. Literature review: Quinoa – Composition, applications and
potential future uses
6
3. Objectives
89
4. Amylolytic activities and starch reserve mobilization during
the germination and early seedling establishment in
Chenopodium quinoa
91
5. Localisation and development of proteolytic activities in
germinating quinoa (Chenopodium quinoa) seeds
110
6. Germination of oat and quinoa and evaluation of the malts as
gluten free baking ingredients
131
7. Physicochemical and acid gelation properties of commercial
UHT-treated plant-based milk substitutes and lactose free
bovine milk
151
8. Functional and acid gelation properties of quinoa protein
isolate: influence of heat-denaturation pH
184
9. Heat-denaturation and aggregation of quinoa (Chenopodium
quinoa) globulins: influence of pH
209
10. General discussion
232
11. Appendix 243

iii
Abstract
Quinoa (Chenopodium quinoa) is a seed crop native to the Andes, that can be
used in a variety of food product in a similar manner to cereals. Unlike most plants,
quinoa contains protein with a balanced amino acid profile. This makes it an
interesting raw material for e.g. dairy product substitutes, a growing market in
Europe and U.S. Quinoa can however have unpleasant off-flavours when processed
into formulated products. One means of improving the palatability is seed
germination. Also, the increased activities of hydrolytic enzymes can have a
beneficial influence in food processing. In this thesis, the germination pattern of
quinoa was studied, and the influence of quinoa malt was evaluated in a model
product. Additionally, to explore its potential for dairy-type products, quinoa protein
was isolated from an embryo-enriched milling fraction of non-germinated quinoa and
tested for functional and gelation properties. Quinoa seeds imbibed water very
rapidly, and most seeds showed radicle protrusion after 8-9 h. The α-amylase activity
was very low, and started to increase only after 24 hours of germination in the
starchy perisperm. Proteolytic activity was very high in dry ungerminated seeds, and
increased slightly over 24 h. A significant fraction of this activity was located in the
micropylar endosperm. The incorporation of germinated quinoa in gluten-free bread
had no significant effect on the baking properties due to low α-amylase activity.
Upon acidification with glucono-δ-lactone, quinoa milk formed a structured
gel. The gelation behaviour was further studied using a quinoa protein isolate (QPI)
extracted from an embryo-enriched milling fraction. QPI required a heat-
denaturation step to form gel structures. The heating pH influenced the properties
drastically: heating at pH 10.5 led to a dramatic increase in solubility, emulsifying
properties, and a formation of a fine-structured gel with a high storage modulus (G')
when acidified. Heating at pH 8.5 varied very little from the unheated protein in
terms of functional properties, and only formed a randomly aggregated coagulum
with a low G'. Further study of changes over the course of heating showed that the
mechanism of heat-denaturation and aggregation indeed varied largely depending on
pH. The large difference in gelation behaviour may be related to the nature of
aggregates formed during heating. To conclude, germination for increased enzyme
activities may not be feasible, but the structure-forming properties of quinoa protein
could possibly be exploited in dairy-type products.

iv
Acknowledgements
I would like to express the deepest appreciation to my supervisor Prof. Elke
Arendt for her guidance during my PhD years. You taught me how stuff works. I am
also grateful to Prof. Peter Koehler for letting me visit his lab, and teaching me the
nuances of protein extraction, Dr. James O’Mahony for his dairy protein insight, and
Dr. Thérèse Uniacke-Lowe for teaching me some of the wonders of dairy research
and gel electrophoresis.
Sincerest thanks to Dr. Deborah Waters and Dr. Emanuele Zannini for being
my post docs, mentors and dear friends.
Dr. Anna-Sophie Hager for her friendship and some good nerd times. I will
never forget our nightly sessions dissecting quinoa seeds while sick as dogs.
Thank you to Tom Hannon, the keeper of the baking realm, Jim McNamara
for always making things work, Maurice Conway for keeping us stocked on useful
things (may the greens be green this summer), and Dave Waldron for his valuable
help with beverage processing (I’m sorry for the quinoa stink).
Dr. Tuula Sontag-Strohm for teaching me scientific and critical thinking from
the moment I set my foot in the Cereal Technology Group in the University of
Helsinki for my M.Sc. studies.
My dear colleagues and friends, Anika, Lorenzo, Sandra, Erica, Stefan, Alice,
Pedro, Markus, Claudia, Birgit and everyone who passed through in the last 3.5
years. All my students. Natasha who dragged me in the gym, sometimes against my
will. “Suck it up, buttercup”. Thank you Dave, Deirdre, Lisa, Matthew, Graham,
Adriaan and the rest of the UCC Olympic lifting club posse for making me achieve
things I never thought I would.
Last but most definitely not least, I would like to express my deepest
gratitude to my parents and the rest of the family who always emphasised the
importance of education. It is not the tiniest bit exaggerated to say this thesis
wouldn’t exist without some “parental guidance” throughout my (numerous) years in
education. A massive thank you to Kristiina, Seppo, Erik, Marja, Leevi, Max and
Ilkka.

v
Declaration
I hereby declare that this thesis is my own work and effort and that it has not been submitted
anywhere for any degree. Where other sources of information have been used, they have
been acknowledged.
Signature:
Date: 09/05/2014

vi
“Men love to wonder, and that is the seed of science.” – Ralph Waldo Emerson
“Education is a girl’s best friend.” - Mum

Chapter 1
1
Chapter 1
Introduction
Chapter 1
2
Introduction
Plants are a significant food source for humans, but most plant proteins are
used as animal feed to produce milk, eggs and meat. The conversion from plant to
animal protein is very inefficient, and as much as 85% is lost, which is problematic
as the growing world population is increasingly pushing the “planetary boundaries”
(Aiking, 2011; Day, 2013). The environmental impacts related to both meat and
dairy production include loss of biodiversity, the disruption of nitrogen and carbon
cycles, changes in land use and diminishing freshwater reserves (Aiking, 2011;
Goodland and Anhang, 2009). Increasing the utilisation of plant proteins in the
human diet would reduce these adverse influences (Day, 2013). Possible approaches
include plant protein based meat and dairy analogues and an increased use of protein-
rich legumes and grains (Goodland and Anhang, 2009).
Plant proteins have generally a poorer nutritional value than animal-derived
proteins. They have a lower digestibility, and are deficient in one or more amino
acids, e.g. lysine in cereals and sulphur amino acids in legumes (Friedman, 1996).
Quinoa seed protein is high in lysine and sulphur amino acids and thus has a high
biological value (Abugoch, 2009; Ranhotra et al., 1992). Although not a protein crop
as such, quinoa can have a higher protein content (12-23%) than other grains, but the
range is wide (Abugoch, 2009). Quinoa seeds also have other desirable nutritional
properties, e.g. higher levels of minerals and vitamins than conventional cereals
(Repo-Carrasco et al., 2003). Quinoa is native to the Andes but can be adapted to
very different environmental conditions due to its wide genetic variability (Jacobsen
et al., 2003). It can thus be cultivated in various parts of the world, including Europe,

Chapter 1
3
North America, North Africa and China (Hirich et al., 2014; Jacobsen et al., 2003;
Zurita-Silva et al., 2014).
Quinoa can be processed into a variety of products, e.g. gluten-free baked
goods, weaning formulae and pasta (Repo-Carrasco et al., 2003). Some studies have
however reported grassy and bitter off-flavours that limit the level of quinoa in a
product (Lorenz and Coulter, 1991; Schonlechner et al., 2006). Germination can be
used to improve the palatability of grains (Kaukovirta-Norja et al., 2004). In
addition, the enzyme activities that arise during germination of seeds can have
desired functionalities cereal and pseudocereal-based foods. Studies on the
germination of quinoa in terms of food applications are however scarce (Atwell et
al., 1988; Park, 2005; Zarnkow et al., 2007).
Increasing the know-how in the processing of novel plant protein based foods
is fundamental for the development of desirable products, as there is much room for
growth in the sales (Goodland and Anhang, 2009). These products include plant-
based dairy substitutes, such as “plant milk” and its derivatives e.g. fermented
yoghurt type products, that are a growing market as a part of the “free from” trend
(Letherhead, 2011). Because of the high nutritional quality of quinoa protein, the
formulation of these products could potentially be feasible.

Chapter 1
4
References
Abugoch James, L., E., 2009. Quinoa (Chenopodium quinoa Willd.): Composition,
chemistry, nutritional, and functional properties. Adv. Food Nutr. Res. 58, 1–31.
Aiking, H., 2011. Future protein supply. Trends Food Sci. Technol. 22, 112–120.
Atwell, W.A., Hyldon, R.G., Godfrey, P.D., 1988. Germinated quinoa flour to reduce
the viscosity of starchy foods. Cereal Chem. 65, 508–509.
Day, L., 2013. Proteins from land plants – Potential resources for human nutrition
and food security. Trends Food Sci. Technol. 32, 25–42.
Friedman, M., 1996. Nutritional value of proteins from different food Sources. A
review. J. Agric. Food Chem. 44, 6–29.
Goodland, R., Anhang, J., 2009. Livestock and climate change. What if the key
actors in climate change were pigs, chickens and cows? Worldwatch Institute,
Washington DC. 10–19.
Hirich, A., Choukr-Allah, R., Jacobsen, S.-E., 2014. Quinoa in Morocco - Effect of
sowing dates on development and yield. J. Agron. Crop Sci. 200, 371–377.
Jacobsen, S.E., Mujica, A., Ortiz, R., 2003. The global potential for quinoa and other
Andean crops. Food Rev. Int. 19, 139–148.
Kaukovirta-Norja, A., Wilhelmson, A., Poutanen, K., 2004. Germination: a means to
improve the functionality of oat. Agric. Food Sci. 13, 100-112.
Lorenz, K., Coulter, L., 1991. Quinoa flour in baked products. Plant Foods Hum.
Nutr. 41, 213–223.
Park, S.H., 2005. Dough and breadmaking properties of wheat flour substituted by
10% with germinated quinoa flour. Food Sci. Technol. Int. 11, 471–476.
Ranhotra, G.S., Gelroth, J.A., Glaser, B.K., Lorenz, K.J., Johnson, D.L., 1992.
Composition and protein nutritional quality of quinoa. Cereal Chem. 70,
303−305.
Repo-Carrasco, R., Espinoza, C., Jacobsen, S.-E., 2003. Nutritional value and use of
the Andean crops Quinoa (Chenopodium quinoa) and Kañiwa (Chenopodium
pallidicaule). Food Rev. Int. 19, 179–189.
Leatherhead Food Research, 2011. Food Allergies and Intolerances: Consumer
Perceptions and Market Opportunities for “Free From” Foods, Leatherhead
Food International, Surrey, UK.

Chapter 1
5
Schonlechner, R., Linsberger, G., Kaczyk, L., Berghofer, E., 2006. Herstellung von
glutenfreien Keksen aus den Pseudo-cerealien Amaranth, Quinoa und
Buchweizen mit Gartenbohnen. Ernähr/Nutr 30, 101–107
Zarnkow, M., Geyer, T., Lindemann, B., Burberg, F., Back, W., Arendt, E.K.,
Kreisz, S., 2007. The use of response surface methodology to optimise malting
conditions of quinoa (Chenopodium quinoa) as a raw material for gluten-free
foods and beverages. Monatsschrift für Brauwiss. 60, 118–126.
Zurita-Silva, A., Fuentes, F., Zamora, P., Jacobsen, S.-E., Schwember, A.R., 2014.
Breeding quinoa (Chenopodium quinoa Willd.): potential and perspectives. Mol.
Breed. 34, 13–30.

Chapter 2
6
Chapter 2
Quinoa: composition, applications and potential future uses
Published as:
Mäkinen, O.E., Wanhalinna, V., Zannini, E. and Arendt, E. 2014. Foods for special
dietary needs: Non-dairy plant based milk substitutes and fermented dairy type
products. Critical Reviews in Food Science and Nutrition, in press.
Mäkinen, O.E, Arendt, E.K. Non-brewing applications of malted cereals,
pseudocereals and legumes – A review. Journal of the American Society of Brewing
Chemists. Under review.

Chapter 2
7
1. Introduction
Seeds are a major food staple for the mankind, mainly those of cereals and
legumes (Bewley and Black, 1994a). The cultivation of the first domesticated grains
during the Neolithic Revolution, wheat and barley in the Fertile Crescent and rice in
China for example, was the basis of early agriculture that led to the rise of
civilisation. The intensified food production lead to a radical transformation from
nomadic hunter-gatherers to agricultural societies, and the subsequent development
of literature, science and technology (Li et al., 2007; Prakash, 2001). In addition to
being of high importance for our past and present day nutrition, seeds are a vital part
of plant reproduction as the propagation and dispersion units of Spermatophytes,
seed producing plants. As plants are attached to their place of growth, seeds provide
them a way to travel through space and time. Potentially a lot of time: the oldest
viable seed known to mankind has been dated back 32 000 years (Yashina et al.,
2012). The seeds of angiosperms are essentially an embryo and food reserves trapped
in one or more protective layers. They vary in structure and patterns of reserve
deposition and mobilisation. For example, cereal grains consist largely of a central
endosperm with starch and protein storage. The embryo is a thin and flattened tissue
nearly absent of storage reserves. In legumes on the other hand, the cotyledons act as
storage tissues, making up nearly all of the seed mass (Bewley and Black, 1994a).
Out of about 250 000 identified plants found in the world 30 000 are edible,
but only 30 species “feed the world”. Wheat, maize and rice alone provide 50% of
the world’s calories (FAO, 1998). There is however an increasing interest in so-
called minor crops, as they may promote sustainability and agrodiversity in farming
systems (Williams and Haq, 2002). Also consumer interest has increased as these
crops are often perceived as healthy by the Western consumer, and minor seed crops

Chapter 2
8
can be devoid of peptides that can not be tolerated by individuals suffering from the
coeliac disease (Bergamo et al., 2011).
One such crop, quinoa, was the most important seed crop in in South America
in the pre-Columbian times. It was of such importance to Inca people that it was
considered sacred and called the “mother grain” in the Quechua language. After the
Spanish conquest (1532 A.D.) the use of quinoa nearly vanished and remained the
food of Quechua and Aymara people in rural mountain areas (Abugoch, 2009).
Quinoa seeds have desirable nutritional properties, with considerably higher levels of
minerals and some vitamins than conventional cereals, as well as high-lysine protein
with good digestibility (Ranhotra et al., 1992; Repo-Carrasco et al., 2003). Quinoa
also has a wide genetic variability and can thus be adapted to very different
environmental conditions, including European countries (Jacobsen et al., 2003). Due
to these factors, FAO has declared it as “one of humanity’s most promising crops”,
and it has been considered as a potential crop for NASA’s Controlled Ecological Life
Support System (CELSS) (FAO, 2011; Schlick and Bubenheim, 1996).
Quinoa has been used for a variety of products, including gluten-free baked
goods, pasta, infant food, extrudates and other processed foods (Repo-Carrasco et al.,
2003). The limiting factor in its incorporation in products is the grassy and bitter
aftertaste it causes when used at higher levels, as has been reported by some authors
(Lorenz and Coulter, 1991; Schonlechner et al., 2006). A way to improve the
palatability and also nutritional properties of grains is germination (Kaukovirta-Norja
et al., 2004). In addition, the enzyme activities formed during germination can have
the potential to modify the properties of cereal and pseudocereal-based foods. The
germination of quinoa has however mainly been studied from the agronomical
perspective (Hariadi et al., 2011; Rosa et al., 2009), and work related to food uses is

Chapter 2
9
limited to a few publications (Atwell et al., 1988; Park, 2005; Valencia et al., 1999;
Zarnkow et al., 2007).
Another potential area of application for quinoa which has received little
research interest is plant-based dairy substitute products. This product segment is
growing as a part of the “free from” trend, but yet scientific literature on systems
other than soy is hard to find. These products include plant milks, water extracts of
seeds that resemble cow’s milk in appearance, and their derivatives, such as
fermented yoghurt-type products and cream substitutes. Because of the high
nutritional quality of quinoa protein, the formulation of these products could
potentially be feasible. This review aims to give an overview about quinoa, its
composition and current and potential uses in the food and beverage industry, for
example plant-based dairy substitute products.
2. Quinoa
Quinoa (Chenopodium quinoa) is a dicotyledonous plant native to the
Andean highland region in South America. It grows 1-3 m tall, and produces starchy
seeds that have a composition similar to cereal grains (Table 2.1) (Galwey, 1995;
Jacobsen et al., 2003). Quinoa is a domesticated species, and has been cultivated in
the Andes for more than 5000 years. Its edible relatives include C. pallidicaule,
“kañiwa” and C. berlandieri subsp. nuttalliae, “huahzontli”, that are used as grains
and vegetables, and C. album, “lambs quarter”, a weed that has been used for food in
prehistoric Europe (Bazile et al., 2013; Heiser and Nelson, 1974).
Quinoa has a wide genetic variability, with cultivars adapted to very different
environmental conditions ranging from a cold highland climate to subtropical
conditions (Jacobsen, 2003). Some cultivars also show good tolerance for adverse

Chapter 2
10
conditions including drought, frost, soil salinity and hale (Bonifacio, 2003; Jacobsen,
2003). Because of its adaptability, quinoa has a potential for cultivation outside the
Andean region. In the past decades, field trials have been conducted in various
European countries, Kenya, United States and Asia, and it is grown commercially in
at least France and Finland at the time of writing (Abbottagra, 2013; Jacobsen, 2003;
Vähämäki and Kasvinen, 2013).
Table 2.1. Chemical composition of quinoa and some cereals (oat and wheat), and
oil seeds (soy and linseed); g per 100 g dry weight (dw), n.r. = not reported.
Component Quinoa a Oat
b Wheat
a Soy
c Linseed
d
Carbohydrate 72.6 69.8 78.6 n.r. 6.2
Protein 14.4 11.6 10.5 42.3 26.4
Fat 6.0 5.2 2.6 19.8 24.6
Fibre 4.0 10.4 2.5 11.5 33.0
Ash 2.9 2.9 1.8 5.2 3.2
Adapted from: a Repo-Carrasco et al., 2003;
b Valentine et al., 2011;
c Grieshop and Fahey,
2001; d Giacomino et al., 2013;
Quinoa seeds are disc-shaped and usually 1.4-1.6 mm in diameter (Abugoch
James, L., 2009). The hulls can have a variety of colours ranging from white to
orange, and pink to black (Figure 2.1), but the seed can exists in three colours; white,
brown (“red”) and black (Jacobsen, S-E., personal communication Sep. 12th
, 2014).
The pigments responsible for the orange-red and red-purple are betalains, found in
only species in the Caryophyllales order in which they replace the more common
anthocyanins (Brockington et al., 2011; Wohlpart and Mabry, 1968).

Chapter 2
11
Quinoa seeds are perispermic: they consist of a central perisperm that is
surrounded by a peripheral embryo (Figure 2.2). The endosperm is a 1-2 cell layer
thick cap covering the micropyle. The storage reserves are strictly compartmentalised
(Prego et al., 1998). The central perisperm acts as a starch storage, while lipid and
protein bodies are found in the embryonic tissues and endosperm. Seeds with a
similar structure and storage reserve compartmentalisation include grain amaranth
(Amaranthus cruentus) and sugar beet (Beta vulgaris).
Figure 2.1. Colour variation of quinoa seeds (Hermann, 2014).
Figure 2.2. Quinoa seed structure showing (Adapted from Prego et al. 1998).
P - perisperm
R – radicle
H – hypocotyl
C – cotyledons
EN – endosperm cap
SC – seed coat

Chapter 2
12
2.1. Chemical and nutritional properties of quinoa constituents
2.1.1. Carbohydrates
Starch is the main storage reserve in most seeds that are cultivated as food,
including quinoa (Bewley and Black, 1994a; Prego et al., 1998). It is found
exclusively in the central perisperm at a content of 58-64% of the seed weight (Prego
et al., 1998; Repo-Carrasco et al., 2003). Starch is a polymer consisting of α-1,4-
linked glucose units that exists in two forms: the linear amylose and branched
amylopectin. In amylopectin, blocks of α-1,4-linked glucose units are attached by α-
1,6-linkages, forming a ramified, very large macromolecule (Zobel and Stephen,
2010). In plants, starch is laid down as complicated granular structures (Buléon et al.,
1998). Starch granules consist of amylose and amylopectin in crystalline and
amorphous states, and vary largely in size and shape among plant species.
Quinoa starch granules are very small, ranging from 0.6 to 2.0 µm in
diameter, and they are found as individual or spherical/oblong compound granules in
perisperm cells (Figure 2.3) (Lorenz, 1990). The amylose content ranges from 3 to
20%, which is lower than in most other species (Lindeboom et al., 2005). Quinoa
amylopectin has low average degree of polymerisation, but is highly branched (Tang,
2002). The physicochemical properties of quinoa starches vary widely (Lindeboom
et al., 2005). Thermal properties, such as starch paste peak viscosity and
gelatinisation onset and peak temperatures, as well as the tendency for
retrogradation, are correlated with the amylose content (Lindeboom et al., 2005).
According to data based on eight quinoa varieties, the onset and peak gelatinisation
temperatures vary between 44.6 to 53.7°C and 50.5-61.7°C, respectively, because of
different amylose contents (Lindeboom et al., 2005). These temperatures are lower
than in many common food crops (Singh et al., 2003; Wolter et al., 2013). Quinoa

Chapter 2
13
starch has been reported to have excellent freeze-thaw stability (Ahamed, 1996), but
a later study found that it varies between cultivars and is generally linked to low
amylose content as a result of decreased tendency to retrogradation (Ahamed, 1996;
Lindeboom et al., 2005).
The digestibility of starch is characterised by the degree of digestion and
absorption, that depends on e.g. starch characteristics and processing techniques used
(Hager et al., 2013; Singh et al., 2010). Glycemic index (GI) relates the glycemic
response of a food to a reference food such as glucose or white bread (Singh et al.,
2010). Ruales and Nair (1994) studied the digestibility of quinoa starch. The
obtained a value of 72% for raw, untreated quinoa starch. Pre-cooking increased the
digestibility slightly to 77% (Ruales and Nair, 1994). The in vitro GI of quinoa bread
is 95, which is nearly as high as that of wheat bread (Wolter et al. 2013). Other
gluten free breads had much lower values, ranging from 69 to 80. Quinoa starch has
very small granules, which was suggested to cause the high glycaemic index (Wolter
et al. 2013).
Figure 2.3. Individual and compound starch granules in quinoa perisperm at
magnification 2000x (a) and 5000 (b).
b. a.

Chapter 2
14
Dry seeds contain small quantities of sugars as energy reserves during the
early stages of germination (Bewley and Black, 1994b). Quinoa contains 1.7%
glucose, 2.9% sucrose and 1.4% maltose, which is higher than the contents in
common grains (Repo-Carrasco et al., 2003). The high content of sugars may be
related to the frost resistance mechanism of quinoa. Dissolved sugars act as “anti-
freeze” and lower the freezing point of water to prevent ice formation in the tissues
(Jacobsen et al., 2007).
Dietary fibre is collective term for polysaccharides that are resistant to
digestion and absorption in the human small intestine, including non-starch plant
polysaccharides, resistant starch and oligosaccharides, and lignin. They thus enter the
large intestine undigested, where they can be fully or partially degraded by gut
microbes (Buttriss and Stokes, 2008; Lattimer and Haub, 2010). High fibre intake
has been linked to reduced risks in e.g. coronary heart disease, certain cancers,
obesity and diabetes by various mechanisms (Buttriss and Stokes, 2008). Fibres are
commonly categorised as soluble or insoluble based on their water-solubility, the
former being fermented in the colon. However, research has shown that neither of
these groups completely fit in these categories and solubility does not predict the
physiological effect, e.g., some insoluble fibres are also fermented (Buttriss and
Stikes, 2008). Still, the physiological properties vary between different fibre forms,
e.g., only highly viscous, soluble fibres lower cholesterol (Buttriss and Stokes, 2008).
Reported values for the fibre content of quinoa range from 4% to 14.4% (Alvarez-
Jubete et al., 2009; Hager et al., 2012b; Repo-Carrasco et al., 2003). Of the total
fibre, 25% is soluble (Hager et al., 2012b). More detailed compositional
characterisation of the fibre fraction is still missing, but (Cordeiro et al., 2012)
isolated a linear (1→5)-linked arabinan, and a rhamnogalacturonan I type branched

Chapter 2
15
polysaccharide from quinoa seeds. These polysaccharides also showed
gastroprotective activity in rats with ethanol-induced gastric lesions (Cordeiro et al.,
2012).
2.1.2. Protein
Seed storage proteins act as a nitrogen, carbon and sulphur source for the
developing plantlet (Shewry, 1999). In seed protein research, the early Osborne
classification based on solubility is still used: albumins are soluble in water,
globulins in saline, prolamins in 60-70% alcohol and glutelins insoluble in neutral
aqueous solvents and alcohol, but can be extracted in alkali (Shewry, 1999). Storage
proteins are found in all Osborne fractions. Globulins and to some extent albumins
make up the main storage proteins in most dicotyledonous seeds, while cereal
proteins are mostly prolamins (Shewry, 1999). Quinoa has a slightly higher protein
content than common food grains, with literature values ranging from 12% to 24%
(Abugoch, 2009; Repo-Carrasco et al., 2003). The major storage proteins are a
legumin type (11S) globulin named chenopodin (37% of total protein) obtained from
the salt-soluble protein fraction by isoelectric precipitation, and a 2S type protein
(35% of total protein), that is the residual protein in the salt-soluble fraction after the
removal of chenopodin, collected by ammonium sulphate precipitation (Brinegar and
Goundan, 1993; Brinegar et al., 1996).
The 11S globulins are hexameric, and consists of six subunits with molecular
weight of 50-57 kDa (Casey, 1999). Each subunit consisting of an acidic (~30-39
kDa) and a basic (~20-27 kDa) polypeptide, that are linked by a disulphide bond. The
subunits are synthesised as a single entities that then assemble into trimers in the
endoplasmatic reticulum. The mature trimers are then stacked face-to-face to form a

Chapter 2
16
hexamer, leaving the side with a higher number of hydrophobic residues buried
inside the molecule (Figure 2.4 a) (Adachi et al., 2003, 2001). The tertiary structure
of the protein is very sensitive to even small shifts in pH and ionic strength, that alter
the association/dissociation behaviour of the subunits (Marcone, 1999). For
example, the 11S globulin from sunflower seeds (Helianthus annuus) exists as a
hexamer at pH 6-9, but dissociates into trimers at higher pH and monomers at very
low pH (Figure 2.4 b).
Figure 2.4. (a) Diagrams of the hydrophobic surface of the two faces of the soy
proglycinin trimer. Hydrophobic amino acid residues are shown in green (Adachi et
al., 2001). (b) The oligomeric state of the 11S globulin from sunflower seeds at
varying pH (Molina et al., 2004).
Generally, 2S storage proteins are found in the water-soluble protein fraction
and are thus called 2S albumins. These proteins are heterodimers of a 30-40 residue
and a 60-90 residue subunit connected by two disulphide bonds. They are highly
polymorphic, and the structures and properties can show large variation between
cultivars and species. The cysteine and methionine contents are usually high, but can
also vary widely between species (Shewry and Pandya, 1999). In contrast, the 2S
protein reported in quinoa is salt-soluble. It consists of polypeptides of 8-9 kDa, and
possibly smaller subunits but those could not be detected in the study. Quinoa 2S
protein is high in cysteine (15.6 mol%) but low in methionine (0.6 mol%) (Brinegar
et al., 1996).
A

Chapter 2
17
The nutritional value of protein depends on their amino acid composition, the
ratios of essential amino acids and physiological utilisation (Friedman, 1996). The
most abundant amino acids in quinoa protein are glutamic acid, aspartic acid,
arginine and leucine in descending order (Abugoch, 2009). Essential amino acids
cannot be synthesises de novo, and hence they have to be supplied in foods. Table
2.2 shows the essential amino acid profiles of quinoa, some cereals and oil seeds, and
milk. FAO amino acid scoring pattern used for the evaluation of protein quality are
shown for comparison. This scoring pattern expresses the amino acid composition of
an “ideal” protein, against which other proteins are evaluated. Quinoa protein is
especially high in lysine (6.0 g/100 g protein), the limiting amino acid in most cereal
grains (Friedman, 1996). The lysine content is nearly as high as that of soy bean (6.3
g/100 g protein), and the quantity of sulphur amino acids (methionine and cysteine)
is nearly twice as high. Quinoa protein meets the FAO values for both infants and
adults, expect for histidine (Table 2.2).
The physiological utilisation of proteins, namely their digestibility, is
generally lower for plant proteins (Friedman, 1996). Several methods of evaluating
the protein quality exist. These include the protein efficiency ratio (PER) that is
based on the weight gain of an experimental animal, and amino acid chemical score

Chapter 2
18
Table 2.2. Essential amino acids in quinoa and other foods (g/100 g protein)
Amino acid Quinoaa Oat
b Linseed
c Wheat
a Soy
d Milk
protein e
FAO*
infant
FAO*
adult
Histidine 3.2 2.2 2.4 2.0 2.6 3.2 2.0 1.5
Isoleucine 4.9 3.9 3.9 4.3 4.9 5.0 3.2 3.0
Leucine 6.6 7.4 5.7 6.7 8.2 9.4 6.6 5.9
Lysine 6.0 4.2 3.8 2.8 6.3 7.6 5.7 4.5
Threonine 3.7 3.3 4.1 2.9 3.7 4.0 3.1 2.3
Tryptophan 0.9 n.r. 1.5 1.2 1.3 n.r. 0.85 0.6
Valine 4.5 5.3 4.8 4.6 5.1 6.2 4.3 3.9
SAA § 4.8 4.1 2.6 3.5 2.6 3.5 2.7 2.2
AAA ǂ 6.2 8.4 7.1 8.6 9.1 10.2 5.2 3.8
Adapted from: a Repo-Carrasco et al., 2003;
b Pomeranz et al., 1971;
c Giacomino et al., 2013;
d Hughes et al., 2011;
e Rutherfurd and Moughan, 1998;
* FAO amino acid scoring pattern requirements (g/100 g protein). Infant 0.5 years; adult >18 years. (FAO, 2011)
§ SAA: Sulphur amino acids (methionine + cysteine)
ǂ AAA: Aromatic amino acids (phenylalanine + tyrosine)

Chapter 2
19
based on comparison to a reference protein (Friedman, 1996). The method currently
preferred by WHO/FAO is the protein digestibility-corrected amino score
(PDCAAS), which compares the concentration of the first limiting amino acid to a
reference pattern (child 2-5 years), that is corrected for the digestibility (Schaafsma,
2000). Table 2.3 lists the PDCAAS and PER values of some plant proteins and cow’s
milk. The PDCAAS of quinoa has been reported by Ruales et al. (2002) with a value
on 67.7%. This is higher than the values for cereals, but notably lower than milk and
soy proteins. The PER value is 2.7, which is higher than that of soy protein, and
slightly higher than for casein used as reference in the study (Ranhotra et al., 1992).
Ruales et al. (1994) reported significantly lower values for in vitro digestibility for
raw quinoa when compared to casein. Also, the removal of saponins, bitter
compounds covering unprocessed quinoa seeds, improved the protein digestibility.
2.1.3. Lipids
Seeds contain varying amounts of lipids used as food reserves during
germination. These are laid down in subcellular organelles called lipid or oil bodies,
that range from 0.2 to 0.6 µm in diameter (Bewley and Black, 1994a). Quinoa has a
lipid content of 5-6%, which is fairly high compared to most cereals but too low for
it to have value as an oil seed (Repo-Carrasco et al., 2003; Wood et al., 1993). The
lipids in the quinoa seeds including hulls consist of 56% of neutral and 25% of polar
lipid, and 19% of free fatty acids (Przybylski et al., 1994). In bran (embryo) and flour
(perisperm), most of the neutral lipids are triglycerides (82-87%), the second
major group being diglycerides (10-13%). In the polar lipid fraction, the most
abundant phospholipid was

Chapter 2
20
Table 2.3. Protein efficiency ratio (PER) and protein digestibility corrected amino
acid score (PDCAAS) values of some plant protein compared to cow’s milk in
descending order. Values in italics indicates heat-treatment.
PDCAAS (%) * PER
Cow’s milk a 120 3.1
Soy 91 a; 93
b 0.46
c; 2.28
c
Quinoa 67.7 d, §
2.7 e
Amaranth f 63; 83
g, ǂ 1.9 ; 2.6
Hemp h 63-66 -
Oat 45-51 j; 60
b 2.3
i
Rice 54 b 2.0
k
Wheat a 42; 37
b 1.5
Linseed l 64 -
Almond m
30 -
Adapted from: a Schaafsma, 2000;
b Michaelsen et al., 2009;
c Friedman et al., 1991;
d Ruales
et al., 2002; e Ranhotra et al., 1993;
f Garcia et al., 1987;
g Escudero et al., 2004;
h House et
al., 2010; i Hischke et al., 1968;
j Pedo et al., 1999;
k Juliano et al., 1971;
l Giacomino 2013;
m Ahrens et al., 2005
* Nontruncated values
§ Value from weaning food formula
ǂ Value from protein concentrate
lysophosphatidyl ethanolamide in the hulls, but phosphatidyl choline in bran and
flour fractions (Przybylski et al., 1994). The fatty acids in the total lipids consist
~85% of unsaturated and 11% saturated fatty acids (Wood et al., 1993). The most
abundant fatty acid is linoleic acid at 52.3%, followed by oleic acid at 31.6% (Table
2.4). Quinoa fat is slightly higher in α-linoleic acid, an essential omega 3 fatty acid,
than oat and soy oils. The content is however significantly lower than in flax seeds.
Overall, the fatty acid profile of quinoa is similar to that of soy bean oil (Wood et al.,
1993).
2.1.4. Minor constituents
Although carbohydrate, protein and lipids are quantitatively the most
significant components of seeds, the minor constituents are important from the

Chapter 2
21
nutritional perspective (Delcour and Hoseney, 2010). These include minerals,
vitamins and sone bioactive compounds, such as phytosterols. Phytic acid, a
compound that inhibits mineral absorption, is discussed in more detail with other
anti-nutrients in a separate paragraph.
Table 2.4. Fatty acid composition of quinoa, some cereals and oil seeds (%)
Fatty acid Quinoa a Oat
b Wheat
c Soy
c Linseed
d
16:0 palmitic 8.5 17.4 21 10.3 4.8
18:0 stearic 0.7 1.1 2 3.8 2.4
18:1 oleic 31.6 38.5 15 22.8 19.2
18:2 linoleic 52.3 39.1 58 51.0 15.0
18:3 α-linoleic 8.1 2.0 4 6.8 58.2
Adapted from: a Wood et al., 1993;
b Saastamoinen et al., 1989;
c Delcour and Hoseney,
2010; d Cunnane et al., 2007
The content of some minerals, vitamins and phytosterols are shown in Table
2.5. Quinoa contains nearly twice as much magnesium and 2-3 times as much iron as
oat and wheat (Repo-Carrasco et al., 2003). Also zinc and calcium contents are
higher, except for oat that has a a similar calcium content. Phosphorus content, likely
to be found in the form of phytic acid, is equal in all compared species (Konishi et
al., 2004).
Konishi et al. (2004) studied the distribution of minerals in quinoa using
energy dispersive X-ray microanalysis (EDX). Phosphorus (P), potassium (K) and
magnesium (Mg) are located in the embryonic tissues in the form of globoids, visible
as colorful reagions at the narrow ends of seed cross-sections (Figure 2.5). Prego et
al. (1998) also observed P, K and Mg containing globoids in the protein bodies
located in endosperm and embryo tissues. Calcium and also potassium were found

Chapter 2
22
in the seed coat, possibly associated with cell wall polysaccharides (Konishi et al.,
2004).
Table 2.5. Contents of some minerals, vitamins and phytosterols in quinoa, some
cereals and oil seeds (mg/100g dw). n.r. = not reported.
Component Quinoa Oat Wheat Soy Linseed
Calcium a 94 94 48 81 163
b
Magnesium a 270 138 152 133 316
b
Iron a 16.8 6.2 4.6 4.9 6.6
b
Zinc a 4.8 3.0 3.3 2.4 9.2
b
Phosphorus a 387 385 387 n.r. 731
b
α-tocopherol c 2.1 n.r. 0.6 § 0.9
d 0.1
β + γ-tocopherols c 3.1 n.r. 0.5 § n.r. 8.2
Folate e, ǂ 180 30 34 40.4
f n.r.
Phytosterols c,*
82.5 39.1 f 68.8 § n.r. 98.2
Adapted from: a Repo-Carrasco et al., 2003;
b Gambuś et al., 2009;
c Ryan et al., 2007;
d
Plaza et al., 2003; e Hager et al., 2012b;
fArcot et al., 2002;
e Normén et al., 2002
* b-sitosterol + campesterol + stigmasterol
§ Value for spelt
ǂ µg/100 g
Figure 2.5. Element mapping (EDX) of cross-sections of whole (left of each pair of
images) and de-hulled (right of each pair of images) quinoa seeds. P = perisperm, E
= embryo, and SC = seed coat. Adapted from Konishi et al. (2004).
E
P
SC

Chapter 2
23
Vitamin E refers to a group of tocopherols and tocotrienols that are only
found in plant foods (Kamal-Eldin and Appelqvist, 1996). These compounds are
strong antioxidant, and protect for example cell membranes from oxidation damage.
Tocotrienols also have neuroprotective effects (Sen et al., 2006). Tocopherols exist
as different isomers (α, β and γ) with varying antioxidant activity, with α-tocopherol
being the strongest antioxidant in vivo (Kamal-Eldin and Appelqvist, 1996).
Compared to wheat and, quinoa has a very high content of both α- and β+γ-
tocopherols (Table 2.5). The β+γ-tocopherol level of linseed is however 2-3 times
higher.
Folate is a term for tetrahydrofolate and its derivatives, that belong in the
group of B vitamins. Folate deficiency may increase the risk of megaloblasic anemia,
cardiovascular disease, and neural tube defects on fetuses. Because of the latter,
folate supplementation is recommended for pregnant women (Bekaert et al., 2008).
Plant foods are the primary source of folates, however the levels in most staple
cereals are very low and cannot satisfy the recommended 170-400 μg/d (Bekaert et
al., 2008; de Bree et al., 1997). Compared to oat and wheat (30-34 μg/100 g), quinoa
is extremely high in folate with 180 μg per 100 g (Table 2.5).
Phytosterols (β-sitosterol, campesterol, and stigmasterol) are compounds
found in plants similar to cholesterol in structure and function (Kritchevsky and
Chen, 2005). They have a well-documented beneficial impact on serum cholesterol
levels on individuals suffering from hypercholesterolemia, and are used to enrich a
number of foods (Kritchevsky and Chen, 2005). Quinoa contains 82.5 mg
phytosterols in 100 g, which is again higher than oat, wheat and barley (Table 2.5).
This is however much lower than the dose required for a hypocholesterolemic effect
(2 g/d), which can only be achieved by supplementation (Katan et al., 2003).

Chapter 2
24
2.1.5. Anti-nutritional factors
Anti-nutritional factors in foods are compounds that reduce the nutrient
utilisation (Soetan, 2008). Anti-nutrients, including tannins, saponins, protease
inhibitors and phytates, are found in plant foods (Singh et al., 2003). Tannins are
water-soluble polyphenols that are synthesised by plants as a part of their defence
mechanisms against insects and herbivores. They influence protein bioavailability by
binding proteins or decreasing the activity of proteases (Singh et al., 2003). Quinoa
contains ~0.5% tannins, most of which is located in the outer layers of the seed
(Chauhan et al., 1992). Ruales and Nair, (1993) could not detect tannins in whole or
polished quinoa, and concluded that their levels are likely to be related to differences
in varieties and growing conditions.
Saponins are amphiphilic triterpene or steroidal glucosides, named after their
ability to form stable foams in water due to their surface active properties (Osbourn,
1996; Singh et al., 2003). They are found in many plant species, and act as
antimicrobial agents (Osbourn, 1996). Saponins do not only have a bitter taste that
renders plants and seeds unpalatable, but they interfere with protein digestion and
can cause cell damage at high concentrations (Singh et al., 2003). Saponins can be
found in seed and the vegetative tissues of plants (Ahamed et al., 1998). Two major
saponins have been identified in quinoa seeds (Figure 2.6). According to Ridout et al.
(1991), the three major aglycones in quinoa saponin mixture are phytolaccagenic
acid, hederagenin and oleanolic acid. The latter has been found to correlate with the
saponin content of quinoa, and can be used as an index of saponin content (Ahamed
et al., 1998).

Chapter 2
25
Figure 2.6. Proposed structures of the major quinoa saponins Adapted from Ruales
and Nair (1993).
Quinoa contains 0.9-1.2% saponins in total, that is found mainly in the seed
coat, and can be removed nearly completely by washing and polishing (Ridout et al.,
1991; Ruales and Nair, 1993). These treatments also removes the bitter taste (Ruales
and Nair, 1993). There is considerable variation in the seed saponin content
(Mastebroek et al., 2000). Cultivars with a low saponin content (sweet quinoa) are of
interest, as they do not require desaponification before use (Ruiz et al., 2013). The
most widespread of such new varieties is called Kancolla (Dini et al., 2002).
However the sweet varieties are late maturing which is an undesirable trait, and
perform poorly at higher latitudes, and are more susceptible to pests (Ruiz et al.,
2013; Ward, 2001).
Phytic acid (myo-inositol hexaphosphate; IP6) is an inhibitor of mineral
absorption present in many plant foods (Sandberg et al., 1999). They are found in
seeds, where they probably act as storage compounds for phosphorus and inositol
(Reddy et al., 1982). Phytic acid and its derivatives bind minerals, especially
calcium, zinc magnesium and iron, making them unavailable for absorption (De
Boland et al., 1975; Maga, 1982; Sandberg et al., 1999). Phytic acid can be
hydrolysed during processing as a result of phytase activity into lower inositol

Chapter 2
26
phosphates with less than six phosphate groups, of which IP5 inhibits iron absorption
(Sandberg et al., 1999). Also, IP4 and IP3 present in processed foods may contribute
to the negative effect of higher inositol phosphates on mineral absorption (Sandberg
et al., 1999). The phytic acid content is ~1% in whole unprocessed quinoa, which is
similar to cereals and legumes (Ruales and Nair, 1993; Valencia et al., 1999).
However, iron solubility in quinoa is double compared to cereals despite a
comparable phytic acid content (Valencia et al., 1999). Washing and polishing of
quinoa reduces the content to 0.78%. This indicates that phytic acid is also found in
abundance in tissues other than the outermost layers (Hídvégi and Lásztity, 2003.;
Ruales and Nair, 1993). The content of IP6+IP5 is reduced by 39% by germination,
68% by cooking and soaking, and 98% by fermenting the germinated quinoa
(Valencia et al., 1999). The resulting increase in iron solubility was 2-4-fold after
soaking and germination, and 5-8-fold after germination and fermentation (Valencia
et al., 1999).
Protease inhibitors regulate protein metabolism in plant tissues, and act as
defence against insects and phytophatogenic microorganisms that secrete proteolytic
enzymes (Habib and Fazili, 2007; Liener, 1970; Murdock and Shade, 2002). They
can be found in leaves, tubers and cotyledons or whole seeds, depending on the plant
species (Liener, 1970). Protease inhibitors reduce the protein digestibility by
inhibiting the action of proteolytic enzymes in the gastrointestinal tract. Early animal
studies showed that soybeans did not support the growth of rats unless thoroughly
cooked to inactivate the inhibitors (Liener, 1970). Most plant protease inhibitors can
be destroyed by heat (Liener, 1970), as can be seen when comparing the PER values
or raw and heated (italic) soy and amaranth proteins in Table 2.3. Ruales and Nair

Chapter 2
27
(1993) could not detect trypsin inhibitors in quinoa, but Chauhan et al. (1992)
reported a low level of inhibitors located in the seed coat.
2.2. Applications of quinoa and its constituents
2.2.1. Post-harvest processing
The outer layer of quinoa seeds contains saponins that taste bitter and may
interfere with protein digestion (Repo-Carrasco et al., 2003; Singh et al., 2003).
These have to be removed before the seed can be consumed (Repo-Carrasco et al.,
2003). The traditional method utilised by farmers is washing the grains while rubbing
them with hands or a stone. This method can however be costly when applied on an
industrial scale because of a necessary drying step and wastewater disposal (Repo-
Carrasco et al., 2003). Also the seeds may start to germinate during the washing step.
Dry methods remove the saponins by polishing the grains, which is cheaper and
more efficient, but may not remove the saponins completely. A combination method
with a polishing step followed by quick washing is the most recommended method
(Repo-Carrasco et al., 2003). After saponin removal, quinoa can be used as whole
seeds in a similar manner to rice, or milled into a flour and processed into a variety
of foods, such as bread, pasta, infant formula, extrudates and meat substitutes
(Abugoch, 2009). The separation of the anatomical parts of the seed by milling is
widely utilised in grain processing (Delcour and Hoseney, 2010). Milling and can
also be used to obtain fraction enriched in certain tissues, e.g. for the production of
fractions high in antioxidants or fibre (Glitsø and Bach Knudsen, 1999; Gray et al.,
2000). As the storage reserves in quinoa seeds show marked compartmentation with
protein and fat reserves located in the embryo and starch in the perisperm, dry
fractionation could have a lot of potential (Prego et al., 1998). Some studies exist on

Chapter 2
28
the composition and properties of seed fractions obtained by milling and sieving, but
to the author’s knowledge these are not commercially available (Ando et al., 2002;
Becker and Hanners, 1990; Elgeti et al., 2014).
2.2.2. Baked goods
Bread is a staple food in many parts of the world. Wheat is by far the most
common ingredient for bread because of the unique dough forming properties of its
proteins. Because of these proteins, wheat dough has the ability to retain gas and
form a light, porous structure when baked (Delcour and Hoseney, 2010). Other
grains such as rye, oats and sorghum are used in traditional local bread-like products
(Duodu and Taylor, 2012). Celiac disease (CD) is an immune-mediated enteropathy
with a worldwide prevalence of 1%. The condition is triggered by wheat gluten and
related proteins in rye and barley. The only existing treatment to CD is the strict life-
long exclusion of cereals containing coeliac toxic proteins (Catassi and Fasano,
2008).
The gluten-free market segment has expanded enormously in the recent years,
and the growth has been predicted to continue (Robinson, 2014). In addition to the
increasing number of people with a diagnosed coeliac disease, gluten-free diet has
also gained popularity as a lifestyle choice. Gluten-free bread is usually based on e.g.
rice flour, pseudocereals (quinoa, buckwheat, amaranth) or purified starches (Hager
et al., 2012a). As the key to breadmaking lies in the structure forming properties of
wheat proteins, the formulation of high-quality gluten-free bread is challenging.
Often hydrocolloids (e.g. hydroxypropylmethylcellulose (HPMC), xanthan gum,
guar gum) are used to mimic the viscoelasticity provided by wheat proteins. Also
proteins from various sources, e.g. egg white, milk or soy beans are useful

Chapter 2
29
ingredients because of their foaming, emulsifying and gelation properties (Hager et
al., 2012a). When used as the only flour in a gluten-free bread recipe with no added
hydrocolloid, quinoa flour produces loaves with low specific volume, hard crumb
and low liking scores due to a pea-like odour (Hager et al., 2012a). Quinoa flour as a
part of a complex formulation with rice flour and xanthan gum however yields loaves
with a higher specific volume, softer crumb and equal acceptability when compared
to a standard gluten-free recipe based in rice flour and potato starch (Laura Alvarez-
Jubete et al., 2009). Elgeti et al. (2014) discovered that a perisperm-enriched milling
fraction of quinoa gives a high volume bread with a fine crumb structure when used
in gluten free baking. Perisperm flour is an interesting ingredient for gluten-free
bread, as the absence of large quantities of embryonic tissue also prevents the
formation of grassy off-flavours. It is however not necessarily any healthier than
using purified starches, as the protein, minerals and vitamins that make quinoa
nutritionally interesting are largely located in the embryo.
The inclusion of quinoa for nutritional enhancement has been studied also in
wheat-based products. Chauhan et al. (1992) substituted wheat flour with quinoa in
the production of bread. The inclusion of quinoa in the product increased the dislike
by a sensory panel, but addition level ≤10% was still acceptable. Lorenz and Coulter
(1991) concluded that 5-10% quinoa produced bread and cake of good quality, but
higher levels decreased the loaf volume and deteriorated the crumb texture. Also, a
30% addition led to a formation of a bitter aftertaste. Park (2005) compared the
influence of the addition (10%) of non-germinated and germinated quinoa flour in
wheat bread. Germination for 24 h increased the hardness of the dough, but led to no
other significant differences. When the seeds were allowed to germinate for 48 or 72
h, they deteriorated the bread quality. According to a report, the production of short

Chapter 2
30
dough biscuits from quinoa is technologically possible, but the product is of low
quality when 100% quinoa flour was used because of poor texture, and a strong bitter
aftertaste (Schoenlechner et al., 2006). As is the case in gluten-free products, the off-
flavour is a major obstacle when whole grain quinoa is included in bakery products.
2.2.3. Pasta and extrudates
Pasta in its most common form is an extruded product that consists of durum
wheat semolina, water, salt and sometimes egg (Delcour and Hoseney, 2010). Like in
bread, wheat proteins play a major role in the quality of pasta, and gluten-free
alternatives tend to show high stickiness and cooking loss, and low elasticity (Hager
et al., 2012b). Schoenlechner et al. (2010) studied the production of pasta using
amaranth, quinoa and buckwheat. Pasta produced from 100% quinoa showed decent
agglutination and performed better than amaranth overall, but had a high cooking
loss. The combination of pseudocereals (60% buckwheat, 20% quinoa and 20%
amaranth) was suitable for the production of good quality gluten-free pasta. Chillo et
al. (2008) investigated the addition of quinoa, chick pea and broad bean (30%) in an
amaranth-based pasta formulation, of which quinoa and broad bean improved the
quality. Low to medium (1.6-10%) inclusion of quinoa flour in corn-based gluten-
free pasta resulted in desirable technological properties (Caperuto et al., 2001).
Extrusion cooking is a hydrothermal process used for the production of
ready-to-eat cereals, snacks, and textured meat-like products based on plant proteins.
Extrusion also influences the digestibility of starch and protein, as well as other
properties of macromolecules. It can for example be used for the modification of
fibre solubility and the functional properties of protein ingredients (Camire, 1991;

Chapter 2
31
Gualberto et al., 1997; Singh et al., 2007). Ramos Diaz et al. (2013) studied the
inclusion of pseudocereals in gluten-free extruded snacks based on corn flour.
Quinoa (20%) increased the expansion of the extrudates when compared to a corn
flour control. However, quinoa extrudates showed considerable hexanal production
after 9 weeks of storage at a low relative humidity, resulting from lipid oxidation
(Ramos Diaz et al., 2013). The extrusion cooking of snack products using 100%
quinoa flour requires a high shear environment because the low amylose content
makes starch granules hard to disrupt (Dogan and Karwe, 2003). The best product,
with high expansion, low density and high degree of starch gelatinisation, was
achieved when low moisture and low temperature were used (Dogan and Karwe,
2003).
2.2.4. Other food applications
Due to its high mineral and vitamin content, as well as the good quality of the
protein, quinoa is a good raw material for infant foods (Repo-Carrasco et al., 2003).
Arginine and histidine are especially important for infants and children, and are
found at high concentrations in quinoa proteins (Berghofer and Schoenlechner,
2008). Despite the increasing prevalence of obesity in Latin America, a significant
number of children suffer from malnutrition (21% according to a 2002 report) in
Bolivia, Peru, Equador and Columbia due to social inequality (Larrea and Freire,
2002). Hence, it is important to have a locally produced raw material for these
products. An infant food for supplementary feeding was developed by Ruales et al.
(2002) by drying a pre-cooked slurry prepared from quinoa flour. The product could
be reconstituted with water and used as porridge or beverage. The product had a
protein content of 16%, and was a good source of vitamin E, thiamine, iron, zinc and

Chapter 2
32
magnesium. The supplementation of the diets of children recovering from
malnutrition with this product led to an increase in insulin-like growth factor 1 levels
after 15 days (Ruales et al., 2002).
Peñaloza et al. (1992) investigated the solid-state fermentation of quinoa
tempeh, a product traditionally made of legumes and fermented with a fungus
(Rhizopus oligosporus) that can be used like meat in vegetarian cooking. They used
both a sweet and a bitter variety, of which the latter led to a decreased fungal
biomass formation possibly because of differences in hyphal penetration.
Schumacher et al. (2010) added toasted quinoa in dark chocolate to develop a
product for health-conscious consumers with an increased protein and vitamin E
content. The inclusion of up to 20% quinoa did not significantly decrease the
acceptability of the product.
2.2.5. Non-food applications
Some components of grains can be used for non-food applications, such as
the manufacture of biodegradable plastic-like materials and fibres (Lawton, 2000).
The formation of biodegradable films and coatings involves cross-linking of polymer
chains. A number of plant-derived macromolecules are suitable for this purpose, e.g.
wheat gluten, maize zein, chitin, starch and cellulose (Tharanathan, 2003). Both
quinoa protein and starch have been used to develop biodegradable films. Quinoa
protein extracts form mechanically resistant films when blended with chitosan in the
absence of a plasticiser (Abugoch et al., 2011). When compared to pure chitosan
films, 1:1 chitosan/quinoa protein blend films showed lower tensile strength but
higher elongation at break, and better water-vapor permeability properties. Quinoa
starch forms colourless films with good mechanical and barrier properties when

Chapter 2
33
produced with 21% glycerol as a plasticiser (Araujo-Farro et al., 2010). Although
biodegradable plastics decrease the need for oil, and also reduce problems with waste
disposal, they should be ideally manufactured out of by-products not usable for
human consumption (Gillgren and Stading, 2007; Tharanathan, 2003). Especially
using the edible parts of a crop like quinoa that is both nutritious and at the moment,
pricey, does not appear feasible.
Due to its very small granule size, quinoa starch has attracted interest in some
other applications. Microencapsulation is a way to achieve controlled release of
compounds such as flavouring. Tari et al. (2003) studied the formation of spherical
aggregates for entrapping vanillin, using starches with small granules. The ability of
the starch to entrap vanillin appeared to depend on the amylose content, with an
extremely low amylose amaranth starch showing the best performance (Tari et al.,
2003). The quinoa starch used had a rather high amylose content for quinoa (22.5%),
and it is thus possible that lower amylose cultivars would be more suitable for such
an application. Pickering emulsions are stabilised by intact particles that accumulate
on the interface instead of surfactants (Rayner et al., 2012). These emulsions are very
stable even at large droplet size of the disperse phase. Quinoa starch granules were
succinylated to increase the hydroprobicity, and successfully used for the
stabilisation of an oil-in-water emulsion. The authors suggested its suitability for
food, cosmetic and pharmaceutical applications (Rayner et al., 2012).
3. Germination in food processing
3.1. Germination and dormancy
Germination is the process during which a new plant is formed from a dry
seed. If the dry seed is non-dormant and the conditions are favourable it enters the

Chapter 2
34
germination process upon imbibition (Weitbrecht et al., 2011). In sensu stricto,
germination is completed once the seed coat is protruded by the radicle, and the
following growth is referred to as seedling establishment or post-germinative growth
(Bewley and Black, 1994a). However, the whole process including the early seedling
growth, is often called the germination by e.g. cereal scientists and hortonomists to
whom the difference between these phases is irrelevant. From a physiological point
of view however, germination and post-germinative growth are clearly separate
events. In this review, the grain processing including both germination, subsequent
growth will be called germination process, but otherwise accurate terminology will
be used. In malt production, the metabolic events are ended by heat-treatment
(kilning) (Kaukovirta-Norja et al., 2004).
The process starts by water uptake (imbibition), that leads to the rise of
metabolism and the subsequent growth (Bewley and Black, 1994b). Imbibition is a
three-stage process (Figure 2.7). Once the seed is exposed to water, the water content
increases rapidly because of the low water potential of the dry seed (Weitbrecht et
al., 2011). Water potential is the tendency of water to travel into a tissue, and it
depends on the pressure (e.g. hydrostatic), osmotic, and matrix (e.g. potential for
capillary action) potentials of the material (Bewley and Black, 1994b). Respiration
and energy metabolism are reactivated, protein synthesis starts, and damage to
membranes and DNA caused by dehydration, storage and rehydration are repaired
during this phase (Weitbrecht et al., 2011). Once the water uptake and swelling starts
to stagnate, the germination process enters phase II. During this phase, respiration
and metabolism are further increased, and the reserve mobilisation in embryonic
tissues and the micropylar endosperm (if present) begin. The embryonic axis starts to
elongate, and the weakening of tissues surrounding the protruding radicle may occur

Chapter 2
35
in some seeds, eventually leading to the rupture of these tissues (Weitbrecht et al.,
2011).
The water uptake starts to increase again during the post-germinative phase (III), as
the cells in the embryo extend. The mobilisation of storage reserves also occurs after
radicle protrusion, leading to the accumulation of osmotically active low-
molecular weight compounds resulting from storage reserve hydrolysis, that increase
the water uptake (Bewley and Black, 1994b).
For germination to commence, water and oxygen must be available and the
physical conditions including temperature, light quality (spectral distribution) and
quantity (intensity, duration) must be suitable for that particular species (Bewley
and Black, 1994). Even if these conditions are right, seeds may fail to germinate
because they are dormant. Dormancy is a mechanism that regulates the timing of
germination: it will only occur
Figure 2.7. The time course of germination and post-germinative growth. Adapted
from Bewley (1997).

Chapter 2
36
when conditions are suitable for the survival of the plant (Finch-Savage and
Leubner-Metzger, 2006). In other words, dormancy is the inability of the seed to
complete germination under conditions otherwise favourable for germination
(Bewley, 1997). Different types of dormancy mechanism exist, including coat-
enhanced dormancy in which germination is prevented by physical constraint of the
structures surrounding the embryo, and embryo dormancy in which the embryo itself
cannot grow (Bewley, 1997). Seeds are usually dormant to varying degrees when
dispersed by the mother plant (primary dormancy), or they can enter secondary
dormancy when exposed to unfavourable conditions, such as high or low
temperatures (Bewley and Black, 1994). The regulation of dormancy and its release
are complex events not fully understood, but abscisic acid (ABA) has an essential
role in the onset and maintenance of the dormant state in many species, while
gibberellic acid (GA) promotes germination (Hilhorst and Karssen, 1992).
The topics of interest for food scientists include the increase in of hydrolytic
enzyme activities and the subsequent hydrolysis of storage macromolecules in the
seed tissues, the change in mechanical properties seed tissues, as well as the
nutritional aspects including modified nutrient bioavailabilities and secondary
metabolites with possible bioactivities (Kaukovirta-Norja et al., 2004). These issues
will be discussed in the following sections.
3.2. Impact of germination process on nutritional properties of seeds
During germination and early seedling growth, a range on hydrolytic
enzymes will be activated and synthesises de novo to mobilise the high-molecular-
weight storage reserves deposited in the storage tissues of the seed, or to loosen
cellular structures. These enzyme activities include amylolytic enzymes, endo-β-

Chapter 2
37
glucanases and other cell-wall degrading enzymes, lipases, proteases and phytase.
The storage compounds are converted into soluble forms that are transported to
metabolising and growing organs (Bewley and Black, 1994c). The influence of these
changes on the nutritional profile of the seed depends on the extent of modification,
i.e., how far the germination process is allowed to continue. In germinating finger
millet (Eleusine coracan), starch content starts to decline after 48 h, as it is converted
into sugars (Mbithi-Mwikya et al., 2000).
Protein digestibility is influenced by, e.g., limited hydrolysis and the
inactivation of protease inhibitors. Reports on the influence of germination vary
between species. Chang and Harrold (1988) studied the fate of lectin and trypsin
inhibitors in navy and pinto beans. Lectin activity was reduced in only navy beans,
and in vitro protein digestibility remained nearly unchanged in both beans. Nnanna
and Phillips (1990) reported an increase in in vivo protein digestibility tested on rats,
but no impact on in vitro digestibility. Germinating fluted pumpkin seeds (Telfairia
occidentalis Hook) for 7 d increased the in vitro protein digestibility from 58% to
77% (Giami et al., 1999). The inclusion of malted sorghum in non-malted sorghum
flour led to a significant dose-dependent increase in protein digestibility (Elkhalil et
al., 2001).
The breakdown of cell walls occurring during germination leads to changes in
the solubility of fiber components. In legumes, germination for 96 h generally
increased the soluble fiber content. The extent of the soluble fiber increase and the
required processing conditions varied between species (Cabrejas et al., 2008).
However, as the health effect of soluble fibers depends on the molecular weight,
excessive hydrolysis is detrimental for the nutritional benefits (Theuwissen and
Mensink, 2008). This may be controlled with process parameters: Wilhelmson et al.

Chapter 2
38
(2001) developed a procedure for malting oats without a considerable loss of high-
molecular-weight beta-glucan. A short germination period (72 h) at 15°C retained
55-60% of the beta-glucan. Legumes contain high quantities of raffinose series
oligosaccharides, that are resistant to digestive enzymes and are metabolised by the
colon microbiota, causing gastrointestinal symptoms. Even a short germination
process is efficient in the removal of these compounds, after 24, the content has
decreased to 50% of the initial, and <20% after 60 h (Figure 2.8 a).
Figure 2.8. Germination as a means of oligosaccharide reduction in pulses (a) and
phytate reduction in selected grains and pulses (b). Adapted from Egli et al. (2002)
and Rao and Belavady (1978).
Phytate is a severe antinutrient present in seeds, as discussed under section
2.1.5. Attempts to remove it by the means of germination have been explored with a
variety of grains and legumes (Egli et al., 2002; Larsson et al., 1996; Valencia et al.,
1999). The results depend greatly of the species in question: for example chick pea
shows very little changes, while the phytate content on rice decreases to nearly 30%
of its original value during 72 h of germination (Figure 2.8 b). Subsequent processing

Chapter 2
39
such as soaking, cooking or fermentation may increase the phytate removal. Zinc
absorption from a breakfast porridge was doubled, and iron absorption increased by
47%, when oats were malted and soaked before use (Larsson et al., 1996). Also the
highest increase in zinc and iron solubility was achieved by germination and
fermentation (Valencia et al., 1999).
Bioactive compounds in seeds include phenolic compounds and other
antioxidants, plant sterols and vitamins, that have been the subject of an increased
interest in cereal processing (Kaukovirta-Norja et al., 2004). The content of phenolic
compounds, avenanthramides and phyrosterols has been shown to increase during
germination of oat (Oksman-Caldentey et al., 2001). Also the contents of folate and
lignin increased by 3- and 2-fold during 6 d germination of rye (Liukkonen et al.,
2003). Active oxygen species accumulate in seed tissues resulting from the
reactivation of metabolism during early germination. The increase in antioxidant
compounds and detoxifying enzymes are the seed’s mechanism for protecting the
tissues from radical damage (Bailly, 2004). Antioxidant activities appear to increases
during germination in a variety of species, including amaranth, quinoa, buckwheat,
wheat, barley and oat (Alvarez-Jubete et al., 2010; Pike et al., 2007). The activities
against lipid oxidation found in methanol extracts of malted oat were comparable to
that of a synthetic antioxidant butylated hydroxytoluene (BHT), suggesting potential
uses in food preservation (Pike et al., 2007).
A combination of germination and fermentation on nutritional modification
of grains and legumes has been explored by several authors. It increases the
hydrolysis of protein and starch drastically, and has also been shown to be more
efficient in the enhancement of mineral solubility than fermentation alone (Sripriya
et al., 1997; Valencia et al., 1999). Katina et al. (2007) compared the influence of

Chapter 2
40
sourdough fermentation of germinated and non-germinated rye on the formation of
bioactive compounds, and found that the combination treatment led to higher levels
of folates, phenolic compounds and alkylresorcinols than fermentation only.
3.3. Significance of germination on food processing
In addition to being used for nutritional enrichment or modification of
products, malted grains and legumes may have technological functionalities in food
systems due to their increased enzyme activities. Hydrolytic enzyme activities and
the degradation of the endosperm reserves are of course a prerequisite for malting
and brewing (Briggs, 1998). Barley is the main malting cereal worldwide, but the
technology can be applied to other grains and legumes. Less common malting grains
include tropical cereals sorghum, maize, millet and tice, and cereals from the
temperate zone, wheat, rye and oat (Briggs, 1998). The latter resemble barley in their
malting properties, the malts have high amylolytic activities, especially α-amylase.
Such malts hydrolyse starch efficiently into sugars, which can be measured as so-
called diastatic power (Table 2.6). Tropical grains and pseudocereals often have low
amylolytic activities with some exceptions.
Generally, these alternative grains produce malts with poor performance.
Low activities of essential enzymes leads to problems with fermentability and high
wort viscosities (Hager et al., 2014; Phiarais et al., 2006; Zarnkow et al., 2007).
Also other factors such as high starch gelatinisation temperatures or complex
cell-wall poly saccharides not readily hydrolysed, may contribute to the poor
performance in brewing (Hager et al., 2014). Brewing with alternative grains often
requires the use of exogenous enzymes (Hager et al., 2014), but also additional

Chapter 2
41
processing steps such as alkaline steeping, and careful process optimisation may
yield acceptable malt quality (Meo et al., 2011).
In addition to brewing, germinated grains can be used as a source of enzymes
to alter the other grain-based foods. Barley and wheat malt can be used to optimise
the α-amylase levels in wheat flour as an alternative to fungal α-amylase, or as a
source of colour and flavour when inactivated (Briggs, 1998; Delcour and Hoseney,
2010). The high amylolytic activity has also been exploited in, e.g., the manufacture
of breakfast cereals and Mämmi, a traditional Finnish rye-based Easter dish, and for
the production of dextrins (Ba et al., 2013; Briggs, 1998; Loponen et al., 2009).
Germination is also an efficient way of decreasing the viscosity of starchy weaning
hooooooo
Table 2.6. Enzyme activities of malts produced from a variety of grains.
α-amylase
* β-amylase
§
Diastatic
power ǂ
Protease † Lipase
‡
Barley a 134 12.0 264
b 9.4 3.0
Wheat a 119 23.5 355
b 8.9 6.9
Oat a 48 2.7 n.r. 11.9 29.5
Rye c 224 8.3 n.r. 27.3 n.r.
Rice d 37 1.9 225 n.r. n.r.
Buckwheat e 19.9 24.7 72
f 5.5 n.r.
Sorghum g 40 2.0 89 n.r. n.r.
Proso millet h 124 1.8 n.r. n.r. n.r.
Teff i 68 7.5 n.r. n.r. n.r.
Adapted from: a Mäkinen and Arendt 2012;
b Briggs, 1998;
c Hübner et al. 2010;
d Ceppi and
Brenna, 2010; e Phiarais et al. 2005;
f Phiarais et al. 2010;
g Agu and Palmer, 1997;
h
Zarnkow et al. 2010; i Gebremariam et al. 2012.
* Analysed with Megazyme Ceralpha kit. One unit of activity corresponds to the liberation of 1 μmol
p-nitrophenol/min. § Analysed with Megazyme Betamyl-3 kit. One unit of activity corresponds to the liberation of 1 μmol
p-nitrophenol/min. Unit converted from BU to B3U when necessary using a factor of 58.6.
ǂ Windisch–Kolbach units (°WK), converted from L when necessary † Analysed against haemoglobin. One unit of activity corresponds to the liberation of 1 mg l-leucine/h.
‡Analysed against triolein using the dough method. One unit of activity corresponds to the liberation
of 1 μmol oleic acid/h under assay conditions.

Chapter 2
42
foods traditionally used in rural communities in developing countries, as it does not
require sophisticated equipment (Atwell et al., 1988; Griffith et al., 1998).
The influence of other germinated grains and legumes on wheat dough and
bread has been studied to some extent. The addition of up to 5% oat malt led to
drastic weakening of the gluten network and subsequent increase in extensibility, but
nevertheless yielded bread with specific volume higher than all wheat control, and
even crumb grain possibly because of its high lipase activity (Mäkinen and Arendt,
2012). Germinated brown rice also weakens the dough, which led to decreased loaf
specific volumes at malt levels higher than 10% but higher nutritional value
(Watanabe et al., 2004). Several papers discuss the incorporation of germinated
legumes in bread for nutritional enhancement. For example, Hallén et al. (2004)
compared the replacement of wheat flour by non-germinated and germinated cowpea
flour. Germinated cowpea flour increased the specific volume slightly at levels 5-
10%, whereas non-germinated flour had no such effect. However, at levels >15%,
germinated flour decreased the volume, while non-germinated flour did not. Morad
et al. (1980) supplemented wheat bread with starches isolated from non-germinated
and germinated yellow peas, lentils and faba beans. All starches deteriorated the loaf
volumes and crumb grain, but the effects were worse for germinated starches.
Germinating and kilning influence the sensory properties of grains, giving
them a typical flavour and odour generally perceived as pleasant. During
germination, reducing sugars and amino acids are released, that subsequently react
during heating, giving rise to Maillard reaction products (Kaukovirta-Norja et al.,
2004). Heiniö et al. (2001) profiled the sensory characteristics of native, germinated
and kilned oats. Germination and kilning decrease the undesirable cereal-like
flavour, and musty and earthy odour notes. The main flavour notes were roasted,

Chapter 2
43
nutty and intense, and dominating textural attributes were crisp and brittle.
Germinating brown rice increased the hedonic response to texture, taste and
appearance when cooked (Parnsakhorn and Langkapin, 2013). The inclusion of
malted raw materials in products has also been shown to alter the sensory properties
favourably. Extrudates produced from malted millet and soybean scored higher in
flavour and texture compared to their unmalted counterparts, and the malted flavour
masked the unpleasant beany flavour originating from soybean (Obatolu, 2002).
Malting of raw materials also changes the sensory properties of rye extrudates
drastically (Heiniö et al., 2003).
4. Plant based dairy type products
Plant milk substitutes are water extracts of legumes, oil seeds, cereals or
pseudocereals that resemble cow’s milk in appearance. These extracts can be
processed further into related products, such as cream, yoghurts and ice cream
substitutes. Milk, by definition, is a mammary secretion, and according to Codex
Alimentarius, the term “milk” (and other dairy terms) can be used for products if
“the exact nature of which is clear from traditional usage”, unless the product is
intended to substitute dairy products (Codex Alimentarius, 1999). Still, the terms like
“almond milk” and “soy yoghurt” are used in everyday language, and the issue has
been a long and still ongoing battle between the National Milk Producers Federation
(NMPF), FDA and plant milk producers in the US (Soyfood Association od
America, 1997; NMPF, 2010). At least at the time of writing, several commercial
products carry the word milk in the US, and although their European counterparts are
call their liquid products drinks or beverages, terms like plant-based yoghurt

Chapter 2
44
alternatives and oat ice cream are used (Silk.com; Almondbreeze.com; Alpro.com,
Oatly.com, Carlshamnmejeri.se, 2014).
There is a wide variety of traditional plant based beverages around the world,
for example Horchata, “tigernut milk” in Spain; Sikhye, a beverage made of cooked
rice, malt extract and sugar in Korea; Boza, a fermented drink made of wheat, rye,
millet and maize consumed in Bulgaria, Albania, Turkey and Romania; Bushera, a
fermented sorghum or millet malt based beverage from Uganda, and traditional soy
milk originating from China (Cortés et al., 2005; Prado et al., 2008; Kim et al., 2012;
Chen, 1989). The most widely consumed plant milk substitute is soy milk, a product
that started its journey from Asia to the supermarket shelves in Europe and the US
less than hundred years ago. The first commercially successful product was launched
in Hong Kong in 1940 and the market grew rapidly during the 1970s and early 1980s
in Asia after the development of technologies for large scale production of mild
flavoured soy milk (Chen, 1989). The demand for soy milk in the Western world was
initiated by consumers intolerant to cow’s milk, but the market expanded in the
1990’s and 2000’s as a part of a health trend, and grew from USD 300 m to USD 4
bn between 1992-2008 in the U.S. (Organic Monitor, 2005; Patisaul and Jefferson,
2010). After soy received an FDA approved health claim for lowering the risk for
coronary heart disease in 1999, more than 2700 new soy products were introduced to
the market (Patisaul and Jefferson, 2010).
Soy products are still dominating the market in the Western world, but the
emerging of alternative products from other plant sources such as coconut, oat and
almond have decreased its share because of increased options and worries about
GMO and allergenicity of soy (Mintel, 2011). Overall, the dairy alternative market is
still growing: Packaged Facts (2012) estimated the U.S. market for plant based milk

Chapter 2
45
substitutes to have a total value on USD 1.33 bn in 2011, which is expected to
increase to USD 1.7 bn by 2016. Also the market for lactose- and dairy free products
in general, estimated to be worth USD 3.6 bn in 2010, is growing in the U.S. and
Western Europe. The figure includes lactose-free dairy products, but much of the
growth has been attributed to soy milk like products (Leatherhead Food Research,
2011).
According to an estimate, 15% of European consumers avoid dairy products
for a variety of reasons, including medical reasons such as lactose intolerance (LI),
cow’s milk allergy (CMA), cholesterol issues and phenylketonuria, as well as
lifestyle choices like a vegetarian/vegan diet or concerns about growth hormone or
antibiotic residues in cow’s milk (Jago, 2011) (Leatherhead Food Research, 2011).
LI is generally an inherited condition (primary hypolactasia) that disables lactose
digestion due to lactase deficiency, causing abdominal pain, bloating and flatulence
upon the consumption of lactose containing foods (Swagerty et al., 2002). The
prevalence of LI varies between ethnic groups, being below 20% only among white
Europeans and their descendants. The significantly higher prevalence in other ethnic
groups (50-80% among Hispanic and Black and nearly 100% among Asian and
Native American populations) has led to a theory that lactase deficiency is a normal
condition for adult humans and the frequency of the lactase persistency gene has
increased in cultures where milk has offered a selective advantage (Sahi, 1994). LI
can also be caused by injuries to the intestinal mucosa (secondary hypolactasia),
resulting from diseases such as untreated celiac disease, cystic fibrosis and
gastroenteritis (Bode and Gudmand-Høyer, 1988; Swagerty et al., 2002). Sufferers of
the inflammatory bowel disease have a higher dairy sensitivity prevalence compared
to the average population (10-20%), and are often advised to avoid dairy products

Chapter 2
46
(Mishkin, 1997). The main treatment for LI is the avoidance of lactose containing
foods and replacing milk and dairy products with lactose-free dairy or dairy-free
alternatives.
CMA is a disorder in which the immune system reacts to one or more milk
proteins causing an inflammatory response. Cow’s milk is the most common allergen
in infants, but 80-90% of sufferers acquire a tolerance by the age of 5 years. The true
prevalence of CMA is 2-6% in infants and 0.1-0.5% in adults, but the number of self-
diagnosed cases is 10-fold higher possibly due to confusion with LI or misdiagnosis
without clinical evaluation (Crittenden and Bennett, 2005). The only treatment for
CMA is the complete avoidance of cow’s milk antigens. Infants with CMA may be
fed with hypoallergenic formulas based on extensively hydrolysed whey or casein
(Kneepkens and Meijer, 2009).
4.1. Processing
Plant milk substitutes are colloidal suspensions or emulsions consisting of
dissolved and disintegrated plant material. They are prepared traditionally by
grinding the raw material into a slurry and straining it to remove coarse particles.
Although countless variations of the process exist, the general outline of a modern
industrial scale process is essentially the same; the plant material is soaked and wet
milled to extract the milk constituents, or alternatively the raw material is dry milled
and the flour is extracted in water (Figure 2.10). The grinding waste is separated by
filtering or decanting. Depending on the product, standardisation and/or addition of
other ingredients such as sugar, oil, flavourings and stabilisers may take place,
followed by homogenisation and pasteurisation/UHT treatment to improve

Chapter 2
47
suspension and microbial stabilities. These extracts can also be spray dried to
produce powders (Diarra et al., 2005).
4.1.1. Raw material pre-treatments
Plant milk substitutes can be produced by extracting the soluble material
directly either ground plant material with water or wet grinding soaked grains or
legumes into a slurry (Diarra et al., 2005). Alternatively, the product can be
reconstituted using protein isolates or concentrates and other ingredients, e.g. oils,
sugars, salts and stabilisers (Debruyne, 2006). This approach also allows the
formulation of a range of related products such as pharmaceutical beverages,
nutritional supplements, infant formulas, meal replacers, cream alternatives and fruit
smoothies (Paulsen et al., 2006). Possible raw material pre-treatments include
dehulling, soaking and blanching (Debruyne, 2006). Blanching is required to
inactivate trypsin inhibitors and lipoxygenase that would produce off-flavours
in soy milk (Giri and Mangaraj, 2012). Roasting of the raw material enhances
the aroma and flavour of the final product, but heating decreases the protein
solubility and extraction yield (Hinds et al., 1997a; Rustom et al., 1991).
4.1.2. Extraction
The extraction step has a profound effect on the composition of the resulting
product. To increase the yield of the process, the efficiency of this step may be
improved by increasing the pH with bicarbonate or NaOH, elevated temperatures or
the use of enzymes. Most cereal and legume proteins have an isoelectric point under
5, translating to the lowest solubility (Wolf, 1970). Alkaline pH during extraction
increases the protein extractability, but a neutralisation step may be required in the

Chapter 2
48
process (Rustom et al., 1991; Aidoo et al., 2012). A higher extraction temperature
increases the extractability of fat, but the denaturation of proteins decreases their
solubility and yield (Rustom et al., 1991). Hot water extraction of cowpea milk
decreases the yield and protein content compared to cold water extraction, but
improves the protein digestibility slightly due to trypsin inhibitor inactivation, and
leads to a reduced extraction of phytic acid (Akinyele, 1991).
Partial hydrolysis of proteins and polysaccharides using enzymes is another
way to increase the extraction yields (Table 2.7). Papain and enzymes extracted from
Pestulotiopsis westerdijkii increased the protein yield of peanut and soy milks
(Rustom et al., 1993; Abdo and King 1967).
Figure 2.9. The general manufacturing process of plant milk substitutes.
Homogenisation
Pasteurisation/UHT
Packaging
Soaking
Wet milling
Separation of solids
Product formulation
Dry milling
Extraction of flour
Grains / pulses / nuts

Chapter 2
49
In addition to proteolytic enzymes, a mixture of amyloglucosidase and a
cellulase cocktail has been shown to increase the carbohydrate recovery of peanut
milk (Rustom et al., 1993). Eriksen (1983) used a variety of enzymes in soy milk
extraction, and found that the highest protein and total solids yield was attained using
a neutral or alkaline proteinases at their optimum pH, while pectinase and β-
glucanase had little effect. Enzymes with low pH optima may not be the most
efficient extraction aids even if the enzyme action per se increases the yield, as the
pH decrease influences the protein solubility, and thus neutral and alkali proteases
may be the best options. In addition to increasing the extraction yield, proteolytic
enzymes improve the suspension stability (Rustom et al., 1991). Also, a cellulase
treatment after homogenisation has been reported to decrease the particle size and
yield a more stable suspension (Rosenthal et al., 2003).
Table 2.7. Effect of enzymes in extraction yields of plant milk substitute substitutes.
Raw
material
Enzyme Dosage/pH/T Increase in yield
Peanut Papain 1:50 protein/ 6.95;
8.0/20 °C; 60 °C
“Significant increase
in protein extraction”
Peanut Cellulase cocktail
(Viscozyme) and
amyloglucosidase
- / 4.5 / 50°C 13.4% (carbohydrate)
Soy Enzyme isolate from
Pestulotiopsis
westerdijkii
- / 4.6 / 37 °C 22% (protein)
Soy Neutral protease and β-
glucanase cocktail
(Neutrase)
0.5%/7.0 / 50 °C 31% (protein)
20% (total solids)
Soy Pectinase 2% / 5.5 / 50 °C 11% (protein)
7% (total solids)
Soy Pectinase, cellulase,
hemicellulase and protease
cocktail (SP-249)
2% / 4.5 / 50 °C 26% (protein)
16% (total solids)
Adapted from: Rustom et al. (1991); Rustom et al. (1993); Abdo and King, (1967) and Eriksen,
(1983).

Chapter 2
50
4.1.3. Separation and starch liquefaction
After the extraction step coarse particles are removed from the slurry by
filtration, decanting or centrifugation (Diarra et al., 2005; Lindahl et al., 2001). When
using raw materials high in fat, such as peanuts, the excess fat can be removed
using a separator as in dairy processing (Diarra et al., 2005). Soy beans and nuts
contain little starch, but when using cereals or pseudocereals the starch forms a thick
slurry when heated above the gelatinisation temperature (55-65 °C). To prevent this
in the further processing steps, starch can be gelatinised and liquefied with α-amylase
or a malt enzyme extract (Mitchell and Mitchell, 1990; Tano-Debrah et al., 2005).
The patented process of Lindahl et al. (2001) employs α- and β-amylases to
hydrolyse the starch until a desired level of sweetness and viscosity is reached. The
liquefaction step may take place before or after the removal of coarse particles.
However, according to Mitchell and Mitchell (2010) and Giri and Mangaraj (2012),
heating the slurry above 50 °C before filtration compromises the mouthfeel of rice
and soy milks.
4.1.4. Product formulation
Other ingredients can be added to the product base after the removal of coarse
plant material. These include vitamins and minerals used for fortification as well as
sweeteners, flavourings, salt, oils and stabilisers. As suspension stability is an issue
in plant milk substitute substitutes, hydrocolloids are often used to increase the
viscosity of the continuous phase, and emulsifiers have also been proven to be
beneficial in some beverages. Rustom et al. (1995) yielded the most stable peanut
milk by using a stabiliser mix for dairy products containing mono and diglycerides,
glyceryl monostearate, guar gum and carrageenan, while Hinds et al. (2007b)

Chapter 2
51
achieved good results with 0.02-0.04% carrageenan and 0.2-0.4% mono- and
diglycerides. Lee and Rhee (2003) used pine nuts to improve the stability of a rice
based beverage, as they contain proteins with good emulsifying properties. Sodium
stearoyl-2 lactylate (SSL), a lipid surfactant, has been found to bind specifically to
partially hydrolysed oat proteins and thus enhance the stability of oat protein
suspensions (Chronakis et al., 2004).
The addition of nutrients in food substitutes may be necessary to ensure the
nutritional quality of the product. The nutrients used must be bioavailable and
sufficiently stable, and not cause excessive changes in product quality. The stability
of vitamins is influenced by several factors during food processing, and may be
reduced as a result of e.g. heating oxygen exposure (Richardson, 1990). The
challenge in mineral enrichment is the reactivity of metal ions with other food
components, and the use of sequestrants such as citric acid may thus be necessary
(Richardson, 1990; Zhang et al., 2007a). Some mineral sources used in plant milk
substitutes include ferric ammonium citrate and ferric pyrophosphate as iron sources
and tricalcium phosphate and calcium carbonate as calcium sources (Zhang et al.,
2007a; Zhao et al., 2005).
4.1.5. Homogenisation and suspension stability
Plant milk substitutes contain insoluble particles, such as protein, starch, fibre
and other cellular material. These particles, being denser than water can sediment,
making the product unstable (Durand et al., 2003). The suspension stability can be
increased by decreasing the particle size, improving their solubility or by using
hydrocolloids and emulsifiers (Durand et al., 2003; Rustom et al., 1995). Many plant

Chapter 2
52
milk substitutes coagulate when heating. When proteins unfold as a result of heating,
the nonpolar amino acid residues are exposed to water increasing the surface
hydrophobicity. This enhances protein-protein interactions that can result in
aggregation and sedimentation or gelling (Phillips et al., 1994). The heat stability of
proteins depends on the pH, ionic strength and the presence of other compounds such
as minerals and carbohydrates (McSweeney et al., 2004).
Homogenisation improves the stability of plant milk substitutes by disrupting
aggregates and lipid droplets and thus decreasing the particle size distribution
(Malaki Nik et al., 2008). When enough lipids are present, an emulsion is formed
resulting in a creamier more homogenous product (Chen, 1989). Homogenisation in
the conventional dairy processing pressure range (ca. 20 MPa) increases the
suspension stability sufficiently of at least soy, peanut and rice milk substitutes
(Hinds et al., 1997b; Lee and Rhee, 2003; Rustom et al., 1995). Ultra high pressure
homogenisation (UHPH) of soy milk at 200 MPa reduces the particle sizes intensely,
from 0.55 μm to 0.13 μm (volume weighted mean diameter), and improves the
stability compared to conventionally processed products. The treatment also reduces
microbial counts and can be used for preservation (Cruz et al., 2007). A higher
homogenisation temperature (72-82 °C) has been reported to increase the stability of
peanut milk (Hinds et al., 1997a; Rustom et al., 1995).
In soy milk, heat denaturation of proteins is required for suspension stability.
Malaki Nik et al. (2008) studied the effect of heat denaturation alone and in
combination with homogenisation (69 MPa) by characterising fractions obtained by
stepwise centrifugation. The protein and solids content decreased after the first
centrifugation (8000 g) in the untreated samples, while significant decrease in both
treated samples occurred after the third centrifugation (40 000 g), indicating an

Chapter 2
53
increase in the resistance to sedimentation upon heating and homogenisation. Also
the ratios of β-conglycinin (7S) and glycinin (11S) in the fractions were influenced
by the treatments. This indicates, that although heating decreased the solubility of β-
conglycinin, large glycinin aggregates were disrupted, resulting in suspensions with
smaller particles and a narrower size distribution.
4.1.6. Microbial shelf life extension
Commercial plant milk substitutes are pasteurised or UHT treated to extend the
shelf life. However heat may cause changes in protein properties that can influence
the stability, as well as changes in flavour, aroma and colour (Kwok and Niranjan,
1995; Rustom et al., 1996). Pasteurisation is carried out at temperatures below 100
°C, and destroys enough micro-organisms to enable a shelf-life of ca. 1 week at
refrigerated temperatures. In the UHT treatment, the product is heated to 135-150 °C
for a few seconds, yielding a commercially sterile product (Kwok and Niranjan,
1995). Rustom et al. (1996) treated a peanut beverage for 4 and 20 s at 137 °C. The
longer treatment time decreased the suspension stability slightly, but led to higher
taste and acceptability scores. Both treatments were effective in increasing the
microbial shelf-life; no vegetative bacteria, spores or moulds were detected in the
products.
The manufacturing process of Horchata (tiger nut milk) takes another
approach: the product is not heated to prevent the starch from gelatinising and the
occurrence of other sensory changes resulting from heating. Prepared this way, the
product has an extremely short shelf-life. In commercial products, pulsed electric
fields has been suggested to extend the microbial shelf life (Cortés et al., 2005).

Chapter 2
54
Also, other non-thermal processes such as ultraviolet sterilisation, high pressure
throttling, high pressure processing and ultra high pressure homogenisation (UHPH)
have been explored as methods of soy milk preservation (Bandla et al., 2011; Cruz et
al., 2007; Smith et al., 2009; Sharma et al., 2009). Sikhye, a Korean rice beverage, is
commonly sold frozen to avoid UHT related changes in flavour. However Bacillus
cereus spores are a risk, and their number has successfully been reduced by
tyndallisation with CO2 injection, a procedure consisting of heating to 80 °C to
activate spore germination and subsequent cooling, followed by CO2 injection and
heating to 95 °C (Kim et al., 2012).
4.1.7. Fermented products
Fermentation with lactic acid bacteria improves the sensory and nutritional
properties, and microbial shelf life of foods (Leroy and De Vuyst, 2004). Plant milk
substitutes can be fermented to produce dairy free yoghurt type products while
rendering the raw material into a more palatable form. For example, the levels of
hexanal responsible for the undesired beany flavour in peanut milk is efficiently
reduced with fermentation (Lee and Beuchat, 1991). Also, the levels of aflatoxin B1
commonly found in peanuts, is reduced by fermentation with Flavobacterium
aurantiacum (Hao and Brackett, 1988). Fermentation of soy milk reduced the
amount of flatulence inducing oligosaccharides depending on the α-galactosidase
activity of the strain, and increased the angiotensin-converting enzyme (ACE)
inhibitory activity (Donkor et al., 2007). The storage proteins of various cereals
contain known ACE inhibitory peptides that can be released using fermentation and
exogenous proteases as has been demonstrated with rye malt (Hu et al., 2011;

Chapter 2
55
Loponen, 2004). These cereals may have potential as raw materials for dairy type
functional products.
In order to produce fermented products, the starter cultures must be able
to grow and dominate the microflora in the plant medium and produce a desired
texture. Lactic acid bacteria have been used for cereal fermentations for centuries and
many cereals and pseudocereals are known to support their growth, but low levels of
fermentable sugars present in some grains may pose a problem (Zannini et al. 2012).
To overcome this, sugars and food grade yeast extract can be added to the media
(Diarra et al., 2005). Also, germinating the raw material to increase the amount of
fermentable sugars and amino acids before processing improves the growth
performance of probiotic strains (Charalampopoulos et al., 2002). Mårtensson et al.
(2000) studied the growth and product characteristics of an oat milk medium
fermented with a range of starter cultures. They found, that strains of Leuconostoc
mesenteriodes, Leuc. dextranicum, Pediococcus damnosus and Lactobacillus kefiri
produced the highest levels of lactic acid, resulting in a pleasant flavour. In addition,
an EPS producing strain of L. delbrueckii ssp. bulgaricus yielded a viscosity
comparable to dairy yoghurts after 72 h fermentation at 25 °C when glucose was
used as a carbon source. Jiménez-Martínez et al. (2003) obtained a product with a
viscosity similar to dairy yoghurt but slightly lower hedonic rating by fermenting
milk extracted from Lupinus campestris seeds with Streptococcus thermophilus and
L. delbrueckii ssp bulgaricus.
Probiotic dairy products have been available for years, but also non-dairy raw
materials can be used as vehicles for probiotic strains for the dairy intolerant or
vegetarian/vegan consumers (Prado et al., 2008). Donkor et al. (2007) reached
desired therapeutic levels of cells (108 cfu/ml) after fermenting soy milk with a range

Chapter 2
56
of probiotic strains for 48 h. Mårtensson et al. (2002) reported inhibition of some
probiotic strains in an oat product when used in combination with a yoghurt starter
culture, as the pH of the medium decreases excessively due to a lower buffering
capacity in comparison to cow’s milk. However a strain of L. reuteri was able to
survive at a therapeutic levelfo at least for 30 days (Mårtensson et al., 2002).
Some authors have used additives such as CMC, coagulants (calcium
citrate), milk powder and gelatin to enhance the texture and reduce syneresis in the
final product (Cheng et al., 2006; Yadav et al., 2010). However, the use of animal
ingredients in this product category in the Western market excludes the
vegetarian/vegan consumer segment. Yazici et al. (1997) aimed to increase the
calcium content of peanut yoghurt to the level of fat free dairy yoghurt, but the
calcium salts decreased the gel strength and promoted syneresis. In addition to plant
milk substitutes, also suspensions of solid grain material can been used as media for
fermentation, yielding a gruel like product (Salovaara, 2004). This enables a more
economic utilisation of the raw material, as well as better preservation of the
nutritional properties such as high fibre content.
4.1.8. Other products
Other products mimicking, e.g., cream, cream cheese, ice cream and dairy
desserts exist in the market. These products are not widely studied, but some reports
dealing with soy-based products are available. Zulkurnain et al. (2008) developed a
soy cream cheese from blended tofu, carrageenan, salt, pectin and maltodextrin were
used to modify the textural properties to resemble those of dairy cream cheese The
resulting product was, however, lacking the elasticity of its dairy counterpart, despite

Chapter 2
57
the modifiers. A later study from the same group showed that this product supports
the growth of probiotic Lactobacilli, and can be used as a carrier for probiotics
(Liong et al., 2009). Granato et al. (2010) optimised the composition for a high
protein dessert based on soy protein and guava juice. The resulting product was of
acceptable sensory quality even at a protein concentration of 3%. Rheological or
textural properties were not reported. Production of an ice cream substitute is
possible using soy bean powder and oil to replace dairy ingredients (Her et al., 2005).
The overrun and meltdown were significantly lower in the soy product compared to
dairy ice cream and also low sensory scores were attained, especially for mouth feel
and melting feel (Her et al., 2005).
4.2. Nutritional properties
Plant milk substitutes are often perceived as healthy, possibly due to negative
perceptions about the nutritional properties of cow’s milk and the health claims
associated with soy (Bus and Worsley, 2003; Patisaul and Jefferson, 2010). In
reality, the nutritional properties vary greatly, as they depend strongly on the raw
material, processing, fortification and the presence of other ingredients such as
sweeteners and oil. The nutritional values of plant milk substitutes purchased from a
local store in Ireland are presented in Table 2.8. When comparing the products, it is
evident that only soy milk has values comparable to cow’s milk, with protein
contents ranging from 2.9-3.7%. All other products are very low in protein, with only
quinoa, hemp and Oatly oat milk containing ≥1% protein. This may pose a risk if
plant milk substitutes are used to replace cow’s milk without knowledge about the
differences, especially when given to young children: several cases of kwashiorkor, a
protein-energy malnutrition typical for areas of famine, have been reported in

Chapter 2
58
Western countries as a result of using rice milk (0.1-0.2% protein) as a weaning food
(Carvalho et al., 2001; Katz et al., 2005). Also, milks produced from legumes other
than soy, such as peanut and cowpea, can have a protein content as high as 4%
(Rustom et al., 1991; Tano-Debrah et al., 2005). Although plant milk substitutes are
low in saturated fats and most products have caloric counts comparable to skim milk,
some products contain as much energy as full fat milk, originating mostly from
sugars and other carbohydrates.
Plant proteins are generally of a lower nutritional quality compared to animal
derived proteins due to limiting amino acids (lysine in cereals, methionine in
legumes) and poor digestibility (Friedman, 1996). PDCAAS and PER values of some
raw materials used in commercially available plant milk substitutes are listed and
compared to the values of cow’s milk were presented previously in Table 2.3 [2.1.2].
Both values are the highest for cow’s milk followed by heat treated soy. PDCAAS
values for all other raw materials fall below 67.7%, quinoa and hemp scoring
highest, with the exception of amaranth protein concentrate with a value of 83%.
PER of cow’s milk is 3.1, while the closest plant protein sources are quinoa,
amaranth and soy (all heat treated) with values 2.7, 2.6 and 2.28, respectively. The
extremely low PER value for raw soy (0.46) reflects the presence of protease
inhibitors that are inactivated upon heating (Friedman, 1996).
In addition to containing high value protein, milk and other dairy products
provide 30–40% of dietary calcium, iodine, vitamin B12 and riboflavin, and
population groups with low milk intakes often have a poor status for these
nutrients (Millward and

Chapter 2
59
Table 2.8. Some plant milk substitutes on the market. Nutritional values per g/100 ml.
Beverage
(manufacturer) Energy (kcal) Protein
Carbohydrate
(sugars) Fat (saturated) Fibre Fortification
Cow’s milk (full) 1 64 3.3 4.6 (4.6) 3.9 (2.5) - -
Cow’s milk (skim) 1 33 3.5 4.8 (4.8) 0.3 (0.1) - -
Soy (Alpro, UK) 38 2.9 2.8 (2.7) 1.7 (0.3) 0.5 Ca, B2, B12, D, E
Soy (Tesco, UK) 32 3.4 0.2 (0.1) 1.9 (0.3) 0.6 Ca, E, D, B12
Oat (Alpro , UK) 66 0.4 12.7 (5.7) 1.5 (0.57) 0.0 -
Oat (Oatly, SE) 35 1 6.5 (4.0) 0.7 (0.1) 0.8 Ca, D2, B2, B12
Kamut, (La Finestra
Sul
Cielo,IT)
46 0.7 7.5 (4.6) 1.4 (0.2) 0.5 -
Amaranth (Ecomil,
SP) 52 0.6 8 (5.0) 1.9 (0.5) 0.3 -
Sesame (Ecomil, SP) 51 0.6 6.7 (3.4) 2.4 (0.5) 0.2 -
Quino (Ecomil, SP) 46 1.5 3.7 (2.5) 2.8 (0.7) 0.6 -
Hemp (Braham and
Murray, UK) 36 1.3 2.2 (2.1) 2.4 (0.3) 0.2 Ca
*, D2
Rice (Hain Europe,
BE) 47 0.1 9.4 (4.0) 1.0 (0.1) 0.1 -
Rice (Alpro, UK) 60 0.2 12.2 (5.0) 1.2 (0.2) 0.0 Ca, B1, B6, B12
Almond (Alpro, UK) 24 0.5 3.0 (3.0) 1.1 (0.1) 1.6 Ca, B2, B12, D2 1 Food Standards Agency (2002) McCance and Widdowson’s The Composition of Foods, 6
th Ed. Cambridge: Royal Society of Chemistry.

Chapter 2
60
Garnett, 2010; Black et al., 2002). To combat these shortcomings, some plant milk
substitutes are fortified with calcium and vitamins, mainly B12, B2, D and E (Table
2.8). However, consumer awareness is important as many of these products are not
fortified.
Calcium absorption depends on the salt used for fortification as well as the
food matrix (Rafferty et al., 2007). A comparison between cow’s milk and soy milk
fortified with tricalcium phosphate revealed a 75% absorption in soy milk compared
to cow’s milk, while no differences have been observed when calcium carbonate was
used (Heaney et al., 2000; Zhao et al., 2005). Ionic calcium precipitates soy proteins
especially when subjected to thermal treatments, which may influence the calcium
content of the beverage consumed (Pathomrungsiyounggul et al., 2010). Indeed, 82%
to 89% of the calcium in soy and rice milks, respectively, are separable by
centrifugation at 3740 g, whereas the value for cow’s milk is 11%, which may
indicate a decrease in the calcium content of a beverage not properly shaken before
use (Heaney et al., 2005). Despite these shortcomings, fortified plant milk substitutes
may be a valuable source of calcium for individuals with medical conditions that
prevent the consumption of dairy products, and offering soy milk as an option in
elementary schools has been reported to increase the selection of a calcium rich
beverage slightly (Reilly et al., 2006).
Some plant derived components have favourable health effects, that may be
present in the beverages produced from that raw material. For example, replacing
low fat cow’s milk with oat or soy milks has been reported to decrease the plasma
cholesterol and low density lipoprotein (LDL) concentrations of healthy individuals
after a 4 week consumption period (Önning et al., 1998). Soy has been perceived as a

Chapter 2
61
health food due to its isoflavone content with reported impacts on the prevention of
e.g. cardiovascular diseases, prostate cancer and osteoporosis (Patisaul and Jefferson,
2010). The health benefits of isoflavones have however become increasingly
controversial and concerns have been raised especially about maternal soy intake and
the use of soy in infant formulas. Isoflavones have a complex interaction in the
endocrine network, and the effect of long term effect of a soy based diet in early
childhood is not known. The serum isoflavone concentration of infants on soy
formula can be as high as 10-fold compared to the concentrations in Japanese adults
(Patisaul and Jefferson, 2010; Andres et al., 2011).
Processing influences the nutritional properties of foods. For example, the
beneficial effects of oat β-glucan on serum LDL cholesterol and postprandial glucose
levels are attributed mainly to the viscosity it forms in aqueous solutions, which is
sensitive to processing (Wood, 2010). Both homogenisation and thermal treatments
have been reported to alter the molecular properties of oat β-glucan (Kivelä et al.,
2011; Kivelä et al., 2010). No significant loss of isoflavones occurs during soy milk
processing, but coagulating the soy proteins in tofu processing decreases the total
isoflavones by 44% (Wang and Murphy, 1996). Another study reports a recovery of
54% isoflavones during soymilk processing and 36% for tofu production (Jackson et
al., 2002).
Water-soluble vitamins can be lost if the raw material is soaked and/or
blanched before the manufacturing process (Kwok and Niranjan, 1995). Also high
amounts of minerals (Ca, Fe, P, Zn) (45-74%) are lost during the decanting step in
oat milk production (Ca, Fe, P, Zn) and 47% of native vitamin B6 (Zhang et al.,
2007b). The destruction of heat sensitive vitamins depends on the time temperature
exposure (Kwok and Niranjan, 1995). UHT treatment caused a 60% loss of D3 after

Chapter 2
62
5 s holding time, while increasing the holding time to 20 s led to a 30% decrease in
B12 concentration. The loss of thiamine (B1) can be minimised by favouring high
temperature short time heat exposure in the manufacturing process in soy milk
production (Kwok and Niranjan, 1995). Significant losses of A, D3 and B12 occurred
during the storage of oat milk, while the levels of folic acid and vitamins C, B6 and
B12 are reduced in soy milk (Zhang et al., 2007b; Kwok and Niranjan, 1995).
4.3. Impact on climate and land use
At the moment climate change is considered one of the most important and
serious phenomena caused by human action. Greenhouse gases (GHG) varying in
their global warming potential are a very probable cause of global warming (IPCC,
2008). GHG emissions originating from food production are remarkable: In the
European Union about 29% of total contributions to global warming are estimated to
come from the food chain (Huppes et al., 2008). According to FAO, livestock is
responsible of 18% of the global GHG emissions, of which dairy production and
processing is estimated to contribute 4% (Steinfeld et al., 2006) (Gerber, 2010).
Main contributors to global warming from livestock sector are methane from enteric
fermentation, nitrous oxide from manure and fertilizer, carbon dioxide from land use
changes and agricultural energy use (Steinfeld et al., 2006). GHGs differ in their
radiative properties and lifetimes in the atmosphere. The warming potentials are
commonly expressed as CO2 equivalents (CO2-eq), the amount of CO2 emission that
would have the same warming effect (IPCC, 2008).
In addition to GHG emissions, another major environmental impact of food
production is land use and changes in soil such as eutrophication and acidification.
Fertile land is a scarce resource, and foods requiring large production areas are less

Chapter 2
63
sustainable even if the direct emissions are low (Sonesson et al., 2010). On a per kg
basis, the production of plant foods generally emits less GHG and requires less land
than does the production of meat and dairy products (Sonesson et al., 2010; Nijdam
et al., 2012).
The global warming potential of cow’s milk varies in the range of 0.84–1.3
CO2-eq/ kg product (De Vries and De Boer, 2010). Studies dealing with the GHG
emissions of plant milk substitutes are scarce, but the few reports published suggest
lower values compared to cow’s milk. According to Smedman et al. (2010) the GHG
emissions produced during a life cycle of oat and soy drinks are 0.21 and 0.31 kg
CO2-eq/kg product. The global warming potential for commercial Oatly oat milk is
0.32 g CO2-eq/l product (Dahllöv and Gustafsson, 2008). Mikkola and Risku-Norja
(2008) compared the pre-farm gate GHG emissions from optional milk production
systems in Finland. The estimated emissions expressed as kg CO2-eq per capita per
year were 4-8 times higher for cow’s milk compared to oat and soy milks.
The nutritional profiles of dairy and plant based products are different, which
makes the direct comparison of the GHG emissions challenging. One approach is to
relate the environmental impact to the protein content. Nijdam et al. (2012) evaluated
the GHG emissions and land use of protein from different sources. The productions
of one kg protein from milk emits 28-43 CO2-eq and requires 26-54 m2 land,
whereas the figures are 4-10 CO2-eq and 10-43 m2 for pulse protein and 6-17 CO2-eq
and 4-25 m2 for vegetable based meat analogue protein. González et al. (2011)
estimated so-called protein delivery efficiency GHG values (g protein/kg CO2-eq)
for a range of foodstuffs. The values were 31 g for milk and 505 g, 359 g and 56 g
for unprocessed soybean, oat and rice protein, respectively. Smedman et al. (2010)
developed a so-called nutrient density to climate impact index (NDCI), aiming to

Chapter 2
64
reflect the proportion of daily nutrient requirements and the contribution of each
nutrient to the Swedish diet in relation to the GHG emissions. As a result the index
for cow’s milk was superior to oat and soy drinks. The equation used in this study
has however been criticised as biased and the finding questioned by other scientists
in the field (Scarborough and Rayner, 2010).
Judging from the very limited literature, plant milk substitutes have a lower
impact on the climate and require less land to produce, but the issue is more complex
as cow’s milk contains several key nutrients (calcium, high quality protein). It is
important for the plant milk industry to either formulate the products to match cow’s
milk in composition, or ensure that consumers are well aware of the limitations.

Chapter 2
65
References
Abbottagra, 2013. Quinoa - AbbottAgra. URL: http://www.abbottagra.com/2.html
(accessed 3.3.14).
Abdo, K. M., and King, K. W. 1967. Enzymic modification of the extractability of
protein from soybeans, Glycine max. J. Agric. Food Chem. 15, 83-87.
Abugoch, L., E., 2009. Quinoa (Chenopodium quinoa Willd.): Composition,
Chemistry, Nutritional, and Functional Properties. Adv. Food Nutr. Res. 58, 1–
31.
Abugoch, L.E., Tapia, C., Villamán, M.C., Yazdani-Pedram, M., Díaz-Dosque, M.,
2011. Characterization of quinoa protein–chitosan blend edible films. Food
Hydrocoll. 25, 879–886.
Adachi, M., Kanamori, J., Masuda, T., Yagasaki, K., Kitamura, K., Mikami, B.,
Utsumi, S., 2003. Crystal structure of soybean 11S globulin: glycinin A3B4
homohexamer. Proc. Natl. Acad. Sci. U. S. A. 100, 7395–400.
Adachi, M., Takenaka, Y., Gidamis, A.B., Mikami, B., Utsumi, S., 2001. Crystal
structure of soybean proglycinin A1aB1b homotrimer. J. Mol. Biol. 305, 291–
305.
Agu, R.C., Palmer, G.H., 1997. The effect of temperature on the modification of
sorghum and barley during malting. Process Biochem. 32, 501–507.
Ahamed, N., 1996. Studies on Chenopodium quinoa and Amaranthus paniculatas
starch as biodegradable fillers in LDPE films. Carbohydr. Polym. 31, 157–160.
Ahamed, N.T., Singhal, R.S., Kulkarni, P.R., Pal, M., 1998. Nutrients and
antinutrients in quinoa seed. Food Nutr. Bull. 19, 61–70.
Ahrens, S., Venkatachalam, M., Mistry, A. M., Lapsley, K., and Sathe, S. K. 2005.
Almond (Prunus dulcis L.) protein quality. Plant Food Hum. Nutr. 60, 123-
128.
Aidoo, H., Sakyi‐Dawson, E., Abbey, L., Tano‐Debrah, K., and Saalia, F. K. 2012.
Optimisation of chocolate formulation using dehydrated peanut–cowpea milk
to replace dairy milk. J. Sci. Food Agric. 92, 224-231.
Akinyele, I. 1991. Effect of process method on the energy and protein content,
antinutritional factors and in-vitro protein digestibility of cowpea milk (Vigna
unguiculata). Food Chem. 42, 129-134.
Almondbreeze.com, 2014. Website of the Almond Breeze brand of Blue Diamond®
Growers. http://www.almondbreeze.com/ (accessed 25.9.2014).
Alpro.com, 2014. Website of the Alpro™ brand by The WhiteWave Foods
Company. http://www.alpro.com (accessed 25.9.2014).

Chapter 2
66
Alvarez-Jubete, L., Arendt, E.K., Gallagher, E., 2009. Nutritive value and chemical
composition of pseudocereals as gluten-free ingredients. Int. J. Food Sci. Nutr.
60 Suppl 4, 240–57.
Alvarez-Jubete, L., Auty, M., Arendt, E.K., Gallagher, E., 2009. Baking properties
and microstructure of pseudocereal flours in gluten-free bread formulations.
Eur. Food Res. Technol. 230, 437–445.
Alvarez-Jubete, L., Wijngaard, H., Arendt, E.K., Gallagher, E., 2010. Polyphenol
composition and in vitro antioxidant activity of amaranth, quinoa buckwheat
and wheat as affected by sprouting and baking. Food Chem. 119, 770–778.
Ando, H., Chen, Y.-C., Tang, H., Shimizu, M., Watanabe, K., Mitsunaga, T., 2002.
Food components in fractions of quinoa seed. Food Sci. Technol. Res. 8, 80–84.
Andres, S., Abraham, K., Appel, K. E., and Lampen, A. 2011. Risks and benefits of
dietary isoflavones for cancer. Crit. Rev. Toxicol. 41, 1-30.
Araujo-Farro, P.C., Podadera, G., Sobral, P.J.A., Menegalli, F.C., 2010.
Development of films based on quinoa (Chenopodium quinoa, Willdenow)
starch. Carbohydr. Polym. 81, 839–848.
Arcot, J., Wong, S., Shrestha, A.K., 2002. Comparison of folate losses in soybean
during the preparation oftempeh and soymilk. J. Sci. Food Agric. 82, 1365–
1368.
Atwell, W.A., Hyldon, R.G., Godfrey, P.D., 1988. Germinated quinoa flour to reduce
the viscosity of starchy foods. Cereal Chem. 65, 508–509.
Ba, K., Aguedo, M., Tine, E., Paquot, M., Destain, J., Thonart, P., 2013. Hydrolysis
of starches and flours by sorghum malt amylases for dextrins production. Eur.
Food Res. Technol. 236, 905–918.
Bailly, C., 2004. Active oxygen species and antioxidants in seed biology. Seed Sci.
Res. 14, 93–107.
Bandla, S., Choudhary, R., Watson, D. G., and Haddock, J. 2011. UV-C treatment of
soymilk in coiled tube UV reactors for inactivation of Escherichia coli
W1485 and Bacillus cereus endospores. LWT - Food Sci. Technol. 46, 71-76.
Bazile, D., Fuentes, F., Mujica, A., 2013. Historical perspectives and domestication,
in: Bhargava, A., Srivastava, S. (Eds.), Quinoa: Botany, Production and Uses.
CABI, Wallingford.
Becker, R., Hanners, G.D., 1990. Compositional and nutritional evaluation of quinoa
whole grain flour and mill fractions. LWT - Food Sci. Technol. 23, 441–444.
Bekaert, S., Storozhenko, S., Mehrshahi, P., Bennett, M.J., Lambert, W., Gregory,
J.F., Schubert, K., Hugenholtz, J., Van Der Straeten, D., Hanson, A.D., 2008.
Folate biofortification in food plants. Trends Plant Sci. 13, 28–35.

Chapter 2
67
Berghofer, E., Schoenlechner, R., 2008. South American traditional pseudocereals.
In: Thomas Gillgren (Ed.), Traditional grains for low environmental impact and
good health, Gothenburg, Sweden, pp. 28–31.
Bergamo, P., Maurano, F., Mazzarella, G., Iaquinto, G., Vocca, I., Rivelli, A.R., De
Falco, E., Gianfrani, C., Rossi, M., 2011. Immunological evaluation of the
alcohol-soluble protein fraction from gluten-free grains in relation to celiac
disease. Mol. Nutr. Food Res. 55, 1266–70.
Bewley, J.D, Black, M., 1994. Dormancy and the Control of Germination, in: Seeds -
Physiology of Development and Germination. Springer US, Boston, MA, pp.
199–271.
Bewley, J.D., 1997. Seed Germination and Dormancy. Plant Cell 9, 1055–1066.
Bewley, J.D., Black, M., 1994a. Germination, Structure and Composition, in: Seeds -
Physiology of Development and Germination. Plenum Press, New York, pp. 1–
33.
Bewley, J.D., Black, M., 1994b. Cellular events during germination and growth, in:
Seeds - Physiology of Development and Germination. Plenum Press, New York,
pp. 147–197.
Bewley, J.D., Black, M., 1994c. Mobilization of stored seed reserves, in: Seeds -
Physiology of Development and Germination. Plenum Press, New York, pp.
293–343.
Black, R. E., Williams, S. M., Jones, I. E., and Goulding, A. 2002. Children who
avoid drinking cow milk have low dietary calcium intakes and poor bone
health. Am. J. Clin. Nutr. 76, 675-680.
Bode, S., and Gudmand-Høyer, E. 1988. Incidence and clinical significance of
lactose malabsorption in adult coeliac disease. Scand. J. Gastroenterol. 23,
484-488.
Bonifacio, A., 2003. Chenopodium Sp.: Genetic Resources, Ethnobotany, and
Geographic Distribution. Food Rev. Int. 19, 1–7.
Briggs, D.E., 1998. Malts and Malting. Blackie Academic and Professional, London,
UK.
Brinegar, C., Goundan, S., 1993. Isolation and characterization of chenopodin, the
11S seed storage protein of quinoa (Chenopodium quinoa). J. Agric. Food
Chem. 41.
Brinegar, C., Sine, B., Nwokocha, L., 1996. High-Cysteine 2S Seed Storage Proteins
from Quinoa (Chenopodium quinoa). J. Agric. Food Chem. 44, 1621–1623.
Brockington, S.F., Walker, R.H., Glover, B.J., Soltis, P.S., Soltis, D.E., 2011.
Complex pigment evolution in the Caryophyllales. New Phytol. 190, 854–864.

Chapter 2
68
Buléon, A., Colonna, P., Planchot, V., Ball, S., 1998. Starch granules: structure and
biosynthesis. Int. J. Biol. Macromol. 23, 85–112.
Bus, A., Worsley, A. 2003. Consumers' health perceptions of three types of milk: a
survey in Australia. Appetite. 40, 93-100.
Buttriss, J.L., Stokes, C.S., 2008. Dietary fibre and health: an overview. Nutr. Bull.
33, 186–200.
Cabrejas, M., Diaz, M., Aguilera, Y., Benitez, V., Molla, E., Esteban, R., 2008.
Influence of germination on the soluble carbohydrates and dietary fibre
fractions in non-conventional legumes. Food Chem. 107, 1045–1052.
Camire, M.E., 1991. Protein functionality modification by extrusion cooking. J. Am.
Oil Chem. Soc. 68, 200–205.
Caperuto, L.C., Amaya-Farfan, J., Camargo, C.R., 2001. Performance of quinoa
(Chenopodium quinoa Willd.) flour in the manufacture of gluten-free spaghetti.
J. Sci. Food Agric. 81, 95–101.
Carlshamnmejeri.se, 2014. Website of the Carlshamn brand of O. Kavli AB.
http://www.carlshamnmejeri.se (accessed 25.9.2014).
Carvalho, N. F., Kenney, R. D., Carrington, P. H., and Hall, D. E. 2001. Severe
nutritional deficiencies in toddlers resulting from health food milk
alternatives. Pediatrics. 107, 46.
Casey, R., 1999. Distribution and some properties of seed globulins, in: Shewry, P..
(Ed.), Seed Proteins. Springer Netherlands, pp. 159–169.
Catassi, C., Fasano, A., 2008. Celiac disease. Curr. Opin. Gastroenterol. 24, 687–
691.
Ceppi, E.L.M., Brenna, O. V, 2010. Experimental studies to obtain rice malt. J.
Agric. Food Chem. 58, 7701–7.
Chang, K.C., Harrold, R.L., 1988. Changes in selected biochemical components, in
vitro protein digestibility and amino acids in two bean cultivars during
germination. J. Food Sci. 53, 783–787.
Charalampopoulos, D. Pandiella, S.S., and Webb, C. 2002. Growth studies of
potentially probiotic lactic acid bacteria in cereal-based substrates. J Appl.
Microbiol. 92, 851-859.
Chauhan, G.S., Eskin, N.A.M., Tkachuk, R., 1992. Nutrients and antinutrients in
quinoa seed. Cereal Chem. 69, 85–88.
Chen, S., 1989. Preparation of fluid soymilk. In: Applewhite, T. N., (Ed.),
Proceedings of the World Congress on Vegetable protein Utilization in

Chapter 2
69
Human Foods and Animal Feedstuffs. American Oil Chemists Society,
Champaign, Illinois, pp. 341-351.
Cheng, Y., Thompson, L., and Brittin, H., 2006. Sogurt, a yogurt‐like soybean
product: development and properties. J. Food Sci. 55, 1178-1179.
Chillo, S., Laverse, J., Falcone, P.M., Del Nobile, M.A., 2008. Quality of spaghetti in
base amaranthus wholemeal flour added with quinoa, broad bean and chick pea.
J. Food Eng. 84, 101–107.
Chronakis, I. S., Fredholm, A., Triantafyllou, A. Ö., and Öste, R., 2004. Complex
formation in aqueous medium of partially hydrolysed oat cereal proteins with
sodium stearoyl-2 lactylate (SSL) lipid surfactant and implications for bile
acids activity. Colloids Surf., B. 35, 175-184.
Codex Alimentarius. 1999. CODEX STAN 206-1999.
Cordeiro, L.M.C., Reinhardt, V. de F., Baggio, C.H., Werner, M.F. de P., Burci,
L.M., Sassaki, G.L., Iacomini, M., 2012. Arabinan and arabinan-rich pectic
polysaccharides from quinoa (Chenopodium quinoa) seeds: Structure and
gastroprotective activity. Food Chem. 130, 937–944.
Cortés, C., Esteve, M., Frıgola, A., and Torregrosa, F., 2005. Quality characteristics
of horchata (a Spanish vegetable beverage) treated with pulsed electric fields
during shelf-life. Food Chem. 91, 319-325.
Crittenden, R. G., and Bennett, L. E., 2005. Cow’s milk allergy: a complex disorder.
J. Am. Coll. Nutr. 24, 582-591.
Cruz, N., Capellas, M., Hernandez, M., Trujillo, A., Guamis, B., and Ferragut, V.,
2007. Ultra high pressure homogenization of soymilk: Microbiological,
physicochemical and microstructural characteristics. Food Res. Int. 40, 725-
732.
Cunnane, S.C., Ganguli, S., Menard, C., Liede, A.C., Hamadeh, M.J., Chen, Z.-Y.,
Wolever, T.M.S., Jenkins, D.J.A., 2007. High α-linolenic acid flaxseed (Linum
usitatissimum):some nutritional properties in humans. Br. J. Nutr. 69, 443.
Dahllöv, O., and Gustafsson, M., 2008. Livscykelanalys av Oatly havredryck. M. Sc.
thesis. Lund University, Lund, Sweden.
De Boland, A.R., Garner, G.B., O’Dell, B.L., 1975. Identification and properties of
phytate in cereal grains and oilseed products. J. Agric. Food Chem. 23, 1186–
1189.
De Bree, A., van Dusseldorp, M., Brouwer, I.A., van het Hof, K.H., Steegers-
Theunissen, R.P.M., 1997. Folate intake in Europe: recommended, actual and
desired intake. Eur. J. Clin. Nutr. 51, 643–660.

Chapter 2
70
De Vries, M., De Boer, I., 2010. Comparing environmental impacts for livestock
products: A review of life cycle assessments. Livest.Sci. 128, 1-11.
Debruyne, I., 2006 Soy base extract: soymilk and dairy alternatives. In: Soy
applications in foods. Riaz, M. N., (Ed.), Taylor & Francis, Boca Raton,
Florida, U.S.A, pp. 111-134.
Delcour, J., Hoseney, R.C., 2010. Principles of Cereal Science and Technology, 3rd
ed, Principles of Cereal Science and Technology. AACC International. Inc, St.
Paul.
Diarra, K., Nong, Z. G., and Jie, C., 2005. Peanut milk and peanut milk based
products production: A review. Crit. Rev. Food. Sci. Nutr. 45, 405-423.
Dini, I., Tenore, G.C., Dini, A., 2002. Oleanane saponins in “Kancolla”, a sweet
variety of Chenopodium quinoa. J. Nat. Prod. 65, 1023–1026.
Dogan, H., Karwe, M. V., 2003. Physicochemical properties of quinoa extrudates.
Food Sci. Technol. Int. 9, 101–114.
Donkor, O., Henriksson, A., Vasiljevic, T., and Shah, N. P., 2007. α-Galactosidase
and proteolytic activities of selected probiotic and dairy cultures in fermented
soymilk. Food Chem. 104, 10-20.
Duodu, K.G., Taylor, J.R., 2012. The quality of breads made with non-wheat flours,
in: Cauvain, S.P. (Ed.), Breadmaking. Woodhead Publishing, Cambridge, UK,
pp. 754–782.
Durand, A., Franks, G., and Hosken, R., 2003. Particle sizes and stability of UHT
bovine, cereal and grain milks. Food Hydrocoll. 17, 671-678.
Egli, I., Davidsson, L., Juillerat, M.A., Barclay, D., Hurrell, R.F., 2002. The
influence of soaking and germination on the phytase activity and phytic acid
content of grains and seeds potentially useful for complementary feeding. J.
Food Sci. 67, 3484–3488.
Elgeti, D., Nordlohne, S.D., Föste, M., Besl, M., Linden, M.H., Heinz, V., Jekle, M.,
Becker, T., 2014. Volume and texture improvement of gluten-free bread using
quinoa white flour. J. Cereal Sci. 59, 41–47.
Elkhalil, E.A., El Tinay, A., Mohamed, B., Elsheikh, E.A., 2001. Effect of malt
pretreatment on phytic acid and in vitro protein digestibility of sorghum flour.
Food Chem. 72, 29–32.
Eriksen, S., 1983. Application of enzymes in soy milk production to improve yield. J.
Food. Sci. 48, 445-447.
Escudero, N., De Arellano, M., Luco, J., Giménez, M., and Mucciarelli, S., 2004.
Comparison of the chemical composition and nutritional value of Amaranthus
cruentus flour and its protein concentrate. Plant Food Hum. Nutr. 59, 15-21.

Chapter 2
71
FAO, 1998. The State of the World’s Plant Genetic Resources for Food and
Agriculture. FAO, Rome, Italy.
FAO, 2011. Dietary protein quality evaluation in human nutrition - Report of an
FAO expert consultation. FAO Food and nutrition paper 92. Auckland, New
Zealand.
Finch-Savage, W.E., Leubner-Metzger, G., 2006. Seed dormancy and the control of
germination. New Phytol. 171, 501–23.
Friedman, M., 1996. Nutritional value of proteins from different food sources. A
review. J. Agric. Food. Chem. 44, 6-29.
Friedman, M., Brandon, D. L., Bates, A. H., Hymowitz, T., 1991. Comparison of a
commercial soybean cultivar and an isoline lacking the Kunitz trypsin
inhibitor: composition, nutritional value, and effects of heating. J. Agric.
Food Chem. 39, 327-335.
Galwey, N., 1995. Quinoa and relatives. In: Evolution of crop plants. Longman
scientific and technical, Harlow, pp. 41-46.
Gambuś, H., Gambuś, F., Wrona, P., Pastuszka, D., Ziobro, R., Nowotna, A., Kopeć,
A., Sikora, M., 2009. Enrichment of gluten-free rolls with amaranth and
flaxseed increases the concentration of calcium and phosphorus in the bones of
rats. Polish J. Food Nutr. Sci. 59.
Garcia, L. A., Alfaro, M. A., and Bressani, R., 1987. Digestibility and protein quality
of raw and heat-processed defatted and nondefatted flours prepared with three
amaranth species. J. Agric. Food. Chem. 35, 604-607.
Gebremariam, M.M., Zarnkow, M., Becker, T., 2012. Effect of drying temperature
and time on alpha-amylase, beta-amylase, limit dextrinase activities and
dimethyl sulphide level of teff (Eragrostis tef) malt. Food Bioprocess Technol.
6, 3462–3472.
Gerber, P., Vellinga, T., Opio, C., Henderson, B., Steinfeld, H., 2010. Greenhouse
gas emissions from the dairy Sector - a life cycle assessment. Food and
Agriculture Organization of the United Nations, Rome, Italy.
Giacomino, S., Peñas, E., Ferreyra, V., Pellegrino, N., Fournier, M., Apro, N.,
Carrión, M.O., Frias, J., 2013. Extruded flaxseed meal enhances the nutritional
quality of cereal-based products. Plant Foods Hum. Nutr. 68, 131–6.
Giami, S.Y., Chibor, B.S., Edebiri, K.E., Achinewhu, S.C., 1999. Changes in
nitrogenous and other chemical constituents, protein fractions and in vitro
protein digestibility of germinating fluted pumpkin (Telfairia occidentalis
Hook) seed. Plant Foods Hum. Nutr. 53, 333–342.

Chapter 2
72
Gillgren, T., Stading, M., 2007. Non-food use of cereal by-products. Proceedings of
Traditional Grains for Low Environmental Impact and Good Health. Pretoria,
South Africa.
Giri, S., Mangaraj, S., 2012. Processing Influences on Composition and Quality
Attributes of Soymilk and its Powder. Food Eng. Rev. 4, 149-164.
Glitsø, L.V., Bach Knudsen, K.E., 1999. Milling of whole grain rye to obtain
fractions with different dietary fibre characteristics. J. Cereal Sci. 29, 89–97.
González, A. D., Frostell, B., Carlsson-Kanyama, A., 2011. Protein efficiency per
unit energy and per unit greenhouse gas emissions: Potential contribution of
diet choices to climate change mitigation. Food Policy. 36, 562-570.
Granato, D., Ribeiro, J.C.B., Castro, I.A., Masson, M.L., 2010. Sensory evaluation
and physicochemical optimisation of soy-based desserts using response surface
methodology. Food Chem. 121, 899–906.
Gray, D.A., Auerbach, R.H., Hill, S., Wang, R., Campbell, G.M., Webb, C., South,
J.B., 2000. Enrichment of oat antioxidant activity by dry milling and sieving. J.
Cereal Sci. 32, 89–98.
Grieshop, C.M., Fahey, G.C., 2001. Comparison of quality characteristics of
soybeans from Brazil, China, and the United States. J. Agric. Food Chem. 49,
2669–2673.
Griffith, L.D., Castell-Perez, M.E., Griffith, M.E., 1998. Effects of blend and
processing method on the nutritional quality of weaning foods made from select
cereals and legumes. Cereal Chem. 75, 105–112.
Gualberto, D.G., Bergman, C.J., Kazemzadeh, M., Weber, C.W., 1997. Effect of
extrusion processing on the soluble and insoluble fiber, and phytic acid contents
of cereal brans. Plant Foods Hum. Nutr. 51, 187–198.
Habib, H., Fazili, K., 2007. Plant protease inhibitors: a defense strategy in plants.
Biotechnol. Mol. Biol. Rev. 2, 68–85.
Hager, A.-S., Czerny, M., Bez, J., Zannini, E., Arendt, E.K., 2013. Starch properties,
in vitro digestibility and sensory evaluation of fresh egg pasta produced from
oat, teff and wheat flour. J. Cereal Sci. 58, 156–163.
Hager, A.-S., Taylor, J.P., Waters, D.M., Arendt, E.K., 2014. Gluten free beer –
A review. Trends Food Sci. Technol. 36, 44–54.
Hager, A.-S., Wolter, A., Czerny, M., Bez, J., Zannini, E., Arendt, E.K., Czerny, M.,
2012a. Investigation of product quality, sensory profile and ultrastructure of
breads made from a range of commercial gluten-free flours compared to their
wheat counterparts. Eur. Food Res. Technol. 235, 333–344.

Chapter 2
73
Hager, A.-S., Wolter, A., Jacob, F., Zannini, E., Arendt, E.K., 2012b. Nutritional
properties and ultra-structure of commercial gluten free flours from different
botanical sources compared to wheat flours. J. Cereal Sci. 56, 239–247.
Hager, A.-S., Zannini, E., Arendt, E.K., 2012a. Formulating breads for specific
dietary requirements, in: Cauvain, S. (Ed.), Breadmaking. Woodhead
Publishing, Cambridge, UK, pp. 711–735.
Hager, A.-S., Zannini, E., Arendt, E.K., 2012b. Gluten-free pasta - Advances in
research and commercialisation. Cereal Foods World 57, 225–229.
Hallén, E., İbanoğlu, Ş., Ainsworth, P., 2004. Effect of fermented/germinated
cowpea flour addition on the rheological and baking properties of wheat flour. J.
Food Eng. 63, 177–184.
Hao, Y. Y., Brackett, R., 1988. Removal of aflatoxin B1 from peanut milk inoculated
with Flavobacterium aurantiacum. J. Food Sci. 53, 1384-1386.
Hariadi, Y., Marandon, K., Tian, Y., Jacobsen, S.-E., Shabala, S., 2011. Ionic and
osmotic relations in quinoa (Chenopodium quinoa Willd.) plants grown at
various salinity levels. J. Exp. Bot. 62, 185–93.
Heaney, R. P., Dowell, M. S., Rafferty, K., Bierman, J., 2000. Bioavailability of the
calcium in fortified soy imitation milk, with some observations on method.
Am. J. Clin. Nutr. 71, 1166-1169.
Heaney, R. P., Rafferty, K., Bierman, J., 2005. Not all calcium-fortified beverages
are equal. Nutr. Today. 40, 39-44.
Heiniö, R.-L., Katina, K., Wilhelmson, A., Myllymäki, O., Rajamäki, T., Latva-Kala,
K., Liukkonen, K.-H., Poutanen, K., 2003. Relationship between sensory
perception and flavour-active volatile compounds of germinated, sourdough
fermented and native rye following the extrusion process. LWT - Food Sci.
Technol. 36, 533–545.
Heiniö, R.-L., Oksman-Caldentey, K.-M., Latva-Kala, K., Lehtinen, P., Poutanen,
K., 2001. Effect of drying treatment conditions on sensory profile of germinated
oat. Cereal Chem. 78, 707–714.
Heiser, C.B.. J., Nelson, D.C., 1974. On the origin of the cultivated chenopods
(Chenopodium). Genetics 78, 503–505.
Her, B.Y., Sung, H.Y., Choi, Y.S., 2005. Oligosaccharide-supplemented soy ice
cream for diabetic patients : Quality characteristics and effects on blood sugar
and lipids in streptozotocin-induced diabetic rats. Korean J. Nutr. 38, 663–671.
Hermann, 2007. INIA Genebank, Peru, http://commons.wikimedia.org/wiki/
File:Colored_quinoa_Genebank_INIA_Juliaca.jpg (accessed 1.3.2014).

Chapter 2
74
Hídvégi, M., Lásztity, R., 2003. Phytic acid content of cereals and legumes and
interaction with proteins. Period. Polytech. Chem. Eng. 46, 59–64.
Hilhorst, H.W.M., Karssen, C.M., 1992. Seed dormancy and germination: the role of
abscisic acid and gibberellins and the importance of hormone mutants. Plant
Growth Regul. 11, 225–238.
Hinds, M. J., Beuchat, L. R., and Chinnan, M. S., 1997a. Properties of a thermal‐processed beverage prepared from roasted partially defatted peanuts.
International Journal of Food Science and Technology, 32(3), 203-211.
Hinds, M., Beuchat, L., and Chinnan, M., 1997b. Effects of homogenization pressure
and stabilizers on some physical characteristics of a beverage prepared from
partially defatted, roasted peanuts. Plant Food Hum. Nutr. 50 : 269-277.
Hinds, M., Chinnan, M., and Beuchat, L., 1997c. Particle size distribution in a heat-
processed beverage prepared from roasted peanuts. Food Res. Int. 30 : 59-64.
Hischke, H., Potter, G., and Graham, W., 1968. Nutritive value of oat proteins. I.
Varietal differences as measured by amino acid analysis and rat growth
responses. Cereal Chem. 45 : 374-378.
House, J. D., Neufeld, J., and Leson, G., 2010. Evaluating the quality of protein from
hemp seed (Cannabis sativa L.) products through the use of the protein
digestibility-corrected amino acid score method. J. Agric. Food Chem. 24 :
11801-11807.
Hu, Y., Stromeck, A., Loponen, J., Lopes-Lutz, D., Schieber, A., and Ganzle, M. G.,
2011. LC-MS/MS Quantification of Bioactive Angiotensin I-Converting
Enzyme Inhibitory Peptides in Rye Malt Sourdoughs. J. Agric. Food. Chem.
59 : 11983-11989.
Huppes, G., Koning, A., Suh, S., Heijungs, R., Oers, L., Nielsen, P., and Guinée, J.
B., 2008. Environmental Impacts of Consumption in the European Union:
High‐Resolution Input‐Output Tables with Detailed Environmental
Extensions. J. Ind. Ecol. 10 : 129-146.
Hübner, F., Schehl, B.D., Gebruers, K., Courtin, C.M., Delcour, J.A., Arendt, E.K.,
2010. Influence of germination time and temperature on the properties of rye
malt and rye malt based worts. J. Cereal Sci. 52, 72–79.
Hughes, G.J., Ryan, D.J., Mukherjea, R., Schasteen, C.S., 2011. Protein digestibility-
corrected amino acid scores (PDCAAS) for soy protein isolates and concentrate:
criteria for evaluation. J. Agric. Food Chem. 59, 12707–12.
IPCC, 2007. Climate Change 2007: Synthesis Report. Contribution of Working
Groups I, II and III to the Fourth Assessment Report of the Intergovernmental
Panel on Climate Change. IPCC, Geneva, Switzerland, 10.

Chapter 2
75
Jackson, C. J. C., Dini, J., Lavandier, C., Rupasinghe, H., Faulkner, H., Poysa, V.,
Buzzell, D., DeGrandis, S., 2002. Effects of processing on the content and
composition of isoflavones during manufacturing of soy beverage and tofu.
Process Biochem. 37, 1117-1123.
Jacobsen, S.-E., 2003. The Worldwide Potential for Quinoa (Chenopodium quinoa
Willd.). Food Rev. Int. 19, 167–177.
Jacobsen, S.-E., Monteros, C., Corcuera, L.J., Bravo, L.A., Christiansen, J.L.,
Mujica, A., 2007. Frost resistance mechanisms in quinoa (Chenopodium quinoa
Willd.). Eur. J. Agron. 26, 471–475.
Jacobsen, S.E., Mujica, A., Ortiz, R., 2003. The Global Potential for Quinoa and
Other Andean Crops. Food Rev. Int. 19, 139–148.
Jago, D., 2011. Free from foods - Mintel report. FreeFrom Allergy and Intolerance
2011; FDIN seminar. Daventry, UK.
Jiménez-Martínez, C., Hernández-Sánchez, H. And Dávila-Ortiz, G., 2003.
Production of a yogurt-like product from Lupinus campestris seeds. J. Sci.
Food. Agric. 83, 515–522.
Johnson, L., Suleiman, T., and Lusas, E., 1979. Sesame protein: A review and
prospectus. J. Am. Oil Chem. Soc. 56, 463-468.
Juliano, B. O., Bressani, R., and Elias, L. G., 1971. Evaluation of the protein quality
and milled rices differing in protein content. J. Agric. Food Chem. 19, 1028-
1034.
Kaldy, M., Kasting, R., 1974. Amino acid composition and protein quality of eight
faba bean cultivars. Can. J. Plant Sci. i. 54, 869-871.
Kamal-Eldin, A., Appelqvist, L.-Å., 1996. The chemistry and antioxidant properties
of tocopherols and tocotrienols. Lipids 31, 671–701.
Katan, M.B., Grundy, S.M., Jones, P., Law, M., Miettinen, T., Paoletti, R., 2003.
Efficacy and safety of plant stanols and sterols in the management of blood
cholesterol levels. Mayo Clin. Proc. 78, 965–78.
Katina, K., Liukkonen, K.-H., Kaukovirta-Norja, A., Adlercreutz, H., Heinonen, S.-
M., Lampi, A.-M., Pihlava, J.-M., Poutanen, K., 2007. Fermentation-induced
changes in the nutritional value of native or germinated rye. J. Cereal Sci. 46,
348–355.
Katz, K. A., Mahlberg, M. H., Honig, P. J., and Yan, A. C., 2005. Rice nightmare:
Kwashiorkor in 2 Philadelphia-area infants fed Rice Dream beverage. J. Am.
Acad. Dermatol. 52, 69-72.
Kaukovirta-Norja, A., Wilhelmson, A., Poutanen, K., 2004. Germination: a means to
improve the functionality of oat. Agric. Food Sci.

Chapter 2
76
Kim, H., Bang, J., Kim, Y., Beuchat, L., and Ryu, J. H., 2012. Reduction of Bacillus
cereus spores in sikhye, a traditional Korean rice beverage, by modified
tyndallization processes with and without carbon dioxide injection. Lett.
Appl. Microbiol. 55, 218-223.
Kivelä, R., Pitkänen, L., Laine, P., Aseyev, V., and Sontag-Strohm, T., 2010.
Influence of homogenisation on the solution properties of oat β-glucan. Food
Hydrocolloid. 24 : 611-618.
Kivelä, R., Sontag-Strohm, T., Loponen, J., Tuomainen, P., and Nyström, L., 2011.
Oxidative and radical mediated cleavage of β-glucan in thermal treatments.
Carbohyd. Polym. 85, 645–652.
Klose, C., Mauch, A., Wunderlich, S., Thiele, F., Zarnkow, M., Jacob, F., Arendt,
E.K., 2011. Brewing with 100% Oat Malt. J. Inst. Brew. 117, 411–421.
Kneepkens, C. M. F., and Meijer, Y., 2009. Clinical practice. Diagnosis and treatment
of cow’s milk allergy. Eur. J. Pediatr. 168, 891-896.
Konishi, Y., Hirano, S., Tsuboi, H., Wada, M., 2004. Distribution of Minerals in
Quinoa (Chenopodium quinoa Willd.) Seeds. Biosci. Biotechnol. Biochem. 68,
231–234.
Kritchevsky, D., Chen, S.C., 2005. Phytosterols—health benefits and potential
concerns: a review. Nutr. Res. 25, 413–428.
Kwok, K. I. N. C., and Niranjan, K., 1995. Review: Effect of thermal processing on
soymilk. Int. J. Food Sci. Technol. 30, 263-295.
Larrea, C., Freire, W., 2002. Social inequality and child malnutrition in four Andean
countries. Rev. Panam. Salud Pública 11, 356–364.
Larsson, M., Rossander-Hulthén, L., Sandström, B., Sandberg, A.S., 1996. Improved
zinc and iron absorption from breakfast meals containing malted oats with
reduced phytate content. Br. J. Nutr. 76, 677–88.
Lattimer, J.M., Haub, M.D., 2010. Effects of dietary fiber and its components on
metabolic health. Nutrients 2, 1266–89.
Lawton, J.W., 2000. Nonfood uses of cereals, in: Kulp, K. (Ed.), Handbook of Cereal
Science and Technology. CRC Press, pp. 725–740.
Leatherhead Food Research., 2011. Food Allergies and Intolerances: Consumer
Perceptions and Market Opportunities for 'Free From' Foods. Leatherhead
Food International, Surrey, UK.
Lee, C., and Beuchat, L. R., 1991. Changes in chemical composition and sensory
qualities of peanut milk fermented with lactic acid bacteria. Int. J. Food
Microbiol. 13, 273-283.

Chapter 2
77
Lee, S. W., and Rhee, C., 2003. Processing suitability of a rice and pine nut (Pinus
koraiensis) beverage. Food Hydrocolloid. 17, 379-385.
Leroy, F., and De Vuyst, L., 2004. Lactic acid bacteria as functional starter cultures
for the food fermentation industry. Trends Food Sci. Technol. 15, 67-78.
Li, X., Dodson, J., Zhou, X., Zhang, H., Masutomoto, R., 2007. Early cultivated
wheat and broadening of agriculture in Neolithic China. The Holocene 17, 555–
560.
Liener, I.E., 1970. Toxic constituents of plant foodstuffs. Proc. Nutr. Soc. 29, 56–57.
Lindahl, L., Ahldén, I., Öste, R., and Sjöholm, I., 2001. Homogeneous and stable
cereal suspension. United States Patent No. 5686123.
Lindeboom, N., Chang, P.R., Falk, K.C., Tyler, R.T., 2005. Characteristics of Starch
from Eight Quinoa Lines. Cereal Chem. 82, 216–222.
Liong, M.-T., Easa, A.M., Lim, P.-T., Kang, J.-Y., 2009. Survival, growth
characteristics and bioactive potential of Lactobacillus acidophilus in a soy-
based cream cheese. J. Sci. Food Agric. 89, 1382–1391.
Liukkonen, K.-H., Katina, K., Wilhelmsson, A., Myllymäki, O., Lampi, A.-M.,
Kariluoto, S., Piironen, V., Heinonen, S.-M., Nurmi, T., Adlercreutz, H.,
Peltoketo, A., Pihlava, J.-M., Hietaniemi, V., Poutanen, K., 2003. Process-
induced changes on bioactive compounds in whole grain rye. Proc. Nutr. Soc.
62, 117–22.
Loponen, J., 2004. Angiotensin converting enzyme inhibitory peptides in Finnish
cereals: a database survey. Agric Food Sci. 13, 39-45.
Loponen, J., Kanerva, P., Zhang, C., Sontag-Strohm, T., Salovaara, H., Gänzle,
M.G., 2009. Prolamin hydrolysis and pentosan solubilization in germinated-rye
sourdoughs determined by chromatographic and immunological methods. J.
Agric. Food Chem. 57, 746–53.
Lorenz, K., 1990. Quinoa (Chenopodium quinoa) Starch — Physico-chemical
Properties and Functional Characteristics. Starch - Stärke 42, 81–86.
Lorenz, K., Coulter, L., 1991. Quinoa flour in baked products. Plant Foods Hum.
Nutr. 41, 213–223.
Maga, J.A., 1982. Phytate: its chemistry, occurrence, food interactions, nutritional
significance, and methods of analysis. J. Agric. Food Chem. 30, 1–9.
Malaki Nik, A., Tosh, S., Poysa, V., Woodrow, L., and Corredig, M., 2008.
Physicochemical characterization of soymilk after step-wise centrifugation.
Food Res Int. 41 : 286-294.

Chapter 2
78
Marcone, M.F., 1999. Biochemical and biophysical properties of plant storage
proteins. Food Res. Int. 32, 79–92.
Mastebroek, H.D., Limburg, H., Gilles, T., Marvin, H.J., 2000. Occurrence of
sapogenins in leaves and seeds of quinoa (Chenopodium quinoa Willd). J. Sci.
Food Agric. 80, 152–156.
Mbithi-Mwikya, S., Van Camp, J., Yiru, Y., Huyghebaert, A., 2000. Nutrient and
Antinutrient Changes in Finger Millet (Eleusine coracan) During Sprouting.
LWT - Food Sci. Technol. 33, 9–14.
McSweeney, S. L., Mulvihill, D. M., O'Callaghan, D. M., 2004. The influence of pH
on the heat-induced aggregation of model milk protein ingredient systems
and model infant formula emulsions stabilized by milk protein ingredients.
Food Hydrocolloid. 18, 109-125.
Meo, B., Freeman, G., Marconi, O., Booer, C., Perretti, G., Fantozzi, P., 2011.
Behaviour of Malted Cereals and Pseudo-Cereals for Gluten-Free Beer
Production. J. Inst. Brew. 117, 541–546.
Michaelsen, K. F., Hoppe, C., Roos, N., Kaestel, P., Stougaard, M., Lauritzen, L.,
Molgaard, C., Girma, T., and Friis, H., 2009. Choice of foods and ingredients
for moderately malnourished children 6 months to 5 years of age. Food Nutr.
Bull. 30, 343.
Mikkola, M., and Risku-Norja, H., 2008. Institutional consumers views of GHG
emission reduction in optional milk systems within sustainability frame. 8th
European IFSA Symposium, Clermont-Ferrand, France.
Millward, J., and Garnett, T., 2010. Plenary Lecture 3 Food and the planet:
nutritional dilemmas of greenhouse gas emission reductions through reduced
intakes of meat and dairy foods. Nutr. Soc. Proc. 69 : 103-118.
Mintel 2011. In the shadow of competition, the soy market slumps. Mintel Press
Release. URL: http://www.mintel.com/press-centre/press-releases/696/in-the-
shadow-of-competition-the-soy-market-slumps (accessed 7.8.2011).
Mishkin, S., 1997. Dairy sensitivity, lactose malabsorption, and elimination diets in
inflammatory bowel disease. Am. J. Clin. Nutr. 65, 564-567.
Mitchell, C. R., and Mitchell, P.R., 1990. Nutritional rice milk product. United States
Patent No. 4894242.
Molina, M.I., Petruccelli, S., Añón, M.C., 2004. Effect of pH and ionic strength
modifications on thermal denaturation of the 11S globulin of sunflower
(Helianthus annuus). J. Agric. Food Chem. 52, 6023–9.
Morad, M.M., Leung, H.K., Hsu, D.L., Finney, P.L., 1980. Effect of germination on
physicochemical and bread-baking properties of yellow pea, lentil, and faba
bean flours and starches. Cereal Chem. 57, 390–396.

Chapter 2
79
Murdock, L.L., Shade, R.E., 2002. Lectins and Protease Inhibitors as Plant Defenses
against Insects. J. Agric. Food Chem. 50, 6605–6611.
Mårtensson, O., Öste, R., and Holst, O, 2000. Lactic acid bacteria in an oat-based
non-dairy milk substitute: fermentation characteristics and exopolysaccharide
formation. LWT - Food Sci. Technol. 33 : 525-530.
Mårtensson, O., Öste, R., and Holst, O., 2002. The effect of yoghurt culture on the
survival of probiotic bacteria in oat-based, non-dairy products. Food Res Int.
35 : 775-784.
Mäkinen, O.E., Arendt, E.K., 2012. Oat malt as a baking ingredient – A comparative
study of the impact of oat, barley and wheat malts on bread and dough
properties. J. Cereal Sci. 56, 747–753.
Nijdam, D., Rood, T., and Westhoek, H., 2012. The price of protein: Review of land
use and carbon footprints from life cycle assessments of animal food products
and their substitutes. Food Policy. 37, 760-770.
Nnanna, I.A., Phillips, R.D., 1990. Protein and Starch Digestibility and Flatulence
Potential of Germinated Cowpeas (Vigna unguiculata). J. Food Sci. 55, 151–
153.
Normén, L., Bryngelsson, S., Johnsson, M., Evheden, P., Ellegård, L., Brants, H.,
Andersson, H., Dutta, P., 2002. The Phytosterol Content of Some Cereal Foods
Commonly Consumed in Sweden and in the Netherlands. J. Food Compos.
Anal. 15, 693–704.
Oatly.com, 2014. Website of Oatly AB. http://www.oatly.com (accessed 25.9.2014).
Obatolu, V.A., 2002. Nutrient and sensory qualities of extruded malted or unmalted
millet/soybean mixture. Food Chem. 76, 129–133.
Oksman-Caldentey, K.-M., Kaukovirta-Norja, A., Heiniö, R.-L., Kleemola, T.,
Mikola, M., Sontag-Strohm, T., Lehtinen, P., Pihlava, J.-M., Poutanen, K.,
2001. Kauran biotekninen prosessointi uusiksi elintarvikkeiksi, in: Ryhänen, E.-
L., Salo, R. (Eds.), Food Cluster Research Programme, Final Report, MTT
Publications. Jokioinen, Finland, pp. 11–22.
Organic Monitor., 2005. The European market for soya and non-dairy drinks.
Organic Monitor, London, UK.
Osbourn, A., 1996. Saponins and plant defence - a soap story. Trends Plant Sci. 1, 4–
9.
Packaged Facts., 2012. Dairy Alternative Beverages in the U.S.: Soy Milk, Almond
Milk, Rice Milk and Other Dairy Milk Alternatives. Packaged Facts,
Rockville, Maryland, U.S.A.

Chapter 2
80
Park, S.H., 2005. Dough and Breadmaking Properties of Wheat Flour Substituted by
10% with Germinated Quinoa Flour. Food Sci. Technol. Int. 11, 471–476.
Parnsakhorn, S.Langkapin, J., 2013. Changes in physicochemical characteristics of
germinated brown rice and brown rice during storage at various temperatures.
Agric. Eng. Int. 15, 293–303.
Pathomrungsiyounggul, P., Lewis, M. J., and Grandison, A. S., 2010. Effects of
calcium-chelating agents and pasteurisation on certain properties of calcium-
fortified soy milk. Food Chem. 118 : 808-814.
Patisaul, H. B., and Jefferson, W., 2010. The pros and cons of phytoestrogens. Front.
Neuroendocrin. 31 : 400-419.
Paulsen, P. V., Welsby, D., and Huang, X. L., 2006. Ready-to-Drink soy protein
nutritional beverages. In : Soy applications in foods, pp. 199-226. Riaz, M.
N., Ed., Taylor & Francis, Boca Raton, Florida, U.S.A.
Pedo, I., Sgarbieri, V., and Gutkoski, L., 1999. Protein evaluation of four oat (Avena
sativa L.) cultivars adapted for cultivation in the south of Brazil. Plant Food
Hum. Nutr. 53 : 297-304.
Peñaloza, W., Davey, C.L., Hedger, J.N., Kell, D.B., 1992. Physiological studies on
the solid-state quinoa tempe fermentation, using on-line measurements of fungal
biomass production. J. Sci. Food Agric. 59, 227–235.
Phiarais, B.P.N., Mauch, A., Schehl, B.D., Zarnkow, M., Gastl, M., Herrmann, M.,
Zannini, E., Arendt, E.K., 2010. Processing of a Top Fermented Beer Brewed
from 100% Buckwheat Malt with Sensory and Analytical Characterisation. J.
Inst. Brew. 116, 265–274.
Phiarais, B.P.N., Schehl, B.D., Oliveira, J.C., Arendt, E.K., 2006. Use of Response
Surface Methodology to Investigate the Effectiveness of Commercial Enzymes
on Buckwheat Malt for Brewing Purposes. J. Inst. Brew. 112, 324–332.
Phiarais, B.P.N., Wijngaard, H.H., Arendt, E.K., 2005. The Impact of Kilning on
Enzymatic Activity of Buckwheat Malt. J. Inst. Brew. 111, 290–298.
Phillips, L., Whitehead, D., and Kinsella, J., 1994. Chemical nature of proteins and
polypeptides. In: Structure-Function Properties of Food Proteins, pp. 3-23.
Academic Press: San Diego, CA.
Pike, P.R., Abdel-Aal, E.-S.M., McElroy, A.R., 2007. Antioxidant Activity of Oat
Malt Extracts in Accelerated Corn Oil Oxidation. J. Am. Oil Chem. Soc. 84,
663–667.
Plaza, L., Ancos, B. de, Cano, P.M., 2003. Nutritional and health-related compounds
in sprouts and seeds of soybean (Glycine max), wheat (Triticum aestivum.L) and
alfalfa (Medicago sativa) treated by a new drying method. Eur. Food Res.
Technol. 216, 138–144.

Chapter 2
81
Pomeranz, Y., Robbins, G.S., Briggle, L.W., 1971. Amino acid composition of oat
groats. J. Agric. Food Chem. 19, 536–539.
Prado, F. C., Parada, J. L., Pandey, A., Soccol, C. R., 2008. Trends in non-dairy
probiotic beverages. Food Re. Int. 41, 111-123.
Prakash, C.S., 2001. The Genetically modified crop debate in the context of
agricultural evolution. Plant Physiol. 126, 8–15.
Prego, I., Maldonado, S., Otegui, M., 1998. Seed structure and localization of
reserves in Chenopodium quinoa. Ann. Bot. 481–488.
Przybylski, R., Chauhan, G., Eskin, N., 1994. Characterization of quinoa
(Chenopodium quinoa) lipids. Food Chem. 51, 187–192.
Ramos Diaz, J.M., Kirjoranta, S., Tenitz, S., Penttilä, P.A., Serimaa, R., Lampi, A.-
M., Jouppila, K., 2013. Use of amaranth, quinoa and kañiwa in extruded corn-
based snacks. J. Cereal Sci. 58, 59–67.
Rafferty, K., Walters, G., Heaney, R., 2007. Calcium fortificants: overview and
strategies for improving calcium nutriture of the US population. J. Food Sci.
72, R152-R158.
Ranhotra, G., Gelroth, J., Glaser, B., Lorenz, K., Johnson, D., 1993. Composition
and protein nutritional quality of quinoa. Cereal Chem. 70, 303-303.
Rao, P.U., Belavady, B., 1978. Oligosaccharides in pulses: varietal differences and
effects of cooking and germination. J. Agric. Food Chem. 26, 316–319.
Rayner, M., Timgren, A., Sjöö, M., Dejmek, P., 2012. Quinoa starch granules: a
candidate for stabilising food-grade Pickering emulsions. J. Sci. Food Agric. 92,
1841–7.
Reddy, N.R., Sathe, S.K., Salunkhe, D.K., 1982. Phytates in legumes and cereals.
Adv. Food Res. 28, 1–92.
Reilly, J. K., Lanou, A. J., Barnard, N. D., Seidl, K., Green, A. A., 2006.
Acceptability of soymilk as a calcium-rich beverage in elementary school
children. J. Am. Diet. Assoc. 106, 590-593.
Repo-Carrasco, R., Espinoza, C., Jacobsen, S.-E., 2003. Nutritional Value and Use of
the Andean Crops Quinoa (Chenopodium quinoa) and Kañiwa (Chenopodium
pallidicaule). Food Rev. Int. 19, 179–189.
Richardson, D., 1990. Food fortification. Proc. Nutr. Soc. 49, 39-50.
Ridout, C.L., Price, K.R., Dupont, M.S., Parker, M.L., Fenwick, G.R., 1991. Quinoa
saponins -analysis and preliminary investigations into the effects of reduction
by processing. J. Sci. Food Agric. 54, 165–176.

Chapter 2
82
Robinson, N., 2014. No sign of gluten-free growth stalling. URL:
http://www.foodmanufacture.co.uk/Sectors/Bakery/No-sign-of-gluten-free-
growth-stalling (accessed 1.3.2014).
Rosa, M., Hilal, M., González, J.A., Prado, F.E., 2009. Low-temperature effect on
enzyme activities involved in sucrose-starch partitioning in salt-stressed and
salt-acclimated cotyledons of quinoa (Chenopodium quinoa Willd.) seedlings.
Plant Physiol. Biochem. 47, 300–7.
Rosenthal, A., Deliza, R., Cabral, L., Cabral, L. C., Farias, C. A. A., Domingues, A.
M., 2003. Effect of enzymatic treatment and filtration on sensory
characteristics and physical stability of soymilk. Food Control. 14, 187-192.
Ruales, J., Grijalva, Y. de, Lopez-Jaramillo, P., Nair, B.M., 2002. The nutritional
quality of an infant food from quinoa and its effect on the plasma level of
insulin-like growth factor-1 (IGF-1) in undernourished children. Int. J. Food
Sci. Nutr. 53, 143–154.
Ruales, J., Nair, B.M., 1993. Saponins, phytic acid, tannins and protease inhibitors in
quinoa (Chenopodium quinoa, Willd) seeds. Food Chem. 48, 137–143.
Ruales, J., Nair, B.M., 1994. Effect of processing on in vitro digestibility of protein
and starch in quinoa seeds. Int. J. Food Sci. Technol. 29, 449–456.
Ruiz, K.B., Biondi, S., Oses, R., Acuña-Rodríguez, I.S., Antognoni, F., Martinez-
Mosqueira, E.A., Coulibaly, A., Canahua-Murillo, A., Pinto, M., Zurita-Silva,
A., Bazile, D., Jacobsen, S.-E., Molina-Montenegro, M.A., 2014. Quinoa
biodiversity and sustainability for food security under climate change. A review.
Agron. Sustain. Dev. 34, 349–359.
Rustom, I., Lopez-Leiva, M., Nair, B., 1996. Nutritional, sensory and
physicochemical properties of peanut beverage sterilized under two different
UHT conditions. Food Chem. 56, 45-53.
Rustom, I., Lopez-Leiva, M., Nair, B. M., 1991. A study of factors affecting
extraction of peanut (Arachis hypogaea L.) solids with water. Food Chem. 42,
153-165.
Rustom, I., Lopez-Leiva, M. H., Nair, B. M., 1993. Extraction of peanut solids with
water-effect of the process and enzymatic hydrolysis. LWT - Food Sci.
Technol. 26, 72-75.
Rustom, I., Lopez-Leiva, M. H., Nair, B. M., 1995. Effect of emulsifier type and
homogenization temperature and pressure on physical properties of peanut
extract. Int. J. Food Sci. Technol. 30, 773-781.
Rutherfurd, S.M., Moughan, P.J., 1998. The digestible amino acid composition of
several milk proteins: Application of a new bioassay. J. Dairy Sci. 81, 909–917.

Chapter 2
83
Ryan, E., Galvin, K., O’Connor, T.P., Maguire, A.R., O’Brien, N.M., 2007.
Phytosterol, squalene, tocopherol content and fatty acid profile of selected
seeds, grains, and legumes. Plant Foods Hum. Nutr. 62, 85–91.
Saastamoinen, M., Kumpulainen, J., Nummela, S., 1989. Genetic and environmental
variation in oil content and fatty acid composition of oats. Cereal Chem. 66,
296–300.
Sahi, T., 1994. Genetics and epidemiology of adult-type hypolactasia. Scand. J.
Gastroenterol. 29, 7-20.
Salovaara, H., 2004. Lactic acid bacteria in cereal-based products. In:
aspectsSalminen, S., and von Wright, A., and Ouwehand, A., (Eds.), Lactic
acid bacteria: Microbiological and functional, Marcel Dekker, New York, pp.
431-452.
Sandberg, A.-S., Brune, M., Carlsson, N.-G., Hallberg, L., Skoglund, E., Rossander-
Hulthen, L., 1999. Inositol phosphates with different numbers of phosphate
groups influence iron absorption in humans. Am J Clin Nutr 70, 240–246.
Sandberg, A. S., Carlsson, N. G., Svanberg, U., 2006. Effects of inositol tri-, tetra-,
penta-, and hexaphosphates on in vitro estimation of iron availability. J. Food
Sci. 54, 159-161.
Scarborough, P., Rayner, M., 2010. Nutrient density to climate impact index is an
inappropriate system for ranking beverages in order of climate impact per
nutritional value. Food Nutr. Res. 54, 5681.
Schaafsma, G., 2000. The protein digestibility–corrected amino acid score. J. Nutr.
130, 1865S-1867S.
Schlick, G., Bubenheim, D.L., 1996. Quinoa: candidate crop for NASA’s controlled
ecological life support systems. In: Janick, J. (Ed.), Progress in New Crops,
ASHS Press, Alexandria, VA, pp. 632–640.
Sharma, V., Singh, R. K., Toledo, R. T., 2009. Microbial inactivation kinetics in
soymilk during continuous flow high‐pressure throttling. J. Food Sci. 74,
M268-M275.
Schoenlechner, R., Drausinger, J., Ottenschlaeger, V., Jurackova, K., Berghofer, E.,
2010. Functional properties of gluten-free pasta produced from amaranth,
quinoa and buckwheat. Plant Foods Hum. Nutr. 65, 339–49.
Schonlechner, R., Linsberger, G., Kaczyk, L., Berghofer, E., 2006. Herstellung von
glutenfreien Keksen aus den Pseudo-cerealien Amaranth, Quinoa und
Buchweizen mit Gartenbohnen. Ernähr/Nutr 30, 101–107
Schumacher, A.B., Brandelli, A., Macedo, F.C., Pieta, L., Klug, T. V, de Jong, E. V,
2010. Chemical and sensory evaluation of dark chocolate with addition of
quinoa (Chenopodium quinoa Willd.). J. Food Sci. Technol. 47, 202–6.

Chapter 2
84
Sen, C.K., Khanna, S., Roy, S., 2006. Tocotrienols: Vitamin E beyond tocopherols.
Life Sci. 78, 2088–98.
Shewry, P.R., 1999. Seed proteins, in: Shewry, P.R. (Ed.), Seed Proteins. Springer
Netherlands, pp. 1–10.
Shewry, P.R., and Pandya, M.J., 1999. The 2S albumin storage proteins, in: Shewry,
P.R. (Ed.), Seed Proteins. Springer Netherlands, pp. 563-686.
Silk.com, 2014. Website of the Silk® brand by The WhiteWave Foods Company.
http://www.silk.com (accessed 25.9.2014).
Singh, B., Bhat, T.K., Singh, B., 2003. Potential therapeutic applications of some
antinutritional plant secondary metabolites. J. Agric. Food Chem. 51, 5579–97.
Singh, J., Dartois, A., Kaur, L., 2010. Starch digestibility in food matrix: a review.
Trends Food Sci. Technol. 21, 168–180.
Singh, N., Singh, J., Kaur, L., Singh Sodhi, N., Singh Gill, B., 2003. Morphological,
thermal and rheological properties of starches from different botanical sources.
Food Chem. 81, 219–231.
Singh, S., Gamlath, S., Wakeling, L., 2007. Nutritional aspects of food extrusion: a
review. Int. J. Food Sci. Technol. 42, 916–929.
Smedman, A., Lindmark-Månsson, H., Drewnowski, A., Edman, A.K.M., 2010.
Nutrient density of beverages in relation to climate impact. Food Nutr. Res.
54, 5170.
Smith, K., Mendonca, A., Jung, S., 2009. Impact of high-pressure processing on
microbial shelf-life and protein stability of refrigerated soymilk. Food
Microbiol. 26, 794-800.
Soetan, K., 2008. Pharmacological and other beneficial effects of antinutritional
factors in plants - A review. African J. Biotechnol. 7, 4713-4721.
Sonesson, U., Davis, J., and Ziegler, F., 2010. Food production and emissions of
greenhouse gases: An overview of the climate impact of different product
groups. SIK-Report No 802 2010. Swedish Institute for Food and
Biotechnology.
Sripriya, G., Antony, U., Chandra, T.S., 1997. Changes in carbohydrate, free amino
acids, organic acids, phytate and HCl extractability of minerals during
germination and fermentation of finger millet (Eleusine coracana). Food Chem.
58, 345–350.
Steinfeld, H., Gerber, P., Wassenaar, T., Castel, V., and de Haan, C., 2006.
Livestock's long shadow: environmental issues and options. FAO, Rome,
Italy.

Chapter 2
85
Swagerty, D.L., Walling, A.D Klein, R.M., 2002. Am. Fam. Physician. 65, 1845-
1850.
Tang, H., 2002. Characterization of storage starches from quinoa, barley and adzuki
seeds. Carbohydr. Polym. 49, 13–22.
Tano-Debrah, K., Asiamah, K., Sakyi-Dawson, E., Budu, A., 2005. Effect of malt
enzyme treatment on the nutritional and physicochemical characteristics of
cowpea-peanut milk. In, Proceedings of the 1st international edible legume
conference/IVth
world cowpea congress, Durban, South Africa.
Tari, T.A., Annapure, U.S., Singhal, R.S., Kulkarni, P.R., 2003. Starch-based
spherical aggregates: screening of small granule sized starches for entrapment
of a model flavouring compound, vanillin. Carbohydr. Polym. 53, 45–51.
Tharanathan, R.., 2003. Biodegradable films and composite coatings: past, present
and future. Trends Food Sci. Technol. 14, 71–78.
Theuwissen, E., Mensink, R.P., 2008. Water-soluble dietary fibers and
cardiovascular disease. Physiol. Behav. 94, 285–92.
Valencia, S., Svanberg, U., Sandberg, A.-S., Ruales, J., 1999. Processing of quinoa
(Chenopodium quinoa , Willd): effects on in vitro iron availability and phytate
hydrolysis. Int. J. Food Sci. Nutr. 50, 203–211.
Valentine, J., Cowan, A.A., Marshall, A.H., 2011. Oat Breeding. In: Webster, F.H.,
Wood, P.J., (Eds.), Oats: chemistry and technology, AACC International, St.
Paul, MN, pp. 11-30
Wang, H. J., and Murphy, P. A., 1996. Mass balance study of isoflavones during
soybean processing. J. Agric. Food Chem. 44, 2377-2383.
Wansink, B., Sonka, S., Goldsmith, P., Chiriboga, J., Eren, N., 2005. Increasing the
acceptance of soy-based foods. JIFAM. 17, 35-55.
Ward, S.M., 2001. A Recessive Allele Inhibiting Saponin Synthesis in Two Lines of
Bolivian Quinoa (Chenopodium quinoa Willd.). J. Hered. 92, 83–86.
Watanabe, M., Maeda, T., Tsukahara, K., Kayahara, H., Morita, N., 2004.
Application of pregerminated brown rice for breadmaking. Cereal Chem. 81,
450–455.
Weitbrecht, K., Müller, K., Leubner-Metzger, G., 2011. First off the mark: early seed
germination. J. Exp. Bot. 62, 3289–309.
Wilhelmson, A., Oksman-Caldentey, K.-M., Laitila, A., Suortti, T., Kaukovirta-
Norja, A., Poutanen, K., 2001. Development of a germination process for
producing high β-glucan, whole grain food ingredients from oat. Cereal Chem.
78, 715–720.

Chapter 2
86
Williams, J.T., Haq, N., 2002. Global research on underutilized crops: An assessment
of current activities and proposals for enhanced cooperation. Bioversity
International, Southampton, UK.
Wohlpart, A., Mabry, T.J., 1968. On the light requirement for betalain biogenesis.
Plant Physiol. 43, 457–9.
Wolf, W. J., 1970. Soybean proteins. Their functional, chemical, and physical
properties. J. Agric. Food Chem. 18, 969-976.
Wolter, A., Hager, A.-S., Zannini, E., Arendt, E.K., 2013. In vitro starch digestibility
and predicted glycaemic indexes of buckwheat, oat, quinoa, sorghum, teff and
commercial gluten-free bread. J. Cereal Sci. 58, 431–436.
Wood, S.G., Lawson, L.D., Fairbanks, D.J., Robison, L.R., Andersen, W.R., 1993.
Seed Lipid Content and Fatty Acid Composition of Three Quinoa Cultivars. J.
Food Compos. Anal. 6, 41–44.
Wood, P.J., 2010. Review: Oat and rye β-Glucan: properties and function. Cereal
Chem. 87, 315-330.
Yadav, D. N., Singh, K. K., Bhowmik, S. N., and Patil, R. T., 2010. Development of
peanut milk–based fermented curd. Int. J. Food Sci. Technol. 54, 2650-2658.
Yashina, S., Gubin, S., Maksimovich, S., Yashina, A., Gakhova, E., Gilichinsky, D.,
2012. Regeneration of whole fertile plants from 30,000-y-old fruit tissue buried
in Siberian permafrost. Proc. Natl. Acad. Sci. U.S.A. 109, 4008–13.
Yazici, F., Alvarez, V., and Hansen, P., 1997. Fermentation and Properties of
Calcium‐fortified Soy Milk Yogurt. J. Food Sci. 62 : 457-461.
Vähämäki, H., Kasvinen, J., 2013. Kvinoa juurtuu Suomeen Liedon ja Tarvasjoen
pelloilla. YLE news. URL: http://yle.fi/uutiset/kvinoa_juurtuu_suomeen_
liedon_ja_tarvasjoen_pelloilla/6827407 (accessed 3.3.14).
Zannini, E., Pontonio, E., Waters, D. M., Arendt, E. K., 2012. Growth studies of
potentially probiotic lactic acid bacteria in cereal-based substrates. Appl.
Microbiol. Biotechnol. 93, 473-485.
Zarnkow, M., Geyer, T., Lindemann, B., Burberg, F., Back, W., Arendt, E.K.,
Kreisz, S., 2007. The use of response surface methodology to optimise malting
conditions of quinoa (Chenopodium quinoa l.) as a raw material for gluten-free
foods and beverages. Monatsschrift fur Brauwiss. 60, 118–126.
Zarnkow, M., Keßler, M., Back, W., Arendt, E.K., Gastl, M., 2010. Optimisation of
the Mashing Procedure for 100% Malted Proso Millet (Panicum miliaceum L.)
as a Raw Material for Gluten-free Beverages and Beers. J. Inst. Brew. 116, 141–
150.

Chapter 2
87
Zhang, H., Önning, G., Öste, R., Gramatkovski, E., Hulthen, L., 2007a. Improved
iron bioavailability in an oat-based beverage: the combined effect of citric
acid addition, dephytinization and iron supplementation. Eur. J. Nutr. 46, 95-
102.
Zhang, H., Önning, G., Triantafyllou, A.Ö., Öste, R., 2007b. Nutritional properties of
oat‐based beverages as affected by processing and storage. J. Sci. Food Agric.
87, 2294-2301.
Zhao, Y., Martin, B.R., Weaver, C.M., 2005. Calcium bioavailability of calcium
carbonate fortified soymilk is equivalent to cow’s milk in young women. J.
Nutr. 135, 2379-2382.
Zobel, H.F., Stephen, A.M., 2010. Starch: Structure, analysis, and application, in:
Food Polysaccharides and Their Applications. CRC Press, p. 25–50.
Zulkurnain, M., Goh, M.-H., Karim, A.A., Liong, M.-T., 2008. Development of a
soy-based cream cheese. J. Texture Stud. 39, 635–654.
Önning, G., Åkesson, B., Öste, R., and Lundquist, I., 1998. Effects of consumption
of oat milk, soya milk, or cow’s milk on plasma lipids and antioxidative
capacity in healthy subjects. Ann. Nutr. Metab. 42, 211-220.

88
Objectives

89
The bitter flavour that makes the inclusion of quinoa in many products
challenging, may be reduced by germination. Also, the enzyme activities that arise
during germination may have functionalities in food applications. Plenty of literature
covering the malting of alternative grains and pseudocereals approaches the
challenge from a process optimisation point of view and use standard methods
developed for barley malt. However many of these seeds are very different from
traditional malting cereals both taxonomically and structurally. The aim of the first
part of this thesis was to investigate the germination pattern of quinoa by following
the development of hydrolytic enzyme activities and subsequent changes in starch
and protein profiles during germination and early seedling growth, and to test the
functionality of malted quinoa in a gluten-free product application.
The second part handles plant-based dairy-type products. The market for such
products is growing, and quinoa would offer an interesting raw material because of
its high quality protein. First a range of commercial plant milks was characterised,
and a process for the production of quinoa milk was being developed. The high
starch content of grains becomes the limiting factor in the extraction procedure, and
the highest protein content achieved this way was 1%. Another approach was taken
by producing a quinoa protein isolate. The functional and acid gelation properties of
this isolate were studied.

Chapter 4
90
Chapter 4
Amylolytic activities and starch reserve mobilization during the
germination of Chenopodium quinoa
Anna-Sophie Hager*, Outi E. Mäkinen*, Elke K. Arendt
*co-first authorship
Published in European Food Research and Technology 239, 621-627.

Chapter 4
91
Abstract
Quinoa (Chenopodium quinoa) is a dicotyledonous plant producing
perispermic seeds, which is increasingly popular in the Western world due to its
nutritional value. Germination can be used in food processing to alter the sensory,
nutritional and functional properties of grains, and the increased enzyme activities
may have beneficial influences in food applications. Knowledge about the
germination of perispermic seeds is scarce. In this study, the development of
amylolytic activities and subsequent changes in sugar profiles and starch content
were followed in quinoa over a period of 72 h. The seeds germinated rapidly with
radicle protrusion occurring 8 h after imbibition, when the seeds had reached a
moisture content of 44%. A low level of α-amylase activity was present in the
embryo of non-germinating seeds, but emerged in the perisperm only after 24 h,
followed by a sharp increase in activity in both tissues. An accumulation of glucose
and fructose and a decrease in starch content were observed after 24 and 36 h,
respectively, indicating the onset of starch reserve mobilization. Overall, the levels of
amylolytic activities remained very low compared to traditional malting cereals,
suggesting the unsuitability of quinoa as a source of amylases in food applications.
Scanning electron microscopy, used to visualize changes in starch granule
morphology, showed mainly exocorrosion, suggesting a homogenous structure of the
outer layers of quinoa starch.

Chapter 4
92
4.1 Introduction
Quinoa (Chenopodium quinoa) has been cultivated as a staple food for
thousands of years in the Andean region (Abugoch, 2009), but is also increasingly
popular in the Western diet. The plant produces highly nutritious seeds and has
potential for production in various climates due to its wide genetic variability
(Jacobsen et al., 2003). Quinoa seeds are oval shaped seeds, with a mean equivalent
diameter between 1.4-2.0 mm and ranging in color from pale yellow over pink and
dark red to black (Abugoch, 2009; Valencia-Chamorro, 2003). Quinoa is a
dicotyledonous plant and therefore not a true cereal (monocotyledonous), but due to
its starch rich seeds it is referred to as pseudocereal. The structure of the seed differs
from that of cereals. Its main storage tissue is a central perisperm that is surrounded
by a band-like embryo (Prego et al., 1998). The storage reserves show strict
localization. Starch, the main carbohydrate reserve, is exclusively located in the
perisperm, while protein and lipid bodies are found in the embryo (Prego et al.,
1998). Seeds with a similar structure and reserve localization include sugar beet and
amaranth (Lawrence et al., 1990; Prego et al., 1998). The embryo consists of a
hypocotyl-radicle axis and two cotyledons and can make up to 60% of the seed
weight. This high proportion of embryo explains the high protein content found in
quinoa compared to cereal grains (Valencia-Chamorro, 2003). The endosperm is
present only in the micropylar region of the seed and consists of one or two layered
tissue surrounding the tip of the radicle (Prego et al., 1998).
Upon removal of the outer seed layer (i.e., pericarp) which contains saponins,
quinoa can be milled into flour and used for the production of e.g. baked and
extruded products (Elgeti et al., 2014). As it is not related to wheat, quinoa is suitable
for people on a gluten free diet (Bergamo et al., 2011) and its inclusion into a

Chapter 4
93
standard gluten-free diet has been reported to be beneficial (Lee et al., 2009). Due to
the outstanding nutritional profile, the general public would also benefit from
increased consumption. Quinoa contains protein with a balanced amino acid
composition and is high in fiber and micronutrients, especially folate (Hager et al.,
2012; Ranhotra et al., 1992).
Germination starts by the imbibition of water, and subsequent increase in
respiration and protein synthesis. Hydrolytic enzymes are synthesized or activated to
break down the seed storage reserves that are in turn used to nourish the growing
seedling (Bewley and Black, 1994). In sensu stricto, germination ends with radicle
protrusion and the following growth of the embryonic axis is referred to as seedling
establishment. In food and malting science it is common to call the whole process
including the early growth “germination” (Mikola, 2001) and the term is used in this
sense throughout this publication.
The increased amylolytic activities resulting from germination are not only a
prerequisite for brewing, but may have functionality in other food applications. The
endogenous enzymes of germinated seeds can be used e.g. to improve the
technological quality of wheat (Mäkinen and Arendt, 2012) and gluten free baked
goods (Mäkinen et al., 2013), and to increase the mineral bioavailability in cereal
foods (Larsson et al., 1996).
Quinoa often shows a strong grassy note that may limit its commercial
applications. Germination of edible seeds modifies both the palatability and the
nutritional profile of grains and is a potential means of reducing off-flavors (Alvarez-
Jubete et al., 2010; Valencia et al., 1999).
Driven by their economic significance, the storage compound mobilization of
barley and wheat has been thoroughly studied over the past decades (Fincher, 1989).

Chapter 4
94
In contrast, the metabolism related to storage mobilization is poorly documented in
perispermic seeds, such as quinoa. In such seeds, the perisperm is the unique
carbohydrate source for cotyledons and embryonic axes during early developmental
stages (Rosa et al., 2004). In this paper, the development of amylolytic activities and
subsequent changes in sugar profile and starch content were studied to shed light on
the mobilization of starch reserves of perispermic quinoa seeds. The aim of this study
is to monitor the development of amylolytic activities in the perisperm and embryo
of quinoa over a germination period of 72 h. In addition, changes in sugar profiles,
starch content and starch granule morphology are discussed.
4.2 Materials and methods
4.2.1 Materials
Red quinoa réal (Priméal, France), dehulled and desaponified by light
abrasion using spring water (personal communication with producer). All chemicals
were purchased from Sigma-Alrich unless otherwise stated.
4.2.2 Germination capacity and germination
The germination capacity was tested by imbibing red quinoa réal (Priméal,
France) on petri dishes with two layers of filter paper at 10, 15 and 22°C in darkness.
Quinoa (150-200 seeds) was soaked in 3 % H2O2 for 1 min to inhibit microbial
growth and germinated on petri dishes with 1 ml water at 15°C in darkness. The
protruding radicle of 10 seeds was measured at different time points using a digital
caliper. The germinated, abnormally germinated (in which the cotyledons emerge
before the radicle) and non-germinated seeds were counted and after 30 h, and
expressed as percentage from the total number of seeds. To prepare samples for

Chapter 4
95
analyses, 15 g seeds were germinated in 15 ml water on large petri dishes at 15°C in
darkness. The embryo was manually separated from the perisperm and samples were
freeze dried. For the determination of moisture contents, sample weights were
recorded before and after lyophilization. The results of all analyses were expressed
on dry weight basis (dwb). Non-germinated seeds (0 h) represent dry seeds that have
not been brought in contact with water.
4.2.3 Amylase activities and zymography
α-amylase activity was determined at pH 5.2 using blocked ρ-nitrophenyl-
maltoheptaoside as substrate for α-amylase (K-CERA, Megazyme, Ireland). Activity
of α-amylase was expressed as CU/g (Ceralpha Unit = the amount of enzyme, in the
presence of excess thermostable α-glucosidase, required to release one micromole of
ρ-nitrophenol from BPNPG7 in one minute under defined assay conditions). Total
starch hydrolysing activity was determined as the release of reducing sugars from a
starch substrate. Samples were extracted using 25 mM Tris/HCl buffer with 0.5 mM
EDTA (pH 6.5) and assayed against 1% starch solution. The extent of hydrolysis was
quantified using the DNS method (Miller, 1959). One unit of activity was defined as
the amount of enzyme that releases reducing sugars equivalent to 1 μmol glucose per
minute under the assay conditions.
For zymography, the enzymes were extracted from ground samples using a
62.5 mM Tris-HCl buffer pH 6.8 containing 10% (w/v) glycerol and 0.01% (w/v)
bromophenol blue (Belay, 2001). Solids were removed by centrifugation (14 000 g x
20 min) and supernatants (25 μl perisperm or 10 μl embryo samples) were loaded
into the wells of 7.5% PAGE gels with 0.6% gelatinised starch. Electrophoresis was
performed according to Laemmli (LAEMMLI, 1970) under non-reducing conditions

Chapter 4
96
at 7 °C (Criterion Dodeca, Bio-Rad, Richmond, CA) followed by renaturing in 2.5%
Triton-X and incubation at 40 °C for 24 h (pH 5.4). After this, gels were stained
using Lugol’s solution and destained overnight in water. Clear bands on a dark
background represent starch degradation. Alternatively, gels were stained using a
modified sensitive colloidal staining protocol to visualise the protein bands
(Westermeier, 2006). Molecular weight markers were run in parallel with the
samples (Precision Plus Protein standards, All Blue, Bio-Rad, Richmond, CA).
4.2.4 Starch and sugar contents
Starch content was analysed using the total starch assay kit (K-TSTA;
Megazyme, Ireland). Dried and ground samples were extracted in 80% EtOH for 5
min at 85°C, and centrifuged (1800 g x 10 min). The pellets were washed in EtOH
and analysed. For the determination of sugar contents, samples (0.4 g) were
extracted in H2O (2 ml) for 20 min at room temperature. Solids were removed by
centrifugation (5000 g x 10 min) and supernatants were clarified with Carrez
reagents (Indyk et al., 1996) and filtered (0.45 μm). The sugar profiles were then
analysed using an Agilent Infinity 1260 HPLC system (Agilent Technologies, Santa
Clara, CA) equipped with a refractive index detector and a Phenomenex Rezex ROA
H+ column. The mobile phase was water with a flow rate 0.6 m/min, and the analysis
was run at 25°C.
4.2.5 Scanning electron microscopy
Starch granule morphology was studied using scanning electron microscopy
(SEM). Dried perisperm was cut into pieces and attached on aluminium stubs with
carbon tape and sputter coated with a 10 nm layer of gold/palladium (80:20) (Polaron

Chapter 4
97
E5150 Sputter Coating). Samples were examined using a Jeol Scanning Electron
Microscope (JSM-5510, Jeol Ltd., Tokyo, Japan) at 5 kV with a working distance of
10 mm.
4.2.6 Statistical analyses
Statistical analysis was performed using R version 3.0.2 "Frisbee Sailing"
(The R Foundation for Statistical Computing, Vienna, Austria) and the package
“agricolae”. Analysis of variance was carried out, followed by Shapiro Wilk
normality test and Tukey’s honest significant difference test. Statistica 7.1 (StatSoft
Software Inc., USA) was used to create boxplot shown in Figure 4.3.
4.3 Results and discussion
4.3.1 Germination capacity and radicle elongation
Germination begins with the uptake of moisture by the seed followed by the
elongation of the embryonic axis or radicle. Germination capacity, i.e. the proportion
of seeds capable of completing germination, was influenced by temperature and
ranged from 73% to 87% (Figure 4.1). Although differences were not significant, the
highest germination capacity was achieved at 15°C, and this temperature was
therefore chosen for further trials. Ca. 1-2 % of the seeds showed abnormal
germination, in which the cotyledons protruded instead of the radicle, eventually
leading to the death of the seedling (Figure 4.2 a). The percentage of abnormally
germinating seeds was low in the red quinoa investigated here, but in preliminary
trials conducted with a range of commercial white quinoa samples up to 10-20% of
the seeds germinated abnormally (not shown).

Chapter 4
98
Figure 4.1. Germination capacity (%) of red quinoa germinated at different
temperatures for 30 h (percentage germinated, abnormally germinated and non-
germinated seeds of total seeds). Bars marked by the same letter are not significantly
different (p<0.05).
Quinoa seeds exhibited rapid growth when exposed to moisture. The radicle
protruded 8 hours after imbibition (hai) in 80% of seeds, and reached an average
length of 1.7 ± 0.4 mm after 12 hai, and 35.0 ± 6.3 mm after 72 hai (Figure 4.3). The
seeds had an average moisture content of 44% at the time of radicle protrusion (not
shown). Rosa et al. (2004) reported radicle protrusion after 5 h at 25 °C and 9 h at 5
°C, showing strong temperature dependence. After radicle elongation, mobilisation
of the stored starch reserves commences, up to which point sucrose and other sugars
present in the grain are used as early energy sources (Bewley and Black, 1994).
Figure 4.2. Visual appearance of germinated red quinoa seeds as well as of an
abnormally germinated seed.

Chapter 4
99
Figure 4.3. Boxplot showing radicle elongation during germination of red quinoa
seeds at 15 °C (ten measurements per time point).
4.3.2 Amylase activities
The mobilization of starch starts by the hydrolysis of amylose and
amylopectin in starch granules into glucose by α-amylase (EC 3.2.1.1), debranching
enzyme (EC 3.2.1.41), β-amylase (EC 3.2.1.2) and α-glucosidase (EC 3.2.1.20).
Glucose in turn is converted into sucrose and transported to the site of requirement
(Bewley and Black, 1994). Total starch hydrolysing activity (42 U/g) was present
already in the non-germinating seeds (Fig. 4.4 a). A dip to a value of 29 U/g was
observed after 24 hai, after which the activity started increasing and reached 53 U/g
after 72 h. It is important to note that the use of a non-specific starch substrate
gives an indication of the total starch hydrolytic activity that could be the results of
the action of more than one enzyme simultaneously, rather than pure α- or β-amylase
for instance (Agu and Palmer, 1997; Bassinello et al., 2002).
In non-germinating dry seeds, the perisperm showed no of α-amylase activity,
whereas a low level of activity could be detected in the embryo (Fig.4.4 b). A sharp
increase in activity occurred in both tissues after 24 hai. The maximum recorded

Chapter 4
100
value was reached after 60 hai (1.8 CU/g) in the embryo, after which the activity
started to decline. The perisperm α-amylase activity kept increasing until the end of
the observation period, with a value of 3.29 CU/g after 72 hai. According to a
previous report where germination was carried out at a higher temperature of 25°C,
α-amylase activity in quinoa perisperm peaked between 12 and 48 h after imbibition,
after which it declined sharply (Rosa et al., 2004). Other previous reports regarding
the α-amylase activity of germinating quinoa include an increase after 12 h
(germination at 22°C) (Atwell et al., 1988) and no increase in 24 h germinated
quinoa (Mäkinen et al., 2013). Zarnkow et al. (2007) optimized the malting
conditions for quinoa using response surface methodology. Tested germination times
ranged from 5 to 7 d, of which 5 d at 15 °C was the optimum. The resulting malt
showed good proteolytic modification when mashed, but the α-amylase activity fell
below the limit of detection, leading to a somewhat low extract (55%) and residual
mash viscosity
Figure 4.4. (a) Total starch hydrolysing activity in the whole seed (●) and (b) α-
amylase activity in the embryo (■) and perisperm (▲). Means ± standard deviations.
Values labelled with the same letter are not significantly different (p<0.05).
0
10
20
30
40
50
60
0 12 24 36 48 60 72
Star
ch h
ydro
lysi
ng
acti
vity
(U
/g)
Time (h)
0
1
2
3
4
0 12 24 36 48 60 72
α-a
myl
ase
act
ivit
y (U
/g)
Time (h)
b. a.

Chapter 4
101
Zymography was performed using starch-containing acrylamide gels that
revealed amylase activity as light bands after staining (Figure 4.5 a). Two distinct
bands of activity were observed on zymograms, and corresponding protein bands
were found on the SDS page gels at ~90 kDa and ~140 kDa (Figure 4.5 b). The 90
kDa activity was present in the perisperm tissue 24 hai and increased in intensity
over time, whereas the 140 kDa activity appeared after 72 hai. Both activities were
visible in the embryo tissue already 24 hai after imbibition. The activities increased
over time, showing very bright bands after 48 hai and 72 hai in the embryo.
Figure 4.5. Zymograms (a) and SDS-PAGE gels (b) from perisperm (P) and embryo
(E) samples after 24 h (P/E24), 48 h (P/E48) and 72 h (P/E72) of germination. A
heated sample was used as a negative control (C).
The observed pattern may suggest that the embryo has a role in the synthesis
of the α-amylases that are then transported to the starchy perisperm. In sugar beet,
which is also a perispermic seed, α-amylase accumulates in the perisperm of an
imbibed seed but not in an isolated perisperm, indicating that the embryo is involved
in the enzyme accumulation (Catusse et al., 2012). It has been proposed that the

Chapter 4
102
structure in which the perisperm is surrounded by a curled embryo, as in quinoa and
sugar beet seeds, suggests that the embryo may act both as a secretory (synthesis and
transport of enzymes) and an absorption system (taking up metabolites) (Lawrence et
al., 1990).
4.3.3 Starch content and sugar profiles
The initial starch content in a non-germinating seed was 52.0 ± 1.0 % dwb
(Fig. 4.6 a). The content started to decrease 36 hai after imbibition, down to 39.5 ±
0.1 % dwb after 72 hai. The decrease appeared to follow the sharp increase in α-
amylase activity 24 h after imbibition (Fig. 4.4 b). The development of sucrose,
fructose and glucose levels are shown in Fig. 4.6 b. The non-germinating seed
contained 2.60 ± 0.24 % dwb of sucrose, 1.73 ± 0.29 % dwb of glucose and 0.08 ±
0.03 % dwb of fructose. After 24 hai, the contents of glucose and fructose started to
increase to 13.4 % and 6.9 % after 72 hai, respectively. The sucrose content
decreased slightly from 5.2 to 3.4 % dwb during the first 24 hai, possibly being used
as an energy source, but hereupon the level remained constant. No information on the
sugar profiles in the quinoa perisperm is available, but glucose and fructose contents
increased in both cotyledons and radicles during the first 24 h, while sucrose has
been found only in the cotyledons (Rosa et al., 2004).
4.3.4 Starch granule morphology
Starch is located in the perisperm of quinoa and can exist as simple units or as
spherical aggregates. Quinoa starch granules have a diameter in the range of 0.4-2.0
µm (Valencia-Chamorro, 2003) and granules are angular in shape. The appearance of
erosion channels during germination and malting of buckwheat, barley and millet

Chapter 4
103
Figure 4.6. Starch (a) and sugar (b) contents of whole quinoa seeds over 72 h
germination. Symbols: glucose (▲), fructose (×) and sucrose (○). Means ± standard
deviations.
was documented previously (Wijngaard et al., 2007; Zarnkow et al., 2007). To
investigate ultrastructural changes during germination and early seedling
development of quinoa, starch granules found both in the center of the perisperm and
the edges facing the embryo were studied using scanning electron microscopy. No
changes in granules were observed in the center of the perisperm (not shown). Also
the granules located in the outer perisperm did not show erosion channels during the
first 48 hai, but some tunnels appeared 72 h after imbibition (arrows in Fig. 4.7). The
fact that mainly exocorrosion was observed indicates a homogenous structure of the
outer layers of quinoa starch (Tang and Watanabe, 2002).
0
10
20
30
40
50
60
70
0 12 24 36 48 60 72
Star
ch c
on
ten
t (%
dw
b)
Time (h)
0
2,5
5
7,5
10
12,5
15
0 12 24 36 48 60 72
Suga
r co
nte
nt
(% d
wb
)
Time (h)
a. b.

Chapter 4
104
Figure 4.7. Scanning electron micrographs of starch granules obtained from the
quinoa perisperm after 0, 24, 48 and 72 hours of germination. Arrows are pointing to
erosion channels. Scale bar represents 2 μm.
4.4 Conclusion
The storage compound mobilisation of barley and wheat (“true cereals”) has
been thoroughly studied over the past decades driven by their economic significance
(Fincher, 1989). This publication adds to the limited knowledge available on quinoa
germination. The results suggest that the embryo is involved in the accumulation of
α-amylase in the starchy perisperm of quinoa in a similar manner as previously
reported for other perispermic seeds. Major changes in the α-amylase activity and
monosaccharide concentrations occurred 24 h after imbibition, indicating the onset of
starch mobilization during germination.
Oftentimes in cereal science and industry the knowledge and procedures used
in barley malting are applied directly to other seeds. This study clearly shows, that in
the case of quinoa, this is not suitable. Germination capacities were determined at

Chapter 4
105
10°C, 15°C and 22°C, and the lowest number of ungerminated or abnormally
germinated seeds were found at 15°C. Quinoa is a fast growing seed and radicles
were already measureable at 12 hours. The increased enzyme activities of germinated
seeds like wheat or barley are not only a prerequisite for brewing, but have
functionality in other cereal applications. The suitability of quinoa as a gluten-free
alternative to barley or wheat malts in regards to enzyme activities, but beer can be
produced with the aid of brewing enzymes. As indicated by increased enzyme
activity as well as decreased starch content, this study showed that the total starch
hydrolysing capacity is significantly lower than that e.g. for barley (approximately
180 U/g barley malt in the study of Yaldagard and Mortazavi (2008), compared to
about 30-60 U/g quinoa in this study. Activity of α-amylase starts to increase only
after significant radicle growth and the use of this material would therefore mean
high malting losses.
For future work it would be interesting to investigate the influence of the
germination process as performed in this study on the palatability of quinoa, as this
very nutritious grain but may be a source of a “grassy/bitter” flavour when used in
product formulations.
Acknowledgments
This research was funded by the Irish Research Council and the Food
Institutional Research Measure administered by the Department of Agriculture,
Fisheries and Food (Ireland).
Chapter 4
106
References
Abugoch James, L., E., 2009. Quinoa (Chenopodium quinoa Willd.): Composition,
chemistry, nutritional, and functional properties. Adv. Food Nutr. Res. 58, 1–
31.
Agu, R.C., Palmer, G.H., 1997. The effect of temperature on the modification of
sorghum and barley during malting. Process Biochem. 32, 501–507.
Alvarez-Jubete, L., Wijngaard, H., Arendt, E.K., Gallagher, E., 2010. Polyphenol
composition and in vitro antioxidant activity of amaranth, quinoa buckwheat
and wheat as affected by sprouting and baking. Food Chem. 119, 770–778.
Atwell, W.A., Hyldon, R.G., Godfrey, P.D., 1988. Germinated quinoa flour to reduce
the viscosity of starchy foods. Cereal Chem. 65, 508–509.
Bassinello, P.Z., Cordenunsi, B.R., Lajolo, F.M., 2002. Amylolytic Activity in
Fruits: Comparison of Different Substrates and Methods Using Banana as
Model. J. Agric. Food Chem. 50, 5781–5786.
Belay, G., 2001. Zymogram patterns of a-amylase isozymes in Ethiopian tetraploid
wheat landraces : insight into their evolutionary history and evidence for gene
flow. Genet. Resour. Crop Ev. 48, 507-512.
Bergamo, P., Maurano, F., Mazzarella, G., Iaquinto, G., Vocca, I., Rivelli, A.R., De
Falco, E., Gianfrani, C., Rossi, M., 2011. Immunological evaluation of the
alcohol-soluble protein fraction from gluten-free grains in relation to celiac
disease. Mol. Nutr. Food Res. 55, 1266–70.
Bewley, J.D., Black, M., 1994. Germination, structure and composition, in: Seeds -
Physiology of development and germination. Plenum Press, New York, pp. 1–
33.
Catusse, J., Job, C., Job, D., 2012. Proteomics Reveals A Potential Role of the
Perisperm in Starch Remobilization During Sugarbeet Seed Germination, in:
Agrawal, G.K., Rakwal, R. (Eds.), Seed Development: OMICS Technologies
toward Improvement of Seed Quality and Crop Yield. Springer Netherlands,
Dordrecht, pp. 27–41.
Elgeti, D., Nordlohne, S.D., Föste, M., Besl, M., Linden, M.H., Heinz, V., Jekle, M.,
Becker, T., 2014. Volume and texture improvement of gluten-free bread using
quinoa white flour. J. Cereal Sci. 59, 41–47.
Fincher, G.B., 1989. Molecular and Cellular Biology Associated with Endosperm
Mobilization in Germinating Cereal Grains. Annu. Rev. Plant Physiol. Plant
Mol. Biol. 40, 305–346.
Hager, A.-S., Wolter, A., Jacob, F., Zannini, E., Arendt, E.K., 2012. Nutritional
properties and ultra-structure of commercial gluten free flours from different
botanical sources compared to wheat flours. J. Cereal Sci. 56, 239–247.

Chapter 4
107
Indyk, H.E., Edwards, M.J., Woollardb, D.C., 1996. High performance liquid
chromatographic analysis of lactose-hydrolysed milk. Food Chem. 57, 575–
580.
Jacobsen, S.E., Mujica, A., Ortiz, R., 2003. The global potential for quinoa and other
Andean crops. Food Rev. Int. 19, 139–148.
Laemmli, U.K., 1970. Cleavage of structural proteins during the assembly of the
head of bacteriophage T4. Nature 227, 680–685.
Larsson, M., Rossander-Hulthén, L., Sandström, B., Sandberg, A.S., 1996. Improved
zinc and iron absorption from breakfast meals containing malted oats with
reduced phytate content. Br. J. Nutr. 76, 677–88.
Lawrence, D.M., Halmer, P., Bowles, D.J., 1990. Mobilisation of storage reserves
during germination and early seedling growth of sugar beet. Physiol. Plant. 78,
421–429.
Lee, A.R., Ng, D.L., Dave, E., Ciaccio, E.J., Green, P.H.R., 2009. The effect of
substituting alternative grains in the diet on the nutritional profile of the
gluten-free diet. J. Hum. Nutr. Diet. 22, 359–63.
Mäkinen, O.E., Arendt, E.K., 2012. Oat malt as a baking ingredient – A comparative
study of the impact of oat, barley and wheat malts on bread and dough
properties. J. Cereal Sci. 56, 747–753.
Mäkinen, O.E., Zannini, E., Arendt, E.K., 2013. Germination of oat and quinoa and
evaluation of the malts as gluten free baking ingredients. Plant Foods Hum.
Nutr. 68, 90–5.
Mikola, M., 2001. Electrophoretic studies on the endoproteinases of oat grain. PhD
thesis, University of Helsinki, Finland.
Miller, G.L., 1959. Use of dinitrosalicylic acid Reagent for determination of reducing
sugar. Anal. Chem. 31, 426–428.
Prego, I., Maldonado, S., Otegui, M., 1998. Seed structure and localization of
reserves in Chenopodium quinoa. Ann. Bot. 481–488.
Ranhotra, G.S., Gelroth, J.A., Glaser, B.K., Lorenz, K.J., Johnson, D.L., 1992.
Composition and protein nutritional quality of quinoa. Cereal Chem. 70, 303-
305.
Rosa, M., Hilal, M., González, J.A., Prado, F.E., 2004. Changes in soluble
carbohydrates and related enzymes induced by low temperature during early
developmental stages of quinoa (Chenopodium quinoa) seedlings. J. Plant
Physiol. 161, 683–9.

Chapter 4
108
Tang H, Watanabe K, M.T., 2002. Characterization of storage starches from quinoa,
barley and adzuki seeds. Carbohydr. Polym. 49, 13–22.
Valencia, S., Svanberg, U., Sandberg, A.-S., Ruales, J., 1999. Processing of quinoa
(Chenopodium quinoa , Willd): effects on in vitro iron availability and phytate
hydrolysis. Int. J. Food Sci. Nutr. 50, 203–211.
Valencia-Chamorro, S.., 2003. Quinoa, In: Caballero, B (Ed.), Encyclopedia of Food
Science and Nutrition. Academic Press, Amsterdam, pp. 4895–4902.
Westermeier, R., 2006. Sensitive, quantitative, and fast modifications for Coomassie
Blue staining of polyacrylamide gels. Proteomics 6 Suppl 2, 61–4.
Wijngaard H.H., Renzetti S., and E.K.A., 2007. Microstructure of Buckwheat and
Barley During Malting Observed by Confocal Scanning Laser Microscopy and
Scanning Electron Microscopy. J Inst Brew 113, 34–41.
Yaldagard M, Mortazavi SA., T.F., 2008. Influence of ultrasonic stimulation on the
germination of barley seed and its alpha-amylase activity. African J.
Biotechnol. 7, 2465–2471.
Zarnkow M, Mauch A, Back W, Arendt EK, K.S., 2007. Proso millet (Panicum
miliaceum L.): An evaluation of the microstructural changes in the endosperm
during the malting process by using scanning-electron and confocal laser
microscopy. J. Inst. Brew. 113, 355–364.
Zarnkow, M., Geyer, T., Lindemann, B., Burberg, F., Back, W., Arendt, E.K.,
Kreisz, S., 2007. The use of response surface methodology to optimise malting
conditions of quinoa (Chenopodium quinoa) as a raw material for gluten-free
foods and beverages. Monatsschrift fur Brauwiss. 60, 118–126.

Chapter 5
109
Chapter 5
Localisation and development of proteolytic activities in quinoa
(Chenopodium quinoa) seeds during germination and early
seedling growth
Outi E. Mäkinen, Anna-Sophie Hager, Elke K. Arendt
Accepted for publication in Journal of Cereal Science

Chapter 5
110
Abstract
Quinoa (Chenopodium quinoa) is an Andean seed crop used in a similar
manner to cereals. Its seeds are perispermic with an endosperm present only in the
micropylar region. The storage globulins are mainly deposited in the embryo. In this
study, the development of proteolytic activities and protein profiles were studied in
these tissues during germination and early growth. The endosperm was highly
proteolytic with a 60-fold activity compared to the embryo. This endosperm activity
consisted 100 % of cysteine-proteases, and increased until 24 hours after imbibition
(hai). The activities found in the embryo consisted of aspartic, serine and metallo-
proteases, but remained nearly unchanged over the course of growth. The bulk of
seed proteins were found in the embryo globulin fraction with electrophoretic
mobilities corresponding to 49 and 57 kDa. These bands started fading 48 hai. The
presence of abscisic acid led to a lower proteolytic activity in the endosperm, and
increased the percentage of abnormally germinating seeds. The protease activities
found in the endosperm are not likely to be significant for storage protein
mobilisation as the majority of the storage proteins are located in the embryo. These
data suggests they may have a role in endosperm weakening during germination.

Chapter 5
111
5.1. Introduction
Quinoa (Chenopodium quinoa) is a dicotyledonous seed crop with high
resistance to adverse abiotic factors including drought, soil salinity and frost
(Bonifacio, 2003; Jacobsen et al., 2003). It is native to the Andean region, where it
has been cultivated for over 5000 years (Abugoch, 2009). Quinoa was the most
important seed crop in the pre-Columbian times, but the consumption nearly
vanished after the Spanish conquest, and it remained the food of Quechua and
Aymara peoples in rural mountain areas (Abugoch, 2009). In the recent years, quinoa
has attracted renewed interest due to its high nutritional value and absence of
proteins that cannot be tolerated by individuals with the celiac disease (Abugoch,
2009; Ranhotra et al., 1992). This has led to a steep increase in demand, with a
nearly 5-fold increase in production since 1970 (FAOSTAT, 2014; Jacobsen, 2003).
Quinoa seeds are flat and spherical with a mean diameter of 1.4-1.6 mm
(Abugoch, 2009). They are composed of a large central perisperm and a peripheral
embryo. The endosperm is present only in the micropylar region of the seed as a cap
surrounding the radicle tip (Prego et al., 1998). The deposition of storage is highly
compartmentalised: starch is located in the perisperm, while protein and lipid bodies
are found in the embryo and endosperm (Prego et al., 1998). Quinoa storage proteins
are a legumin type globulin (chenopodin) with a sedimentation coefficient of 11S,
and high-cysteine globulin with a sedimentation coefficient of 2S (Brinegar and
Goundan, 1993; Brinegar et al., 1996). Native chenopodin is a hexamer of subunits,
that each consist of an acidic (32-39 kDa) and basic (22-23 kDa) polypeptides
(Brinegar and Goundan, 1993; Müntz, 1996).
Germination starts by water uptake and ends when the radicle emerges
through the surrounding layers. The following growth is referred to as early seedling

Chapter 5
112
establishment (Bewley and Black, 1994a). In the seeds of some species, the
micropylar endosperm cap controls the germination by acting as a physical barrier
that prevents radicle protrusion (Bewley, 1997; Finch-Savage and Leubner-Metzger,
2006). The weakening of the micropylar endosperm has been reported to occur
during early germination by autolysis caused by cell-wall modifying proteins, cell-
wall polysaccharide degradation, and protein degradation (Morris et al. 2011, Finch-
Savage and Leubner-Metzger, 2006). Abscisic acid (ABA), a plant hormone that
regulates the induction and maintenance of dormancy, delays the onset of endosperm
weakening (Morris et al., 2011).
Dry, ungerminated quinoa seeds have a very high proteolytic activity,
comparable to that of malted barley. Additionally, the total activity does not
markedly change over 24 h germination period when analysed in the whole seed
(Mäkinen et al., 2013). In most seeds, storage protein mobilisation is initiated by de
novo synthesised endopeptidases that render the proteins into a more soluble form
and available for further degradation by another proteolytic enzyme (Müntz, 1996).
For example, the activity is very low in ungerminated cereals and starts to increase
only after 2-5 d after exposure to water (Brijs et al., 2002; Wrobel and Jones, 1992).
To shed light on the physiological role of the peculiar pattern of proteolytic
activities in quinoa, the development of these activities and changes in protein
profiles were studied separately in the perisperm, embryo and endosperm tissues
during germination and seedling establishment.

Chapter 5
113
5.2. Materials and methods
5.2.1 Materials
Red quinoa réal (Priméal, France) was desaponified by light abrasion using
spring water (personal communication with producer). Protein content of the whole
seed was 12.15%. Chemicals were purchased from Sigma-Aldrich (St Louis,
Missouri, USA) unless otherwise stated.
5.2.2 Germination and separation of tissues
Quinoa seeds (2 g) were imbibed with distilled water (6 ml) and grown in
petri dishes on two layers of filter paper in darkness at 15 °C. The water uptake of
the seeds was measured by choosing 20 seeds that were dried gently with tissue,
weighed and placed back in petri dishes. The influence of abscisic acid (ABA) on
germination power was tested with 10 and 50 µM ABA in identical conditions. For
analyses, samples were collected at different time points and the endosperms and
embryos were separated from perisperms using forceps. Samples were immediately
frozen and lyophilised.
5.2.3 Synthetisis of azogelatin
Azogelatin was prepared according to the method of Jones et al (1998).
Solution A was prepared by dissolving 20 g porcine skin gelatin (300 bloom) in 275
ml H2O containing 4 g NaHCO3 and heated until dissolved. Solution B was prepared
by subsequently dissolving 0.4 g NaOH; 1.73 g sulfanilic acid; 0.69 g NaNO2; 3.33
ml 6 M HCl in 30 ml H2O. Solution B was stirred until cloudy, 0.8 g NaOH was
added and the solution was combined with solution A under stirring. The mixture

Chapter 5
114
was dialysed (MW cut-off 12 400) against 3 x 4 l sodium azide (0.01%) and
lyophilised.
5.2.4 Extraction of proteolytic enzymes
Proteases from endosperm, perisperm and embryo of 50 seeds were extracted
in 0.05 M phosphate buffer (pH5.0) with 2 mM L-cysteine for 1 h at 4 °C.
Perisperms were homogenised in the buffer using a mortar and pestle, embryos were
homogenised using a high-shear dispenser (Ultra-Turrax T10, IKA-Werke GmbH &
Co. KG, Staufen, Germany) before extraction. Endosperms were extracted as is, and
homogenised using Ultra-Turrax only after the extraction, as considerable amount of
sample got caught in the dispersion head. Solids were separated by centrifugation (15
000 g x 15 min), and supernatants were filtered (0.45 μm). Extracts were analysed
immediately for in solution proteolytic activities.
5.2.5 Assay of proteolytic activities
Proteolytic activities of endosperms, perisperms and embryos excised from
quinoa seeds at different stages of growth were analysed at pH 2.5-7.0 as follows.
Extracts (30 μl) were mixed with 30 μl 0.1 M phosphate buffer of reaction pH.
Aqueous azogelatin solution was mixed with 0.2 M phosphate buffer of reaction pH
(1:1), to a final azogelatin concentration of 2%, and 67.5 μl of this solution was
added in the sample. Samples were incubated for 30 min at 40 °C, and reaction was
stopped by adding 112.5 μl cold trichloroacetic acid (TCA) (25%). Precipitated
substrate was removed by centrifugation (10 000 g x 10 min), and 200 μl of
supernatants were transferred in the wells of a flat-bottomed 96 well plates. The
absorbance was read at 450 nm (Multiscan FC, Thermo Fisher scientific, Vantaa,

Chapter 5
115
Finland). General proteolytic activities were expressed as increase in absorbance
compared to a reaction blank under experimental conditions. The reaction blank was
prepared by adding TCA before reaction. A unit of activity (U) was defined as the
increase in absorbance under experimental conditions.
5.2.6 Effect of class-specific inhibitors on protease activity
The effect of class-specific inhibitors on gelatin hydrolysing activity was
determined at optimum pH of each tissue. The following inhibitors were used at
concentrations chosen based on preliminary trials: 20 μm E-64 (cysteine (Cys)
protease inhibitor), 20 μm pepstatin A (Pep-A; aspartic (Asp) protease inhibitor), 1
mM phenylmethanesulfonyl fluoride (PMSF; serine (Ser) protease inhibitor) and 10
mM o-phenanthroline (o-phen; metallo (Met) protease inhibitor). Extracts (30 μl)
prepared as described under 2.3.2 were incubated with each inhibitor (1.25 μl) for 5
min and the proteolytic activities were analysed as previously described, and the
inhibition was expressed against a control without the inhibitor [Eq. 1].
𝐼𝑛ℎ𝑖𝑏𝑖𝑡𝑖𝑜𝑛(%) = 𝐴𝑐𝑜𝑛𝑡𝑟𝑜𝑙 − (𝐴𝑠𝑎𝑚𝑝𝑙𝑒
𝐴𝑐𝑜𝑛𝑡𝑟𝑜𝑙) × 100
5.2.7 SDS-PAGE
Tissues were extracted sequentially in dH2O (albumin fraction) and 0.05 M
Tris-HCl buffer (pH 9.0) with 0.5 M NaCl (globulin fraction), both containing 10
μl/ml protease inhibitor cocktail (P9599; Sigma-Aldrich). Perisperm samples were
ground using mortar and pestle in extraction solution, embryos were homogenised
before and after extraction using a high-shear disperser, and endosperms were
homogenised only after extraction. The extraction was performed at 5 °C for 60 min,
followed by centrifugation (2500 g x 5 min at 4 °C). Protein contents of the extracts
[Eq. 1]

Chapter 5
116
were determined using the Bradford assay, and samples were diluted in water or
extraction buffer, and sample loading buffer (yielding final concentrations of 2%
SDS, 4% glycerol, 2.5 mM DTT and 0.01% coomassie blue in 0.05 M Tris-HCl, pH
6.8). Each well of a 12.5 % polyacrylamide gel (10 x 10 cm) was loaded with 10 μg
protein, and electrophoresis was performed at 7 °C according to Laemmli (1970).
Gels were stained using a modified sensitive colloidal staining protocol
(Westermeier, 2006). Molecular weight markers were run in parallel with the
samples (Precision Plus Protein standards, All Blue, Bio-Rad, Richmond, CA). Gels
were scanned and bands were quantified by densitometry (ImageJ 1.47v, National
Institutes of Health, USA). Band densities were expressed relative to the
corresponding bands from ungerminated seeds (0 h).
5.2.8 Scanning electron microscopy
Whole seeds and endosperm caps excised from ungerminated and 24 hai
seeds were lyophilised, attached on aluminium stubs with conductive carbon cement
(Leit-C, Neubauer Chemikalien, Münster, Germany), and sputter coated with a 5 nm
layer of gold/palladium (80:20) (Polaron E5150 Sputter Coating). Samples were
examined using a Jeol Scanning Electron Microscope (JSM-5510, Jeol Ltd., Tokyo,
Japan) at an acceleration voltage of 7 kV and a working distance of 20 mm.
5.2.9 Statistical analyses
All analyses were carried out at least in triplicate. Means were compared
using one way analysis of variance (ANOVA) and Tukey’s post hoc test using
Statistica 12 (StatSoft, Tulsa, OK, USA). The level of significance was determined at
p < 0.05.

Chapter 5
117
5.3 Results
5.3.1 Water uptake, germination and the influence of ABA
The majority of seeds had completed germination (defined as ruptured
endosperm) between 6 and 10 hours after imbibition (hai), when the water content of
the seeds increased from 41 to 45 % (Figure 5.1 a). The seeds germinated in two
steps, where the rupture of the seed coat and endosperm occurred separately approx.
2 h apart (Figure 5.2 a-b). The extent of endosperm rupture varied, ranging from the
formation of a hole through which the radicle continued to grow (Figure 5.2 d), to
complete splitting of the tissue on one side (Figure 5.2 e-f).
Figure 5.1. Time course of water uptake (●) and germination (○) (a), and the
influence of ABA (10 µM) on the occurrence of ruptured endosperm and testa
(green), ruptured testa only (yellow) and no radicle expansion (grey) 22 hai (b).
The presence of abscisic acid (ABA) led to a near 2.5-fold increase in the
percentage of seeds that exhibited ruptured testa only, but an intact endosperm 22 hai
(Figure 5.1 b). ABA did not significantly influence the percentage of seeds not
showing visible changes (“non-germinating”). Higher ABA concentration (50 µM)
had an impact similar to 10 µM after 22 h (not shown). When the seeds that
exhibited only testa rupture were germinated for another 12 h (total 34 h), endosperm
0
20
40
60
80
100
0
10
20
30
40
50
60
0 2 4 6 8 10 12 14 16 18
End
osp
erm
rup
ture
(%)
Wat
er
con
ten
t (%
)
hai
a.
0%
20%
40%
60%
80%
100%
120%
Control ABA 10
% o
f se
ed
s
b.

Chapter 5
118
Figure 5.2. SEM images of ruptured seed coat (a) and endosperm (b) in germinating
quinoa seeds. Abnormal germination in the presence of ABA (c). The appearance of
an intact endosperm of a non-germinated seed (d) ruptured endosperms excised from
24 hai seeds (e-f). Bars 500 µm.
rupture had occurred in 33 and 39% of the seeds in the absence and presence of
ABA, respectively (not shown). Additionally, 32.5 % of the ABA treated seeds
showed radicle elongation despite an intact endosperm. In this case, the endosperm
was either torn off the seed but still around the tip of the growing radicle, or still
connected to the seed, causing the radicle-hypocotyl axis to burst out the seed with
the radicle tip and cotyledons still attached (Figure 5.2 c). A higher ABA
concentration (50 µM) decreased the number of seeds exhibiting this behaviour, with
most seeds remaining unchanged between 22 and 34 h. Overall, ABA appeared to
inhibit or delay the endosperm rupture, but did not stop the embryo from growing.
5.3.2 Proteolytic activities
Proteolytic activities of endosperms, perisperms and embryos excised from
quinoa seeds at different stages of growth are presented in Figures 5.3a-c as a
function of pH. Activity was found at a pH range 3.0-6.0 in endo- and perisperms
with optima at pH 4.0. The activities increased until 24 hai in endo- and perisperms,
c.
ht
tp
:/
/
w
w
w.
te
m
pe
.fi
/e
tu
si
vu
/s
h
or
tly
-
in
-
en
gli
sh
b.
ht
tp
:/
/
w
w
w.
te
m
pe
.fi
/e
tu
si
vu
/s
h
or
tly
-
in
-
en
gli
sh
a.
ht
tp
:/
/
w
w
w.
te
m
pe
.fi
/e
tu
si
vu
/s
h
or
tly
-
in
-
en
gli
sh
f.
ht
tp
:/
/
w
w
w.
te
m
pe
.fi
/e
tu
si
vu
/s
h
or
tly
-
in
-
en
gli
sh
e.
ht
tp
:/
/
w
w
w.
te
m
pe
.fi
/e
tu
si
vu
/s
h
or
tly
-
in
-
en
gli
sh
d.
ht
tp
:/
/
w
w
w.
te
m
pe
.fi
/e
tu
si
vu
/s
h
or
tly
-
in
-
en
gli
sh

Chapter 5
119
after which they declined. A low level of activity at a higher pH range, between 6.0
and 6.5, arose 24 hai in the endosperm, and 48 hai in the perisperm (Figure 5.3 a-b).
In the embryo, the activity shifted towards higher pH, with most activity found
between pH 3.5 and 6.5, with an optimum between 4.5 and 5.0 (Figure. 5.3 c). In
contrast to the other tissues, nearly no changes in the level of activity were found in
the embryo except a slight increase in activity between 12 and 24 hai despite the
increase in total mass of the tissue over the course of growth.
When the activities were expressed per mass, it was clear that the endosperm
was highly proteolytic, with a maximum activity of 116.6 U/g, compared to the
maxima of perisperm (4.1 U/g) and embryo (2.0 U/g) (not shown). The endosperm
made up 29 % of the total activity in ungerminated seeds (0 hai), which increased to
40 % by 24 hai.
As ABA appeared to inhibit or delay the endosperm rupture, the influence of
10 µM ABA on the proteolytic activity found in the endosperm was tested after 24
hai. The activity was significantly lower in the presence of ABA (Figure 5.3 d), and
comparable to the level of activity found after 12 h in the absence of ABA (Figure
5.3 a). Hence, it appears that the high proteolytic activity in the endosperm tissue is
at least partly related to endosperm weakening.
5.3.3 Effect of class-specific inhibitors
Class-specific protease inhibitors were used to evaluate the activities in each
tissue. The presence of E-64 (Cys) led to a full inhibition of proteolytic activity in
endo- and perisperms (Table 5.1). Also, chelation of metal ions with o-
phenanthroline inhibited the activity by 68 and 56% in endo- and perisperms,

Chapter 5
120
Figure 5.3. General proteolytic activities of quinoa endosperm (a), perisperm (b) and
embryo (c) as a function of pH 0 hai ( ), 12 hai ( ), 24 h ( ), 48 hai ( )
and 72 hai ( ), and in the endosperm after 24 h in the absence and presence of 10
µM ABA (d).
Cys protease activity remained unchanged. Low levels of inhibition were achieved
with Pep-A (Asp) and PMSF (Ser) in ungerminated endosperm, and in the perisperm
72 hai.
In the ungerminated embryo, proteolytic activity was inhibited by Pep-A
(41.4 %), PMSF (27.4%) and o-phen (81.3 %), indicating the presence of Asp, Ser
and metallo protease activities, but it was completely absent of Cys protease activity.
However, 72 hai Cys protease activity emerged (13.6 % inhibition by E-64), while
the other activities did not change over the course of germination. Overall, the
activities in endo- and perisperms showed very similar patterns, but a different set on
proteolytic activities was present in the embryo.
0
0,1
0,2
0,3
0,4
0,5
0,6
2,5 4,5 6,5
A4
50
(5
0 s
ee
ds)
a.
0
0,1
0,2
0,3
0,4
0,5
0,6
0,7
2,5 3,5 4,5 5,5 6,5
A4
50
(50
se
ed
s)
b.
0
0,02
0,04
0,06
0,08
0,1
0,12
2,5 4,5 6,5
A4
50
(5
0 s
ee
ds)
c.
0,0
0,1
0,2
0,3
0,4
0,5
0,6
Control ABA
A4
50
(5
0 s
ee
ds)
d.

Chapter 5
121
Table 5.1. Inhibition (as % of the activity without inhibition) by class-specific
inhibitors.
Inhibitor
Tissue hai E-64 Pep-A PMSF o-phen
Endosperm 0 101.2 ± 1.58 a 10.5 ± 2.24 a 5.5 ± 3.49 a 68.0 ± 4.45 a
24 100.7 ± 0.43 a 1.3 ± 2.91 b 0.8 ± 2.47 a 54.9 ± 2.47 b
48 101.3 ± 2.33 a -3.1 ± 2.82 b -1.0 ± 2.86 a 57.9 ± 5.50 b
72 99.2 ± 0.38 a -0.7 ± 5.39 b 2.8 ± 4.34 a 54.6 ± 3.82 b
Perisperm 0 99.4 ± 0.86 a -1.1 ± 0.75 c 1.9 ± 0.64 b 56.0 ± 2.18 b
24 98.8 ± 1.73 a 0.7 ± 3.38 bc 4.2 ± 1.66 b 56.6 ± 3.75 b
48 100.5 ± 2.48 a 5.9 ± 2.01 b 9.9 ± 4.46 a 58.9 ± 2.62 b
72 100.7 ± 3.84 a 13.2 ± 5.16 a 12.8 ± 1.54 a 68.1 ± 2.34 a
Embryo 0 -2.5 ± 5.19 b 41.4 ± 5.46 a 27.4 ± 4.61 ab 81.3 ± 5.78 a
24 1.4 ± 4.48 b 39.0 ± 3.51 a 27.2 ± 1.75 b 71.0 ± 7.20 a
48 3.7 ± 4.58 ab 46.4 ± 1.40 a 35.9 ± 4.67 a 74.3 ± 2.01 a
72 13.6 ± 3.84 a 46.3 ± 2.61 a 35.5 ± 1.36 a 72.9 ± 1.50 a
Values within a column within that tissue that share a superscript are not significantly different from
one another (p<0.05).
5.3.4 Changes in protein profiles
The majority of seed proteins was found in the embryo globulin (GL) fraction
(Figure. 5.4 a). Under non-reducing conditions, two bands corresponding to
chenopodin subunits with molecular weights of 49 and 57 kDa were observed. These
proteins dissociated into pairs of acidic (28 and 34 kDa) and basic (17 and 19 kDa)
chains in the presence of a reducing agent (DTT). The molecular weights were
slightly lower than previously reported (32-39 and 22-23 kDa) (Brinegar and
Goundan, 1993). Also a 50 kDa protein was found in the GL fraction under reducing
conditions by Brinegar and Goundan (1993). They suggested that this protein may be
an 11S subunit precursor before the post-translational separation of the acidic and

Chapter 5
122
basic chains. The 49 and 57 kDa proteins showing the same behavior under reducing
conditions were also found in the endosperm decreased to 0.95 and 0.96 after 48 h
and 0.84 and 0.88 after 72 h for 49 and 57 kDa bands, respectively. In the
endosperm, changes were visible already after 24 h. The 57 kDa protein was
degraded faster: the relative density was 0.49 after 24 h, and the whole band has
disappeared after 48 h, while the 49 kDa band was still visible after 48 h with a
relative density of 0.31.
Figure 5.4. SDS-PAGE profiles of globulin fractions of embryo under non-reducing
(a) and reducing (b) conditions, and endosperm (c) and perisperm (d) under non-
reducing conditions. Numbers over each lane indicates hours after imbibition.
Chenopodin subunits (11 S), and acidic (A) and basic (B) polypeptides and are
indicated.
11S
A
B
0 24 48 72 0 24 48 72 0 24 48 72 0 24 48 72
100 ---
150 ---
50 ---
37 ---
25 ---
20 ---
15 ---
75 ---
kDa a. b. c. ht
d.

Chapter 5
123
5.4. Discussion
Quinoa germinated very fast, with the majority of seeds showing radicle
protrusion 6-10 h after exposure to water. Very fast germination (<24 h) is a trait
found in some seeds from high-stress habitats, most of them belonging in the former
Chenopodiaceae family (Parsons, 2012). The ability to exploit favourable conditions
by fast germinating rapidly may be a means of survival in these environments
(Gutterman, 1972; Parsons, 2012).
The application of exogenous ABA inhibited or delayed endosperm rupture
but did not stop the embryo from growing, leading to a high occurrence of seeds
showing significant radicle elongation despite intact endosperms. The presence of
ABA also reduced the proteolytic activity found in the endosperm after 24 h by 40%.
These observations suggest that ABA may be involved in the control of endosperm
weakening, but does not prevent the seed from germinating alone at least when
added during imbibition. ABA has been found to delay the endosperm weakening in
cress (Lepidium sativum) and Arabidopsis thaliana, playing at least a partial role in
the mediation of radicle protrusion (Müller et al., 2006).
Experiments with class-specific protease inhibitors showed that the
endosperm activity consisted 100 % of Cys proteases, of which 68 % were also
inhibited by a metallo protease inhibitor, indicating the requirement of metal ions for
these enzymes. The embryo was absent of Cys activity until 72 hai, before which its
activity consisted of Asp, Ser and Met protease activities. Storage protein
mobilisation from the native protein to amino acids is a result of sequential activity
of various enzymes (Bewley and Black, 1994b). The general pattern in
dicotyledonous seeds is the initiation of globulin mobilisation by a de novo
synthesised Cys protease (proteinase A), followed by further degradation by another

Chapter 5
124
Cys protease (proteinase B) and carboxypeptidases (Bewley and Black, 1994b;
Müntz, 1996). Some reports of triggering proteases from other classes exist: in
soybean (Glycine max), a Ser protease initiates the degradation of β-conglycinin
subunits, and a Met protease has been found to perform limited proteolysis on
buckwheat (Fagopyrum esculentum) 13S globulin (Belozersky et al., 1990; Qi et al.,
1992). Storage protein mobilisation in the cotyledons and endospermic storage
tissues generally occurs after radicle protrusion, but stored proteases start globulin
mobilisation in the embryonic axes and cotyledons of vetch (Vicia sativa) already
during germination (Schlereth et al., 2001).
It is notable that the class-specific protease activities remained relatively
unchanged over the course of 72 h. The endosperm activities increased and peaked
24 hai, but no significant changes in the total activity or the influence of class-
specific inhibitors was observed in embryo proteases except the emergence of a low
level of Cys protease activity between 48 and 72 hai before. Before 48 hai, the
embryo was absent of Cys proteases. Whether this activity is relevant for storage
globulin mobilisation remains unanswered. Although degradation of 11S subunits in
the GL fraction was not obvious before 72 hai, the fading of the corresponding bands
in the AL fraction 48 hai indicate occurrence of proteolysis earlier in the embryonic
tissues. Storage globulin mobilisation in amaranth (Amaranthus hypochondriacus)
seeds is initiated by limited proteolysis leading to changes in charge immediately
after the completion of germination (Aphalo et al., 2009). In vetch (Vicia sativa),
stored proteases trigger the globulin mobilisation, but the bulk of the proteolysis is
performed by de novo synthesised proteases (Müntz, 2001; Schlereth et al., 2001).
The absence of significant changes in the protease activities in the quinoa embryo do
not indicate major synthesis of proteases. However it has to be noted that activities

Chapter 5
125
measured in tissue extracts may not reflect in planta activity, as the storage proteins
may be protected from premature degradation by maintaining the enzymes inactive, a
structural feature in the protein that inhibits proteolysis, or compartmentation that
prevents the enzyme from contact with its substrate (Bewley and Black, 1994a;
Müntz, 1996; van der Hoorn et al., 2004). For example, a vacuolar Cys proteinase
that hydrolyses storage proteins in legumes is processed into a mature form at pH
values <5.8, which occurs only after the pH has decreases from 6 to 5.5 during
germination, preventing its activity at the pH of the protein bodies of ungerminated
seeds (Okamoto et al., 1999).
Although embryo is the major protein storage tissue in quinoa, protein bodies
are present also in the endosperm (Prego et al., 1998). Extraction of protein from
endosperms at different stages of growth showed rapid degradation of the 11S
subunit bands. It may be assumed, that the high Cys protease activity found in the
endosperm is responsible for the hydrolysis of these proteins. In a study on cress, the
incubation of excised endosperm caps with Asp, Ser and Cys protease inhibitors each
decreased tissue autolysis by 30 % compared to control, and the inhibition of the 26S
proteasome led to a complete inhibition of the endosperm autolysis (Morris et al.,
2011). Each class of studied proteases had an effect, implying that the degradation of
numerous protein targets is necessary for endosperm autolysis in this particular seed.
Müller et al. (2010) reported Asp protease accumulation in the endosperm cap of
germinating cress during endosperm weakening. The authors suggested that the
enzyme serves a non-nutritional function in the control of germination.
To conclude, the high endosperm protease activity is not likely to be
significant in terms of storage protein mobilisation because of the bulk of storage
proteins is located in the embryo. The negative influence of ABA on the occurrence

Chapter 5
126
of endosperm rupture and the development of proteolytic activity in the endosperm
suggests that protein degradation is involved in endosperm weakening. The total
proteolytic activity in the embryo remained unchanged over the course of 72 h,
evoking the question whether the key proteases responsible for embryonic storage
protein mobilisation are already stored in the dry ungerminated seed.
Acknowledgments
This study was funded by the Food Institutional Research Measure
administered by the Department of Agriculture, Fisheries and Food (Ireland) and the
Irish Research Council. We sincerely thank Prof. Leubner-Metzger for illuminating
discussions.

Chapter 5
127
References
Abugoch James, L., E., 2009. Quinoa (Chenopodium quinoa Willd.): Composition,
chemistry, nutritional, and functional properties. Adv. Food Nutr. Res. 58, 1–31.
Aphalo, P., Martínez, E.N., Añón, M.C., 2009. Structural modifications of Amaranth
proteins during germination. Protein J. 28, 131–8.
Belozersky M., A., Dunaevsky Y., E., Voskoboynikova N., E., 1990. Isolation and
properties of a metalloproteinase from buckwheat (Fagopyrum esculentum)
seeds. Biochem. J. 15, 677–682.
Bewley, J.D., 1997. Breaking down the walls - a role for endo-β-mannanase in
release from seed dormancy? Trends Plant Sci. 2, 464–469.
Bewley, J.D., Black, M., 1994a. Germination, structure and composition, in: Seeds -
Physiology of development and germination. Plenum Press, New York, pp. 1–
33.
Bewley, J.D., Black, M., 1994b. Mobilization of stored seed reserves, in: Seeds -
Physiology of Development and Germination. Plenum Press, New York, pp.
293–343.
Bonifacio, A., 2003. Chenopodium Sp.: Genetic resources, ethnobotany, and
geographic distribution. Food Rev. Int. 19, 1–7.
Brijs, K., Trogh, I., Jones, B.L., Delcour, J.A., 2002. Proteolytic enzymes in
germinating rye grains. Cereal Chem. 79, 423–428.
Brinegar, C., Goundan, S., 1993. Isolation and characterization of chenopodin, the
11S seed storage protein of quinoa (Chenopodium quinoa). J. Agric. Food
Chem. 41.
Brinegar, C., Sine, B., Nwokocha, L., 1996. High-cysteine 2S seed storage proteins
from quinoa (Chenopodium quinoa). J. Agric. Food Chem. 44, 1621–1623.
FAOSTAT, 2014. Agricultural statistics database. Word Agric. Inf. Cent., Rome,
Italy.
Finch-Savage, W.E., Leubner-Metzger, G., 2006. Seed dormancy and the control of
germination. New Phytol. 171, 501–23.
Gutterman, Y., 1972. Delayed seed dispersal and rapid germination as survival
mechanisms of the desert plant Blepharis persica (Burm.) kuntze. Oecologia 10,
145–149.
Jacobsen, S.-E., 2003. The worldwide potential for quinoa (Chenopodium quinoa
Willd.). Food Rev. Int. 19, 167–177.

Chapter 5
128
Jacobsen, S.-E., Mujica, A., Jensen, C.R., 2003. The resistance of quinoa
(Chenopodium quinoa Willd.) to adverse abiotic factors. Food Rev. Int. 19, 99–
109.
Mäkinen, O.E., Zannini, E., Arendt, E.K., 2013. Germination of oat and quinoa and
evaluation of the malts as gluten free baking ingredients. Plant Foods Hum.
Nutr. 68, 90–5.
Morris, K.D., Linkies, A., Müller, K., Oracz, K., Wang, X., Lynn, J.R., Leubner-
Metzger, G., Finch-Savage, W.E., 2011. Regulation of seed germination in the
close Arabidopsis relative Lepidium sativum: a global tissue-specific transcript
analysis. Plant Physiol.
Müller, K., Job, C., Belghazi, M., Job, D., Leubner-Metzger, G., 2010. Proteomics
reveal tissue-specific features of the cress (Lepidium sativum L.) endosperm cap
proteome and its hormone-induced changes during seed germination.
Proteomics 10, 406–16.
Müller, K., Tintelnot, S., Leubner-Metzger, G., 2006. Endosperm-limited
Brassicaceae seed germination: abscisic acid inhibits embryo-induced
endosperm weakening of Lepidium sativum (cress) and endosperm rupture of
cress and Arabidopsis thaliana. Plant Cell Physiol. 47, 864–77.
Müntz, K., 2001. Stored proteinases and the initiation of storage protein mobilization
in seeds during germination and seedling growth. J. Exp. Bot. 52, 1741–1752.
Müntz, K., 1996. Proteases and proteolytic cleavage of storage proteins in
developing and germinating dicotyledonous seeds. J. Exp. Bot. 47, 605–622.
Okamoto, T., Yuki, A., Mitsuhashi, N., Mimamikawa, T., 1999. Asparaginyl
endopeptidase (VmPE-1) and autocatalytic processing synergistically activate
the vacuolar cysteine proteinase (SH-EP). Eur. J. Biochem. 264, 223–232.
Parsons, R.F., 2012. Incidence and ecology of very fast germination. Seed Sci. Res.
22, 161–167.
Prego, I., Maldonado, S., Otegui, M., 1998. Seed structure and localization of
reserves in Chenopodium quinoa. Ann. Bot. 481–488.
Qi, X., Wilson, K.A., Tan-Wilson, A.L., 1992. Characterization of the major protease
involved in the soybean - conglycinin storage protein mobilization. Plant
Physiol. 99, 725–733.
Ranhotra, G.S., Gelroth, J.A., Glaser, B.K., Lorenz, K.J., Johnson, D.L., 1992.
Composition and protein nutritional quality of quinoa. Cereal Chem. 70, 303-
305.
Schlereth, A., Standhardt, D., Mock, H.-P., Müntz, K., 2001. Stored cysteine
proteinases start globulin mobilization in protein bodies of embryonic axes and

Chapter 5
129
cotyledons during vetch (Vicia sativa L.) seed germination. Planta. 212, 718–
727.
Van der Hoorn, R.A.L., Leeuwenburgh, M.A., Bogyo, M., Joosten, M.H.A.J., Peck,
S.C., 2004. Activity profiling of papain-like cysteine proteases in plants. Plant
Physiol. 135, 1170–8.
Westermeier, R., 2006. Sensitive, quantitative, and fast modifications for Coomassie
Blue staining of polyacrylamide gels. Proteomics 6 Suppl 2, 61–4.
Wrobel, R., Jones, B.L., 1992. Appearance of endoproteolytic enzymes during the
germination of barley. Plant Physiol. 100, 1508–1516.

Chapter 6
130
Chapter 6
Germination of oat and quinoa and evaluation of the malts as
gluten free baking ingredients
Outi E. Mäkinen, Emanuele Zannini, Elke K. Arendt
Published in Plant Foods for Human Nutrition. 68 (2013): 90–95

Chapter 6
131
Abstract
Germination can be used to improve the sensory and nutritional properties of
cereal and pseudocereal grains. Oat and quinoa are rich in minerals, vitamins and
fibre while quinoa also contains high amounts of protein of a high nutritional value.
In this study, oat and quinoa malts were produced and incorporated in a rice and
potato based gluten free formulation. Germination of oat led to a drastic increase of
α-amylase activity from 0.3 to 48 U/g, and minor increases in proteolytic and
lipolytic activities. Little change was observed in quinoa except a decrease in
proteolytic activity from 9.6 to 6.9 U/g. Oat malt addition decreased batter viscosities
at both proofing temperature and during heating. These changes led to a decrease in
bread density from 0.59 to 0.5 g/ml and the formation of a more open crumb, but
overdosing of oat malt deteriorated the product as a result of excessive amylolysis
during baking. Quinoa malt had no significant effect on the baking properties due to
low α-amylase activity. Despite showing a very different impact on the bread quality,
both malts influenced the electrophoretic patterns of rice flour protein similarly. This
suggests that malt induced proteolysis does not influence the technological properties
of a complex gluten free formulation.

Chapter 6
132
6.1 Introduction
Celiac disease (CD) is an immune-mediated enteropathy with a worldwide
prevalence of 1%, triggered by wheat gluten and related proteins in rye and barley
(Catassi and Fasano, 2008). The only treatment is the complete exclusion of these
proteins from the diet (Catassi and Fasano, 2008). Uncontaminated oat is well
tolerated by most CD patients and the consumption of “pure oat” is recommended by
many national coeliac associations, while quinoa is considered safe (Bergamo et al.,
2011; Butzner, 2011; Kemppainen et al., 2007). Commercial gluten free breads are
often produced using ingredients low in minerals and fibre (Hager et al., 2011). The
inclusion of oat and quinoa in standard gluten free diets has been found to improve
the nutrient profile, increasing especially the intake of fibre, iron, folate and protein
(Lee et al., 2009).
Oat (Avena sativa) is a cereal rich in minerals, vitamins and compounds with
antioxidant activities, and it contains protein high in lysine (Lásztity, 1998). Also its
main cell wall constituent, (1→3), (1→4)-β-glucan, carries an FDA and EFSA
approved health claim on a cholesterol lowering effect (Wood, 2010). Quinoa
(Chenopodium quinoa) is a pseudocereal indigenous to the Andean region, where it
has been used as a staple food for thousands of years (Repo-Carrasco et al., 2003).
Quinoa seeds contain high amounts of vitamins, minerals and protein with a good
digestibility and a balanced amino acid profile (Repo-Carrasco et al., 2003; Ruales
and Nair, 1992). Due to its excellent nutritional value and a potential for production
in various climates (incl. Europe), quinoa has been declared as one of the humanity’s
most promising crops by the Food and Agriculture Organisation of the United
Nations (FAO, 2011; Jacobsen et al., 2003).

Chapter 6
133
During malting the grains are soaked, germinated and subjected to a heat
treatment to end the metabolic processes and to develop aroma and flavour. During
the germination step the storage compounds of the seed are being mobilised by a
variety of synthesised and activated enzymes, resulting in an improved protein
digestibility and mineral bioavailability (Kaukovirta-Norja et al., 2004; Valencia et
al., 1999). The metabolic processes occurring in the germinating seeds also lead to an
increase in antioxidant activity and the formation of secondary metabolites with
possible bioactivities (Kaukovirta-Norja et al., 2004; Kim et al., 2012).
The aim of this study was to germinate oat and quinoa and evaluate their
suitability for use in gluten free baking. In addition to influencing the nutritional
profile of gluten free products, the malt enzymes may influence the technological
quality of the products: barley and wheat malts are used in the industry as natural
dough conditioners in wheat based products. Fortification of wheat bread with
unconventional malted grains has been studied previously on malted quinoa, oat,
sorghum and brown rice (Hugo et al., 2000; Mäkinen and Arendt, 2012; Park and
Morita, 2005; Watanabe et al., 2004) but to the author‘s knowledge no work on
gluten free systems has been published.
6.2 Materials and methods
6.2.1 Malting
Oat (variety Lutz, Germany) was steeped, germinated at 15 °C for 5 d and
subsequently kilned in three stages (35 °C, 50 °C and 60 °C) in a malting machine
(Joe White Malting Systems, Perth, Australia). Commercial white quinoa (variety
unknown, Bolivia) was steeped for 5 h, germinated at 15 °C for 24 h and kilned in
four stages (45°C, 50°C, 55°C and 65°C). Before use the rootlets and protruding

Chapter 6
134
cotyledons were removed by hand, and the malts were ground to pass a 0.25 mm
sieve.
6.2.2 Enzyme activities of malts
α- and β-amylase activities were determined by Ceralpha and Betamyl-3
methods (Megazyme, Wicklow, Ireland). Proteolytic activities were determined from
malts extracted in 0.05 M acetate buffer containing 2 mM L-cysteine (pH 5.0) at a
ratio of 1:3 for 30 min at 5 °C. Solids were removed by centrifugation (10 000 g x
15 min) and samples assayed against 1.4% (w/v) azocasein in 0.2 M sodium acetate
buffer for 1 h. The reaction was stopped with 10% trichloroacetic acid and the
samples were centrifuged. The supernatant was mixed with 0.5 M NaOH (1:1) and
absorbance at 440 nm measured after 20 min. Lipase activities were determined
using the dough method (Matlashewski et al., 1982) by incubating defatted malt
samples in a mixture of Tris-HCl buffer (0.05 M, pH 7.5), 9.8 % (w/w) glyceryl
trioleate and 1% Triton-X for 60 min as described in detail previously (Mäkinen and
Arendt, 2012). The reaction was stopped with 1 M HCl. The free fatty acids were
extracted in 2,2,4-trimethylpentane, quantified using the copper soap method against
an oleic acid standard curve (Kwon and Rhee, 1986).
6.2.3 Malt protease induced changes in ingredients using lab-on-a-chip capillary
electrophoresis
The effect of malt proteases on whey protein isolate (WPI) and rice flour
proteins were studied by incubating each ingredient with 5% malts in 0.2 M acetate
buffer (pH 5.4) at 30°C for 24 h, followed by lyophilisation. Ground samples (rice
flour 20 mg; WPI 10 mg) were extracted in 1 ml buffer (5 M urea, 50 mM DTT and
2% (w/v) SDS in 0.1 M Tris-HCl; pH 8.8) for 2 h, solids removed by centrifugation

Chapter 6
135
(15 000 g x 15 min) and supernatants were diluted (rice flour 1:1 and WPI 1:9). The
protein profiles were analysed using a Protein80 kit with a molecular weight range of
5-80 kDa (Bioanalyzer, Agilent Technologies, Palo Alto, USA) under reducing
conditions using reagents and standards provided by the manufacturer. For result
evaluation the raw data was rescaled to match the height of the upper marker when
necessary.
6.2.4 Batter properties
Starch pasting properties of rice flour and potato starch mixtures (1:1) with
oat and quinoa malts were determined using the Rapid Visco Analyzer (General
Pasting Method, AACC 76-21). The densities of the batters was measured by
transferring 30 g batter in a 100 ml measuring cylinder immediately after mixing and
recording the volume before and after 30 min proofing at 30 °C.
For rheological measurements, batters excluding yeast were mixed for 70 s
with Glutomatic (Falling Number AB, Huddinge, Sweden), incubated in a proofer
(30°C) for 30 min and then mounted on a controlled stress rheometer (MCR301,
Anton Paar GmbH, Austria) with a cross-hatched parallel plate geometry (50 mm;
gap 2 mm). A frequency sweep at a 0.01% strain was performed for angular
frequencies (ω) 0.628-62.8 s-1
followed by a viscosity measurement for shear rates
0.6-5 s-1
. The complex moduli (G*) values from the frequency sweep were fitted
using a weak gel model (Eq. 1) (Gabriele et al., 2001).
G(ω)∗ = AFω
1z⁄
The effect of the malt enzymes on the viscosities of 0.3% xanthan and
hydroxypropylmethylcellulose (HPMC) solutions was studied by incubating the
samples with malt extracts (extracted for 15 min in 0.04 M acetate buffer (pH 4.6);
•
Eq. 1

Chapter 6
136
1:3 extraction ratio) for 30 min at 30 °C and measuring the viscosities between shear
rates 1-50 s-1
. All measurements were performed at 30 °C.
6.2.5 Baking and bread properties
A previously published formulation was used for the baking trials (Table 6.1) (Nunes
et al., 2008). The yeast (2%; Puratos, Belgium) was activated by dissolving it in 30˚C
tap water (90% on flour basis) and the suspension was added to pre-mixed dry
ingredients: rice flour (50%; Doves Farm Foods Ltd, UK), potato starch (50%;
Doves Farm Foods Ltd, UK), whey protein isolate (10%; Glanbia, Ireland), vegetable
oil (6%; Homestead, Ireland), sugar (2%; Siucra, Ireland), salt (2%; Glacia British
Salt Ltd., UK), xanthan gum (0.3%; Keltrol F; CP Kelko, Atlanta, U.S.A), HPMC
(0.3%; Metolose NE-4000, Harke, Germany) and the ground malts, and mixed for 2
min using a Kenwood Chef (Kenwood Manufacturing Co. Ltd., UK). Batter was
proofed in tins for 30 min (30˚C; RH 85%) and the loaves were baked for 45 min at
190 °C in a deck oven (MIWE, Arnstein, Germany).
Table 6.1. Recipes used in the baking trials.
Ingredient
Baker's
%
(%)
Control
(g)
0.5%
malt (g)
0.75%
malt (g)
1%
malt
(g)
2%
malt
(g)
2.5%
malt
(g)
5%
malt
(g)
Rice flour 50 300 298.5 297.75 297 294 292.5 285
Potato starch 50 300 298.5 297.75 297 294 292.5 285
Malt 0 0 3 4.5 6 12 15 30
WPI 10 60 60 60 60 60 60 60
Vegetable oil 6 36 36 36 36 36 36 36
Sugar 2 12 12 12 12 12 12 12
Salt 2 12 12 12 12 12 12 12
Dry yeast 2 12 12 12 12 12 12 12
Xanthan gum 0.3 1.8 1.8 1.8 1.8 1.8 1.8 1.8
HPMC 0.3 1.8 1.8 1.8 1.8 1.8 1.8 1.8
Water 90 540 540 540 540 540 540 540
Dough yield 212.6

Chapter 6
137
The volume of the loaves was measured with VolScan Profiler (Stable Micro
Systems, Surrey, UK) and the bread density calculated by dividing the loaf weight by
the loaf volume. The crumb hardness was measured using a TAXT2i texture analyser
(Stable Micro Systems, Surrey, UK) by compressing a 25 mm slice to 50% of its
original height with a 20 mm aluminium probe. Hardness was defined as the
maximum force during compression. Crumb grain was evaluated by image analysis
using a C-cell Imaging System and software (Calibre Control International Ltd.,
UK). The parameters used were cell diameter, wall thickness and number of
cells/cm2 calculated from the number of cells and slice area.
6.2.6 Scanning electron microscopy (SEM) and confocal laser scanning
microscopy (CLSM)
SEM samples were prepared by placing a small drop of batter on stubs (Agar
Scientific, plain stubs 10mm x 10mm) and immersing the stub in liquid nitrogen after
leavening (30 min at 30 °C) or baking at 190 °C. The frozen samples were fractured
and lyophilised immediately. Dry samples were mounted on SEM stubs and sputter
coated with a 5 μm layer of 80:20 gold-palladium and examined with a JEOL
Scanning Electron Microscope (JSM-5510, Jeol Ltd., Tokyo, Japan) at 5 kV and
working distance of 20 mm. For CLSM, batters were prepared with a Glutomatic a
1:3 mixture of 0.1% Rhodamin B and 50% Calcofluor white (Sigma-Aldrich) as
dough liquid, incubated (30 min; 30 °C) and examined with a FV300 confocal laser-
scanning system mounted on an Olympus IX80 inverted microscope with a 20x dry
objective (Olympus, Germany), using ex = 405 and 543 nm. Bread pieces were
stained for 5 min in the Rhodamin B and Calcofluor mixture described above,

Chapter 6
138
followed by 10 s in 0.3% FITC (Sigma-Aldrich) in acetone, and rinsed with H2O.
The samples were examined using ex = 405, 488 and 543 nm.
6.2.7 Statistical analysis
All analyses were performed at least in triplicates and means were compared
using one way analysis of variance with Tukey post-hoc test at a significance level of
p < 0.05. All statistical analyses were performed using Statistica 7.1 (Statsoft, USA).
Model fitting for rheological data was performed using Origin 7.5 (Originlab
Corporation, Northampton, USA).
6.3 Results and discussion
6.3.1 Malt enzyme activities
The enzyme activities of the malts are given in Table 6.2. α- and β-amylase
activities of oat increased from 0.3 to 48 and 0.5 to 2.3 U/g during malting,
respectively. In quinoa malt, the amylolytic activities remained nearly unchanged
before and after germination (< 1 U/g). This trend was reflected in the effect of
added malts on the RVA peak viscosities: a 0.5% oat malt addition led to a viscosity
loss of 18.5% and 56% with 2% oat malt (Table 6.3). Quinoa malt decreased the
peak viscosity only little: 2.5% and 5% quinoa malt additions decreased the
viscosities by 4.7% and 5.2%, respectively. A starch paste viscosity (Amylograph)
loss of 18% as a result of adding 5% 12 h germinated quinoa in wheat flour has been
reported previously (Atwell et al., 1988). The low amylolytic activities observed in
this study may be caused by varietal differences or poor germination performance
due to post-harvest processing.

Chapter 6
139
Table 6.2. Enzyme activities of oat and quinoa before and after malting (U/g).
Parameter α-amylase β-amylase Lipase Protease
Oat 0.29 ± 0.07 b 0.5 ± 0.05 b 27.7 ± 4.8 b 2.13 ± 1.0 c
Oat malt 47.7 ± 2.0 a 2.3 ± 0.23 a 31.3 ± 3.3 a 5.86 ± 0.6 b
Quinoa 0.09 ± 0.05 b 0.5 ± 0.16 b N/A 9.6 ± 1.1 a
Quinoa malt 0.08 ± 0.01 b 0.7 ± 0.28 b 1.3 ± 0.1 c 6.9 ± 1.2 b
Lipase activity of unmalted oat was high, and malting only slightly increased
it (Table 6.2). No lipase activity was detected in unmalted quinoa, but a low level of
activity (1.3 U/g) appeared as a result of malting. The protease activity of oat nearly
tripled to 5.68 U/g during malting, but decreased from 9.6 to 6.9 U/g in quinoa.
Compared to barley and wheat malts, both malts produced in this study were high in
proteolytic activities (Mäkinen and Arendt, 2012).
6.3.2 Malt protease induced changes in ingredients
The electropherogramms of the WPI samples revealed two peaks at 15 kDa
and 25 kDa, but malt proteases had no visible effect on either of the peaks (not
shown). The electropherogramms of rice flour protein (Figure 6.1) show major
peaks at molecular weights 10-15 kDa (a prolamin), at 21 kDa and a triple peak at
36-39 kDa (corresponding to oryzenin subunits) and two peaks at 55 and 59 kDa
(Moroni et al., 2011). After 24 h, all peaks except the last one (59 kDa) showed a
decrease in samples digested with both oat (Figure 6.1a) and quinoa malts (Figure
6.1b). No differences between the oat malt and quinoa malt digested samples were
observable.

Chapter 6
140
Table 6.3. Properties of batters with oat (O) and quinoa (Q) malts.
RVA Rheology
Parameter Peak viscosity
(RVU)
Viscosity loss (%) a
Viscosity (Pas) b Af
c z
c
Control 363 ± 2.2 a 0.0 33.5 ± 2.6 a 812 ± 98 a 6.36 ± 0.2 a
O 0.5% 296 ± 2.8 c 18.5 33.2 ± 2.5 a 765 ± 125 ab 6.08 ± 0.2 a
O 0.75% 256 ± 3.1 d 29.5 33.1 ± 2.2 a 746 ± 17 ab 6.32 ± 0.0 a
O 1% 225 ± 3.2 e 37.9 30.5 ± 5.0 ab 602 ± 62 bc 6.14 ± 0.2 a
O 2% 159 ± 8.3 f 56.2 25.4 ± 1.5 b 503 ± 23 c 6.15 ± 0.5 a
Q 1% 356 ± 3.4 ab 1.8 33.6 ± 4.0 a 821 ± 60 a 6.89 ± 0.5 a
Q 2.5% 346 ± 12.4 b 4.7 31.0 ± 2.6 a 871 ± 59 a 6.80 ± 0.4 a
Q 5% 344 ± 0.9 b 5.2 29.8 ± 3.4 ab 824 ± 78 a 6.73 ± 0.4 a a Peak viscositysample / Peak viscositycontrol * 100
b Apparent viscosity at γ = 5 s
-1
c r
2 was > 0.95 for all samples

Chapter 6
141
Figure 6.1. Electropherogramms of rice protein digested with oat malt (a. black);
quinoa malt (b. black) and without malt (a-b. grey) for 24 h. Data from three runs
averaged.
6.3.3 Batter rheology
Only 2% oat malt decreased batter viscosities significantly (Table 6.2). The
results from the small strain oscillation measurements were interpreted by fitting the
data in a weak gel model, yielding parameters AF and z. The z value is an interaction
factor indicating the amount of interactions in the food network, while AF can be
interpreted as the strength of the interactions (Gabriele et al., 2001). As a result of
oat malt addition, the AF values decreased, while z values remained nearly
unchanged. This suggests that the amount of interactions remained the same while
only their strength was weakened as a result of oat malt enzyme action on the batter
components, as opposed to the effect of sourdough fermentation that decreases both
factors (Moroni et al., 2011). The viscosities of 0.3% xanthan gum and HPMC
solutions were 1.4 and 0.01 Pas at 5 s-1
, respectively, and not influenced by
incubation with malt enzyme extracts (not shown).
As starch is still in its granular state at the proofing temperature and not prone
to amylolysis, the main contributors to the rheological properties of the batters were

Chapter 6
142
xanthan gum and proteins (endogenous and ingredient derived). As oat malt had no
influence on the viscosity of a xanthan gum solution, it would appear that the
viscosity decreasing effect would be due to proteolysis, as reported in previous
studies (Renzetti and Arendt, 2009a, 2009b). However, quinoa malt had a proteolytic
activity comparable to oat malt and their effects on the electrophoretic pattern of
protein containing ingredients are identical. The impact of proteolysis on gluten free
batter and bread properties depends strongly on the matrix (Renzetti and Arendt,
2009b). A possible explanation for the apparent lack of significance of the
proteolytic activities may be the dominant effect of two ingredients with strong
foaming properties, HPMC and WPI.
6.3.4 Bread properties
Loaves with varying levels of oat (0.5; 0.75; 1 and 2%) and quinoa (1%;
2.5% and 5%) malts were baked in addition to a control bread without malt. The
addition of oat malt decreased the bread densities (Table 6.4), translating to higher
loaf volumes, but a 2% addition led to a formation of large holes in the centre of the
crumb (Figure 6.2). There were no significant differences in batter densities between
the control and batters with oat malt. Quinoa malt addition had no impact on bread or
batter densities even at an addition level of 5%. Image analysis showed that oat malt
addition gave a more open crumb with fewer and larger cells with thicker walls. The
no. cells/cm2 decreased from 80.8 to 63.9 in the bread baked with 0.75% oat malt,
still resulting in an even crumb. The cause for the lower values in the breads with 1
and 2% oat malt is the forming of large holes due to excessive cell coalescence in the
centre of the loaf. Quinoa malt had no significant effect on the crumb grain.

Chapter 6
143
Batter densities showed no differences but the densities of baked breads
decreased with increasing oat malt level. It would thus appear that the changes
leading to a higher loaf volume and more open crumb grain occurred during baking.
RVA results indicated a drastic drop in peak viscosity as a result of oat malt α-
amylase action, which has a major impact on the stability of the gas cells. The lack of
impact of quinoa malt on any bread properties is probably due to a very low α-
amylase activity. This also suggests that proteolytic activity had little role in the
properties of the formulation used in this study, as both malts contained high
protease activities.
Malt additions had no influence on crumb hardness (not shown). A crumb
softening effect in rice bread using a maltogenic α-amylase has been reported before
(Gujral et al., 2003). Possibly the early inactivation of malt α-amylases (75-80 °C)
makes them inefficient as crumb softening enzymes. Lipases alter the polarity of
lipids that may contribute to the stability of the gas cell walls (Primo-Martín et al.,
2006).
Figure 6.2. Photos of bread slices with added oat (1
st row) and quinoa (2
nd row)

Chapter 6
144
Table 6.4. Bread and batter densities and crumb properties with oat (O) and quinoa (Q) malts.
Parameter Batter density (g/ml) Bread density (g/ml) No. cells/cm2 Cell diameter (mm) Wall thickness (mm)
Control 0.69 ± 0.03 a 0.59 ± 0.02 a 80.8 ± 7.5 a 1.55 ± 0.21 a 0.44 ± 0.01 a
O 0.5% 0.66 ± 0.04 a 0.58 ± 0.04 ab 71.4 ± 8.6 b 1.89 ± 0.35 b 0.48 ± 0.03 b
O 0.75% 0.67 ± 0.03 a 0.54 ± 0.03 bc 63.9 ± 5.8 cd 2.27 ± 0.26 c 0.51 ± 0.01 c
O 1% 0.69 ± 0.04 a 0.53 ± 0.02 c 64.7 ± 3.9 c 2.28 ± 0.18 c 0.51 ± 0.01 c
O 2% 0.67 ± 0.02 a 0.50 ± 0.01 d 56.0 ± 4.1 d 2.63 ± 0.25 d 0.50 ± 0.01 d
Q 1% 0.70 ± 0.03 a 0.60 ± 0.02 a 79.0 ± 6.4 ab 1.45 ± 0.13 a 0.43 ± 0.01 a
Q 2.5% 0.70 ± 0.02 a 0.58 ± 0.04 a 79.2 ± 9.5 ab 1.55 ± 0.31 a 0.44 ± 0.02 a
Q 5% 0.69 ± 0.02 a 0.58 ± 0.04 a 78.8 ± 8.9 ab 1.57 ± 0.26 a 0.45 ± 0.02 ab

Chapter 6
145
Monoglycerides have been reported to increase the volume and increase the cell size
in the crumb when added in the same formulation used in this study (Nunes et al.,
2008). Lipases may thus influence the bread properties, but their role was not
confirmed in this study.
6.3.5 Microscopy
CLSM micrographs of bread crumbs (Figure 6.3d-f) show a dominating
matrix of gelatinised starch visualised with FITC, surrounded by discontinuous
networks of protein and hydrocolloids. The protein matrix consists of larger
aggregates in the control bread compared to the ones baked with malts. CLSM
micrographs of the batters and SEM micrographs of batters and breads reveal no
visible differences upon malt addition (Figure 6.3a-c; g-l).
6.3.6 Conclusion
Oat malt produced from pure oats may be used to improve the volume and
crumb grain of gluten free bread at levels <1%, but overdosing may deteriorate the
crumb. Quinoa malt had no effect on the baking quality and germinating quinoa for
bakery products may not be feasible, unless improvements in the palatability and
nutritional properties are desired. The key parameter to altered technological
properties was α-amylase activity. Malt induced proteolysis did not influence the
properties of a gluten free formulation at least in the presence of other ingredients
with strong foaming properties such as WPI and HPMC.

Chapter 6
146
Figure 6.3. CLSM micrographs of of batters after proofing (a-c) and bread crumbs
(d-f) and SEM micrographs of batters after proofing (g-i) and bread crumbs (j-l).
Letters indicating protein (P), starch (S) and hydrocolloids (H); Bars 200 μm.

Chapter 6
147
Acknowledgments
The authors wish to thank Eva Bernardis for technical assistance. This study
was funded by the Food Institutional Research Measure (FIRM) administered by the
Department of Agriculture, Fisheries and Food (Ireland).
References
Atwell, W.A., Hyldon, R.G., Godfrey, P.D., 1988. Germinated quinoa flour to reduce
the viscosity of starchy foods. Cereal Chem. 65, 508–509.
Bergamo, P., Maurano, F., Mazzarella, G., Iaquinto, G., Vocca, I., Rivelli, A.R., De
Falco, E., Gianfrani, C., Rossi, M., 2011. Immunological evaluation of the
alcohol-soluble protein fraction from gluten-free grains in relation to celiac
disease. Mol. Nutr. Food Res. 55, 1266–70.
Butzner, J.D., 2011. Pure oats and the gluten-free diet: are they safe? JPEN. J.
Parenter. Enteral Nutr. 35, 447–8.
Catassi, C., Fasano, A., 2008. Celiac disease. Curr. Opin. Gastroenterol. 24, 687–
691.
FAO, 2011. Quinoa: An ancient crop to contribute to world food security. FAO
Regional Office for Latin America and the Caribbean, Santiago, Chile.
Gabriele, D., de Cindio, B., D’Antona, P., 2001. A weak gel model for foods. Rheol.
Acta 40, 120–127.
Gujral, H.S., Haros, M., Rosell, C.M., 2003. Starch hydrolyzing enzymes for
retarding the staling of rice bread. Cereal Chem. 80, 750–754.
Hager, A.-S., Axel, C., Arendt, E.K., 2011. Status of carbohydrates and dietary fiber
in gluten-free diets. Cereal Foods World 56, 109–114.
Hugo, L.F., Rooney, L.W., Taylor, J.R.N., 2000. Malted sorghum as a functional
ingredient in composite bread. Cereal Chem. 77, 428–432.
Jacobsen, S.E., Mujica, A., Ortiz, R., 2003. The global potential for quinoa and other
Andean crops. Food Rev. Int. 19, 139–148.
Kaukovirta-Norja, A., Wilhelmson, A., Poutanen, K., 2004. Germination: a means to
improve the functionality of oat. Agric. Food Sci. 13, 100-112.
Kemppainen, T., Janatuinen, E., Holm, K., Kosma, V.-M., Heikkinen, M., Mäki, M.,
Laurila, K., Uusitupa, M., Julkunen, R., 2007. No observed local immunological

Chapter 6
148
response at cell level after five years of oats in adult coeliac disease. Scand. J.
Gastroenterol. 42, 54–9.
Kim, D.-K., Jeong, S.C., Gorinstein, S., Chon, S.-U., 2012. Total polyphenols,
antioxidant and antiproliferative activities of different extracts in mungbean
seeds and sprouts. Plant Foods Hum. Nutr. 67, 71–5.
Kwon, D.Y., Rhee, J.S., 1986. A simple and rapid colorimetric method for
determination of free fatty acids for lipase assay. J. Am. Oil Chem. Soc. 63, 89–
92.
Lásztity, R., 1998. Oat grain – a wonderful reservoir of natural nutrients and
biologically active substances. Food Rev. Int. 14, 99–119.
Lee, A.R., Ng, D.L., Dave, E., Ciaccio, E.J., Green, P.H.R., 2009. The effect of
substituting alternative grains in the diet on the nutritional profile of the gluten-
free diet. J. Hum. Nutr. Diet. 22, 359–63.
Mäkinen, O.E., Arendt, E.K., 2012. Oat malt as a baking ingredient – A comparative
study of the impact of oat, barley and wheat malts on bread and dough
properties. J. Cereal Sci. 56, 747–753.
Matlashewski, G., Urquhart, A., Sahasrabudhe, M., Altosaar, I., 1982. Lipase activity
in oat flour suspensions and soluble extracts. Cereal Chem. 59, 418–422
Moroni, A. V., Dal Bello, F., Zannini, E., Arendt, E.K., 2011. Impact of sourdough
on buckwheat flour, batter and bread: Biochemical, rheological and textural
insights. J. Cereal Sci. 54, 195–202.
Nunes, M.H.B., Moore, M.M., Ryan, L.A.M., Arendt, E.K., 2008. Impact of
emulsifiers on the quality and rheological properties of gluten-free breads and
batters. Eur. Food Res. Technol. 228, 633–642.
Park, S.H., Morita, N., 2005. Dough and breadmaking properties of wheat flour
substituted by 10% with germinated quinoa flour. Food Sci. Technol. Int. 11,
471–476.
Primo-Martín, C., Hamer, R.J., Jongh, H.H.J., 2006. Surface layer properties of
dough liquor components: Are they key parameters in gas retention in bread
dough? Food Biophys. 1, 83–93.
Renzetti, S., Arendt, E.K., 2009a. Effect of protease treatment on the baking quality
of brown rice bread: From textural and rheological properties to biochemistry
and microstructure. J. Cereal Sci. 50, 22–28.
Renzetti, S., Arendt, E.K., 2009b. Effects of oxidase and protease treatments on the
breadmaking functionality of a range of gluten-free flours. Eur. Food Res.
Technol. 229, 307–317.

Chapter 6
149
Repo-Carrasco, R., Espinoza, C., Jacobsen, S.-E., 2003. Nutritional value and use of
the Andean crops quinoa (Chenopodium quinoa) and Kañiwa (Chenopodium
pallidicaule). Food Rev. Int. 19, 179–189.
Ruales, J., Nair, B.M., 1992. Nutritional quality of the protein in quinoa
(Chenopodium quinoa, Willd) seeds. Plant Foods Hum. Nutr. 42, 1–11.
Valencia, S., Svanberg, U., Sandberg, A.-S., Ruales, J., 1999. Processing of quinoa
(Chenopodium quinoa , Willd): effects on in vitro iron availability and phytate
hydrolysis. Int. J. Food Sci. Nutr. 50, 203–211.
Watanabe, M., Maeda, T., Tsukahara, K., Kayahara, H., Morita, N., 2004.
Application of pregerminated brown rice for breadmaking. Cereal Chem. 81,
450–455.
Wood, P.J., 2010. Review: Oat and Rye β-Glucan: Properties and Function. Cereal
Chem. 87, 315–330.

Chapter 7
150
Chapter 7
Physicochemical and acid gelation properties of commercial
UHT-treated plant-based milk substitutes and lactose free
bovine milk
Outi E. Mäkinen, Therese Uniacke-Lowe, James A. O’Mahony, Elke K. Arendt
Published in Food Chemistry,168, 630–638.

Chapter 7
151
Abstract
Physicochemical and acid gelation properties of commercial soy, oat, quinoa,
rice and lactose-free bovine milks were studied. The separation profiles were
determined using a LUMiSizer dispersion analyzer. Soy, rice and quinoa milks
formed both cream and sediment layers, while oat milk sedimented but did not
cream. Bovine milk was very stable to separation at 1000 rpm (30 min) followed by
3000 rpm (60 min), while all plant milks separated at varying rates; rice and oat
milks being the most unstable products. Particle sizes in plant-based milk substitutes,
expressed as volume mean diameters (d4.3), ranged from 0.55 μm (soy) to 2.08 μm
(quinoa) while the average size in bovine milk was 0.52 μm. Particles of plant-based
milk substitutes were significantly more polydisperse compared to those of bovine
milk. Upon acidification with glucono-δ-lactone (GDL), bovine, soy and quinoa
milks formed structured gels with maximum storage moduli of 262, 187 and 105 Pa,
respectively. In addition to soy products currently on the market, quinoa may have
potential in dairy-type food applications.

Chapter 7
152
7.1 Introduction
Plant-based milk substitutes are water soluble extracts of legumes, oil seeds,
cereals or pseudocereals that resemble bovine milk in appearance. These products are
used to replace bovine milk in the diet by an increasing number of consumers for
medical reasons (e.g., lactose intolerance, cow’s milk allergy) or as a lifestyle choice
(Mäkinen, Wanhalinna, Zannini, & Arendt, 2013). Soy products dominate the
market, but products based on other plant materials, e.g., coconut endosperm and oat,
almond, rice, hemp and quinoa seeds are also available (Mäkinen et al., 2013). Plant-
based milk substitutes are generally manufactured by the extraction of plant material
in water, removal of solids, and product formulation, followed by homogenization
and heat-treatment. The resulting products are suspensions of extracted and
disintegrated plant material and other ingredients such as oils and hydrocolloids, if
used (Durand, Franks, & Hosken, 2003; Mäkinen et al., 2013). Such liquid systems
may separate during storage either by sedimentation, creaming, or syneresis, which is
detrimental to the product quality. The separating particles can be denatured and
aggregated protein particles, oil droplets or cellular fragments (van Vliet & Walstra,
1989). Plant storage proteins are often oligomeric: they are composed of two or more
subunits that in turn consist of a number of polypeptide chains (Bewley and Black,
1994). The native storage proteins of seeds may be considered as a complex of
individual proteins held together by a combination of intermolecular disulphide
bonds, hydrogen bonding, ionic bonding and hydrophobic interactions rather than a
single protein (Bewley & Black, 1994). Generally, proteins having a tertiary
structure are more susceptible to heat denaturation and subsequent aggregation upon
intermolecular disulphide and hydrophobic bonding, leading to decreased solubility
(Morr, 1979).

Chapter 7
153
Bovine milk contains 3.0-3.7% protein of which ca. 80% is casein and the
remaining 20% is whey protein. The casein fraction exists in the form of micelles
that play a crucial role in the physicochemical stability of milk. The hydrophilic C-
terminal region of κ-casein or ‘brush’ protrudes from the surface of the micelles and
sterically stabilizes them against aggregation (de Kruif & Zhulina, 1996).
Coagulation of casein micelles can occur only following collapse of the brush, which
occurs on acidification of milk or during the rennet-induced coagulation of milk (de
Kruif & Zhulina, 1996). Caseins have very little secondary or tertiary structure and
contain no disulphide bridges, making them relatively stable to thermal processing
which can cause denaturation and aggregation of plant proteins (Morr, 1979; Singh,
2004). Whey proteins on the other hand, are sensitive to unfolding at temperatures
above 60oC, which renders them susceptible to protein-protein interactions on
thermal processing. Heat-induced denaturation of -lactoglobulin results in its
disulfide-mediated binding with -casein, consequently affecting the properties of
the casein micelles, e.g., this may promote the aggregation of micelles at low pH
(Singh, 2004).
Some proteins are capable of gelling when heat-induced particle aggregates
form a continuous, three-dimensional network structure upon lowering of pH or
addition of salt. Glucono-δ-lactone (GDL) can be used to replicate acid production
on microbial fermentation, as it converts to gluconic acid in water and slowly
releases H+ over time gradually decreasing the pH of milk (Lucey, 2002). This
approach has been widely used to study the gelation of bovine milk proteins (Lucey,
2002; van Marle & Zoon, 1995) and soy proteins by several authors (Kuipers, Alting,
& Gruppen, 2007; Grygorczyk & Corredig, 2013).

Chapter 7
154
The physicochemical and acid gelation properties of commercial ultra-high
temperature-treated (UHT) plant-based milk substitutes, as well as their hedonic
response among consumers was studied and compared to lactose free UHT-treated
bovine milk. Commercial products were chosen to represent the products as the
consumer would purchase them.
7.2 Materials and methods
7.2.1 Samples
The samples were commercial UHT-treated lactose-free bovine (full fat), soy,
oat, quinoa and rice milks purchased from a local health store. The oat milk
contained added calcium in the form of calcium carbonate and calcium phosphate.
The samples were stored at 4°C and used within 3-5 days of opening the packaging,
as preliminary work showed that the viscosity of soy and quinoa milks increased
gradually during storage: from 7.15 to 19.5 and 116 mPas after 11 and 14 d storage,
respectively, for soy milk, and from 23.8 to 236 mPas after 21 d for quinoa milk.
7.2.2. Composition and hedonic response
The total nitrogen content of the samples was analysed using the Kjeldahl
method (MEBAK 1.5.2.1). Nitrogen to protein conversion factor of 6.38 was used
for bovine milk, 5.75 for rice milk and 5.95 for all other samples, based on the
different proportions of amino acid residues to amino acid nitrogen, as well as the
amount of non-protein nitrogen, that vary between plant species (Fujihara, Sasaki,
Aoyagi, & Sugahara, 2008). The ash was analysed by incineration in a muffle
furnace: 10 g of sample was pre-heated in crucibles for 1 h at 100°C and ashed for 4
h at 600°C. The dishes were cooled to room temperature and weighed. Fat content

Chapter 7
155
was determined using the Gerber method. For sugar analysis, samples were first
clarified using Carrez reagents. Samples (2.5 ml) were diluted with ca. 15 ml warm
water in 25 ml volumetric flasks and Carrez 1 and 2 reagents (2.5 ml each) were
added sequentially. Extracts were diluted to 25 ml, centrifuged (5000 g x 5 min) and
filtered (0.45 μm). Sugar profiles were analysed using an Infinity 1260 HPLC
system equipped with an refractive index detector (Agilent Technologies, Palo Alto,
CA) and a 300 x 7.8 mm Rezex ROA H+ column (Phenomenex, Torrance, CA,
USA). Water was used as the mobile phase at a flow rate of 0.6 ml/min at 25°C.
Sucrose, maltose, glucose and fructose were quantified using standard curves
(Sigma-Aldrich, St Louis, MO). Maltose and sucrose peaks overlap when analysed
with Rezex H+ column, but only the sucrose peak splits into two peaks corresponding
to glucose and fructose when analysed at 65°C. To distinguish between sucrose and
maltose, samples were analysed at 25 and 65°C, and only if the peak was still present
at 65°C, was it quantified as maltose.
A consumer panel consisting of students and staff who consume bovine or
plant milks at least monthly was recruited from University College Cork, Ireland
(n=62, 76% female, mean age 23.3 years, S.D.=4.4 years). The refrigerated products
(40 ml) were served in sensory laboratory booths in a randomized order in covered
transparent plastic cups with three-digit codes, and rated using a 9-point hedonic
scale (appearance, smell, mouthfeel, flavour, overall; like extremely - dislike
extremely). After testing, the panellists filled out a questionnaire on demographic
information, beverage consumption habits and motivators for plant milk
consumption, as well as the food neophobia scale (FNS) questionnaire (Pliner &
Hobden, 1992).

Chapter 7
156
7.2.3. Physicochemical properties
Viscosity of the plant milk substitutes was measured using a controlled stress
rheometer (MCR301, Anton Paar GmbH, Austria) equipped with a 75 mm cone and
plate geometry at a shear rate (γ) range of 0.5-100 s-1
. Experimental data were fitted
to the Ostwald de Waele equation (Eq. 1), yielding the consistency coefficient (K)
and the power law index (n). The measurements were carried out at 10°C. The
apparent viscosity measured at 10 s-1
is referred to as “viscosity” throughout this
paper.
𝜂 = 𝐾(𝛾)𝑛−1
Separation rates of the plant milk substitutes were analyzed with an analytical
centrifuge (LUMiSizer®; LUM GmbH, Berlin, Germany). Samples were subjected to
centrifugal force, while near-infrared light illuminated the entire sample cell to
measure the intensity of transmitted light as a function of time and position over the
entire sample length. The separation rate was expressed as the slope of the integrated
transmission–time plots determined at 1000 rpm for 30 min and followed by 3000
rpm for 60 min s at 24°C.
The particle size distribution of the milk substitutes was determined using a
static laser light diffraction unit equipped with a 300 RF lens (reverse Fourier; range
0.05 to 880 μm) and a He-Ne laser light source (633 nm) using a polydisperse optical
analysis model (Mastersizer, Malvern Instruments Ltd, Worcestershire, UK)
equipped with a small volume sample presentation unit. Samples were applied to the
instrument using the small volume sample presentation unit (MSXL 5), with distilled
water as dispersion medium. For bovine milk, a refractive index of 1.342 was used
(Singh, McCarthy, & Lucey, 1997). The refractive indices of plant milks were
[Eq. 1] •

Chapter 7
157
measured using a hand-held refractometer (Atago R5000, Atago, Tokyo, Japan). The
values ranged from 1.338 to 1.340, but the measurements were not consistent due to
the opaque nature of the samples. An average value of 1.339 from these
measurements was used for all plant milks. The refractive index of the dispersant
(water) was 1.333. The target for laser obscuration was ∼15%. The following values
were reported: volume mean diameter (d4.3) surface to volume weighed mean
diameter (d3.2), the arithmetic mean diameters below which 10, 50 and 90% of
particles have diameters lower than (D(v,0.1), D(v,0.5), D(v,0.9)), and the span as a
measure of the width of the distributions (Eq. 2).
𝑆𝑝𝑎𝑛 =𝐷(𝑣, 0.9) − 𝐷(𝑣, 0.1)
𝐷(𝑣, 0.5)
The solubility of proteins in the beverages as affected by pH was determined
by adjusting the pH from 3.0 to 8.0 at 0.5 unit intervals using 0.1-1 M HCl or NaOH.
The samples were incubated at 4°C overnight. The pH was re-adjusted before
measurements in case it had drifted. Samples were centrifuged at 5000 g x 30 min.
The protein contents of the supernatants were analyzed using the Bradford assay, and
by Kjeldahl in untreated products. The results were expressed as % of the protein
content of the supernatant of the untreated product (Eq. 3).
𝑆𝑜𝑙𝑢𝑏𝑖𝑙𝑖𝑡𝑦 =Protein content in supernatant
Protein content in product ∗ 100
7.2.4 Rheological changes during acidification
For the acidification trials, concentrations of GDL sufficient to reduce the pH
of the samples below 5 (plant milks) or 4.5 (bovine milk) within 120 min were used,
[Eq. 2]
[Eq. 3]
Chapter 7
158
as these pH values were within the range of minimum protein solubility for each
sample. These corresponded to 1.2, 0.6, 2.5, 0.2 and 1% GDL for soy, quinoa,
bovine, rice and oat milks, respectively.
Rheological changes during the acidification of milks were determined by
small deformation oscillatory measurements using an AR-G2 controlled stress
rheometer (Waters TA Instruments, Leatherhead, Surrey, UK) equipped with a
Peltier concentric cylinder (aluminium conical rotor, 42.01 mm (h) x 28.02 mm (d))
at a constant temperature of 30°C. Each milk (25 ml) was pre-warmed at 30°C for 15
min, GDL was added to each sample as described above and the sample was
immediately placed in the pre-heated cup. Simultaneously, the pH of sub-samples
were monitored continuously under quiescent conditions at 30°C. The storage (G′)
and loss (G″) moduli and loss tangent (tan δ=G″/G′) were recorded at an angular
frequency (ω) of 0.6283 rad s-1
and a shear strain of 0.01 (within the linear
viscoelastic range) for 150 min. Each sample was analyzed in at least triplicate.
To obtain further information about the properties of the final bovine, soy and
quinoa milk gels, a frequency sweep in the frequency range 0.1-100 rad s-1
and a
fixed strain of 0.1 % was performed after 150 min acidification. G′, G″ and complex
dynamic viscosity η* [Eq. 4] were recorded and the mechanical spectra of the gels
(frequency-dependence of G′, G′′ and η*) were plotted.
(G′2 + G″
2)½
To compare the viscoelastic properties of acidified bovine, quinoa and soy
milk gels creep tests were carried out using the AR-G2 rheometer with concentric
cylinder geometry described above. Milk samples were prepared by heating 25 mL
[Eq. 4]

Chapter 7
159
of each sample to 30°C in a waterbath for 15 min. GDL was added as described
above and the sample stirred vigorously for 1 min before pouring into the preheated
concentric cylinder of the rheometer. Creep-recovery experiments were carried out
150 min after the addition of GDL by applying a shear stress (τ) for 5 min, with
measurement of the resulting strain (γ) followed by a 5 min recovery phase after
removal of the stress. The applied stresses used were increazed by 2-fold increments,
from 1.6 to 102.4 Pa. For all samples, creep-recovery curves are reported as
compliance, J, where, J = γ / τ.
The difference in the resistance of acidified bovine, quinoa and soy milk gels
to fracture and in their extent of deformation in response to lower stresses was
analyzed by plotting maximum strain values reached at the end of the initial 5 min
period against the applied stress.
7.2.5 Microscopy
Milk samples were prepared for confocal laser scanning microscopy by
adding 70 µl of 0.1% Rhodamine B (aq) in 5 ml sample. When analysing acidified
samples, GDL was added in the samples before staining, a drop of the mixture was
placed between cover slips and incubated at 30°C (RH = 85%) for an hour before
microscopic observation. All samples were examined with an FV300 confocal laser
scanning system mounted on an Olympus IX80 inverted microscope with a 40x dry
objective (Olympus, Germany), using exc = 543 nm and a 560-600 nm emission
filter. Unstained samples were also observed using only transmitted light.
For transmission electron microscopy (TEM) samples of bovine, soy and
quinoa milk before, and 150 min after acidification with GDL, were fixed with
electron microscopy (EM)-grade, aqueous gluteraldahyde in a ratio of 9:1, v/v,

Chapter 7
160
milk:gluteraldehyde to a final gluteraldehyde concentration of 25 g L-1
by the
addition of 100 L of 250 g L-1
gluteraldehyde to 900 L sample in an Eppendorf
tube. Ten L of each fixed sample was mixed with 10 L of 20 g L-1
phosphotungstic acid (PTA), pH 7.2, and held for 5 min. A Formvar-coated copper
grid (400 mesh; Agar Scientific, Stansted, UK) was immersed in the mixture for 5
min after which it was dabbed around the periphery with filter paper to remove
excess sample. The sample was allowed to air-dry at room temperature under a clean
up-turned Petri-dish and was imaged the following day.
7.2.6 Statistical analyses
Statistical analysis of data was carried out using Minitab release 16 (Minitab
Inc., State College, PA, USA). Initially the data for all parameters measured were
examined for normality using the Anderson-Darling normality test at a significance
level of 0.1, i.e., when calculated p values were found to be < 0.1, it was assumed
that the data were not normally distributed. The Kruskal-Wallis non-parametric
alternative to one-way analysis of variance was used to make inferences about the
equality of medians between the samples. If the p values from the Kruskal-Wallis
test was found to be greater than a pre-determined α-level (0.05), it was concluded
that none of the treatment effects (samples) were significant and population medians
were equal. Where p values were less than or equal to 0.05, a difference in
population medians was apparent and rank values were examined to ascertain which
samples were different. All analyses were carried out in triplicate. In the case of
rheological analyses, the data presented are the results from a single analysis for
clarity. The coefficient of variation was < 5% for data points.

Chapter 7
161
7.3 Results and discussion
7.3.1 Composition and hedonic response
The compositional data of the plant milk substitutes is given in Table 7.1. The
protein contents ranged from 0.07% of rice milk to 3.32% for bovine milk. Only the
protein content of soy milk was close to bovine milk at 2.95% protein. Bovine and
quinoa milks were high in fat at 3.50% and 2.40%, respectively, while rice and oat
milks contained <1% fat. Bovine and soy milks contained ca. 0.7% ash. Rice and
quinoa milks were lower in ash at 0.18% and 0.22%, respectively, but oat milk had
values closer to bovine milk at 0.48% ash, as it contained added calcium. The main
sugar was maltose in oat and rice milks, fructose in quinoa milk, and sucrose and
fructose in soy milk (Table 1). The sugars may originate from a starch hydrolysis
step during processing, or from additional ingredients, such as apple concentrate
(soy) and agave syrup (quinoa). Only lactose hydrolysis products glucose and
galactose were detected in bovine milk.
Plant milk substitutes are often used to replace bovine milk in an individual’s
diet. In addition to containing high quality protein, bovine milk is an important
source of calcium, iodine, vitamin B12 and riboflavin, and population groups with
low milk intakes often have a poor status for these nutrients (Millward & Garnett,
2010). The beverages studied varied greatly in protein contents, with only soy milk
being comparable to bovine milk in terms of protein content. Considerable deviations
from the nutritional composition of the product being substituted may be harmful;
cases of kwashiorkor, a protein-energy malnutrition typical for areas of famine, have
been reported in Western countries as a result of using rice milk as a weaning food
(Carvalho, Kenney, Carrington, & Hall, 2001).

Chapter 7
162
Table 7.1. Composition (%) and consumer hedonic ratings of bovine milk and plant-
based milk substitutes. Hedonic ratings were evaluated on a 9-point hedonic scale.
Bovine
Soy
Oat Quinoa Rice
Protein 3.32 ± 0.11 2.95 ± 0.07 0.78 ± 0.13 1.26 ± 0.03 0.07 ± 0.02
Fat 3.50 ± 0.05 1.72 ± 0.03 0.28 ± 0.03 2.40 ± 0.10 0.87 ± 0.12
Ash 0.67 ± 0.01 0.71 ± 0.02 0.48 ± 0.02 0.22 ± 0.01 0.13 ± 0.01
Sugars1
Mal - - 2.75 0.92 4.88
Suc - 0.91 - - -
Glu 2.06 0.45 - 0.22 0.11
Fru - 1.02 1.9 -
Gal 2.55 - - - -
Hedonic
Appearance 7.30 ± 1.35 4.84 ± 1.94 3.41 ± 1.66 5.49 ± 1.91 4.95 ± 1.87
Smell 5.20 ± 1.82 4.18 ± 1.92 4.30 ± 1.27 3.07 ± 2.15 4.30 ± 1.56
Mouthfeel 6.49 ± 1.79 5.54 ± 1.61 5.16 ± 1.57 4.62 ± 2.23 505 ± 1.91
Flavour 5.79 ± 2.44 4.79 ± 1.86 4.82 ± 1.91 3.07 ± 2.33 4.34 ± 2.06
Overall 5.9 ± 2.21 4.87 ± 1.78 4.74 ± 1.85 3.23 ± 2.32 4.52 ± 1.94 1 Standard deviations < 0.008 (%)
The values for compositional data were significantly different between samples
(Kruskal-Wallis test; p<0.05).
The hedonic ratings were the highest for bovine milk samples across all
attributes, while quinoa milk was the least liked (Table 7.1). Soy, oat and rice milks
received similar scores in all attributes except appearance which was very low for oat
milk, possibly due to yellowish colour. The overall liking ranged from 4.5 to 4.9
(“neither like or dislike”) for the aforementioned samples, which was slightly lower
than for bovine milk (5.79 “like slightly”). Quinoa milk scored very low (3, “dislike
moderately”) in the attributes smell, flavour and overall. When observing the results
from the Kruskal-Wallis test, rice, oat and soy had average rank values close to the
overall rank (smell, flavour and overall), indicating similarity, while bovine and
quinoa milks deviated from it. Bovine milk had rank values furthest from the overall
rank in all attributes, showing that it received very different ratings in all attributes

Chapter 7
163
compared to the plant based samples. Although bovine milk got the highest hedonic
ratings, the flavour attribute scored between “neither like or dislike” and “like
slightly”. The bovine milk product used in this study was lactose free, as it is likely
to be used by the same consumer segment as plant milk substitutes. The lower values
may be caused by the sweetness of lactose hydrolysis products glucose and
galactose, and the deterioration of the flavour as a result of UHT treatment. Quinoa
milk was generally disliked, possibly due to its strong nutty flavour/aroma atypical of
a milk-like product. The hedonic ratings did not correlate with demographic data or
the food neophobia score. 73% of panellists stated they would consume more plant
milk substitutes if the products had proven health benefits, 86% if the products tasted
better, 68% if they had allergies and 43% if the products were proven to be an
environmentally friendly option.
7.3.2. Physicochemical properties
The viscosities of the beverages studied were between 2.02 and 7.15 mPas for
all samples except quinoa milk which had a significantly higher viscosity of 23.8
mPas (Table 7.2). Bovine and soy milks showed slight pseudoplastic behaviour with
flow indices of 0.80 and 0.83, respectively, while quinoa milk showed considerable
pseudoplasticity with a flow index of 0.45. The solubility of proteins in all plant milk
substitutes decreased to their minimum between pH 5.0 and 6.0, while the minimum
solubility was reached at pH 4.5 in bovine milk (Figure 7.1). Bovine milk showed
nearly 100% protein solubility at pH 7.0 and above, but the maximum solubility was
lower in plant milks: the corresponding values were 78.6% in soy milk, 65% in
quinoa milk and as low as 11.8% rice milk. Oat milk protein was nearly insoluble.

Chapter 7
164
Figure 7.1. Protein solubility of bovine (green), soy (blue) and quinoa (purple), rice
(red), and oat milks (orange) as a function of pH. The arrows indicate the initial pH
of the product.
Numerical data describing the particle size distributions of the beverages are
presented in Table 7.2. The surface to volume average diameters (d3.2) ranged from
0.39 μm for soy milk to 0.49 μm for oat milk. Volume mean diameters (d4.3) showed
larger variation: bovine and soy milks had low values (0.52 and 0.55 μm), but oat
and quinoa milks had diameters of 1.51 μm and 2.08 μm, respectively. The d3.2
parameter is sensitive to smaller particles, whereas d4.3 is a better indicator of the
presence of larger particles or aggregates (Surh, Decker, & McClements, 2006). Span
values were used to indicate the width of the distributions. Bovine and soy milks had
low span values of 1.31 and 1.59 μm, respectively, whereas oat milk had a span
value of 4.99, indicating the presence of particles with broader size distribution. The
similarity of bovine and soy milks compared to the other samples is evident from the
Kruskal-Wallis test results: the ranks of these samples deviated the most from the
overall rank in all particle size parameters (p<0.05). Bovine milk contains casein
0
20
40
60
80
100
120
3 4 5 6 7 8
Pro
tein
so
lub
ility
%

Chapter 7
165
micelles and fat globules. The size of the fat globules is strongly influenced by
treatments: they are decreased from ca. 4 μm to 0.6 μm as a result of
homogenisation, and UHT-treatment decreases the diameter further to 0.3 μm
(Walstra et al. 2006). Casein micelles are much smaller, ranging from 0.04 to 0.3 μm,
but they can be aggregated in UHT-treated milk (Walstra et al. 1999; Donato &
Guyomarc’h, 2009).
The light microscopy images support the particle size data (Figure 7.2).
Bovine milk appeared to consist of small, uniformly sized particles when observed
using light microscopy (Figure 7.2 a). In TEM micrographs, these particles appeared
to be slightly clustered casein micelles around lighter fat globules (Figure 7.2 a
insert). Soy milk contained a similar population of small particles in addition to
larger fragments of varying diameters. Also, the smaller particles appeared to have
the tendency to cluster, which can be seen clearly in the TEM image (Figure 7.2 b;
TEM as insert). Soy milk particles have previously been shown to exist as
aggregated structures with a "chain-like" morphology, and some lipid globules
visible in the aggregates (Ringgeberg et al., 2012). The particles in oat milk existed
as large aggregates of varying sizes (Figure 7.2 c), supported by the large particle
sizes and wide distributions from the particle size measurements. Quinoa milk
contained a population of small, homogenous, tightly-packed particles, and whole
large cellular fragments were also found in the samples (Figure 7.2 d). Particles in
rice milk were heterogeneous in size, while no aggregates or larger fragments could
be observed (Figure 7.2 e).

Chapter 7
166
Figure 7.2. Light microscopy images of bovine (a), soy (b), oat (c), quinoa (d) and
rice (e) milks, and transmission electron micrographs of bovine (a), soy (b) and
quinoa (d) milks as inserts. Scale bars 50 μm (white) and 250 nm (black).
The rates of separation showed large variation between the products (Table
7.2). Bovine milk was very stable with a separation rate of 1.58 %/h. Soy and quinoa
milks also showed considerable stability with values <10 %/h, but oat and rice milks
separated rapidly. Soy, quinoa and rice milks formed both sediment and cream
layers, while oat milk sedimented leaving a very clear serum. In samples stored at
5°C, sedimentation in oat milk and creaming in the rice milk sample were clearly
observable after 24 h (Figure 7.2; marked with arrows).

Chapter 7
167
Table 7.2. Rheological and particle size properties of bovine milk and plant-based milk substitutes.
Apparent viscosity
(mPas) Flow index
Separation rate
(%/h) d3.2 (μm)
a
d4.3 (μm) b
Span (μm) pH
Storage
modulus G′
(Pa)
Loss tangent
tan δ
Bovine 3.57 ± 1.21 0.80 ± 0.07 1.58 ± 0.03 0.42 ± 0.01 0.52 ± 0.01 1.31 ± 0.00 6.83 262.0± 3.42 0.22 ± 0.00
Soy 7.15 ± 0.62 0.83 ± 0.05 9.95 ± 0.30 0.39 ± 0.01 0.55 ± 0.01 1.59 ± 0.01 6.80 186.5 ± 6.68 0.15 ± 0.01
Oat 6.09 ± 0.12 0.98 ± 0.02 49.6 ± 1.58 0.49 ± 0.02 1.51 ± 0.03 4.99 ± 0.28 7.14 < 1 2.64 ± 0.02
Quinoa 23.8 ± 4.72 0.45 ± 0.03 8.52 ± 0.37 0.46 ± 0.01 2.08 ± 0.01 2.14 ± 0.19 6.40 104.6 ± 0.59 0.15 ± 0.00
Rice 2.02 ± 0.11 0.97 ± 0.04 55.7 ± 0.15 0.47 ± 0.01 0.81 ± 0.04 2.74 ± 0.03 7.47 < 1 2.87 ± 0.01 a d3.2 Surface to volume weighed mean diameter (Sauter mean diameter)
b d4.3 Volume mean diameter
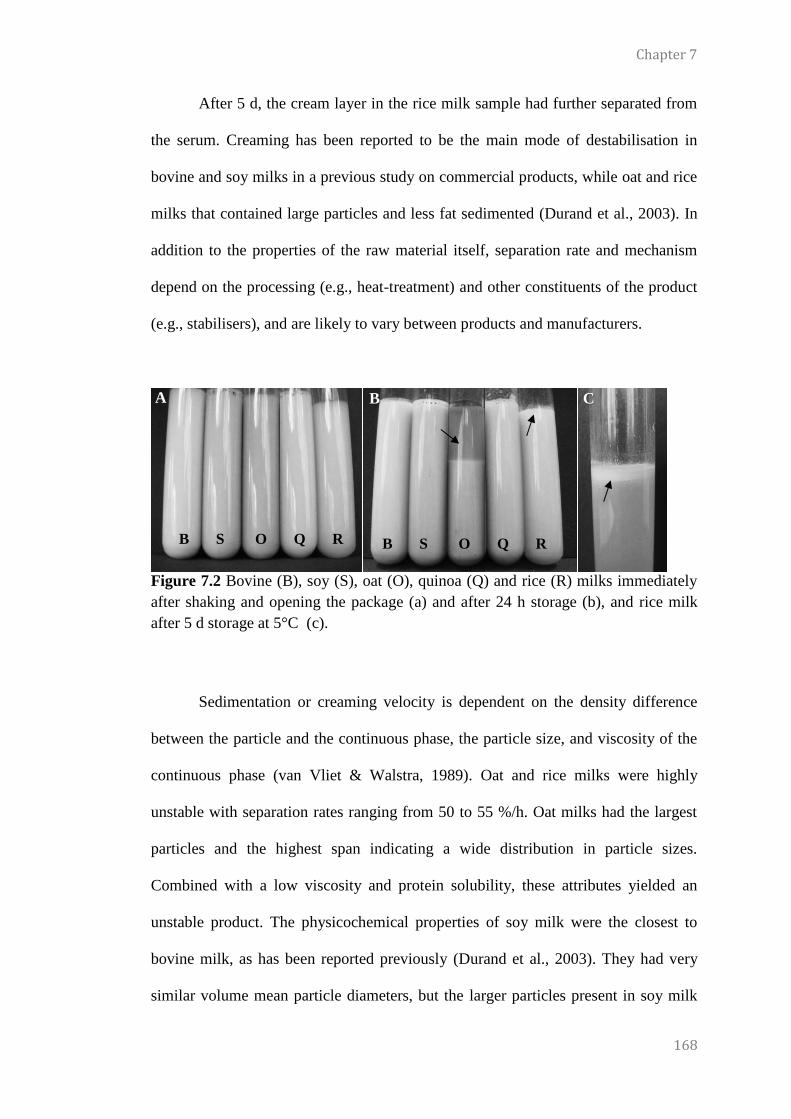
Chapter 7
168
After 5 d, the cream layer in the rice milk sample had further separated from
the serum. Creaming has been reported to be the main mode of destabilisation in
bovine and soy milks in a previous study on commercial products, while oat and rice
milks that contained large particles and less fat sedimented (Durand et al., 2003). In
addition to the properties of the raw material itself, separation rate and mechanism
depend on the processing (e.g., heat-treatment) and other constituents of the product
(e.g., stabilisers), and are likely to vary between products and manufacturers.
Figure 7.2 Bovine (B), soy (S), oat (O), quinoa (Q) and rice (R) milks immediately
after shaking and opening the package (a) and after 24 h storage (b), and rice milk
after 5 d storage at 5°C (c).
Sedimentation or creaming velocity is dependent on the density difference
between the particle and the continuous phase, the particle size, and viscosity of the
continuous phase (van Vliet & Walstra, 1989). Oat and rice milks were highly
unstable with separation rates ranging from 50 to 55 %/h. Oat milks had the largest
particles and the highest span indicating a wide distribution in particle sizes.
Combined with a low viscosity and protein solubility, these attributes yielded an
unstable product. The physicochemical properties of soy milk were the closest to
bovine milk, as has been reported previously (Durand et al., 2003). They had very
similar volume mean particle diameters, but the larger particles present in soy milk
B S O Q R
A B C
B S O Q R

Chapter 7
169
widened the particle size distribution slightly. Generally, the stability of plant milks
correlates with their particle sizes (Durand et al., 2003). In this study, quinoa milk
was an exception to this as it had the highest volume mean particle diameter caused
by the dominance of very large particles, but had a low separation rate. The viscosity
of quinoa milk was much higher than the other beverages, which retards the
sedimentation or creaming of the large particles (van Vliet & Walstra, 1989).
TEM images of bovine, soy and quinoa milks showed clustering of particles.
UHT-treatment of bovine milk has been reported to cause interactions between
denatured whey proteins and casein micelles, leading to an increase in particle size
and age gelation during longterm storage (3-18 months) (Datta and Deeth, 2001). It
has been reported that low temperature storage of UHT-treated bovine milk may
accelerate the age gelation process (Andrews, Brooker, & Hobbs, 1977). Increased
protein aggregation as a result of UHT induced protein denaturation also occurs in
soy milk (Cruz et al., 2007 The d3.2 values of bovine and soy milk were similar to
previously reported for UHT-treated commercial products (Durand et al., 2003) but
3-fold higher compared to soy milks prepared in a pilot plant (Malaki Nik, Tosh,
Poysa, Woodrow, & Corredig, 2008). Malaki Nik et al. (2008) reported a decrease in
particle sizes after heating, and further decrease after homogenisation. The authors
concluded that although heating decreases the solubility of 7S subunits, the larger
11S subunits are disrupted, leading to a narrower particle size distribution and
smaller particles overall. Heating to high temperatures may however alter the
behaviour of the proteins during storage. Quinoa milk showed similar changes, and
both light microscopy and TEM revealed the presence of a matrix of tightly packed
particles and aggregates. Some beverages are weak gels with continuous network
structures that stabilise the system from separation. An example of this includes a

Chapter 7
170
cocoa milk system which is a fluid with a weak network consisting of protein
aggregates and cocoa particles in the presence of κ-carrageenan (Boomgaard, Vliet,
& Hooydonk, 1987). Such networks stabilise the system if the yield stress is greater
than the sedimentation stress (van Vliet & Walstra, 1989).
7.3.3 Rheological changes during acidification
The influence of acidification by GDL on the storage modulus (G′) of
bovine, quinoa, soy, rice and oat milk is shown in Figure 7.4 a, and the time course
of pH decrease in Figure 7.4 b. Generally, the gel point observed during small
amplitude oscillatory rheology is regarded as the point where the storage modulus
(G′) and the loss modulus (G″) cross-over or when G′ increases to ~ 1 Pa. The G′ of
bovine milk increased sharply when the pH decreased to 5.4 at ~ 30 min after GDL
addition and a final G′ of ~ 261 Pa was recorded after 150 min. The G′ of soy and
quinoa milks started to increase at pH values below 6.2 and 6.4, respectively. The
final G′ values after 150 min acidification were 186 Pa for soy and 104 Pa for
quinoa. No increase in G′ was observed for either acidified rice or oat milk during
150 min after GDL addition, even though the pH decreased to 3.99 and 4.11,
respectively. Oat proteins are capable of heat gelation at high concentrations, but oat-
based milk-type suspensions do not form gel-like structures when acidified, and the
production of a yoghurt-type product requires the presence of thickeners
(Mårtensson, Öste, & Holst, 2000; Nieto-Nieto, Wang, Ozimek, & Chen, 2014). The
final G′ values recorded decreased with decreasing protein content, in the order
bovine > soy > quinoa.

Chapter 7
171
Figure 7.4. Effect of acidification with glucono--lactone (GDL) on the storage
modulus (G΄) (A), and pH (B) and loss tangent (tan (C) of bovine (solid black),
soy (dashed black), quinoa (grey), rice (dashed grey) and oat (dotted black) milks,
and the mechanical spectrum (D) of acidified bovine milk showing the frequency
dependence of G' (●), G'' (○) and η* (+).
Rheological data were supported by the microscopic observations which
showed a clear structural change from liquid to solid in acidified bovine and soy milk
samples (Figure 7.5). Quinoa milk showed aggregated structures before acidification
that became more structured and ‘gel-like’ as a result of the pH reduction. Oat milk
particles appeared to form larger aggregates, but no network structures could be
observed.
a. b.
c. d.

Chapter 7
172
Figure 7.5. Confocal laser scanning micrographs of bovine (a-b), soy (c-d), oat (e-f) and quinoa (g-h) milks before and after acidification. Scale
bars 50 μm (white) and 250 nm (black).
A
H G F E
D C B

Chapter 7
173
In acid-induced gels from bovine milk, casein is the dominant structural
component and it is heterogeneously arranged as three-dimensional aggregates of
strands and linkage sites (Roefs & Walstra, 1986). The principal factors governing
acid milk gel formation are the concentration of casein, pH, temperature and ionic
strength (Roefs & van Vliet, 1990). The final G′ value of 264 Pa for acidified UHT-
treated bovine milk was similar in this study to values of 300-450 Pa reported by
Lucey et al. (2000) for bovine milk acidified with GDL following heat treatment at >
80oC for 15 min. Gels made from non-heat-treated bovine milk have lower G′ values
(typically < 20 Pa), because the compact clusters of aggregated casein particles
formed by the extensive rearrangement of particles during gel formation do not
entirely cross-link as the gel network is formed (Lucey, 2002). In heated milk
samples, denatured whey proteins associated with casein micelles interact with each
other and act as bridging material which increases the number and strength of bonds
between protein particles (Lucey, 2002). In unheated bovine milk, gelation occurs at
pH ~ 4.9, whereas pre-heated milk gels at pH ~ 5.2-5.4, as heat-denatured whey
proteins associated with -casein at the micelle surface have higher isoelectric points
(Lucey, 2004). Acid-induced gels formed from preheated milk therefore develop a
firm texture due to disulphide bridging which leads to increased cross-linking
through the gel network with high whey retention capacity (Lucey, 2004).
In soy milk the protein structures are very complex due to subunit structures
and heterogeneity (Mohamed & Xu, 2003). Heat treatment of soy milk causes
protein denaturation and exposes reactive amino acid groups usually buried in the
core of the proteins (Doi, 1993), which results in an increase in surface
hydrophobicity and leads to protein aggregation via non-covalent interactions and
some disulphide interchange (Malaki Nik et al., 2008). Aggregation of soy proteins

Chapter 7
174
occurs on addition of salt or acid, probably due to a reduction in electrostatic
interaction with aggregation occurring via hydrophobic interactions (Kohyama &
Nishinari, 1993). The decreased charge on soy proteins due to acidification is
reported to be a prerequisite for aggregation which is primarily driven by hydrogen
bridging (Ringgenberg, 2011). The G′ of soy milk started to increase below pH 6.2,
having reached the final G′ at pH 4.7. Previous reports for the pH at the onset of
gelation for soy proteins include 6.3 and 5.90 (Grygorczyk & Corredig, 2013;
Kuipers et al., 2007). This is close ot the isoelectric point of glycinin (6.4), which
indicates that the gelation is a result os short-range interactions (Grygorczyk &
Corredig, 2013; Thanh & Shibasaki, 1976).
Statistical analysis showed that loss tangent (tan δ) values were significantly
different for all milks (Table 7.2) and median rank values indicated soy and quinoa
milk gels were similar. For those samples that clearly gelled, i.e., bovine, quinoa and
soy milk, tan values as a function of time were plotted (Figure 7.4 c). Tan δ is
related to the spatial distribution and the number of protein-protein bonds formed
during the gelation of milk and may be regarded as a good indicator of the type and
strength of bonds between protein particles (Roefs, 1986). The result for bovine milk
is in agreement with the data reported by Lucey et al. (2000) where tan δ decreased
at gelation and continued to decrease as the milk gel aged. Also the maximum in the
tan values just after the onset of gelation of acidified bovine milk was observed in
this study, which is in agreement with the results of Lucey et al. (2000) for the
acidification of preheated bovine milk. An increase in tan at the onset of gelation
has been reported in gels formed by microbially acidified high heat-treated milk
(Rönnegård & Dejmek, 1993; van Marle & Zoon, 1995) and in gels formed from
heated bovine milk acidified with GDL (Lucey et al., 2000). Tan δ values for both

Chapter 7
175
soy and quinoa milk followed a similar pattern with a very sharp decrease in values
at the onset of gelation compared to the pattern seen for bovine milk which could be
attributed to the presence of protein aggregates seen in the TEM micrographs (Figure
7.5) which quickened the gelation process considerably. This decrease in tan
during gelation is a general and well-understood phenomenon: initially,
intermolecular associations will create aggregates or clusters which are free to move
independently through the solvent, but offer greater resistance to flow than any
individual protein molecules; this causes an increase in G′′ and therefore in tan . As
the extent of association increases, protein clusters will link together in a continuous
network, which causes a substantial increase in the solid-like, elastic character and a
reduction in the viscous response causing a rapid and sharp decrease in tan . The
lower tan values recorded for both soy and quinoa milk compared to bovine milk
150 min after GDL addition could indicate that they contain a significant amount of
material that does not contribute to gel formation under acidic conditions.
7.3.4 Rheological properties of gels
Mechanical spectra displaying the frequency dependence of G′, G″ and η*
were plotted for acidified bovine, soy and quinoa milks (the spectrum of bovine milk
shown in Figure 7.4d). All samples showed gel-like character with G′ > > G′′ and a
linear reduction in log * with increasing log ω (the spectrum of bovine milk shown
as an example in Figure 7.4d). For bovine milk, the maximum G′ after 150 min
acidification was 264 Pa and the sample displayed typical gel-like behaviour as the
frequency of oscillation was increased. The separation between G′ and G″ was
considerably smaller than in typical, self-supporting biopolymer gels and the
frequency dependence of both moduli showed a slight increase as the frequency of

Chapter 7
176
oscillation increased indicating some weakness of the gel structure (Ross-Murphy,
1983). Similarily, gels formed from acidified soy and quinoa milk showed slight
frequency-dependence of both G′ and G′′ and in the case of quinoa milk both moduli
were lower than those of either soy or bovine milk. The higher moduli recorded for
both bovine and soy milk indicate more intermolecular association between protein
particles compared to quinoa milk which is consistent with the higher protein
contents in both bovine and soy milk (Table 7.1). In a true viscoelastic gel, the
dynamic moduli are totally independent of frequency (ω) and in a typical biopolymer
gel, G′ (the solid-like response) exceeds G″ (the liquid-like response) by an order of
magnitude and a linear relationship exists between log * and log with a slope of ~
-1 (Ross-Murphy, 1983). To form an ‘ideal’ gel, permanent covalent bonding is
required and the dynamic moduli are independent of frequency, but in a typical
protein gel, some frequency dependence is always observed and log G′ vs. log has
a slope which is greater than zero but typically is < 0.1 (Ross-Murphy, 1983).
The creep curves recorded for acidified bovine, quinoa and soy milk are shown in
Figure 7.6a-c. In the case of bovine milk, the strains generated in response to the
stresses, the compliance (J) curves, were characteristic of a gel network with some
elasticity. In a true viscoelastic gel, the compliance curves would superimpose
closely and the irrecoverable strain would be similar for each applied stress. For the
weak gel formed from bovine milk in this study, some irrecoverable deformation of
the sample occurred for all stress levels and increased as the stress increased. At an
applied stress of 102.4 Pa, the compliance increased dramatically at the start of the
creep period and the gel network fractured and flowed when a finite ‘yield stress’
value was exceeded. Yielding of sample occurred instantaneously at 12.5 Pa for
acidified quinoa milk and at 25.6 Pa for soy milk. More overlap of compliance

Chapter 7
177
versus time curves was observed in the case of soy milk (Figure 7.6 b) compared to
those of either bovine or quinoa, indicating quite an elastic protein network although
application of a stress of 25.6 Pa fractured this structure easily. Acidified quinoa milk
had the sharpest increase in strain/compliance on application of each stress with a
significant increase over time possibly due to more rearrangement of the protein
network as it was stressed compared to those of bovine and soy gels.
Figure 7.6. Creep-recovery curves recorded at 30oC for acidified bovine (a), soy (b)
and quinoa (c) milks and variation of maximum strain after 5 min creep (d) for
acidified bovine (○), soy (▲) and quinoa milks (+). In a-c, the curves show the
variation of compliance (J) in response to applied stress values of 1.6 (black solid),
3.2 (grey solid), 6.4 (light grey solid), 12.8 (black open), 25.6 (grey open), 51.2 (light
grey open) or 102.4 Pa (dashed line).
a.
d. c.
b.

Chapter 7
178
The differences in resistance to fracture and in the extent of deformation in
response to applied stresses of acidified bovine, quinoa and soy milk gels was
illustrated by plotting, double-logarithmically, the maximum strain reached at the
end of the 5 min period of applied stress (Figure 7.6d). The gel formed from bovine
milk was substantially stronger than that formed from either quinoa or soy milk and
fractured at a higher stress value presumably due to the higher protein content of
bovine milk compared to that of quinoa or soy milk (Table 7.1). The strength of
protein-protein bonds, the number of bonds per cross-sectional area of a protein
strand, the relaxation times for the network bonds and the orientation of the strands
in the protein matrix all contribute to the yield properties of gels (Vliet, Dijk, Zoon,
& Walstra, 1991). Despite having a protein content quite similar to bovine milk, the
result here would suggest that a proportion of the protein in soy milk is not actually
incorporated fully in the gel formed after 150 min acidification.
7.4 Conclusion
To date, soy proteins have been widely utilized for their functional properties and
the tendency to form gels (Kinsella, 1979). Quinoa proteins and their hydrolyzates
have been studied for their functional properties, and they also form mechanically
resistant films with chitosan (Abugoch, Romero, Tapia, Silva, & Rivera, 2008;
Valenzuela, Abugoch, Tapia, & Gamboa, 2013). This study shows for the first time
the ability of quinoa proteins to form gel structures on acidification. Due to its
balanced amino acid profile and a high biological value (Ranhotra, Gelroth, Glaser,
Lorenz, & Johnson, 1992), quinoa protein may be an interesting raw material to
study further.

Chapter 7
179
Acknowledgments
The authors would like to thank Kamil Drapala for assistance with the
LUMiSizer, and Benjamin Schiller for help with the sensory and compositional
analyses. We would also like to thank Professor Edwin Morris for his very helpful
comments on the rheology results. Outi Mäkinen was funded by the Food
Institutional Research Measure administered by the Department of Agriculture,
Fisheries and Food (Ireland).
References
Abugoch, L. E., Romero, N., Tapia, C. A., Silva, J., Rivera, M., 2008. Study of some
physicochemical and functional properties of quinoa (Chenopodium quinoa
Willd.) protein isolates. J. Agric. Food Chem. 56, 4745–50.
Andrews, A. T., Brooker, B. E., Hobbs, D. G., 1977. Properties of aseptically packed
ultra-heat-treated milk: Electron microscopic examination of changes
occurring during storage. J. Dairy Res. 44, 283.
Bewley, J. D., Black, M., 1994. Germination, structure and composition. In: Seeds -
Physiology of development and germination. New York: Plenum Press. pp,
1–33.
Boomgaard, T., Vliet, T., Hooydonk, A. C. M., 1987. Physical stability of chocolate
milk. Int. J. Food Sci. Technol. 22, 279–291.
Carvalho, N. F., Kenney, R. D., Carrington, P. H., Hall, D. E., 2001. Severe
nutritional deficiencies in toddlers resulting from health food milk
alternatives. Pediatrics. 107, e46–e46.
Cruz, N., Capellas, M., Hernández, M., Trujillo, A. J., Guamis, B., Ferragut, V.,
2007. Ultra high pressure homogenization of soymilk: Microbiological,
physicochemical and microstructural characteristics. Food Res. Int. 40, 725–
732.
De Kruif, C. G., Zhulina, E. B., 1996. κ-casein as a polyelectrolyte brush on the
surface of casein micelles. Colloid Surf. A. 117, 151–159.
Doi, E., 1993. Gels and gelling of globular proteins. Trends Food Sci. Technol. 4, 1–
5.

Chapter 7
180
Donato, L., Guyomarc’h, F., 2009. Formation and properties of the whey protein/κ-
casein complexes in heated skim milk – A review. Dairy Sci. Technol. 89, 3–
29.
Durand, A., Franks, G. V, Hosken, R. W., 2003. Particle sizes and stability of UHT
bovine, cereal and grain milks. Food Hydrocoll. 17(5), 671–678.
Fujihara, S., Sasaki, H., Aoyagi, Y., Sugahara, T., 2008. Nitrogen-to-protein
conversion factors for some cereal products in Japan. J. Food Sci. 73, C204–
9.
Grygorczyk, A., Corredig, M., 2013. Acid induced gelation of soymilk, comparison
between gels prepared with lactic acid bacteria and glucono-δ-lactone. Food
Chem. 141, 1716–1721.
Millward, J.D., Garnett, T., 2010. Plenary Lecture 3 Food and the planet: nutritional
dilemmas of greenhouse gas emission reductions through reduced intakes of
meat and dairy foods. Proc. Nutr. Soc. 69, 103–118.
Kinsella, J. E., 1979. Functional properties of soy proteins. J. Am. Oil Chem. Soc.
56, 242–258.
Kohyama, K., & Nishinari, K., 1993. Rheological studies on the gelation process of
soybean 7S and 11S proteins in the presence of glucono-delta-lactone. J.
Agric. Food Chem. 41, 8–14.
Kuipers, B. J. H., Alting, A. C., Gruppen, H., 2007. Comparison of the aggregation
behavior of soy and bovine whey protein hydrolysates. Biotechnol. Adv. 25,
606–610.
Lucey, J. A., Tamehana, M., Singh, H., Munro, P. A., 2000. Rheological properties
of milk gels formed by a combination of rennet and glucono-delta-lactone. J.
Dairy Res. 67, 415–27.
Lucey, J.A., 2002. Formation and Physical Properties of Milk Protein Gels. J. Dairy
Sci. 85, 281–294.
Lucey, John A., 2004. Cultured dairy products: an overview of their gelation and t
exture properties. Int. J. Dairy Technol. 57, 77–84.
Mäkinen, O. E., Wanhalinna, V., Zannini, E., Arendt, E. K., 2013. Foods for special
dietary needs: Non-dairy plant based milk substitutes and fermented dairy
type products. Crit. Rev. Food Sci. Nutr. in press.
Malaki Nik, A., Tosh, S., Poysa, V., Woodrow, L., Corredig, M., 2008.
Physicochemical characterization of soymilk after step-wise centrifugation.
Food Res. Int. 41, 286–294.

Chapter 7
181
Mårtensson, O., Öste, R., Holst, O., 2000. Lactic Acid Bacteria in an Oat-based Non-
dairy Milk Substitute: Fermentation Characteristics and Exopolysaccharide
Formation. LWT - Food Sci. Technol. 33, 525–530.
Mohamed, A., Xu, J., 2003. Effect of ionic strength and pH on the thermal and
rheological properties of soy protein–amylopectin blend. Food Chem. 83,
227–236.
Morr, C. V., 1979. Technical problems and opportunities in using vegetable proteins
in dairy products. J. Am. Oil Chem. Soc. 56, 383–385.
Nieto-Nieto, T. V., Wang, Y. X., Ozimek, L., Chen, L., 2014. Effects of partial
hydrolysis on structure and gelling properties of oat globular proteins. Food
Res. Int. 55, 418–425.
Pliner, P., Hobden, K., 1992. Development of a scale to measure the trait of food
neophobia in humans. Appetite. 19, 105–120.
Ranhotra, G.S., Gelroth, J.A., Glaser, B.K., Lorenz, K.J., Johnson, D.L., 1992.
Composition and protein nutritional quality of quinoa. Cereal Chem. 70, 303-
305.
Ringgenberg, E., 2011. The physico-chemical characterization of soymilk particles
and gelation properties of acid-induced soymilk gels, as a function of soymilk
protein concentration. MSc thesis. University of Guelph, Canada.
Roefs, S.P.F.M., van Vliet, T., 1990. Structure of acid casein gels. II, Dynamic
measurements and type of interaction forces. Colloids Surf. 50, 161–175.
Roefs, S.P.F.M., 1986. Structure of acid casein gels: a study of gels formed after
acidification in the cold . PhD thesis. Wageningen University, Netherlands.
Rönnegård, E., Dejmek, P., 1993. Development and breakdown of structure in
yoghurt studied by oscillatory rheological measurements. Le Lait. 73, 371–
379.
Ross-Murphy, S.B., 1983. Rheological methods. In: H. W. S. Chan (Ed.),
Biophysical methods in food research. Critical reports on applied chemistry.
Society of Chemical Industry, London, UK, pp. 195–290.
Singh, H., McCarthy, O. J., Lucey, J. A., 1997. Physico-chemical properties of milk.
In P. F. Fox (Ed.), Advanced Dairy Chemistry Vol. 3: Lactose, Water, Salts
and Vitamins. Springer, Boston, MA, pp. 469–518.
Singh, H., 2004. Heat stability of milk. Int. J. Dairy Technol. 57, 111–119.
Surh, J., Decker, E. A., McClements, D. J., 2006. Properties and stability of oil-in-
water emulsions stabilized by fish gelatin. Food Hydrocoll. 20, 596–606.

Chapter 7
182
Thanh, V. H., & Shibasaki, K., 1976. Major proteins of soybean seeds. A
straightforward fractionation and their characterization. J Agric Food Chem.
24, 1117-1121.
Valenzuela, C., Abugoch, L., Tapia, C., Gamboa, A., 2013. Effect of alkaline
extraction on the structure of the protein of quinoa (Chenopodium quinoa
Willd.) and its influence on film formation. Int. J. Food Sci. Technol. 48,
843–849.
Van Marle, M. E., Zoon, P., 1995. Permeability and rheological properties of
microbially and chemically acidified skim-milk gels. Neth. Milk Dairy J. 49,
47–65.
Van Vliet, T., Walstra, P., 1989. Weak particle networks. In R. D. Bee, P. Richmond,
& J. Mingings (Eds.), Food Colloids. Royal Society of Chemistry, London,
UK, pp. 206–217.
Van Vliet, T., Dijk, H. J. M., Zoon, P., Walstra, P., 1991. Relation between syneresis
and rheological properties of particle gels. Colloid Polym. Sci. 269, 620–627.
Walstra, P., Wouters, J. T., & Geurts, T. J. 2010. Colloidal particles of milk. In:
Dairy science and technology. CRC Press, Boca Raton, FL, USA. pp, 109-
157.

Chapter 8
183
Chapter 8
Functional and acid gelation properties of quinoa protein
isolate: influence of heat-denaturation pH
Outi E. Mäkinen, Elke K. Arendt
Submitted manuscript

Chapter 8
184
Abstract
Heat-denaturation of quinoa protein isolate (QPI) at alkali pH and its
influence on protein functionality were investigated. Heating QPI at pH 8.5 led to
increased surface hydrophobicity and decreases in free and bound sulfhydryl group
contents. Heating at pH 10.5 caused a lesser degree of changes in sulfhydryls and
surface hydrophobicity, and the resulting solutions showed drastically increased
solubility and emulsifying activity. SDS PAGE revealed the presence of large
aggregates only in the sample heated at pH 8.5, suggesting that any aggregates
present in the sample heated at pH 10.5 were non-covalently bound and disintegrated
in the presence of SDS. Reducing conditions partially dissolved the aggregates in the
pH 8.5 heated sample, indicating the occurrence of disulphide linking, but caused no
major alterations in the separation pattern of the sample heated at pH 10.5.
Denaturation pH influenced the acid gelation properties greatly. Solutions heated at
pH 8.5 formed a coarse coagulum with maximum G' of 5 Pa. Heat-induced
denaturation at 10.5 enabled the proteins to form a finer and regularly structured gel
with a maximum G' of 1140 Pa. Particle size analysis showed that the pH 10.5 heated
sample contained very small particles (0.1-1.0 µm, that readily aggregated (22-140
µm) when pH was lowered to 5.5. When the sample was heated at pH 8.5, large
aggregates (26-500 µm) were present in addition to the <1 µm particles. Differences
in the nature of aggregates formed during heating may explain the dramatic variance
in gelation properties.

Chapter 8
185
8.1 Introduction
Quinoa is a dicotyledonous crop native to the Andean region. The plant
produces starchy seeds that have been used as a food staple for thousands of years by
the Quechua and Ayamara peoples (Abugoch, 2009). Demand for quinoa has
increased in Europe and North America of late, due to its remarkable nutritional
properties. Quinoa protein in particular has received attention because of its excellent
nutritional quality: it has a high digestibility and a balanced amino acid profile. It is
notably high in lysine, the limiting amino acid in cereals (Abugoch, 2009; Ranhotra,
Gelroth, Glaser, Lorenz, & Johnson, 1992).
In addition to their nutritional relevance, proteins often provide and stabilise
the structural and textural properties of foods (Foegeding & Davis, 2011). The
chemical and physical properties that affect the behaviour of the protein in a food
system are referred to as functional properties. These properties largely determine the
usefulness of proteins in food systems (Kinsella, 1982). Proteins in foods are seldom
in their native state. Structural transitions, i.e., unfolding in solution or at an
interface, are associated with food applications due to heating, changes in pH or ionic
strength and the application of mechanical force (Foegeding & Davis, 2011). Heat-
denaturation of proteins may lead to loss of solubility and other functional properties,
but it is also often a prerequisite for gel formation (Hermansson, 1986; Nakai & Li-
Chen, 1989).
A gel structure is formed if intermolecular cross-linking occurs in a manner
that leads to the development of a continuous network that exhibits elastic behaviour
(Foegeding & Davis, 2011; Hermansson, 1979). A critical balance between attractive
and repulsive forces must occur: if attractive forces dominate, a random coagulum

Chapter 8
186
unable to hold water forms, and excessive repulsive forces prevent gelation
altogether (Hermansson, 1979; Kinsella, Rector, & Phillips, 1994).
Cold gelation of proteins is a two-step process, e.g. during yoghurt or tofu
making. First, a solution of proteins is heated at a pH distant from the isoelectric
point (pI), resulting in the formation of soluble aggregates. Gelation is induced by
reducing the electrostatic repulsion by lowering the pH towards pI or by salt
addition, which leads to association of the soluble aggregates into a continuous
network structure (Alting et al., 2004).
As is common in dicotyledonous seeds, quinoa storage proteins are found in
the globulin fraction. Two protein fractions, a legumin type globulin (11S) and a
globulin with sedimentation coefficient of 2S have been found in quinoa (Brinegar &
Goundan, 1993; Brinegar, Sine, & Nwokocha, 1996). The storage proteins are
deposited in protein storage vacuoles located in the embryo and endosperm of the
quinoa seed (Prego, Maldonado, & Otegui, 1998). The embryo is a band-like tissue
surrounding the perisperm, contributing ca. 30% of the seed weight. It can be
separated from the perisperm by milling and sieving (Ando et al., 2002).
In this study, we used an embryo-enriched milling fraction for the production
of a protein isolate. We then investigated the alteration of chemical properties
(sulfhydryl groups, hydrophobicity, deamidation, molecular weight and particle size)
as a result of heat-denaturation at alkali pH, as preliminary results showed that a high
pH alters the properties significantly, and the effects of these changes on the
functional and acid gelation properties of protein solutions.

Chapter 8
187
8.2 Materials and Methods
8.2.1 Fractionation and QPI production
8.2.1.1 Quinoa fractionation
White quinoa (Real, Bolivia) was kindly fractionated by Buehler AG into
flour (perisperm), bran (testa) and pollard (embryo enriched). Pollard had the highest
protein content and was used for the production of quinoa protein isolate (QPI). The
fraction was defatted with petroleum ether (3x) for 8 h and air dried.
8.2.1.2 Production and heat-processing of quinoa protein isolate
Quinoa protein isolates were produced using a procedure modified from
(Abugoch, Romero, Tapia, Silva, & Rivera, 2008). Defatted quinoa pollard was
ground with coffee grinder and dispersed in 0.1 M Tris-HCl buffer (pH 9.0) with 0.5
M NaCl (10% w/v). The suspension was extracted at room temperature for 2 h under
shaking and the solids were removed by centrifugation (9000 g x 20 min). The
supernatants were adjusted to pH 5 with 6 M HCl and centrifuged at 4°C (9000 g x
20 min). The pellet was suspended in distilled water (1:3 w/v), neutralised using 6 M
NaOH, homogenised with an Ultra-Turrax disperser (IKA-Werke GmbH and Co.,
Staufen, KG, Germany) for 1 min and freeze dried. The dried isolate was ground
with a ball mill (Tissuelyzer II, Qiagen, Valencia, CA). For analyses, QPI was
dispersed in water and left under gentle shaking for 24-48 h. Sodium azide (0.02%)
was used for microbial control. Samples that were heat denatured were pH adjusted
to 8.5 or 10.5, and heated for 15 min at 100°C in sealed tubes. The ‘native’ sample
was not heated before analyses.

Chapter 8
188
8.2.2 Compositional analysis
The total nitrogen content of the samples was analysed using the Kjeldahl
method (MEBAK 1.5.2.1). A nitrogen to protein conversion factor of 5.95 was used.
Moisture content was determined by oven drying for 1 h at 103°C. Amino acid
composition was analysed after hydrolysis by ion chromatography using ninhydrin
post-column derivatization (EEC, 2009).
8.2.3. Heat-induced changes in QPI solutions
8.2.3.1 Sulfhydryl groups
Free and total sulfhydryl groups were determined with Ellman’s reagent
(TNB, 5,5'-dithio-bis-(2-nitrobenzoic acid). Sample (62.5 µl) was diluted with 1.312
ml 0.1 M phosphate buffer (pH 8.0) containing 2 mM EDTA, and 25 µl TNB (0.4%)
was added. The absorbance (412 nm) was measured after 15 min incubation. Total
sulfhydryl groups were analysed as free sulfhydryl groups, but in the presence of 6 M
urea and 0.5% SDS. The sulfhydryl group concentration was calculated from the
molar extinction coefficient of TNB,
𝑐𝑆𝐻 =𝐴412𝑛𝑚
𝑏𝐸
where b is cuvette path length and Ε = 14,150 M-1
cm-1
.
8.2.3.2 Surface hydrophobicity
Surface hydrophobicity was measured using 1-anilino-8-naphthalene
sulfonate (ANS) as a hydrophobic probe (Hayakawa & Nakai, 1985). Protein
solutions were diluted to a concentration series ranging from 0.0006% to 0.004%
with 0.01 M phosphate buffer (pH 8.0). ANS (10 µl) was added to 2 ml sample, and
[Eq. 1]

Chapter 8
189
the fluorescence intensity was measured immediately with a spectrofluorometer
(SFM25, Bio-Tek Kontron Instruments, Zürich, Switzerland). The excitation and
emission wavelengths were 390 and 470 nm, respectively. The slope of relative
fluorescence intensity and protein concentration (x1000) was used as a measure of
surface hydrophobicity (S0).
8.2.3.3 Degree of deamidation
Heated samples were dialysed (cut-off 12 400kDa) against water overnight,
and lyophilised. Dry samples (100 mg) were then digested by heating in 2 N H2SO4
(750 µl) for 4 h, filtered (0.2 µm), and neutralised with 2 N NaOH. The content of
released ammonia was measured using the Berthelot method (Maita, Parsons, &
Lalli, 1984). The degree of deamidation was expressed as the ratio of ammonia
released from the heated protein samples to that of the unheated control (%).
8.2.3.4 SDS-PAGE
Protein solutions were analysed under non-reducing conditions using a 4-20%
gradient gel (Bio-Rad, Richmond, CA). Samples were diluted in sample loading
buffer, yielding final concentrations of 2% SDS, 4% glycerol, 0.01% bromophenol
blue in 0.05 M Tris-HCl, pH 6.8, 45 µg protein was loaded and electrophoresis was
performed according to Laemmli (1970). Gels were stained using a modified
sensitive colloidal staining protocol (Westermeier, 2006). Molecular weight markers
were run in parallel with the samples (Precision Plus Protein standards, All Blue,
Bio-Rad, Richmond, CA).

Chapter 8
190
8.2.4 Physicochemical and emulsifying properties of QPI after treatments
8.2.4.1 Solubility
A pH series was prepared by adjusting the pH of a 2% QPI solution to 3.0-9.5
at 0.5 increments, and diluting each sample to a final concentration of 1%. The
samples were refrigerated overnight and re-adjusted before analysis when necessary.
Solubility was determined after centrifugation (10 000 g x 15 min). Protein content
of the supernatants were analysed using the Bradford assay. The results are expressed
as % of the protein content of the supernatant of the solution:
𝑆𝑜𝑙𝑢𝑏𝑖𝑙𝑖𝑡𝑦 % =𝑃𝑟𝑜𝑡𝑒𝑖𝑛 𝑖𝑛 𝑠𝑢𝑝𝑒𝑟𝑛𝑎𝑡𝑎𝑛𝑡 (
𝑚𝑔
𝑚𝑙)
𝐼𝑛𝑖𝑡𝑖𝑎𝑙 𝑝𝑟𝑜𝑡𝑒𝑖𝑛 (𝑚𝑔
𝑚𝑙)
∗ 100%
8.2.4.2. Viscosity
Viscosity of 1% QPI solutions was measured using a rheometer (MCR301,
Anton Paar GmbH, Austria) equipped with a 50 mm cone (2°) and plate. The
measurement was performed at 20°C from shear rate 0.5 to 50 s-1
, and the apparent
viscosity at 20 s-1
was reported. If a sediment was formed in the sample, only the
supernatant was used for the measurement.
8.2.4.3 Emulsifying activity index and emulsion stability
Emulsifying properties were using the turbidity based method by (Pearce &
Kinsella, 1978) with slight modifications. A 2 ml sample of QPI solution (0.4% ) was
mixed with 0.5 ml sunflower oil and homogenised using an Ultra-Turrax T10
equipped with a S10N-10G dispersing element (Ika-Labortechnik, Janke and Kunkel
GmbH, Staufen). An aliquote was collected from the bottom of the tube immediately
(A0) and after 10 min (A10), and diluted 200-fold in 0.1% SDS solution. The
[Eq. 1]

Chapter 8
191
absorbance (500 nm) was read. The emulsifying activity index (EAI) was calculated
using the corrected equation by (Cameron, Weber, Idziak, Neufeld, & Cooper,
1991):
𝐸𝐴𝐼 = 2𝑇𝐶ϕ⁄
Where T is turbidity (2.303*A0/l), C the concentration of the protein solution
(mg/ml), ϕ the oil fraction (0.2) and l the cuvette path length. Emulsion stability (ES)
was calculated as:
𝐸𝑆 =𝐴10
𝐴0⁄
8.2.4.4. Particle size distribution
Particle size distribution was determined using a static laser light diffraction
unit equipped with a 300 RF lens (reverse Fourier; range 0.05 to 880 μm) and a He-
Ne laser light source (633 nm) using a polydisperse optical analysis model
(Mastersizer, Malvern Instruments Ltd, Worcestershire, UK) equipped with a small
volume sample presentation unit. Samples were applied to the instrument using the
small volume sample presentation unit (MSXL 5), with distilled water adjusted to
sample pH as dispersion medium. A refractive index of 1.339 from was used for the
dispersed phase, and 1.333 for the dispersant (water). The target for laser obscuration
was ∼15%.
[Eq. 3]
[Eq. 2]

Chapter 8
192
8.2.5 Gelation properties
8.2.5.1 Rheological changes during acidification
The acid gelation properties were measured by adding glucono-δ-lactone
(GDL, 0.33 mg per mg protein) and performing a time sweep (f= 1 Hz; γ= 0.05%;
T= 30°C) immediately using a rheometer (MCR301, Anton Paar GmbH, Austria).
The geometry used was a 50 mm cone and plate with a 0.8 mm gap. In addition to
the samples studied, as QPI solution heated at pH 9.5 was acidified because there
was a large difference in properties between the samples heated at pH 8.5 and 10.5.
8.2.5.2. Confocal laser scanning microscopy (CLSM)
Samples were prepared for microscopy by acidifying as decribed in Chapter
7, but 10 µl 0.1% Rhodamine B (aq) was added in the solution before the GDL). A
drop of the mixture was placed between cover slips, using pieces of cover slips as
spacers. The samples were incubated in a plastic box containing wet cotton wool at
30°C for the time required for the G’ to level off in the rheological measurements.
All samples were observed using a FV300 confocal laser-scanning system (Olympus,
Germany) mounted on an Olympus IX80 inverted microscope, with and excitation
wavelength of 543 nm and a 560-600 nm emission filter.
8.2.6. Statistical analyses
All analyses were carried out at least in triplicate. Means were compared
using one way analysis of variance (ANOVA) using Statistica 12 (StatSoft, Tulsa,
OK, USA). The level of significance was determined at p < 0.05.

Chapter 8
193
8.3 Results and discussion
8.3.1 Composition of QPI
Quinoa pollard, the embryo enriched milling fraction, was used for the
production of QPI. The whole quinoa seed contained 12.7 % protein (as is) and
pollard 23.9 %. After defatting, the protein content increased to 27.4 %. QPI
produced from pollard had a protein content of 91.3 % (dry basis), and from the
whole quinoa 64.3 % (not shown). The main amino acids in QPI were glutamic acid
(13.8 mol%), aspartic acid (10.3 mol%), glycine (9.02 mol%), leucine (8.67 mol%)
(Table 8.1). The values were very similar to pollard, indicating no major loss in
amino acids as a result of extraction. The main differences were a 2.26% decrease in
glycine and 1.21 and 0.96% increases in arginine and isoleucine, respectively. The
lysine content remained nearly unchanged. The overall amino acid composition was
very similar to that of chenopodin (Brinegar & Goundan, 1993).
8.3.2 pH-dependent heat-induced changes in QPI solutions
The native structure of 11S type globulins is stabilised by electrostatic and
hydrophobic interactions, and hydrogen bonding (Marcone, 1999). Disulfide bridges
are found as interchain disulfides connecting the acidic and basic polypeptides, or
intrachain disulfides stabilising the tertiary structure (Wolff 1993). These bonds can
be disrupted by heating, leaving them available for the formation of new disulfide
bonds (Wolff 1993).
The quantity of free SH groups was 10.9 umol/g protein in QPI before heating
(Figure 8.1a). The concentration decreased to 6.2 umol/g protein when heated at pH
8.5, and 8.8 umol/g protein when heated at pH 10.5. Also, the total SH group
content decreased upon heating at both pH values. Heating leads to increased

Chapter 8
194
exposure of buried SH groups, that can react further, leading to reductions in both
free and total SH groups. Both occurences are favoured by high pH (Monahan,
German, &Kinsella, 1995). SH group content also decreases during heating via β-
elimination of cysteine (Whitaker & Feeney, 1983). At pH 8.5, 10% of SH and
disulfides were lost during 15 min heating in soy protein (Wang & Damodaran,
1990). As the reaction rate is directly proportional to OH- concentration, the thermal
destruction of these groups is assumed to be significantly higher at pH 10.5
(Whitaker & Feeney, 1983).
Table 8.1. Amino acid composition of quinoa protein isolate compared to those of
pollard, whole quinoa and literature values of chenopodin (11S) and 2S globulins.
mol% QPI Pollard Whole quinoa 11Sa 2S
b
Nonpolar
Alanine 7.04 7.77 7.38 5.3 1.4
Proline 4.92 5.66 4.53 4.9 4.5
Phenylalanine 4.08 3.77 4.12 4.0 1.2
Glycine 9.02 11.3 11.1 8.7 7.4
Isoleucine 5.47 4.50 4.85 4.9 1.3
Leucine 8.67 8.07 8.02 7.4 2.2
Valine 6.51 6.28 6.65 6.8 0.7
Polar/charged
Glutamic acid 13.8 13.7 13.7 14.8 30.8
Arginine 7.97 6.77 6.92 9.7 15.2
Histidine 2.13 2.80 2.75 3.0 7.6
Lysine 5.43 5.67 6.06 3.2 0.9
Polar/uncharged
Aspartic acid 10.3 9.99 10.1 10.5 5.3
Serine 7.08 6.23 6.52 8.9 2.0
Tyrosin 2.77 2.22 2.26 2.9 2.9
Threonine 4.80 5.28 5.12 3.9 0.4 a Brinegar & Goundan. 1993. J Agric Food Chem 41. 41 (2), 182–185.
b Brinegar, Sine & Nwokocha. 1996. J Agric Food Chem. 44(7), 1621–1623.

Chapter 8
195
Figure 8.1. Free (green) and total (red) sulfhydryl groups (a), and surface
hydrophobicity (blue) and degree of deamidation (yellow) (b) before and after
heating at pH 8.5 and 10.5.
Heating at pH 8.5 also caused a nearly 2-fold increase in surface
hydrophobicity (S0), while the difference between native and pH 10.5 heated sample
was not significant (Figure 8.1b). The higher S0 indicates exposure of hydrophobic
amino acid residues as a result of protein unfolding. As this occurs during heating
and at alkaline pH alone (Monahan et al., 1995), the relatively low S0 of the pH
10.5 heated sample is suprising. A similar observation has however been reported
previously: when whey proteins were heated at pH 9.0, S0 increased steadily, but
decreased sharply after the temperature exceeded 60°C at pH 11.0 (Monahan et al.,
1995).
Deamidation, the conversion of amide groups of glutamine and asparagine
into acid groups, alters the solubility and surface properties drastically. It occurs at
acidic (< 3.0) or basic (>8.0) pH, and during heating (Riha, Izzo, Zhang, & Ho,
1996). The degree of deamidation was ~30% after heat-treatments, with no
differences between pH (Figure 8.1b).
SDS PAGE gels of non-heated samples showed major bands at 45 and 55
kDa, corresponding to 11S subunits (Figure 8.2a). In the presence of DTT, the
0
5
10
15
20
25
30
Native pH 8.5 pH 10.5
SH µ
mo
l/g
pro
tein
a.
0
10
20
30
40
50
0
2
4
6
8
10
12
Native pH 8.5 pH 10.5
De
gree
of d
eam
idatio
n (%
)
Surf
ace
hyd
rop
ho
bic
ity
S 0 b.
a
b
a
a
b b
a b
ab
bc
a
b

Chapter 8
196
subunits have partially dissociated into two acidic and two basic polypeptides with
molecular weights of 27-30 and 18-20 kDa (Figure 8.2b). After heating at pH 8.5, the
11S subunits had disintegrated, leaving polypeptides with MW ~42 and ~30 kDa as
major bands. The latter may be an acidic polypeptide, but no bands corresponding to
basic polypeptides were present. When heated at pH 10.5, it appears that the 11S
subunits have dissociated into acidic and basic polypeptides, but the bands are
fuzzy, indicating heterogeneity in size. Aggregates can be seen on the top of the gel
in the sample heated at pH 8.5, as well as entities with MW >250 kDa. Under
reducing conditions, the intensity of the aggregate bands has reduced significantly,
and the >250 kDa band has smeared all the way down to 50 kDa. Disulfide bonds
appear to be at least partially involved in the aggregation occurring during heating at
pH 8.5. In the sample heated at pH 10.5, the presence of DTT did not largely
influence the protein profile.
Figure 8.2. SDS PAGE under non-reducing (a) and reducing (b) conditions. Lanes 1,
pH 8.5 non-heated; lane 2, pH 8.5 heated; lane 3, pH 10.5 non-heated; lane 4, pH
10.5 heated.
15 ---
1 2 3 4 1 2 3 4
100 ---
200 ---
50 ---
37 ---
25 --- 20 ---
75 ---
kDa
250 ---
a. b.

Chapter 8
197
The subunits of oligomeric globulins dissociate during heating. Also,
cleavage of the disulfide bonds occurs, releasing the acidic and basic subunits. After
heating at 100°C, soy glycinin is not found in 11S form, but as dissociation products
(S4) and aggregates (Wolf & Tamura, 1969). The basic polypeptides have a low
solubility at pH 5.0-9.0 and aggregate readily during heating at this pH range
(German, Damodaran, & Kinsella, 1982). It is possible that, when heated at pH 10.5,
all the polypeptides remain soluble.
8.3.3 Physicochemical and emulsifying properties of QPI after treatments
Solubility depends on the composition, size and surface net charge of the
protein The net charge is pH-dependent and dictates the extent of attractive and
repulsive electrostatic forces (Kinsella, 1982). The solubility of native and heated
QPI was determined as a function of pH (Figure 8.3a). The solubility was strongly
pH dependant, with a maximum solubility of 37-75% and 45-95% at pH 3.0-3.5 and
8.0-9.0, respectively. QPI was essentially insoluble between pH 5.0 and 6.5. The
shape of the curve was not altered by heat-treatments, but heating at pH 10.5
increased the solubility at low and high pH by 30-40%, while heating at pH 8.5
decreased it slightly at high pH when compared to the native sample (p<0.05).
When in solution, native proteins are usually folded with their polar amino
acid residues exposed to the aqueous phase and the hydrophobic residues buried in
the core of the structure (Kinsella, 1982). Unfolding of the protein due to e.g. heating
or pH extremes can expose the hydrophobic amino acid residues and decrease the
solubility of the protein (Marcone, 1999; Voutsinas, Cheung, & Nakai, 1983). The
rather low overall solubility of the unheated protein is likely to result from the pH
extremes or freeze-drying step during the extraction procedure. Abugoch et al.

Chapter 8
198
(2008) acquired a very different solubility curve for a QPI isolated under similar
conditions, but at ionic strength of 0.5. The solubility remained high (80-95%)
between pH 4.5 and 11.0 and very low between pH 3.0-4.0 instead of the U-shaped
curve obtained in this study.
Viscosity of the solutions was highest at low pH, and appeared to peak at pH
4.5 in all samples (Figure 8.3b). At pH 5.5 and above, the viscosity remained low (≤
2 mPas). Solutions heated at pH 8.5 had lower viscosity at low pH, while samples
heated at pH 10.5 had slightly higher viscosity at high pH compared to the rest
Figure 8.3. Solubility (a), viscosity (b), emulsifying activity index (c), and emulsion
stability (d) of native (red), denatured at pH 8.5 (red) and denatured at pH 10.5
(green) QPI as a function of pH.
0
20
40
60
80
100
120
3 4 5 6 7 8 9
Solu
bili
ty (
%)
pH
a.
0
2
4
6
8
10
12
3 4 5 6 7 8 9
Vis
cosi
ty (
mP
as)
pH
b.
0
50
100
150
200
3 4 5 6 7 8 9
EAI
(m2
g-1
)
pH
c.
0
25
50
75
100
3 4 5 6 7 8 9
Emu
lsio
n s
tab
ility
(%
)
pH
d.

Chapter 8
199
(p<0.05). In a model system, the viscosity of protein solutions should be inversely
related to solubility because increased intermolecular interactions would be expected
to increase the viscosity (Schneppf, 1992; Shen, 1981). However viscosity behaviour
is complex and influenced by other factors such as conformation and exposure of
hydrophobic groups, making more fundamental interpretations in complex systems
challenging (Schneppf, 1992; Shen, 1981). The viscosity of soy protein as a function
of pH gives a similarly shaped curve as solubility, which was the case below neutral
pH in this study (Shen, 1981).
Emulsifying activity index (EAI) (Figure 8.3c) and emulsion stability (Figure
8.3d) figures were nearly identical to the solubility curves: EAI and emulsion
stability had their minimum between pH 5.0 and 6.5 in all samples. Heating at pH
10.5 increased the values at low and high pH, and heating at pH 8.5 increased them
slightly at pH 7.5-9.0, compared to the native sample (p<0.05). The values cannot be
compared directly to literature as the outcome depends on the means of emulsifying,
but as a comparison, the EAI for bovine serum albumin, a good emulsifier was
measured in this study. The EAI was 172 m2g
-1 at pH 8.0 with this experimental
setup. The corresponding values were 87.3 and 141 m2g
-1 for native and pH 10.5
heated QPI, respectively.
Proteins stabilise emulsions by adsorbing and partially unfolding on the oil-
water interface, hence forming a viscoelastic layer that prevents coalescence (Wilde,
2000). Generally, heating increases the surface hydrophobicity of proteins, but this
does not always improve the emulsifying properties because of a loss in solubility
(Nakai & Li-Chen, 1989). Many native plant proteins have poor interfacial properties
because of their quaternary structure and compact tertiary structures (Gruener &
Ismond, 1997; Liu, Lee, & Damodaran, 1999). Dissociation of the subunits of soy

Chapter 8
200
protein decreases the molecular weight and increases surface hydrophobicity and
molecular flexibility, leading to an increased ability to adsorb on the interface (Qi,
Hettiarachchy, & Kalapathy, 1997; Wagner & Guéguen, 1999; Withana-Gamage &
Wanasundara, 2012).
Particle size distributions were determined in heated and non-heated solutions
at pH 3.5 (Figure 8.4a; very acidic pH, high solubility), pH 5.5 (Figure 8.4b; acidic
pH, insoluble) and pH 8.0 (Figure 8.4c; alkali pH, high solubility). Three distinct
populations of particles were present with diameters ca. 0.1-1.0 µm, 1-10 µm and 35-
350 µm, the population size depending on pH and heat-treatment. When the particle
sizes were measured at pH of high protein solubility (3.5 and 8.0), native and pH 8.5
heated samples showed similar profiles, but pH 8.5 contained more large particles.
In the sample heated at pH 10.5, the particle size distribution was monomodal with
only small particles present (Figure 8.4a and c). At minimum solubility (pH 5.5), all
samples larger aggregated particles, but the sizes varied: the particles were in the
range of 50-500 in native samples, 26-500 in pH 8.5 heated samples and 22-140 µm
in pH 10.5 heated samples (Figure 8.4 b). It appears that heating QPI at pH 10.5
leads an increased dissociation and/or hydrolysis of the protein into small particles.
These particles readily assemble into large aggregates at pH close to the isoelectric
point (pI). Larger aggregates (22-140 µm) exist in the pH 10.5 heated sample sample
at pH with minimum solubility, although these were not visible in the comb of the
SDS PAGE gel unlike in the case of the pH 8.5 treated sample. These aggregates are
either small enough to enter the gel, or they are disintegrated by SDS, indicating non-
covalent forces.

Chapter 8
201
Figure 8.4. Particle size distributions of native (solid) and denatured at pH 8.5
(dashed) and pH 10.5 (dotted) QPI solutions at pH 3.5 (a), 5.5 (b) and pH 8.0 (c).
8.3.4 Acid gelation of QPI solutions
QPI solutions (5%) were heat-treated at pH 7.5, 8.5, 9.5 and 10.5 and
acidified using glucono-δ-lactone (GDL). The storage moduli (G') were recorded
simultaneously (Figure 8.5). An increase in G' occurred in samples heated at pH 8.5
and above, but not at 7.5 or a non-heated solution (not shown). The maximum G'
reached during the acidification depended very strongly on the pH at which the
solution was heated: the final G' values were 5 Pa for pH 8.5, 20 Pa for pH 9.5 and
1140 Pa for pH 10.5 (Figure 8.5 a-b). The G' was very dependent on sample

Chapter 8
202
preparation, and, for example, high shear mixing of the protein solution before
acidification resulted in gels with a G' < 100 Pa.
Figure 8.5. Development of storage moduli (G') during the acidification of 5% QPI
solutions heated at pH 8.5 (red), 9.5 (blue) and 10.5 (green). Figure b is a
magnification of the lower Pa range of figure a.
When observing the gels using a confocal laser scanning microscope, it is
evident that the structures of gels from solutions heated at pH 8.5 and 9.5 were
coarse and they appeared to consist of irregular clusters of aggregated particles
(Figure 6a-b). The gel formed from the pH 10.5 sample on the other has a fine and
regular structure and a smaller pore size (Figure 6c).
The degree of aggregation determines the type of gel that is formed
(Hermansson, 1986). Renkema, Lakemond, de Jongh, Gruppen, & van Vliet (2000)
observed that a fine-stranded gel was formed when soy protein was heat-gelled at a
neutral pH, whereas acidic pH led to the formation of a coarse, granulated gel
because the proteins were aggregated to a larger extent. The authors hypothesised
that only the precipitated protein in the solution is incorporated in the gel, and the
0
200
400
600
800
1000
1200
0 20 40
Sto
rage
mo
du
lus
G' (
Pa)
Time (min)
a.
0
5
10
15
20
25
0 10 20 30
Sto
rage
mo
du
lus
G' (
Pa)
Time (min)
b.

Chapter 8
203
higher proportion of soluble protein at neutral pH explains the finer structure
(Renkema et al., 2000).
Figure 8.6.CLSM images of acidified QPI heated at different pH 8.5 (a), 9.5 (b) and
10.5 (c). Bars 20 µm.
The pH 10.5 heated sample was marked by lower surface hydrophobicity and
higher solubility than the sample treated at pH 8.5. Gel electrophoresis showed the
apparent absence of larger disulphide-bound aggregates that were found in the
sample heated at pH 8.5, but particle size data (Figure 8.5) revealed the presence of
aggregates of 30-200 µm diameters. These particles however appear be soluble to a
large extent. If aggregation is suppressed during unfolding, the resulting gel network
will have a finer structure and higher elasticity than when random aggregation and
unfolding occur simultaneously (Hermansson, 1979). The solubility of the basic
polypeptide increases above 9, below which it readily aggregates during heating
(German et al., 1982). Possibly, in the sample heated at pH 10.5, the basic
polypeptides remain soluble after dissociation and the formation of protein-protein
interactions occurs largely only during acidification. Also hydrolysis may increase
the gelation properties of proteins. For example in the case of whey proteins,
extensive hydrolysis (>DH=18%) leads to the formation of a strong gel (Doucet,

Chapter 8
204
Gauthier, & Foegeding, 2001), and similar behavior has been reported for soy
glycinin (Kuipers & Gruppen, 2008).
8.4 Conclusions
The present study shows that the pH at which heat-denaturation occurs
influences the functional and structure forming properties of QPI strongly. Heating
QPI at pH 8.5 led to an increase in surface hydrophobicity and subsequent reduction
of solubility and viscosity, whereas heat-denaturation at pH 10.5 increased the
solubility and emulsifying activity strongly. Also the acid gelation properties were
dramatically altered: the maximum G' of an acidified QPI denatured at pH 10.5 was
1140 Pa compared to 5-20 Pa of proteins denatured at lower pH. We propose the
following: formation of random disulphide bound aggregates occurred during heating
at pH 8.5. When the repulsive forces were brought down by acidification, these
aggregates formed a coarse coagulum with a low G'. When heating at pH 10.5, the
high solubility of basic polypeptides and increased surface charge retarded aggregate
formation and, when this system was acidified, the soluble aggregates cross-linked in
a manner leading to a fine and regular network structure.
Acknowledgments
Outi Makinen was funded by the Food Institutional Research Measure
administered by the Department of Agriculture, Fisheries and Food (Ireland). The
authors wish to express their sincere gratitude to Walter von Reding, Uwe Schill and
Uncas Roukema from Bühler AG for the fractionation of quinoa.

Chapter 8
205
References
Abugoch James, L., E., 2009. Quinoa (Chenopodium quinoa Willd.): Composition,
chemistry, nutritional, and functional properties. Adv. Food Nutr. Res. 58, 1–31.
Abugoch, L. E., Romero, N., Tapia, C. A., Silva, J., Rivera, M., 2008. Study of some
physicochemical and functional properties of quinoa (Chenopodium quinoa
Willd) protein isolates. J. Agric. Food Chem. 56, 4745–50.
Alting, A. C., Weijers, M., de Hoog, E. H. A., van de Pijpekamp, A. M., Cohen
Stuart, M. A., Hamer, R. J., Visschers, R. W., 2004. Acid-induced cold gelation
of globular proteins: effects of protein aggregate characteristics and disulfide
bonding on rheological properties. J. Agric. Food Chem. 52, 623–31.
Ando, H., Chen, Y.-C., Tang, H., Shimizu, M., Watanabe, K., Mitsunaga, T., 2002.
Food components in fractions of quinoa seed. Food Sci. Technol. Res. 8, 80–84.
Brinegar, C., Goundan, S., 1993. Isolation and characterization of chenopodin, the
11S seed storage protein of quinoa (Chenopodium quinoa. J. Agric. Food Chem.
41, 182–185.
Brinegar, C., Sine, B., Nwokocha, L., 1996. High-cysteine 2S seed storage proteins
from quinoa (Chenopodium quinoa). J. Agric. Food Chem. 44, 1621–1623.
Cameron, D. R., Weber, M. E., Idziak, E. S., Neufeld, R. J., Cooper, D. G., 1991.
Determination of interfacial areas in emulsions using turbidimetric and droplet
size data: correction of the formula for emulsifying activity index. J. Agric.
Food Chem. 39, 655–659.
Doucet, D., Gauthier, S. F., Foegeding, E. A., 2001. Rheological characterization of
a gel formed during extensive enzymatic hydrolysis. J. Food Sci. 66, 711–715.
EEC, 2009. Commission Regulation (EC) No 152/2009 of 27 January 2009 laying
down the methods of sampling and analysis for the official control of feed.
Official Journal of the European Union L 054, 26.2.2009, p.1.
Foegeding, E. A., Davis, J. P., 2011. Food protein functionality: A comprehensive
approach. Food Hydrocoll. 25, 1853–1864.
German, B., Damodaran, S., Kinsella, J. E., 1982. Thermal dissociation and
association behavior of soy proteins. J. Agric. Food Chem. 30, 807–811.
Gruener, L., Ismond, M. A. H., 1997. Effects of acetylation and succinylation on the
functional properties of the canola 12S globulin. Food Chem. 60, 513–520.
Hayakawa, S., Nakai, S., 1985. Relationships of hydrophobicity and net charge to the
solubility of milk and soy proteins. J. Food Sci. 50, 486–491.
Hermansson, A. M., 1986. Soy protein gelation. J. Am. Oil Chem. Soc. 63, 658–666.

Chapter 8
206
Hermansson, A.-M., 1979. Aggregation and denaturation involved in gel formation -
Chapter 5. In: Pour-El, A. (Ed.), Functionality and Protein Structure. American
Chemical Society, Washington D.C., U.S.A. pp, 281-304
Kinsella, J. E., 1982. Relationships between structure and functional properties of
food proteins. In: Fox, P.F., Condon, J.J. (Eds.), Food Proteins 1. Applied
Science Publishers Ltd, Barking, UK. pp. 51–103
Kinsella, J. E., Rector, D. J., Phillips, L. G., 1994. Physicochemical properties of
proteins: Texturization via gelation, glass and film formation. In: Yada, R.Y.,
Jackman, R.L., Smith, J.L. (Eds.), Protein Structure-Function Relationships in
Foods. Springer US, Boston, M.A., U.S.A. pp, 1-21.
Kuipers, B. J. H., Gruppen, H., 2008. Identification of strong aggregating regions in
soy glycinin upon enzymatic hydrolysis. J. Agric. Food Chem. 56, 3818–27.
Liu, M., Lee, D.-S., Damodaran, S., 1999. Emulsifying properties of acidic subunits
of soy 11S globulin. J. Agric Food Chem. 47, 4970–4975.
Maita, Y., Parsons, T. R., Lalli, C. M., 1984. A manual of chemical and
biological methods for seawater analysis. Pergamon Press, Oxford, U.k.
Marcone, M. F., 1999. Biochemical and biophysical properties of plant storage
proteins. Food Res. Int. 32, 79–92.
Monahan, F. J., German, J. B., Kinsella, J. E., 1995. Effect of pH and temperature on
protein unfolding and thiol/disulfide interchange reactions during heat-induced
gelation of whey proteins. J. Agric. Food Chem. 43, 46–52.
Nakai, S., Li-Chen, E., 1989. Effects of heating on protein functionality. In: Phillips,
R.D., Finley, J.W. (Eds.), Protein Quality and the Effects of Processing.
Dekker, New York, U.S.A. pp 125−144.
Pearce, K. N., Kinsella, J. E., 1978. Emulsifying properties of proteins: evaluation of
a turbidimetric technique. J. Agric. Food Chem. 26, 716-723.
Prego, I., Maldonado, S., Otegui, M., 1998. Seed structure and localization of
reserves in Chenopodium quinoa. Ann. Bot. 82, 481–488.
Qi, M., Hettiarachchy, N. S., Kalapathy, U., 1997. Solubility and emulsifying
properties of soy protein isolates modified by pancreatin. J. Food Sci. 62, 1110–
1115.
Ranhotra, G.S., Gelroth, J.A., Glaser, B.K., Lorenz, K.J., Johnson, D.L., 1992.
Composition and protein nutritional quality of quinoa. Cereal Chem. 70, 303-
305.
Renkema, J. M., Lakemond, C. M., de Jongh, H. H., Gruppen, H., van Vliet, T.,
2000. The effect of pH on heat denaturation and gel forming properties of soy
proteins. J. Biotechn. 79, 223–230.

Chapter 8
207
Riha, W.E., Izzo, H.V, Zhang, J., Ho, C.T., 1996. Nonenzymatic deamidation of food
proteins. Crit. Rev. Food Sci. Nutr. 36, 225–55.
Schneppf, M. I., 1992. Protein-water interactions. In: Hudson, B.J.F. (Ed.),
Biochemistry of Food Proteins. Springer US, Boston, M.A. pp. 1–33
Shen, J.L., 1981. Solubility and viscosity. In: Cherry, J. (Ed.), Protein functionality
in foods. American Chemical Society, Washington D.C. pp, 89-109.
Voutsinas, L.P., Cheung, E., Nakai, S., 1983. Relationships of hydrophobicity to
emulsifying properties of heat denatured proteins. J. Food Sci. 48, 26–32.
Wagner, J.R., Guéguen, J., 1999. Surface functional properties of native, acid-
treated, and reduced soy glycinin. 2: Emulsifying properties. J. Agric. Food
Chem. 47, 2181–2187.
Wang, C.H., Damodaran, S., 1990. Thermal destruction of cysteine and cystine
residues of soy protein under conditions of gelation. J. Food Sci. 55, 1077–
1080.
Whitaker, J.R., Feeney, R.E., 1983. Chemical and physical modification of proteins
by the hydroxide ion. Crit. Rev. Food Sci. Nutr. 19, 173–212.
Wilde, P., 2000. Interfaces: their role in foam and emulsion behaviour. Curr. Opin.
Colloid Interface Sci. 5, 176–181.
Withana-Gamage, T.S., Wanasundara, J.P.D., 2012. Molecular modelling for
investigating structure–function relationships of soy glycinin. Trends Food Sci.
Technol. 28(2), 153–167.
Wolf, W.J., Tamura, T., 1969. Heat denaturation of soybean IIS protein. Cereal
Chem. 46, 331–344.

Chapter 9
208
Chapter 9
Heat-denaturation and aggregation of quinoa (Chenopodium
quinoa) globulins: influence of pH
Outi E. Mäkinen, Peter Koehler, Elke, K. Arendt
Manuscript under review

Chapter 9
209
Abstract
The influence of heating (100°C; 0-15 min) on the molecular weight, protein
unfolding and secondary structure of quinoa globulins was studied at pH 6.5 (very
low solubility), 8.5 and 10.5 (high solubility). The mechanism of denaturation and
aggregation varied with pH. Heating triggered the disruption of the disulphide bonds
connecting the acidic and basic chains of the chenopodin subunits at pH 8.5 and 10.5,
but these remained intact at pH 6.5. Large aggregates unable to enter a 4% SDS-
PAGE gel were formed at pH 6.5 and 8.5, and were mostly dissolved under reducing
conditions. Heating at pH 10.5 lead to a rapid dissociation of the native chenopodin
and the disruption of the subunits, but no SDS-insoluble aggregates were formed. No
major changes in secondary structure occurred during a 15 min heating, but an
increase in hydrophobicity indicated unfolding of the tertiary structure in all samples.

Chapter 9
210
9.1 Introduction
The relevance of plant-derived proteins in human nutrition has been predicted
to increase in the future, e.g. in the form of meat and dairy substitutes (Aiking, 2011;
Day, 2013). Increasing the knowledge about the physical properties, structure-
function relationship and processing behaviour of plant proteins is fundamental for
the development of desirable products (Aiking, 2011; Kinsella, 1982). Quinoa
(Chenopodium quinoa) is a dicotyledonous seed crop native to the Andean region,
where it has been used as a food staple for thousands of years (Abugoch James, L.,
2009). Quinoa seeds contain 12-16% protein with a balanced amino acid profile and
a protein efficiency ratio equal to casein (Abugoch James, L., 2009; Ranhotra et al.,
1992). The protein storage vacuoles are primarily located in the embryonic tissue that
surrounds the seed (Prego et al., 1998). This tissue can be readily separated by
milling into a fraction that contains 23% protein (Ando et al., 2002; Mäkinen and
Arendt, 2014), leaving the starchy perisperm available for other applications (Elgeti
et al., 2014; Rayner et al., 2012).
The main protein present in quinoa protein isolated by alkali extraction and
isoelectric precipitation is chenopodin, an 11S globulin (Mäkinen and Arendt, 2014;
Brinegar et al., 1993). Chenopodin consists of ~49 and 57 kDa subunits (AB-11S)
that are associated into a hexamer by non-covalent interactions (Brinegar and
Goundan, 1993; Casey, 1999; Mäkinen et al., 2014). Each subunit consists of acidic
(~28 and 34 kDa; A) and basic (~17 and 19 kDa; B) chains, that are linked by a
disulphide bond (Mäkinen et al., 2014). These proteins have their isoelectric point
between pH 5.0 and 6.5, where they exhibit minimum solubility (Mäkinen and
Arendt, 2014).

Chapter 9
211
The physical and physicochemical properties of proteins dictate their
potential use (Kinsella, 1982). Previous work has shown that the denaturation pH
drastically influences the properties of quinoa globulins. Heating quinoa protein
isolate at alkali pH (10.5) improved its solubility and emulsifying activity, and also
formed a gel with a regular structure and high storage modulus upon acidification
(Mäkinen and Arendt, 2014). Mildly alkali denaturation pH (8.5-9.5) led to the
formation of a weak coagulum, while protein denatured at a neutral pH formed no
structures (Mäkinen and Arendt, 2014). The differences were linked to the higher
solubility of the polypeptides released from the chenopodin subunits during heating
that were able to arrange into a fine gel network upon acidification. Heating at lower
pH led to the formation of large aggregates, that formed merely a randomly
aggregated coagulum with no gel-like properties (Hermansson, 1979; Mäkinen and
Arendt, 2014). Improved emulsifying properties have also been reported for soy
protein subjected to alkaline pH-shifting (Jiang et al., 2009).
The aim of this study was to investigate the influence of pH on the structural
changes occurring during the heat-induced denaturation of quinoa globulins, that
may be related to altered functionality. Protein solutions (1%) were subjected to
heating at pH 6.5 (very low solubility), 8.5 and 10.5 (high solubility), and changes in
molecular weight and aggregation, free sulfhydryl groups, surface hydrophobicity
and secondary structure were monitored as a function of heating time.

Chapter 9
212
9.2 Materials and Methods
9.2.1 Heat processing of protein solutions
Quinoa globulins were isolated by alkaline extraction and isoelecetric
precipitation as described in previous work (Mäkinen and Arendt, 2014). The freeze
dried protein isolate was dispersed in water and left under gentle shaking for 24-48 h.
Insoluble protein was removed by filtering through filter paper. Sodium azide
(0.02%) was used for microbial control. The pH of solutions was adjusted with
NaOH and HCl, and heat-treatments were carried out in sealed tubes in a boiling
water bath.
9.2.2 Free sulfhydryl groups
Free sulfhydryl groups were determined with Ellman’s reagent (TNB, 5,5'-
dithio-bis-(2-nitrobenzoic acid). Sample (62.5 µl) was diluted with 1.312 ml 0.1 M
phosphate buffer (pH 8.0) containing 2 mM EDTA, and 25 µl TNB (0.4%) was
added. The absorbance (412 nm) was measured after 15 min incubation. The
sulfhydryl group concentration was calculated from the molar extinction coefficient
of TNB,
𝑐𝑆𝐻 =𝐴412𝑛𝑚
𝑏𝐸
where b is cuvette path length and Ε = 14,150 M-1
cm-1
.
9.2.3 Surface hydrophobicity
Surface hydrophobicity was measured using 1-anilino-8-naphthalene
sulfonate (ANS) as a hydrophobic probe (Hayakawa & Nakai, 1985). Protein
[Eq. 1]

Chapter 9
213
solutions were diluted to a concentration series ranging from 0.0006% to 0.004%
with 0.01 M phosphate buffer (pH 8.0). ANS (10 µl) was added to 2 ml sample, and
the fluorescence intensity was measured immediately with a spectrofluorometer
(SFM25, Bio-Tek Kontron Instruments, Zürich, Switzerland). The excitation and
emission wavelengths were 390 and 470 nm, respectively. The slope of relative
fluorescence intensity and protein concentration (x1000) was used as a measure of
surface hydrophobicity (S0).
9.2.4 HPLC analysis of proteins
For HPLC analysis, samples were filtered (0.45 µl) and separated by reverse
phase (RP) to study changes in the hydrophobic nature of the samples, and size
exclusion (SEC) for information on molecular weight. Both analyses were carried
out using an Infinity 1260 HPLC system equipped with a UV detector (Agilent
Technologies, Palo Alto, CA). UV detection was at 210 nm, and a reference
wavelength of 360 nm was used.
A C18 column (Agilent Technologies, Palo Alto, CA) was used for RP-
HPLC, with eluents A: water + 0.1% TFA, and B: acetonitrile + 0.1% TFA. Two
linear gradients were applied at a flow rate of 03 ml/min: 0-5 min 10-30% B, and 5-
25 min 40-60% B, followed by a 15 min equilibration period before the next run.
The SEC analysis was carried out using two columns with exclusion limits of
500-150 000 and 5 000-1 250 000 (SEC-5 150 and 300Å, Agilent Technologies, Palo
Alto, CA), and 0.1 M phosphate buffer (pH 7.0) with 0.1 M NaCl as a mobile phase
at 1 ml/min. A calibration curve was constructed using aprotinin, cytochrome c,
ribonuclease A, carbonic anhydrase, hen egg albumin, bovine serum albumin, γ-
globulin, catalase and thyroglobulin (6.5-670 kDa) (Sigma-Aldrich).

Chapter 9
214
9.2.5 SDS-PAGE
Protein solutions were analysed under non-reducing conditions using a 4-20%
gradient gel (Bio-Rad, Richmond, CA). Samples were diluted in sample loading
buffer, yielding final concentrations of 2% SDS, 4% glycerol, 0.01% bromophenol
blue in 0.05 M Tris-HCl, pH 6.8, 45 µg protein was loaded and electrophoresis was
performed according to Laemmli (1970). Gels were stained using a modified
sensitive colloidal staining protocol (Westermeier, 2006). Molecular weight markers
were run in parallel with the samples (Precision Plus Protein standards, All Blue,
Bio-Rad, Richmond, CA).
9.2.6 Circular dichroism
Far-UV circular dichroism (CD) measurements of protein solutions (1 mg/ml)
were carried out in the range of 180-260 nm using Chirascan (Applied Photophysics,
Leatherhead, UK) with a path length of 0.1 mm. The spectra of three scans were
averaged and a 5-point smoothing algorithm was applied after correction for the
water baseline.
9.2.7 Statistical analyses
All analyses were carried out in triplicate. Where applicable, means were
compared using one way analysis of variance (ANOVA) using Sigmaplot 11.0
(Systat Software Inc., USA). The level of significance was determined at P < 0.05.

Chapter 9
215
9.3 Results
9.3.1 Changes in molecular weight (MW)
Size exclusion chromatograms of protein solutions before and after various
heating times are presented in Figure 9.1. Non-heated samples (solid black line)
showed a major peak corresponding to 250 kDa. At pH 6.5 and 8.5, a small peak
with a MW of 456 kDa was also present (Figure 9.1a-b). At pH 10.5, the 250 kDa
peak was partly dissociated into smaller fragments with MW in the range of ca. 10-
60 kDa before
Figure 9.1. Size exclusion chromatography elution profiles of samples heated at pH
6.5 (a), 8.5 (b) and 10.5 (c).

Chapter 9
216
heating (Figure 9.1c). This occurred as a result of heating at pH 6.5 and 8.5, but the
low MW peaks were either smaller (pH 8.5) or completely absent (pH 6.5),
indicating the formation of aggregates with diameters larger than 0.2 μm, that were
caught in the syringe filter before analysis.
The MW of 250 kDa is considerably lower than previously reported;
according to Brinegar and Goundan (1993), native chenopodin has a MW of 320
kDa, and 11S globulins from a number of dicotyledonous species all fall within a
relatively narrow range of 300-370 kDa (Marcone, 1999). To see whether this
difference was due to alteration of the proteins during isolation, especially isoelectric
precipitation, the globulin fraction extracted from excised quinoa embryos was also
analyzed. An identical SEC elution profile to the non-heated samples was obtained,
showing that the MW had not been affected by the isolation procedure (not shown),
and the difference to literature values is likely to be caused by calibration. The
relationship between retention time and MW is non-linear at higher MW, and even
small shifts in retention times result in large differences in MW. This could possibly
be improved by using more standards > 150 kDa, but the availability of high MW
standards is limited.
SDS-PAGE gels of the samples were run under non-reducing (Figure 9.2a)
and reducing (Figure 9.2b) conditions. The presence of SDS disrupts non-covalent
bonds, enabling the observation of dissociated subunits. The major proteins in
unheated samples were two bands found at ~45 and 55 kDa, and three other bands at
~30-35 kDa. The former correspond to chenopodin subunits (AB-11S), and have
been previously observed in the globulin fraction of quinoa embryo (Brinegar and
Goundan, 1993; Mäkinen and Arendt, 2014). These subunits consist of an acidic (A)

Chapter 9
217
and a basic (B) chain, connected by a disulfide bond, which can be disrupted in the
presence of reducing agents or as a result of heating.
Figure 9.2. SDS-PAGE gels of samples heated for varying times at pH 6.5, 8.5 and
10.5 as analysed under non-reducing (a) and reducing (b) conditions.
100
150
50
37
25 20
75
kDa
250
15
pH 6.5 pH 8.5 pH 10.5
L 0 1 2.5 5 15 0 1 2.5 5 15 0 1 2.5 5 15
acidic
basic
acidic
basic
100
150
50
37
25 20
75
kDa
250
15
L 0 1 2.5 5 15 0 1 2.5 5 15 0 1 2.5 5 15
pH 6.5 pH 8.5 pH 10.5
a.
b.

Chapter 9
218
The AB-11S bands had faded considerably after 5 min heating and nearly
disappeared after 15 min of heating at pH 6.5 and 10.5. At pH 6.5 and 8.5,
aggregates appeared as a result of heating just above 250 kDa and in the wells,
unable to enter the gel. The gel concentration was 4%, indicating an aggregate
MW larger than million Da (Utsumi et al., 1984). The >250 kDa aggregates faded
after 15 min heating, possibly polymerizing further. The aggregates were largely
dissociated under reducing conditions, indicating disulfide bonding as the
polymerization mechanism (Figure 9.2b). In the samples heated at pH 10.5, no
aggregates were found. The disulfide bonds connecting the acidic and basic chains
were gradually disrupted, giving rise to bands at 18 and 21 kDa and 30 and 35 kDa.
These bands were present under reducing conditions in samples heated at pH 8.5, but
not at pH 6.5. It appears that the aggregates are formed of intact subunits at pH 6.5,
and both intact and dissociated subunits at pH 8.5. Additionally, the bands in the
sample heated at pH 10.5 for 15 min were fuzzy, suggesting some degree of
hydrolysis of the acidic and basic chains.
9.3.2 Free sulfhydryl groups and surface hydrophobicity
The concentration of free sulfhydryl (SH) groups increased from 10.9 to 17.7
and 16.8 μmol/g protein at pH 8.5 and 10.5, respectively during the first 5 min of
heating (Figure 9.3a). This was likely to result from the disruption of the disulfide
(SS) bonds connecting the acidic and basic subunits seen in the SDS-PAGE gels
(Figure 9.2a), as well as the exposure of buried SH groups due to unfolding. When
heated further, the SH group concentration decreased below the starting level at both

Chapter 9
219
Figure 9.3. Development of free sulfhydryl groups (a) and surface hydrophobicity
(b) during heating at pH 6.5 (red), 8.5 (blue) and 10.5 (green).
pH values. At pH 6.5, the quantity of free SH groups was low and increased only
slightly from 5.1 to 8.7 μmol/g protein. ANS binding experiments showed that the
surface hydrophobicity (S0) increased in all samples during the first 5 min (Figure
9.3b). This indicates changes in tertiary structure related to unfolding and subsequent
exposure of hydrophobic amino acid residues (Marcone et al., 1998). Also, the
dissociation of the subunits may contribute to surface hydrophobicity due to the
exposure of the hydrophobic areas that are stacked facing each other in the native
protein (Adachi et al., 2003). Interestingly, similar degree of hydrophobic exposure
occurredat pH 6.5 despite the apparent lack of disruption of SS bonds. When the
samples were heated further, S0 increased slightly at pH 6.5 and 8.6, but decreased
nearly back to its value before heating at pH 10.5.
9.3.3 Reverse phase chromatography (RP-HPLC)
Peak regions on the RP-HPLC elution profiles of samples were grouped in
four categories (P1-P4) with P1 being least hydrophobic and P4 most hydrophobic
(Figure 9.4). The area beneath P3 and P4 decrease in all samples as a result of
0
2
4
6
8
10
12
14
16
18
20
0 5 10 15
SH µ
mo
l/g
pro
tein
Heating time (min)
a.
0
2
4
6
8
10
12
0 5 10 15
Surf
ace
hyd
rop
ho
bic
ity
Heating time (min)
b.

Chapter 9
220
heating, but the main differences occur in P1 and P2. Heating at pH 6.5 led to a
decrease in P1 and P2 due to aggregation, but the shape of the peaks remained
similar (Figure 9.4a). At pH 8.5, a shift from P2 to P1 becomes evident after 5 min
heating (Figure 9.4b), whereas at pH 10.5, P2 disappears leaving a large peak in P1
as the major fraction (Figure 9.4c). In contrary to ANS-binding results, the amount of
more hydrophilic proteins appeared to increase during heating at pH 10.5, and to
some extent at pH 8.5.
Figure 9.4. Reverse phase chromatograms of samples heated at pH 6.5 (a), 8.5 (b)
and 10.5 (c) for 0 min (black), 2.5 min (wine), 5 min (red) or 15 min (orange).
3 5 7 9
Ab
sorb
ance
21
0 n
m
Retention time (min)
a.
0 min
2.5 min
5 min
10 min
3 5 7 9
Ab
sorb
ance
21
0 n
m
Retention time (min)
b.
3 5 7 9
Ab
sorb
ance
21
0 n
m
Retention time (min)
c.
P1 P2 P3 P4

Chapter 9
221
9.3.4 Circular dichroism (CD)
CD spectroscopic measurements were performed at the far UV range to gain
information about the secondary structure of the proteins as affected by heating. All
spectra exhibited a strong positive peak at 190-195 nm, and a broad negative peak in
the region of with a minimum at 208 nm in unheated samples at pH 6.5 and 8.5, and
207 nm at pH 10.5 (Figure 9.5). At pH 8.5, this peak did not change, but at pH 6.5
the negative maximum was attenuated in samples heated for 5 and 15 min, leaving a
broad peak ranging from 208 to 226 nm (Figure 9.5a). This atypical spectral shape
may be caused by the turbidity of these two samples, that aggregated during heating
(Kim et al., 2004). In the samples at pH 10.5, the negative peak was shifted towards
lower wavelength and peaked at 204 nm after 15 min heating (Figure 9.5c). This
indicates a slight conversion of α-helix and β-sheet to aperiodic structure (Prabakaran
and Damodaran, 1997). Overall, the changes in spectra were minor, i.e. the
secondary structures of the native protein were mostly retained (Tani et al., 1995).

Chapter 9
222
Figure 9.5. Circular dichroism spectra recorded after 0 min (black), 5 min (red) and
15 min (orange) heating at pH 6.5 (a), pH 8.5 (b) and pH 10.5 (c).
9.4 Discussion
pH influences the conformation of proteins greatly, as the ionization of
charged amino acid residues is pH dependent. The surface charge distribution
impacts the interactions of proteins with the solvent and each other. The further the
pH is from the isoelectric point, the greater the electrostatic repulsion and
subsequently, the solubility of the protein, while little repulsion promotes
aggregation (Creighton, 1993). Also, pH extremes advance unfolding and decrease
the thermal stability of proteins (Creighton, 1993; Petruccelli and Añón, 1996).
-6
-4
-2
0
2
4
6
190 200 210 220 230 240 250
Cir
cula
r d
ich
rois
m (
md
eg)
Wavelength (nm)
a.
-6
-4
-2
0
2
4
6
190 200 210 220 230 240 250
Cir
cula
r d
ich
rois
m (
md
eg)
Wavelength (nm)
b.
-6
-4
-2
0
2
4
6
190 200 210 220 230 240 250
Cir
cula
r d
ich
rois
m (
md
eg)
Wavelength (nm)
c.

Chapter 9
223
The main storage globulin in quinoa is chenopodin, an 11S type globulin
(Brinegar and Goundan, 1993). The native structure of these proteins is a hexamer
of ~50 kDa subunits associated by hydrogen bonding, and electrostatic and
hydrophobic interactions (Marcone, 1999). The 11S subunit (AB-11S) consist of a
small basic chain (B) and a larger acidic chain (A) that are connected by a single
disulfide bridge. Heating can disrupt these bonds, leaving them available for cross-
linking by the formation of new disulfide bonds (Schurer et al., 2007; Wolf, 1993).
Heating at pH 8.5 and 10.5 led to the dissociation of native chenopodin
oligomer. This occurred especially rapidly, in less than a minute, at pH 10.5. Further
heating disrupted the disulfide bond connecting the acidic and basic chains. This was
also observed as an increase in the quantity of free SH groups during the first 5 min
of heating, after which the number declined. At pH 8.5, these chains aggregated into
disulfide bound species accompanied by a reduction in the quantity of free SH
groups. At pH 10.5 the acidic and basic chains remained soluble, but the quantity of
free SH groups decreased nevertheless. Cysteine and cysteine residues are destroyed
by heating under neutral and alkali pH via β-elimination (Wang and Damodaran,
1990). β-elimination is catalyzed by the hydroxyl ion, leading to an increased rate of
destruction at higher pH. It is also influenced by the ionization of the sulfhydryl
group (pK = 8.8) (Wang and Damodaran, 1990; Whitaker and Feeney, 1983). This
reaction may however carry a food safety concerns: dehydroalanine is formed as
result of β-elimination, and can react further with other amino acids e.g. into lysine
alanine and ornithoalanine (Friedman, 1999; Whitaker and Feeney, 1983). These
amino acids have been reported to impair the digestibility of proteins, and dietary
lysinoalanine has been associated with changes in kidney cells in rats (Friedman,
1999).

Chapter 9
224
Thermally induced aggregation of partially unfolded proteins can occur either
by disulfide crosslinking of newly available SH groups, or non-covalently to counter
the increased hydrophobic exposure (Visschers and de Jongh, 2005). While
aggregation was clearly disulfide-mediated at pH 8.5, the latter mechanism would
explain the decrease in S0 after the initial increase observed at pH 10.5. These
aggregates would not be expected to be visible in during electrophoresis, as non-
covalent bonds are disrupted in the presence of SDS. In soy glycinin, the basic
chains have been shown to aggregate readily once dissociated between pH 6.5-8.0
(German et al., 1982). The solubility of basic subunits increases at alkali pH,
reaching its maximum above pH 9.0 (German et al., 1982). The high solubility of the
basic chains at pH 10.5 as well as the destruction of sulfhydryl groups may explain
the lack of SDS-insoluble aggregate formation.
At pH 6.5, aggregation occurred without the dissociation of the subunits.
(Renkema et al., 2000) suggested different heat denaturing mechanisms for soy
glycinin at varying pH. At an acidic pH (3.8), the disulfide bonds between the acidic
and basic subunits were not disrupted, while at pH 7.6 they were. This greatly
influenced the properties of the formed heat-set gels: at pH 3.8 the gel was coarse
and granular, but fine and smooth with a lower G’ at pH 7.6. The higher gel strength
of the coarse gel was likely to result from stronger aggregation due to more protein-
protein interactions (Renkema et al., 2000). In previous work, quinoa globulins
heated below 8.5 only aggregated but did not form gel like structures when acidified,
while a homogenous acid gel with a high G’ was formed from protein denatured at
alkali pH (10.5) (Mäkinen and Arendt, 2014). This behavior is likely to vary greatly
between different proteins. More aggregation does not necessarily mean stronger
gelation, as gel formation is dictated by the balance of attractive and repulsive forces:

Chapter 9
225
if attractive forces dominate, a randomly aggregated coagulum unable to trap water
may be formed (Hermansson, 1979; Kinsella et al., 1994). In fact, suppressing the
degree of aggregation of egg white proteins with SDS makes the resulting gel
structure finer and more uniform (Handa et al., 1998). Also the size of the particles
formed during denaturation influence the acid gelation properties. Sonication of soy
protein isolate decreases the particle size and surface hydrophobicity, and leads to the
formation of small, soluble particles. When acidified, these particles form a stronger
and more uniform gel compared to non-sonicated protein with larger particles (Hu et
al., 2013).
Heating up to 15 min did not considerably influence the secondary structure
at any pH studied. Changes in S0 and RP-HPLC elution patterns however indicated
unfolding in all samples, and the disruption of the tertiary structure was evident in
samples heated at pH 8.5 and 10.5. Numerous globular proteins, including
oligomeric seed globulins, have been shown to take a partially unfolded state,
“molten globule” (Hirose, 1993; Marcone et al., 1997; Tani et al., 1995). This
structure is clearly distinguished from both native and fully unfolded structures, and
is characterized by native-like secondary structure, some exposed hydrophobic
regions, and a compact but slightly loosened state rather than a random coil (Tani et
al., 1995). The molten globule state may explain the behavior of proteins when
exhibiting functionality such as emulsifying or gelation (Hirose, 1993). It is worth
noting that the change in S0 was similar in all samples despite the resistance of
disulfide bonds to heating at pH 6.5. This suggests that the changes in tertiary
structure are likely to be different when heated at pH 6.5, because of the intact
disulfide bonds. Partially unfolded protein that retains disulfide bonds is more

Chapter 9
226
compact, as cross-links of any kind decrease the conformational flexibility
(Creighton, 1993).
These results demonstrate that, while the secondary structure was retained
and some unfolding occurred in all conditions studied, the denaturation and
aggregation mechanisms of quinoa globulins are strongly pH-dependent. Heat-
induced disruption of SS bonds was prevented by heating at a pH close to the
isoelectric point, but this lead to rapid aggregation. Mildly and highly alkaline pH
(8.5 and 10.5) disrupted the SS bonds, but while the free SH groups appeared to be
involved in aggregation at pH 8.5, in a highly alkaline environment these groups
were possibly destroyed, altering the behavior of the proteins. Overall, processing
conditions of quinoa globulins largely influence their functionality.
Acknowledgments
Outi Makinen was funded by the Food Institutional Research Measure
administered by the Department of Agriculture, Fisheries and Food (Ireland). The
authors would like to thank Dr. Michael Cronin from the School of Pharmacy for
assistance with circular dichroism measurements.

Chapter 9
227
References
Abugoch James, L., E., 2009. Quinoa (Chenopodium quinoa Willd.): Composition,
chemistry, nutritional, and functional properties. Adv. Food Nutr. Res. 58, 1–31.
Adachi, M., Kanamori, J., Masuda, T., Yagasaki, K., Kitamura, K., Mikami, B.,
Utsumi, S., 2003. Crystal structure of soybean 11S globulin: glycinin A3B4
homohexamer. Proc. Natl. Acad. Sci. 100, 7395–7400.
Aiking, H., 2011. Future protein supply. Trends Food Sci. Technol. 22, 112–120.
Ando, H., Chen, Y.-C., Tang, H., Shimizu, M., Watanabe, K., Mitsunaga, T., 2002.
Food Components in Fractions of Quinoa Seed. Food Sci. Technol. Res. 8, 80–
84.
Brinegar, C., Goundan, S., 1993. Isolation and characterization of chenopodin, the
11S seed storage protein of quinoa (Chenopodium quinoa). J. Agric. Food
Chem. 41, 182–185.
Casey, R., 1999. Distribution and some properties of seed globulins,. In: Shewry, P.
(Ed.), Seed Proteins. Springer Netherlands, N.L. pp, 159–169.
Creighton, T.E., 1993. Proteins in solution and in membranes, in: Proteins: Structures
and Molecular Properties. W.H. Freeman and Company, New York, U.S.A. pp.
261 –325.
Day, L., 2013. Proteins from land plants – Potential resources for human nutrition
and food security. Trends Food Sci. Technol. 32, 25–42.
Elgeti, D., Nordlohne, S.D., Föste, M., Besl, M., Linden, M.H., Heinz, V., Jekle, M.,
Becker, T., 2014. Volume and texture improvement of gluten-free bread using
quinoa white flour. J. Cereal Sci. 59, 41–47.
Friedman, M., 1999. Chemistry, biochemistry, nutrition, and microbiology of
lysinoalanine, lanthionine, and histidinoalanine in food and other proteins. J.
Agric. Food Chem. 47, 1295–1319.
German, B., Damodaran, S., Kinsella, J.E., 1982. Thermal dissociation and
association behavior of soy proteins. J. Agric. Food Chem. 30, 807–811.
Handa, A., Takahashi, K., Kuroda, N., Froning, G.W., 1998. Heat-induced egg white
gels as affected by pH. J. Food Sci. 63, 403–407.

Chapter 9
228
Hermansson, A.-M., 1979. Aggregation and Denaturation Involved in Gel Formation
- Chapter 5. In: Pour-El, A. (Ed.), Functionality and Protein Structure. American
Chemical Society, Washington D.C., U.S.A. pp, 281-304
Hirose, M., 1993. Molten globule state of food proteins. Trends Food Sci. Technol.
4, 48–51.
Hu, H., Fan, X., Zhou, Z., Xu, X., Fan, G., Wang, L., Huang, X., Pan, S., Zhu, L.,
2013. Acid-induced gelation behavior of soybean protein isolate with high
intensity ultrasonic pre-treatments. Ultrason. Sonochem. 20, 187–95.
Jiang, J., Chen, J., Xiong, Y.L., 2009. Structural and emulsifying properties of soy
protein isolate subjected to acid and alkaline pH-shifting processes. J. Agric.
Food Chem. 57, 7576–83.
Kim, K.S., Kim, S., Yang, H.J., Kwon, D.Y., 2004. Changes of glycinin
conformation due to pH, heat and salt determined by differential scanning
calorimetry and circular dichroism. Int. J. Food Sci. Technol. 39, 385–393.
Kinsella, J.E., 1982. Relationships between structure and functional properties of
food proteins, in: Fox, P.F., Condon, J.J. (Eds.), Food Proteins 1. Applied
Science Publishers Ltd, Barking, UK, pp. 51–103.
Kinsella, J.E., Rector, D.J., Phillips, L.G., 1994. Physicochemical properties of
proteins: Texturization via gelation, glass and film formation, in: Yada, R.Y.,
Jackman, R.L., Smith, J.L. (Eds.), Protein Structure-Function Relationships in
Foods. Springer US, Boston, MA, pp. 1–21.
Mäkinen, O.E., Arendt, E.K., 2014. Functional and acid gelation properties of quinoa
protein isolate: influence of heat-denaturation pH. Manuscript.
Mäkinen, O.E., Hager, A.-S., Arendt, E.K., 2014. Localisation and development of
proteolytic activities in quinoa (Chenopodium quinoa) seeds during germination
and early seedling establishment. J. Cereal Sci. In press.
Marcone, M.F., 1999. Biochemical and biophysical properties of plant storage
proteins. Food Res. Int. 32, 79–92.
Marcone, M.F., Kakuda, Y., Yada, R.Y., 1998. Salt-soluble seed globulins of
dicotyledonous and monocotyledonous plants II. Structural characterization.
Food Chem. 63, 265–274.
Marcone, M.F., Yada, R.Y., Kakuda, Y., 1997. Evidence for a molten globule state
in an oligomeric plant protein. Food Chem. 60, 623–631. doi:10.1016/S0308-
8146(97)00043-5

Chapter 9
229
Petruccelli, S., Añón, M.C., 1996. pH-induced modifications in the thermal stability
of soybean protein isolates. J. Agric. Food Chem. 44, 3005–3009.
Prabakaran, S., Damodaran, S., 1997. Thermal unfolding of β-
lactoglobulin: Characterization of initial unfolding events responsible for heat-
induced aggregation. J. Agric. Food Chem. 45, 4303–4308.
Prego, I., Maldonado, S., Otegui, M., 1998. Seed Structure and Localization of
Reserves in Chenopodium quinoa. Ann. Bot. 82, 481–488.
Ranhotra, G.S., Gelroth, J.A., Glaser, B.K., Lorenz, K.J., Johnson, D.L., 1992.
Composition and protein nutritional quality of quinoa. Cereal Chem. 70, 303-
305.
Rayner, M., Timgren, A., Sjöö, M., Dejmek, P., 2012. Quinoa starch granules: a
candidate for stabilising food-grade Pickering emulsions. J. Sci. Food Agric. 92,
1841–7.
Renkema, J.M.., Lakemond, C.M.., de Jongh, H.H.., Gruppen, H., van Vliet, T.,
2000. The effect of pH on heat denaturation and gel forming properties of soy
proteins. J. Biotechnol. 79, 223–230.
Schurer, F., Kieffer, R., Wieser, H., Koehler, P., 2007. Effect of hydrostatic pressure
and temperature on the chemical and functional properties of wheat gluten II.
Studies on the influence of additives. J. Cereal Sci. 46, 39–48.
Tani, F., Murata, M., Higasa, T., Goto, M., Kitabatake, N., Doi, E., 1995. Molten
globule state of protein molecules in heat-induced transparent food gels. J.
Agric. Food Chem. 43, 2325–2331.
Utsumi, S., Damodaran, S., Kinsella, J.E., 1984. Heat-induced interactions between
soybean proteins: preferential association of 11S basic subunits and .beta.
subunits of 7S. J. Agric. Food Chem. 32, 1406–1412.
Visschers, R.W., de Jongh, H.H.J., 2005. Disulphide bond formation in food protein
aggregation and gelation. Biotechnol. Adv. 23, 75–80.
Wang, C.H., Damodaran, S., 1990. Thermal Destruction of Cysteine and Cystine
Residues of Soy Protein under Conditions of Gelation. J. Food Sci. 55, 1077–
1080.
Whitaker, J.R., Feeney, R.E., 1983. Chemical and physical modification of proteins
by the hydroxide ion. Crit. Rev. Food Sci. Nutr. 19, 173–212.

Chapter 9
230
Wolf, W.J., 1993. Sulfhydryl content of glycinin: effect of reducing agents. J. Agric.
Food Chem. 41, 168–176.

Chapter 10
231
Chapter 10
General discussion

Chapter 10
232
10.1 Germination of quinoa and its application
Quinoa seeds are perispermic with highly compartmentalised storage
reserves. The main starch reserve is located in the perisperm, and the protein and
lipid bodies are found in the embryonic tissues. An endosperm is present only in the
micropylar region, surrounding the tip of the radicle (Prego et al., 1998). Quinoa
germinates very fast after being exposed to water. The majority of the seeds showed
radicle protrusion 6-10 h after imbibition at 15°C, after the seeds had reached a
moisture level between 41 and 45% (Mäkinen et al., 2014a/Chapter 5). The radicle
also expanded rapidly, reaching a length of 5 mm and 35 mm after 24 and 72 h,
respectively (Hager et al., 2014/Chapter 4). Very fast germination (<24 h) is a trait
found in some seeds from high-stress habitats. Most of the known species belong in
the former Chenopodiaceae family, like quinoa (Parsons, 2012).
A dry, non-germinating quinoa seed is characterised by a very low α-amylase
activity, undetectable lipolytic activity and a very high proteolytic activity (Mäkinen
et al., 2013/Chapter 6). The proteolytic activity is comparable to the level found in
malted barley, that arises only after 3-5 d of germination (Mäkinen and Arendt,
2012). When the enzyme activities were measured separately in the anatomical parts
of the seeds, it was observed that a low level of α-amylase activity was present in the
embryo of non-germinating seeds, but emerged in the perisperm only after 24 h.
After this point, a sharp increase in activity in both tissues occurred (Hager et al.,
2014/Chapter 4). The overall level of the activity however remained extremely low
compared to traditional malting cereals barley and wheat, or even oat (Mäkinen and
Arendt, 2012).
Quinoa seeds have an endosperm only in the micropylar region. In some
seeds, this tissue controls dormancy and germination by acting as a physical barrier

Chapter 10
233
that prevents the radicle from penetrating from protruding (Bewley, 1997; Finch-
Savage and Leubner-Metzger, 2006). In order for germination to occur, the
mechanical strength of the micropylar endosperm cap has to be weakened by
autolysis of cell-wall polysaccharides and proteins (Morris et al. 2011, Finch-Savage
and Leubner-Metzger, 2006). The endosperm dissected from dry, non-germinating
quinoa seeds was highly proteolytic with a 60-fold activity compared to the embryo
(Mäkinen et al., 2014a/Chapter 5). This is likely to be one reason for the extremely
high proteolytic activity observed for the whole seeds before germination (Mäkinen
et al., 2013/Chapter 6). The proteolytic activity in the endosperm increased until 24
hai after which it declined. In the embryo where the protein storage vacuoles are
mainly found, both the quality and quantity of proteolytic activities remained nearly
unchanged over the course of germination (Mäkinen et al., 2014a/Chapter 5).
It has to be noted that activities measured in homogenised tissue extracts may
not reflect in planta activity, because the enzyme might be inactive under the
physiological conditions in the seed at that stage of development, or simply not
contact with the substrate due to compartmentation (Bewley and Black, 1994a;
Müntz, 1996; van der Hoorn et al., 2004). Still, the high proteolytic activity in the
endosperm is not necessarily related to storage protein mobilisation because the
storage proteins are mainly located in the embryo. Instead, the results suggest these
activities may have a role in endosperm weakening and thus, the regulation of
germination. This is also supported by the observed influence abscisic acid (ABA), a
plant hormone that regulates the induction and maintenance of dormancy: the
presence of ABA led to a lower proteolytic activity in the endosperm after 24 h, and
increased the occurrence of abnormally germinated seeds, where endosperm rupture
did not occur (Mäkinen et al., 2014a/Chapter 5).

Chapter 10
234
In true cereals (monocotyledonous seed crops), proteolytic enzymes are
generally either absent or very low in non-germinated seeds, and arise after 2-3 h of
germination in e.g. barley, rye and oat (Brijs et al., 2002; Wrobel and Jones, 1992;
Mikola et al. 2002). These studies also show that seeds that are taxonomically and
anatomically distant from conventional malting cereals may show very different
patterns in enzyme activity development during germination. The use of standard
methods in malting and brewing research that have been developed for barley should
be done with caution when dealing with different grains.
Malted barley and wheat were widely used for the adjustment for α-amylase
activity in baking flours before the rise of commercial fungal amylases (Briggs,
1998). They are also used in some baked goods as sources for starch-degrading
enzymes to increase the volume and shelf-life in baked goods, or to alter the
rheological properties of dough due to proteolysis (Mäkinen and Arendt, 2012).
Similar use in a gluten-free bread formulation was tested with malted quinoa (24 h)
and oat (Mäkinen et al., 2013/Chapter 6). These two malts had similar proteolytic
activities but the α-amylase activity of oat malt was vastly higher than that of quinoa
malt. Oat malt improved the volume and crumb grain of the bread but quinoa malt
had no influence of any of the parameters. As the two malts had similar proteolytic
activities, it appeared that α-amylase was the key to the improved bread quality.
Generally, proteolytic enzymes have a favourable influence on gluten-free
bread because proteolysis enhances the foaming properties of proteins (Renzetti and
Arendt, 2009a, 2009b). The recipe used in this study however contained whey
protein isolate (WPI), a protein mixture with a very high foaming capacity. The
influence of WPI may have hidden any effect from quinoa or oat malt proteases
(Mäkinen et al., 2013/Chapter 6). Also, as the proteolytic activity was very high in

Chapter 10
235
nongerminated seeds and did not increase dramatically, germination may not be
necessary if proteolytic activity is desired for a technological purpose. Also it has to
be considered that in addition to the amylolytic activities remaining low, the radicle
has reached a considerable length by the time the activities start to increase. In terms
of food applications, this would mean a high malting loss if the radicles are removed,
as is the practise with malts. This would suggest that germinating quinoa for an
amylase source for food applications would not be feasible.
10.2 Plant milks and quinoa protein properties
Plant-based milk substitutes (“plant milks”) are suspensions of dissolved and
disintegrated plant material that resemble cow’s milk in appearance. They are
manufactured by extracting the plant material in water, separating the liquid and
formulating the final product, or alternatively reconstituted from protein isolates and
other ingredients (Debruyne, 2006; Mäkinen et al., 2014b/Chapter 2). This base
product can be further processed into other dairy type product e.g. the manufacture of
a yoghurt-type product by fermentation. A market overview (Table 2.8) showed that
commercially available plant milks vary remarkably in their nutritional profiles,
especially in terms of protein content that was very low in most products (Mäkinen et
al., 2014b/Chapter 2). Also, the physicochemical properties of these products varied;
the particles are generally larger and more polydisperse compared to cow’s milk,
which leads to higher sedimentation rates (Mäkinen et al., 2015/Chapter 7). Upon
acidification with glucono-δ-lactone (GDL), cow’s milk and beverages made from
soy and quinoa formed structured gels.
When grains that are high in starch are used as raw material, starch forms a
thick slurry when the mixture is heated above the gelatinisation temperature (55-65

Chapter 10
236
°C). To prevent this in the further processing steps, starch has to be gelatinised and
liquefied with α-amylase or a malt enzyme extract (Mitchell and Mitchell, 1990;
Tano-Debrah et al., 2005). Starch gelatinisation limits the flour-to-water ratio that
can be used for milk extraction, and thus the protein content of the final product. In
order to explore the possibility of the reconstitution approach to achieve a beverage
with a higher protein content, a protein isolate was prepared and studied for
functional and acid gelation properties.
A milling fraction enriched in embryo that had a protein content of 27.4%
after defatting was used for protein extraction. The resulting protein isolate (QPI) had
a protein content of 91.3% and an amino acid composition similar to that of
chenopodin (11S). Also the electrophoretic profile showed clearly that the main
proteins present were 11S type globulins (Mäkinen and Arendt, 2014c/Chapter 8).
The study showed that the heat-denaturation pH influences the functional and acid
gelation properties of QPI strongly. Heating QPI at pH 8.5 increased the surface
hydrophobicity and subsequently reduced solubility and viscosity, whereas heat-
denaturation at pH 10.5 increased the solubility and emulsifying activity strongly.
Solutions heated at pH 8.5 formed a coarse coagulum with maximum G' of 5 Pa
when acidified with GDL. Heat-induced denaturation at 10.5 enabled the proteins to
form a finer and regularly structured strong gel with a maximum G' > 1000 Pa. A
possible explanation for this large variation in behaviour is the differences in the
nature of aggregates that are formed during heating.
When the changes occurring during denaturation at various pH was studied in
more detail, it was confirmed that the mechanism of denaturation and aggregation
indeed varied with pH. Heating triggered the disruption of the disulphide bonds
connecting the acidic and basic chains of the chenopodin subunits at pH 8.5 and 10.5,

Chapter 10
237
but these remained intact at pH 6.5. At pH 6.5 and 8.5, rapid formation of mainly
disulphide-bound aggregates occurred, but the proteins appeared to remain soluble at
pH 10.5 (Mäkinen et al., 2014d/Chapter 9). However the quantity of free sulfhydryl
groups decreased during heating also at pH 10.5 but due to the apparent lack of
disulphide-driven aggregation, it is possible that these groups were destroyed at
highly alkali pH (Wang and Damodaran, 1990).
Coarse and granular appearance of a gel indicates strong aggregation due to
more protein-protein interactions (Renkema et al., 2000). More aggregation does not
necessarily mean stronger gelation, as gel formation depends on the balance of
attractive and repulsive forces: if attractive forces dominate, a randomly aggregated
coagulum unable to trap water may be formed (Hermansson, 1979; Kinsella et al.,
1994). Also the suppression of aggregation during denaturation enables the formation
of a fine network compared to a system where unfolding and random aggregation
occur simultaneously (Hermansson, 1979). Both the higher solubility of the proteins
and lack of disulfide bonding may retard aggregation. When this system is acidified,
the particles are cross-linked in a manner that leads to the formation of a fine and
regular network structure.
All in all, processing conditions of quinoa proteins influence their functionality
strongly. Native quinoa protein isolate has a rather low solubility and does not gel
upon acidification, but these factors can be enhanced by modification. Highly
alkaline processing however may carry health risks due to the potential formation of
“unnatural amino acids” such as lysinoalanine. The formation of these amino acids as
well as alternative ways to modify the functionality of proteins require further
studies. These results show that quinoa protein can form structures and act as a
decent emulsifier under certain conditions. Further studies are needed to get more

Chapter 10
238
detailed information about the gelation mechanism and the required pre-treatments.
Also other means of structural modification should be explored, e.g., enzymatic
cross-linking and limited hydrolysis. Quinoa protein has a balanced amino acid
profile and a high biological value (Ranhotra et al., 1992), which is exceptional in the
plant kingdom. Because of this, quinoa would make an interesting raw material for
gelled or emulsified dairy-type products.
10.3 Future outlook
It would be interesting to study how changes occurring during germination
influence the functional and gelation properties of proteins. Elkhalifa and Bernhardt
(2010) observed and increase in solubility, emulsifying activity and stability, and
foaming capacity of sorghum flour as a result of germination. There would however
be some practical considerations: the protein content of an isolate produced out of
whole seeds is rather low at 64%. A high protein content isolate (91%) was only
obtained when defatted embryo-rich milling fraction was used for the extraction
procedure (Mäkinen et al., 2014c/Chapter 8). This milling fraction can be produced
from dry, non-germinated seeds but the embryo elongates rapidly during germination
and becomes very fragile when the germinated seeds are dried. The application of
milling and sieving techniques are most likely not suitable for such material. Other
approaches do however exist if a high protein isolate is desired: a crude isolate can
be purified with other methods such as ultrafiltration and ion exchange (Moure et al.,
2006; Tzeng et al., 1988).
Because the different tissues of quinoa have a very different composition,
fractionation offers interesting potential. Although quinoa is not a protein crop per
se, the embryo-enriched milling fraction has a significant protein content. Both the

Chapter 10
239
sustainability and economic feasibility of isolating protein from quinoa depends on
the other uses of non-protein fractions (Aiking, 2011). For example, the starchy
perisperm fraction appears to be well suitable for the production of gluten-free bread
(Elgeti et al., 2014). Also, the very small diameter and unimodal size distribution of
quinoa starch offers some applications, such as the stabilisation of Pickering
(particle-stabilised) emulsions in food, cosmetic or pharmaceutical applications, or
microencapsulation of e.g. flavouring (Rayner et al., 2012; Tari et al., 2003).
References
Aiking, H., 2011. Future protein supply. Trends Food Sci. Technol. 22, 112–120.
Briggs, D.E., 1998. Malts and Malting. Blackie Academic and Professional, London,
UK.
Brijs, K., Trogh, I., Jones, B.L., Delcour, J.A., 2002. Proteolytic Enzymes in
Germinating Rye Grains. Cereal Chem. 79, 423–428.
Debruyne, I., 2006. Soy base extract: soymilk and dairy alternatives, in: Riaz, M.N.
(Ed.), Soy Applications in Foods. Taylor & Francis, Boca Raton, Florida,
U.S.A, pp. 111–134.
Elgeti, D., Nordlohne, S.D., Föste, M., Besl, M., Linden, M.H., Heinz, V., Jekle, M.,
Becker, T., 2014. Volume and texture improvement of gluten-free bread using
quinoa white flour. J. Cereal Sci. 59, 41–47.
Elkhalifa, A.E.O., Bernhardt, R., 2010. Influence of grain germination on functional
properties of sorghum flour. Food Chem. 121, 387–392.
Hager, A.-S., Makinen, O.E., Arendt, E.K., 2014. Amylolytic activities and starch
reserve mobilization during the germination and early seedling establishment in
quinoa. Eur. Food Res. Technol, in press.
Hermansson, A.-M., 1979. Aggregation and Denaturation Involved in Gel Formation
- Chapter 5. In: Pour-El, A. (Ed.), Functionality and Protein Structure. American
Chemical Society, Washington D.C., U.S.A. pp, 281-304
Kinsella, J.E., Rector, D.J., Phillips, L.G., 1994. Physicochemical properties of
proteins: Texturization via gelation, glass and film formation, in: Yada, R.Y.,
Jackman, R.L., Smith, J.L. (Eds.), Protein Structure-Function Relationships in
Foods. Springer US, Boston, MA, pp. 1–21.

Chapter 10
240
Mäkinen, O.E., Arendt, E.K., 2012. Oat malt as a baking ingredient – A comparative
study of the impact of oat, barley and wheat malts on bread and dough
properties. J. Cereal Sci. 56, 747–753.
Mäkinen, O.E., Zannini, E., Arendt, E.K., 2013. Germination of oat and quinoa and
evaluation of the malts as gluten free baking ingredients. Plant Foods Hum.
Nutr. 68, 90–5.
Mäkinen, O.E., Hager, A.., Arendt, E.K., 2014a. Localisation and development of
proteolytic activities in quinoa (Chenopodium quinoa) seeds during germination
and early seedling establishment. J. Cereal Sci, in press/Chapter 5.
Mäkinen, O.E., Wanhalinna, V., Zannini, E., Arendt, E.K., 2014b. Foods for special
dietary needs: Non-dairy plant based milk substitutes and fermented dairy type
products. Crit. Rev. Food Sci. Nutr, In press.
Mäkinen, O.E., Uniacke-Lowe, T., O’Mahony, J.A., Arendt, E.K., 2015.
Physicochemical and acid gelation properties of commercial UHT-treated plant-
based milk substitutes and lactose free bovine milk. Food Chem. 168, 630–638.
Chapter 7.
Mäkinen, O.E., Arendt, E.K., 2014c. Functional and acid gelation properties of
quinoa protein isolate: influence of heat-denaturation pH. Manuscript/Chapter
8.
Mäkinen, O.E., Koehler, P., Arendt, E.K., 2014d. Heat-denaturation and aggregation
of quinoa (Chenopodium quinoa) globulins: influence of pH.
Manuscript/Chapter 9.
Mitchell, C.R., Mitchell, P.R., 1990. Nutritional rice milk product. United States
Patent No. 4894242.
Moure, A., Domínguez, H., Parajó, J.C., 2006. Antioxidant properties of
ultrafiltration-recovered soy protein fractions from industrial effluents and their
hydrolysates. Process Biochem. 41, 447–456.
Prego, I., Maldonado, S., Otegui, M., 1998. Seed Structure and Localization of
Reserves in Chenopodium quinoa. Ann. Bot. 481–488.
Rayner, M., Timgren, A., Sjöö, M., Dejmek, P., 2012. Quinoa starch granules: a
candidate for stabilising food-grade Pickering emulsions. J. Sci. Food Agric. 92,
1841–7.
Renkema, J.M.., Lakemond, C.M.., de Jongh, H.H.., Gruppen, H., van Vliet, T.,
2000. The effect of pH on heat denaturation and gel forming properties of soy
proteins. J. Biotechnol. 79, 223–230.
Renzetti, S., Arendt, E.K., 2009a. Effect of protease treatment on the baking quality
of brown rice bread: From textural and rheological properties to biochemistry
and microstructure. J. Cereal Sci. 50, 22–28.

Chapter 10
241
Renzetti, S., Arendt, E.K., 2009b. Effects of oxidase and protease treatments on the
breadmaking functionality of a range of gluten-free flours. Eur. Food Res.
Technol. 229, 307–317.
Tano-Debrah, K., Asiamah, K., Sakyi-Dawson, E., Budu, A., 2005. Effect of malt
enzyme treatment on the nutritional and physicochemical characteristics of
cowpea-peanut milk., in: Proceedings of the 1st International Edible Legume
conference/IVth World Cowpea Congress. Durban, South Africa.
Tari, T.A., Annapure, U.S., Singhal, R.S., Kulkarni, P.R., 2003. Starch-based
spherical aggregates: screening of small granule sized starches for entrapment
of a model flavouring compound, vanillin. Carbohydr. Polym. 53, 45–51.
Tzeng, Y.-M., Diosady, L.L., Rubin, L.J., 1988. Preparation of Rapeseed Protein
Isolate by Sodium Hexametaphosphate Extraction, Ultrafiltration, Diafiltration,
and Ion-Exchange. J. Food Sci. 53, 1537–1541.
Wang, C.H., Damodaran, S., 1990. Thermal Destruction of Cysteine and Cystine
Residues of Soy Protein under Conditions of Gelation. J. Food Sci. 55, 1077–
1080.
Wrobel, R., Jones, B.L., 1992. Appearance of Endoproteolytic Enzymes during the
Germination of Barley. Plant Physiol. 100, 1508–1516.

Appendix
242
Appendix
Publications, abstracts and awards

Appendix
243
Peer-reviewed publications
Mäkinen, O.E, Arendt, E.K. Non-brewing applications of malted cereals,
pseudocereals and legumes – A review. Submitted manuscript.
Mäkinen, O.E., Koehler, P. and Arendt, E.K. 2014. Heat-denaturation and
aggregation of quinoa (Chenopodium quinoa) globulins: influence of pH.
Submitted manuscript.
Mäkinen, O.E. and Arendt, E.K. 2014. Functional and acid gelation properties of
quinoa protein isolate: influence of denaturation and pH. Submitted manuscript.
Mäkinen, O.E., Uniacke-Lowe, T., O’Mahony, J.A., Arendt, E.K., 2015.
Physicochemical and acid gelation properties of commercial UHT-treated plant-
based milk substitutes and lactose free bovine milk. Food Chem. 168, 630–638.
Mäkinen, O.E., Hager, A-S., Water, D.M. and Arendt, E.K. 2013. Localisation and
development of proteolytic activities in germinating quinoa (Chenopodium
quinoa) seeds. J. Cereal Sci, in press.
Hager, Α-S., Mäkinen, O.E.*, Arendt, E.K. 2013. Amylolytic activities and starch
reserve mobilization in germinating Chenopodium quinoa. Eur. Food Sci.
Technol. 239, 621-627.
Mäkinen, O.E., Wanhalinna, V., Zannini, E. and Arendt, E. 2013. Foods for special
dietary needs: Non-dairy plant based milk substitutes and fermented dairy type
products. Critical Reviews in Food Science and Nutrition, in press.
Mäkinen, O.E., Zannini, E. and Arendt, E. 2013. Germination of oat and quinoa
and evaluation of the malts as gluten free baking ingredients. Plant Food Hum.
Nutr. 68, 90-95.

Appendix
244
Conference abstracts
Mäkinen O.E., Hager A-S. and Arendt E.K. 2013. Hydrolytic enzyme activities
and the mobilisation of starch and protein reserves in Chenopodium
quinoa. 42nd Annual Food Research Conference, Dublin, Ireland, June 2013 (oral
presentation). Best oral presentation (runner-up) prize.
Mäkinen, O.E., Uniacke-Lowe, T., O’Mahony, J.A. and Arendt, E.K. 2013. Physical
stability and acid gelation properties of plant-based milk substitutes. C&E Spring
Meeting, Leuven, Belgium, May 2013 (oral presentation).
Mäkinen O.E., Hager A-S. and Arendt E.K. 2013. Mobilisation of starch and
protein reserves and the development of related enzyme activities in
Chenopodium quinoa. 3rd international Symposium on Gluten Free, Vienna,
Austria, June 2013. Poster presentation.
Mäkinen O.E., Hager A-S. and Arendt E.K. 2013. Investigation on the
mobilisation of starch and protein reserves and the development of related
enzyme activities in Chenopodium quinoa. 12th European Young Cereal
Scientists and Technologists Workshop, Nottingham, United Kingdom, April 2013.
Oral presentation.
Mäkinen, O.E., Oliveira, P. and Arendt, E. 2012. Use of confocal laser scanning
and scanning electron microscopy in cereal science. Proceedings of the
Microscopic Society of Ireland Annual Symposium. August, 29-31st. Poster
presentation.

Appendix
245
Oral presentations delivered
Mäkinen O.E., Hager A-S. and Arendt E.K. 2013. Hydrolytic enzyme activities
and the mobilisation of starch and protein reserves in Chenopodium
quinoa. 42nd Annual Food Research Conference, Dublin, Ireland, June 2013 (oral
presentation). Best oral presentation (runner-up) prize.
Mäkinen, O.E., Uniacke-Lowe, T., O’Mahony, J.A. and Arendt, E.K. 2013. Physical
stability and acid gelation properties of plant-based milk substitutes. C&E Spring
Meeting, Leuven, Belgium, May 2013 (oral presentation).
Mäkinen O.E., Hager A-S. and Arendt E.K. 2013. Investigation on the
mobilisation of starch and protein reserves and the development of related
enzyme activities in Chenopodium quinoa. 12th European Young Cereal
Scientists and Technologists Workshop, Nottingham, United Kingdom, April 2013.
Oral presentation.
Mäkinen, O.E. and Arendt, E. 2012. Malted oat as an ingredient in wheat and
gluten-free baking. 11th European Young Cereal Scientists and Technologists
Workshop. May, 9-11th, Barcelona, Spain. Oral presentation.
Awards
Best oral presentation award (runner-up), 42nd Annual Food Research
Conference June 2013, Taegasc, Dublin, Ireland