Host Responses to Intestinal Microbial Antigens in Gluten-Sensitive Mice
Upload
khangminh22Category
view
1download
0
biomolecules
Article
Comparative Characterization of Gluten andHydrolyzed Wheat Proteins
Angelika Miriam Gabler 1 and Katharina Anne Scherf 1,2,*1 Leibniz-Institute for Food Systems Biology at the Technical University of Munich, 85354 Freising, Germany;
[email protected] Department of Bioactive and Functional Food Chemistry, Institute of Applied Biosciences,
Karlsruhe Institute of Technology (KIT), 76131 Karlsruhe, Germany* Correspondence: [email protected]; Tel.: +49-721-6084-4176
Received: 21 July 2020; Accepted: 19 August 2020; Published: 24 August 2020�����������������
Abstract: Hydrolyzed wheat proteins (HWPs) are widely used as functional ingredients in foods andcosmetics, because of their emulsifying and foaming properties. However, in individuals sufferingfrom celiac disease or wheat allergy, HWPs may have a modified immunoreactivity compared tonative gluten due to changes in molecular structures. Although a variety of HWPs are commerciallyavailable, there are no in-depth comparative studies that characterize the relative molecular mass(Mr) distribution, solubility, and hydrophilicity/hydrophobicity of HWPs compared to native gluten.Therefore, we aimed to fill this gap by studying the above characteristics of different commercialHWP and gluten samples. Up to 100% of the peptides/proteins in the HWP were soluble in aqueoussolution, compared to about 3% in native gluten. Analysis of the Mr distribution indicated thatHWPs contained high percentages of low-molecular-weight peptides/proteins and also deamidatedglutamine residues. We also found considerable differences between the seven HWPs studied, so thateach HWP needs to be studied in detail to help explain its potential immunoreactivity.
Keywords: celiac disease; gel electrophoresis; gliadin; gluten; high-performance liquidchromatography (HPLC); hydrolyzed wheat proteins; wheat allergy
1. Introduction
Wheat gluten is the viscoelastic mass that remains when starch and other water-soluble componentsare washed out of wheat dough [1]. According to Codex Standard 163–1987, wheat gluten consistsof >80% protein, 5–10% lipids, and residues of starch and non-starch polysaccharides [2]. The term“gluten” describes a mixture of over 100 different proteins with a mono-, oligo-, or polymeric structure.Oligomeric and polymeric proteins consist of monomers linked by interchain disulfide bonds. Glutenproteins contain high amounts of glutamine (Gln/Glu: 37.1 mol-% in gliadins, 30.1 mol-% in glutenins)and proline (16.6 mol-% in gliadins, 11.9 mol-% in glutenins) as well as low amounts of amino acidswith charged side chains, such as lysine (0.8 mol-% in gliadins, 2.1 mol-% in glutenins) [1,3]. Accordingto the so-called Osborne fractionation, gluten proteins can be divided into two protein fractionsdepending on their solubility, the gliadins and the glutenins. Gliadins are soluble in 60% ethanol,whereas glutenins remain insoluble [4,5]. Furthermore, gluten proteins can be subdivided by sodiumdodecyl sulfate-polyacrylamide gel electrophoresis (SDS-PAGE) or reversed-phase high-performanceliquid chromatography (RP-HPLC) into gluten protein types: α-, γ-, ω1,2-, and ω5-gliadins andhigh- and low-molecular-weight glutenin subunits (HMW-GS and LMW-GS) [5–7].
Gliadins consist of mostly monomeric and glutenins of oligomeric and polymeric proteins.Gluten is responsible for the unique baking properties of wheat flour, by building a viscoelastic gluten
Biomolecules 2020, 10, 1227; doi:10.3390/biom10091227 www.mdpi.com/journal/biomolecules

Biomolecules 2020, 10, 1227 2 of 15
network [1,7]. Wheat gluten is often used as an ingredient to improve and standardize the bakingproperties of wheat flours [1,8].
Furthermore, gluten is also used in various non-cereal products, in which the consumer generallydoes not expect gluten to be present. For example, wheat gluten is used as binding or protein-enrichingagent in meat products or even cosmetics [9,10]. To improve wheat gluten solubility, it is treatedin different chemical and biochemical ways, leading to modifications and/or partial hydrolysis.Deamidation of proteins takes place during hydrolysis with acid or alkali. In the case of enzymatichydrolysis, the deamidation depends on the enzyme used [8–10]. Hydrolysis leads to the formation ofproteins or peptides with lower relative molecular masses (Mr) and deamidation to changes of the netcharge. Both processes increase the solubility of gluten. Treatment with alkali removes intermoleculardisulfide bonds, but usually, it does not lead to a cleavage of peptide bonds [8,11]. Sodium hydroxideis typically used for alkaline hydrolysis; hydrochloric acid or sulfuric acid for acidic hydrolysis; andenzymes like papain, trypsin, and pronase for enzymatic hydrolysis [8,12,13]. Furthermore, glutencan be modified by physical means, like high-pressure processing, heat treatment, extrusion, and UVirradiation [8,14,15].
Wheat is one of the most common foods that may cause adverse reactions, such as celiacdisease, non-celiac gluten sensitivity, and wheat allergy. Celiac disease is a chronic small intestinalimmune-mediated enteropathy in genetically predisposed individuals, caused by the ingestion ofgluten. Its estimated prevalence is about 1% of the population worldwide, with 0.7% reported basedon biopsy-confirmed cases and 1.4% reported based on seroprevalence [16]. Wheat allergy has aprevalence of 0.2–1% and is defined as an adverse immune response, with intestinal and extraintestinalsymptoms occurring within minutes or hours after exposition [17]. Thereby, the exposition triggeringthe immunoglobulin E (IgE)-mediated allergy can be through inhalation, skin contact, or oral ingestion.Wheat allergy can be classified into immediate food allergy, wheat-dependent exercise-inducedanaphylaxis (WDEIA), respiratory allergy, and skin allergy. Gluten proteins and inhibitors in wheathave been identified to play a key role in wheat allergy [17,18]. WDEIA is a cofactor-triggeredwheat allergy and is subdivided into conventional-WDEIA (CO-WDEIA) and hydrolyzed wheatprotein-WDEIA (HWP-WDEIA). In CO-WDEIA, patients react to native gluten proteins, whereas inHWP-WDEIA, patients are sensitized to HWP but tolerate native gluten. This underlines that hydrolysisaffects the immunoreactivity of wheat proteins [19]. Allergic reactions to soap and cosmetics containingHWPs were reported [20,21]. Parts of the relevant immunoreactive epitopes are already pre-existent innative wheat protein aggregations and are laid bare through hydrolysis but not destroyed. Besides,new epitopes may be created through hydrolysis and simultaneous deamidation [20,21]. Additionally,the increased solubility of the HWP and the route of exposure also affects the immunoreactivity of HWPcompared to the native form. Consequently, the degree and type of hydrolysis play an important role,because this could affect the transport through natural barriers, such as the small intestinal epitheliumor the skin [19–22].
Gluten is used as the starting material for the production of HWP, which may also be calledpartially hydrolyzed gluten to better reflect this. There are various methods of how gluten can behydrolyzed, including chemical, biochemical, and physical approaches, leading to highly variablepreparations of HWP. In most cases, the functional properties of the HWP were described as emulsifyingor foaming [8,23]. Additionally, the sensory properties were analyzed as well as the use of HWP as anutritional additive. When characterizing the proteins and peptides in HWP, biochemical analyses, suchas enzyme-linked immunosorbent assays (ELISAs) or Western blots, are widely used [23–30]. However,there are only few studies on commercially available HWP compared to native gluten. Gessendorferet al. (2009) prepared three enzymatically hydrolyzed prolamins from wheat, rye, and barley andcharacterized the resulting HWP using ELISA, SDS-PAGE, and RP-HPLC [31]. Wieser and Scherfdeveloped a well-characterized HWP for diagnosis and clinical investigations of wheat-relateddisorders [32], but comprehensive comparative investigations on commercially available HWP are

Biomolecules 2020, 10, 1227 3 of 15
missing. Additionally, the detection of modified gluten proteins can be done with ELISA or polymerasechain reaction (PCR) [9,33–35].
Considering the differences between HWP and native gluten in terms of immunoreactivity, it isreasonable to hypothesize that various treatments cause changes in the molecular structures of gluten.Consequently, there is a need to characterize commercial HWP in comparison to native gluten. In thepresent study, gluten and commercially available HWP products were analyzed for their crude proteincontents, solubility, and Mr distribution of the proteins and peptides as well as the contents of freeammonium as an indicator for deamidation.
2. Materials and Methods
2.1. Reagents and Materials
All reagents and chemicals were from Merck (Darmstadt, Germany), Sigma-Aldrich(Darmstadt, Germany), Serva (Heidelberg, Germany), Applichem (Darmstadt, Germany), Carl Roth(Karlsruhe, Germany), Honeywell (Offenbach, Germany), and J.T. Baker (Arnhem, Netherlands) inanalytical grade or higher. Ultra-pure water for HPLC was purified with an Arium 611VF waterpurification system (Sartorius, Goettingen, Germany). Prolamin Working Group (PWG)-gliadin wasused for calibration, which is well suited to quantitate all types of different wheat proteins [5,7,36].Wheat gluten and HWP were obtained from Hermann Kröner GmbH (Ibbenbueren, Germany),Sigma-Aldrich (Darmstadt, Germany), Mühle Schlingemann (Waltrop, Germany), Tereos (Lille, France),Solabia Group (Pantin, France) Manildra Group (Gladesville, Australia), Golden Peanut GmbH(Garstedt, Germany), Reform- und Muehlenbaeckerei Boesen GmbH (Langenfeld, Germany), and Tate& Lyle (Aalst, Belgium). Seven HWP (HWP 1–7), six gluten samples (G1–6), and two treatedgluten samples (G7, G8) were purchased. G7 is described as denatured wheat protein with a highprotein content and G8 as a slightly textured product from wheat protein. Protein/peptide markersused for the gel-permeation HPLC were purchased from Sigma-Aldrich (Darmstadt, Germany):β-amylase from sweet potato (200 kDa), albumin from bovine serum (66 kDa), carbonic anhydrasefrom bovine erythrocytes (29 kDa), cytochrome c from horse heart (12.4 kDa), α-lactalbumin (14 kDa),and glutathione (0.3 kDa). Furthermore, a gluten peptide (1.9 kDa) was received from GenescriptBiotech (Piscataway Township, NJ, USA).
2.2. Determination of Crude Protein Contents
The crude protein content of all samples was determined by the combustion method according toDumas (ICC Standard Method No.167). The samples were analyzed using a Leco TruSpec NitrogenAnalyzer (LECO, Mönchengladbach, Germany) to determine the nitrogen content after combustion at950 ◦C. Ethylenediaminetetraacetic acid (EDTA) was used for calibration. The nitrogen content wasmultiplied by the factor 5.7 to calculate the crude protein content (wheat protein, ICC No. 105/2) [7].
2.3. Stepwise Fractionation According to Solubility
The stepwise fractionation according to solubility was performed according to the modifiedOsborne method by Wieser et al. (1998) [5]. Three fractions A, B, and C were received. Fraction A issoluble in aqueous salt solution (0.4 mol/L NaCl, 0.067 mol/L Na2HPO4/KH2PO4, pH 7.6), fractionB is soluble in 60% ethanol (v/v), and fraction C is soluble in 1-propanol/0.05 mol/L Tris/HCl, pH 7.5(50% (v/v), with 2 mol/L (w/v) urea and 0.06 mol/L dithiothreitol, DTT) (glutenin extraction solution).
The gluten samples G1–G8 (20 mg) were first extracted with 3 × 0.5 mL aqueous salt solution toobtain fraction A by vortex mixing for 2 min, followed by stirring at room temperature for 30 min andcentrifugation (25 min, 3750× g, 20 ◦C). The corresponding three supernatants each were united andfilled up with the extraction solution to a volume of 2 mL. The residue was discarded.
In a separate experiment, the gluten samples G1–G8 (20 mg) were extracted with 3 × 1.5 mL60% ethanol (v/v) by 2 min vortex mixing, 30 min stirring at room temperature, and centrifugation

Biomolecules 2020, 10, 1227 4 of 15
(25 min, 3750× g, 20 ◦C). The three supernatants were combined, and the volume was adjusted to5 mL with 60% ethanol. To calculate the content of fraction B, the content of fraction A was deductedfrom the 60% ethanol extract after the RP-HPLC measurement. To extract fraction C, the residue wasextracted three times with 1.5 mL of glutenin extraction solution by vortex mixing for 2 min followedby stirring at 60 ◦C under nitrogen atmosphere for 30 min and centrifugation (25 min, 3750× g, 20 ◦C).The supernatants were united and filled up with the extraction solvent to a volume of 5 mL. All extractswere filtered (0.45 µm) and each sample was analyzed in triplicate (n = 3) [5,7].
HWP1–HWP7 were extracted three times with 0.5 mL aqueous salt solution to obtain fraction A.The residue was subsequently extracted three times with 0.5 mL 60% ethanol (v/v) to obtain fraction B.Then, the residue was extracted three times with 0.5 mL of solution C. All steps were carried out exactlyas described above, except that the final volumes were 2 mL for fractions A, B, and C, respectively.All extracts were filtered (0.45 µm) and each sample was analyzed in triplicate (n = 3) [5,7].
2.4. Reversed-Phase High-Performance Liquid Chromatography (RP-HPLC)
Protein composition and contents in fractions A, B, and C were analyzed by RP-HPLC on a JascoXLC instrument (Jasco, Gross-Umstadt, Germany) using a C18 column at 60 ◦C (AcclaimTM 300, C18,2.1 × 150 mm, 300 nm, 3 µm, Thermo Fisher Scientific, Braunschweig, Germany). The elution solventswere 0.1% trifluorocacetic acid (TFA) in ultra-pure water (A) and 0.1% TFA in acetonitrile (B). Theflow rate was 0.2 mL/min with the following gradient: 0 min 0% B, 0.5 min 24% B, 20 min 56% B,20.1–24.1 90% B, 24.2–30.0 min 0% B. 2) [5,7]. For G 1–8, the injection volume was 20 µL for fraction Aand C and 10 µL for fraction B. For HWP 1–8, it was necessary to vary the injection volumes, becauseof the different protein contents in the fractions (1–20 µL). The absorbance at 210 nm was detected.PWG-gliadin was dissolved in 60% ethanol (v/v) to a concentration of 2.5 mg/mL and used for externalcalibration (50, 37.5, 25, 12.5, and 5 µg absolute) [36]. The limit of quantitation was estimated byinjecting different amounts of PWG-gliadin (12.5, 5.00, 3.75, 2.50, 1.25, 0.50, and 0.25 µg absolute). Theprotein content of PWG-gliadin was 93.1 g/100 g. The software Jasco Chrompass was used for dataanalysis (version 1.2).
2.5. Gel-Permeation High-Performance Liquid Chromatography (GP-HPLC)
To analyze the Mr of proteins and peptides in HWP and treated gluten samples, HWP1–HWP7 andG7,8 were extracted by stepwise fractionation according to solubility. Three fractions I, II, and III werereceived. Fraction I, soluble in aqueous salt solution (0.4 mol/L NaCl, 0.067 mol/L Na2HPO4/KH2PO4,pH 7.6), corresponds to fraction A in Section 2.3. Fraction II, soluble in 60% ethanol, corresponds tofraction B in Section 2.3. Fraction III is a mixture of ultra-pure water and acetonitrile (50/50, v/v) andcorresponds to fraction C in Section 2.3. Each fraction was extracted three times. Fraction I and IIwere extracted from HWP (20.0 mg or 100 mg) as described for fractions A and B in Section 2.3 forHWP. Fraction III was extracted from the residue three times with 0.5 mL of ultra-pure water andacetonitrile (50/50, v/v) by vortex mixing for 2 min followed by stirring at room temperature for 30 minand centrifugation (25 min, 3750× g, 20 ◦C). The corresponding three supernatants were united andfilled up with the respective extraction solvent to a volume of 2 mL. All extracts were filtered (0.45 µm)and each sample was analyzed in triplicate (n = 3) [5].
For chromatographic analysis, two GP-HPLC systems were used. For larger molecules, a GP-HPLCsystem according to Scherf et al. (2016) was used (system 1) [36]. A BioSep-SEC-s3000 (300 × 4.6 mm,29 nm, 5 µm, Phenomenex) was used on a Jasco HPLC Extrema (Jasco, Gross-Umstadt, Germany) at20 ◦C. Elution solvents A and B were used with a flow rate of 0.3 mL/min and an isocratic gradientcomposition of 50% A and 50% B. Because of different protein/peptide contents in the different fractions,the injection volumes were between 1 and 20 µL. The absorbance at 210 nm was detected. To separatesmaller molecules, a second GP-HPLC system was used with a BioBasic SEC-60 column (150 × 7.8 mm,6 nm, 5 µm, Thermo Scientific) on the same Jasco HPLC Extrema at 20 ◦C (system 2). The elutionsolvents were 0.1% TFA in ultra-pure water (A) and 0.1% TFA in acetonitrile (B). The flow rate was

Biomolecules 2020, 10, 1227 5 of 15
1 mL/min with an isocratic gradient composition of 70% A and 30% B for a duration of 12 min. Becauseof the different protein/peptide contents in the different fractions, the injection volumes were between5 and 20 µL.
The absorbance at 210 nm was detected [37]. The software ChromNAV was used for data analysis(Jasco Deutschland GmbH, Pfungstadt, Germany). Proteins and peptides with known Mr weremeasured to mark integration areas for a certain Mr range. β-Amylase from sweet potato (200 kDa),albumin from bovine serum (66 kDa), carbonic anhydrase from bovine erythrocytes (29 kDa), andcytochrome c from horse heart (12.4 kDa) were used for system 1. α-Lactalbumin (14.2 kDa), a glutenpeptide (1.9 kDa), and glutathione (0.3 kDa) were used for system 2. The area under the curve (AUC)was integrated in each section and calculated as the percentage of the total area.
2.6. Sodium Dodecyl Sulfate-Polyacrylamide Gel Electrophoresis (SDS-PAGE)
SDS-PAGE was performed according to Lagrain et al. (2012) [6]. G1–G8 and HWP1–HWP7were characterized by SDS-PAGE on a homogenous NuPAGE 10% polyacrylamide Bis-Tris gel(10 × 1 mm wells) (Invitrogen, Carlsbad, CA, USA). A mixture of proteins was used as a size standard(PageRulerTM Unstained Protein Ladder, Thermo Fisher Scientific). All samples (1.5 mg each) weremixed with 1 mL of extraction buffer (200 g/L sucrose, 59.7 g/L Tris-HCl, 40 g/L SDS, 0.3 g/L EDTA,0.4 g/L Coomassie blue, 0.1 g/L phenol red, 0.11 mmol/L HCl) containing 7.72 g/L DTT. After incubationfor 12 h, the samples were heated to 60 ◦C for 10 min and centrifuged (5 min, 5000× g, 20 ◦C). Twodifferent running buffers were used. The MOPS running buffer consisted of 20.9 g/L 3-(N-morpholino)propane sulfonic acid (MOPS), 12.1 g/L Tris-HCl, 2 g/L SDS, 0.6 g/L EDTA, and 0.77 g/L DTT as thereducing agent. The MES running buffer consisted of 20.9 g/L 2-(N-morpholino) ethane sulfonic acid(MES), 12.1 g/L Tris-HCl, 2 g/L SDS, 0.6 g/L EDTA, and 0.77 g/L DTT, as the reducing agent. The runningtime was 30 min at 115 mA and 200 V. The protein bands were fixed with 12% (w/w) trichloroaceticacid for 30 min, stained with Coomassie blue for 30 min, and destained first with methanol/glacialacetic acid/water (50/10/40, v/v/v), and then with methanol/glacial acetic acid/water (10/10/80, v/v/v).The gels were scanned using the Gel DocTM EZ Imager (Bio-Rad Laboratories, Munich, Germany) andthe Image Lab software (Bio-Rad Laboratories, Munich, Germany). The images were converted tograyscale [6,7].
2.7. Contents of Free Ammonium
For the determination of free ammonium in G1–G8 and HWP1–HWP7, 50 mg of sample (n = 3)were weighed into a 50-mL two-neck round-bottom flask with a 25-mL dropping funnel with a vacuumequalizer and a vacuum receiver. Glass wool was inserted into the vacuum receiver and wettedwith 200 µL sulphuric acid (0.5 mol/L). Vacuum was created using a vacuum pump and 5 mL ofboric acid/sodium hydroxide buffer (pH 10) were added via the dropping funnel. Ammonia wasexpelled for two hours while stirring at room temperature. The glass wool was then transferred intoa 50-mL volumetric flask and the vacuum receiver was washed with water. The measurement wasperformed by photometry [38]. For this purpose, the samples were mixed with 4 mL each of thefollowing solutions: (a) 130 g/L sodium salicylate, 130 g/L trisodium citrate dihydrate, and 970 g/Ldisodium-tacanonitrosyl-(III)-ferrate-dihydrate dissolved in water; (b) 0.032 g/L sodium hydroxideand 0.002 g/L sodium dichloro-isocyanurate dissolved in water. The flask was then filled up with waterto a volume of 50 mL and left to stand for 1 h at room temperature. The measurement was carried outaccording to DIN ISO 11732 with a UV-2401 spectrophotometer PC (Shimadzu, Neufahrn, Germany)at 655 nm. An external calibration line was prepared using ammonium sulfate [38].
2.8. Statistical Analysis
Statistical analysis was carried out with the use of Origin 19 (OriginLab Cooperation, Northampton,MA, USA) and SigmaPlot 14 (Systat Software GmbH, Erkrath, Germany).

Biomolecules 2020, 10, 1227 6 of 15
3. Results
3.1. Determination of Crude Protein Contents
The untreated (G1–G6) and the treated gluten samples (G7–G8) showed comparable crude proteincontents with 703.2–855.1 and 731.6–765.0 mg/kg, respectively (Table 1). The HWP had a widerrange and HWP5 (650 mg/g) had the lowest and HWP7 (898 mg/g) the highest crude protein content.Still, the mean values of gluten samples and HWP were quite similar (G1–G8: 773 ± 45.3 mg/g;HWP1–HWP7: 756 ± 67.9 mg/g; total: 765 ± 57.6 mg/g). HWP5 and G4 were significantly differentfrom each other.
Table 1. Contents of fractions A, B, and C and their sum (SUM), crude protein and free ammoniumin the gluten samples (G1–G8) and hydrolyzed wheat proteins (HWP1–HWP7). Values are given asmeans (n = 3) and different capital letters indicate significant differences between the samples in eachcolumn (one-way ANOVA, Tukey’s post hoc test, p < 0.05).
Sample Fraction A Fraction B Fraction C SUM ProteinContent Free NH4
+
[mg/g] [mg/g] [mg/g] [mg/g] [mg/g] [mg/g]
HWP 1 400.7 G <2.3 <4.7 400.7 737.4 A,B 4.12 A,B
HWP 2 569.4 J 25.9 A <4.7 595.3 752.6 A,B 0.59 A,B
HWP 3 493.6 I <2.3 <4.7 493.6 764.9 A,B 5.00 B
HWP 4 158.2 E 237.2 E 142.5 B 537.9 737.3 A,B 0.39 A,B
HWP 5 443.4 H 118.3 B 15.4 A 577.1 649.9 A 0.13 A,B
HWP 6 280.0 F 150.2 C 162.2 B,C 592.4 750.2 A,B 0.15 A,B
HWP 7 45.8 D 423.1 G 146.5 B 615.4 898.8 B 0.56 A,B
G 1 18.4 C 410.9 G 191.8 C,D 621.1 766.2 A,B 0.11 A,B
G 2 15.1 B 509.6 I 226.6 D 751.3 824.5 A,B 0.05 A
G 3 14.8 C 460.6 H 212.9 D 688.3 778.1 A,B 0.12 A,B
G 4 11.0 A 505.6 I 212.9 D 729.5 855.1 B 0.05 A
G 5 21.1 C 394.2 G 182.4 C 597.7 757.3 A,B 0.09 A,B
G 6 21.6 C 427.6 G 208.9 D 658.1 703.2 A,B 0.11 A,B
G 7 14.8 B 321.3 F 331.3 E 667.4 765.0 A,B 0.10 A,B
G 8 10.9 A 183.7 D 336.9 E 531.5 731.6 A,B 0.10 A,B
VC * 2.24 2.29 3.13 - 6.14 5.14
* Variation coefficient [%]: median of all relative standard deviations per analysis.
3.2. Stepwise Fractionation According to Solubility and RP-HPLC
The contents of fractions A, B, and C in gluten samples and HWP were determined according tothe modified Osborne fractionation, combining extraction and RP-HPLC analysis [4,7]. The RP-HPLCchromatograms of the three fractions from gluten (G1) and HWP2 are shown as examples in Figure 1and those of all other samples are available as Supplementary Material Figures S1–S13. Fraction Bconsists of gliadins, whereas fraction C contains glutenins. The contents of fraction B were between321.3 and 505.6 mg/g and fraction C between 182.4 and 331.3 mg/g. The contents of fraction B in G3, G7,and G8 were significantly different to each other and to other gluten samples as well as HWP (Table 1).Residues of albumins and globulins, present in fraction A, were determined (11.0–21.6 mg/g). They aremostly washed out during the gluten extraction process of wheat gluten but not completely. Thecontent of fraction A was similar for gluten samples in most cases. The contents of the three fractionswere similar for G8 (A: 10.9 mg/g, B: 183.7 mg/g, C: 336.9 mg/g) compared to the untreated glutensamples (G1–G6). G7 (A: 14.8 mg/g, B: 321.3 mg/g, C: 331.3 mg/g) had a similar content of fractionC but significantly different contents of fraction A and B in relation to G1–G6 and G8 and all HWP(except fraction A of G2).

Biomolecules 2020, 10, 1227 7 of 15
Biomolecules 2020, 10, x 7 of 16
Figure 1. Reversed-phase high-performance liquid-chromatography: Chromatograms of the three fractions, soluble in aqueous salt solution (fraction A), soluble in 60% ethanol (fraction B), and soluble in glutenin extraction solution (fraction C) of gluten G1 (a–c) and hydrolyzed wheat protein HWP2 (d–f). Albumins and globulins (fraction A: a,d), gliadins subdivided into ω5-, ω1,2-, α-, and γ-gliadins (fraction B: b,e), and glutenins subdivided into high-molecular-weight- (HMW-) and low-molecular-weight- (LMW-) glutenin subunits (fraction C: c,f).
The contents of fraction A from all HWP (45.8–569.4 mg/g) were significantly higher compared to gluten G1–G8. This results from the modification process where gluten proteins are degraded to smaller proteins, which are consequently more soluble in aqueous solutions. Furthermore, the contents of fraction A from HWP1–HWP7 were significantly different to each other. For HWP, the contents were between 25.9 and 423.1 mg/g for fraction B and between 15.4 and 162.2 mg/g for
Figure 1. Reversed-phase high-performance liquid-chromatography: Chromatograms of the threefractions, soluble in aqueous salt solution (fraction A), soluble in 60% ethanol (fraction B), and solublein glutenin extraction solution (fraction C) of gluten G1 (a–c) and hydrolyzed wheat protein HWP2(d–f). Albumins and globulins (fraction A: a,d), gliadins subdivided into ω5-, ω1,2-, α-, andγ-gliadins (fraction B: b,e), and glutenins subdivided into high-molecular-weight- (HMW-) andlow-molecular-weight- (LMW-) glutenin subunits (fraction C: c,f).
The contents of fraction A from all HWP (45.8–569.4 mg/g) were significantly higher comparedto gluten G1–G8. This results from the modification process where gluten proteins are degraded tosmaller proteins, which are consequently more soluble in aqueous solutions. Furthermore, the contentsof fraction A from HWP1–HWP7 were significantly different to each other. For HWP, the contentswere between 25.9 and 423.1 mg/g for fraction B and between 15.4 and 162.2 mg/g for fraction C. ForHWP1 and HWP3, the contents of fraction B were lower than 2.3 mg/g. This value was estimated byinjecting decreasing amounts of PWG-gliadin and checking the linearity of the calibration curve. ForHWP1, HWP2, and HWP3, the contents of fraction C were lower than 4.7 mg/g. HWP2 and HWP5 hada significantly lower content of fraction B than the other HWP and G1–G8.
Biomolecules 2020, 10, 1227 8 of 15
3.3. Gel-Permeation High-Performance Liquid Chromatography (GP-HPLC)
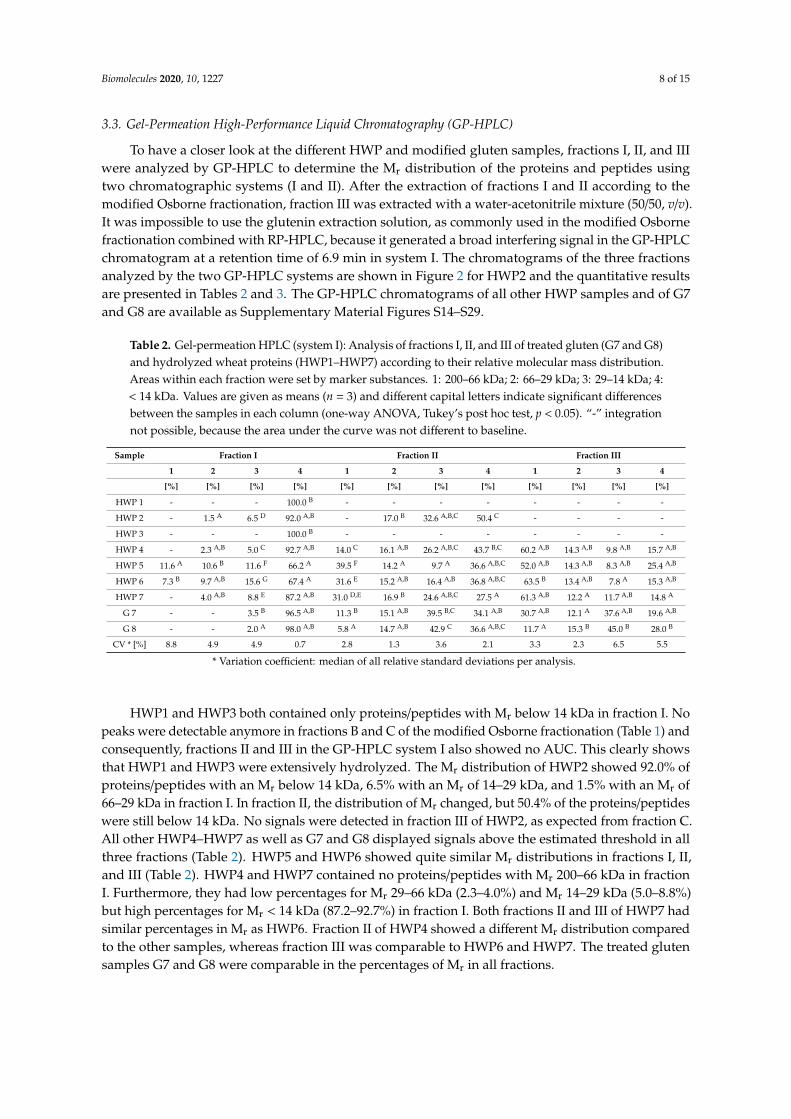
To have a closer look at the different HWP and modified gluten samples, fractions I, II, and IIIwere analyzed by GP-HPLC to determine the Mr distribution of the proteins and peptides usingtwo chromatographic systems (I and II). After the extraction of fractions I and II according to themodified Osborne fractionation, fraction III was extracted with a water-acetonitrile mixture (50/50, v/v).It was impossible to use the glutenin extraction solution, as commonly used in the modified Osbornefractionation combined with RP-HPLC, because it generated a broad interfering signal in the GP-HPLCchromatogram at a retention time of 6.9 min in system I. The chromatograms of the three fractionsanalyzed by the two GP-HPLC systems are shown in Figure 2 for HWP2 and the quantitative resultsare presented in Tables 2 and 3. The GP-HPLC chromatograms of all other HWP samples and of G7and G8 are available as Supplementary Material Figures S14–S29.
Table 2. Gel-permeation HPLC (system I): Analysis of fractions I, II, and III of treated gluten (G7 and G8)and hydrolyzed wheat proteins (HWP1–HWP7) according to their relative molecular mass distribution.Areas within each fraction were set by marker substances. 1: 200–66 kDa; 2: 66–29 kDa; 3: 29–14 kDa; 4:< 14 kDa. Values are given as means (n = 3) and different capital letters indicate significant differencesbetween the samples in each column (one-way ANOVA, Tukey’s post hoc test, p < 0.05). “-” integrationnot possible, because the area under the curve was not different to baseline.
Sample Fraction I Fraction II Fraction III
1 2 3 4 1 2 3 4 1 2 3 4
[%] [%] [%] [%] [%] [%] [%] [%] [%] [%] [%] [%]
HWP 1 - - - 100.0 B - - - - - - - -
HWP 2 - 1.5 A 6.5 D 92.0 A,B - 17.0 B 32.6 A,B,C 50.4 C - - - -
HWP 3 - - - 100.0 B - - - - - - - -
HWP 4 - 2.3 A,B 5.0 C 92.7 A,B 14.0 C 16.1 A,B 26.2 A,B,C 43.7 B,C 60.2 A,B 14.3 A,B 9.8 A,B 15.7 A,B
HWP 5 11.6 A 10.6 B 11.6 F 66.2 A 39.5 F 14.2 A 9.7 A 36.6 A,B,C 52.0 A,B 14.3 A,B 8.3 A,B 25.4 A,B
HWP 6 7.3 B 9.7 A,B 15.6 G 67.4 A 31.6 E 15.2 A,B 16.4 A,B 36.8 A,B,C 63.5 B 13.4 A,B 7.8 A 15.3 A,B
HWP 7 - 4.0 A,B 8.8 E 87.2 A,B 31.0 D,E 16.9 B 24.6 A,B,C 27.5 A 61.3 A,B 12.2 A 11.7 A,B 14.8 A
G 7 - - 3.5 B 96.5 A,B 11.3 B 15.1 A,B 39.5 B,C 34.1 A,B 30.7 A,B 12.1 A 37.6 A,B 19.6 A,B
G 8 - - 2.0 A 98.0 A,B 5.8 A 14.7 A,B 42.9 C 36.6 A,B,C 11.7 A 15.3 B 45.0 B 28.0 B
CV * [%] 8.8 4.9 4.9 0.7 2.8 1.3 3.6 2.1 3.3 2.3 6.5 5.5
* Variation coefficient: median of all relative standard deviations per analysis.
HWP1 and HWP3 both contained only proteins/peptides with Mr below 14 kDa in fraction I. Nopeaks were detectable anymore in fractions B and C of the modified Osborne fractionation (Table 1) andconsequently, fractions II and III in the GP-HPLC system I also showed no AUC. This clearly showsthat HWP1 and HWP3 were extensively hydrolyzed. The Mr distribution of HWP2 showed 92.0% ofproteins/peptides with an Mr below 14 kDa, 6.5% with an Mr of 14–29 kDa, and 1.5% with an Mr of66–29 kDa in fraction I. In fraction II, the distribution of Mr changed, but 50.4% of the proteins/peptideswere still below 14 kDa. No signals were detected in fraction III of HWP2, as expected from fraction C.All other HWP4–HWP7 as well as G7 and G8 displayed signals above the estimated threshold in allthree fractions (Table 2). HWP5 and HWP6 showed quite similar Mr distributions in fractions I, II,and III (Table 2). HWP4 and HWP7 contained no proteins/peptides with Mr 200–66 kDa in fractionI. Furthermore, they had low percentages for Mr 29–66 kDa (2.3–4.0%) and Mr 14–29 kDa (5.0–8.8%)but high percentages for Mr < 14 kDa (87.2–92.7%) in fraction I. Both fractions II and III of HWP7 hadsimilar percentages in Mr as HWP6. Fraction II of HWP4 showed a different Mr distribution comparedto the other samples, whereas fraction III was comparable to HWP6 and HWP7. The treated glutensamples G7 and G8 were comparable in the percentages of Mr in all fractions.

Biomolecules 2020, 10, 1227 9 of 15
Biomolecules 2020, 10, x 11 of 16
Figure 2. Gel-permeation high-performance liquid-chromatography: Chromatograms of the three fractions, soluble in aqueous salt solution (fraction I: a,d), soluble in 60% ethanol (fraction II: b,e), and soluble in acetonitrile/water (50/50, v/v) (fraction III: c,f) of HWP2 in two different systems. System I (a–c) is subdivided into the following ranges of relative molecular masses: Mr 200–66 kDa (1), Mr 66–29 kDa (2), 29–14 kDa (3), < 14 kDa (4). System II (d–f) is subdivided into the following ranges of relative molecular masses: Mr ≥ 14 kDa (1), Mr 14–2 kDa (2), Mr < 2 kDa (3).
Figure 2. Gel-permeation high-performance liquid-chromatography: Chromatograms of the threefractions, soluble in aqueous salt solution (fraction I: a,d), soluble in 60% ethanol (fraction II: b,e), andsoluble in acetonitrile/water (50/50, v/v) (fraction III: c,f) of HWP2 in two different systems. SystemI (a–c) is subdivided into the following ranges of relative molecular masses: Mr 200–66 kDa (1), Mr
66–29 kDa (2), 29–14 kDa (3), < 14 kDa (4). System II (d–f) is subdivided into the following ranges ofrelative molecular masses: Mr ≥ 14 kDa (1), Mr 14–2 kDa (2), Mr < 2 kDa (3).

Biomolecules 2020, 10, 1227 10 of 15
Table 3. Gel-permeation HPLC (system II): Analysis of fractions I, II, and III of treated gluten (G7 and G8)and hydrolyzed wheat proteins (HWP1-HWP7) according to their relative molecular mass distribution.Areas within each fraction were set by marker substances. 1: ≥ 14 kDa; 2: 14–2 kDa; 3: < 2 kDa. Valuesare given as means (n = 3) and different capital letters indicate significant differences between thesamples in each column (one-way ANOVA, Tukey’s post hoc test, p < 0.05). “-” integration not possible,because the area under the curve was not different to baseline.
Sample Fraction I Fraction II Fraction III
1 2 3 1 2 3 1 2 3
[%] [%] [%] [%] [%] [%] [%] [%] [%]
HWP 1 16.8 B 33.9 G 49.3 F - - - - - -
HWP 2 66.3 E 18.8 F 14.9 B 100.0 - - - - -
HWP 3 3.9 A 39.1 H 57.0 G - - - - - -
HWP 4 75.3 I 13.7 E 11.0 A 100.0 - - 100.0 - -
HWP 5 73.7 G,H,I 11.5 D 14.8 B 100.0 - - - - -
HWP 6 74.2 H,I 4.5 B,C 21.3 C 100.0 - - 100.0 - -
HWP 7 70.5 F 5.6 C 23.9 D 100.0 - - 100.0 - -
G 7 53.3 D 2.5 A 44.2 E 100.0 - - 100.0 - -
G 8 31.6 C - 68.4 H 100.0 - - 100.0 - -
CV * [%] 2.0 2.9 2.6 0.0 - - 0.0 - -
* Variation coefficient: median of all relative standard deviations per analysis.
The GP-HPLC system II was established to have a closer look at proteins/peptides with lowMr (Table 3). As expected from the Osborne fractionation (Table 1), HWP1 and HWP3 only showedbaseline values in fractions II and III. The Mr distribution in fraction I of HWP1 and HWP3 wassignificantly different to all other samples and to each other. HWP1 had significantly higher percentagesof proteins/petides with Mr ≥ 14 kDa but lower percentages of proteins/petides with Mr < 2 kDacompared to HWP3. In fraction I, the Mr of HWP2 was mostly≥ 14 kDa (66.3%), whereas the percentageof peptides with an Mr < 2 kDa was similar to that of HWP5. HWP4 and HWP5 as well as HWP6 andHWP7 showed comparable Mr distributions in fraction I, respectively. Considering fractions II and III,HWP1 and HWP3 only had baseline values, indicating that the samples were completely soluble inaqueous salt solution. HWP2 and HWP5 showed no peaks in fraction III, but fraction II contained100% of proteins/peptides with Mr ≥ 14 kDa.
When comparing the results from RP-HPLC and GP-HPLC analyses, we found 15.4 mg/g offraction C in HWP5 after extraction/RP-HPLC analysis (Table 1) but no signal above the baselineafter extraction/GP-HPLC analysis. This discrepancy can be explained with the change of extractionsolvents for both analyses. Apparently, the glutenin extraction solution with DTT used in combinationwith RP-HPLC (fraction C) is more efficient at extracting the proteins/peptides from the sample thanthe water-acetonitrile mixture used for GP-HPLC (corresponding fraction III). The difference wassmall and only apparent for HWP5, because it had such low contents of fraction C/III. HWP4, HWP6,and HWP7 had 100% of proteins/peptides with Mr ≥ 14 kDa in fractions II and III, respectively, as didG7 and G8. The Mr distribution of G7 and G8 was significantly different from HWP1–HWP7 in fractionI. G8 was the only sample with no AUC in the range of Mr 14–2 kDa. G7 and G8 were also significantlydifferent to each other, which is according to expectations, because they were treated in different ways.
3.4. Sodium Dodecyl Sulfate-Polyacrylamide Gel Electrophoresis (SDS-PAGE)
Two different reducing buffer systems, using MES and MOPS, were tested for SDS-PAGE. Overall,the gels looked similar regarding band patterns, but the bands were sharper with MOPS compared

Biomolecules 2020, 10, 1227 11 of 15
to MES. Consequently, the SDS-PAGE gels with MOPS running buffer are discussed in the following(Figure 3). The protein marker contained proteins with 15 and 10 kDa, but these bands were notseparated at the end of the gel, so that all bands in this range were designated as Mr ≤ 15 kDa.
Biomolecules 2020, 10, x 12 of 16
3.4. Sodium Dodecyl Sulfate-Polyacrylamide Gel Electrophoresis (SDS-PAGE)
Two different reducing buffer systems, using MES and MOPS, were tested for SDS-PAGE. Overall, the gels looked similar regarding band patterns, but the bands were sharper with MOPS compared to MES. Consequently, the SDS-PAGE gels with MOPS running buffer are discussed in the following (Figure 3). The protein marker contained proteins with 15 and 10 kDa, but these bands were not separated at the end of the gel, so that all bands in this range were designated as Mr ≤ 15 kDa.
Gluten protein types have different Mr, ranging from HMW-GS with 65–90 kDa, to LMW-GS with 30–50 kDa and to gliadins with 28–55 kDa. Among gliadins, the Mr ranges are 49–55 kDa for ω5-gliadins, 39–44 kDa for ω1,2-gliadins, and 28–39 kDa for α- and γ-gliadins. Veraverbeke et al. and Lagrain et al. reported that the Mr of HMW-GS is overestimated to 80–120 kDa in SDS-PAGE due to aggregation effects This is visible in all gluten samples (G1–G8), with three characteristic bands of HMW-GS in this range. In general, the native gluten samples (G1–G6) showed the typical protein bands of the different gluten protein types. A protein band with Mr ≤ 15 kDa was also present in each native gluten sample (G1–G6), which results from residues of albumins and globulins (see also 3.2., fraction A) [1,6,7,39].
The treated gluten samples G7 and G8 showed the same protein bands as the native gluten samples G1–G6, indicating that the treatment did not cause extensive changes in the protein composition. In contrast, the HWP were completely different. Depending on their degree of hydrolysis, they showed more or fewer protein bands. HWP4 and HWP7 showed protein bands in the range of 30–50 kDa and approximately 60 and 85 kDa, but they were much more blurred compared to G1–G8. HWP5 and HWP6 showed only blurred lanes with no discernible protein bands. HWP2, HWP5, and HWP6 showed one band at Mr ≤ 15 kDa, which was also visible in G1–G8, as well as HWP4 and HWP7. HWP1 and HWP3 showed no protein bands at all, indicating that they had been extensively hydrolyzed.
Figure 3. Sodium dodecyl sulfate-polyacrylamide gel electrophoresis of gluten samples (G1–G8) and hydrolyzed wheat proteins (HWP1–HWP7). Protein marker 3.5 µg, samples 15 µg.
3.5. Contents of Free Ammonium
The content of free ammonium in a sample is an indicator for hydrolysis under drastic conditions, like highly concentrated mineral acids and high temperature, or the use of deamidating enzymes, such as transglutaminases [9]. The native gluten samples (G1–G6) had low contents of free ammonium (0.05–0.12 mg/g) (Table 1), as did the treated gluten samples (G7–G8: 0.10 mg/g). However, the values were higher (0.13–5.00 mg/g) for HWP. This was expected and depends on the
Figure 3. Sodium dodecyl sulfate-polyacrylamide gel electrophoresis of gluten samples (G1–G8) andhydrolyzed wheat proteins (HWP1–HWP7). Protein marker 3.5 µg, samples 15 µg.
Gluten protein types have different Mr, ranging from HMW-GS with 65–90 kDa, to LMW-GSwith 30–50 kDa and to gliadins with 28–55 kDa. Among gliadins, the Mr ranges are 49–55 kDa forω5-gliadins, 39–44 kDa forω1,2-gliadins, and 28–39 kDa for α- and γ-gliadins. Veraverbeke et al. andLagrain et al. reported that the Mr of HMW-GS is overestimated to 80–120 kDa in SDS-PAGE due toaggregation effects This is visible in all gluten samples (G1–G8), with three characteristic bands ofHMW-GS in this range. In general, the native gluten samples (G1–G6) showed the typical proteinbands of the different gluten protein types. A protein band with Mr ≤ 15 kDa was also present ineach native gluten sample (G1–G6), which results from residues of albumins and globulins (see alsoSection 3.2, fraction A) [1,6,7,39].
The treated gluten samples G7 and G8 showed the same protein bands as the native gluten samplesG1–G6, indicating that the treatment did not cause extensive changes in the protein composition.In contrast, the HWP were completely different. Depending on their degree of hydrolysis, they showedmore or fewer protein bands. HWP4 and HWP7 showed protein bands in the range of 30–50 kDaand approximately 60 and 85 kDa, but they were much more blurred compared to G1–G8. HWP5and HWP6 showed only blurred lanes with no discernible protein bands. HWP2, HWP5, and HWP6showed one band at Mr ≤ 15 kDa, which was also visible in G1–G8, as well as HWP4 and HWP7. HWP1and HWP3 showed no protein bands at all, indicating that they had been extensively hydrolyzed.
3.5. Contents of Free Ammonium
The content of free ammonium in a sample is an indicator for hydrolysis under drastic conditions,like highly concentrated mineral acids and high temperature, or the use of deamidating enzymes,such as transglutaminases [9]. The native gluten samples (G1–G6) had low contents of free ammonium(0.05–0.12 mg/g) (Table 1), as did the treated gluten samples (G7–G8: 0.10 mg/g). However, the valueswere higher (0.13–5.00 mg/g) for HWP. This was expected and depends on the production process.HWP1 and HWP3 had the highest contents of free ammonium (4.12 and 5.00 mg/g, respectively). G2and HWP3 had significantly different contents of free ammonium.

Biomolecules 2020, 10, 1227 12 of 15
As shown with RP-HPLC, GP-HPLC, and SDS-PAGE, HWP1 and HWP3 were both extensivelyhydrolyzed wheat protein samples. These two samples may have been processed via hydrolysis withmineral acid under heating, which is a very common procedure in the food industry. As shown above,HWP2 has also been extensively hydrolyzed. In contrast to HWP1 and HWP3, the ammonium contentof HWP2 was low (0.59 mg/g) and this could be an indicator that HWP2 might have been hydrolyzedenzymatically, with a long duration [9].
4. Discussion
Gluten and HWP showed similarities in the crude protein contents (about 765 mg/g) and thesecontents were expected for gluten [1]. This shows that the treatment of the HWP did not change thecrude protein content, except for HWP 5. The content of free ammonium was used as an indicatorfor deamidation. Consequently, higher values were expected for the HWP compared to gluten andthe results supported the expectation, because HWP had average contents of 1.56 mg/g and glutenof 0.09 mg/g. No exact contents have been reported in the literature so far, but it is known thatdeamidation may take place during hydrolysis and is also carried out intentionally to achieve thedesired functional properties, such as increased solubility [8,9].
The most remarkable differences between gluten and HWP were the contents of fraction A of themodified Osborne fractionation. HWP (on average: 341.6 mg/kg) showed significantly higher contentsthan gluten (on average: 16.0 mg/kg), according to expectations. Crude gluten is treated in chemicaland biochemical ways to improve solubility. Consequently, a higher percentage of proteins or peptidesis soluble in salt solution and does not require organic solvents or reducing agents anymore to becomesoluble, like intact gliadins and glutenins do. The extent of the increase in solubility and thus contentsof fraction A depend on the type and degree of processing. Consequently, with increased contents infraction A, HWP had decreased contents in fraction B and C. Among others, Kanerva et al. (2011) andWu et al. (1976) described a noticeably increased solubility of HWP compared to gluten [9,28].
In agreement with the RP- and GP-HPLC results, differences were also visible between glutenand HWP using SDS-PAGE. While gluten showed typical protein bands, the HWP showed less oreven no protein bands, because of protein degradation. Generally, the protein bands were weaker inHWP than in gluten, which was expected. Wieser et al. (2018) showed a change in protein bandsin SDS-PAGE relative to the duration of hydrolysis [32]. However, the degree of hydrolysis and thepresence of protein bands in SDS-PAGE is not only dependent on the duration but also on the type ofhydrolysis. Chemical hydrolysis is usually harsher than enzymatic digestion [8,12,32,40].
Interestingly, in SDS-PAGE, a protein band was found at Mr ≤ 15 kDa in G1–G8 and in mostHWP samples, except HWP1 and HWP3. In the GP-HPLC system I, this is also clearly visible inarea 4 of fraction I (Mr < 14 kDa), which had the highest percentage in the fraction of these samples.Additionally, in the GP-HPLC system II, the highest percentage was present in area 1 of fraction I(Mr ≥14 kDa) for HWP2, 4–7 and G7. This indicates the presence of proteins with Mr around about14 kDa or lower. This may result from, e.g., α-amylase/trypsin-inhibitors that have a Mr of about12–16 kDa, but further analyses are required to unambiguously identify these proteins [41].
HWP1 and HWP3 did not show any protein bands in SDS-PAGE, which indicated the status oftotal hydrolysis. This is also visible in their GP-HPLC measurements, showing Mr lower than 14 kDa inboth systems. Such an extensive hydrolysis can be carried out with the use of 0.5–1 mol/L hydrochloricacid and boiling [9,28].
Furthermore, the HWP were different from each other in many cases. The contents of fractions Aand B were significantly different in every HWP. Additionally, differences in Mr using GP-HPLC werevisible. It was predictable that HWP were different from each other, because many different approachesfor gluten hydrolysis are in use like treatment with chemicals [13] and enzymes or high-pressureprocessing and UV irradiation [8].

Biomolecules 2020, 10, 1227 13 of 15
The differences between native gluten and HWP are likely to result in difficulties regarding glutenanalysis, important for people with wheat-related disorders, who need to avoid gluten. The identifieddifferences between HWP support the allegation that their determination is challenging [9,33,35].
In general, it should be noted that the differences between gluten and HWP need to be consideredwhen developing analytical methods, e.g., because sample preparation is affected due to differentsolubility. Another point is that reference materials used for calibration may need to be adapted orthat different assay formats may be necessary, i.e., a competitive ELISA as opposed to a sandwichformat [31,35]. Regarding diagnostic approaches, the immunoreactivity might differ greatly, as thedifferences found at the molecular level suggest. The same applies to different HWP, because theirproperties are highly variable. The in-depth characterization of the samples allowed us to selectparticularly interesting HWP samples showing a low or a high degree of hydrolysis for furtherwork to characterize the sensitization profiles in wheat allergic patients. Testing the levels of glutenimmunogenic peptides arising after the ingestion of gluten or HWP in patients’ urine or stool sampleswould be very interesting to assess potential differences in bioaccessibility, bioavailability, and uptakevs. excretion ratios [42].
How the identified molecular differences influence the mechanisms of celiac disease and wheatallergy is hard to say. On the one hand, hydrolysis uncovers immunoactive epitopes in the proteinsand potentially generates new ones by deamidation. In addition, the increased solubility of HWP mayhave an influence on the bioavailability and digestibility in the body. On the other hand, hydrolysiscan also destroy immunoactive epitopes, because of extensive protein degradation [19–22].
5. Conclusions
Commercially available HWP and gluten samples were characterized according to their crudeprotein content, solubility, and Mr of the proteins and peptides as well as the content of free ammoniumas indicator for deamidation. Differences in the protein composition, solubility, and Mr distributionbetween HWP and native gluten were expected and found, especially for the solubility of HWP andgluten in aqueous salt solution. Additionally, all analyzed HWP were significantly different fromeach other. This shows that the molecular characteristics of HWP generally are highly variable andthat these are likely to cause differences in the immunoreactivity of the products. These findingshighlight that the exact characterization of HWP products is very important to establish relationshipsbetween protein structure and immunoreactivity for patients suffering from wheat-related disorders.It is necessary to pay attention to the molecular differences between gluten and HWP, especially for thedevelopment of analytical or diagnostic methods.
Supplementary Materials: The following are available online at http://www.mdpi.com/2218-273X/10/9/1227/s1,Figures S1–S13: Reversed-phase HPLC analysis of G2 to G8 as well as HWP1 and HWP3 to HWP7, Figure S14–S21:Gel-permeation HPLC analysis of HWP1, HWP3 to HWP7 and G7 and G8, Figure S22–S29: Gel-permeation HPLCanalysis of HWP1, HWP3 to HWP7 and G7 and G8.
Author Contributions: Conceptualization, K.A.S.; Formal analysis, Investigation, Methodology, A.M.G.;Resources, Supervision, K.A.S; Visualization, Writing—original draft, A.M.G.; Writing—review and editing, K.A.S.All authors have read and agreed to the published version of the manuscript.
Funding: This research received no external funding.
Acknowledgments: The authors would like to thank Ms. Angelika Graßl and Ms. Stefanie Hackl(Leibniz-LSB@TUM) for their excellent technical assistance. We acknowledge support by the KIT-PublicationFund of the Karlsruhe Institute of Technology.
Conflicts of Interest: The authors declare no conflict of interest.
References
1. Scherf, K.A.; Koehler, P.; Wieser, H. Gluten and wheat sensitivities—An overview. J. Cereal Sci. 2016, 67, 2–11.[CrossRef]

Biomolecules 2020, 10, 1227 14 of 15
2. Codex Alimentarius Standard. Wheat Protein Products Including Wheat Gluten: CODEX STAN 163-1987,Rev.1-2001; FAO/WHO Joint Publications: Rome, Italy, 2001.
3. Koehler, P.; Wieser, H.; Konitzer, K. Celiac Disease and Gluten: Multidisciplinary Challenges and Opportunities;Academic Press: Amsterdam, The Netherlands, 2014.
4. Wieser, H.; Seilmeier, M.; Belitz, H.-D. Quantitative determination of gliadin subgroups from different wheatcultivars. J. Cereal Sci. 1994, 149–155. [CrossRef]
5. Wieser, H.; Antes, S.; Seilmeier, W. Quantitative determination of gluten protein types in wheat flour byreversed-phase high-performance liquid chromatography. J. Cereal Sci. 1998, 75, 644–650. [CrossRef]
6. Lagrain, B.; Rombouts, I.; Wieser, H.; Delcour, J.A.; Koehler, P. A reassessment of the electrophoretic mobilityof high molecular weight glutenin subunits of wheat. J. Cereal Sci. 2012, 56, 726–732. [CrossRef]
7. Schalk, K.; Lexhaller, B.; Koehler, P.; Scherf, K.A. Isolation and characterization of gluten protein types fromwheat, rye, barley and oats for use as reference materials. PLoS ONE 2017, 12, 1–20. [CrossRef]
8. Day, L.; Augustin, M.A.; Batey, I.L.; Wrigley, C.W. Wheat-gluten uses and industry needs. Trends Food Sci.Technol. 2006, 17, 82–90. [CrossRef]
9. Kanerva, P.; Brinck, O.; Sontag-Strohm, T.; Salovaara, H.; Loponen, J. Deamidation of gluten proteins andpeptides decreases the antibody affinity in gluten analysis assays. J. Cereal Sci. 2011, 53, 335–339. [CrossRef]
10. Laurière, M.; Pecquet, C.; Bouchez-Mahiout, I.; Snégaroff, J.; Bayrou, O.; Raison-Peyron, N.; Vigan, M.Hydrolysed wheat proteins present in cosmetics can induce immediate hypersensitivities. Contact Dermat.2006, 54, 283–289. [CrossRef] [PubMed]
11. Batey, I.L.; Gras, P.W. Solubilization of wheat gluten with sodium hydroxide. J. Food Technol. 1981, 16,561–566. [CrossRef]
12. Riha, W.E.; Izzo, H.V.; Zhang, J.; Ho, C.T. Nonenzymatic deamidation of food proteins. Crit. Rev. Food Sci.Nutr. 1996, 36, 225–255. [CrossRef]
13. Batey, I.L.; Gras, P.W. Preparation of salt-free protein products from acid or alkali-treated proteins. Food Chem.1983, 12, 265–273. [CrossRef]
14. Rhim, J.W.; Gennadios, A.; Fu, D.; Weller, C.L.; Milford, A.H. Properties of ultraviolet irradiated proteinfilms. LWT Food Sci. Technol. 1999, 32, 129–133. [CrossRef]
15. Apichartsrangkoon, A.; Bell, A.E.; Ledward, D.A.; Schofield, J.D. Dynamic viscoelastic behavior ofhigh-pressure-treated wheat gluten. Cereal Chem. 1999, 76, 777–782. [CrossRef]
16. Singh, P.; Arora, A.; Strand, T.A.; Leffler, D.A.; Catassi, C.; Green, P.H.; Kelly, C.P.; Ahuja, V.; Makharia, G.K.Global prevalence of celiac disease: Systematic review and meta-analysis. Clin. Gastroenterol. Hepatol. 2018,16, 823–836. [CrossRef] [PubMed]
17. Cianferoni, A. Wheat allergy: Diagnosis and management. J. Asthma Allergy 2016, 9, 13–25. [CrossRef][PubMed]
18. Scherf, K.A. Immunoreactive cereal proteins in wheat allergy, non-celiac gluten/wheat sensitivity (NCGS)and celiac disease. Curr. Opin. Food Sci. 2019, 25, 35–41. [CrossRef]
19. Scherf, K.A.; Brockow, K.; Biedermann, T.; Koehler, P.; Wieser, H. Wheat-dependent exercise-inducedanaphylaxis. Clin. Exp. Allergy 2016, 46, 10–20. [CrossRef]
20. Yokooji, T.; Kurihara, S.; Murakami, T.; Chinuki, Y.; Takahashi, H.; Morita, E.; Harada, S.; Ishii, K.; Hiragun, M.;Hide, M.; et al. Characterization of causative allergens for wheat-dependent exercise-induced anaphylaxissensitized with hydrolyzed wheat proteins in facial soap. Allergol. Int. 2013, 62, 435–445. [CrossRef]
21. Hiragun, M.; Ishii, K.; Hiragun, T.; Shindo, H.; Mihara, S.; Matsuo, H.; Hide, M. The sensitivity and clinicalcourse of patients with wheat-dependent exercise-induced anaphylaxis sensitized to hydrolyzed wheatprotein in facial soap—Secondary publication. Allergol. Int. 2013, 62, 351–358. [CrossRef]
22. Scherf, K.A.; Lindenau, A.-C.; Valentini, L.; Collado, M.C.; García-Mantrana, I.; Christensen, M.; Tomsitz, D.;Kugler, C.; Biedermann, T.; Brockow, K. Cofactors of wheat-dependent exercise-induced anaphylaxis donot increase highly individual gliadin absorption in healthy volunteers. Clin. Transl. Allergy 2019, 9, 19.[CrossRef]
23. Kong, X.; Zhou, H.; Qian, H. Enzymatic preparation and functional properties of wheat gluten hydrolysates.Food Chem. 2007, 101, 615–620. [CrossRef]
24. Wang, L.; Xu, B.; Li, L.; Zhang, M.; Feng, T.; Wang, J.; Jin, Z. Enhancement of umami taste of hydrolyzedprotein from wheat gluten by β-cyclodextrin. J. Sci. Food Agric. 2016, 96, 4499–4504. [CrossRef] [PubMed]

Biomolecules 2020, 10, 1227 15 of 15
25. Panda, R.; Garber, E.A.E. Detection and quantitation of gluten in fermented-hydrolyzed foods byantibody-based methods: Challenges, progress, and a potential path forward. Front. Nutr. 2019, 6,97. [CrossRef] [PubMed]
26. Liao, L.; Qiu, C.Y.; Liu, T.X.; Zhao, M.M.; Ren, J.Y.; Zhao, H.F. Susceptibility of wheat gluten to enzymatichydrolysis following deamidation with acetic acid and sensory characteristics of the resultant hydrolysates.J. Cereal Sci. 2010, 52, 395–403. [CrossRef]
27. Liao, L.; Liu, T.-x.; Zhao, M.-m.; Cui, C.; Yuan, B.-E.; Tang, S.; Yang, F. Functional, nutritional andconformational changes from deamidation of wheat gluten with succinic acid and citric acid. Food Chem.2010, 123, 123–130. [CrossRef]
28. Wu, C.H.; Nakai, S.; Powrie, W.D. Preparation and properties of acid-solubilized gluten. J. Agric. Food Chem.1976, 24, 504–510. [CrossRef]
29. Koehler, P.; Schwalb, T.; Immer, U.; Lacorn, M.; Wehling, P.; Don, C. AACCI Approved Methods TechnicalCommittee report: Collaborative study on the immunochemical determination of partially hydrolyzedgluten using an R5 competitive ELISA. Cereal Foods World 2013, 58, 154–158. [CrossRef]
30. Gorissen, S.H.; Horstman, A.M.; Franssen, R.; Crombag, J.J.R.; Langer, H.; Bierau, J.; Respondek, F.;van Loon, L.J. Ingestion of wheat protein increases in vivo muscle protein synthesis rates in healthy oldermen in a randomized trial. J. Nutr. 2016, 146, 1651–1659. [CrossRef]
31. Gessendorfer, B.; Koehler, P.; Wieser, H. Preparation and characterization of enzymatically hydrolyzedprolamins from wheat, rye, and barley as references for the immunochemical quantitation of partiallyhydrolyzed gluten. Anal. Bioanal. Chem. 2009, 395, 1721–1728. [CrossRef]
32. Wieser, H.; Scherf, K.A. Preparation of a defined gluten hydrolysate for diagnosis and clinical investigationsof wheat hypersensitivities. Nutrients 2018, 10, 1411. [CrossRef]
33. Scherf, K.A.; Poms, R.E. Recent developments in analytical methods for tracing gluten. J. Cereal Sci. 2016, 67,112–122. [CrossRef]
34. Lexhaller, B.; Tompos, C.; Scherf, K.A. Fundamental study on reactivities of gluten protein types from wheat,rye and barley with five sandwich ELISA test kits. Food Chem. 2017, 237, 320–330. [CrossRef] [PubMed]
35. Rallabhandi, P.; Sharma, G.M.; Pereira, M.; Williams, K.M. Immunological characterization of the glutenfractions and their hydrolysates from wheat, rye and barley. J. Agric. Food Chem. 2015, 63, 1825–1832.[CrossRef]
36. Van Eckert, R.; Berghofer, E.; Ciclitira, P.J.; Chirdo, F.; Denery-Papini, S.; Ellis, H.J.; Ferranti, P.; Goodwin, P.;Immer, U.; Mamone, G.; et al. Towards a new gliadin reference material–isolation and characterisation.J. Cereal Sci. 2006, 43, 331–341. [CrossRef]
37. Scherf, K.A.; Wieser, H.; Koehler, P. Improved quantitation of gluten in wheat starch for celiac disease patientsby gel-permeation high-performance liquid chromatography with fluorescence detection (GP-HPLC-FLD).J. Agric. Food Chem. 2016, 64, 7622–7631. [CrossRef]
38. Brunnbauer, M.W. Hochdruckbehandlung von Weizenkleber in Gegenwart von Zusätzen. Ph.D. Thesis,Technical University of Munich, Munich, Germany, 2014.
39. Veraverbeke, W.S.; Delcour, J.A. Wheat protein composition and properties of wheat glutenin in relation tobreadmaking functionality. Crit. Rev. Food Sci. Nutr. 2002, 42, 179–208. [CrossRef]
40. Wright, H.T. Nonenzymatic deamidation of asparaginyl and glutaminyl residues in proteins. Crit. Rev.Biochem. Mol. Biol. 1991, 26, 1–52. [CrossRef]
41. Geisslitz, S.; Longin, C.F.H.; Koehler, P.; Scherf, K.A. Comparative quantitative LC-MS/MS analysis of 13amylase/trypsin inhibitors in ancient and modern Triticum species. Sci. Rep. 2020. [CrossRef]
42. De Lourdes Moreno, M.; Cebolla, A.; Muñoz-Suano, A.; Carrillo-Carrion, C.; Comino, I.; Pizarro, A.; León, F.;Rodríguez-Herrera, A.; Sousa, C. Detection of gluten immunogenic peptides in the urine of patients withcoeliac disease reveals transgressions in the gluten-free diet and incomplete mucosal healing. Gut 2017, 66,250–257. [CrossRef]
© 2020 by the authors. Licensee MDPI, Basel, Switzerland. This article is an open accessarticle distributed under the terms and conditions of the Creative Commons Attribution(CC BY) license (http://creativecommons.org/licenses/by/4.0/).
Copyright © 2022 FDOKUMEN