Effective Degradation of Gluten and Its Fragments by ... - MDPI
Upload
independentCategory
view
1download
0
www.elsevier.com/locate/foodchem
Food Chemistry 92 (2005) 7–15
FoodChemistry
Effects of some additives on wheat glutensolubility: A structural approach
Mondher Mejri a, Barbara Roge b, Abdelfattah BenSouissi a,Franck Michels c, Mohamed Mathlouthi b,*
a Laboratoire de Genie Biologique de l�INSAT, Universite de Tunis Carthage, B.P. 676 – 1080 Tunis Nord, Tunisieb Laboratoire de Chimie Physique Industrielle, Faculte des Sciences, UMR 614 FARE, Universite de Reims Champagne Ardenne, Centre Europol�
Agro, B.P. 1039, F-51687 Reims Cedex 2, Francec Societe CHAMTOR, Route de Pomacle, 51110 Bazancourt, France
Received 19 December 2003; received in revised form 6 July 2004; accepted 6 July 2004
Abstract
The effects of KCl, NaCl and cysteine on the solubility in water of partially hydrolyzed gluten were studied at different pH values.
As expected, solubility was shown to depend on solution pH. It decreased to reach a minimal value at the isoelectric pH (pH 6) and
then it increased.
In the presence of additives, the same behaviour was observed with an increase in solubilities values. In fact, an improvement of
solubility of 28–30% was observed in the case of KCl and cysteine, while NaCl was much less efficient. The solubilisation effect of
such additives was found to decrease with the initial concentration of wheat gluten.
The structural investigation, by analysis of the amide I region of the infrared spectra of gluten samples, solubilised in the presence
of additives, showed an increase in the proportion of b-turns and extended structures, accompanied by a decrease in the a-helixproportion. Such results confirm and explain the improvement of wheat gluten solubility by enhancing water–protein bonding
and reducing protein–protein interactions. Structural changes result in a better accessibility of more water molecules to the protein
and in greater hydration and solubilisation effects.
� 2004 Elsevier Ltd. All rights reserved.
Keywords: Gluten; Hydration; Solubility; Additives; Secondary structure; Infrared spectra
1. Introduction
Wheat gluten proteins are composed of monomeric
and polymeric or aggregated prolamines. They are vis-
coelastic when hydrated and are responsible for the elas-
tic texture of wheat flour dough (Shewry, Tatham,
Forde, Kreis, & Miflin, 1986). The limited solubility of
wheat gluten in aqueous solvent has been generally
0308-8146/$ - see front matter � 2004 Elsevier Ltd. All rights reserved.
doi:10.1016/j.foodchem.2004.07.021
* Corresponding author. Tel.: +33 3 26 91 32 39.
E-mail address: [email protected] (M.
Mathlouthi).
attributed to its large molecular size and intermolecular
aggregation, arising from strong non-covalent interac-tions, involving hydrogen bonds and hydrophobic inter-
actions (Weegels, de Groot, Verhoek, & Hammer,
1994). It has been reported that acidic amino acids
and ionizable groups of native gluten are important fac-
tors in accentuating the potential role of ionic interac-
tions and salt effects in the solubility of these proteins
in aqueous solvents (Fu, Sapirstein, & Bushuk, 1996).
Improvement of gluten solubility in water by additionof salts is well documented (Fu et al., 1996; Khalid
et al., 2003; Kim & Bushuk, 1995; Ragab, Babiker, &
8 M. Mejri et al. / Food Chemistry 92 (2005) 7–15
El Tinay, 2003) but no structural evidence of this effect
has been reported.
On the other hand, several studies were devoted to
the effect of hydration on the secondary structure of
gluten, using spectroscopic techniques such as IR, Ra-
man or circular dichroısm spectroscopy. Pezolet, Bon-enfant, Dousseau, and Popineau (1992), have shown
that the solubilisation of gluten proteins results in an
important decrease of the amount of b-sheets, accompa-
nied by an increase of the content of b-turns and a-hel-ical conformation. These results were contrasted with
those of Belton et al. (1995) who found that increasing
hydration appears to influence the conformation of b-sheet and extended chain structures. Such findings arein agreement with Wellner, Belton, and Tatham
(1996) who have shown that the secondary structure
of the fully hydrated gluten proteins was a mixture of
b-turns and extended chains. Popineau, Bonenfant,
Cornec, and Pezolet (1994) have noticed, that in the hy-
drated viscoelastic state, the b-sheet content is higher
than that in solution, whereas, the a-helix content is
lower.It appears, from previous work, that hydration yields
an increase in water-protein interactions via hydrogen
bonds and a rupturing of protein-protein interactions
responsible for the backbone distortion into helical
structures, which can lead to an increase in extended
structure, b-turns and b-sheet.This paper reports the effects of NaCl, KCl and cys-
teine on water solubility of wheat gluten and explores(by FTIR spectroscopy) the resulting secondary struc-
ture modifications. The objective is to obtain informa-
tion on the structural changes of the hydrated protein
in the presence of such additives.
2. Materials and methods
2.1. Materials
The investigated wheat gluten sample was kindly do-
nated by CHAMTOR, (Bazancourt, France) and identi-
fied as partially hydrolyzed gluten (Hydrolysis
Degree = 3%). This gluten contained 86% protein
(N · 5.6) on a dry basis, and 5% moisture, and was ob-
tained after the action of a commercial protease (Neut-rase 0.8 L, Novo Nordisk, Denmark) on native wheat
gluten.
Chemicals used (NaCl, KCl, Cysteine, NaOH and
HCl) were analytical grade Sigma products.
The following symbols are used for the studied gluten
samples: gluten H, the original partially hydrolyzed glu-
ten sample; gluten HN, the dissolved fraction in presence
of 0.2% NaCl; gluten HK, the dissolved fraction in pres-ence of 0.2% KCl; gluten HC, the dissolved fraction in
presence of 0.5% cysteine.
2.2. Determination of the solubility ratio of wheat gluten
in the presence of additives
The effect of additives on the solubility of gluten H
sample was studied as a function of pH. The solubility
of the protein at 1% (w/v) in distilled deionised wateror in the presence of, respectively, 0.2% NaCl (gluten
HN), 0.2% KCl (gluten HK), and 0.5% cysteine (gluten
HC), was determined over a pH range from 2.0 to 10.0.
The dispersion was gently shaken at different pH val-
ues in a shaker (140 jolts/min) at room temperature for 1
h. Finally the supernatant was recovered after centrifu-
gation (20 min at 1500 rpm) and freeze-dried.
The protein concentrations in the supernatant and inthe original samples were determined using the Kjeldhal
method (AOAC, 1995).
The protein solubility was calculated as:
Solubilityð%Þ ¼ P sup
� �= P total½ ��100;
where [Psup] is the protein concentration in g/100 g.This method is derived from that described by Wang
and Zayas (1991).
2.3. Water vapour sorption isotherms
Water vapour sorption isotherms of the above listed
samples were established using the microclimate method
(De Jong, Van den Berg, & Kokelaar, 1996). Equilib-rium relative humidity (ERH) of gas-tight jars were
fixed with saturated salt solutions (LiCl 11%, MgCl2 Æ 6-H2O 33%, K2CO3 Æ 2H2O 44%, NaBr 58%, NaCl 75%,
KBr 82%, K2SO4 97%) (Greenspan, 1977). The adsorp-
tion curves were carried out on previously solubilised
gluten samples in the presence of additives and then
freeze-dried. Gluten was weighted into cupels (1 g) and
maintained at 20 �C under different ERH until equilib-rium (constant weight) was reached after 7 days. At a gi-
ven equilibrium relative humidity (ERH), water content
was calculated and the sorption curve established as
water content = f (ERH).
2.4. FTIR spectra
Samples after dissolution were lyophilized and sub-mitted to equilibrium with humid air (ERH = 96%).
Infrared spectra (200 scans) of humid (ERH = 96%)
additive-free samples and gluten samples containing
additives (0.2% KCl and 0.5% cysteine) were recorded
with a resolution of 2 cm�1 on a Nicolet� infrared spec-
trophotometer (Model ‘‘Impact 410’’) using a thunder-
dome attenuated total reflectance (ATR) accessory.
Hydrated thin layer samples were obtained by regulat-ing the relative humidity. The samples were first vigor-
ously mixed and then humidified to pasty state in a
gas-tight jar in the presence of saturated K2SO4 solu-
tions (ERH = 96%) (AOAC, 1980).
M. Mejri et al. / Food Chemistry 92 (2005) 7–15 9
The interpretation of the changes in the overlapping
amide I i.r. band components, was made possible by
Fourier self-deconvolution using Grams software
(Galactic Industries Corporation, USA). Initial band
parameters were considered as a basis and used for each
new spectrum (Wellner et al., 1996; Belton et al., 1995).
3. Results and discussion
3.1. Effect of additives on the solubility of partially
hydrolyzed gluten at variable pH
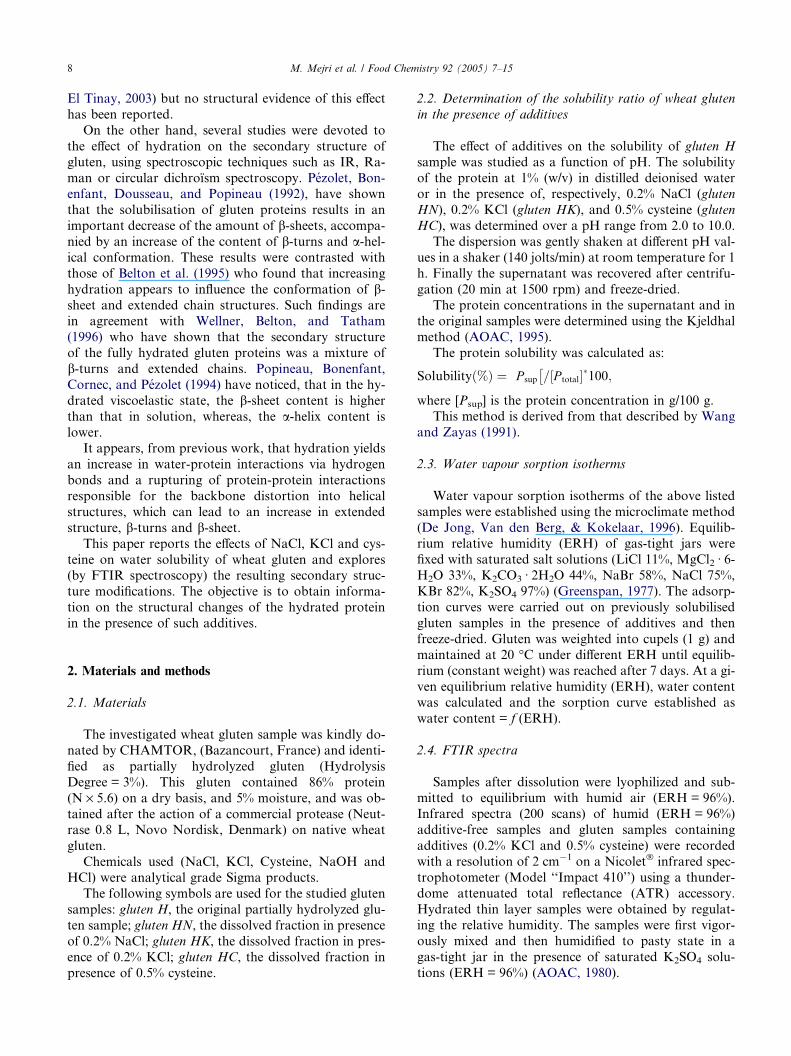
Variation of solubility, as a function of solution pHfor partially hydrolyzed wheat gluten in the absence
and in the presence of cysteine, NaCl and KCl, is shown
in Fig. 1
The curve describing the effect of pH on the solubility
of wheat gluten, in additive-free solution, shows that
this parameter increases with decreasing pH to reach a
minimum value of about 50% at pH 6, followed by an
increase in the region of basic pH. This is not surprisingbecause the minimal solubility of proteins is known to
occur at the isoelectric point, corresponding to the neu-
tral global charge of the proteins and the increase of
association reactions of polypeptide chains at this point
(Drago & Gonzalez, 2001). On both sides of the isoelec-
tric point, the solubility increases, resulting in the in-
crease of the global charge of the ionized protein. The
slightly higher solubility in the alkaline region is dueto the presence of a high proportion of acidic amino-
acids (Glu, Asp) in wheat gluten proteins which are ion-
ized at alkaline pH (Belton et al., 1995; Tatham et al.,
1990).
The curve corresponding to the effect of cysteine
shows the same behaviour, with a relatively higher solu-
bility (about 90%) compared to that obtained in the ab-
40
50
60
70
80
90
100
0 2 4
Solu
bilit
y %
110
Fig. 1. Effect of pH levels on solubility of partially hydrolysed gluten in abse
NaCl (gluten HN: j), 0.5% cysteine (gluten HC: d) and 0.2% KCl (gluten
sence of cysteine, even if the pH is equal to the
isolelectric point. On both sides of the isoelectric point,
the solubility increases to reach 100% at pH 4. Such in-
crease in solubility under the effect of cysteine could be
attributed to its mild reducing property (German & Phil-
lips, 1994). Cysteine is known to reduce the SS bondsand to weaken the protein tertiary structure and conse-
quently to improve the wheat gluten solubility (Popi-
neau, Huchet, Larre, & Berot, 2002).
The curve corresponding to the effect of NaCl shows
different behaviour. A slight solubility-enhancing effect
was observed at pH 4 and 6. The solubilities were,
respectively, 90% and 80%. The solubility is decreased
below the reference curve obtained in the absence ofadditives. Fu et al. (1996) reported that low ionic
strength favours the exposure to solvent of polar and
hydrophilic residues at the surface of the protein and en-
hances gluten solubility. However, at alkaline pH, solu-
bility decrease is very likely due to an increase in
protein–protein interactions via ionic bonds, which re-
sults from the deprotonation of surface polar residues
by salt addition. Similar results on the increasing solu-bility of seed protein isolates at different pH levels at
low NaCl concentrations, were reported in recent papers
(Khalid, Babiker, & Tinay, 2003).
KCl shows behaviour different from that of NaCl,
and comparable to that of cysteine, with higher solubil-
ities at all the tested pH levels which remain above 90%.
It seems that, apart from its effect on the ionic strength,
KCl acts as a water structure-breaker as compared toNaCl which acts as a water structure maker (Mathlou-
thi, Hutteau, & Angiboust, 1996). The increase in mobil-
ity of water molecules in KCl–gluten solutions affects
the water–gluten interactions and the exchange of
hydrating water molecules between gluten surface and
the aqueous environment. Damodaran (1989) showed
that weak concentrations of certain salts result in
6 8 10 12pH
nce of additives (gluten H: }) and, respectively, in the presence of 0.2%
HK: m).

10 M. Mejri et al. / Food Chemistry 92 (2005) 7–15
changes in the structure of water. This affects the water–
b-lactoglobulin interface and contributes to the expo-
sure of polar residues at the surface of the protein which
leads to an enhancement of its solubility.
Oshodi and Ojokan (1997) reported an enhancing of
techno-functional properties of bovine plasma protein,by low salt concentrations, especially solubility, water
absorption and gelation. The effect of KCl on water
absorption of bovine plasma protein gels was reported
to be twice that obtained with NaCl at the same concen-
tration (0.5%). The combined effects of salts and pH
were studied and the reported results are in agreement
with ours. However, no structural arguments were
advanced.In summary, the difficulty in solubilising gluten pro-
teins, arises predominantly from the lack of ionisable
groups and the increase of molecular weight. Factors
which promote the ionization of residues or the disag-
gregation of protein molecules, certainly enhance the
solubility and consequently improve the functional
properties (Bondos & Bicknell, 2003; Singh & MacRit-
chie, 2001).As the effect of NaCl seems negligible, only KCl and
cysteine were used for the following experiments.
3.2. Dependence of solubility enhancement, by additives,
on initial gluten concentration
The effect of additives on solubility was found to de-
pend on initial sample concentration (Fig. 2). A progres-sive decrease in gluten solubility was observed as initial
concentration was increased. The relative decrease in
solubility is about 40% for an increase in gluten concen-
tration from 1% to 10%. The same behaviour was ob-
served in the presence of 0.2% KCl and 0.5% cysteine.
0
10
20
30
40
50
60
70
80
90
100
0 2 4[glute
Solu
bilit
y (%
)
Fig. 2. Effect of initial concentration on the solubility of
However, the drop in solubility is particularly important
in the presence of cysteine: 70% in the same range of ini-
tial gluten concentration. Thus, the solubility-enhancing
effect of cysteine is only possible at very low gluten con-
centration. For KCl, although the solubility remains
above 20% for the tested initial gluten concentrationrange, the drop in solubility is also of the same order
as for cysteine (70%). The increase in protein concentra-
tion yields more protein–protein interactions and causes
the aggregation of proteins, leading to reduction of sol-
ubility. At high gluten concentration, the solubilising ef-
fect of additives and the interactions responsible for this
phenomenon, culminating in hydrophobic interactions
between protein molecules, contributed to the aggrega-tion and precipitation (Bondos & Bicknell, 2003).
3.3. Water vapour sorption isotherms
To understand the hydration behaviour of partially
hydrolyzed gluten and the effect of additives on such
properties, we determined water vapour adsorption iso-
therms over the whole range of water activities (Fig. 3).From the isotherms, it seems clear that gluten HK ad-
sorbs more water vapour, especially for aw values above
0.9. In this aw range (aw > 0.9), the gluten HK sample ad-
sorbed more than once and half a times its dry weight.
For glutenH and glutenHC, the water content did not ex-
ceed, respectively, 0.7 and 0.9 g/100 g (dry basis). The
interactions with ionic additives contributed to exposure
of polar and ionic groups of the protein at the surface andled to increased interactions with water vapour mole-
cules. Ionic interactions (protein–salt–protein) may pro-
mote the formation of a hydrophilic network in which
water molecules aggregate and form micro-droplets
embedded in the protein (Marechal, 1997).
6 8 10 12n] (% (w/v))
gluten H (}), gluten HC (d) and gluten HK (m).

0
0.2
0.4
0.6
0.8
1
1.2
1.4
1.6
1.8
0 0.2 0.4 0.6 0.8 1aw
Wat
er c
onte
nt (
g/g
dry
basi
s)
Fig. 3. Water vapour sorption isotherms, at 20 �C, of gluten H (}), gluten HC (d) and gluten HK (m)
M. Mejri et al. / Food Chemistry 92 (2005) 7–15 11
3.4. Infrared study of the effects of additives on the
behaviour of partially hydrolyzed gluten
3.4.1. Effect on hydration properties
FTIR spectra of soluble gluten samples were re-
corded in the OH stretching region (2800–3800 cm�1)
and are shown in Fig. 4. The observed broad absorption
band is mainly assigned to the OH stretching mode of
water (Servaty, Schiller, Binder, & Arnold, 2001).In the presence of additives (gluten HK and HC), the
intensity of (OH) increases, especially for gluten HK.
Servaty et al. (2001) have correlated the intensity of this
Fig. 4. Infrared spectra in the OH region of freeze-dried and humidified (E
band with the amount of water absorbed by the proteinpolymer. A variation in the shape and area of band is
observed in the presence of additives (Fig. 4), the area
of the OH band being proportional to sample water con-
tent (Grdadolnik & Marechal, 2003; Marechal, 1997;
Servaty et al., 2001; Starzak & Mathlouthi, 2003). These
results confirm that gluten is more hydrated, after solu-
bilising by KCl (gluten HK), than by cysteine (gluten
HC) or in the additive-free sample (gluten H). This isin agreement with the results of water vapour sorption
isotherms. Michels (2000) obtained a perfect correla-
tion between water sorption isotherms, determined by
RH = 96%) soluble fractions of gluten H, gluten HC and gluten HK.
12 M. Mejri et al. / Food Chemistry 92 (2005) 7–15
gravimetric measurements, and those determined by
measuring the area of the OH infrared absorption band
during the hydration process. The same type of correla-
tion was previously observed by (Ruegg & Hani, 1975).
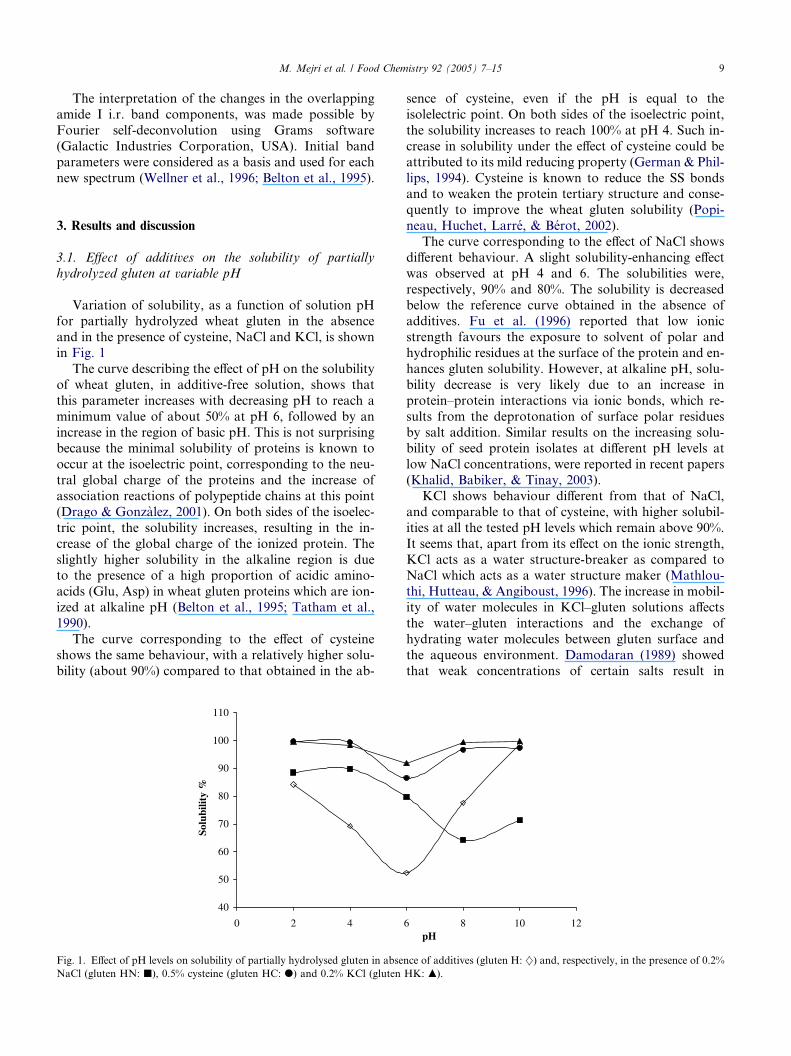
3.4.2. Effect on the secondary structure
Fourier transform infrared spectroscopy was used to
detect structural changes in the secondary structure of
proteins and determine the water binding-properties
(Table 1). Shifts in frequencies of amide I band (1600–
1700 cm�1), as well as those of amide II and amide
III, were correlated with the changes in secondary struc-
ture of proteins (Byler & Susi, 1986; Surewicz &
Mantsch, 1988). Amide I band mainly originates fromthe C@O stretching vibration (Byler & Susi, 1986; Arr-
ondo et al., 1993) and appears as a broad band, centred
at 1650 cm�1 and composed of several overlapping com-
ponent bands due to various protein segments with dif-
ferent structures (Surewicz & Mantsch, 1988).
The deconvolution of amide I band reveals that it is
composed of at least five components situated approxi-
mately at 1615, 1630, 1650, 1670 and 1687 cm�1 (Subi-rade, Kelly, Gueguen, & Pezolet, 1998. Belton et al.
(1995) found, in addition, a shoulder at 1625 cm�1.
The relative assignments of these bands, based on previ-
ous studies, are summarized in Table 1.
In order to investigate the structural effect of cysteine
and KCl on partially hydrolyzed gluten solubility and
hydration, amide I infrared absorption bands were Fou-
rier deconvoluted using the same method and parame-ters as described above. Fig. 5 shows the original
infrared spectra in the amide I region of gluten and addi-
tive containing gluten. The qualitative analysis of spec-
tra reveals a decrease in the intensities of the amide I
bands and in the whole amide region. This supposes that
important changes in the secondary structure have oc-
curred as a result of the effects of additives on the
protein.Fig. 6 shows the deconvoluted amide I band for addi-
tive-free gluten. The deconvolution showed 5 compo-
nents centred at wave-numbers in agreement with
Table 1
Positions and relative assignments, from earlier studies, of the different com
Component band position Assignment
1615 Intermolecular b-sheets due to protein agg
1625 Extended structures
1630 Extended b-sheet structures (hydrated)
1650 a-Helices
1670 b-Turns
1687 b-Sheet structures
those listed in Table 1 and discussed previously. How-
ever, the information provided directly by the deconvo-
luted spectra is only qualitative. Surewicz & Mantsch
(1988) have observed that the fractional areas (inte-
grated intensities of bands) of the resolved component
bands are directly related to the relative populations ofthe conformational structures represented by these
components.
The percentages of secondary structure segments (a-helices, b-sheets or b-turns) have been estimated as the
percentage of the corresponding area by ratios to the to-
tal amide I band area (Surewicz & Mantsch, 1988). This
method was adopted in several studies for the estimation
of protein secondary structure from amide I band ininfrared and Raman spectra (Dousseau & Pezolet,
1990; Lee, Haris, Chapman, & Mitchell, 1990).
We used this method to quantify the change in sec-
ondary structure of gluten in the absence and the pres-
ence of additives and the results obtained are listed in
Table 2.
(Table 2) shows that hydrated gluten H (partially
hydrolyzed gluten) contains 34% of b-sheet, 16% of a-helix and 49% of b-turn structures. According to Lee
et al. (1990) hydrated native gluten contains approxi-
mately equal amounts of b-sheet, a-helix and b-turnstructure (28% of b-sheet, 31% of -helix, 27% of b-turnstructure) and a proportion of extended structures
(15%). Comparison of the secondary structures of native
and partially hydrolyzed gluten, allows the conclusion
that the partial enzymatic hydrolysis of gluten engendersa noticeable decrease of the a-helix content (from 31%
to 16%), with an increase in the b-turn amount from
28% to 49%, accompanied by a weak increase in b-sheetstructure. In fact, the enzymatic hydrolysis reduces the
size of gluten molecules by rupturing of the peptide
chains. This reduces the distortion of the polypeptide
backbone, responsible for bearing of the helical struc-
ture. In fact, partially hydrolyzed gluten is more solublethan native gluten. This is due to the shortage in a-helixstructures which are more hydrophobic, rigid and less
accessible to hydrating water.
ponents resulting from the deconvolution of the amide Iband.
Reference study
regation Surewicz and Mantsch (1988)
Carrier et al. (1990)
Mantsch et al. (1993)
Belton et al. (1995)
Byler and Susi (1986); Surewicz and Mantsch (1988);
Surewicz et al. (1990, 1993)
Byler and Susi (1986)
Byler and Susi (1986); Surewicz and Mantsch (1988);
Mantsch et al. (1993)
Byler and Susi (1986); Surewicz and Mantsch (1988);
Surewicz et al. (1990, 1993)

Fig. 5. Infrared spectra in the amide I and amide II region of freeze-dried and humidified (ERH = 96%) soluble fractions of gluten H, gluten HC and
gluten HK.
Fig. 6. Deconvoluted infrared amide I band of gluten H.
M. Mejri et al. / Food Chemistry 92 (2005) 7–15 13
If we now compare the secondary structure of par-
tially hydrolyzed gluten sample to that solubilised in
the presence of additives, we observe a reduction of a-helices, from 16.3% to 7.5%, in the presence of cysteine
(gluten HC) and to 0.4% in the presence of KCl (gluten
HK). This is accompanied by an increase in b-turns in
the presence of additives. The b-sheet structure showsa certain stability in the presence of cysteine, but it in-
creases in the presence of KCl (from 34% to 42%).
The ratio, a-helix/b-sheet, is divided by two in the pres-
ence of cysteine (from 0.48 to 0.22) and becomes very
weak in the presence of KCl. This ratio expresses the
variation of the secondary structures observed in the
presence of additives. Structural changes of gluten in
the presence of additives, consists in a reduction ofa-helix, which is converted into b-turn structures. Such
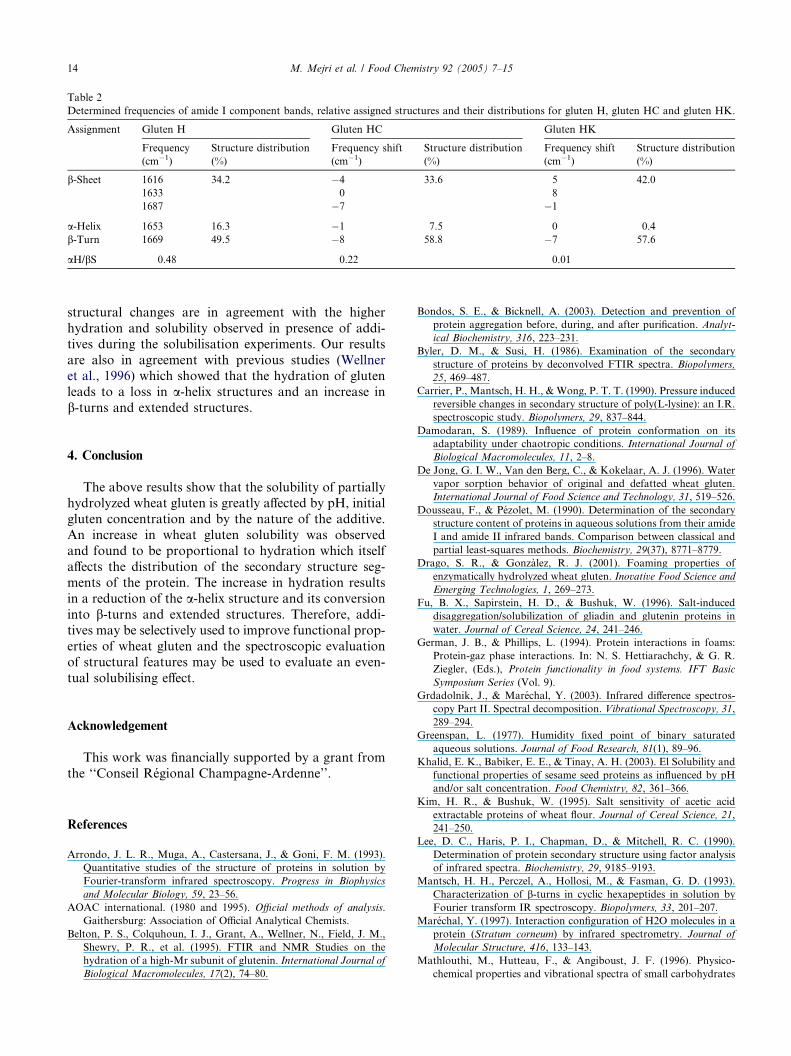
Table 2
Determined frequencies of amide I component bands, relative assigned structures and their distributions for gluten H, gluten HC and gluten HK.
Assignment Gluten H Gluten HC Gluten HK
Frequency
(cm�1)
Structure distribution
(%)
Frequency shift
(cm�1)
Structure distribution
(%)
Frequency shift
(cm�1)
Structure distribution
(%)
b-Sheet 1616 34.2 �4 33.6 5 42.0
1633 0 8
1687 �7 �1
a-Helix 1653 16.3 �1 7.5 0 0.4
b-Turn 1669 49.5 �8 58.8 �7 57.6
aH/bS 0.48 0.22 0.01
14 M. Mejri et al. / Food Chemistry 92 (2005) 7–15
structural changes are in agreement with the higher
hydration and solubility observed in presence of addi-
tives during the solubilisation experiments. Our results
are also in agreement with previous studies (Wellneret al., 1996) which showed that the hydration of gluten
leads to a loss in a-helix structures and an increase in
b-turns and extended structures.
4. Conclusion
The above results show that the solubility of partiallyhydrolyzed wheat gluten is greatly affected by pH, initial
gluten concentration and by the nature of the additive.
An increase in wheat gluten solubility was observed
and found to be proportional to hydration which itself
affects the distribution of the secondary structure seg-
ments of the protein. The increase in hydration results
in a reduction of the a-helix structure and its conversion
into b-turns and extended structures. Therefore, addi-tives may be selectively used to improve functional prop-
erties of wheat gluten and the spectroscopic evaluation
of structural features may be used to evaluate an even-
tual solubilising effect.
Acknowledgement
This work was financially supported by a grant from
the ‘‘Conseil Regional Champagne-Ardenne’’.
References
Arrondo, J. L. R., Muga, A., Castersana, J., & Goni, F. M. (1993).
Quantitative studies of the structure of proteins in solution by
Fourier-transform infrared spectroscopy. Progress in Biophysics
and Molecular Biology, 59, 23–56.
AOAC international. (1980 and 1995). Official methods of analysis.
Gaithersburg: Association of Official Analytical Chemists.
Belton, P. S., Colquhoun, I. J., Grant, A., Wellner, N., Field, J. M.,
Shewry, P. R., et al. (1995). FTIR and NMR Studies on the
hydration of a high-Mr subunit of glutenin. International Journal of
Biological Macromolecules, 17(2), 74–80.
Bondos, S. E., & Bicknell, A. (2003). Detection and prevention of
protein aggregation before, during, and after purification. Analyt-
ical Biochemistry, 316, 223–231.
Byler, D. M., & Susi, H. (1986). Examination of the secondary
structure of proteins by deconvolved FTIR spectra. Biopolymers,
25, 469–487.
Carrier, P., Mantsch, H. H., & Wong, P. T. T. (1990). Pressure induced
reversible changes in secondary structure of poly(L-lysine): an I.R.
spectroscopic study. Biopolymers, 29, 837–844.
Damodaran, S. (1989). Influence of protein conformation on its
adaptability under chaotropic conditions. International Journal of
Biological Macromolecules, 11, 2–8.
De Jong, G. I. W., Van den Berg, C., & Kokelaar, A. J. (1996). Water
vapor sorption behavior of original and defatted wheat gluten.
International Journal of Food Science and Technology, 31, 519–526.
Dousseau, F., & Pezolet, M. (1990). Determination of the secondary
structure content of proteins in aqueous solutions from their amide
I and amide II infrared bands. Comparison between classical and
partial least-squares methods. Biochemistry, 29(37), 8771–8779.
Drago, S. R., & Gonzalez, R. J. (2001). Foaming properties of
enzymatically hydrolyzed wheat gluten. Inovative Food Science and
Emerging Technologies, 1, 269–273.
Fu, B. X., Sapirstein, H. D., & Bushuk, W. (1996). Salt-induced
disaggregation/solubilization of gliadin and glutenin proteins in
water. Journal of Cereal Science, 24, 241–246.
German, J. B., & Phillips, L. (1994). Protein interactions in foams:
Protein-gaz phase interactions. In: N. S. Hettiarachchy, & G. R.
Ziegler, (Eds.), Protein functionality in food systems. IFT Basic
Symposium Series (Vol. 9).
Grdadolnik, J., & Marechal, Y. (2003). Infrared difference spectros-
copy Part II. Spectral decomposition. Vibrational Spectroscopy, 31,
289–294.
Greenspan, L. (1977). Humidity fixed point of binary saturated
aqueous solutions. Journal of Food Research, 81(1), 89–96.
Khalid, E. K., Babiker, E. E., & Tinay, A. H. (2003). El Solubility and
functional properties of sesame seed proteins as influenced by pH
and/or salt concentration. Food Chemistry, 82, 361–366.
Kim, H. R., & Bushuk, W. (1995). Salt sensitivity of acetic acid
extractable proteins of wheat flour. Journal of Cereal Science, 21,
241–250.
Lee, D. C., Haris, P. I., Chapman, D., & Mitchell, R. C. (1990).
Determination of protein secondary structure using factor analysis
of infrared spectra. Biochemistry, 29, 9185–9193.
Mantsch, H. H., Perczel, A., Hollosi, M., & Fasman, G. D. (1993).
Characterization of b-turns in cyclic hexapeptides in solution by
Fourier transform IR spectroscopy. Biopolymers, 33, 201–207.
Marechal, Y. (1997). Interaction configuration of H2O molecules in a
protein (Stratum corneum) by infrared spectrometry. Journal of
Molecular Structure, 416, 133–143.
Mathlouthi, M., Hutteau, F., & Angiboust, J. F. (1996). Physico-
chemical properties and vibrational spectra of small carbohydrates

M. Mejri et al. / Food Chemistry 92 (2005) 7–15 15
in aqueous solution and the role of water in their sweet taste. Food
Chemistry, 56, 215–221.
Michels Franck. (2000). Contribution a l�etude des proprietes physico-chimiques des glutens de ble. Memoire CNAM – Reims, specialite
Biochimie Industrielle et agroalimentaire. 5 juillet 2000. p. 145.
Oshodi, A. A., & Ojokan, E. B. (1997). Effect of salts on some of the
functional properties of bovine plasma protein concentrate. Food
Chemistry, 59, 333–338.
Pezolet, M., Bonenfant, S., Dousseau, F., & Popineau, Y. (1992).
Conformation of wheat gluten proteins. Comparison between
functional and solution state as determined by infrared spectros-
copy. FEBS Letters, 299(3), 247–250.
Popineau, Y., Bonenfant, S., Cornec, M., & Pezolet, M. (1994). A
study by infrared spectroscopy of the conformations of gluten
proteins differing in their gliadin and glutenin compositions.
Journal of Cereal Science, 20, 15–22.
Popineau, Y., Huchet, B., Larre, C., & Berot, S. (2002). Foaming and
emulsifying properties of fractions of gluten peptides obtained by
limited enzymatic hydrolysis and ultrafiltration. Journal of Cereal
Science, 35, 327–335.
Ragab, D. M., Babiker, E. E., & El Tinay, A. H. (2003). Fractionation,
solubility and functional properties of cowpea (Vigna unguicullata)
proteins as effected by pH and/or salt concentration. Food
Chemistry, 84, 207–212.
Ruegg, M., & Hani, H. (1975). Infrared spectroscopy of the water
vapor sorption process of caseins. Biochimica et Biophysica Acta,
400, 17–23.
Servaty, R., Schiller, J., Binder, H., & Arnold, K. (2001). Hydration of
polymeric components of cartilage-an infrared spectroscopic study
on hyaluronic acid and chondroitin sulfate. International Journal of
Biological Macromolecules, 28, 121–127.
Shewry, P. R., Tatham, A. S., Forde, J., Kreis, M., & Miflin, B. J.
(1986). The classification and nomenclature of wheat gluten
proteins: A reassessment. Journal of Cereal Science, 4, 97–106.
Singh, H., & MacRitchie, F. (2001). Application of polymer
science to properties of gluten. Journal of Cereal Science, 33,
231–243.
Starzak, M., & Mathlouthi, M. (2003). Cluster composition of liquid
water derived from laser-Raman spectra and molecular simulation
data. Food Chemistry, 82, 3–22.
Subirade, M., Kelly, I., Gueguen, J., & Pezolet, M. (1998). Molecular
basis of film formation from a soybean protein: Comparison
between the conformation of glycinin in aqueous solution and in
films. International Journal of Biological Macromolecules, 23,
241–249.
Surewicz, W. K., Leddy, J. J., & Mantsch, H. H. (1990). Structure,
stability and receptor interaction of cholera toxin as studied by
infrared spectroscopy. Biochemistry, 29, 8101–8111.
Surewicz, W. K., & Mantsch, H. H. (1988). New insight into protein
secondary structure from resolution-enhanced infrared spectra.
Biochimica et Biophysica Acta, 952, 115–130.
Surewicz, W. K., Montsch, H. H., & Chapman, P. (1993). Determi-
nation of protein secondary structure by Fourier transform
infrared spectroscopy. A critical assessment. Biochemistry, 32,
389–394.
Tatham, A. S., Drake, A. F., & Shewry, P. R. (1990). Conformational
studies of synthetic peptides corresponding to repetitive regions of
the high molecular weight (HMW) glutenin subunits of wheat.
Journal of Cereal Science, 11, 189–200.
Wang, C. R., & Zayas, J. F. (1991). Water retention and solubility of
soy proteins and corn germ proteins in a model system. Journal of
Food Science, 56(2), 455–458.
Weegels, P. L., de Groot, A. M. G., Verhoek, J. A., & Hammer, R. J.
(1994). Effects on gluten of heating at different moisture contents.
II. Changes in functional properties. Journal of Cereal Science, 19,
39–47.
Wellner, N., Belton, P. S., & Tatham, A. (1996). Fourier transform IR
solid state of x-gliadins. Biochemical Journal, 319, 741–747.
Copyright © 2022 FDOKUMEN