
Nanolubricant Oil Additives for Performance Improvement of ...
11
1 Nanolubricant Oil Additives for Performance Improvement of the Intermediate Gearbox in the AH-64D Helicopter K.M. Gouda [email protected] Graduate Research Assistant Mechanical Engineering University of South Carolina Columbia, SC USA 29208 J.A Tarbutton [email protected] Assistant Professor Mechanical Engineering University of South Carolina Columbia, SC USA 29208 Jacob McVay Abdel Bayoumi [email protected] [email protected] Testing Manager Professor Condition-Based Maintenance Mechanical Engineering University of South Carolina University of South Carolina Columbia, SC USA 29208 Columbia, SC USA 20208 ABSTRACT This paper presents a new nanolubricant for the intermediate gearbox of the Apache aircraft. Historically, the intermediate gearbox has been prone for grease leaking and this natural-occurring fault has negatively impacted the airworthiness of the aircraft. In this study, the incorporation of graphite nanoparticles in mobile aviation gear oil is presented as a nanofluid with excellent thermo-physical properties. Condition-based maintenance practices are demonstrated where four nanoparticle additive oil samples with different concentrations are tested in a full-scale tail rotor drive-train test stand, in addition to, a baseline sample for comparison purposes. Different condition monitoring results suggest the capacity of the nanofluids to have significant gearbox performance benefits when compared to the base oil. INTRODUCTION The intermediate gearbox is located on the tail rotor drive- train (TRDT) of the Apache (AH-64) helicopter and it serves the purpose of transmitting torque across the drive-train. The IGB is a grease-lubricated transmission system. The main function of the lubricant is to maintain a fluid film between the moving surfaces, to minimize metal to metal contact in the gearbox when subjected to heavy loads. A secondary objective is to remove heat generated due to friction. One major problem of these gearboxes is the ejection of grease through their breather port as presented in Figure 1. In the field, this issue presents a serious inconvenience to maintenance crews. Grease leakage can cause the immediate landing of the aircraft to perform extensive maintenance procedures and part removals 1 . After a long period of operation with this fault, excessive wear, erosion, high vibration characteristics, overheating can have a negative impact on the gearbox’s performance. A study was conducted on an IGB at the Condition-Based Maintenance (CBM) test stand at the University of South Carolina. After several hours of operation, an unexpected rapid change of gearbox temperature was observed. An over- temperature of 300˚F occurred and the test stand was warranted for shutdown due to threshold limit exceedance of 295 ˚F. Vibration signatures and tear down analysis findings of the gearbox were inconclusive. There was no indication of abnormal behavior of gear teeth or damage to roller Presented at the AHS 70th Annual Forum, Montréal, Québec, Canada, May 20–22, 2014. Copyright © 2014 by the American Helicopter Society International, Inc. All rights reserved. bearing elements. It was theorized that the reason for this sudden heat generation and grease leaking was not due to mechanical phenomena such as friction and wear, but rather to the chemical decomposition of grease to thin oil. Figure 1. Ejection grease column in intermediate gearbox Another IGB experiment at USC-CBM 2 was investigated. The main purpose of this experiment was to test the gearbox with oil instead of the conventional used grease lubricant and to compare the performance. Vibration results were inconclusive and, as expected, oil was found to show potential by having a lower operating temperature than grease. A Tail rotor gearbox (TGB) experiment performed by Goodman et al. 3 concluded the possibility of viscosity Breather port
-
Upload
khangminh22 -
Category
Documents
-
view
4 -
download
0
Transcript of Nanolubricant Oil Additives for Performance Improvement of ...

1
Nanolubricant Oil Additives for Performance Improvement of the Intermediate
Gearbox in the AH-64D Helicopter
K.M. Gouda
Graduate Research Assistant
Mechanical Engineering
University of South Carolina
Columbia, SC USA 29208
J.A Tarbutton
Assistant Professor
Mechanical Engineering
University of South Carolina
Columbia, SC USA 29208
Jacob McVay Abdel Bayoumi
[email protected] [email protected]
Testing Manager Professor
Condition-Based Maintenance Mechanical Engineering
University of South Carolina University of South Carolina
Columbia, SC USA 29208 Columbia, SC USA 20208
ABSTRACT
This paper presents a new nanolubricant for the intermediate gearbox of the Apache aircraft. Historically, the
intermediate gearbox has been prone for grease leaking and this natural-occurring fault has negatively impacted the
airworthiness of the aircraft. In this study, the incorporation of graphite nanoparticles in mobile aviation gear oil is
presented as a nanofluid with excellent thermo-physical properties. Condition-based maintenance practices are
demonstrated where four nanoparticle additive oil samples with different concentrations are tested in a full-scale tail
rotor drive-train test stand, in addition to, a baseline sample for comparison purposes. Different condition monitoring
results suggest the capacity of the nanofluids to have significant gearbox performance benefits when compared to the
base oil.
INTRODUCTION
The intermediate gearbox is located on the tail rotor drive-
train (TRDT) of the Apache (AH-64) helicopter and it serves
the purpose of transmitting torque across the drive-train. The
IGB is a grease-lubricated transmission system. The main
function of the lubricant is to maintain a fluid film between
the moving surfaces, to minimize metal to metal contact in
the gearbox when subjected to heavy loads. A secondary
objective is to remove heat generated due to friction.
One major problem of these gearboxes is the ejection of
grease through their breather port as presented in Figure 1.
In the field, this issue presents a serious inconvenience to
maintenance crews. Grease leakage can cause the immediate
landing of the aircraft to perform extensive maintenance
procedures and part removals 1. After a long period of
operation with this fault, excessive wear, erosion, high
vibration characteristics, overheating can have a negative
impact on the gearbox’s performance.
A study was conducted on an IGB at the Condition-Based
Maintenance (CBM) test stand at the University of South
Carolina. After several hours of operation, an unexpected
rapid change of gearbox temperature was observed. An over-
temperature of 300˚F occurred and the test stand was
warranted for shutdown due to threshold limit exceedance of
295 ˚F. Vibration signatures and tear down analysis findings
of the gearbox were inconclusive. There was no indication
of abnormal behavior of gear teeth or damage to roller
Presented at the AHS 70th Annual Forum, Montréal,
Québec, Canada, May 20–22, 2014. Copyright © 2014 by
the American Helicopter Society International, Inc. All
rights reserved.
bearing elements. It was theorized that the reason for this
sudden heat generation and grease leaking was not due to
mechanical phenomena such as friction and wear, but rather
to the chemical decomposition of grease to thin oil.
Figure 1. Ejection grease column in intermediate
gearbox
Another IGB experiment at USC-CBM 2 was investigated.
The main purpose of this experiment was to test the gearbox
with oil instead of the conventional used grease lubricant
and to compare the performance. Vibration results were
inconclusive and, as expected, oil was found to show
potential by having a lower operating temperature than
grease. A Tail rotor gearbox (TGB) experiment performed
by Goodman et al. 3 concluded the possibility of viscosity
Breather port

2
changes in the lubricant to affect vibration, temperature and
some condition indicators (CIs). Consequently, all of these
studies have shown one common interest: The need for
better lubricant performance in the AH-64 drive-train
gearboxes.
Nanofluids have captured huge attention in the past decade
as a new class of material with excellent cooling capabilities
in a variety of applications 4. Nanofluids are colloidal
suspension of sub-micron or nano-sized solid particles
dispersed in the fluid forming a two phase solid-liquid
mixture. These nanomaterial additives are dispersed
thoroughly in the liquid phase and are intended to boost the
thermo-physical properties of the base fluid. Furthermore,
the distinctive high surface-area-to volume ratio of the
nanoparticles (NPs) enhances surface functionality, resulting
in nanofluids having superior heat transfer characteristics
when compared to the conventional fluids with no additives.
There are numerous experimental and theoretical studies on
nanofluids that have been thoroughly investigated in the
literature. For example, Song et al.5 studied experimentally
the rheological properties of different concentrations of
nanofluids and nanolubricants using aircraft grease as the
base fluid. Another study conducted by Koo et al. 6
was
undertaken to understand the mechanism behavior of the
NPs and their interactions in the fluid. They theoretically
developed a new model to predict the effective thermal
conductivity and effective viscosity of nanofluids. The
results were in agreement with available experimental data.
Most of the presented literature only suggests the potential
of nanofluids in heat transfer applications based on small lab
scale experimental investigations or theory. However, the
application of nanofluids in complex mechanical systems
remains limited and is not sufficiently reported. The main
goal of this work is to validate the proof-of-concept of
nanofluids and to gain leverage of this new technology for
the CBM system. Nanofluids are presented as a new
approach for lubrication in a real helicopter gearbox to
increase its performance, improve tirbological characteristics
and reduce oil temperature which slows breakdown of the
fluid film between moving parts.
The purpose of this paper is to study the impact of different
nanolubricant additives on the dynamics of the IGB system.
EXPERIMENTAL WORK
Nanolubricant testing
Four samples with different concentrations of graphite
nanoparticle additives in the AGL and one baseline oil
sample with no NPs were investigated at the CBM test stand.
Scanning electron micrographs in Figure 2 revealed the flake
like morphology of the particles before dispersion. The
particles are expected to be in the range of 100 nm in
diameter. Table 1 presents a list of the nanolubricants that
were used in testing. In a previous related study 7, these
samples were experimentally studied off-line and showed
superior thermo-physical properties than the base oil with no
nanoparticles.
Table 1. AGL nanolubricants for testing
Sample name Concentration
(vol %)
Base Fluid
XG-0A
XG-2A
XG-2B
XG-2C
1 % AGL
1.5 % AGL
2 % AGL
2.5 % AGL
Figure 2. SEM schematics of graphite nanoparticles
Full-load AH-64 test stand
The CBM test stand at USC is a full-scale AH-64 test stand.
It is designed to incorporate all drive-train components and
emulate the operating conditions of the drive-train as on an
actual helicopter. The test stand is a constant-speed and
dynamic-loading power transmission system, starting from
the main transmission tail rotor take-off to the tail rotor
swashplate assembly. As illustrated in Figure 3, the tail rotor
drive shafts are spun at 4863 RPM throughout the duration
of a single test run and each test lasts approximately 4 hours.
The prime mover for the drive-train is an 800 hp motor
controlled by a variable frequency drive. An absorption
motor similar to the prime mover creates the braking torque
required and acts as a generator. Torque is ramped up from 0
ft-lb to 1223 ft-lb during the experimental run with a 10
minute survey at a constant load step of 111ft-lb. These
specific conditions of speed, time of test and load are met to
match flight regimes as requested by the Army Engineering
Directorate 3. Overall, the test stand provides a scientific
understanding of failure modes of the aircraft drive-train
components: Hanger bearings, IGB and TGB.
No-load AH-64 test stand

3
The purpose of the no-load experiment was to filter out
poorly performed samples based on their responses. The no-
load test stand in Figure 4 is capable of being used as a
preliminary test bed for components before moving to the
full-load test stand. Currently, the no-load test stand is set up
similarly to the tail rotor drive-train test stand. This test
stand is driven by a 5 horsepower motor and it allows for
full speed testing of components without applying a torque
load. It is to be noted that there are difficulties in
establishing which frequencies belong to what components
due to noise and/or due to components sharing similar
frequencies. For the purpose of this research, as much as
possible, analysis is performed as if no other AH-64
vibration information exists.
Figure 3. AH-64 drive-train. Drive-train on actual AH-64
(top) and test stand at USC (bottom)
Methodology
The experimental investigation started at the no-load test
stand on an IGB that was removed from an aircraft after
completing its required maintenance hours (Figure 4). A
design of experiment approach was applied where the five
oil samples were tested as the lubricant for the IGB
throughout a thirty minute test run per sample. Numerous
vibration and temperature responses were monitored and
measured via installed sensors. After each experimental run,
the gearbox was flushed and drained completely at least 3
times using flushing oil to be ready for the next experiment.
XG-2B was found to be the best performing nanofluid from
all the tested lubricants based on the IGB’s output
characteristics and was moved to the full-load test stand for
a 4 hour experimental run where further measurements and
analysis were performed. For comparison purposes, the
baseline AGL was also tested for a 4 hour run. Once again,
several vibration and temperature signatures were measured.
Figure 4. IGB on no-load test stand (Top) and close-up of
the IGB used for the testing (bottom)
Data Description
The no-load test stand employs a National Instruments (NI)
data acquisition system (DAQ) to collect raw vibration and
temperature data. Three acquisitions with a total period of 4
seconds were sampled as shown in Figure 5 during the thirty
minute experimental run for the different lubricants.
The full load TRDT employs two DAQs for the collection of
vibration, temperature and other data from the drive-train
components. The first is known as Modernized Signal
Processing Unit (MSPU): a CBM military tool currently
installed onboard the AH-64 helicopter (Figure 5). The
MSPU is a DAQ optimized for representing processed
vibration data, which is the diagnostic parameter or CI. The
data is processed through filtering, FFT and other
convolution functions built into the MSPU. The second is a
NI DAQ that operates in parallel to MSPU and collects the
discrete vibration time-series data. A hanning window is
used to smooth out responses. NI DAQ runs with custom
written code using LABVIEW software and the raw data
was acquired simultaneously with MSPU as vibration
Oil service port

4
surveys during the load steps of the four hour run. These raw
vibration data acquisitions were represented as four seconds
of total sampling period and both DAQs are survived at a
sampling frequency (fs) of 48 KHz. The purpose of the NI
DAQ is to help in providing complete information on the
health of the gearbox.
Vibration data from both no-load and full-load test sands are
thoroughly investigated using temporal, spectral and wavelet
analyses.
GEARBOX CONDITION INDICATORS
CIs are an indication of vibration due to mechanical
behavior. They are based on the spectral analysis. Multiple
CIs are used in the diagnostic process for different
components. The following are some of the most common,
open-literature algorithms used for machinery diagnostics on
gearboxes, specifically for gears8.
Zero-order Figure of Merit (FM0)
The FM0 is defined as the peak-to-peak of the time signal
average normalized by the sum of gear mesh frequency
(GMF) and its harmonics:
Figure 5. Vibration data acquisition on the no-load stand
(Top) and the MSPU (bottom)
( ) ( )
∑ ( )
(1)
where A (fi) is the sum of amplitudes of the i-th harmonic of
the GMF.
FM0 is a robust condition indicator. It is sensitive to major
faults in gear meshes such as tooth breakage and uniform
wear and an increase in peak- to- peak level is generally
observed without significant change in the mesh frequency,
which results in an increased level of FM0.
In case of uniform wear, the peak-to-peak does not change
appreciably, but the meshing frequencies decrease. The
meshing surface is affected and degrades significantly. The
energy is redistributed from the GMF to the modulating
sidebands and again this result in increase of FM0 values.
Root Mean Square (RMS) of Signal Average RMS is a good time domain indicator in tracking the overall
noise level and is a measure of the power content in the
signal. RMS is given by:
RMS(x(n)) √
∑
(2)
where xn is the data series of length N.
Fourth-order Figure of Merit (FM4)
This frequency domain indicator is sensitive to localized
faults in gear teeth and was developed to detect changes in
the vibration pattern resulting from damage on a limited
number of gear teeth. FM4 is calculated by applying the
fourth normalized statistical moment to the difference signal
as follows:
FM4 = √
∑ ( )
(3)
Where di is the difference signal, d is the mean value of
difference signal and N is the total number of data points in
the time record. A difference signal from a gear in good
condition will be primarily Gaussian noise therefore
resulting in an FM4 value of 3. As a defect develops in a
tooth, peaks will grow in the difference signal that will result
in the value to increase beyond 3.
WAVELET ANALYSIS
Wavelet Transform
Wavelet transform is the convolution of the signal x (t) with
a set of wavelets of various scales and shifts in time.
(Figure 6). The output at a given time and scale is known as
the wavelet transform coefficient. The continuous wavelet
transform (CWT) is defined in the discrete form as a
function of two variables and performs the following inner
product operation:
( )
√| |∑ ( ) (
( )
)
(6)
Where C is the wavelet coefficient, s is the scale, τ is the
translation or the location of the window, ѱ is the mother
wavelet and the symbol * stands for complex conjugate. The
energy of the wavelet is normalized by 1/√| |, so that the
wavelets would have the same unit energy at every scale.
Mother Wavelet
5
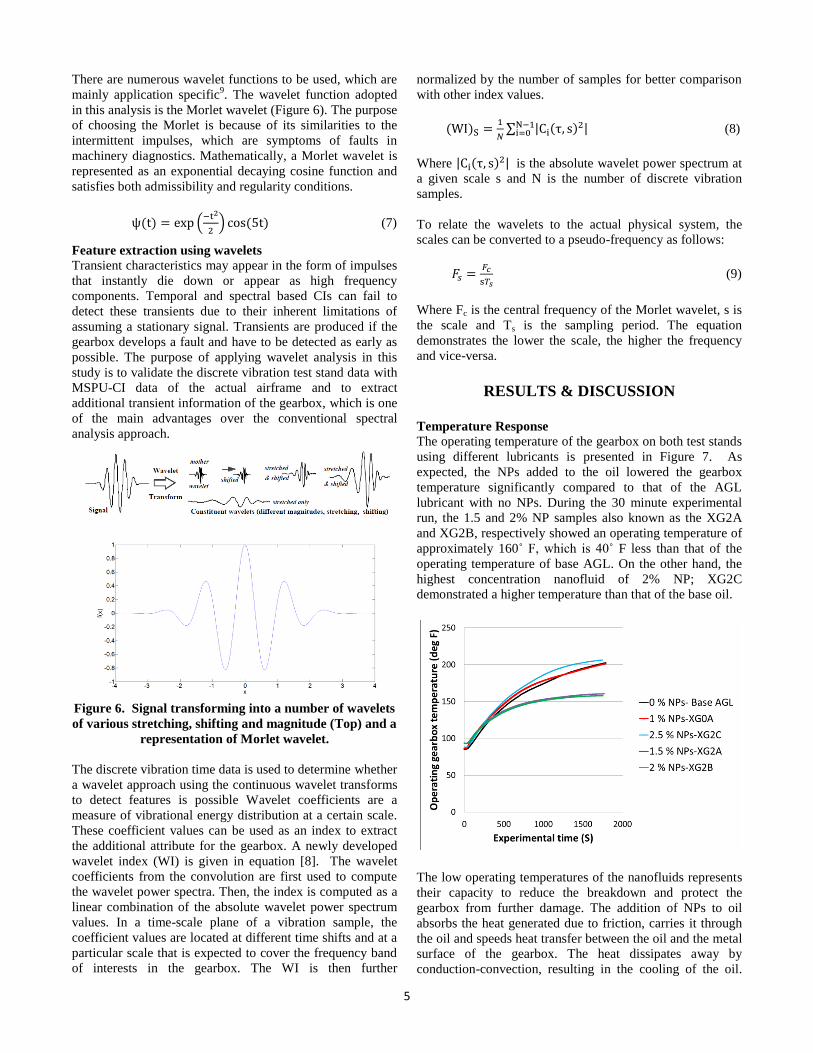
There are numerous wavelet functions to be used, which are
mainly application specific9. The wavelet function adopted
in this analysis is the Morlet wavelet (Figure 6). The purpose
of choosing the Morlet is because of its similarities to the
intermittent impulses, which are symptoms of faults in
machinery diagnostics. Mathematically, a Morlet wavelet is
represented as an exponential decaying cosine function and
satisfies both admissibility and regularity conditions.
( ) (
) ( ) (7)
Feature extraction using wavelets
Transient characteristics may appear in the form of impulses
that instantly die down or appear as high frequency
components. Temporal and spectral based CIs can fail to
detect these transients due to their inherent limitations of
assuming a stationary signal. Transients are produced if the
gearbox develops a fault and have to be detected as early as
possible. The purpose of applying wavelet analysis in this
study is to validate the discrete vibration test stand data with
MSPU-CI data of the actual airframe and to extract
additional transient information of the gearbox, which is one
of the main advantages over the conventional spectral
analysis approach.
Figure 6. Signal transforming into a number of wavelets
of various stretching, shifting and magnitude (Top) and a
representation of Morlet wavelet.
The discrete vibration time data is used to determine whether
a wavelet approach using the continuous wavelet transforms
to detect features is possible Wavelet coefficients are a
measure of vibrational energy distribution at a certain scale.
These coefficient values can be used as an index to extract
the additional attribute for the gearbox. A newly developed
wavelet index (WI) is given in equation [8]. The wavelet
coefficients from the convolution are first used to compute
the wavelet power spectra. Then, the index is computed as a
linear combination of the absolute wavelet power spectrum
values. In a time-scale plane of a vibration sample, the
coefficient values are located at different time shifts and at a
particular scale that is expected to cover the frequency band
of interests in the gearbox. The WI is then further
normalized by the number of samples for better comparison
with other index values.
( )
∑ | ( )
| (8)
Where | ( ) | is the absolute wavelet power spectrum at
a given scale s and N is the number of discrete vibration
samples.
To relate the wavelets to the actual physical system, the
scales can be converted to a pseudo-frequency as follows:
(9)
Where Fc is the central frequency of the Morlet wavelet, s is
the scale and Ts is the sampling period. The equation
demonstrates the lower the scale, the higher the frequency
and vice-versa.
RESULTS & DISCUSSION
Temperature Response
The operating temperature of the gearbox on both test stands
using different lubricants is presented in Figure 7. As
expected, the NPs added to the oil lowered the gearbox
temperature significantly compared to that of the AGL
lubricant with no NPs. During the 30 minute experimental
run, the 1.5 and 2% NP samples also known as the XG2A
and XG2B, respectively showed an operating temperature of
approximately 160˚ F, which is 40˚ F less than that of the
operating temperature of base AGL. On the other hand, the
highest concentration nanofluid of 2% NP; XG2C
demonstrated a higher temperature than that of the base oil.
The low operating temperatures of the nanofluids represents
their capacity to reduce the breakdown and protect the
gearbox from further damage. The addition of NPs to oil
absorbs the heat generated due to friction, carries it through
the oil and speeds heat transfer between the oil and the metal
surface of the gearbox. The heat dissipates away by
conduction-convection, resulting in the cooling of the oil.
6
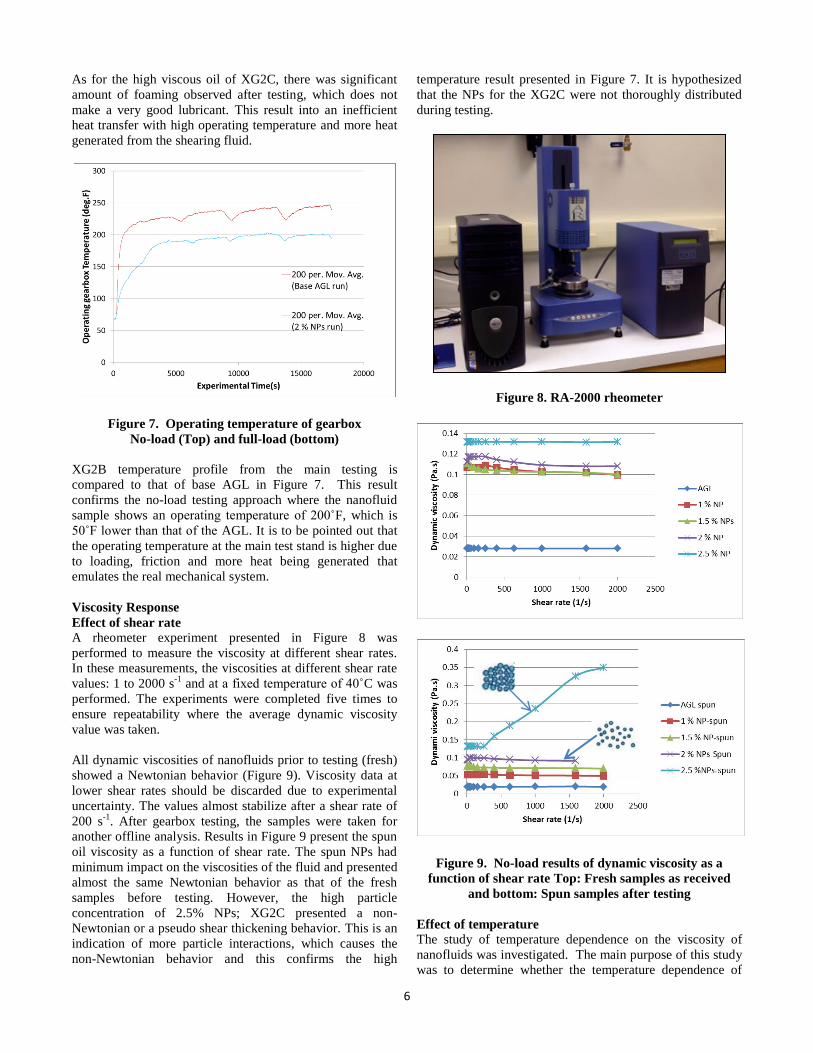
As for the high viscous oil of XG2C, there was significant
amount of foaming observed after testing, which does not
make a very good lubricant. This result into an inefficient
heat transfer with high operating temperature and more heat
generated from the shearing fluid.
Figure 7. Operating temperature of gearbox
No-load (Top) and full-load (bottom)
XG2B temperature profile from the main testing is
compared to that of base AGL in Figure 7. This result
confirms the no-load testing approach where the nanofluid
sample shows an operating temperature of 200˚F, which is
50˚F lower than that of the AGL. It is to be pointed out that
the operating temperature at the main test stand is higher due
to loading, friction and more heat being generated that
emulates the real mechanical system.
Viscosity Response
Effect of shear rate
A rheometer experiment presented in Figure 8 was
performed to measure the viscosity at different shear rates.
In these measurements, the viscosities at different shear rate
values: 1 to 2000 s-1
and at a fixed temperature of 40˚C was
performed. The experiments were completed five times to
ensure repeatability where the average dynamic viscosity
value was taken.
All dynamic viscosities of nanofluids prior to testing (fresh)
showed a Newtonian behavior (Figure 9). Viscosity data at
lower shear rates should be discarded due to experimental
uncertainty. The values almost stabilize after a shear rate of
200 s-1
. After gearbox testing, the samples were taken for
another offline analysis. Results in Figure 9 present the spun
oil viscosity as a function of shear rate. The spun NPs had
minimum impact on the viscosities of the fluid and presented
almost the same Newtonian behavior as that of the fresh
samples before testing. However, the high particle
concentration of 2.5% NPs; XG2C presented a non-
Newtonian or a pseudo shear thickening behavior. This is an
indication of more particle interactions, which causes the
non-Newtonian behavior and this confirms the high
temperature result presented in Figure 7. It is hypothesized
that the NPs for the XG2C were not thoroughly distributed
during testing.
Figure 8. RA-2000 rheometer
Figure 9. No-load results of dynamic viscosity as a
function of shear rate Top: Fresh samples as received
and bottom: Spun samples after testing
Effect of temperature
The study of temperature dependence on the viscosity of
nanofluids was investigated. The main purpose of this study
was to determine whether the temperature dependence of
7
viscosity of nanofluids is dominated by the base fluid or
influenced by the NPs. The dynamic viscosity of the spun
nanofluids was measured with a viscometer at a temperature
range of 8-56˚C. For appropriate convenience, a relative
viscosity (µr) is defined as the ratio of dynamic viscosity of
nanofluid to that of the base fluid (µnf / µbf).
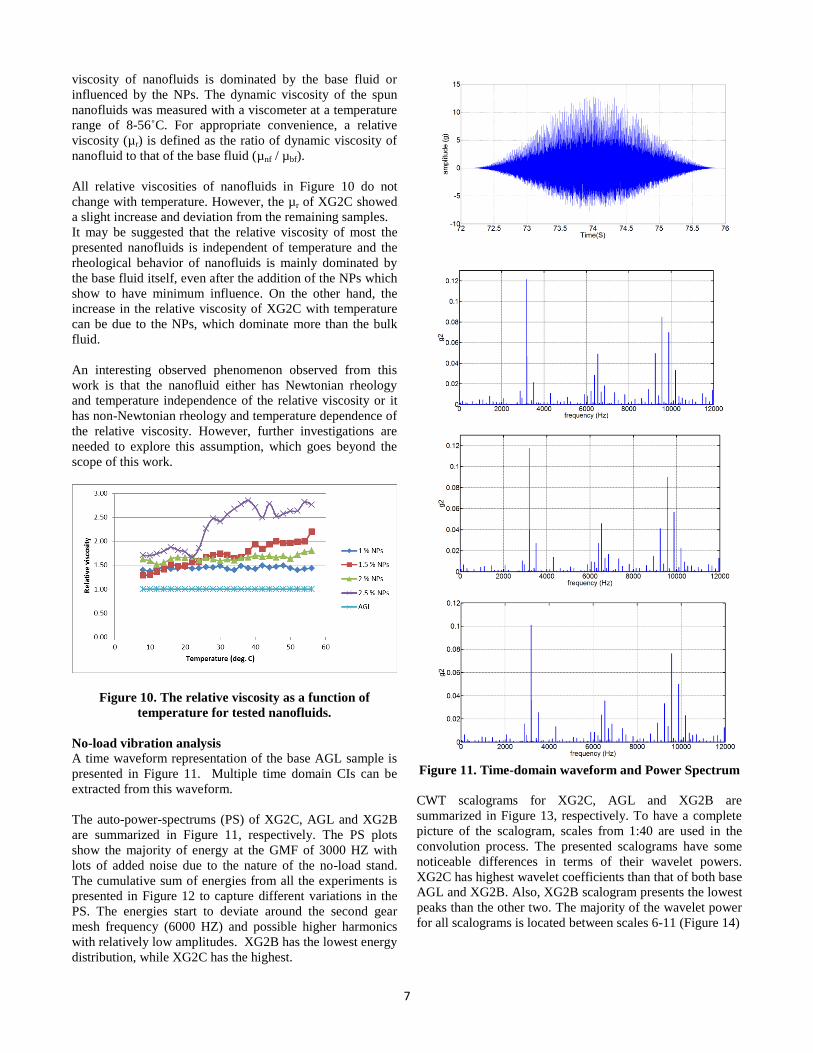
All relative viscosities of nanofluids in Figure 10 do not
change with temperature. However, the µr of XG2C showed
a slight increase and deviation from the remaining samples.
It may be suggested that the relative viscosity of most the
presented nanofluids is independent of temperature and the
rheological behavior of nanofluids is mainly dominated by
the base fluid itself, even after the addition of the NPs which
show to have minimum influence. On the other hand, the
increase in the relative viscosity of XG2C with temperature
can be due to the NPs, which dominate more than the bulk
fluid.
An interesting observed phenomenon observed from this
work is that the nanofluid either has Newtonian rheology
and temperature independence of the relative viscosity or it
has non-Newtonian rheology and temperature dependence of
the relative viscosity. However, further investigations are
needed to explore this assumption, which goes beyond the
scope of this work.
Figure 10. The relative viscosity as a function of
temperature for tested nanofluids.
No-load vibration analysis
A time waveform representation of the base AGL sample is
presented in Figure 11. Multiple time domain CIs can be
extracted from this waveform.
The auto-power-spectrums (PS) of XG2C, AGL and XG2B
are summarized in Figure 11, respectively. The PS plots
show the majority of energy at the GMF of 3000 HZ with
lots of added noise due to the nature of the no-load stand.
The cumulative sum of energies from all the experiments is
presented in Figure 12 to capture different variations in the
PS. The energies start to deviate around the second gear
mesh frequency (6000 HZ) and possible higher harmonics
with relatively low amplitudes. XG2B has the lowest energy
distribution, while XG2C has the highest.
Figure 11. Time-domain waveform and Power Spectrum
CWT scalograms for XG2C, AGL and XG2B are
summarized in Figure 13, respectively. To have a complete
picture of the scalogram, scales from 1:40 are used in the
convolution process. The presented scalograms have some
noticeable differences in terms of their wavelet powers.
XG2C has highest wavelet coefficients than that of both base
AGL and XG2B. Also, XG2B scalogram presents the lowest
peaks than the other two. The majority of the wavelet power
for all scalograms is located between scales 6-11 (Figure 14)
8
Figure 12. Cumulative sum of energies
Figure 13. CWT scalograms
The application of WI is demonstrated using the scalograms.
Before feature extraction, it is necessary to choose the scale
that can properly represent the system. Furthermore, for an
accurate physical interpretation, equation [9] is used to
compute corresponding frequencies, which are summarized
in Table 2.
Figure 14. Wavelet power over the scales
Scale 9 corresponds to the GMF, while the remainders of
those scales are most likely to be presented as the sidebands.
The lower the scale is an indication of higher frequencies
and most likely where symptoms or faults start to develop.
Consequently, any of the low scales can be used for feature
extraction. At this point, it is important to state that a
component can have multiple CIs; multiple faults can affect
the value of a single CI and a single fault can affect multiple
CIs.
Table 2. Scales and the corresponding frequency
S Fs (Hz)
6
7
8
9
10
11
4200
4000
3250
3000
2785
2437
In this analysis, scale 7 is used for computing the WI from
equation [8]. This scale corresponds to a frequency of 4000
Hz and has almost 5% of the wavelet energy. A horizontal
slice of the wavelet power (s=7) for XG2C, AGL and
XG2B, respectively is summarized in Figure 15. Unlike the
Fourier spectrum in Figure 11, the energies at the specified
scale or frequency show obvious differences from one
experiment to another, which represent the existing transient
characteristics. Consequently, WI is extracted and is
compared to the conventional CIs of the gearbox.
The proposed WI is compared in Figure 16 with a few
vibration-based CIs. FM0 values computed from all no-load
oil experiments show little to no change at all with a
constant value of 0.05. The RMS values have a trend from
high to low; highest value is from the XG2C experiment and
lowest is from the XG2B. WCI values are is in agreement
with RMS’.
Full-load vibration analysis
The auto-power spectrum from both AGL and XG2B are
reported in Figure 17. The data appears significantly
meaningful than the spectral analysis of the no-load.
Evidently, the gearbox is in a healthy condition and all peaks
have low amplitudes where the dominant frequency is the
GMF at 3000 HZ, surrounded by a few sidebands and

9
bearing frequency of 800-900 HZ.
Figure 15. Horizontal slice of wavelet power at scale 7
Furthermore, the spectrum from the nanolubricant; XG2B
has lower energy and sidelobes surrounding the GMF. The
cumulative sums of the FFT energies in Figure 18 present a
clearer difference, the base AGL appear higher than those
from the nanolubricant experiment at higher gear mesh
harmonics starting from 2 X GMF.
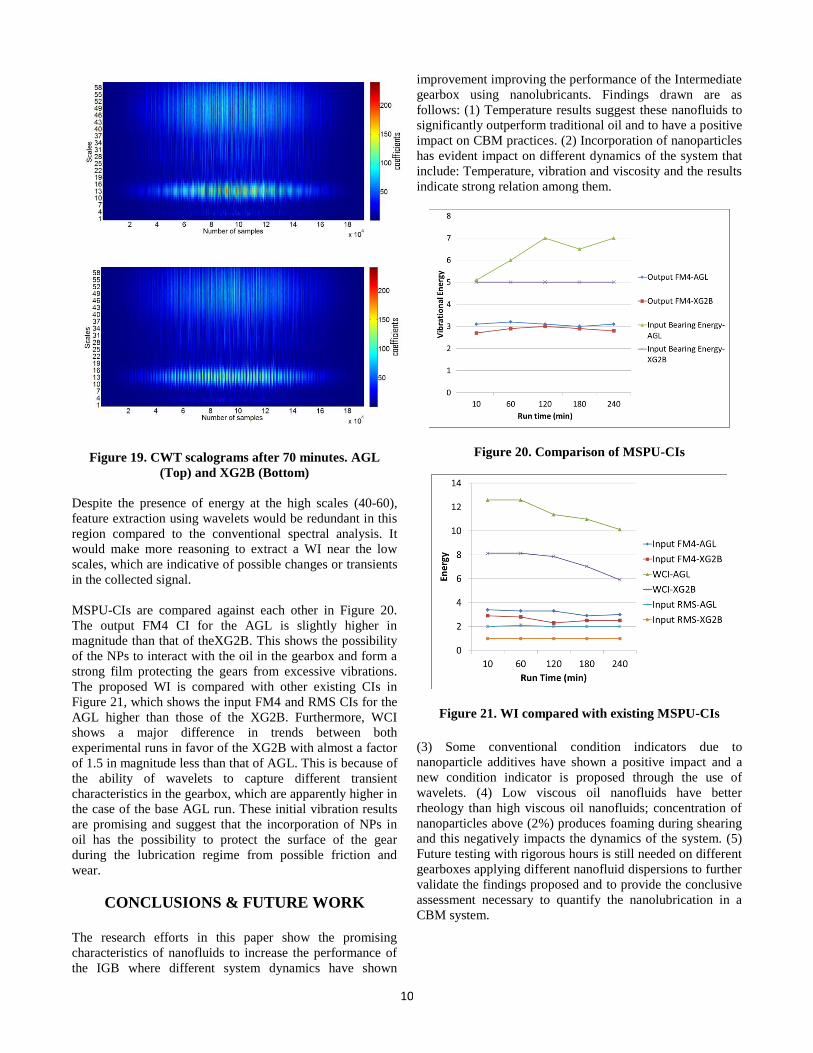
The CWT scalograms in Figure 19 are displayed after 70
minutes of full-load testing. The convolution process was
applied on scales 1:60, which can give redundancy in the
transform sometimes. However, the main focus in this work
is for feature extraction purposes. There are two regions of
wavelet power distributed over the scales. The input and
output bearing energy is between scales of 40-60, which
correspond to frequencies of 650-1000 Hz. The other region
is between scales 9-19, which correspond to the vibrational
energies of the GMF and its sidebands. It is clear that there
is less wavelet coefficient distribution for the XG2B across
both mentioned scale regions. Scale 10 is chosen for wavelet
index calculation (fs=4000HZ), as it represents a
considerable amount of the wavelet power.
Figure 16. Comparison between different indicators
Figure 17. Power spectrum after 130 minutes of testing.
Figure 18. Cumulative sum of FFT energies. Left: after
70 minutes and right: after 130 minutes
10
Figure 19. CWT scalograms after 70 minutes. AGL
(Top) and XG2B (Bottom)
Despite the presence of energy at the high scales (40-60),
feature extraction using wavelets would be redundant in this
region compared to the conventional spectral analysis. It
would make more reasoning to extract a WI near the low
scales, which are indicative of possible changes or transients
in the collected signal.
MSPU-CIs are compared against each other in Figure 20.
The output FM4 CI for the AGL is slightly higher in
magnitude than that of theXG2B. This shows the possibility
of the NPs to interact with the oil in the gearbox and form a
strong film protecting the gears from excessive vibrations.
The proposed WI is compared with other existing CIs in
Figure 21, which shows the input FM4 and RMS CIs for the
AGL higher than those of the XG2B. Furthermore, WCI
shows a major difference in trends between both
experimental runs in favor of the XG2B with almost a factor
of 1.5 in magnitude less than that of AGL. This is because of
the ability of wavelets to capture different transient
characteristics in the gearbox, which are apparently higher in
the case of the base AGL run. These initial vibration results
are promising and suggest that the incorporation of NPs in
oil has the possibility to protect the surface of the gear
during the lubrication regime from possible friction and
wear.
CONCLUSIONS & FUTURE WORK
The research efforts in this paper show the promising
characteristics of nanofluids to increase the performance of
the IGB where different system dynamics have shown
improvement improving the performance of the Intermediate
gearbox using nanolubricants. Findings drawn are as
follows: (1) Temperature results suggest these nanofluids to
significantly outperform traditional oil and to have a positive
impact on CBM practices. (2) Incorporation of nanoparticles
has evident impact on different dynamics of the system that
include: Temperature, vibration and viscosity and the results
indicate strong relation among them.
Figure 20. Comparison of MSPU-CIs
Figure 21. WI compared with existing MSPU-CIs
(3) Some conventional condition indicators due to
nanoparticle additives have shown a positive impact and a
new condition indicator is proposed through the use of
wavelets. (4) Low viscous oil nanofluids have better
rheology than high viscous oil nanofluids; concentration of
nanoparticles above (2%) produces foaming during shearing
and this negatively impacts the dynamics of the system. (5)
Future testing with rigorous hours is still needed on different
gearboxes applying different nanofluid dispersions to further
validate the findings proposed and to provide the conclusive
assessment necessary to quantify the nanolubrication in a
CBM system.

11
AKNOWLEDGMENTS
The research in this study is funded by the South Carolina
Army National Guard and the United State Army Aviation
and Missile Command via the CBM Research Center at
USC-Columbia. The authors would like to thank NEI
Corporation for their partnership and for preparing and
supplying the Nanofluids needed for testing.
REFERENCES 1
“AH-64 Testing of SHC 626 Oil in IGB-Developmental,”
RFMR-AED TTS 83442, 2009.
2 Bayoumi, A., McKenzie, A., Gouda, K., and
McVay, J. “Impact of Lubrication Analysis on Improvement
of AH-64D Helicopter Component Performance,” AHS 68th
Conference Proceedings, Fort Worth, TX, May 1-3, 2012.
3 Goodman, N., Bayoumi, Abdel, Blechertas, V., Shah, R.
and Shin, Y.J., “CBM Component Testing at The University
of South Carolina: AH-64 Gearbox Grease Studies,” AHS
65th
Conference Proceedings, grapevine, Texas, May 27-29,
2009.
4 Saidur, R., Leong, K. Y. and Mohammad H. A, "A review
on applications and challenges of nanofluids," Renewable
and Sustainable Energy Reviews, Vol. 15, (3), 2011, pp.
1646-1668.
5 Song, B., Yang, Q., Zhang, F. and Su, D. “Rheological
Properties of Aircraft Grease Containing Nano-Additives,”
Key Engineering Materials, Vols. 419-420, 2010, pp. 53-56.
6 Koo, J. and Kleinstreur, C., “A new thermal conductivity
of nanofluids,” Journal of Nanoparticle Research, Vol. 6,
2004, pp. 577-588.
7 Gouda, K.M., Nikhoo, M., Marcous, S., Bayoumi, A.,
Tarbutton, J., Eberts, K., Skandan, G., Carr, D. and Eisner,
L., “A Study of Nanoparticle Additives on the Performance
of the AH-64 Intermediate Gearbox Lubricant to Achieve
CBM Objectives,” AHS Airworthiness, CBM, and HUMS
Specialists’ Meeting, Huntsville, AL, Feb. 2013.
8 Lebold, M., McClintic, K., Campbell, R., Byington, C. and
Maynard, K., “Review of vibration analysis methods for
gearbox diagnostics and prognostics,” The 54th
Meeting of
the Society for Machinery Failure Prevention Technology,
Virginia Beach, VA.
9
Bendjama, H., Bouhouche, S. and Boucherit, M.S.,
“Application of wavelet transform for fault diagnosis in
rotating machinery,” International Journal of Machine
Learning and computing, Vol. 2, (1), 2012, pp. 82-87.


![Paint & Coating additives Broucher[1] - K-tech (india) Limited](https://static.fdokumen.com/doc/165x107/6334c8fdd2b7284203079d85/paint-coating-additives-broucher1-k-tech-india-limited.jpg)