Mapping histologic patchiness of celiac disease by push enteroscopy
Upload
nottingham-myCategory
view
1download
0
1096 VOLUME 10 NUMBER 10 OctOBER 2009 nature immunology
A rt i c l e s
The human major histocompatibility complex (MHC), encoded on chromosome 6, is associated with susceptibility to many immunopathological diseases. One of the diseases with the strongest association with particular MHC alleles is celiac disease, for which there is also mechanistic insight into the basis for the human leukocyte antigen (HLA) association1,2. Celiac disease is caused by an inappropriate intestinal immune response to wheat gluten (consisting of the gliadin and glutenin subcomponents) and the related proteins of rye and barley. Patients with celiac disease have glutenreactive CD4+ T cells in their small intestinal mucosa, but healthy controls do not3. Most patients with celiac disease carry the HLADQ2 variant DQ2.5, which is encoded by the DQA1*0501 and DQB1*0201 genes of the DR3DQ2 haplotype. Most of the few remaining patients express HLADQ8. The glutenreactive T cells of patients with celiac disease recognize a diverse set of gluten epitopes presented in context of DQ2.5 or DQ8 MHC molecules but not in the context of other MHC class II molecules expressed by the patients. ‘Preferential’ presentation of gluten peptides by the DQ2.5 and DQ8 molecules thus seems to explain the association of HLA with celiac disease1. This idea is supported by crystal structure data and peptidebinding experiments4–6.
Another HLADQ2 molecule, DQ2.2 (DQA1*0201 and DQB1*0202), encoded by the DR7DQ2 haplotype, is highly homologous to DQ2.5 but has on its own a very low risk for celiac disease. Notably, however, people who are heterozygous for DR7DQ2 and DR5DQ7 are at high risk for celiac disease; this is explained by expression of the DQ2.5 molecule (DQA1*05 and DQB1*02) in such people by HLA-DQA1 and HLA-DQB1 alleles located on opposite chromosomes7. This observation suggests that variation in the
αchain of DQ2 has a considerable effect on the risk of celiac disease. The reason for the selective association of DQ2.5 but not DQ2.2 with celiac disease is not obvious, as the peptidebinding motifs of these two molecules are almost identical8,9. Also, the glutenreactive T cells of DQ2.5+ patients with celiac disease recognize the gluten T cell epitopes when presented by DQ2.2+ antigenpresenting cells (APCs), although they do so with less efficiency for some gluten T cell epitopes10,11.
DQ2.5 molecules of B lymphoblastoid cell lines (BLCLs) are associated with abundant amounts of two cohorts of peptides derived from the MHC class II–associated invariantchain peptide CLIP12,13: CLIP1 and CLIP2 (refs. 14,15). Complexes of DQ2.5 with either CLIP1 and CLIP2 are poor substrates for the peptideexchange molecule HLADM15, which offers a possible explanation for the abundance of CLIP associated with DQ2.5. Here we analyzed the amount of CLIP1 peptides associated with DQ2.2. We found that DQ2.5 and DQ2.2 differed in their CLIP1 content, which is the first hint to our knowledge suggesting a difference in the peptidebinding abilities of the two DQ2 molecules. Delineating the molecular basis for the divergent CLIP phenotypes further, we found no evidence for differences in interaction with HLADM but instead identified a mechanism involving a hydrogen bond from a polymorphic MHC residue to the peptide main chain, which is relevant for the binding of all peptide ligands regardless of their sequence. This polymorphic residue caused DQ2.5 to better retain its peptide cargo than did DQ2.2. This difference also affected binding of gluten peptides and led to protracted presentation of gluten antigens by DQ2.5expressing APCs. Our results suggest a molecular explanation for the differences in the association of DQ2.5 and DQ2.2 with celiac disease.
1Centre for Immune Regulation, Institute of Immunology, University of Oslo and Oslo University Hospital Rikshospitalet, Oslo, Norway. 2Department of Biological Sciences, National University of Singapore, Singapore. 3These authors contributed equally to this work. Correspondence should be addressed to L.M.S. ([email protected]).
Received 9 January; accepted 13 July; published online 30 August 2009; corrected online 13 September 2009; doi:10.1038/ni.1780
Differences in the risk of celiac disease associated with HLA-DQ2.5 or HLA-DQ2.2 are related to sustained gluten antigen presentationLars-Egil Fallang1,3, Elin Bergseng1,3, Kinya Hotta2, Axel Berg-Larsen1, Chu-Young Kim2 & Ludvig M Sollid1
Celiac disease driven by an antigluten T cell response is strongly associated with the histocompatibility antigen HLA-DQ2.5 but is barely associated with HLA-DQ2.2. Yet these molecules have very similar peptide-binding motifs and both present gluten T cell epitopes. We found that DQ2.5+ antigen-presenting cells (APCs) had greater stability of bound peptides and protracted gluten presentation relative to that of DQ2.2+ cells. The improved ability of DQ2.5 to retain its peptide cargo can be ascribed to a polymorphism of DQ22 whereby DQ2.5 (tyrosine) can establish a hydrogen bond to the peptide main chain but DQ2.2 (phenylalanine) cannot. Our findings suggest that the kinetic stability of complexes of peptide and major histocompatibility complex (MHC) is of importance for the association of HLA with disease.
©20
09 N
atu
re A
mer
ica,
Inc.
All
rig
hts
res
erve
d.
nature immunology VOLUME 10 NUMBER 10 OctOBER 2009 1097
A rt i c l e s
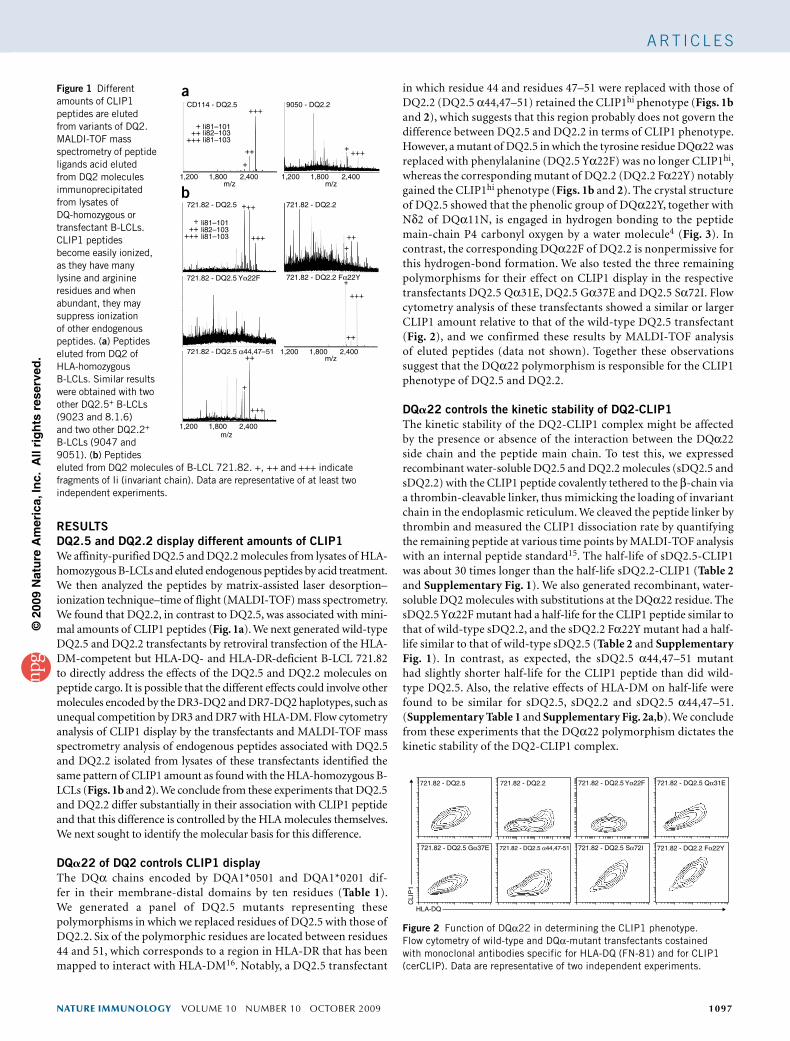
RESULTSDQ2.5 and DQ2.2 display different amounts of CLIP1We affinitypurified DQ2.5 and DQ2.2 molecules from lysates of HLAhomozygous BLCLs and eluted endogenous peptides by acid treatment. We then analyzed the peptides by matrixassisted laser desorption– ionization technique–time of flight (MALDITOF) mass spectrometry. We found that DQ2.2, in contrast to DQ2.5, was associated with minimal amounts of CLIP1 peptides (Fig. 1a). We next generated wildtype DQ2.5 and DQ2.2 transfectants by retroviral transfection of the HLADMcompetent but HLADQ and HLADRdeficient BLCL 721.82 to directly address the effects of the DQ2.5 and DQ2.2 molecules on peptide cargo. It is possible that the different effects could involve other molecules encoded by the DR3DQ2 and DR7DQ2 haplotypes, such as unequal competition by DR3 and DR7 with HLADM. Flow cytometry analysis of CLIP1 display by the transfectants and MALDITOF mass spectrometry analysis of endogenous peptides associated with DQ2.5 and DQ2.2 isolated from lysates of these transfectants identified the same pattern of CLIP1 amount as found with the HLAhomozygous BLCLs (Figs. 1b and 2). We conclude from these experiments that DQ2.5 and DQ2.2 differ substantially in their association with CLIP1 peptide and that this difference is controlled by the HLA molecules themselves. We next sought to identify the molecular basis for this difference.
DQ22 of DQ2 controls CLIP1 displayThe DQα chains encoded by DQA1*0501 and DQA1*0201 differ in their membranedistal domains by ten residues (Table 1). We generated a panel of DQ2.5 mutants representing these polymorphisms in which we replaced residues of DQ2.5 with those of DQ2.2. Six of the polymorphic residues are located between residues 44 and 51, which corresponds to a region in HLADR that has been mapped to interact with HLADM16. Notably, a DQ2.5 transfectant
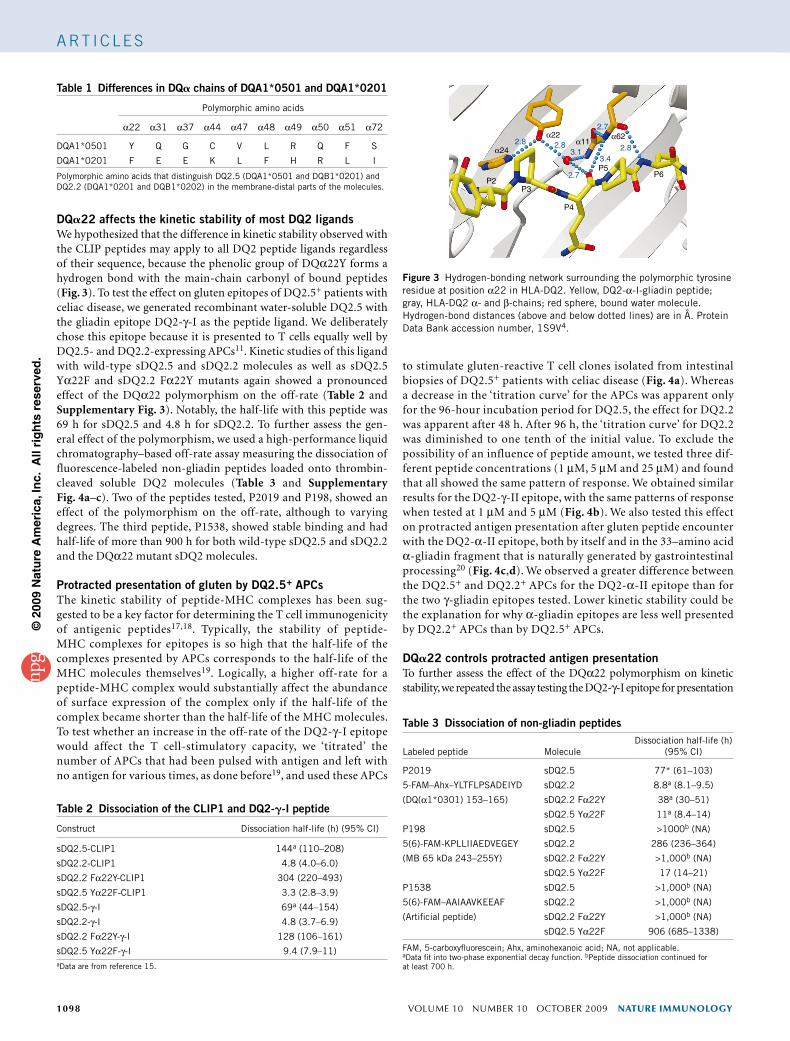
in which residue 44 and residues 47–51 were replaced with those of DQ2.2 (DQ2.5 α44,47–51) retained the CLIP1hi phenotype (Figs. 1b and 2), which suggests that this region probably does not govern the difference between DQ2.5 and DQ2.2 in terms of CLIP1 phenotype. However, a mutant of DQ2.5 in which the tyrosine residue DQα22 was replaced with phenylalanine (DQ2.5 Yα22F) was no longer CLIP1hi, whereas the corresponding mutant of DQ2.2 (DQ2.2 Fα22Y) notably gained the CLIP1hi phenotype (Figs. 1b and 2). The crystal structure of DQ2.5 showed that the phenolic group of DQα22Y, together with Nδ2 of DQα11N, is engaged in hydrogen bonding to the peptide mainchain P4 carbonyl oxygen by a water molecule4 (Fig. 3). In contrast, the corresponding DQα22F of DQ2.2 is nonpermissive for this hydrogenbond formation. We also tested the three remaining polymorphisms for their effect on CLIP1 display in the respective transfectants DQ2.5 Qα31E, DQ2.5 Gα37E and DQ2.5 Sα72I. Flow cytometry analysis of these transfectants showed a similar or larger CLIP1 amount relative to that of the wildtype DQ2.5 transfectant (Fig. 2), and we confirmed these results by MALDITOF analysis of eluted peptides (data not shown). Together these observations suggest that the DQα22 polymorphism is responsible for the CLIP1 phenotype of DQ2.5 and DQ2.2.
DQ22 controls the kinetic stability of DQ2-CLIP1The kinetic stability of the DQ2CLIP1 complex might be affected by the presence or absence of the interaction between the DQα22 side chain and the peptide main chain. To test this, we expressed recombinant watersoluble DQ2.5 and DQ2.2 molecules (sDQ2.5 and sDQ2.2) with the CLIP1 peptide covalently tethered to the βchain via a thrombincleavable linker, thus mimicking the loading of invariant chain in the endoplasmic reticulum. We cleaved the peptide linker by thrombin and measured the CLIP1 dissociation rate by quantifying the remaining peptide at various time points by MALDITOF analysis with an internal peptide standard15. The halflife of sDQ2.5CLIP1 was about 30 times longer than the halflife sDQ2.2CLIP1 (Table 2 and Supplementary Fig. 1). We also generated recombinant, watersoluble DQ2 molecules with substitutions at the DQα22 residue. The sDQ2.5 Yα22F mutant had a halflife for the CLIP1 peptide similar to that of wildtype sDQ2.2, and the sDQ2.2 Fα22Y mutant had a halflife similar to that of wildtype sDQ2.5 (Table 2 and Supplementary Fig. 1). In contrast, as expected, the sDQ2.5 α44,47–51 mutant had slightly shorter halflife for the CLIP1 peptide than did wildtype DQ2.5. Also, the relative effects of HLADM on halflife were found to be similar for sDQ2.5, sDQ2.2 and sDQ2.5 α44,47–51. (Supplementary Table 1 and Supplementary Fig. 2a,b). We conclude from these experiments that the DQα22 polymorphism dictates the kinetic stability of the DQ2CLIP1 complex.
Figure 1 Different amounts of CLIP1 peptides are eluted from variants of DQ2. MALDI-TOF mass spectrometry of peptide ligands acid eluted from DQ2 molecules immunoprecipitated from lysates of DQ-homozygous or transfectant B-LCLs. CLIP1 peptides become easily ionized, as they have many lysine and arginine residues and when abundant, they may suppress ionization of other endogenous peptides. (a) Peptides eluted from DQ2 of HLA-homozygous B-LCLs. Similar results were obtained with two other DQ2.5+ B-LCLs (9023 and 8.1.6) and two other DQ2.2+ B-LCLs (9047 and 9051). (b) Peptides eluted from DQ2 molecules of B-LCL 721.82. +, ++ and +++ indicate fragments of Ii (invariant chain). Data are representative of at least two independent experiments.
CD114 - DQ2.5
a
b721.82 - DQ2.5
721.82 - DQ2.5 Yα22F
721.82 - DQ2.5 α44,47–51
721.82 - DQ2.2 Fα22Y
721.82 - DQ2.2
9050 - DQ2.2
+
+
li81–101li82–103li81–103
1,200 1,800 2,400m/z
1,200 1,800 2,400m/z
1,200 1,800 2,400m/z
1,200 1,800 2,400m/z
++
++ ++++
+
+
+
li81–101li82–103li81–103
++
++
++
+++
++
+++
+
+++
+++
+++
+++
+++
Figure 2 Function of DQα22 in determining the CLIP1 phenotype. Flow cytometry of wild-type and DQα-mutant transfectants costained with monoclonal antibodies specific for HLA-DQ (FN-81) and for CLIP1 (cerCLIP). Data are representative of two independent experiments.
721.82 - DQ2.5 721.82 - DQ2.5 Yα22F
721.82 - DQ2.5 Gα37E
CLI
P1
721.82 - DQ2.5 Sα72I
HLA-DQ
721.82 - DQ2.2 Fα22Y721.82 - DQ2.5 α44,47-51
721.82 - DQ2.5 Qα31E721.82 - DQ2.2
©20
09 N
atu
re A
mer
ica,
Inc.
All
rig
hts
res
erve
d.
1098 VOLUME 10 NUMBER 10 OctOBER 2009 nature immunology
A rt i c l e s
DQ22 affects the kinetic stability of most DQ2 ligandsWe hypothesized that the difference in kinetic stability observed with the CLIP peptides may apply to all DQ2 peptide ligands regardless of their sequence, because the phenolic group of DQα22Y forms a hydrogen bond with the mainchain carbonyl of bound peptides (Fig. 3). To test the effect on gluten epitopes of DQ2.5+ patients with celiac disease, we generated recombinant watersoluble DQ2.5 with the gliadin epitope DQ2γI as the peptide ligand. We deliberately chose this epitope because it is presented to T cells equally well by DQ2.5 and DQ2.2expressing APCs11. Kinetic studies of this ligand with wildtype sDQ2.5 and sDQ2.2 molecules as well as sDQ2.5 Yα22F and sDQ2.2 Fα22Y mutants again showed a pronounced effect of the DQα22 polymorphism on the offrate (Table 2 and Supplementary Fig. 3). Notably, the halflife with this peptide was 69 h for sDQ2.5 and 4.8 h for sDQ2.2. To further assess the general effect of the polymorphism, we used a highperformance liquid chromatography–based offrate assay measuring the dissociation of fluorescencelabeled nongliadin peptides loaded onto thrombincleaved soluble DQ2 molecules (Table 3 and Supplementary Fig. 4a–c). Two of the peptides tested, P2019 and P198, showed an effect of the polymorphism on the offrate, although to varying degrees. The third peptide, P1538, showed stable binding and had halflife of more than 900 h for both wildtype sDQ2.5 and sDQ2.2 and the DQα22 mutant sDQ2 molecules.
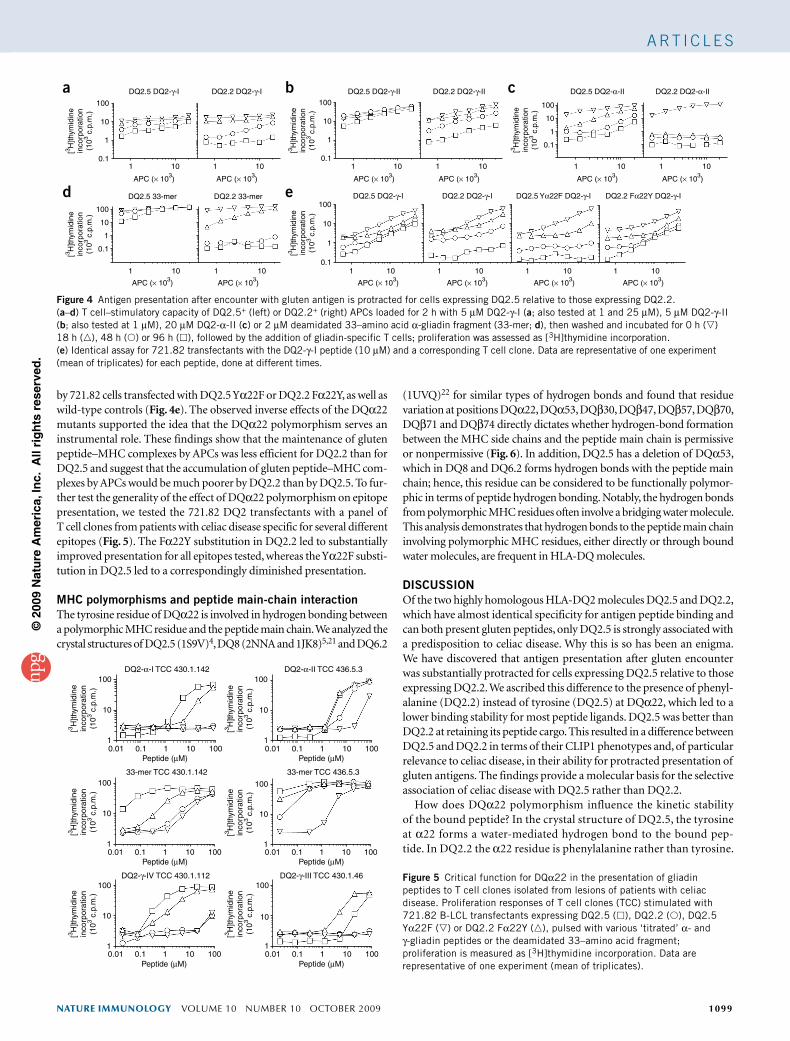
Protracted presentation of gluten by DQ2.5+ APCsThe kinetic stability of peptideMHC complexes has been suggested to be a key factor for determining the T cell immunogenicity of antigenic peptides17,18. Typically, the stability of peptideMHC complexes for epitopes is so high that the halflife of the complexes presented by APCs corresponds to the halflife of the MHC molecules themselves19. Logically, a higher offrate for a peptideMHC complex would substantially affect the abundance of surface expression of the complex only if the halflife of the complex became shorter than the halflife of the MHC molecules. To test whether an increase in the offrate of the DQ2γI epitope would affect the T cellstimulatory capacity, we ‘titrated’ the number of APCs that had been pulsed with antigen and left with no antigen for various times, as done before19, and used these APCs
to stimulate glutenreactive T cell clones isolated from intestinal biopsies of DQ2.5+ patients with celiac disease (Fig. 4a). Whereas a decrease in the ‘titration curve’ for the APCs was apparent only for the 96hour incubation period for DQ2.5, the effect for DQ2.2 was apparent after 48 h. After 96 h, the ‘titration curve’ for DQ2.2 was diminished to one tenth of the initial value. To exclude the possibility of an influence of peptide amount, we tested three different peptide concentrations (1 µM, 5 µM and 25 µM) and found that all showed the same pattern of response. We obtained similar results for the DQ2γII epitope, with the same patterns of response when tested at 1 µM and 5 µM (Fig. 4b). We also tested this effect on protracted antigen presentation after gluten peptide encounter with the DQ2αII epitope, both by itself and in the 33–amino acid αgliadin fragment that is naturally generated by gastrointestinal processing20 (Fig. 4c,d). We observed a greater difference between the DQ2.5+ and DQ2.2+ APCs for the DQ2αII epitope than for the two γgliadin epitopes tested. Lower kinetic stability could be the explanation for why αgliadin epitopes are less well presented by DQ2.2+ APCs than by DQ2.5+ APCs.
DQ22 controls protracted antigen presentationTo further assess the effect of the DQα22 polymorphism on kinetic stability, we repeated the assay testing the DQ2γI epitope for presentation
Table 1 Differences in DQ chains of DQA1*0501 and DQA1*0201
Polymorphic amino acids
α22 α31 α37 α44 α47 α48 α49 α50 α51 α72
DQA1*0501 Y Q G C V L R Q F S
DQA1*0201 F E E K L F H R L I
Polymorphic amino acids that distinguish DQ2.5 (DQA1*0501 and DQB1*0201) and DQ2.2 (DQA1*0201 and DQB1*0202) in the membrane-distal parts of the molecules.
α24
α22 α62α11
P2P3
P4
P5P6
2.7
2.83.4
3.1
2.7
2.82.8
Figure 3 Hydrogen-bonding network surrounding the polymorphic tyrosine residue at position α22 in HLA-DQ2. Yellow, DQ2-α-I-gliadin peptide; gray, HLA-DQ2 α- and β-chains; red sphere, bound water molecule. Hydrogen-bond distances (above and below dotted lines) are in Å. Protein Data Bank accession number, 1S9V4.
Table 2 Dissociation of the CLIP1 and DQ2--I peptide
Construct Dissociation half-life (h) (95% CI)
sDQ2.5-CLIP1 144a (110–208)
sDQ2.2-CLIP1 4.8 (4.0–6.0)
sDQ2.2 Fα22Y-CLIP1 304 (220–493)
sDQ2.5 Yα22F-CLIP1 3.3 (2.8–3.9)
sDQ2.5-γ-I 69a (44–154)
sDQ2.2-γ-I 4.8 (3.7–6.9)
sDQ2.2 Fα22Y-γ-I 128 (106–161)
sDQ2.5 Yα22F-γ-I 9.4 (7.9–11)aData are from reference 15.
Table 3 Dissociation of non-gliadin peptides
Labeled peptide MoleculeDissociation half-life (h)
(95% CI)
P2019 sDQ2.5 77* (61–103)
5-FAM–Ahx–YLTFLPSADEIYD sDQ2.2 8.8a (8.1–9.5)
(DQ(α1*0301) 153–165) sDQ2.2 Fα22Y 38a (30–51)
sDQ2.5 Yα22F 11a (8.4–14)
P198 sDQ2.5 >1000b (NA)
5(6)-FAM-KPLLIIAEDVEGEY sDQ2.2 286 (236–364)
(MB 65 kDa 243–255Y) sDQ2.2 Fα22Y >1,000b (NA)
sDQ2.5 Yα22F 17 (14–21)
P1538 sDQ2.5 >1,000b (NA)
5(6)-FAM–AAIAAVKEEAF sDQ2.2 >1,000b (NA)
(Artificial peptide) sDQ2.2 Fα22Y >1,000b (NA)
sDQ2.5 Yα22F 906 (685–1338)
FAM, 5-carboxyfluorescein; Ahx, aminohexanoic acid; NA, not applicable.aData fit into two-phase exponential decay function. bPeptide dissociation continued for at least 700 h.
©20
09 N
atu
re A
mer
ica,
Inc.
All
rig
hts
res
erve
d.
nature immunology VOLUME 10 NUMBER 10 OctOBER 2009 1099
A rt i c l e s
by 721.82 cells transfected with DQ2.5 Yα22F or DQ2.2 Fα22Y, as well as wildtype controls (Fig. 4e). The observed inverse effects of the DQα22 mutants supported the idea that the DQα22 polymorphism serves an instrumental role. These findings show that the maintenance of gluten peptide–MHC complexes by APCs was less efficient for DQ2.2 than for DQ2.5 and suggest that the accumulation of gluten peptide–MHC complexes by APCs would be much poorer by DQ2.2 than by DQ2.5. To further test the generality of the effect of DQα22 polymorphism on epitope presentation, we tested the 721.82 DQ2 transfectants with a panel of T cell clones from patients with celiac disease specific for several different epitopes (Fig. 5). The Fα22Y substitution in DQ2.2 led to substantially improved presentation for all epitopes tested, whereas the Yα22F substitution in DQ2.5 led to a correspondingly diminished presentation.
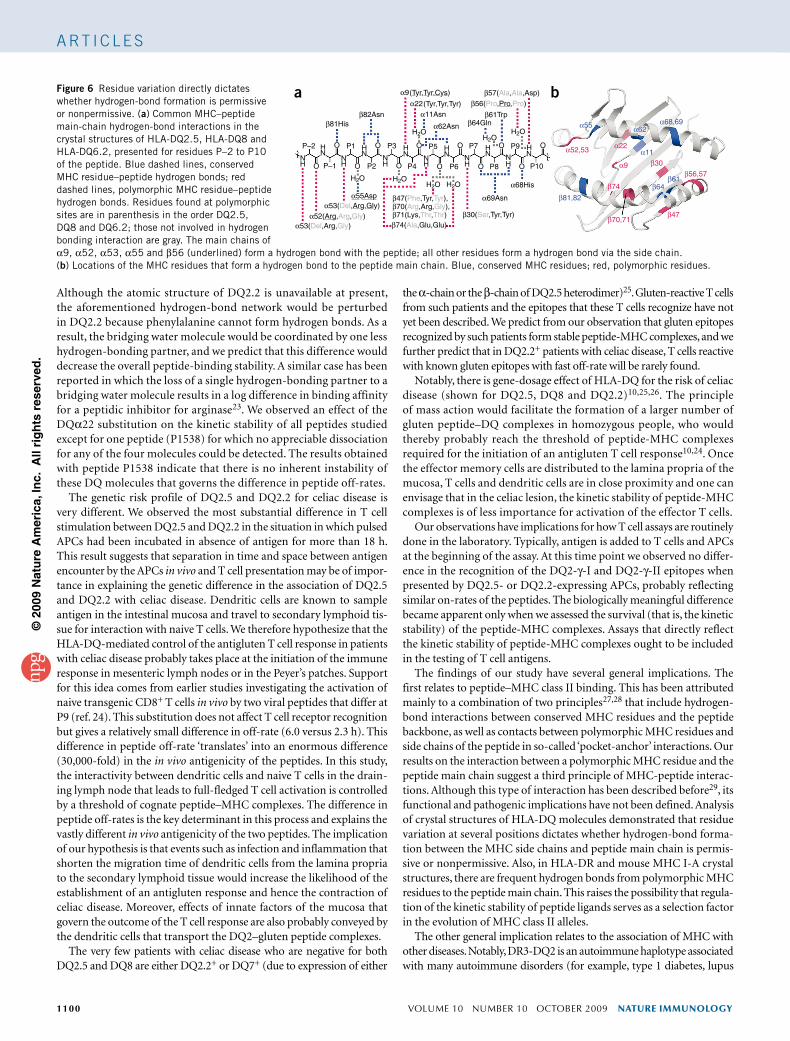
MHC polymorphisms and peptide main-chain interactionThe tyrosine residue of DQα22 is involved in hydrogen bonding between a polymorphic MHC residue and the peptide main chain. We analyzed the crystal structures of DQ2.5 (1S9V)4, DQ8 (2NNA and 1JK8)5,21 and DQ6.2
(1UVQ)22 for similar types of hydrogen bonds and found that residue variation at positions DQα22, DQα53, DQβ30, DQβ47, DQβ57, DQβ70, DQβ71 and DQβ74 directly dictates whether hydrogenbond formation between the MHC side chains and the peptide main chain is permissive or nonpermissive (Fig. 6). In addition, DQ2.5 has a deletion of DQα53, which in DQ8 and DQ6.2 forms hydrogen bonds with the peptide main chain; hence, this residue can be considered to be functionally polymorphic in terms of peptide hydrogen bonding. Notably, the hydrogen bonds from polymorphic MHC residues often involve a bridging water molecule. This analysis demonstrates that hydrogen bonds to the peptide main chain involving polymorphic MHC residues, either directly or through bound water molecules, are frequent in HLADQ molecules.
DISCUSSIONOf the two highly homologous HLADQ2 molecules DQ2.5 and DQ2.2, which have almost identical specificity for antigen peptide binding and can both present gluten peptides, only DQ2.5 is strongly associated with a predisposition to celiac disease. Why this is so has been an enigma. We have discovered that antigen presentation after gluten encounter was substantially protracted for cells expressing DQ2.5 relative to those expressing DQ2.2. We ascribed this difference to the presence of phenylalanine (DQ2.2) instead of tyrosine (DQ2.5) at DQα22, which led to a lower binding stability for most peptide ligands. DQ2.5 was better than DQ2.2 at retaining its peptide cargo. This resulted in a difference between DQ2.5 and DQ2.2 in terms of their CLIP1 phenotypes and, of particular relevance to celiac disease, in their ability for protracted presentation of gluten antigens. The findings provide a molecular basis for the selective association of celiac disease with DQ2.5 rather than DQ2.2.
How does DQα22 polymorphism influence the kinetic stability of the bound peptide? In the crystal structure of DQ2.5, the tyrosine at α22 forms a watermediated hydrogen bond to the bound peptide. In DQ2.2 the α22 residue is phenylalanine rather than tyrosine.
Figure 4 Antigen presentation after encounter with gluten antigen is protracted for cells expressing DQ2.5 relative to those expressing DQ2.2. (a–d) T cell–stimulatory capacity of DQ2.5+ (left) or DQ2.2+ (right) APCs loaded for 2 h with 5 µM DQ2-γ-I (a; also tested at 1 and 25 µM), 5 µM DQ2-γ-II (b; also tested at 1 µM), 20 µM DQ2-α-II (c) or 2 µM deamidated 33–amino acid α-gliadin fragment (33-mer; d), then washed and incubated for 0 h () 18 h (), 48 h () or 96 h (), followed by the addition of gliadin-specific T cells; proliferation was assessed as [3H]thymidine incorporation. (e) Identical assay for 721.82 transfectants with the DQ2-γ-I peptide (10 µM) and a corresponding T cell clone. Data are representative of one experiment (mean of triplicates) for each peptide, done at different times.
Figure 5 Critical function for DQα22 in the presentation of gliadin peptides to T cell clones isolated from lesions of patients with celiac disease. Proliferation responses of T cell clones (TCC) stimulated with 721.82 B-LCL transfectants expressing DQ2.5 (), DQ2.2 (), DQ2.5 Yα22F () or DQ2.2 Fα22Y (), pulsed with various ‘titrated’ α- and γ-gliadin peptides or the deamidated 33–amino acid fragment; proliferation is measured as [3H]thymidine incorporation. Data are representative of one experiment (mean of triplicates).
DQ2-α-I TCC 430.1.142
DQ2-γ-IV TCC 430.1.112 DQ2-γ-III TCC 430.1.46
33-mer TCC 430.1.142
DQ2-α-II TCC 436.5.3
33-mer TCC 436.5.3
100
10
0.01 0.1Peptide (µM) Peptide (µM)
Peptide (µM) Peptide (µM)
Peptide (µM) Peptide (µM)
1 10 1001
100
10
0.01 0.1 1 10 1001
100
10
0.01 0.1 1 10 1001
100
10
0.01 0.1 1 10 1001
100
10
0.01 0.1 1 10 100
[3 H]th
ymid
ine
inco
rpor
atio
n(1
03 c.p
.m.)
[3 H]th
ymid
ine
inco
rpor
atio
n(1
03 c.p
.m.)
[3 H]th
ymid
ine
inco
rpor
atio
n(1
03 c.p
.m.)
[3 H]th
ymid
ine
inco
rpor
atio
n(1
03 c.p
.m.)
[3 H]th
ymid
ine
inco
rpor
atio
n(1
03 c.p
.m.)
[3 H]th
ymid
ine
inco
rpor
atio
n(1
03 c.p
.m.)
1
100
10
0.01 0.1 1 10 1001
DQ2.5 DQ2-γ-I DQ2.2 DQ2-γ-I
DQ2.5 33-mer DQ2.2 33-mer
DQ2.5 DQ2-γ-II
DQ2.5 Yα22F DQ2-γ-I DQ2.2 Fα22Y DQ2-γ-IDQ2.5 DQ2-γ-I
DQ2.2 DQ2-γ-II
DQ2.2 DQ2-γ-I
DQ2.5 DQ2-α-II DQ2.2 DQ2-α-II
100
a
d e
b c
10
1
0.11 10
100
10
1
0.1
100
10
1
0.1
100
10
1
0.1
APC (× 103) APC (× 103) APC (× 103) APC (× 103)
1 10
APC (× 103)
1 10
APC (× 103)
1 10
APC (× 103)
1 10
APC (× 103)
1 10
APC (× 103)
1 10
APC (× 103)
1 10
1 10 1 10
APC (× 103)
1 10
APC (× 103)
1 10
[3 H]th
ymid
ine
inco
rpor
atio
n(1
03 c.p
.m.)
[3 H]th
ymid
ine
inco
rpor
atio
n(1
03 c.p
.m.)
100
10
1
0.1
[3 H]th
ymid
ine
inco
rpor
atio
n(1
03 c.p
.m.)
[3 H]th
ymid
ine
inco
rpor
atio
n(1
03 c.p
.m.)
[3 H]th
ymid
ine
inco
rpor
atio
n(1
03 c.p
.m.)
©20
09 N
atu
re A
mer
ica,
Inc.
All
rig
hts
res
erve
d.
1100 VOLUME 10 NUMBER 10 OctOBER 2009 nature immunology
A rt i c l e s
Although the atomic structure of DQ2.2 is unavailable at present, the aforementioned hydrogenbond network would be perturbed in DQ2.2 because phenylalanine cannot form hydrogen bonds. As a result, the bridging water molecule would be coordinated by one less hydrogenbonding partner, and we predict that this difference would decrease the overall peptidebinding stability. A similar case has been reported in which the loss of a single hydrogenbonding partner to a bridging water molecule results in a log difference in binding affinity for a peptidic inhibitor for arginase23. We observed an effect of the DQα22 substitution on the kinetic stability of all peptides studied except for one peptide (P1538) for which no appreciable dissociation for any of the four molecules could be detected. The results obtained with peptide P1538 indicate that there is no inherent instability of these DQ molecules that governs the difference in peptide offrates.
The genetic risk profile of DQ2.5 and DQ2.2 for celiac disease is very different. We observed the most substantial difference in T cell stimulation between DQ2.5 and DQ2.2 in the situation in which pulsed APCs had been incubated in absence of antigen for more than 18 h. This result suggests that separation in time and space between antigen encounter by the APCs in vivo and T cell presentation may be of importance in explaining the genetic difference in the association of DQ2.5 and DQ2.2 with celiac disease. Dendritic cells are known to sample antigen in the intestinal mucosa and travel to secondary lymphoid tissue for interaction with naive T cells. We therefore hypothesize that the HLADQmediated control of the antigluten T cell response in patients with celiac disease probably takes place at the initiation of the immune response in mesenteric lymph nodes or in the Peyer’s patches. Support for this idea comes from earlier studies investigating the activation of naive transgenic CD8+ T cells in vivo by two viral peptides that differ at P9 (ref. 24). This substitution does not affect T cell receptor recognition but gives a relatively small difference in offrate (6.0 versus 2.3 h). This difference in peptide offrate ‘translates’ into an enormous difference (30,000fold) in the in vivo antigenicity of the peptides. In this study, the interactivity between dendritic cells and naive T cells in the draining lymph node that leads to fullfledged T cell activation is controlled by a threshold of cognate peptide–MHC complexes. The difference in peptide offrates is the key determinant in this process and explains the vastly different in vivo antigenicity of the two peptides. The implication of our hypothesis is that events such as infection and inflammation that shorten the migration time of dendritic cells from the lamina propria to the secondary lymphoid tissue would increase the likelihood of the establishment of an antigluten response and hence the contraction of celiac disease. Moreover, effects of innate factors of the mucosa that govern the outcome of the T cell response are also probably conveyed by the dendritic cells that transport the DQ2–gluten peptide complexes.
The very few patients with celiac disease who are negative for both DQ2.5 and DQ8 are either DQ2.2+ or DQ7+ (due to expression of either
the αchain or the βchain of DQ2.5 heterodimer)25. Glutenreactive T cells from such patients and the epitopes that these T cells recognize have not yet been described. We predict from our observation that gluten epitopes recognized by such patients form stable peptideMHC complexes, and we further predict that in DQ2.2+ patients with celiac disease, T cells reactive with known gluten epitopes with fast offrate will be rarely found.
Notably, there is genedosage effect of HLADQ for the risk of celiac disease (shown for DQ2.5, DQ8 and DQ2.2)10,25,26. The principle of mass action would facilitate the formation of a larger number of gluten peptide–DQ complexes in homozygous people, who would thereby probably reach the threshold of peptideMHC complexes required for the initiation of an antigluten T cell response10,24. Once the effector memory cells are distributed to the lamina propria of the mucosa, T cells and dendritic cells are in close proximity and one can envisage that in the celiac lesion, the kinetic stability of peptideMHC complexes is of less importance for activation of the effector T cells.
Our observations have implications for how T cell assays are routinely done in the laboratory. Typically, antigen is added to T cells and APCs at the beginning of the assay. At this time point we observed no difference in the recognition of the DQ2γI and DQ2γII epitopes when presented by DQ2.5 or DQ2.2expressing APCs, probably reflecting similar onrates of the peptides. The biologically meaningful difference became apparent only when we assessed the survival (that is, the kinetic stability) of the peptideMHC complexes. Assays that directly reflect the kinetic stability of peptideMHC complexes ought to be included in the testing of T cell antigens.
The findings of our study have several general implications. The first relates to peptide–MHC class II binding. This has been attributed mainly to a combination of two principles27,28 that include hydrogenbond interactions between conserved MHC residues and the peptide backbone, as well as contacts between polymorphic MHC residues and side chains of the peptide in socalled ‘pocketanchor’ interactions. Our results on the interaction between a polymorphic MHC residue and the peptide main chain suggest a third principle of MHCpeptide interactions. Although this type of interaction has been described before29, its functional and pathogenic implications have not been defined. Analysis of crystal structures of HLADQ molecules demonstrated that residue variation at several positions dictates whether hydrogenbond formation between the MHC side chains and peptide main chain is permissive or nonpermissive. Also, in HLADR and mouse MHC IA crystal structures, there are frequent hydrogen bonds from polymorphic MHC residues to the peptide main chain. This raises the possibility that regulation of the kinetic stability of peptide ligands serves as a selection factor in the evolution of MHC class II alleles.
The other general implication relates to the association of MHC with other diseases. Notably, DR3DQ2 is an autoimmune haplotype associated with many autoimmune disorders (for example, type 1 diabetes, lupus
β81His
α68His
β82Asn
a b
H2OH2O
H2O
H2O
α52(Arg,Arg,Gly) β30(Ser,Tyr,Tyr)
α53(Del,Arg,Gly)
H2OH2O H2O
α69Asn
O
O O
O O
O O O
O O O
O
P–2 P1
P2
P3
P4
P5
P8
P9
P10P6
P7
P–1NH
NH
NH
NH
NH
NH
NH
NH
NH
NH
NH
NH
α11Asn
α62Asn
(Tyr,Tyr,Cys)
(Tyr,Tyr,Tyr)
α9
α22
α55
α52,53 α22
α9
β74
β30
β56,57
β47β70,71
α62α68,69
α11
β81,82
β64β61
β57(Ala,Ala,Asp)
β56(Pro,Pro,Pro)
β47(Phe,Tyr,Tyr),β70(Arg,Arg,Gly),β71(Lys,Thr,Thr)β74(Ala,Glu,Glu)
β64Glnβ61Trp
α55Aspα53(Del,Arg,Gly)
Figure 6 Residue variation directly dictates whether hydrogen-bond formation is permissive or nonpermissive. (a) Common MHC–peptide main-chain hydrogen-bond interactions in the crystal structures of HLA-DQ2.5, HLA-DQ8 and HLA-DQ6.2, presented for residues P–2 to P10 of the peptide. Blue dashed lines, conserved MHC residue–peptide hydrogen bonds; red dashed lines, polymorphic MHC residue–peptide hydrogen bonds. Residues found at polymorphic sites are in parenthesis in the order DQ2.5, DQ8 and DQ6.2; those not involved in hydrogen bonding interaction are gray. The main chains of α9, α52, α53, α55 and β56 (underlined) form a hydrogen bond with the peptide; all other residues form a hydrogen bond via the side chain. (b) Locations of the MHC residues that form a hydrogen bond to the peptide main chain. Blue, conserved MHC residues; red, polymorphic residues.
©20
09 N
atu
re A
mer
ica,
Inc.
All
rig
hts
res
erve
d.
nature immunology VOLUME 10 NUMBER 10 OctOBER 2009 1101
A rt i c l e s
and Graves’ disease), whereas the DR7DQ2 haplotype does not demonstrate the same associations30. The peptide sequences of autoantigens or other antigens that elicit pathogenic T cell responses in DQ2.5+ people probably bind to the DQ2.2 molecule as well. However, the chance for productive presentation of peptide antigens by DQ2.2 on APCs that transit from tissue to lymph nodes would be substantially lower and result in less T cell stimulation. This effect would particularly apply to lowaffinity binding self antigens, which are thought to drive autoimmune T cell responses. The DQα22 tyrosinetophenylalanine polymorphism is critical for determining the disparate association of DQ2.5 and DQ2.2 with celiac disease and may well be a critical factor in determining the effect of MHC on other DQ2.5associated diseases as well. Analysis of the influence on peptidebinding stability by polymorphic MHC class II residues that form hydrogen bonds to the peptide main chain is warranted in the future.
METHODSMethods and any associated references are available in the online version of the paper at http://www.nature.com/natureimmunology/.
Note: Supplementary information is available on the Nature Immunology website.
ACKnowLEdgMEntSWe thank E. Mellins (Stanford University) for 8.1.6 BLCLs and S2 cells expressing soluble HLADM; B. Roep (Leiden University Medical Center) for 721.82 BLCLs; H. Soltani for flowassisted cell sorting; T. Svingerud for assistance in making the sDQ2.2 and sDQ2.2 Fα22Y constructs; C. Khosla (Stanford University) and U. Jüse (University of Oslo) for fluorescencelabeled peptides; and B. Jabri and S. Buus for critical reading of the manuscript. Supported by the Research Council of Norway (L.M.S.), the Biomedical Research Council of Singapore (C.Y.K.) and the Life Sciences Institute, National University of Singapore (C.Y.K).
AUtHoR ContRIBUtIonSL.E.F. and E.B. designed and did experiments, analyzed data and contributed to the writing of the manuscript; K.H. contributed to data analysis and revised the manuscript; A.B.L. did experiments, contributed to data analysis and revised the manuscript; C.Y.K. contributed to data analysis and to the writing of the manuscript; and L.M.S. directed the research, designed experiments, analyzed data and wrote the manuscript.
Published online at http://www.nature.com/natureimmunology/. reprints and permissions information is available online at http://npg.nature.com/reprintsandpermissions/.
1. Sollid, L.M. Coeliac disease: dissecting a complex inflammatory disorder. Nat. Rev. Immunol. 2, 647–655 (2002).
2. Kagnoff, M.F. Celiac disease: pathogenesis of a model immunogenetic disease. J. Clin. Invest. 117, 41–49 (2007).
3. Lundin, K.E.A. et al. Gliadin-specific, HLA-DQ(α1*0501,β1*0201) restricted T cells isolated from the small intestinal mucosa of celiac disease patients. J. Exp. Med. 178, 187–196 (1993).
4. Kim, C.Y., Quarsten, H., Bergseng, E., Khosla, C. & Sollid, L.M. Structural basis for HLA-DQ2-mediated presentation of gluten epitopes in celiac disease. Proc. Natl. Acad. Sci. USA 101, 4175–4179 (2004).
5. Henderson, K.N. et al. A structural and immunological basis for the role of human leukocyte antigen DQ8 in celiac disease. Immunity 27, 23–34 (2007).
6. Bergseng, E., Sidney, J., Sette, A. & Sollid, L.M. Analysis of the binding of gluten T-cell epitopes to various human leukocyte antigen class II molecules. Hum. Immunol. 69, 94–100 (2008).
7. Sollid, L.M. et al. Evidence for a primary association of celiac disease to a particular HLA-DQ α/β heterodimer. J. Exp. Med. 169, 345–350 (1989).
8. Johansen, B.H. et al. Both α and β chain polymorphisms determine the specificity of the disease-associated HLA-DQ2 molecules, with β chain residues being most influential. Immunogenetics 45, 142–150 (1996).
9. van de Wal, Y. et al. Unique peptide binding characteristics of the disease-associated DQ(α1*0501, β1*0201) vs the non-disease-associated DQ(α1*0201, β1*0202) molecule. Immunogenetics 46, 484–492 (1997).
10. Vader, W. et al. The HLA-DQ2 gene dose effect in celiac disease is directly related to the magnitude and breadth of gluten-specific T cell responses. Proc. Natl. Acad. Sci. USA 100, 12390–12395 (2003).
11. Qiao, S.W. et al. Refining the rules of gliadin T cell epitope binding to the disease-associated DQ2 molecule in celiac disease: importance of proline spacing and glutamine deamidation. J. Immunol. 175, 254–261 (2005).
12. van de Wal, Y., Kooy, Y.M.C., Drijfhout, J.W., Amons, R. & Koning, F. Peptide binding characteristics of the coeliac disease-associated DQ(α1*0501, β1*0201) molecule. Immunogenetics 44, 246–253 (1996).
13. Vartdal, F. et al. The peptide binding motif of the disease associated HLA-DQ(α1*0501, β1*0201) molecule. Eur. J. Immunol. 26, 2764–2772 (1996).
14. Wiesner, M. et al. Dominance of an alternative CLIP sequence in the celiac disease associated HLA-DQ2 molecule. Immunogenetics 60, 551–555 (2008).
15. Fallang, L.E. et al. Complexes of two cohorts of CLIP peptides and HLA-DQ2 of the autoimmune DR3–DQ2 haplotype are poor substrates for HLA-DM. J. Immunol. 181, 5451–5461 (2008).
16. Pashine, A. et al. Interaction of HLA-DR with an acidic face of HLA-DM disrupts sequence-dependent interactions with peptides. Immunity 19, 183–192 (2003).
17. Hall, F.C. et al. Relationship between kinetic stability and immunogenicity of HLA-DR4/peptide complexes. Eur. J. Immunol. 32, 662–670 (2002).
18. Lazarski, C.A. et al. The kinetic stability of MHC class II:peptide complexes is a key parameter that dictates immunodominance. Immunity 23, 29–40 (2005).
19. Lanzavecchia, A., Reid, P.A. & Watts, C. Irreversible association of peptides with class II MHC molecules in living cells. Nature 357, 249–252 (1992).
20. Shan, L. et al. Structural basis for gluten intolerance in celiac sprue. Science 297, 2275–2279 (2002).
21. Lee, K.H., Wucherpfennig, K.W. & Wiley, D.C. Structure of a human insulin peptide–HLA-DQ8 complex and susceptibility to type 1 diabetes. Nat. Immunol. 2, 501–507 (2001).
22. Siebold, C. et al. Crystal structure of HLA-DQ0602 that protects against type 1 diabetes and confers strong susceptibility to narcolepsy. Proc. Natl. Acad. Sci. USA 101, 1999–2004 (2004).
23. Shishova, E.Y., Di, C.L., Emig, F.A., Ash, D.E. & Christianson, D.W. Probing the specificity determinants of amino acid recognition by arginase. Biochemistry 48, 121–131 (2009).
24. Henrickson, S.E. et al. T cell sensing of antigen dose governs interactive behavior with dendritic cells and sets a threshold for T cell activation. Nat. Immunol. 9, 282–291 (2008).
25. Karell, K. et al. HLA types in celiac disease patients not carrying the DQA1*05–DQB1*02 (DQ2) heterodimer: results from the European Genetics Cluster on Celiac Disease. Hum. Immunol. 64, 469–477 (2003).
26. Ploski, R., Ek, J., Thorsby, E. & Sollid, L.M. On the HLA-DQ(α1*0501, β1*0201)-associated susceptibility in celiac disease: a possible gene dosage effect of DQB1*0201. Tissue Antigens 41, 173–177 (1993).
27. Stern, L.J. et al. Crystal structure of the human class II MHC protein HLA-DR1 complexed with an influenza virus peptide. Nature 368, 215–221 (1994).
28. Nelson, C.A. & Fremont, D.H. Structural principles of MHC class II antigen presentation. Rev. Immunogenet. 1, 47–59 (1999).
29. Fremont, D.H., Monnaie, D., Nelson, C.A., Hendrickson, W.A. & Unanue, E.R. Crystal structure of I-Ak in complex with a dominant epitope of lysozyme. Immunity 8, 305–317 (1998).
30. Price, P. et al. The genetic basis for the association of the 8.1 ancestral haplotype (A1, B8, DR3) with multiple immunopathological diseases. Immunol. Rev. 167, 257–274 (1999).
©20
09 N
atu
re A
mer
ica,
Inc.
All
rig
hts
res
erve
d.
nature immunology doi:10.1038/ni.1780
31. Erlich, H., Lee, J.S., Petersen, J.W., Bugawan, T. & DeMars, R. Molecular analysis of HLA class I and class II antigen loss mutants reveals a homozygous deletion of the DR, DQ, and part of the DP region: implications for class II gene order. Hum. Immunol. 16, 205–219 (1986).
32. Johansen, B.H. et al. Binding of peptides to HLA-DQ molecules: peptide binding properties of the disease-associated HLA-DQ(α1*0501, β1*0201) molecule. Int. Immunol. 6, 453–461 (1994).
33. Quarsten, H. et al. Staining of celiac disease-relevant T cells by peptide-DQ2 multimers. J. Immunol. 167, 4861–4868 (2001).
34. Viken, H.D. et al. Characterization of an HLA-DQ2-specific monoclonal antibody. Influence of amino acid substitutions in DQβ1*0202. Hum. Immunol. 42, 319–327 (1995).
35. Sloan, V.S. et al. Mediation by HLA-DM of dissociation of peptides from HLA-DR. Nature 375, 802–806 (1995).
36. Pettersen, E.F. et al. UCSF Chimera—a visualization system for exploratory research and analysis. J. Comput. Chem. 25, 1605–1612 (2004).
37. Davis, I.W. et al. MolProbity: all-atom contacts and structure validation for proteins and nucleic acids. Nucleic Acids Res. 35, W375–W383 (2007).
ONLINE METHODSCells. HLAhomozygous EpsteinBarr virus–transformed BLCLs were from the Tenth International Histocompatibility Workshop (also available from the Cell and Gene Bank of the International Histocompatibility Working Group). The 8.1.6 and 721.82 BLCLs were gifts from E. Mellins and B. Roep, respectively.
Retroviral transfection of 721.82 B-LCLs. The cDNA encoding HLADQ was generated from the BLCLs CD114 (DQA1*0501 and DQB1*0201) and 9047 (DQA1*0201) and was then cloned into pLNCX (DQB1) and pLHCX (DQA1) of the LRCX Retroviral Vector Set (Clontech). DQA1 mutations were completed by sitedirected mutagenesis (Quikchange Multi SiteDirected Mutagenesis Kit; Stratagene) in the pMOSBlue vector (GE Healthcare Life Sciences) with primers containing the desired nucleotide change. Constructs were verified by DNA sequencing. Retroviral transduction was done as recommended by Clontech; however, BLCLs were cocultured with the transfected packaging cell to obtain sufficient transduction efficiency. GP2293 cells (Clontech) were cultured in DMEM supplemented with 10% (vol/vol) FCS. Cells were plated at a density of 2 × 10⁶ cells per 100mm dish 24 h before cotransfection with expression plasmids and pAMPHO (plasmid containing envelope proteins) with Lipofectamine 2000 (Invitrogen) as the transfection agent. Transfected packaging cells were incubated for 48 h, then were irradiated, washed and resuspended in RPMI1640 medium with 10% (vol/vol) FCS before the addition of 2 × 10⁶ 721.82 cells (homozygous deletion mutant expressing HLADP but not HLADR or HLADQ)31. BLCL 721.82 was first retrovirally transfected with DQB1*0201 with selection by the aminoglycoside G418, followed by retroviral transfection with variants of DQA1, with hygromycin for selection. Transfectants with higher expression of HLADQ molecules were isolated by immunomagnetic isolation (monoclonal antibody SPVL3 coupled to M450 SAM IgG Dynabeads; Invitrogen) or flowassisted cell sorting (FACSAria; BD Pharmingen) with monoclonal antibody FN81 (Diatec).
Elution and analysis of DQ2-bound peptides. Lysates of 1 × 10⁸ to 1 × 10⁹ BLCLs were clarified by centrifugation (1% (vol/vol) Nonidet P40, 5 mM sodium orthovanadate, 25 mM iodoacetamide and 1 mM phenylmethyl sulfonyl fluoride), and DQ2 molecules were immunoprecipitated with monoclonal antibody 2.12.E11 to DQ2 covalently crosslinked to protein A–coated CL4B Sepharose32. Peptides were acideluted (0.1% (vol/vol) trifluoroacetic acid) from purified DQ2 (or from Sepharosebound DQ2 in the case of the transfectants), were purified on R2 reversephase material and were analyzed on a MALDITOF–TOF mass spectrophotometer (Ultraflex II; Bruker Daltonics).
Flow cytometry analysis. BLCLs (1 × 10⁵) were washed twice and then were stained for 45 min at 4 °C in 50 µl of 3% (vol/vol) FCS in PBS containing 5 µl conjugated monoclonal antibody to HLADQ (phycoerythrinconjugated FN81; Diatec) and/or CLIP1 (fluorescein isothiocyanate–conjugated cerCLIP; BD Pharmingen). The fluorescein isothiocyanate signal was amplified by staining the cells for an additional 45 min with 1 µg/ml of monoclonal antibody to fluorescein isothiocyanate (antifluorescein–Oregon green–Alexa Fluor 488, Invitrogen) in a volume of 50 µl. Cells were washed once and analyzed on a FACSCalibur (BD Pharmingen).
Water-soluble DQ2-peptide complexes. Watersoluble DQ2.5, engineered to have a peptide ligand tethered to the βchain by a thrombincleavable linker and a FosJun leucine zipper pair replacing the transmembrane domains, was expressed in insects cells with a baculovirus expression vector system33. Similar constructs for watersoluble DQ2.2 were created with cDNA of DQA1*0201 (from BLCL 9047) together with the previously made gene encoding DQB1*0201 (ref. 33). Mutations of DQA1 were introduced as described above and constructs were verified by DNA sequencing. The soluble DQ2.5 and DQ2.2 molecules were affinitypurified with monoclonal antibody 2.12.E11 to DQ2 (ref. 34).
HLA-peptide dissociation experiments. Two experimental procedures for measuring dissociation of peptides from soluble DQ2 molecules were used. The first method involved measurement of the dissociation of thrombincleaved, tethered peptide ligands from soluble DQ2 by MALDITOF analysis, which has been described15. In some of these experiments, watersoluble HLADM (6 µM) was included. HLADM was produced in stably transfected S2 cells (a gift from E. Mellins) and was purified by affinity and sizeexclusion chromatography as described35. The second method involved the formation of DQ2peptide complexes by uploading of the Nterminal fluorescence–labeled peptide P2019 (5FAM–Ahx–YLTFLPSADEIYD; GL Biochem), P198 (5(6)FAM–KPLLIIAEDVEGEY; a gift from U. Jüse) or P1538 (5(6)FAM–AAIAAVKEEAF; a gift from C. Khosla), at a concentration of 200 µM, onto thrombincleaved sDQ2peptide molecules (6.5 µM), allowing for peptide exchange for 24–48 h at 37 °C. Complexes were isolated in spin columns containing G50 Superfine Sepharose and were incubated at a pH of 5.3 and at 37 °C in the presence of an excess of unlabeled competitive highaffinity peptide (KPLLIIAEDVEGEY; Mycobacterium bovis 65kilodalton heatshock protein 243255Y)) to inhibit rebinding. Aliquots were removed at various time points and were analyzed by highperformance liquid chromatography sizeexclusion chromatography (Agilent 1100) with a ZORBAX GF250 column (Agilent) and an inline fluorescence detector. For each time point, the area of the fluorescent peak of the complexes was compared with that of the released peptides, and the dissociation kinetics were fit into the onephase exponential decay function (Y = As x exp(−ks x)) or the twophase exponential decay function (Y = Af x exp(−kf x) + As x exp(−ks x)) with GraphPad Prism (Version 4.01).
T cell assay. Six different T cell clones derived from DQ2.5+ patients with celiac disease were used (specificity in parentheses): 430.1.142 (DQ2αI), 436.5.3 (DQ2αII), 423.1.3.8 (DQ2γI), 437.1.3.17 (DQ2γII), 430.1.46 (DQ2γIII), 430.1.112 (DQ2γIV). The T cell clones were tested with synthetic peptides representing the following gluten T cell epitopes: DQ2αI, QLQPFPQPELPY; DQ2αII, PQPELPYPQPQL; deamidated 33–amino acid peptide, LQLQPF(PQPELPY)3PQPQPF; DQ2γI, PEQPQQSFPEQERP; DQ2γII, GIIQPEQPAQL; DQ2γIII, FPQQPEQPYPQQP; DQ2γIV, FSQPEQEFPQPQ. The T cell proliferation assay has been described in detail11. The lifetime of peptide–MHC class II complexes was measured by T cell proliferation as described19. Irradiated APCs (80 or 160 Gy) were pulsed for 2 h at 37 °C with peptide in RPMI medium containing 5% (vol/vol) FCS, then were washed three times to remove free peptide and were cultured for 0, 18, 48 and 96 h. T cells (4 × 10⁴ to 5 × 10⁴ cells per well) were cultured with ‘graded’ number of APCs. After 48 h, [3H]thymidine was added and radioactivity was measured after an additional 20 h by liquid scintillation counting.
Structural analysis of MHC-peptide complexes. Analysis of hydrogen bonding was done with two programs, Chimera36 and MolProbity37. Although these programs used different methodology and criteria in identifying hydrogen bonds, they generally gave identical results. Hydrogen bonds that were identified by only one of the programs, however, were inspected manually for their validity.
©20
09 N
atu
re A
mer
ica,
Inc.
All
rig
hts
res
erve
d.
Copyright © 2022 FDOKUMEN