Deregulation of education: What does it mean for efficiency and equality
Upload
independentCategory
view
1download
0
Neurobiology of Disease 39 (2010) 204–210
Contents lists available at ScienceDirect
Neurobiology of Disease
j ourna l homepage: www.e lsev ie r.com/ locate /ynbd i
Pantothenate kinase-2 (Pank2) silencing causes cell growth reduction, cell-specificferroportin upregulation and iron deregulation
Maura Poli a,1, Manuela Derosas a,1, Sara Luscieti a,1, Patrizia Cavadini a, Alessandro Campanella b,c,Rosanna Verardi d, Dario Finazzi a,e, Paolo Arosio a,e,⁎a Dipartimento Materno Infantile e Tecnologie Biomediche, Università di Brescia, viale Europa 11, 25123 Brescia, Italyb IIT Network, Research Unit of Molecular Neuroscience, Italyc Vita-Salute San Raffaele University, Italyd Section of Immunohematology and Transfusional Medicine, A.O. Spedali Civili di Brescia, 25123 Brescia, Italye Terzo Laboratorio Analisi Chimico Cliniche, A.O. Spedali Civili di Brescia, 25123 Brescia, Italy
⁎ Corresponding author. Dipartimento Materno InfanFacoltà di Medicina e Chirurgia, Università di Brescia, VItaly. Fax: +39 030 307251.
E-mail address: [email protected] (P. Arosio).1 M.D., M.P. and S.L. equally contributed to the work.
Available online on ScienceDirect (www.scienced
0969-9961/$ – see front matter © 2010 Elsevier Inc. Adoi:10.1016/j.nbd.2010.04.009
a b s t r a c t
a r t i c l e i n f oArticle history:Received 13 October 2009Revised 9 April 2010Accepted 9 April 2010Available online 23 April 2010
Keywords:Pantothenate kinaseFerroportinIron metabolismFerritinNeurodegeneration with brain ironaccumulation
Pantothenate kinase 2 (Pank2) is a mitochondrial enzyme that catalyses the first regulatory step ofCoenzyme A synthesis and that is responsible for a genetic movement disorder named Pank-associatedneurodegeneration (PKAN). This is characterized by abnormal iron accumulation in the brain, particularly inthe globus pallidus. We downregulated Pank2 in some cell lines by using specific siRNAs to study its effect oniron homeostasis. In HeLa cells this caused a reduction of cell proliferation and of aconitase activity, signs ofcytosolic iron deficiency without mitochondrial iron deposition, and a 12-fold induction of ferroportinmRNA. Pank2 silencing caused a strong induction of ferroportin mRNA also in hepatoma HepG2, a modestone in neuroblastoma SH-SY5Y and none in glioma U373 cells. A reduction of cell growth was observed in allthese cell types. The strong Pank2-mediated alteration of ferroportin expression in some cell types mightalter iron transfer to the brain and be connected with brain iron accumulation.
tile e Tecnologie Biomediche,iale Europa 11, 25123 Brescia,
irect.com).
ll rights reserved.
© 2010 Elsevier Inc. All rights reserved.
Introduction
Pank-associated neurodegeneration (PKAN) is an autosomalrecessive disease linked to mutations of the human Pank2 gene(Hayflick, 2003). PKAN is part of the NBIA disorders (neurodegenera-tion with brain iron accumulation) previously known as Hallervor-den–Spatz syndrome (Gregory and Hayflick, 2005). Patients withPKAN exhibit motor symptoms, such as dystonia, dysarthria,intellectual impairment, and gait disturbance (Dooling et al., 1974).Early onset patients have a rapidly progressive disease, whereas lateronset patients have a slowly progressive, atypical disease (Hayflick etal., 2003; Thomas et al., 2004). A primary site of neurodegenerationand of iron accumulation is the globus pallidus, which on T2-weightedmagnetic resonance produces a characteristic image called “eye-of-the-tiger” (Hayflick et al., 2003). Pantothenate kinase (Pank) is thefirst and rate-limiting enzyme in the Coenzyme A (CoA) biosyntheticpathway, which catalyses the phosphorylation of vitamin B5,
pantothenate (Leonardi et al., 2005). In human, there are threegenes that express active Pank enzymes. Pank1 and Pank3 encodecytosolic enzymes, while Pank2 encodes a protein that is processedand localized in the mitochondria (Rock et al., 2000; Zhang et al.,2005). All of the Pank isoforms contain a common, highly homologouscatalytic domain of about 355 residues and differ in the N-terminaldomains that have regulatory roles (Hong et al., 2007). Human Pank2has an additional amino-terminal extension that includes twomitochondrial targeting signals, which are removed by mitochondrialprocessing peptidases concomitant with the mitochondrial localiza-tion (Kotzbauer et al., 2005; Zhang et al., 2006). Human and primatePank2 seem to be unique for their mitochondrial localization, sincethe mouse Pank2 homologue was reported to have a cytosoliclocalization (Leonardi et al., 2007) and most organisms have only asingle cytosolic Pank (Leonardi et al., 2005). The link between Pank2mutations, neurodegeneration and brain iron accumulation remainslargely enigmatic and even the subcellular localization of the irondeposition has not been defined, since iron granules have beenobserved around blood vessels both intracellularly and extracellularly(Koeppen and Dickson, 2001; Neumann et al., 2000). Pank2 null miceshowed growth reduction, retinal degeneration and male infertilitydue to azoospermia, but no movement disorders or brain ironaccumulation, even after 18 months of age (Kuo et al., 2005). On theother side, pantothenic acid deficient diet caused movement disorder

205M. Poli et al. / Neurobiology of Disease 39 (2010) 204–210
and azoospermia in mice, but no evident iron accumulation in thebasal ganglia (Kuo et al., 2007). Also in Drosophila, the suppression ofPank or of other genes of CoA pathway caused neurodegeneration, butwithout signs of neuronal iron accumulation (Bosveld et al., 2008).Interestingly, the Drosophila phenotype caused by the suppression ofPank was efficiently rescued by the expression of the mitochondrialhuman Pank2, and less so by that of the cytosolic Pank1 and Pank3(Wu et al., 2009). The hypothesis that PKAN neurodegeneration islinked to defects of its enzymatic activity is supported by theobservation that frameshift and nonsense mutations cause earlieronset disease than some missense mutations, and that most of themutations so far identified alter enzyme activity, its stability or itsaggregation status (Hong et al., 2007). For the association of PKANwith brain iron accumulation it has been proposed that a reducedPank2 activity may lead to accumulation of cysteine, which maychelate iron and catalyse free radical formation (Perry et al., 1985), orthat the mitochondrial CoA deficiency may damage membrane andlead to oxidative stress, which would alter iron homeostasis (Hayflick,2006). Pank2 is ubiquitous, and thus the effects of Pank2 down-regulation can be analysed in cultured cell lines.
Here we describe the silencing of Pank2. We found that in HeLacells it causes a reduction of cell growth, signs of cellular irondeficiency without mitochondrial iron deposition, a large increase offerroportin mRNA and reduction of aconitase activity. Pank2 silencingreduced cell growth also in HepG2, neuroblastoma SH-SY5Y andgliomaU373 cell,while the induction of ferroportinmRNAwaspresentin HepG2 but low or absent in the neuronal cell lines. The strongPank2-mediated alteration of ferroportin expression in some cell typesmight alter iron transfer to the brain and be connected with NBIA.
Materials and methods
Cells and siRNAs
HeLa, U373 and H4 cells were cultured in DMEM (Invitrogen,Paisley, UK) supplemented with 10% fetal bovine serum (Euroclone,Milano, Italy), 1 mM L-glutamine and 40 μg/ml gentamicin. HepG2cells were cultured in Minimal Essential Medium (PAA LaboratoriesGmbH, M-Medical, Milano) with 10% fetal bovine serum, 40 μg/mlgentamicin and 1 mM L-glutamine. SH-SY5Y cells were cultured inMinimal Essential Medium/Ham's F-12 (PAA Laboratories GmbH, M-Medical, Milano) with 10% fetal bovine serum, 40 μg/ml gentamicinand 1 mM L-glutamine. SH-SY5Y cells were differentiated by growing14 days in completemediumsupplementedwith 0.1 mMretinoic acid.The cells were maintained at 37 °C under 5% CO2. Two ds-siRNAsspecific for Pank2 gene were obtained from Ambion (Ambion, Austin,TX), one named A (siRNA ID # 131833, sense 5′-GCGACUUUGAUCAC-CAUCAtt-3′; antisense 5′-UGAUGGUGAUCAAGUCGCtt-3′), and theother named B (siRNA ID # 131834, sense 5′-GGCUACUAUGC-GUUAUAAUtt-3′, antisense 5′-AUUAUAACGCAUAGUAGCCtg-3′).Scrambled siRNA was obtained from Qiagen (Qiagen-Xeragon)named Control siRNA 10220776 sense 5′-UUCUCCGAACGUGUCAC-GUtt and antisense 5′-ACGUGACACGUUCGGAGAAtt. For transfectionof HeLa, HepG2 andU373 cells, 105 cellswere seeded in 12-well plates,and incubated the following day with 100 pmol of siRNAs and 3 μloligofectamine (Invitrogen). For transfection of SH-SY5Y cells we usedthe Amaxa Nucleofector Technology and SH-SY5Y optimized protocol(Lonza Group Ltd, Switzerland). We performed two sequentialtransfections at day 0 and again at day 2, and cells were harvested atday 5. All experiments used oligofectamine alone or electroporationalone for SH-SY5Y (mock) or scramble siRNA (scr) as control.
Biochemical and immunological methods
In immunoblot experiments equal amounts of proteins wereseparated on SDS-PAGE and transferred to PVDF membrane. The
membranes were incubated at 4 °C for 16 h with specific antibodies:polyclonal rabbit anti-L ferritin (1:1000, Sigma, St. Louis, MO), poly-clonal rabbit anti-SOD2 (1:4000 Millipore, Bilerica NA), polyclonalmouse anti-TfR1 (1:1000, Zymed, Invitrogen), and rabbit anti β-actin(1:1000, Sigma). The filters were then washed and incubated for 1 hwith HRP-conjugated anti-rabbit IgG (Pierce, Rockford, IL, USA) oranti-mouse IgG (Dako Copenhagen, Denmark). Immunocomplexeswere detected by a chemiluminescence detection kit (ECL advance, GEHealthcare Waukesha, WI) with Kodak Image Station 440 CF (Kodak,Rochester, NY). The densitometric analysis was performed with theKodak 1D 3.6 program. The activity of aconitase, citrate synthase andSOD2 was determined as previously described (Gardner et al., 1994).When mitochondrial fractionation was required, cells were washedwith ice-cold PBS and treated with 0.01% digitonin followed by twodifferential centrifugations as in Cavadini et al. (2007). Proteinconcentrationwas determined by the BCAmethod (Pierce), calibratedon bovine serum albumin (BSA). Free protoporphyrin was evaluatedby flow cytometry as is described in Luksiene et al. (2001).
Cell treatments and viability
HeLa cells were treated with 1 mM ferric ammonium citrate (FAC)and 0.1 mM ascorbic acid for 18 h, with the iron chelator desferox-amine (DFO, 0.1 mM) for 18 h, with 0.5 mM H2O2 for 2 h or with30 μM Fe–transferrin for 72 h. For viability assays the cells werewashed once with ice-cold PBS, harvested, counted and evaluated fortrypan blue exclusion. Alternatively and in the cytotoxicity studies thecells were seeded in 96-well plates, and after treatments, they werewashed and incubated with 50 μl of 5 mg/ml solution thiazolyl bluetetrazolium bromide in PBS (MTT, Sigma,) for 2 h. The supernatantwas removed, the insoluble formazan blue was dissolved in 100 μlDMSO, and the absorbance was read at 570 nm (Cavadini et al., 2007).
Transcript quantification
RNA was purified from cells using Tri Reagent solution (Ambion,Austin, TX). Total RNA DNase treated (1 μg) was used to synthesise thefirst strand of cDNA with the Improm-II Reverse Transciption System(Promega,Madison,WI), using oligo dT as primer. For RT-PCR analysis ofPank1, Pank2, and Pank3 primerswere designed by NCBI/Primer-BLASTdesigning tool and synthesised by MWG Ebersberg, Germany. The PCRwere run for 30 cycles. (Pank1 forward: 5′-AGGTTCATTCAGATGGGCAG-3′; Pank1 reverse: 5′-AGCCCATGTTAACCAGCAAC-3′; Pank3 forward: 5′-CATTGCAGACGGTGCTATGT-3′; Pank3 reverse: 5′-ATCACCTTTGGATGC-CATTT-3′, Pank2 forward: 5′-GGATCGACTGGGCTCTTACA-3′; Pank2reverse: 5′-TTGGAGGTCAGGTACTTCCG-3′). For real-time RT-PCR anal-ysis, we used the Assays on Demand Product (Hs00227958-m1 forPank2 and Hs00205888-m1 for ferroportin) (20×) and TaqMan MasterMix (2×) from Applied Biosystem (Foster City, CA). We followed themanufacturer's instructions, and the reaction was run on ABI PRISM7700 Sequence Detection System (Applied Biosystem) in a final volumeof 25 μl for 40 cycles. Glyceraldehyde 3-phosphate dehydrogenase(GAPDH) was used as an endogenous reference.
55Fe uptake
Cells at 4 day after transfectionwere incubated for 18 hwith 2 μCi/ml (74 KBq) 55Fe-FAC and 200 μM ascorbic acid, as previouslydescribed (Zanella et al., 2008). Cells were then washed 3 timeswith PBS, harvested and treated with 0.01% digitonin to separate themitochondrial (MF) and post-mitochondrial fractions (PMF) as above.Then, 5 μl of MF samples was added to 1 ml scintillation liquid (ReadySafe, Beckman Coulter, Fullerton, CA) and counted. The solubleproteins were run on 7% non-denaturing PAGE, the dried gels wereexposed to autoradiography. The intensity of the ferritin bands wasquantified by densitometry in the linear range.
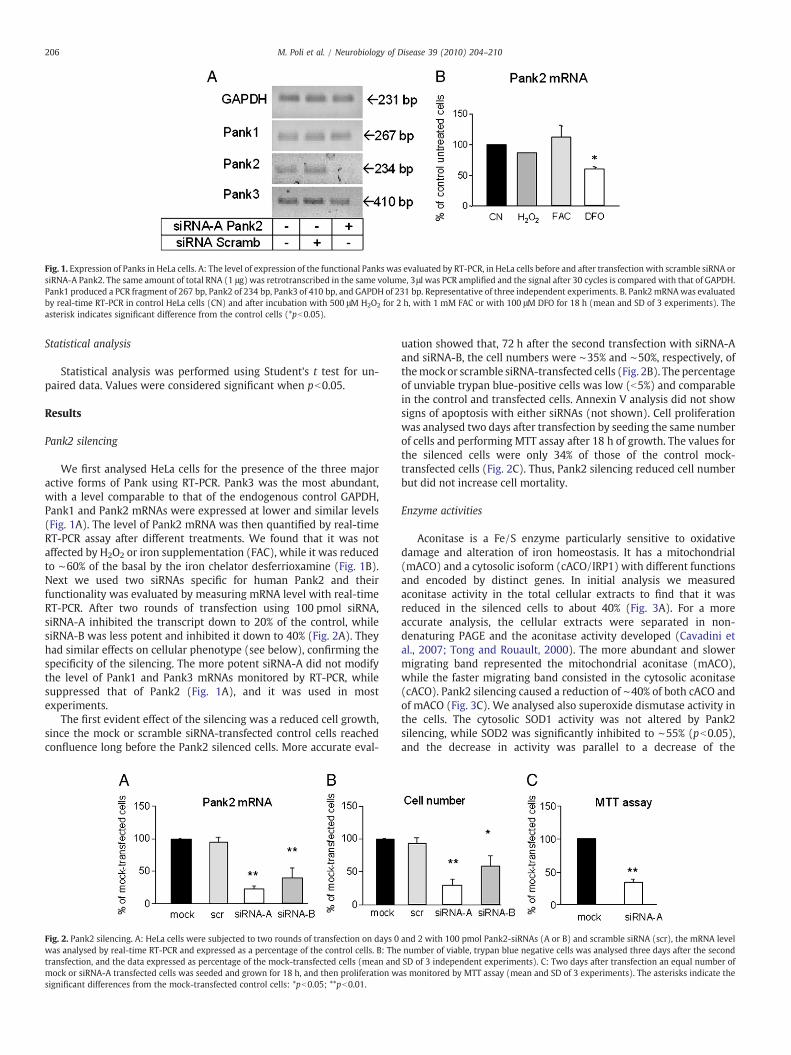
Fig. 1. Expression of Panks in HeLa cells. A: The level of expression of the functional Panks was evaluated by RT-PCR, in HeLa cells before and after transfection with scramble siRNA orsiRNA-A Pank2. The same amount of total RNA (1 μg) was retrotranscribed in the same volume, 3μl was PCR amplified and the signal after 30 cycles is compared with that of GAPDH.Pank1 produced a PCR fragment of 267 bp, Pank2 of 234 bp, Pank3 of 410 bp, and GAPDH of 231 bp. Representative of three independent experiments. B. Pank2mRNAwas evaluatedby real-time RT-PCR in control HeLa cells (CN) and after incubation with 500 μM H2O2 for 2 h, with 1 mM FAC or with 100 μM DFO for 18 h (mean and SD of 3 experiments). Theasterisk indicates significant difference from the control cells (*pb0.05).
206 M. Poli et al. / Neurobiology of Disease 39 (2010) 204–210
Statistical analysis
Statistical analysis was performed using Student's t test for un-paired data. Values were considered significant when pb0.05.
Results
Pank2 silencing
We first analysed HeLa cells for the presence of the three majoractive forms of Pank using RT-PCR. Pank3 was the most abundant,with a level comparable to that of the endogenous control GAPDH,Pank1 and Pank2 mRNAs were expressed at lower and similar levels(Fig. 1A). The level of Pank2 mRNA was then quantified by real-timeRT-PCR assay after different treatments. We found that it was notaffected by H2O2 or iron supplementation (FAC), while it was reducedto ∼60% of the basal by the iron chelator desferrioxamine (Fig. 1B).Next we used two siRNAs specific for human Pank2 and theirfunctionality was evaluated by measuring mRNA level with real-timeRT-PCR. After two rounds of transfection using 100 pmol siRNA,siRNA-A inhibited the transcript down to 20% of the control, whilesiRNA-B was less potent and inhibited it down to 40% (Fig. 2A). Theyhad similar effects on cellular phenotype (see below), confirming thespecificity of the silencing. The more potent siRNA-A did not modifythe level of Pank1 and Pank3 mRNAs monitored by RT-PCR, whilesuppressed that of Pank2 (Fig. 1A), and it was used in mostexperiments.
The first evident effect of the silencing was a reduced cell growth,since the mock or scramble siRNA-transfected control cells reachedconfluence long before the Pank2 silenced cells. More accurate eval-
Fig. 2. Pank2 silencing. A: HeLa cells were subjected to two rounds of transfection on days 0was analysed by real-time RT-PCR and expressed as a percentage of the control cells. B: Thetransfection, and the data expressed as percentage of the mock-transfected cells (mean andmock or siRNA-A transfected cells was seeded and grown for 18 h, and then proliferation wsignificant differences from the mock-transfected control cells: *pb0.05; **pb0.01.
uation showed that, 72 h after the second transfection with siRNA-Aand siRNA-B, the cell numbers were ∼35% and ∼50%, respectively, ofthemock or scramble siRNA-transfected cells (Fig. 2B). The percentageof unviable trypan blue-positive cells was low (b5%) and comparablein the control and transfected cells. Annexin V analysis did not showsigns of apoptosis with either siRNAs (not shown). Cell proliferationwas analysed two days after transfection by seeding the same numberof cells and performing MTT assay after 18 h of growth. The values forthe silenced cells were only 34% of those of the control mock-transfected cells (Fig. 2C). Thus, Pank2 silencing reduced cell numberbut did not increase cell mortality.
Enzyme activities
Aconitase is a Fe/S enzyme particularly sensitive to oxidativedamage and alteration of iron homeostasis. It has a mitochondrial(mACO) and a cytosolic isoform (cACO/IRP1) with different functionsand encoded by distinct genes. In initial analysis we measuredaconitase activity in the total cellular extracts to find that it wasreduced in the silenced cells to about 40% (Fig. 3A). For a moreaccurate analysis, the cellular extracts were separated in non-denaturing PAGE and the aconitase activity developed (Cavadini etal., 2007; Tong and Rouault, 2000). The more abundant and slowermigrating band represented the mitochondrial aconitase (mACO),while the faster migrating band consisted in the cytosolic aconitase(cACO). Pank2 silencing caused a reduction of ∼40% of both cACO andof mACO (Fig. 3C). We analysed also superoxide dismutase activity inthe cells. The cytosolic SOD1 activity was not altered by Pank2silencing, while SOD2 was significantly inhibited to ∼55% (pb0.05),and the decrease in activity was parallel to a decrease of the
and 2 with 100 pmol Pank2-siRNAs (A or B) and scramble siRNA (scr), the mRNA levelnumber of viable, trypan blue negative cells was analysed three days after the secondSD of 3 independent experiments). C: Two days after transfection an equal number ofas monitored by MTT assay (mean and SD of 3 experiments). The asterisks indicate the

Fig. 3. Enzyme activities. A: The level of aconitase activity in the total cellular homogenates was analysed and expressed as percentage of the activity of the control mock-transfectedcells (mean and SD of three experiments). B: The level of citrate synthase activity in the total cellular homogenates was measured and expressed as percentage of the mock-transfected cells (mean and SD of three experiments). C: The total cell homogenates were separated on non-denaturing PAGE, and the activity of aconitase was revealed. The fastband corresponds to the cytosolic aconitase (cACO), while the slower band, to the mitochondrial isoform (mACO) The histograms show the relative densitometry values and SD ofthree independent experiments. D: Analysis of SOD2 by western blotting, and of enzyme activity of non-denaturing PAGE stained by nitro blue tetrazolium chloride. All theexperiments were performed at least three times with analogous results.
207M. Poli et al. / Neurobiology of Disease 39 (2010) 204–210
corresponding protein level, evaluated by western blotting (Fig. 3D).Citrate synthase activity, a non-iron enzyme used as control, remainedunchanged (Fig. 3B).
Indices of iron status
The effect of Pank2 deficiency on cellular iron status has not beenreported before. We first analysed ferritin level, a protein tightlyregulated by iron availability. This was found to be significantly lowerin the silenced cells (∼60% with siRNA-A and 80% with -B). Moreover,
Fig. 4. Indices of iron status. A: Western blotting with anti-FtL antibody of the cellular extractafter 72 h incubation with 30 μM Fe–transferrin (FeTf). β-actin was used for normalizationmean and SD of three experiments. B:Western blotting of the cellular extracts with anti-TfR1for normalization, mean and SD of three experiments. C: The level of free protoporphyrinpercentage of the mock-transfected cells (mean and SD of three experiments). The asterisk
after 72 h incubation with 30 μM Fe–transferrin the level of ferritinremained significantly reduced with respect to the mock-transfectedcells (Fig. 4A). Transferrin receptor-1 (TfR1) level analysed bywesternblotting was significantly increased in the transfected cells (∼1.5 foldwith siRNA-A and 1.3 fold with siRNA-B) (Fig. 4B). As an alternativeindex of iron availability we studied free protoporphyrin level,detectable by the cellular endogenous fluorescence. It increased inthe silenced cells ∼1.2 fold (Fig. 4C). To verify if the apparent decreaseof iron availability in the silenced cells was a consequence of increasedmitochondrial iron uptake, the cells were incubated for 18 h with
s (20 μg per lane) of the control and of cells transfected with siRNA-A and -B before and. The histogram shows the densitometry values referred to mock transfected controls,antibody (20 μg per lane) and the corresponding densitometry values. β-Actin was usedwas analysed for its intrinsic fluorescence by flow cytometry. Data were expressed ass indicate the significant differences (pb0.05) from the mock-transfected control cells.

Fig. 5. Iron and ferroportin transcript. A: The mitochondrial (MF) and post-mitochondrial fractions (PMF) of HeLa cells were separated and their purity assessed by blotting withantibodies for the mitochondrial-specific SOD2 and for the cytosolic-specific β-actin. B: The silenced and mock-transfected cells were incubated for 18 h with 74 kBq/ml [55Fe] FAC,and the specific radioactivity of the total cell extracts and of the mitochondrial fractions was counted. The data are expressed as percentage of the value of the mock-transfected cells(mean and SD of three experiments). C: The HeLa cells were transfected with siRNA-A and siRNA-B and the level of ferroportin mRNA analysed by real-time RT-PCR using GAPDHmRNA as internal control. The relative amount of FPN mRNA was about 0.01% of that of GAPDH. Mean and SD for siRNA-A are from 16 independent experiments.
208 M. Poli et al. / Neurobiology of Disease 39 (2010) 204–210
74 kBq/ml of 55Fe, and the total homogenate and the separatedmitochondrial fraction were counted. The purity of this fraction wasconfirmed by the high enrichment of mitochondrial SOD2 protein andvirtual absence of cytosolic β-actin (Fig. 5A). We found that thespecific activity in the total cell homogenates and in themitochondrialfractions was not significantly different in the control and silencedcells (Fig. 5B). Ferroportin (FPN) is a cellular iron exporter and itsupregulation was shown to induce iron deficiency (Nemeth et al.,2004), thuswe analysed the level of its transcript by real-time RT-PCR.In 16 independent experiments with siRNA-A we found it to bestrongly and significantly elevated, with a mean value of 12-fold, andsome variability. In the three experiments with siRNA-Bwe obtained asignificant 2.5-fold induction of FPN (Fig. 5A). The level of FPNtranscript in HeLa cells is low (about 0.01% of that of the controlGAPDH), and the protein could not be detected with the availableantibodies.
Fig. 6. Pank2 silencing in hepatoma HepG2, in neuroblastoma SH-SY5Y and in glioma U373(GA) mRNAs were evaluated by RT-PCR with the same method used in Fig. 1A. B: The ntransfection, and the data expressed as percentage of the mock-transfected cells (mean aferroportin mRNA analysed using GAPDH mRNA as internal control.
Pank2 silencing in hepatoma and neuronal cell lines
The major finding in the study of HeLa cells was the upregulationof FPN mRNA and downregulation of ferritin consequent to Pank2silencing. To evaluate if this occurs in other cell types characterized bydifferent levels of FPN or Pank expression, we used hepatoma HepG2cells, glioma U373 lines and neuroblastoma SH-SY5Y cells. SH-SY5Ywere also differentiated by two-week treatment with 0.1 mM retinoicacid. The levels of Pank1, 2 and 3 mRNAs evaluated by RT-PCR, weresimilar to those found in HeLa cells, with Pank3 being the mostabundant one (Fig. 6A). Real-time RT-PCR showed that the level ofPank2 mRNA was remarkably similar in these cells, being 6–8 foldmore abundant than in HeLa cells (not shown). Moreover, we foundthat siRNA-A was efficient in all these cells and downregulated Pank2down to 30% in HepG2, 33% in SH-SY5Y, 25% in the differentiated SH-SY5Y and 15% in U373 cells (not shown). We analysed cell growth by
cells. A: The relative levels of Pank1 (P1), Pank2 (P2), Pank3 (P3) and of control GAPDHumber of viable, trypan blue negative cells was analysed three days after the secondnd SD of 3 experiments). C: The cells were transfected with siRNA-A and the level of

209M. Poli et al. / Neurobiology of Disease 39 (2010) 204–210
counting the trypan blue negative cells 72 h after the second round oftransfection. Live HepG2, U373 and SH-SY5Y cells were reduced to25–35% of the respective mock-transfected cells (Fig. 6B). We couldnot detect an increase in the number of the trypan blue-positive anddead cells in any of the silenced cell type. Next we analysed the levelFPN transcript by real-time RT-PCR. Compared with that in HeLa cells,FPN basal level was about 6000-fold higher in HepG2, 1000-fold inU373 cells and 3000-fold in SH-SY5Y cells, and in these cells itincreased to 2.5-fold after differentiation with retinoic acid. Ferro-portin response to Pank2 silencing differed: in HepG2 cells itincreased significantly at a mean of 6-fold, with a large variabilitysimilar to that observed in HeLa cells (Fig. 6C). In SH-SY5Y it showed amarginal but significant increase of 1.3-fold, while in the glioma U373cell type it was unchanged (Fig. 6C). Glioma H4 cell line, showedlevels of FPN and Pank2 mRNA similar to those of U373 cells, and alsoin these cells Pank2 silencing did not cause significant changes of FPNmRNA (not shown). Interestingly, HepG2 L-ferritin level decreasedslightly but significantly after Pank2 silencing (80%±2%, pb0.005),while in SH-SY5Y and U373 cells it did not change (92% and 107% ofthe control, respectively, not shown).
Discussion
After the finding that Pank2 is responsible of genetic forms of NBIA,the protein was studied in various cellular models showing that it islocalized in the mitochondrial matrix or intermembrane space, that itis processed into 59 and 48 kD forms (Kotzbauer et al., 2005), and thatmost, but not all, pathogenicmutations cause a reduction of the kinaseactivity or affect protein folding/assembly (Zhang et al., 2006). Theseworks weremainly aimed to understand the relationship between theenzyme activity and the mutations, but the effects on mitochondriafunctionality and on iron homeostasis have not been considered sofar. The most severe forms of PKAN are associated with nonsensemutations of the gene, thus we studied a cellular model in which theprotein was specifically silenced. We initially used HeLa cells. Wefound that they express detectable levels of the three functional formsof Pank, with Pank3 being more abundant, and that Pank2 mRNA isdownregulated by iron chelators, similarly to frataxin (Li et al., 2008),a mitochondrial protein involved iron handling. The efficient silencingof Pank2 reduced the target mRNA down to 20% of the basal levelwithout affecting the amount of Pank1 and Pank3 transcripts. In HeLacells, Pank2 silencing reduced cell number without apparentinduction of cell death, thus it seemed to reduce cell growth. It alsoreduced the activity of mitochondrial and cytosolic aconitase. We alsoobserved a significant decrease of level and activity of SOD2, an anti-oxidant protein. This protein is regulated by various factors, includingHIF-2α (Oktay et al., 2007), and HIF-2α was shown to contain afunctional IRE and to be regulated by iron (Sanchez et al., 2007), andthis may partially explain its inhibition in the Pank2 silenced cells.It should be noticed that also in fibroblasts from patients withFriedreich's ataxia, a disease with abnormal iron management in themitochondria, the expression of SOD2 was inhibited, even afterexposure to iron (Jiralerspong et al., 2001). Thus we found someabnormalities in mitochondrial enzymes activity which might berelated to the specific role of Pank2.
The major and unexpected finding was that the silenced HeLa cellsshowed signs of cytosolic iron deficiency, with reduced cytosolicferritin, increased TfR1 and free protoporphyrin, although totalcellular iron did not change significantly. This occurs also in othergenetic neurodegenerative diseases, such as in the deficiency offrataxin or ABCB7 (Cavadini et al., 2007; Zanella et al., 2008) where itwas found to be mainly associated with iron accumulation inside themitochondria. However, using radioactive iron we could not findevidence of mitochondrial iron accumulation. Instead we found asignificant upregulation of FPN mRNA, about 12-folds, using the mostefficient Pank2 silencing. FPN is the only known cellular iron exporter,
and its induction is expected to increase cellular iron secretion,reducing cytosolic iron (Nemeth et al., 2004). An increase of ironexport due to FPN upregulation may explain not only the reducedbasal ferritin level, but also its lower induction by iron supplemen-tation (Fig. 4A), since part of the iron accumulated may be released.Moreover, a cytosolic iron deficiency may partially explain the defectsin cytosolic aconitase activity, a major iron sensor that is inactivatedby low iron availability, and also in mitochondrial aconitase that hasfunctional IRE and is regulated by iron in the same way as ferritin(Kim et al., 1996). Thus, an abnormal upregulation of FPNmay explainmost of the phenotypic characteristics of the silenced HeLa cells,possibly also the downregulation of SOD2, which may be mediated byiron via its effect on HIF-2α (Shanchez et al., 2007). We found thatalso HepG2 cells responded in similar way to Pank2 silencing, with astrong upregulation of FPN mRNA and a downregulation of ferritin,indicating that the effect is not related to the low abundance of FPNmRNA in HeLa cells. However, in the neuronal cell lines analysed, theeffect of Pank2 silencing on FPN and iron status was low or absent,even though FPNmRNA abundance was similar to that in HepG2 cells.
FPN is part of the hepcidin–FPN axis that is considered the majorregulator of systemic iron homeostasis (Nemeth et al., 2004), and thatmight have a role also in the control of brain iron (Clardy et al., 2006).FPN expression is tightly regulated in complexways at transcriptional,translational and post translational levels (Zhang et al., 2009), but wecould analyse only the transcriptional regulation, due to the lack ofantibodies with sufficient sensitivity to detect the endogenous FPNprotein in HeLa and HepG2 cells. FPN mRNA has been studied indifferent cell types. Inflammatory stimuli and cytokines repressed FPNmRNA in monocytic cells (Ludwiczek et al., 2003) but stimulated it inC6 glioma cells (di Patti et al., 2004). Very recently it was shown thatFPN expression in mouse macrophages is transcriptionally regulatedby heme (Marro et al., 2010). Moreover, it was shown that alternativepromoters regulate the expression of two FPN splicing forms, oneform (FPN1A) is under an iron-dependent regulation mediated by theIRE/IRP machinery, while the other form (FPN1B), which encodes anidentical protein, is not repressed by iron and contributes significantlyto FPN expression in erythroid precursors and in duodenum (Zhang etal., 2009). Thus, FPN regulation is tissue specific, in agreement withour data that show a strong Pank2-dependent regulation in HeLa andHepG2, but not in SH-SY5Y and U373 cells. Moreover, we observed asignificant increase in FPN mRNA after SH-SY5Y differentiation withretinoic acid. The significant variation in ferritin levels found in HepG2and HeLa cells, suggests that the modification in FPN expression hasconsequences on cell iron status. Thus, present data indicate that alinkage exists between Pank2 expression and cellular iron homeo-stasis, and that it is mediated by its effect on FPN expression. However,this effect is cell-dependent and not very evident, or absent in theneuronal cell lines we analysed. In contrast the negative effect on cellgrowth was common to all the cell types analysed, not related to thelevel of FPN mRNA or of ferritin and probably not directly related toiron homeostasis.
Altogether, present data indicate that Pank2 downregulationcauses iron deficiency in some cell types, a finding in apparent con-trast with the brain iron accumulation found in the affected patients.Neurons express FPN (Wu et al., 2004) and FPN in the brain secretescellular iron with the assistance of ceruloplasmin. The finding thataceruloplasminemia causes NBIA in human (Texel et al., 2008;McNeillet al., 2008) supports the importance of this mechanism in brain ironhomeostasis. However, assuming that SH-SY5Y and U373 are goodmodels of neuronal cells, our data indicate that the Pank2 deficiencydoes not affect neurons or glia, but rather other cell types. FPNexpression is strongly altered in polycythaemiamice (Pcm) that have a58 bpdeletion in the promoter region of FPN1A, the transcriptwith theIRE in the 5′ UTR (Mok et al., 2004a,b). Brain FPN in these mice isdecreased at birth, a period in which they show brain iron deficiency.Then, the postnatal upregulation of TfR1 in brain microvasculature

210 M. Poli et al. / Neurobiology of Disease 39 (2010) 204–210
seems to restore wild-type levels of brain iron (Iacovelli et al., 2009).Interestingly Pcm mice have FPN upregulation in retina with loss ofretinal photoreceptors in adult age (Iacovelli et al., 2009), andretinopathy is also frequently observed in PKAN patients (Kuo et al.,2005). We postulate that Pank2 may affect FPN expression in cellsinvolved in transporting iron to the brain that remains to be identified.This would deliver extra iron to the highly saturated brain transferrinand may cause intracellular and extracellular iron deposition,particularly in the basal ganglia, which is the brain region richest iniron. The form of iron deposition in the affected brain area of Pank2patients has not been clearly defined and histochemical data showedthat iron granules with extracellular and intracellular localization areapparently not associated with ferritin. Moreover, ferritin, which is anindex of cytosolic iron loading, is not, or only marginally increased(Koeppen and Dickson, 2001); (Neumann et al., 2000).
In conclusion our data indicate a novel relationship between Pank2expression, ferroportin and iron homeostasis which may play a roleon the brain iron accumulation typical of Pank2 patients. It would beinteresting to evaluate if FPN expression is modified also in PLA2G6deficiency, which is another genetic cause of NBIA (Morgan et al.,2006). This might indicate if the FPNmodification is related to defectsin CoA or of membrane biosynthesis.
Acknowledgments
The work was partially supported by Murst-Cofin-2006 to PA, byTelethon-Italy grant GGP05141 to PA, and by Euroiron1 grant 200-037296 to PA. AC was supported by the University Vita-Salute andItalian Institute of Technology PhD program.
References
Bosveld, F., et al., 2008. De novo CoA biosynthesis is required to maintain DNA integrityduring development of the Drosophila nervous system. Hum. Mol. Genet. 17,2058–2069.
Cavadini, P., et al., 2007. RNA silencing of the mitochondrial ABCB7 transporter in HeLacells causes an iron-deficient phenotype with mitochondrial iron overload. Blood109, 3552–3559.
Clardy, S.L., et al., 2006. Is ferroportin–hepcidin signaling altered in restless legssyndrome? J. Neurol. Sci. 247, 173–179.
di Patti, M.C., et al., 2004. Interleukin-1beta up-regulates iron efflux in rat C6 gliomacells through modulation of ceruloplasmin and ferroportin-1 synthesis. Neurosci.Lett. 363, 182–186.
Dooling, E.C., et al., 1974. Hallervorden–Spatz syndrome. Arch. Neurol. 30, 70–83.Gardner, P.R., et al., 1994. Aconitase is a sensitive and critical target of oxygen poisoning in
culturedmammalian cells and in rat lungs. Proc.Natl. Acad. Sci. U. S. A. 91, 12248–12252.Gregory, A., Hayflick, S.J., 2005. Neurodegeneration with brain iron accumulation. Folia
Neuropathol. 43, 286–296.Hayflick, S.J., 2003. Unraveling the Hallervorden–Spatz syndrome: pantothenate
kinase-associated neurodegeneration is the name. Curr. Opin. Pediatr. 15, 572–577.Hayflick, S.J., 2006. Neurodegeneration with brain iron accumulation: from genes to
pathogenesis. Semin. Pediatr. Neurol. 13, 182–185.Hayflick, S.J., et al., 2003. Genetic, clinical, and radiographic delineation of Hallervor-
den–Spatz syndrome. N. Engl. J. Med. 348, 33–40.Hong, B.S., et al., 2007. Crystal structures of human pantothenate kinases. Insights into
allosteric regulation and mutations linked to a neurodegeneration disorder. J. Biol.Chem. 282, 27984–27993.
Iacovelli, J., et al., 2009. Brain and retinal ferroportin 1 dysregulation in polycythaemiamice. Brain Res. 1289, 85–95.
Jiralerspong, S., et al., 2001. Manganese superoxide dismutase induction by iron isimpaired in Friedreich ataxia cells. FEBS Lett. 509, 101–105.
Kim, H.Y., et al., 1996. Identification of a conserved and functional iron-responsiveelement in the 5′-untranslated region of mammalian mitochondrial aconitase. J.Biol. Chem. 271, 24226–24230.
Koeppen, A.H., Dickson, A.C., 2001. Iron in the Hallervorden–Spatz syndrome. Pediatr.Neurol. 25, 148–155.
Kotzbauer, P.T., et al., 2005. Altered neuronal mitochondrial coenzyme A synthesis inneurodegeneration with brain iron accumulation caused by abnormal processing,stability, and catalytic activity of mutant pantothenate kinase 2. J. Neurosci. 25,689–698.
Kuo, Y.M., et al., 2005. Deficiency of pantothenate kinase 2 (Pank2) in mice leads toretinal degeneration and azoospermia. Hum. Mol. Genet. 14, 49–57.
Kuo, Y.M., et al., 2007. Deprivation of pantothenic acid elicits a movement disorder andazoospermia in a mouse model of pantothenate kinase-associated neurodegenera-tion. J. Inherit. Metab. Dis. 30, 310–317.
Leonardi, R., et al., 2005. Coenzyme A: back in action. Prog. Lipid Res. 44, 125–153.Leonardi, R., et al., 2007. Localization and regulation of mouse pantothenate kinase 2.
FEBS Lett. 581, 4639–4644.Li, K., et al., 2008. Iron-dependent regulation of frataxin expression: implications for
treatment of Friedreich ataxia. Hum. Mol. Genet. 17, 2265–2273.Ludwiczek, S., et al., 2003. Cytokine-mediated regulation of iron transport in human
monocytic cells. Blood 101, 4148–4154.Luksiene, Z., et al., 2001. Evaluation of protoporphyrin IX production, phototoxicity and
cell death pathway induced by hexylester of 5-aminolevulinic acid in Reh and HPB-ALL cells. Cancer Lett. 169, 33–39.
Marro, S., et al., 2010. Heme controls ferroportin1 (FPN1) transcription involving Bach1,Nrf2 and a MARE/ARE sequence motif at position −7007 of the FPN1 promoter.Haematologica (2010 Feb 23. Electronic publication ahead of print).
McNeill, A., et al., 2008. T2* and FSE MRI distinguishes four subtypes of neurodegenera-tion with brain iron accumulation. Neurology 70, 1614–1619.
Mok, H., et al., 2004a. Disruption of ferroportin 1 regulation causes dynamic alterationsin iron homeostasis and erythropoiesis in polycythaemia mice. Development 131,1859–1868.
Mok, H., et al., 2004b. Dysregulation of ferroportin 1 interferes with spleenorganogenesis in polycythaemia mice. Development 131, 4871–4881.
Morgan, N.V., et al., 2006. PLA2G6, encoding a phospholipase A2, is mutated inneurodegenerative disorders with high brain iron. Nat. Genet. 38, 752–754.
Nemeth, E., et al., 2004. Hepcidin regulates cellular iron efflux by binding to ferroportinand inducing its internalization. Science 306, 2090–2093.
Neumann, M., et al., 2000. Alpha-synuclein accumulation in a case of neurodegenera-tion with brain iron accumulation type 1 (NBIA-1, formerly Hallervorden–Spatzsyndrome) with widespread cortical and brainstem-type Lewy bodies. ActaNeuropathol. 100, 568–574.
Oktay, Y., et al., 2007. Hypoxia-inducible factor 2alpha regulates expression ofthe mitochondrial aconitase chaperone protein frataxin. J. Biol. Chem. 282,11750–11756.
Perry, T.L., et al., 1985. Hallervorden–Spatz disease: cysteine accumulation and cysteinedioxygenase deficiency in the globus pallidus. Ann. Neurol. 18, 482–489.
Rock, C.O., et al., 2000. Pantothenate kinase regulation of the intracellular concentrationof coenzyme A. J. Biol. Chem. 275, 1377–1383.
Sanchez, M., et al., 2007. Iron-regulatory proteins limit hypoxia-inducible factor-2alphaexpression in iron deficiency. Nat. Struct. Mol. Biol. 14, 420–426.
Texel, S.J., et al., 2008. Ceruloplasmin in neurodegenerative diseases. Biochem. Soc.Trans. 36, 1277–1281.
Thomas, M., et al., 2004. Clinical heterogeneity of neurodegeneration with brain ironaccumulation (Hallervorden–Spatz syndrome) and pantothenate kinase-associat-ed neurodegeneration. Mov. Disord. 19, 36–42.
Tong, W.H., Rouault, T., 2000. Distinct iron–sulfur cluster assembly complexes exist inthe cytosol and mitochondria of human cells. EMBO J. 19, 5692–5700.
Wu, L.J., et al., 2004. Expression of the iron transporter ferroportin in synaptic vesiclesand the blood–brain barrier. Brain Res. 1001, 108–117.
Wu, Z., et al., 2009. Pantothenate kinase-associated neurodegeneration: insights from aDrosophila model. Hum. Mol. Genet. 18, 3659–3672.
Zanella, I., et al., 2008. The effects of frataxin silencing in HeLa cells are rescued by theexpression of human mitochondrial ferritin. Biochim. Biophys. Acta 1782, 90–98.
Zhang, Y.M., et al., 2005. Feedback regulation of murine pantothenate kinase 3 bycoenzyme A and coenzyme A thioesters. J. Biol. Chem. 280, 32594–32601.
Zhang, Y.M., et al., 2006. Biochemical properties of human pantothenate kinase 2isoforms and mutations linked to pantothenate kinase-associated neurodegenera-tion. J. Biol. Chem. 281, 107–114.
Zhang, D.L., et al., 2009. A ferroportin transcript that lacks an iron-responsive elementenables duodenal and erythroid precursor cells to evade translational repression.Cell Metab. 9, 461–473.
Copyright © 2022 FDOKUMEN