Deregulation of education: What does it mean for efficiency and equality
41
econstor www.econstor.eu Der Open-Access-Publikationsserver der ZBW – Leibniz-Informationszentrum Wirtschaft The Open Access Publication Server of the ZBW – Leibniz Information Centre for Economics Nutzungsbedingungen: Die ZBW räumt Ihnen als Nutzerin/Nutzer das unentgeltliche, räumlich unbeschränkte und zeitlich auf die Dauer des Schutzrechts beschränkte einfache Recht ein, das ausgewählte Werk im Rahmen der unter → http://www.econstor.eu/dspace/Nutzungsbedingungen nachzulesenden vollständigen Nutzungsbedingungen zu vervielfältigen, mit denen die Nutzerin/der Nutzer sich durch die erste Nutzung einverstanden erklärt. Terms of use: The ZBW grants you, the user, the non-exclusive right to use the selected work free of charge, territorially unrestricted and within the time limit of the term of the property rights according to the terms specified at → http://www.econstor.eu/dspace/Nutzungsbedingungen By the first use of the selected work the user agrees and declares to comply with these terms of use. zbw Leibniz-Informationszentrum Wirtschaft Leibniz Information Centre for Economics Schlicht-Schmälzle, Raphaela; Teltemann, Janna; Windzio, Michael Working Paper Deregulation of education: What does it mean for efficiency and equality? TranState working papers, No. 157 Provided in Cooperation with: University of Bremen, Collaborative Research Center 597: Transformations of the State Suggested Citation: Schlicht-Schmälzle, Raphaela; Teltemann, Janna; Windzio, Michael (2011) : Deregulation of education: What does it mean for efficiency and equality?, TranState working papers, No. 157 This Version is available at: http://hdl.handle.net/10419/52224
-
Upload
uni-bremen -
Category
Documents
-
view
2 -
download
0
Transcript of Deregulation of education: What does it mean for efficiency and equality

econstor www.econstor.eu
Der Open-Access-Publikationsserver der ZBW – Leibniz-Informationszentrum WirtschaftThe Open Access Publication Server of the ZBW – Leibniz Information Centre for Economics
Nutzungsbedingungen:Die ZBW räumt Ihnen als Nutzerin/Nutzer das unentgeltliche,räumlich unbeschränkte und zeitlich auf die Dauer des Schutzrechtsbeschränkte einfache Recht ein, das ausgewählte Werk im Rahmender unter→ http://www.econstor.eu/dspace/Nutzungsbedingungennachzulesenden vollständigen Nutzungsbedingungen zuvervielfältigen, mit denen die Nutzerin/der Nutzer sich durch dieerste Nutzung einverstanden erklärt.
Terms of use:The ZBW grants you, the user, the non-exclusive right to usethe selected work free of charge, territorially unrestricted andwithin the time limit of the term of the property rights accordingto the terms specified at→ http://www.econstor.eu/dspace/NutzungsbedingungenBy the first use of the selected work the user agrees anddeclares to comply with these terms of use.
zbw Leibniz-Informationszentrum WirtschaftLeibniz Information Centre for Economics
Schlicht-Schmälzle, Raphaela; Teltemann, Janna; Windzio, Michael
Working Paper
Deregulation of education: What does it mean forefficiency and equality?
TranState working papers, No. 157
Provided in Cooperation with:University of Bremen, Collaborative Research Center 597:Transformations of the State
Suggested Citation: Schlicht-Schmälzle, Raphaela; Teltemann, Janna; Windzio, Michael(2011) : Deregulation of education: What does it mean for efficiency and equality?, TranStateworking papers, No. 157
This Version is available at:http://hdl.handle.net/10419/52224

Deregulation of eDucation – What Does it Mean for efficiency anD equality?
no. 157
raphaela schlicht-schMälzle
Janna telteMann
Michael WinDzio


Raphaela Schlicht-Schmälzle Janna Teltemann Michael Windzio
Deregulation of Education – What Does it Mean for Efficiency and Equality?
TranState Working Papers
No. 157
Sfb597 „Staatlichkeit im Wandel“ − „Transformations of the State“ Bremen, 2011 [ISSN 1861-1176]

Sfb 597 „Staatlichkeit im Wandel“ - „Transformations of the State“ (WP 157)
Raphaela Schlicht-Schmälzle, Janna Teltemann, Michael Windzio
Deregulation of Education – What Does it Mean for Efficiency and Equality?
(TranState Working Papers, 157)
Bremen: Sfb 597 „Staatlichkeit im Wandel“, 2011
ISSN 1861-1176
Universität Bremen
Sonderforschungsbereich 597 / Collaborative Research Center 597
Staatlichkeit im Wandel / Transformations of the State
Postfach 33 04 40
D - 28334 Bremen
Tel.:+ 49 421 218-8720
Fax:+ 49 421 218-8721
Homepage: http://www.staatlichkeit.uni-bremen.de
Diese Arbeit ist im Sonderforschungsbereich 597 „Staatlichkeit im
Wandel“, Bremen, entstanden und wurde auf dessen Veranlassung
unter Verwendung der ihm von der Deutschen Forschungsgemein-
schaft zur Verfügung gestellten Mittel veröffentlicht.

Sfb 597 „Staatlichkeit im Wandel“ - „Transformations of the State“ (WP 157)
Deregulation of Education – What Does it Mean for Efficiency and Equality?
ABSTRACT
This article analyses from a cross-national comparative perspective how deregulation of
compulsory education affects two central educational outcomes: efficiency and equality.
The conflict between public regulation on the one hand and the market model on the
other hand describes one of the most fundamental political struggles. In several fields of
societal life, such as compulsory education, the state traditionally holds a strong mo-
nopoly in almost all capitalist societies. However, using three waves of PISA school
level data we show that the degree of public regulation varies cross-nationally. The cen-
tral finding of our analyses is that deregulation of education increases educational
achievement of individual students across all social classes and thereby fosters the edu-
cational efficiency of the national education systems. Nevertheless, it also becomes evi-
dent that higher social classes benefit more strongly from deregulation, which increases
the degree of educational inequality. These results indeed confirm that deregulation of
education provokes an efficiency-versus-equality trade-off in national education sys-
tems.

Sfb 597 „Staatlichkeit im Wandel“ - „Transformations of the State“ (WP 157)
CONTENTS
INTRODUCTION ........................................................................................................................1
THEORETICAL APPROACHES TO THE EFFECTS OF DEREGULATION OF EDUCATION......................2
Deregulation of Education and Educational Efficiency...........................................................4
Deregulation of Education and Educational Inequality ...........................................................5
METHODS ................................................................................................................................6
A COMPARATIVE MAP OF EDUCATIONAL DEREGULATION .......................................................10
RESULTS................................................................................................................................12
Deregulation of Education and Efficiency.............................................................................14
Deregulation and Social Inequality of Education ..................................................................16
CONCLUSION .........................................................................................................................17
REFERENCES..........................................................................................................................18
BIOGRAPHICAL NOTE ............................................................................................................34

Sfb 597 „Staatlichkeit im Wandel“ - „Transformations of the State“ (WP 157)
- 1 -
Deregulation of Education – What Does it Mean for Efficiency and Equality?
INTRODUCTION
The conflict between public regulation on the one hand and the market model on the
other hand describes one of the most fundamental political struggles. In this article we
analyze how deregulation of education as opposed to public regulation affects two cen-
tral educational outcomes: efficiency and equality. The core thesis is that deregulation
of education – defined as a strong private school sector, a significant share of private
educational expenditures and school autonomy as opposed to centralized regulation and
standardization – increases the general educational achievement in national compulsory
education systems. The level of educational achievement in a country is an indicator of
its human capital and its potential productivity. Thus, we speak of “efficiency” if an
educational system produces high levels of achievement. However, we also expect that
deregulation increases social inequality in education since social classes benefit more
from deregulation policies (efficiency vs. equality trade-off).
In several spheres of societal life, such as compulsory education, the state tradition-
ally holds a strong monopoly in almost all capitalist societies, with private actors play-
ing only a minor role. In all highly developed OECD countries the provision of compul-
sory education is strongly dominated by public institutions (or at least by public fund-
ing). Even though many national constitutions include the right of private education, the
public monopoly in compulsory education remains amazingly unchallenged.1 From a
classical liberal perspective, centralized education systems are often criticized for being
largely inefficient. Chubb and Moe (1988) published highly influential results for the
scope of the United States of America (USA), showing that higher degrees of school
autonomy lead to better school managerial outcomes than a highly centralized public
education system. According to their results, the autonomy of private schools leads to
better performance in terms of clearer goals and stricter requirements, greater stress on
academic excellence and to more harmonious, interactive, and teaching-oriented rela-
tions between principals and teachers and among teachers themselves (Chubb and Moe
1988: 1084). As modern market economies generally suffer from far-reaching public
debt (cf. Klitgaard 2007: 448) a retraction of the state’s responsibility for traditional
public services such as education is – at least from a liberal perspective - considered to
be a legitimate and necessary strategy.
1 (cf. German constitution GG: Article 7, Section 4; Austrian constitution: Article 14, Section 7; South African
Constitution: Chapter I, section 29(3)).

Sfb 597 „Staatlichkeit im Wandel“ - „Transformations of the State“ (WP 157)
- 2 -
From a socialist perspective, however, a strong public education system is seen as a
precondition for social equity. Deregulation in the form of privatization and institutional
autonomy in education are considered as catalysts for social inequalities, while a cen-
tralized2 education system is deemed to inhibit the inheritance of educational opportu-
nity over generations. This is in line with Esping-Andersen’s argument that there is al-
ways a trade-off between socio-economic efficiency and equality in the welfare state
(Kolberg and Esping-Andersen 1992). This paper contributes to this debate by analyz-
ing the consequences of deregulation of education from a cross-national comparative
perspective. How does deregulation versus public regulation of education affect both
efficiency and equality outcomes in education?
Using three waves of PISA data, we show that the degree of public regulation versus
market dependence varies cross-nationally. The central finding of our multi-level analy-
ses is that deregulation of education (measured as the degree of privatization and school
autonomy), as opposed to central government regulation, increases the educational
achievement of students from all social classes and thereby fosters educational effi-
ciency in the OECD member states. Nevertheless, it also becomes evident that higher
social classes benefit more strongly from deregulation which increases the degree of
educational inequality. These results indeed confirm an efficiency-versus-equality trade-
off in education.
THEORETICAL APPROACHES TO THE EFFECTS OF DEREGULATION OF
EDUCATION
From a perspective of classical liberalism, deregulation of education is defined as the
retraction of the state in the field of education and a shift of responsibility to private and
decentralized actors (Mill 1984; Smith 2005; von Hayek 2005; Friedman 2008). There-
fore, the shift of responsibility from the government to the schools (school autonomy),
and the shift from public funding to private funding and from public school government
to private school government can be described as proper indicators for deregulation.
Chubb and Moe (1988) systematically compared public and private schools and showed
that they distinctively differ in environment and organization. While public schools are
ruled by a hierarchic centralized system of democratic politics, private schools are
strongly autonomous and ruled by the market (Chubb and Moe 1988: 1067). In line with
these arguments, we regard deregulation as a broader concept, which comprises liberali-
2 We use the terms “centralization”, “standardization” or public / governmental regulation synonymously as a
description of education systems that are predominantly controlled and run by national governments and institu-
tions, with low private education expenditure.

Sfb 597 „Staatlichkeit im Wandel“ - „Transformations of the State“ (WP 157)
- 3 -
zation, privatization and decentralization of authority as empirically measurable indica-
tors.
The political discourse about deregulation versus centralization and standardization
is divided. From a liberal perspective, a retreat of the state from interventions in societal
life – including education – is valuable both for moral and for socio-economic out-
comes. Von Hayek (1976: 379) challenges the centralized public dominance in educa-
tion from a moral perspective: “The very magnitude of the power over men’s minds that
a highly centralized and government-dominated system of education places in the hands
of the authorities ought to make one hesitate before accepting it too readily.” Beyond
these moral arguments, deregulation is assumed to be more efficient from a socio-
economic point of view (cf. Chubb and Moe 1988).
By contrast, socialists prefer strong governmental regulation in education as a central
part of the welfare state, both for moral as well as for socio-economic reasons. From a
rather moral-related perspective, public education as a central part of the welfare state is
not conceived as a good to acquire for a certain return but as a civil right (Marshall
1950). From a rather socio-economic perspective, socialists consider public education
as an instrument to regulate societal stratification (Esping-Andersen 1999: 20). Depend-
ing on its structure, the public education system may inhibit the inheritance of social
status over generations and thereby contributes to the production of equal opportunities.
In this paper, we neglect the moral arguments of liberalism (deregulation) and socialism
(de-commodification/education as a civil right) and focus exclusively on the effects on
socio-economic outcomes: efficiency (liberal focus) and equality (socialist focus). Our
main thesis is that educational deregulation affects individuals’ school success and
thereby determines macro-societal educational outcomes. The rationales of our hypothe-
ses mainly depend on classical liberal and socialist assumptions regarding standardized,
governmental controlled versus deregulated, privatized education. Therefore, we expect
deregulation of education to entail an efficiency-versus-equality trade-off. While less
governmental control in education should increase educational efficiency, it is also ex-
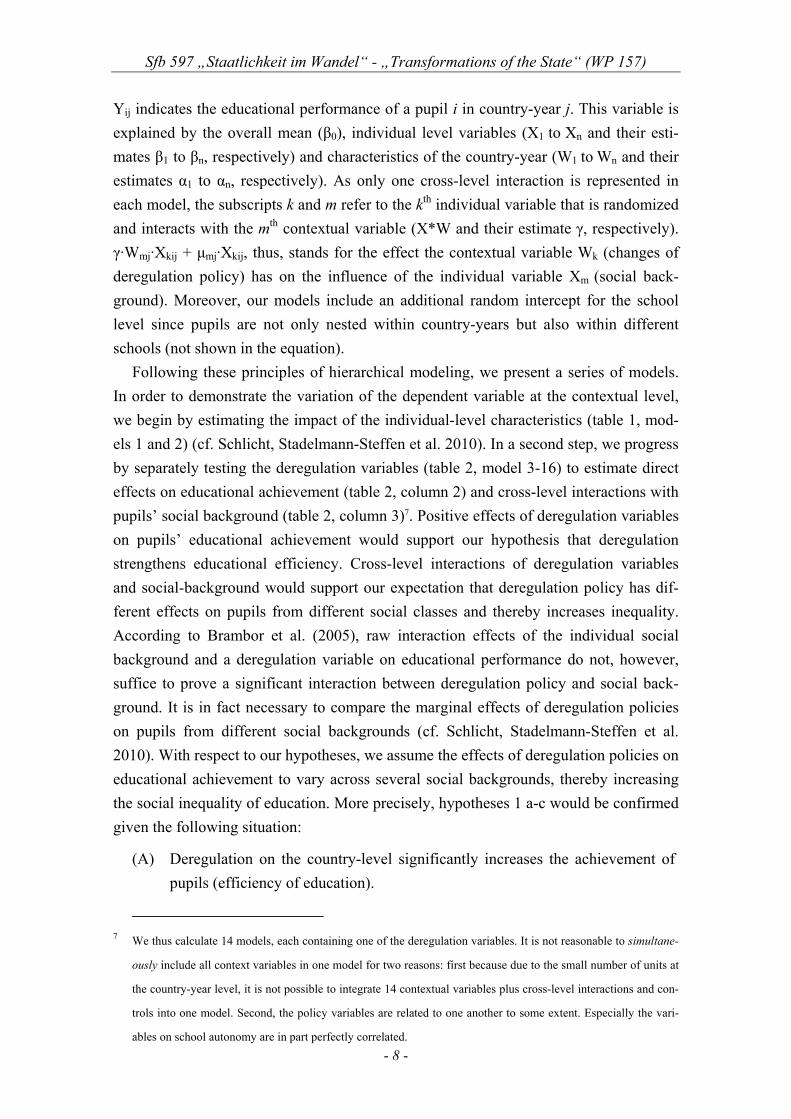
pected to produce higher degrees of inequality in education (cf. figure 1). Below, we
elaborate how educational deregulation affects individuals’ educational achievements
and consequently the degrees of macro-societal efficiency and equality in education.
The effects of educational deregulation are discussed extensively, but are scientifically
unsettled. While some argue that deregulation is a catalyst of social inequality (Weiß
1986: 159; Meier, Polinard et al. 2000; Campbell 2005), others contend that it encour-
ages overall educational efficiency (Coleman, Hoffer et al. 1982; Chubb and Moe 1988:
1070; Witte and Rigdon 1993).

Sfb 597 „Staatlichkeit im Wandel“ - „Transformations of the State“ (WP 157)
- 4 -
Figure 1: Theoretical model
Deregulation of Education and Educational Efficiency
According to the Coleman-Hoffer thesis, private schools are more effective in education
since pupils at private schools show higher achievement scores (Coleman, Hoffer et al.
1981; Coleman, Hoffer et al. 1982; Coleman, Kilgore et al. 1982; Chubb and Moe 1988:
1070; Witte and Rigdon 1993; 2006). This finding can mainly be attributed to different
learning environments and cultures at public and private schools. Private schools are
characterized by a strong principal-agent relationship between schools (agents) and par-
ents and pupils (principals) (cf.. Weiß 1986; Chubb and Moe 1988: 1084; Manna 2002).
The collection of tuition fees provides parents and pupils with stronger customer power
and implements a service culture that is responsive to individuals’ preferences. The
higher school autonomy of private schools strengthens the influence and the demands of
parents and pupils, since schools are able to cater these demands (Chubb and Moe
1988). Furthermore, private schools possess a higher financial budget than public
schools due to the receipt of tuition fees and further private funding. These higher fi-
nancial resources may lead to better teaching conditions and consequently to better edu-
cational achievements. Lubienski et al. (2008) show that higher educational achieve-
ments at private schools are mainly attributable to better teaching conditions, such as
smaller class sizes, better qualified teaching staff, and higher parental participation.
Most of the studies regarding the effects of deregulation are case studies; large-n
cross-national evidence of deregulation in education is rather rare. As an exception
West and Woesmann (2009) show with a cross-national comparative approach that pri-
vate school competition in a country improves pupils’ school achievement.
Thus the central expectation in the hypotheses 1a, 1b, and 1c is that deregulation of
education increases educational efficiency:
Hypothesis 1a: The higher the school autonomy in a country, the stronger the educa-
tional efficiency.

Sfb 597 „Staatlichkeit im Wandel“ - „Transformations of the State“ (WP 157)
- 5 -
Hypothesis 1b: The higher the percentage of private schools in a country, the stronger
the educational efficiency.
Hypothesis 1c: The higher the percentage of private funding of education in a country,
the stronger the educational efficiency.
Deregulation of Education and Educational Inequality
From a socialist perspective, deregulation of education is often claimed to foster social
inequality in education. Analyses of the social stratification at private schools show that
private school pupils are far more likely to come from higher social classes than pupils
at public schools (Weiß 1986: 159; Meier, Polinard et al. 2000; Campbell 2005). First
and foremost, parents from higher social classes are more likely able and willed to pay
tuition fees at private schools (Buddin, Cordes et al. 1998). According to rational choice
institutionalism, the decision of parents for or against private school in turn depends on
cost-benefit-risk analyses. For parents from higher social classes, the benefits of private
school are higher since the higher education standards help to maintain or even increase
social status (cf. Weiß 1986). Witte, (1992: 390) for example, shows that pupils from
lower social classes have lower prospects of succeeding at private schools than pupils
from higher social classes. For higher social classes, the expenditure of tuition fees is
less daunting and the risk of loss of status is low due to the better prospects of success.
As a result, there is a tendency toward segregation along the lines of social class at pub-
lic and private schools. (Ambler 1994; Buddin, Cordes et al. 1998; Levin 1998;
Wrinkle, Stewart et al. 1999; Fairlie and Resch 2002). In countries with a strong privati-
zation of education, higher social classes will move to the private schools, while lower
social classes will remain on public schools (Levin 1998; Campbell 2005). Moreover,
“(e)ducational choice tends to intensify class segregation … throughout the effects of
different preferences and information costs” (Ambler 1994: 454). Campbell (2005) at-
tributes the migration of the middle classes from public (schools) to private schools
mainly to the low participation and influence of parents and pupils on public schools
and the neglect of parents’ duties toward public schools (Weiß 1986: 163).
Studies that analyzed the effects of school autonomy have shown that autonomy in-
creases the influence of social origin (Wößmann 2007, 2009).Consequently, it is likely
that only higher social classes will benefit from better learning conditions at private
schools. A deregulation of education should thus lead to stronger social inequality of
education.
Hypothesis 2a: The higher the school autonomy in a country, the more pronounced the
degree of social inequality in education.
Hypothesis 2b: The higher the percentage of private schools in a country, the more
pronounced the degree of social inequality in education.

Sfb 597 „Staatlichkeit im Wandel“ - „Transformations of the State“ (WP 157)
- 6 -
Hypothesis 2c: The higher the percentage of private funding of education in a country,
the more pronounced the degree of social inequality in education.
METHODS3
In the remainder of this article, the hypotheses will be empirically tested via multi-level
analyses, which can be seen as a direct empirical implementation of our theoretical
model. We calculate models with individual educational performance as the dependent
variable. This outcome will be explained by relevant individual parameters, such as so-
cial background, migration status, and gender, as well as macro-political indicators of
deregulation on the national levels and cross-level interactions between individual social
background and indicators of deregulation. The fundamental principle of multi-level
analysis is the modeling of contextual variance which enables an account of the depend-
ence of observations that are nested in clusters (Jones 1997; Steenbergen and Jones
2002; Windzio 2008):
To widen our analytical scope and to gain robust indicators of deregulation policies
in the OECD countries, we used the pooled data of three waves (2000, 2003, and 2006)
of the OECD PISA study (OECD 2001, 2004, 2007). This means that most of the coun-
tries are represented three times in our data set depending on their participation in the
study. By using the country level as contextual level, the observations at the country
level thus are not completely independent. Therefore, our contextual level units are not
defined as countries as such but as country-years (countries A in a specific year X)
(Windzio 2006).
At first sight, country-year clusters do not account for the clustering of country-years
with countries. But this is unproblematic since ignoring the clustering of years (“situa-
tions”) within countries would lead to underestimated standard errors of time-constant
effects at the country-level, whereas standard errors at the country-year-level remain
rather unaffected.
Therefore, we deal with 98 country-years as contextual units: 31 countries in 20004 ,
31 countries in 20035 and 36 countries in 20066. This leads to a sample of 488,344 15-
3 The following part describes a methodological approach very similar to the one applied by Schlicht et al. (2010).
Accordingly, the method descriptions partly correspond with those of the earlier article.
4 Australia (AUS), Austria (AUT), Belgium (BEL), Canada (CAN), Switzerland (CHE), Chile (CHL), Czech Re-
public (CZE), Germany (DEU), Denmark (DNK), Spain (ESP), Finland (FIN), France (FRA), Great Britain
(GBR), Greece (GRC), Hungary (HUN), Ireland (IRL), Island (ISL), Italy (ITA), Japan (JPN), Korea (KOR),
Luxembourg (LUX), Latvia (LVA), Mexico (MEX), Netherlands (NLD), Norway (NOR), New Zealand (NZL),
Poland (POL), Portugal (PRT), Romania (ROU), Sweden (SWE), and United States of America (USA).

Sfb 597 „Staatlichkeit im Wandel“ - „Transformations of the State“ (WP 157)
- 7 -
year-old pupils in 36 OECD member states. The macro-political measures of deregula-
tion policies are measured on the country-year level instead of on the raw country level,
meaning that deregulation of education is measured in most of the countries for three
different years (2000, 2003, and 2006).
ijijjij exy 10 (1)
jj u000 ( ju0 stands for the residuals at the contextual level) (2)
In such a model, it is reflected that the behavior of individual i can vary between con-
textual units j. In contrast to standard regression analysis, this model does not presup-
pose individual educational performance to be the same in all country-years (constant
β0); rather, it can vary between contexts. Furthermore, multi-level models are able to
model macro-level characteristics (deregulation policies) that explain the variance be-
tween country-years.
An extension of the approach reveals whether social inequality varies between con-
texts by allowing the effects of individual social background to vary between country
years – i.e. random slopes (cf. Schlicht et al. 2010). Furthermore, cross-level interac-
tions of country-year-specific characteristics (deregulation policy) Wj and individuals’
social background (X) elucidate whether the effect of the micro relation between social
background and educational performance (Y) is moderated by macro-political factors.
Beyond the explanation of the raw efficiency of the education systems, we are particu-
larly interested in these cross-level interactions since they show how social inequality in
education is affected by deregulation policy. The model including these cross-level in-
teractions is shown in equation 3.
Yij = β0 + β1·X1ij + ... + βkj·Xkij + ... + βn·Xnij + α1·W1j + ...
+ αm·Wmj + ... + αn·Wnj + ... + γ·Wmj · Xkij + μoj + μmj · Xkij + εij (3)
5 Australia (AUS), Austria (AUT), Belgium (BEL), Canada (CAN), Switzerland (CHE), Czech Republic (CZE),
Germany (DEU), Denmark (DNK), Spain (ESP), Finland (FIN), France (FRA), Great Britain (GBR), Greece
(GRC), Hungary (HUN), Ireland (IRL), Island (ISL), Italy (ITA), Japan (JPN), Korea (KOR), Luxembourg
(LUX), Latvia (LVA), Mexico (MEX), Netherlands (NLD), Norway (NOR), New Zealand (NZL), Poland (POL),
Portugal (PRT), Slovakia (SVK), Sweden (SWE), Turkey (TUR), and United States of America (USA)
6 Australia (AUS), Austria (AUT), Belgium (BEL), Canada (CAN), Switzerland (CHE), Chile (CHL), Czech Re-
public (CZE), Germany (DEU), Denmark (DNK), Spain (ESP), Estonia (EST), Finland (FIN), France (FRA),
Great Britain (GBR), Greece (GRC), Hungary (HUN), Ireland (IRL), Island (ISL), Italy (ITA), Japan (JPN), Ko-
rea (KOR), Lithuania (LTU), Luxembourg (LUX), Latvia (LVA), Mexico (MEX), Netherlands (NLD), Norway
(NOR), New Zealand (NZL), Poland (POL), Portugal (PRT), Romania (ROU), Slovakia (SVK), Slovenia (SVN),
Sweden (SWE), Turkey (TUR), and United States of America (USA)
Sfb 597 „Staatlichkeit im Wandel“ - „Transformations of the State“ (WP 157)
- 8 -
Yij indicates the educational performance of a pupil i in country-year j. This variable is
explained by the overall mean (β0), individual level variables (X1 to Xn and their esti-
mates β1 to βn, respectively) and characteristics of the country-year (W1 to Wn and their
estimates α1 to αn, respectively). As only one cross-level interaction is represented in
each model, the subscripts k and m refer to the kth individual variable that is randomized
and interacts with the mth contextual variable (X*W and their estimate γ, respectively).
γ·Wmj·Xkij + μmj·Xkij, thus, stands for the effect the contextual variable Wk (changes of
deregulation policy) has on the influence of the individual variable Xm (social back-
ground). Moreover, our models include an additional random intercept for the school
level since pupils are not only nested within country-years but also within different
schools (not shown in the equation).
Following these principles of hierarchical modeling, we present a series of models.
In order to demonstrate the variation of the dependent variable at the contextual level,
we begin by estimating the impact of the individual-level characteristics (table 1, mod-
els 1 and 2) (cf. Schlicht, Stadelmann-Steffen et al. 2010). In a second step, we progress
by separately testing the deregulation variables (table 2, model 3-16) to estimate direct
effects on educational achievement (table 2, column 2) and cross-level interactions with
pupils’ social background (table 2, column 3)7. Positive effects of deregulation variables
on pupils’ educational achievement would support our hypothesis that deregulation
strengthens educational efficiency. Cross-level interactions of deregulation variables
and social-background would support our expectation that deregulation policy has dif-
ferent effects on pupils from different social classes and thereby increases inequality.
According to Brambor et al. (2005), raw interaction effects of the individual social
background and a deregulation variable on educational performance do not, however,
suffice to prove a significant interaction between deregulation policy and social back-
ground. It is in fact necessary to compare the marginal effects of deregulation policies
on pupils from different social backgrounds (cf. Schlicht, Stadelmann-Steffen et al.
2010). With respect to our hypotheses, we assume the effects of deregulation policies on
educational achievement to vary across several social backgrounds, thereby increasing
the social inequality of education. More precisely, hypotheses 1 a-c would be confirmed
given the following situation:
(A) Deregulation on the country-level significantly increases the achievement of
pupils (efficiency of education).
7 We thus calculate 14 models, each containing one of the deregulation variables. It is not reasonable to simultane-
ously include all context variables in one model for two reasons: first because due to the small number of units at
the country-year level, it is not possible to integrate 14 contextual variables plus cross-level interactions and con-
trols into one model. Second, the policy variables are related to one another to some extent. Especially the vari-
ables on school autonomy are in part perfectly correlated.

Sfb 597 „Staatlichkeit im Wandel“ - „Transformations of the State“ (WP 157)
- 9 -
Hypotheses 2a-c would be confirmed given the following situations:
(B) The marginal positive effects of deregulation policy significantly increase ac-
cording to higher social background.
(C) The marginal positive effect of deregulation policy gains statistical signifi-
cance for higher social backgrounds.
At the individual-level, we have to include variables that indicate the individual social
background, the migration status, gender and – as dependant variable - educational per-
formance. Following Levels and Dronkers (2008), we measure individual educational
performance using the mathematical test scores in PISA (PV1MATH, PV2MATH,
PV3MATH, PV4MATH, PV5MATH). To receive robust effects of deregulation on
mathematical achievement, we calculate all our models in tables 1 and 2 for each of the
five mathematical test scores (in each of the five models, one of the five test scores
serves as the dependent variable). The averaged coefficients and their adjusted standard
errors (OECD 2009: 100) are used as the actual robust effects on mathematical
achievement. It can be assumed that mathematics is the most suitable subject to com-
pare since it is the most “universal” one and tends to be independent of country-specific
characteristics, such as linguistic heterogeneity. As discussed above, pupils’ social
background is measured by the International Socio-Economic Index of Occupational
Status (ISEI) on a scale from 16 (lowest social background) to 90 (highest social back-
ground) (Ganzeboom, De Graaf et al. 1992). This index builds on the standard classifi-
cation of occupations (ISCO) and assumes that a respective occupation requires a cer-
tain degree of education and yields a typical income. The combination of education,
income and occupation allows a hierarchical and metric differentiation of socio-
economic background. The variable indicates the highest occupational status, depending
on whether the mother or the father has the higher status. Migration status is measured
by a dummy variable coded 1 when at least one of the two parents was born abroad.
Gender is also measured by a dummy with females coded 1 and males coded 0.
At the macro level we use the deregulation policies in the field of education as ex-
planatory variables. The PISA studies provide school-level measures regarding whether
a school is publicly or privately run, the percentage to which it is government-funded or
by privately funded (tuition fees, donations, and other resources), and the autonomy of
the schools in different dimensions (courses that are offered, course contents, textbook
selection, student admission policies, student assessment, student disciplinary policies,
general budgeting, budget allocation, general setting of teacher salaries, setting of
teacher salary increases, recruiting and dismissal of teachers). In order to obtain a coun-
try-specific measure of these indicators of deregulation, we aggregated the school-level
variables at the country-year level. Institutional privatization is thus measured by the
percentage of private schools in each country and PISA wave. We also account for the

Sfb 597 „Staatlichkeit im Wandel“ - „Transformations of the State“ (WP 157)
- 10 -
actual funding of schools by public (governmental) or non-governmental resources -
which is not equal to having a school run by a public or a private authority. In order to
measure non-public (financial privatization) funding on the country- and PISA wave-
level, we calculated the average of non-governmental school funding per country and
PISA wave. Further aspects of deregulation comprise the autonomy of schools with re-
gard to decision making in the teaching process, the recruitment of students and teach-
ers, and in budgeting. To receive country and PISA wave data on school autonomy, we
aggregated these school-level data by their country and PISA wave specific means.
A COMPARATIVE MAP OF EDUCATIONAL DEREGULATION
How do democratic nations differ with regard to governmental control versus deregula-
tion in the field of education? The comparative research on the constitution of national
education systems and, in particular, on the deregulation of education is still in its fledg-
ling stages. Windzio et al. (2005) as well as Iversen and Stephens (2008) made an initial
step of transferring classical welfare regime types – social democratic, conservative, and
liberal welfare states (Esping-Andersen 1993) - to the field of education. With regard to
deregulation of education, Iversen and Stephens (2008) show that liberal market
economies possess higher degrees of private education expenditures than conservative
or social democratic market economies. Klitgaard (2007; 2008) particularly focused on
deregulation of education by comparing three welfare state regimes (USA, Sweden, and
Germany) with regard to the implementation of school vouchers and school choice.
Klitgaard (2007: 446) sees the introduction of parental choice and school vouchers as a
re-arrangement of the public sector into quasi-markets (cf. also Friedman 1997;
Hanushek, Sarpça et al. 2011). These quasi-markets provide a stronger reliance on pri-
vate entrepreneurs in school education and stronger freedom of choice for citizens; this
in turn should lead to an increase of public sector efficiency and a stronger responsive-
ness to individual preferences (Klitgaard 2007: 449). School vouchers should represent
these ideas of parental choice and competition between public and private education.
Surprisingly, he found that school choice and the system of school vouchers are equally
distributed in social-democratic and liberal welfare states (USA and Sweden) but almost
non-existent in conservative welfare states (Germany). Thus the welfare patterns of
education policy are not clearly distinct in the three worlds of the welfare state.
In the previous section we described how we derived our measures of deregulation;
the next paragraphs illustrate how these measures are distributed across countries and
groups of countries. According to appendix 1, the mean share of private schools (insti-
tutional privatization) in the OECD countries is about 14% (in all three PISA waves).
However, the variation between the countries is quite strong. The share of private
schools varies from less than 1% in Finland, Iceland, Luxembourg, Norway, and Swe-

Sfb 597 „Staatlichkeit im Wandel“ - „Transformations of the State“ (WP 157)
- 11 -
den to more than 50% in Mexico and South Korea. We also have to consider within
country changes over time from PISA 2000 to PISA 2006. The maximum decrease of
private school share occurred in Mexico in the amount of -11 percentage points from
2000 to 2006, and the maximum increase – of 6 percentage points – occurred in Italy.
With regard to institutional privatization we can partly identify welfare regime clusters.
While conservative and social-democratic welfare state regimes provide rather low lev-
els of deregulation (Germany and Sweden), liberal welfare states rank on a medium
level of privatization.
A further indicator of deregulation beyond institutional privatization is the privatiza-
tion of funding (financial privatization). Appendix 2 shows that the mean share of pri-
vate funding varies between less than 1% (Iceland, Latvia, Romania) and about 70%
(Belgium and Netherlands). The OECD average of the private funding is about 18% (all
three PISA waves). The strongest decrease of private funding from 2000 to 2006 oc-
curred in South Korea (about 6 percentage points) and the strongest increase in Chile of
about 11 percentage points. Can we identify welfare clusters regarding financial privati-
zation? The prototypes of the three worlds of welfare capitalism Germany, the United
States and Sweden all rank low on private funding of schools. Most surprisingly, Den-
mark as a social democratic welfare state exhibits a large share of private funding (about
24% of the total funding is received from private resources, cf. appendix 3). Thus we
can again not identify clear welfare state patterns.
When correlating the degrees of financial privatization and the degrees of institu-
tional privatization, it becomes obvious that we have to deal with two different and
rather independent concepts of deregulation. The two concepts are only weakly corre-
lated in all three PISA waves (Pearson’s r is about 0.2).
Our third measure of deregulation in the field of education is the autonomy of
schools regarding the teaching process, budgeting, selection of pupils, and recruitment
of teachers. At the country level, the autonomy varies from 0% (none of the schools are
autonomous in the respective dimension) to 100% (all of the schools in the respective
country are autonomous) (cf. appendices 3-5). The countries where more than 90% of
schools are autonomous are Belgium, the Czech Republic, Hungary, Iceland, Latvia,
New Zealand, USA, the Netherlands, and Great Britain. In this regard, the strong degree
of deregulation in the former communist OECD countries is especially remarkable.
Countries with autonomy in less than 10% of schools are Luxembourg and France. In
those countries, governmental regulation is rather dominant. The average percentage of
autonomous schools across the OECD is 60% in 2000, 74% in 2003, and 68% in 2006.
Considering the welfare state tradition, Germany as a conservative welfare state exhibits
low degrees of autonomy. By contrast, the USA (liberal welfare state) features high
degrees of autonomy. In Sweden as a social democratic welfare state schools are rather
moderately autonomous (cf. Appendices 3-5). Thus we can tentatively conclude that

Sfb 597 „Staatlichkeit im Wandel“ - „Transformations of the State“ (WP 157)
- 12 -
liberal and social democratic welfare states feature remarkable degrees of school auton-
omy, while education systems in conservative welfare states are rather centralized.
These patterns are in line with Klitgaard’s (2007) findings regarding the implementation
of school vouchers.
RESULTS
How does deregulation of the school education system affect the educational efficiency
and equality of education in the OECD member states? Model 1 in table 1 preliminarily
shows that a hierarchical model is appropriate. Pupils’ mathematical achievement varies
not only between individuals but also between schools and countries. About 14.6% of
the variance is due to the country-year level.8 Thus macro-societal conditions indeed
mold individual achievement. Therefore, we can assume different degrees of educa-
tional efficiency between our countries. Furthermore, model 1 shows that a privileged
social background has a positive effect on mathematical achievement while migration
status and female gender have negative effects.
Model 2 builds on model 1, adding a random slope for social background. Indeed,
the effect of social background on mathematical achievement varies between countries.
Consequently, there are different degrees of social inequality in education. Model 2 also
elucidates that there is a negative co-variation between the random social background
effect and the random intercept of mathematical achievement. Thus countries with
higher efficiency also provide a lower degree of inequality in education. There is there-
fore no genuine equality-versus-efficiency trade-off in education (Kolberg and Esping-
Andersen 1992; Schlicht 2010). By contrast, equality and efficiency of education are
rather interdependent.
8 23.8% of the variation in mathematical achievement is due to the school and 61.6% is due to the individual level.

Sfb 597 „Staatlichkeit im Wandel“ - „Transformations of the State“ (WP 157)
- 13 -
Table 1: Cross-national variation of education efficiency and equity
Model 1
(random intercept) Model 2
(random slope)
Constant 435.082***
(0.448) 427.850***
(0.461)
Individual Effects
Social background (ISEI) 1.391*** (0.007)
1.5592*** (0.007)
Migration background -6.790***
(0.360) -6.414***
(0.358)
Females -11.853***
(0.263) -12.013***
(0.262)
Random Effects
Social background (ISEI)
variance 1.902*** (0.040)
Co-variance -86.056***
(2.148)
Individual Variance 5525.442***
(70.233) 5132.180***
(65.225)
School Variance 1815.751***
(71.904) 1663.735***
(68.749)
Country-year Variance 1499.687***
(20.589) 5262.305***
(121.096)
N 579038 579038
Number of country-years 98 98
-2loglikelihood 6891225.068 6885501.15 (MW 5 Modelle)
Note: The effects display the mean effects on all 5 plausible values and the adjusted standard errors (cf. OECD 2009:
100). All models calculated using MLWin and RIGLS. The effects display the mean effects on all 5 plausible values
and the adjusted standard errors (cf. OECD 2009: 100). Bold effects are significant (***=p>0.01; **=p<0.05).
As a next step, we extended model 2 by introducing measures of deregulation policies –
institutional privatization, financial privatization, and school autonomy – at the country-
year level (models 3-16 in table 2)9. In these models, we respectively added a country-
year-level effect of deregulation and a cross-level interaction of this variable with indi-
vidual social background to assess the degrees of efficiency and equality of education.
9 Controlling for the degree of liberalization in 2000 to evaluate the effect of change.

Sfb 597 „Staatlichkeit im Wandel“ - „Transformations of the State“ (WP 157)
- 14 -
Table 2: Effects of liberalization in education on efficiency and equality of education
Model Measure of deregulation Effect on mathematical
achievement (efficiency)
Interaction of Deregulation and social background of
pupils (equality)
Institutional Privatization
Model 3 Institutional Privatization 25.9102***
(2.261) 0.1622***
(0.044)
Budgeting
Model 4 Financial Privatization -1.2652***
(0.021) -0.001***
(0)
Model 5 School Autonomy regarding alloca-tion of budget
0.2946*** (0.019)
0.0028*** (0.001)
Model 6 School Autonomy regarding the budget in general
0.0524** (0.017)
0.004*** (0)
School Autonomy Characteristics (Teaching process)
Model 7 Autonomy regarding the courses offered
0.6056*** (0.014)
0.001*** (0)
Model 8 Autonomy regarding the course contents
0.554*** (0.015)
0.001*** (0)
Model 9 Autonomy regarding textbook selection
0.3386*** (0.016)
0.001*** (0)
Model 10 Autonomy regarding admissions of pupils
0.1548*** (0.019)
0.004*** (0)
Model 11 Autonomy regarding assessment of pupils
0.23*** (0.017)
0.003*** (0)
Model 12 Autonomy regarding disciplinary policies
-0.0206 (n.s.) (0.019)
0.004*** (0)
School Autonomy Characteristics (Teacher selection and payment)
Model 13 Autonomy regarding the salaries 0.0394** (0.013)
0.001*** (0)
Model 14 Autonomy regarding the salary increases
0.0822*** (0.013)
0 (0)
Model 15 Autonomy regarding hiring teachers
0.2276*** (0.012)
0.0022*** (0.001)
Model 16 Autonomy regarding firing teachers0.1582 (n.s.)
(0.013) 0.002***
(0)
Note: All Models are controlled for ISEI, migration status and gender, effects are not shown here.
Deregulation of Education and Efficiency
According to table 2, deregulation indeed affects the degree of efficiency (in terms of
the total achievement) in the OECD member states. All except two measures of deregu-
lation show significant effects on individual achievement. Moreover, all measures of
deregulation except financial privatization show positive impacts on achievement. Aus-
tralia for instance shows high levels of institutional privatization and school autonomy
as well as very high levels of educational efficiency (mean of competences per country-

Sfb 597 „Staatlichkeit im Wandel“ - „Transformations of the State“ (WP 157)
- 15 -
year). Luxembourg on the other hand exhibits low levels of institutional privatization
and school autonomy and ranks low on efficiency measures. With regard to financial
privatization, the mechanism is vice versa. Australia with low levels of financial privati-
zation ranks high on efficiency, and Luxembourg with moderate to high levels of finan-
cial privatization features low levels of efficiency. We can thus conclude that institu-
tional privatization and measures of school autonomy foster educational efficiency in
the OECD countries.
Regarding (in-)equality, we found that the higher the degree of deregulation, the
higher are the achievement scores of pupils in a country. This strongly confirms our
hypothesis (1) that deregulation of school education increases the effectiveness of the
learning process. It moreover confirms the finding of Chubb and Moe (1988) that mar-
ketization of education not only makes the school managerial output more efficient but
also the educational outcomes in terms of pupils’ achievements. However, it is striking
that financial privatization shows quite contrary effects. The higher the share of private
funding is, the lower are pupils’ achievement scores. This is particularly remarkable
since two other school autonomy measures regarding budgeting actually increase educa-
tional achievement (cf. table 2). Indeed, the degrees of institutional and financial priva-
tization in OECD countries in a specific year are only weakly correlated (Pearson’s
r=0.22). This means that schools should be institutionally private and have great auton-
omy as regards the teaching process, budgeting, and teacher selection and payments, but
that they should still receive their budget from public sources. However, it is possible
that the effect of financial privatization interacts with the general degree of institutional
privatization and school autonomy. More precisely, it may be that private funding is
only harmful when the state holds a strong monopoly on education in general – mainly
in the form of public schools – and only weak autonomy regarding budgeting. Interac-
tions between the effects of private funding and the strength of the private school sector
or the autonomy regarding budgeting indeed show that the negative effect of private
funding is far stronger when institutional privatization and budget autonomy are weak
(cf. appendix 6 and 7). This is the case in Luxembourg (low level of efficiency) where a
centralized school autonomy controls private funding. By contrast, South Korea pos-
sesses a high level of efficiency even though both, institutional and financial privatiza-
tion, are high. In summary, raw financial privatization (e.g. to disburden public house-
holds) will lead to a less efficient education system. Only in combination with strong
institutional privatization where budget autonomy rests with the schools will the nega-
tive effects of financial privatization on efficiency decrease. Governmental control over
private money will lead to a strongly inefficient school system. Thus, deregulation of
school education can definitely be recommended with regard to institutional privatiza-
tion and school autonomy.

Sfb 597 „Staatlichkeit im Wandel“ - „Transformations of the State“ (WP 157)
- 16 -
Deregulation and Social Inequality of Education
So far, we have focused on the relationship between deregulation and educational effi-
ciency. But how does deregulation of education affect the degree of social inequality in
education? In a next step, we analyze whether the positive effects of deregulation on
individual’s educational achievement varies according to social status. The models in
appendices 8-21 confirm the results of models 3-16 (table 2, column 3) and show that
all but one deregulation policies mold the degree of social inequality in education. Ac-
cording to Brambor (2005), only the marginal effects of deregulation on the mathematic
achievement in different social classes identify the actual interaction between these two
factors. Primarily, the figures show that all pupils are positively affected by most of the
deregulation policies. Only financial privatization (figure 9) and the autonomy regard-
ing the courses offered at school (figure 10) negatively affect educational achievement.
This shows that deregulation policies do not have contradictory effects on educational
achievement for students with different social backgrounds.
However, the figures also show that the strength of the effects varies according to so-
cial status. Only autonomy regarding the increase of teachers’ salaries raises educational
achievement equally for all students. With respect to institutional privatization and the
measures of autonomy regarding budgeting, course contents, textbook selection, admis-
sion fees, student assessment, disciplinary policies, teachers’ salaries, as well as hiring
and firing of teachers, students with higher social status benefit more strongly from
these policies than lower status students. Therefore, in Australia (strong institutional
privatization), Belgium (strong financial privatization), and the Netherlands (strong
school autonomy), students with higher status benefit stronger from deregulation than
students with lower status. However, considering the degrees of social inequality in
specific countries, the picture is not as clear since countries as Australia, Belgium, and
the Netherlands show very different degrees of inequality. There are also several coun-
tries with low degrees of institutional privatization and autonomy and high degrees of
inequality (Germany). Furthermore countries like Japan, South Korea, or Australia rank
low on social inequality but high on institutional privatization. This confirms that the
actual level of inequality does not tell us anything about whether higher social classes
benefit stronger from deregulation than lower social classes. This confirms our hypothe-
ses 2a-c that deregulation increases the degree of social inequality in education. Al-
though all students benefit from deregulation, higher status students benefit to a re-
markably higher degree. With regard to financial privatization and autonomy regarding
the course supply, we can conclude that these deregulation policies may even cushion
the degree of inequality. The negative effect of financial privatization on educational
achievement is less strong for pupils with lower social status. Financial privatization is
much more disadvantageous for students with higher status. Thus financial privatization
may decrease inequality by impeding the achievement of the higher social classes. Fur-

Sfb 597 „Staatlichkeit im Wandel“ - „Transformations of the State“ (WP 157)
- 17 -
thermore, the positive effect of autonomy regarding the course supply more strongly
affects the lower social classes, thereby causing a reduction of social inequality in edu-
cation.
To sum up, most of the deregulation policies foster inequality of education since stu-
dents with higher social status benefit significantly more than lower status students.
Only the school autonomy regarding the course supply is more advantageous for lower
status groups than for students with higher status. Furthermore, financial privatization
may reduce inequality by adversely affecting pupils from higher status groups.
CONCLUSION
The central question of this article was how deregulation of compulsory education af-
fects efficiency and equality of education. The conflict between centralized regulation
on the one hand and the market model on the other hand describes one of the most fun-
damental political struggles. Liberals and socialists have genuinely different expecta-
tions regarding the outcomes of a retreat of the state in the field of education. From a
liberal perspective, deregulation of education is assumed to be socio-economically more
efficient (cf. Chubb and Moe 1988). By contrast, according to socialist ideas, deregula-
tion of education and the retreat of public education is often claimed to foster social
inequality in education (Weiß 1986: 159; Meier, Polinard et al. 2000; Campbell 2005).
The rationales of our hypotheses mainly depend on these expectations. Therefore, we
expect a deregulation of education to encourage an efficiency-versus-equality trade-off.
While a stronger market dependency in education should increase educational effi-
ciency, it is also expected to produce higher degrees of inequality in education.
In several fields of societal life, such as compulsory education, the state traditionally
holds a strong monopoly almost in all capitalist societies, with private actors playing
only a minor role. However, we have shown that the extent of deregulation varies in
kind and degree among the OECD member states. In our analysis, we have focused on
three aspects of deregulation: institutional privatization, financial privatization, and
school autonomy. We can indeed show that deregulation can occur in very different
ways. Moreover, different kinds of deregulation are rather uncorrelated as, for example,
institutional and financial privatization. Beyond that, different kinds of deregulation
also have different impacts on efficiency and equality of education.
In line with the Coleman-Hoffer thesis (1982), our results elucidate that deregulation
of education – at least institutional privatization and school autonomy – increases edu-
cational achievement of all students, thereby fostering the educational efficiency of the
national education systems. Nevertheless, it becomes also evident that higher status
groups benefit more strongly from deregulation, thereby raising the degree of educa-
tional inequality. These results indeed confirm that deregulation of education provokes

Sfb 597 „Staatlichkeit im Wandel“ - „Transformations of the State“ (WP 157)
- 18 -
an efficiency-versus-equality trade-off in national education systems. Even in the case
of financial privatization we can observe an efficiency-versus-equality trade-off. While
financial privatization rather lowers efficiency, it seems to decrease the achievement
gap between the rich and the poor: The negative effect of financial privatization is
weaker for pupils from lower social backgrounds. We can conclude that a retreat of the
state from public education entails stronger inequality structures on a higher general
level of education. This in turn means that it still remains a normative question whether
one prefers equality on a lower general level of education or a higher level of education
at the expense of a higher degree of inequality. These preferences will probably mainly
depend on moral principles, i.e. education as a civil right (de-commodification and cen-
tralization) versus individual freedom (marketization and autonomy). One shortcoming
in our paper is surely that we did not test net effects of variables at the county-year-
level, but only bivariate associations, plus each cross-level interaction. Further research
should be based on an even larger database and try to separate the net effects of each
indicator of deregulation.
REFERENCES
Ambler, J. S. (1994) Who Benefits From Educational Choice - Some Evidence From Europe. Journal of
Policy Analysis and Management 13(3): 454-476.
Brambor, T., W. R. Clark, et al. (2005) Understanding Interaction Models: Improving Empirical
Analyses. Political Analysis 14: 63-82.
Buddin, R. J., J. J. Cordes, et al. (1998) School choice in California: Who chooses private schools? Jour-
nal of Urban Economics 44(1): 110-134.
Campbell, C. (2005) Changing school loyalties and the middle class: A reflection on the developing fate
of state comprehensive high schooling. Australian Educational Researcher 32(1): 3-24.
Chubb, J. E. and T. M. Moe (1988) Politics, markets, and the organization of schools. The American
Political Science Review 82(4): 1066-1087.
Coleman, J. S., T. Hoffer, et al. (1981) Questions and answers - our response. Harvard Educational Re-
view 51(4): 526-545.
Coleman, J. S., T. Hoffer, et al. (1982) Achievement and segregation in secondary schools - A further
look at public and private school differences. Sociology of Education 55(2-3): 162-182.
Coleman, J. S., T. Hoffer, et al. (1982) Cognitive outcomes in public and private schools. Sociology of
Education 55(2-3): 65-76.
Coleman, J. S., S. Kilgore, et al. (1982) Public and private schools. Society 19(2): 4-9.
Esping-Andersen, G. (1993) The three worlds of welfare capitalism. Cambridge, Polity Press.
Esping-Andersen, G. (1999) Social Foundations of Postindustrial Economies: Oxford University Press.
Fairlie, R. W. and A. M. Resch (2002) Is there “white flight” into private schools? Evidence from the
National Educational Longitudinal Survey. Review of Economics and Statistics 84(1): 21-33.

Sfb 597 „Staatlichkeit im Wandel“ - „Transformations of the State“ (WP 157)
- 19 -
Friedman, M. (1997) Public schools: make them private. Education Economics 5(3): 341-344.
Friedman, M. (2008) Kapitalismus und Freiheit. München & Zürich, Piper.
Ganzeboom, H. B. G., P. M. De Graaf, et al. (1992) A standard international socio-economic index of
occupational status. Social Science Research 21(1): 1-56.
Hanushek, E. A., S. Sarpça, et al. (2011) Private Schools and Residential Choices: Accessibility, Mobil-
ity, and Welfare. The B.E. Journal of Economic Analysis & Policy 11(1).
Iversen, T. and J. D. Stephens (2008) Partisan politics, the welfare state, and three worlds of human
capital formation. Comparative Political Studies 41(4-5): 600-637.
Jones, K. (1997) Multilevel Approaches to Modelling Contextuality. From Nuisance to Substance in the
Analysis of Voting Behaviour. Places and people. Multilevel modelling in geographical research. G.
P. a. R. N. V. Westert. Utrecht, KNAG/Netherlands Geographical Studies: 19-43.
Klitgaard, M. B. (2007) Do welfare state regimes determine public sector reforms? Choice reforms in
American, Swedish and German schools. Scandinavian Political Studies 30(4): 444-468.
Klitgaard, M. B. (2008) School vouchers and the new politis of the welfare state. Governance 21(4): 479-
498.
Kolberg, J. E. and G. Esping-Andersen (1992) Welfare States and Employment Regimes. New York, M.
E. Sharpe: 3-36.
Levels, M., J. Dronkers, et al. (2008) Immigrant children's educational achievement in Western
Democracies: origin, destination, and community effects on mathemetical performance. American So-
ciological Review 73(5): 835-853.
Levin, H. M. (1998) Educational vouchers: Effectiveness, choice, and costs. Journal of Policy Analysis
and Management 17(3): 373-392.
Lubienski, S. T., C. Lubienski, et al. (2008) Achievement differences and school type: The role of school
climate, teacher certification, and instruction. American Journal of Education 115(1): 97-138.
Marshall, T. H. (1950) Citizenship and social class: and other essays. Cambridge Univ. Press.
Manna, P. F. (2002) The signals parents send when they choose their children's schools. Educational
Policy 16(3): 425-447.
Meier, K. J., J. L. Polinard, et al. (2000) Bureaucracy and organizational performance: Causality
arguments about public schools. American Journal of Political Science 44(3): 590-602.
Mill, J. S. (1984) On Liberty. Harmondsworth, Penguin Books.
OECD (2001): Knowledge and skills for life. First results from the OECD Programme for International
Student Assessment (PISA) 2000. Paris: OECD (Education and skills).
OECD (2004): Learning for tomorrow's world. First results from PISA 2003. Paris: OECD.
OECD (2007): PISA 2006. Science competencies for tomorrow's world. Volume 2: Data. Paris: OECD.
OECD (2009): PISA Data Analysis Manual: SPSS-Edition. Paris.
Schlicht, R. (2010) Efficiency and Equality of Education: The Effectiveness of Education Policy in the
German Federal States. submitted.
Schlicht, R., I. Stadelmann-Steffen, et al. (2010) Educational Inequality in the EU: The Effectiveness of
the National Education Policy. European Union Politics 11(1): 29-59.

Sfb 597 „Staatlichkeit im Wandel“ - „Transformations of the State“ (WP 157)
- 20 -
Smith, A. (2005) Untersuchung über Wesen und Ursachen des Reichtums der Völker. Tübingen, UTB.
Steenbergen, M. and B. S. Jones (2002) Modeling Multilevel Data Structures. Amercian Journal of Po-
litical Science 46(1): 218-237.
von Hayek, F. A. (1976) The Constitution of Liberty. London, Routledge Kegan Paul.
von Hayek, F. A. (2005) Die Verfassung der Freiheit. Tübingen, Mohr Siebeck.
Weiß, M. (1986) The financing of private schools in the Federal-Republic-of-Germany. Compare - a
Journal of Comparative Education 16(2): 149-165.
West, M. R. and L. Woessmann (2009) School Choice International: Higher Private School Share Boosts
Test Scores. Education Next 9(1): 54-61.
Windzio, M. (2008) Social structures and actors: The application of multilevel analysis in migration
research. Romanian Journal of Population Studies 2(1): 113–138.
Windzio, M. (2006) The Problem of Time Dependent Explanatory Variables at the Context-Level in
Discrete Time Multilevel Event History Analysis. A Comparison of Models Considering Mobility
Between Local Labour Markets as an Example. Quality & Quantity 40(2): 175–185.
Windzio, M., K. Martens, R. Sackmann (2005) Types of Governance in Education – A Quantitative
Analysis. SFB 597, University of Bremen. TranState Working Paper, 025/2005.
Witte, J. F. (1992) Private school versus public school achievement: Are there findings that should affect
the educational choice debate? Economics of Education Review 11(4): 371-394.
Witte, J. F. and M. E. Rigdon (1993) Education choice reforms - Will they change American schools.
Publius-the Journal of Federalism 23(3): 95-114.
Wößmann, L. (2007) International Evidence on School Competition, Autonomy, and Accountability: A
Review. Peabody Journal of Education 82(2-3): 473-497.
Wößmann, L. and M. R. West (2009) School Choice International: Higher Private School Share Boosts
Test Scores. Education Next 9(1): 54-56.
Wrinkle, R. D., J. Stewart, et al. (1999) Public school quality, private schools, and race. American Jour-
nal of Political Science 43(4): 1248-1253.

Sfb 597 „Staatlichkeit im Wandel“ - „Transformations of the State“ (WP 157)
- 21 -
Appendix 1: Share of Private schools in OECD countries in percent
Country Share private schools (%)
2000
Share private schools (%)
2003
Share private schools (%)
2006
Change 2000 to 2006
(in percentage points)
AUS 30.6 29.0 29.9 -0.6
AUT 9.6 missing missing missing
BEL 12.4 11.2 14.7 2.3
CAN 10.0 8.3 11.0 1.0
CHE 6.1 4.7 4.8 -1.4
CHL 30.1 missing 29.8 -0.3
CZE 5.1 5.3 4.1 -0.9
DEU 2.7 3.9 4.4 1.6
DNK 5.8 6.9 8.6 2.8
ESP 17.1 14.5 15.0 -2.1
FIN 0.2 0.2 0.2 0.1
FRA 24.6 missing missing missing
GBR 10.2 6.6 7.1 -3.1
GRC 16.3 12.2 18.5 2.3
HUN 12.4 8.9 9.5 -3.0
IRL 8.9 7.0 9.1 0.2
ISL 0.6 0.4 0.6 0.0
ITA 24.9 27.8 30.9 6.0
JPN 27.5 25.8 29.3 1.8
KOR 50.9 48.0 52.6 1.7
LUX 0.0 2.7 2.2 2.2
LVA 4.4 3.7 3.8 -0.6
MEX 62.8 60.6 51.8 -11.0
NLD 5.3 4.4 3.7 -1.6
NOR 0.5 0.4 0.3 -0.2
NZL 19.7 22.2 22.8 3.1
POL 7.7 4.0 3.6 -4.1
PRT 12.1 16.0 16.0 3.8
ROU 5.4 6.6 1.1
SVK missing 7.5 5.0 missing
SWE 0.1 0.2 0.1 0.0
TUR missing 44.7 44.6 missing
USA 8.3 12.4 12.4 4.1
EST missing missing 2.2 missing
LTU missing missing 2.0 missing
SVN missing missing 5.8 missing
Minimum 0.0 0.2 0.1 -11.0
Maximum 62.8 60.6 52.6 6.0
Mean 13.9 13.8 13.6 0.2
Note: Aggregated Data of the PISA school level data.

Sfb 597 „Staatlichkeit im Wandel“ - „Transformations of the State“ (WP 157)
- 22 -
Appendix 2: Mean share of Private funding schools receive in OECD countries
(in percent)
Country Share private funding (%)
2000
Share private funding (%)
2003
Share private funding (%)
2006
Change 2000-2006
(in percent-age points)
AUS Missing 0.0 Missing Missing
AUT 12.7 8.0 9.3 -3.4
BEL 73.8 68.1 68.7 -5.1
CAN Missing 6.7 7.3 Missing
CHE 6.4 5.5 5.0 -1.4
CHL 45.5 Missing 56.6 11.1
CZE 6.0 6.6 6.6 0.6
DEU 4.4 7.4 5.7 1.3
DNK 24.7 20.5 24.0 -0.7
ESP 39.3 36.0 35.4 -3.9
FIN 2.8 6.6 3.0 0.2
FRA 21.6 0.0 Missing Missing
GBR 8.6 6.1 7.6 -1.0
GRC 7.2 4.1 5.2 -2.0
HUN 5.3 11.3 16.3 11.0
IRL 60.9 61.0 60.3 -0.6
ISL 0.8 0.4 1.1 0.3
ITA 5.8 4.7 3.9 -1.9
JPN 30.2 27.3 30.9 0.7
KOR 52.3 55.9 46.3 -6
LUX 12.1 14.1 14.4 2.3
LVA 0.7 1.0 0.0 -0.7
MEX 15.4 14.9 15.0 -0.4
NLD 73.5 74.5 67.7 -5.8
NOR 1.4 0.9 1.9 0.5
NZL 4.6 4.7 5.7 1.1
POL 2.9 0.7 1.6 -1.3
PRT 7.3 6.2 10.2 2.9
ROU 0.9 Missing 0.0 -0.9
SVK Missing 12.0 7.7 Missing
SWE 3.4 4.4 8.3 4.9
TUR Missing 3.4 2.3 Missing
USA 6.6 5.1 7.8 1.2
EST Missing Missing 1.9 Missing
LTU Missing Missing 0.7 Missing
SVN Missing Missing 2.3 Missing
Minimum 0.7 0.0 0.0 -0.7
Maximum 73.8 74.5 68.7 -5.1
Mean 18.5 15.4 15.9 -2.6
Note: Aggregated Data of the PISA school level data.

Sfb 597 „Staatlichkeit im Wandel“ - „Transformations of the State“ (WP 157)
- 23 -
Appendix 3: Degrees of autonomy 200010
Country A B C D E F G H I J K L Mean
AUS 52.4 52.4 52.4 52.4 52.4 52.4 52.4 52.4 52.4 64.0 52.4 52.4 53.4
AUT 25.0 25.0 25.0 25.0 25.0 25.0 25.0 25.0 25.0 41.3 25.0 25.0 26.4
BEL 97.3 97.3 97.3 97.3 97.3 97.3 97.3 97.3 97.3 97.7 97.3 97.3 97.3
CAN 67.1 67.1 67.1 67.1 67.1 67.1 67.1 67.1 67.1 86.6 67.1 67.1 68.7
CHE 89.4 89.4 89.4 89.4 89.4 89.4 89.4 89.4 89.4 95.6 89.4 89.4 89.9
CHL 49.5 49.5 49.5 49.5 49.5 49.5 49.5 49.5 49.5 52.6 49.5 49.5 49.8
CZE 96.7 96.7 96.7 96.7 96.7 96.7 96.7 96.7 96.7 97.5 96.7 96.7 96.7
DEU 9.0 9.0 9.0 9.0 9.0 9.0 9.0 9.0 9.0 24.5 9.0 9.0 10.3
DNK 68.2 68.2 68.2 68.2 68.2 68.2 68.2 68.2 68.2 97.6 68.2 68.2 70.7
ESP 38.7 38.7 38.7 38.7 38.7 38.7 38.7 38.7 38.7 37.7 38.7 38.7 38.6
FIN 39.9 39.9 39.9 39.9 39.9 39.9 39.9 39.9 39.9 61.3 39.9 39.9 41.7
FRA 6.0 6.0 6.0 6.0 6.0 6.0 6.0 6.0 6.0 21.9 6.0 6.0 7.4
GBR 88.8 88.8 88.8 88.8 88.8 88.8 88.8 88.8 88.8 99.3 88.8 88.8 89.7
GRC 81.2 81.2 81.2 81.2 81.2 81.2 81.2 81.2 81.2 85.4 81.2 81.2 81.6
HUN 99.9 99.9 99.9 99.9 99.9 99.9 99.9 99.9 99.9 100.0 99.9 99.9 100.0
IRL 74.7 74.7 74.7 74.7 74.7 74.7 74.7 74.7 74.7 88.6 74.7 74.7 75.8
ISL 95.3 95.3 95.3 95.3 95.3 95.3 95.3 95.3 95.3 99.7 95.3 95.3 95.7
ITA 10.9 10.9 10.9 10.9 10.9 10.9 10.9 10.9 10.9 10.3 10.9 10.9 10.9
JPN 33.2 33.2 33.2 33.2 33.2 33.2 33.2 33.2 33.2 34.6 33.2 33.2 33.3
KOR 22.1 22.1 22.1 22.1 22.1 22.1 22.1 22.1 22.1 32.3 22.1 22.1 23.0
LUX 0.0 0.0 0.0 0.0 0.0 0.0 0.0 0.0 0.0 0.0 0.0 0.0 0.0
LVA 99.0 99.0 99.0 99.0 99.0 99.0 99.0 99.0 99.0 100.0 99.0 99.0 99.1
MEX 47.9 47.9 47.9 47.9 47.9 47.9 47.9 47.9 47.9 60.2 47.9 47.9 48.9
NLD 100.0 100.0 100.0 100.0 100.0 100.0 100.0 100.0 100.0 100.0 100.0 100.0 100.0
NOR miss-ing
miss-ing
miss-ing
miss-ing
miss-ing
miss-ing
miss-ing
miss-ing
miss-ing
miss-ing
miss-ing
miss-ing
miss-ing
NZL 99.3 99.3 99.3 99.3 99.3 99.3 99.3 99.3 99.3 100.0 99.3 99.3 99.4
POL miss-ing
miss-ing
miss-ing
miss-ing
miss-ing
miss-ing
miss-ing
miss-ing
miss-ing
miss-ing
miss-ing
miss-ing
miss-ing
PRT 7.1 7.1 7.1 7.1 7.1 7.1 7.1 7.1 7.1 20.6 7.1 7.1 8.3
ROU 76.1 76.1 76.1 76.1 76.1 76.1 76.1 76.1 76.1 16.1 76.1 76.1 71.1
SVK miss-ing
miss-ing
miss-ing
miss-ing
miss-ing
miss-ing
miss-ing
miss-ing
miss-ing
miss-ing
miss-ing
miss-ing
miss-ing
SWE 86.0 86.0 86.0 86.0 86.0 86.0 86.0 86.0 86.0 100.0 86.0 86.0 87.2
TUR miss-ing
miss-ing
miss-ing
miss-ing
miss-ing
miss-ing
miss-ing
miss-ing
miss-ing
miss-ing
miss-ing
miss-ing
miss-ing
USA 98.8 98.8 98.8 98.8 98.8 98.8 98.8 98.8 98.8 98.8 98.8 98.8 98.8
EST miss-ing
miss-ing
miss-ing
miss-ing
miss-ing
miss-ing
miss-ing
miss-ing
miss-ing
miss-ing
miss-ing
miss-ing
miss-ing
LTU miss-ing
miss-ing
miss-ing
miss-ing
miss-ing
miss-ing
miss-ing
miss-ing
miss-ing
miss-ing
miss-ing
miss-ing
miss-ing
SVN miss-ing
miss-ing
miss-ing
miss-ing
miss-ing
miss-ing
miss-ing
miss-ing
miss-ing
miss-ing
miss-ing
miss-ing
miss-ing
Mean 60.7 60.7 60.7 60.7 60.7 60.7 60.7 60.7 60.7 66.4 60.7 60.7 61.2
Max. 100.0 100.0 100.0 100.0 100.0 100.0 100.0 100.0 100.0 100.0 100.0 100.0 100.0
Min. 0.0 0.0 0.0 0.0 0.0 0.0 0.0 0.0 0.0 0.0 0.0 0.0 0.0
Note: Aggregated Data of the PISA school level data (mean over all schools per country).
10 A= Courses offered, B= Course content , C= Textbook selection , D=Admission, E= Student assessment , F=
Disciplinary policy , G= Budget allocation , H= budget , I= Salary increase , J= hiring , K= firing , L= salary.

Sfb 597 „Staatlichkeit im Wandel“ - „Transformations of the State“ (WP 157)
- 24 -
Appendix 4: Degrees of autonomy 200311
Country A B C D E F G H I J K L Mean
AUS 99.5 88.1 99.9 95.3 99.2 100.0 100.0 91.5 25.1 69.8 55.0 23.3 78.9
AUT 75.2 76.4 98.8 77.0 81.3 99.3 97.7 22.0 0.9 34.6 17.2 0.9 56.8
BEL 81.9 68.4 99.0 93.3 97.2 99.6 96.5 85.7 0.0 86.3 87.1 0.1 74.6
CAN 95.5 58.0 91.4 92.7 95.2 99.9 98.7 81.7 42.6 86.5 65.4 42.5 79.2
CHE 73.9 69.0 81.4 80.5 88.4 99.9 96.3 79.4 19.5 98.2 90.1 16.2 74.4
CHL miss-ing
miss-ing
miss-ing
miss-ing
miss-ing
miss-ing
miss-ing
miss-ing
miss-ing
miss-ing
miss-ing
miss-ing
miss-ing
CZE 91.0 90.9 100.0 98.2 99.4 100.0 97.8 93.2 79.6 100.0 100.0 80.0 94.2
DEU 89.4 70.5 100.0 91.0 95.9 99.1 98.0 15.7 22.2 36.4 12.9 1.7 61.1
DNK 91.7 89.5 99.7 89.1 89.5 98.4 99.5 93.8 45.0 98.5 75.3 28.6 83.2
ESP 61.6 70.8 100.0 75.0 96.2 98.8 99.0 86.7 6.9 36.0 36.2 6.5 64.5
FIN 99.8 92.0 100.0 71.2 99.0 99.9 99.9 80.5 5.9 70.1 35.6 10.1 72.0
FRA miss-ing
miss-ing
miss-ing
miss-ing
miss-ing
miss-ing
miss-ing
miss-ing
miss-ing
miss-ing
miss-ing
miss-ing
miss-ing
GBR 100.0 98.4 100.0 71.4 100.0 100.0 99.9 90.7 87.1 99.1 92.1 85.6 93.7
GRC 1.8 1.3 3.7 100.0 3.8 100.0 100.0 100.0 2.0 3.9 3.9 2.0 35.2
HUN 88.5 89.1 100.0 99.7 100.0 100.0 97.9 93.9 57.9 100.0 99.1 45.3 89.3
IRL 97.2 53.2 100.0 95.9 98.2 100.0 96.3 81.6 4.7 90.4 74.1 4.7 74.7
ISL 88.9 87.1 99.6 82.7 100.0 100.0 98.1 93.9 49.5 100.0 99.6 24.4 85.3
ITA 89.3 84.4 100.0 91.4 99.8 99.9 99.0 27.6 1.9 8.0 7.8 2.3 59.3
JPN 99.4 100.0 97.6 100.0 100.0 100.0 96.0 56.5 32.0 31.7 29.4 26.5 72.4
KOR 98.4 99.1 100.0 93.1 99.3 100.0 96.1 92.8 7.7 33.2 18.5 15.5 71.2
LUX 5.1 5.1 5.1 100.0 5.1 100.0 100.0 100.0 5.1 5.1 94.9 5.1 44.2
LVA 88.4 79.5 100.0 99.5 97.3 100.0 95.4 87.7 59.2 99.2 100.0 46.1 87.7
MEX 72.2 70.5 84.9 83.4 96.1 99.6 86.0 85.6 45.0 81.7 70.6 48.3 77.0
NLD 100.0 100.0 100.0 99.2 98.8 99.5 98.8 99.5 73.1 99.5 99.3 91.3 96.6
NOR 40.6 65.8 98.3 30.0 74.0 94.3 99.5 77.6 24.1 70.4 52.3 2.6 60.8
NZL 100.0 99.4 100.0 90.0 98.9 100.0 100.0 99.3 37.5 100.0 99.2 21.7 87.2
POL 59.9 100.0 100.0 98.7 100.0 100.0 92.8 42.1 17.3 100.0 100.0 25.4 78.0
PRT 60.9 43.5 100.0 92.9 69.4 70.6 92.4 90.8 0.9 11.7 8.6 0.9 53.6
ROU miss-ing
miss-ing
miss-ing
miss-ing
miss-ing
miss-ing
miss-ing
miss-ing
miss-ing
miss-ing
miss-ing
miss-ing
miss-ing
SVK 82.7 79.9 98.0 97.4 92.7 99.6 97.8 88.4 66.0 100.0 100.0 67.6 89.2
SWE 79.9 96.0 100.0 66.5 100.0 100.0 98.8 91.6 91.9 100.0 87.7 74.3 90.6
TUR 51.0 38.7 97.8 76.8 93.6 98.9 68.4 54.6 5.9 7.6 7.1 6.9 50.6
USA 98.3 88.5 96.1 79.2 93.3 98.6 95.3 89.9 78.2 99.0 96.6 78.1 90.9
EST miss-ing
miss-ing
miss-ing
miss-ing
miss-ing
miss-ing
miss-ing
miss-ing
miss-ing
miss-ing
miss-ing
miss-ing
miss-ing
LTU miss-ing
miss-ing
miss-ing
miss-ing
miss-ing
miss-ing
miss-ing
miss-ing
miss-ing
miss-ing
miss-ing
miss-ing
miss-ing
SVN miss-ing
miss-ing
miss-ing
miss-ing
miss-ing
miss-ing
miss-ing
miss-ing
miss-ing
miss-ing
miss-ing
miss-ing
miss-ing
Mean 78.7 75.1 91.7 87.0 88.7 98.5 96.4 79.1 33.2 68.6 63.9 29.5 74.2
Max. 100.0 100.0 100.0 100.0 100.0 100.0 100.0 100.0 91.9 100.0 100.0 91.3 96.6
Min. 1.8 1.3 3.7 30.0 3.8 70.6 68.4 15.7 0.0 3.9 3.9 0.1 35.2
Note: Aggregated Data of the PISA school level data.
11 A= Courses offered, B= Course content , C= Textbook selection , D=Admission, E= Student assessment , F=
Disciplinary policy , G= Budget allocation , H= budget , I= Salary increase , J= hiring , K= firing , L= salary.

Sfb 597 „Staatlichkeit im Wandel“ - „Transformations of the State“ (WP 157)
- 25 -
Appendix 5: Degrees of autonomy 200612
Country A B C D E F G H I J K L Mean
AUS 98.3 81.8 99.4 95.8 96.5 98.6 99.0 88.7 23.2 73.6 44.9 17.8 76.5
AUT 80.1 77.1 98.3 86.5 72.1 98.5 96.3 20.1 0.0 32.1 21.9 0.9 57.0
BEL 82.9 63.1 98.4 89.9 94.1 95.9 87.0 76.3 1.1 86.6 78.9 1.1 71.3
CAN 90.9 51.4 77.6 88.1 77.8 87.3 89.9 63.7 21.7 79.8 44.6 19.6 66.0
CHE 66.1 58.1 75.2 85.9 74.1 95.6 92.9 74.8 20.9 93.4 84.1 13.5 69.6
CHL 89.5 66.0 94.0 95.2 90.5 97.1 86.2 67.4 47.8 59.4 56.8 50.7 75.1
CZE 99.5 96.4 90.9 100.0 95.9 100.0 99.0 89.7 88.5 100.0 100.0 90.8 95.9
DEU 89.7 60.9 94.4 92.8 85.4 95.1 95.0 87.1 8.7 42.9 16.4 5.0 64.4
DNK 78.2 75.0 82.5 78.2 75.1 82.9 82.9 79.2 31.7 80.9 56.0 29.8 69.4
ESP 57.3 57.0 97.8 61.1 80.7 96.3 96.8 85.3 8.7 34.5 34.4 8.8 59.9
FIN 92.6 70.1 100.0 76.7 98.3 98.5 98.6 67.3 9.0 63.4 31.2 10.3 68.0
FRA 0.0 0.0 0.0 0.0 0.0 0.0 0.0 0.0 0.0 0.0 0.0 0.0 0.0
GBR 92.0 86.5 91.0 71.8 91.3 91.6 91.5 80.1 82.4 91.5 85.8 74.8 85.9
GRC 9.1 1.5 5.4 71.3 23.6 88.7 59.1 66.8 2.7 5.2 5.2 1.0 28.3
HUN 89.7 85.3 95.9 96.3 97.5 97.6 95.1 87.3 66.7 98.3 97.4 59.0 88.8
IRL 97.0 58.9 98.2 97.4 97.1 98.2 95.9 74.4 4.7 81.3 70.9 6.2 73.3
ISL 63.3 62.5 84.5 81.2 93.8 95.4 84.8 68.0 13.9 95.3 87.6 11.1 70.1
ITA 78.1 78.8 96.0 94.0 94.6 96.9 91.5 30.3 2.8 21.8 13.0 2.8 58.4
JPN 96.8 97.8 95.2 100.0 99.8 100.0 92.5 44.9 33.4 33.5 33.5 32.3 71.6
KOR 96.7 98.2 100.0 91.3 85.1 95.0 93.6 79.8 7.3 43.5 39.1 16.4 70.5
LUX 42.1 40.3 43.2 96.1 25.4 91.7 100.0 84.8 12.6 60.5 47.3 12.6 54.7
LVA 86.8 52.7 98.5 97.9 90.2 100.0 31.7 93.1 41.3 100.0 100.0 38.6 77.6
MEX 19.1 24.6 66.4 73.8 70.0 94.7 85.4 59.1 21.2 51.5 36.8 22.3 52.1
NLD 94.9 92.8 99.5 98.8 97.7 99.5 99.5 98.5 69.1 100.0 99.5 81.2 94.2
NOR 46.1 59.6 97.4 53.4 58.7 92.1 95.9 71.7 21.9 72.2 49.7 14.4 61.1
NZL 95.7 91.7 95.2 92.4 95.1 95.7 95.2 92.1 33.6 95.2 92.9 14.5 82.4
POL 70.4 99.4 99.4 98.5 99.4 99.4 63.6 41.5 22.1 99.1 97.8 26.6 76.4
PRT 76.1 46.8 99.0 89.6 70.2 74.6 79.3 82.3 4.6 21.9 10.7 4.5 55.0
ROU 77.7 44.1 91.7 27.2 59.3 99.3 45.3 63.0 10.4 8.9 21.7 8.1 46.4
SVK 77.5 63.1 88.6 100.0 85.5 97.8 96.5 82.8 51.2 99.8 99.8 59.3 83.5
SWE 73.7 91.4 99.5 77.0 95.0 99.4 98.2 87.6 92.8 99.5 77.4 77.9 89.1
TUR 42.2 10.6 72.8 83.1 50.1 41.7 71.1 69.0 2.3 6.0 3.8 3.8 38.0
USA 96.8 88.7 98.1 90.0 92.6 98.2 96.0 95.6 91.8 98.1 98.6 89.4 94.5
EST 97.7 96.9 98.1 99.5 97.5 100.0 97.3 93.3 63.5 98.3 98.9 34.2 89.6
LTU 93.8 81.4 98.0 97.6 95.2 98.4 78.6 68.2 17.1 97.5 98.3 19.3 78.6
SVN 73.1 63.3 94.4 77.7 76.7 99.2 97.3 75.2 31.4 99.6 94.5 12.6 74.6
Mean 75.3 65.9 86.5 83.5 80.0 91.4 85.0 71.9 29.5 67.4 59.1 27.0 68.5
Max. 99.5 99.4 100.0 100.0 99.8 100.0 100.0 98.5 92.8 100.0 100.0 90.8 95.9
Min. 0.0 0.0 0.0 0.0 0.0 0.0 0.0 0.0 0.0 0.0 0.0 0.0 0.0
Note: Aggregated Data of the PISA school level data.
12 A= Courses offered, B= Course content , C= Textbook selection , D=Admission, E= Student assessment , F=
Disciplinary policy , G= Budget allocation , H= budget , I= Salary increase , J= hiring , K= firing , L= salary.

Sfb 597 „Staatlichkeit im Wandel“ - „Transformations of the State“ (WP 157)
- 26 -
Appendix 6: The negative Effect of Funding privatization depending on the degree of
Institutional Privatization
Appendix 7: The negative Effect of Funding privatization depending on the degree of
School autonomy regarding budgeting
The
neg
ativ
e ef
fect
of
fina
ncia
l pr
ivat
izat
ion
on m
athe
mat
ical
ac
hiev
emen
t
The
neg
ativ
e ef
fect
of
fina
ncia
l pr
ivat
izat
ion
on m
athe
mat
ical
ac
hiev
emen
t
Institutional privatization
Institutional privatization

Sfb 597 „Staatlichkeit im Wandel“ - „Transformations of the State“ (WP 157)
- 27 -
Appendix 8: Marginal effects of institutional privatization on educational achieve-
ment of pupils from different social classes.
Appendix 9: Marginal effects of financial privatization on educational achievement of
pupils from different social classes.
Eff
ect o
f de
regu
lati
on o
n in
di-
vidu
als’
edu
cati
onal
ach
ieve
men
t
Eff
ect o
f de
regu
lati
on o
n in
di-
vidu
als’
edu
cati
onal
ach
ieve
men
t
International Socio-Economic Index of
Occupational Status (ISEI)
International Socio-Economic Index of
Occupational Status (ISEI)

Sfb 597 „Staatlichkeit im Wandel“ - „Transformations of the State“ (WP 157)
- 28 -
Appendix 10: Marginal effects of school autonomy regarding the courses offered on
educational achievement of pupils from different social classes.
Appendix 11: Marginal Effects of school autonomy regarding budgeting on Educa-
tional Achievement of pupils from different social classes.
Eff
ect o
f de
regu
lati
on o
n in
di-
vidu
als’
edu
cati
onal
ach
ieve
men
t
Eff
ect o
f de
regu
lati
on o
n in
divi
du-
als’
edu
cati
onal
ach
ieve
men
t
International Socio-Economic Index of
Occupational Status (ISEI)
International Socio-Economic Index of
Occupational Status (ISEI)

Sfb 597 „Staatlichkeit im Wandel“ - „Transformations of the State“ (WP 157)
- 29 -
Appendix 12: Marginal Effects of school autonomy regarding budget allocation on
Educational Achievement of pupils from different social classes.
Appendix 13: Marginal effects of school autonomy regarding course contents on edu-
cational achievement of pupils from different social classes.
Eff
ect o
f de
regu
lati
on o
n in
divi
du-
als’
edu
cati
onal
ach
ieve
men
t
Eff
ect o
f de
regu
lati
on o
n in
di-
vidu
als’
edu
cati
onal
ach
ieve
men
t
International Socio-Economic Index of
Occupational Status (ISEI)
International Socio-Economic Index of
Occupational Status (ISEI)

Sfb 597 „Staatlichkeit im Wandel“ - „Transformations of the State“ (WP 157)
- 30 -
Appendix 14: Marginal effects of school autonomy regarding textbook selection on
educational achievement of pupils from different social classes.
Appendix 15: Marginal effects of school autonomy regarding school admissions on
educational achievement of pupils from different social classes.
Eff
ect o
f de
regu
lati
on o
n in
di-
vidu
als’
edu
cati
onal
ach
ieve
men
t
Eff
ect o
f de
regu
lati
on o
n in
di-
vidu
als’
edu
cati
onal
ach
ieve
men
t
International Socio-Economic Index of
Occupational Status (ISEI)
International Socio-Economic Index of
Occupational Status (ISEI)

Sfb 597 „Staatlichkeit im Wandel“ - „Transformations of the State“ (WP 157)
- 31 -
Appendix 16: Marginal effects of school autonomy regarding student assessment on
educational achievement of pupils from different social classes.
Appendix 17: Marginal effects of school autonomy regarding disciplinary policies on
educational achievement of pupils from different social classes.
Eff
ect o
f de
regu
lati
on o
n in
divi
du-
als’
edu
cati
onal
ach
ieve
men
t E
ffec
t of
dere
gula
tion
on
indi
vidu
-
als’
edu
cati
onal
ach
ieve
men
t
International Socio-Economic Index of
Occupational Status (ISEI)
International Socio-Economic Index of
Occupational Status (ISEI)

Sfb 597 „Staatlichkeit im Wandel“ - „Transformations of the State“ (WP 157)
- 32 -
Appendix 18: Marginal effects of school autonomy regarding teachers’ salaries on
educational achievement of pupils from different social classes.
Appendix 19: Marginal effects of school autonomy regarding teachers’ salary in-
creases on educational achievement of pupils from different social
classes.
Eff
ect o
f de
regu
lati
on o
n in
di-
vidu
als’
edu
cati
onal
ach
ieve
men
t
Eff
ect o
f de
regu
lati
on o
n in
divi
dual
s’
educ
atio
nal a
chie
vem
ent
International Socio-Economic Index of
Occupational Status (ISEI)
International Socio-Economic Index of
Occupational Status (ISEI)

Sfb 597 „Staatlichkeit im Wandel“ - „Transformations of the State“ (WP 157)
- 33 -
Appendix 20: Marginal effects of school autonomy regarding hiring teachers on edu-
cational achievement of pupils from different social classes.
Appendix 21: Marginal effects of school autonomy regarding firing teachers on educa-
tional achievement of pupils from different social classes.
Eff
ect o
f de
regu
lati
on o
n in
di-
vidu
als’
edu
cati
onal
ach
ieve
men
t
Eff
ect o
f de
regu
lati
on o
n in
di-
vidu
als’
edu
cati
onal
ach
ieve
men
t
International Socio-Economic Index of
Occupational Status (ISEI)
International Socio-Economic Index of
Occupational Status (ISEI)

Sfb 597 „Staatlichkeit im Wandel“ - „Transformations of the State“ (WP 157)
- 34 -
BIOGRAPHICAL NOTE
Raphaela Schlicht-Schmälzle is research assistant at the Chair for Political Science
at the University of Konstanz. Telephone: +49 7531 88 3092
E-Mail: [email protected]
Address: Universität Konstanz, Lehrstuhl für Politikwissenschaft, Fachbe-
reich Politik- und Verwaltungswissenschaft, Fach D 79, D-78457
Konstanz
Janna Teltemann is research fellow at the Collaborative Research Center “Transfor-
mations of the State”, University of Bremen. Telephone: +49 421 218 67311
E-Mail: [email protected]
Address: University of Bremen, EMPAS, FVG, Celsiusstraße, D 28359
Bremen
Michael Windzio is project director at the Collaborative Research Center “Transfor-
mations of the State”, University of Bremen. Telephone: +49 421 218 67310
E-Mail: [email protected]
Address: University of Bremen, EMPAS, FVG, Celsiusstraße, D 28359
Bremen