Sample mean presentation
11
“ TWO SAMPLE MEAN” TWO SAMPLE MEAN” PAIRED T-TEST PAIRED T-TEST SUNDUS TOOR SUNDUS TOOR
Transcript of Sample mean presentation
“TWO SAMPLE MEAN”TWO SAMPLE MEAN”PAIRED T-TESTPAIRED T-TEST
SUNDUS TOOR SUNDUS TOOR

PAIRED t-TEST:PAIRED t-TEST:
“Paired t-test is a statistical technique
that is used to compare two population
means“

DistributionDistribution of the Paired of the Paired t-Statistict-Statistic
3
Suppose x is a variable on each of two populations whose members can be paired. Further suppose that the paired-difference variable d is normally distributed. Then, for paired samples of size n, the variable
has the t-distribution with df = n – 1.
The normal null hypothesis is that μD = 0
1;/
nvnDs
Ddt

Steps for paired t-testSteps for paired t-test::4
Step 1: The null hypothesis is H0: D = 0; the alternative hypothesis is one of the following:
Ha: D 0 Ha: D < 0 Ha: D > 0
(Two Tailed) (Left Tailed)(Right Tailed)Step 2: Decide on the significance level,
Step 3: The critical values are :±t/2 -t +t
(Two Tailed) (Left Tailed) (Right Tailed)
with df (degree of freedom)= (n – 1).

Region analysis for paired Region analysis for paired t-test :t-test :
5
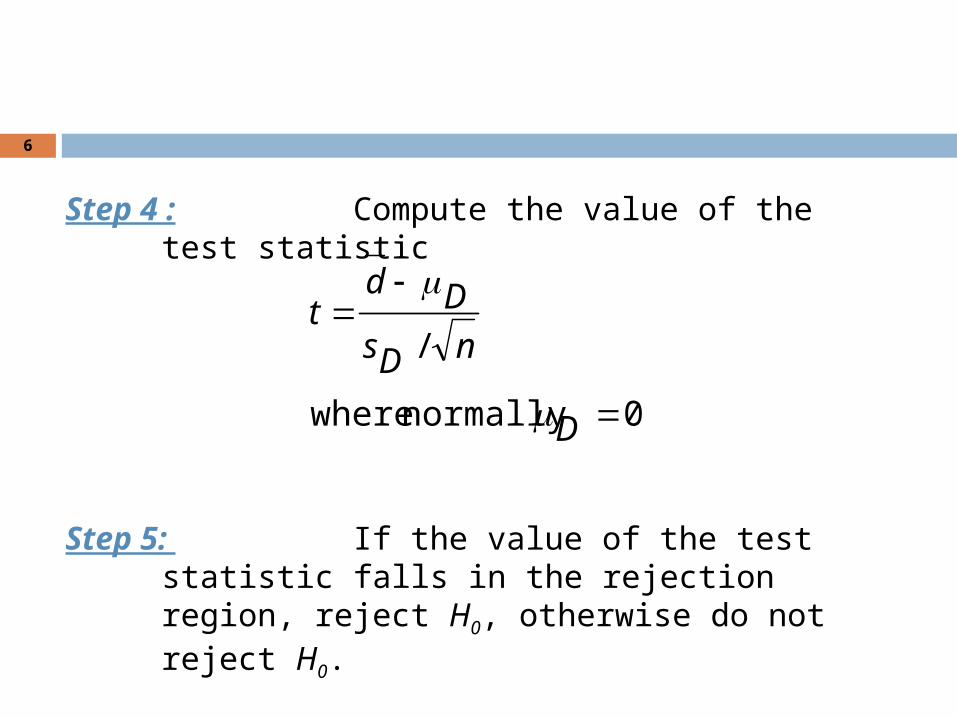
6
Step 4 : Compute the value of the test statistic
Step 5: If the value of the test statistic falls in the rejection region, reject H0, otherwise do not reject H0.
0normally where/
D
nDsDd
t

EXAMPLEEXAMPLE:

SolutionSolution:


Conclusion:Conclusion:
Comparison b/w 2 means. Comparing changes Estimating the designs

“THANKYOU”THANKYOU”