Late Holocene sedimentary changes in floodplain and shelf environments of the Tagus River (Portugal)
Quaternary Science Reviews 22 (2003) 1737–1756
Palaeoflood record of the Tagus River (Central Spain) during theLate Pleistocene and Holocene
Gerardo Benitoa,*, Alfonso Sopenab, Yolanda S!anchez-Moyac, Mar!ıa J. Machadod,Alfredo P!erez-Gonz!alezd
aCSIC-Centro de Ciencias Medioambientales, Serrano 115 bis, 28006 Madrid, Spainb Instituto de Geolog!ıa Econ !omica, CSIC-UCM, Facultad de Ciencias Geol !ogicas, Universidad Complutense de Madrid, 28040 Madrid, Spain
cDepartamento de Estratigraf!ıa, Instituto de Geolog!ıa Econ !omica, CSIC-UCM, Facultad de Ciencias Geol !ogicas,
Universidad Complutense de Madrid, 28040 Madrid, SpaindDepartamento de Geodin !amica, Facultad de Ciencias Geol !ogicas, Universidad Complutense de Madrid, 28040 Madrid, Spain
Received 13 September 2002; accepted 18 April 2003
Abstract
Palaeoflood hydrology of the Tagus River (Central Spain) was reconstructed from slackwater deposits and palaeostage indicators
in two canyon reaches located at El Puente del Arzobispo in the central part of the catchment (35; 000 km2 in drainage area) and in
Alc!antara, at the lower part of the catchment (52; 000 km2 in drainage area) near the Portuguese border. The palaeoflood record,
with more than 80 flood events, shows clusters of floods at specific periods from 9440 to 9210 14C yr BP (8540–8110 BC), 8500 to
8000 14C yr BP (7500–7000 BC),B6750 14C yr BP (B5000 BC), 1200 to 950 14C yr BP (AD 785–1205),B410 14C yr BP (AD 1450–
1500), 170 to 80 14C yr BP (AD 1670–1950). The largest flood(s) occurred during the periods 9440 to 9210 14C yr BP, B6750 14C yr
BP and 1200 to 950 14C yr BP reaching minimum discharge estimates of between 4000 and 4100 m3 s�1 in the El Puente del
Arzobispo reach and 13,700–15; 000 m3 s�1 in the Alc!antara reach. These periods with increased flood magnitude and/or frequency
in the Tagus River are strongly related to increased moisture influx and winter precipitation in the Iberian Peninsula, especially in
the western zone. Proxy records sensitive to winter precipitation such as lake levels and vegetation changes (indicated by pollen
records) are in good agreement with the clusters of floods found in the Tagus River. This flood variability seems to correspond to
changes in the prevailing atmospheric circulation pattern affecting the Iberian Peninsula.
r 2003 Elsevier Ltd. All rights reserved.
1. Introduction
During the 20th Century, most of Europe hasexperienced a temperature increase of about 0:8�C onaverage (IPCC, 2001), and even larger over the IberianPeninsula (Onate and Pou, 1996). Global circulationmodel (GCM) projections for the future, applied toregions such as Europe, are still too uncertain to drawall but highly tentative conclusions predicting changeson rainfall patterns. There is also an open debate overchanges in the frequency of future floods. For a scenarioof increased rainfall during periods when soils aresaturated (i.e. winter and spring) along with earliersnowmelt, the frequency and severity of floods might be
increased, especially in large river basins of Central-Western Europe in winter (IPCC, 1996). Expectedincreased temperatures in summer could lead to higherlocal precipitation extremes and associated flood risks insmall catchments. Other scenarios can be predicted fordifferent regions such as the Mediterranean, indicatingthat the flood response to global warming basedexclusively on GCMs is still far from well understood.
Some insight into flood–climate relations is providedby past flood data, both from palaeoflood and historicalflood records. Historical information provides a catalo-gue of the largest floods occurring during periods ofsettlement (Benito et al., 1996, 2003b; Barriendos andMart!ın-Vide, 1998), while palaeoflood investigationsbased on geological indicators can document themagnitude of these large floods over a certain periodof time (from decades to millennia). Thus, the length ofthe extreme flood record is not limited to the few dozen
ARTICLE IN PRESS
*Corresponding author. Tel.: +34-1-562-5020; fax: +34-1-564-
0800.
E-mail address: [email protected] (G. Benito).
0277-3791/03/$ - see front matter r 2003 Elsevier Ltd. All rights reserved.
doi:10.1016/S0277-3791(03)00133-1
years of the conventional (instrumental) record, but maybe extended to cover thousands of years.
Stadial and interstadial periods of the Late Pleisto-cene show some of the most significant rapid climaticchange events (such as the Younger Dryas, with a meansummer temperature 8�C cooler than the present),with transitions occurring over very short time spans(on the decade to century time scale; Allen et al., 1996).For the Holocene, multiple scenarios of climatechange have been defined and include temperaturechanges of 72�C with respect to present temperatures,and mean precipitation changes of some 20% (Knox,1993). It is true that there are still many doubts as tohow these changes occurred and to their spacio-temporal effects on the magnitude and frequency offloods. However, it is clear that using past climaticscenarios is a viable option in understanding thepotential disruptions of the water cycle during futureglobal climatic change.
It has been established that floods are highly sensitiveto even modest changes in climate (Knox, 1993, 2000;Ely, 1997). Palaeoflood studies are based on event-related records that represent an immediate response toa climate-related extreme (intense precipitation overextensive zones), which can be quantified in terms ofmagnitude and frequency. Indeed, traditional methodsof analysing Holocene climatic change such as the use ofpollen records, may show low sensitivity to shortduration climatic change. Even in the case of lake levelvariability, hydrologic responses and their responsibleclimatic change may not be contemporary. Palaeofloodrecords cannot be considered a proxy-record but may betaken as real evidence for the occurrence of anindividual hydrological event. In large river catchmentssuch as that of the Tagus River ð80; 000 km2Þ; highprecipitation for weeks or even months is required toproduce a flood event and raise the stage up to 35 mhigher than normal, producing peak discharges up to 50times the mean. Clusters of floods over certain periodsof the Late Pleistocene–Holocene are likely to be linkedto regional and global climatic variation over the last15,000 years.
Palaeohydrological analysis permits the identificationof periods showing a greater frequency of a particularbehaviour, or pattern, of global circulation of theatmosphere and, in some way, allows the estimation ofthe size of these anomalies over time (Hirschboeck,1991). Relationships between changes in climate andflood frequency have been established for certain areasincluding southwestern USA, Australia, China andSouth Africa (Knox, 1985, 1993, 2000; Baker, 1987;Pickup et al., 1988; Ely et al., 1993; Ely, 1997). As forclimate, the hydrologic response to changes in globalcirculation shows regional variation and may haveconsiderable impact on this scale. Past regional andglobal spatial and temporal patterns of flooding show
how past climatic changes provoked strong in-phase orout-of-phase relations between regions as well as adiachronous response across regions (Knox, 2000).Distribution patterns corresponding to either in-phaseor out-of-phase situations similarly suggest that thesealterations in atmospheric circulation play a significantrole on the global scale. As we continue to understandmore about the patterns of climatic change for thedifferent regions in the world, we will improve ourunderstanding of potential responses of extreme eventsto the different forecasted scenarios of global warmingmodels.
This paper deals with the application and develop-ment of new methodologies for the reconstruction of thehigh-magnitude flood record of the Tagus Basin over thelast 15; 000 yr: The main objectives are: (1) reconstruc-tion of the catalogue of major flood events using thestratigraphic record of slackwater flood deposits, (2)study of palaeoflood hydraulics associated with thesefloods with estimation of flood peak discharges, (3)analysis of palaeoclimatic conditions related to thepalaeoflood periods derived from palynological dataand other proxy-records of the Iberian Peninsula andnorthern Africa, and (4) evaluation of relations betweenclimatic variability and changes in flood frequency andmagnitude. These flood clusters identified for someperiods of the Late Pleistocene and Holocene can belinked to climatic and/or environmental changes on theregional and global scale.
2. Study areas
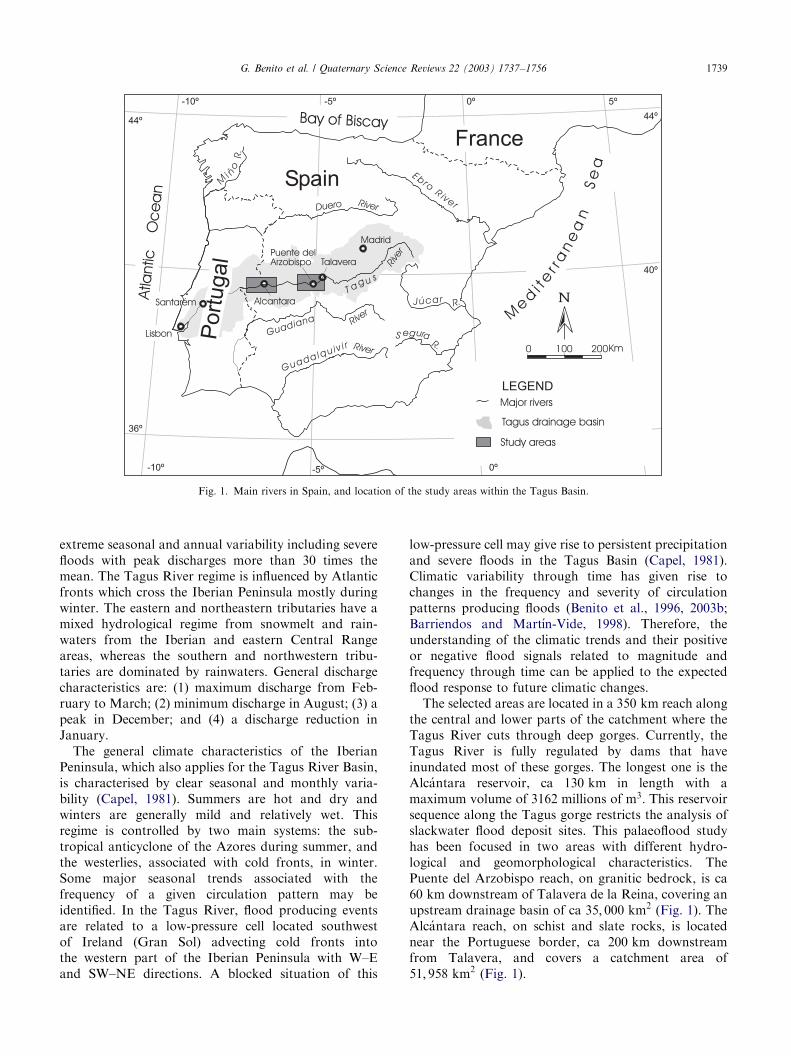
The Tagus River drains the central part of the SpanishPlateau (Meseta), with an E–W elongated basin withheadwaters in the Iberian Range and its mouth into theAtlantic Ocean in Lisbon (Fig. 1). It is the longest riverof the Iberian Peninsula ð1200 kmÞ and the third largestin catchment area ð81; 947 km2Þ: The Tagus Basin islimited by the Central Range to the north, the IberianRange to the east and the Toledo Mountains to thesouth. In the area limited by these mountain ranges andin the first 300 km of its course, the Tagus crosses atectonic depression filled by continental Tertiary sand-stones, shales, marls, gypsum and limestones. Here, theriver has developed a complete sequence of terracesurfaces and a wide floodplain. From Talavera de laReina to Santarem (entrance of the Lisbon estuary), theTagus River has incised into the bedrock composed ofPalaeozoic rocks (granite, slate, schist, quartzite),forming a series of deep gorges.
Present-day mean discharge close to the river mouthin Lisbon is 500 m3 s�1; where the major contribution ismade by the tributaries draining the Central Range.These open into the middle-low reaches of the Tagus.Hydrologically, the Tagus River is characterised by
ARTICLE IN PRESSG. Benito et al. / Quaternary Science Reviews 22 (2003) 1737–17561738
extreme seasonal and annual variability including severefloods with peak discharges more than 30 times themean. The Tagus River regime is influenced by Atlanticfronts which cross the Iberian Peninsula mostly duringwinter. The eastern and northeastern tributaries have amixed hydrological regime from snowmelt and rain-waters from the Iberian and eastern Central Rangeareas, whereas the southern and northwestern tribu-taries are dominated by rainwaters. General dischargecharacteristics are: (1) maximum discharge from Feb-ruary to March; (2) minimum discharge in August; (3) apeak in December; and (4) a discharge reduction inJanuary.
The general climate characteristics of the IberianPeninsula, which also applies for the Tagus River Basin,is characterised by clear seasonal and monthly varia-bility (Capel, 1981). Summers are hot and dry andwinters are generally mild and relatively wet. Thisregime is controlled by two main systems: the sub-tropical anticyclone of the Azores during summer, andthe westerlies, associated with cold fronts, in winter.Some major seasonal trends associated with thefrequency of a given circulation pattern may beidentified. In the Tagus River, flood producing eventsare related to a low-pressure cell located southwestof Ireland (Gran Sol) advecting cold fronts intothe western part of the Iberian Peninsula with W–Eand SW–NE directions. A blocked situation of this
low-pressure cell may give rise to persistent precipitationand severe floods in the Tagus Basin (Capel, 1981).Climatic variability through time has given rise tochanges in the frequency and severity of circulationpatterns producing floods (Benito et al., 1996, 2003b;Barriendos and Mart!ın-Vide, 1998). Therefore, theunderstanding of the climatic trends and their positiveor negative flood signals related to magnitude andfrequency through time can be applied to the expectedflood response to future climatic changes.
The selected areas are located in a 350 km reach alongthe central and lower parts of the catchment where theTagus River cuts through deep gorges. Currently, theTagus River is fully regulated by dams that haveinundated most of these gorges. The longest one is theAlc!antara reservoir, ca 130 km in length with amaximum volume of 3162 millions of m3: This reservoirsequence along the Tagus gorge restricts the analysis ofslackwater flood deposit sites. This palaeoflood studyhas been focused in two areas with different hydro-logical and geomorphological characteristics. ThePuente del Arzobispo reach, on granitic bedrock, is ca60 km downstream of Talavera de la Reina, covering anupstream drainage basin of ca 35; 000 km2 (Fig. 1). TheAlc!antara reach, on schist and slate rocks, is locatednear the Portuguese border, ca 200 km downstreamfrom Talavera, and covers a catchment area of51; 958 km2 (Fig. 1).
ARTICLE IN PRESS
Fig. 1. Main rivers in Spain, and location of the study areas within the Tagus Basin.
G. Benito et al. / Quaternary Science Reviews 22 (2003) 1737–1756 1739
3. El Puente del Arzobispo
The Tagus River downstream of El Puente delArzobispo cuts through granitic rocks and developsinto a 125 m deep gorge. The remnants of erodedPleistocene soils, only 6 m above the present thalweg,indicate that incision of the gorge during the Holocenehas been minor. Late Pleistocene and Holocene depositsalong the gorge are related to the flood dynamics and tolocal slope processes. Sudden changes in water stage dueto flooding are frequent during winter covering thecentennial water mills located along the river. Floodinghas left a set of erosional and depositional features,which allow reconstruction of the flood dynamics.
3.1. Flood geomorphology and stratigraphy
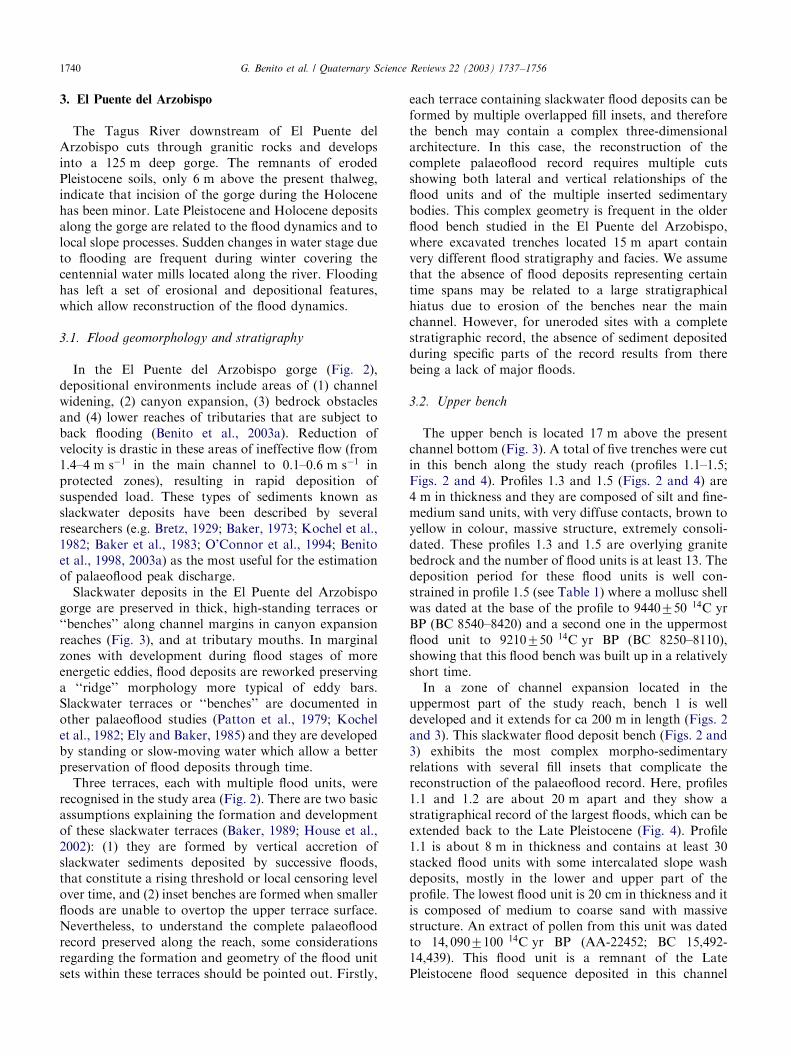
In the El Puente del Arzobispo gorge (Fig. 2),depositional environments include areas of (1) channelwidening, (2) canyon expansion, (3) bedrock obstaclesand (4) lower reaches of tributaries that are subject toback flooding (Benito et al., 2003a). Reduction ofvelocity is drastic in these areas of ineffective flow (from1.4–4 m s�1 in the main channel to 0.1–0:6 m s�1 inprotected zones), resulting in rapid deposition ofsuspended load. These types of sediments known asslackwater deposits have been described by severalresearchers (e.g. Bretz, 1929; Baker, 1973; Kochel et al.,1982; Baker et al., 1983; O’Connor et al., 1994; Benitoet al., 1998, 2003a) as the most useful for the estimationof palaeoflood peak discharge.
Slackwater deposits in the El Puente del Arzobispogorge are preserved in thick, high-standing terraces or‘‘benches’’ along channel margins in canyon expansionreaches (Fig. 3), and at tributary mouths. In marginalzones with development during flood stages of moreenergetic eddies, flood deposits are reworked preservinga ‘‘ridge’’ morphology more typical of eddy bars.Slackwater terraces or ‘‘benches’’ are documented inother palaeoflood studies (Patton et al., 1979; Kochelet al., 1982; Ely and Baker, 1985) and they are developedby standing or slow-moving water which allow a betterpreservation of flood deposits through time.
Three terraces, each with multiple flood units, wererecognised in the study area (Fig. 2). There are two basicassumptions explaining the formation and developmentof these slackwater terraces (Baker, 1989; House et al.,2002): (1) they are formed by vertical accretion ofslackwater sediments deposited by successive floods,that constitute a rising threshold or local censoring levelover time, and (2) inset benches are formed when smallerfloods are unable to overtop the upper terrace surface.Nevertheless, to understand the complete palaeofloodrecord preserved along the reach, some considerationsregarding the formation and geometry of the flood unitsets within these terraces should be pointed out. Firstly,
each terrace containing slackwater flood deposits can beformed by multiple overlapped fill insets, and thereforethe bench may contain a complex three-dimensionalarchitecture. In this case, the reconstruction of thecomplete palaeoflood record requires multiple cutsshowing both lateral and vertical relationships of theflood units and of the multiple inserted sedimentarybodies. This complex geometry is frequent in the olderflood bench studied in the El Puente del Arzobispo,where excavated trenches located 15 m apart containvery different flood stratigraphy and facies. We assumethat the absence of flood deposits representing certaintime spans may be related to a large stratigraphicalhiatus due to erosion of the benches near the mainchannel. However, for uneroded sites with a completestratigraphic record, the absence of sediment depositedduring specific parts of the record results from therebeing a lack of major floods.
3.2. Upper bench
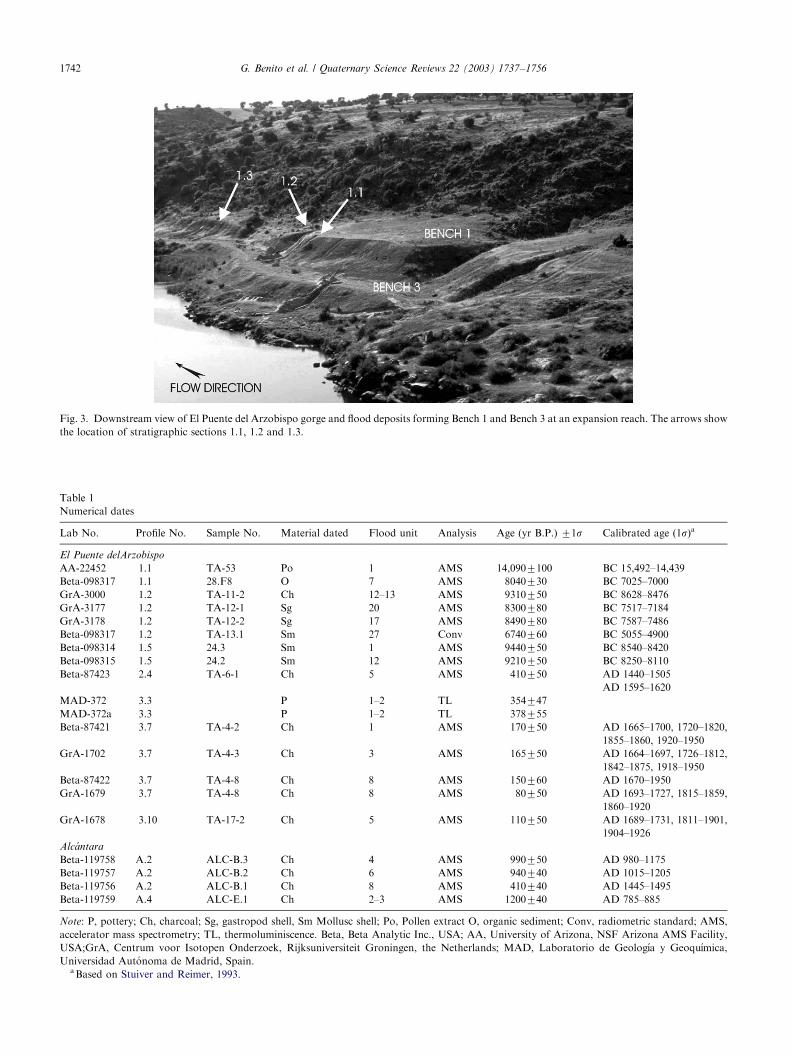
The upper bench is located 17 m above the presentchannel bottom (Fig. 3). A total of five trenches were cutin this bench along the study reach (profiles 1.1–1.5;Figs. 2 and 4). Profiles 1.3 and 1.5 (Figs. 2 and 4) are4 m in thickness and they are composed of silt and fine-medium sand units, with very diffuse contacts, brown toyellow in colour, massive structure, extremely consoli-dated. These profiles 1.3 and 1.5 are overlying granitebedrock and the number of flood units is at least 13. Thedeposition period for these flood units is well con-strained in profile 1.5 (see Table 1) where a mollusc shellwas dated at the base of the profile to 9440750 14C yrBP (BC 8540–8420) and a second one in the uppermostflood unit to 9210750 14C yr BP (BC 8250–8110),showing that this flood bench was built up in a relativelyshort time.
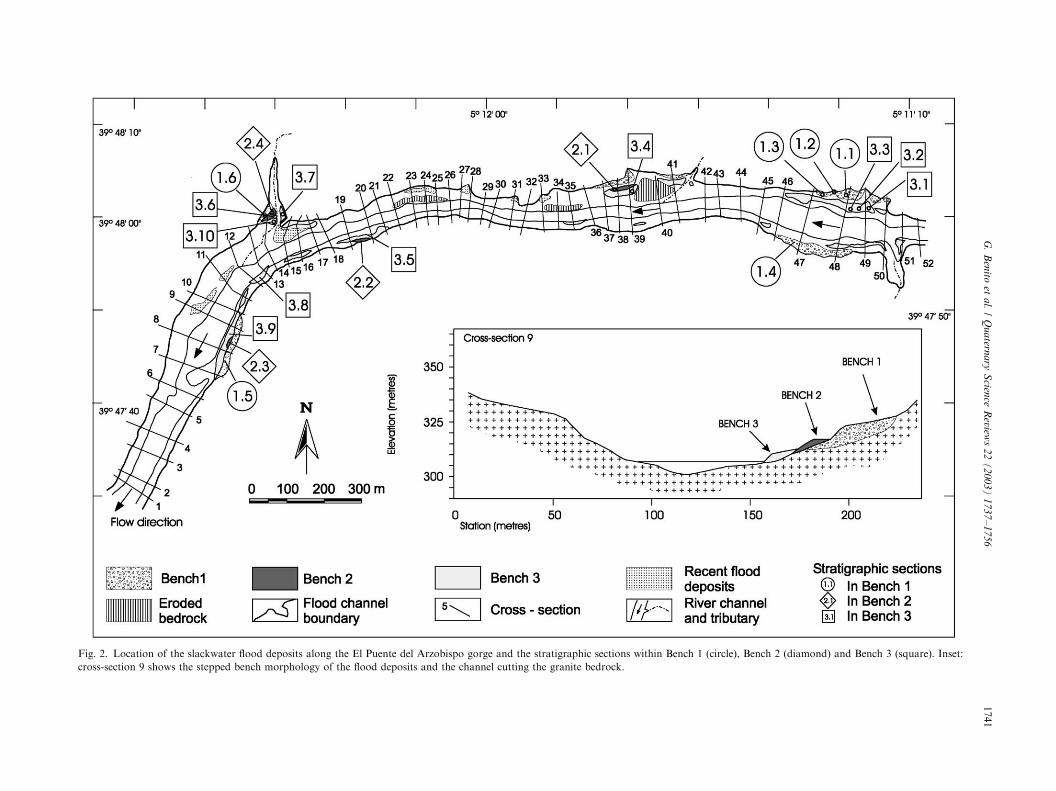
In a zone of channel expansion located in theuppermost part of the study reach, bench 1 is welldeveloped and it extends for ca 200 m in length (Figs. 2and 3). This slackwater flood deposit bench (Figs. 2 and3) exhibits the most complex morpho-sedimentaryrelations with several fill insets that complicate thereconstruction of the palaeoflood record. Here, profiles1.1 and 1.2 are about 20 m apart and they show astratigraphical record of the largest floods, which can beextended back to the Late Pleistocene (Fig. 4). Profile1.1 is about 8 m in thickness and contains at least 30stacked flood units with some intercalated slope washdeposits, mostly in the lower and upper part of theprofile. The lowest flood unit is 20 cm in thickness and itis composed of medium to coarse sand with massivestructure. An extract of pollen from this unit was datedto 14; 0907100 14C yr BP (AA-22452; BC 15,492-14,439). This flood unit is a remnant of the LatePleistocene flood sequence deposited in this channel
ARTICLE IN PRESSG. Benito et al. / Quaternary Science Reviews 22 (2003) 1737–17561740
ARTIC
LEIN
PRES
S
Fig. 2. Location of the slackwater flood deposits along the El Puente del Arzobispo gorge and the stratigraphic sections within Bench 1 (circle), Bench 2 (diamond) and Bench 3 (square). Inset:
cross-section 9 shows the stepped bench morphology of the flood deposits and the channel cutting the granite bedrock.
G.Benito
etal./Quatern
ary
Scien
ceReview
s22(2003)1737–1756
1741
ARTICLE IN PRESS
Fig. 3. Downstream view of El Puente del Arzobispo gorge and flood deposits forming Bench 1 and Bench 3 at an expansion reach. The arrows show
the location of stratigraphic sections 1.1, 1.2 and 1.3.
Table 1
Numerical dates
Lab No. Profile No. Sample No. Material dated Flood unit Analysis Age (yr B.P.) 71s Calibrated age ð1sÞa
El Puente delArzobispo
AA-22452 1.1 TA-53 Po 1 AMS 14,0907100 BC 15,492–14,439
Beta-098317 1.1 28.F8 O 7 AMS 8040730 BC 7025–7000
GrA-3000 1.2 TA-11-2 Ch 12–13 AMS 9310750 BC 8628–8476
GrA-3177 1.2 TA-12-1 Sg 20 AMS 8300780 BC 7517–7184
GrA-3178 1.2 TA-12-2 Sg 17 AMS 8490780 BC 7587–7486
Beta-098317 1.2 TA-13.1 Sm 27 Conv 6740760 BC 5055–4900
Beta-098314 1.5 24.3 Sm 1 AMS 9440750 BC 8540–8420
Beta-098315 1.5 24.2 Sm 12 AMS 9210750 BC 8250–8110
Beta-87423 2.4 TA-6-1 Ch 5 AMS 410750 AD 1440–1505
AD 1595–1620
MAD-372 3.3 P 1–2 TL 354747
MAD-372a 3.3 P 1–2 TL 378755
Beta-87421 3.7 TA-4-2 Ch 1 AMS 170750 AD 1665–1700, 1720–1820,
1855–1860, 1920–1950
GrA-1702 3.7 TA-4-3 Ch 3 AMS 165750 AD 1664–1697, 1726–1812,
1842–1875, 1918–1950
Beta-87422 3.7 TA-4-8 Ch 8 AMS 150760 AD 1670–1950
GrA-1679 3.7 TA-4-8 Ch 8 AMS 80750 AD 1693–1727, 1815–1859,
1860–1920
GrA-1678 3.10 TA-17-2 Ch 5 AMS 110750 AD 1689–1731, 1811–1901,
1904–1926
Alc !antara
Beta-119758 A.2 ALC-B.3 Ch 4 AMS 990750 AD 980–1175
Beta-119757 A.2 ALC-B.2 Ch 6 AMS 940740 AD 1015–1205
Beta-119756 A.2 ALC-B.1 Ch 8 AMS 410740 AD 1445–1495
Beta-119759 A.4 ALC-E.1 Ch 2–3 AMS 1200740 AD 785–885
Note: P, pottery; Ch, charcoal; Sg, gastropod shell, Sm Mollusc shell; Po, Pollen extract O, organic sediment; Conv, radiometric standard; AMS,
accelerator mass spectrometry; TL, thermoluminiscence. Beta, Beta Analytic Inc., USA; AA, University of Arizona, NSF Arizona AMS Facility,
USA;GrA, Centrum voor Isotopen Onderzoek, Rijksuniversiteit Groningen, the Netherlands; MAD, Laboratorio de Geolog!ıa y Geoqu!ımica,
Universidad Aut !onoma de Madrid, Spain.aBased on Stuiver and Reimer, 1993.
G. Benito et al. / Quaternary Science Reviews 22 (2003) 1737–17561742
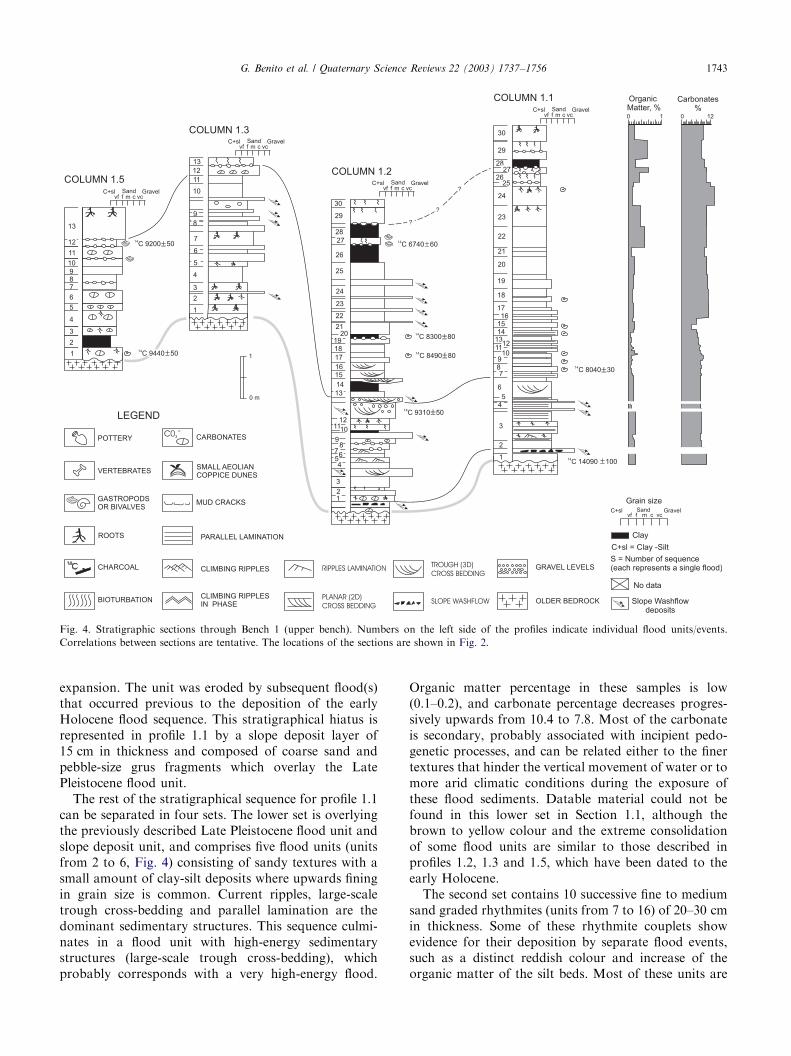
expansion. The unit was eroded by subsequent flood(s)that occurred previous to the deposition of the earlyHolocene flood sequence. This stratigraphical hiatus isrepresented in profile 1.1 by a slope deposit layer of15 cm in thickness and composed of coarse sand andpebble-size grus fragments which overlay the LatePleistocene flood unit.
The rest of the stratigraphical sequence for profile 1.1can be separated in four sets. The lower set is overlyingthe previously described Late Pleistocene flood unit andslope deposit unit, and comprises five flood units (unitsfrom 2 to 6, Fig. 4) consisting of sandy textures with asmall amount of clay-silt deposits where upwards finingin grain size is common. Current ripples, large-scaletrough cross-bedding and parallel lamination are thedominant sedimentary structures. This sequence culmi-nates in a flood unit with high-energy sedimentarystructures (large-scale trough cross-bedding), whichprobably corresponds with a very high-energy flood.
Organic matter percentage in these samples is low(0.1–0.2), and carbonate percentage decreases progres-sively upwards from 10.4 to 7.8. Most of the carbonateis secondary, probably associated with incipient pedo-genetic processes, and can be related either to the finertextures that hinder the vertical movement of water or tomore arid climatic conditions during the exposure ofthese flood sediments. Datable material could not befound in this lower set in Section 1.1, although thebrown to yellow colour and the extreme consolidationof some flood units are similar to those described inprofiles 1.2, 1.3 and 1.5, which have been dated to theearly Holocene.
The second set contains 10 successive fine to mediumsand graded rhythmites (units from 7 to 16) of 20–30 cmin thickness. Some of these rhythmite couplets showevidence for their deposition by separate flood events,such as a distinct reddish colour and increase of theorganic matter of the silt beds. Most of these units are
ARTICLE IN PRESS
Fig. 4. Stratigraphic sections through Bench 1 (upper bench). Numbers on the left side of the profiles indicate individual flood units/events.
Correlations between sections are tentative. The locations of the sections are shown in Fig. 2.
G. Benito et al. / Quaternary Science Reviews 22 (2003) 1737–1756 1743
structureless although parallel lamination, presumablyformed as the result of migration of plane beds, mayoccur in the sand layers. Organic matter varies between0.1% and 0.2%, and within the couplets the lowermedium-sand bed contains higher organic content thanthe upper bed. Carbonate content varies between 3.8%and 8.8%, usually the lower couplet has a slightly higherpercentage and, in the set, progressively the upperrhythmites contain a lower carbonate percentage. Aradiocarbon date from charcoal in the second rhythmite(unit 8, column 1.1; Fig. 2) provided an age of8040730 14C yr BP (BC 7025–7000). We may speculatethat the other rhythmites were deposited within a shorttime span or that they may correlate with units 13–17(column 1.2; Fig. 2) in which radiocarbon dates (bythe AMS technique) on terrestrial gastropod shellsgave ages of 8490780 and 8300780 14C yr BP(BC 7587–7486 and BC 7517–7184).
The third set shows at least eleven slackwatersedimentation units (units 17–27; Fig. 4), 12–43 cm inthickness, dominated by silty sand and sandy silttextures. Here, stratigraphical breaks are more difficultto determine due to minor changes in texture andmassive structure. This set shows a notable increase inthe carbonate, which is close to 12% in most of theunits. Organic matter in the third set ranges from 0.13%to 0.2%. These units did not contain any datablematerial. However, in column 1.2, unit 27 includes ariver mollusc that was dated to 6740760 14C yr BP (BC5055–4900). The fourth set comprises at least threefloods (units from 28 to 30), with a dominant sandy silttexture and massive structure. Most of the flood unitswere affected by pedogenic processes after deposition,which are reflected in the higher percentages of organicmatter (up to 0.6%) and carbonate content (around10%). These pedogenetic processes may be due to thelonger time span between the occurrences of large floodevents. In profile 1.1, overlying the uppermost soil, apale-brown slackwater unit was deposited probably by ahistorical flood (either AD 1876 or AD 1947).
In the stratigraphical profile 1.1, 62 samples weretaken for pollen analysis. Only units 1 and 3 containedpollen, with up to a total of 15 taxons identified (Mart!ın-Arroyo and Ruiz-Zapata, 1996; Mart!ın-Arroyo et al.,1999). These samples showed an important developmentof arboreal pollen, dominated by Pinus and Quercus-p,contrasting with the poor content both quantitativelyand qualitatively of the herbaceous pollen (Asteroideae,Chenopodiaceae, Lamiaceae, Plantago and Poaceae),whilst the shrub pollen is represented by Juniperus andRosaceae. According to Mart!ın-Arroyo et al. (1999),this vegetation represents dry and cold conditionsprevailing during the late glacial (pollen content on unit1, Section 1.1, was dated as 14; 0907100 14C yr BP),similar to ones described in other parts of the IberianPeninsula. Other interesting data obtained by these
authors is the presence of quantified percentages ofCastanea (chestnut tree). Currently, this arboreal taxonis located in humid and temperate zones of the westernpart of the Iberian Peninsula, and it is likely related towetter and warmer conditions prevailing during the lastdeglacial cycle along the Tagus valley.
3.3. Middle bench
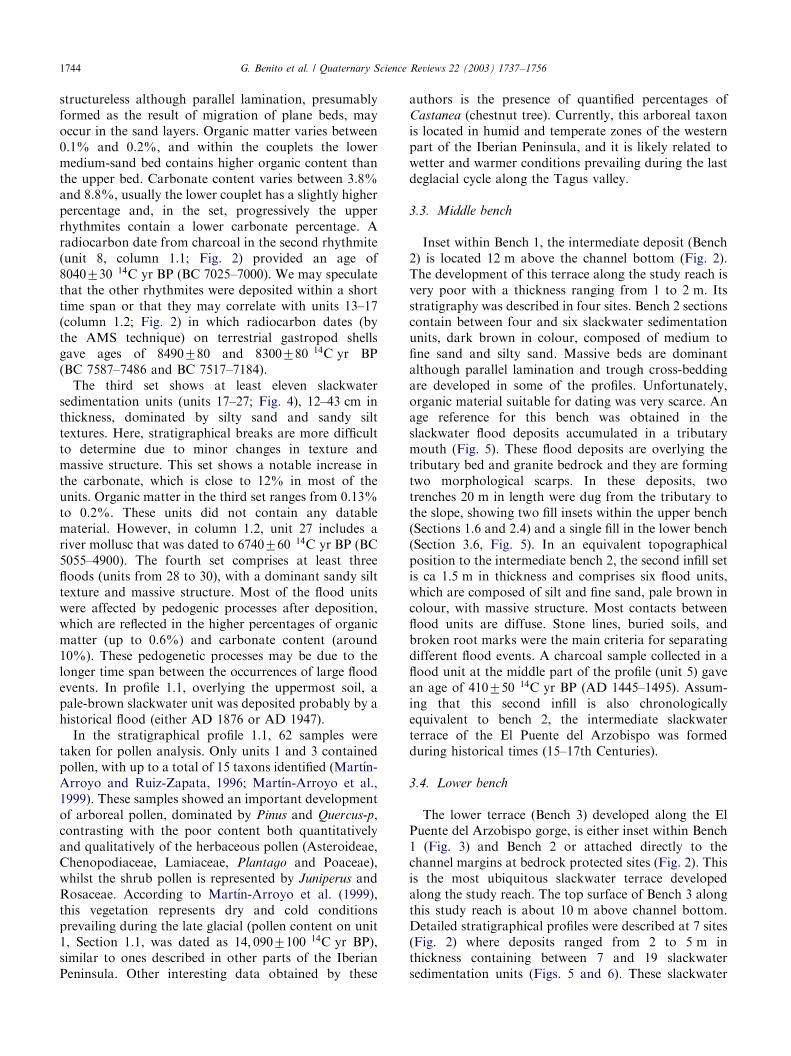
Inset within Bench 1, the intermediate deposit (Bench2) is located 12 m above the channel bottom (Fig. 2).The development of this terrace along the study reach isvery poor with a thickness ranging from 1 to 2 m: Itsstratigraphy was described in four sites. Bench 2 sectionscontain between four and six slackwater sedimentationunits, dark brown in colour, composed of medium tofine sand and silty sand. Massive beds are dominantalthough parallel lamination and trough cross-beddingare developed in some of the profiles. Unfortunately,organic material suitable for dating was very scarce. Anage reference for this bench was obtained in theslackwater flood deposits accumulated in a tributarymouth (Fig. 5). These flood deposits are overlying thetributary bed and granite bedrock and they are formingtwo morphological scarps. In these deposits, twotrenches 20 m in length were dug from the tributary tothe slope, showing two fill insets within the upper bench(Sections 1.6 and 2.4) and a single fill in the lower bench(Section 3.6, Fig. 5). In an equivalent topographicalposition to the intermediate bench 2, the second infill setis ca 1:5 m in thickness and comprises six flood units,which are composed of silt and fine sand, pale brown incolour, with massive structure. Most contacts betweenflood units are diffuse. Stone lines, buried soils, andbroken root marks were the main criteria for separatingdifferent flood events. A charcoal sample collected in aflood unit at the middle part of the profile (unit 5) gavean age of 410750 14C yr BP (AD 1445–1495). Assum-ing that this second infill is also chronologicallyequivalent to bench 2, the intermediate slackwaterterrace of the El Puente del Arzobispo was formedduring historical times (15–17th Centuries).
3.4. Lower bench
The lower terrace (Bench 3) developed along the ElPuente del Arzobispo gorge, is either inset within Bench1 (Fig. 3) and Bench 2 or attached directly to thechannel margins at bedrock protected sites (Fig. 2). Thisis the most ubiquitous slackwater terrace developedalong the study reach. The top surface of Bench 3 alongthis study reach is about 10 m above channel bottom.Detailed stratigraphical profiles were described at 7 sites(Fig. 2) where deposits ranged from 2 to 5 m inthickness containing between 7 and 19 slackwatersedimentation units (Figs. 5 and 6). These slackwater
ARTICLE IN PRESSG. Benito et al. / Quaternary Science Reviews 22 (2003) 1737–17561744
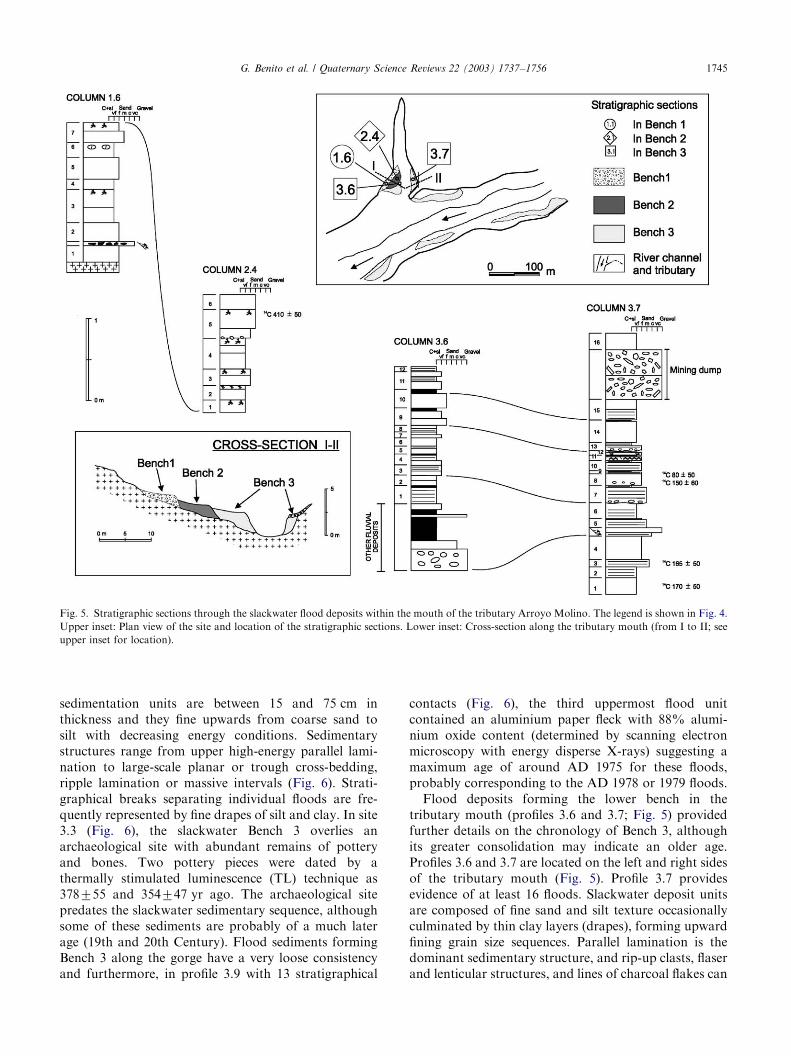
sedimentation units are between 15 and 75 cm inthickness and they fine upwards from coarse sand tosilt with decreasing energy conditions. Sedimentarystructures range from upper high-energy parallel lami-nation to large-scale planar or trough cross-bedding,ripple lamination or massive intervals (Fig. 6). Strati-graphical breaks separating individual floods are fre-quently represented by fine drapes of silt and clay. In site3.3 (Fig. 6), the slackwater Bench 3 overlies anarchaeological site with abundant remains of potteryand bones. Two pottery pieces were dated by athermally stimulated luminescence (TL) technique as378755 and 354747 yr ago. The archaeological sitepredates the slackwater sedimentary sequence, althoughsome of these sediments are probably of a much laterage (19th and 20th Century). Flood sediments formingBench 3 along the gorge have a very loose consistencyand furthermore, in profile 3.9 with 13 stratigraphical
contacts (Fig. 6), the third uppermost flood unitcontained an aluminium paper fleck with 88% alumi-nium oxide content (determined by scanning electronmicroscopy with energy disperse X-rays) suggesting amaximum age of around AD 1975 for these floods,probably corresponding to the AD 1978 or 1979 floods.
Flood deposits forming the lower bench in thetributary mouth (profiles 3.6 and 3.7; Fig. 5) providedfurther details on the chronology of Bench 3, althoughits greater consolidation may indicate an older age.Profiles 3.6 and 3.7 are located on the left and right sidesof the tributary mouth (Fig. 5). Profile 3.7 providesevidence of at least 16 floods. Slackwater deposit unitsare composed of fine sand and silt texture occasionallyculminated by thin clay layers (drapes), forming upwardfining grain size sequences. Parallel lamination is thedominant sedimentary structure, and rip-up clasts, flaserand lenticular structures, and lines of charcoal flakes can
ARTICLE IN PRESS
Fig. 5. Stratigraphic sections through the slackwater flood deposits within the mouth of the tributary Arroyo Molino. The legend is shown in Fig. 4.
Upper inset: Plan view of the site and location of the stratigraphic sections. Lower inset: Cross-section along the tributary mouth (from I to II; see
upper inset for location).
G. Benito et al. / Quaternary Science Reviews 22 (2003) 1737–1756 1745
be observed in some units. Most of the contacts betweenunits are sharp and frequently slightly erosive with clastaccumulations at the bottom of the units. Charcoalmaterial from the lower part of the profile indicateabsolute ages of 170750 14C yr BP (AD 1665–1950)and 165750 14C yr BP (AD 1664–1950), and at themiddle part deposits were dated as 150760 14C yr BP(1670–1950) and 80750 14C yr BP (AD 1693–1920). A50-cm thick accumulation of boulders (23 cm indiameter), gravels and pebbles with chaotic structureat the top of the slackwater units were caused by miningactivities located upslope operating at the beginning ofthe 20th Century. Another profile within the tributarymouth (profile 3.10; Fig. 2) shows five flood unitsoverlying an older flood deposit yellowish in colour.These units are 10–20 cm in thickness, and arecomposed of silt and fine sand with parallel laminationor massive structure. A charcoal flake collected in thesecond youngest flood unit in the profile was dated byAMS to 110750 14C yr BP (AD 1689–1926).
The pollen study of 15 samples from profile 3.3showed two groups, which are separated by a middlesterile layers (Mart!ın-Arroyo and Ruiz-Zapata, 1996).In this profile, no major changes in vegetation duringthe time scale represented on the diagram were detected.Quercus P., Olea and Pinus are the three principalcomponents of the arboreal pollen, Juniperus, Ericaceaeand Cistaceae, the shrub pollen, and Cichoroideae andAsteroideae, the herbaceous pollen. Flood unit 1 (profile3.3) contains up to 60% of arboreal pollen, whereas inflood unit 3 the levels of Quercus p. pollen fell below 5%,whilst the herbaceous pollen, namely Cichoriaceae,Poaceae and Chenopodiaceae, increased. In the upperzone (from unit 10 to 19), the same pollen elements werefound, although distributed differently and with moreshrub pollen, indicating a landscape covered in heathdotted with trees. The vegetation changes indicated bythe pollen content can be interpreted as the results ofhuman intervention and for the manufacture of charcoal(Mart!ın-Arroyo and Ruiz-Zapata, 1996).
ARTICLE IN PRESS
Fig. 6. Stratigraphic sections through Bench 3 (lower bench). The legend is shown in Fig. 4. and location of the sections in Fig. 2. Numbers on the
left side of the profiles indicate individual flood units/events. Correlations between sections are tentative.
G. Benito et al. / Quaternary Science Reviews 22 (2003) 1737–17561746
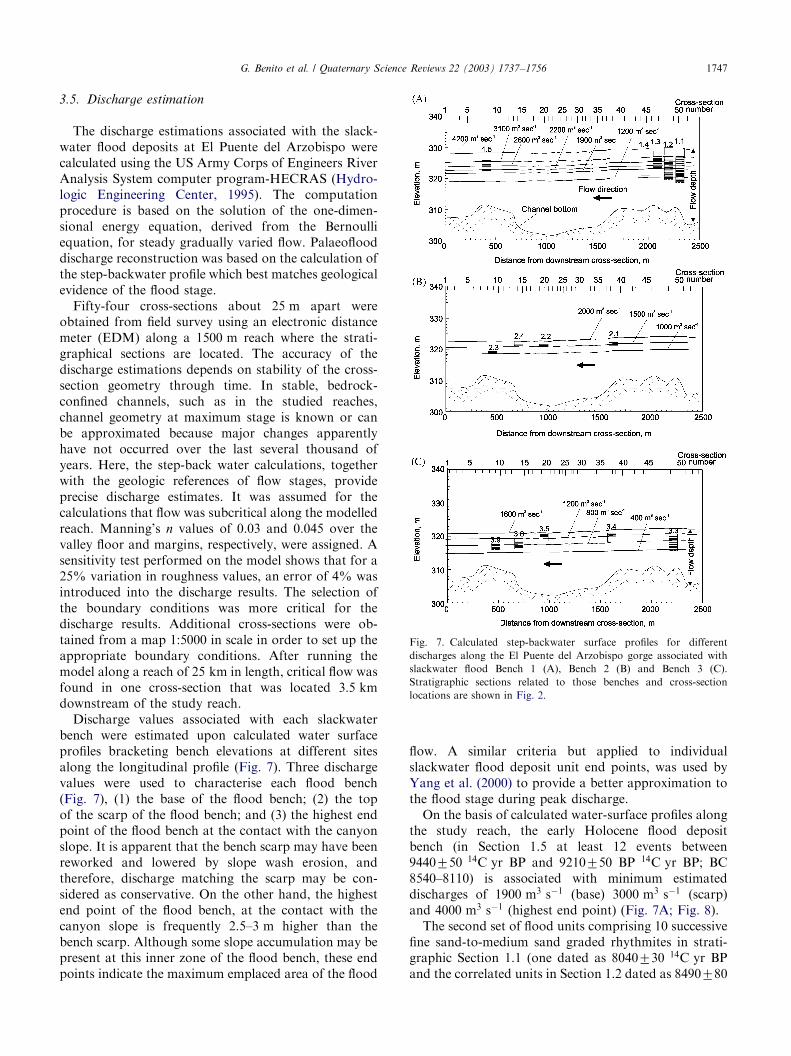
3.5. Discharge estimation
The discharge estimations associated with the slack-water flood deposits at El Puente del Arzobispo werecalculated using the US Army Corps of Engineers RiverAnalysis System computer program-HECRAS (Hydro-logic Engineering Center, 1995). The computationprocedure is based on the solution of the one-dimen-sional energy equation, derived from the Bernoulliequation, for steady gradually varied flow. Palaeoflooddischarge reconstruction was based on the calculation ofthe step-backwater profile which best matches geologicalevidence of the flood stage.
Fifty-four cross-sections about 25 m apart wereobtained from field survey using an electronic distancemeter (EDM) along a 1500 m reach where the strati-graphical sections are located. The accuracy of thedischarge estimations depends on stability of the cross-section geometry through time. In stable, bedrock-confined channels, such as in the studied reaches,channel geometry at maximum stage is known or canbe approximated because major changes apparentlyhave not occurred over the last several thousand ofyears. Here, the step-back water calculations, togetherwith the geologic references of flow stages, provideprecise discharge estimates. It was assumed for thecalculations that flow was subcritical along the modelledreach. Manning’s n values of 0.03 and 0.045 over thevalley floor and margins, respectively, were assigned. Asensitivity test performed on the model shows that for a25% variation in roughness values, an error of 4% wasintroduced into the discharge results. The selection ofthe boundary conditions was more critical for thedischarge results. Additional cross-sections were ob-tained from a map 1:5000 in scale in order to set up theappropriate boundary conditions. After running themodel along a reach of 25 km in length, critical flow wasfound in one cross-section that was located 3:5 kmdownstream of the study reach.
Discharge values associated with each slackwaterbench were estimated upon calculated water surfaceprofiles bracketing bench elevations at different sitesalong the longitudinal profile (Fig. 7). Three dischargevalues were used to characterise each flood bench(Fig. 7), (1) the base of the flood bench; (2) the topof the scarp of the flood bench; and (3) the highest endpoint of the flood bench at the contact with the canyonslope. It is apparent that the bench scarp may have beenreworked and lowered by slope wash erosion, andtherefore, discharge matching the scarp may be con-sidered as conservative. On the other hand, the highestend point of the flood bench, at the contact with thecanyon slope is frequently 2.5–3 m higher than thebench scarp. Although some slope accumulation may bepresent at this inner zone of the flood bench, these endpoints indicate the maximum emplaced area of the flood
flow. A similar criteria but applied to individualslackwater flood deposit unit end points, was used byYang et al. (2000) to provide a better approximation tothe flood stage during peak discharge.
On the basis of calculated water-surface profiles alongthe study reach, the early Holocene flood depositbench (in Section 1.5 at least 12 events between9440750 14C yr BP and 9210750 BP 14C yr BP; BC8540–8110) is associated with minimum estimateddischarges of 1900 m3 s�1 (base) 3000 m3 s�1 (scarp)and 4000 m3 s�1 (highest end point) (Fig. 7A; Fig. 8).
The second set of flood units comprising 10 successivefine sand-to-medium sand graded rhythmites in strati-graphic Section 1.1 (one dated as 8040730 14C yr BPand the correlated units in Section 1.2 dated as 8490780
ARTICLE IN PRESS
Fig. 7. Calculated step-backwater surface profiles for different
discharges along the El Puente del Arzobispo gorge associated with
slackwater flood Bench 1 (A), Bench 2 (B) and Bench 3 (C).
Stratigraphic sections related to those benches and cross-section
locations are shown in Fig. 2.
G. Benito et al. / Quaternary Science Reviews 22 (2003) 1737–1756 1747
and 8300780 14C yr BP; BC 7025–7000, BC 7587–7486and BC 7517–7184) is associated with minimumdischarges between 1200 and 2200 m3 s�1 (Fig. 8).There is no field evidence to provide an upper range ofdischarge estimates for these flood units. In Sections 1.1and 1.2 the third fill set (at least 11 flood units)containing a dating at the upper portion of this set of6740760 14C yr BP (BC 5055–4900) matched withdischarge estimates between 2200 and 2600 m3 s�1
(Fig. 8). The upper and fourth fill set within Sections1.1 and 1.2 (at least three flood units) matches withdischarge estimates of 2600 m3 s�1 (base), 3100 m3 s�1
(scarp), and 4200 m3 s�1 (end point). Unfortunately, thelack of organic material avoided numerical dating ofthese flood units which comprise the largest flood thatoccurred in the Tagus River during the last 4000 yr:Information on historical floods indicate that thispalaeoflood record should include the AD 1876 floodand AD 1947 flood, the latter flood having at leastreached the bench scarp.
The slackwater Bench 2 comprising between four andsix sedimentary units was associated with an estimatedminimum discharge of 1000 m3 s�1 (base) to2000 m3 s�1 (top) (Fig. 7B; Fig. 8). In fact, flood unit
five in stratigraphic Section 2.4 and dated as410750 14C yr BP (AD 1445–1495) matches with awater surface profile of 2000 m3 s�1:
The slackwater Bench 3, comprising upto 19 floodunits, has an associated maximum age of 378755; andincludes the most recent floods (AD 1978, 1979, 1984and 1989). Flood discharges are bracketed by minimumvalues that range between 400 and 1200 m3 s�1 inSection 3.3 (Fig. 7C). However, flood deposits formingthe lower bench in the tributary mouth (profiles 3.6 and3.7) include at least 16 floods having occurred since AD1664 and whose minimum discharge magnitudes rangebetween 800 and 1600 m3 s�1:
The nearest gauge record to El Puente del Arzobispois that of Talavera de la Reina, approximately 60 kmupstream of the study reach. The peak discharge recordis incomplete and includes the periods 1942–1949 and1971–1990. During these periods only two floodsexceeded 1500 m3 s�1 and four floods surpassed1000 m3 s�1: The largest flood during this instrumentalperiod occurred in March 1947. Reported peak dis-charge inferred by rating curve extrapolation was7320 m3 s�1or approximately four times that of thesecond largest recorded flood. The field data suggest
ARTICLE IN PRESS
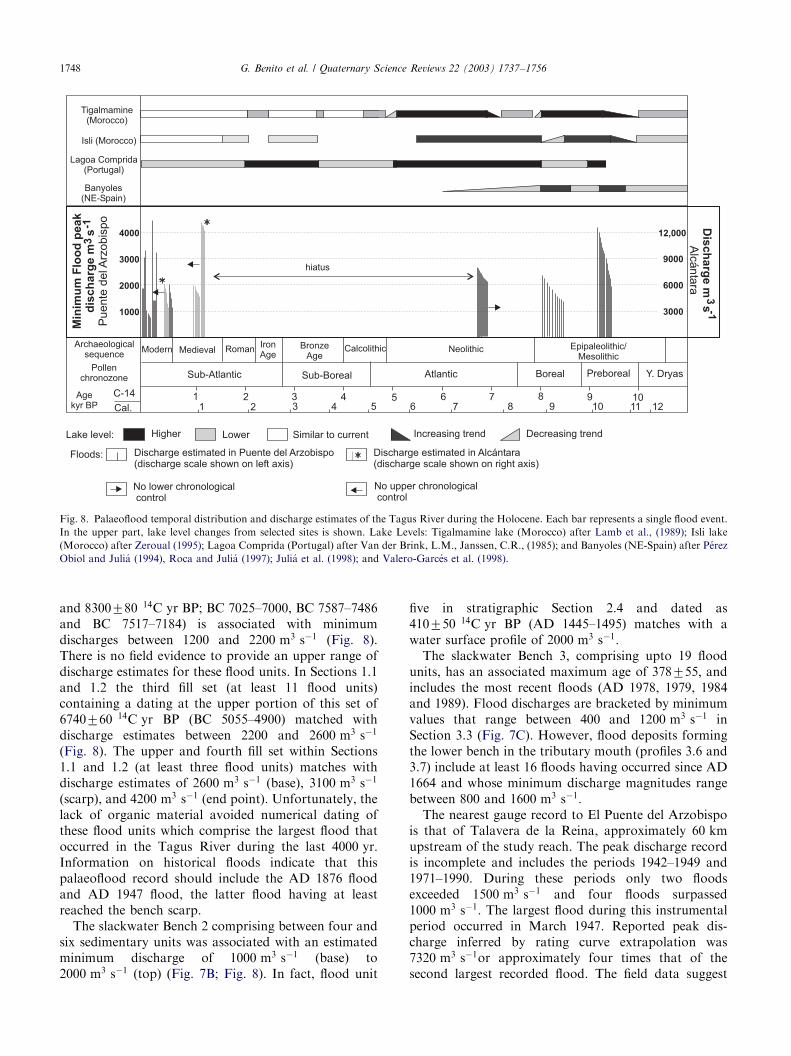
Fig. 8. Palaeoflood temporal distribution and discharge estimates of the Tagus River during the Holocene. Each bar represents a single flood event.
In the upper part, lake level changes from selected sites is shown. Lake Levels: Tigalmamine lake (Morocco) after Lamb et al., (1989); Isli lake
(Morocco) after Zeroual (1995); Lagoa Comprida (Portugal) after Van der Brink, L.M., Janssen, C.R., (1985); and Banyoles (NE-Spain) after P!erez
Obiol and Juli!a (1994), Roca and Juli!a (1997); Juli!a et al. (1998); and Valero-Garc!es et al. (1998).
G. Benito et al. / Quaternary Science Reviews 22 (2003) 1737–17561748
that the 1947 discharge values were overestimated. Thewater surface elevation was documented on marks onthe walls of buildings at El Puente del Arzobispo.According to these marks the 1947 flood discharge morelikely was between 2500 and 3000 m3 s�1:
Currently, the Tagus River is fully regulated by damsthat have inundated most of the channel and floodplainareas downstream of Talavera de la Reina (central partof the basin) to the Portuguese border. The Azutan dam,approximately 15 km upstream of El Puente delArzobispo was built in 1969 for hydroelectric purposes.The spillway was designed for flood control with adischarge capacity of 6000 m3 s�1: According to ourstudy, the Azutan dam spillway is clearly over dimen-sioned for any flood that has occurred in the last10; 000 yr:
4. Alc!antara
Alc!antara reach is located 10 km upstream of thePortuguese border, and ca 170 km downstream from ElPuente del Arzobispo, covering a catchment area of51; 958 km2: Here, the Tagus River flows through a500 m-wide constricted segment incised ca 150 m intoschist and slates. The physiography of the Tagus Rivervalley is characterised by steep slopes and developmentof rock-cut terraces in which the river has cut a 100 m
wide low-flow channel. In the study reach, water isregulated by the Cedillo dam, built in 1975, and locatedca 50 km downstream. The reservoir water levelconstrains the potential location of the slackwater sites.
4.1. Flood geomorphology and stratigraphy
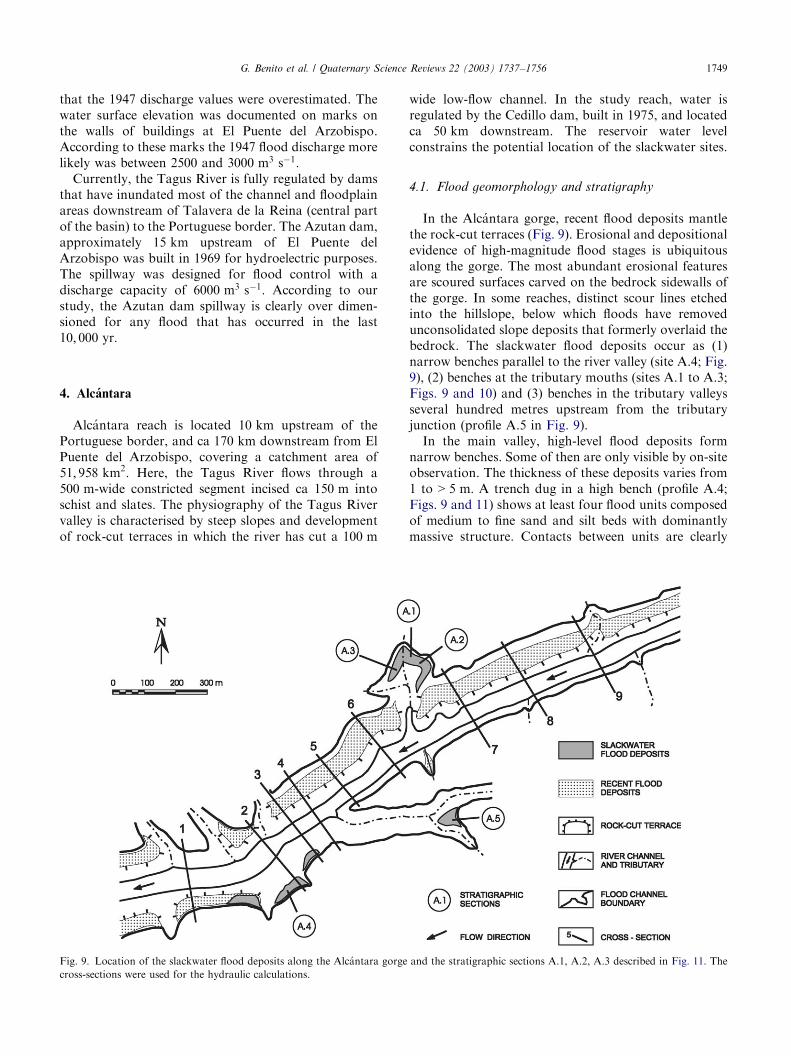
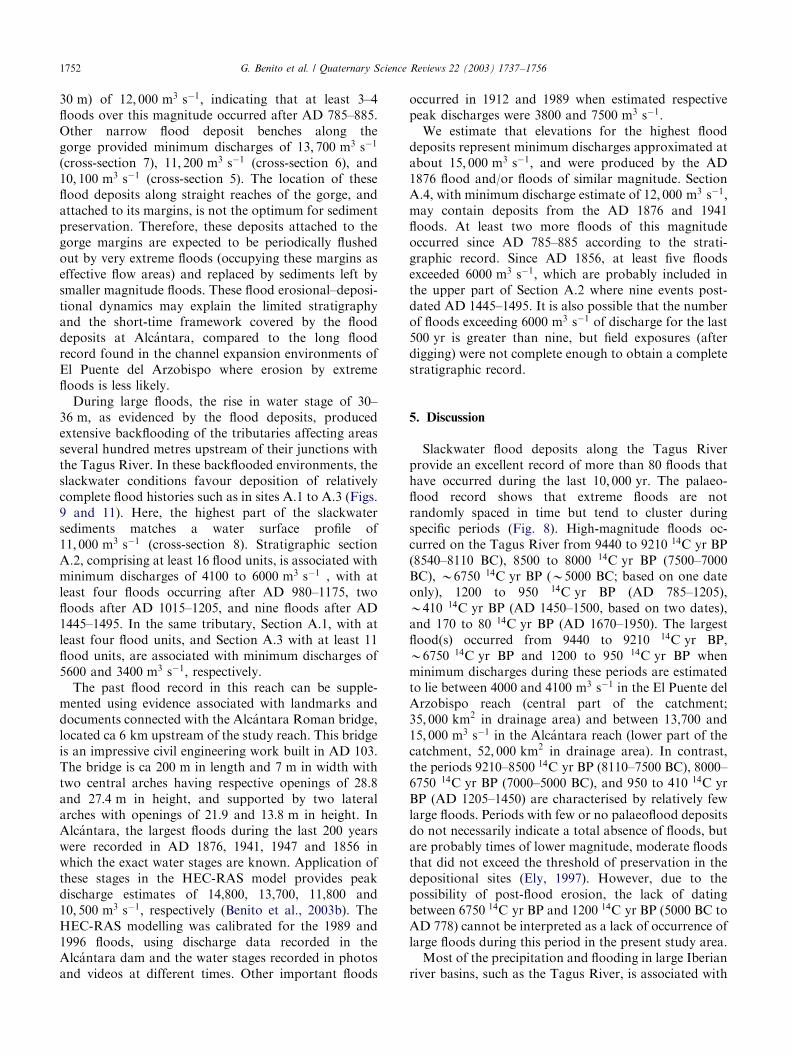
In the Alc!antara gorge, recent flood deposits mantlethe rock-cut terraces (Fig. 9). Erosional and depositionalevidence of high-magnitude flood stages is ubiquitousalong the gorge. The most abundant erosional featuresare scoured surfaces carved on the bedrock sidewalls ofthe gorge. In some reaches, distinct scour lines etchedinto the hillslope, below which floods have removedunconsolidated slope deposits that formerly overlaid thebedrock. The slackwater flood deposits occur as (1)narrow benches parallel to the river valley (site A.4; Fig.9), (2) benches at the tributary mouths (sites A.1 to A.3;Figs. 9 and 10) and (3) benches in the tributary valleysseveral hundred metres upstream from the tributaryjunction (profile A.5 in Fig. 9).
In the main valley, high-level flood deposits formnarrow benches. Some of then are only visible by on-siteobservation. The thickness of these deposits varies from1 to > 5 m: A trench dug in a high bench (profile A.4;Figs. 9 and 11) shows at least four flood units composedof medium to fine sand and silt beds with dominantlymassive structure. Contacts between units are clearly
ARTICLE IN PRESS
Fig. 9. Location of the slackwater flood deposits along the Alc!antara gorge and the stratigraphic sections A.1, A.2, A.3 described in Fig. 11. The
cross-sections were used for the hydraulic calculations.
G. Benito et al. / Quaternary Science Reviews 22 (2003) 1737–1756 1749
delineated by colour and textural changes, wash-slopematerial on top of the units, truncated bioturbation androot marks. Charcoal found in a slope deposit in themiddle part of the stratigraphical profile was dated as1200740 14C yr BP (AD 785–885), indicating that atleast three extremely large floods have occurred since theninth century.
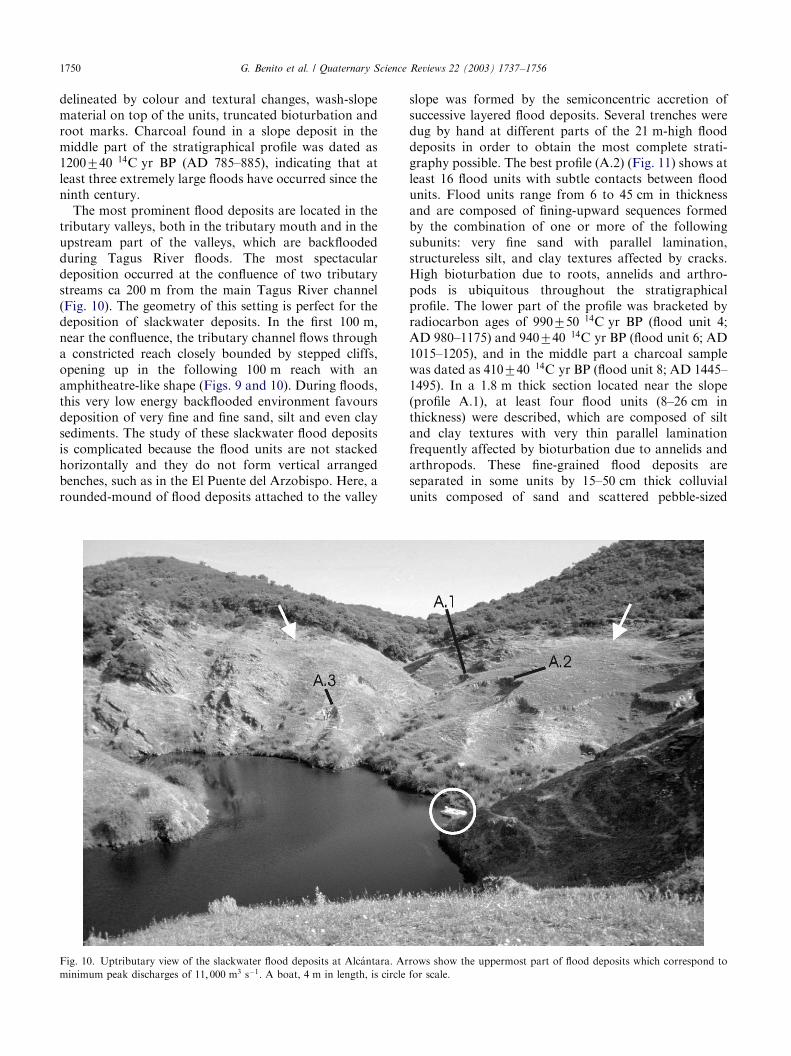
The most prominent flood deposits are located in thetributary valleys, both in the tributary mouth and in theupstream part of the valleys, which are backfloodedduring Tagus River floods. The most spectaculardeposition occurred at the confluence of two tributarystreams ca 200 m from the main Tagus River channel(Fig. 10). The geometry of this setting is perfect for thedeposition of slackwater deposits. In the first 100 m;near the confluence, the tributary channel flows througha constricted reach closely bounded by stepped cliffs,opening up in the following 100 m reach with anamphitheatre-like shape (Figs. 9 and 10). During floods,this very low energy backflooded environment favoursdeposition of very fine and fine sand, silt and even claysediments. The study of these slackwater flood depositsis complicated because the flood units are not stackedhorizontally and they do not form vertical arrangedbenches, such as in the El Puente del Arzobispo. Here, arounded-mound of flood deposits attached to the valley
slope was formed by the semiconcentric accretion ofsuccessive layered flood deposits. Several trenches weredug by hand at different parts of the 21 m-high flooddeposits in order to obtain the most complete strati-graphy possible. The best profile (A.2) (Fig. 11) shows atleast 16 flood units with subtle contacts between floodunits. Flood units range from 6 to 45 cm in thicknessand are composed of fining-upward sequences formedby the combination of one or more of the followingsubunits: very fine sand with parallel lamination,structureless silt, and clay textures affected by cracks.High bioturbation due to roots, annelids and arthro-pods is ubiquitous throughout the stratigraphicalprofile. The lower part of the profile was bracketed byradiocarbon ages of 990750 14C yr BP (flood unit 4;AD 980–1175) and 940740 14C yr BP (flood unit 6; AD1015–1205), and in the middle part a charcoal samplewas dated as 410740 14C yr BP (flood unit 8; AD 1445–1495). In a 1:8 m thick section located near the slope(profile A.1), at least four flood units (8–26 cm inthickness) were described, which are composed of siltand clay textures with very thin parallel laminationfrequently affected by bioturbation due to annelids andarthropods. These fine-grained flood deposits areseparated in some units by 15–50 cm thick colluvialunits composed of sand and scattered pebble-sized
ARTICLE IN PRESS
Fig. 10. Uptributary view of the slackwater flood deposits at Alc!antara. Arrows show the uppermost part of flood deposits which correspond to
minimum peak discharges of 11; 000 m3 s�1: A boat, 4 m in length, is circle for scale.
G. Benito et al. / Quaternary Science Reviews 22 (2003) 1737–17561750

fragments. Datable material was not found in thesection.
4.2. Discharge estimation
Ten cross-sections along a reach of 1400 m in lengthwere obtained by field survey using an EDM surveyorand an echosounder. These cross-sections were thenused in the HEC-RAS model to estimate palaeoflooddischarges that were assumed to have involved sub-critical hydraulic flow. In order to reduce uncertaintiesduring the selection of the boundary conditions fordownstream cross-sections, 23 additional cross-sectionswere measured from topographic maps 1:5000 in scale(5 m contour intervals) along a reach of 5 km down-stream of the surveyed cross-sections. Discharges wereestimated for Manning’s n values between 0.03 over thevalley floor and 0.04 over the margins. For a 15%
variation in roughness value, an error of 3–5% wasintroduced in the discharge results. Uncertainties of upto 15% on the discharge results were introduced by theboundary conditions selected for the steady flowmodelling in the initial cross-section (most downstreamcross-section for subcritical flow). The model was runassuming critical flow conditions on the first cross-section located in the entrance to an extremely narrowreach 5 km downstream of the studied reach. However,it is possible that the hydraulic control section can belocated farther downstream within the Portuguese partof the Tagus River.
On the basis of calculated water-surface profiles alongthe study reach, the highest elevation for geologicalevidence of former floods (located in cross-section 9) isassociated with a minimum discharge of 15; 000 m3 s�1:The step-backwater calculations show a minimum peakdischarge for profile A.4 (cross-section 4; water depth of
ARTICLE IN PRESS
Fig. 11. Stratigraphic sections of the slackwater flood deposits in the Alc!antara gorge. Numbers on the left side of the profiles indicate individual
flood units/events. The location of the sections are illustrated in Fig. 9.
G. Benito et al. / Quaternary Science Reviews 22 (2003) 1737–1756 1751
30 m) of 12; 000 m3 s�1; indicating that at least 3–4floods over this magnitude occurred after AD 785–885.Other narrow flood deposit benches along thegorge provided minimum discharges of 13; 700 m3 s�1
(cross-section 7), 11; 200 m3 s�1 (cross-section 6), and10; 100 m3 s�1 (cross-section 5). The location of theseflood deposits along straight reaches of the gorge, andattached to its margins, is not the optimum for sedimentpreservation. Therefore, these deposits attached to thegorge margins are expected to be periodically flushedout by very extreme floods (occupying these margins aseffective flow areas) and replaced by sediments left bysmaller magnitude floods. These flood erosional–deposi-tional dynamics may explain the limited stratigraphyand the short-time framework covered by the flooddeposits at Alc!antara, compared to the long floodrecord found in the channel expansion environments ofEl Puente del Arzobispo where erosion by extremefloods is less likely.
During large floods, the rise in water stage of 30–36 m; as evidenced by the flood deposits, producedextensive backflooding of the tributaries affecting areasseveral hundred metres upstream of their junctions withthe Tagus River. In these backflooded environments, theslackwater conditions favour deposition of relativelycomplete flood histories such as in sites A.1 to A.3 (Figs.9 and 11). Here, the highest part of the slackwatersediments matches a water surface profile of11; 000 m3 s�1 (cross-section 8). Stratigraphic sectionA.2, comprising at least 16 flood units, is associated withminimum discharges of 4100 to 6000 m3 s�1 , with atleast four floods occurring after AD 980–1175, twofloods after AD 1015–1205, and nine floods after AD1445–1495. In the same tributary, Section A.1, with atleast four flood units, and Section A.3 with at least 11flood units, are associated with minimum discharges of5600 and 3400 m3 s�1; respectively.
The past flood record in this reach can be supple-mented using evidence associated with landmarks anddocuments connected with the Alc!antara Roman bridge,located ca 6 km upstream of the study reach. This bridgeis an impressive civil engineering work built in AD 103.The bridge is ca 200 m in length and 7 m in width withtwo central arches having respective openings of 28.8and 27:4 m in height, and supported by two lateralarches with openings of 21.9 and 13:8 m in height. InAlc!antara, the largest floods during the last 200 yearswere recorded in AD 1876, 1941, 1947 and 1856 inwhich the exact water stages are known. Application ofthese stages in the HEC-RAS model provides peakdischarge estimates of 14,800, 13,700, 11,800 and10; 500 m3 s�1; respectively (Benito et al., 2003b). TheHEC-RAS modelling was calibrated for the 1989 and1996 floods, using discharge data recorded in theAlc!antara dam and the water stages recorded in photosand videos at different times. Other important floods
occurred in 1912 and 1989 when estimated respectivepeak discharges were 3800 and 7500 m3 s�1:
We estimate that elevations for the highest flooddeposits represent minimum discharges approximated atabout 15; 000 m3 s�1; and were produced by the AD1876 flood and/or floods of similar magnitude. SectionA.4, with minimum discharge estimate of 12; 000 m3 s�1;may contain deposits from the AD 1876 and 1941floods. At least two more floods of this magnitudeoccurred since AD 785–885 according to the strati-graphic record. Since AD 1856, at least five floodsexceeded 6000 m3 s�1; which are probably included inthe upper part of Section A.2 where nine events post-dated AD 1445–1495. It is also possible that the numberof floods exceeding 6000 m3 s�1 of discharge for the last500 yr is greater than nine, but field exposures (afterdigging) were not complete enough to obtain a completestratigraphic record.
5. Discussion
Slackwater flood deposits along the Tagus Riverprovide an excellent record of more than 80 floods thathave occurred during the last 10; 000 yr: The palaeo-flood record shows that extreme floods are notrandomly spaced in time but tend to cluster duringspecific periods (Fig. 8). High-magnitude floods oc-curred on the Tagus River from 9440 to 9210 14C yr BP(8540–8110 BC), 8500 to 8000 14C yr BP (7500–7000BC), B6750 14C yr BP (B5000 BC; based on one dateonly), 1200 to 950 14C yr BP (AD 785–1205),B410 14C yr BP (AD 1450–1500, based on two dates),and 170 to 80 14C yr BP (AD 1670–1950). The largestflood(s) occurred from 9440 to 9210 14C yr BP,B6750 14C yr BP and 1200 to 950 14C yr BP whenminimum discharges during these periods are estimatedto lie between 4000 and 4100 m3 s�1 in the El Puente delArzobispo reach (central part of the catchment;35; 000 km2 in drainage area) and between 13,700 and15; 000 m3 s�1 in the Alc!antara reach (lower part of thecatchment, 52; 000 km2 in drainage area). In contrast,the periods 9210–8500 14C yr BP (8110–7500 BC), 8000–6750 14C yr BP (7000–5000 BC), and 950 to 410 14C yrBP (AD 1205–1450) are characterised by relatively fewlarge floods. Periods with few or no palaeoflood depositsdo not necessarily indicate a total absence of floods, butare probably times of lower magnitude, moderate floodsthat did not exceed the threshold of preservation in thedepositional sites (Ely, 1997). However, due to thepossibility of post-flood erosion, the lack of datingbetween 6750 14C yr BP and 1200 14C yr BP (5000 BC toAD 778) cannot be interpreted as a lack of occurrence oflarge floods during this period in the present study area.
Most of the precipitation and flooding in large Iberianriver basins, such as the Tagus River, is associated with
ARTICLE IN PRESSG. Benito et al. / Quaternary Science Reviews 22 (2003) 1737–17561752
zonal flow lying between 35� and 45�N: Generalfeatures of present-day atmospheric circulation wereprobably in existence by the mid- to late Holocene(Knox, 1983). Since flooding is an important source ofwater to natural systems, especially in the IberianPeninsula, periods with a higher frequency and/ormagnitude of floods usually coincide with otherindicators of climate/environmental change, such aspollen and lake level records.
Late Pleistocene and early Holocene atmosphericcirculation patterns were affected by changes leading tocombinations of dry/wet and cool/warm conditionssince the Last Glacial Maximum (LGM). During theYounger Dryas (about 8�C cooler than today), thelarge-scale atmospheric circulation regime was charac-terised by the predominance of a high-pressure cell atmiddle latitudes, which displaced storm tracks into verylow latitudes (Lamb, 1971). In northwestern Spain(Allen et al., 1996), pollen-based palaeoclimatic recon-structions indicate a dry and cool climate with strongseasonality from 14,600 to 12,400 14C yr BP and duringthe Younger Dryas (10,700–9800 14C yr BP). Lake levelsduring the Younger Dryas period were very low in theIberian Peninsula, with pollen assemblages characterisedby mesic trees indicating a cold and dry climate (Penalbaet al., 1997; Roca and Juli!a, 1997; Valero-Garc!es andKelts, 1997; Juli!a et al., 1998; Wansard et al., 1998).These cold and dry conditions could also affect the floodfrequency over the Iberian Atlantic basins, and it mayexplain the lack of palaeoflood record in the TagusRiver during this period.
The climatic changes experienced immediately afterthe Younger Dryas period are well represented in thepalaeoflood record with an anomalous number of verylarge floods, at least 12 floods in B400 yr; from 9440 to9210 14C yr BP (BC 8540 to 8110; Fig. 8). Because of thelarge size of the river catchment (ca 35,000 and52; 000 km2), years with occurrence of extreme floodsare usually related to anomalously wetter conditions.This flood period can be interpreted as related towesterly dominated hemispheric circulation with theAzores High at lower latitudes and a low index zonalcirculation over the Atlantic. In Banyoles and Salineslakes in NE Spain, periods of increased rainfall andwater balance have been correlated with the B^lling-Aller^d and Preboreal periods (Roca and Juli!a, 1997;Juli!a et al., 1998; Valero-Garc!es et al., 1998; Wansardet al., 1998). Lake level record and pollen analysis ofLaguna Comprida (Serra de Estrela, Portugal) showedwetter conditions in the Preboreal suggesting an increasein winter precipitation in the Atlantic side of the IberianPeninsula (Van der Brink and Janssen, 1985; Van derKnaap and van Leeuwen, 1995).
The clusters of moderate floods from 8500 to 800014C yr BP (BC 7600–7000) coincide with high lake leveland forest development in the Iberian Peninsula and
Morocco (Fig. 8). In the Tigalmamine Lake, in theMiddle Atlas, Lamb et al. (1989) describe a markedenvironmental change due to increased available moist-ure at about 8500 yr 14C BP, interpreted from lakewater level rise, isotopic evidence for climatic change,and a rise in the percentage of cedar pollen. In Morocco,precipitation patterns are also associated with frontalsystems entering from the Atlantic, although thepersistence and intensity of these patterns depends onthe latitudinal location of the zonal flow. A pollenrecord from Padul in southeast Spain, showed anexpansion of sclerophyllous oak forest towards8000 14C yr BP which marks the onset of the hot andhumid Holocene optimum (Pons and Reille, 1988).
Unfortunately, the poor chronological control of themiddle and late Holocene palaeoflood record preventsinferences to be made regarding the responses of floodsto climate change for some periods. One flood unitdated as 6740 14C yr BP (BC 5055–4900) is not enoughto indicate a flood period at that time. At a global scale,the most prominent Holocene climatic event recognisedin the Greenland ice-core climate proxies, with approxi-mately half the amplitude of the Younger Dryas,occurred ca 7500 14C yr BP (8000–8400 calendar yearsBP; Alley et al., 1997). There is no evidence of extremefloods during these dry periods in the Tagus River.
One of the most important changes in the pattern ofthe Mediterranean and North African climatic circula-tion was recorded at 4000 BP, although the effects ofthese changes varied with the region. In the MiddleAtlas, Lamb et al. (1989) interpreted the arrival of cedarat 4000 14C yr BP as indicating an increase in moisture,whereas palynological records from Tunisia (Ritchie,1984), SE-Spain (Pons and Reille, 1988), and southernEurope (Huntley and Birks, 1983) have been interpretedas a return to dry conditions. These dry conditions seemto prevail throughout the late Holocene in the Ebrovalley (Davis, 1994; Valero-Garc!es et al., 2000). Anotherchange affecting the late Holocene palaeohydrology isthe extensive deforestation produced after 2500 yr BP(Burjachs et al., 1997; Ruiz-Zapata, 1999). This vegeta-tion change may affect the flood peak hydrograph withan increase in the peak discharges, although floodoccurrence would be still controlled by the persistence ofthe frontal systems over the Peninsula and by theamount of the rainfall. Indeed, there is evidence of largefloods during the last 3000 yr reaching peak dischargesof similar order of magnitude to the Preboreal floods,although the chronological limitations do not allow forfurther precision until the last 1500 yr:
The frequency and magnitude of floods increasedagain between 1200 and 950 14C yr BP (AD 785–1205;Fig. 8). This palaeoflood evidence is corroborated bydocumentary sources of historical floods, especiallybetween AD 1150 and 1200 (Benito et al., 1996,2003b). A sharp decrease in the frequency and
ARTICLE IN PRESSG. Benito et al. / Quaternary Science Reviews 22 (2003) 1737–1756 1753
magnitude of palaeofloods from 950–410 14C yr BP (AD1205–1450) may have some relationship to the climaticsignals prevailing in the western Mediterranean at theend of the Medieval Warm Period, although the onsetand termination of this period is still in debate (Hughesand D!ıaz, 1994).
For the last 500 yr; the palaeoflood record shows anincrease in frequency between AD 1650 and 1900 (170and 80 14C yr BP). This increase coincides with glacialadvances, high lake levels, and cooler and/or wetterconditions at many sites around the globe during somedecades or all of the Little Ice Age (15th to mid-19thcenturies; Porter, 1986, Grove, 1988). During the15–16th centuries, increases in lake levels and generalwater table rise in the central Ebro valley have beinterpreted as the result of increased precipitation andlower evaporation (Valero-Garc!es et al., 2000), probablyrelated to the climatic conditions that prevailed duringsome periods of the Little Ice Age. Palaeofloodchronologies and historical flood records indicate ananomalous concentration of floods during the secondhalf of the 19th century and first-half of the 20thcentury, a period that also contains the largest floodsduring the last 750 yr:
Long-term palaeoflood records using slackwater flooddeposits are not available in Europe. In Central Europe,phases of a higher flood frequency are found fromoverbank flood deposit records at about 8500–7700,6500–6000, 5200–4400, 3000–2600, 2200–1800, 1000 and400–100 yr BP (Starkel, 1991). The timing of at leastthree of these periods roughly coincides with those ofthis study. In the Negev Desert of Israel, Greenbaumet al. (2000) identified in a palaeoflood record twoperiods of higher frequency of large floods (1380–880 yrBP and the last 60 yr) correlated with high Dead Sealevels and wetter climate conditions, and two periodswith low flood frequency (1730–1380 yr BP and880–60 yr BP), which were correlated to low Dead Sealevels and may be linked to a drier climate conditions.Although these patterns are also found in the studiedsites, a higher variability in the flood clusters is recordedin the Tagus River palaeoflood and historical floodrecords probably due to the type of flood-generatingevents.
Several analyses of late Holocene flood chronologieshave been undertaken in the semiarid southwesternUnited States (Ely and Baker, 1985; Webb et al., 1988;Enzel, 1992; Ely et al., 1993; O’Connor et al., 1994; Ely,1997) and in the Upper Mississippi Valley (Knox, 1985,1993, 1999). Most of the southwestern United Stateschronologies have been reconstructed from slackwaterflood deposits. In a regional synthesis, Ely (1997)observed that the frequency of large floods increasedthroughout the region from 5000 to 3600 14C yr BP(3800–2200 BC) and increased again after 2200 14C yrBP (400 BC) with a maximum in magnitude and
frequency of around AD 900–1100, and after AD1400. In the SW United States, most of the severecurrent floods are associated with winter storms andtropical cyclones, and these are the most probablecauses of the palaeofloods over the last 5000 yr (Elyet al., 1993; Ely, 1997). Despite the differences in theflood-producing storms and geographical settings, thelatter two periods (AD 900–1100 and AD 1400) arecoincident with the most recent palaeoflood periodsrecorded in the Tagus River. In the Upper MississippiValley and using an excellent record of overbank flooddeposits, Knox (1993) describes periods of small floodsfrom 5000 to 3300 cal yr BP (3050–1350 BC), andperiods of average increased flood magnitudes after3300 cal yr BP, and even larger floods from AD 1250 to1450 at the end of the Medieval Warm Period.Comparison of these flood periods with the Tagus riverrecord is difficult due to the lack of chronologiesbetween 6000 and 1500 yr BP. In the case of the AD1250–1450 flood period the flood signal is opposite fromthe pattern found in the Tagus River, where there is noevidence of a large number of exceptional floods.
6. Conclusions
The palaeoflood record of the Tagus River during theLate Pleistocene and Holocene shows non-randomoccurrence of large floods whose recurrence frequenciesappear to be associated with regional climatic/environ-mental changes as interpreted from lake level variationsand pollen records. The largest flood(s) occurred from9440 to 9210 14C yr BP (BC 8540–8110), B6750 14C yrBP (BC 5000) and 1200 to 950 14C yr BP (785–1205)and reached estimated minimum discharge magnitudesof between 4000 and 4100 m3 s�1 in the El Puentedel Arzobispo reach (Central part of the catchment;35; 000 km2 in drainage area) and 13,700–15; 000 m3 s�1
in the Alc!antara reach (lower part of the catchment,52; 000 km2 in drainage area). High frequency-lowermagnitude floods were recorded in the Tagus River from8500 to 8000 14C yr BP (7500–7000 BC), B410 14C yrBP (AD 1450–1500), 170 to 80 14C yr BP (AD 1670–1950). The largest floods in the last 750 yr occurredduring the second-half of the 19th century and first-halfof the 20th century. In contrast, the periods 9210–850014C yr BP (8110–7500 BC), 8000–6750 14C yr BP (7000–5000 BC), and 950–410 14C yr BP (AD 1205–1450) arecharacterised by decreases in the record of large floods.
These periods with increased flood magnitude and/orfrequency in the Tagus River are strongly related toincreased moisture influx and winter precipitation in theIberian Peninsula. Proxy records sensitive to winterprecipitation such as lake levels and vegetation (throughpollen records) are in good agreement with the clustersof floods found in the Tagus River, although floods may
ARTICLE IN PRESSG. Benito et al. / Quaternary Science Reviews 22 (2003) 1737–17561754
respond faster to a change in rainfall than lake levels orvegetation.
Tagus River palaeoflood periods coincide with someflood clusters found in various regions of the globe suchas central Europe, Israel and SW United States, or withlow flood frequency periods of regions such as the upperMississippi valley. This suggests that alterations in theglobal-scale climate system produce changes in floodregime although signals in terms of magnitude andfrequency may vary between regions (Knox, 1993, 2000;Ely, 1997). Further palaeoflood studies and moredetailed palaeoflood chronologies are required toprovide an important source of information on theimmediate hydrological response, at the event scale, toglobal changes in the atmospheric circulation patterns.
Acknowledgements
This research was supported by the Spanish Commit-tee for Science and Technology (CICYT) grant HID99-0850, FEDER Project 1FD97-2110-CO2-02, and by deEuropean Commission (DG XII), through researchcontract number EVG1-CT-1999-00010 (Systematic,Palaeoflood and Historical data for the improvEmentof flood Risk Estimation, ‘‘SPHERE’’ Project). Wewish to thank Tomas Mart!ın-Arroyo and BlancaRu!ız-Zapata for the pollen analysis, to David Uribe-larrea del Val, Mayte Rico, Alfonso Benito Calvo,Mar!ıa Fern!andez de Villalta, and Satur de Alba for theirhelp in the field and to Varyl R. Thorndycraft for hishelp with the English. Helpful manuscript reviews wereprovided by Jim Knox, Pete Coxon and Jim Rose.
References
Allen, J.R., Huntley, B., Watts, W.A., 1996. The vegetation and
climate of north-west Iberia over the last 14; 000 yr: Journal ofQuaternary Science 11, 125–147.
Alley, R.B., Mayewski, P.A., Sowers, T., Stuiver, M., Taylor, K.C.,
Clark, P.U., 1997. Holocene climatic instability: a prominent,
widespread event 8200 yr ago. Geology 25, 483–486.
Baker, V.R., 1973. Paleohydrology and sedimentology of Lake
Missoula flooding in eastern Washington, Geological Society of
America. Special Paper 144, 79pp.
Baker, V.R., 1987. Paleloflood hydrology and extraordinary flood
events. Journal of Hydrology 96, 79–99.
Baker, V.R., 1989. Magnitude and frequency of paleofloods. In:
Beven, K., Carling, P. (Eds.), Floods: Hydrological, Sedimentolo-
gical, and Geomorphological Implications. Wiley, Chichester,
pp. 171–183.
Baker, V.R., Kochel, R.C., Patton, P.C., Pickup, G., 1983. Palaeo-
hydrologic analysis of Holocene flood slack-water sediment.
Special Publication of the International Association of Sedimen-
tologists 6, 229–239.
Barriendos, M., Mart!ın-Vide, J., 1998. Secular climatic oscillations as
indicated by catastrophic floods in the Spanish Mediterranean
Coastal Area (14–19th Centuries). Climatic Change 38, 473–491.
Benito, G., Machado, M.J., P!erez-Gonz!alez, A., 1996. Climate change
and flood sensitivity in Spain. In: Branson, J., Brown, A.G.,
Gregory, K.J. (Eds.), Global Continental Changes: The Context of
Palaeohydrology. Geological Society of London Special Publica-
tion No. 115, pp. 85–98.
Benito, G., Machado, M.J., P!erez-Gonz!alez, A., Sopena, A., 1998.
Palaeoflood hydrology of the Tagus River, Central Spain. In:
Benito, G., Baker, V.R., Gregory, K.J. (Eds.), Palaeohydrology
and Environmental Change. Wiley, London, pp. 317–333.
Benito, G., S!anchez-Moya, Y., Sopena, A., 2003a. Sedimentology of
high-stage flood deposits of the Tagus River, Central Spain.
Sedimentary Geology 157, 107–132.
Benito, G., D!ıez-Herrero, A., Fern!andez de Villalta, M., 2003b.
Magnitude and frequency of flooding in the Tagus Basin (Central
Spain) over the last millennium. Climatic Change 58, 171–192.
Bretz, J.H., 1929. Valley deposits immediately east of the Channeled
Scabland of Washington. Journal of Geology 37, 393–427,
505–541.
Burjachs-Casas, F., Guiralt, S., Roca, J.R., Seret, G., Juli!a, R., 1997.
Palinolog!ıa Holoc!enica y Desertizaci !on en el Mediterr!aneo
Occidental. In: Ib!anez, J.J., Valero-Garc!es, B.L., Machado, C.
(Eds.), El paisaje mediterr!aneo a trav!es del espacio y del tiempo.
Implicaciones en la desertificaci!on. Geoforma Ediciones, Logrono,
pp. 379–394.
Capel, J., 1981. Los Climas de Espana. Col. Ciencias Geogr!aficas.
Oikos-Tau, Barcelona, 429pp.
Davis, B.A.S., 1994. Paleolimnology and Holocene environmental
change from endorheic lakes in the Ebro Basin, north-east Spain.
Ph.D. Thesis, University of Newcastle Upon Tyne, 317pp.
Ely, L.L., 1997. Response of extreme floods in the southwestern
United States to climatic variations in the late Holocene.
Geomorphology 19, 175–201.
Ely, L.L., Baker, V.R., 1985. Reconstructing Paleoflood hydrology
with Slackwater deposits: Verde River, Arizona. Physical Geo-
graphy 6, 103–126.
Ely, L.L., Enzel, Y., Baker, V.R., Cayan, D.R., 1993. A 5000-year
record of extreme floods and climate change in the southwestern
United States. Science 262, 410–412.
Enzel, Y., 1992. Flood frequency of the Mojave River and the
formation of late Holocene playa lakes, southern California, USA.
Holocene 2, 11–18.
Greenbaum, N., Schick, A.P., Baker, V.R., 2000. The palaeoflood
record of a Hyperarid catchment, Nahal Zin, Negev Desert, Israel.
Earth Surface Processes and Landforms 25, 951–971.
Grove, J.M., 1988. The Little Ice Age. Routledge, London.
Hirschboeck, K.K., 1991. Climate and floods. US Geological Survey
Water Supply Paper 2375, pp. 67–88.
House, P.K., Pearthree, P.A., Klawon, J.E., 2002. Historical flood and
paleoflood chronology of the lower Verde River, Arizona:
stratigraphical evidence and related uncertainties. In: House,
P.K., Webb, R.H., Baker, V.R., Levish, D.R. (Eds.), Ancient
Floods, Modern Hazards: Principles and Applications of Paleo-
flood Hydrology. Water Science and Application 5, American
Geophysical Union, Washington DC, pp. 267–293.
Hughes, K.M., D!ıaz, H.F., 1994. Was there a medieval warm period,
and if so, where and when? In: Hughes, M.K., D!ıaz H.F. (Eds.),
The Medieval Warm Period. Kluwer Academic Publishers.
Dordrecht, The Netherlands, 342pp.
Huntley, B., Birks, H., 1983. An Atlas of Past and Present Pollen Maps
for Europe: 0–13,000 Years Ago. Cambridge University Press,
Cambridge, 667pp.
Hydrologic Engineering Center 1995. HEC-RAS, River Analysis
System, Hydraulics Reference Manual, (CPD-69). Davis,
California.
IPCC, 1996. Climate change 1995: impacts, adaptations, and mitiga-
tion of climate change: scientific-technical analyses. In: Watson,
ARTICLE IN PRESSG. Benito et al. / Quaternary Science Reviews 22 (2003) 1737–1756 1755
R.T., Zinyowera, M.C., Moss, R.H. (Eds.), Contribution of
Working Group II to the Second Assessment Report of the
Intergovernmental Panel on Climate Change. Cambridge Uni-
versity Press, Cambridge, UK, New York, NY, USA, 880pp.
IPCC, 2001. Climate change 2001: impacts, adaptation and vulner-
ability. In: McCarthy, J.J., Canziani, O.F., Leary, N.A., Dokken
D.J., White, K.S. (Eds.), Contribution of Working Group II to the
Third Assessment Report of IPCC. Cambridge University Press,
Cambridge, UK, New York, NY, USA, 1000pp.
Juli!a, R., Guiralt, S., Burjachs, F., Roca, J.R., Wansard, G., 1998.
Short climate events in the Mediterranean Iberian Peninsula during
the Lateglacial and the Early Holocene transition. Terra Nostra 98
(6), 65–69.
Knox, J.C., 1983. Responses of river systems to Holocene climates. In:
Wright, Jr. H.E. (Ed.), Late-Quaternary Environments of the
United States, Vol. 2. University of Minnesota Press, Minneapolis,
pp. 26–41.
Knox, J.C., 1985. Responses of floods to Holocene climatic change in
the upper Mississippi Valley. Quaternary Research 23, 287–300.
Knox, J.C., 1993. Large increases in flood magnitude in response to
modest changes in climate. Nature 361, 430–432.
Knox, J.C., 1999. Long-term episodic changes in magnitudes and
frequencies of floods in the upper Mississippi River Valley. In:
Brown, G.A., Quine, T.A. (Eds.), Fluvial Processes and Environ-
mental Change. Wiley, New York, pp. 255–282.
Knox, J.C., 2000. Sensitivity of modern and Holocene floods to
climate change. Quaternary Science Reviews 19, 439–457.
Kochel, R.C., Baker, V.R., Patton, P.C., 1982. Paleohydrology of
Southwestern Texas. Water Resources Research 18, 1165–1183.
Lamb, H.F., Eicher, U., Switsur, V.R., 1989. An 18,000-year record of
vegetational, lake level and climate change from the Middle Atlas,
Morocco. Journal of Biogeography 16, 65–74.
Lamb, H.H., 1971. Climates and circulation regimes developed over
the northern hemisphere during and since the Last Ice Age.
Palaeogeography, Palaeoclimatology, Paleoecology 10, 125–162.
Mart!ın-Arroyo, T., Ruiz-Zapata, M.B., 1996. Pollinic diagram of El
Puente del Arzobispo slackwater flood deposits. In: Benito, G.,
P!erez-Gonz!alez, A., Machado, M.J., de Alba, S. (Eds.), Palaeo-
hydrology and Modelling of Environmental Change. Second
International Meeting on Global Continental Palaeohydrology.
INQUA, Toledo, pp. 17–18.
Mart!ın-Arroyo, T., Ruiz-Zapata, M.B., P!erez-Gonz!alez, A., Valdeol-
millos, A., Dorado Valino, M., Benito, G., Gil Garc!ıa, M.J., 1999.
Paleoclima y paleoambiente durante el Pleistoceno Superior y el
Tardiglaciar en la regi !on central peninsular. In: Palli Bux !o, L.,
Roqu!e Pau, C. (Eds.), Avances en el estudio del Cuaternario
Espanol, Girona, pp. 317–324.
O’Connor, J.E., Ely, L.L., Wohl, E.E., Stevens, L.E., Meli, T.S., Kale,
V.S., Baker, V.R., 1994. 4000-year record of large floods on
the Colorado River in the Grand Canyon. Journal of Geology 102,
1–9.
Onate, J.J., Pou, A., 1996. Temperature variations in Spain since 1901:
a preliminary analysis. International Journal of Climatology 16,
805–815.
Patton, P.C., Baker, V.R., Kochel, R.C., 1979. Slack-water deposits: a
geomorphic technique for the interpretation of fluvial paleo-
hydrology. In: Rhodes, D.D., Williams, G.P. (Eds.), Adjustments
of the Fluvial System. Kendall Hunt Publ. Co., Dubuque, IA,
pp. 225–252.
Penalba, M.C., Arnold, M., Guiot, J., Duplessy, J.C., de Beaulieu,
J.L., 1997. Termination of the Last Glaciation in the Iberian
Peninsula inferred from the pollen sequence of Quintanar de la
Sierra. Quaternary Research 48, 205–214.
P!erez Obiol, R., Juli!a, R., 1994. Climatic change on the Iberian
Peninsula recorded in a 30,000-yr pollen record from Lake
Banyoles. Quaternary Research 41, 91–98.
Pickup, G., Allan, G., Baker, V.R., 1988. History, palaeochannels and
palaeofloods of the Finke river, Central Australia. In: Warner,
R.F. (Ed.), Fluvial Geomorphology of Australia. Academic Press,
Australia, pp. 177–200.
Pons, A., Reille, M., 1988. The Holocene-and Upper Pleistocene pollen
record from Padul (Granada, Spain): a new study. Palaeogeogra-
phy, Palaeoclimatology, Palaeoecology 66, 243–263.
Porter, S.C., 1986. Pattern and forcing of Northern Hemisphere glacier
variations during the LastMillennium. Quaternary Research 28, 27–48.
Ritchie, J.C., 1984. Analyse pollinique de s!ediments Holoc!enes
sup!erieurs des hauts plateaux du Maghreb Oriental. Pollen et
Spores 26, 489–496.
Ruiz-Zapata, B., 1999. El Cambio Clim!atico en la Pen!ınsula Ib!erica.
In: Ruiz-Zapata, B., Dorado, M., Gil, M.J., Valdeolmillos, A.
(Eds.), Efectos del Cambio Clim!atico en la Regi !on Mediterr!anea
durante los !ultimos 3000 anos. Universidad de Alcal!a de Henares,
Madrid, pp. 86–95.
Roca, J.R., Juli!a, R., 1997. Late glacial and holocene climatic changes
and desertification expansion based on biota content in the Salines
sequence, Southeastern Spain. Geobios 30, 823–830.
Starkel, L., 1991. Fluvial environments as a source of information on
climatic changes and human impact in Europe. In: Frenzel, B.,
Pons, A., Gl.aser, B. (Eds.), Evaluation of Climate Proxy Data in
Relation to the European Holocene. G. Fischer Verlag, Stuttgart,
pp. 241–254.
Stuiver, M., Reimer, P.J., 1993. Extended 14C database and revised
CALIB radiocarbon. Radiocarbon 35, 215–230.
Valero-Garc!es, B., Kelts, K.R., 1997. Desertificaci !on y Cambio Global
en la Pen!ınsula Ib!erica durante el !ultimo ciclo glacial a partir de
registros lacustres. In: Ib!anez, J.J., Valero-Garc!es, B.L., Machado,
C. (Eds.), El paisaje mediterr!aneo a trav!es del espacio y del tiempo.
Implicaciones en la desertificaci!on. Geoforma Ediciones, Logrono,
pp. 419–437.
Valero-Garc!es, B., Zeroual, E., Kelts, K., 1998. Arid Phases in the
western Mediterranean region during the Last Glacial Cycle
reconstructed from lacustrine records. In: Benito, G., Baker,
V.R., Gregory, K.J. (Eds.), Palaeohydrology and Environmental
Change. Wiley, London, pp. 67–80.
Valero-Garc!es, B.L., Gonz!alez-Samp!eriz, P., Delgado-Huertas, A.,
Navas, A., Mach!ın, J., Kelts, K., 2000. Lateglacial and Late
Holocene environmental and vegetational change in Salada
Mediana, central Ebro Basin, Spain. Quaternary International
73/74, 29–46.
Van der Brink, L.M., Janssen, C.R., 1985. The effects of human
activities during cultural phases on the development of montane
vegetation in the Serra de Estrela, Portugal. Review of Paleobotany
and Palynology 44, 193–215.
Van der Knaap, W.O., van Leeuwen, J.F.N., 1995. Holocene
vegetation succession and degradation as responses to climatic
change and human activity in the Serra de Estrela, Portugal.
Review of Paleobotany and Palynology, 153–211.
Wansard, G., Juli!a, R., Roca, J.R., Riera, S., Seret, G., 1998. The last
2000 years-environmental change of Lake Estanya (NE Spain)
based on mineralogy, ostracod fauna and trace-element shell
chemistry. Terra Nostra 98, 132–136.
Webb, R.H., O’Connor, J.E., Baker, V.R., 1988. Paleohydrologic
reconstruction of flood frequency on the Escalante River. In:
Baker, V.R., Kochel, R.C., Patton, P.C. (Eds.), Flood Geomor-
phology. Wiley, New York, pp. 403–418.
Yang, D., Yu, G., Xie, Y., Zhan, D., Zhijia, L., 2000. Sedimentary
records of large Holocene floods from the middle reaches of the
Yellow River, China. Geomorphology 33, 73–88.
Zeroual, E., 1995. Enregistrements climatiques dans les sediments du
Lac Isli (Haut Atlas du Maroc). Variations des influences
climatiques sahariennes et mediterran!eennes (de 34000 ans BP a
nos jours). Ph.D. Thesis, University of Neuchatel, Switzerland.
ARTICLE IN PRESSG. Benito et al. / Quaternary Science Reviews 22 (2003) 1737–17561756
Copyright © 2022 FDOKUMEN