Latest Pleistocene and Holocene dune construction at the north-eastern edge of the Rub Al Khali,...
11
Latest Pleistocene and Holocene dune construction at the north-eastern edge of the Rub Al Khali, United Arab Emirates ANDREW S. GOUDIE*, ALISON COLLS*, STEPHEN STOKES*, ADRIAN PARKER , KEVIN WHITE à and ASMA AL-FARRAJ§ *University of Oxford, School of Geography and the Environment, Mansfield Road, Oxford OX1 3TB, UK (E-mail: [email protected]) Oxford Brookes University, Geography Department, Gipsy Lane, Oxford OX3 0BP, UK àUniversity of Reading, Department of Geography, Whiteknights, Reading RG 6 6AB, UK §University of the United Arab Emirates, Department of Geography, PO Box 17551, Al Ain, United Arab Emirates ABSTRACT Optical dating of two dune profiles developed in linear dunes in Ras Al Khaimah, United Arab Emirates, has been used to establish the timing and rate of dune accretion. One section at Awafi was over 17 m high, while that at Idhn was over 40 m high. The Awafi dune appears to have accumulated very rapidly »10 000 years ago, with a vertical accumulation rate of about 3Æ3 m ka )1 . The Idhn dune appears to have accumulated over the past 1000 years, with 20 m of sediment accumulating in a time period of about 270 years. The Awafi dune may have accumulated in response to the transgression of the Persian Gulf by rising sea levels in late Pleistocene and Holocene times. The Idhn dune may have accumulated rapidly because of intensified human activity, a short-lived climatic event, or because it may periodically be reactivated after erosion by fluvial action at its base. Keywords Linear dune, optical dating, Rub Al-Khali, sand accumulation. INTRODUCTION There remains some uncertainty surrounding the style and timing of deposition of large aeolian dunes, with authors supporting both gradual and punctuated models of dune development (for a discussion, see Thomas, 1997). This divergence of opinion results from both the general absence of dating control within dunes in most studies, and difficulties in gaining exposures within some of the larger dune bedforms. The purpose of this paper is to establish a chronology of dune development for two thick (>10 m) dune sections excavated within large, complex, linear dunes from within the Rub Al Khali, near Ras Al Khaimah, in the north of the United Arab Emirates (Fig. 1). The sites were selected because of the availability of thick, fresh sections in recently excavated moist sand. With an area of around 600 000 km 2 , the Rub Al Khali is the largest active sand sea in the world (Besler, 1982) and possesses many aeolian bed- form types including linear, transverse, crescentic and star dunes. Within the United Arab Emirates sector of the Rub Al Khali, linear bedforms are predominant (National Atlas of the United Arab Emirates, 1993, plate 36). Plots of the main dune patterns within the United Arab Emirates portion of the Rub Al Khali (Fig. 2) show that the dunes in Ras Al Khaimah may largely be categorized as ‘branching parallel linear’ forms, following the classification of Embabi (1991). Their sedimentology has been discussed by El-Sayed (1999). The dunes are predominantly red and quartzitic, but contain secondary amounts of carbonate (either as calcite or dolomite). The quartz grains are subrounded to subangular in shape, have a unimodal size distribution, are moderately to very well sorted and are positively skewed and mesokurtic. The heavy mineral content indicates that the sands are mostly derived from the ultrabasic rocks Sedimentology (2000) 47, 1011–1021 Ó 2000 International Association of Sedimentologists 1011
-
Upload
oxfordbrookes -
Category
Documents
-
view
1 -
download
0
Transcript of Latest Pleistocene and Holocene dune construction at the north-eastern edge of the Rub Al Khali,...
Latest Pleistocene and Holocene dune construction at thenorth-eastern edge of the Rub Al Khali, United Arab Emirates
ANDREW S. GOUDIE*, ALISON COLLS*, STEPHEN STOKES*, ADRIAN PARKER , KEVINWHITEà and ASMA AL-FARRAJ§*University of Oxford, School of Geography and the Environment, Mans®eld Road, Oxford OX1 3TB, UK(E-mail: [email protected]) Oxford Brookes University, Geography Department, Gipsy Lane, Oxford OX3 0BP, UKàUniversity of Reading, Department of Geography, Whiteknights, Reading RG 6 6AB, UK§University of the United Arab Emirates, Department of Geography, PO Box 17551, Al Ain,United Arab Emirates
ABSTRACT
Optical dating of two dune pro®les developed in linear dunes in Ras Al
Khaimah, United Arab Emirates, has been used to establish the timing and rate
of dune accretion. One section at Awa® was over 17 m high, while that at Idhn
was over 40 m high. The Awa® dune appears to have accumulated very rapidly
»10 000 years ago, with a vertical accumulation rate of about 3á3 m ka)1. The
Idhn dune appears to have accumulated over the past 1000 years, with 20 m of
sediment accumulating in a time period of about 270 years. The Awa® dune
may have accumulated in response to the transgression of the Persian Gulf by
rising sea levels in late Pleistocene and Holocene times. The Idhn dune may
have accumulated rapidly because of intensi®ed human activity, a short-lived
climatic event, or because it may periodically be reactivated after erosion by
¯uvial action at its base.
Keywords Linear dune, optical dating, Rub Al-Khali, sand accumulation.
INTRODUCTION
There remains some uncertainty surrounding thestyle and timing of deposition of large aeoliandunes, with authors supporting both gradual andpunctuated models of dune development (for adiscussion, see Thomas, 1997). This divergence ofopinion results from both the general absence ofdating control within dunes in most studies, anddif®culties in gaining exposures within some ofthe larger dune bedforms. The purpose of thispaper is to establish a chronology of dunedevelopment for two thick (>10 m) dune sectionsexcavated within large, complex, linear dunesfrom within the Rub Al Khali, near Ras AlKhaimah, in the north of the United ArabEmirates (Fig. 1). The sites were selected becauseof the availability of thick, fresh sections inrecently excavated moist sand.
With an area of around 600 000 km2, the RubAl Khali is the largest active sand sea in the world
(Besler, 1982) and possesses many aeolian bed-form types including linear, transverse, crescenticand star dunes. Within the United Arab Emiratessector of the Rub Al Khali, linear bedforms arepredominant (National Atlas of the United ArabEmirates, 1993, plate 36).
Plots of the main dune patterns within theUnited Arab Emirates portion of the Rub Al Khali(Fig. 2) show that the dunes in Ras Al Khaimahmay largely be categorized as `branching parallellinear' forms, following the classi®cation ofEmbabi (1991). Their sedimentology has beendiscussed by El-Sayed (1999). The dunes arepredominantly red and quartzitic, but containsecondary amounts of carbonate (either as calciteor dolomite). The quartz grains are subrounded tosubangular in shape, have a unimodal sizedistribution, are moderately to very well sortedand are positively skewed and mesokurtic. Theheavy mineral content indicates that the sandsare mostly derived from the ultrabasic rocks
Sedimentology (2000) 47, 1011±1021
Ó 2000 International Association of Sedimentologists 1011
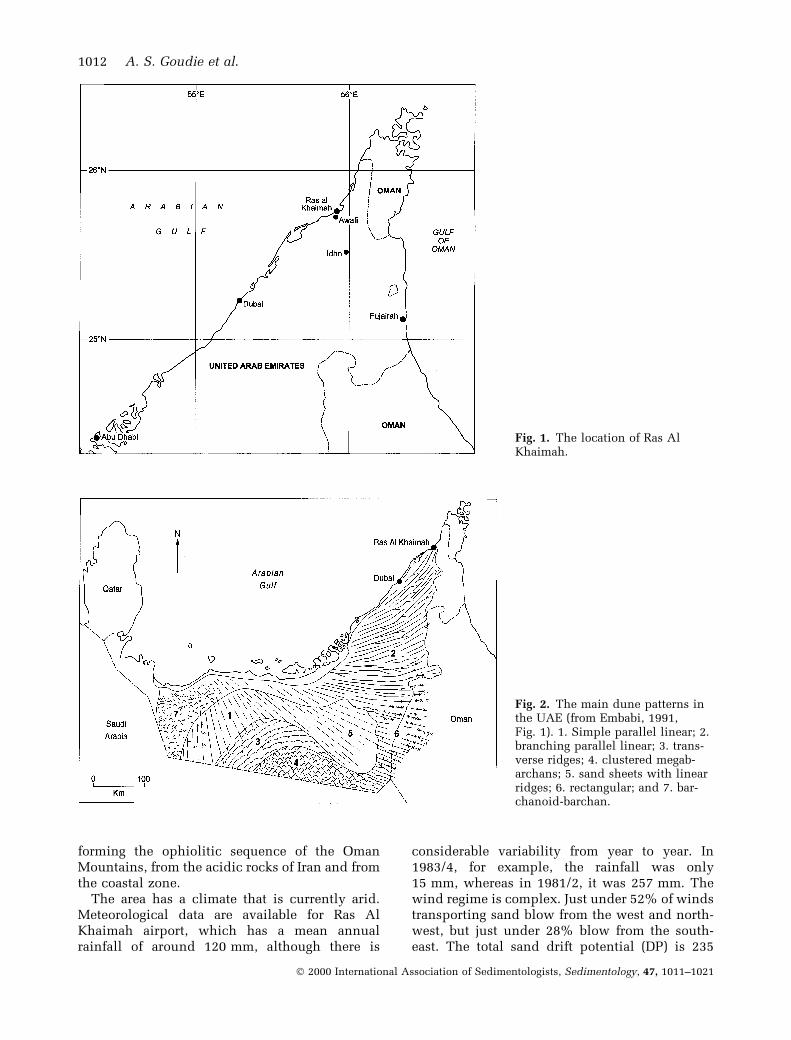
forming the ophiolitic sequence of the OmanMountains, from the acidic rocks of Iran and fromthe coastal zone.
The area has a climate that is currently arid.Meteorological data are available for Ras AlKhaimah airport, which has a mean annualrainfall of around 120 mm, although there is
considerable variability from year to year. In1983/4, for example, the rainfall was only15 mm, whereas in 1981/2, it was 257 mm. Thewind regime is complex. Just under 52% of windstransporting sand blow from the west and north-west, but just under 28% blow from the south-east. The total sand drift potential (DP) is 235
Fig. 1. The location of Ras AlKhaimah.
Fig. 2. The main dune patterns inthe UAE (from Embabi, 1991,Fig. 1). 1. Simple parallel linear; 2.branching parallel linear; 3. trans-verse ridges; 4. clustered megab-archans; 5. sand sheets with linearridges; 6. rectangular; and 7. bar-chanoid-barchan.
1012 A. S. Goudie et al.
Ó 2000 International Association of Sedimentologists, Sedimentology, 47, 1011±1021

vector units, which makes it an intermediatewind energy environment under the scheme ofFryberger (1979).
The dunes at the study sites of Idhn and Awa®(Fig. 1) have a modest vegetation cover dominat-ed by Hammada elegans, Comulaca monacantha,Cyperus conglomeratus and Pennisetum divisum.Occasional trees and shrubs include Prosopiscinerea, Tamarix sp. and Calotropis procera.
Morphology of the dunes
The morphology and origin of the dunes of Ras AlKhaimah is both complex and controversial.Using LANDSAT and other remote sensing ima-gery, Breed et al. (1979) described them as `com-pound feathered linear dunes', while Besler(1982) suggests that they are longitudinal dunesshaped under a former wind regime and nowbeing reshaped by transverse winds. Glennie(1996, ®g. 2.9) maps these dunes as de¯atedlinear megadunes, formed initially by windsblowing from SW to NE. Under current windconditions, however, the megadunes are more orless transverse to the NW `shamal' (the local namefor high-velocity winds from that quarter), so thatthe linear megaridges (Fig. 3) are overlain bysecondary patterns. At Awa®, the secondary dunepattern consists of branching linear dunes withtuning fork junctions, which are oriented NW toSE. At Idhn, the secondary dune pattern has a`®sh-scale' type of planform. The sampling ofdunes was undertaken through cores of theprimary linear megadunes.
Previous dating of Rub Al Khali dunes
Only a very limited amount of work has beenundertaken previously in order to date the Rub AlKhali dunes. However, the sheer size of the sandsea and of some of its megadunes suggests thatthe erg must be of some considerable antiquity.Indeed, some of the dunes in the Oman regioncould date back to 180±150 ka (Glennie, 1996),and Juyal et al. (1998) refer to dates from theLiwa Oasis of 40±70 ka and 100±200 ka (Fig. 4).In addition to these mid-Pleistocene periods ofdune activity, latest Pleistocene development hasalso been inferred, and Juyal et al. (1998) havegiven three dates from Liwa of 12, 15 and 31 ka.Glennie (1998) suggests that the dune systems ofsouth-east Arabia were widely active at the timeof the last glacial maximum (LGM) and may havebeen stabilized by vegetation in Early to mid-Holocene times because of increased rainfall
(McClure, 1976; Burns et al. 1998; Jolly et al.,1998). Glennie (1998) argues that widespreaddune formation preceded this stabilization andwas characteristic of the Late Pleistocenebetween 22 and 11 ka. The National Atlas of theUnited Arab Emirates (1993, plate 36), alsosuggests that the megabarchans of the Liwa-AlBatin basin started to develop during the aridperiod of the Late Pleistocene, between 17 000and 9000 years BP.
Likewise, on the basis that dunes overlie asupposedly pluvial terrace of the Wadi Dhaid,dated to between 30 000 and 20 000 years ago,Dalongeville et al. (1991) suggested that the dunesformed mainly between 20 000 and 9000years ago. The broad correspondence betweeninferred dune accretion and the LGM is a patternthat has been suggested for large areas of theworld's deserts at that time (Sarnthein, 1978).
Fig. 3. Landsat image of the Ras Al Khaimah dune-®elds. The image is 24 km wide. a, Awa®; b, Idhn.
Rub Al Khali dunes 1013
Ó 2000 International Association of Sedimentologists, Sedimentology, 47, 1011±1021

However, it also needs to be remembered that thearea is currently arid and that, particularly in dryyears, dunes may be reactivated at the presenttime.
SAMPLING SITES AND COLLECTIONPROCEDURES
The Awa® site
The Awa® dune site (25°42¢57¢¢ N, 55°57¢6¢¢ E)occurs at the northernmost end of the sand sea,just south of Ras Al Khaimah city (Fig. 1). Withinthe dune ®eld, there are various closed depres-sions that contain at least 4 m of strati®edlacustrine deposits containing ostracodes. Theexposed dune section is located on the westernend of such a depression, where a clear face hasbeen cut back into the dune to obtain sand for theconstruction industry. The total height of thevertical section was 17á7 m. The dune sand is red(Munsell notation 5YR 6/3) and predominantlyquartzitic.
The morphology of the dunes is complex but,as already noted, principally consists of mega-dunes that run from SW to NE, overlain bybranching linear features that run approximatelyfrom NW to SE. The site is located about 6á8 kmfrom the coast of the Arabian Gulf. Pottery andother artefacts found over the dunes suggest thatthe dunes predate the mid-Holocene and, byanalogy with other interdune depressions inArabia, it is possible that the depressions areEarly to mid-Holocene features. In Ras Al Khai-mah harbour, the island of Abu-Tabil Nad is adetached area of a dune that appears to have been¯ooded and isolated by the post-LGM sea-levelrise. This evidence therefore implies that thedunes are older than the earliest Holocene. Thebedding structures and strati®cation within theAwa® dune suggest that the entire dune was
deposited in a single phase and contains no fossilsoils or interdune deposits.
The Idhn site
The Idhn site (25°26¢36¢¢ N, 55°59¢02¢¢ E), like thatat Awa®, consists of a near-vertical quarried facecreated by excavation (Fig. 5). It differs from theAwa® site in being much thicker (40 m) andoverlies cemented gravels that have been depos-
Fig. 4. Summary of previous stud-ies that have attempted to de®neperiods of dune formation in theUAE±Oman sector of the Rub AlKhali. (NAUAE, National Atlas ofthe United Emirates, 1993). See textfor details.
Fig. 5. The Idhn section.
1014 A. S. Goudie et al.
Ó 2000 International Association of Sedimentologists, Sedimentology, 47, 1011±1021

ited by wadis draining from the Oman Mountainsto the east. The Idhn site is part of a megaridgethat runs approximately from SW to NE and maybe oversteepened from time to time by ¯uvialerosion at its base. The continuity of beddingstructures within the dune and the absenceof any well-developed palaeosols, as at Awa®,suggest that it may relate to one phase of aeoliandeposition. The sand is again red (Munsellnotation 5YR 6/3) and dominantly quartzitic(carbonate grain content 31±48%).
OPTICAL DATING PROCEDURES
Samples were collected for optical dating byhammering light-proof 42-mm PVC cylinders(»500 cm3) horizontally into the vertical facesof freshly cleaned exposures prepared at eachsite. The ends of the cylinders were sealed withblack tape and placed in black polythene bagsfor transportation to the dating laboratory inOxford.
The samples were opened and prepared in thelaboratory under subdued amber lighting. Allequivalent dose (De) determinations were madeon sand-sized (90±150 lm) quartz grains separ-ated from bulk sediment samples. Isolation of thequartz involved treatment with dilute HCl toremove carbonates, wet sieving, heavy liquidseparation (using lithium heteropolytungstate,q � 2á75 g cm)3) to remove heavy minerals andetching using both HF (48%, 1 h) and H2SiF6
(40%, 48 h) to remove any remaining non-quartzcontaminants and the outer 10 lm of the quartzgrains (Stokes, 1994). Re®ned quartz grains weremounted as monolayers on 10-mm-diameter alu-minium disks using a silicone oil spray.
Equivalent dose (De) determination
A modi®ed single aliquot regeneration (SAR)protocol (Fig. 6; Murray & Wintle, 2000) was usedfor the determination of equivalent doses (De). Inthis approach, a De is calculated for each aliquotof a sample by an iterative procedure involvingthe measurement of the natural (Lo; i.e. burial)OSL signal (n � 0, irradiation � 0 Gy) by expos-ing the aliquot to a ®ltered light source afterpreheating at 250 °C for 10 s. The OSL signal isthen `regenerated' by a series of irradiation (Dn) ±preheat ± optical stimulation (Ln) cycles. In thiscase, three irradiation cycles (n � 1±3) wereused. All measurements were made on a RISOTL-DA-15 model TL/OSL reader ®tted with a
75-W halogen lamp, ®ltered by a GG-420 andinterference ®lter (excitation window »420±550 nm; Botter-Jensen, 1997). The OSL emittedfrom the sample was detected using a blue-sensitive EMI 9235Q photomultiplier ®tted withtwo U-340 ®lters, providing a UV detectionwindow.
The SAR approach may be complicated bychanges in the behaviour of an aliquot during theprocedure. To check and correct for any changesthat occur, an additional three steps are includedwithin the iterative procedure (Fig. 6). Theseinvolve the addition of a further small (2 Gy) testdose, a low (0±160 °C, no hold) preheat and anoptical stimulation to detect the OSL derivedfrom the test dose (Tn). A background value,estimated from counts in the last 5 s of opticalstimulation, is removed from the natural (Lo),
Fig. 6. The modi®ed single aliquot regeneration (SAR)protocol.
Rub Al Khali dunes 1015
Ó 2000 International Association of Sedimentologists, Sedimentology, 47, 1011±1021

regenerated (Ln) and test dose response (Tn)signals.
The corrected OSL signals are given by,
Ln; corr: � Ln
Tn�1�
The corrected OSL intensity values for theexposure interval 0±1 s are plotted against doseto construct a regenerated growth curve fromwhich the De values are interpolated by match-ing the equivalent of radiation required to obtainthe natural OSL intensity. A ®rst series ofmeasurements on all samples at a temperatureof 125 °C resulted in erroneous age De estimatesfor the younger (c. <1 ka) samples and, as aresult, the analyses were repeated at a tempera-ture of 60 °C.
Two additional steps are also incorporatedwithin the SAR technique (Fig. 6). The ®rst stepinvolves the replication of the dose used for the®rst regenerated point at the end of growth curveconstruction. The degree of agreement of thecorrected OSL value for this last (L4) value incomparison with the ®rst value, L1, expressed as aratio and termed the `recycling ratio', provides ameasure of the ef®cacy of the sensitivity correc-tion. The second step, taking place at the end ofthe procedure, involves a further preheat, OSLmeasurement (Lrecup.) and test dosing (and acorresponding preheating and optical stimulation[Trecup.]). This step provides a measure of thedegree of thermal transfer that may occur duringother SAR cycles. Any thermal transfer compo-nent may contribute to the observed OSL but isnot directly related to radiation damage in theground or in the laboratory.
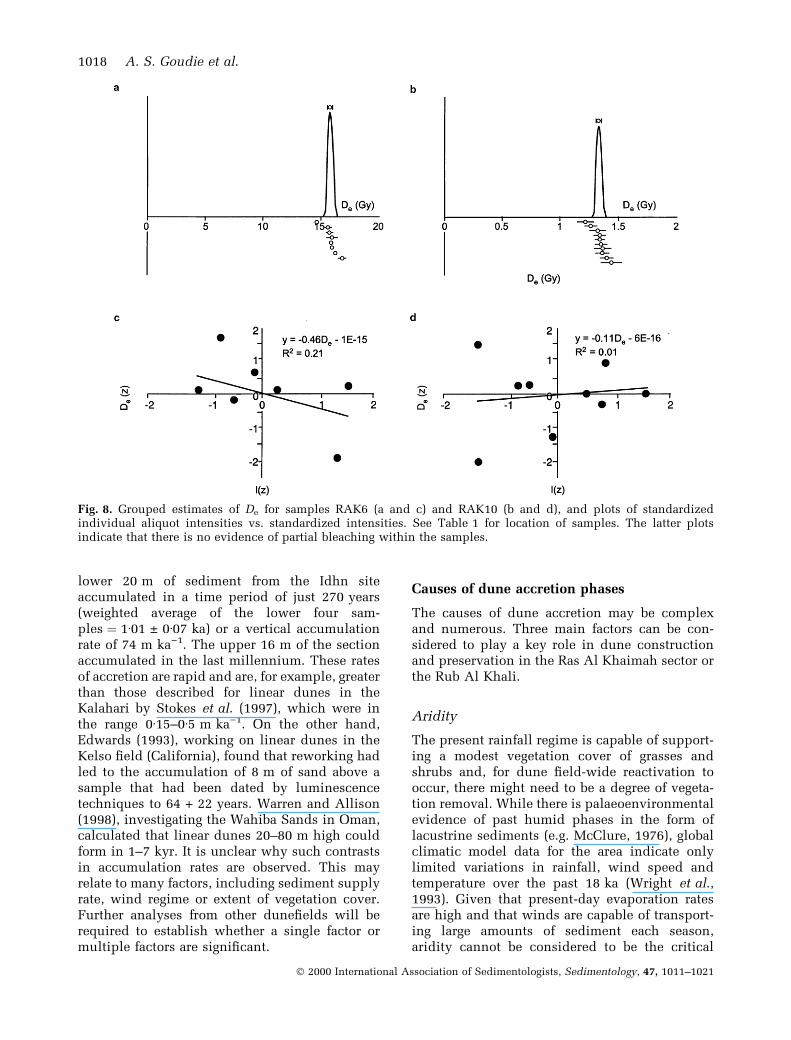
Six to eight aliquots of each sample weremeasured and then combined by unweightedaveraging to produce a single De estimate. Theuncertainty in the grouped De estimate wascalculated from the standard error of the meanof the individual single aliquot estimates. Inaddition to deriving an average De for eachsample, a modi®ed approach derived from that®rst proposed by Li (1994) was used to test for thepresence of incomplete bleaching at deposition.Li (1994) recommended plotting De vs. the inten-sity of the natural signals. Samples that exhibiteda signi®cant relationship were considered tore¯ect their derivation from a sample populationthat had been poorly bleached. Li's (1994) ap-proach was adopted by standardizing both De andnatural signal intensities (I) to unit mean (�x) andstandard deviation (r), by
De(z) � �De ÿ �xDe�
rDe
�2�
likewise I(z) � �Iÿ �xI�rI
�3�
De(z) and I(z) are then plotted in a similar wayto the method of Li (1994) but, in this case, it ispossible to use a simple Student's t-test todetermine objectively the statistical signi®canceof the relationship.
Dose rate determination
Dose rate determination was achieved by acombination of thick source alpha counting(TSAC; uranium and thorium) and ¯ame pho-tometry (potassium). Details of methods andconversion factors are provided by Aitken(1990). For TSAC, the samples were ®rst crushedto <30 lm and then counted unsealed (i.e. allow-ing for radon emanation).
RESULTS
Optical stimulation of all samples resulted in thecharacteristic multiple exponential decay formwhen plotted against exposure time (e.g. Fig. 7).Integrating the background and sensitivity-cor-rected ®rst second of OSL allowed the construc-tion of SAR growth curves and the interpolationof De estimates. All growth curves exhibitedlinear growth with dose, and the ef®ciency ofthe sensitivity correction procedure was con-®rmed by recycling ratios, which ranged from0á96 to 1á02 (mean � 0á99). The SAR procedureproduced robust De estimates (e.g. Fig. 8). Thisrobustness is demonstrated by the closeness ofthe recycling ratios to unity, the generally limitedscatter between individual aliquots from anygiven sample and the absence of any evidenceof partial bleaching or other effects (Fig. 8). TheSAR analyses produced high precision (meanerror � 6á4%) mean De estimates when the indi-vidual single aliquot De estimates were combined.The optical ages are summarized in Table 1 andplotted for the Awa® and Idhn sections in Fig. 9aand b.
With the exception of the uppermost sample,dated to 190 � 40 years, the samples from withinthe Awa® section cluster in a tight group span-ning the Latest Pleistocene and Earliest Holocene
1016 A. S. Goudie et al.
Ó 2000 International Association of Sedimentologists, Sedimentology, 47, 1011±1021
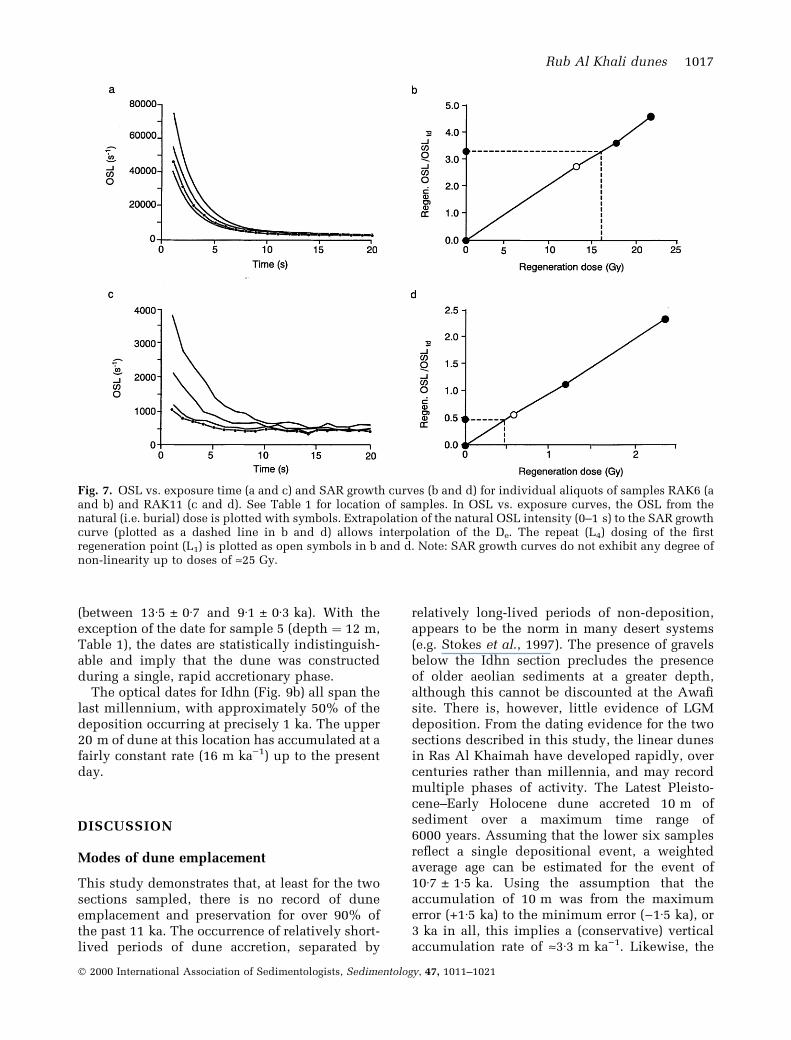
(between 13á5 � 0á7 and 9á1 � 0á3 ka). With theexception of the date for sample 5 (depth � 12 m,Table 1), the dates are statistically indistinguish-able and imply that the dune was constructedduring a single, rapid accretionary phase.
The optical dates for Idhn (Fig. 9b) all span thelast millennium, with approximately 50% of thedeposition occurring at precisely 1 ka. The upper20 m of dune at this location has accumulated at afairly constant rate (16 m ka)1) up to the presentday.
DISCUSSION
Modes of dune emplacement
This study demonstrates that, at least for the twosections sampled, there is no record of duneemplacement and preservation for over 90% ofthe past 11 ka. The occurrence of relatively short-lived periods of dune accretion, separated by
relatively long-lived periods of non-deposition,appears to be the norm in many desert systems(e.g. Stokes et al., 1997). The presence of gravelsbelow the Idhn section precludes the presenceof older aeolian sediments at a greater depth,although this cannot be discounted at the Awa®site. There is, however, little evidence of LGMdeposition. From the dating evidence for the twosections described in this study, the linear dunesin Ras Al Khaimah have developed rapidly, overcenturies rather than millennia, and may recordmultiple phases of activity. The Latest Pleisto-cene±Early Holocene dune accreted 10 m ofsediment over a maximum time range of6000 years. Assuming that the lower six samplesre¯ect a single depositional event, a weightedaverage age can be estimated for the event of10á7 � 1á5 ka. Using the assumption that theaccumulation of 10 m was from the maximumerror (+1á5 ka) to the minimum error ()1á5 ka), or3 ka in all, this implies a (conservative) verticalaccumulation rate of »3á3 m ka)1. Likewise, the
Fig. 7. OSL vs. exposure time (a and c) and SAR growth curves (b and d) for individual aliquots of samples RAK6 (aand b) and RAK11 (c and d). See Table 1 for location of samples. In OSL vs. exposure curves, the OSL from thenatural (i.e. burial) dose is plotted with symbols. Extrapolation of the natural OSL intensity (0±1 s) to the SAR growthcurve (plotted as a dashed line in b and d) allows interpolation of the De. The repeat (L4) dosing of the ®rstregeneration point (L1) is plotted as open symbols in b and d. Note: SAR growth curves do not exhibit any degree ofnon-linearity up to doses of »25 Gy.
Rub Al Khali dunes 1017
Ó 2000 International Association of Sedimentologists, Sedimentology, 47, 1011±1021
lower 20 m of sediment from the Idhn siteaccumulated in a time period of just 270 years(weighted average of the lower four sam-ples � 1á01 � 0á07 ka) or a vertical accumulationrate of 74 m ka)1. The upper 16 m of the sectionaccumulated in the last millennium. These ratesof accretion are rapid and are, for example, greaterthan those described for linear dunes in theKalahari by Stokes et al. (1997), which were inthe range 0á15±0á5 m ka)1. On the other hand,Edwards (1993), working on linear dunes in theKelso ®eld (California), found that reworking hadled to the accumulation of 8 m of sand above asample that had been dated by luminescencetechniques to 64 + 22 years. Warren and Allison(1998)1 , investigating the Wahiba Sands in Oman,calculated that linear dunes 20±80 m high couldform in 1±7 kyr. It is unclear why such contrastsin accumulation rates are observed. This mayrelate to many factors, including sediment supplyrate, wind regime or extent of vegetation cover.Further analyses from other dune®elds will berequired to establish whether a single factor ormultiple factors are signi®cant.
Causes of dune accretion phases
The causes of dune accretion may be complexand numerous. Three main factors can be con-sidered to play a key role in dune constructionand preservation in the Ras Al Khaimah sector orthe Rub Al Khali.
Aridity
The present rainfall regime is capable of support-ing a modest vegetation cover of grasses andshrubs and, for dune ®eld-wide reactivation tooccur, there might need to be a degree of vegeta-tion removal. While there is palaeoenvironmentalevidence of past humid phases in the form oflacustrine sediments (e.g. McClure, 1976), globalclimatic model data for the area indicate onlylimited variations in rainfall, wind speed andtemperature over the past 18 ka (Wright et al.,1993). Given that present-day evaporation ratesare high and that winds are capable of transport-ing large amounts of sediment each season,aridity cannot be considered to be the critical
Fig. 8. Grouped estimates of De for samples RAK6 (a and c) and RAK10 (b and d), and plots of standardizedindividual aliquot intensities vs. standardized intensities. See Table 1 for location of samples. The latter plotsindicate that there is no evidence of partial bleaching within the samples.
1018 A. S. Goudie et al.
Ó 2000 International Association of Sedimentologists, Sedimentology, 47, 1011±1021

factor. This view contrasts with that expressed byGlennie (1998), who inferred maxima of dunemobilization and accretion during global temper-ature minima with associated high winds.
Sediment supply
It is increasingly being recognized that supplyrate is critical for the accretion of a stratigraphicrecord (e.g. Kocurek, 1998; Kocurek & Lancaster,1999; O'Connor & Thomas, 1999). Given changinglevels of vegetation and sea level, the sedimentsupply could have been greater at times in thepast. For example, Ash & Wasson (1983) sugges-ted that little or no sand movement takes placewhen the vegetation cover exceeds 30%, whileChan & Kocurek (1988) explored the complexrelationship between eustatic changes in sea leveland the nature of sand sea construction.
Human activity
Many human activities may cause an increase insediment supply by destabilization of the veget-ation. In the present study area, the most likelycause of such destabilization is grazing pressurefrom domesticated camels.
The Late Pleistocene±Early Holocene period ofdune accumulation is close in timing to theperiod of maximum sea-level rise since the LGM(Fairbanks, 1989; Lambeck, 1996; Uchupi et al.,1999). Because of the hypsometry of the Gulf, therate of horizontal transgression was especiallyrapid (Evans, 1979). Although the relationshipbetween sea-level change and dune developmenthas been much debated (for a review of theT
able
1.
Op
tical
ages
for
the
Aw
a®
an
dId
hn
du
nes.
Sam
ple
Sam
ple
K2O
UT
hD
ose
rate
No.
of
Equ
ivale
nt
Age
IDd
ep
th(m
)(%
)(p
pm
)(p
pm
)(G
yka
±1)
ali
qu
ots
dose
(De)
(Gy)
(ka)
Aw
a®
site
RA
K7
0á5
0á7
5�
0á0
31á3
3�
0á1
51á0
9�
0á4
81á2
1�
0á0
37
0á2
3�
0á0
50á1
9�
0á0
4R
AK
15
0á8
8�
0á0
4N
AN
A1á3
1*
�0á0
38
11á9
�0á2
9á1
�0á3
RA
K2
60á7
9�
0á0
31á3
4�
0á2
22á4
6�
0á7
01á3
5�
0á0
325
14á7
�0á3
10á9
�0á3
RA
K3
7á5
0á8
8�
0á0
41á5
4�
0á1
81á1
8�
0á5
71á3
7�
0á0
420
13á3
�0á3
9á7
�0á3
RA
K4
9á5
1á0
8�
0á0
41á4
1�
0á1
91á5
�0á6
11á5
3�
0á0
49
15á8
�0á8
10á3
�0á6
RA
K5
12
0á8
2�
0á0
31á2
6�
0á2
01á8
3�
0á6
51á3
1�
0á0
38
17á7
�0á8
13á5
�0á7
RA
K6
14
0á9
6�
0á0
41á8
3�
0á1
70á8
9�
0á5
21á4
9�
0á0
48
15á9
�0á2
10á7
�0á3
Idh
nsi
teR
AK
13
60á7
5�
0á0
3N
AN
A1á3
1*
�0á0
38
0á1
1�
0á0
20á0
8�
0á0
2R
AK
12
10
0á8
2�
0á0
31á2
2�
0á1
51á1
4�
0á4
91á2
5�
0á0
310
0á3
8�
0á0
30á3
0�
0á0
3R
AK
11
15
0á8
5�
0á0
31á1
7�
0á1
91á5
3�
0á6
01á2
9�
0á0
38
0á6
4�
0á0
50á5
0�
0á0
4R
AK
10
20
0á9
7�
0á0
41á2
9�
0á2
01á5
8�
0á6
31á4
2�
0á0
49
1á3
5�
0á0
20á9
5�
0á0
3R
AK
925
0á8
4�
0á0
31á0
6�
0á1
40á9
6�
0á4
41á2
1�
0á0
38
1á3
2�
0á0
71á0
9�
0á0
6R
AK
830
0á8
2�
0á0
30á9
7�
0á1
61á3
3�
0á5
11á1
9�
0á0
37
1á2
2�
0á0
41á0
3�
0á0
4R
AK
14
35
0á8
�0á0
30á8
5�
0á1
81á4
5�
0á5
91á1
5�
0á0
37
1á1
0�
0á0
90á9
6�
0á0
8
*D
ose
rate
est
imate
dfr
om
avera
ge
of
oth
er
sam
ple
s.
Fig. 9. The sequence of optical dates at (a) Awa® and(b) Idhn.
Rub Al Khali dunes 1019
Ó 2000 International Association of Sedimentologists, Sedimentology, 47, 1011±1021
arguments, see Pye & Tsoar, 1990), many authorshave proposed that a transgressive sea-levelchange may result in large amounts of sand beingtransported landwards as transgressive dunes(e.g. Thom, 1978; Pye, 1984). To the south-westof Ras Al Khaimah, near Jazirat al Hamra, reddunes have been trimmed by recent coastalerosion, and some dunes have been ¯ooded, butit is likely that both drowning and sedimentremobilization can occur during a transgression.
The rapid Late Holocene accretion at the Idhnsite could, in part, result from (1) the dunereforming after it had been trimmed by a ¯oodevent in the neighbouring wadi; (2) the expan-sion of settlement and grazing by domestic stockat that time; or (3) a short-lived climatic ¯uctu-ation. The period of dune formation at Idhn tookplace during the Abassid archaeological period(750±1250 AD). This period saw the largest extentof a uni®ed Islamic Empire and a huge increasein trade with eastern Asia, although this hasbeen recognized from only a few sites in the Gulfarea. The most important sites to date, however,are located in the Emirate of Ras Al Khaimah, forexample at Kush (Kennet, 1997) and the Islandof Hulaylah (Kennet, 1994; Sasaki, 1996). Fur-ther inland, at Khatt around 10 km from Idhn,recent ®eldwork has suggested an importantfocus of occupation at this time (De Cardi et al.,1994). There is therefore some prima facieevidence that intensi®ed human activities couldhave played a role in dune accumulation.However, the period of dune formation at Idhnalso corresponds with a proposed precipitationminimum across the region. Varve thickness andlow turbidite activity recorded from the north-eastern Arabian Sea off the coast of Pakistanhave been interpreted as the result of lowprecipitation and decreased river run-off at thistime (Von Rad et al., 1999).
The age range of dune activity indicated byanalyses within the two sites described here isshort in comparison with previous studies fromadjacent areas of the Rub Al Khali (e.g. Glennie,1996, 1998; Juyal et al., 1998). This suggests that,in some parts of the sand sea, the dune ®eld hasbeen constructed by a punctuated series ofrelatively short-lived events rather than by per-sistent accumulation under a uniformly dry and/or windy environment. Given that this area hashigher precipitation levels than the sites studiedby previous investigators, it may be one that ismore prone to the effects of phases of enhanceddrought.
CONCLUSIONS
The optical ages for the site at Awa® indicate thatdune formation was rapid in the Late Pleistocenein the eastern portion of the Rub Al Khali, withover 17 m of sand deposited in just a fewthousand years. These rates are unparalleled inprevious studies of fossilized linear dunes. Theoptical dates reported in this study corroboratethe evidence provided by the presence of artefactson the dunes and the ¯ooding of the coastal dunesby the Holocene Flandrian Transgression. Incontrast to previous studies that infer that regionalaridity was the most signi®cant determinant fordune accretion, the present data suggest thatsediment supply and/or surface reactivationplayed a major role. The older phase of activity(9±13 ka) is inferred to be related to sedimentbeing transported landwards during the latestPleistocene transgression. In contrast, dune accu-mulation occurring over the past 1000 yearsmay be related to vegetation destabilization byexpanding human populations within the Ara-bian Gulf.
ACKNOWLEDGEMENTS
We are grateful to the National Museum of Ras AlKhaimah, the United Arab Emirates University inAl Ain, the British Council and the Faculty Boardof Anthropology and Geography of the Universityof Oxford. The optical dates were produced at theSchool of Geography, University of Oxford. Weare also grateful to Professor Ken Glennie forsome most helpful comments on dune morphol-ogy in the area.
REFERENCES
Aitken, M.J. (1990). Science-Based Dating in Archaeology.
Longman, London, 274 pp.
Ash, J.E. and Wasson, R.J. (1983) Vegetation and dune mo-
bility in the Australian desert dune®eld. Z. Geomorphol.Suppl., 45, 7±25.
Besler, H. (1982) The north-eastern Rub-Al Khali within the
borders of the United Arab Emirates. Z. Geomorphol., 26,495±504.
Botter-Jensen, L. (1997) Luminescence techniques ± instru-
mentation and methods. Radiat. Measurements, 27, 749±
768.Breed, C.S., Fryberger, S.G., Andrew, S., McCauley, C.,
Lennartz, F., Gebel, D. and Horstman, K. (1979) Regional
studies of sand seas using Landsat (ERTS) imagery. US Geol.Surv. Prof. Paper, 1052, 305±397.
1020 A. S. Goudie et al.
Ó 2000 International Association of Sedimentologists, Sedimentology, 47, 1011±1021
Burns, S.J., Matter, A., Frank, N. and Mangini, A. (1998)
Speleothem-based paleoclimate record from northern
Oman. Geology, 26, 499±502.
Chan, M.A. and Kocurek, G. (1988) Complexities in eolianand marine interactions: processes and eustatic controls on
erg development. Sedim. Geol., 56, 283±300.
Dalongeville, R., de Medwecki, V. and Sanlaville, P. (1991)
Evolution du piemont occidental de l'Oman depuis lePleistoceÁne Superieur. In: Deserts, PasseÂ, Present, Futur.Actes Du 116e CongreÁs National Des SocieÂteÂs Savantes,
Chambery, 29±30 April 1991, pp. 97±109. Editions duCTHS, Paris.
De Cardi, B., Kennet, D. and Stocks, R.L. (1994) Five thousand
years of settlement at Khatt, UAE. Proc. Semin. ArabianStudies, 24, 35±96.
Edwards, S.R. (1993) Luminescence dating of sand from the
Kelso Dunes, California. In: The Dynamics and Environ-mental Context of Aeolian Sedimentary Systems (Ed. K.
Pye), Geol Soc. London Spec. Publ., 72, 59±68.El-Sayed, M.I. (1999) Sedimentological characteristics and
morphology of the aeolian sand dunes in the eastern part of
the UAE: a case study from Ar Rub' Al Khali. Sedim. Geol.,123, 219±238.
Embabi, N.S. (1991) Dune types and patterns in the United
Arab Emirates using Landsat TM data. Proceedings 24thInternational Symposium on Remote sensing of the Envi-ronment, Rio de Janeiro, Brazil, 27±31 May, 1991, pp. 895±
909.
Evans, G. (1979) Quaternary transgressions and regressions.
J. Geol Soc. London, 136, 125±132.Fairbanks, R.W. (1989) A 17 000-year glacio-eustatic sea level
record: in¯uence of glacial melting rates on the Younger
Dryas event and deep-ocean circulation. Nature, 342, 637±642.
Fryberger, S.G. (1979) Dune forms and wind regime. US Geol.Surv. Prof. Paper, 1052, 137±169.
Glennie, K.W. (1996) Geology of Abu Dhabi. In: Desert Ecologyof Abu Dhabi (Ed. P.E. Osborne), pp. 17±35. Pisces Publi-
cations, Newbury.
Glennie, K.W. (1998) The desert of southeast Arabia: a product
of Quaternary climatic change. In: Quaternary Deserts andClimatic Change (Eds A.S. Alsharhan, K.W. Glennie, G.L.
Whittle and G.G. St C. Kendall), pp. 279±291. Balkema,
Rotterdam.
Jolly, D. et al. (1998) Biome reconstruction from pollen andplant macrofossil data from Africa and the Arabian penin-
sula at 0 and 6000 years. J. Biogeogr., 25, 1007±1027.
Juyal, N., Singhvi, A.K. and Glennie, K.W. (1998) Chronologyand paleoenvironmental signi®cance of Quaternary desert
sediment in southern Arabia. In: Quaternary Deserts andClimatic Change (Eds A.S. Alsharhan, K.W. Glennie, G.L.
Whittle and G.G. St C. Kendall), pp. 315±325. Balkema,Rotterdam.
Kennet, D. (1994) Jazirat al-Hulayla: Early Julfar. J. R. AsiaticSoc., Series 3, 4, 163±212.
Kennet, D. (1997) Kush: a Sasanian and Islamic-period ar-chaeological tell in Ras al-Khaimah (UAE). ArabianArchaeol. Epigr., 8, 284±302.
Kocurek, G. (1998) Aeolian system response to external forc-ing ± a sequence stratigraphic approach. In: QuaternaryDeserts and Climatic Change (Eds A.S. Alsharhan, K.W.
Glennie, G.L. Whittle and G.G. St C. Kendall), pp. 327±338.
Balkema, Rotterdam.
Kocurek, G. and Lancaster, N. (1999) Aeolian system sedi-
ment state: theory and Mojave Desert dune ®eld example.
Sedimentology, 46, 505±515.
Lambeck, K. (1996) Shoreline reconstructions for the PersianGulf since the last glacial maximum. Earth Planetary Sci.Lett., 142, 43±57.
Li, S.H. (1994) Optical dating: Insuf®ciently bleached sedi-
ments. Radiat. Measurements, 23, 563±567.McClure, H.A. (1976) Radiocarbon chronology of late Quater-
nary lakes in the Arabian desert. Nature, 263, 755.
Murray, A.S. and Wintle, A.G. (2000) Luminescence dating ofquartz using an improved single-aliquot regenerative-dose
protocol. Radiat. Measurements, 32, 57±73.
National Atlas of the United Arab Emirates (1993) NationalAtlas of the United Arab Emirates. United Arab EmiratesUniversity, Al Ain, 164 pp.
O'Connor, P. and Thomas, D.S.G. (1999) Periods of dune ac-
tivity in the Northwestern sector of the Kalahari. Quatern.Res., 52, 44±55.
Pye, K. (1984) Models of transgressive coastal dune building
episodes and their relationship to Quaternary sea level
changes: a discussion with reference to evidence fromeastern Australia. In: Coastal Research: UK Perspectives(Ed. M. Clarke), pp. 81±104. Geo Books, Norwich.
Pye, K. and Tsoar, H. (1990). Aeolian Sand and Sand Dunes.
Unwin Hyman, London, 396 pp.Sarnthein, M. (1978) Sand deserts during glacial maximum
and climatic optimum. Nature, 272, 43±46.
Sasaki, T. (1996) Umayyad and Abassid ®nds from the 1994
excavations at Jazirat al-Hulayla. Bull. Archaeol. Univ.Kanazawa, 23, 179±222.
Stokes, S. (1994). Optical Dating of Selected Late QuaternaryDeposits from the Southwestern USA. Unpublish. DPhilThesis, University of Oxford, 660 pp.
Stokes, S., Thomas, D.S.G. and Washington, R.W. (1997)
Multiple episodes of aridity in Southern Africa since the
last interglacial period. Nature, 388, 154±158.Thom, B.G. (1978) Coastal sand deposits in Southeast Aus-
tralia during the Holocene. In: Landform Evolution in Aus-tralia (Eds J.L. Davies and M.A.J. Williams), pp. 197±214.
ANU Press, Canberra.Thomas, D.S.G. (1997) Reconstructing ancient arid environ-
ments. In: Arid Zone Geomorphology. (Ed. D.S.G. Thomas),
pp. 577±606. Wiley & Sons, Chichester.
Uchupi, E., Swift, S.A. and Ross, D. (1999) Late Quaternarystratigraphy, paleoclimate and neotectonism of the Persian
(Arabian) Gulf region. Mar. Geol., 160, 1±23.
Von Rad, U., Schaaf, M., Michels, K.H., Schultz, H., Berger,W.H. and Sirocko, F. (1999) A 5000-yr record of climate
change in varved sediments from the Oxygen minimum
zone off Pakistan, Northeastern Arabian Sea. Quatern. Res.51, 39±53.
Warren, A. and Allison, D. (1998) The palaeoenvironmental
signi®cance of dune size hierarchies. Palaeogeogr., Palaeo-climatol., Palaeoecol., 137, 289±303.
Wright, H.E., Kutzbach, J.E., Webb, T., Ruddiman, W.F.,Street-Perrott, F.A. and Bartlein, J.P. (1993). Global Cli-mates Since the Last Glacial Maximum. University of Min-
nesota Press. Minneapolis.
Manuscript received 3 August 1999;revision accepted 22 February 2000.
Rub Al Khali dunes 1021
Ó 2000 International Association of Sedimentologists, Sedimentology, 47, 1011±1021