Reconstruction of environmental and climate changes at Braamhoek wetland, eastern escarpment South...
19
Reconstruction of environmental and climate changes at Braamhoek wetland, eastern escarpment South Africa, during the last 16,000 years with emphasis on the Pleistocene–Holocene transition E. Norström a, ⁎, L. Scott b , T.C. Partridge c , J. Risberg a , K. Holmgren a a Department of Physical Geography and Quaternary Geology, Stockholm University,106 91 Stockholm, Sweden b Department of Plant Sciences, University of the Free State, Bloemfontein, 9300 South Africa c Climatology Research Group, University of the Witwatersrand, Johannesburg, South Africa abstract article info Article history: Received 22 January 2008 Received in revised form 15 October 2008 Accepted 26 October 2008 Keywords: Climate change Pollen Stable isotopes South Africa A paleo-environmental record covering the last 16 ka (16,000 cal yrs BP) from the eastern areas of the summer rainfall region in South Africa is presented. This area is until now sparsely investigated due to the lack of well preserved natural archives. For this study, we used a peat section from a wetland situated close to the Drakensberg escarpment, where the high annual rainfall amounts supported a continuous peat accumulation since c. 16 ka. One peat core was analysed in terms of fossil pollen composition, carbon and nitrogen content, isotope composition (δ 13 C, δ 15 N) and microscopic charcoal concentration. The greatest degree of temporal resolution was achieved from the late Pleistocene and early Holocene section, where proxy-records indicate relatively dry conditions between ca. 16–13.7 ka, 12.8–10.5 ka, 9.5–8.2 ka, and wet conditions between c. 13.7–12.8 ka and 10.5–9.5 ka. A weak moisture signal is also evident at c. 8.2–7.5 ka. The late Pleistocene to early Holocene period was relatively cool, while conditions became generally warmer after 11–8 ka. The interpretation of the mid- and late-Holocene sequence is limited due to a slow accumulation and low sample resolution, but the available data suggest relatively dry conditions until c. 1.5 ka, followed by more humid conditions until c. 0.5 ka. We suggest that the millennial scale variability within the record can be attributed to shifts in the circulation systems dominating the region, i.e. the latitudinal movements of the inter-tropical convergence zone (ITCZ) and the dynamics of the mid-latitude low pressure belts. © 2008 Elsevier B.V. All rights reserved. 1. Introduction The summer rainfall region of central South Africa is an important area for Quaternary paleoclimatic research, because of the scarcity of fossil records in the region, and because of its position between the tropical and temperate zones, and between the arid west and sub- humid east. Shifts in the mid-latitude belt of cool westerly air flow around Antarctica, and the tropical convergence zone associated with warm and wet conditions, makes the summer rainfall region sensitive to changes in the position of latitudinal zones of atmospheric circulation. Late Quaternary paleoclimatic records from the southern part of South Africa has increased steadily providing strong evidence of significant impact of changes in atmospheric circulation around Antarctica on South African climate (Chase and Meadows, 2007; Scott and Woodborne 2007; Scott et al., 2008). In areas of South Africa experiencing summer rainfall, including the northern, eastern and interior regions (Fig. 1), the available records are sparsely spread over a vast area where preservation conditions for natural climate archives are unfavourable, and few new records are found. Despite this, some of the longest paleo-environmental records from the subcontinent are located in the northern interior. The impact crater Tswaing Crater (Pretoria Salt Pan) presents a 190 ka long sedimentological record that points to co-variation between precipitation amounts and the orbital precession cycle until around 60 ka when rainfall and insolation moves out of phase (Partridge et al., 1997; Kristen et al., 2007). Records from Wonderkrater, Makapansgat and Clarens (Fig. 1)(Scott and Thackeray, 1987; Scott, 1989; Scott, 1999; Holmgren et al., 2003; Scott et al., 2003, 2008), generally concur with the large scale variations observed in the Tswaing Crater record during the late glacial to Holocene, but more detailed comparisons often display inconsisten- cies between records. In order to improve knowledge of regional climate changes, as well as the understanding of the associated forcing factors, it is crucial to increase the number of continuous paleoclimatic records from the northern and eastern part of the summer rainfall region. The aim of this study is to gain information on past environmental changes in eastern South Africa during the late Pleistocene and Holocene. Our investigation is based on multi-proxy analysis of a peat Palaeogeography, Palaeoclimatology, Palaeoecology 271 (2009) 240–258 ⁎ Corresponding author. Fax: +46 8 164818. E-mail address: [email protected] (E. Norström). 0031-0182/$ – see front matter © 2008 Elsevier B.V. All rights reserved. doi:10.1016/j.palaeo.2008.10.018 Contents lists available at ScienceDirect Palaeogeography, Palaeoclimatology, Palaeoecology journal homepage: www.elsevier.com/locate/palaeo
Transcript of Reconstruction of environmental and climate changes at Braamhoek wetland, eastern escarpment South...

Palaeogeography, Palaeoclimatology, Palaeoecology 271 (2009) 240–258
Contents lists available at ScienceDirect
Palaeogeography, Palaeoclimatology, Palaeoecology
j ourna l homepage: www.e lsev ie r.com/ locate /pa laeo
Reconstruction of environmental and climate changes at Braamhoek wetland, easternescarpment South Africa, during the last 16,000 years with emphasis on thePleistocene–Holocene transition
E. Norström a,⁎, L. Scott b, T.C. Partridge c, J. Risberg a, K. Holmgren a
a Department of Physical Geography and Quaternary Geology, Stockholm University, 106 91 Stockholm, Swedenb Department of Plant Sciences, University of the Free State, Bloemfontein, 9300 South Africac Climatology Research Group, University of the Witwatersrand, Johannesburg, South Africa
⁎ Corresponding author. Fax: +46 8 164818.E-mail address: [email protected] (E. Nors
0031-0182/$ – see front matter © 2008 Elsevier B.V. Aldoi:10.1016/j.palaeo.2008.10.018
a b s t r a c t
a r t i c l e i n f oArticle history:
A paleo-environmental rec Received 22 January 2008Received in revised form 15 October 2008Accepted 26 October 2008Keywords:Climate changePollenStable isotopesSouth Africa
ord covering the last 16 ka (16,000 cal yrs BP) from the eastern areas of thesummer rainfall region in South Africa is presented. This area is until now sparsely investigated due to thelack of well preserved natural archives. For this study, we used a peat section from awetland situated close tothe Drakensberg escarpment, where the high annual rainfall amounts supported a continuous peataccumulation since c. 16 ka. One peat core was analysed in terms of fossil pollen composition, carbon andnitrogen content, isotope composition (δ13C, δ15N) and microscopic charcoal concentration. The greatestdegree of temporal resolution was achieved from the late Pleistocene and early Holocene section, whereproxy-records indicate relatively dry conditions between ca. 16–13.7 ka, 12.8–10.5 ka, 9.5–8.2 ka, and wetconditions between c. 13.7–12.8 ka and 10.5–9.5 ka. A weak moisture signal is also evident at c. 8.2–7.5 ka.The late Pleistocene to early Holocene period was relatively cool, while conditions became generally warmerafter 11–8 ka. The interpretation of the mid- and late-Holocene sequence is limited due to a slowaccumulation and low sample resolution, but the available data suggest relatively dry conditions untilc. 1.5 ka, followed by more humid conditions until c. 0.5 ka. We suggest that the millennial scale variabilitywithin the record can be attributed to shifts in the circulation systems dominating the region, i.e. thelatitudinal movements of the inter-tropical convergence zone (ITCZ) and the dynamics of the mid-latitudelow pressure belts.
© 2008 Elsevier B.V. All rights reserved.
1. Introduction
The summer rainfall region of central South Africa is an importantarea for Quaternary paleoclimatic research, because of the scarcity offossil records in the region, and because of its position between thetropical and temperate zones, and between the arid west and sub-humid east. Shifts in the mid-latitude belt of cool westerly air flowaround Antarctica, and the tropical convergence zone associated withwarm and wet conditions, makes the summer rainfall region sensitiveto changes in the position of latitudinal zones of atmosphericcirculation.
Late Quaternary paleoclimatic records from the southern part ofSouth Africa has increased steadily providing strong evidence ofsignificant impact of changes in atmospheric circulation aroundAntarctica on South African climate (Chase and Meadows, 2007;Scott andWoodborne 2007; Scott et al., 2008). In areas of South Africaexperiencing summer rainfall, including the northern, eastern andinterior regions (Fig. 1), the available records are sparsely spread over
tröm).
l rights reserved.
a vast area where preservation conditions for natural climate archivesare unfavourable, and few new records are found. Despite this, someof the longest paleo-environmental records from the subcontinent arelocated in the northern interior. The impact crater Tswaing Crater(Pretoria Salt Pan) presents a 190 ka long sedimentological record thatpoints to co-variation between precipitation amounts and the orbitalprecession cycle until around 60 ka when rainfall and insolationmoves out of phase (Partridge et al., 1997; Kristen et al., 2007). Recordsfrom Wonderkrater, Makapansgat and Clarens (Fig. 1) (Scott andThackeray, 1987; Scott, 1989; Scott, 1999; Holmgren et al., 2003; Scottet al., 2003, 2008), generally concur with the large scale variationsobserved in the Tswaing Crater record during the late glacial toHolocene, but more detailed comparisons often display inconsisten-cies between records. In order to improve knowledge of regionalclimate changes, as well as the understanding of the associated forcingfactors, it is crucial to increase the number of continuous paleoclimaticrecords from the northern and eastern part of the summer rainfallregion.
The aim of this study is to gain information on past environmentalchanges in eastern South Africa during the late Pleistocene andHolocene. Our investigation is based on multi-proxy analysis of a peat

Fig. 1. Map of the Braamhoek surroundings and (bottom right) map of South Africa showing the general vegetation biomes, the seasonal distribution of rainfall as well as the mostimportant sites mentioned within the text. The Clarens area include several important paleo-climatological sites referred to in the text, such as Elim, Craigrosse and Cornelia pollensequences (Scott, 1989) and Caledon River enamel isotope data (Smith et al., 2002).
241E. Norström et al. / Palaeogeography, Palaeoclimatology, Palaeoecology 271 (2009) 240–258
core sampled at Braamhoek wetland, eastern Free State, South Africa(Fig. 1). The studied record covers the last c. 16 ka (16,000 cal yrs BP)and was analysed in terms of variations in carbon and nitrogenisotopes, carbon and nitrogen content, fossil pollen composition,microscopic charcoal concentration, lithological properties andaccumulation rates. In addition, a phytolith and diatom study by M.Finné et al. is in progress.
The vegetation in the Braamhoek area contains a mixture of C3 andC4 plants, making downcore δ13C-analysis a promising tool forresolving the relative changes in C3 and C4 plant abundance overtime. The nitrogen isotope composition (δ15N) may be used as anadditional environmental indicator, providing information about theorigin of the source material, productivity, nitrogen fixation andeutrophication (Talbot, 2001). The carbon and nitrogen content isoften expressed as a ratio between the two (C/N), and may giveinformation about the origin of organic matter (Meyers, 1994; Talbot,2001). The pollen analysis is expected to give information on regionalpaleo-vegetation and associated climatic conditions. The Braamhoeksetting is promising for retrieving such information, as the highaltitude grassland and the nearby escarpment host both fynbosvegetation and forest trees of afromontane type (Coetzee, 1967).Microscopic charcoal is a potential proxy for regional fire activity (e.g.MacDonald et al., 1991; Tinner et al., 1998). Fire frequency can becoupled to anthropogenic activity (Tolonen, 1985; Pitkänen et al.,1999), and/or various environmental factors associated with theregional vegetation and climate (Trollope, 1993). This ensemble of
proxies has the potential to provide a new palaeo-environmentalsequence from the summer rainfall region in South Africa, and sincethe wetland is part of a proposed hydro-electric scheme, it becameurgent to study it before its peat accumulation is lost forever.
2. The study area
2.1. Site description and lithology
Braamhoek wetland (also referred to as Bedford-Chatsworth orIngula wetland), is located at an altitude of 1700 m a.s.l., in the easternpart of the Free State, close to the border of Kwa-Zulu Natal (S 28°14', E29°35'; Fig. 1). Approximately 2 km south-east of the wetland is themajor Drakensberg escarpment, with an altitudinal difference ofaround 500 m between the high altitude grassland biome on thewestern side and the lower lying grasslands and savanna on theeastern side. The escarpment acts as a water divide between theeasterly and the westerly drainage systems of South Africa. Togetherwith other wetland sites located along the escarpment, Braamhoekforms the upper drainage system of the Wilge River, which is one ofthe headwaters of the Vaal and Orange River, eventually draining intothe Atlantic Ocean.
The bedrock of the Braamhoek area consist mainly of sandstone ofthe Karoo super group and the Beaufort series that formed around260 Ma ago (Visser and Bishop, 1976). The sandstone is occasionallyinter-layered by mudstones and shales (Visser and Bishop, 1976). The

Fig. 2. Detailed map over the Braamhoek wetland complex. Enhanced map show the AH1 coring site and the cardinal stretch of the transect profile. Transect coring was performedhalf way through the profile A–B.
242 E. Norström et al. / Palaeogeography, Palaeoclimatology, Palaeoecology 271 (2009) 240–258
long term weathering of the bedrock has created a gently undulatinglandscape, with distinct dolorite dykes in some cases formingprominent ridges in the landscape. The soils are thin, highly leachedand poor in nutrients, which have resulted in slightly acidic soil andwater conditions with a pH around 5.
The drainage pattern of the wetland shows a dendritic configura-tion, draining from southeast towards northwest (Fig. 2). The eastern-most part of the wetland complex acts as an upper catchment,draining via the main inlet river to the lower lying wetland areas(Arm 1, Fig. 2). Close to the escarpment crest, in the southern end ofthe wetland complex, shallow groundwater springs feed watertowards the wetland from south-east. The relatively small drainagearea is believed to cause a more or less immediate response tovariations in precipitation. A major dolorite dyke cuts through thewetland complex, passing through the eastern wetland arm (Arm 1).Where the dyke crosses wetland arm 1, the swamp is both narrow andshallow, indicating that the dyke has a damming function, creatingwetter conditions in the upstream area where this study is focussed(AH1, Fig. 2). Despite seasonal rainfalls, Braamhoek is a permanentwetland, with a braided drainage pattern of relatively low energywater-flow towards the outlet into the Wilge River. The permanentwetness can be explained by the high annual rainfall in the area(~1400 mm/year), together with a high water storage capacity of thewetland, resulting from the low inclination that slows down thetransport of water. This situation promotes plant growth, allowing thewetland to continuously increase in thickness and thus furtherimproving its water-holding capacity. Extended parts of the wetlandhave an uneven surface consisting of solid, floating organic tussocks.
The tussocks are c. 0.5–1.0 m in diameter and raise c. 0.5 m above thewater. They are covered by vegetation and surrounded by a vastnetwork of approximately 0.5 to 1.0 m wide water channels.
In 2002, ten cores from the top of tussocks were taken with avibracorer and a Livingstone corer at different locations within thewetland (Fig. 2). Of those, AH1 was chosen for this study, since thispart of the wetland will be lost in reservoir excavations. The core wascollected as a single 5.5 m long segment reaching bedrock.
In 2007, six cores were taken with a Russian corer along a profilestretching from east towest and crossing the approximate position forAH1 (Fig. 2). Each core along the profile was examined in field in termsof lithology and a transect showing the stratigraphic distribution ofthe various layers was constructed (Fig. 3). The bottom portionconsists mainly of minerogenic particles ranging in size from clay tofine sand, with occasional gravel and pebbles, here defined as “clayey,sandy, stoney silt” (Fig. 3). The organic content is only around 1%(Fig. 3b). This unit is interpreted to represent in situweathering of thebedrock and/or in-wash from the surrounding exposed soil surfaces.In some parts, downward percolation of humic acids has coloured thegrains brown to black. The accumulations above the minerogenic unitdisplay a higher organic content, varying between c. 8 and 45% and isreferred to as “sandy peat”, “clayey peat” or “tussock peat” (Fig. 3b).The organic matter most likely originated from accumulation of in situdecomposed plants with in-mixing of sand derived from water- andwind-transported erosional products from the surrounding slopes.The top layer, here referred to as “tussock peat”, represent a grasstussock that more or less float on the water and is only attached to theunderlying layer by long roots passing through the water section.
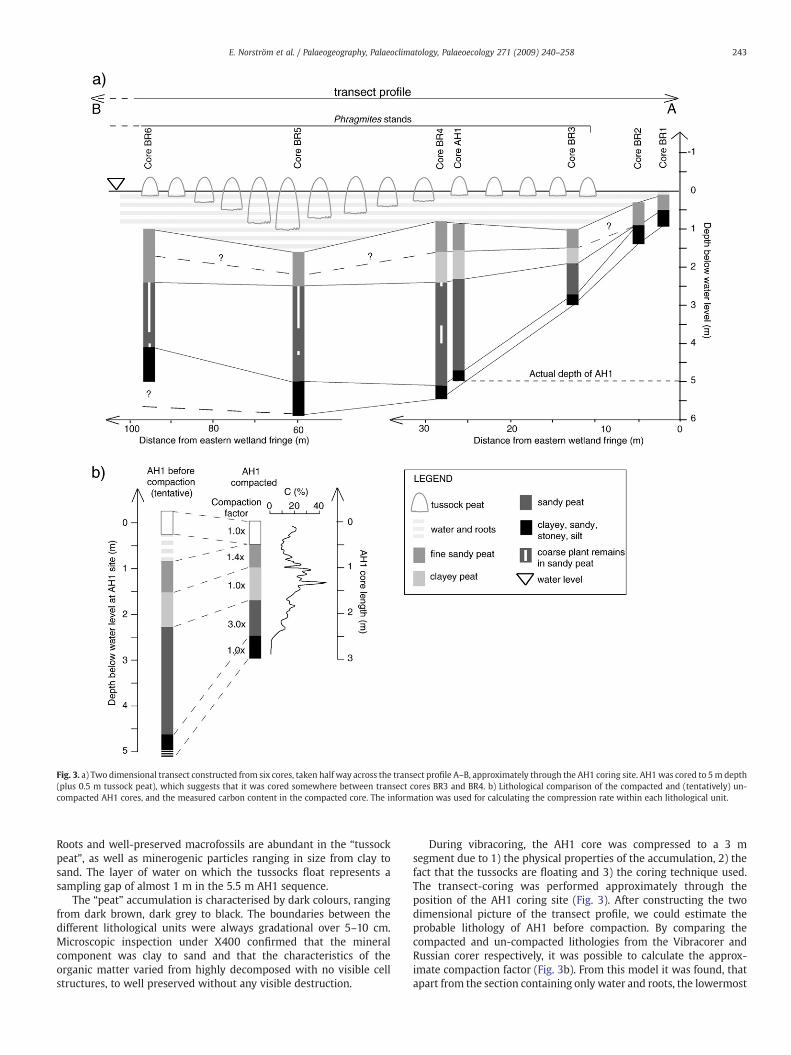
Fig. 3. a) Two dimensional transect constructed from six cores, taken half way across the transect profile A–B, approximately through the AH1 coring site. AH1was cored to 5m depth(plus 0.5 m tussock peat), which suggests that it was cored somewhere between transect cores BR3 and BR4. b) Lithological comparison of the compacted and (tentatively) un-compacted AH1 cores, and the measured carbon content in the compacted core. The information was used for calculating the compression rate within each lithological unit.
243E. Norström et al. / Palaeogeography, Palaeoclimatology, Palaeoecology 271 (2009) 240–258
Roots and well-preserved macrofossils are abundant in the “tussockpeat”, as well as minerogenic particles ranging in size from clay tosand. The layer of water on which the tussocks float represents asampling gap of almost 1 m in the 5.5 m AH1 sequence.
The “peat” accumulation is characterised by dark colours, rangingfrom dark brown, dark grey to black. The boundaries between thedifferent lithological units were always gradational over 5–10 cm.Microscopic inspection under X400 confirmed that the mineralcomponent was clay to sand and that the characteristics of theorganic matter varied from highly decomposed with no visible cellstructures, to well preserved without any visible destruction.
During vibracoring, the AH1 core was compressed to a 3 msegment due to 1) the physical properties of the accumulation, 2) thefact that the tussocks are floating and 3) the coring technique used.The transect-coring was performed approximately through theposition of the AH1 coring site (Fig. 3). After constructing the twodimensional picture of the transect profile, we could estimate theprobable lithology of AH1 before compaction. By comparing thecompacted and un-compacted lithologies from the Vibracorer andRussian corer respectively, it was possible to calculate the approx-imate compaction factor (Fig. 3b). From this model it was found, thatapart from the section containing only water and roots, the lowermost

244 E. Norström et al. / Palaeogeography, Palaeoclimatology, Palaeoecology 271 (2009) 240–258
organic section (“sandy peat”), experienced most compression duringvibracoring. The sampled bottom minerogenic layer shows nocompaction, probably as a consequence of its solid state (sand, graveland stones), and because the Vibracorer probably reached deeperdown, compared to the Russian corer which was manoeuvred byhand. As it is still unclear how this lowermost section was affected byvibracoring, this section is treated as un-compacted. Although thismodel of compaction contains possible errors, such as uncertainties inthe positioning of the AH1 coring site (GPS-monitoring gave aprecision of ±7 m), it gives a reasonable indication of tentativecompaction factors in AH1.
2.2. Climate
The annual climatic seasonality of South Africa is determined byseveral large scale climatic phenomena, such as the sea surfacetemperature contrasts between thewarm Indian Ocean and the coolerAtlantic ocean, the geographical dynamics of the circumpolar vortexover Antarctica, and the position of the Inter-tropical convergencezone (ITCZ) in the tropics. During austral summers, the summerrainfall region of South Africa (Fig. 1) is influenced by warm and moisteasterly air masses associated with the southward movement of theITCZ on the eastern side of the continent, leading to high rainfallamounts. During austral winters, the Antarctic circumpolar vortex andlow pressure zone expand, pushing cool and wet air of the mid-latitude westerlies over south-western Cape, which therefore receivesmost of its annual rainfall during winter, while dry, high-pressureconditions develop in the summer rainfall region during this time ofthe year (Tyson and Preston-Whyte, 2000).
In eastern South Africa where the Braamhoek wetland is situated,the annual rainfall declines from moist along the eastern escarpmentunder its orographic influence, to relatively dry in the western FreeState. Braamhoek receives c. 1400mm rain annually, while the nearestweather station, barely 100 km to the west (Bethlehem, 28°15'S28°20'E, Fig. 1) receives c. 680 mm annually (Schulze, 1997).Instrumental weather data from Bethlehem shows that summer rainclearly dominated the annual precipitation pattern with 78% fallingbetween October and March for the period 1960–90 (South AfricanWeather Bureau). Temperatures fluctuate between average dailymaximum of +27 °C in the hottest month (January) to an averagedaily minimum of −2 °C in the coldest months (June and July). Thegrowing season (October–March) is characterised by mean daily
Table 1Botanical and ecological preferences of plant groups applied on Braamhoek pollen dataset
1. Regional taxa (taxa in the pollen sum)
Forest trees Mainly afromontane forest vegetation, which is well reprRutherford, 2006). The afromontane forest vegetation pre
Trees and shrubs The majority of trees and shrubs, growing in a wide rangin the area, as well as distant savanna vegetation at lowefrom these different habitats or the nearby forests.
Herbs and small shrubs All terrestrial herbs and small shrubs with various enviroincluding the prominent Asteraceae group.
Fynbos Fynbos is the common term for ericoid, proteoid and restcool Drakensberg mountainous region of South Africa (WSouth-western Cape region, but they represent a differenAfrica. This fynbos vegetation is frost-tolerant and grows
2. Local taxa (taxa excluded from the pollen sum)
Grasses and sedges Sedges are associated with the local wetland vegetation,As we cannot distinguish between local and regional gras
Aquatics Plants that are closely related to the aquatic environmenWetland vegetation All herbs that are associated with the wetland that may bSpores Ferns and mosses from various habitats, generally preferrAlgae Algae from local waters. Also included is Pseudoschizaea,
maximum temperature of +25 °C and a mean daily minimumtemperature of +11 °C (South African Weather Bureau).
2.3. Vegetation
The Braamhoek wetland is located within the South Africangrassland biome that covers several veld types in the interior of thecountry (Acocks, 1953; Mucina and Rutherford, 2006). The siterepresents Eastern Free State Sandy Grassland and is located justabove the Drakensberg Escarpment, which forms a sharp transitionto Low Escarpment Moist Grassland with dense isolated patches ofNorthern Afrotemperate Forest on steep east- and south-facingslopes and ravines (Mucina and Rutherford, 2006). Other grasslandtypes and savannas of northern Kwazulu–Natal occur further to theeast in lower-lying areas. The escarpment forests contain typicalafromontane species, for example Buddleja salvifolia (Lognaiaceae),Celtis africana (Ulmaceae), Pittosporum viridiflorum (Pittosporoceae)and Podocarpus latifolius (Podocarpaceae). The rocky outcrops andslopes along the inlet streams feeding the wetland, also host severalmontane forest elements like Clutia pulchella (Euphorbiaceae),Diospyros (Ebenaceae), Leucosidea sericea (Rosaceae), Maytenusheterophylla (Celastraceae), Myrsine africana (Myrsinaceae), andPodocarpus spp. The Eastern Free State Sandy Grassland is part of azone where 75–95% of the grasses are C4 and 5–25% of them are C3
(Vogel et al., 1978). The most abundant grasses found in the areasurrounding the swamp are Themeda triandra (C4), Tristachyaleucothrix (C4) and Heteropogon contortus (C3) (Nacelle Collins,pers. comm.). Several herbs and small shrubs grow solitarily withinthe dense grass cover in the Braamhoek area, e.g. Cliffortia sp.(Rosaceae), Erica sp. (Ericaceae), Helichrysum spp (Asteraceae),Kniphofia sp. (Liliaceae), Passerina montana (Thymelaceae), Proteadracomontana (Proteaceae), Senecio spp (Asteraceae), Stoebe sp.(Asteraceae) and Watsonia lepida (Iridaceae).
Grasses and sedges dominate the local swamp vegetation. In thewetter areas, where the micro-morphology is characterised by largetussocks surrounded by water, the vegetation is dominated byPhragmites australis (Poaceae, C3), Carex acutiformis (Cyperaceae, C3)and Poa binata (Poaceae, C3). P. binata grows on top of the tussocks,while the former two species grow both on top of, and in between thetussocks. Near the drier fringes of the wetland, common plants areCyperus fastigiatus, Juncus effuses and species of Crassula, Ericocaulon,Scirpus, Limosella and Polygonum. Semi-aquatics are also found around
esented on slopes and in ravines along the Drakensberg escarpment (Mucina andfers relatively warm and moist conditions and is sensitive to frequent fires.e of biomes. The taxa are mainly associated with more exposed mountain slopesr-lying, warmer locations. However, no clear distinction is possible between taxa
nmental preferences for growth. The majority of the herb taxa fall into this group,
ioid flora mainly growing in the Cape region, but with some forms also present in thehite, 1978). These high-altitude types are related to genera found in the species-richt and less diverse group of species, typical of high-altitudes in the interior of Southernalmost year-round under relatively cool and wet conditions (Cowling et al., 1997).
while grasses grow both within the wetland and in the surroundings.ses, we exclude it from the pollen sum.t, usually submerged or floating on the surface.e seasonally submerged, but do not generally grow within the water.ing humid conditions (Gajewski et al., 2002).a structure resembling algae, but of unknown origin (Scott, 1992).

245E. Norström et al. / Palaeogeography, Palaeoclimatology, Palaeoecology 271 (2009) 240–258
the springs feeding the wetland, and within and around waterfallsalong the inlets to the wetland. Around the southern inlet, close to theAH1 bore site, Persicaria sericulata (formerly Polygonum sericulata),Limosella maior and Gunnera perpensa are examples of commonlyfound species.
3. Methods
3.1. Pollen analysis
Samples for pollen analysis were taken approximately at every7 cm along the AH1 core. The samples were prepared by standardmethods (Berglund and Ralska-Jasiewiczowa, 1986) with the addi-tion of a heavy liquids separation (Nakagagawa et al.,1998) in order tomaximise the concentration of pollen in the final samples. Because ofpresence of large plant remains in some of the samples, sieving wasperformed with a 250 μ mesh sieve before starting the chemicaltreatment. The pollen slides were mounted in glycerol jelly andviewed under ×400 magnification for routine counting switching to×1000 for identification of some pollen grains where necessary. Aknown number of Lycopodium spores were added to weightedsamples according to the method of Stockmarr (1971) to calculatethe pollen concentration. Identification was done by consultingseveral references (e.g. van Zinderen Bakker, 1953–1956; vanZinderen Bakker and Coetzee, 1959; Caratini and Guinet, 1974;Bonnefille and Riollet, 1980; Scott, 1982a) as well as using referencematerial and photos from the Department of Plant Sciences,University of the Free State, Bloemfontein and reference materialfrom the Environmental Change Institute, Oxford University. Photosand descriptions at several web-sites further helped the identifica-tionwork (e.g. the African Pollen Database; http://medias.obs-mip.fr/pollen/). The visual inspection of the pollen grains during lightmicroscope analysis showed that the grains are well preserved withvery limited erosive damage. Potential biases in the pollen assem-blages due to selective damage of certain pollen taxa (due to differentexine properties), are therefore not considered a major source oferror in the Braamhoek core.
There is a generally high over-representation of certain local taxa,mainly Cyperaceae and Poaceae, at all levels in the AH1 core (Table 1).As these taxawere excluded from the total regional pollen (the “pollensum”; Fægri and Iversen, 1964), a large number of grains had to becounted in order to reach a pollen sum exceeding 250 grains. The total
Table 2Results from radiocarbon dating of the AH1 Braamhoek core
Lab. Id. Sample depth(cm)
Sampletype
Radiocarbonage (yrs BP)
Anaerro
Poz18391 1 Macro 110,91 pMC 0.35Poz18342 25 Bulk 460 30Poz12599 39 Bulk 1500 35Poz18343 50 Bulk 2015 35Poz12234 59 Bulk 4340 30Poz18344 77 Bulk 6970 40Poz18346 87 Bulk 7190 40Poz12600 97 Bulk 8150 50Poz18347 116 Bulk 8870 50Poz12235 135 Macro 9270 50Poz18348 154 Macro 9660 50Poz12237 173 Macro 9740 60Poz18349 191 Bulk 10410 50Poz12601 211 Bulk 11060 70Poz18350 234a Bulk 11900 60Poz18351 234b Macro 11820 60Pta 8778 250 Bulk 11920 210
The samples calibrated with IntCal04 were corrected for the southern hemispheric offset, byThe uppermost sample is of modern age and therefore expressed as percent modern carbo
count was therefore more than 2000 grains in that part of the corewhere the over-representation of local taxa was highest.
In order to estimate regional climate change we made a selectionof 26 predominantly regional pollen taxa and performed principalcomponents analyses (PCA), using the XLSTAT program withPearson correlation coefficient in order to determine the mostimportant groups of co-varying taxa and their distribution over thesequence.
3.2. Analysis of carbon and nitrogen content and isotope composition
Bulk material from 1-cm sections, sampled at every 5 cm along thecore, was freeze dried and homogenized. Around 5 mg of each samplewas weighed into small tin capsules and treated with acid beforemass-spectrometry to ensure that any calcareous components wouldnot disturb the δ13C signal. The mass spectrometry analysis wasperformed at the department of Geology and Geochemistry atStockholm University, using a Finnigan Delta Plus Masspectrometerequipped with a Carlo Erba NC2500 and conflo interface. Theinstrumental precision is 0.1‰ for both δ15N and δ13C.
3.3. Charcoal analysis
Charcoal particles were identified after criteria described in theliterature (e.g. Clark, 1984; Patterson et al., 1987) and counted alongthe same transects as the pollen grains. Around 1500–2000 particleswere counted in each sample. The total charcoal abundance was thencalculated in the same way as the pollen concentration using Lyco-podium spores, and expressed in terms of number of particles per dryweight of sample (Stockmarr, 1971). The charcoal particles werearbitrarily divided into five groups in terms of size based on thelongest axis of each fragment; 5–10 μm, 10–20 μm, 20–50 μm, 50–100 μm and N100 μm. Particles smaller than 5 μm were not counteddue to the risk of false identification related to possible confusionwithother similar objects, such as small dark plant fragments or pyrite(Clark, 1984).
3.4. Radiocarbon dating and age model construction
Bulk samples and macrofossils from 15 levels were AMS dated atPoznan Radiocarbon Laboratory, Poland (Table 2). Bulk sample fromone level (250 cm)was dated by conventional 14C-methods at the CSIR
lyticalr (±yrs)
Cal. curve Highest probabilitypoint (yrs BP)
95.4% probabilityrange (cal yr BP)
pMC ShCal04 0 –
ShCal04 495 530–331ShCal04 1320 1398–1294ShCal04 1894 1992–1825ShCal04 4849 4966–4728ShCal04 7724 7915–7662ShCal04 7960 8029–7850ShCal04 9010 9251–8777ShCal04 9889 10,158–9669IntCal04 10410 10,570–10,245IntCal04 10885 11,188–10,747IntCal04 11175 11,244–10,775IntCal04 12215 12,605–11,989IntCal04 12924 13,106–12,845IntCal04 13740 13,898–13,484IntCal04 13665 13,796–13,433IntCal04 13750 14,414–13,240
subtracting 40±20 14C-yrs prior to calibration (here uncorrected 14C-dates are shown).n (pMC).

246 E. Norström et al. / Palaeogeography, Palaeoclimatology, Palaeoecology 271 (2009) 240–258
radiocarbon dating facilities in Pretoria, South Africa. At all levels,except the lowermost (250 cm), 1 cm slices of the core were studiedunder low magnification in search for macrofossils. In five of thesamples (at 1, 135, 154, 173 and 234 cm) sufficient macrofossils werefound for AMS dating. The majority of the macrofossils found wereseeds from Carex, except for the uppermost sample (1 cm), whereunidentified seeds were dated. In the remaining samples, fewer seedswere found, and bulk samples were therefore used for dating. Allvisible roots and rootlets were removed from the bulk using tweezers,working under a low magnification lens. All samples were dried afterroot-removal. At 234 cm, both a bulk sample and a macrofossil samplewere dated, in order to control possible age differences. The bulksample was c. 80 14C-years older than the macrofossils and nocorrection was performed on the remaining bulk samples prior tocalibration.
The youngest samples in our core were calibrated by thesouthern hemisphere radiocarbon calibration curve, ShCal04(McCormac et al., 2004). Beyond 10 ka (cal yrs BP), the northernhemisphere calibration curve IntCal04 (Reimer et al., 2004) wasused, after adjustment of the radiocarbon ages in line with theinter-hemispheric offset. Dated material from the southern hemi-sphere is generally 20–60 radiocarbon years younger than northernhemisphere samples (Vogel et al., 1993). We adjusted those sampleslying outside the range of the ShCal04, by subtracting the meandifference between the southern and northern hemisphere curves,i.e. 40 14C-years, from the 14C-age before calibration. For the samereason, ±20 years were added to the error of these samples. Theadjusted 14C-ages (samples 135–250 cm) were then calibrated,using IntCal04. The rest of the samples (25–116 cm) were calibratedwithout correction, using ShCal04.
The calibrated ages are plotted in Fig. 4 with 95% probabilityranges. The age model is constructed by linear regression betweenthe single highest probability point of each calibrated date. The oldestdate (level 250 cm) has a broad 95% probability range and no clearintercept. Therefore, the mean accumulation rate from the previoussection was used also for age control of the lowermost part of thecore. The age control before 14 ka is therefore of lower precision thanthe younger part of the section.
Fig. 4. Age model (graph) and accumulation rates (bar chart) of the AH1 Braamhoek core. Ttogether with the 95% probability range. Dates based on macrofossils are illustrated as greyconstructed age model, after compensation for compaction during coring.
The accumulation rates (Fig. 4) were calculated from the calibratedradiocarbon dates and the degree of compaction during coring(Fig. 3b). Using the same depth conversion model, the sections withhighly preserved plant remains found in transect core BR4 (Fig. 3a)could be extrapolated to the adjacent AH1 core. Tentative ages forthese sections were calculated from the available age model of AH1. Itshould, however, be stressed that the indirect “dating” of these wellpreserved plant remains, as well as the calculated accumulation rates,should be carefully interpreted due to the weaknesses within thecompaction model.
As a result of different accumulation rates throughout the core, thesample resolution in the different sections of the core variessignificantly. The highest resolution was reached for the sectionolder than 10 ka, while the resolution in the mid-Holocene section islower.
4. Results and interpretation
4.1. Proxy response to changes in environmental conditions
The AH1 pollen assemblage is dominated by local wetland taxa(Table 1, Appendix 2) partly as a result of the high representation ofCyperaceae and Poaceae pollen, varying between 30–60% and 15–40%respectively (Fig. 5).
The terrestrial assemblage (Table 1) is dominated by pollen fromherbs and small shrubs (Appendix 1, Fig. 6). Asteraceae pollendominates through all six zones, showing relatively large variationwith at least three general peaks. The forest tree pollen accounts forapproximately 5–10% of all terrestrial pollen (the pollen sum), whilepollen from other trees and shrubs contribute with c. 10–15% andfynbos pollen with c. 1–15% of the pollen sum. Despite the lowrepresentation of upland herbs and arboreal taxa, they may be usedfor interpretation of regional vegetation when combined with otherproxy records.
The Braamhoek proxies give general indications of past fluctuationsin humidity. Temperature changes, which most likely occurred duringthe studied period, are not as easy to detect from the pollen assemblage.The ratio between Poaceae and Asteraceae give information about the
he points in the graph indicate the single highest probability point of each calibration,points, bulk samples as black points. The accumulation rates were calculated from the

Fig. 5. Pollen diagram showing selected taxa associated with the local wetland vegetation of the Braamhoek wetland. Percentages are based on all local taxa including Cyperaceae, Poaceae and spores, excluding only algae. Zonation is based oncalculations in CONISS (Grimm,1987), based on variations in both the local and terrestrial pollen spectra. Also shown are the carbon isotope composition (δ13C), total carbon content (%C), carbon/nitrogen ratio and nitrogen isotope composition(δ15N).
247E.N
orströmet
al./Palaeogeography,Palaeoclim
atology,Palaeoecology271
(2009)240
–258

Fig. 6. Pollen diagram showing selected taxa associated with the terrestrial vegetation surrounding the Braamhoek wetland, together with other proxy records associated with regional environmental conditions. Pollen percentages are basedon the pollensum, i.e. all terrestrial taxa. Poaceae and Cyperaceaewere excluded from the pollen sum due to overrepresentation. Zonation is based on calculations in CONISS (Grimm,1987) on variations in the local and terrestrial pollen spectra.Rare taxa are exaggerated by a factor of 4. Cheno/Am represents the total percentage of both Chenopodiaceae and Amararanthaceae pollen.
248E.N
orströmet
al./Palaeogeography,Palaeoclim
atology,Palaeoecology271
(2009)240
–258

249E. Norström et al. / Palaeogeography, Palaeoclimatology, Palaeoecology 271 (2009) 240–258
degree of rainfall seasonality and dryness. Poaceae growth within thegrassland (and savanna) biome is generally associated with high rainfallduring summer, while Asteraceae vegetation is favoured by weakerrainfall seasonality, or drier and cooler summers (Coetzee, 1967;Cooremans,1989; O'Connor and Bredenkamp,1997).When interpretingthe Braamhoek datawe consider the Poaceae/Asteraceae-ratio, but keepin mind that the local and regional components of these cannot beseparated and therefore itmaygive locally biased indications of regionalmoisture availability.
The arboreal pollen taxa in the Braamhoek record are generallyassociated with afromontane forest trees. These trees are favoured byrelatively warm and moist conditions (van Wyk and van Wyk, 1997;Mucina and Rutherford, 2006). The fynbos-vegetation in this part ofSouth Africa, is favoured by relatively wet and cool conditions(Coetzee, 1967; Mucina and Rutherford, 2006), however, consideringthe already wet conditions prevailing at Braamhoek, a decline intemperature and/or a seasonal shift in the precipitation patternswould probably favour the fynbos community to a greater extent thanwetness alone. Increased dryness would on the other hand probablynot favour the fynbos community. Pollen from Ericaceae, Stoebe-typeand Anthospermum are relatively important in the late Pleistocenepart of the core. Ericaceae grows today at high altitudes in the Lesothomountains (Killick, 1990; Pooley, 1998), where conditions are coolercompared to the Braamhoek site. Pollen of Anthospermum, as well asStoebe-type, has further been suggested to represent relatively coolerenvironmental conditions (Coetzee, 1967; Livingstone, 1967; Morri-son, 1968). The pollen of Stoebe is however not possible to distinguishfrom Elytropappus-pollen by light microscope. Compared to Stoebe,Elytropappus has a different ecological niche, preferring slightly drierconditions of the karoo (Coetzee, 1967; Scott, 1982a), and the paleo-environmental interpretation of the Stoebe-type therefore involvesuncertainties.
The results of the PCA show positive loadings with the followingvalues for the first factor (accounting for 17% variance): Buddleja(0.883), Cliffortia (0.815), Anthospermum (0.770), Celtis (0.686),Tarchonantus (0.643) and Passerina (0.540). These taxa representregional woodland and fynbos vegetation of surrounding valleyslopes and only Tarchonanthus that usually grow in rocky areas, isassociated with drier conditions to the west. This group iscontrasted by high negative loadings in the case of a diversegroup of taxa, including Asteraceae other (−0.427), Acanthaceae
Fig. 7. Charcoal particles per gram sample in the AH1 Braamhoek core, illu
(−0.362), Aizoaceae type (−0.235), Euphorbia (−0.234), Kiggelaria(−0.228) and Olea (−0.219). In general the positively and negativelyloaded groups seem to contrast wetter against drier conditions. Theexceptions are Tarchonanthus and Kiggelaria but their loadings arerelatively neutral and therefore their influence on the PCA scores(Fig. 6) of PC1 is relatively low. The most striking feature of thisfactor is two positive peaks at c. 13.2 ka and c. 10 ka (Fig. 6).Although it is not easy to attribute a definite environmental gradientto this distribution, the peaks may possibly indicate episodes ofrelatively moist conditions.
Compared to pollen analysis from savanna areas where manyplants are sensitive to frost (Scott, 1982a), most plants in theBraamhoek surroundings tolerate frost conditions. Thus, it isuncertain how more frequent frost occurrences will affect thevegetation composition, except for harming montane forestelements (O'Connor and Bredenkamp, 1997). Indirect evidencefor more evaporation, such as a higher representation of Cheno/Am (Chenopodiaceae+Amaranthaceae) pollen, can however be asign of increasing temperatures. Although Cheno/Am vegetationgenerally is associated with strong (summer) evaporation (Scott,1982a; Vincens et al., 2006), it may also be favoured by localerosion or human disturbances in the grassland, and are there-fore not necessarily always indicators of evaporative or dryconditions.
The charcoal concentration in AH1 is illustrated as the number offragments per gram dry sample (Fig. 7). The variations in charcoalconcentration reveal a close similarity between the size classes 10–20 μm, 20–100 μm and N100 μm, while the concentration of thesmallest size class (5–10 μm) show a slightly different distributionthroughout the core. In the interpretationwe avoid using the smallestsize fraction (b10 μm), as it may include too much noise, while largerfractions give a better indication of fire frequencies in the area(Carcaillet et al., 2007).
In tropical environments, an increase in fire frequency may beassociated with dry conditions favouring ignition and the spread offire, resulting in a high concentration of charcoal particles inassociated sediments (Kershaw et al., 1997). The Braamhoek area isin the plateau region where lightning is the most frequent in SouthAfrica and the risk of natural fires is high (Werger, 1978). Stormswith thunder and lightning are most common during summers,when also most of the annual rain is falling. Thus, increased fire
strated for each size class. The zonation is based on the pollen record.

250 E. Norström et al. / Palaeogeography, Palaeoclimatology, Palaeoecology 271 (2009) 240–258
activity due to natural ignition from lightning is probably favouredby dry episodes with enough available fuel. In grassy environmentsthe amount of available fuel is an important factor influencing thefire activity (Bond, 1997) and in the Braamhoek area the rainfallwas probably high enough throughout the sequence to produceenough plants for .fuel. Fire was probably not limited by fuelsupply but was initiated by lightning after seasonal drying and/orby human activity.
The correlation between charcoal concentration and the repre-sentation of forest tree pollen (p=−0.6) suggests that intense fireactivity restricts the expansion of forest trees in the area. Thisrelation is probably enhanced by the climatic factor, as dryconditions favour fires and not forest expansion, and vice versaduring wet conditions. Further, the taxa associated with positive PCAloadings (woody elements, fynbos), are types which spread in thegrassland and savanna biome after long periods of low fire activity(Bond et al., 2003a,b; Sankaran et al., 2005). The spread of fire-sensitive forests is particularly evident in grassy ecosystems withhigh rainfall amounts (N650 mm/yr) (Bond et al., 2003a,b). This is aneffect of competitive advantages of trees versus grasses in absence offire, but the low fire activity may in turn be a result of increasedwetness, as discussed above. Hence, when performing paleo-environmental reconstructions, it should be kept in mind thatvegetation, fire activity and climatic factors are intimately inter-connected. In our Braamhoek record, abundant charcoal fragmentsand increased fire activity may also be associated with humanactivity. Preliminary archaeological excavations near the wetlandreveal that humans occupied the area at several occasions during theHolocene and possibly also during late Pleistocene (Gavin Andersson,pers. comm.).
The δ13C-analysis in sediments is widely used as a proxy for therelative availability of C3 and C4 plants, as their different photosyn-thetic pathways result in different isotope ratios (Vogel et al., 1978).The C3 pathway is mainly used by shrubs, trees and temperate grasses,while species of Poaceae (especially subtropical grasses), Cyperaceae,Chenopodiaceae, Aizoaceae and Amaranthaceae depend on the C4strategy (Vogel et al., 1978). The C4 grasses are generally favoured bywarm growing seasons (in both wet and dry areas), while C3 grassesare favoured under cooler growing conditions, e.g. areas with winterrain or cool high altitude areas with rain during any season. Thetypical δ13C signal for South African C3 grasses lies below −20‰ whileC4 grasses are characterized by δ13C-values above −16‰ (Vogel et al.,1978). South African sedges do not show the same clear link betweenphotosynthetic pathway and climate as the South African grasses(Stock et al., 2004). The δ13C values in the Braamhoek record are below−20‰, indicating a dominance of C3 plants (Fig. 5). However, themajority of the grasses growing in the area today use the C4
photosynthetic pathway (Vogel et al., 1978), suggesting that the C3dominance in the Braamhoek record is associated with the localwetland flora, where important elements such as Typha, Carex,Phragmites and Poa are C3 plants. Isotope variations are probablyaffected by local changes in the species distribution (between C3 andC4 plants, but also between different C3 species). That does not excludethe possibility that such local vegetation changes, at least partly, maybe attributed to changes in regional climate. Enriched δ13C-valuesprobably reflect a higher number of C4-grasses associated with thesurrounding slopes. Depleted δ13C-values instead indicate a higherrepresentation of the local wetland flora, consisting of C3 plants thatare favoured by moist conditions. When the size of the wetland andthe relative input from these sources change due to regional rainfallvariations, or when the ratio of summer to winter rains change, theδ13C values will reflect this. We expect that moisture changes areprobably the primary driver of the isotope variations at Braamhoek,rather than changes in temperature. Extreme cooling would also haveaffected C4 plants, but our record apparently starts after the coldestphase of the last glacial period.
The carbon to nitrogen ratio may give information about theorigin of the organic matter. A high C/N ratio (N20) in sedimentaryorganic matter, generally represents a high production of vascularplants, while a low ratio (4–10) indicates a higher representationof algae (Meyers, 1994; Lamb et al., 2004). Further, soil formationmay lower the C/N-ratio due to selective decomposition of theorganic matter (Meyers, 1994). The nitrogen isotope composition(δ15N) can be associated with variations in nitrogen fixation, but itis also dependent on the origin of the nitrogen (Talbot, 2001). Asediment sample containing a high abundance of algae generallyshow more depleted δ15N-values compared to a sample containingmainly terrestrial plants (Talbot, 2001).
4.2. Local wetland development
The accumulation-rate at Braamhoekwas relatively high during thelate Pleistocene and early Holocene, but slows down considerablybetween c. 7.7 and 1.9 ka, returning to a higher rate after c. 1.9 ka(Fig. 4). The increase in accumulation rate at 1.9 ka coincides with ashift in lithology. The upper part of the core (b1.9 ka) represents thesurface tussocks that are present within thewetland today. The shift inaccumulation rate at c. 1.9 ka may represent an environmental shiftfrom drier to wetter conditions and the tussocks probably started toform after the mid-Holocene dry period. Similar tussocks are presentalong the fringes of the swamp, where spring water seepage keeps theground relatively moist but not completely saturated. This tussockymorphology is most likely a result of the specific growth pattern ofcertain tufted grasses and sedges.When conditions becamewetter, theaccumulation on top of the tussocks increased. The tussocks wereeventually raised to a floating condition by the higher water levels,while contact with the underlying units probably was kept intactthrough root attachment. The underlying section of fine sandy peatstayed relatively intact in terms of accumulation during this phase, dueto its sheltered location below thewater and tussocks. If accumulation/sedimentation occurred on this section, the material probably felldown from underside of the tussocks, and in that way thechronological order of the material stayed intact, as indicated by theage model. When water passes through the wetland, it could result indeposition of modern material below the tussocks, i.e. creating asequence parallel in age with the tussock accumulation. However, ourradiocarbon dates show no evidence of such a parallel sequence.
Once formed, the tussocky formation itself supports more growthand probably acts as a sedimentation trap for washed- and blown-inminerogenic particles, which in turn supports a relatively fastaccumulation. It cannot be excluded that tussocks were present alsoduring late Pleistocene and early Holocene times, and that these oldtussocks eventually became submerged. The abundance of wellpreserved plant remains in the lower sandy peat layer supports sucha scenario.
It is uncertain whether the phase with low accumulation (c. 7.7–1.9 ka) is a result of one (or several) hiatuses, or whether it is simply aresult of very slow but undisturbed accumulation of peat. Oneplausible scenario is that drier conditions, initiated c. 7.7 ka, resultedin less vegetation growth and slow accumulation. Alternatively oradditionally, one or several hiatuses were created through fluvialerosion and transport of organic and minerogenic particles down-stream. The three dates that frame this low accumulation period (7.7,4.8 and 1.9 ka) indicate a relatively constant accumulation rate duringthis phase but the resolution is not high enough to exclude thepossibility of hiatuses.
4.3. Pollen assemblage zones
The record was divided into six pollen assemblage zones, broadlybased on CONISS calculations (Grimm, 1987) including both localand terrestrial pollen percentages. The following discussion

251E. Norström et al. / Palaeogeography, Palaeoclimatology, Palaeoecology 271 (2009) 240–258
attempts to relate changes in proxies between pollen zones (Figs. 5and 6), to changes in regional climate and local environmentalconditions.
4.3.1. Zone 1: 16–14.3 ka (300–250 cm)Cool and dry conditions prevailed, possibly with weaker rainfall
seasonality than today. The early wetland environment was charac-terised by wet conditions and a sparse vegetation cover.
The high occurrence of Poaceae, Asteraceae and Chenopodiaceaepollen suggests an open and dry grassland environment with a lowPoaceae/Asteraceae ratio. The relatively high charcoal concentrationbetween 15 and 13 ka reflects regular fires. The high fire frequencyduring this period may be associated with human activity and/ordrier conditions in the surrounding environment.
The high representation of Asteraceae and fynbos pollen may bean indication of vegetation types favoured by slightly weakersummer rainfall seasonality than at present, or drier and coolersummers, as a result of the lower summer insolation intensity(Berger and Loutre, 1991) (Fig. 8). The low representation of allforest tree pollen except Podocarpus, suggests that the forests inthe area were limited, possibly due to a cool and dry climate. Anadditional or alternative explanation may have been the directphysiological impact (Harrison and Prentice, 2003) of low atmo-spheric CO2-levels (Monnin et al., 2001), possibly in combinationwith frequent natural fires (Bond et al., 2003a,b).
The cool environment probably led to more available moisture forthe local swamp area, despite the generally dry regional climate. Thepresence of algae (Fig. 5) may have affected the C/N-ratio towardslower values. Cooler conditions probably kept down the growth ofvascular plants, leading to low organic content and a furtherlowering of C/N. The decline in δ15N at c. 14.5 ka, simultaneouswith the rise in carbon content and δ13C depletion probably reflectincreasing representation of swamp vegetation in the organicmatter. Swampy environments are often rich in nitrogen (Talbot,2001), and the lowering of δ15N after 14.5 ka may also be a sign ofincreasing nitrogen fixation associated with the build up of thewetland.
The relatively enriched δ13C-values between c. 16–14.5 ka, may bea result of C4 vegetation under drier conditions but C4 plants may alsohave been favoured by the low CO2-concentrations associated withthe late glacial conditions (Ehleringer et al., 1997).
4.3.2. Zone 2: 14.3–11.5 ka (250–178 cm)The regional climate changes from dry to more humid, culminat-
ing at c. 13.2 ka and returning to dry conditions after c. 12.8 ka. Thelocal wetland shows high productivity and the wetland vegetationexpands.
Increased wetness is inferred from many of the proxies in earlyZone 2. After c. 14 ka, the representation of Asteraceae pollen declines,while the Poaceae/Asteraceae ratio increases. The charcoal dataindicate a decline in fire activity after c. 13.5 ka. The PCA analysisshow high positive loadings of the first component (PC1) around13.2 ka, associated with vegetation favoured by relatively moistconditions. The relatively wetter conditions peak between c. 13.7 and12.8 ka.
High representation of pollen from Cyperaceae and Gunneraperpensa indicates moist conditions also locally. The δ13C-values areslightly more negative during this phase, most likely as a result of
Fig. 8. Summary diagram of regional environmental proxies from Braamhoek wetland(lower graphs). Grey bars indicate periods where Braamhoek proxies suggest increasedmoisture. The upper graphs show other available records from the summer rainfallregion: Wonderkrater and Tswaing PCA-values (Scott, 1999; Scott et al., 2008), Caledonriver grazer enamel carbon isotope values (black bars showing periods when C3-grassesexpanded in the area due to cooler conditions) (Smith et al., 2002), Makapansgat carbon(grey curve) and oxygen (black curve) isotope values illustrated as a 50 year intervalwith 9 term weighted running mean (5 term in beginning and end) (Holmgren et al.,2003) and the precessional insolation values for 30°S (Berger and Loutre, 1991).

252 E. Norström et al. / Palaeogeography, Palaeoclimatology, Palaeoecology 271 (2009) 240–258
locally wetter conditions, which probably favoured local C3-grassesassociated with wetland environments. A gradual decline insummer/winter rainfall-ratio related to insolation (Fig. 8) mayhave contributed to the δ13C-depletion (Berger and Loutre, 1991).Between 13.6 and 12.9 ka, plant remains were very well preserved,which further supports that wet conditions prevailed, preventingthe organic material from complete decomposition.
The humid period was followed by a return to drier conditions at c.12.8 ka, as suggested from a declining Poaceae/Asteraceae ratio andlower PCA-score. A peak in the percentage of Stoebe type pollenbetween c. 13–12.5 ka may indicate a temperature drop.
4.3.3. Zone 3: 11.5–9.7 (178–112 cm)Conditions were initially dry, but after 10.5 ka turning wetter and
cooler, with more forest and fynbos type vegetation. Lowering ofaccumulation rate and abundant C3-vegetation characterises the localenvironment.
The regionally dry conditions continued to prevail in early Zone 3,at least until c. 11 ka. The charcoal concentration is high, indicatingfrequent fire activity in the region. Simultaneously, the accumulationrates slow down.
Between c. 11.0–10.5 ka, pollen from Cheno/Ams is almost absentand the charcoal concentration is lowest on record, suggesting non-disturbed conditions. However, throughout this phase, Asteraceaepollen remains relatively abundant, the accumulation rate continuesto slow down, the Poaceae/Asteraceae ratio stays low, all indicative ofa relatively dry environment.
Between c. 10.5 and 9.5 ka, the terrestrial taxa suggest moister andless evaporative conditions. Asteraceae pollen decline while thePoaceae/Asteraceae ratio increases. Several of the tree pollen (e.g.Acalypha, Buddleja, Celtis, Pittosporum and Podocarpus) become moreprominent after 10.5 ka, all being taxa which generally prefer moist,mainly afromontane forest environments (Hilliard,1985; vanWyk andvan Wyk, 1997; Thomas and Grant, 2002). Stoebe pollen declineswhile the rest of the fynbos associated vegetation increase during thisphase. A common abundance of forest trees, grasses and fynbosvegetation is indicative of moist conditions under current tempera-tures in the grassland environment of the eastern part of South Africa(Mucina and Rutherford, 2006). The low charcoal concentrationindicates low fire frequency from around 10.7 ka, supportingindications of regionally wet conditions. The PCA-analysis show highpositive loadings between c. 10.0 and 10.5 ka, which highlights thewetter phase.
Throughout Zone 3, δ13C and δ15N show depleted values centred at10.6 ka, simultaneous with a rise in Cyperaceae. Most likely, thenegative anomaly in the δ13C-record can be attributed to the increasein pollen of Typha (C3), probably represented by the aquatic plantT. latifolia (subsp. capensis). The C3 sedges and grasses associated withthe wettest areas of a wetland e.g. Carex, Schoenoplectus and Phrag-mites (Kotze and O'Connor, 2000), probably increased in importanceduring this phase, which lowered δ13C even further. Well preservedCarex seeds in the section dated to c. 11.2–10.4 ka may support this.Above and below this sequence, only very few seeds were found. Thisseed-rich phase must be a result of either good preservation withinthe wetland and/or simply a very high representation of Carex sedgesat the site. Lowered summer insolation (Fig. 8) and its seasonal effectmay also have hampered C4 plants in general and contributed todepleted carbon isotope values. The low δ15N-values could probablyrepresent well preserved remains from aquatic and semi-aquaticplants.
4.3.4. Zone 4: 9.7–7.5 ka (112–75 cm)Regional conditions change towards drier and warmer. Forest
vegetation is still important but declining, while other arboreal taxastay relatively constant. Tentatively a cool/wet spell is indicated around8 ka.
A shift towards drier and possibly warmer conditions is suggestedby several proxies. The total percentage of local wetland pollen taxadeclines in favour of terrestrial pollen taxa (Appendix 2b) and thePoaceae/Asteraceae ratio as well as fynbos pollen declines. The fireactivity increases. The generally high representation of arboreal taxamay be a response to generally warmer conditions.
Around 8 ka, rising Poaceae/Asteraceae ratio and accumulationrates indicate a change towards more humid conditions, apparentlycontradicting the PC1 curve. The charcoal data infer a period ofintense fire activity at around 8 ka, contemporaneous with a declinein the arboreal flora, contradicting the indications of a moistersituation. Possibly, human activity in the area was responsible for thehigh fire activity, which in turn may have resulted in a decline inforest trees.
The δ13C-values increase continuously, indicating a transitionfrom a C3 environment, possibly interpreted as wet and cool,towards a higher C4 interference, possibly indicating drier andwarmer conditions. The carbon content drops from around 30% toalmost 15%, which also can be related to a change from wetter todrier conditions, as drier conditions may lead to faster decomposi-tion of organic material.
4.3.5. Zone 5: 7.5–2.5 ka (75–42 cm)Warm and relatively dry conditions are indicated both locally and
regionally.Due to low accumulation rate, Zone 5 and 6 have a lower
chronological resolution compared to previous zones, and the proxiescan therefore only give general information about the paleo-environ-ment. The available proxies, as well as the PCA, suggest regionallyrelatively dry conditions during Zone 5. Pollen of forest trees andfynbos vegetation generally appear in lower percentages than earlier,while other arboreal pollen remain relatively unchanged. The charcoalanalysis suggests high fire frequencies and the Poaceae/Asteraceaeratio is low.
Locally, Zone 5 is characterised by a low accumulation rate,suggesting dry conditions and sparse vegetation cover within thewetland. The species diversity seems to decline and the vegetationis almost completely dominated by sedges. δ13C gives the sameenriched levels as during late Pleistocene. The significant increasein pollen of the C4 sedge Ascolepis probably explain this δ13Cenrichment, maybe together with an increase in warm and droughtadapted C4 grasses.
4.3.6. Zone 6: 2.5 ka — present (42–0 cm)Relatively humid condition after c. 1.5 ka, with an increasing forest
element, a prominent grass cover and increasing wetland accumulation.A return to more moist conditions after c. 1.5 ka is implied by less
Asteraceae pollen, higher abundance of Poaceae pollen in relation toAsteraceae and a general increase in arboreal pollen (e.g. Podocarpus,Pittosporum, Acalypha, Buddleja, Leucosidea, Otholobium type). Thecharcoal concentration remains low, suggesting low fire activitythroughout the zone.
Locally, the wetland is still dominated by sedges, including Asco-lepis which probably stabilises the δ13C-values at relatively enrichedlevels. The accumulation rate increases after c. 1.5 ka, simultaneouswith rising carbon content, probably a result of the change in soilproperties towards “tussock peat”, which requires locally wetconditions during its formation.
5. Braamhoek proxy data in a regional paleo-climatic context
5.1. The Late Glacial Period
The Braamhoek wetland started to accumulate at c. 16 ka. Due toimprecise age control in the oldest sequence, it is possible thataccumulation was initiated somewhat later, but it did however start
253E. Norström et al. / Palaeogeography, Palaeoclimatology, Palaeoecology 271 (2009) 240–258
before 14 ka, according to the second oldest, more precise date(Fig. 4). In South Africa, many wetlands developed during thetransition between Pleistocene and Holocene, at c. 15–11.5 ka(Meadows, 1988). The organic accumulation of the Craigrossie andCornelia swamps near Caledon River in Eastern Free State (Scott,1989) and at Aliwal North, in Northern Cape (Coetzee, 1967) areexamples of nearby wetlands that started to accumulate at around15.4 ka (12,600 14C-yrs BP), which is contemporary with theinitiation at Braamhoek. However, there are also examples of olderand younger periods of wetland initiation in the area, e.g., at Elim(Scott, 1989) and in Lesotho (van Zinderen Bakker and Werger,1974). The Braamhoek proxies indicate relatively dry conditions inthe oldest section, but conditions were, however, obviously sub-humid and wet enough for wetland initiation.
The available late Quaternary proxy-records from the north-eastern part of the summer rainfall region, generally give similarindications of climate change in a multi-millennial perspective.More detailed comparisons between records have been hampereddue to problematic dating control and occasional hiatuses (Fig. 8).The longest, most continuous records from the summer rainfallregion of South Africa are the multiproxy records from TswaingCrater (Partridge et al., 1997; Scott, 1999), speleothem isotoperecords from Makapansgat valley (Holmgren et al., 2003) and apollen record from Wonderkrater swamp (Scott, 1982b, 1999; Scottet al., 2003), all extending beyond Holocene, covering the entire, orparts of the last glacial period.
Both the Wonderkrater and Makapansgat records indicate anabrupt start of the post-glacial warming at around 17 ka. Makapans-gat isotopes suggest dry and cool conditions between 15–13.5 ka(Holmgren et al., 2003) andWonderkrater pollen data indicate coolerconditions between 15–13 ka (Scott et al., 2003). This lends support tothe Braamhoek record, where fynbos and Asteraceae vegetation,together with sparse forest vegetation indicate a cool environmentwith drier summers and possibly wetter winters during this phaseconsidering the insolation curve (Berger and Loutre, 1991) (Fig. 8).
In the vicinity of the Braamhoek wetland site, the available proxy-records are sparser and less continuous than the northern interiorrecords. Important contributions, however, are the carbon isotopeanalysis of grazer enamel from different sites in the Caledon RiverArea in the Lesotho highlands (Smith et al., 2002), aswell as a series ofpollen records from Clarens (Elim, Cornelia and Craigrossie) in thesame area (Scott, 1989). The Caledon River grazer enamel isotopesreveal periods of regionally cooler climate between 16–14 ka (Fig. 8),contemporary with drier conditions according to the Braamhoekrecord. The nearby Clarens pollen records reveal a vegetation patterncharacterised by cool fynbos grasslands and a climate situationassociated with dry summer conditions and intermediate tempera-tures from around 14.5 ka (13,000 14C yrs BP). At some stage before12.5 ka (10,700 14C yrs BP), the Clarens area experienced a changetowards moister and warmer conditions, characterised by a sub-humid grassland and Podocarpus (Scott, 1989). This phase couldcorrespond to the vegetation changes taking place at Braamhoekafter around 14 ka, such as the sharp rise in Cyperaceae in relation toPoaceae, the rise in δ13C and a clear occasional decline in Asteraceaevegetation, including Stoebe. According to Braamhoek proxies, thishumid phase is centred at c. 13.2 ka and shifts towards drierconditions at c. 12.5 ka. At Craigrosse in the Clarens area, accumula-tionwas initiated at around 12.7 ka (Scott, 1989), possibly supportingthat humid conditions prevailed.
The interior Makapansgat record show a wet and warm phasebetween 13.5–12.5 ka (Holmgren et al., 2003), which may becontemporary with the indications of wetness at Braamhoek atc. 13.2 ka. This humid period in the Braamhoek record coincides withthe Antarctic Cold Reversal (ACR, c. 14–12.5 ka), when some of theAntarctic ice cores indicate an occasional return to cooler conditions(e.g. Augustin et al., 2004).
5.2. The Pleistocene/Holocene transition
From a global perspective, the southern hemisphere ACR wasfollowed by the Younger Dryas Chronozone (YD) (c. 12.9–11.6 ka),when the northern hemisphere experienced a temporary glacial re-advance (e.g. Alley et al., 1993; Grootes et al., 1993; Bond and Lotti,1995). It is still unclear, whether there exists a coupling between thenorthern hemisphere YD event, and southern hemisphere climateduring this phase, and how a potential coupling was manifested inthe southern hemisphere. The available natural climate archives fromthe southern hemisphere covering this episode show contradictoryindications (e.g. Scott et al., 1995).
The records available from the interior summer rainfall region ofSouth Africa generally suggest drier conditions at the time of the YDand beyond (Fig. 8). Makapansgat speleothems from the northerninterior (Holmgren et al., 2003) as well as Cango Cave speleothemsfrom the southern coast region (Talma and Vogel, 1992), both havegrowth hiatuses around the time of the YD. This may be a result of dryor locally evaporative conditions that prevented speleothem growth(Holmgren et al., 2003), but it cannot be discarded that the hiatus wascaused by other, non climatic factors. Wonderkrater pollen recordinfers evaporative but not necessarily dry conditions during the YDperiod (Scott, 1999; Scott et al., 2003). Wonderkrater further shows atemperature reversal around the closing stages of the YD, after 11.5 ka,and δ18O in macro-fossils from northern South Africa suggest thatslightly cooler conditions prevailed before c. 11.5 ka (9,940 14C yrs BP)(Abell and Plug, 2000).
The Braamhoek record shows similar indications to the othersummer rainfall region records, inferring relatively dry conditionsbetween 12.8 ka and 11 ka. The nearby Craigrosse record at Clarensshow high occurrence of Cheno/Ams pollen around 12.5 ka (Scott,1989), possibly indicating stronger evaporative conditions duringsummer. After c. 11 ka, the peak in Asteraceae between c. 12.5 and10.3 ka in the Braamhoek record does match the timing of theMakapansgat hiatus between 12.7 and 10.2 ka (Holmgren et al., 2003).Asteraceae could be indicative of a less pronounced seasonality in theregion, and generally less rain on an annual basis (O'Connor andBredenkamp, 1997).
Other Braamhoek proxies indicate a change towards wetterconditions at c. 10.5 ka. The Clarens record shows a decline incharcoal concentration at around 10.5 ka (Scott, 2002) which iscontemporary with low fire activity in Braamhoek area between10.7 and 9.5 ka. The Makapansgat speleothem started growingaround 10.2 ka and its isotope records reveal relatively warm andwet conditions around 10 ka followed by drier conditions(Holmgren et al., 2003), in line with Braamhoek PCA-values after10 ka (Fig. 8). Radiocarbon dates from archaeological sites in theCaledon Valley (Mitchell, 1994; Wadley, 1995; Mitchell et al., 1998)and from the Lesotho highlands (Mitchell, 1996; Mitchell et al.,1998) indicate a pulse of occupation preceding and continuingduring this phase, at c. 11.2–10.7 ka (Lesotho highlands) and at c.9.5–11.5 ka (Caledon Valley).
From a large-scale regional perspective, the Antarctic regionexperienced cool conditions during the Last Glacial Maximum (LGM),and possibly also during the YD (Stieg et al., 2000; Brook et al., 2000).This lead to an expansion of the circumpolar lowpressure beltswhichgenerated a north-east-ward shift of the winter rains in South Africa.It is unclear to what extent the South African continent was affectedby this shift in circulation regimes, but available proxy-recordssuggest that thewinter rains were not reaching as far north/east as tothe Braamhoek site, neither during the LGMnor during a tentative YDperiod (Chase and Meadows, 2007). Instead, north-eastern SouthAfricawas likely to be locatedwithin the belt of subtropical highs, stillreceiving mainly summer rains, but experiencing drier conditions asthe southern hemisphere tropical climate system possibly weakenedand contracted equator wards, due to cooler conditions around the

254 E. Norström et al. / Palaeogeography, Palaeoclimatology, Palaeoecology 271 (2009) 240–258
south pole. Such a scenario would involve drier conditions also in theequatorial region, which is evident from several east Africanequatorial sites suggesting a dry YD (e.g. Gasse, 2000; Johnsonet al., 2002; Barker and Gasse, 2003; Ryner et al., 2006; Tierny andRussel, 2007), and wetter conditions in the region between SouthAfrica and the equatorial region, which is evident from studies insouthern Tanzania and Malawi (Vincens et al., 2007, Garcin et al.,2007). However, the contradictory temperature signals from Antarc-tic ice core records covering the YD (e.g. Brook et al., 2000; Augustinet al., 2004) puts constraints to this model and further complicatesthe understanding of climate forcing in southern Africa during thisphase.
5.3. Holocene
After the wet phase at c. 10.5–9.5 ka, the Braamhoek proxiessuggest drier conditions until c. 8.5 ka, which is supported byMakapansgat δ13C-values (Holmgren et al., 2003) and WonderkraterPC2 values (Scott et al., 2008) (Fig. 8). Around 9.5 ka, the fynbosvegetation becomes a less important element of the Braamhoekvegetation, indicating drier and generally warmer conditions. At thistime, the Antarctic ice core records show a rapid increase intemperatures, for example at Vostok between 10 and 9 ka (e.g. Petitet al., 1999).
Around 8 ka, the accumulation rate increases briefly at Braam-hoek, simultaneous with a decline in arboreal taxa which may beassociated with cool, low evaporative conditions. A low-intensityincrease in moisture may be related to the initial southwarddevelopment of stronger summer insolation that was apparentlyinfluencing other sites such as Florisbad to the west (Scott andNyakale, 2002; Scott and Lee-Thorp, 2004). Cool conditions wererecorded in the Caldeon River area between 8.4 and 8.0 ka (Smithet al., 2002) and the Makapansgat speleothems show a temporarycool event at around 8.5 ka (Holmgren et al., 2003). At severalarchaeological sites above the escarpment in Lesotho and easternFree State, Late Stone Age assemblages are dated to c. 8 ka (Mitchell,1994; Mitchell 1996), indicating the presence of human settlementsin the area during this phase.
The low sample resolution of the middle to late HoloceneBraamhoek record is hampering the interpretation of the datasetduring this period. The dataset, however, indicates a drier phaseuntil c. 4 ka, supported by a relatively high Asteraceae componentat Elim near Clarens (Nyakale and Scott, 2002). Wonderkraterpollen data and Makapansgat speleothem isotopes indicate that thewarm early Holocene phase continued until around 6 ka (Scott etal., 2003; Holmgren et al., 2003). Jolly et al. (1998) suggest dryconditions around 5 ka (6000 14C-yrs BP) in eastern South Africa.The interior of South Africa and the area above the escarpment wasprobably relatively sparsely populated during early and midHolocene, between c. 9–4.5 ka (Deacon and Deacon, 1999). AtBraamhoek, wetter conditions returned only after c. 1.5 ka, as wellas at Wonderkrater and Tswaing (Scott et al., 2008). At Lake Sibaya,KwaZulu-Natal, vegetation changes indicate a shift towards amoister environment at c 1.5–1.3 ka (Neumann et al., 2008).Concurrently with these environmental changes, at c. 1.5–1.0 ka,humans started to settle in Lesotho and above the easternescarpment in the interior of South Africa (Mitchell, 1994; Mitchell,1996).
During thewhole Holocene period, the representation of fynbos islow in the Braamhoek record, indicating generally warmer condi-tions, and possibly a seasonality in line with the modern summerrainfall type. The comparison between Braamhoek and the recordsfrom the northern interior, suggest that the sites were influenced bythe same rainfall seasonality during the Holocene. Although changesin precession may have affected the long term trends in climate,individual climate eventsweremost likely a result of latitudinal shifts
in the tropical and circumpolar circulation cells (Partridge et al.,2004).
6. Conclusions
The Braamhoekmulti-proxy record adds awell-dated continuoustime series of regional and local climate and environmental changespanning the last 16 ka from the summer rainfall region of SouthAfrica. The time resolution of analysed parameters is highest for thesequence covering the late Pleistocene and early Holocene period,while the sequence covering the mid-Holocene is analysed withlower temporal resolution, due to slow accumulation rates or apossible hiatus during this phase.
According to the Braamhoek record, a transition from cooler towarmer environment is apparent between 11 ka and 8 ka. The latePleistocene conditions were generally cooler, supporting thegrowth of fynbos-type vegetation and restricting the spread offorest trees of afromontane type. Between c. 10.5 ka and 8 ka bothfynbos and forest vegetation are important within the regionalflora, suggesting wet conditions and temperatures rising to a levelwhere the forest trees were favoured, but still being cool enoughfor the fynbos flora to thrive. After c. 9.5 ka, the fynbos elementdeclines, while the forest trees stay important as a response tocontinuously warmer conditions and possibly a shift towardsstronger rainfall seasonality. The mechanisms behind changes inrainfall seasonality in the multi-millennial time perspective aremost likely indirectly associated with changes in insolationintensity, and directly influenced by the contraction and expansionof the tropical and mid-latitude circulation systems (Partridge etal., 1997; Tyson and Preston-Whyte, 2000).
Higher frequency variability in the Braamhoek record infer fourmajor phases of relatively wet and/or less evaporative conditions atc. 13.7–12.8 ka, 10.5–9.5 ka, 8.2–7.5 ka and from 1.5 ka to present.Other proxy records from the summer rainfall region showsimilarities in trends when compared to the Braamhoek record,strengthening the Braamhoek record as a provider of regionalclimate and environmental conditions. The forcing mechanismsbehind these climate shifts are still not fully understood, althoughsome influence probably can be attributed to the dynamics of thecircumpolar low pressure belts and the ITCZ (Tyson and Preston–Whyte, 2000).
The Braamhoek study provides new insights to the regionalenvironmental history of the summer rainfall region in South Africabut should be followed by investigations of more sites in the regionand adjacent subtropical areas further north, before the forcingmechanisms behind climate change can be interpreted with moreconfidence. This particularly refers to the climate shifts during ACR, YDand early Holocene, when different proxies in the southern hemi-sphere show indications of climate change that are difficult toincorporate into a single explanation model regarding forcings (e.g.Gasse, 2000; Holmgren et al., 2003; Garcin et al., 2006; Scott et al.,2008; Talbot et al., 2007; Vincens et al., 2007).
Acknowledgements
Brett Smith and Lloyd Rossouw helped with the vibracoring ofseveral sequences, including AH1. The vibracorer was provided by theUniversity of Cape Town. Nacelle Collins and Johann du Preez kindlyassisted with plant species identification and provided with informa-tion about the Braamhoek flora. Siep Talma and Tomasz Gozlar gavevaluable input on radiocarbon calibration. Michael Meadows andWilliam Bond gave valuable input on themanuscript. The field work in2002 was made possible by Eskom (Electricity Supply Commission,South Africa). The Swedish International Cooperation DevelopmentAgency (SIDA) financed the later stages of the project. The NationalResearch Foundation (NRF, GUN 2053236) supported L. Scott.

Appendix 1
Braamhoek AH1 pollen diagram illustrating the terrestrial taxa. Percentages are based on the pollensum, including all terrestrial taxa.
255E.N
orströmet
al./Palaeogeography,Palaeoclim
atology,Palaeoecology271
(2009)240
–258

Appendix 2
a) Braamhoek AH1 pollen diagram illustrating taxa associated with the local wetland environment. Percentages are based on the total count. Algae are excluded from the sum and illustratedas a percentage of the total pollen count. b) Pollen diagram showing the representation of local versus regional pollen.
256E.N
orströmet
al./Palaeogeography,Palaeoclim
atology,Palaeoecology271
(2009)240
–258

257E. Norström et al. / Palaeogeography, Palaeoclimatology, Palaeoecology 271 (2009) 240–258
References
Abell, P.I., Plug, I., 2000. The Pleistocene/Holocene transition in South Africa: evidencefor the Younger Dryas event. Global and Planetary Change 26, 173–179.
Acocks, J.P.H., 1953. Veld types of South Africa. Memoirs of the Botanical Survey of SouthAfrica. Government Printer, Pretoria. 192pp.
Alley, R.B.,Meese,D.A., Shuman, C.A., Gow, A.J., Taylor, K.C., Grootes, P.M.,White, J.W.C., Ram,M.,Waddington, E.D.,Mayewski, P.A., Zielinski,G.A.,1993.Abrupt increase inGreenlandsnow accumulation at the end of the Younger Dryas event. Nature 362, 527–529.
Augustin, L., Barbante, C., Barnes, P.R.F., Barnola, J.M., Bigler, M., Castellano, E., Cattani, O.,Chappellaz, J., DahlJensen, D., Delmonte, B., Dreyfus, G., Durand, G., Falourd, S.,Fischer, H., Fluckiger, J., Hansson, M.E., Huybrechts, P., Jugie, R., Johnsen, S.J., Jouzel,J., Kaufmann, P., Kipfstuhl, J., Lambert, F., Lipenkov, V.Y., Littot, G.V.C., Longinelli, A.,Lorrain, R., Maggi, V., Masson-Delmotte, V., Miller, H., Mulvaney, R., Oerlemans, J.,Oerter, H., Orombelli, G., Parrenin, F., Peel, D.A., Petit, J.R., Raynaud, D., Ritz, C., Ruth,U., Schwander, J., Siegenthaler, U., Souchez, R., Stauffer, B., Steffensen, J.P., Stenni, B.,Stocker, T.F., Tabacco, I.E., Udisti, R., van deWal, R.S.W., van den Broeke, M., Weiss, J.,Wilhelms, F., Winther, J.G., Wolff, E.W., Zucchelli, M., 2004. Eight glacial cycles froman Antarctic ice core. Nature 429, 623–628.
Barker, P., Gasse, F., 2003. New evidence for a reduced water balance in East Africaduring the Last Glacial Maximum: implication for model-data comparison.Quaternary Science Reviews 22, 823–837.
Berger, A., Loutre, M.F., 1991. Insolation values for the climate of the last10,000,000 years. Quaternary Science Reviews 10, 297–317.
Berglund, B.E., Ralska-Jasiewiczowa, M., 1986. Handbook of Holocene Paleoecology andPaleohydrology. Wiley, Chichester. 869pp.
Bond, W.J., 1997. Fire. In: Cowling, R.M., Richardson, D.M., Pierce, S.M. (Eds.), Vegetationof Southern Africa. Cambridge University Press, Cambridge. 615p.
Bond, G.C., Lotti, R., 1995. Iceberg discharges into the north-Atlantic on millennial timescales during the last glaciation. Science 267, 1005–1010.
Bond,W.J., Midgley, G.F., Woodward, F.I., 2003a. The importance of lowatmospheric CO2
and fire in promoting the spread of grasslands and savannas. Global Change Biology9 (7), 973–982.
Bond,W.J., Midgley, G.F.,Woodward, F.I., 2003b.What controls South African vegetation—climate or fire? South African Journal of Botany 69, 79–91.
Bonnefille, R., Riollet, G., 1980. Pollens des savanes d'Afrique orientale. CNRS Editions,Paris. 140p.
Brook, E.J., Harder, S., Severinghaus, J., Steig, E.J., Sucher, C.M., 2000. On the origin andtiming of rapid changes in atmospheric methane during the last glacial period.Global Biogeochemical Cycles 14, 559–572.
Caratini, C., Guinet, P., 1974. Pollen et spores d'Afrique tropicale. Travaux et Documentsde Géographie Tropicale, 16. Association des Palynologues de Langue Française.CNRS, Talence. 282p.
Carcaillet, C., Perroux, A.-S., Genries, A., Perrette, Y., 2007. Sedimentary charcoal patternin a karstic underground lake, Vercors massif, French Alps: implications for palaeo-fire history. Holocene 17, 845–850.
Chase, M.J., Meadows, M.E., 2007. Late Quaternary dynamics of southern Africa's winterrainfall zone. Earth-Science Reviews 84, 103–138.
Clark, R.L., 1984. Effects of charcoal on pollen preparation procedures. Pollen et Spores24, 525–535.
Coetzee, J.A., 1967. Pollen analytical studies in East and Southern Africa. In: van ZinderenBakker, E.M. (Ed.), Palaeoecology of Africa 3. Balkema, Cape Town, p. 146.
Cooremans, B., 1989. Pollen production in central southern Africa. Pollen et Spores 31,61–78.
Cowling, R.M., Richardson, D.M., Mustart, P.J., 1997. Fynbos. In: Cowling, R.M.,Richardson, D.M., Pierce, S.M. (Eds.), Vegetation of Southern Africa. CambridgeUniversity Press, Cambridge, p. 615.
Deacon, H.J., Deacon, J., 1999. Human beginnings in South Africa. Uncovering the secretsof the Stone Age. David Phillip Publishers, Cape Town. 214pp.
Ehleringer, J.R., Cerling, T.E., Helliker, B.R., 1997. C4 photosynthesis, atmospheric CO2,and climate. Oecologia 112, 285–299.
Fægri, K., Iversen, J., 1964. Textbook of pollen analysis. Scandinavian University Books,Copenhagen. 237pp.
Gajewski, K., Lezine, A.M., Vincens, A., Delestan, A., Sawada, M., 2002. Modern climate-vegetation-pollen relations in Africa and adjacent areas. Quaternary ScienceReviews 21, 1611–1631.
Garcin, Y., Williamson, D., Taieb, M., Vincens, A., Mathé, P.-E., Majule, A., 2006.Centennial to millennial changes in maar-lake deposition during the last45,000 years in tropical Southern Africa (Lake Masoko, Tanzania). Palaeogeography,Palaeoclimatology, Palaeoecology 239, 334–354.
Garcin, Y., Vincens, A., Williamson, D., Buchet, G., Guiot, J., 2007. Abrupt resumption ofthe African Monsoon at the Younger Dryas-Holocene climatic transition. Quatern-ary Science Reviews 26, 690–704.
Gasse, F., 2000. Hydrological changes in the African tropics since the Last GlacialMaximum. Quaternary Science Reviews 19, 189–211.
Grimm, E.C., 1987. CONISS: a Fortran 77 program for stratigraphically constrined clusteranalysis by the method of international sum of sequences. Computer andGeosciences 13, 13–35.
Grootes, P.M., Stuvier, M., White, J.W.C., Johnsen, S., Jouzel, J., 1993. Comparison ofoxygen isotope records from GISP2 and GRIP Greenland ice cores. Nature 366(6455), 552–554.
Harrison, S.P., Prentice, I.C., 2003. Climate and CO2 controls on global vegetationdistribution at the last glacial maximum: analysis based on palaeovegetation data,biome modeling and palaeoclimate simulations. Global Change Biology 9, 983–1004.
Hilliard, O.M., 1985. Trees and shrubs of the Natal Drakensberg. University of NatalPress, Pietermaritzburg. 40p.
Holmgren, K., Lee-Thorp, J.A., Cooper, G.R.J., Lundblad, K., Partridge, T.C., Scott, L.,Sithaldeen, R., Talma, A.S., Tyson, P.D., 2003. Persistent millennial-scale climaticvariability over the past 25,000 years in Southern Africa. Quaternary ScienceReviews 22, 2311–2326.
Johnson, T.C., Brown, E.T., McManus, J., Barry, S., Barker, P., Gasse, F., 2002. A highresolution paleoclimate record spanning the past 25000 years in southerna eastAfrica. Science 269, 113–132.
Jolly, D., Prentice, I.C., Bonnefille, R., Ballouche, A., Bengo, M., Brenac, P., Buchet, G.,Burney, D., Cazet, J.P., Cheddadi, R., Edorh, T., Elenga, H., Elmoutaki, S., Guiot, J.,Laarif, F., Lamb, H., Lezine, A.M., Maley, J., Mbenza, M., Peyron, O., Reille, M.,Reynaud-Farrera, I., Riollet, G., Ritchie, J.C., Roche, E., Scott, L., Ssemmanda, I., Straka,H., Umer, M., Van Campo, E., Vilimumbalo, S., Vincens, A., Waller, M., 1998. Biomereconstruction from pollen and plant macrofossil data for Africa and the Arabianpeninsula at 0 and 6000 years. Journal of Biogegraphy 25, 1007–1027.
Killick, D., 1990. A field guide to the flora of the Natal Drakensberg. Jonathan Ball and Ad.Donker Publishers, Johannesburg. 200pp.
Kershaw, A.P., Bush, M.B., Hope, G.S., Weiss, K.F., Goldemmer, J.G., Sanford, R., 1997. Thecontribution to humans to past biomass burning in the tropics. In: Clarc, J.S.,Cachier, H., Goldammer, J.G., Stocks, B. (Eds.), Sediment records of biomass burningand global change. Springer Verlag, Berlin, pp. 413–442.
Kotze, D.C., O'Connor, T.G., 2000. Vegetation variation within and among palustrinewetlands along an altitudinal gradient in KwaZulu-Natal, South Africa. PlantEcology 146, 77–96.
Kristen, I., Fuhrmann, A., Thorpe, J., Röhl, U., Wilkes, Oberhänsli, H., 2007. Hydrologicalchanges in southern Africa over the last 200 ka as recorded in lake sediments fromthe Tswaing impact crater. South African Journal of Geology 110, 311–326.
Lamb, A.L., Leng, M.J., Mohammed, M.U., Lamb, H.F., 2004. Holocene climate andvegetation change in the Main Ethiopian Rift Valley, inferred from the composition(C/N and delta C-13) of lacustrine organic matter. Quaternary Science Reviews 23,881–891.
Livingstone, D.A., 1967. Postglacial vegetation of the Ruwenzori Mountains in EquatorialAfrica. Ecological Monographs 37, 25–52.
MacDonald, G.M., Larsen, C.P.S., Szeicz, J.M., Moser, K.A., 1991. The reconstruction ofBoreal Forest-fire history from lake-sediments — a comparison of charcoal, pollen,sedimentological and geochemical indexes. Quaternary Science Reviews 10, 53–71.
McCormac, F.G., Hogg, A.G., Blackwell, P.G., Buck, C.E., Higham, T.F.G., Reimer, P.J., 2004.SHCal04 Southern Hemisphere calibration, 0–11.0 cal kyr BP. Radiocarbon 46,1087–1092 (http://www.radiocarbon.org/IntCal04.htm).
Meadows, M.E., 1988. Late Quaternary peat accumulation in southern Africa. Catena 15,459–472.
Meyers, P.A., 1994. Preservation of elemental and isotopic source identification ofsedimentary organic matter. Chemical Geology 114, 289–302.
Mitchell, P., 1994. The archaeology of the Phuthiatsana-ea-Thaba Bosiu Basin, Lesotho,southernAfrica: changes inLater SyoneAge regional demography. Antiquity 68, 83–96.
Mitchell, P., 1996. The late Quaternary of the Lsotho highlands, southern Africa:preliminary results and future potential of ongoing research at Sehonghong shelter.Quaternary International 33, 35–43.
Mitchell, P., Parkington, J., Wadel, L., 1998. A tale from three regions: the archaeology ofthe Pleistocene/Holocene transition in the Western Cape, the Caledon Valley andthe Lesptho highlands, southern Africa. Quaternary International 49/50, 105–115.
Monnin, E., Indermühle, A., Dällenbach, A., Flückiger, J., Stauffer, B., Stocker, T.F.,Raynaud, D., Barnola, J.-M., 2001. Atmospheric CO2 concentrations over the LastGlacial Termination. Science 291, 112–114.
Morrison, M.E.S., 1968. Vegetation and climate in the uplands of south-western Ugandaduring the later Pleistocene period. Journal of Ecology 56, 363–384.
Mucina, L., Rutherford, M.C., 2006. The vegetation of South Africa, Lesotho and Swaziland.Strelitzia 19. South African National Biodiversity Institute, Pretoria. 807pp.
Nakagagawa, T., Brugiapaglia, E., Digerfeldt, G., Reille, M., de Beaulieu, J., Yasuda, Y.,1998.Dense-media separation as more efficient pollen extraction method for use withorganic sediment/deposit samples: comparison with the conventional method.Boreas 27, 15–24.
Neumann, F.H., Stager, J.C., Scott, L., Venter, H.J.T., Weyhenmayer, C., 2008. Holocenevegetation and climate records from Lake Sibaya, KwaZulu-Natal (South Africa).Review of Palaeobotany and Palynology 152, 113–128.
Nyakale, M., Scott, L., 2002. Interpretation of Late Holocene pollen in channel fills in theeastern Free State, South Africa. South African Journal of Botany 68, 464–468.
O'Connor, T.G., Bredenkamp, G.J., 1997. Grassland. In: Cowling, R.M., Richardson, D.M.,Pierce, S.M. (Eds.), Vegetation of Southern Africa. Cambridge University Press,Cambridge, pp. 215–245.
Partridge, T.C., DeMenocal, P.B., Lorentz, S.A., Paiker, M.J., Vogel, J.C.,1997. Orbital forcingof climate over South Africa: a 200,000 year rainfall record from the PretorisSaltpan. Quaternary Science Reviews 16, 1125–1133.
Partridge, T.C., Scott, L., Schneider, R.R., 2004. Between Agulhas and Benguela:responses of southern African climate of the late Pleistocene to current fluxes,orbital precession and the extent of the circum-antarctic vortex. In: Battarbee, R.W.,Gasse, F., Stickley, C.E. (Eds.), Past Climate Variability through Europe and Africa.Springer, Dordrecht, pp. 45–68.
Patterson, W.A., Edwards, K.J., Maguire, D.J., 1987. Microscopic charcoal as a fossilindicator of fire. Quaternary Science Reviews 6, 3–23.
Petit, J.R., Jouzel, J., Raynaud, D., Barkov, N.I., Barnola, J.M., Basile, I., Bender, M.,Chappellaz, J., Davis, M., Delaygue, G., Delmotte, M., Kotlyakov, V.M., Legrand, M.,Lipenkov, V.Y., Lorius, C., Pepin, L., Ritz, C., Saltzman, E., Stievenard,M.,1999. Climateand atmospheric history of the past 420,000 years from the Vostok ice core,Antarctica. Nature 399 (6735), 429–436.
Pitkänen, A., Lehtonen, H., Huttunen, P., 1999. Comparison of sedimentary microscopiccharcoal particle records in a small lake with dendrochronological data: evidence

258 E. Norström et al. / Palaeogeography, Palaeoclimatology, Palaeoecology 271 (2009) 240–258
for the local origin of microscopic charcoal produced by forest fires of low intensityin eastern Finland. The Holocene 559–567.
Pooley, E., 1998. A field guide to wild flowers. KwaZulu-Natal and the Eastern Region.Natal Flora Publications Trust, Durban. 630pp.
Reimer, P.J., Baillie, M.G.L., Bard, E., Bayliss, A., Beck, J.W., Bertrand, C.J.H., Blackwell, P.G.,Buck, C.E., Burr, G.S., Cutler, K.B., Damon, P.E., Edwards, R.L., Fairbanks, R.G.,Friedrich, M., Guilderson, T.P., Hogg, A.G., Hughen, K.A., Kromer, B., McCormac, G.,Manning, S., Ramsey, C.B., Reimer, R.W., Remmele, S., Southon, J.R., Stuiver, M.,Talamo, S., Taylor, F.W., van der Plicht, J., Weyhenmeyer, C.E., 2004. IntCal04terrestrial radiocarbon age calibration, 0–26 cal kyr BP. Radiocarbon 46, 1029–1058.
Ryner, M., Bonnefille, R., Holmgren, K., Muzuka, A., 2006. Vegetation changes inEmpakaai Crater, northern Tanzania, at 14 800–9 300 cal yr BP. Review ofPaleobotany and Palynology 140, 163–174.
Sankaran, M., Hanan, N., Scholes, R.J., Ratnam, J., Augustine, D., Cade, B.S., Gignoux, J.,Higgins, S.I., Le Roux, X., Ludwig, F., Ardo, J., Banyikwa, F., Bronn, A., Bucini, G., Caylor,K.K., Coughenour, M.B., Diouf, A., Ekaya, W., Feral, C.J., February, E.C., Frost, P.G.H.,Hiernaux, P., Hrabar, H., Metzger, K.L., Prins, H.H.T., Ringrose, S., Sea, W., Tews, J.,Worden, J., Zambatis, N., 2005. Determinants of woody cover in African savannas.Nature 438, 846–849.
Schulze, R.E., 1997. South African atlas of agrohydrology and climatology. WaterResearch Commision Report. TT82/96.
Scott, L., 1982a. Late Quaternary fossil pollen grains from the Transvaal, South Africa.Review of Paleobotany and Palynology 36, 241–278.
Scott, L., 1982b. A late Quaternary pollen record from the Transvaal bushveld, SouthAfrica. Quaternary Research 17, 339–370.
Scott, L., 1989. Late Quaternary vegetation history and climate change in the easternOrange Free State, South Africa. South African Journal of Botany 55l, 107–116.
Scott, L., 1992. Environmental implications and origin of micrscopic PseudoschizaeaThiergart and Frantz ex-protonie emend in sediments. Journal of Biogeography 19–4,349–354.
Scott, L., 1999. Vegetation history and climate in the savanna biome South Africa since190,000 ka: a comparison of pollen data from the Tswaing Crater (the Pretoriasaltpan) and Wonderkrater. Quaternary International 57/58, 215–223.
Scott, L., 2002. Microscopic charcoal in sediments: Quaternary fire history of thegrassland and savanna regions in South Africa. Journal of Quaternary Science 17,77–86.
Scott, L., Lee-Thorp, J.A., 2004. Holocene climatic trends and rhythms in Southern Africa.In: Battarbee, R.W., Gasse, F., Stickley, C.E. (Eds.), Past Climate Variability throughEurope and Africa. Springer, Dordrecht, pp. 69–91.
Scott, L., Nyakale, M., 2002. Pollen indications of Holocene palaeoenvironments atFlorisbad in the central Free State. South Africa. The Holocene 12, 497–503.
Scott, L., Thackeray, J.F., 1987. Multivariate analysis of late Pleistocene and Holocenepollen spectra fromWonderkrater, Transvaal, South Africa. South African Journal ofScience 83, 93–98.
Scott, L., Woodborne, S., 2007. Vegetation history inferred from pollen in LateQuaternary faecal deposits (hyraceum) in the Cape winter-rain region and itsbearing on past climates in South Africa. Quaternary Science Reviews 26, 941–953.
Scott, L., Steenkamp, M., Beaumont, P.B., 1995. Palaeoenvironmental conditions in SouthAfrica at the Pleistocene–Holocene transition. Quaternary Science Reviews (GlobalYounger Dryas Issue) 14, 937–947.
Scott, L., Holmgren, K., Talma, A.S., Woodborne, S., Vogel, J.C., 2003. Age interpretation ofthe Wonderkrater spring sediments and vegetation change in the Savanna Biome,Limpopo province, South Africa. South African Journal of Science 99, 484–488.
Scott, L., Holmgren, K., Partridge, T.C., 2008. Reconciliation of vegetation and climaticinterpretations of pollen and other regional records from the last 60 thousand yearsin the Savanna Biome of Southern Africa. Palaeogeography, Palaeoclimatology,Palaeoecology 257, 198–206.
Smith, J.M., Lee-Thorp, J., Sealy, J., 2002. Stable carbon and oxygen isotopic evidence forlate Pleistocene tomiddle Holocene climatic fluctuations in the interior of southernAfrica. Journal of Quaternary Science 17, 683–695.
Stieg, E.J., Morse, D.L., Waddington, E.D., Stuvier, M., Grootes, P.M., Mayewski, P.A.,Twickler, M.S., Whitlow, S.I., 2000. Wisconsian and Holocene climate history from
an ice core at Taylor Dome, Western Ross Embayment, Antarctica. GeografiskaAnnaler 82A, 213–235.
Stock, W.D., Chuba, D.K., Verboom, G.A., 2004. Distribution of South African C-3 and C-4species of Cyperaceae in relation to climate and phylogeny. Austral ecology 29,313–319.
Stockmarr, J., 1971. Tablet with spores used in absolute pollen analysis. Pollen Spores 13,614–621.
Talbot, M.R., 2001. Nitrogen isotopes in palaeolimnology. In: Smol, J.P., Birks, H., Last, W.(Eds.), Tracking environmental change using lake sediments. Kluwer AcademicPublishers, Dordrecht/Boston, pp. 401–439.
Talbot, M., Filippi, M., Jensen, N., Tiercelin, J.-J., 2007. An abrupt change in the Africanmonsoon at the end of the Younger Dryas. Geochemistry geophysics geosystems 8art. no. Q03005.
Talma, A.S., Vogel, J.C., 1992. Late Quaternary Paleotempreatures derived from aspeleothem from Cango caves, Cape Province, South Africa. Quaternary Research 37,203–213.
Thomas, V., Grant, R., 2002. Sappi tree spotting. Highveld and the Drakensberg. JacanaEducation, Johannesburg. 306pp.
Tierny, J.E., Russel, J.M., 2007. Abrupt climate change in southeast tropical Africainfluenced by Indianmonsoon variability and ITCZmigration. Geophysical ResearchLetters 34, L15709. doi:10.1029/2007GL029508.
Tinner, W., Conedera, M., Ammann, B., Gaggeler, H.W., Gedye, S., Jones, R., Sagesser, B.,1998. Pollen and charcoal in lake sediments compared with historicallydocumented forest fires in southern Switzerland since AD 1920. Holocene 8, 31–42.
Tolonen, M., 1985. Palaeoecological record of local fire history from a peat deposit in SWFinland. Annales Botanici Fennici 22, 15–29.
Trollope, W.S.W., 1993. Fire regime of the Kruger National Park for the period 1980–1992. Koedoe 36, 45–52.
Tyson, P.D., Preston-Whyte, R.A., 2000. The weather and climate of Southern Africa.Oxford University Press Southern Africa, Cape Town. 396pp.
van Wyk, B., van Wyk, P., 1997. Field guide to trees of Southern Africa. Struik PublishersLtd., Cape Town. 536pp.
van Zinderen Bakker, E.M., 1953–1956. South African Pollen Grains and Spores. I and II.Balkema A.A., Cape Town.
van Zinderen Bakker, E.M., Coetzee, J.A., 1959. South African Pollen Grains and Spores.III. Balkema A.A., Cape Town.
van Zinderen Bakker, E.M., Werger, M.J.A., 1974. Environment, vegetation andphytogeography of the high altitude bogs of Lesotho. Vegetatio 29, 37–49.
Vincens, A., Bremond, L., Brewer, S., Buchet, G., Dussouillez, 2006. Modern pollen-basedbiome reconstructions in East Africa expanded to southern Tanzania. Review ofPaleobotany and Palynology 140, 187–212.
Vincens, A., Garcin, Y., Buchet, G., 2007. Influence of rainfall seasonality on Africanlowland vegetation during the Late Quaternary: pollen evidence from Lake Masoko,Tanzania. Journal of Biogeography 34, 1274–1288.
Visser, H.N., Bishop, D.W., 1976. The geology of the Newcastle and Dundee areas and adetailed description of the Klip River coalfield of northern Natal. Sheet 2829B(Elandslaagte). Geological survey, Memoir 68. Department of Mines, South Africa.The Governmental Printer, Pretoia. 198p.
Vogel, J.C., Fuls, A., Ellis, R.P., 1978. The geographical distribution of Kranz Grasses inSouth Africa. South African Journal of Science 47, 209–215.
Vogel, J.C., Fuls, A., Visser, E., Becker, B., 1993. Pretoria calibration curve for short-livedsamples 1930–3350 BC. In: Stuvier, M., Kra, R.S. (Eds.), Calibration issue 1993.Radiocarbon, 35–1, pp. 73–85.
Wadley, L., 1995. Review of dated Stone Age sites recently excavated in the eastern FreeState, South Africa. South African Journal of Science 91, 574–582.
Werger, M.J.A., 1978. Biogeography and ecology of Southern Africa, vol 31. Dr. W. Junksbv Publishers, The Hague. 1455p.
White, F.,1978. TheAfromontane region. In:Werger,M.J.A. (Ed.), Biogeographyand ecologyof Southern Africa, vol. 31. Dr. W. Junks bv Publishers, The Hague, pp. 463–510.