THE RELATIONSHIP BETWEEN ACADEMIC EMPHASIS AND ...
140
THE RELATIONSHIP BETWEEN ACADEMIC EMPHASIS AND ACADEMIC ACHIEVEMENT FOR AFRICAN-AMERICAN STUDENTS IN PREDOMINATELY WHITE SUBURBAN SCHOOLS DISSERTATION Presented in Partial Fulfillment of the Requirements for the Doctor of Philosophy Degree in the Graduate School of The Ohio State University By Julio Ceaser Olivo II, M.A. Collage of Education and Human Ecology The Ohio State University 2010 Dissertation Committee: Dr. Antoinette Miranda, Advisor Dr. Adrienne Dixson Dr. Kisha M. Radliff
-
Upload
khangminh22 -
Category
Documents
-
view
3 -
download
0
Transcript of THE RELATIONSHIP BETWEEN ACADEMIC EMPHASIS AND ...

THE RELATIONSHIP BETWEEN ACADEMIC EMPHASIS AND ACADEMIC ACHIEVEMENT FOR AFRICAN-AMERICAN STUDENTS
IN PREDOMINATELY WHITE SUBURBAN SCHOOLS
DISSERTATION
Presented in Partial Fulfillment of the Requirements for the Doctor of Philosophy Degree in the Graduate School of The Ohio State University
By
Julio Ceaser Olivo II, M.A.
Collage of Education and Human Ecology
The Ohio State University
2010
Dissertation Committee:
Dr. Antoinette Miranda, Advisor
Dr. Adrienne Dixson
Dr. Kisha M. Radliff

ii
ABSTRACT African-American students in suburban schools are underperforming. Data
reveals that African-American students who attend suburban schools do not perform as
well as their Caucasian peers (Alson, 2003; Ferguson, Clark, & Stewart, 2002; Ogbu,
2002). The achievement gap between African-American and Caucasian students appears
in not only scores, but also in other academic areas, such as attendance rates, graduation
rates, special and gifted education placements, percentages of students in college
preparatory or advanced placement classes, numbers of students in extracurricular
activities, honor roll nominations, and grade-point-averages (Kober, 2001; Ogbu, 2002).
The purpose of this study is to examine the difference in academic emphasis between
high performing and low performing African-Americans in predominately white
suburban schools by examining the relationship between academic emphasis and the
achievement of African-American students. More specifically, examine the relationship
between academic emphasis and the achievement of African-American children in
predominately white suburban schools by observing the opinions of parents. The study is
designed to indicate the importance of School, Family, Children, and Student Peer
Academic Emphasis for African-American children in predominately white suburban
schools based on parents’ perceptions. Participants in this study were black parents of

iii
221 African-American students attending predominately white suburban schools.
Parents’ opinions were collected during the third quarter of the academic school year
2007- 08 using a self-constructed questionnaire. Results reflected that after controlling
for significant demographic variables, School Academic Emphasis was not related to
grade point average; however, Family, Children, and Student Peer Academic Emphasis,
as well as, characteristics of academic emphasis remained to have significant
relationships to student achievement.

iv
Dedicated to my family, friends, and the people of Newark, New Jersey.

v
ACKNOWLEDGMENTS
I would like to thank everyone who has helped me with my dissertation. Thank
you: mommy (Nigi Olivo), daddy (Julio Olivo), Sally Mezon-Olivo (wife), Pedro G.
Olivo (brother), Dr. Antoinette Miranda, Dr. Robert Ransom, Michelle Chambers, Dr.
Jeffrey Levy, Dr. Eric Rodriguez, Dr. Adrianne “Epistemology” Dixson, Dr. Kisha
Radliff, Dr. Wayne Hoy, LeKeshea Brooks-Wertz, Martha Flohr, Timothy Flohr, Andrea
Frankiewicz, Nancy Hill-McClary, Mingnon Morton, Katherine Mosher, Deborah
O’Neal, Kathy Ordonez, Yos Reyes, Rick Richardson, Glorymar Rosario, Alex Rosario,
Edith Velez, and Dolcé. Than you so much! Without your help this dissertation was not
possible.

vi
VITA
January 11, 1981..............................................Born – Newark, New Jersey May 12, 2003...................................................B.S.E. Education and Psychology,
Seton Hall University, South Orange, New Jersey
September 24, 2003 – Present.........................School Psychology Graduate Student, The Ohio State University, Columbus, Ohio September 24, 2003 – June 7, 2007…………Graduate Administrative Assistant, The Office of Equity and Diversity College of Education and Human Ecology The Ohio State University, Columbus, Ohio June 12, 2005………………………………...M.A. School Psychology, The Ohio State University, Columbus, Ohio December 7, 2006............................................Post M.A. Educational Administration The Ohio State University, Columbus, Ohio September 4, 2007 – Present……...…………School Psychologists, Newark Public School, Newark, New Jersey
PUBLICATIONS Miranda, A.H. & Olivo II, J.C. (2008). Best practices in urban school psychology. In Thomas & J. Grimes (Eds.), Best practices in school psychology V. Washington,
D.C. National Association of School Psychologists.
FIELDS OF STUDY Major Field: Education and Psychology

vii
TABLE OF CONTENTS Page
Abstract……………………………………………………................................................ii Dedication...........................................................................................................................iv Acknowledgements………………………………..............................................................v Vita……..............................................................................................................................vi List of Tables......................................................................................................................ix Chapters: 1. Introduction……………..........................................................................................1
1.1 Statement of the Problem……………………………………………………...5 1.2 Objectives of the Study………………………………………………………..6 1.3 Research Questions……………………………………………………………6 1.4 Definition of Terms……………………………………………………………8 1.5 Limitations of the Study……………………………………...………………10 1.6 Basic Assumptions…………………………………………………………...11
2. Literature Review………………………………………………………………...12
2.1 The Achievement Gap in Education................................................................12 2.2 The Achievement Gap in Early and Primary Education..................................13 2.3 The Achievement Gap in Elementary and Secondary Education....................15 2.4 The Achievement Gap in Post-Secondary Education......................................20 2.5 No Child Left Behind.......................................................................................23 2.6 Achievement Gap in Predominately White Suburban Schools.......................24 2.7 Academic Emphasis and the Achievement Gap..............................................35 2.8 Limitations of Previous Studies.......................................................................36 2.9 Conclusion.......................................................................................................37
3. Methodology..........................................................................................................39
3.1 Participants.......................................................................................................39 3.2 Materials..........................................................................................................40 3.3 Measurements..................................................................................................41
3.3.1 School Academic Emphasis..............................................................42 3.3.2 Family Academic Emphasis.............................................................42

viii
3.3.3 Children Academic Emphasis...........................................................43 3.3.4 Student Peer Academic Emphasis....................................................44 3.3.5 Setting Goals.....................................................................................45 3.3.6 Setting Environment.........................................................................46 3.3.7 Believing in Children........................................................................46
3.3.8 Working Hard...................................................................................47 3.3.9 Acknowledging Achievement...........................................................47 3.3.10 Demographic Variables..................................................................48 3.3.11 Student Achievement......................................................................50
3.4 Validity............................................................................................................50 3.5 Reliability.........................................................................................................51 3.6 Design and Procedures.....................................................................................52 3.7 Data Analysis Plan...........................................................................................55 4. Results....................................................................................................................60
4.1 Research Question 1........................................................................................64 4.2 Research Question 2........................................................................................65 4.3 Research Question 3........................................................................................67 4.4 Research Question 4........................................................................................69 4.5 Research Question 5........................................................................................72 4.6 Research Question 6........................................................................................74 4.7 Research Question 7........................................................................................75 4.8 Research Question 8........................................................................................78
5. Discussion..............................................................................................................83
5.1 Overview..........................................................................................................83 5.2 Summary of Findings and Interpretations........................................................82
5.2.1 Research Question 1.........................................................................85 5.2.2 Research Question 2.........................................................................88 5.2.3 Research Question 3.........................................................................89 5.2.4 Research Question 4.........................................................................90 5.2.5 Research Question 5.........................................................................91 5.2.6 Research Question 6.........................................................................93 5.2.7 Research Question 7.........................................................................94 5.2.8 Research Question 8.........................................................................94
5.3 Implications for Helping African-American Students in Suburban Schools...96 5.3.1 Setting Challenging Goals for African-American Children.............97
5.3.2 Organizing an Environment Conducive to Learning for African- American Children............................................................................98 5.3.3 Believing in the Abilities of African-American Children...............100 5.3.4 Working Hard to Provide African-American Children with an Adequate Education........................................................................101

ix
5.3.5 Acknowledging the Achievement of African-American Children...........................................................................................104
5.4 Implications for Future Research...................................................................105 5.5 Summary and Conclusion..............................................................................106
6. Appendixes..........................................................................................................109 6.1 Appendix A: Academic Emphasis Scales......................................................109 6.2 Appendix B: Demographic Variable Questions............................................112 6.3 Appendix C: Initial Postcard..........................................................................114 6.4 Appendix D: Initial Cover Letter...................................................................116 6.5 Appendix E: Final Cover Letter.....................................................................118 6.6 Appendix F: Final Postcard...........................................................................120 7. List of References................................................................................................122

x
LIST OF TABLES
Table Page Table 3.1: Coefficient Alphas for Academic Emphasis Scales and Characteristics..........52
Table 4.1: Descriptive Statistics for Continuous Demographic Variables and Grade Point Average...……………………………………………………………….61 Table 4.2: Frequencies and Percents for Categorical Demographic Variables.................62
Table 4.3: Descriptive Statistics for Academic Emphasis Scales and Characteristics…..63 Table 4.4: Correlation Analyses for Academic Emphasis Scales, Characteristics of
Academic Emphasis, and Demographic Variables…………………………...66 Table 4.5: Correlation Analyses for Academic Emphasis Scales and Grade Point
Average……………………………………………………………………….67 Table 4.6: Correlation Analyses for Demographic Variables and Grade Point
Average…………………………………………………………………….....68 Table 4.7: Partial Correlation Analyses for Academic Emphasis Scales and Grade
Point Average...……………………………………………………………….69 Table 4.8: Frequencies and Percents for Students with High Levels of Zero, One,
Two, Three and Four Forms of Academic Emphasis.......……………………70 Table 4.9: UNIANOVA Table Showing the Significance of Having High Levels of
Two or More Forms of Academic Emphasis....................................................72 Table 4.10: Correlation Analyses for Characteristics of Academic Emphasis and
Grade Point Average.………………………………………………………..73 Table 4.11: Partial Correlation Analyses for Characteristics of Academic Emphasis
and Grade Point Average……………………………………………………75 Table 4.12: Frequencies and Percents for Students with High Levels of Zero, One, Two,
Three, Four, and Five Characteristics of Academic Emphasis......................76

xi
Table 4.13: UNIANOVA Table Showing the Significance of Having High Levels of
Three or More Characteristics of Academic Emphasis.................................77 Table 4.14: Self-Reported Causes for the Achievement Gap…………………………...80 Table 4.15: Partial Correlation Analyses for Self-Reported Causes for the
Achievement Gap from Parents of High and Low Achieving Students..…..82

1
CHAPTER 1
INTRODUCTION
On July 2, 1966, James S. Coleman changed the perception on the achievement
gap in American public schools with his report, “The Equality of Educational
Opportunity.” Data from his report suggested that achievement gaps between African-
American and Caucasian students were a result of differences in socioeconomic
characteristics and not the quality of education (Coleman, 1966). At the time, it was
commonly believed that the achievement gap was attributed to the difference in education
provided to African-American students when compared to Caucasian students –
suggesting that African-Americans did not receive a quality education. Coleman’s data
alluded to the fact that the quality of education was not the cause of the achievement gap.
According to Coleman, schools predominately enrolled with African-American students
had similar characteristics and funding to those predominately enrolled with Caucasian
students. Thus, suggesting that achievement gaps could not be reduced by improving the
quality of education for African-American students. Instead, Coleman implied that
integration was the key to eliminate the achievement gap in America. By integrating
schools, African-American students would benefit from factors associated with middle
class Caucasian children such as their attitudes towards achievement. Coleman suggested

2
that African-American students had less confidence in their abilities to control outcomes
in their lives. As a result of Coleman’s study, the United States Department of Education
strengthened their plan to desegregate public schools across America. Unfortunately,
instead of improving the quality of education for schools located in urban areas, African-
American students were transferred to schools outside of their neighborhoods
(Schugurensky, 2002). Thus, the belief that education is better in suburban schools was
thereafter upheld as a fact by many Americans.
Researchers like Ronald R. Edmonds and John R. Frederiksen attempted to
disprove Coleman’s findings by identifying schools in lower class urban neighborhoods
that were successful in educating children in poverty. Based on their analysis of
Coleman’s study, Edmonds and Frederiksen concluded that achievement gaps are
attributed to the quality of education provided by schools – not socioeconomic
characteristics. They revealed that the differences in achievement gaps were attributed to
five characteristics of schools. These characteristics were: (1) principal leadership, (2) a
high level of student expectation, (3) orderly and structured classrooms, (4) teachers
dedication to education, and (5) monitoring student progress. With the recognition of
successful schools in lower class urban neighborhoods, data supported that the quality of
education contributes to the achievement gap (Edmonds, 1979). Unfortunately, it is still
commonly believed by many that achievement gaps are a result of only socioeconomic
factors.
On January 1, 2003, this debate reopened with the release of John U. Ogbu’s book
titled, Black American Student in an Affluent Suburb. Ogbu’s book focused on
achievement gaps that exist in areas that many believed to be nonexistent such as those

3
that exist between African-American and Caucasian students in predominately white
affluent neighborhoods. Ogbu concluded that one of the many reasons the achievement
gap exists in predominately white suburban schools are because African-American
parents lack engagement in their children’s education – not the quality of education or
socioeconomic characteristics. Data in Ogbu’s study revealed that African-American
parents were less involved in their children’s education when compared to Caucasian
parents. Furthermore, African-American students were not taking advantage of
opportunities offered by schools in affluent neighborhoods (Ogbu, 2002). Black children
also took less challenging classes, completed less work, and did not participate in school
activities that promoted achievement. As concluded by Ogbu, the achievement gap in
affluent neighborhoods is a result of the lack of engagement from African-Americans in
predominately white suburban neighborhoods.
Ferguson (2002) attempted to disprove Ogbu’s findings in his study titled, What
Doesn’t Meet the Eye: Understanding and Addressing Racial Disparities in High-
Achieving Suburban Schools. Ferguson examined the differences in socioeconomic
characteristics as well as academic efforts and student performances. Ferguson’s data
revealed that although African-American children lived in middle class neighborhoods,
they still experienced far more socioeconomic difficulties when attending schools in
these neighborhoods. For instance, data revealed that African-American children in
middle class neighborhoods were more likely to live in households that consisted of one
parent, one parent and a step-parent, or no biological parents. Caucasian children were
more likely to live with both biological parents. Also, the study indicated that African-
American children were more likely to have three or more siblings with fewer resources

4
such as books at home or households that were limited to one computer. Assuming that
more siblings equal more sharing of resources, the study revealed that African-American
families were at a greater disadvantage than their Caucasian classmates (Ferguson, 2002).
For the most part, Ferguson suggested that socioeconomic characteristics could not be
left out when explaining the achievement gap in suburban schools.
With respect to school engagement, Ferguson (2002) revealed that the level of
engagement by African-American students did not explain the achievement gap in
suburban schools as indicated by Ogbu. Ferguson inferred that although behaviors
exhibited by African-American students were different from Caucasian students, the
difference was not significant nor should it be used to suggest that African-American
students lacked engagement. For instance, Ferguson concluded that Caucasian students
engaged in homework approximately five minutes more per night than African-American
students. However, this time difference was attributed to the types of classes in which
Caucasian students were enrolled – when comparing basic skills or advanced placement
classes. To a large extent, more African-American students were enrolled in basic skills
classes. The data also showed African-American students were also completing less
homework than Caucasian students. Again, Ferguson suggested that these findings were
also not significant and should not be used to infer that African-American students are
not engaged in their education. He believed that teachers also assumed that African-
American students were less engaged in their academics because they completed less
homework. Ferguson concluded that homework completion does not indicate how much
time was spent on homework – nor should it indicate student engagement. Students who
experienced difficulties in school may spend more time on homework while completing

5
less homework. For instance, in Ferguson’s study, data revealed that African-American
students worked longer to complete the same amount of homework as Caucasian
students. This could suggest that African-American students were just struggling to
complete their homework. Despite the aforementioned findings and potential rationales,
teachers may still assume African-American students are not interested in acquiring an
education.
Statement of the Problem
Research has indicated that there is an achievement gap between African-
American and Caucasian students in predominately white suburban schools.
Unfortunately, there is a disagreement on the primary cause of these gaps. Research has
also revealed that when opinions are surveyed from schools, most teachers and students
in predominately white suburban neighborhoods believe that the achievement gap is
attributed to African-American parents and their lack of engagement in their children’s
education. African-American parents’ opinions are rarely discussed. Secondly, research
has not identified the differences between high achieving and low achieving African-
American students in suburban schools. It may appear that all African-American
students in predominately white suburban schools are failing or have similar
characteristics. This is not the case. Therefore, the purpose of this study was to examine
the difference in academic emphasis between high performing and low performing
African-Americans in predominately white suburban schools by examining the
relationship between academic emphasis and the achievement of African-American
students based on parents’ perception. Parents’ opinions of the achievement gap and
academic emphasis were surveyed.

6
Objectives of the Study
This study was conducted to examine the achievement gap in suburban schools
beyond traditional research of achievement gaps in affluent areas. Again, in previous
studies, achievement gaps were usually examined to identify the differences between
African-American and Caucasian students. This study examined the achievement gap
between high achieving and low achieving African-American students in predominately
white suburban schools. In addition, this study collected African-American parents’
opinions about the achievement gap through a mail-in survey. In prior research that
analyzed the achievement of middle class African-American children, teachers and
students’ views were usually collected; parent opinions were rarely studied. This study
not only collected parent opinions, but examined the achievement gap from a socio-
cultural context. Students do not experience school in a vacuum but do so within a socio-
cultural context of school, family, children, and peers (PAES, 2009). The achievement
gap in this study was analyzed through four types of academic emphasis, namely, School,
Family, Children, and Student Peer Academic Emphasis.
Research Questions
1. Is there a significant correlation between academic emphasis, characteristics of
academic emphasis, and demographic variables for African-American children in
predominately white suburban schools?
2. How do School, Family, Children, and Student Peer Academic Emphasis load on
achievement for low achieving and high achieving African-American students in
predominately white suburban schools?

7
3. How do School, Family, Children, and Student Peer Academic Emphasis load on
achievement for low achieving and high achieving African-American students in
predominately white suburban school after controlling for significant
demographic variables?
4. Do African-American students with higher levels of two or more forms of
academic emphasis perform better than students with only one and no forms of
academic emphasis?
5. How do characteristics of academic emphasis (i.e., Setting Goals, Setting
Environment, Believing in Children, Working Hard, and Acknowledging
Achievement) load on achievement for low achieving and high achieving African-
American students in predominately white suburban schools?
6. How do characteristics of academic emphasis (i.e., Setting Goals, Setting
Environment, Believing in Children, Working Hard, and Acknowledging
Achievement) load on achievement for low achieving and high achieving African-
American students in predominately white suburban schools after controlling for
significant demographic variables?
7. Do African-American students with higher levels of three or more characteristics
of academic emphasis perform better than students with only two, one, and no
characteristics of academic emphasis?
8. What do parents of low achieving and high achieving African-American students
feel are the causes for achievement gaps in predominately white suburban
schools?

8
Definitions of Terms
1. Academic Emphasis – The extent to which emphasis is placed on academics. In
this study, such emphasis is measured by five characteristics. They are: setting
challenging goals, setting learning environments that are structured and conducive
to learning, believing in academic abilities, working hard towards academic
excellence, and respecting and acknowledging achievement.
2. School Academic Emphasis – The extent to which parents view school’s drive
toward academic achievement. Such drive is measured by: (1) parents’
perceptions of schools setting challenging goals for their children, (2) parents’
views of the school organizing an environment conducive to learning, (3) parents’
opinions of teachers believing in their children’s abilities, (4) parents’ perceptions
of teachers working hard to provide students with an adequate education, and (5)
parents’ take on schools acknowledging their children’s achievement.
3. Family Academic Emphasis – The extent to which parents view their own drive
toward helping their children achieve. It is measured by observing parents’ self-
perceptions of: (1) setting challenging but achievable goals for their children, (2)
managing a structured and orderly home, (3) believing in their children’s abilities,
(4) working hard for their children’s education, and (5) acknowledging their
children’s accomplishments.
4. Children Academic Emphasis – The extent to which parents’ view their children’s
drive towards academic excellence. It is measured by observing parents’
perception of their children’s determination. Such determination is measured by:
(1) parents’ views of their children setting challenging goals, (2) parents’ views of

9
their children creating an organized environment conducive to learning, (3)
parents’ opinions of their children’s confidence, (4) parents’ opinions of their
children’s studious practices, and (5) parents’ views on their children respecting
other students who achieve.
5. Student Peer Academic Emphasis – The extent to which parents view their
children’s friends and their drive toward academic excellence. Such drive is
measured by parents’ opinions of their children’s peers and their practice of: (1)
setting challenging goals, (2) belonging to a positive social group, (3) helping
their children with academic difficulties, (4) believing in their children, and (5)
respecting other children who achieve in school.
6. Characteristics of Academic Emphasis – Pertains to the characteristics of
academic emphasis. These characteristics are: setting challenging goals, setting
learning environments that are structured and conducive to learning, believing in
academic abilities, working hard toward academic excellence, and respecting and
acknowledging achievement.
7. Setting Goals – The extent to which parents view schools, their children, their
children’s peers, as well as themselves, setting challenging goals for their
children.
8. Setting Environment – The extent to which parents view schools, their children,
their children’s peers, as well as themselves, setting structured and organized
environments conducive to learning for their children.

10
9. Believing in Children – The extent to which parents view schools, their children,
their children’s peers, as well as themselves, believing in their children’s
academic abilities.
10. Working Hard – The extent to which parents view schools, their children, their
children’s peers, as well as themselves, working hard toward academic
excellence.
11. Acknowledging Achievement – The extent to which parents view schools, their
children, their children’s peers, as well as themselves, respecting and
acknowledging achievement.
12. Student Achievement – Pertains to the grade point average of students. Also
called academic achievement, grade point average, student performance, etc.
13. Predominately White Suburban Schools – Public schools located in a suburban
district where the majority of students are made up of Caucasian children.
Limitations of the Study
As with all research, the current study has a series of methodological limitations
that need to be taken into account. Although all participants were provided with a
questionnaire in a manner that would allow them to return their survey randomly, these
results may not be generalized to all African-American students in predominately white
suburban schools. Surveys were only collected from one Midwestern suburban
neighborhood. Secondly, there are drawbacks to using and relying on someone else’s
opinions when collecting data. While one of the purposes of this study was to collect
parents’ opinions, these opinions may not be as accurate when compared to the accuracy
of collecting data from school, children, and student peers. Parents may not have an

11
accurate account of academic emphasis provided by schools, children, and students’
peers.
Basic Assumptions
The following assumptions were made to collect the parents’ perceptions of
academic emphasis:
1. The perceptions of parents are meaningful.
2. Parents are knowledgeable of their children’s schools.
3. Parents are knowledgeable of their children’s behaviors.
4. Parents are knowledgeable of the behaviors of their children’s friends.
5. Parents will accurately record their perceptions of academic emphasis.
6. Parents will accurately record the grade point average of their children.
7. Survey research was an appropriate methodology for collecting data.

12
CHAPTER 2
LITERATURE REVIEW
The purpose of this study was to examine the difference in academic emphasis
between high and low performing African-American students in predominately white
suburban schools by analyzing the relationship between academic emphasis and student
achievement. This literature review begins with a brief summary of the existence of
achievement gaps at various levels of education and possible causes that are well
documented. A review of No Child Left Behind will follow as well as its influence on
research examining achievement gaps in predominately white suburban schools. After
reviewing No Child Left Behind, the causes of the achievement gap in predominately
white suburban schools will be presented – specifically those causes cited by Ogbu
(2002) and Ferguson (2002). Finally, the achievement gap in regards to academic
emphasis will be discussed. This chapter will conclude with a section on the limitations
found within current literature.
The Achievement Gap in Education
The achievement gap in education refers to a discrepancy of academic
measurements between student groups usually defined by gender, race, and
socioeconomic status (K12 Academics, 2009). Achievement gaps appear in academic

13
scores, attendance rates, graduation rates, special and gifted education placement, percent
of students in college preparatory or advanced placement classes, numbers of students in
extracurricular activities, honor roll nominations, and grade point averages (Kober, 2001;
Ogbu, 2002). Even though efforts have been made to close achievement gaps, they still
exist. Most of the documented research on the achievement gap in education focuses on
Caucasians and African-American students. Caucasian students are outperforming their
African-American classmates. According to data sources such as the National
Assessment of Educational Progress (2007), only 14% of African-American fourth
graders across the United States scored at or above the “basic” level in reading compared
to 43% of Caucasian students. These same gaps exist at the eight grade level where 13%
of African-American students scored proficient compared to 40% of their Caucasians
classmates. Achievement gaps continue throughout high school. Less than 84% of
African-American students graduate from high school compared to 92% of Caucasian
students (Kaufman, Alt, & Chapman, 2001). Although Caucasian students are
outperforming their African-American classmates, it should be noted that there are
studies that reveal that Caucasian students are also underperforming in school (Singham,
2003). Therefore, the achievement gap has not significantly changed over the last four
decades. Unfortunately, data reveals that African-American students continue to
underachieve when compared to Caucasian students – at all grade levels.
The Achievement Gaps in Early and Primary Education
Achievement gaps exist in children before they enroll in school (Bowman,
Donovan, & Burns, 2001; Cooper & Schleser, 2006; Hart & Risley, 1995; Hill & Craft,
2003; Jenks & Phillips, 1998; Snow, Burns, & Griffin, 1998). Research reveals that by

14
the time children enter elementary school, achievement gaps exist because of the
different experiences children have at home (Rock & Stenner, 2005; Fryer & Levitt,
2004; Brooks-Gunn, Klebanov, Smith, Duncan, & Lee, 2003; Hill & Craft, 2003;
Phillips, Brooks-Gunn, Duncan, Klebanov, & Crane, 1998). For instance, in a renowned
study by Hart and Risley (1995), data indicated that before children enter primary
schools, children raised in lower class families experienced approximately 30 million less
words than those who were raised in middle class families. Unfortunately, the
discrepancy is not only in the quantity of words. It also exists in the quality of words.
There is a difference in the amount of positive words heard from children of different
socioeconomic statuses (Hart & Risley, 1995). On average, middle class families provide
their children with 32 positive words and 5 negative words per hour. Negative words
were described as words that prohibited a child’s behavior whereas positive words were
defined as opposite. Conversely, the average child in a working class family heard 12
positive words compared to 6 negative words. Unfortunately, lower class children
suffered the most. They heard only 6 positive words compared to 11 negative words per
hour. As Hart and Risley suggested, if this trend is projected for a year, children in
middle class families would hear 166,000 affirming words versus 26,000 prohibiting
words, children in working class families would hear 62,000 positive words compared to
36,000 negative words, and children in lower class families would hear 26,000 positive
words versus 57,000 prohibiting words. Moreover, research supports that children from
different socioeconomic levels may differ in the amount of access they have to formal
registers of language (Moore, 1998). Thus, suggesting that children enroll into school
with different educational experiences (Bransford, Brown, & Cocking, 2000). These

15
experiences are linked to their achievement as they enter primary school and continue
throughout high school.
The Achievement Gap in Elementary and Secondary Education
Once achievement gaps exist they are likely to continue throughout a student’s
education (Entwisle & Alexander, 1999). In a study conducted by Davison, Seo,
Davenport, Butterbaugh, & Davison (2004), researchers concluded that achievement gaps
measured in early grades exist between the same groups of students compared again in
their future educational years. In their study, Davison et al. collected the proficiency
scores of third grade students and grouped each student according to their score. In other
words, every student that had the same score was assigned to the same group. Davison et
al. then collected the same students’ proficiency scores in the fifth grade. Data revealed
that there was not a single group of students who obtained a low proficiency score in the
third grade who achieved a score equal to or better than students who scored higher when
compared again in the fifth grade. The achievement gap between these students remained
the same. As concluded by Davison et al., achievement gaps continue to exist because
when students fall below their grade level, they must make more progress during the
academic school year to close the achievement gaps. Unfortunately, this is unlikely to
happen especially when effective interventions are not implemented. In Davison et al.’s
study, data also revealed that students who scored low on their third grade proficiency
test did not make more progress than students who scored higher. In fact, data revealed
that students who scored lower made less progress over the years than those that scored
higher in the third grade. As a result, the achievement gap increased over the years.

16
When students continue to underachieve in school, teachers and parents attempt to
help by providing them with interventions that are likely to increase learning. If learning
is still not achieved, special education is sometimes used as an option. Unfortunately,
research indicates that different student groups are more apt to be placed in special
education. For instance, females are less likely to be placed in special education than
male students (Arms, Bickett, & Graf, 2008). Similarly, Caucasian students are also less
likely to be placed in special education compared to African-American and Latino-
American students. In a study by Losen and Orfield (2002), data revealed that African-
American students are placed in special education at significantly higher rates than
Caucasian students. Although African-American students make up 14% of student
enrollment in American public schools, black students make up more than 20% percent
of enrollment in special education. Disproportionality increases when analyzing the
difference in classification and placements provided to African-American and Caucasian
students (Vines, 2002). For instance, African-American students are 2.4 times more
likely to be classified as cognitively impaired when compared to Caucasian students
(Klinger, Artiles, Kozleski Harry, Zion, Tate et al., 2005). African-American students
are also 1.7 times more likely to be classified as emotionally disturbed and 1.3 times
more likely to be identified as a child with a specific learning disability. Once placed in
special education, research also shows that African-Americans make less progress in
special education and spend more than 60% of their time outside general education when
compared to Caucasian students with special needs (Quality Counts, 2004). African-
American students are not benefiting from being placed in a least restrictive environment.
Moreover, they are less likely to be provided with the general education curriculum when

17
placed in special education (Gloeckler & Daggett, 2004; Quality Counts, 2004; U.S.
Department of Education, 2004). They are simply put at a disadvantage when placed in
special education.
Differences have also surfaced when analyzing the percentages of students being
retained for a year in school. African-American students are more likely to be retained
when compared to Caucasian students (Hoffman, Llagas, Snyder, & National Center for
Education Statistics, 2003). In a data analysis review by Hoffman, Llagas, and Snyder,
data indicated that African-American students had higher retention rates than Caucasians,
Latino-Americans, and Asian-Americans. In their survey, 18% of African-Americans
reported that they were retained at least one time while attending school compared to
13% of Latino-Americans, 9% of Caucasians, and 7% of Asian-Americans. Similar to
special education, grade retention puts African-American students at a disadvantage. For
instance, research supports that retention puts students at greater risk of dropping out of
school (Sterns, Moller, Ptochnick, & Blau, 2007). Therefore, it is not surprising that
Caucasian students are completing high school at higher percentage rates than African-
American and Latino-American students. According to a study by Kaufman, Alt, and
Chapman (2001), 84% of African-American and 64% of Latino-Americans obtain a high
school diploma or pass the general education development assessment when compared to
92% of Caucasians. It is estimated that 13% of African-American students dropout of
school each year. This percentage is considerably high when compared to the percentage
of Caucasian that dropped out of school – 7%. Unfortunately, Latino-American students
are dropping out at the highest rates. It is estimated that 28% of all Latino-American
students are dropping out of school. According to research, school suspension and

18
expulsions account for a large percentage of dropout rates (Catterall, 1998; Jimerson,
1999). African-American students are more likely to get suspended from school when
compared to Caucasian students. It is estimated that 35% of all middle and high school
African-American students were either expelled or suspended from school (Hoffman,
Llagas, Snyder, & National Center for Education Statistics, 2003). This is significantly
disproportionate when considering that it was estimated that only 20% of Latino-
American and 15% of Caucasians were also expelled or suspended.
Researchers have attributed the large percentage of African-American students
that are placed in special education, retained, or expelled from school to racism that
continues to exist in American public schools. According to researcher Blanchett (2006),
racism continues to create achievement gaps in these areas because schools with African-
American students continue to receive less funding than those enrolled with Caucasian
students, teachers do not connect the curriculum to the lives of African-American
students making it less culturally relevant, and many teachers do not know how to teach
African-American students. It is not surprising that when schools receive less funding,
African-American students are not provided with an equal learning experience. On the
other hand, even when they are equally funded, African-American students may not
receive an education that is culturally relevant. A cultural relevant education is an
education that makes connections to between learning materials and the lives of diverse
children. African-American students who are not provided with a culturally relevant
education may experience difficulty realizing the benefits of education. Moreover, they
may become less motivated in acquiring an education. Teachers should understand the
needs of African-American students and engage in practices that motivate them. Many

19
African-American students may need to be shown why acquiring an education is
beneficial to their lives. By making this connection, teachers may decrease the
percentage of African-American students placed in special education, referred for grade
retention, or expelled from school.
There is also an achievement gap with respect to the types of classes students
enroll in during high school (Dillion, 2007). The percentages of African-American
students in college preparatory or advanced placement classes are significantly lower
when compared to other student groups. Dillion reported that in the academic year 2005-
06, African-American students were the only student group who was underrepresented in
advanced placement classes. While African-American students made up 14 percent of
the student population, only 7% of African-American students were enrolled in advanced
placement classes. This was not the case for other student groups. For instance, Asian-
American students represented 6 percent of students but had 11 percent enrolled in
advanced placement classes. Both Caucasian and Latino-American students were
represented according to their population. Unfortunately, achievement gaps still occur
between African-American and Caucasian students when enrolled in advanced placement
classes. On average, African-American students score significantly lower on advanced
placement exams when compared to Caucasian students (Dillion, 2007). Therefore, they
are less likely to receive college credits for these courses when attempting to enroll into
college.
Many researchers attribute the under representation of African and Latino-
American students in advanced placement classes to a practice called tracking (Burris &
Welner, 2005). Tracking is a practice used by some schools which place students in

20
classes according to their abilities. Unfortunately, too many African-American and
Latino-American students are wrongfully placed in lower track classes because it is
perceived that they lack ability. Despite research indicating that tracking does not close
achievement gaps, many schools continue to use it (Oakes, Gamoran, & Page, 1992).
Many schools believe that by tracking students, teachers will be able to better instruct
students – allowing teachers to concentrate on the strengths of high performing students
or the weaknesses of students performing low. Regrettably, high achieving students are
provided with challenging education at the expense of low performing students (Burris &
Welner, 2005). Due to disproportionality, Caucasian students are usually placed in
advanced classes or higher tracks. Detracking students may help close the achievement
gap because it gives all children an equal and challenging education (Levin, 1987). As
Levin suggested, this is one solution in narrowing the achievement gaps. By providing
both groups of students with higher track classes or a challenging education, all schools
will ensure that every student is equally challenged with a rigorous education.
The Achievement Gap in Post-Secondary Education
A large percentage of diverse students are enrolling in United States’ colleges
when compared to previous years. In the academic year of 1999-2000, 31% of African-
American students, ages 18 to 24, enrolled into college compared to 19% of African-
Americans in 1980 (Hoffman, Llagas, Snyder, & National Center for Education
Statistics, 2003). This trend is also occurring for Latino-American and Caucasian
students. The percentage of Latino-American and Caucasian students, ages 18 to 24,
enrolled in college during the 1999-2000 academic school year was 22% and 39%,
respectively. Although enrollment in college increased for all students, Caucasian

21
students are still enrolling in college at higher rates than African-American, Latino-
Americans, and Asian-Americans. Whereas African-American, Latino-American, and
Asian-American students represent 27% of the total student population enrolled in
college, Caucasians make up 68 percent of students in college. It should be noted that
when the enrollment is measured with regard to gender only, female students enroll in
college at a higher percentage across all student groups with the exception of foreign
students.
The achievement gap in post-secondary education is beyond student enrollment. It
continues through graduation and is evident in the types of degrees obtained by all
students (Hoffman, Llagas, Snyder, & National Center for Education Statistics, 2003).
For instance, Caucasian students are more likely to complete college when compared to
African-American and Latino-American students. Moreover, a higher percentage of
Caucasian students receive their bachelor’s degree when compared to African-
Americans, Latino-Americans, and Native-Americans. On the other hand, African-
Americans, Latino-Americans, and Native-Americans are more likely to receive an
associate’s degree. In the academic year 1999-2000, 28% of African-Americans and
34% of Latino-Americans received an associated degree compared to 23% of Caucasian
students. This gap decreases as groups obtain higher degrees. For example,
approximately 2% of all groups receive doctorate degree with the exception of foreign
students of which approximately 9% obtain such a degree. It should be noted that
although the percentages are similar, more Caucasian students are obtaining doctorate
degrees since they make up the majority of students enrolled in graduate school. In the
academic year 1999-2000, over 50,000 Caucasian students obtained doctorate degrees.

22
In comparison, only 5,552 African-Americans, 3,865 Latino-Americans, 8,576 Asian-
Americans, 564 Native-Americans, and 1,899 foreign students obtained doctorate
degrees, which totaled approximately 40,000 less than all Caucasian students.
There are many reasons why African-American students are not enrolling in
college and failing to graduate. According to the Journal of Blacks in Higher Education
(2007), many schools fail to provide recruitment services necessary to inform African-
American students of the application process needed to get into college. On the other
hand, once in college, African-American students need to be provided with an
encouraging environment to increase retention and graduation rates. The Journal of
Blacks in Higher Education suggests that colleges can help increase graduation rates by
establishing the presence of African-American students on campus. Colleges should
enroll more African-American students. Moreover, there is also a need for the presence
of African-American faculty. African-American students need to be able to engage with
successful African-Americans professors in a variety of fields. This will enrich advisor-
advisee relationships. Moreover, it will further develop their interests in their academic
concentration. Finally, the cost and lack of financial aid does not help African-
Americans when attempting to continue college. Financial support is needed. Although
some schools provide more financial support than others, many colleges are not
affordable. All these problems, coupled with the lack of proficiency from kindergarten to
grade 12, place African-American students at a disadvantage when trying to enroll and
graduate from college.

23
No Child Left Behind
In an attempt to close achievement gaps, President George W. Bush signed the No
Child Left Behind Act on January 8, 2002 (Public Law 107-110) – a law holding public
schools accountable to ensure that all students in every school score proficiently in
reading and mathematics by 2014 (Ankeny, 2006; Ferguson et al., 2002). To accomplish
this goal, each school must meet an adequate yearly progress standard for reading and
mathematics for all student groups, including subgroups of students containing 30 or
more children (Ankeny, 2006). According to the legislation, schools that fail to meet
their requirements will have sanctions applied to them such as being required to offer
parents the option to transfer their children to other schools within the district. Hence, if
a school continues to fail, its administrators must restructure the school by appointing
outside consultants, reorganizing school personnel, and implementing scientific-based
instruction.
Two important features of the No Child Left Behind Act impacted the quality of
education provided to diverse student groups: (1) federal policy mandates that all schools
must analyze academic achievement for all diverse student groups and (2) all schools
must reduce any existing achievement gap between them (Ferguson et al., 2002). In
other words, the federal government is mandating schools to disaggregate academic data
(Ferguson et al., 2002). Disaggregated data for No Child Left Behind has indicated that
many achievement gaps exist across different subgroups (e.g., African-American and
Caucasian, underprivileged and privileged, English language learners and English
speaking students, etc.). Moreover, achievement gaps are acknowledged within areas
that were once ignored – such as those achievement gaps that exist between students in

24
middle class suburban schools. While it has been known that there was an achievement
gap, this legislation has forced education and educators to finally address the issue. The
problem can no longer be ignored. School districts are now mandated to demonstrate that
they are closing the achievement gap (Ferguson, 2002).
Achievement Gaps in Predominately White Suburban Schools
Up until No Child Left Behind, achievement gaps in suburban schools were rarely
discussed (Ferguson et al., 2002). Increasing attention has been given to the achievement
gap between African-American and Caucasian students in predominately white suburban
neighborhoods. Data revealed that Caucasian children are significantly outperforming
African-American students (Ogbu, 2002). Although research supports an achievement
gap, it should be noted that many studies support that African-American students in
suburban schools are performing better than other African-Americans in urban schools
(Strayhorn, 2009). Unfortunately, African-American parents are moving to suburban
neighborhoods to improve the quality of their children’s education but a discrepancy
remains between the achievement of African-American and Caucasian students. In fact,
some research has indicated that the achievement gap between African-American and
Caucasian students is greater in suburban schools than it is in urban schools (Alson,
2003).
Researchers have attempted to understand why achievement gaps continue to
exist between African-American and Caucasian students in predominately white
suburban neighborhoods. One of the most extensive studies in this area was conducted
by John U. Ogbu. This comprehensive ethnographic study examined the academic
engagement of African-Americans in Shaker Heights, Ohio, during the 1996-97 academic

25
school year. At the time of the study, Shaker Heights had a population of 30,000
residents with approximately 32.6% of the population being African-American and 50%
being Caucasian. The average family annual income was $50,000 to $100,000 (Stupay as
cited in Ogbu, 2002). Shaker Heights was described as a highly educated community in
which 61% of the residents over the age of 25 had obtained a bachelor’s degree.
Moreover, 85% of the students who graduated from Shaker Heights went on to attend
college.
Although African-Americans benefited from the characteristics of Shaker
Heights, an achievement gap remained. For instance, during the 1994-95 academic
school year, 90% of African-American fourth grade students scored proficient in reading.
The same year, nearly all Caucasians scored proficient in reading – 99%. Bigger
achievement gaps in proficiency scores were revealed for mathematics, writing, and
science. Comparing African-American students to Caucasians, only 75%, 74%, and 51%
of African-Americans scored proficient in the areas of mathematics, writing, and science,
respectively. The comparable proficient rates for Caucasian students were 98%, 95%,
and 94%. Similar to national trends, Shaker Heights’ achievement gaps also increased in
later grades. In the eighth grade, only 37%, 83%, 77%, and 48% of African-American
students scored proficient in mathematics, reading, writing, and science, respectively,
compared to 92%, 100%, 93% and 91% of Caucasian students. Moreover, between 1992
and 1995, only 22 African-American students out of 310 students ranked in the top 20
percent at Shaker Heights High School. Conversely, of the bottom 20% during that time
period, 295 of 325 students were African-American. African-American students made up
91% of students ranked in the bottom 20% between the years 1992 and 1995. African-

26
American students in Shaker Heights were significantly underperforming when compared
to Caucasians students.
To determine the causes of the achievement gaps in Shaker Heights, Ogbu (2002)
conducted a comprehensive ethnographic study which focused on the following research
goals: (1) understand Shaker Heights perception of the education system, (2) observe
student engagement, (3) understand how parents implement their expectations of
achievement, and (4) develop an understanding of how schools educate their students.
Ogbu gathered his information by visiting Shaker Heights, conducting meetings with
members of the community, and interviewing teachers and students. In discussions with
the residents of Shaker Heights, Ogbu concluded that the achievement gaps are primarily
attributed to the lack of academic engagement. Data revealed that African-American
students did not work as hard as their Caucasian classmates. Teachers reported that
African-American students did not take advantage of opportunities provided by Shaker
Heights schools. For instance, African-American students were less likely to enroll in
honor or advance placement courses. When African-American students were asked why
they did not take advantage of advanced placement classes, many replied that they did
enough just to pass. They reported that by taking less challenging classes, it opened up
their time to engage in nonacademic activities after school. Moreover, they believed that
taking less challenging classes helped them achieve because they felt they could not do
well in those classes. The work was too hard. Ogbu also observed that many African-
American students engaged in behaviors that put children at risk of academic failure. For
instance, when analyzing students in the classroom, Ogbu noticed that African-American
children were more likely to arrive late to class and less likely to return completed work.

27
Again, when African-American students were asked why they appeared disinterested in
achieving, many reported that it was not “cool” to achieve in school. They revealed that
school was boring and attributed some of their behaviors to their parents’ lack of
academic engagement.
Ogbu suggested that African-American parents were less involved in their
children’s education when compared to Caucasian parents. Teachers at Shaker Heights
Schools reported that African-American parents were least likely to engage in school
organizations, school events, or volunteer in programs dedicated to helping students who
were experiencing difficulty in school – despite the fact that some of these academic
programs were directed at helping African-American students. For instance, Ogbu
recorded the participation of African-American parents at a parent workshop designed to
explain how parents can prepare their children to pass state proficiency tests. Although
most of the students who failed were African-Americans, parent participation in these
workshops was extremely low. Teachers noticed that in the beginning of the workshops
very few African-Americans parents attended. Unfortunately, as the program progressed,
these same parents became absent and eventually did not complete the workshop. On the
other hand, teachers revealed Caucasian parents in attendance were more likely to
continue the workshop.
Similar findings were also reported from African-American students. African-
American children revealed that their parents were less involved at home when compared
to Caucasian parents. They stated that their parents were less likely to supervise their
work, mange their behaviors, control peer pressures, and motivate them to achieve in
school. In fact, many African-American children in Shaker Heights revealed that their

28
homework would be completed if their parents monitored them after school. They
suggested that when compared to Caucasian parents, their parents did not expect them to
have much homework. Data revealed that not only did Caucasian parents expect their
children to have homework, they also were more likely to make sure it was completed
and returned to the teacher. Unfortunately, for African-American children, they did not
have the same support. Due to their lack of involvement, many African-American
children reported that they became very distracted at home. A lot of their time was
dedicated to watching television. The more time children spend watching television at
home, the less likely they will do well in school (Dumais, 2006).
In gathering information from residents of Shaker Heights, Ogbu noted several
explanations for the lack of parental involvement by African-American parents. Ogbu
suggested that African-American parents were not well aware of the educational process.
Teachers believed that African-American parents did not know the importance of school
organizations, school events, and programs dedicated to helping their children achieve in
school. Hence, they did not know how to help their children achieve in school. In
contrast, Ogbu believed that Caucasian parents understood the importance of school
involvement. They attended parent-teacher conferences and in return took advantage of
opportunities offered to help their children. The absence of African-American parents at
parent-teacher conferences frustrated teachers because Shaker Heights had programs
installed to help African-American students. Unfortunately, African-American parents
who did not attend were least likely to be informed of these programs. Teachers believed
that African-American parents who lacked an understanding of how the educational
process works did not participate in school functions because they believed it was the

29
schools’ responsibility to do everything needed for their children to achieve. Teachers
believed that African-American parents did not feel responsible for participating in
school programs or contacting a teacher to discuss their children’s progress. Simply put,
it was enough for their children just to go to Shaker Heights schools.
Teachers suggested that another explanation for the lack of involvement by
African-American parents was that schools may alienate them. According to teachers,
some African-American parents informed them that visiting their children’s school was a
negative experience. Moreover, teachers believed that there was a perception held by
African-American parents that school programs were predominately composed of “stay-
home white moms.” They believed that this lead African-American parents to mistrust
the school. As suggested during a group discussion, feelings toward the school may be
influenced by the history of mistreatment of African-American by Caucasians. Actions
taken against African-Americans to keep them out of suburban neighborhoods have made
them distrustful of their Caucasian neighbors (Pattillo-McCoy, 1999). Moreover,
previous history to keep blacks undereducated may have made many African-Americans
distrustful of America’s education system. Unfortunately, not much emphasis was put on
this explanation in Ogbu’s study.
The generation gap between parents and their children may also play a critical
role in determining the lack of parental involvement in African-American parents (Ogbu,
2002). As revealed by African-American students in Shaker Heights, many of them felt
that their parents’ views were too old for them to take their advice. Instead, students
would turn to their peers for advice. By keeping their parents out of discussions, their
parents became less informed of their difficulties at school. In fact, many teachers

30
believed that parents did not help their children because they did not know that their
children were having problems at school. Teachers recalled many African-Americans
parents surprised at parent-teacher conferences. On too many occasions, African-
American parents would attend these conferences thinking that their children were
achieving when they were really failing.
Schools may be one of the leading causes for the achievement gap (Catterall,
1998; Borman & Overman, 2004). Although Ogbu did not find any evidence to support
this belief, many African-American students in this study believed that Shaker Heights
schools significantly contributed to the achievement gap. African-American students
believed that teachers had low expectations of their abilities. Due to this belief, African-
American students felt that teachers treated them differently when compared to
Caucasian students. In fact, African-American students revealed that they felt their
teachers did not attempt to push them toward achievement. Residents of Shaker Heights
believed that teachers expected African-American students to behave differently from
Caucasians. Sadly for African-American students, it was expected for them to behave in
a manner that would put them more at risk of academic failure. It should be revealed that
although African-American students mentioned that their teachers lacked expectation for
their abilities, Ogbu noted that African-American students never discussed their own
personal experiences with any of his researchers. They usually discussed general
statements that may have occurred due to teacher’s low expectations. Ogbu believed that
many of these occurrences may have never existed.
It was strongly believed by residents of Shaker Heights that school counselors
also lacked expectations for African-American students. Many members of the

31
community believed that African-American students were not encouraged to take
advanced placement classes because school counselors believed they could not achieve in
these types of classes. Unfortunately, there was strong belief that teachers taught
children better in advanced placement classes than those who attended basic skill classes.
Since most of the students who enrolled in advanced placement classes were Caucasian,
these beliefs implied that they were getting a better education when compared to African-
American students. Surprisingly, teachers acknowledged that students in advanced
placement received a better education. When they were asked if students in advanced
placement classes read the same books at the same pace as students in basic skill classes,
teachers revealed that these classes were different. Teachers stated that they expected
students in advanced placement classes to be more engaged in classroom discussion. On
the other hand, students in basic skills classes usually did not critically discuss materials
in the class. On many occasions, their discussions were off topic. Teachers in advanced
placement classes expected their students to discuss topics in ways that would exhibit
higher levels of learning. On the other hand, students in basic skills classes, which were
mostly made up of African-American students, were asked to recall information rather
than discuss the lesson.
In another study examining racial and ethnic achievement gaps in middle and
upper class neighborhoods, Ferguson (2002) reviewed data collected by the Minority
Student Achievement Network – an organization formed to narrow achievement gaps in
the 15 affluent neighborhoods of California, Illinois, Massachusetts, Michigan, New
Jersey, New York, North Carolina, Ohio, Virginia, and Wisconsin. Data was collected
by surveying 34,218 secondary students during the 2000-01 academic school year on the

32
differences in socioeconomic characteristics, academic efforts, and student performances.
An achievement gap was also evident in this study. Compared to Caucasian students,
African-American students were reported to have lower grade point averages. Only 15%
percent of African-American students reported they received a grade point average
equivalent to an A. On the other hand, 50% of Caucasians reported this grade.
Unfortunately, African-American students also reported that they were less likely to
understand their teachers’ lessons in school. In this study, the differences in grade point
average and understanding are associated with differences in socioeconomic
characteristics between African-Americans and Caucasian families – not student or
parent disengagement. African-American children in these neighborhoods were more
likely to live in households that consisted of one parent, one parent and a stepparent, or
no biological parents – 66%. Caucasian children were more likely to live with both
biological parents – 77%. African-American children were also more likely to have
three or more siblings with fewer resources at home such as computers when compared to
Caucasian children. On average, 51% of African-American students reported that they
lived with three or more siblings at home. Only 19 % of Caucasian children reported
having just as many siblings. Most African-American children lived in households that
were limited to one computer and less than one hundred books – more specifically over
50%. Conversely, 57% of Caucasians reported to have two or more computers at home
and 79% reported that they had over 100 books at home. Assuming that siblings equal
more sharing, it appeared that African-American families are at a greater disadvantage
than their Caucasian classmates (Ferguson, 2002).

33
With data on achievement and socioeconomic characteristics, Ferguson analyzed
whether the magnitude of achievement is different for children from lower, middle, and
upper socioeconomic statuses. Ferguson used a multiple regression analysis with fixed
effects to control for different schools and grade levels. According to Ferguson,
disparities in socioeconomic characteristics predicted substantial portions of the
difference in grade point averages. On average, African-American students that were
classified as living in families of lower socioeconomic status were predicted to acquire a
2.38 grade point average. On the other hand, Caucasian children of similar
characteristics were predicted to acquire a 2.52 grade point average. Contrary to popular
belief, as African-American and Caucasian students were classified into higher levels of
socioeconomic status, the achievement gap increased. African-American children
classified as living in families of higher socioeconomic status were predicted to obtain a
grade point average of 3.18 while their Caucasian peers of the same status were predicted
to acquire a grade point average of 3.68. It should be noted that there is a difference
between the degree to which socioeconomic characteristics helped African-American and
Caucasian students. As African-American children moved from lower class to lower
middle, upper middle, and upper class statuses, they made smaller gains in achievement
when compared to Caucasian children.
In agreement with Ogbu, Ferguson also revealed that African-American students
complete less homework when compared to Caucasian students. These differences may
make it appear as though Caucasian students are more engaged in their school work.
Ferguson revealed this is not true. According to his study, the differences between
African-American and Caucasian students are not significant. Although African-

34
American students are completing less homework, the amount of time African-American
students spend studying and doing homework is not that different than Caucasian
students. On average, Caucasian students engage in homework approximately five more
minutes per night than African-American students. Further analysis of the data revealed
that this difference is not due to race but to the difference in classes students take – basic
skills or advanced placement. Since more Caucasian students are enrolled in advanced
placement classes it appears that African-American students are not completing
homework. Ferguson also suggested that homework completion is not a strong indicator
of how much time is spent on homework or student engagement. Students who are
experiencing difficulties in school may spend more time on homework while completing
less work. In Ferguson’s study, data revealed that African-American students work
longer to complete the same amount of homework as Caucasian students.
Finally, Ferguson’s analysis revealed that African-American and Caucasian
students work really hard in school for the same reasons. Such reasons were to: (1) get
grades for enrollment in college, (2) please or impress parents, (3) get a better job, (4)
prepare for tough college courses, and (5) learn the material. Another two reasons were
because parents put pressure on them and they were interested in a particular subject.
According to Ferguson, for the most part, African-American and Caucasian students
ranked the list of reasons equally; however, there were two differences. African-
American students were three times more likely to cite teacher encouragement as an
important motivator rather than teacher demands. Conversely, Caucasian students were
equally motivated by teacher encouragement and demands. According to African-
American students in the study, teacher encouragement was described as an interaction

35
between teachers and students that instills confidence in children. African-American
students reported that they responded better to this type of interaction. On the other hand,
they did not respond well to teacher demands – a direct command to submit to authority
which carries no assurance of care by the teacher. In conclusion, Ferguson believed that
teachers may have to interact with African-American students in a different manner to
improve learning compared to their interaction with Caucasian students.
Academic Emphasis and the Achievement Gap
Many researchers dispute the causes of achievement gaps in suburban schools.
Some researchers believe it is a result of teacher, parents, and student disengagement,
while others believe it to be the result of characteristics associated with socioeconomic
status or a combination of both. Although there is disagreement on the causes, there is a
general belief that positive and personal relationships students have with teachers,
parents, and other students helped them achieve in school – regardless of any researched
cause of the achievement gap. Research reveals that when parents encourage their
children to succeed it helps them achieve (Borman & Overman, 2004; Castillo, 1999;
Catterall, 1998; Floyd, 1996; Jackson, 1999; Smokowski, Reynolds, & Bezruczko, 1999).
Data also reveals that African-American children report having relationships with people,
besides their parents, that contribute to their achievement (Floyd, 1996) – most of which
were teachers and counselors. Like all students, middle class African-American students
in suburban schools need positive and personal relationships to achieve. Middle class
African-American students benefit from these relationships because they place emphasis
on academics, also known as academic emphasis.

36
Academic emphasis is the extent to which one develops high but achievable
goals, an orderly learning environment, believes in children’s abilities, works hard for
academic achievement, and respects education. Research reveals that schools with
academic emphasis can decrease achievement gaps (Phillips, 1997). For instance, in a
study conducted by Goddard, Sweetland, and Hoy (2000), data revealed that schools with
academic emphasis increased student performance in the areas of language arts and
mathematics. Results found that each unit of increase of academic emphasis, as
measured by the Organizational Health Inventory, accounted for 30% of increase in
student performance. However, little is known about academic emphasis from other
contexts beyond school. How does academic emphasis hold up for middle class African-
American students in predominately white suburban schools when provided by schools,
families, student peers as well as children having their own academic emphasis?
Limitations of Previous Studies
In previous research similar to those in the literature review, teacher and student
opinions were usually collected to understand the achievement gap between African-
American and Caucasian students in predominately white suburban schools. African-
American parents’ opinions were rarely discussed. This study collected the opinions of
African-American parents in predominately white suburban neighborhoods. In addition,
previous studies also only examined the achievement gap with regard to African-
American and Caucasian students. Thus, suggesting that all African-American students
in suburban schools were failing and have similar characteristics. This study examines
this myth. This study identified the difference between high achieving and low achieving
African-American students in predominately white suburban schools by examining

37
School, Family, Children, and Student Peer Academic Emphasis according to parents’
opinions. Finally, there is no literature on School, Family, Children, and Student Peer
Academic Emphasis and its relationship to the achievement gap between African-
American and Caucasian students in predominately white suburban schools. This study
examined the achievement gap through a socio-cultural context. Therefore, the
achievement gap is observed through School, Family, Children, and Student Peer
Academic Emphasis.
Conclusion
Nationally, African-American students are underperforming when compared to
the achievement of Caucasian students. The same trend is true in predominately white
suburban schools. Data revealed that African-American students who attend suburban
schools do not perform as well as their Caucasian peers (Alson, 2003; Ferguson et al.,
2002; Ogbu, 2002). The achievement gap between African-American and Caucasian
students appeared in not only test scores but also in many other academic areas (Kober,
2001; Ogbu, 2002). Research suggested that the achievement gap in predominately white
suburban schools may be attributed to many factors. Fortunately, research also revealed
that academic emphasis may narrow achievement gaps. The current study observed the
relationship between academic emphasis and achievement for African-American students
in predominately white suburban schools. Adding to the literature and noting previous
limitations, the current research also examined the perceptions of academic emphasis
from parents of African-American students in predominately white suburban schools.
Parents’ opinions are important to measure because research has shown that it is a strong
predictor of student achievement (Hood & LoVette, 2002). The current study: (1)
38
collected parents opinions of academic emphasis and the cause of the achievement gap in
predominately white suburban schools, (2) attempted to find a difference in academic
emphasis between high performing and low performing African-Americans in
predominately white suburban schools, and (3) used a collective measure such as
academic emphasis to indicate potential differences between high and low performing
students.

39
CHAPTER 3
METHODOLOGY
Chapter three describes the methodology used to address eight research questions
in regards to the relationship between School, Family, Children, and Student Peer
Academic Emphasis and the achievement of African-Americans in predominately white
suburban schools. More specifically, the participants, materials, measurements, validity
and reliability, design and procedure, and data analysis plan are addressed. Results and a
discussion of the study’s findings follow in subsequent chapters.
Participants
The target population for this study was black parents and guardians of African-
American and biracial students attending grades 7-12 in predominately white suburban
schools in a Midwestern neighborhood. If parents identified their children as biracial,
they had to identify that there children were partially African-American to qualify for this
study. All students, whose parents were enlisted in the study, attended schools located in
one predominately white suburban neighborhood. In this neighborhood, African-
American families made up less than 10% of the total population (Census, 2000).
African-American children made up approximately 16% of the overall student population
of this neighborhood group. Of the total students qualifying for this study (N = 627), a

40
subsample of 251 surveys were returned by parents (40%). Since this study was only
interested in collecting information from African-American parents of black or biracial
children, only African-American families who were parenting black or biracial high
school children were used for this study. Parents of African-American children who did
not identify themselves as black were not used in the study. Of the 251 surveys, 6 were
dropped from the study as parents revealed they were not African-American. An
additional 15 surveys were dropped from the study because parents completed a survey
for one of their children who was not in grades 7-12. Seven more surveys were dropped
because participants filled out two surveys for the same child – one survey was randomly
selected for the study. Finally, two participants returned a survey blank with the
exception of the open-ended question. They revealed in the open-ended question that
they did not want to participate in the study so they were dropped. The final sample
consisted of 221 completed surveys from black parents of African-American and biracial
students attending grades 7-12 in a predominately white suburban district.
Materials
A self-constructed questionnaire (Appendix A) was used to survey parents’
opinions of academic emphasis and student achievement. Academic emphasis questions
were constructed from the Organization Health Inventory for Secondary Schools (Hoy,
2006) – an instrument designed to measure academic emphasis in schools. In this
instrument, academic emphasis is the extent to which the school is driven by the mission
of academic achievement – challenging goals are set for students, learning environments
are structured, teachers believe in student’s abilities, students work hard to gain academic
excellence, and classmates respect children who achieve in school. For the purpose of

41
this study, academic emphasis was examined according to these characteristics not only
with regard to schools but also families, children, and students’ peers.
The design of the survey was in accordance with guidelines supported by Miller
(2005). For instance, the questionnaire was printed as an 8.5 x 5.5 inch booklet, items
were listed in a 7 x 4.5 inch space in 10-point type font size, and the questionnaire was
printed on 20 lb. paper. As suggested by Miller, these specifications allow for the
questionnaire to be easily completed, folded, and returned in a regular business envelope.
The questionnaire consisted of 40 closed-response academic emphasis items, 13
demographic questions, 2 academic achievement questions, and 1 open-ended question
regarding the cause of the achievement gap between African-American and Caucasian
students in predominately white suburban schools. Closed-response academic emphasis
items were set in a summated rating scale format – also known as Likert Scales. Each
closed-response academic emphasis item had two levels of disagreement and agreement:
(1) Strongly Disagree = SD, (2) Disagree = D, (3) Agree = A, and (4) Strongly Agree =
SA. A neutral response was not provided to force participants into making a choice.
Measurements
Items within the questionnaire measured School, Family, Children, and Student
Peer Academic Emphasis, characteristics of academic emphasis (i.e., Setting Goals,
Setting Environment, Believing in Children, Working Hard, and Acknowledging
Achievement), demographic variables, and student achievement. It should be noted that
items measuring the characteristics of academic emphasis are the same items used to
measure School, Family, Children, and Student Peer Academic Emphasis.

42
School academic emphasis. Ten items on the questionnaire were composed of
statements concerning School Academic Emphasis. School Academic Emphasis was
important to measure because research has shown that schools with academic emphasis
close achievement gaps (Goddard, Sweetland, & Hoy, 2000). In this study, School
Academic Emphasis was the extent to which parents view schools’ drive toward
academic achievement. Such drive was measured by: (1) parents’ perception of schools
setting challenging goals for their children, “My child’s school sets high standards for my
child” and “My child’s school is not challenging,” (2) parents’ view of schools
organizing an environment conducive to learning, “My child’s classrooms are well
structured and organized” and “My child’s school is orderly and very serious,” (3)
parents’ opinion of teachers believing in their children’s abilities, “Overall, my child’s
teachers do not believe in the abilities of my child” and “Teachers believe that my child
has the ability to organize and execute their own school work,” (4) parents’ perception of
teacher’s working hard to provide students with an adequate education, “My child’s
school has programs available for when children need academic help” and “Teachers at
my child’s school work hard to give my child a solid education,” and (5) parents’ take on
schools acknowledging their children’s achievement, “The school rewards my child when
he/she does well in school” and “My child’s achievements are acknowledge by the
school.” It should be noted that two of these items were reverse coded. They were items
stating “My child’s school is not challenging,” and “Overall, my child’s teachers do not
believe in the abilities of my child.”
Family academic emphasis. Ten items on the questionnaire contained statements
reflecting parents’ attitudes toward Family Academic Emphasis. Family Academic

43
Emphasis is important to measure because research has revealed that children who
achieve in school report that their families contribute to their success (Jackson, 1999).
Family Academic Emphasis was the extent to which parents view their own drive toward
helping their children achieve. It was measured by: (1) observing parents’ self-
perception of setting challenging but achievable goals for their children, “I expect my
child to complete all of his/her homework” and “I expect my child to do well in school,”
(2) managing a structured and orderly home, “I enforce rules that make my home well
controlled and serious about school” and “I enforce rules at home to make sure school
work is completed,” (3) believing in their children’s abilities, “I believe that my child has
the ability to do well in school” and “I believe that my child has the ability to organize
and execute their own work,” (4) working hard for their children’s education, “I help my
child as much as I can with school work” and “I make sure my child has all supplies
necessary to achieve in school,” and (5) acknowledging their children’s
accomplishments, “My family respects children who do well in school” and “I praise my
child when he or she does well in school.”
Children academic emphasis. The questionnaire had ten items which consisted
of statements reflecting parents’ attitudes toward their children’s academic emphasis.
Children Academic Emphasis was important to measure because research has shown that
when students are highly engaged in academics, they are self-motivated (Siren & Rogers-
Siren, 2004). Therefore, Children Academic Emphasis was the extent to which parents’
view their children’s drive toward academic excellence. It was measured by observing
parents’ perceptions of their children’s determination. Such determination was measured
by: (1) parents’ view of their children setting challenging goals, “My child challenges

44
themselves to do well in school everyday” and “My child sets high, but achievable
goals,” (2) parents’ view of their children creating an organized environment conducive
to learning, “My child studies in a room with minimal distractions” and “My child
studies or completes his/her homework before watching TV,” (3) parents’ opinion of their
children’s confidence, “My child believes that he/she can do well in school” and “My
child dislikes school because he/she does poorly,” (4) parents’ opinion of their children’s
studious practices, “My child takes on the initiative to seek extra assignments to further
prepare for school” and “My child revisits previous assignments to correct wrong
answers,” and (5) parents’ view on their children respecting other students who achieve,
“My child respects other students who get good grades” and “My child feels that
students who do well in school are ‘nerds’.” It should be noted that two items were
reverse coded. They were: “My child dislikes school because he/she does poorly” and
“My child feels that students who do well in school are ‘nerds’.”
Student peer academic emphasis. Ten items within the questionnaire reflected
parents’ attitudes toward their children’s peers’ academic emphasis. Student Peer
Academic Emphasis was important to measure because research revealed that at
adolescence, teenagers stray away from their families and develop supportive
relationships with their friends (Bixenstine, Decorte, & Bixenstine, 1976; Constanzo &
Shaw, 1966). Peer relationships are an influential support group during adolescence
(Clark, 1991). Student Peer Academic Emphasis was the extent to which parents view
their children’s friends and their drive toward academic excellence. Such drive was
measured by: (1) parents’ opinions of their children’s peers and their practice of setting
challenging goals, “My child’s friends set high academic goals for themselves” and “My

45
child’s friends are not challenged to get good grades,” (2) belonging to a positive social
group, “My child’s friends hang around other children who are serious about school”
and “My child’s friends frequently study” (3) helping their children with academic
difficulties, “My child’s friends study with my child” and “My child’s friends help each
other with homework especially when it is hard,” (4) believing in their children, “My
child’s friends think that my child is not smart” and “My child’s best friend thinks that
my child has strong academic ability,” and (5) respecting other children who achieve in
school “My child’s friends respect other students who get good grades” and “My child’s
friends believe that making the honor roll is important.” It should be noted that two of
these items were reverse coded. There were items stating “My child’s friends are not
challenged to get good grades” and “My child’s friends thinks that my child is not
smart.”
Setting goals. Items measuring the characteristic of Setting Goals were the same
as those measuring School, Parent, Children, and Student Peer Academic Emphasis;
however, this scale consisted of only items that pertain to setting challenging goals for
children. The eight questionnaire items pertaining to Setting Goals follow: “My child’s
school sets high standards for my child,” “My child’s school is not challenging,” “I
expect my child to complete all of his/her homework,” “I expect my child to do well in
school,” “My child challenges themselves to do well in school everyday,” “My child sets
high, but achievable goals,” “My child’s friends set high academic goals for
themselves,” and “My child’s friends are not challenged to get good grades.” It should
be noted that two of these items (the second item and the last item) were reverse coded.

46
Setting environment. Items measuring the characteristic of Setting Environment
were the same as those measuring School, Parent, Children, and Student Peer Academic
Emphasis; however, the Setting Environment scale consisted of only items that pertain to
setting structured environments conducive to learning. The eight questionnaire items
follow: “My child’s classrooms are well structured and organized,” “My child’s school
is orderly and very serious,” “I enforce rules that make my home well controlled and
serious about school,” “I enforce rules at home to make sure school work is completed,”
“My child studies in a room with minimal distractions,” “My child studies or completes
his/her homework before watching TV,” “My child’s friends hang around other children
who are serious about school,” and “My child’s friends frequently study.”
Believing in children. There were eight items that measured Believing in
Children. These items were the same as those used to measure School, Parent, Children,
and Student Peer Academic Emphasis. They were as follows: “Overall, my child’s
teachers do not believe in the abilities of my child,” “Teachers believe that my child has
the ability to organize and execute their own school work,” “I believe that my child has
the ability to do well in school,” “I believe that my child has the ability to organize and
execute their own work,” “My child believes that he/she can do well in school,” “My
child dislikes school because he/she does poorly,” “My child’s friends thinks that my
child is not smart,” and “My child’s best friend thinks that my child has strong academic
ability.” It should be noted that three of these items were reverse coded. They were:
“Overall, my child’s teachers do not believe in the abilities of my child,” “My child
dislikes school because he/she does poorly,” and “My child’s friends thinks that my child
is not smart.”

47
Working hard. Items measuring Working Hard were the same as those measuring
School, Parent, Children, and Student Peer Academic Emphasis; however, the Working
Hard scale consisted of only items that pertain to working hard to help children gain
academic excellence. These items were: “My child’s school has programs available for
when children needs academic help,” “Teachers at my child’s school work hard to give
my child a solid education,” “I help my child as much as I can with school work,” “I
make sure my child has all supplies necessary to achieve in school,” “My child takes on
the initiative to seek extra assignments to further prepare for school,” “My child revisits
previous assignments to correct wrong answers,” “My child’s friends study with my
child,” and “My child’s friends help each other with homework especially when it is
hard.”
Acknowledging achievement. Eight items measured Acknowledging
Achievement. These items were the same as those used to measure School, Parent,
Children, and Student Peer Academic Emphasis; however, the Acknowledging
Achievement scale consisted of eight items that pertain to acknowledging academic
achievement. They were: “The school rewards my child when he/she does well in
school,” “My child’s achievements are acknowledge by the school,” “My family respects
children who do well in school,” “I praise my child when he or she does well in school,”
“My child respects other students who get good grades,” “My child feels that students
who do well in school are ‘nerds’,” “My child’s friends respect other students who get
good grades,” and “My child’s friends believe that making the honor roll is important.”
The item stating “My child feels that students who do well in school are ‘nerds’” was
reversed coded.

48
Demographic variables. The questionnaire also contained 13 items (Appendix
B) to measure demographic variables. Demographic information was needed to observe
possible relationships between academic emphasis, student achievement, and
demographic variables. The questionnaire requested the following demographic
information: (1) child’s gender, (2) number of children in the household, (3) name of
child’s current school, (4) grade of child, (5) guardianship, (6) relationship to child, (7)
parent’s race/ethnicity, (8) satisfaction of school, (9) numbers of computers at home, (10)
child’s race/ethnicity, (11) years lived in neighborhood, (12) family income, and (13)
highest level of education completed by parents. Questions requesting guardianship and
name of child’s school were only used to determine if participants qualified for the study.
If participants revealed that they were not a guardian or their child did not attend a
participating school, the survey was dropped from the study.
It should also be noted that open-response and closed-response items were used to
collect demographic information. For instance, open-response questions were used to
collect information on the number of children in the household, name of child’s current
school, grade of child, numbers of computers at home, and years lived in neighborhood.
Conversely, closed-response items were used to collect all other demographic variables.
In order to collect the child’s gender, a closed-response item was given that allowed
parents to select either “Male” or “Female.” Two other items allowed participants to
respond by selecting “Yes” or “No” (i.e., “Are you the child’s legal parent/guardian?”
and “Are you happy with your child’s school?”). Items that collected parent’s and
child’s race/ethnicity were obtained similarly. They provided six options for participants
to select. They were: (1) African-American, (2) Native-American, (3) Asian-American,
49
(4) Caucasian, (5) Latino/Hispanic, and (6) Other. It was determined that the selection
of “Other” will offer parents the opportunity to write their race/ethnicity if they did not
identify with those provided. This question was also used to determine if participants
qualified for the study. If participants did not circle African-American as an option, they
were dropped from the study. On the other hand, if participants selected African-
American with another race/ethnicity or selected African-American and “Other,” they
were considered biracial. Since this study only collected information from African-
Americans or biracial parents of black or biracial students, this information was used in
for the demographic variable Race of Parent and Race of Child. Race of Parent or Child
measured whether participants and their children were African-American or biracial.
Another item allowed participants to select “Other” for an option. Participants
were asked, “What is your relationship to the child?” and provided the options
“Mother,” “Father,” and “Other.” Again, a space was provided for participants to share
their relationship to their child. Finally, two closed-response items requested participants
to provide information on family income (i.e., “What was your approximate household
income last year (2007)?”) and highest level of education completed by parents (i.e.,
“What is the highest level of education your have completed?”) Participants were
provided with six options to select their family income. Each selection was in ranges of
$20,000, beginning with the selection “Less than $20,000” and ending with “More than
$110,000.” This item was written in a closed-response format to encourage participants
to provide an answer. To collect information on highest level of education completed by
parents, eight options were provided: (1) Some High School, (2) High School Diploma or

50
GED, (3) Some College, (4) Associates Degree, (5) Bachelor’s Degree, (6) Some
Graduate School, (7) Master’s Degree, and (8) Doctoral Degree.
Student achievement. Two items in the demographic section measured student
achievement. Parents were asked to provide their child’s grade point average from 0 to
4.0 and to circle the types of grades their children typically received (e.g., A, B, C, etc.).
It should be noted that the question requesting the types of grades children typically
received was developed as a backup plan if a large percentage of parents did not indicate
their children’s grade point average. This was not the case so their responses were not
used.
Validity
The questionnaire was put through a series of assessments to examine validity.
The questionnaire was sent to an expert in the literature of academic emphasis to review
items in regards to face and content validity. Items were edited according to feedback by
the expert. After items were edited, the questionnaire was administered to participants of
a Black Parent Association meeting held in another Midwestern predominately white
suburban neighborhood. The participants were asked to complete the questionnaire and
to identify problems they had in understanding and answering all items. Twenty-eight
participants completed the questionnaire and provided feedback. After feedback was
provided, items were analyzed again for face and content validity. Face and content
validity were determined in accordance with guidelines supported by research (Patten,
1997). Again, each item was reviewed and carefully constructed with the supervision of
an expert in the literature of academic emphasis. The Organizational Health Inventory
for Secondary Schools was also used as a model (Hoy, 2006). To further ensure content

51
validity, items were written in a manner appropriate for all participants. The
questionnaire was written on a fourth grade level to make certain that all questions were
comprehensible as detected by a feature in Microsoft Word.
Reliability
Coefficient alphas were computed for the internal consistency estimate of
reliability for academic emphasis scales. The alphas for School Academic Emphasis,
Family Academic Emphasis, Children Academic Emphasis, and Student Peer Academic
Emphasis were .84, .72, .81, and .84, respectively. Moreover, the alphas for Setting
Goals, Setting Environment, Believing in Children, Working Hard, and Acknowledging
Achievement were .67, .65, .78, .60, and .67. According to Patten (1997), most published
tests have reliability coefficients of .80 or higher; however, a reliability of .50 to .60 is
satisfactory for newly developed instruments. All scales had a coefficient alpha higher
than .60. These results are indicated in Table 3.1.

Table 3.1: Coefficient Alphas for Academic Emphasis Scales and Characteristics
N Alpha
School Academic Emphasis 221 .84
Family Academic Emphasis 221 .72
Children Academic Emphasis 221 .81
Student Peer Academic Emphasis 221 .84
Setting Goals 221 .67
Setting Environment 221 .65
Believing in Children 221 .78
Working Hard 221 .60
Acknowledging Achievement 221 .67
(N = 221)
Design and Procedures
The existing research is a quantitative study that used survey methodology to
gather data. This research was designed to analyze the relationship between the
achievement of African-American students and parents’ attitudes towards School,
Family, Children, and Student Peer Academic Emphasis and its characteristics. Parents’
attitudes were collected during the third quarter of the 2007-08 academic school year
using a self-constructed questionnaire described in the previous “Materials” section.
Participants were contacted by using the mailing list of African-American and
biracial students attending grades 7-12 in a predominately white suburban school district
52

53
located in the Midwest region of the United States. The mailing list was used to recruit
families because all African-American parents whose children attended schools in this
neighborhood were listed on the mailing list. It should be noted, that the school district
used for this study was also selected for two reasons: (1) all of their schools are located
within a predominately white suburban neighborhood and (2) they were willing to
provide the contact information of all their secondary African-American students. Since
all African-American parents were provided with a questionnaire, it was assumed that
threats to external validity would be minimal because all participants were provided with
a questionnaire in a manner that would allow them to return their survey randomly. It
should also be noted, that other predominately white suburban districts were contacted to
participate in this study; however, they declined to participate because they didn’t want to
disclose student’s contact information.
The Tailored Design Method, a survey procedure based on the theory of human
interaction, was used to make contact with parents, distribute questionnaires, and receive
data (Dillman, 2007). The first step of the Tailored Design Method was to initiate
contact with parents. Therefore, a pre-notice postcard was sent to African-American
parents two days prior to the shipment of the questionnaire packet (Appendix C). The
postcard informed participants of the arrival of the questionnaire. After the postcard was
mailed, the questionnaire packet was sent to participants. The packet included a cover
letter explaining the purpose of the study (Appendix D), a questionnaire attached with a
dollar, and a stamped, return-addressed envelope. A dollar was used as an incentive for
parents to fill out the questionnaire. Parents with more than one child were sent
additional questionnaires and incentives to match the number of children enrolled in

54
volunteering schools that also qualified for the study. One additional cover letter
(Appendix E) and questionnaire were sent to participants who did not return a
questionnaire within one week of shipping. This procedure was used to minimize
selection bias – an internal validity threat that occurs when one type of participant is used
for a study (e.g., participants that actively volunteer for studies). After two weeks from
the initial postcard distribution, a final postcard was sent to thank participants for
volunteering in the study (Appendix F). All data was collected through U.S. mail.
Using mail surveys poses strengths and weaknesses. In regards to strengths, mail
survey is a reliable method for conducting large-scale research (Dillman, 2007). It
allows a single experimenter to collect data about a number of variables from a large
group of participations. It also allows the experimenter to provide research questions to
participants and enables participants to respond at their own convenience. Conversely,
there are limitations. Such limitations include: inaccuracy of responses, non-
responsiveness, and subjective interpretation of rating scales. Since mail surveys are not
completed in front of the experimenter, participants may inaccurately fill out
questionnaires. Another significant weakness in using mail surveys is that questionnaires
are open for interpretation without the presence of the experimenter. For instance, in
summated rating scales, the magnitude of each statement is interpreted by the
participants. Participants may not be aware of the reason they selected one answer over
another. Other limitations in using mail survey are the validity and reliability of
responses. While completing a survey, participants usually provide information on their
feelings toward an item; however, responses cannot always be taken as accurate measures
of what participants actually feel. According to Dillman (2007), this is particularly true

55
for feelings and behaviors that are not socially accepted. If a participant feels that their
actual behaviors are not socially accepted, they may provide information to appear more
positive. This is particularly true if the experimenter is not present at the time
participants complete their survey – much like a mail survey. Finally, participants may
not return their questionnaire, thereby reducing response rates.
Measures were taken to minimize limitations of mail survey methodology. For
instance, to reduce inaccurate responses, directions were provided on the first, second,
and third pages of the questionnaire. The questionnaire was also written in a manner to
reduce subjective interpretation. As previously stated, items were written on a fourth
grade reading level to make certain that all questions were comprehensible and
questionnaire items were written in a summated rating scale format. There were only
four selections for each item: (1) Strongly Disagree = SD, (2) Disagree = D, (3) Agree =
A, and (4) Strongly Agree = SA. By using only four selections, interpretation for each
statement was minimized. Finally, to reduce non-responsiveness, one additional cover
letter and questionnaire were sent to participants who did not return a questionnaire
within one-week of shipping. As previously mentioned, this procedure was used to
minimize selection bias. It should be noted that an additional 93 surveys were returned
upon the second distribution of questionnaires.
Data Analysis Plan
Analysis of data proceeded in several stages. In the first stage of the data analysis
plan, power was calculated to ensure that there were enough subjects to detect significant
statistical differences. Assuming a standard power of .80, a standard alpha of .05, a
medium effect size (r = .15), and at least eight independent variables, the minimum

56
number of subjects needed for data analysis purposes was n = 107. The final n = 221
represents more than enough power for all planned data analyses (Cohen, 1988; 1992).
After power was referenced, descriptive analyses were used to examine the demographic
data, student achievement, and academic emphasis. Correlation was used to answer
Research Question 1 – “Is there a significant correlation between academic emphasis,
characteristics of academic emphasis, and demographic variables for African-American
children in predominately white suburban schools?” Following this research question,
another correlation analysis was conducted between School, Family, Children, Student
Peer Academic Emphasis and grade point average to answer Research Question 2 –
“How do School, Family, Children, and Student Peer Academic Emphasis load on
achievement for low achieving and high achieving African-American students in
predominately white suburban schools?”
A partial correlation analysis was used to answer Research Question 3 – “How do
School, Family, Children, and Student Peer Academic Emphasis load on achievement for
low achieving and high achieving African-American students in predominately white
suburban school after controlling for significant demographic variables?” In order to
complete this analysis, first a correlation analysis was completed between demographic
variables and grade point average. Significant demographic variables were controlled for
during the partial correlation analysis. These results were compared to the previous
research question.
After analyzing how School, Family, Children and Student Peer Academic
Emphasis load on the achievement of African-American students in predominately white
suburban schools after controlling for significant demographic variables, a partial

57
correlation analyses and an univariate analysis of variance was conducted to answer
Research Question 4 – “Do African-American students with higher levels of two or more
forms of academic emphasis perform better than students with only one and no forms of
academic emphasis?” In order to complete this analysis, African-American students
were assigned to two subcategories based upon their academic emphasis scores. These
subcategories were: (1) African-American students who did not score high on at least two
forms of academic emphasis and (2) African-American students who scored high on two
or more forms of academic emphasis. Scores were considered high if they were one
standard deviation above the mean. A partial correlation analysis was completed
between these subcategories and grade point average. Again, significant demographic
variables were controlled. Furthermore, after the partial correlation analysis was
conducted, grade point averages for these subcategories were compared using a
univariate analysis of variance (UNIANOVA). One-way analysis of variance is a
statistical technique that is used to test for mean differences among two groups. The null
hypothesis suggested that all averages will be similar.
Following analyses of School, Family, Children, and Student Peer Academic
Emphasis, characteristics of academic emphasis were analyzed in the same manner. A
correlation analysis was conducted between characteristics of academic emphasis and
grade point average to answer Research Question 5 – “How do characteristics of
academic emphasis (i.e., Setting Goals, Setting Environment, Believing in Children,
Working Hard, and Acknowledging Achievement) load on achievement for low achieving
and high achieving African-American students in predominately white suburban
schools?”

58
Another partial correlation analysis was used to answer Research Question 6 –
“How do characteristics of academic emphasis (i.e., Setting Goals, Setting Environment,
Believing in Children, Working Hard, and Acknowledging Achievement) load on
achievement for low achieving and high achieving African-American students in
predominately white suburban schools after controlling for significant demographic
variables?” Again, significant demographic variables were controlled for during the
partial correlation analysis. Results from this partial correlation were compared to the
results of Research Question 5.
After analyzing how characteristics of academic emphasis load on the
achievement of African-American students in predominately white suburban schools, a
partial correlation analyses and a analysis of variance was conducted to answer Research
Question 7 – “Do African-American students with higher levels of three or more
characteristics of academic emphasis perform better than students with only two, one,
and no characteristics of academic emphasis?” Similar to Research Question 4, African-
American students were again assigned to two subcategories based upon their scores.
These subcategories were: (1) African-American students who did not score high on at
least three characteristic of academic emphasis and (2) African-American students who
scored high on three or more characteristics of academic emphasis. Again, scores were
considered high if they were one standard deviation above the mean. A partial
correlation analysis was completed between these subcategories and grade point average.
After the partial correlation analysis was conducted, grade point averages for these
subcategories were compared using a univariate analysis of variance (UNIANOVA).
Again, the null hypothesis assumed that all averages were similar.

59
Finally after all descriptive statistics were completed, the following open-ended
question was examined: “Research shows that there is an achievement gap between
African-American and Caucasian students in suburban school districts. In other words,
White children are doing better academically than Black children in suburban schools.
What do you feel causes this achievement gap?” The open-ended question was reviewed
through thematic analysis (Smith, 1993). Thematic analysis enabled the experimenter to
select specific answers that reflected achievement gap themes while also examining the
academic achievement of the participants’ children. After the thematic analysis was
conducted, responses were “dummy” coded for a partial correlation analysis. Therefore,
if a participant’s response was a reoccurring theme, they received a 1 for the “dummy”
code. Conversely, if they did not provide a reoccurring theme, they received a zero. This
was used to answer Research Question 8 – “What do parents of low achieving and high
achieving African-American students feel are the causes for achievement gaps in
predominately white suburban schools?” The data analysis plan was calculated in a
computer software called SPSS - Statistical Package for the Social Sciences.

60
CHAPTER 4
RESULTS
This study examined the relationship between academic emphasis and student
achievement for African-American students in predominately white suburban
neighborhoods. The following chapter reports data collected from black parents of
African-American or biracial students in predominately white suburban schools during
the third quarter of the 2007-08 academic school year. First, descriptive analysis results
will be reviewed – followed by research questions. This chapter will end with the final
research question, “What do parents of low achieving and high achieving African-
American students feel are the causes for achievement gaps in predominately white
suburban schools?”
The general demographic information for participant responses is presented in
Tables 4.1 and 4.2. Participants of the study were predominantly mothers (77.4%) of
high school children (59.7%). Each family averaged 2.14 children and had 1.81
computers in the household. Parents described their family as: (1) having a parent, on
average, with at least an associate’s degree or a bachelor’s degree, (2) living in their
neighborhood for approximately 6 years and 8 months, and (3) having an annul
household income approximately between $61,000 and $80,000. Approximately 89% of

61
participants identified themselves, as well as their children, as African-American, non-
mixed. The remaining percentage identified themselves and their children as African-
American, mixed with another race/ethnicity. Their children’s gender was evenly
divided – 50.9% female to 49.1% male. In regards to their children’s achievement,
participants on average described their children as having a 2.96 grade point average.
Furthermore, 91.6% of parents were happy with their children’s school.
Continuous Demographic Variables N Min. Max. M SD
Grade of Child 221 7 12 9.12 1.69
Number of Children 219 1 5 2.14 1.02
Number of Computers 216 0 5 1.81 1.09
Parents’ Highest Level of Education 220 1 8 4.66 1.62
Family Income* 210 1 6 3.94 1.71
Years in Neighborhood 213 0.25 26 6.73 5.64
Grade Point Average 196 1.20 4.3 2.96 0.64
* Item was written in a closed-response format where:
1 = Less than $20,000 2 = $21,000 - $40,000 3 = $41,000 - $60,000
4 = $61,000 - $80,000 5 = $81,000 - $100,000 6 = More than $100,000
Table 4.1: Descriptive Statistics for Continuous Demographic Variables and Grade Point
Average (N = 221)

62
Categorical Demographic Variables N %
Parent Mother
Father
Other Guardian
171
33
17
77.4
14.9
7.7
Race of Parent African-American (Non-Mixed)
African-American (Mixed)
197
24
89.1
10.9
School Happiness Yes
Maybe
No
197
5
13
91.6
2.3
6.0
Gender of Child Male
Female
108
112
49.1
50.9
Race of Child African-American
African-American (Mixed)
201
20
91.0
9.0
Current School of
Child
Middle School A
Middle School B
Middle School C
High School
18
39
28
126
8.5
18.5
13.3
59.7
Table 4.2: Frequencies and Percents for Categorical Demographic Variables
(N = 221)
The descriptive statistics for School, Family, Children, and Student Peer
Academic Emphasis scales, as well as their characteristics, are listed in Table 4.3.
Participants revealed that their children receive the least academic emphasis from their

63
student peers (M = 29.4). On average, parents rated their children’s academic emphasis
as 30.7 and their children’s school as 32.5. They rated their own academic emphasis
highest (M = 37.2). In regards to characteristics of academic emphasis, parents revealed
that Believing in Children was the most frequent characteristic of academic emphasis
provided to their children (M = 27.4). Their ratings indicated that they believed Setting
Goals (M = 26.7) was the second most frequent characteristic of academic emphasis
followed by Acknowledging Achievement (M = 25.3), Setting Environment (M = 25.0),
and Working Hard (M = 24.0).
N Range Min. Max. M SD
School Academic Emphasis 221 27 13 40 32.5 4.79
Family Academic Emphasis 221 12 28 40 37.2 2.61
Children Academic Emphasis 221 24 16 40 30.7 4.79
Student Peer Academic Emphasis 221 25 15 40 29.4 4.99
Setting Goals 221 12 20 32 26.7 2.91
Setting Environment 221 16 16 32 25.0 3.12
Believing in Children 221 20 12 32 27.4 3.51
Working Hard 221 15 17 32 24.0 3.08
Acknowledging Achievement 221 14 17 31 25.3 2.68
Table 4.3: Descriptive Statistics for Academic Emphasis Scales and Characteristics
(N = 221)

64
Correlation analyses were conducted between School, Family, Children, Student
Peer Academic Emphasis scales, characteristics of academic emphasis, and demographic
variables to address Research Question 1 – “Is there a significant correlation between
academic emphasis, characteristics of academic emphasis, and demographic variables
for African-American children in predominately white suburban schools?” These results
can be found in Table 4.4.
Most of the significant relationships between academic emphasis and
characteristics of academic emphasis were with three demographic variables: the
demographic variable indicating that another guardian, besides a mother of father,
completed the questionnaire; school happiness; and gender of child. Of the three
demographic variables, school happiness was significantly and positively correlated with
the most forms and characteristics of academic emphasis. It had a significant positive
relationship with School Academic Emphasis (r =.422, p < 0.01), Student Peer Academic
Emphasis (r = .201, p < 0.01), Setting Goals (r = .314, p < 0.01), Believing in Children (r
= .201, p < 0.01), Working Hard (r = .202, p < 0.01), and Acknowledging Achievement (r
= .239, p < 0.01). Gender of child followed second. It had significant and positive
correlations to Children Academic Emphasis (r = .285, p < 0.01), Student Peer Academic
Emphasis (r = .210, p < 0.01), Setting Goals (r = .200, p < 0.01), Believing in Children (r
= .225, p < 0.01), and Working Hard (r = .164, p < 0.05). Conversely, the demographic
variable indicating that another guardian, besides a mother of father, completed the
questionnaire was negatively correlated to Family Academic Emphasis (r = -.134, p <
0.05), Believing in Children (r = -.167, p < 0.05), and Acknowledging Achievement (r = -
.145, p < 0.05). There were two demographic variables that had only one significant

65
relationship to academic emphasis or a characteristic of academic emphasis. These
correlations were between the number of computers in a household and School Academic
Emphasis (r = -.153, p < 0.05) and the number of children in a household and
Acknowledging Achievement (r = -.168, p < 0.05).
Another correlation analysis was conducted between School, Family, Children,
Student Peer Academic Emphasis and grade point average to answer Research Question 2
– “How do School, Family, Children, and Student Peer Academic Emphasis load on
achievement for low achieving and high achieving African-American students in
predominately white suburban schools?”
These results can be found in Table 4.5. All academic emphasis scales were
positively correlated to grade point average at a 0.01 significant level with the exception
of School Academic Emphasis. School Academic Emphasis was positively correlated to
grade point average at a 0.05 significance level. According to the results, Children
Academic Emphasis had the strongest correlation with grade point average (r = .612, p <
0.01) while Student Peer Academic Emphasis (r = .436, p < 0.01), Family Academic
Emphasis (r = .361, p < 0.01), and School Academic Emphasis (r = .165, p < 0.05) had
weaker, but still significant, relationships.

66
Table 4.4: Correlation Analyses for Academic Emphasis Scales, Characteristics of Academic Emphasis, and
Demographic Variables (N = 221)
Mother
Father Other
Guardian
Race of
Parent
School
Happiness
Gender
of Child
Race
of
Child
Grade
Number
of
Children
Number of
Computers
Parents’
Highest Level
of Education
Family
Income
Years in
Neighborhood
School Academic Emphasis .038 -.032 -.017 -.028 .442** -.024 -.010 .000 -.126 -.153* .012 -.030 .066
Family Academic Emphasis .118 -.039 -.134* .014 -.043 .119 -.018 -.054 -.024 .088 -.023 .026 -.013
.007 Children Academic Emphasis .099 -.024 -.124 .020 .103 .285** -.089 .004 .027 .048 .011 .003
Student Peer Academic Emphasis -.010 .073 -.082 .076 .201** .210** .020 .029 -.042 -.078 -.047 -.048 .085
Setting Goals .011 .034 -.062 -.007 .314** .200** -.056 .041 -.008 -.107 -.049 -.037 .006
.010 Setting Environment .051 -.013 -.063 -.024 .119 .057 .014 -.079 -.111 .011 -.006 -.018
Believing in Children .080 .031 -.167* .088 .201** .225** -.029 .032 -.008 .054 .008 .027 .099
Working Hard .061 -.031 -.054 .041 .202** .164* -.027 .018 -.014 -.047 -.021 -.041 .066
.115 Acknowledging Achievement .079 .016 -.145* -.033 .239** .113 -.042 -.007 -.168* -.091 .073 -.007
* Correlation is significant at the 0.05 level (two-tailed)
** Correlation is significant at the 0.01 level (two-tailed)

67
Forms of Academic Emphasis Grade Point Average
School Academic Emphasis .165*
Family Academic Emphasis .361**
Children Academic Emphasis .612**
Student Peer Academic Emphasis .436**
* Correlation is significant at the 0.05 level (two-tailed).
** Correlation is significant at the 0.01 level (two-tailed).
Table 4.5: Correlation Analyses for Academic Emphasis Scales and Grade Point Average
(N = 196)
Partial correlation analysis was used to answer Research Question 3 – “How do
School, Family, Children, and Student Peer Academic Emphasis load on achievement for
low achieving and high achieving African-American students in predominately white
suburban school after controlling for significant demographic variables?” As indicated
in Table 4.6, only six demographic variables had significant relationships to grade point
average – the demographic variable indicating that another guardian, besides a mother of
father, completed the questionnaire (r = -.240, p < 0.01); school happiness (r = .149, p <
0.05); gender of child (r = .339, p < 0.01); parents’ highest level of education (r = .169, p
< 0.05); family income (r = .166, p < 0.05); and years lived in neighborhood (r = .159, p
< 0.05). These demographic variables were removed from the partial correlation
analysis.

68
Demographic Variables Grade Point Average
Mother .085
Father .089
Other Guardian -.240**
Race of Parent .092
School Happiness .149*
Gender of Child .339**
Race of Child -.041
Grade -.045
Number of Children .065
Number of Computers .138
Parents’ Highest Level of Education .169*
Family Income .166*
Years in Neighborhood .159*
* Correlation is significant at the 0.05 level (two-tailed).
** Correlation is significant at the 0.01 level (two-tailed).
Table 4.6: Correlation Analyses for Demographic Variables and Grade Point Average
(N = 196)
After significant demographic variables were removed from the correlation
analysis, only three forms of academic emphasis continued to hold significant
relationships with grade point average – Family Academic Emphasis (r = .328, p < 0.01),

69
Children Academic Emphasis (r = .590, p < 0.01), and Student Peer Academic Emphasis
(r = .353, p < 0.01). School Academic Emphasis was not correlated to grade point
average. These results can be found in Table 4.7. It should be noted that the rankings for
School, Family, Children, Student Peer Academic Emphasis and grade point average
remained the same before and after controlling for demographic variables. In other
words, Children Academic Emphasis had the strongest relationship to grade point
average, followed by Student Peer Academic Emphasis, Family Academic Emphasis, and
School Academic Emphasis even after controlling for demographic variables.
Forms of Academic Emphasis Grade Point Average
School Academic Emphasis .044
Family Academic Emphasis .328*
Children Academic Emphasis .590*
Student Peer Academic Emphasis .353*
* Correlation is significant at the 0.01 level (two-tailed).
Table 4.7: Partial Correlation Analyses for Academic Emphasis Scales and Grade Point
Average (N = 170)
In order to answer Research Question 4 – “Do African-American students with
higher levels of two or more forms of academic emphasis perform better than students
with only one and no forms of academic emphasis?” African-American students were
assigned to two subcategories based upon their academic emphasis scores. These
subcategories were: (1) African-American students who did not score high at least two

70
forms of academic emphasis, and (2) African-American students who scored high on two
or more forms of academic emphasis. Scores were considered high if they were one
standard deviation above the mean. It should be noted that the original research question
was, “Do African-American students with higher levels of four forms of academic
emphasis perform better than students with only three, two, one and no forms of
academic emphasis?” Unfortunately, groups that had high levels of two, three, and four
forms of academic emphasis were combined because there were not enough participants
who qualified for each category. Descriptive data for African-American students who
scored high on four, three, two, one, and no forms of academic emphasis are provided in
Table 4.8. After combining categories to represent the revised research question, there
were 168 African-American students who did not score high on at least two forms of
academic emphasis and 53 African-American students who scored high on two or more
forms of academic emphasis.
High Levels of Academic Emphasis N %
Zero High Levels of Academic Emphasis 124 56.1
One High Level of Academic Emphasis 44 19.9
Two High Levels of Academic Emphasis 37 16.7
Three High Levels of Academic Emphasis 9 4.1
Four High Levels of Academic Emphasis 7 3.2
Table 4.8: Frequencies and Percents for Students with High Levels of Zero, One, Two,
Three, and Four Forms of Academic Emphasis (N = 221)

71
Again, the six demographic variables that had significant relationships to grade
point average were removed from the partial correlation to answer Research Question 4.
After these variables were removed from the correlation analysis, students with high
levels of two or more forms of academic emphasis had a significant correlation to grade
point average (r = .247, p < 0.01).
Additionally, a univariate analysis of variance (UNIANOVA) was used to further
check the difference of grade point averages between these two groups. African-
American children with high levels of two or more forms of academic emphasis had
significantly higher grade point averages. These results can be found in Table 4.9.

72
Source SS df MS F Sig.
Corrected Model 12.128* 2 6.064 17.078 .000
Intercept 485.617 1 485.617 1367.677 .000
Gender of Child 7.252 1 7.252 20.426 .000
Two or More High Levels of
Academic Emphasis
2.540 1 2.540 7.155 .008
Error 62.137 175 .355
Total 1637.953 178
Corrected Total 74.265 177
* R Squared = .163 (adjusted R Squared = .154)
The following covariates were not statistically significant and thus not used for the
final model: the demographic variable indicating that another guardian, besides a
mother of father, completed the questionnaire, school happiness, parents’ highest level
of education, family income, and years lived in neighborhood.
Table 4.9: UNIANOVA Table Showing the Significance of Having High Levels of Two
or More Forms of Academic Emphasis (N = 178)
Similar to Research Question 2, a correlation analysis was conducted between
characteristics of academic emphasis and grade point average to answer Research
Question 5 – “How do characteristics of academic emphasis (i.e., Setting Goals, Setting
Environment, Believing in Children, Working Hard, and Acknowledging Achievement)
load on achievement for low achieving and high achieving African-American students in
predominately white suburban schools?” These results are provided Table 4.10.

73
All characteristics of academic emphasis were positively correlated to grade point
average. The characteristic of academic emphasis which had the strongest significant
relationship to grade point average was Believing in Children (r = .572, p < 0.01).
Results also indicated that Setting Goals (r = .430, p < 0.01) had the second strongest
relationship to grade point average while Acknowledging Achievement (r = .405, p <
0.01), Working Hard (r = .383, p < 0.01), and Setting Environment (r = .293, p < 0.01)
had weaker, but still significant, relationships.
Characteristics of Academic Emphasis Grade Point Average
Setting Goals .430*
Setting Environment .293*
Believing in Children .572*
Working Hard .383*
Acknowledging Achievement .405*
* Correlation is significant at the 0.01 level (two-tailed).
Table 4.10: Correlation Analyses for Characteristics of Academic Emphasis and Grade
Point Average (N = 196)
As addressed in Table 4.6, six demographic variables had significant relationships
to grade point average – the demographic variable indicating that another guardian
completed the questionnaire (r = -.240, p < 0.01), school happiness (r = .148, p < 0.05),
gender of child (r = .339, p < 0.01), parents’ highest level of education (r = .169, p <
0.05), family income (r = .166, p < 0.05), and years lived in neighborhood (r = .159, p <

74
0.05). These demographics were removed from the partial correlation analysis to answer
Research Question 6 – “How do characteristics of academic emphasis (i.e., Setting
Goals, Setting Environment, Believing in Children, Working Hard, and Acknowledging
Achievement) load on achievement for low achieving and high achieving African-
American students in predominately white suburban schools after controlling for
significant demographic variables?”
After significant demographic variables were removed from the correlation
analysis, all characteristics of academic emphasis continued to have a significant positive
relationship to grade point average. Believing in Children remained to have the strongest
correlation with grade point average (r = .510, p < 0.01). Setting Goals had the second
strongest relationship to grade point average (r = .346, p < 0.01), while Working Hard (r
= .340, p < 0.01), Setting Environment (r = .252, p < 0.01), and Acknowledging
Achievement (r = .238, p < 0.05) had weaker, but significant, relationships. These results
are presented in Table 4.11. It should be noted that after controlling for demographic
variables, the order of relationships between characteristics of academic emphasis and
grade point average had changed. Believing in Children and Setting Goals had remained
the strongest and second strongest relationship, respectively, to grade point average after
controlling for demographics variables. The order of relationships between Working
Hard, Setting Environment, Acknowledging Achievement, and grade point average had
changed.

75
Characteristics of Academic Emphasis Grade Point Average
Setting Goals .346**
Setting Environment .252**
Believing in Children .510**
Working Hard .340**
Acknowledging Achievement .238*
* Correlation is significant at the 0.05 level (two-tailed).
** Correlation is significant at the 0.01 level (two-tailed).
Table 4.11: Partial Correlation Analyses for Characteristics of Academic Emphasis and
Grade Point Average (N = 170)
In order to answer Research Question 7 – “Do African-American students with
higher levels of three or more characteristics of academic emphasis perform better than
students with only two, one, and no characteristics of academic emphasis?” African-
American students were assigned to two subcategories based upon their academic
emphasis scores. These subcategories were: (1) African-American students who did not
score high on at least three characteristics of academic emphasis and (2) African-
American students who scored high on three or more characteristics of academic
emphasis. Again, scores were considered high if they were one standard deviation above
the mean. It should also be noted that the original research question was, “Do African-
American students with higher levels of five characteristics of academic emphasis
perform better than students with only four, three, two, one and no characteristics of
academic emphasis?” Groups with high levels of three, four, and five characteristics of

76
academic emphasis were combined because there were not enough participants who
qualified for each category. Descriptive data for African-American students who scored
high on five, four, three, two, one, and no characteristics of academic emphasis are
provided in Table 4.12.
High Levels of Characteristics of Academic Emphasis N %
Zero High Levels of Characteristics of Academic Emphasis 133 60.2
One High Level of Characteristics of Academic Emphasis 31 14.0
Two High Levels of Characteristics of Academic Emphasis 30 13.6
Three High Levels of Characteristics of Academic Emphasis 17 7.7
Four High Levels of Characteristics of Academic Emphasis 7 3.2
Five High Levels of Characteristics of Academic Emphasis 3 1.3
Table 4.12: Frequencies and Percents for Students with High Levels of Zero, One, Two,
Three, Four, and Five Characteristics of Academic Emphasis (N = 221)
Again, the six demographic variables that had significant relationships to grade
point average were removed from the partial correlation analysis to answer Research
Question 7 – “Do African-American students with higher levels of three or more
characteristics of academic emphasis perform better than students with only two, one,
and no characteristics of academic emphasis?” Students with high levels of three or
more characteristics of academic emphasis had a significant correlation to grade point
average (r = .204, p < 0.05).

77
Similar to Question 4, a univariate analysis of variance was used to further check
the differences in grade point averages amongst students that had high levels of three or
more characteristics of academic emphasis when compared to students with less than
three high levels of characteristics of academic emphasis. African-American children
with high levels of three or more characteristics of academic emphasis had significantly
higher grade point averages. These data results are presented in Table 4.13.
Source SS df MS F Sig.
Corrected Model 12.200* 2 6.100 17.201 .000
Intercept 472.531 1 472.531 1332.376 .000
Gender of Child 8.392 1 8.392 23.663 .000
Three or More High Levels of
Academic Emphasis Characteristics
2.613 1 2.613 7.368 .007
Error 62.064 175 .355
Total 1637.953 178
Corrected Total 74.265 177
* R Squared = .164 (adjusted R Squared = .155).
The following covariates were not statistically significant and thus not used for the
final model: the demographic variable indicating that another guardian, besides a
mother of father, completed the questionnaire, school happiness, parents’ highest level
of education, family income, and years lived in neighborhood.
Table 4.13: UNIANOVA Table Showing the Significance of Having High Levels of
Three or More Characteristics of Academic Emphasis (N = 178)

78
Finally, thematic analyses were conducted on responses for the open-ended
question, “Research shows that there is an achievement gap between African-American
and Caucasian students in suburban school districts. In other words, White children are
doing better academically than Black children in suburban schools. What do you feel
causes this achievement gap?” This procedure was used to answer Research Question 8
– “What do parents of low achieving and high achieving African-American students feel
are the causes for achievement gaps in predominately white suburban schools?” Eight
emerging themes were noted after several readings by both the experimenter and an
outside reader, namely:
1. School Prejudices, Racisms, Discrimination, and Insensitivity to Diversity –
themes relating to prejudice of African-American students by racist teachers,
discrimination in educational services and programs provided to African-
American students when compared to Caucasian students, and a lack of African-
American teachers in predominately white suburban schools (e.g., “White
teachers spend extra time relating with white students. There is more of a bond.
They also expect wrong doing and attitudes of black students to be negative
before they even know them. There needs to be a push for more black teachers.”)
2. Lack of Family Involvement – themes relating to African-American parents not
vesting in their children’s education (e.g., “The African-American family
structure has suffered for many years. They key is to be involved with your
children and being in constant contact with their teachers.”)
3. Socioeconomic Issues – themes associated to African-American families having
less financial resources than Caucasian families such as having less time to spend
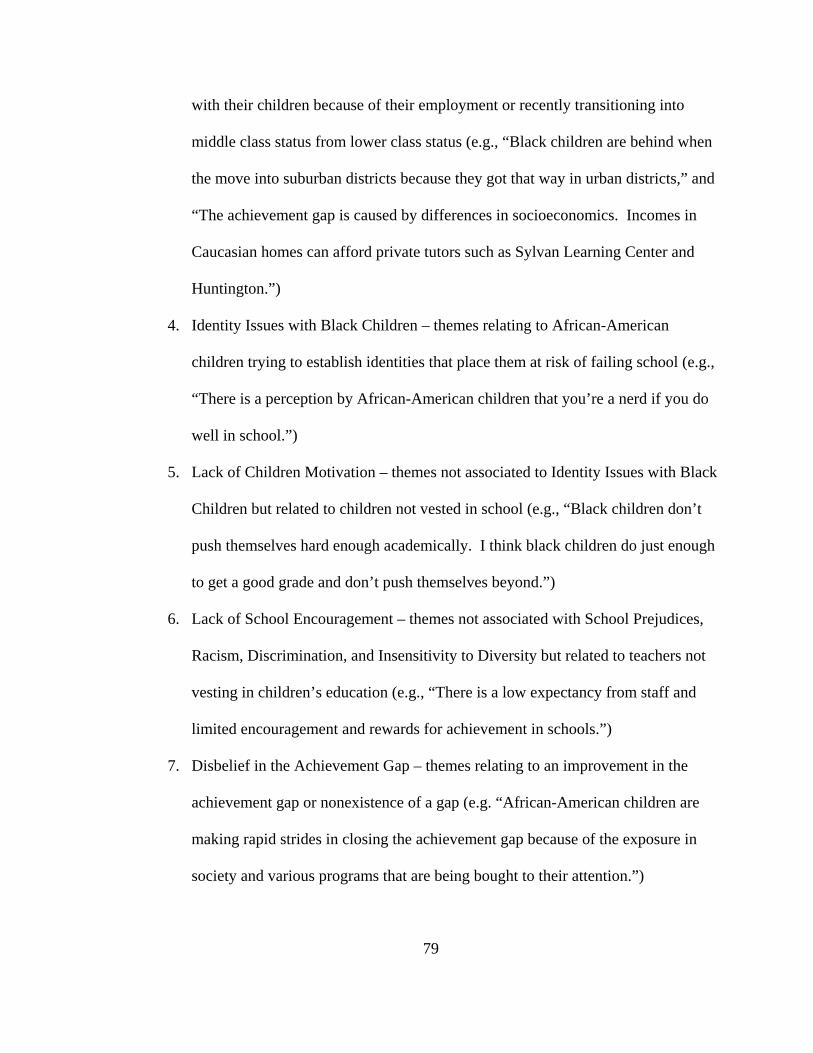
79
with their children because of their employment or recently transitioning into
middle class status from lower class status (e.g., “Black children are behind when
the move into suburban districts because they got that way in urban districts,” and
“The achievement gap is caused by differences in socioeconomics. Incomes in
Caucasian homes can afford private tutors such as Sylvan Learning Center and
Huntington.”)
4. Identity Issues with Black Children – themes relating to African-American
children trying to establish identities that place them at risk of failing school (e.g.,
“There is a perception by African-American children that you’re a nerd if you do
well in school.”)
5. Lack of Children Motivation – themes not associated to Identity Issues with Black
Children but related to children not vested in school (e.g., “Black children don’t
push themselves hard enough academically. I think black children do just enough
to get a good grade and don’t push themselves beyond.”)
6. Lack of School Encouragement – themes not associated with School Prejudices,
Racism, Discrimination, and Insensitivity to Diversity but related to teachers not
vesting in children’s education (e.g., “There is a low expectancy from staff and
limited encouragement and rewards for achievement in schools.”)
7. Disbelief in the Achievement Gap – themes relating to an improvement in the
achievement gap or nonexistence of a gap (e.g. “African-American children are
making rapid strides in closing the achievement gap because of the exposure in
society and various programs that are being bought to their attention.”)

80
8. Lack of Education in Parents – themes associated to African-American families
having less education than Caucasian parents (e.g., “On average, their Caucasian
parents have a higher level of education versus African-American parents.”)
Inter-rater reliability was estimated at .89. Unfortunately, twenty-eight parents
did not provide a response to the open-ended question. Descriptive data on the eight
emerging themes appears in Table 4.14.
Reasons Stated by Parents N* %
School Prejudices, Racisms, Discrimination,
and Insensitivity to Diversity
55 24.2%
Lack of Family Involvement 54 23.7%
Socioeconomic Issues 41 18.1%
Identity Issues with Black Children 27 11.9%
Lack of Children Motivation 21 9.3%
Lack of School Encouragement 17 7.5%
Disbelief in Achievement Gap 9 4.0%
Lack of Education in Parents 3 1.3%
* Columns do not add up to 221 because participants reported
more than one reason for the achievement gap.
Table 4.14: Self-Reported Causes for the Achievement Gap (N = 221)
After emerging themes were indicated, each response was “dummy” coded for a
partial correlation analysis. Then all demographic variables that had significant

81
relationships to grade point average, were removed from the partial correlation analysis
to answer Research Question 8 – “What do parents of low achieving and high achieving
African-American students feel are the causes for achievement gaps in predominately
white suburban schools?” After significant demographic variables were removed from
the correlation analysis, only one emerging theme continued to hold significant
relationships with grade point average – Lack of Children Motivation (r = -.221, p <
0.05). This indicates that parents of low achieving African-American students were more
likely to attribute the achievement gap to their children’s lack of motivation. On the
other hand, parents of high achieving students were less likely to attribute the
achievement gap to student motivation. Although not significant, parents of achieving
African-American students were more likely to attribute the achievement gap to Lack of
Family Involvement (r = .141, p < 0.05). The opposite was true for the parents of low
achieving African-American students. Results are provided in Table 4.15.

82
Reasons Stated by Parents Grade Point Average
School Prejudices, Racisms, Discrimination,
and Insensitivity to Diversity
.100
Lack of Family Involvement .141
Socioeconomic Issues -.109
Identity Issues with Black Children -.037
Lack of Children Motivation -.211*
Lack of School Encouragement -.051
Disbelief in Achievement Gap .041
Lack of Education in Parents .044
* Correlation is significant at the 0.05 level (two-tailed).
Table 4.15: Partial Correlation Analyses for Self-Reported Causes for the Achievement
Gap from Parents of High and Low Achieving Students (N = 178)

83
CHAPTER 5
DISCUSSION
In this chapter, significant results generated by the study will be discussed. The
discussion begins with a brief review of objectives for this study and a summary of
results with interpretations. This will be followed by recommendations needed for
helping African-American students in predominately white suburban schools and
implications for future research. Finally, this chapter will end with a summary and a
conclusion.
This study was conducted to examine the achievement gap in suburban schools
beyond traditional research. In previous studies, causes for achievement gaps that were
examined between African-American and Caucasian students in predominately white
suburban schools were usually based upon the opinions of teachers and students. This
study, examined the achievement gap between high performing and low performing
African-American students, collected parents’ opinions of causes of the achievement gap,
and examined the achievement gap through a socio-cultural context of School, Family,
Children, and Student Peer Academic Emphasis – the extent to which emphasis is placed
on academics by schools, family, children as well as student peers by setting challenging
goals, setting learning environments that are structured and conducive to learning,

84
believing in academic abilities, working hard towards academic excellence, and
respecting and acknowledging achievement.
In regards to overall demographics of African-American families who completed
questionnaires for this study, 77.4% of participants were mothers, 14.9% were fathers,
and 7.7% were another type of guardian – not a biological mother or father. The
participation in this study may suggest that African-American mothers in this study may
be more engaged in their children’s education compared to their fathers since they
completed the questionnaire. More importantly, it also reveals that African-American
children are being raised by at least one biological parent when compared to another type
of guardian. Demographics variables also indicated that African-American children in
this predominately white suburban neighborhood have fewer siblings and more
computers at home when compared to other studies. In a study by Ferguson (2002), data
revealed that African-American children were more likely to live in a household of three
or more siblings and one computer when compared to Caucasian students. Ferguson
indicated that this may place African-American children at a disadvantage since more
siblings equal more sharing resources. In this study, African-American families on
average consisted of 2.14 children and 1.81 computers in the household. They almost
matched the number of computers in a household. Most parents obtained a degree after
high school. On average, most parents received an associate’s degree or a bachelor’s
degree. Moreover, they lived in the neighborhood for approximately 6 years and 8
months and had an annual household income between $61,000 and $80,000. Data
revealed that there were less socioeconomic disadvantages when compared to average
demographic variables of African-American families in other studies. Finally, parents on

85
average described that their children received academic emphasis mostly from their
family, followed by schools, children, and student peers. Their children had 2.96 grade
point average which in this school district is equivalent to a “C+.” Hence, on average
most African-American students were not failing but also not highly achieving. They
were performing average.
Research Question 1: Is there a significant correlation between academic emphasis,
characteristics of academic emphasis, and demographic variables for African-American
children in predominately white suburban schools?
There were significant correlations between academic emphasis, characteristics of
academics emphasis, and demographic variables for African-American children in
predominately white suburban schools. School happiness had the most significant
relationships to other variables. Not surprising, it was significantly and positively
correlated to School Academic Emphasis, Student Peer Academic Emphasis, as well as
characteristics of academic emphasis such as Setting Goals, Believing in Children,
Working Hard, and Acknowledging Achievement. These results may simply reflect that
parents who are happy with their children’s schools were more likely to rate School
Academic Emphasis and Student Peer Academic Emphasis, as well as, characteristics of
academic emphasis such as Setting Goals, Believing in Children, Working Hard, and
Acknowledging Achievement more favorable.
Another demographic variable that was significantly and positively related to
academic emphasis, as well as its characteristics, was the gender of child for which a
parent completed a questionnaire. African-American parents’ ratings indicated a

86
difference between male and female students. For instance, the ratings for female
African-American students indicated that females were more likely to be perceived as
having higher levels of Children Academic Emphasis and Student Peer Academic
Emphasis, as well as, characteristics such as Setting Goals, Believing in Children, and
Working Hard. On the other hand, the opposite was true for male African-American
students. Their parents’ ratings indicated that they were perceived as having less
Children Academic Emphasis, Student Peer Academic Emphasis, as well as less
characteristics of academic emphasis – more specifically Setting Goals, Believing in
Children, and Working Hard.
Female African-American students may have been perceived to have higher levels
of Children Academic Emphasis, School Peer Academic Emphasis, and characteristics of
academic emphasis (i.e., Setting Goals, Believing in Children, and Working Hard)
because of the belief that African-American males are less engaged in their education
when compared to African-American females and their Caucasian classmates. This
belief is usually supported by an achievement gap that exists between African-American
males and females. Data from this study also support that females obtain higher grade
point averages than male students. No matter the reasons why parents of female African-
American students rated their Children and Student Peer Academic Emphasis higher than
parents of male students, parents’ ratings revealed that African-American males may
receive less Student Academic Emphasis and characteristics of academic emphasis. They
also have less Children Academic Emphasis. Unlike School and Family Academic
Emphasis, Children Academic Emphasis and Student Peer Academic Emphasis are two
forms of academic emphasis which African-American males can control. This data may

87
reveal that African-American males in predominately white suburban neighborhoods are
potentially less engaged in their academics when compared to females. Moreover, they
befriended students who provide less Student Peer Academic Emphasis.
Surprisingly, parents’ ratings revealed that children raised by their parents
received higher levels of academics emphasis when compared to children being raised by
another guardian, besides a mother or father. This is surprising because it would appear
that if a guardian, other than a biological parent, took on the responsibility of parenting a
child, they would provide the same level of academic emphasis when compared to
biological parents raising their own children. Unfortunately, this does not occur.
Biological parents may be more likely to provide their children with higher levels of
academic emphasis because they are more vested in their own children’s education. On
the other hand, African-Americans raised by another guardian may not be as vested as a
biological parent. This may happen for many reasons. For example if a child is being
raised by their grandparents, they may not be able to provide the same levels of academic
emphasis due to many hardships that may not be experienced by younger biological
parents. On the other hand, when another relative takes on the responsibility of raising a
child (e.g., aunt, uncle, older sibling, etc.) they may be more vested in providing
academic emphasis to their own biological children or themselves – if they themselves
are still attending school. Again, no matter the reason, data revealed that there were
significant negative relationships between this variable and Family Academic Emphasis,
as well as, Believing in Children and Acknowledging Achievement. This suggested that
children raised by another guardian besides their biological parents are less likely to
receive ratings that indicate higher levels of Family Academic Emphasis. Moreover,

88
these children were also less likely to receive ratings that indicate characteristics such as
Setting Goals, Believing in Children, and Working Hard toward academic excellence.
Finally, there were two demographic variables that had only one significant
relationship to academic emphasis or its characteristics. These significant negative
correlations were between the number of computers in a household and School Academic
Emphasis, as well as the number of children in a household and Acknowledging
Achievement. Although it is unclear why School Academic Emphasis is negatively
correlated with the numbers of computers in a household, it is also not surprising that
there is a significant negative correlation between the number of children in a household
and Acknowledging Achievement. This may occur because it may be harder for parents
with more children to provide each child with individual attention and encouragement
that is needed for academic achievement.
Research Question 2: How do School, Family, Children, and Student Peer Academic
Emphasis load on achievement for low achieving and high achieving African-American
students in predominately white suburban schools?
According to parents’ perceptions, School, Family, Children, and Student Peer
Academic Emphasis load more on high achieving African-American students in
predominately white suburban schools when compared to low achieving African-
American students. Low achieving students were perceived as having lower levels of
academic emphasis, and these relationships were significant. In this study, the ratings of
African-American parents revealed a strong relationship between Children Academic
Emphasis and grade point average. This was followed by a significant positive

89
correlation between Student Peer Academic Emphasis and grade point average. These
results suggest that parents of high achieving students are more likely to perceive that
their children receive higher levels of School, Family, Children, and Students Peers
Academic Emphasis. These results are supported by previous research (e.g., Siren &
Rogers-Siren, 2004). Research reveals that students who are highly engaged in
academics are also self-motivated. They obtain higher grade point averages. Moreover,
during adolescence peer relationships are one of the most influential support groups
(Clark, 1991). Findings similar to Clark appear true for African-American students in
predominately white neighborhoods since many of these students were at the age of
adolescence at the time of the study.
Research Question 3: How do School, Family, Children, and Student Peer Academic
Emphasis load on achievement for low achieving and high achieving African-American
students in predominately white suburban school after controlling for significant
demographic variables?
Correlation analysis revealed that there were six demographic variables that had a
significant relationship to grade point average. They were the demographic variables
indicating that another guardian, besides a mother or father, completed the questionnaire,
school happiness, gender of child, parents highest level of education, family income, and
years lived in the neighborhood. This analysis revealed that high achieving African-
American students were more likely to live with a biological parent that completed the
questionnaire, as opposed to a guardian, their parents were happy with the school,
obtained a higher level of education, grossed higher family incomes, and lived in the

90
neighborhood longer. Moreover, high achieving students were more likely to be female
students. These demographic variables were removed to indicate how School, Family,
Children, and Student Peer Academic Emphasis load on achievement for low and high
achieving African-American students in predominately white suburban schools.
After controlling for significant demographic variables, Family Academic
Emphasis, Children Academic Emphasis, and Student Peer Academic Emphasis
remained to have a significant positive relationship to grade point average. Surprisingly,
School Academic Emphasis did not have a significant relationship. In other words, even
after controlling for significant demographic variables, the ratings of African-American
parents still revealed that high achieving African-American students were more likely to
have high levels of Family Academic Emphasis, Children Academic Emphasis, and
Student Peer Academic Emphasis. The same was not true for School Academic
Emphasis. School Academic Emphasis may not be related to grade point average
because schools in predominately white suburban neighborhoods may be perceived as
providing the same level of academic emphasis to all their children no matter if they are
low or high achieving students.
Research Question 4: Do African-American students with higher levels of two or more
forms of academic emphasis perform better than students with only one and no forms of
academic emphasis?
Two subcategories were created based upon the academic emphasis scores of
African-American students in response to Research Question 4 – “Do African-American
students with higher levels of two or more forms of academic emphasis perform better

91
than students with only one and no forms of academic emphasis?” These subcategories
were: (1) African-American students who did not score high on at least two forms of
academic emphasis and (2) African-American students who scored high on two or more
forms of academic emphasis. It is unfortunate that more than half of African-American
children in this study did not have at least one form of academic emphasis that scored
high. On the other hand, 24% of student had high ratings of two or more forms of
academic emphasis. Data indicated that African-American students with high levels of
two or more forms of academic emphasis were more likely to have higher grade point
averages when compared to students that had less forms of academic emphasis.
Research Question 5: How do characteristics of academic emphasis (i.e., Setting Goals,
Setting Environment, Believing in Children, Working Hard, and Acknowledging
Achievement) load on achievement for low achieving and high achieving African-
American students in predominately white suburban schools?
Data also supported that even when analyzing each characteristic of academic
emphasis, all characteristics had significant and positive relationships to children with
high grade point averages when compared to children with lower grade point averages.
According to their parents’ ratings, low achieving African-American students were
perceived to have less characteristics of academic emphasis such as Setting Goals,
Setting Environment, Believing in Children, Working Hard, and Acknowledging
Achievement. The strongest relationship to student achievement was between the
characteristics of people Believing in Children and grade point average – followed by
Setting Goals, Acknowledging Achievement, Working Hard, and Setting Environments

92
conducive to learning. Much research has been conducted detailing the importance of
teachers, families, children, and student peers believing in a student’s academic abilities
(Brophy, 1983; Catterall, 1998; Copper & Tom, 1984; Good, 1987; Good & Nichols,
2001; Tyler & Boelter, 2008). When teachers do not believe in their students’ abilities,
there is a greater likelihood that their students will be at a greater risk of academic failure.
Teachers that lack these beliefs provide a less challenging experience at school. They
offer less time for students to think when answering a question, give students answers
rather than wait for an answer, spend more time on discipline than acknowledging
achievement, and provide less homework for their students (Brophy, 1983; Copper &
Tom, 1984; Good, 1987; Good & Nichols, 2001).
Much like teachers, when parents, children, and their student peers believe less in
children’s abilities they also provide less challenging goals. When parents believe in
their children’s abilities, it allows their children to develop confidence (Dryfoos, 1990;
Halpern, 1990; Masten, Best, & Garmezy, 1990; Werner, 1990). On the other hand,
when parents fail to promote their children’s confidence, children are left to develop their
own confidence without any positive feedback from their parents – making it more
acceptable for children to believe in negative stereotypes (Constantine, Erickson, Banks,
& Timberlake, 1998). As research indicates, African-American children have more
negative stereotypes to overcome than Caucasian children (Barbarin, 1993; Dryfoos,
1990; Halpern, 1990; Masten, Best, & Garmezy, 1990; Werner, 1990). If their parents do
not help them to overcome these stereotypes by helping them develop confidence in their
abilities, it may encourage their children to accept these negative stereotypes and behave
in manners that would only confirm negative stereotypes. Research has revealed that

93
negative stereotypes have been linked to the development of low self-esteem, aggressive
behavior, as well as, the disliking of school (Freedman, 2002). In Ogbu’s study, many
African-American students who did not believe in their own abilities did not challenge
themselves in school. They revealed that they did not take advance placement classes
because they felt they could not achieve in these types of classes. They felt that the work
was “too challenging.” Since they didn’t believe in their own abilities they did not
challenge themselves to take advanced placement classes. On the other hand, when
children believe in their abilities, they set higher goals for themselves and are more likely
to accomplish set goals (Catterall, 1998).
Research Question 6: How do characteristics of academic emphasis (i.e., Setting Goals,
Setting Environment, Believing in Children, Working Hard, and Acknowledging
Achievement) load on achievement for low achieving and high achieving African-
American students in predominately white suburban schools after controlling for
significant demographic variables?
Again, after removing all six demographic variables that had significant
relationships to student achievement, a partial correlation was used to indicate how
characteristics of academic emphasis load on achievement for African-American students
in predominately white suburban schools after controlling for significant demographic
variables. All five characteristics of academic emphasis had significant and positive
relationships to grade point average. In other words, even after controlling for
demographic variables, the perception of African-American parents still revealed that
high achieving African-American students were more likely to have high levels of

94
characteristics of academic emphasis such as Setting Goals, Setting Environment,
Believing in Children, Working Hard, and Acknowledging Achievement.
Research Question 7: Do African-American students with higher levels of three or more
characteristics of academic emphasis perform better than students with only two, one,
and no characteristics of academic emphasis?
Similar to Research Question 4, African-American students with high levels of
three or more characteristics of academic emphasis were compared to students with only
high levels of two, one, and no characteristics of academic emphasis. Unfortunately, 60%
percent of parents in this study indicated that their children did not have at least one
characteristic of academic emphasis that was rated high. On the other hand, results
indicated that students with high levels of three or more characteristics of academics
emphasis had higher grade point averages. Again, revealing the more characteristics of
academic emphasis a student has the more likely they will perform better in school.
Research Question 8: What do parents of low achieving and high achieving African-
American students feel are the causes for achievement gaps in predominately white
suburban schools?
Results suggested that African-American parents believe that there are many
causes to the achievement gap between African-American and Caucasian students in
predominately white suburban schools. Although each response was worded differently,
there were eight emerging themes. These themes were: (1) School Prejudices, Racisms,
Discrimination, and Insensitivity to Diversity, (2) Lack of Family Involvement, (3)

95
Socioeconomic Issues, (4) Identity Issues with Black Children, (5) Lack of Children
Motivation, (6) Lack of School Encouragement, (7) Disbelief in the Achievement Gap,
and (8) Lack of Education in Parents. Approximately, fifty percent of responses
attributed the achievement gap to two themes. They were: School Prejudices, Racism,
Discrimination, Insensitivity to Diversity, and Lack of Family Involvement.
Results also indicated that parents of high achieving and low achieving African-
American were more likely to attribute the achievement gap to different variables.
Parents of low achieving African-American students were more likely to state that the
achievement gap was a result of African-American children lacking motivation. An
example of this theme was revealed in the response, “Black children don’t push
themselves hard enough academically. I think black children do just enough to get a
good grade and don’t push themselves beyond.” This theme had a significant
relationship to lower grade point averages. Another notable but not significant theme that
was more likely to be reported by African-American parents of low achieving students
was Socioeconomic Issues. On the other hand, responses from parents of high achieving
African-American students were more likely to provide themes such as School
Prejudices, Racisms, Discrimination, and Insensitivity to Diversity and Lack of Family
Involvement. None of these responses were statistically significant. Overall, responses
provided by African-American parents of low achieving and high achieving students
indicated that parents are attributing the achievement gap to different issues. Whereas
parents of low achieving African-American students made statements attributing the
achievement gap to issues within children and socioeconomic characteristics, it appears
that parents of high achieving students took more responsibility and were more likely to

96
attribute the achievement gap to Lack of Family Involvement. They were more likely to
suggest themes relating to African-American parents not vesting in their children’s
education. Perhaps these parents felt as though parents of low achieving African-
American were not involved in their children’s education. Moreover, parents of high
achieving African-American were more likely to attribute the achievement gap towards a
school problem - School Prejudices, Racisms, Discrimination, and Insensitivity to
Diversity. Instead of simply stating that schools did not encourage their children, they
provided specific solutions on how schools could close the achievement gap by reducing
prejudices and racism while also incorporating more diversity in predominately white
suburban schools.
Implications for Helping African-American Students in Suburban Schools
According to the ratings of African-American parents in this study, Family
Academic Emphasis is the most common form of academic emphasis received by
African-American students in predominately white suburban schools - followed by
School, Children, and Student Peer Academic Emphasis. On the other hand, School
Academic Emphasis is the only form of academic emphasis that is not related to student
achievement after controlling for demographic variables. This may reflect that after
controlling for demographic variables, all African-American students, high and low
performing, are perceived as being provided with the same level of School Academic
Emphasis. All characteristics of academic emphasis were related to student achievement.
Unfortunately, after analyzing open-ended responses collected from African-American
parents, there are large percentages of parents who attributed the achievement gap
specifically to schools, families, and/or children. Since there is an equal responsibility

97
for all parties to decrease the achievement gap, the following section will discussed some
solutions on how to provide academic emphasis to African-American students in
predominately white suburban schools.
Setting challenging goals for African-American children. African-American
students in predominately white suburban schools need to be encouraged by their teacher
to take more challenging classes. According to results in this study, many African-
American parents believed that the achievement gap is attributed to the lack of school
encouragement. These results are supported by Ogbu’s study. In Ogbu’s study, data
revealed that African-American students in suburban schools were less likely to be
encouraged by counselors to take more challenging classes when compared to Caucasian
students. If this is true, this hidden form of tracking can not continue in predominately
white suburban schools. There is a clear difference in the types of challenges presented
in advanced placement classes when compared to basic skills classes. According to
College Board (2010), a nonprofit association whose mission is to help students prepare
for college, advanced placement classes are unique learning experiences that help
students achieve in college. Advanced placement classes challenge students to engage in
college level learning. It encourages students to engage in a community of teachers and
students who are also committed to student achievement. On the other hand, basic skills
classes do not offer the same experiences. Often, they focus on helping students improve
developmental skills. If there is disproportionality in the lack of African-American
students in advanced placement classes, they are put at a disadvantage when compared to
Caucasian students in advanced placement classes.

98
Understandably, low achieving African-American students may need to be placed
in general classes to further improve their skills; however, they still need to be
challenged. Results indicated that when schools provide all their students with a
challenging curriculum, the achievement gap decreases. For instance, in the Rockville
Centre School District, detracting students closed the gap in high school graduation rates
(Burris & Welner, 2005). Data revealed that in the academic years 1992-93, students
placed in high track classes were graduating at a rate of 58 percent while students placed
in low track classes were graduating at a rate of 28 percent. After detracking their
students and providing all their students with a challenging education, the gap in
graduation rates decreased. By the academic year 1999-2000, 78 percent of all students
were graduating. If schools in predominately white suburban neighborhoods are not
challenging African-American students, they are putting them at greater risk of failure.
Organizing an environment conducive to learning for African-American children.
As indicated by Butler (2003), the achievement gap can be explained by schools failing
to provide adequate facilities and resources to African-American students. Research has
acknowledged the difference between education provided to African-American students
in urban areas when compared to the education provided to Caucasians in suburban
neighborhoods (Kozal, 1991). Yet, African-American students may still be placed at a
disadvantage in suburban schools where facilities and resources are adequate because
classes are not conducive to their ways of learning. Many African-American parents in
this study believe that their children’s school lack diversity. Many parents indicated that
the achievement gap is attributed to School Prejudices, Racisms, Discrimination, and/or
Insensitivity to Diversity. For instance, even with the adequate resources and facilities

99
that are provided in suburban schools, African-American parents in this study believe that
their children are not benefiting because Caucasian teachers do not know how to teach to
their children. They also believe that Caucasian teachers are not relating to their children.
In order to make more African-American students motivated to learn, teachers should
attempt to provide more culturally relevant education – teaching which is dedicated to
connecting academic experiences with the lives of diverse students. Moreover,
classrooms need to be organized in a manner which teaches to different types of learners.
For instance, African-American students may rely on visual information when compared
to auditory information, respond better to cooperative learning rather than individual
learning, or prefer engaging in simultaneous discussion when compared to alternative
discussion. Although these suggestions do not apply to all African-American students, it
is important that teachers in predominately white suburban schools recognize that
African-American students may have a different way of learning and attempt to organize
the classroom to meet their needs. If teachers are differentiating their instruction, then
they will be addressing the different learning styles that students bring to the classroom.
School administrators in predominately white suburban schools can provide teachers with
professional development focused on culturally relevant teaching. Also, one of the most
common solutions suggested for assisting African-American students is in this study, is
the hiring of African-American teachers. Unfortunately, this is a difficult task as many
African-Americans are acquiring bachelor’s degrees in other areas rather than education.
However, by attempting to provide these solutions, it will help ensure to African-
American parents that schools are trying to organize the classroom in a manner that will
facilitate their children’s learning.
100
Surprisingly, children in suburban schools can also help to provide their African-
American peers with an organized environment conducive to learning. This can be done
by helping African-American students engage in friendships with other students who
achieve in school. It is no surprise that children who spend time with peers that engage in
behaviors that put them at risk of academic failure are more likely to engage in these
types of behaviors (Schoeny, 2000). On the other hand, students that make friends with
other students that achieve are more likely to achieve in school. These students are also
more likely to engage in school related activities after school. There are strong
correlations between the amount of time children engage in school related activities after
school and student achievement. For instance, Gaddy (1998) reported that the amount of
time students spend reading at home is strongly linked to student achievement. On the
other hand, the amount of time spent on nonacademic activities, such as watching
television, is related to academic failure (Bowen & Bowen, 1998; Dumais, 2006).
Unfortunately, African-American students are less likely to engage in school-related
activities after school (Dumais, 2006). According to Dumais, they are more likely to talk
on the phone, watch television, or play videogames, when compared to Caucasian
students. In order to close the achievement gap in suburban schools, African-American
children may need to engage in educational activities outside of school. Ideally, this will
help close the achievement gap.
Believing in the abilities of African-American children. It is not surprising that
teachers and parents who do not believe in the abilities of African-American children fail
to help them achieve in school. There is plenty of research which indicates that student
achievement is related to teachers, as well as parents, and their beliefs in their children’s

101
abilities (Good & Nichols, 2001; Tyler & Boelter, 2008). Therefore, teachers and parents
of African-American students that do not believe in their abilities or have stereotypes
about their ability to be successful may contribute to the achievement gap by leading
African-American students toward greater risk of academic failure. Teachers that don’t
believe in their African-American students’ abilities, tend to lower their expectations. As
previously mentioned, research supports that teachers who do not believe in their
students’ abilities are less likely to provide class and homework because they believe it
will be inaccurate or incomplete (Tyler & Boelter, 2008). They also offer less time for
students to think when answering a question, give students answers rather than wait for
an answer, and spend more time on disciplinary issues when compared student
achievement (Brophy, 1983; Copper & Tom, 1984; Good, 1987; Good & Nichols, 2001).
On the other hand, when parents do not believe in their children’s abilities, they may
lower their expectations, become less vested in their children’s education, and fail to
make sure that their children perform well in school. By lowering their expectations,
African-American children become less challenged in school and perform to meet low
expectations. Teachers and parents in predominately white suburban schools need to
make certain that they have high expectations for their children. This will help African-
American develop stronger confidence in their abilities and become better performers in
school.
Working hard to provide African-American children with an adequate education.
It is important that teachers work hard to provide African-American students with an
adequate education – especially in predominately white suburban neighborhoods where
there is a current achievement gap. As previously mentioned, achievement gaps continue

102
to exist when students fall below their grade level because these students must make up
more progress during the academic school year to close the gap. Therefore, teachers may
have to provide more effort to increase the performance of African-American students
because many may already be behind their classmates (Ferguson, 2002). Data from this
study revealed that there is a significant and positive relationship between the number of
years a family lived in a suburban neighborhood and the grade point average of their
children – suggesting that children who recently moved in these types of neighborhoods
are more likely to have lower grade point averages. If newly enrolled African-American
students are targeted, they can easily be screened for skill deficits in which teachers can
gather data and implement an early and effective academic intervention to further
develop their skills. Anything less would only continue the achievement gap in suburban
schools.
On the other hand, it is equally important for parents to put as much, or more,
effort in their children’s education as their children’s teachers. Parents that do not put
much effort in their children’s education fail to promote learning for their children. Data
from this study indicates that Family Academic Emphasis is the most common form of
academic emphasis provided to African-American children. Unfortunately, conflicting
data supports that African-American parents in another suburban neighborhood are less
engaged in their children’s education when compared to Caucasian children (Ogbu,
2002). The differences in African-American parents and their commitment towards
providing their children with an adequate education have been documented. In a study
conducted by Jackson (1999), African-American children that were failing in school
reported that their parents did not help them at home. Instead, they reported that their

103
parents engaged in more time watching television than helping them with their education.
On the other hand, African-American students that achieved in school revealed that their
parents were involved in their education. The more parents engage in their children’s
learning and work hard to ensure that they are being provided with an adequate education
at home the more likely their children will achieve in school (Kenny, Gallagher, Alverez-
Salvat, & Silsby, 2002). African-American parents of low achieving African-American
students may need to work harder to help their children achieve in school.
Student peers of African-American children can also work hard to help towards
their friends’ education. This may be done by inviting African-Americans to study
groups or creating study groups with African-American students. There are many
advantages of peer study groups that are beneficial to African-American children. Such
benefits are, but not limited to: (1) having a support system – students in a study group
support and encourage each other, (2) learning from the strengths and weakness of others
– each student in a study group has their own strengths and uses it to help others with
their weaknesses, (3) opportunity to teach – each member of the groups is provided with
an opportunity to teach other students, (4) understanding the material – students in study
groups understand and retain more information when compared to learning by
themselves, and (5) develops confidence – as children understand more their confidence
in increases (Center for Academic Success, 2009). Moreover, as children engage with
study groups, they develop more opportunities to learn new study habits. These benefits
may help increase the academic performance of African-American students in suburban
schools.

104
Acknowledging the achievement of African-American children. Finally, teachers
that do not acknowledge the achievement of African-American students fail to promote
student learning in suburban schools. Unfortunately, African-Americans students in
suburban schools revealed that teachers, who acknowledge their achievement,
encouraged them to perform better in school when compared to teachers who make
teacher demands (Ferguson, 2002). Recognizing achievement increases student
performance because it provides students with goals to achieve rather than focusing on
behaviors to avoid. When teachers acknowledge achievement, they are noting the
behaviors they want repeated in the classroom. Conversely, when they lack
acknowledgement, or only acknowledge students’ lack of success, they are only
informing students of improper behaviors but not appropriate ones. This may lead
students to develop low confidence. Unfortunately, many teachers tend to recognize
inappropriate behaviors more often than student achievement. If teachers that fail to
acknowledge student achievement want African-American students to increase their
performance, they may need to make a stronger attempt to reward positive behaviors.
Similarly, African-American parents that fail to acknowledge their children’s
achievement in school may also cause achievement gaps by decreasing their children’s
motivation. According to Ogbu (2002), African-American parents in suburban
neighborhoods acknowledge their children’s achievement; however, punishment may not
be the most effective way to increase motivation for African-American children. In
Ogbu’s study, African-American children revealed that their parents encouraged them to
perform better in school when they acknowledge their achievement. Acknowledging
their accomplishments motivated them more to increase their performance when being

105
compared to being punished. In fact, it was suggested that punishment decreased their
motivation. As previously stated, recognizing achievement helps increase student
performance because it provides children with goals to achieve rather than focusing on
behaviors to avoid. When parents acknowledge achievement, they are reminding children
of the behaviors they want repeated. On the other hand, when they only acknowledge
their children’s lack of success, they inform their children of improper behaviors but not
reminding them of more appropriate behaviors to repeat. According to this study, many
parents indicated that Lack of Children Motivation is the cause for the achievement gap.
If African-American parents in suburban neighborhoods want to help increase their
children’s motivation to achieve in school, they may need to make a stronger attempt in
acknowledging their children’s achievement, reward all positive behaviors, and decrease
punishment for misbehaving.
Implications for Future Research
As with all research, the current study has a series of limitations that need to be
taken into account when addressing the implications for future research. These
limitations, as well as findings from this study, were used to suggest future research. For
instance, all questionnaires used in this survey were collected from schools within one
Midwestern predominately white suburban neighborhood. Although all participants were
provided with a questionnaire in a manner that would allow them to return their surveys
randomly, these results may not be generalized to all African-American students in
predominately white suburban schools. Future studies should attempt to collect data
from more schools within predominately white suburban neighborhoods across different
regions of the United States. This will increase generalizability. Secondly, although it

106
was an objective to collect responses from African-American parents of black students in
predominately white suburban schools, there are major drawbacks to using and relying on
someone else’s ratings to collect data. Future research may want to collect data of
academic emphasis from the direct source. Therefore, future research may want to
collect School Academic Emphasis from teachers, Family Academic Emphasis from
parents, Children Academic Emphasis from children, and Student Peer Academic
Emphasis from a child’s best friend. Moreover, student achievement should be observed
beyond the limits of grade point average, (e.g., class rank, score obtain on statewide
proficiency tests, etc.) and collected from schools. Finally, when provided the
opportunity, African-American parents’ ratings revealed that School Academic Emphasis
was less provided than Family Academic Emphasis. Unfortunately, it was the only form
of academic emphasis that did not have a significant and positive relationship to grade
point average, suggesting that both high and low performing African-American students
were provided with similar academic emphasis. This should be further explored. If
future research collects ratings from the direct source and attempts to control for
academic emphasis, each form of academic emphasis could be analyzed to see what form
of academic emphasis has the strongest effect on student achievement. Future research
can analyze which is most important.
Summary and Conclusion
Based on previous discussion of the results, several conclusions were drawn from
this study. First, when provided the opportunity to express their opinion, African-
American parents’ ratings revealed that Family Academic Emphasis was the most
common form of academic emphasis received by their children. Secondly, there were

107
differences in demographic variables between high performing and low performing
African-American students in predominately white suburban schools. High achieving
African-American students were more likely to live with a biological parent that
completed the questionnaire, as opposed to a guardian; were happy with the school;
obtained a higher level of education; grossed higher family incomes; and lived in the
neighborhood longer. Moreover, high achieving students were more likely to be female
students.
In regards to academic emphasis (i.e., School, Family, Children, and Student Peer
Academic Emphasis), as well as characteristics (i.e., Setting Goals, Setting
Environments, Believing in Children, Working Hard, and Acknowledging Achievement),
they also had significant and positive relationships to grade point averages. Surprisingly,
after controlling for demographic variables, all remained to have significant positive
relationships to grade point average with the exception of School Academic Emphasis.
This may indicate that after controlling for these demographic variables, parents’ ratings
revealed that they perceive there to be no difference in the amount of School Academic
Emphasis provided to high and low performing African-American students. According
to these parents, it appears schools equally provide academic emphasis. Further analyses
indicated that when African-American students had high levels of two or more forms of
academic emphasis, academic emphasis was significantly related to higher grade point
averages. The same was true when African-American students in predominately white
suburban neighborhoods had three or more characteristics of academics emphasis.
Finally, when parents where provided the opportunity to give their reasons for the
achievement gap, eight themes emerged. Two themes accounted for nearly half of all

108
responses. These themes were School Prejudices, Racisms, Discrimination, and
Insensitivity to Diversity, and Lack of Family Involvement. There was one significant
difference for the cause of the achievement gap between parents of high achieving
student and low achieving students. After controlling for significant demographic
variables, Lack of Children Motivation continued to hold significant relationships with
grade point average. This indicated that parents of low achieving African-American
students were more likely to attribute the achievement gap to their children’s lack of
motivation. On the other hand, parents of achieving students differed. Data collected
from this study demonstrates a need to collect the opinions of African-American parents
in predominately white suburban schools and further investigate the cause of the
achievement gap between low and high performing African-American students.

109
APPENDIX A
ACADEMIC EMPHASIS SCALES

110

111

112
APPENDIX B
DEMOGRAPHIC VARIABLE QUESTIONS

113

114
APPENDIX C
INITIAL POSTCARD

115
Dear Resident of ___________,
My name is Julio Olivo and I am a graduate student at The Ohio State University.
I am in pursuit of my doctorate degree and I need your help. In two days, I will mail you
a survey that I would like for you to complete. The survey is very easy and can be
completed in approximately five minutes. It is about your children’s education. Please
fill out the survey and send it back to me.
I greatly appreciate it,
Julio C. Olivo II, M.A.
P. S. A pre-postage envelop will be provided for you to send back your survey.

116
APPENDIX D
INITIAL COVER LETTER

117
Dear Parent(s) or Guardian(s):
My name is Julio C. Olivo II and I am a doctorial candidate at The Ohio State University. I am writing to ask for your participation in a research project that will help researchers better understand the achievement of African-American students in predominately white suburban schools. My research project examines the academic emphasis of African-American students in suburban schools. Academic emphasis is a term that expresses the emphasis that teachers, parents, and students place on academics. I am interested in identifying contributing factors that impact your child/children's achievement.
The project in which you have been invited to participate in is expected to take approximately 5 minutes for each child you have in middle school, junior high, and high school. However, the decision to participate is ultimately yours. To help you in your decision, a brief description of the research project is provided. All you have to do is answer each question on the survey and return it to my address. A prepaid envelop is provided so you can easily mail back your answers. By completing the survey and sending it in, you are voluntarily making a decision to participate in this research study. If you do not want to participate, simply ignore this survey.
I would like to assure you that this study has been reviewed and received clearance through the Office of Responsible Research Practices at The Ohio State University. In addition, it has been approved by your district’s superintendent. However, the final decision about participation is yours. There are no known or anticipated risks to participation in this study. Your answers are considered confidential and will not be shared with school staff. Should you have any concerns or comments resulting from your participation in this study, please contact the Office of Responsible Research Practices at 1-800-678-6251. Attached to this letter is the survey I would like you to fill out for each child in your household that is enrolled in grades 7 through 12. Please follow the instructions on the first page. When the survey(s) is complete, slip it in the pre-paid envelop and send it back to me. Please, do not send it back to your child(ren)’s school. Also, as a token of my appreciation, I have attached a dollar to this letter. I know it is not much but I wanted to show you my appreciation. Please fill out my survey(s)☺.
Yours sincerely,
Julio C. Olivo II, M. A.
P. S. If you have any questions, please feel free to contact me at 973-545-6767.

118
APPENDIX E
FINAL COVER LETTER

119
Dear Parent(s) or Guardian(s):
My name is Julio C. Olivo II and I am a doctorial candidate at The Ohio State University. I am writing to you again to ask for your participation in a research project that will help researchers better understand the achievement of African-American students in predominately white suburban schools. My research project examines the academic emphasis of African-American students in suburban schools. Academic emphasis is a term that expresses the emphasis that teachers, parents, and students place on academics. I am interested in identifying contributing factors that may impact your child/children's achievement.
The project in which I have invited you to participate in is expected to take approximately 5 minutes for each child you have in middle school, junior high, and high school. However, the decision to participate is ultimately yours. To help you in your decision, a brief description of the research project is provided. All you have to do is answer each question on the survey and return it to my address. A prepaid envelop is provided so you can easily mail back your answers. By completing the survey and sending it in, you are voluntarily making a decision to participate in this research study. If you do not want to participate, simply ignore this survey.
I would like to assure you that this study has been reviewed and received clearance through the Office of Responsible Research Practices at The Ohio State University. In addition, it has been approved by your district’s superintendent. However, the final decision about participation is yours. There are no known or anticipated risks to participation in this study. Your answers are considered confidential and will not be shared with school staff. Should you have any concerns or comments resulting from your participation in this study, please contact the Office of Responsible Research Practices at 1-800-678-6251. Attached to this letter is the survey I would like you to fill out for each child in your household that is enrolled in grades 7 through 12. Please follow the instructions on the first page. When the survey(s) is complete, slip it in the pre-paid envelop and send it back to me. Please, do not send it back to your child(ren)’s school.
Yours sincerely,
Julio C. Olivo II, M. A.
P. S. If you have any questions, please feel free to contact me at 973-545-6767.

120
APPENDIX F
FINAL POSTCARD

121
THANK YOU
FOR PARTICIPATING IN MY STUDY!
Julio C. Olivo II, M.A.

122
LIST OF REFERENCES
Alson, A. (2003). The academic achievement gap: The suburban challenge. (Office of Elementary and Secondary Education). Washington, DC: National Clearinghouse for Comprehensive School Reform.
Ankeny (2006). Retrieved from http://www.ankeny.k12.ia.us/ Arms, E., Bickett, J., & Graf, V. (2008). Gender bias and imbalance: Girls in US special
education programmes. Gender and Education, 20(4), 349-359. Barbarin, O. A. (1993). Coping and resilience: Exploring the inner lives of African American children. Journal of Black Psychology, 19, 478-492. Bixenstine, V.E., DeCorte, M.S., Bixenstine, B.A. (1976). Conformity to peer-
sponsored misconduct at four grade levels. Developmental Psychology, 12, 226-236.
Blanchett, W.J. (2006). Disproportionate representation of African-American students in
special education: Acknowledging the role of white privilege and racism. Educational Researcher, 35(6), 24-28.
Borman, G. D. & Overman, L. T. (2004). Academic resilience in mathematics
among poor minority students. The Elementary School Journal, 104(3), 177-195. Bowen, N.K. & Bowen, G.L. (1998). The mediating role of educational meaning in the
relationship between home academic culture and academic performance. Family Relations 47, 45-51.
Bowman, B.T., Donovan, S., & Burns, S. (Eds.). (2001). Eager to learn: Educating our
preschoolers. Report of the National Research Council, Committee on Early Childhood Pedagogy, Commission on Behavioral and Social Sciences and Education. Washington, DC: National Academies Press.
Bransford, J., Brown, A., Cocking, R., & National Academy of Sciences - National
Research Council, W. (2000). How people learn: Brain, mind, experience, and school. Expanded Edition.

123
Brooks-Gunn, J., Klebanov, P.K., Smith, J., Duncan, G.J., & Lee, K. (2003). The black-
white test score gap in young children: Contributions of test and family. Applied Developmental Science, 7(4), 239-252.
Brophy, J.E. (1983). Research on the self-fulfilling prophecy and teacher expectations.
Journal of Educational Psychology, 75, 631-661.
Burris, C.C., & Welner, K.G. (2005). Closing the achievement gap by detracking. Phi Delta Kappan, 86, 594-598.
Butler, S. K. (2003). “Helping urban African American high school students to excel academically: the roles of school counselors,” High School Journal, Vol. 87:1. Castillo, J.A. (1999). Family-based resilience process in African American inner
city at-risk youth (Doctoral Dissertation, Fordham University, 2003) Dissertation Abstract International, 64, 1521.
Catterall, J. (1998). Risk and resilience in student transitions to high school.
American Journal of Education, 106, 302-333. Census. (2000). Retrieved from http://quickfacts.census.gov/qfd/ Center for Academic Success. (2009).
Retrieved from http://www.lehigh.edu/~inacsup/cas/pdfs/StudyGroups_info.pdf Clark, M.L. (1991). Social identity, peer relations, and academic competence of
African-American adolescents. Education and Urban Society, 24(1), 41-52. Cohen, J. (1992). A power primer. Psychological Bulletin, 112(1), 155-159. Cohen, J. (1988). Statistical power analysis for the behavioral sciences (2nd Edition).
Hillsdale, NJ: Erlbaum. Coleman, J. and Others & National Center for Educational Statistics (DHEW/OE), W.
(1966). Equality of Educational Opportunity. College Board (2010). Retrieved from
http://www.collegeboard.com/student/testing/ap/about.html Constantine, M. G., Erickson, C. D., Banks, R. W., & Timberlake, T. L. (1998). Challenges to the career development of urban racial and ethnic minority youth: Implications for vocational intervention. Journal of Multicultural Counseling and Development, 26, 83-95.

124
Constanzo, P.R., & Shaw, M. E. (1966). Conformity as a function of age level.
Child Development, 37, 967-975. Copper, H.M., & Tom, D.Y. (1984). Teacher expectation research: A review with
implications for classroom instruction. The Elementary School Journal, 85, 77-89. Cooper, J.A. & Schleser, R. (2006). Closing the achievement gap: Examining the role of
cognitive development level in academic achievement. Early Childhood Education Journal, 33(5), 301-306.
Davison, M.L., Seo, Y.S., Davenport, E.C., Butterbaugh, D. & Davison, L.J. (2004).
When do children fall behind? What can be done? Phi Delta Kappan, 85, 752-761.
Dillion, S. (2007, February 7). Advanced placement tests are leaving some behind. The
New York Times. Retrieved from http://www.nytimes.com/2007/02/07/education/07ap.html
Dillman, D.A. (2007). Mail and internet surveys: The tailored method design (2nd
ed.). New Jersey: John Wiley & Sons, Inc. Dryfoos, J. G. (1990). Adolescents at risk: Prevalence and prevention. New York: Oxford University Press. Dumais, S. A., (2006) "After-School Activities and Students' Mathematics Achievement:
Differences by Gender, Race, and Socioeconomic Status" Paper presented at the annual meeting of the American Sociological Association, Montreal Convention Center, Montreal, Quebec, Canada Online. Retrieved from http://www.allacademic.com/meta/p103727_index.html
Edmonds, R. (1979). Effective schools for the urban poor. Educational Leadership, 15-
24. Entwisle, D.R., & Alexander, K.L. (1999). Early schooling and social stratification. In
R.C. Piana & M.J. Cox (Eds.), The Transition to kindergarten (pp. 13-39). Baltimore: Brookes.
Ferguson, R.F. (2002). What doesn’t meet the eye: Understanding and addressing
racial disparities in high achieving suburban schools (North Central Educational Lab). Oak Brook, IL: Rockefeller Foundation.
Ferguson, R.F., Clark, R., & Stewart, J. (2002). Closing the achievement gap in
suburban and urban school community. Policy Issues, 13, 1-20.

125
Floyd, C. (1996) Achieving despite the odds: A study of resilience among a group
of African American high school seniors. The Journal of Negro Education, 65(2), 181-189.
Freedman, J.S. (2002). Easing the Teasing: Helping your children with name-calling,
ridicule, and verbal bullying. Chicago: McGraw-Hill. Fryer, R.G., & Levitt, S.D. (2004). Understanding the black-white test score gap in the
first two years of school. Review of Economics and Statistics, 86(2), 447-464. Gaddy, G.D. (1986). Television’s impact on high school achievement. The Public
Opinion Quarterly, 50, 340-359. Goddard, R.D., Sweetland, S.R., & Hoy, W.K. (2000). Academic emphasis of urban
elementary schools and student achievement in reading and mathematics: A multilevel analysis. Educational Administration Quarterly, 36(5), 683-702.
Good, T.L. (1987). Two decades of research on teacher expectations: Finding and future
directions. Journal of Teacher Education, 38, 32-47. Good, T.L. & Nichols, S.L. (2001). Expectancy effects in the classroom: A special focus
on improving the reading performance of minority students in first-grade classrooms. Educational Psychologist, 35, 113-126.
Gloecker, L. & Daggett, W. (2004). NCLB- A crossroad for special education. Retrieved
from http://www.leadered.com/pdf/4%20SpecEdwhitepaper.PDF Halpern, R. (1990). Poverty and early childhood parenting: Toward a framework for intervention. American Journal of Orthopsychiatry, 60, 6-18. Hart, B., & Risley, T.R. (1995) Meaningful differences in the everyday experience of
young American children. Baltimore: Paul H. Brooks. Hill, N.E., & Craft, S.A. (2003). Parent-school involvement and school performance:
Mediated pathways among socioeconomically comparable African-American and Euro-American families. Journal of Educational Psychology, 95(1), 74-83.
Hoffman, K., Llagas, C., Snyder, T., & National Center for Education Statistics (ED), W.
(2003). Status and Trends in the Education of Blacks. Hood, J.L, & LoVette, O.K. (2002, Mar). An investigation of the relationship between
parents’ perceptions of parental involvement and the academic achievement of their children. Paper presented at the annual meeting of the Louisiana Educational Research Association, Ruston, Louisiana.

126
Hoy, W.K. (2006). Retrieved from http://www.coe.ohio-state.edu/whoy/instruments_6.htm#E
Jackson, C. (1999). Factors that foster academic resilience in African American
male middle school students from low socioeconomic, single-parent homes. (Doctoral Dissertation, University of Alabama at Birmingham, 1999). Dissertation Abstracts International, 60, 4317.
Jencks, C. & Phillips, M. (1998) “America’s next achievement test: Closing the black-white achievement gap,” The American Prospect. No. 40, 44-53.
Jimerson, S.R. (1999). On the failure of failure: Examining the association between early grade retention and education and employment outcomes during late adolescence. Journal of School Psychology, 37(3), 243-272.
Journal of Blacks in Higher Education. (2007). Retrieved from www.jbhe.com/preview/winter07preview.html
K12 Academics (2009). Retrieved from
http://www.k12academics.com/education-issues/achievement-gap Kaufman, P., Alt, M.N., and Chapman, C.D. (2001). Dropout Rates in the United States:
2000 (NCES 2002–114). U.S. Department of Education. Washington, DC: National Center for Education Statistics.
Kenny, M. E., Gallagher, L. A., Alvarez-Salvat, R., & Silsby, J. (2002). Sources of
support and psychological distress among academically successful inner-city youth. Adolescence, 37(145), 161-182.
Klinger, J., Artiles, AJ., Kozleski, E., Harry, B., Zion, S., Tate, W., et al. (2005).
Addressing the disproportionate representation of culturally and linguistically diverse students in special education through culturally responsive educational system. Education Policy Analysis Archives, 13(38).
Kober, N. (2001). It takes more than testing: Closing the achievement gap.
Washington, DC: Center on Education Policy. Kozal, J. (1991). Savage inequalities: Children in America’s schools. New York:
Crown Publishers, Inc. Levin, H. (1987). Accelerated schools for disadvantaged students. Educational
Leadership, 44(6), 19-21.

127
Losen, D.J., & Orfield, G. (2002). Racial inequality in special education. Cambridge, MA: Harvard Education Press.
Masten, A. S., Best, K. M., & Garmezy, N. (1990). Resilience and development: Contributions from the study of children who overcame adversity. Development and Psychopathology, 2, 425-444. Miller, L. (2005). Retrieved from http://www.ag.ohio-state.edu/~aged888/ Moore, J. (1998). Black English speakers: An examination of language registers of
high and low achieving black elementary school students. Retrieved from http://www.eric.ed.gov/ERICDocs/data/ericdocs2sql/content_storage_01/0000019b/80/17/34/b5.pdf
National Assessment of Educational Progress, (2007). Retrieved from
http://nces.ed.gov/pubs2008/nativetrends/tables/table_4_2b.asp Oakes, J., Gamoran, A., & Page, R. (1992). Curriculum differentiation: Opportunities,
outcomes, and meanings. In P. Jackson (Ed.), Handbook of Research on Curriculum, edited by Phillip Jackson (pp. 570-608). New York: Macmillan.
Ogbu, J.U. (2002). Black American students in an affluent suburb. London:
Lawrence Erlbaum Associates, Publishers. PAES (2009). Retrieved from http://ehe.osu.edu/paes/school-psychology/ Patten, M.L. (1997). Understanding research methods: An overview of the essentials. Los
Angeles: Pyrczak. Pattillo-McCoy, M. (1999). Black picket fences. Chicago: University of Chicago
Press. Phillips, M. (1997). What makes schools effective? A comparison of the
relationship of communitarian climate and academic climate of mathematics achievement attendance during middle school. American Educational Research Journal, 34(4) 633-662.
Phillips, M., Brooks-Gunn, J., Duncan, G.J., Klebanov, P., & Crane, J. (1998). Family
background, parenting practices, and the black-white test score gap. In C. Jenks & M. Phillips (Eds.), The Black-White Test Score Gap, edited by Christopher Jenks and Meredith Phillips (pp. 103-145). Washington, DC: Brookings Institute Press.
Quality counts 2004: Count me in. (2004). Education Week, 23(17). Rock, D.A., & Stenner, A.J. (2005). Assessment issues in the testing of children at

128
school entry. The Future of Children, 15(1), 15-34. Schoeny, M. E. (2000). An ecological model of adolescent risk and resilience: The
influence of family, peers, and mentors. (Doctoral Dissertation, Depaul University, 2000). Dissertation Abstracts International, 61, 4428.
Schugurensky, D. (2002). Retrieved from
http://www.wier.ca/~%20daniel_schugurensky/assignment1/1966coleman.html Singham, M. (2003). The achievement gap: Myths and reality. Phi Delta Kappan, 84(8),
586-581. Siren, S.R. & Rogers-Siren, L.R. (2004). Exploring school engagement of middle-
class African American adolescents. Youth & Society, 35(3), 323-340. Smith, J.K. (1993). Hermeneutics and qualitative inquiry. Concepts in qualitative
research, edited by David J. Finders and Geoffrey E. Mills, 183-201, New York, NY: Teachers College.
Smokowski, P. R., Reynolds, A.J., Bezruczko, N. (1999). Resilience and protective
factors in adolescence: An autobiographical perspective from disadvantaged youth. Journal of School Psychology, 37(4). 425-448.
Snow, C.E., Burns, M.S., & Griffin, P. (Eds.). (1998). Preventing reading difficulties in
young children. Washington, DC: National Academy Press. Sterns, E., Moller, S., Potochnick, S., & Blau, J. (2007). Staying back and dropping out:
The relationship between retention and school dropout. Sociology of Education, 80(3), 210-240.
Strayhorn, T. (2009). Different folks, different hopes: The educational aspirations of black males in urban, suburban, and rural high schools. Urban Education, 44(6), 710-731.
Tyler, K. M., & Boelter, C. M. (2008). Linking black middle school students’ perception
of teachers’ expectations to academic engagement and efficacy. The Negro Educational Review, 59(1-2), 27-44.
U.S. Department of Education. (2004). To assure the free appropriate public education of
all children with disabilities: Twenty-fourth annual report to Congress on the implementation of the Individuals with Disabilities Education Act. Washington, DC: Author.

129
Vines, V. (2002). http://www8.nationalacademies.org/onpinews/newsitem.aspx?RecordID=10128
Werner, E. E. (1990). Protective factors and individual resilience. In S. J. Meisels & J. P. Shonkoff (Eds.), Handbook of Early Childhood Education (pp. 225- 256). Cambridge, England: Cambridge University Press.