FGD Biodiversity & Wetland Assessment - JICA
515
FGD Biodiversity & Wetland Assessment Natural Scientific Services CC 1
-
Upload
khangminh22 -
Category
Documents
-
view
1 -
download
0
Transcript of FGD Biodiversity & Wetland Assessment - JICA
FGD Biodiversity & Wetland Assessment
Natural Scientific Services CC 1

FGD Biodiversity & Wetland Assessment
Natural Scientific Services CC 2
BIODIVERSITY AND WETLAND ASSESSMENT FOR THE
FGD PROJECT AT MEDUPI POWER STATION –
LEPHALALE, LIMPOPO
Compiled For:
Maxwell Office Park
Magwa Crescent West
Waterfall City, Midrand
Tel: +27 11 207 2060
Compiled By:
Natural Scientific Services CC
64A Colleraine Drive River Club Ext 7
Sandton, Johannesburg 2191
Tel: (011) 787-7400 Fax: (011) 784-7599
COPYRIGHT WARNING With very few exceptions the copyright of all text and presented information is the exclusive property of Natural Scientific Services. It is a criminal offence to reproduce and/or use, without written consent, any information, technical procedure and/or technique contained in this document. Criminal and civil proceedings will be taken as a matter of strict routine against any person and/or institution infringing the copyright of Natural Scientific Services.
Ref No: 2112
Date: January 2018

FGD Biodiversity & Wetland Assessment
Natural Scientific Services CC 3
TABLE OF CONTENTS
1. Introduction .......................................................................................................................... 10
2. Terms of Reference ............................................................................................................. 11
3. Project Team ........................................................................................................................ 13
4. Applicable Legislation ......................................................................................................... 17
4.1. International Agreements .............................................................................................. 17
4.2. Regional Agreements .................................................................................................... 19
4.3. National Legislation, Policies and Guidelines ................................................................ 19
4.4. Limpopo Legislation, Policies and Guidelines ................................................................ 23
5. Study Site Description ......................................................................................................... 25
5.1. Locality and Land Use ................................................................................................... 25
5.2. Climate .......................................................................................................................... 26
5.3. Geology and Soils ......................................................................................................... 28
5.4. Hydrology ...................................................................................................................... 30
5.5. Regional Vegetation ...................................................................................................... 32
6. Methodology ........................................................................................................................ 37
6.1. Vegetation & Floral Communities .................................................................................. 37
6.2. Faunal Communities ..................................................................................................... 40
6.3. Watercourses, Wetlands and Ephemeral Systems ........................................................ 45
7. Results .................................................................................................................................. 55
7.1. Vegetation Communities ............................................................................................... 55
7.2. Faunal Communities ..................................................................................................... 72
7.3. Watercourses, Wetlands and Ephemeral Systems ........................................................ 90
7.4. Wetland Classification ................................................................................................. 101
7.5. Wetland Extent ............................................................................................................ 102
7.6. Present Ecological State of the Wetlands .................................................................... 103
7.7. Sediment ..................................................................................................................... 104
7.8. Eco-system Services ................................................................................................... 114
7.9. Wetland (Ecological) Importance and Sensitivity ......................................................... 117
8. Conservation Important Areas .......................................................................................... 119
8.1. National Significance ................................................................................................... 119
8.2. Provincial Significance ................................................................................................ 121
8.3. Local Significance ....................................................................................................... 121
9. Impact Assessment ........................................................................................................... 130
9.1. Activity: Site clearing ................................................................................................... 133
9.2. Activity: Construction and operation of the ADF and FGD infrastructure ..................... 139
9.3. Activity: Harvesting of hillwash material (topsoil) within the ADF footprint ................... 140
9.4. Activity: Earth Works (associated with construction of the ADF) .................................. 142
FGD Biodiversity & Wetland Assessment
Natural Scientific Services CC 4
9.5. Activity: Increased Traffic, Machinery & Human Activity .............................................. 144
9.6. Activity: Construction clearing and resultant increase in exposed surfaces during
construction of the FGD plant, ADF and associated infrastructure. ............................. 145
9.7. Activity: Trucking Waste to Holfontein ......................................................................... 146
9.8. Activity: Storage of substrates and by-products associated with the ADF and FGD
operation. .................................................................................................................... 147
10. Predicted Ecological State: Targets and Strategies ........................................................ 172
11. Conclusion ......................................................................................................................... 177
12. References ......................................................................................................................... 179
13. Appendices ........................................................................................................................ 186
13.1. Appendix 1 Floral species recorded in the QDGS ....................................................... 186
13.2. Appendix 1a Additional photographic evidence of floral species on site ...................... 197
13.3. Appendix 2 Mammal list for the study area .................................................................. 199
13.4. Appendix 3 Bird list for the study area ......................................................................... 205
13.5. Appendix 4 Reptile list for the study area .................................................................... 220
13.6. Appendix 5 Frog list for the study area ........................................................................ 225
13.7. Appendix 6 Butterfly list for the study area .................................................................. 227
13.8. Appendix 7 Present and potentially occurring dragonfly and damselfly species
within the study area ................................................................................................... 234
13.9. Appendix 8 Present and potentially occurring scorpion species within the study
area............................................................................................................................. 236
13.10. Appendix 9 Present and potentially occurring baboon spider species within
the study area ............................................................................................................. 236
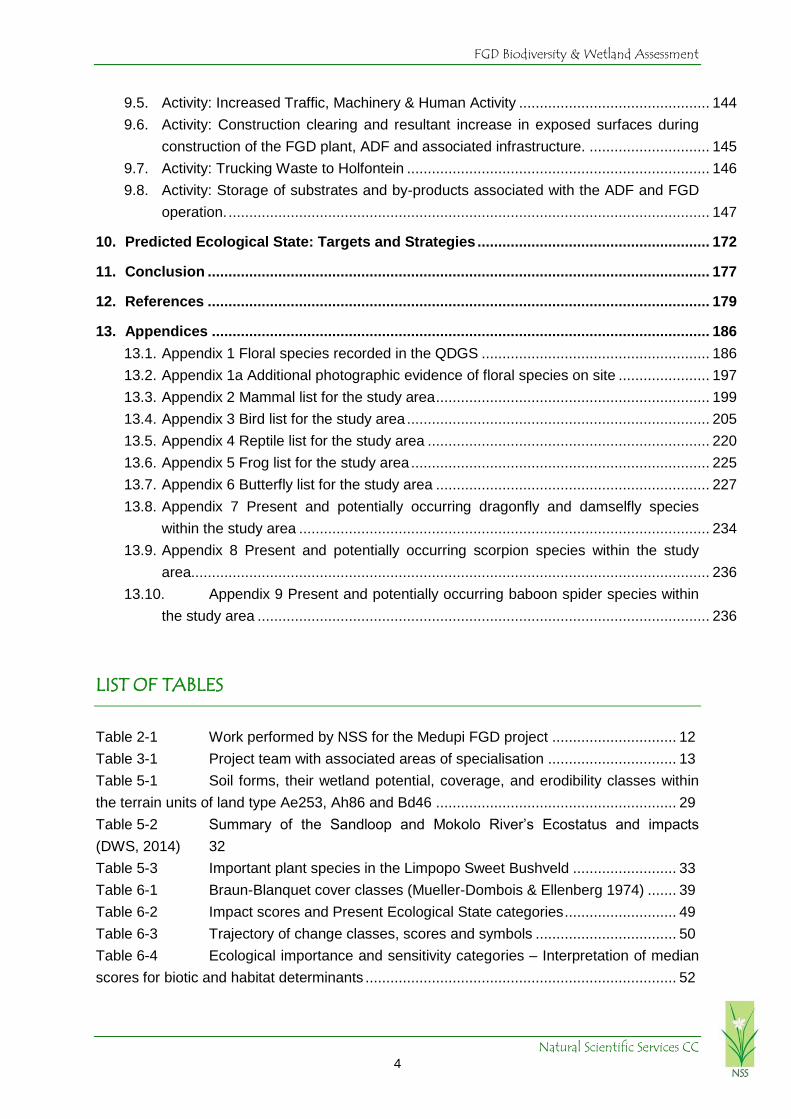
LIST OF TABLES
Table 2-1 Work performed by NSS for the Medupi FGD project .............................. 12
Table 3-1 Project team with associated areas of specialisation ............................... 13
Table 5-1 Soil forms, their wetland potential, coverage, and erodibility classes within
the terrain units of land type Ae253, Ah86 and Bd46 .......................................................... 29
Table 5-2 Summary of the Sandloop and Mokolo River’s Ecostatus and impacts
(DWS, 2014) 32
Table 5-3 Important plant species in the Limpopo Sweet Bushveld ......................... 33
Table 6-1 Braun-Blanquet cover classes (Mueller-Dombois & Ellenberg 1974) ....... 39
Table 6-2 Impact scores and Present Ecological State categories ........................... 49
Table 6-3 Trajectory of change classes, scores and symbols .................................. 50
Table 6-4 Ecological importance and sensitivity categories – Interpretation of median
scores for biotic and habitat determinants ........................................................................... 52

FGD Biodiversity & Wetland Assessment
Natural Scientific Services CC 5
Table 7-1 Top Ten Dominant Families and Most Dominant Growth Forms obtained
from the POSA website for the QDS 2327DA ..................................................................... 55
Table 7-2 Vegetation Communities .......................................................................... 57
Table 7-3 Acacia nigrescens - Grewia Open Veld Vegetation Description ............... 58
Table 7-4 Acacia nigrescens –Combretum apiculatum Woodland Vegetation
Description 60
Table 7-5 Acacia erubescens - Grewia Thornveld Vegetation Description ............... 61
Table 7-6 Acacia Mixed Woodland Vegetation Description ...................................... 62
Table 7-7 Transformed Areas .................................................................................. 64
Table 7-8 Numbers of conservation important plant species per Red Data category
within South Africa and Limpopo ......................................................................................... 66
Table 7-9 Species recorded in the surrounding farms QDG (PRECIS Data) ............ 67
Table 7-10 Main Alien Invasive Species found within the Study Area ........................ 71
Table 7-11 Summary of faunal species richness in the study area as compared to a
regional scale 72
Table 7-12 Present and potentially occurring CI mammal species ............................. 76
Table 7-13 Newman’s (2002) modified bird categories .............................................. 80
Table 7-14 Present and potentially occurring CI bird species..................................... 81
Table 7-15 Present and potentially occurring CI reptile species ................................. 84
Table 7-16 Present and potentially occurring CI frog species .................................... 87
Table 7-17 Present and potentially occurring CI terrestrial macro-invertebrate species
88
Table 7-18 Wetland summary HGM Unit 1 ................................................................ 96
Table 7-19 Wetland summary HGM Unit 2 ................................................................ 97
Table 7-20 Wetland summary HGM Unit 3 ................................................................ 98
Table 7-21 Wetland summary HGM Unit 4 ................................................................ 99
Table 7-22 Summary information for excavations (artificial systems) ....................... 100
Table 7-23 Wetland classification ............................................................................ 101
Table 7-24 Wetland extent ....................................................................................... 103
Table 7-25 Summary of the overall health of the wetland based on impact score and
change score 104
Table 7-26 Sediment Sampling Sites ....................................................................... 105
Table 7-27 Metal concentrations in the sediment samples from the study area during
December 2015 107
Table 7-28 Comparison between metal concentrations in the sediment and water
samples (excluding MD7 and 8) ........................................................................................ 108
Table 7-29 A Summary of the EIS for the Site ......................................................... 118
Table 8-1 Sensitivity rating of different habitats / floral communities in the study area.
127
Table 9-1 Extent of catchment loss for the various infrastructure alternatives ........ 140
Table 9-2 Impact ratings – Construction Phase ..................................................... 151
Table 9-3 Impact ratings – Operation / Decommissioning Phase ........................... 164

FGD Biodiversity & Wetland Assessment
Natural Scientific Services CC 6
Table 10-1 Predicted SEW 1 health scores for the four infrastructure alternatives with
and without mitigation showing anticipated change in wetland functionality. ..................... 173
Table 10-2 Predicted health scores for SEW 2 as a result of the FGD plant for
scenarios with and without mitigation showing anticipated change in wetland functionality.173
LIST OF FIGURES
Figure 1-1 Construction of MPS and the ADF facilities .............................................. 11
Figure 3-1 Locality map of the study area showing the position of the Sandloop FEPA
14
Figure 3-2 Locality map of the study area showing the position of the proposed FGD
Footprint area 16
Figure 5-1 Basic process Flow Diagram for the FGD process at Medupi Power Station
26
Figure 5-2 Current Land Use for the site and surrounds ........................................... 27
Figure 5-3 Monthly rainfall and temperature data measured at Lephalale ................. 27
Figure 5-4 Terrain units occurring within land type Ae252, Ah86 and Bd46 (AGIS,
2014) 29
Figure 5-5 Regional Vegetation and Land Types ...................................................... 34
Figure 5-6 Biomes and Wetland Vegetation in the Study Area .................................. 35
Figure 5-7 Quaternary Catchments and Ecoregion in the Study Area ....................... 36
Figure 6-1 Main vegetation sampling points .............................................................. 38
Figure 6-2 Live trapping sites .................................................................................... 42
Figure 6-3 Schematic layout of an array trap including drift fences, pitfall and funnel
traps 42
Figure 6-4 Examples of sampling techniques employed ........................................... 43
Figure 6-5 Layout of faunal sampling points showing the bat acoustic transect and
position of the motion cameras. .......................................................................................... 44
Figure 6-6 IUCN Red List categories ........................................................................ 45
Figure 7-1 Photographic representation of the different vegetation found within the
study area 57
Figure 7-2 Vegetation Units for the study area .......................................................... 65
Figure 7-3 Examples of the CI species located within the study area ........................ 68
Figure 7-4 Evidence of Alien species found within the study area ............................. 72
Figure 7-5 Localities of Conservation Important Fauna ............................................. 73
Figure 7-6 Examples of some of the mammal species detected in the study area .... 75
Figure 7-7 Examples of some of the bird species detected in the study area ............ 80
Figure 7-8 Comparison of the number of bird species with different feeding habits,
recorded in pentads 2340_2725 and 2340_2730 during the SABAP 2, and in Medupi by NSS
81
Figure 7-9 Examples of some of the reptile species detected in the study area ........ 84

FGD Biodiversity & Wetland Assessment
Natural Scientific Services CC 7
Figure 7-10 Examples of some of the frog species detected in the study area ............ 86
Figure 7-11 Examples of some of the invertebrate species detected in the study area 88
Figure 7-12 Wetland extent ......................................................................................... 91
Figure 7-13 Wetland sampling points .......................................................................... 92
Figure 7-14 USGS DEM derived catchment and channel model showing Golder (2017)
1:100 year floodline delineation ........................................................................................... 94
Figure 7-15 ESS (2015) soil classification map ........................................................... 95
Figure 7-16 Flow paths and water inundation ........................................................... 102
Figure 7-17 Artificial systems .................................................................................... 102
Figure 7-18 Wetland Indicators ................................................................................. 103
Figure 7-19 Sediment Sampling Sites ....................................................................... 106
Figure 7-20 Estimated - Ecosystem Services ............................................................ 116
Figure 8-1 Freshwater Ecosystem Priority Areas and Limpopo Cplan for the greater
study area 123
Figure 8-2 Limpopo Plains Ecoregions and Present Ecological State ..................... 124
Figure 8-3 Waterberg Critical Biodiversity and Ecological Support Areas................ 125
Figure 8-4 Mining and Biodiversity Guidelines for the greater study area ................ 126
Figure 8-5 Local Significance (Areas of Concern shown only within the study area) 129
Figure 9-1 Impacts in the Study Area ...................................................................... 132
Figure 9-2 Existing clearing of Acacia woodland for the ADF .................................. 136
Figure 9-3 Infrastructure Alternative 1 (1 km buffer on Sandloop FEPA) ................. 166
Figure 9-4 Infrastructure Alternative 2 (500 m buffer on Sandloop FEPA) ............... 167
Figure 9-5 Infrastructure Alternative 3 (1 km buffer on Sandloop FEPA excluding
previously disturbed areas) ............................................................................................... 168
Figure 9-6 Infrastructure Alternative 4 (entire Site 13) ............................................. 169
Figure 9-7 Infrastructure Alternative 5 (current proposed footprint area supplied by
Jones and Wagner) ........................................................................................................... 170
Figure 9-8 Areas of current disturbance .................................................................. 171
Figure 10-1 Areas of recent disturbance ................................................................... 175

FGD Biodiversity & Wetland Assessment
Natural Scientific Services CC 8
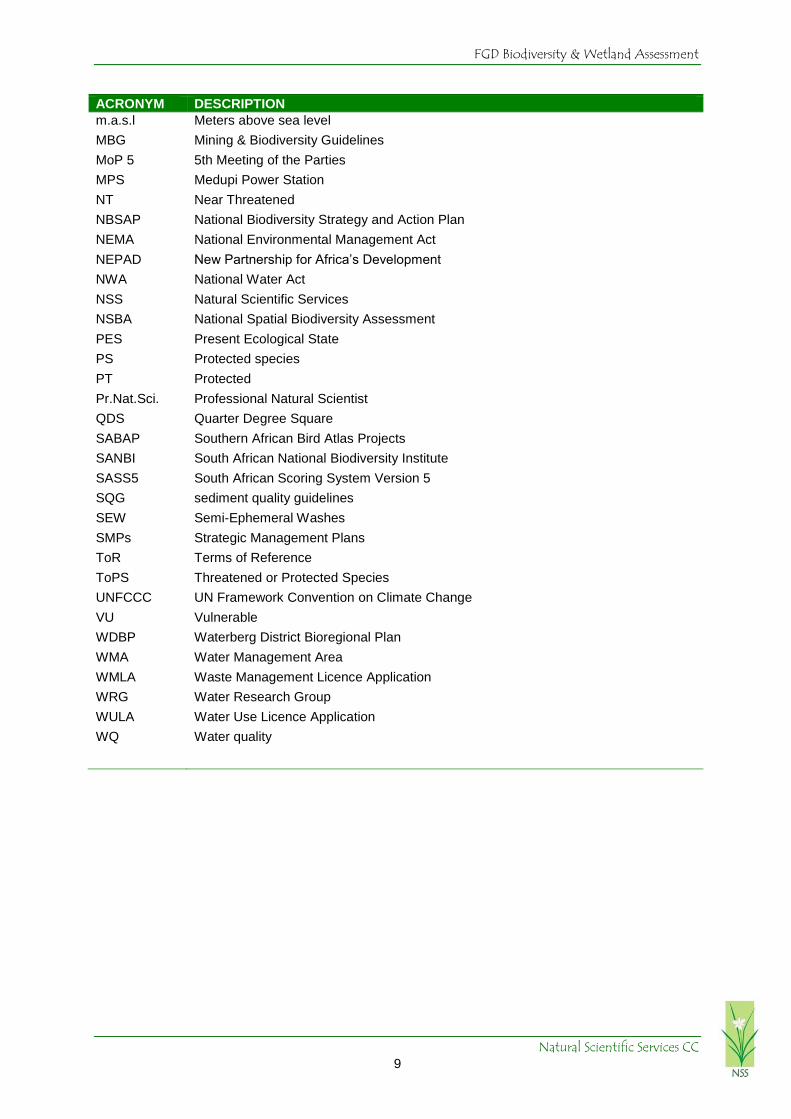
LIST OF ACRONYMS
ACRONYM DESCRIPTION
ADF Ash Disposal Facility
APPA
CARA
CBA
CBG4
CI
CR
Atmospheric Pollution Prevention Act
Conservation of Agricultural Resources Act
Critical Biodiversity Area
Central Bushveld Group 4
Conservation Important
Critically Endangered
CIS
CITES
Conservation important species
Convention on International Trade in Endangered Species
CoPs
DAFF
DCA
Conference of the Parties
Department of Agriculture, Forestry and Fisheries
TWINSPAN Detrended Correspondence Analysis
DEAT
DWAF
Department of Environmental Affairs and Tourism
Department of Water Affairs and Forestry
DWS
ECA
EA
EI
ES
ESA
Department of Water and Sanitation
Environmental Conservation Act
Environmental Authorisation
Ecological Importance
Ecological Sensitivity
Ecological Support Area
EIAs Environmental Impact Assessments
EIS Ecological Importance and Sensitivity
EMPRs Environmental Management Programme Reports
EMPs
EN
Environmental Management Plans
Endangered
EO
EWT
Environmental Officer
Endangered Wildlife Trust
FEPA
FGD
Freshwater Ecosystem Priority Area
Flue Gas Desulphurisation
FRAI Fish Response Assessment Index
GG
GPS
Government Gazette
Global Positioning System
HGM
ICP-OES
ICP-MS
Hydro-geomorphic
Inductively Coupled Plasma – Optical Emission Spectrophotometer
Inductively Coupled Plasma – Mass Spectrophotometer
JPOI
LC
Johannesburg Plan of Implementation
Least Concern
LEDET
LCPlan
Limpopo Department of Economic Development, Environment and Tourism
Limpopo Conservation Plan
LSB
LO
Limpopo Sweet Bushveld
Likelihood of Occurrence
LT Least Threatened
FGD Biodiversity & Wetland Assessment
Natural Scientific Services CC 9
ACRONYM DESCRIPTION
m.a.s.l
MBG
Meters above sea level
Mining & Biodiversity Guidelines
MoP 5 5th Meeting of the Parties
MPS
NT
Medupi Power Station
Near Threatened
NBSAP
NEMA
NEPAD
National Biodiversity Strategy and Action Plan
National Environmental Management Act
New Partnership for Africa’s Development
NWA
NSS
NSBA
National Water Act
Natural Scientific Services
National Spatial Biodiversity Assessment
PES
PS
PT
Present Ecological State
Protected species
Protected
Pr.Nat.Sci. Professional Natural Scientist
QDS
SABAP
SANBI
Quarter Degree Square
Southern African Bird Atlas Projects
South African National Biodiversity Institute
SASS5
SQG
South African Scoring System Version 5
sediment quality guidelines
SEW Semi-Ephemeral Washes
SMPs
ToR
ToPS
Strategic Management Plans
Terms of Reference
Threatened or Protected Species
UNFCCC
VU
UN Framework Convention on Climate Change
Vulnerable
WDBP Waterberg District Bioregional Plan
WMA
WMLA
WRG
Water Management Area
Waste Management Licence Application
Water Research Group
WULA
WQ
Water Use Licence Application
Water quality

FGD Biodiversity & Wetland Assessment
Natural Scientific Services CC 10
Biodiversity is defined as "…the variability
among living organisms from all sources
including…terrestrial, marine and other
aquatic ecosystems and the ecological
complexes of which they are a part; this
includes diversity within species,
between species and of ecosystems"
(The Convention of Biological Diversity,
1992). In other words, plants, animals and
micro-organisms, their genes, and the
ecosystems that living organisms inhabit,
are all facets of biodiversity.
1. Introduction
In South Africa, the legislation affirms the national commitment to conservation. The National
Environmental Management: Biodiversity Act, 2004 (Act 10 of 2004) has the objective to
provide for, amongst others the management and conservation of South Africa’s biodiversity
within the framework of the National Environmental
Management Act, 1998; the protection of species
and ecosystems that warrant national protection;
and the sustainable use of indigenous biological
resources.
Further to this, South Africa has various pieces of
legislation governing activities in and around
wetlands under International, Regional and
National legislation and Guidelines. The National
Water Act, 1998, (Act 36 of 1998) (NWA) is the
principle legal instrument relating to water resource management in South Africa, with all
wetlands protected under the NWA. The National Water Act (Act No. 36 of 1998), (NWA)
defines a wetland as: ”land which is transitional between terrestrial and aquatic systems
where the water table is usually at or near the surface, or the land is periodically covered with
shallow water, and which in normal circumstances supports or would support vegetation
typically adapted to life in saturated soils .”
This report represents an amalgamation of work done by NSS on terrestrial biodiversity and
wetlands since 2014 at Medupi Power Station (MPS) as it relates to the Flue Gas
Desulphurisation (FGD) Retrofit Project. Medupi is located about 15km west of the town of
Lephalale in the Limpopo Province. The project essentially involves the reduction of sulphur
dioxide (SO2) emissions from power station and the consequent disposal of its by-product,
gypsum, on the proposed ash disposal facility. Medupi will be the first coal-fired power
station in the Eskom fleet to deploy this supercritical abatement technology which will reduce
SO2 emissions by over 90%.
Zitholele Consulting (Pty) Ltd (Zitholele) was appointed in 2014 to undertake the
environmental processes including an Environmental Impact Assessment (EIA), Water Use
Licence Application (WULA) and Waste Management Licence Application (WMLA) for the
MPS Flue Gas Desulphurisation (FGD) Retrofit project. In 2017, the MPS FGD project scope
was extended to include the environmental authorisation process for the other FGD
associated infrastructures including the railway yard and siding, limestone and gypsum
handling facilities, diesel storage facilities, new access roads, a Waste Water Treatment
plant, and facilities for temporary storage of salts and sludge (hazardouswaste). Additionally
the project is dealing with the Water Use Licence Application (WULA) for the wetlands which

FGD Biodiversity & Wetland Assessment
Natural Scientific Services CC 11
were detected by NSS during 2015 within the study area and a 500m buffer around it.
Therefore NSS was requested by Zitholele to provide biodiversity and wetland input into this
greater EIA process.
It must be noted that the construction of the MPS is almost complete and the ADF
construction already commenced prior to 2012 (Figure 1-1). The majority of the site is now
cleared and any depressions, washes and other wetlands that were within the footprint have
now been removed. NSS therefore focused on areas within the railway yard, MPS and ADF
that were not transformed as well as within the 500m buffer of the site.
Ongoing construction of the ADF
Ongoing construction of the MPS
Figure 1-1 Construction of MPS and the ADF facilities
2. Terms of Reference
Based on requests made by ESKOM at the FGD scope consolidation workshop held in
December 2017, this report represents an amalgamation of NSS work conducted to date for
Medupi Power Station (MPS) as it pertains to the FGD project area as a whole. The various
projects for which NSS was previously appointed are summarized in Table 2-1.

FGD Biodiversity & Wetland Assessment
Natural Scientific Services CC 12
Table 2-1 Work performed by NSS for the Medupi FGD project
WORK REQUESTED STATUS
Eco assessment FGD railway yard -September 2014: Submitted – March 2015
Eco & Wetland assessment (2,12 &13) - October 2014 Stopped, fieldwork completed – December
2015
Eco opinion sites 2,12 & 13 Submitted – January 2016
Screening additional ADF sites – April 2016 Cancelled
Wetland assessment Site 13 - October 2016 Submitted – December 2016 - revised
2017
Wetland offset and rehabilitation plan - May 2017 Ongoing
Wetland & eco assessment for FGD area – November 2017 Ongoing
More specifically the SoW for this report is as follows:
Combine relevant sections of reports into one integrated biodiversity and wetland
report for the FGD study area which includes the Medupi Power Station, the FGD /
railway yard area and the area earmarked for the ADF (referred to as Site 13) and a
500m buffer around these areas.
Over and above integration, address any new impacts which may be associated with
the construction and operation of the FGD system within the Medupi Power Station
Footprint as well as that of the railway yard, limestone and gypsum handling facilities
between the Medupi Power Station and existing ADF.
The Report includes:
o An Introduction and Terms of Reference;
o List of applicable legislation, guidelines, standards and criteria;
o A broad description of the biophysical environment wherein Medupi is
situated;
o The terrestrial assessment methods and results including:
A description of regional vegetation and local floral (including their
structure, dominant plant composition and condition);
Recorded alien invasive species;
The local diversity of mammals, birds, reptiles, frogs, butterflies,
odonata (dragonflies and damselflies), scorpions and megalomorph
spiders;
Recorded Conservation Important (CI) species of flora and fauna.
o The wetland assessment methods and results including:
The delineation of wetlands (including pans) within 500m of the MPS
and ADF footprint based on limited field work.
The sediment and water quality analysis of surface water bodies –
especially the FEPA to the south-west of the ADF area;
An assessment of pan invertebrate diversity through laboratory
hatching tests.
Wetland ecosystem goods and services;
The determination of wetland buffers.
FGD Biodiversity & Wetland Assessment
Natural Scientific Services CC 13
o A qualitative assessment (and mapping) of the relative sensitivity or
conservation importance of local floral, faunal and wetland biodiversity.
o A detailed Impact Assessment with recommended impact mitigation
measures.
o Concluding remarks.
o References.
o Appendices.
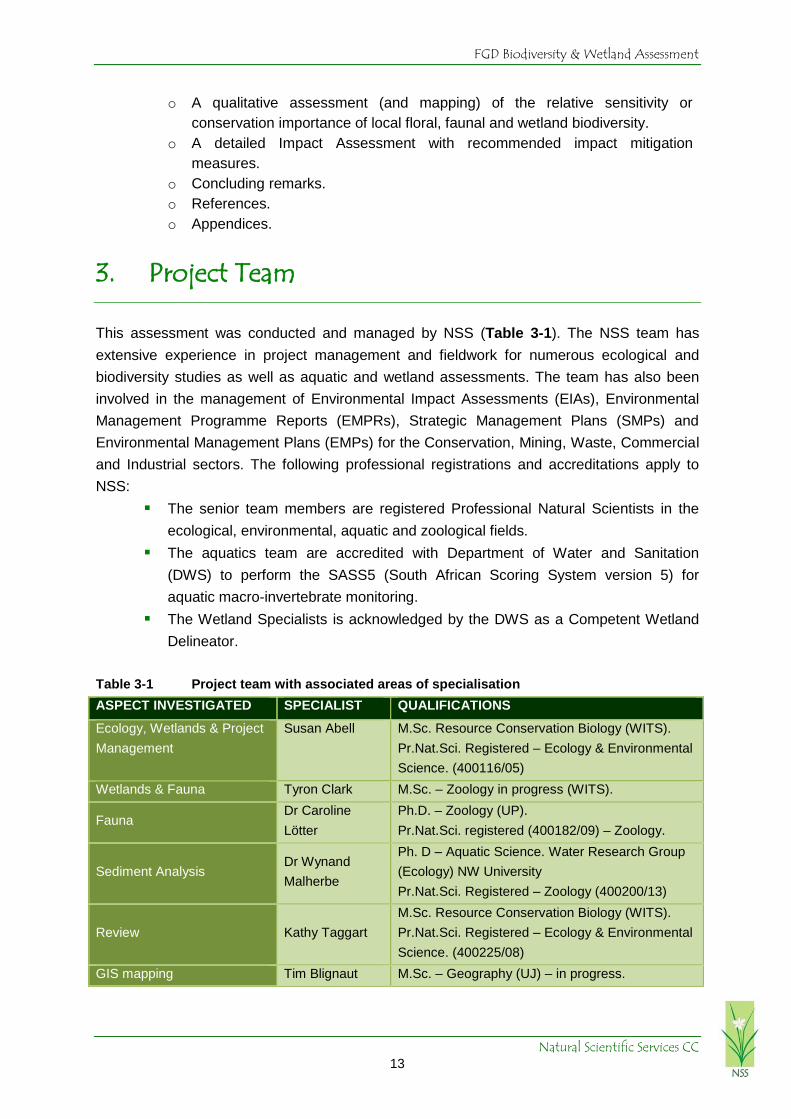
3. Project Team
This assessment was conducted and managed by NSS (Table 3-1). The NSS team has
extensive experience in project management and fieldwork for numerous ecological and
biodiversity studies as well as aquatic and wetland assessments. The team has also been
involved in the management of Environmental Impact Assessments (EIAs), Environmental
Management Programme Reports (EMPRs), Strategic Management Plans (SMPs) and
Environmental Management Plans (EMPs) for the Conservation, Mining, Waste, Commercial
and Industrial sectors. The following professional registrations and accreditations apply to
NSS:
The senior team members are registered Professional Natural Scientists in the
ecological, environmental, aquatic and zoological fields.
The aquatics team are accredited with Department of Water and Sanitation
(DWS) to perform the SASS5 (South African Scoring System version 5) for
aquatic macro-invertebrate monitoring.
The Wetland Specialists is acknowledged by the DWS as a Competent Wetland
Delineator.
Table 3-1 Project team with associated areas of specialisation
ASPECT INVESTIGATED SPECIALIST QUALIFICATIONS
Ecology, Wetlands & Project
Management
Susan Abell M.Sc. Resource Conservation Biology (WITS).
Pr.Nat.Sci. Registered – Ecology & Environmental
Science. (400116/05)
Wetlands & Fauna Tyron Clark M.Sc. – Zoology in progress (WITS).
Fauna Dr Caroline
Lötter
Ph.D. – Zoology (UP).
Pr.Nat.Sci. registered (400182/09) – Zoology.
Sediment Analysis Dr Wynand
Malherbe
Ph. D – Aquatic Science. Water Research Group
(Ecology) NW University
Pr.Nat.Sci. Registered – Zoology (400200/13)
Review Kathy Taggart
M.Sc. Resource Conservation Biology (WITS).
Pr.Nat.Sci. Registered – Ecology & Environmental
Science. (400225/08)
GIS mapping Tim Blignaut M.Sc. – Geography (UJ) – in progress.

FGD Biodiversity & Wetland Assessment
Natural Scientific Services CC 14
Figure 3-1 Locality map of the study area showing the position of the Sandloop FEPA
FGD Biodiversity & Wetland Assessment
Natural Scientific Services CC 15

FGD Biodiversity & Wetland Assessment
Natural Scientific Services CC 16
Figure 3-2 Locality map of the study area showing the position of the proposed FGD Footprint area

FGD Biodiversity & Wetland Assessment
Natural Scientific Services CC 17
4. Applicable Legislation
There are several international treaties and considerable national and provincial legislation
regarding the sustainable use and conservation of terrestrial and wetland biodiversity
including species and ecosystems. As coal fired power stations such as MPS inevitably have
the potential to have major negative impacts on biodiversity, all the below-mentioned
international, regional, national and provincial legislation, policies and guidelines are
applicable to the proposed project. While the list below is extensive, additional legislation,
policies and guidelines that have not been mentioned may apply.
4.1. International Agreements
World Summit on Sustainable Development, 2002;
Johannesburg Plan of Implementation (JPoI), Chapter 4, 2002. The JPoI
acknowledges that biodiversity is critical for the planet, sustainable development,
poverty eradication, human well-being and the cultural integrity people. It also
recognizes that biodiversity is currently being lost at unprecedented rates due to
human activities, and that this trend can only be reversed if local people benefit
directly from the conservation and sustainable use of biological diversity in their
countries. South Africa uses the National Biodiversity Strategy and Action Plan
(NBSAP) as a means to achieve the JPoI biodiversity targets;
UN Framework Convention on Climate Change (UNFCCC), 1994. UNFCCC is an
international agreement to stabilize greenhouse gas concentrations in the
atmosphere at a level that would prevent dangerous anthropogenic interference
with the climate system. This agreement, although non-binding, does provide for
updates called "protocols,” which set mandatory emission limits.
o Kyoto Protocol, 1997. The principal update is the Kyoto Protocol developed
during the 3rd Conference of the Parties (CoP 3) in Kyoto, Japan in 1997, and
was entered into force in 2005. Approximately 191 states have signed and
ratified the Protocol including South Africa. Under the Protocol, 37 countries
("Annex I countries") committed themselves to reduce their greenhouse gas
emissions by 5.2% on average for the period 2008-2012. This reduction was
relative to their annual emissions in a base year, generally 1990.
o Copenhagen Accord, 2009. This included the 15th Conference of the Parties
(CoP 15) to the UNFCCC and the 5th Meeting of the Parties (MoP 5) to the
Kyoto Protocol. A framework for climate change mitigation beyond 2012, the
Copenhagen Accord, was drafted during the Summit by the United States,
China, India, Brazil and South Africa. It was "taken note of," but not "adopted".
The Accord recognizes that climate change is one of the greatest challenges of
the present day and that actions should be taken to keep any temperature
increases to below 2°C.

FGD Biodiversity & Wetland Assessment
Natural Scientific Services CC 18
o 17th Conference of the Parties (CoP 17). The 2011 UNFCCC in Durban was
held to establish a new treaty to limit carbon emissions. This Convention
agreed to a legally binding deal comprising all countries, which will be prepared
by 2015 and to take effect in 2020. While the president of the conference, Maite
Nkoana-Mashabane, declared it a success, scientists and environmental
groups warned that the deal was not sufficient to avoid global warming beyond
2°C as more urgent action is needed.
o Paris Agreement to reduce climate change, and the Paris Pledge for Action.
This latest agreement on climate change calls for zero net anthropogenic
greenhouse gas emissions to be reached during the second half of the 21st
century. The agreement is due to enter into force in 2020, and Parties that have
signed the Agreement, including South Africa, will need to adopt the Agreement
within their own legal systems. By joining the Pledge, businesses, cities, civil
society groups, investors, regions, trade unions and other signatories promise
to ensure that the Agreement’s ambition to limit the global temperature rise to
less than 2ºC is met. A number of mining companies, including those operating
in South Africa have joined this Pledge.
Convention on Biological Diversity (Rio de Janeiro, 1992). The CBD has three main
goals: conservation, and sustainable use of biodiversity, and equitable sharing of
benefits arising from genetic resources. South Africa signed this treaty in 1998
showing further commitment to the conservation of biodiversity;
Agenda 21 and Rio Declaration, 1992;
The Bonn Convention (on conservation of migratory species of wild animals), 1979.
South Africa is a party to this Convention, which affords protection to all migratory
animals in the project area including various bird, bat and butterfly species;
CITES (the Convention on International Trade in Endangered Species of Wild Fauna
and Flora), 1973. CITES is an international agreement between governments, which
aims to ensure that international trade in specimens of wild animals and plants does
not threaten their survival. It accords varying degrees of protection to more than
33,000 species of animals and plants;
The World Heritage Convention, 1972. This aims to preserve the world's natural and
scenic areas and historic sites for present and future generations of humanity; The
Convention recognizes the way in which people interact with nature, and the
fundamental need to preserve the balance between the two. Eight World Heritage
Sites are currently recognized in South Africa, with the Mapungubwe Cultural
Landscape being the closest to the study area.
The Ramsar Convention (on wetlands of international importance especially as
waterfowl habitat). This is an intergovernmental treaty that embodies the
commitments of its member countries to maintain the ecological character of their
Wetlands of International Importance but also to plan for the "wise use", or
sustainable use, of all of the wetlands in their territories. In terms of the site, an

FGD Biodiversity & Wetland Assessment
Natural Scientific Services CC 19
ephemeral system is existing the study area to the south west and there are a
number of water bodies present just south of the site; and
United Nations Convention to Combat Desertification.
4.2. Regional Agreements
Action Plan of the Environmental Initiative of NEPAD. This New Partnership for
Africa’s Development (NEPAD) Action Plan was established during the 2003 African
Convention on Conservation of Nature and Natural Resources held in Maputo. As a
contracting state, South Africa has undertaken to adopt measures to ensure the
conservation, utilization and development of soil, water, flora and faunal resources in
accordance with scientific principles and with due regard to the best interests of the
people.
African Convention on the Conservation of Nature and Natural Resources, 1969.
4.3. National Legislation, Policies and Guidelines
Constitution of the Republic of South Africa (Act 108 of 1996). According to South
Africa’s Constitution, South African citizens have the right to have the environment
protected for the benefit of present and future generations.
Conservation of Agricultural Resources Act (CARA; Act 43 of 1983). CARA includes
the use and protection of land, soil, wetlands and vegetation and the control of weeds
and invader plants. In 1984 regulations were passed under CARA, which declared
about 50 plant species as “weeds” or “invader plants.” On 30 March 2001 the Minister
of Agriculture promulgated an amendment to these regulations, which now contain a
comprehensive list of declared weed and invader plant species. Further additions to
the law have occurred and are discussed under NEMBA below.
Water Services Act (WSA; Act 108 of 1997). This Act provides for, among other
things, the effective water resource management and conservation.
White Paper on Environmental Management Policy for South Africa (1998). Through
this Policy, Government undertakes to give effect to the many rights in the
Constitution that relate to the environment.
National Veld and Forest Fire Act (NVFFA; Act 101 of 1998). The purpose of this Act
is to prevent and combat veld fires in the country. The NVFFA was amended by the
National Forest and Fire Laws Amendment Act (NFFLAA; Act 12 of 2001).
National Water Act (NWA; Act 36 of 1998). The NWA recognises that water is a
scarce and unevenly distributed natural resource that should be equitably utilised in a
sustainable manner. The Act ensures that water resources are protected, used,
developed, conserved and controlled in ways that take into account a range of needs
and obligations, including the need to “Protect aquatic and associated ecosystems
and their biological diversity.” The NWA specifies that water use must be authorised.
It indicates the means for authorisation and includes minimum requirements for
evaluation and decision-making by relevant authorities. To protect aquatic
FGD Biodiversity & Wetland Assessment
Natural Scientific Services CC 20
ecosystems and biodiversity, the NWA has a number of requirements, which are
controlled by the DWS, including:
o Section 19(2) which states that: responsible persons of pollution of any water
resources must take all measures to prevent and remedy effects of pollution.
o Section 21 which states that a license for water use is required if activities such
as taking water from a water resource; storing water; impeding or diverting the
flow of water in a watercourse or engaging in a stream flow reduction activity
amongst others. As per the NWA, a General Authorisation from Section 21 (c)
and (i) water use is not an entitlement for the use of water in terms of section
21 (c) and (i) within a 500 metre radius from the boundary of any wetland and is
based on the outcome of a Risk Assessment.
o Section 37(2) states that activities (described in Section 37(1)) require
authorization before being undertaken and include: irrigation on any land with
waste or water containing waste generated through any industrial activity of by
a waterworks; intentional recharging of an aquifer with any waste or water
containing waste; and an activity which has been declared by the minister as a
“controlled activity.”
National Forests Act (NFA; Act 84 of 1998) and Protected Tree Species. An objective
of the NFA is to provide special measures for the protection of certain forests and tree
species, and to promote the sustainable use of forests for environmental, economic,
educational, recreational, cultural, health and spiritual purposes. In terms of Section
15(1) of the NFA forest trees or Protected Tree Species may not be cut, disturbed,
damaged, destroyed and their products may not be possessed, collected, removed,
transported, exported, donated, purchased or sold – except under license granted by
the Department of Agriculture, Forestry and Fisheries (DAFF) or a delegated
authority. Government Notice 35648 of 2012 provides the latest List of Protected Tree
Species within the borders of South Africa under the NFA.
National Environmental Management Act (NEMA; Act 107 of 1998). NEMA is an
umbrella Act covering broad principles of environmental management. NEMA can be
regarded as the most important piece of general environmental legislation covering
three main areas namely: Land, planning and development; Natural and cultural
resources use and conservation; Pollution control and waste management. According
to NEMA sustainable development requires the consideration of all relevant factors
including:
o That the disturbance of ecosystems and loss of biological diversity are avoided,
or, where they cannot be altogether avoided, are minimised and remedied;
o That the use and exploitation of non-renewable natural resources is
responsible and equitable, and takes into account the consequences of the
depletion of the resource; and
o That the development, use and exploitation of renewable resources and the
ecosystems of which they are part do not exceed the level beyond which their
integrity is jeopardised.

FGD Biodiversity & Wetland Assessment
Natural Scientific Services CC 21
According to Section 2(r) in NEMA, sensitive, vulnerable, highly dynamic or stressed
ecosystems require specific attention in management and planning procedures,
especially where they are subject to significant human resource usage and
development pressure. Grasslands and wetlands in Mpumalanga are a strong case in
point.
National Heritage Resources Act (NHRA; Act 25 of 1999). According to the NHRA
heritage sites, sensitive, vulnerable, highly dynamic or stressed ecosystems, such as
coastal shores, dolomitic land and ridges, estuaries, wetlands, and similar systems
require specific attention in management and planning procedures, especially where
they are subject to significant human resource usage and development pressure.
National Mineral and Petroleum Resources Development Act (NMPRD; Act 28 of
2002). The NMPRDA is concerned with equitable access to and sustainable
development of the nation’s mineral and petroleum resources.
National Environmental Management Protected Areas Act (NEMPAA: Act. 57 of
2003). The NEM:PAA is focussed on the protection and conservation of ecologically
viable areas representative of South Africa’s biological diversity and its natural
landscapes and seascapes, and addresses, inter alia:
o The protection and conservation of ecologically viable areas representative of
South Africa’s biological diversity and its natural landscapes and seascapes;
o The establishment of a national register of all national, provincial and local
protected areas;
o The management of those areas in accordance with national standards;
o Inter-governmental co-operation and public consultation in matters concerning
protected areas.
National Environmental Management: Biodiversity Act (NEMBA; Act 10 of 2004). A
main objective of NEMBA is to provide for the management and conservation of
South Africa’s biodiversity within the framework of NEMA and to ensure the
sustainable use of indigenous biological resources. In addition to regulations on
Threatened, Protected, Alien and Invasive Species in South Africa, the NBSAP was
formulated where under the NSBA was used to identify Terrestrial and Aquatic
Priority Areas and Threatened Ecosystems for biodiversity conservation.
o Threatened, Protected, Alien and Invasive Species Regulations. Chapter 4,
Part 2 of NEMBA provides for listing of species that are threatened or in need
of protection to ensure their survival in the wild while regulating the activities,
including trade, which may involve such listed threatened or protected species
and activities which may have a potential impact on their long-term survival.
According to Section 56(1) of NEMBA, in February 2007 the Minister of
Environmental Affairs and Tourism published a list of Critically Endangered
(CR), Endangered (EN), Vulnerable (VU) and Protected Species (PS).
o Alien and Invasive Species Regulations, 2014 (GG 37885, 1 August 2014).
These regulations listed all declared weeds and invasive plant species in South
Africa.

FGD Biodiversity & Wetland Assessment
Natural Scientific Services CC 22
National Biodiversity Strategy and Action Plan (NBSAP). The development of the
NBSAP is part of South Africa’s obligations as a signatory to the CBD, and was
compiled by the Department of Environmental Affairs and Tourism (DEAT 2005).
Through the NBSAP it is recognized that biodiversity cannot be conserved through
protected area networks only. All stakeholders, from private landowners and
communities to business and industry must get involved in biodiversity
management. The NBSAP highlights, in particular, that South Africa’s rivers are
poorly protected and that the present status of many of these freshwater
ecosystems is disturbing. To ensure further protection and sustainability of South
Africa’s wetlands, the DWS (DWAF at the time) initiated the National Aquatic
Ecosystem Health Monitoring Programme (NAEHMP) and River Health Programme
(RHP).
National Spatial Biodiversity Assessment (NSBA). The NSBA, which is part of the
NBSAP, was led by the SANBI (Driver et al. 2004). Its main focus was on
mainstreaming biodiversity priorities and making links between biodiversity and
socio–economic development in South Africa. The NSBA represents South Africa’s
first national assessment of spatial priorities for conservation action, integrating
terrestrial, river, estuarine and marine ecosystems, using available spatial data,
biodiversity planning software and a series of expert and stakeholder workshops.
National Aquatic Ecosystem Health Monitoring Program (NAEHMP) & River Health
Program (RHP). The NAEHMP is a national programme managed by DWS’s
Resource Quality Services with support from the Water Research Commission
(WRC), the Council for Scientific and Industrial Research (CSIR) and various
regional and provincial authorities. The overall purpose of the NAEHMP is to
provide ecological information for South African rivers and the broader aquatic
ecosystems required to support the rational management of these systems. The
best-known component of the NAEHMP is the RHP.
National Freshwater Ecosystem Priority Areas (NFEPA). The NFEPA project is a
multi-partner project between CSIR, South African National Biodiversity Institute
(SANBI), Water Research Commission (WRC), Department of Water Affairs
(DWA), Department of Environmental Affairs (DEA), Worldwide Fund for Nature
(WWF), South African Institute of Aquatic Biodiversity (SAIAB) and South African
National Parks (SANParks). The NFEPA project aims to:
o Identify Freshwater Ecosystem Priority Areas (hereafter referred to as ‘FEPAs’)
to meet national biodiversity goals for freshwater ecosystems (through
systematic biodiversity planning); and
o Develop a basis for enabling effective implementation of measures to protect
FEPAs, including free-flowing rivers.
FEPAs should be regarded as ecologically important and as generally sensitive to
changes in water quality and quantity, owing to their role in protecting freshwater
ecosystems and supporting sustainable use of water resources (Driver et al.
2011).

FGD Biodiversity & Wetland Assessment
Natural Scientific Services CC 23
National Environmental Management: Air Quality Act (NEMAQA; Act 39 of 2004).
The Atmospheric Pollution Prevention Act (APPA; Act 45 of 1965), which largely
governed point-source emission control and therefore did not take into
consideration the cumulative impacts of air pollution, has been repealed by the
NEMAQA. Amongst other objectives, this Act provides for the “prevention of air
pollution and ecological degradation.”
National Environmental Management: Waste Act (Act 59 of 2008). This act serves
inter alia to protect health and the environment by providing reasonable measures
for the prevention of pollution and ecological degradation and for securing
ecologically sustainable development.
Mining & Biodiversity Guideline (MBG). The mining industry plays a vital role in
South Africa’s growth and development and indirectly is connected to MPS. The
MBG (DEA et al. 2013) interprets the best available biodiversity knowledge and
science in terms of the implications and risks for mining in a practical and user-
friendly guideline for integrating relevant biodiversity information into decision
making. The development of this guideline was initiated by the Chamber of Mines
and the South African Mining and Biodiversity Forum (SAMBF), in partnership with
the DEA, the Department of Mineral Resources (DMR), and with technical input and
co-ordination by the SANBI Grasslands Programme.
National Water Resource Strategy (NWRS) 2. The NWRS2 (DWA 2013) builds on
the first NWRS published in 2004. The purpose of the NWRS2 is to ensure that
national water resources are protected, used, developed, conserved, managed and
controlled in an efficient and sustainable manner towards achieving South Africa's
development priorities in an equitable manner over the next five to 10 years.
Draft National Biodiversity Offset Policy. The recently published draft National
Biodiversity Offset Policy (GG 40733, GN 276, 31 March 2017) aims to ensure that
significant residual impacts of developments are remedied as required by NEMA,
and in line with the Constitutional right to an environment that is not harmful.
4.4. Limpopo Legislation, Policies and Guidelines
In addition to national legislation, some of South Africa's nine provinces have their own
provincial biodiversity legislation, as nature conservation is a concurrent function of national
and provincial government in terms of the Constitution (Act 108 of 1996).
Limpopo Environmental Management Act, 2003 (Act No. 7 of 2003). This Act
repealed the former Lebowa, Gazankulu, Venda and Northern Province Acts and
the Nature Conservation Ordinance (Ordinance 12 of 1983). It provides the lists for
Protected and Specially Protected species under Schedule 2, 3 and 12 as well as
the stipulation for permit applications to remove these species. In addition it gives
protection measures for the terrestrial and aquatic biota and systems. Schedule 9
lists aquatic plant species that are prohibited in the province.
Limpopo Conservation Plan version 2, 2013. This conservation plan is consistent
with NEMA principles and the NEMBA. It is designed to support integrated
FGD Biodiversity & Wetland Assessment
Natural Scientific Services CC 24
development planning and sustainable development by identifying an efficient set
of CBAs that are required to meet national and provincial biodiversity objectives, in
a configuration that is least conflicting with other land uses and activities. Where
alternatives are available, the CBAs are designed to avoid conflict with existing
IDPs, EMFs and SDFs in the region by favouring the selection of sites that are least
conflicting with other land-uses.
Municipal Biodiversity Summaries Project, 2010. This was the most relevant
biodiversity conservation plan for Lephalale Municipality, prior to the C-Plan 2
publication.
Limpopo State of Environment Report (SoER), 2004. This report provides a high-
level overview of the State of the Environment in Limpopo.
Waterberg Environmental Management Plan (EMP), 2006. The Waterberg EMP
provides for the protection of the environment and describes how activities that
have, or could have, an adverse impact on the environment, should be mitigated,
controlled, and monitored. The Waterberg EMP is a coarse-scale planning tool that
outlines strategic objectives. New development in the Waterberg District
Municipality should be aligned with these objectives.
Waterberg Biosphere Reserve. The Waterberg Biosphere Reserve, proclaimed in
2001 and recognized by UNESCO, covers a 654, 033ha area in the Waterberg
wherein more than 80, 000 people live (DEA 2016). It is managed by the Waterberg
Biosphere Reserve Committee and the Limpopo Department of Economic
Development, Environment and Tourism (LEDET), which coordinates the provincial
Man and the Biosphere Reserves programme. Like most other biosphere reserves,
the Waterberg Biosphere Reserve comprises:
o A (104, 179ha) Core Area for conserving biological diversity, monitoring
minimally disturbed ecosystems, and undertaking non-destructive research and
other low-impact uses.
o A (185, 517ha) Buffer Area for cooperative activities compatible with sound
ecological practices, including environmental education, recreation, ecotourism
and applied basic research.
o A (364, 336ha) Transitional Area, which contains a variety of agricultural
activities, settlements and other uses in which local communities, management
agencies, scientists, non-governmental organizations, cultural groups,
economic interest and other stakeholders work together to manage and
sustainably develop the area’s resources.
Waterberg Spatial Development Framework, 2009. The Waterberg Spatial
Development Framework delineated areas of ecological sensitivity within the
district, based on the occurrence of threatened species; centres of endemism;
existing protected areas; occurrence of rivers and streams; vegetation types of
conservation importance; and areas with high aesthetic value (Environomics,
2010).

FGD Biodiversity & Wetland Assessment
Natural Scientific Services CC 25
Lephalale Spatial Development Framework, 2008. The Lephalale Municipality
compiled a Spatial Development Framework (SDF) with the purpose of guiding the
form and location of future physical development within a Municipal area in order to
address the imbalances of the past. This SDF identifies environmentally sensitive
areas (e.g. mountain ridges, riverine environments) and makes recommendations
regarding proposed developments in these areas.
Lephalale Integrated Development Plan (2014-2016). The role of an IDP is to
facilitate local governments’ planning and municipal management. Lephalale
Municipality has an environmental function to execute and ensure that the
fundamental environmental rights of the community as enshrined in the constitution
are realized. The Municipality has sensitive and conservation worthy areas within
its jurisdiction, such as the wetlands, river systems, cultural sites, rare and
endangered species and part of the Waterberg biosphere. There are also many
areas that require remedial attention i.e. the eradication of alien vegetation, soil
erosion control and aspects that require special management, such as pollution
control and land use management. The Municipality has the capacity to perform
duties that enhance sound environmental management practices which include EIA
related. Within the 2014/2015 Revenue and Expenditure Framework, no
revenue/expenditure has been listed for Environmental and Biodiversity Sectors.
However, a forecast of funds for environmental campaigns including educating the
communities has been set up going forward (2016-2019).
Waterberg Bio-regional Plan - The Waterberg bioregional plan considers the
Limpopo Conservation Plan version 2, 2013 and Waterberg EMF together to
develop an Integrated Development Framework.
Waterberg EMF, 2010 - The purpose of the Waterberg EMF is to develop a
framework that will integrate policies and frameworks, and align different
government mandates in a way that will streamline decision-making to improve
cooperative governance and guide future development in an environmentally
responsible manner.
5. Study Site Description
5.1. Locality and Land Use
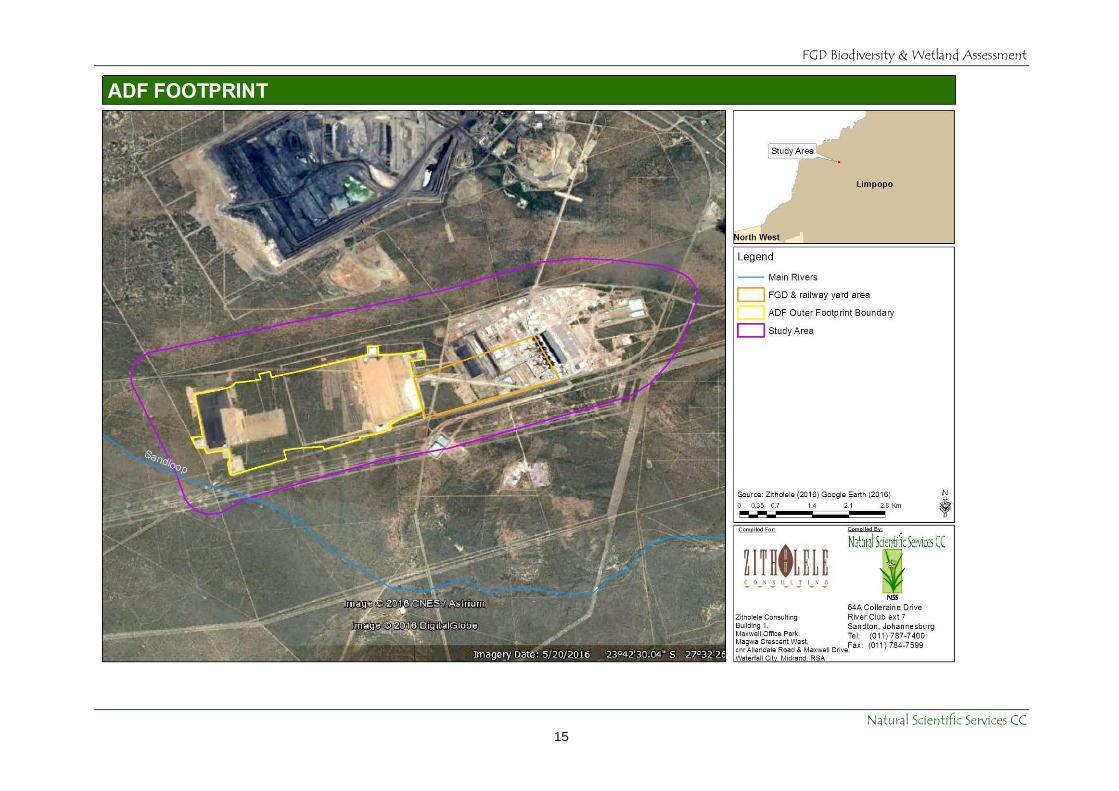
The FGD study area includes the site for the ADF, the MPS precinct and a 500m buffer on
this area (Figure 3-1). This area is 2745 ha in extent (1629 ha excluding buffer). The site is
approximately 1.5km from Grootegeluk Mine, 12km from Lephalale and 4.5km from
Marapong (‘as the crow flies’). The site falls within the 1:50 000 topographical map Quarter
Degree Square (QDS) 2327DA.

FGD Biodiversity & Wetland Assessment
Natural Scientific Services CC 26
Within this greater study area NSS was commissioned to focus on two specific areas:
The site for the ADF.
The site for the FGD and associated infrastructure including the railway siding,
limestone offtake and storage facilities.
Details on the operation design and conceptual layout of the ADF and FGD infrastructure will
be detailed in the EIA and WULA application conducted by Zitholele and in the interim the
reader is referred to the technical documents and design philosophies produced by Jones
and Wagener and Knight & Piesold Consulting. The basic FGD process is outlined in Figure
5-1.
Figure 5-1 Basic process Flow Diagram for the FGD process at Medupi Power Station
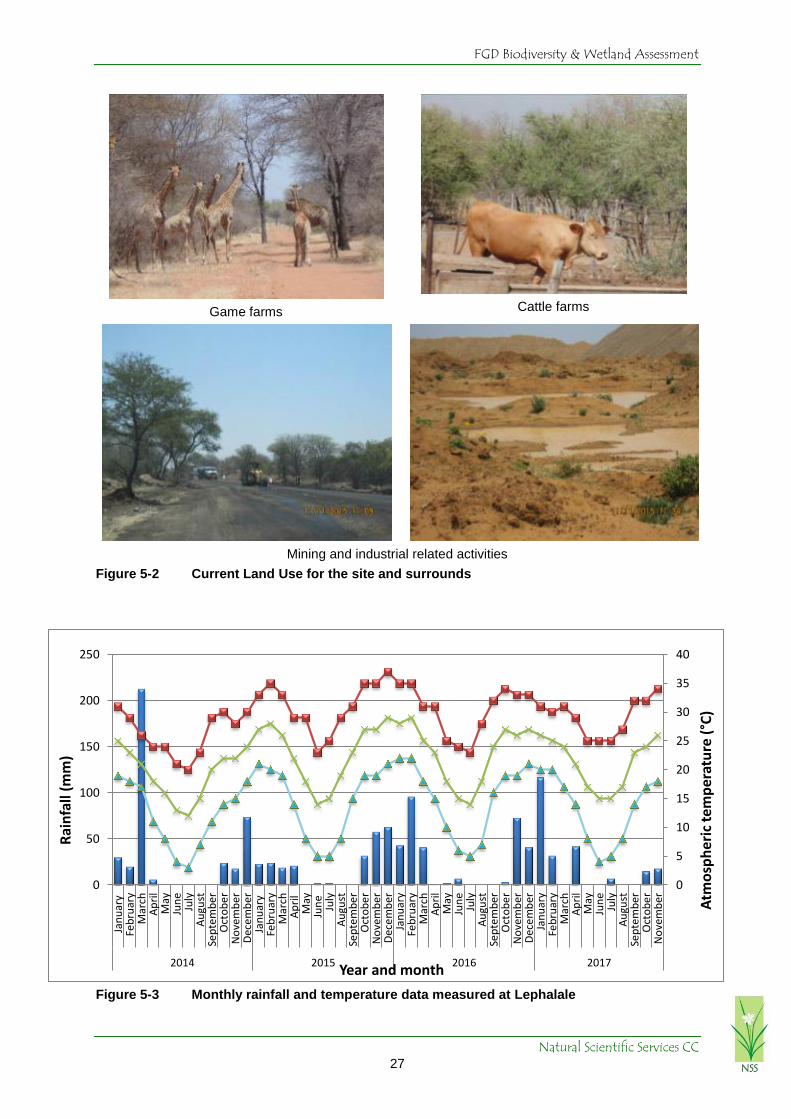
Current forms of land use on and surrounding the site are presented in Figure 5-2. To the
south and west of the study area are game and cattle farms consisting mostly of natural
woodland vegetation. To the north of the FGD study area is the Manketti Reserve (the
wildlife area of Grootegeluk Mine). To the east of the study area is the Matimba Power
Station, game and cattle farms and the towns of Marapong and Lephalale.
5.2. Climate
The study region falls within a summer rainfall region and little to no precipitation is recorded
in the months May, August and September whilst the maximum rainfall occurs in November
and December. The average annual rainfall is recorded as 410.4mm per year (data from
1993-2009, Station [0674341 8]). The maximum summer temperature is experienced from
November to February with an average high of 25°C and maximum temperatures reaching
37°C. The lowest temperatures are experienced between May and August. Monthly rainfall
and temperature data measure at Lephalale since September 2014 are shown in Figure 5-3.
FGD Biodiversity & Wetland Assessment
Natural Scientific Services CC 27
Game farms
Cattle farms
Mining and industrial related activities
Figure 5-2 Current Land Use for the site and surrounds
Figure 5-3 Monthly rainfall and temperature data measured at Lephalale
0
5
10
15
20
25
30
35
40
0
50
100
150
200
250
Jan
uar
yFe
bru
ary
Mar
chA
pri
lM
ayJu
ne
July
Au
gust
Sep
tem
ber
Oct
ob
er
No
vem
ber
Dec
em
ber
Jan
uar
yFe
bru
ary
Mar
chA
pri
lM
ayJu
ne
July
Au
gust
Sep
tem
ber
Oct
ob
er
No
vem
ber
Dec
em
ber
Jan
uar
yFe
bru
ary
Mar
chA
pri
lM
ayJu
ne
July
Au
gust
Sep
tem
ber
Oct
ob
er
No
vem
ber
Dec
em
ber
Jan
uar
yFe
bru
ary
Mar
chA
pri
lM
ayJu
ne
July
Au
gust
Sep
tem
ber
Oct
ob
er
No
vem
ber
2014 2015 2016 2017
Atm
osp
her
ic t
emp
erat
ure
(°C
)
Rai
nfa
ll (m
m)
Year and month

FGD Biodiversity & Wetland Assessment
Natural Scientific Services CC 28
The rainfall data indicate that the study region had received a slightly below-average amount
of (329mm) rainfall during the 12-month period preceding the site visit in November 2016.
However, the 2016/2017 summer season was not as hot, and more promising in terms of
rainfall, than the preceding 2015/2016 and 2014/2015 summer seasons. NSS conducted a
number of site visits throughout the seasons and was able to obtain a reasonable
understanding of the ephemeral systems within the study area and beyond. This was
particularly the case for the December 2015 site visit, where the area received significant
rainfall in the weeks preceding the visit. Not as much rain fell prior to the November 2016
visit, which allowed a broader understanding of the dynamics and fluctuation in these
systems.
5.3. Geology and Soils
The study area is underlain with a sequence of yellow to purple coloured sandstones and
conglomerate rock of the Waterberg Group. The majority of the Waterberg occurs within the
Limpopo Province with exposures extending into Botswana. It lies unconformably over the
Transvaal Group and is comprised of three subgroups. With regard to economic geology, the
Waterberg was mined for lead in the early 20th century and currently is mined for tin in the
Rooiberg region. Geohydrological studies indicate that the area is located over aquifers that
contain limited amounts of groundwater. Groundwater flowing to the south and east is
reported to be contaminated, although to a limited extent, by the ash deposited at the
existing Matimba Power Station (Envirolution Consulting, 2009).
Land types represent areas that are uniform with respect to climate, terrain form, geology
and soil. According to the Agricultural Geo-referenced Information System (AGIS, 2014), the
site is situated in land type Ah86, Bd46 and Ae252 (Figure 5-5). This and the surrounding
land types are associated with shale, sandstone, mudstone and coal from the Karoo
sequence as well as sandstone and conglomerate rock from the Kransberg Subgroup. The
study area is situated in a region where erosion rates are considered as moderate to high
relative to other parts of the country and soils are generally sandy and rarely more than 3m
thick. Clay soils are uncommon in the area.
Across a landscape, usually five terrain units can be identified. Wetlands occur most
frequently in valley bottoms (unit 5), but can also occur on crests, mid slopes and foot slopes
(units 1, 3 and 4). The catenas within land types Ah86 and Bd46 incorporate all of the four
terrain units 1, 3, 4 and 5, whilst land type Ae252 mainly features terrain units 4 and 5 as
shown in Figure 5-4. Presented in Table 5-1 is an overview of the soil forms and their extent
of coverage, which can be expected within different terrain units in land type Ae252, Ah86
and Bd46.

FGD Biodiversity & Wetland Assessment
Natural Scientific Services CC 29
Figure 5-4 Terrain units occurring within land type Ae252, Ah86 and Bd46 (AGIS, 2014)
According to ESS (2015), the most dominant soil units for the study area (Figure 7-15)
include:
Shallow (<400mm) sandy to silty loams (salm/silm);
Moderate to Shallow (400-600mm) sandy loam (salm); and
Wet based soils with a variety of depths and clay composition.
Specifically important for the wetland assessment are the wet-based soils of varying depths
and clay content. According to ESS (2015), the semi-arid climate and negative water balance
combined with the horizontal attitude of the sedimentary host lithologies that characterise the
Karoo sediments in the area have aided in the development of evaporates within the vadose
zone. These include calcrete and in some areas ferricrete or laterite formations. The
presence of the ferricrete or hard pan calcretes and plinthic horizons is considered of
importance in the soil moisture regime and in many cases the reason for wet features within
the soil profile. These soils classify as highly sensitive where they occur in the top 500mm of
the profile.
Table 5-1 Soil forms, their wetland potential, coverage, and erodibility classes within the
terrain units of land type Ae253, Ah86 and Bd46

FGD Biodiversity & Wetland Assessment
Natural Scientific Services CC 30
SOIL FORM % COVER PER TERRAIN UNIT
1 3 4 5
Ae253
SLOPE (%) 0-1% 1-2%
Shigalo Hu46 79
Mispah Ms10, Muden Ms20 11 10
Portsmouth Hu35 8
Levubu Oa34, Jozini Oa36,
Limpopo Oa46 70
Shorrocks Hu36 2 20
Ah86
SLOPE (%) 1-2% 0-2% 0-1% 1-3%
Bontberg Hu25, Portsmouth Hu35 60 55 43
Gutu Cv25, Denhere Cv35 40 45 38
Shorrocks Hu36 4 25
Tweefontein Cv20, Ofazi Cv23, Annandale Cv33, Maputa Fw10 5
Chester Hu22, Moriah Hu32 5
Vaalsand Lo31 2 20
Windmeul Av35, Newcastle Av25, Soetmelk Av36, Uitkot Gc35 2 5
Lindley Va41, Limpopo Oa46, Mutale Oa47, Killarney Ka20 30
Blinkklip Cv36 1 5
Pans 15
Bd46
SLOPE (%) 1-3% 2-8% 0-1% 1-3%
Denhere Cv35, Sandveld Fw12, Constantia Ct12 20 15 27
Windmeule Av35, Soetmelk Av36, Leslie Gc36 28
Paddock We31, Davel We32 14 4
Venda Oa35, Jozini Oa36, Limpopo Oa46, Valsrivier Va40 10 60
Portsmouth Hu35, Shorrocks Hu36 30 25 10
Valssand Lo31 11 6
Mispah Ms10 50 60
Slangkop Kd15 15
Stream beds/Stroombeddings 15
5.4. Hydrology
The Study Area falls within the Limpopo Water Management Area (WMA) 1 and is situated in
the Mokolo River Catchment area (8387 km2), where the Mokolo River (also known as the
Mogol or Mogolo River) system varies from good to fair health (RHP, 2006). The Mokolo
River rises in the western part of the Waterberg (between 1200 and 1600 metres above
mean sea level). It originates in a flattish, open area with numerous koppies and flows
through a steep gorge emerging above the town of Vaalwater. Here the river flows through a
relatively flat area until it enters the Mokolo Dam. From there, it flows through another gorge
before entering the Limpopo Plain, near the junction with the Rietspruit. From this point, the
Mokolo River flows through flat sandy areas until it reaches the Limpopo River. The main

FGD Biodiversity & Wetland Assessment
Natural Scientific Services CC 31
tributaries joining the Mokolo River downstream of the Mokolo Dam are the Rietspruit, Poer
se Loop, and Tamboti River (DWA, 2012a; 2012b, RHP, 2006). The Mokolo River is a major
tributary of the Limpopo River and commands a total catchment area of over 8 387 km2
(Savannah Environmental, 2013) with a total natural mean annual runoff (MAR) of almost
300 Mm3/a. The towns of Lephalale and Vaalwater are situated in the Mokolo Catchment.
Agriculture (irrigation) is the major water user in the catchment (RHP, 2006).
According to the RHP (2006), the river channel of the Mokolo River is dominated by sandy
runs and pools, but is heavily infested with reed beds (Phragmites mauritianus). The lower
part of the Mokolo river is afforded some protection by game farms and other private farms
while the wide floodplain and reed beds also limit access. The river flow highly regulated
from the Mokolo Dam with sporadic flows being released for the farming community. There
are five major road bridges in this area. A number of farm dams are located in the Mokolo
River close to the Limpopo confluence and sand mining is widespread. The lower Mokolo
River is dominated by hardy, pool dwelling species of fish. It is possible that some species
may have been lost due to fragmentation of the river from the Limpopo River. No fish species
requiring permanent flow were recorded, but several species that require flowing water for
breeding purposes still remain, such as the Large Scale Yellowfish (Labeobarbus
marequensis) and other Labeo species. However, no alien fish species were recorded. The
poor habitat diversity caused the invertebrate assemblage to be dominated by hardy families
associated with marginal vegetation and sand. The moderately scoring SASS assessments
are likely to be as a result of the irregular flow regime. The main vegetation impact is
considered to be reed encroachment and there are clear indications that the regulated flow
regime is contributing to this problem. Alien vegetation was very sparse and only a few
Syringa (Melia azedarach) was recorded. Downstream from Lephalale, disturbance to the
riparian zone was limited to bridges, sand mining, and agricultural practices (mostly water
abstraction pumps and the cutting of vegetation to the river’s edge) (RHP, 2006).
The Sandloop is a tributary of the Mokolo River. A summary of the Present Ecological State
(PES), Ecological Importance (EI), Ecological Sensitivity (ES) and current impacts on the
Sandloop is presented in Table 5-2 (DWS, 2014). The Desktop PES of the Sandloop is
moderately modified (C category) where the loss and change of natural habitats and biota
have occurred but the basic ecosystem functions are still predominately unchanged.
According to the DWS (2014), this river is seriously influenced by cattle grazing and land-
use. The instream and riparian habitats are moderately influenced by agricultural fields, low
water crossings, erosion, overgrazing and trampling. The WQ is also moderately impacted
on by run-off from mining. These habitats are also affected by bed and channel disturbances,
small farm dams, inundation, road crossings, urbanisation and vegetation removal but only to
a lesser degree. The moderate EI of the Sandloop is due to the one wetland and two riparian
habitat types, 12 different types of vegetation cover and three endemic species in this sub-
quaternary catchment with a taxon richness of at least 25 species (wetland, riparian and
aquatic vegetation). The size of stream, morphology and geomorphic habitat units determine
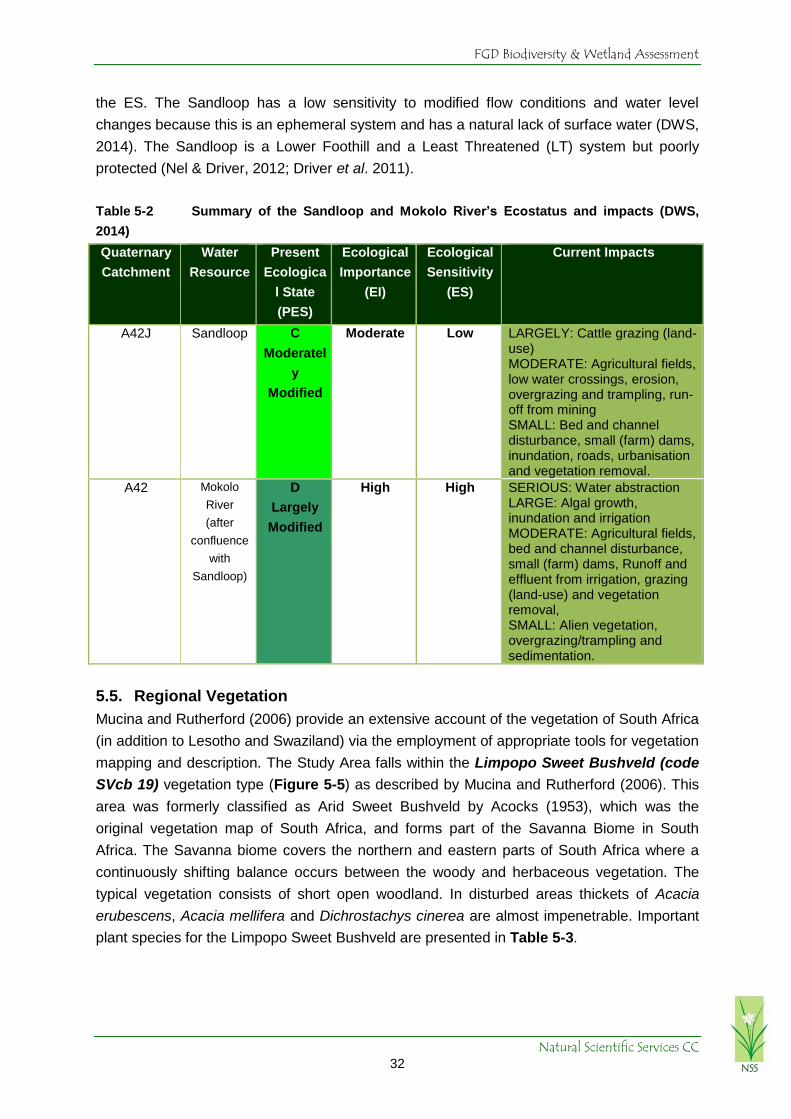
FGD Biodiversity & Wetland Assessment
Natural Scientific Services CC 32
the ES. The Sandloop has a low sensitivity to modified flow conditions and water level
changes because this is an ephemeral system and has a natural lack of surface water (DWS,
2014). The Sandloop is a Lower Foothill and a Least Threatened (LT) system but poorly
protected (Nel & Driver, 2012; Driver et al. 2011).
Table 5-2 Summary of the Sandloop and Mokolo River’s Ecostatus and impacts (DWS,
2014)
Quaternary
Catchment
Water
Resource
Present
Ecologica
l State
(PES)
Ecological
Importance
(EI)
Ecological
Sensitivity
(ES)
Current Impacts
A42J Sandloop C
Moderatel
y
Modified
Moderate Low LARGELY: Cattle grazing (land-use) MODERATE: Agricultural fields, low water crossings, erosion, overgrazing and trampling, run-off from mining SMALL: Bed and channel disturbance, small (farm) dams, inundation, roads, urbanisation and vegetation removal.
A42 Mokolo
River
(after
confluence
with
Sandloop)
D
Largely
Modified
High High SERIOUS: Water abstraction LARGE: Algal growth, inundation and irrigation MODERATE: Agricultural fields, bed and channel disturbance, small (farm) dams, Runoff and effluent from irrigation, grazing (land-use) and vegetation removal, SMALL: Alien vegetation, overgrazing/trampling and sedimentation.
5.5. Regional Vegetation
Mucina and Rutherford (2006) provide an extensive account of the vegetation of South Africa
(in addition to Lesotho and Swaziland) via the employment of appropriate tools for vegetation
mapping and description. The Study Area falls within the Limpopo Sweet Bushveld (code
SVcb 19) vegetation type (Figure 5-5) as described by Mucina and Rutherford (2006). This
area was formerly classified as Arid Sweet Bushveld by Acocks (1953), which was the
original vegetation map of South Africa, and forms part of the Savanna Biome in South
Africa. The Savanna biome covers the northern and eastern parts of South Africa where a
continuously shifting balance occurs between the woody and herbaceous vegetation. The
typical vegetation consists of short open woodland. In disturbed areas thickets of Acacia
erubescens, Acacia mellifera and Dichrostachys cinerea are almost impenetrable. Important
plant species for the Limpopo Sweet Bushveld are presented in Table 5-3.

FGD Biodiversity & Wetland Assessment
Natural Scientific Services CC 33
The conservation status of the Limpopo Sweet Bushveld is classified as Least Threatened. In
2006, about 5% of the vegetation type had been transformed, mainly by cultivation and the
area is suitable for game and cattle farming due to the high grazing capacity of sweet veld.
Subsequent to 2006, the area has been facing increasing pressure from numerous coal
mining projects within the vicinity with a much greater percentage of land transformed.
Table 5-3 Important plant species in the Limpopo Sweet Bushveld
SPECIES
GROUP IMPORTANT TAXA
Tall trees Acacia robusta (d), Acacia burkei
Small trees Acacia erubescens (d), A. fleckii (d), A. nilotica (d), A. senegal var rostrata (d),
Albizia anthelmintica (d), Boscia albitrunca (d), Combretum apiculatum (d),
Terminalia sericea
Tall shrubs Catophractes alexandri (d), Dichrostachys cinerea (d), Phaeoptilum spinosum (d),
Rhigozum obovatum (d), Cadaba aphylla, Combretum hereroense, Commiphora
pyracanthoides, Ehretia rigida subsp. rigida, Euclea undulata, Grewia flava,
Gymnosporia senegalensis
Low shrubs Acacia tenuispina (d), Commiphora africana, Felicia muricata, Gossypium
herbaceum subsp. africanum, Leucospaera bainesii.
Graminoids Digitaria eriantha subsp. eriantha (d), Enneapogon cenchroides (d), Eragrostis
lehmanniana (d), Panicum coloratum (d), Schmidtia pappophoroides (d),
Aristida congesta, Cymbopogon nardus, Eragrostis pallens, E. rigidior, E.
trichophora, Ischaemum afrum, Panicum maximum, Setaria verticillata,
Stipagrostis uniplumis, Urochloa mosambicensis.
Herbs Acanthosicyos naudinianus, Commelina benghalensis, Harpagophytum
procumbens subsp. transvaalense, Hemizygia elliotii, Hermbstaedtia odorata,
Indigofera daleoides.
Succulent herbs Kleinia fulgens, Plectranthus neochilus
Source: Mucina & Rutherford (2006)
Key: (d) = dominant species; Species in Bold indicate those identified in the study area

FGD Biodiversity & Wetland Assessment
Natural Scientific Services CC 34
Figure 5-5 Regional Vegetation and Land Types

FGD Biodiversity & Wetland Assessment
Natural Scientific Services CC 35
Figure 5-6 Biomes and Wetland Vegetation in the Study Area

FGD Biodiversity & Wetland Assessment
Natural Scientific Services CC 36
Figure 5-7 Quaternary Catchments and Ecoregion in the Study Area

FGD Biodiversity & Wetland Assessment
Natural Scientific Services CC 37
6. Methodology
6.1. Vegetation & Floral Communities
6.1.1 Desktop Research
A desktop investigation of regional vegetation, including Conservation Important (CI) and
alien, invasive floral species, was performed by consulting the following information sources:
Google Earth (recent and historical imagery) and Bing satellite imagery. Historical
imagery was incorporated into the assessment due to the continuous earth moving
activities and developments occurring within the Medupi ADF, coal stockpile area and
FGD portion of the Power Station.
Mucina & Rutherford’s (2006) vegetation map of southern Africa.
The South African National Biodiversity Institute’s (SANBI’s) online PRECIS
(PREtoria Computerised Information System), which provides taxonomic information
for plant species occurring in southern Africa (in the format of Germishuizen & Meyer,
2003). For this study, plant species data were obtained for the quarter degree square
(QDS) 2327DA.
CI plant species records in the study region, supplied by Limpopo Conservation.
The current Limpopo C-Plan (Version 2, 2013).
The list of declared weeds and invader species as promulgated under the amended
regulations (Regulation 15) of the Conservation of Agricultural Resources Act (CARA;
Act 43 of 1983), and the Alien and Invasive Species Regulations (August, 2014)
under Section 70 of the National Environmental Management: Biodiversity Act
(NEMBA; Act 10 of 2004).
6.1.2 Fieldwork
Fieldwork was performed during January 2015, November 2015, December 2015 and
December 2016 and involved:
Sampling vegetation plots to determine the spatial extent, structure, condition and
dominant species composition of different local floral communities (Figure 6-1)
Sampling plot size was standardised at 100m2. Whilst a plot was sampled, a list of
plant taxa was compiled and each taxon was assigned a cover-abundance estimate
using the Braun-Blanquet approach (Mueller-Dombois & Ellenberg 1974). The cover-
abundance categories that were used for this purpose are listed in Table 6-1. It must
be noted that the habitat in which the site fell was mostly homeogenous in nature,
fragmented and disturbed, therefore the use of the Braun-Blanquet approach was
limited.
Walking random transects to detect localised and CI plant species (i.e. Red Data,
endemic, protected and cultural species).
Recording any observed alien and invasive plant species on site.

FGD Biodiversity & Wetland Assessment
Natural Scientific Services CC 38
Figure 6-1 Main vegetation sampling points

FGD Biodiversity & Wetland Assessment
Natural Scientific Services CC 39
6.1.3 Data Analysis
The Juice (version 7.0.99) software program for management, analysis and
classification of ecological data was used to conduct a TWINSPAN Detrended
Correspondence Analysis (DCA) (Tichy & Holt, 2006) on the limited sampling points.
The R-program was included as an add-on programme to Juice to conduct the DCA
ordination.
A TWINSPAN analysis (Hill 1979) of the Braun-Blanquet data, which represented the
cover-abundance of species in each sample plot, was used to classify vegetation
assemblages. TWINSPAN is used to investigate associations between samples with
the purpose of objectively distinguishing groups or assemblages. Samples that
cluster together are believed to have similar compositions. The data were left
untransformed to allow for only common or dominant species to participate in the
analysis.
For CI floral species, Likelihood of Occurrence (LO) rating is assigned to each
species based on the availability of suitable habitat using the following scale:
o Present
o Highly likely
o Possible
o Unlikely
o No Habitat
Table 6-1 Braun-Blanquet cover classes (Mueller-Dombois & Ellenberg 1974)
CLASS RANGE OF COVER (%) MEAN
5 75-100 87.5
4 50-75 62.5
3 25-50 37.5
2 5-25 15.0
1 1-5 2.5
<1 0.1
r <<1 0.01
6.1.4 Limitations
It is important to note that the absence of species on site does not conclude that the species
is not present at the site. Reasons for not finding certain species during the different visits (all
conducted in mid-summer) may be due to:
The fragmented nature of the remaining natural vegetation within the boundary of the
Medupi Power Station FGD Project area.
The duration of fieldwork and the period at which rainfall events took place. I.e. while
the December 2015 fieldwork took place during a heavy rainfall period – this was
beneficial for faunal species. Floral species require some growth time after such
events.
Some plant species, which are small, have short flowering times, rare or otherwise
difficult to detect may not have been detected even though they were potentially
present on site.

FGD Biodiversity & Wetland Assessment
Natural Scientific Services CC 40
As an alternative to other vegetation cover methods (such as the Domin method), the
Braun-Blanquet cover-abundance scale was used to analyse vegetation. It is reported
that the Braun-Blanquet method requires only one third to one fifth the field time
required to other similar methods (Wikum & Shanholtzer, 1978). Furthermore, cover-
abundance ratings are better suited than density values to elucidate graphically
species-environment relationships. For extensive surveys this method provides
sufficiently accurate baseline data to allow environmental impact assessment as
required by regulatory agencies. However, there are a couple of problems that have
been detected with such sampling methods (Hurford & Schneider, 2007). These are
as follows:
o It can be seen as subjective and dependent upon the experience and
knowledge of the vegetation type by the surveyor. The cover estimate may vary
from observer to observer.
o There also may be a problem when the cover estimate is very close to two
different classes (on the border so to speak) and then it is for the observer to
decide which class it should be allocated to. In Hurford & Schneider’s (2007)
experience, in marginal situations, where the cover of a species is close to a
boundary between two classes, the chance of two observers allocating the
species to the same cover class is no better than 50:50. However, when
comparing to other sampling methods such as Domin, Braun-Blanquet scale is
better adapted for monitoring (less cover classes and fewer boundaries).
6.2. Faunal Communities
6.2.1 Desktop Research
Lists of potentially occurring faunal species (Appendices 2-7) were based on distribution
data sourced for:
Mammals, using the published species distribution maps in Friedmann & Daly (2004),
as well as the online species distribution data provided by the ADU’s MammalMap
(2018) for the regional QDSs 2327CB, 2327DA, 2327CD and 2327DC.
Birds, using the online species distribution data from the first and second Southern
African Bird Atlas Projects (SABAP 1 & 2, 2018) for QDSs 2327CB, 2327DA and
respective pentads 2340_2725 and 2340_2730.
Reptiles, using the published species distribution maps in Bates et al. (2014) and the
online species distribution data from ReptileMap (2018) for all four regional QDSs.
Frogs, using the published species distribution maps in Minter et al. (2004) and the
online species distribution data from FrogMap (2018) for all four QDSs.
Butterflies, using the online species distribution data from Mecenero et al. (2015) and
LepiMap (2018) for all four QDSs.
Dragonflies and damselflies (odonata), using distribution maps and habitat information
provided in Samways (2008).

FGD Biodiversity & Wetland Assessment
Natural Scientific Services CC 41
Scorpions, using distribution maps and habitat information provided in Leeming
(2003).
Baboon Spiders, using distribution maps provided in Dippenaar-Schoeman (2002).
A Likelihood of Occurrence (LO) rating was then assigned to each species based on
distribution and the availability of suitable habitat using the following scale:
1 Present
2 High
3 Moderate
4 Unlikely
5 The species would only occur in the area as a managed population.
Species lists were then supplemented with records obtained by BEC (2006) as part of the
Medupi EMPR, as well as combined records from NSS studies in the Vicinity at Grootegeluk
and Limpopo West Mines, Mafutha Project and Matimba Power Station.
6.2.2 Fieldwork
NSS visited the greater FGD study area three times i.e. during 12-13 January 2015, 9-11
November 2015 and 7-11 December 2015. During the first two visits a brief scan was
performed, which involved active searching, deployment of motion cameras, and night time
bat and frog acoustic surveys. The final five day survey followed a similar approach but with
the addition of live-trapping.
Visual observations, grab-sampling and netting
Faunal observations were made during active point searches both by day and night on foot
and incidentally while driving in and around the study area. Herpetofauna were searched for
by turning rocks, logs and mats deployed during the November visit. Holes were investigated
using a burrow scope. Tadpoles were sampled by dipnetting, and identified based on
morphology and labial tooth row formula. Sweepnetting was used to sample butterflies.
Scorpions were searched for under bark and rocks. Mammals were detected from
observations of dead or live animals and their spoor, droppings, burrows and any other
evidence of their presence. Birds were identified based on direct observation or from their
calls and flight behaviour. Spotlighting during slow night drives was used to detect additional
nocturnal fauna.
Live-trapping
In total, four live-trapping sites were installed in and around the FGD study area. Each trap
site consisted of one array trap and a set of rodent traps. The trap sites operated over five
days and four nights, and were checked daily. The location of each trap site is mapped in
Figure 6-5.
Trap sites and techniques are shown in Figure 6-2 and Figure 6-4, respectively. Additionally
three sets of five large Astroturf mats were deployed during the November visit targeting
reptiles, frogs and fossorial fauna. The mats were recollected during the December visit.

FGD Biodiversity & Wetland Assessment
Natural Scientific Services CC 42
Trap Site 1 Trap Site 2 Trap Site 3 Trap Site 4
Figure 6-2 Live trapping sites
A schematic layout of an array trap site is presented in Figure 6-3. The array traps
(Campbell & Christman, 1982) were used to sample herpetofauna (reptiles and frogs) and
terrestrial macro-invertebrates. Each array consisted of three arms of plastic drift fencing
(30cm high and 8m long). Pitfall traps (5 litre buckets sunken to ground level) were placed at
the centre of the array and at the end of each drift fence. Each pitfall trap was provisioned
with a stone, wet cotton wool and a raised, wooden cover board to provide shelter, moisture
and shade for trapped animals. A plastic, mesh funnel trap was placed on either side of each
drift fence and covered with a wooden board for shade.
Figure 6-3 Schematic layout of an array trap including drift fences, pitfall and funnel traps
A live rodent trapping transect typically included a series of metal rodent traps spaced at 5-
10m intervals. Each series included one pair of multi-entry traps, and 16 Sherman traps.
Each trap was baited with a mixture of peanut butter, rolled oats, raisins, sunflower oil and
seeds, and supplied with cotton wool and a wooden cover board to provide warmth and
shade for trapped animals. The traps were checked daily and re-baited when necessary.
Pitfall trap
Funnel trap
Plastic sheeting
8 m
ete
rs

FGD Biodiversity & Wetland Assessment
Natural Scientific Services CC 43
Funnel and pitfall traps
along drift fence
Sherman rodent trap Motion camera Mat Trap
Figure 6-4 Examples of sampling techniques employed
Acoustic survey for bats and frogs
Bat calls were recorded during a short driven transect in the study area (Figure 6-5) using an
ultra-sonic Echo Meter 3 (EM3) detector (Wildlife Acoustics, Inc., USA). Wildlife Acoustics
Compressed (.wac) files of bat calls recorded by the EM3 detector were converted to zero
crossing (.zc) and wave (.wav) files using the WAC2WAV and Kaleidoscope programmes
(Wildlife Acoustics Inc., USA). The converted data were subsequently processed using the
BatSound Pro (Pettersson Elektronik, Sweden) programme to identify bat taxa from detailed
examination of the peak frequency, duration and band width of calls.
Camera-trapping
Motion-sensitive cameras, set to record both infrared and flash images, were installed in and
around the FGD study area where vertebrate activity was deemed likely, such as near water
holes, game feeding stations or along paths (Figure 6-5 and Figure 6-4). Some cameras
were baited to attract secretive, nocturnal, carnivorous mammals.
Designation of Conservation Status
In the appended faunal species lists the global, national and provincial conservation status of
applicable species is provided. Global and National Red Lists are based on the IUCN Red
List criteria and categories, shown in Figure 6-6, which were developed to provide a simple
and effective system for rating the conservation status of species, mainly at global and
regional levels. The global status of species was sourced from the IUCN (2017.3) Red List.
The latest national Red List status of species was sourced for mammals, birds, reptiles, frogs
and butterflies from the atlases and Red Data books by SANBI & EWT (unpubl.), Taylor et al.
(2015), Bates et al. (2014), Minter et al. (2004) and Mecenero et al. (2013), respectively. A
legally-binding national list of Threatened or Protected Species (ToPS, 2015) is provided
under the 2004 National Environmental Management: Biodiversity Act (NEMBA). As there is
often spatio-temporal variation in human disturbances, the conservation status of some
species differs between the IUCN global/regional, national and provincial Red Listings.

FGD Biodiversity & Wetland Assessment
Natural Scientific Services CC 44
Figure 6-5 Layout of faunal sampling points showing the bat acoustic transect and position of the motion cameras.

FGD Biodiversity & Wetland Assessment
Natural Scientific Services CC 45
Figure 6-6 IUCN Red List categories
6.2.3 Limitations
Several inherent and unavoidable limitations need to be considered when interpreting survey
results. Reasons for the lack of detection of some species include:
Inductions and security protocol which significantly decreased the amount of time
spent in the study area.
The small, fragmented nature of the study area, and disturbances from Medupi
Power Station.
The short duration of each field survey, and the lack of significant rainfall preceding
the January survey.
The cryptic nature of certain species or simply lack of species presence. Some
animal species, which are uncommon, small, migratory, secretive or otherwise
difficult to find may not have been detected even though they were potentially
present in the study area.
6.3. Watercourses, Wetlands and Ephemeral Systems
As part of this study it is important to define what systems are being investigated. As
mentioned in Section 5, the study area lies within a drier region of the country where
evapotranspiration exceeds rainfall. Rainfall in this region is approximately 400mm per
annum. Systems, therefore within this region are largely ephemeral and are seen as
drainage systems that potentially flow intermittently. These fall under the definition of a
Watercourse.
Extinct (EX)
Extinct in the wild (EW)
Critically Endangered (CR)
Endangered (EN)
Vulnerable (VU)
Near Threatened (NT)
Least Concern (LC)
Threatened Adequate data
Data Deficient (DD)
Evaluated
Not Evaluated

FGD Biodiversity & Wetland Assessment
Natural Scientific Services CC 46
A watercourse defined by the National Water Act (Act 36 of 1998) means –
(a) a river or spring;
(b) a natural channel or depression in which water flows regularly or intermittently;
(c) a wetland, lake or dam into which, or from which, water flows; and
(d) any collection of water which the Minister may, by notice in the Gazette, declare to
be a watercourse as defined in the National Water Act, 1998 (Act No. 36 of 1998) and
reference to a watercourse includes, where relevant, its bed and banks;
When discussing a wetland, the definition used within this study is that defined by the
Ramsar Convention1 and those used within publications such as the “Classification System
for Wetlands and other Aquatic Ecosystems in South Africa” (Ollis et al. 2013) which
incorporates both the definition of Aquatic Ecosystems2 and Wetlands3 as defined by the
National Water Act (Act 36 of 1998).
The National Water Act defines a wetland as “land which is transitional between terrestrial
and aquatic systems where the water table is usually at or near the surface, or the land is
periodically covered with shallow water, and which land in normal circumstances supports or
would support vegetation typically adapted to life in saturated soil”.
Due to the extent of the areas to be investigated, the ToR for NSS was to identify and
delineate watercourses and wetland systems at a desktop level within a 500m buffer of the
MPS and ADF and to then undertake limited ground truthing (mainly within December 2015
and November 2016) within the areas identified. Prior to any field investigations being
undertaken, the area was therefore surveyed at a desktop level using 1:50 000 topographical
maps, Google Earth™ Imagery, and available contour data (a relatively flat region, so
contour data limiting in this assessment) to determine the layout of potential watercourses
and wetlands within the study site and immediate surrounds.
6.3.1 Classification of the Watercourses and Wetlands
Where wetlands were found, they were defined using the classification system discussed
above by Ollis et al. (2013), hereafter referred to as “the Classification System”. The
Classification System recognizes three broad inland systems: rivers, wetlands and open
water bodies. Like Kotze et al’s. (2008) classification of wetlands based on hydro-
geomorphic (HGM) units, the Ollis et al. (2013) Classification System asserts that the
1 “Wetlands – areas of marsh, fen, peatland or water, whether natural or artificial, permanent or temporary, with water that is
static or flowing, fresh, brackish or salt, including areas of marine water the depth of which at low tide does not exceed six
meters” Ramsar Convention Secretariat, 2011. 2 Aquatic Ecosystem: an ecosystem that is permanently or periodically inundated by flowing or standing water, or which has
soils that are permanently or periodically saturated within 0.5m of the soil surface. 3 3
NWA defines a wetland as “land which is transitional between terrestrial and aquatic systems where the water table is
usually at or near the surface, or the land is periodically covered with shallow water, and which land in normal circumstances
supports or would support vegetation typically adapted to life in saturated soil.”

FGD Biodiversity & Wetland Assessment
Natural Scientific Services CC 47
functioning of an inland aquatic ecosystem is determined fundamentally by hydrology and
geomorphology.
The Classification System has a six-tiered structure where under the determination of a
system’s HGM unit (Level 4) is the most fundamental:
Level 1 – Type of Systems (Marine, estuarine or Inland)
Level 2 – Regional Setting (Level 1 Ecoregions; NFEPA WetVeg units etc)
Level 3 – Landscape Unit (Valley Floor, Slope, Plain, Bench)
Level 4 – Hydrogeomorphic (HGM) Unit
Level 5 – Hydrological Regime
Level 6 – Descriptors (e.g. Natural vs Artificial; Salinity; pH etc)
6.3.1.1 Ephemeral Systems (Watercourses)
Within the study area there are a number of drainage features referred to hereafter as Semi-
Ephemeral Washes (SEWs). These are situated in the upper reaches of their catchment and
characterised by a very gradual slope (<1%) and cross sectional profile. Although a very
slight change in vegetation structure (not composition) is sometimes apparent, no clearly
defined channel is obvious and it is often difficult to locate these systems on the ground
without the aid of aerial imagery.
6.3.2 Wetlands and Riparian Extent
Where required, the wetland delineation methods used in the field were the same as those
outlined in the DWS field procedure for identification and delineation of wetlands and riparian
areas (DWAF, 2005). The following three indicators described by DWAF (2005) were used:
Terrain Unit Indicator: The topography of the area was used to determine where in
the landscape wetlands were likely to occur. During the December 2015 field visit the
site experienced 38mm of rainfall in one week. This assisted NSS in determining the
flow paths of a number of the ephemeral systems on site. In addition, aerial imagery
and contour data were used to identify potential flow paths in the landscape.
Soil Wetness Indicator: The soil wetness and duration of wetness are indicated by the
colour of the soil. A grey soil matrix such as a G-horizon is an indication of wetness
for prolonged periods of time and mottles indicate a fluctuating water table. In terms
of the DWS guidelines (DWAF, 2005), signs of soil wetness must be found within the
top 50 cm of the soil surface to classify as a wetland. Temporary wetlands in arid
environments however do not usually exhibit mottling, because often the soils have
naturally low levels of iron, and the soils are by definition not exposed to the specific
conditions under which such indicators are formed so the absence of mottles does
not necessarily indicate the absence of a wetland in these systems (Day et al, 2010).
Where possible, soils data supplied by ESS (2016) for the study area were used
to identify wet-based and alluvial soils; and
Vegetation Indicator: Vegetation is a key component of the wetland definition in the
National Water Act, 1998 (Act No 36 of 1998), and vegetation can be used as an
indicator of wetland conditions. The presence / absence of hydrophytes usually
FGD Biodiversity & Wetland Assessment
Natural Scientific Services CC 48
provide a useful additional criterion in determining the boundaries of wetlands. Within
arid environments and the temporary wetlands identified on site it was more the
change in vegetation structure and facultative wetland plants (helophytes) that were
used as wetland indicators, as opposed to only hydrophytes. (Day et al. 2010). The
delineation of riparian vegetation was conducted using the three simple steps
outlined by Mackenzie & Rountree (2007), for sites that support predominantly
indigenous and naturally occurring vegetation, as such:
o Starting at the sides of the channel, identify the edge of the zone of
obligate riparian plants using the regional riparian vegetation indicator list.
o Check if there are hydric indicators in the soil, such as G-horizons or soil
mottling, or evidence of unconsolidated recent alluvial sediment. Find the
outer edges of these indicators.
o Examine the geomorphology (shape) of the channel and river banks. The
locations selected based on riparian indicator species or soil features
described above, should be at or close to the edge of the “macro-channel
bank” (in the case of erosive rivers) or at the edge of an active floodplain /
flood zone (in the case of alluvial depositional rivers). At this point, or
nearby, should be an inflection point (change of slope) between the
riparian area and the upland (terrestrial) slopes. This site can be
considered as the edge of the riparian zone.
The study site was traversed, on foot, with select areas chosen from the desktop mapping for
limited ground truthing. Soil samples, within the top 50cm and deeper where necessary, of
the soil profile, were taken using a hand auger along transects across the property and within
areas where wetland vegetation indicators were present. The areas were assessed for the
above wetland indicators. Each auger point sampled was marked with a handheld Global
Positioning System (GPS) device (Geographic projection, WGS 84 Datum).
6.3.3 Present Ecological State
6.3.3.1 Semi-Ephemeral Washes
Although this is not an HGM unit defined specifically in Ollis et al (2013), an attempt was
made to obtain a PES score using the Level 1 WET-HEALTH tool of Macfarlane et al. (2008).
In spite of this limitation it is our opinion that the scores attained for the wetlands are
representative and therefore afforded a high confidence. The WET-HEALTH tool is designed
to assess the health or integrity of a wetland. To assess wetland health, the tool uses
indicators based on the main wetland drivers: geomorphology, hydrology and vegetation.
Macfarlane et al. (2008) explain that the application and methodology of WET-HEALTH uses:
An impact-based approach, for those activities that do not produce clearly visible
responses in wetland structure and function. The impact of irrigation or afforestation

FGD Biodiversity & Wetland Assessment
Natural Scientific Services CC 49
in the catchment, for example, produces invisible impacts on water inputs. This is
the main approach used in the hydrological assessment.
An indicator-based approach, for activities that produce clearly visible responses in
wetland structure and function, e.g. erosion or alien plants. This approach is mainly
used in the assessment of geomorphology and vegetation health.
With WET-HEALTH a wetland is first classified into HGM units (Level 4 – Ollis et al. 2013),
and each HGM unit is separately assessed in terms of the extent, intensity and magnitude of
impacts on the hydrology, geomorphology and vegetation of the unit, which is translated into
a health score as follows:
The extent of impact is measured as the proportion (percentage) of a wetland and/or
its catchment that is affected by an activity.
The intensity of impact is estimated by evaluating the degree of alteration that
results from a given activity.
The magnitude of impact for individual activities is the product of extent and
intensity.
The magnitudes of all activities in each HGM unit are then combined in a structured
and transparent way to calculate the overall impact of all activities that affect a unit’s
hydrology, geomorphology and vegetation, and wetland PES is expressed on a
scale of A-F (Table 6-2).
Table 6-2 Impact scores and Present Ecological State categories
ECOLOGICAL
CATEGORY DESCRIPTION
COMBINED
IMPACT SCORE
A Unmodified, natural 0-0.9
B
Largely natural with few modifications. A slight change in
ecosystem processes is discernible and a small loss of natural
habitats and biota may have taken place.
1-1.9
C
Moderately modified. A moderate change in ecosystem
processes and loss of natural habitat has taken place but the
natural habitat remains predominantly intact.
2-3.9
D Largely modified. A large change in ecosystem processes
and loss of natural habitat and biota has occurred. 4-5.9
E
Seriously modified. The change in ecosystem processes and
loss of natural habitat and biota is great but some remaining
natural habitat features are still recognizable.
6-7.9
F
Critically modified. Modifications have reached a critical level
and the ecosystem processes have been modified completely
with an almost complete loss of natural habitat and biota.
8-10
Source: Modified from Macfarlane et al. (2008)
In addition, the threat and/or vulnerability of a wetland must be assessed to determine its
likely “trajectory of change” (Table 6-3). Overall wetland health is then jointly represented by
the wetland’s PES and trajectory of change. This approach not only provides an indication of
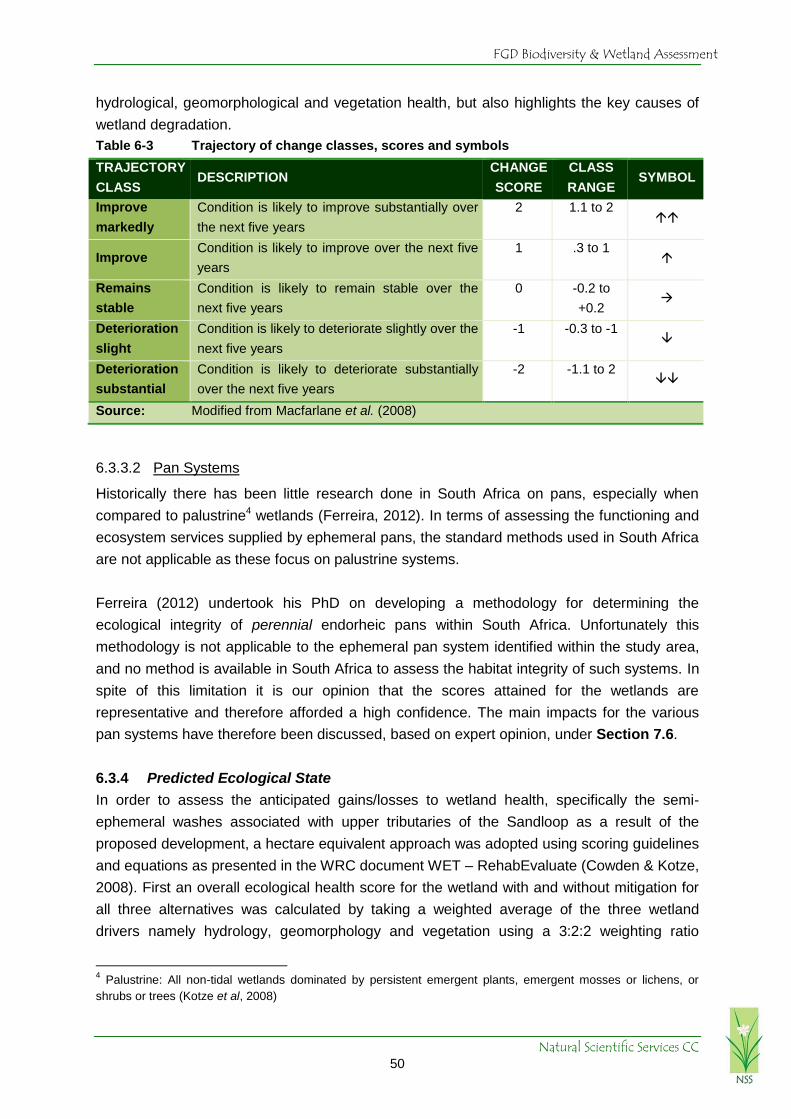
FGD Biodiversity & Wetland Assessment
Natural Scientific Services CC 50
hydrological, geomorphological and vegetation health, but also highlights the key causes of
wetland degradation.
Table 6-3 Trajectory of change classes, scores and symbols
TRAJECTORY
CLASS DESCRIPTION
CHANGE
SCORE
CLASS
RANGE SYMBOL
Improve
markedly
Condition is likely to improve substantially over
the next five years
2 1.1 to 2
Improve Condition is likely to improve over the next five
years
1 .3 to 1
Remains
stable
Condition is likely to remain stable over the
next five years
0 -0.2 to
+0.2
Deterioration
slight
Condition is likely to deteriorate slightly over the
next five years
-1 -0.3 to -1
Deterioration
substantial
Condition is likely to deteriorate substantially
over the next five years
-2 -1.1 to 2
Source: Modified from Macfarlane et al. (2008)
6.3.3.2 Pan Systems
Historically there has been little research done in South Africa on pans, especially when
compared to palustrine4 wetlands (Ferreira, 2012). In terms of assessing the functioning and
ecosystem services supplied by ephemeral pans, the standard methods used in South Africa
are not applicable as these focus on palustrine systems.
Ferreira (2012) undertook his PhD on developing a methodology for determining the
ecological integrity of perennial endorheic pans within South Africa. Unfortunately this
methodology is not applicable to the ephemeral pan system identified within the study area,
and no method is available in South Africa to assess the habitat integrity of such systems. In
spite of this limitation it is our opinion that the scores attained for the wetlands are
representative and therefore afforded a high confidence. The main impacts for the various
pan systems have therefore been discussed, based on expert opinion, under Section 7.6.
6.3.4 Predicted Ecological State
In order to assess the anticipated gains/losses to wetland health, specifically the semi-
ephemeral washes associated with upper tributaries of the Sandloop as a result of the
proposed development, a hectare equivalent approach was adopted using scoring guidelines
and equations as presented in the WRC document WET – RehabEvaluate (Cowden & Kotze,
2008). First an overall ecological health score for the wetland with and without mitigation for
all three alternatives was calculated by taking a weighted average of the three wetland
drivers namely hydrology, geomorphology and vegetation using a 3:2:2 weighting ratio
4 Palustrine: All non-tidal wetlands dominated by persistent emergent plants, emergent mosses or lichens, or
shrubs or trees (Kotze et al, 2008)

FGD Biodiversity & Wetland Assessment
Natural Scientific Services CC 51
respectively. Secondly this score was then used in to calculate hectare equivalents which
represent the extent of functional wetland in relation to the total wetland extent. This was
done using the following formula:
((Overall Health Score – 10) / 10) x Wetland Area = Hectare Equivalent
6.3.5 Ecosystem Services
The WET – EcoServices tool is a technique for rapidly assessing ecosystem services
supplied by wetlands (Kotze et. al., 2008). This tool has been designed for inland palustrine
wetlands, i.e. marshes, floodplains, vleis and seeps and has been developed to help assess
the goods and services that individual wetlands provide to support planning and decision-
making. No palustrine wetlands were identified on site, but rather semi-ephemeral drainage
features (Washes). This proposed methodology was only utilised in this assessment as a
guide to the services offered by the different systems. In spite of this limitation it is our
opinion that the scores attained for the wetlands are representative and therefore afforded a
high confidence.
6.3.6 Ecological Importance and Sensitivity
The assessment of wetland Ecological Importance and Sensitivity (EIS) was based on the
EIS Tool developed by Rountree and Kotze (2012). The purpose of assessing the EIS of
water resources is to identify those systems that provide higher than average ecosystem
services and/or biodiversity support functions, and/or are especially sensitive to impacts.
The Tool collectively considers:
Ecological Importance and Sensitivity, incorporating the traditionally examined
criteria used in EIS assessments of other water resources by DWS and thus
enabling consistent assessment approaches across water resource types;
Hydro-functional importance, which considers water quality, flood attenuation and
sediment trapping ecosystem services that the wetland may provide; and
Importance in terms of basic human benefits - this suite of criteria consider the
subsistence uses and cultural benefits of the wetland system.
It is recommended that the highest scoring of these three criteria be used to determine the
overall Importance and Sensitivity category (Table 6-4) of the wetland system.

FGD Biodiversity & Wetland Assessment
Natural Scientific Services CC 52
Table 6-4 Ecological importance and sensitivity categories – Interpretation of median
scores for biotic and habitat determinants
Range
of
Median
Ecological Importance & Sensitivity (EIS) Recommended
EMC
>3 and
<=4
Very high
Wetlands that are considered ecologically important and sensitive on a
national / international level. The biodiversity of these systems is usually
very sensitive to flow and habitat modifications. They play a major role
in moderating the quantity and quality of water of major rivers.
A
>2 and
<=3
High
Wetlands that are considered to be ecologically important and sensitive.
The biodiversity of these systems may be sensitive to flow and habitat
modifications. They play a role in moderating the quantity and quality of
water of major rivers.
B
>1 and
<=2
Moderate
Wetlands that are considered to be ecologically important and sensitive
on a provincial or local scale. The biodiversity of these systems is not
usually sensitive to flow and habitat modifications. They play a small role
in moderating the quantity and quality of water of major rivers.
C
>0 and
<=1
Low/Marginal
Wetlands which are not ecologically important and sensitive at any
scale. The biodiversity of these systems is ubiquitous and not sensitive
to flow and habitat modifications. They play an insignificant role in
moderating the quantity and quality of water of major rivers.
D
6.3.7 Sediment
Sediment samples were collected to determine the metal concentrations of the samples.
These sediment samples were collected at six of the sampling sites during the high flow
season (December 2015) and two additional samples within the November 2016 visit. The
sediment samples were collected in PET jars, frozen to prevent any organic decomposition
and sent to the Water Research Group (WRG) at the Potchefstroom Campus of North-West
University for the metal analysis.
The analysis for metals involved a total digestion of sediments and was based on the
methodology of Hassan et al. (2007). Each sediment sample was oven-dried for 2–4 days at
70°C. A known amount of each sample (approximately 0.5 g) was digested with Suprapur
nitric acid (HNO3) in a MARS 5 Microwave Digester for 20 minutes. The samples were then
diluted and filtered with 0.45 µm cellulose nitrate under vacuum pressure. The filtered extract
was analysed by Inductively Coupled Plasma – Optical Emission Spectrophotometer (ICP-
OES) and an Inductively Coupled Plasma – Mass Spectrophotometer (ICP-MS). The results
are expressed as mg/kg. Currently no sediment quality guidelines (SQGs) exist for
freshwaters in South Africa. Therefore, the concentrations for each of the metals are
compared to international standards and other local studies.
FGD Biodiversity & Wetland Assessment
Natural Scientific Services CC 53
6.3.7.1 Invertebrate Hatching
The aim of the invertebrate hatching was to determine if any invertebrate resting eggs were
present in the sediment from selected pans in the study area. Certain invertebrates,
especially Branchiopoda, form resting eggs of ephippia to overcome the harsh conditions
experienced in ephemeral wetlands. These resting eggs within the sediment are thus called
the egg bank. The resting eggs remain in the sediment until the correct environmental
triggers and conditions are present. The hatchlings are the first inhabitants of these
ephemeral pans before other insect taxa colonise the system. When these ephemeral
systems are dry it is impossible to determine what the biological community will comprise of
when it is inundated. However, determining what the initial community will be comprised of
can go a long way to provide an indication of the potential community.
Sediment samples from site MD7 and site MD8 were dried, at room temperature, upon
receiving the samples from the field investigations, for a minimum of 48 hours. The hatching
experiments were completed at a room temperature of approximately 22 °C. Each sample
was hatched in triplicate. A known amount of sediment, 25g, was placed into 2L plastic
containers for the hatching experiment. The experiment was initiated when 1L of distilled
water was added to each hatching container. Due to time constraints the hatching
experiment was allowed to run for 10 days but it would have been ideal to continue for up to
28 days. The hatching containers were examined every three to four days for any sign of
invertebrate hatchlings. A small amount of oxygen was also added to each container when
they were examined for invertebrate hatchlings. Both sites, MD7 and MD8, indicated that
hatching of invertebrates occurred more or less after three days.
6.3.7.2 Comparative analysis with Water Quality Results
NSS collected water quality samples for Golder & Associates Surface Water Quality
Assessment at the same time and position as the Sediment Samples. Water quality (WQ) is
used to describe the aesthetic, biological, chemical and physical properties of water that
determine its condition for a variety of uses and for the protection of the health and integrity
of aquatic ecosystems. These dissolved or suspended constituents, in the water, could
influence or control the WQ properties. For example, in some cases anthropogenic activities
can cause the physio-chemical constituents that occur naturally in the water to become toxic
under certain conditions. Each aquatic ecosystem possesses natural limits or thresholds to
the extent and frequency of change it can tolerate without being permanently modified
(DWAF, 1996). If an aquatic ecosystem crosses these thresholds, it will be difficult to recover
or regain its functional capacity without mitigation. It must also be taken into consideration
that determining the effects of changes in WQ on aquatic ecosystems is considered complex,
as these systems can fluctuate spatially and temporally. For this project the results from the
WQ analysis were used to compare those found within the sediment analysis.

FGD Biodiversity & Wetland Assessment
Natural Scientific Services CC 54
6.3.8 Limitations
Even though all attempts were made to take samples under optimal conditions certain
limitations were encountered. The limitations to this study included:
Wetland assessment techniques are inherently subjective.
The PES and EcoServices were also not designed for systems such as Ephemeral
Washes
The boundary determined by infield wetland delineation can often occur within a
certain tolerance because of the potential for the change in gradient of the wetness
zones within wetlands.
The modification of the soil profile related to agricultural activities and the clearing of
the site and the modification of the hydrological conditions within disturbed sites limits
the accuracy of the resulting boundary as the sampling methodology relies heavily on
interpretation of undisturbed soil morphology and characteristic.
The use of vegetation indicators (seasonal and temporary zones) was limited to non-
existent due to the ephemeral nature of the systems. Riparian vegetation was even
not evident. Only vegetation structure in comparison to surrounding areas was
conducted.
Water was limited to sandy pools within the drainage features in the study area.
None of the biomonitoring indices (Box 1) could be used due to the ephemeral nature
of these systems (Not within this Scope). Instead Invertebrate hatching at two pans in
the ADF site was conducted. Due to time constraints the hatching experiment was
allowed to run for 10 days but it would have been ideal to continue for up to 28 days.
Box 1
* The assessment of macro-invertebrate communities in a river system is a
recognised means of determining river “health”. Macro-invertebrates are good
indicators because they are visible, easy to identify and have rapid life cycles
(Dickens & Graham, 2002). According to Dickens & Graham (2002), the SASS5
(South African Scoring System, version 5) method is designed for low/moderate flow
hydrology and is not applicable in wetlands, impoundments, estuaries and other lentic
habitats. In addition, it has not been tested in ephemeral rivers and so should be
used with caution.
* No fish sampling was performed during the current study as the sampling sites were
shallow pools with limited water levels. The Fish Response Assessment Index (FRAI)
developed by Kleynhans (2008) cannot not be used in these ephemeral systems.

FGD Biodiversity & Wetland Assessment
Natural Scientific Services CC 55
7. Results
7.1. Vegetation Communities
SANBI frequently collect/collate floral data within Southern Africa and update their PRECIS
database system (National Herbarium Pretoria (PRE) Computerised Information System)
which is captured according to QDS. For this study, the site falls with 2327DA. Species within
the POSA database for this QDS do not exceed 311 species (Date extracted February 2015)
and represent 68 Families. The dominant families being FABACEAE, POACEAE and
MALVACEAE (Table 7-1), with the herbs representing 30.87%, dwarf shrubs 14.47%, shrubs
to small trees 15.76% and graminoids representing 11.25% of the total species listed for the
area. This is a typical representation of vegetation structure for savanna communities.
Table 7-1 Top Ten Dominant Families and Most Dominant Growth Forms obtained from
the POSA website for the QDS 2327DA
IMPORTANT FAMILIES No. OF
SPP
GROWTH FORMS % TOTAL
SPP
FABACEAE 38 Herb 30.87
POACEAE 35 Dwarf shrub 14.47
MALVACEAE 35 Graminoid 11.25
ACANTHACEAE 17 Shrub 9.65
ASTERACEAE 16 Shrub to small tree 6.11
CONVOLVULACEAE 11 Climbers 5.14
APOCYNACEAE 11 Geophyte 4.5
EUPHORBIACEAE 10 Succulent 3.86
HYACINTHACEAE 9 Tree 3.54
RUBIACEAE 8 Bryophyte 2.57
7.1.1 Vegetation Communities
For a more detailed sampling of the project area, sample points were investigated in various
natural and semi natural habitats of the study area and analysed using TWINSPAN. The
study area was very homogenous in nature, fragmented and largely disturbed through
clearing etc. This made it difficult to use a sampling method that would yield different
communities. The main plant communities were identified based on understory coverage and
disturbances (Table 7-2 and Figure 7-2). These communities were mainly Acacia dominated
Woodlands with associated Wetlands and included: Acacia nigrescens - Grewia Open Veld;
Acacia nigrescens –Combretum apiculatum dominated woodland, Acacia erubescens -
Grewia Thornveld, Disturbed A nigrescens-Dicrostachys-Grewia fragmented Thornveld and
Disturbed Acacia mixed woodland. Associated wetland and hydromorphic areas included the
Acacia dominated Wetland Flats, Depressions and Artificial Waterbodies.
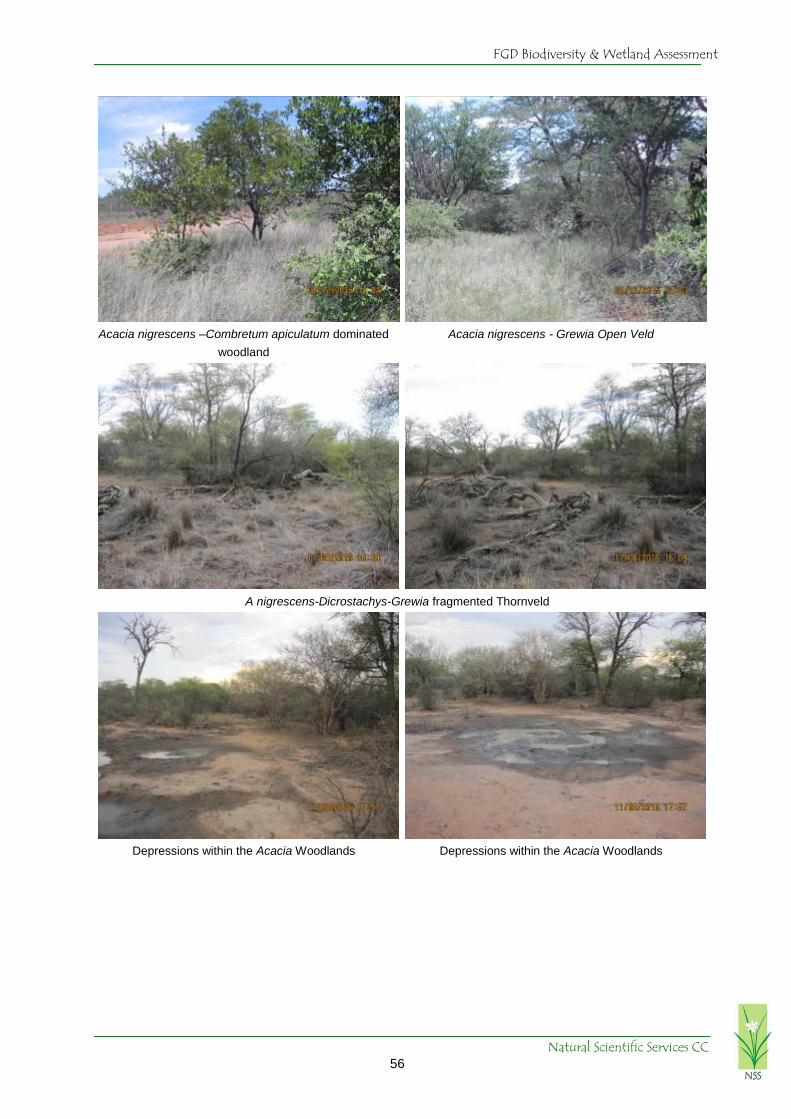
FGD Biodiversity & Wetland Assessment
Natural Scientific Services CC 56
Acacia nigrescens –Combretum apiculatum dominated
woodland
Acacia nigrescens - Grewia Open Veld
A nigrescens-Dicrostachys-Grewia fragmented Thornveld
Depressions within the Acacia Woodlands Depressions within the Acacia Woodlands

FGD Biodiversity & Wetland Assessment
Natural Scientific Services CC 57
Acacia erubescens - Grewia Thornveld Acacia erubescens - Grewia Thornveld
Waterbodies Waterbodies
Acacia mixed woodland Acacia dominated Wetland Flat
Figure 7-1 Photographic representation of the different vegetation found within the study
area
Table 7-2 Vegetation Communities
UNIT HABITAT & VEGETATION COMMUNITIES % COVERAGE
A Main Vegetation Communities – Acacia Woodlands
Acacia nigrescens - Grewia Open Veld 9.19
Acacia nigrescens –Combretum apiculatum dominated woodland 22.87
Acacia erubescens - Grewia Thornveld 2.26

FGD Biodiversity & Wetland Assessment
Natural Scientific Services CC 58
UNIT HABITAT & VEGETATION COMMUNITIES % COVERAGE
B Disturbed Woodlands
A nigrescens-Dicrostachys-Grewia fragmented Thornveld 8.27
Acacia mixed woodland 6.59
C Transformed
Disturbed (previously scraped) 11.47
Cleared areas and stockpiles 14.61
Roads and Storm Water 4.32
Infrastructure 16.21
D Wetland Areas / Hydromorphic Grasslands
Acacia dominated Wetland Flat 3.56
Depressions 0.37
Artificial water points / Waterbodies 0.15
A description and photographic evidence for each main natural vegetation unit is provided in
the Tables below (Table 7-3 to Table 7-7). This excludes depressions (lack of vegetation,
with only occasional hydromorphic species present), waterbodies and transformed areas
such as the alien bushclumps and any agricultural areas. The Acacia dominated Wetland
Flats were situated within the Acacia Woodland Communities and showed limited variation
from the surrounding vegetation other than a denser leaf coverage and height change.
Wetlands constituted over 4% of the study area.
Table 7-3 Acacia nigrescens - Grewia Open Veld Vegetation Description
Acacia nigrescens - Grewia Open Veld
Photographic
representation
National
Zones:
C-Plan Ecological Support Area; Waterberg CBA-Optimal, LC Vegetation Type ; Sweet
Limpopo Bushveld
Sub-
Community A nigrescens-Dicrostachys-Grewia fragmented Thornveld
% Site
Coverage 9.19 % - mainly in the northern region; Fragmented Habitat – 8.27%
Condition:
Limited to no alien encroachment
Quicker establishing grass species – dominated by Increaser 2 and sub-climax
species
CI Species: Sclerocarya birrea (A.Rich.) (PT)
Spirostachys africana Sond. (PT)
Common Abutilon cf austro-africanum Digitaria eriantha Steud.

FGD Biodiversity & Wetland Assessment
Natural Scientific Services CC 59
Acacia nigrescens - Grewia Open Veld
species: Hochr.
Acacia karroo Hayne
Acacia nigrescens Oliv.
Acacia tortilis (Forssk.) Hayne
subsp. heteracantha (Burch.)
Brenan
Agathisanthemum bojeri Klotzsch
subsp. bojeri
Alistilus bechuanicus N.E.Br.
Aristida congesta Roem. & Schult.
subsp. barbicollis (Trin. & Rupr.)
De Winter
Aristida stipitata Hack.
Asparagus cf cooperi Baker
Boscia albitrunca (Burch.) Gilg &
Gilg-Ben.
Chlorophytum recurvifolium
(Baker) C.Archer & Kativu
Clerodendrum ternatum Schinz
Combretum apiculatum Sond.
subsp. apiculatum
Commelina africana L. var.
africana
Commelina benghalensis L.
Cyperus margaritaceus Vahl var.
margaritaceus
Dipcadi viride (L.) Moench
Eragrostis superba Peyr.
Evolvulus alsinoides (L.) L.
Gomphocarpus tomentosus Burch.
subsp. tomentosus
Grewia flavescens Juss.
Grewia monticola Sond.
Heliotropium ciliatum Kaplan
Hermannia spp
Ipomoea bolusiana
Kyllinga alba Nees
Oxygonum dregeanum Meisn.
subsp. canescens (Sond.)
Germish. var. canescens
Panicum maximum Jacq.
Pavonia burchellii
Polygala amatymbica Eckl. &
Zeyh.
Polygala sphenoptera var.
sphenoptera
Schmidtia pappophoroides Steud.
Solanum panduriforme Droge er
Dunal
Stipagrostis uniplumis (Licht.) De
Winter var. uniplumis
Terminalia sericea Burch. er DC.
Species
Examples:
Agathisanthemum bojeri Pavonia burchellii
Current Conservation Status Medium
Current Conservation Status - A nigrescens-Dicrostachys-
Grewia fragmented Thornveld Medium-Low
* Alien Species; *1 Category 1 Alien Invasive; PT: Protected –DAFF;

FGD Biodiversity & Wetland Assessment
Natural Scientific Services CC 60
Table 7-4 Acacia nigrescens –Combretum apiculatum Woodland Vegetation Description
Acacia nigrescens –Combretum apiculatum dominated woodland
Photographic
representation
National
Zones:
C-Plan Critical Biodiverse Area;Ecological Support Area; Waterberg CBA, LC Vegetation
Type; Sweet Limpopo Bushveld
% Site
Coverage 22.87 % - central region
Condition:
Limited to no alien encroachment
Similar species contribution to Acacia nigrescens - Grewia Open Veld
Pioneer to sub-climax species; Increaser 2 species the most common
CI Species: Sclerocarya birrea (A.Rich.) (PT)
Common
species:
Abutilon cf austro-africanum
Hochr.
Acacia erubescens Welw. er Oliv.
Acacia nigrescens Oliv.
Acacia tortilis (Forssk.) Hayne
subsp. heteracantha (Burch.)
Brenan
Agathisanthemum bojeri Klotzsch
subsp. bojeri
Aristida congesta Roem. & Schult.
subsp. barbicollis (Trin. & Rupr.)
De Winter
Aristida congesta Roem. & Schult.
subsp. congesta
Aristida stipitata Hack.
Asparagus cf cooperi Baker
Boscia albitrunca (Burch.) Gilg &
Gilg-Ben.
Cenchrus ciliaris L.
Combretum apiculatum Sond.
subsp. apiculatum
Cyperus margaritaceus Vahl var.
margaritaceus
Eragrostis superba Peyr.
Evolvulus alsinoides (L.) L.
Gomphocarpus tomentosus Burch.
subsp. tomentosus
Grewia flavescens Juss.
Grewia monticola Sond.
Kyllinga alba Nees
Oxygonum dregeanum Meisn.
subsp. canescens (Sond.)
Germish. var. canescens
Panicum maximum Jacq.
Polygala sphenoptera var.
sphenoptera
Schmidtia pappophoroides Steud.
Sida ovata Forssk.
Solanum panduriforme Droge er
Dunal
Stipagrostis uniplumis (Licht.) De
Winter var. uniplumis

FGD Biodiversity & Wetland Assessment
Natural Scientific Services CC 61
Acacia nigrescens –Combretum apiculatum dominated woodland
Commelina africana var. africana
Species
Examples:
Polygala sphenoptera var. sphenoptera Gomphocarpus tomentosus
Current Conservation Status Medium
Table 7-5 Acacia erubescens - Grewia Thornveld Vegetation Description
Acacia erubescens - Grewia Thornveld
Photographic
representation
National
Zones:
Sandloop FEPA, C-Plan Critical Biodiverse Area; Waterberg CBA; LC Vegetation Type ;
Sweet Limpopo Bushveld
% Site
Coverage 2.26 % - western section
Condition:
Limited to no alien encroachment
Limited herbacous and grass cover present (even during the mid-summer
sampling months)
CI Species: Ammocharis coranica (P)
Common
species:
Acacia erubescens
Acacia karroo Hayne
Acacia nigrescens Oliv.
Acacia tortilis (Forssk.) Hayne
subsp. heteracantha (Burch.)
Brenan
Aristida congesta Roem. & Schult.
subsp. barbicollis (Trin. & Rupr.)
De Winter
Aristida stipitata Hack.
Asparagus spp
Evolvulus alsinoides (L.)
Eragrostis spp
Grewia flava.
Heliotropium ciliatum Kaplan
Hermannia spp
Ipomoea bolusiana
Kyllinga alba Nees
Oxygonum dregeanum Meisn.
Panicum maximum Jacq.
Pavonia burchellii
Polygala amatymbica Eckl. &

FGD Biodiversity & Wetland Assessment
Natural Scientific Services CC 62
Acacia erubescens - Grewia Thornveld
Chlorophytum recurvifolium
(Baker) C.Archer & Kativu
Clerodendrum ternatum Schinz
Commelina africana L. var.
africana
Digitaria eriantha Steud.
Eragrostis superba Peyr.
Zeyh.
Schmidtia pappophoroides Steud.
Solanum panduriforme Droge er
Dunal
Stipagrostis uniplumis (Licht.) De
Winter var. uniplumis
Terminalia sericea Burch. er DC.
Species
Examples:
Ammocharis coránica flowers Ammocharis coránica leaves
Current Conservation Status Medium
* Alien Species; *1 Category 1 Alien Invasive; P: Protected under the ordinance;
Table 7-6 Acacia Mixed Woodland Vegetation Description
Acacia mixed woodland
Photographic
representation
National
Zones: C-Plan Ecological Support Area; LC Vegetation Type; Sweet Limpopo Bushveld
% Site
Coverage 6.59% - eastern and southern region
Condition:
Alien encroachment evident, specifically weedy species such as Gomphrena
present
Very fragmented habitat
Quicker establishing grass species – dominated by Increaser 2 and sub-climax
species
CI Species: Sclerocarya birrea (A.Rich.) (PT)
Common
species:
Acacia erubescens Welw. er Oliv.
Acacia karroo Hayne
Evolvulus alsinoides (L.) L.
Gomphocarpus tomentosus Burch.

FGD Biodiversity & Wetland Assessment
Natural Scientific Services CC 63
Acacia mixed woodland
Acacia mellifera (Vahl) Benth.
subsp. detinens (Burch.) Brenan
Acacia nigrescens Oliv.
Acacia tortilis (Forssk.) Hayne
subsp. heteracantha (Burch.)
Brenan
Aristida congesta Roem. & Schult.
subsp. congesta
Aristida stipitata Hack.
Cenchrus ciliaris L.
Chenopodium album L.*
Combretum apiculatum Sond.
subsp. apiculatum
Commelina africana L. var.
africana
Commelina benghalensis L.
Conyza bonariensis (L.)Cronquist*
Dichrostachys cinerea (L.) Wight &
Arn. subsp. africana Brenan &
Brummitt var. africana
Eragrostis superba Peyr.
subsp. tomentosus
Gomphrena celosioides Mart.*
Grewia flavescens Juss.
Grewia monticola Sond.
Ipomoea bolusiana
Kyllinga alba Nees
Melinis repens (Willd.) Zizka
subsp. grandiflora (Hochst.) Zizka
Monsonia glauca R.Knuth
Panicum maximum Jacq.
Pavonia burchellii
Peltophorum africanum Sond.
Schmidtia pappophoroides Steud.
Sclerocarya birrea (A.Rich.)
Hochst. subsp. caffra (Sond.)
Kokwaro
Sida ovata Forssk.
Solanum panduriforme Droge er
Dunal
Stipagrostis uniplumis (Licht.) De
Winter var. uniplumis
Terminalia sericea Burch. er DC.
Species
Examples:
Terminalia sericea Justica flava
Current Conservation Status Medium-Low

FGD Biodiversity & Wetland Assessment
Natural Scientific Services CC 64
Table 7-7 Transformed Areas
Transformed Areas
Photographic
representation
National
Zones: C-Plan Ecological Support Area; LC Vegetation Type; Sweet Limpopo Bushveld
% Site
Coverage 46.61% but constantly increasing due to the construction of the ADF and coal stockyard
Condition:
Alien species scattered throughout these areas
Very fragmented habitat
Dominated by Pioneer, Increaser 2 and sub-climax species
CI Species: Sclerocarya birrea (A.Rich.) (PT)
Common
species:
Acacia karroo Hayne
Achyranthes aspera
Aristida congesta Roem. & Schult.
subsp. congesta
Cenchrus ciliaris L.
Chenopodium album L.
Commelina benghalensis L.
Conyza bonariensis (L.) Cronquist
Dichrostachys cinerea (L.) Wight &
Arn. subsp. africana Brenan &
Brummitt var. africana
Gomphocarpus tomentosus Burch.
subsp. tomentosus
Gomphrena celosioides Mart.
Melinis repens (Willd.) Zizka
subsp. grandiflora (Hochst.) Zizka
Monsonia glauca R.Knuth
Nicotiana glauca
Nidorella resedifolia DC. subsp.
resedifolia
Sida ovata Forssk.
Solanum panduriforme Droge er
Dunal
Urochloa brachyura (Hack.) Stapf
Verbesina encelioides
Xanthium strumarium L.
Species
Examples:
Dactyloctenium aegyptium Monsonia cf angustifolia
Current Conservation Status Low
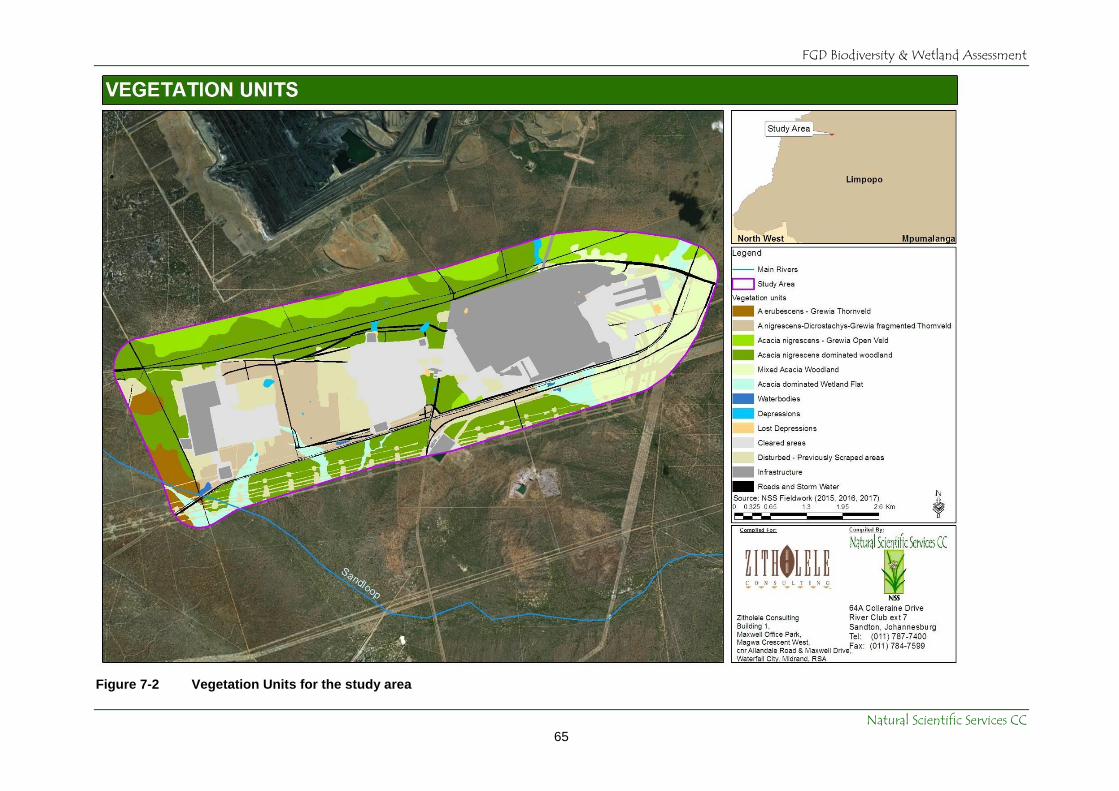
FGD Biodiversity & Wetland Assessment
Natural Scientific Services CC 65
Figure 7-2 Vegetation Units for the study area

FGD Biodiversity & Wetland Assessment
Natural Scientific Services CC 66
7.1.2 Conservation Important (CI) species
It is well documented that heterogeneous landscapes, diverse geology and a range of
environmental conditions, provide a diverse number of habitats for plant species (Pickett, et.al.
1997; O’Farrell, 2006; KNNCS, 1999). These areas are normally associated with high levels of
species endemism and richness. For example, at least 74% of the 23 threatened Highveld plant
taxa occur on the crests and slopes of ridges and hills (Pfab & Victor 2002). However, homogenous
landscapes, either natural or that have been transformed through historical farming practices and
infrastructural development contain minimal diversity and endemism. The FDG Study Area is
situated in an area that is both natural and modified through soil stockpiling, fragmentation and
clearing for construction of the ADF and MPS associated infrastructure. The remaining fragmented
natural areas largely consist of Acacia woodland habitat that is homogenous in nature.
The Threatened Plant Species Programme (TSP) is an ongoing assessment that revises all
threatened plant species assessments made by Craig Hilton-Taylor (1996), using IUCN Red Listing
Criteria modified from Davis et al. (1986). According to the TSP Red Data list of South African plant
taxa (POSA, March 2015), there are 212 Red Data listed species (Table 7-8) within Limpopo
Province (including Data Deficient species) of which 14 species are Critically Endangered (CR), 17
Endangered (EN) and 40 are Vulnerable (VU).
Table 7-8 Numbers of conservation important plant species per Red Data category within South
Africa and Limpopo
Threat Status South Africa Limpopo 2327DA
EX (Extinct) 28 0 0
EW (Extinct in the wild) 7 2 0
CR PE (Critically Endangered, Possibly Extinct) 57 2 0
CR (Critically Endangered) 332 14 0
EN (Endangered) 716 17 0
VU (Vulnerable) 1 217 40 0
NT (Near Threatened) 402 21 1
Critically Rare (known to occur only at a single site) 153 5 0
Rare (Limited population but not exposed to any direct or
potential threat) 1 212 45 1
Declining (not threatened but processes are causing a
continuing decline in the population) 47 19 0
LC (Least Concern) 13 856 3598 287
DDD (Data Deficient - Insufficient Information) 348 13 0
DDT (Data Deficient - Taxonomically Problematic) 904 34 1
Total spp. (including those not evaluated) 23 399 4799 311
**POSA last updated in 2012 – data may be out of date
From the POSA website (QDS 2327DA) and the data supplied by Limpopo for the surrounding
farms, 3 CI species have been recorded in the region. The most threatened species recorded within
the QDS is the Eulalia aurea, which is listed as Near Threatened. However, habitat availability for

FGD Biodiversity & Wetland Assessment
Natural Scientific Services CC 67
this species is unlikely. Corchorus psammophilus could occur on site based on its habitat
requirements. The conservation status of these species and others, their habitat preferences and
the possibility of occurring on site has been provided in Table 8.2 below. Although no Red Listed
species were recorded, Ammocharis coranica and Crinum buphanoides were considered a
Protected species under the Nature Conservation Ordinance, 12 of 1983, before Limpopo Province
released more recent legislation [which repeals the Ordinance] -
Limpopo Environmental Management Act NO. 7 OF 2003, the Protected Status of these species
were revised and are no longer on the list.
Government Notice 39433 of 2015 provides the latest List of Protected Tree Species within the
borders of South Africa under the NFA. A number of CI Protected Tree species were located during
this study. Those found are represented in Figure 7-3 and Table 7-9.
Boscia albitrunca (Burch.) Gilg & Gilg-Ben.
Sclerocarya birrea (A.Rich.) Hochst. subsp. caffra (Sond.) Kokwaro
Spirostachys africana Sond.
Boscia albitrunca (Burch.) Gilg & Gilg-Ben and Sclerocarya birrea are both Keystone species.
Further information on these species and their importance is provided in Section 9.1.5 below. In
terms of Section 15(1) of the National Forests Act (NFA; Act 84 of 1998) forest trees or Protected
Tree Species may not be cut, disturbed, damaged, destroyed and their products may not be
possessed, collected, removed, transported, exported, donated, purchased or sold – except under
license granted by the Department of Agriculture, Forestry and Fisheries (DAFF) or a delegated
authority.
Table 7-9 Species recorded in the surrounding farms QDG (PRECIS Data)
Family Species Threat status Habitat LoO
EUPHORBIACEAE Acalypha caperonioides Baill. var. caperonioides DDT
In grassland, Brachystegia woodland and at margins of vleis, typically after grass fires. Unlikely
POACEAE Eulalia aurea (Bory) Kunth NT
In water, along rivers and in occasionally inundated soils. Unlikely
EUPHORBIACEAE Euphorbia waterbergensis R.A.Dyer Rare
Quartzite ridges and outcrops, mixed bushveld, 900-1100 m. Unlikely
MALVACEAE Corchorus psammophilus Codd Threatened Sandy flats in open Terminalia sericea veld. Possible
NT = Near Threatened; DDT= Data Deficient Taxonomically; P = Protected Limpopo

FGD Biodiversity & Wetland Assessment
Natural Scientific Services CC 68
Spirostachys africana bark Spirostachys africana leaves
Boscia creating habitat and shade for numerous faunal species Sclerocarya birrea- Fruit
Figure 7-3 Examples of the CI species located within the study area
FGD Biodiversity & Wetland Assessment
Natural Scientific Services CC 69
7.1.3 Local Disturbances
Alien species, especially invasive species, are a major threat to the ecological functioning of
natural systems and to the productive use of land. These plants can have the following
negative impacts on our natural systems:
A loss of biodiversity and ecosystem resilience as alien species out-compete
indigenous flora and in doing so reduce complex ecosystems to mono-cultures
therefore destroying habitats for both plant and animals;
Through increased evaporative transpiration rates ‘alien thickets’, reduce the amount
of groundwater thus reducing the volume of water entering our river systems;
Alien invasive species dry out wetlands and riparian areas thereby increasing the
potential for erosion in these areas;
The loss of potentially productive land, and the loss of grazing potential and livestock
production;
Poisoning of humans and livestock;
An increase in the cost of fire protection and damage in wildfires due to alien invasive
stands being denser than natural vegetation and the wood more resinous, creating
hotter fires;
An increased level of erosion, following fires in heavily invaded areas, as well as the
siltation of dams.
Two main pieces of legislation are applicable to this section:
Conservation of Agriculture Resources Act, 1983 (Act No. 43 of 1983) (CARA)
National Environmental Management: Biodiversity Act, 2004 (Act 10 of 2004)
(NEM:BA)
o NEM:BA Regulations August 2014 -Government Gazette Vol 526, No. 32090
In terms of the amendments to the regulations under CARA, landowners are legally
responsible for the control of alien species on their properties. Declared weeds and invasive
species had been divided into three categories in accordance with the Act.
These categories are as follows:
Category 1: Declared weeds that are prohibited on any land or water surface in South
Africa. These species must be controlled, or eradicated where possible.
Category 2: Declared invader species that are only allowed in demarcated areas under
controlled conditions and prohibited within 30m of the 1:50 year flood line of any
watercourse or wetland.
Category 3: Declared invader species that may remain, but must be prevented from
spreading. No further planting of these species are allowed.
The protection of our natural systems from invasive species is further strengthened within
Sections 70-77 of NEMBA. Chapter 5 of this Act specifically deals with Species and

FGD Biodiversity & Wetland Assessment
Natural Scientific Services CC 70
Organisms Posing Potential Threats to Biodiversity. To summarise, the purpose of Chapter 5
is to:
Prevent the unauthorised introduction and spread of alien species and invasive
species to ecosystems and habitats where they do not naturally occur.
To manage and control alien species and invasive species to prevent or minimise
harm to the environment and to biodiversity in particular.
To eradicate alien species and invasive species from ecosystems and habitats where
they may harm such ecosystems or habitats.
Furthermore Section 73 (2) states that a person who is the owner of land on which a listed
invasive species occurs must:
Notify any relevant competent authority, in writing, of the listed invasive species
occurring on that land;
Take steps to control and eradicate the listed invasive species and to prevent it from
spreading; and
Take all the required steps to prevent or minimise negative impacts to biodiversity.
The regulations for this Act were issued for public comment on 3 April 2009 (Government
Gazette Vol. 526, No. 32090) and promulgated in August 2014 (Government Gazette Vol.
590, No. 37885). The regulations list the categories for alien and listed invasive species.
These are:
Exempted species.
Category 1a Listed Invasive Species -Species requiring compulsory control.
Category 1b Listed Invasive Species - Invasive species controlled by an invasive
species management programme.
Category 2 Listed Invasive Species- Invasive species controlled by area (2).
Category 3 Listed Invasive Species - Invasive species controlled by activity (3).
An updated set of Invasive Species Lists (as per the NEMBA Regulations) were published on
29 July 2016. This legislation became law on 1 October 2016 and replaced any earlier lists.
Note: A species may be listed in different categories for different parts of the country.
According to POSA, over 55 species of Aliens have been recorded within the QDS. Of these
8 species are considered Category 1b species under NEMBA and must be controlled from
any property on which they are found (i.e. an invasive species management programme
needs to be in place). Patches of natural areas remain within the study area, specifically
within the western section and therefore alien species did not completely dominate the
landscape. Category 1 species that were identified on site occurred within the soil stockpile
areas and included species such as Nicotiana glauca and Xanthium strumarium. (Figure 7-4
and Table 7-10). These species will need to be controlled by the EO and team as part of
MPS’s management plan. A list of the main species recorded is supplied in Table 7-10.

FGD Biodiversity & Wetland Assessment
Natural Scientific Services CC 71
Table 7-10 Main Alien Invasive Species found within the Study Area
FAMILY SPECIES GROWTH FORMS CARA NEMBA
AMARANTHACEAE Gomphrena celosioides Mart. Herb Weed Weed
ASTERACEAE Conyza cf. bonariensis (L.) Cronquist Herb Weed Weed
AMARANTHACEAE Achyranthes aspera Herb 1
ASTERACEAE Xanthium strumarium L. Herb 1 1b
ASTERACEAE Verbesina encelioides Herb/shrub Weed Weed
CHENOPODIACEAE Chenopodium album L. Herb Weed Weed
SOLANACEAE Nicotiana glauca Shrub, tree 1 1b
VERBENACEAE Verbena cf bonariensis Herb 1b
* Highlights in green represent Category 1 species through either CARA or NEMBA
One species that was prolific in the soil stockpile areas close to the MPS was Golden
crownbeard, (Verbesina encelioides). This species is part of the Asteraceae family from
North America to the tropics and is an annual flowering shrub. As an invasive weed, it grows
aggressively in stands within sandy soils, shading out indigenous vegetation, competing for
nutrients and water as well as producing chemicals that are toxic to indigenous plants.
Flowers produce up to 350 wind dispersed seeds by both cross- and self-pollination and
stands self-seed annually. The seeds exhibit highest rate of germination in open, disturbed
areas with sandy soils.
Conyza bonariensis Achyranthes aspera
Nicotiana glauca Nicotiana glauca in transformed area

FGD Biodiversity & Wetland Assessment
Natural Scientific Services CC 72
Gomphrena celosioides Verbesina encelioides
Figure 7-4 Evidence of Alien species found within the study area
7.2. Faunal Communities
NSS surveys in and around the FGD study area yielded 43 mammal, 158 birds, 20 reptile, 16
frog, nine butterfly, two dragonfly and one scorpion species, greatly contributing to the overall
Medupi inventory. Context for these figures is provided in Table 7-11 which gives a
comparison of the observed species richness, with that expected at both local and regional
scales. From Table 7-11 it is evident that remaining natural and semi-natural areas in and
around Medupi support a considerable proportion of the region’s faunal diversity. Lists of
potentially occurring faunal species are provided in Appendices 2-9, and the bat call data
are presented in Appendix 9. Examples of some of the observed species are shown in
Figure 7-6 to Figure 7-11.
Table 7-11 Summary of faunal species richness in the study area as compared to a
regional scale
FAUNAL GROUP
SPECIES RICHNESS
POTENTIAL OBSERVED
RE
GIO
N1
QD
S2
ME
DU
PI3
BE
C
(2006)
FG
D
ME
DU
PI
VIC
INIT
Y4
Mammals 124 41 89 18 43 47 54
Birds 345 314 304 67 158 183 211
Reptiles 96 83 47 7 20 20 46
Frogs 27 22 20 8 16 19 14
Butterflies 176 149 88 3 9 26 15
Dragonflies & Damselflies 66 66 48 0 2 3 1
Scorpions 11 11 11 0 1 1 2
Megalomorph Spiders 4 4 2 0 0 0 1
KEY 1Species recorded during atlas projects within the four regional QDSs 2327CB, 2327DA, 2327CD & 2327DC
2Species that have been recorded during atlas projects within the QDS 2327DA wherein Medupi is situated
3Species that are likely to occur (LoO of 2 or 3) in Medupi
4Species recorded during NSS studies in the vicinity: Grootegeluk and Limpopo West Mines, Mafutha Project and Matimba
Power Station

FGD Biodiversity & Wetland Assessment
Natural Scientific Services CC 73
Figure 7-5 Localities of Conservation Important Fauna

FGD Biodiversity & Wetland Assessment
Natural Scientific Services CC 74
Notable faunal observations in and around the FGD study area included Serval (NT), Brown
Hyaena (NT), White-backed Vulture (EN), Tawny Eagle (VU) and Red-billed Oxpecker (NT),
African Bullfrog (PS) and Giant Bullfrog (NT), and also an out of range observation of
Sanderling (nearest SABAP 2 record 190km east near Polokwane), and a 300km westwards
range extension on Green House Bat (Scotophilus viridis) based on recorded bat call data.
Local farmers reported the presence Leopard (VU), Cheetah (VU), African Wild Dog (EN),
Spotted Hyaena (NT) and Pangolin (VU) as well as Southern African Python (PS) and Nile
Crocodile (EN, now absent). African Bullfrogs were found to be particularly abundant in the
more natural areas in and near the southern section of Medupi, where there are a number of
breeding sites for this species. As both bullfrog species appear to utilize the same type of
breeding habitat (Du Preez & Carruthers, 2009), this area and its pans might also provide
suitable breeding habitat for Giant Bullfrog. However, only a dam along the southern
boundary of the ADF yielded potential signs of this species in the form of a single froglet.
7.2.1 Mammals
Of the approximately 124 regionally-occurring mammal species some 89 species (with a LoO
of 1, 2 or 3 in Appendix 2) are considered likely to occur, based on the species’ known
distributions and the diversity of available habitats where natural and semi-natural areas
remain in and around the southern section of Medupi. MammalMap (2018) has records for
41 species from the four regional QDSs. To date a total of 43 mammal species (36 observed,
seven anecdotal) has been recorded in the FGD study area (47 species for the greater
Medupi premises). On a regional scale 18 Conservation Important (CI) mammal species
occur naturally (i.e. excluding managed game species). Of these, eight are likely to occur in
the study area, one of which was recorded on site, i.e. Serval (NT; Figure 7-5).
The sandy substrates of the Limpopo Sweet Bushveld provide suitable habitat for the VU
Pangolin and a host of CI carnivores. Observed species included Serval (NT) on the ADF
site and Brown Hyaena (NT) further to the south-west. Local farmers reported the presence
of illusive species such as Leopard (VU), Cheetah (VU), Spotted Hyaena (NT; captured on
NSS motion camera but image is poor quality), Pangolin (VU) and African Wild Dog (EN).
These are wide ranging, free-roaming species whose persistence in the region is threatened
by persecution and structures that fragment their habitat and restrict their movement such as
fences (electric and Bonnox), roads and mines. Other carnivore species which may occur
include Black-footed Cat (VU), African Weasel (NT), Honey Badger (PS) and Cape Fox (PS).

FGD Biodiversity & Wetland Assessment
Natural Scientific Services CC 75
Serval
(Leptailurus serval)
Caracal
(Caracal caracal)
Black-backed Jackal
(Canis mesomelas)
Black-backed Jackal with
prey
African Civet
(Civettictis civetta)
Aardwolf
(Proteles cristatus)
Slender Mongoose
(Galerella sanguinea)
Warthog
(Phacochoerus africanus)
Giraffe
(Giraffa camelopardalis)
Plains Zebra
(Equus quagga)
Blue Wildebeest
(Connochaetes taurinus)
Kudu
(Tragelaphus strepsiceros)
Waterbuck
(Kobus ellipsiprymnus)
Impala
(Aepyceros melampus)
Common Duiker
(Sylvicapra grimmia)
Grey Rhebok
(Pelea capreolus)
Gemsbok
(Oryx gazelle)
Tree Squirrel
(Paraxerus cepapi)
Chacma Baboon
(Papio ursinus)
Aardvark
(Orycteropus afer)
Figure 7-6 Examples of some of the mammal species detected in the study area

FGD Biodiversity & Wetland Assessment
Natural Scientific Services CC 76
Juliana's Golden Mole (EN), which has a very small and fragmented distribution, mainly
between Pretoria and Polokwane, is considered highly unlikely to occur in Medupi. Three
elephant shrew species may occur sympatrically in the area, but can be distinguished by
habitat preference and size. Rock Elephant-shrew is restricted to rocky substrates, whereas
the Bushveld (length 24 cm; mass 50 g) and Short-snouted (length 21 cm; mass 44 g)
elephant-shrews occur in sandy substrates (Stuart & Stuart, 2007). Other insectivores that
may occur in sandy habitats include the Reddish-grey and Lesser musk shrews, as well as
Southern African Hedgehog (NT).
Table 7-12 Present and potentially occurring CI mammal species
ORDER & SPECIES COMMON NAME
CONSERVATION STATUS
Lo
O I
N F
GD
1,3
,5,6
ME
DU
PI*
VIC
INIT
Y**
AT
LA
S6
GLOBAL RED LIST
1
S.A. RED LIST
2,3
S.A. TOPS LIST
4
AFROSORICIDA (Golden moles)
Neamblysomus julianae Juliana's Golden Mole EN (U) EN VU 4
EULIPOTYPHLA (Hedgehogs & shrews)
Atelerix frontalis Southern African Hedgehog LC (S) NT PS 3
CHIROPTERA (Bats)
Cloeotis percivali Percival's Short-eared Trident Bat LC (U) EN - 4
PHOLIDOTA (Pangolin)
Manis temminckii Pangolin VU (D) VU VU 4 x x
RODENTIA (Rodents)
Dasymys incomtus Water Rat LC (U) NT - 4
CARNIVORA (Carnivores)
Crocuta crocuta Spotted Hyaena LC (D) NT PS 4
Hyaena brunnea Brown hyaena NT (S) NT PS 3 x x x
Acinonyx jubatus Cheetah VU (D) VU VU 4 x x
Panthera pardus Leopard VU (D) VU VU 3 x x x
Panthera leo Lion VU (D) VU VU 5
Felis nigripes Black-footed Cat VU (D) VU PS 4
Leptailurus serval Serval LC (S) NT PS 1 x
Lycaon pictus African Wild Dog EN (D) EN EN 4 x
Vulpes chama Cape Fox LC (S) LC PS 3
Mellivora capensis Honey Badger LC (D) LC PS 3 x
Poecilogale albinucha African Weasel LC (U) NT - 2
PROBOSCIDEA (Elephant)
Loxodonta africana African Elephant VU (I) LC PS 5
PERISSODACTYLA (Zebras)
Ceratotherium simum White Rhinoceros NT (I) NT PS 5 x x
Diceros bicornis Black Rhinoceros CR (I) EN EN 5
RUMINATA (Even-toed ungulates)
Connochaetes gnou Black Wildebeest LC (I) LC PS 5
Damaliscus lunatus Tsessebe LC (D) VU EN 5 x x
Hippotragus equinus Roan LC (D) EN VU 5
Hippotragus niger Sable LC (S) VU - 5 x
Redunca arundinum Reedbuck LC (S) LC PS 4 x
Redunca fulvorufula Mountain Reedbuck EN (D) EN - 4 x
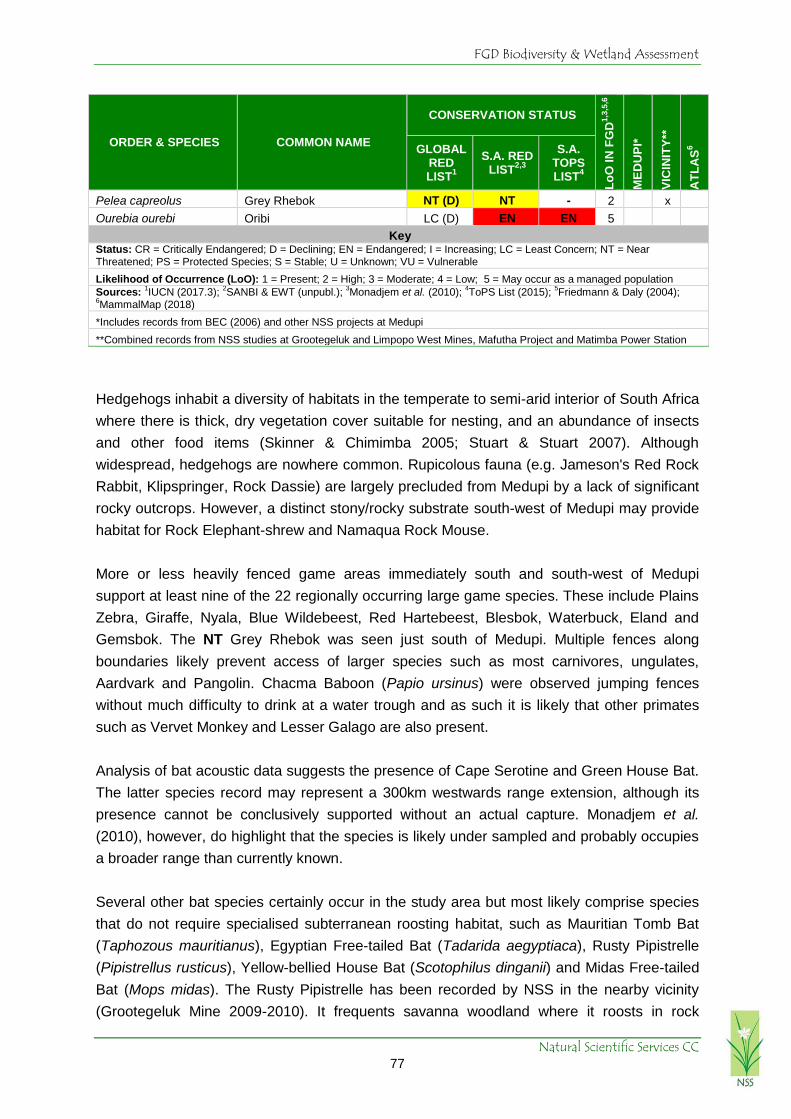
FGD Biodiversity & Wetland Assessment
Natural Scientific Services CC 77
ORDER & SPECIES COMMON NAME
CONSERVATION STATUS
Lo
O I
N F
GD
1,3
,5,6
ME
DU
PI*
VIC
INIT
Y**
AT
LA
S6
GLOBAL RED LIST
1
S.A. RED LIST
2,3
S.A. TOPS LIST
4
Pelea capreolus Grey Rhebok NT (D) NT - 2 x
Ourebia ourebi Oribi LC (D) EN EN 5
Key Status: CR = Critically Endangered; D = Declining; EN = Endangered; I = Increasing; LC = Least Concern; NT = Near Threatened; PS = Protected Species; S = Stable; U = Unknown; VU = Vulnerable
Likelihood of Occurrence (LoO): 1 = Present; 2 = High; 3 = Moderate; 4 = Low; 5 = May occur as a managed population
Sources: 1IUCN (2017.3);
2SANBI & EWT (unpubl.);
3Monadjem et al. (2010);
4ToPS List (2015);
5Friedmann & Daly (2004);
6MammalMap (2018)
*Includes records from BEC (2006) and other NSS projects at Medupi
**Combined records from NSS studies at Grootegeluk and Limpopo West Mines, Mafutha Project and Matimba Power Station
Hedgehogs inhabit a diversity of habitats in the temperate to semi-arid interior of South Africa
where there is thick, dry vegetation cover suitable for nesting, and an abundance of insects
and other food items (Skinner & Chimimba 2005; Stuart & Stuart 2007). Although
widespread, hedgehogs are nowhere common. Rupicolous fauna (e.g. Jameson's Red Rock
Rabbit, Klipspringer, Rock Dassie) are largely precluded from Medupi by a lack of significant
rocky outcrops. However, a distinct stony/rocky substrate south-west of Medupi may provide
habitat for Rock Elephant-shrew and Namaqua Rock Mouse.
More or less heavily fenced game areas immediately south and south-west of Medupi
support at least nine of the 22 regionally occurring large game species. These include Plains
Zebra, Giraffe, Nyala, Blue Wildebeest, Red Hartebeest, Blesbok, Waterbuck, Eland and
Gemsbok. The NT Grey Rhebok was seen just south of Medupi. Multiple fences along
boundaries likely prevent access of larger species such as most carnivores, ungulates,
Aardvark and Pangolin. Chacma Baboon (Papio ursinus) were observed jumping fences
without much difficulty to drink at a water trough and as such it is likely that other primates
such as Vervet Monkey and Lesser Galago are also present.
Analysis of bat acoustic data suggests the presence of Cape Serotine and Green House Bat.
The latter species record may represent a 300km westwards range extension, although its
presence cannot be conclusively supported without an actual capture. Monadjem et al.
(2010), however, do highlight that the species is likely under sampled and probably occupies
a broader range than currently known.
Several other bat species certainly occur in the study area but most likely comprise species
that do not require specialised subterranean roosting habitat, such as Mauritian Tomb Bat
(Taphozous mauritianus), Egyptian Free-tailed Bat (Tadarida aegyptiaca), Rusty Pipistrelle
(Pipistrellus rusticus), Yellow-bellied House Bat (Scotophilus dinganii) and Midas Free-tailed
Bat (Mops midas). The Rusty Pipistrelle has been recorded by NSS in the nearby vicinity
(Grootegeluk Mine 2009-2010). It frequents savanna woodland where it roosts in rock

FGD Biodiversity & Wetland Assessment
Natural Scientific Services CC 78
crevices and under tree bark (Stuart & Stuart, 2007). Smither’s, Geoffroy's, Darling's and
Bushveld horseshoe bats may occur based on distribution. However, their preferred roosting
habitat in the form of subterranean caves or mine shafts is distinctly lacking (although it
should be noted that all of these species have, occasionally, been known to roost in trees or
buildings and as such their presence in Medupi, albeit low, cannot be ruled out). Little is
known regarding the ecology of the Botswana Long-eared Bat (Laephotis botswanae) which
may occur.
7.2.2 Birds
Of the approximately 345 regionally-occurring bird species some 304 species (with a LoO of
1, 2 or 3 in Appendix 3) are considered likely to occur, based on the species’ known
distributions and the diversity of available habitats within the FGD study area and greater
Medupi. A total of 314 species was recorded in QDSs 2327CB and 2327DA and pentads
2340_2730 and 2340_2725 covering the study area during the SABAP1 (310 spp.) and 2
(218 spp.), respectively.
To date, NSS has detected 158 bird species in and near the FGD study area (183 from all
studies for the greater Medupi). Of the 20 regionally occurring CI bird species, eight are likely
to occur within the study area (Table 7-14), two of which were found to be present namely
White-backed Vulture (EN) and Tawny Eagle (EN).
A single White-backed Vulture (EN) was observed flying high near the southern boundary of
Medupi. A key aspect in designation of the area south of Medupi as a CBA1 in the Limpopo
C-Plan is said to be its importance with regards to this species (LEDET pers. comm.). White-
backed Vultures are generally associated with dry woodland and tall trees, which they are
dependent upon for breeding. Although no nests were detected within the boundaries of
Medupi, trees suitable for nesting (in terms of height, structure and species) do occur to the
south and south-west. The species constructs large stick nests at the tops of tall trees (>5 m)
particularly Terminalia prunoides, Acacia nigrescens, Boscia albitrunca and B. foetida,
normally nesting in small colonies of two to six pairs. The total population of White-backed
Vulture is estimated at less than 10 000 individuals and is in decline. The greatest threats
include a loss of habitat and decreased food availability. Collision, electrocution, poisoning
and drowning also threaten this species (Barnes, 2000).
Tawny Eagle (EN) was observed where the ADF is located. The species inhabits mostly
wooded to lightly wooded areas but is generally scarce outside of major reserves. This once
widespread raptor has suffered major range contractions having lost as much as 20% of its
regional population in recent years. Currently there are probably less than 800 pairs in South
Africa making it one of the most threatened eagles in the country. The fact that this species
may occasionally scavenge makes it particularly susceptible to poisoning. Additionally, the
species suffers from persecution mainly through shooting and gin traps but drowning in
sheer-walled water reservoirs accounts for many deaths too. Other threats include collision

FGD Biodiversity & Wetland Assessment
Natural Scientific Services CC 79
and electrocution with transmission lines, roadkill and reduction in prey base due to habitat
transformation (Barnes, 2000).
Although no longer Red Listed (Taylor et al. 2015), it is still worth mentioning that Red-billed
Oxpeckers were observed to the south and south-west of Medupi. Although formerly
widespread these birds suffered local population declines particularly in the Eastern Cape
and Pilanesberg National Park as a result of hunting of game and the use of arsenic-based
‘purple label’ cattle dips which poison both ticks and oxpeckers. More recent ongoing re-
introductions and the use of oxpecker-friendly green-label dips, together with the oxpecker’s
adaptability to feed on domestic livestock, are bringing them back from localised extinctions
(Barnes, 2000).
Other potentially occurring avifaunal CI species recorded during NSS studies in the vicinity
include the EN Cape and Lappet-faced Vultures (motion camera at carcass, Mafutha Project,
pentad 2340_2705, farm Geelbuilt), the VU Greater Painted-snipe (nomadic, locally scarce
species with a highly fragmented population; detected twice at Matimba Power Station during
summer, pentads 2335_2735 and 2340_2735), the NT Kori Bustard (uncommon resident
especially outside reserves; motion camera, Mafutha Project, pentad 2340_2705, farm
Geelbuilt), NT European Roller (nonbreeding Palaearctic migrant; Mafutha Project
2340_2720) and NT Short-clawed Lark (uncommon resident; Mafutha Project, pentad
2340_2705, farm Geelbuilt).
European Bee-eater
(Merops apiaster)
Barred Wren-warbler
(Calamonastes fasciolatus)
Pied Crow
(Corvus albus)
Brown-hooded Kingfisher
(Halcyon albiventris)
Red-billed Oxpecker
(Buphagus erythrorhynchus)
Rufous-cheeked Nightjar
(Caprimulgus rufigena)
Swainson's Spurfowl
(Francolinus swainsonii)
Tawny Eagle
(Aquila rapax)

FGD Biodiversity & Wetland Assessment
Natural Scientific Services CC 80
Pearl-spotted Owlet
(Glaucidium perlatum)
Southern Pied-babbler
(Turdoides bicolor)
Spotted Eagle-owl
(Bubo africanus)
Barn Swallow
(Hirundo rustica)
Figure 7-7 Examples of some of the bird species detected in the study area
Provided in Figure 7-8 is a comparison of the numbers of bird species with different feeding
habits, which are listed for pentads 2340_2725 and 2340_2730 (SABAP 2, 2018), and which
have been recorded in Medupi by NSS and BEC (2006). Species were categorized
according to a modified version of Newman’s (2002) 12 bird categories (Table 7-13).
Table 7-13 Newman’s (2002) modified bird categories
CATEGORY DESCRIPTION
1. Ocean birds Albatrosses, gannets/boobies, gulls, penguins, petrels, prions, shearwaters,
skimmer, skuas, subAntartctic birds, terns, & tropic-/frigatebirds.
2. Inland water birds Pelicans, cormorants, herons, egrets, storks, hamerkop, flamingos, spoonbill,
ibises & finfoot.
3. Ducks & wading birds Ducks, geese, grebes, coot, gallinules, crakes, flufftails, snipes, plovers,
lapwings, waders, jacanas, oystercatchers, curlews, avocet & stilts.
4. Large terrestrial birds Thicknees, pratincoles, coursers, korhaans, bustards, cranes, quail, francolins,
spurfowl, buttonquail, guineafowl, ostrich & secretarybird.
5. Raptors Vultures, kites, eagles, buzzards, sparrowhawks, hawks, harriers, falcons &
kestrels.
6. Sandgrouse, doves, etc Sandgrouse, doves, pigeons, parrots, lovebirds, trogon, turacos & go-away
birds (louries), cuckoos & coucals.
7. Owls & nightjars Owls & nightjars.
8. Aerial feeders, etc Swallows, martins, swifts, mousebirds, bee-eaters, kingfishers, rollers,
hoopoes, hornbills, barbets, woodpeckers, wryneck & honeyguides.
9. Cryptic & elusive insect-
eaters
Larks, finchlarks, pipits, wagtails, drongos, black flycatcher, cuckooshrikes,
crows, orioles, bulbuls, tits, babblers, thrushes, chats & robins.
10. Regular insect-eaters Warblers, apalises, titbabblers, eremomelas, carmoropteras, grassbird,
cisticolas, prinias, flycatchers, batises, shrikes, boubous, tchagras,
helmetshrikes & starlings.
11. Oxpeckers & nectar
feeders
Sunbirds, oxpeckers, white-eyes & queleas.
12. Seedeaters Sparrows, weavers, widow birds, bishops, finches, firefinches, waxbills,
manikins, whydahs, canaries, siskins & buntings.
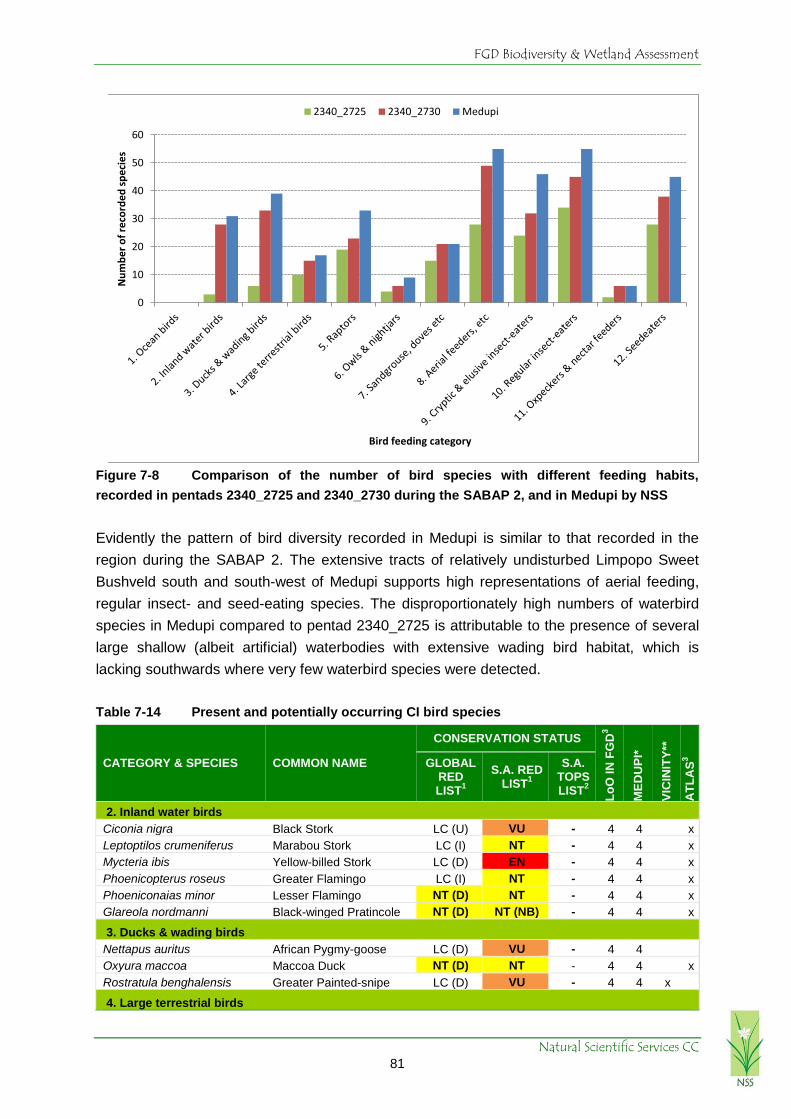
FGD Biodiversity & Wetland Assessment
Natural Scientific Services CC 81
Figure 7-8 Comparison of the number of bird species with different feeding habits,
recorded in pentads 2340_2725 and 2340_2730 during the SABAP 2, and in Medupi by NSS
Evidently the pattern of bird diversity recorded in Medupi is similar to that recorded in the
region during the SABAP 2. The extensive tracts of relatively undisturbed Limpopo Sweet
Bushveld south and south-west of Medupi supports high representations of aerial feeding,
regular insect- and seed-eating species. The disproportionately high numbers of waterbird
species in Medupi compared to pentad 2340_2725 is attributable to the presence of several
large shallow (albeit artificial) waterbodies with extensive wading bird habitat, which is
lacking southwards where very few waterbird species were detected.
Table 7-14 Present and potentially occurring CI bird species
CATEGORY & SPECIES COMMON NAME
CONSERVATION STATUS
Lo
O I
N F
GD
3
ME
DU
PI*
VIC
INIT
Y**
AT
LA
S3
GLOBAL RED LIST
1
S.A. RED LIST
1
S.A. TOPS LIST
2
2. Inland water birds
Ciconia nigra Black Stork LC (U) VU - 4 4 x
Leptoptilos crumeniferus Marabou Stork LC (I) NT - 4 4 x
Mycteria ibis Yellow-billed Stork LC (D) EN - 4 4 x
Phoenicopterus roseus Greater Flamingo LC (I) NT - 4 4 x
Phoeniconaias minor Lesser Flamingo NT (D) NT - 4 4 x
Glareola nordmanni Black-winged Pratincole NT (D) NT (NB) - 4 4 x
3. Ducks & wading birds
Nettapus auritus African Pygmy-goose LC (D) VU - 4 4
Oxyura maccoa Maccoa Duck NT (D) NT - 4 4 x
Rostratula benghalensis Greater Painted-snipe LC (D) VU - 4 4 x
4. Large terrestrial birds
0
10
20
30
40
50
60
Nu
mb
er
of
reco
rde
d s
pe
cie
s
Bird feeding category
2340_2725 2340_2730 Medupi

FGD Biodiversity & Wetland Assessment
Natural Scientific Services CC 82
CATEGORY & SPECIES COMMON NAME
CONSERVATION STATUS
Lo
O I
N F
GD
3
ME
DU
PI*
VIC
INIT
Y**
AT
LA
S3
GLOBAL RED LIST
1
S.A. RED LIST
1
S.A. TOPS LIST
2
Sagittarius serpentarius Secretarybird VU (D) VU - 2 3 x
Ardeotis kori Kori Bustard NT (D) NT PS 4 4 x
5. Raptors
Gyps coprotheres Cape Vulture VU (D) EN EN 2 1 x x
Gyps africanus White-backed Vulture EN (D) EN EN 1 1 x x
Torgos tracheliotos Lappet-faced Vulture VU (D) EN EN 2 2 x x
Aquila rapax Tawny Eagle LC (S) EN EN 1 1 x x
Polemaetus bellicosus Martial Eagle VU (D) EN EN 2 2 x
Terathopius ecaudatus Bateleur NT (D) EN EN 4 4 x
Falco biarmicus Lanner Falcon LC (I) VU - 2 3
8. Aerial feeders, etc
Coracias garrulus European Roller NT (D) NT - 2 2 x x
9. Cryptic & elusive insect-eaters
Certhilauda chuana Short-clawed Lark LC (D) NT - 4 4 x
Key Status: D = Declining; EN = Endangered; I = Increasing; LC = Least Concern; NB = Non-breeding; NT = Near Threatened; PS = Protected Species; S = Stable; U = Unknown population trend; VU = Vulnerable
Likelihood of Occurrence (LoO): 1 = Present; 2 = High; 3 = Moderate; 4 = Low
Sources: 1Taylor et al. (2015);
2ToPS List (2015);
3SABAP 1 & 2 (2018)
*Includes records from BEC (2006) and other NSS projects at Medupi
**Combined records from NSS studies at Grootegeluk and Limpopo West Mines, Mafutha Project and Matimba Power Station
7.2.3 Reptiles
Of some 96 regionally-occurring reptile species, 50 are considered highly likely to occur (with
a LoO of 1 or 2 in Appendix 4), based on the species’ known distributions and the diversity
of available habitats in and around the FGD study area. An additional 33 species may also
occur (LoO 3 in Appendix 4). Available atlas data include records for 47 species from the
four regional QDSs (ReptileMap, 2018; Bates et al. 2014). At a more local scale NSS has
recorded 46 species in the general vicinity (Grootegeluk and Limpopo West Mines, Mafutha
Project and Matimba Power Station). To date, a total of 20 reptile species (15 observed, four
anecdotal) have been detected by NSS and / or reported anecdotally within the study area
(Appendix 4 and Figure 7-9).
Fossorial species, terrapins and snakes in general, are underrepresented due to the
difficulties involved in their detection. Of the two regionally-occurring CI reptile species, only
one, the Southern African Python, is likely to occur naturally. The other species is the Nile
Crocodile, which apart from occurring in the Limpopo River, is largely restricted to managed
populations within reserves in the region (Table 7-15). Although no pythons were detected
they likely occur throughout the study region and anecdotal reports were numerous,
particularly near water to the south-west of Medupi. A large individual was photographed by
Mr Gavin Cronk (farm manager) eating a Bushbuck ram at a dam in the south-west (Figure
7-9). Although currently listed as Least Concern (LC) these large snakes are classified as
Protected Species (ToPS, 2015). They are threatened by commercial trade and listed as a

FGD Biodiversity & Wetland Assessment
Natural Scientific Services CC 83
CITES Appendix II species due to high levels of persecution for their skin which is used in
the leather industry. A single Nile Crocodile (EN) of approximately 1.5m was reportedly
observed at a dam also to the south-west of Medupi. The individual was seen approximately
eight years ago and has not been seen since.
The local diversity of reptiles is largely comprised of a subset of tortoises, snakes, lizards and
geckos that are generally adapted to the soft red sands that characterise the Limpopo Sweet
Bushveld. Although a band of rockier substrate is present to the south-west of Medupi, it is
probably too small and fragmented to support any of the locally occurring yet strictly
rupicolous species such as Waterberg Dragon Lizard (recorded at the base of a small rocky
ridge on a neighbouring farm to the west), Wahlberg's Snake-eyed Skink, and Southern Rock
Agama.
Large trees, Boscia spp. in particular, proved to be important microhabitats for reptiles and
frequently yielded Wahlberg’s Velvet Gecko, Common Dwarf Gecko, Variable Skink,
Southern Rock Monitor and Southern Tree Agama. Two tortoise species were recorded
south of Medupi. Leopard Tortoise was the more widespread and ubiquitous of the two, with
sightings of Speke’s Hinged-back Tortoise5 being far less frequent and more closely
associated with rocky substrates. No Kalahari Tent Tortoises were detected.
Observed venomous species included Puff Adder, Boomslang and Black Mamba, but
species such as Vine Snake, Snouted Cobra and various other elapids certainly occur. Some
interesting, less frequently encountered species (which may occur but were not detected)
include; Serrated Hinged Terrapin, Serrated Tent Tortoise, Jones’ Girdled Lizard, Kalahari
Dwarf Worm Lizard, Cape Worm Lizard, Bicoloured Quill-snouted Snake, Jalla’s Sand
Snake, Two-striped Shovel-snout, Common Shield Cobra, Sundevall’s Garter Snake,
Eastern Tiger Snake, Limpopo Dwarf Burrowing Skink, Common Purple-glossed Snake and
Eastern Bark Snake.
c.f. Speke’s Hinged-back
Tortoise (Kinixys spekii)
Leopard Tortoise
(Stigmochelys pardalis)
Spotted Sand Lizard
(Pedioplanis l. lineoocellata)
Waterberg Dragon Lizard
(Smaug breyeri)
5 Identification tentative due to sympatry with the similar congeneric Lobatse Hinged-back Tortoise.

FGD Biodiversity & Wetland Assessment
Natural Scientific Services CC 84
Southern Tree Agama
(Acanthocercus a. atricollis)
Turner’s Gecko
(Chondrodactylus turneri)
Common Tropical House Gecko
(Hemidactylus mabouia)
Common Dwarf Gecko
(Lygodactylus c. capensis)
Southern Rock Monitor
(Varanus albigularis albigularis)
Puff Adder
(Bitis arietans arietans)
Boomslang
(Dispholidus typus)
Western yellow-bellied Sand Snake
(Psammophis subtaeniatus)
Southern African Python (Python natalensis) Image courtesy of Gavin Cronk
Figure 7-9 Examples of some of the reptile species detected in the study area
Table 7-15 Present and potentially occurring CI reptile species
FAMILY & SPECIES COMMON NAME
CONSERVATION STATUS
Lo
O I
N F
GD
1,3
ME
DU
PI*
*
VIC
INIT
Y**
*
AT
LA
S3
GLOBAL RED LIST
1
S.A. RED LIST
1
S.A. ToPS LIST
2
PYTHONIDAE (Python)
Python natalensis Southern African Python - LC PS 1* x x x
CROCODYLIDAE (Crocodile)
Crocodylus niloticus Nile crocodile LC VU PS 1* x x
Key
Status: LC = Least Concern; PS = Protected Species; VU = Vulnerable
Likelihood of Occurrence (LoO): 1 = Present
Sources: 1Bates et al. (2014);
2ToPS List (2015);
3ReptileMap (2018)
*Anecdotal records only
**Records from other NSS studies at Medupi
***Combined records from NSS studies at Grootegeluk and Limpopo West Mines, Mafutha Project and Matimba Power Station
7.2.4 Frogs

FGD Biodiversity & Wetland Assessment
Natural Scientific Services CC 85
Combined NSS surveys at Medupi show that the power station premises support 20 frog
species, representing 74% of the regional amphibian diversity. Of the 27 regionally occurring
species only Natal Sand Frog and Muller's Platanna are considered unlikely to occur based
on their marginal distributions. FrogMap (2018) lists 22 species for the four regional QDSs. In
total 16 frog species were detected within the FGD study area (Appendix 5 and Figure
7-10). Both of the two regionally occurring CI species, namely African and Giant Bullfrog,
were recorded in the FGD study area (Table 7-16).
During our December 2015 visit, a high rainfall event (38mm on 8 December 2015) triggered
the emergence of exceptionally high densities of winged termites, and subsequently, African
Bullfrog and various other frog species appeared en masse. The breeding frenzy that
ensued, drastically increased detection rate, and emphasised the exceptional abundance of
amphibian species in the study area.
Both Giant and African Bullfrog occur sympatrically in the region, with the latter generally
being regarded as the more ubiquitous of the two in warm bushveld regions (Du Preez and
Carruthers, 2009). Whereas the Giant Bullfrog has only been recorded once in 2327CB (C.
Lotter; V. Kleynhans and N. Kleynhans) and twice in 2327DA (one VMUS record submitted
by L. Verburgt and one questionable Minter et al. 2004 record), the African Bullfrog has been
recorded in all four regional QDSs (Yetman et al. 2015). Indeed, African Bullfrog were found
to be exceptionally abundant, and likely breed at the majority of the pans / depressions in
and around the FGD study area, while in contrast, Giant Bullfrog was only potentially
recorded where the ADF is situated at a small (historically natural) pan which has been
deepened and widened by excavation.
Plain Grass Frog
(Ptychadena anchietae)
Sand Frog
(Tomopterna sp.)
Eastern Olive Toad
(Amietophrynus garmani)
Mottled Shovel-nosed Frog
(Hemisus marmoratus)
Bushveld Rain Frog
(Breviceps adspersus
Common Platanna
(Xenopus laevis)
Bubbling Kassina
(Kassina senegalensis)
Red Toad
(Schismaderma carens)

FGD Biodiversity & Wetland Assessment
Natural Scientific Services CC 86
adspersus)
Ornate Frog
(Hildebrandtia ornata)
Boettger’s Caco
(Cacosternum boettgeri)
Banded Rubber Frog
(Phrynomantis
bifasciatus)
Southern Foam Nest Frog
(Chiromantis xerampelina)
Giant Bullfrog froglet
(Pyxicephalus adspersus)
African Bullfrog
(Pyxicephalus edulis)
African Bullfrog pair in
amplexus
African Bullfrog tadpoles
Figure 7-10 Examples of some of the frog species detected in the study area
The Giant Bullfrog observation was of a single froglet (identification tentative based on
absence of pale half-moon on tympanum, which is usually indicative of African Bullfrog.
Specimen age precluded confirmation by labial tooth row formula or adult colouration and
morphology). Species distinction among froglet bullfrogs is notoriously difficult (A. Channing
pers. comm.). A recent publication by Yetman and Verburgt (2015) provides the first records
of Giant Bullfrog in the Lephalale region and the greater Limpopo Sweet Bushveld. The study
highlights that the species is likely more widespread and common in the region than was
previously thought, and that low detection levels are likely the result of irregular emergence
and breeding only during sufficiently wet summers in this dry region.
Suitable breeding habitat appears to be present for both African and Giant Bullfrogs at
multiple locations, but Giant Bullfrog breeding was not detected by NSS due to timing. The
presence of both of these large conservation important frog species warrants the
commissioning of a specialist bullfrog study to better understand the extent and occurrence
of these species in the study area, and to minimise loss of breeding sites and foraging
habitat from the construction of the ADF and other infrastructure. Based on this
recommendation, Medupi has commissioned NSS to assess the suitability of local wetlands
for bullfrog breeding, and the Endangered Wildlife Trust to relocate bullfrogs between
wetlands where necessary, in collaboration with NSS.
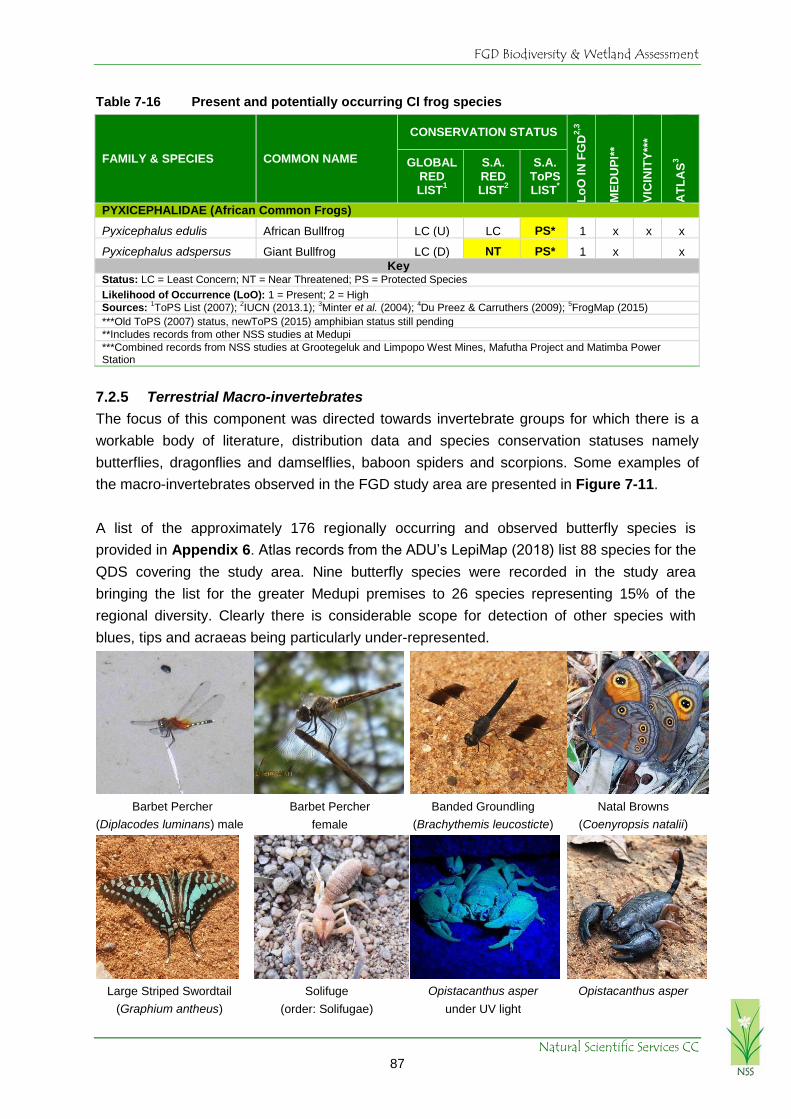
FGD Biodiversity & Wetland Assessment
Natural Scientific Services CC 87
Table 7-16 Present and potentially occurring CI frog species
FAMILY & SPECIES COMMON NAME
CONSERVATION STATUS
Lo
O I
N F
GD
2,3
ME
DU
PI*
*
VIC
INIT
Y**
*
AT
LA
S3
GLOBAL RED LIST
1
S.A. RED LIST
2
S.A. ToPS LIST
*
PYXICEPHALIDAE (African Common Frogs)
Pyxicephalus edulis African Bullfrog LC (U) LC PS* 1 x x x
Pyxicephalus adspersus Giant Bullfrog LC (D) NT PS* 1 x
x
Key Status: LC = Least Concern; NT = Near Threatened; PS = Protected Species
Likelihood of Occurrence (LoO): 1 = Present; 2 = High
Sources: 1ToPS List (2007);
2IUCN (2013.1);
3Minter et al. (2004);
4Du Preez & Carruthers (2009);
5FrogMap (2015)
***Old ToPS (2007) status, newToPS (2015) amphibian status still pending
**Includes records from other NSS studies at Medupi
***Combined records from NSS studies at Grootegeluk and Limpopo West Mines, Mafutha Project and Matimba Power Station
7.2.5 Terrestrial Macro-invertebrates
The focus of this component was directed towards invertebrate groups for which there is a
workable body of literature, distribution data and species conservation statuses namely
butterflies, dragonflies and damselflies, baboon spiders and scorpions. Some examples of
the macro-invertebrates observed in the FGD study area are presented in Figure 7-11.
A list of the approximately 176 regionally occurring and observed butterfly species is
provided in Appendix 6. Atlas records from the ADU’s LepiMap (2018) list 88 species for the
QDS covering the study area. Nine butterfly species were recorded in the study area
bringing the list for the greater Medupi premises to 26 species representing 15% of the
regional diversity. Clearly there is considerable scope for detection of other species with
blues, tips and acraeas being particularly under-represented.
Barbet Percher
(Diplacodes luminans) male
Barbet Percher
female
Banded Groundling
(Brachythemis leucosticte)
Natal Browns
(Coenyropsis natalii)
Large Striped Swordtail
(Graphium antheus)
Solifuge
(order: Solifugae)
Opistacanthus asper
under UV light
Opistacanthus asper

FGD Biodiversity & Wetland Assessment
Natural Scientific Services CC 88
Giant Longhorn
(Tithoes confinis)
Figure 7-11 Examples of some of the invertebrate species detected in the study area
Distribution data for dragonflies and damselflies provided in Samways (2008) suggests that
some 66 odonata species have the potential to occur in the region Appendix 7. However,
the vast majority of these species are likely precluded by the absence of significant rivers
and lakes with suitable substrate and vegetation. As such, only a subset of just less than 50
species that are frequently found away from water and / or require only temporarily
inundated areas are considered highly likely to occur (see Appendix 7). Of the seven
regionally occurring CI species6 only five, namely the Sudan Sprite, Little Wisp, Black
Emperor, Strong Skimmer and Silhouette Dropwing are considered more or less likely to
occur in the FGD study area (Table 7-17). The Makabusi Sprite (VU) and Spined Fairytail
(NT) are likely precluded by a lack of sluggish perennial rivers in the study area. The greater
diversity of wetland habitat immediately south of Medupi is expected to support the greatest
diversity of odonata. Three dragonfly species were identified during the NSS site visit
namely Banded Groundling, Green Hooktail and Barbet Percher.
Table 7-17 Present and potentially occurring CI terrestrial macro-invertebrate species
SPECIES COMMON NAME
ST
AT
US
Lo
O I
N F
GD
ME
DU
PI
VIC
INIT
Y
Dragonflies
Chlorolestes fasciatus Mountain Malachite - 4 Chlorolestes tessellatus Forest Malachite - 4 Pseudagrion makabusiense Makabusi Sprite VU 4 Pseudagrion sudanicum Sudan Sprite LC 3 Agriocnemis exilis Little Wisp - 3 Anax tristis Black Emperor - 3 Lestinogomphus angustus Spined Fairytail NT 4 Orthetrum stemmale Strong Skimmer - 3 Trithemis donaldsoni Denim Dropwing - 4
Trithemis hecate Silhouette Dropwing - 3
6 Red listed species or those species with a Dragonfly Biotic Index score of 4 or higher are considered here to be of
conservation importance.
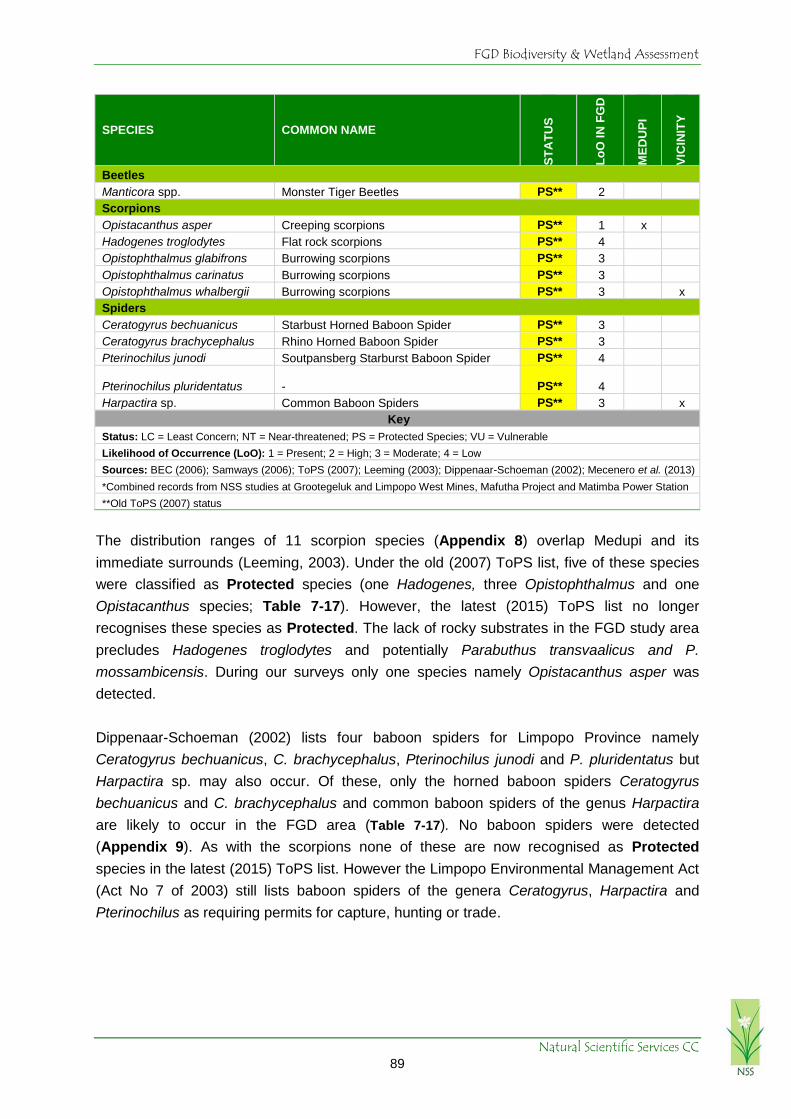
FGD Biodiversity & Wetland Assessment
Natural Scientific Services CC 89
SPECIES COMMON NAME
ST
AT
US
Lo
O I
N F
GD
ME
DU
PI
VIC
INIT
Y
Beetles
Manticora spp. Monster Tiger Beetles PS** 2 Scorpions
Opistacanthus asper Creeping scorpions PS** 1 x Hadogenes troglodytes Flat rock scorpions PS** 4
Opistophthalmus glabifrons Burrowing scorpions PS** 3 Opistophthalmus carinatus Burrowing scorpions PS** 3 Opistophthalmus whalbergii Burrowing scorpions PS** 3
x
Spiders
Ceratogyrus bechuanicus Starbust Horned Baboon Spider PS** 3 Ceratogyrus brachycephalus Rhino Horned Baboon Spider PS** 3 Pterinochilus junodi Soutpansberg Starburst Baboon Spider PS** 4
Pterinochilus pluridentatus - PS** 4
Harpactira sp. Common Baboon Spiders PS** 3
x
Key
Status: LC = Least Concern; NT = Near-threatened; PS = Protected Species; VU = Vulnerable
Likelihood of Occurrence (LoO): 1 = Present; 2 = High; 3 = Moderate; 4 = Low
Sources: BEC (2006); Samways (2006); ToPS (2007); Leeming (2003); Dippenaar-Schoeman (2002); Mecenero et al. (2013)
*Combined records from NSS studies at Grootegeluk and Limpopo West Mines, Mafutha Project and Matimba Power Station
**Old ToPS (2007) status
The distribution ranges of 11 scorpion species (Appendix 8) overlap Medupi and its
immediate surrounds (Leeming, 2003). Under the old (2007) ToPS list, five of these species
were classified as Protected species (one Hadogenes, three Opistophthalmus and one
Opistacanthus species; Table 7-17). However, the latest (2015) ToPS list no longer
recognises these species as Protected. The lack of rocky substrates in the FGD study area
precludes Hadogenes troglodytes and potentially Parabuthus transvaalicus and P.
mossambicensis. During our surveys only one species namely Opistacanthus asper was
detected.
Dippenaar-Schoeman (2002) lists four baboon spiders for Limpopo Province namely
Ceratogyrus bechuanicus, C. brachycephalus, Pterinochilus junodi and P. pluridentatus but
Harpactira sp. may also occur. Of these, only the horned baboon spiders Ceratogyrus
bechuanicus and C. brachycephalus and common baboon spiders of the genus Harpactira
are likely to occur in the FGD area (Table 7-17). No baboon spiders were detected
(Appendix 9). As with the scorpions none of these are now recognised as Protected
species in the latest (2015) ToPS list. However the Limpopo Environmental Management Act
(Act No 7 of 2003) still lists baboon spiders of the genera Ceratogyrus, Harpactira and
Pterinochilus as requiring permits for capture, hunting or trade.

FGD Biodiversity & Wetland Assessment
Natural Scientific Services CC 90
7.3. Watercourses, Wetlands and Ephemeral Systems
The Study area (Figure 3-1) is situated on a watershed and comprises both northwards and
southwards draining systems. The hot semi-arid plains of the Limpopo Sweet Bushveld
covering the study area are characterised by a series of ephemeral pans and drainage
features, which we have termed Semi-Ephemeral Washes (SEWs). The southern boundary
of the study area is intruded by a series of these SEWs, which all form part of a greater
alluvial fan draining into the Sandloop.
The upper reaches of this system diagonally bisects the south western corner of the study
area and is classified as a FEPA in recognition of its reference site suitability as an upper
foothill ephemeral system that is still in a largely natural state. Results of the wetland
assessment are summarised in Table 7-18 –
Table 7-22. The sampling points and the delineated wetlands are depicted in Figure 7-12. A
DEM derived catchment model and channel analysis produced by NSS overlayed with the
1:100 year floodline produced by Zitholele (2016) is shown in Figure 7-14. Additionally
Figure 7-15 depicts the soils as classified by ESS (2015).
Four HGM units were identified, which include two south–east and one north–east draining
Washes (SEW 1 – 3), and multiple inward-draining depressions (D1). In addition, two
excavated areas were encountered on site (Figure 7-17). It should be noted that portions of
the SEW 1 HGM unit forms part of the Sandloop FEPA system. As a consequence, a large
portion of the HGM unit is classified as being of Highest Biodiversity Importance and Risk for
Mining according to the SANBI Mining and Biodiversity Guidelines. Within these areas the
MBG stipulates a 1km buffer on all FEPA listed systems. The same is true for the FEPA
guidelines which state that a 1km buffer is required.

FGD Biodiversity & Wetland Assessment
Natural Scientific Services CC 91
Figure 7-12 Wetland extent

FGD Biodiversity & Wetland Assessment
Natural Scientific Services CC 92
Figure 7-13 Wetland sampling points

FGD Biodiversity & Wetland Assessment
Natural Scientific Services CC 93
Wetland HGM unit overall PES ratings

FGD Biodiversity & Wetland Assessment
Natural Scientific Services CC 94
Figure 7-14 USGS DEM derived catchment and channel model showing Golder (2017) 1:100 year floodline delineation

FGD Biodiversity & Wetland Assessment
Natural Scientific Services CC 95
Figure 7-15 ESS (2015) soil classification map

FGD Biodiversity & Wetland Assessment
Natural Scientific Services CC 96
Table 7-18 Wetland summary HGM Unit 1
HGM Unit 1 – Semi-arid Ephemeral Wash 1
HGM Unit 1 and sampling points
SETTING
Coordinates (Centroid ) 23°43'49.57"S 27°30'34.76"E Area- 500m buffer of site (ha) 71.5
Alt (m a.s.l.) 908 Level 1: System Inland
Aspect South-east Level 2a: Ecoregion 1.03
Regional vegetation SVcb 19 LSB Level 2b: NFEPA WetVeg CBG 4
Quaternary catchment A42J Level 3: Landscape unit Plain
Limpopo BCPLAN V2 CBA 1 and ESA 1 Level 4a: CBG 4 Flat: LT NP
Waterberg TCBA CBAI; CBAO and ON Level 4b: NA
MBG B: Highest NB and risk FEPA: Start of Sandloop FEPA
SITE DESCRIPTION
Overview Semi-ephemeral washes, with pockets within the drainage showing wetland characteristics (pooling).
Wetland indicators Terrain relatively flat and difficult to determine slope. The soil indicators were present along some points of
each system and in these areas the herbaceous vegetation layer was dense in comparison to the surrounds.
Within the more permanent pooling areas, species such as Scirpus and Cyperus were evident
Impacts Clearing of the vegetation within the ash dump has resulted in increased exposed and hardened surface within
catchment. During high flow culverts concentrate flow. Some borrow pits evident along the systems.
Dominant species Non wetland species: Acacia nigrescens, A erubescens, Terminalia sericea (taller and more leaf composition
within the drainage evident); Grewia bicolor and Grewia flava. Stands of Spirostachys africana (Tamboti) are
present along the system.
Soil characteristics Mixture of wet-based, and shallow, shallow-moderate, and moderate-deep sandy loamy soils
Present Ecological State (PES)
Hydrology Geomorphology Vegetation
C B B
Wetland Ecosystem Services
Maintenance of biodiversity; Phosphate trapping; Sediment trapping; Toxicant removal; Nitrate removal
Wetland Importance and Sensitivity
Hydrological Ecological Cultural
Moderate (2.2) Very High (4.0) Moderate (1.5)
MBG: Mining & Biodiversity Guidelines; LSB: Limpopo Sweet Bushveld; CBA: Critical Biodiversity Area; ESA: Ecological Support Area; CBG4:
Central Bushveld Group 4; FEPA: Freshwater Ecosystem Priority Area; ON:

FGD Biodiversity & Wetland Assessment
Natural Scientific Services CC 97
Table 7-19 Wetland summary HGM Unit 2
HGM Unit 2 – Semi-arid Ephemeral Wash 2
HGM Unit 2 and sampling points
SETTING
Coordinates (Centroid ) 23°42'44.20"S 27°33'57.96"E Area Within Site (ha) 38.0
Alt (m a.s.l.) 902 Level 1: System Inland
Aspect South-east Level 2a: Ecoregion 1.03
Regional vegetation SVcb 19 LSB Level 2b: NFEPA WetVeg CBG 4
Quaternary catchment A42J Level 3: Landscape unit Plain
Limpopo BCPLAN V2 ESA 1 Level 4a: NA
Waterberg TCBA ON Level 4b: NA
MBG E: Low NB and risk
SITE DESCRIPTION
Overview Semi-ephemeral wash, with pockets within the drainage showing wetland characteristics (pooling).
Wetland indicators Terrain relatively flat and difficult to determine slope. The soil indicators were present along certain points of
the system. A number of pools found along system before entering the Sandloop.
Impacts Likely a fair amount of water is diverted into the system compared to natural flow. MPS acts as a large
hardened surface with surface / catchment area runoff increasing flood peaks substantially during high rainfall
events but two natural depressions, a borrow pit and a road assist to attenuate flow, create depositional
environments, and stem flow. Some excavations have formed more permanent dams. Increased roughness,
saturation and nutrient loading. Pits (excavation), tailings (infilling), tailing sediment are washing onto system.
Dominant species Non wetland species: Acacia nigrescens, A karoo, Dichrostachys cinerea; Grewia bicolor and Grewia flava.
Denser Grass Sward in places
Soil characteristics Mixture of wet-based and man-made soils
Present Ecological State (PES)
Hydrology Geomorphology Vegetation
C C D
Wetland Ecosystem Services
Maintenance of biodiversity; Toxicant removal; Phosphate trapping; Sediment trapping; Flow attenuation
Wetland Importance and Sensitivity
Hydrological Ecological Cultural
Moderate (2.1) Very High (4.0) Low (1.4)

FGD Biodiversity & Wetland Assessment
Natural Scientific Services CC 98
Table 7-20 Wetland summary HGM Unit 3
HGM Unit 3 – Semi-arid Ephemeral Wash 3
HGM Unit 3 and sampling points
SETTING
Coordinates (Centroid ) 23°41'39.64"S 27°34'59.20"E Area Within Site (ha) 18.2
Alt (m a.s.l.) 891 Level 1: System Inland
Aspect North-north-east Level 2a: Ecoregion 1.03
Regional vegetation SVcb 19 LSB Level 2b: NFEPA WetVeg CBG 4
Quaternary catchment A42J Level 3: Landscape unit Plain
Limpopo BCPLAN V2 ESA 1 Level 4a: NA
Waterberg TCBA ON Level 4b: NA
MBG E: Low NB and risk
SITE DESCRIPTION
Overview Semi-ephemeral washes flowing north eastward. Currently fed by MPS overflow of treated water
Wetland indicators Terrain indicator present; limited vegetation indicators
Impacts Storm water from MPS is channelled into this system but does not appear to significantly increase inundation
below the control dams. High run-off from MPS’s hardened surfaces during rainfall events but seems
attenuated by storm water dams and the tar road. Under normal conditions effects of increased flood peaks are
expected to be negligible, but because all MPS’s storm water is diverted to this point freak high rainfall events
have the potential to cause a serious impact on the systems downstream. Earth-moving impacts are also
evident. A large storm water control dam in the drainage way headwaters is starving the system of sediment
and influencing natural flow patterns. However, the intensity of this impact does not seem high, possibly due to
ephemeral nature of system. Road impedes flow slightly and further traps sediment from reaching downstream
reaches. There is some evidence of erosion. Flat topography and the tar road appear to prevent erosion
downstream during high rainfall events. Signs that water flows fast in reach between dam outlet and tar road.
Storm water dam and road reduce sediment inputs from MPS to downstream system.
Dominant species Non Wetland species: Dominated by Acacia nigrescens, A karroo, etc in the wooded component
Soil characteristics Mixture of man-made, wet-based, and shallow-deep sandy loamy soils
Present Ecological State (PES)
Hydrology Geomorphology Vegetation
F C D
Wetland Ecosystem Services
Maintenance of biodiversity; Toxicant removal; Phosphate trapping; Sediment trapping; Erosion control; Flood attenuation
Wetland Importance and Sensitivity
Hydrological Ecological Cultural
Moderate (1.7) High (2.7) Low (1.0)

FGD Biodiversity & Wetland Assessment
Natural Scientific Services CC 99
Table 7-21 Wetland summary HGM Unit 4
HGM Unit 4 – Depressions
HGM Unit 4 and sampling points
SETTING
Coordinates (Centroids); Alt (m a.s.l.) Area Within Site (ha) 9.7
23°41'58.34"S 27°32'9.96"E; 913 23°42'44.48"S 27°32'37.87"E; 915
23°42'57.53"S 27°31'21.30"E; 914 23°42'40.87"S 27°31'1.01"E; 918
23°42'10.23"S 27°31'26.90"E; 918 23°42'10.83"S 27°32'2.64"E; 916
23°42'11.11"S 27°32'32.16"E; 915 23°42'20.94"S 27°30'33.70"E; 922
23°42'15.55"S 27°30'56.53"E; 919 23°41'30.86"S 27°33'37.69"E; 900
23°42'51.10"S; 27°31'25.61"E; 916
Level 1: System Inland
Level 2a: Ecoregion 1.03
Regional vegetation SVcb 19 LSB Level 2b: NFEPA WetVeg CBG 4
Quaternary catchment A42J Level 3: Landscape unit Plain
Limpopo BCPLAN V2 ESA 1 Level 4a: NA
Waterberg TCBA CBAO and ON Level 4b: NA
MBG E: Low NB and risk
SITE DESCRIPTION
Overview Scattered, small, isolated depressions
Wetland indicators Soil indicators evident in most of these systems -showing signs of wetness (mottling). Vegetation shows more
cover, but hydrophytes are generally lacking. There is also limited change to the terrain.
Impacts Cattle trampling of the depressions, which affects species such as frogs that remaining in the cracks until rain
Dominant species In most cases these depressions are devoid of vegetation. Where there is vegetation, it is merely denser cover
of the surrounding terrestrial environment.
Soil characteristics Mostly moderate-deep sandy loamy soils
Present Ecological State (PES)
Hydrology Geomorphology Vegetation
B B C
Wetland Ecosystem Services
Maintenance of biodiversity; Tourism and recreation; Phosphate trapping; Toxicant removal
Wetland Importance and Sensitivity
Hydrological Ecological Cultural
Low (1.4) Very High (4.0) Moderate (1.6)

FGD Biodiversity & Wetland Assessment
Natural Scientific Services CC 100
Table 7-22 Summary information for excavations (artificial systems)
Excavations
Excavations
SETTING
Coordinates (Centroids); Alt (m a.s.l.)
Area Within Site (ha)
West: 2.2ha; East:
0.9ha
West: 23°43'37.82"S 27°30'24.69"E; 909
East: 23°43'12.59"S 27°31'44.29"E; 910
Level 1: System Inland
Level 2a: Ecoregion 1.03
Regional vegetation SVcb 19 LSB
Level 2b: NFEPA
WetVeg CBG 4
Quaternary catchment A42J Level 3: Landscape unit Plain
Limpopo BCPLAN V2 ESA 1 Level 4a: NA
Waterberg ACBA and
TCBA ESA and ON, respectively Level 4b: NA
MBG B: Highest NB and risk
SITE DESCRIPTION
Overview Old borrow pits or excavations now filled with water and providing a biodiversity
hotspot in the greater area
Wetland indicators No indicators were assessed for these pits
Impacts Potentially limiting the inputs of sediment into the system and influencing natural flow patterns
Dominant species Limited to no vegetation within the pits, on the edges show typical Bushveld Habitat
Soil characteristics Mixture of wet-based, and shallow-moderate, and moderate-deep sandy loamy soils
Present Ecological State (PES)
NA
Wetland Ecosystem Services
NA
Wetland Importance and Sensitivity
NA

FGD Biodiversity & Wetland Assessment
Natural Scientific Services CC 101
7.4. Wetland Classification
HGM units SEW1 to 3 were classified following Ollis et al (2013) up to Level 3. However, did
not fit with any of the Level 4 classifications. These systems are ephemeral with no channels
and not considered valley bottom systems. The best description for these systems is a
Wash. Washes are dry land drainage ways where water flows after heavy rainstorms, but
which are otherwise dry. Washes usually indicate that there is no local groundwater
connection to the valley bottom. However, they sometimes mark areas where groundwater is
closer to the surface than in the surrounding landscape (”recharge windows” where a portion
of the surface flow seeps down through to the groundwater aquifer), or a layer such as
ferricrete is providing an impermeable layer allowing soils to become saturated above and
presenting wetland characteristics. This is true to the description on the soils of the area,
provided by ESS (2015). This was evident in the fieldwork where, within the larger system,
water was pooling and showing signs of wetland characteristics such as soil mottling and a
change in vegetation structure (denser grass swards and taller potentially more productive
wooded component) (Figure 7-18). During the drier period of the year these trees kept their
leaves for longer than the surrounding areas potentially being fed by groundwater. The
denser grass swards indicate more availability of water subsurface.
The various pans were classified following Ollis et al (2013) up to Level 4 as Endorheic
Depressions without Channelled Outflow. Pans (depressions) within South Africa are mainly
characteristic of the drier parts of the country but do occur within the wetter areas (Allan et al.
1995). The conditions within the study site are all conclusive with the formation of pans: the
area is arid (i.e. receives approximately 400mm of rainfall, with evapo-transpiration higher
than rainfall), the area is underlain mainly by sandstones, and the slope is less than 1
degree. The depressions identified within the study area are small in extent and ephemeral in
nature. Depressions are defined by Ollis et al (2013) as “a wetland or aquatic ecosystem with
closed (or near closed) elevation contours, which increases in depth from the perimeter to a
central area of greatest depth and within which water accumulates.” Due to the large number
of depressions within the CBG4 vegetation type, they are classified as Least Threatened. In
terms of delineating the systems, it is the catchment of the depression that should be
demarcated as sensitive. The available contour data were used to demarcate the pans,
however, due to the flat terrain the scale of the contours was not fine enough for an accurate
delineation. The Level 1 – 4 wetland classification (Ollis et al 2013) for the four HGM units on
site is given in Table 7-23.
Table 7-23 Wetland classification
* Central Bushveld Group 4
HGM UNIT
NAME
LEVEL 1
LEVEL 2 LEVEL 3 LEVEL 4
System Eco -
region
NFEPA WetVeg Landscape Unit 4a 4b 4c
Type Status Protection
SEW1 Inland 1.03 CBG4 LT MP Plain N/A N/A N/A
SEW2 Inland 1.03 CBG4 LT MP Plain N/A N/A N/A
SEW3 Inland 1.03 CBG4 LT MP Plain N/A N/A N/A
D1 Inland 1.03 CBG4 LT MP Plain Depression Endorheic Without
Channelled Outflow

FGD Biodiversity & Wetland Assessment
Natural Scientific Services CC 102
Pans inundated after sufficient rainfall
SEW – Flow Patch clearly visible Flow path for an SEW
Figure 7-16 Flow paths and water inundation
Figure 7-17 Artificial systems
7.5. Wetland Extent
The spatial distribution of the wetlands in the study site and the 500m survey buffer) was
determined using a combination of standard in-field delineation techniques including terrain,
soil and vegetation indicators (DWAF, 2005), available contour data, satellite imagery over a
10 year period (Google Earth). The separate and collective extent (in hectares and percent)
of the four identified HGM units is presented in
Table 7-24.

FGD Biodiversity & Wetland Assessment
Natural Scientific Services CC 103
Table 7-24 Wetland extent
HGM Unit HGM Type Ha Extent (%)*
SEW 1 Semi-ephemeral Wash 71.5 52
SEW 2 Semi-ephemeral Wash 38.0 28
SEW 3 Semi-ephemeral Wash 18.2 13
Depressions Depressions 9.7 7
Total 137.3 100
Soil Mottling -Depressions Dense Vegetation within the Depressions
Soil Mottling- SEW Units Depression
Figure 7-18 Wetland Indicators
7.6. Present Ecological State of the Wetlands
A summary of the PES of each HGM units on site is provided in Table 7-25 and discussed in
greater detail under Table 7-18 -
Table 7-22. The PES for SEW 1, 2 and D4 show a relatively stable and natural to moderately
modified state. Whereas SEW 3 in the north eastern section of the site showed a more
modified system. This is potentially due to the seepage and/ or overflow during high rainfall
events of MPS clean and dirty water into the system.

FGD Biodiversity & Wetland Assessment
Natural Scientific Services CC 104
Table 7-25 Summary of the overall health of the wetland based on impact score and
change score
HGM Unit Ha Extent
(%)
Hydrology Geomorphology Vegetation Overall
Impact Score
Change Score
Impact Score
Change Score
Impact Score
Change Score
Impact Score
SEW 1 72 52 3 -2 1.7 -1 1 -1 2.1
SEW 2 38 28 3.5 -1 3 -1 4.2 -1 3.6
SEW 3 18 13 9.5 -1 3.9 -1 5.8 -1 6.8
Depressions 10 7 1 -1 1 -1 2 -1 1.3
Scores
SEW 1 C ↓↓ B ↓ B ↓ C
(Lower)
SEW 2 C ↓ C ↓ D ↓ C
(Upper)
SEW 3 F ↓ C ↓ D ↓ E
D 4 B ↓ B ↓ C ↓ B
Area weighted impact scores* 3.9 -1.5 2.3 -1 2.6 -1
PES Category (See Table 6.1) C ↓↓ C ↓ C ↓
* The total impact score for the wetland as a whole is calculated by summing the area-weighted HGM scores for each HGM unit.
7.7. Sediment
Due to the semi-ephemeral nature of the systems on site, sediment samples were collected
to determine the metal concentrations within the sediment of the systems. The results give
an indication of the contamination levels within the water when the systems are flowing.
7.7.1 Sediment Sampling Sites
Six sediment sampling sites were chosen based on their location in 2015, upstream and
downstream from the ADF and MPS, with a further two sites within two remaining
depressions in the ADF footprint. The sampling sites are summarised in Table 7-26 and
illustrated in Figure 7-19.
7.7.2 Metal Analysis
The results of the total sediment metal concentrations for the high flow assessment at the
eight sampling sites are presented in Table 7-27. Currently, no sediment quality guidelines
(SQGs) exist for freshwaters in South Africa. Therefore, the shaded values in Table 7-27
indicate any increased concentrations compared to the available international SQGs. A study
by Botes & Van Staden (2005) on a site in the Olifants River, in Limpopo Province, is also
provided as a comparison. No sediment data for the Sandloop was available for comparison.
Therefore, this data will serve as a reference for future surveys and can be compared against
to determine increasing or decreasing concentrations. The water quality samples were taken
at the same sampling sites as the sediment samples for comparison. The WQ data was
provided by Zitholele consulting. Only the exceeding concentrations of both the metals in the
sediment and water quality data are presented in Table 7-28.

FGD Biodiversity & Wetland Assessment
Natural Scientific Services CC 105
Table 7-26 Sediment Sampling Sites
Sampling Site Description Latitude (S) Longitude (E)
MD1 Upstream site on the Sandloop River.
Upstream of all three proposed site
alternatives.
-23.722876° 27.490132°
MD2 Sandloop River. Located in Site 12 but
downstream of Site 13.
-23.731668° 27.514446°
MD3 Pan. Located south of the ADF. -23.747372° 27.504599°
MD4 Unnamed tributary of the Sandloop River.
Located south of MPS
-23.727258° 27.528442°
MD5 Unnamed tributary of the Sandloop River.
Downstream.
-23.738966° 27.548697°
MD6 Sandloop River. Downstream -23.745971° 27.572112°
MD7 A Pan situated in close proximity to the
ADF (South of the ADF)
-23.722098° 27.514976°
MD8 A Pan situated in close proximity to the
ADF
-23.716043° 27.522619°
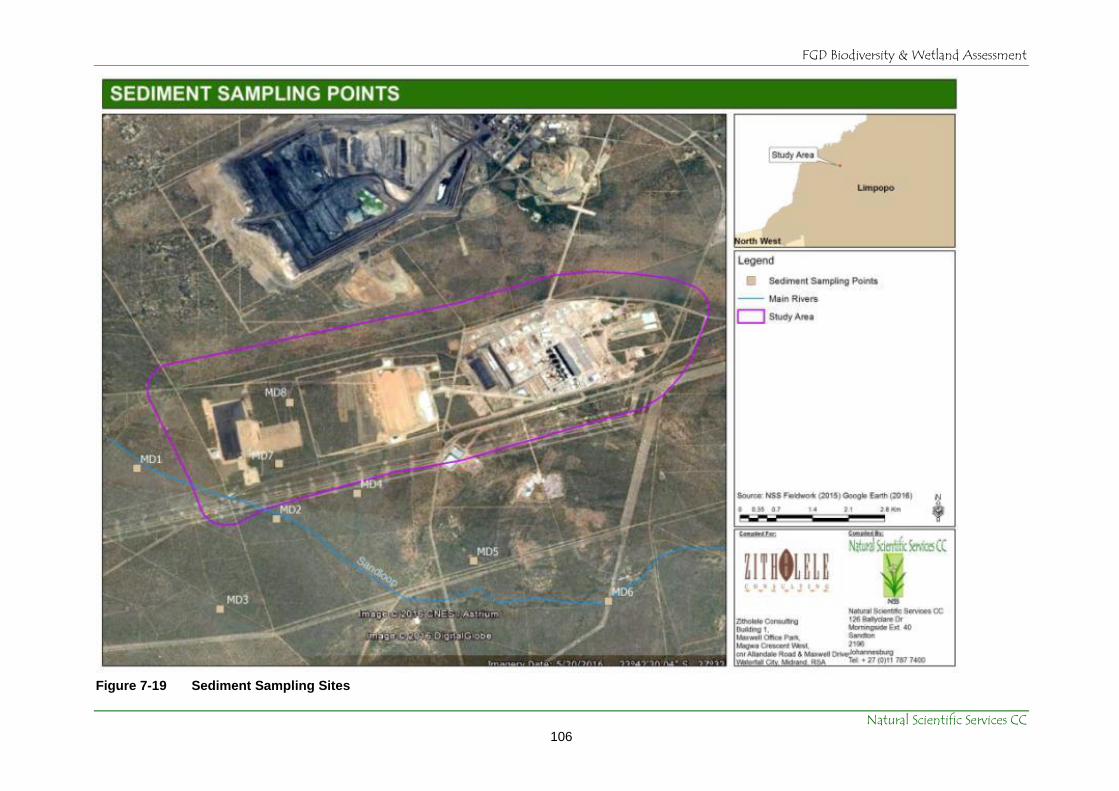
FGD Biodiversity & Wetland Assessment
Natural Scientific Services CC 106
Figure 7-19 Sediment Sampling Sites

FGD Biodiversity & Wetland Assessment
Natural Scientific Services CC 107
Table 7-27 Metal concentrations in the sediment samples from the study area during December 2015
Constituents
Chemical
symbol Unit
Guideline
Value
Olifants
River# MD1 MD2 MD3 MD4 MD5 MD6 MD7 MD8
Dec 2015 Dec 2015 Dec 2015 Dec 2015 Dec 2015 Dec 2015
Nov
2016
Nov
2016
Metals
Aluminium Al mg/kg n/a - 16451.38 26148.15 4497.26 7585.38 8775.56 4901.48
54119.
3
34604.
8
Arsenic As mg/kg 5.9 3.33 1.35 0.89 0.36 0.70 0.80 0.37 1.63 1.26
Boron B mg/kg n/a - 6.77 5.79 BD 0.11 0.92 BD 20.32 18.33
Barium Ba mg/kg n/a 24.27 120.27 126.94 25.49 50.10 71.85 32.59 346.51 250.6
Beryllium Be mg/kg n/a - 0.55 0.62 0.11 0.20 0.23 0.15 1.47 1.00
Cadmium Cd mg/kg 0.57 BD 0.03 0.04 0.01 0.01 0.01 0.00 0.07 0.06
Chromium Cr mg/kg 26 38.83 31.76 44.81 27.05 24.89 23.34 17.17 87.11 57.86
Cobalt Co mg/kg 20 7.57 3.96 4.27 0.87 1.91 2.72 1.72 9.72 7.78
Copper Cu mg/kg 16 BD 12.99 10.97 3.01 4.64 6.27 3.64 26.00 17.51
Iron Fe mg/kg n/a 16090 11008.71 13629.63 3135.89 5529.10 6588.21 4071.43
22773.
6
18013.
3
Manganese Mn mg/kg 460 249.1 161.39 106.79 21.62 73.30 66.43 56.11 220.38 208.18
Molybdenum Mo mg/kg 10 BD 0.03 0.10 BD 0.04 0.09 BD 0.22 0.26
Nickel Ni mg/kg 18 10.89 13.70 18.05 3.53 6.00 8.51 5.09 39.11 33.22
Lead Pb mg/kg 35 BD 22.29 10.85 4.10 7.56 5.51 2.36 18.11 33.91
Selenium Se mg/kg 0.08 - 0.58 0.49 0.12 0.24 0.28 0.08 0.93 0.58
Silver Ag mg/kg 1 - 1.25 1.08 1.00 BD 0.43 0.65 4.16 7.18
Strontium Sr mg/kg n/a - 13.30 13.40 2.19 4.83 6.43 5.77 21.32 17.79
Titanium Ti mg/kg n/a - 193.18 241.95 62.27 113.76 97.43 55.17 231.66 144.93
Uranium U mg/k 2.50 - 0.61 0.55 0.12 0.23 0.32 0.20 0.95 0.61
Vanadium V mg/kg n/a 47.46 21.97 26.22 8.08 12.80 15.03 9.29 50.5 33.31
n/a – not available; BD = Below detection limit; #
Botes & Van Staden (2005).
Guideline values derived from Australia-New Zealand (ANZECC, 2000), Netherlands (Friday, 1998) and Canada (Friday, 1998; Hamilton, 2004; Sheppard et
al. 2005);
Constituents shaded in red exceeded the guideline concentrations.

FGD Biodiversity & Wetland Assessment
Natural Scientific Services CC 108
Table 7-28 Comparison between metal concentrations in the sediment and water samples (excluding MD7 and 8)
Constituents Chemical symbol Unit Guideline Value MD1 MD2 MD3 MD4 MD5 MD6
Dec 2015 Dec 2015 Dec 2015 Dec 2015 Dec 2015 Dec 2015
Metals
Sediment Aluminium Al mg/kg n/a 16451.38 26148.15 4497.26 7585.38 8775.56 4901.48
Water Aluminium Al mg/ℓ 0.005 10.25 1.42 7.43 5.36 6.84 20.43
Sediment Chromium Cr mg/kg 26 31.76 44.81 27.05 24.89 23.34 17.17
Water Chromium Cr mg/ℓ 0.007 0.025 <0.01 0.013 <0.01 <0.01 0.026
Sediment Iron Fe mg/kg n/a 11008.71 13629.63 3135.89 5529.10 6588.21 4071.43
Water Iron Fe mg/ℓ 0.1 11.445 0.897 7.836 2.740 3.669 4.588
Sediment Manganese Mn mg/kg 460 161.39 106.79 21.62 73.30 66.43 56.11
Water Manganese Mn mg/ℓ 0.18 0.252 0.013 0.048 0.015 0.132 0.447
Sediment Selenium Se mg/kg 0.08 0.58 0.49 0.12 0.24 0.28 0.08
Water Selenium Se mg/ℓ 0.002 <0.01 <0.01 <0.01 <0.01 <0.01 <0.01
Sediment Silver Ag mg/kg 1 1.25 1.08 1.00 BD 0.43 0.65
Water Silver Ag mg/ℓ n/a <0.01 <0.01 <0.01 <0.01 <0.01 <0.01
n/a – not available; BD = Below detection limit;
Guideline values derived from Australia-New Zealand (ANZECC, 2000), Netherlands (Friday, 1998) and Canada (Friday, 1998; Hamilton, 2004; Sheppard et al. 2005);
Constituents shaded in red exceeded the sediment guideline concentrations whilst constituents shaded in blue exceed the WQ guideline concentrations for aquatic ecosystems (DWAF, 1996).

FGD Biodiversity & Wetland Assessment
Natural Scientific Services CC 109
Metals like aluminium (Al) and iron (Fe) are found at high concentrations in the natural
geology and as such often occur in high concentrations in the sediment. Both these metals
are common and no guideline values are described for it. In this study, both the aluminium
and iron concentrations were also high in the water and exceeded the guideline values
(Table 7-28). Aluminum is one of the more toxic metals within a water ecosystem and is
associated with numerous biochemical effects on aquatic biota. For example, aluminum can
cause neuromuscular dysfunction in fish (Colvin et al. 2011) and effects on fish are only
usually evident at concentrations greater than 0.1 to 3.2 mg/l (Dallas & Day, 2004). At five of
the sites i.e. MD1, MD3, MD4, MD5 and MD6, the aluminium concentrations were high than
3.2 mg/l, ranging 5.36 to 20.43 mg/l. However, the pH levels for these sites were neutral and
may slightly limit the toxicity of aluminium. Iron is an important micronutrient but toxic at high
concentrations and inhibits various enzymes. Iron compounds easily oxidize and the high
concentrations observed at all the sites can result in oxygen depletion in these pans.
Many other metals do not have any recommended sediment guideline limits and include
beryllium (Be), boron (B), titanium (Ti), vanadium (V), strontium (Sr) and barium (Ba). These
metals do not have guidelines due to a lack of research in their occurrences in South African
sediment or a lack of information on its toxicity within the sediment environment.
The metals that did have international guideline values indicated that manganese (Mn),
cobalt (Co), zinc (Zn), arsenic (As), molybdenum (Mo), cadmium (Cd) and lead (Pb) did not
exceed the guideline concentrations. Manganese, cadmium, molybdenum, zinc and cobalt
concentrations were significantly lower than the guideline values. Manganese often occurs
at high concentrations in the natural environment in South Africa as the geology contains
high concentrations especially in the Highveld. Soluble manganese mostly occurs under low
dissolved oxygen conditions, which are more than likely in these pans. The manganese
concentrations in the water exceeded the guidelines at MD1 and MD6. Very little known
about the effects on aquatic organisms but elevated levels of manganese are toxic to fish
(Heal, 2001). Cadmium has the potential to be hazardous to aquatic biota and can be
considered toxic and relatively accessible to aquatic organisms (DWAF, 1996). For example,
Oligochaeta (earthworms) and other important soil organisms are very susceptive to
cadmium poisoning and can die at very low concentrations. When cadmium concentrations
in the soil are high it will impact on the soil processes, soil structure and threaten the whole
soil ecosystem (Lenntech, 2016).
The chromium (Cr) concentrations exceeded the guideline concentration at site MD1, MD2
and MD3 from the December 2015 survey. The chromium concentrations at site MD7 and
MD8 during the November 2016 survey also exceeded the guideline concentrations.
However, site MD4 and MD5 also contained chromium concentrations that were close to the
26 mg/kg guideline. In natural ecosystems, chromium is generally a scarce metal and the
concentrations are low in aquatic ecosystems. When the chromium levels are elevated it
generally is a consequence of industrial activities (DWAF, 1996). A study by Botes & Van
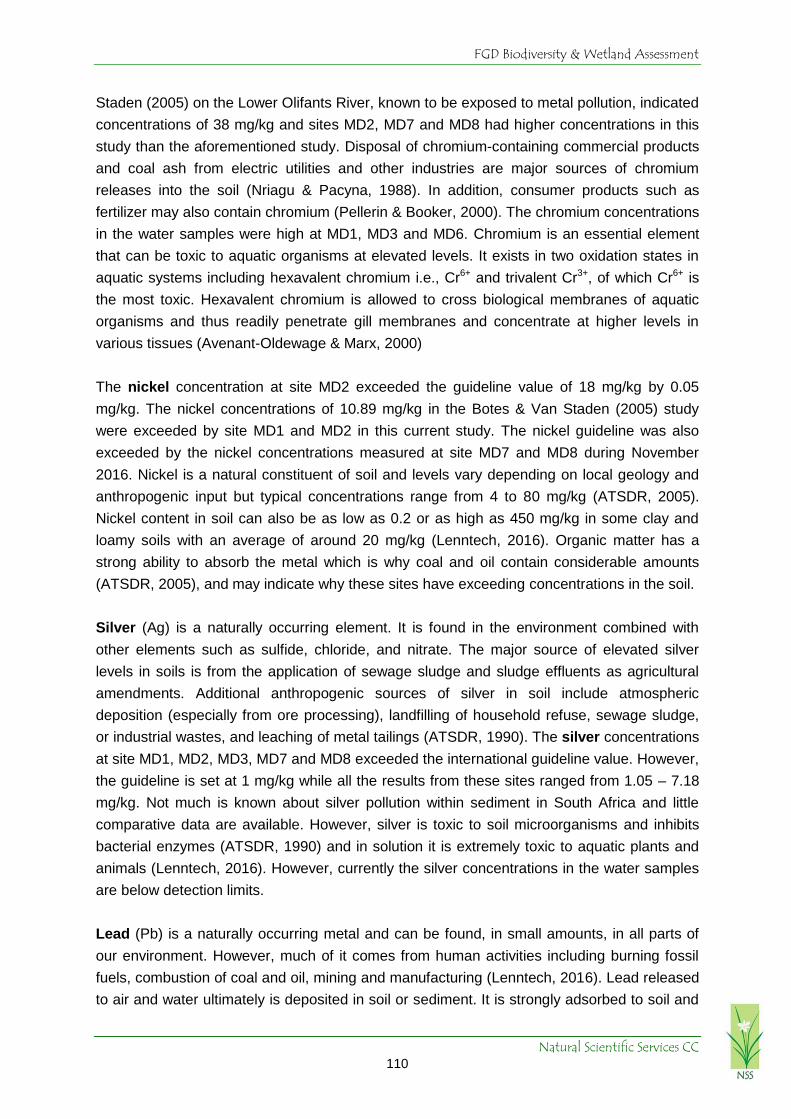
FGD Biodiversity & Wetland Assessment
Natural Scientific Services CC 110
Staden (2005) on the Lower Olifants River, known to be exposed to metal pollution, indicated
concentrations of 38 mg/kg and sites MD2, MD7 and MD8 had higher concentrations in this
study than the aforementioned study. Disposal of chromium-containing commercial products
and coal ash from electric utilities and other industries are major sources of chromium
releases into the soil (Nriagu & Pacyna, 1988). In addition, consumer products such as
fertilizer may also contain chromium (Pellerin & Booker, 2000). The chromium concentrations
in the water samples were high at MD1, MD3 and MD6. Chromium is an essential element
that can be toxic to aquatic organisms at elevated levels. It exists in two oxidation states in
aquatic systems including hexavalent chromium i.e., Cr6+ and trivalent Cr3+, of which Cr6+ is
the most toxic. Hexavalent chromium is allowed to cross biological membranes of aquatic
organisms and thus readily penetrate gill membranes and concentrate at higher levels in
various tissues (Avenant-Oldewage & Marx, 2000)
The nickel concentration at site MD2 exceeded the guideline value of 18 mg/kg by 0.05
mg/kg. The nickel concentrations of 10.89 mg/kg in the Botes & Van Staden (2005) study
were exceeded by site MD1 and MD2 in this current study. The nickel guideline was also
exceeded by the nickel concentrations measured at site MD7 and MD8 during November
2016. Nickel is a natural constituent of soil and levels vary depending on local geology and
anthropogenic input but typical concentrations range from 4 to 80 mg/kg (ATSDR, 2005).
Nickel content in soil can also be as low as 0.2 or as high as 450 mg/kg in some clay and
loamy soils with an average of around 20 mg/kg (Lenntech, 2016). Organic matter has a
strong ability to absorb the metal which is why coal and oil contain considerable amounts
(ATSDR, 2005), and may indicate why these sites have exceeding concentrations in the soil.
Silver (Ag) is a naturally occurring element. It is found in the environment combined with
other elements such as sulfide, chloride, and nitrate. The major source of elevated silver
levels in soils is from the application of sewage sludge and sludge effluents as agricultural
amendments. Additional anthropogenic sources of silver in soil include atmospheric
deposition (especially from ore processing), landfilling of household refuse, sewage sludge,
or industrial wastes, and leaching of metal tailings (ATSDR, 1990). The silver concentrations
at site MD1, MD2, MD3, MD7 and MD8 exceeded the international guideline value. However,
the guideline is set at 1 mg/kg while all the results from these sites ranged from 1.05 – 7.18
mg/kg. Not much is known about silver pollution within sediment in South Africa and little
comparative data are available. However, silver is toxic to soil microorganisms and inhibits
bacterial enzymes (ATSDR, 1990) and in solution it is extremely toxic to aquatic plants and
animals (Lenntech, 2016). However, currently the silver concentrations in the water samples
are below detection limits.
Lead (Pb) is a naturally occurring metal and can be found, in small amounts, in all parts of
our environment. However, much of it comes from human activities including burning fossil
fuels, combustion of coal and oil, mining and manufacturing (Lenntech, 2016). Lead released
to air and water ultimately is deposited in soil or sediment. It is strongly adsorbed to soil and

FGD Biodiversity & Wetland Assessment
Natural Scientific Services CC 111
therefore it is generally retained in the upper layers of soil and does not leach appreciably
into the subsoil and groundwater (ATSDR, 2007). The natural lead content of soil typically
ranges from 10 to 30 mg/kg. However, lead levels in the top layers of soil vary widely due to
deposition and accumulation of atmospheric particulates from anthropogenic sources
(ATSDR, 2007). Lead concentrations in the sediment did not exceed the 35 mg/kg guideline
value but it was measured at 22 mg/kg at site MD2 and very close to the Guideline for MD8
(33mg/kg) which are significantly higher than measured at the other sites. Lead
concentrations were not detected above the concentrations in the Botes & Van Staden
(2005) study. Lead can potentially be hazardous and toxic to aquatic biota and is relatively
accessible to aquatic organisms (DWAF, 1996) if high concentrations are present in the
environment. Lead is toxic in high concentrations and sub-lethal concentrations result in the
regression of the physiological or behavioural processes of the aquatic organism, and
therefore reducing its overall fitness.
According to ATSDR (2003), selenium occurs naturally in the environment and can be
released by both natural and manufacturing processes. It also enters water from rocks and
soil, and from agricultural and industrial waste. Some selenium compounds will dissolve in
water, and some will settle to the bottom as particles. Weathering of rocks and soils may
result in low levels of selenium in water, which may be taken up by plants. Disposal of
selenium in commercial products and waste could also increase the amount of selenium in
soil. Selenium that may be present in fossil fuels combines with oxygen when burned, which
may then react with water to form soluble selenium compounds (ATSDR, 2003). Selenium is
most likely to enter the air through coal and oil combustion, as selenium dioxide (Lenntech,
2016) or airborne particles of selenium, such as in ash, can settle on soil or surface water
(ATSDR, 2003). Due to irrigation run-off, concentrations of selenium tend to be very high in
aquatic organisms in many areas (Lenntech, 2016). The forms and fate of selenium in soil
depend largely on the acidity of the surroundings and its interaction with oxygen. In the
absence of oxygen when the soil is acidic, the amount of selenium that can enter plants and
organisms should be low. Various studies estimated natural selenium concentration of most
soils to be between 0.01 and 0.2 mg/kg (Lenntech, 2016). Selenium concentrations
exceeded the guideline value at all of the sites in the study area. The selenium
concentrations ranged from 0.08 to 0.57 mg/kg which is above the guideline value of 0.08
mg/kg. The selenium concentrations were the highest at site MD1, MD7 and MD8. The
concentrations decreased from site MD1 towards site MD6. Sites MD1, MD7 and MD8 had
similar concentrations. Selenium is a necessary trace element in animals for some enzyme
processes. However, elevated levels can interfere in biological substances containing
sulphur due to selenium’s similarity to sulphur. This can cause toxic effects in fish and
invertebrates. In addition, aquatic animals absorb or accumulate extremely high
concentrations of selenium that will be passed up through the food chain that can cause
reproductive failure and birth defects in animals and humans (Lenntech, 2016).

FGD Biodiversity & Wetland Assessment
Natural Scientific Services CC 112
The copper concentrations at site MD7 and MD8 were above the international guideline
concentration of 16 mg/kg. In general, the copper concentrations at site MD7 and site MD8
were higher than the concentrations measured at site MD1 to site MD6.
In summary, the metal analysis indicated that five metals showed increased concentrations
above the international guideline values. The general trend within the results indicated that
the highest concentrations of the majority of the metals were seen at site MD1 and MD2
during the December 2015 survey. The concentrations of metals at the other sites were in
most cases significantly lower. The November 2016 survey indicated that the metal
concentrations in the samples within the ADF footprint, which exceeded guidelines values,
were chromium, copper, selenium, nickel, and silver. The concentrations were generally
higher than seen at sites sampled during the December 2015 sampling sites.
Anthropogenic contaminants such as metals take various pathways once they have entered
the aquatic environment. These pathways include the adsorption of contaminants to the
surfaces of sediments and colloids and deposition into organic debris contained in silts
(ATSDR, 2012a; 2012b & 2013). These sediments then become potential sources of
contamination of the water column and subsequently biota, as they play a role in the
remobilisation of contaminants in these systems (Yohannes et al. 2013). Contaminants
trapped in sediments tend to have long residence times and these sediments may serve as a
constant supply of contaminants to the surrounding environment (Filgueiras et al. 2004).
Metals are generally subject to immobilisation and deposition, and changes in properties
such as pH, conductivity, temperature, dissolved oxygen and turbidity affect the speciation
and distribution of many metals. The solubility of metals is found to increase under changing
pH and as a result increase these metals’ potential to become bioavailable as they move
from sediments into the water column.
Although some of the metal concentrations were high in the sediment i.e. chromium,
selenium and silver, these metal concentrations in the water samples were generally low
(Table 7-28). This could potentially indicate that the metal concentrations measured in the
sediment could be natural background concentrations and exceeding the international
guidelines does not necessarily indicate pollution. However, those samples with exceeded
concentrations were closest to the ADF and Coal Stockpile area. This was further confirmed
with the two pan samples (MD7 and MD8) in the November 2016 analysis. In addition, the
concentrations of aluminium, chromium, iron and manganese were high in the water
samples. It is recommended to continue monitoring the metal concentrations at the selected
sampling sites for a minimum of one survey per year if the proposed waste disposal project,
near any of these sites, will be continued.
7.7.3 Invertebrate within the Sediments
Hot semi-arid areas such as the Lephalele region, are characterized by an abundance of
small temporary or ephemeral pans, which depend on rain for their existence. These habitats

FGD Biodiversity & Wetland Assessment
Natural Scientific Services CC 113
are distinguished by fluctuating and unpredictable changes in their hydrological regime and
of physical and chemical conditions (Lahr, 1996). Their existence, extent and duration
therefore depend on climatic factors and on morphometric and sediment characteristics.
They contain a uniquely adapted fauna that copes in different ways with changing and often
extreme temperatures, oxygen levels, pH, salinity and turbidity. The typical ephemeral pan is
a shallow, closed basin (Belk and Cole, 1975) that usually contains a well-adapted fauna.
Characteristic groups include large Branchiopoda: Anostraca or fairy shrimps, Notostraca or
tadpole shrimps, and Spinicaudata and Laevicaudata (formerly grouped together as
Conchostraca) or clam shrimps. These three groups of crustaceans are often referred to as
phyllopods. Assemblages of species of these groups are found all over the world in hot arid
and semi-arid regions.
The main strategies for these fauna are dormancy (escape in time) and dispersal (escape in
space). However, these adaptations or strategies may affect the impact of toxicants on
individuals, populations and communities of temporary ponds. The physiological adaptations
of species found in temporary ponds are likely to alter the sensitivity to pollutants of
characteristic species. According to Lahr (1996), results from laboratory experiments, for
example, suggest that fairy shrimp (Branchiopoda, Anostraca) may react differently to heavy
metals as the standard test species Daphnia. Life history strategies influence recovery rates
of populations after exposure to acutely toxic substances such as heavy metals. It is also
suggested that slow growth and decreased reproductive capacity of organisms caused by
toxicants may, in ephemeral pans, result in the failure of annual recruitment.
According to Lahr (1995), increased agriculture and mining are likely to increase
environmental contamination by pesticides, fertilizers, heavy metals and other pollutants on
these sensitive and important systems. An overview in an ecotoxicological context of the
adaptations of one group of temporary pond inhabitants from (semi-) arid zones, fairy
shrimps (Branchiopoda,Anostraca), in particular Streptocephalus proboscideus
(Streptocephalidae), has been presented by Brendonck & Persoone (1993). They showed
that the life history traits of these animals make them attractive for application in cost-
effective, cyst-based toxicity.
The aim of the invertebrate hatching within two small pans on site was to determine if any
invertebrate resting eggs were present in the sediment. Initial hatchlings were identified as
Anostraca, fairy shrimp; however, no further identification was possible as the hatchlings did
not survive for them to be identified to a lower taxonomic level. The other taxa that hatched in
the following days were mostly Daphnidae and one Notostraca, tadpole shrimp, from site
MD8. The Notostraca is most probably Triops granarius as only two species are found in
South Africa. It is important to note that during the early stage of an ephemeral pan filling
with water, populations are usually below the carrying capacity of the system. Species that
are r-selected will be more successful in this nonlimiting environment, which is relatively free
of competition and predation (Brendonck and Persoone 1993). They grow rapidly, mature

FGD Biodiversity & Wetland Assessment
Natural Scientific Services CC 114
early, and produce many offspring. However, if pools are more long-lived, the community
may shift towards the K-end of the r-K continuum. Crustaceans that rapidly colonize newly
filled pans from dormant stages are typical r-species. More competitive, K-selected
predators, such as hemipterans and coleopterans, arrive later by aerial migration. At this
stage many crustaceans disappear.
Due to the extreme rarity of ecotoxicological studies in these habitats, the impact of
chemicals on temporary ponds and its inhabitants are not well known. Crisinel et al.
(1994) compared the acute toxicity of sixteen chemicals (four heavy metals, eleven
organic compounds and one organometallic compound) to nauplii of the Streptocephalus
fairy shrimps with results from the standard test with Daphnia magna (Branchiopoda,
Cladocera). The sensitivity of the Streptocephalus species to heavy metals was slightly
higher than that of D. Magna. Mizutani et al. (1991), while determining the uptake of
heavy metals by the fairy shrimp Branchinecta longiantenna (Branchinectidae), found
that animals exposed to 1.0 mg L-1 zinc or cadmium expired after two days. This also
seems in agreement with the results of Crisinel et al. (1994), and may explain the short
lived nature of the shrimp that were hatched from MD8 and MD7.
Overall, the initial screening for invertebrate egg banks within site MD7 and MD8 were
positive and it is recommended that detailed hatching studies be completed on the pans
surrounding the ADF and MPS, in the long term, if any impact to these systems are
predicted.
7.8. Eco-system Services
Despite their recognised importance, the scientific understanding of the functioning of
wetlands in arid environments and their associated ecosystem services is incomplete (Tooth,
2015). Although the ecosystem services were not suppose to be assessed, due to the
systems not being palustrine systems (Kotze et al, 2008), Levick et al (2008) highlights the
services offered by these systems:
Semi-ephemeral and non-perennial systems provide the same ecological and
hydrological functions as perennial systems by moving water, nutrients, and
sediment throughout the watershed. When functioning properly, these provide
landscape hydrologic connections; stream energy dissipation during high-water
flows to reduce erosion and improve water quality; surface and subsurface water
storage and exchange; ground-water recharge and discharge; sediment transport,
storage, and deposition to aid in floodplain maintenance and development; nutrient
storage and cycling; wildlife habitat and migration corridors; support for vegetation
communities to help stabilize stream banks and provide wildlife services; and water
supply and water-quality filtering. They provide a wide array of ecological functions
including forage, cover, nesting, and movement corridors for wildlife.

FGD Biodiversity & Wetland Assessment
Natural Scientific Services CC 115
In addition to the Semi-Ephemeral Washes (SEWs) identified on site, a number of pans were
identified. The presence of pans within the moisture stressed environment of the study area
means that these wetlands are key providers (‘hotspots’) of ecosystem services, including
water and food supply (Tooth, 2015). The Millennium Ecosystem Assessment (2005) and the
UNEP’s Global Deserts Outlook (Acura, 2006) both highlighted that in moisture stressed
environments such as the study area wetland ecosystem services are unbalanced and may
provide the only supply of fundamental water and food resources.
The concern with pans is that they perform few of the functions normally associated with
wetlands and could therefore be seen as less important systems (Ferreira, 2012), which is
not the case. In addition to the provision of water, these depressions provide a unique habitat
in terms of biodiversity maintenance, precipitation of minerals and the distribution of
accumulated salts and nutrients during the dry months.
In general pans can provide the following services (Kotze et al., 2008):
Flood attenuation. The opportunity for attenuating floods is limited by the position of
pans in the landscape, which are generally isolated from stream channels. However,
they do capture runoff because of their inward draining nature, and thus they reduce
the volume of surface water that would otherwise reach the stream system during
storm flow conditions.
Precipitation of minerals. Temporary pans allow for the precipitation of minerals,
including phosphate minerals due to the concentrating effects of evaporation.
Nitrogen cycling is likely to be important with some losses due to denitrification, and
volatilization in the case of high pH.
The penology, geology and climate influence the response of these pan systems to
nutrient inputs. In pans that dry out completely at some stage or another (non-
perennial pans), some of the accumulated salts and nutrients (such as organic
nitrogen, and various phosphate and sulphate salts) can be transported out of the
system by wind and be deposited on the surrounding slopes. Those remaining may
dissolve again when waters enter the system again as the pan fills after rainfall
events.
As a guide, NSS utilised the WET EcoServices tool to obtain an understanding on how the
four HGM units would provide such services. In summary, with all four units, the main service
is Biodiversity Maintenance. This is evident during high rainfall events when these areas
become inundated and provide breeding and foraging habitat for an array of species. In
addition to this, the Semi-Ephemeral Washes also provided services for toxicant and nitrate
removal as well as phosphate and sediment trapping.

FGD Biodiversity & Wetland Assessment
Natural Scientific Services CC 116
Figure 7-20 Estimated - Ecosystem Services
Combined NSS surveys shows that the MPS and ADF sites (including 500m buffer) support
20 frog species, representing 74 % of the regional amphibian diversity. During high rainfall
events, NSS recorded 16 species in total within the study area (Figure 7-10). Both of the 2
regionally occurring CIS namely African and Giant Bullfrog were recorded in the study area.
A high rainfall event (38 mm in early December 2015) during the second NSS visit triggered
the emergence of exceptionally high densities of winged termites and subsequently African
Bullfrog and various other species en masse around the pools within the drainage features.
The breeding frenzy which insued drastically increased detection rate, and emphasised the
exceptional abundance of amphibian species in the study area. Both Giant and African
Bullfrog occur sympatrically in the area with the latter generally being regarded as the more
ubiquitous of the two in warm bushveld regions (Du Preez and Carruthers, 2009). Indeed
African Bullfrog were found to be exceptionally abundant and likely breed at the majority of
the pans / depressions within the study area, while in contrast, Giant Bullfrog was only
potentially recorded at one locality in the ADF footprint, a small (historically natural) pan
which has been deepened and widened by excavation. The observation was of a single
froglet (identification tentative based on absence of pale half moon on tympanum usually
indicative of African Bullfrog but age precluded confirmation by labial tooth row formula or
adult colouration and morphology). Species distinction among froglet bullfrogs is notoriously
difficult (A. Channing pers comm.). A recent publication by NSS and Enviro-Insight (Yetman
0.0
1.0
2.0
3.0
4.0Flood attenuation
Streamflow regulation
Sediment trapping
Phospahte trapping
Nitrate removal
Toxicant removal
Erosion control
Carbon storageMaintenance of biodiversity
Water supply for human use
Natural resources
Cultivated foods
Cultural significance
Tourism and recreation
Education and research
SEW 1
0.0
1.0
2.0
3.0
4.0Flood attenuation
Streamflow regulation
Sediment trapping
Phospahte trapping
Nitrate removal
Toxicant removal
Erosion control
Carbon storageMaintenance of biodiversity
Water supply for human use
Natural resources
Cultivated foods
Cultural significance
Tourism and recreation
Education and research
SEW 2
0.0
1.0
2.0
3.0
4.0Flood attenuation
Streamflow regulation
Sediment trapping
Phospahte trapping
Nitrate removal
Toxicant removal
Erosion control
Carbon storageMaintenance of biodiversity
Water supply for human use
Natural resources
Cultivated foods
Cultural significance
Tourism and recreation
Education and research
D 1

FGD Biodiversity & Wetland Assessment
Natural Scientific Services CC 117
and Verburgt, 2015) provides the first records of Giant Bullfrog in the Lephalale region and
the greater Limpopo Sweet Bushveld. The study highlights that the species is likely more
widespread and common in the region than was previously thought and that low detection
levels are likely the result of irregular emergence and breeding in this dry region only during
sufficiently wet summers. Suitable breeding habitat appears to be present for both African
and Giant Bullfrog along the washes and around the depressions within the study area and it
is likely that Giant Bullfrog breeds at more localities within the study area but was not
detected due to timing.
Along with the emergence of frogs, comes the emergence of their predators. Numerous
snakes were also detected during the surveys at a number of pools and depressions. One
species dependant on these systems is the Southern African Python (Python natalensis)
(Figure 7-9).
Distribution data for dragonflies and damselflies provided in Samways (2008) suggests that
approximately 50 species have the potential to occur. These species are frequently found
away from water and / or require only temporarily inundated areas. Of the seven regionally
occurring CIS7 only five namely Sudan Sprite, Little Wisp, Black Emperor, Strong Skimmer
and Silhouette Dropwing are considered likely to occur.
In summary these semi-ephemeral systems are providing an important foraging, breeding
and migration habitat for a diverse array of species and are therefore considered extremely
important.
7.9. Wetland (Ecological) Importance and Sensitivity
In accordance with a recent study by the DWS (2014) on the PES, Ecological Importance
(EI) and Ecological Sensitivity (ES) per Sub Quaternary Reaches for Secondary Catchments
in South Africa, the Sandloop PES is moderately modified (C category) where the loss and
change of natural habitats and biota have occurred but the basic ecosystem functions are
still predominately unchanged. According to the DWS (2014), this river is seriously influenced
by cattle grazing and land-use. The moderate EI of the Sandloop is due to the one wetland
and two riparian habitat types, 12 different types of vegetation cover and three endemic
species in this sub-quaternary catchment with a taxon richness of at least 25 species
(wetland, riparian and aquatic vegetation). The size of stream, morphology and geomorphic
habitat units determine the ES. The Sandloop has a low sensitivity to modified flow
conditions and water level changes because this is an ephemeral system and has a natural
lack of surface water (DWS, 2014).
7 Red listed species or those species with a Dragonfly Biotic Index score of 4 or higher are considered
here to be of conservation importance.

FGD Biodiversity & Wetland Assessment
Natural Scientific Services CC 118
A summary of the Wetland Importance and Sensitivity is highlighted in Table 7-29. The
Ecological Importance and Sensitivity of HGM scored High on a national scale given the
presence of the Sandloop FEPA and its importance from a biodiversity maintenance
perspective. HGM Units SEW 2 and D 4 scored a Very High whereas SEW 3 scored High.
Further discussions on this are highlighted in Section 7.1.4 above. The
hydrological/functional importance or SEW1 and SEW 2 scored a Moderate due to the
scores received for water quality enhancement. Direct Human Benefits for all four units
received a Low/Moderate score. These systems provide little in the way of subsistence
benefits but may provide benefits in terms of tourism etc., due to the number of game farms
around the ADF.
Table 7-29 A Summary of the EIS for the Site
WETLAND IMPORTANCE AND SENSITIVITY
SEW 1 Importance Confidence
ECOLOGICAL IMPORTANCE & SENSITIVITY 4.0 4.2
HYDROLOGICAL/FUNCTIONAL IMPORTANCE 2.2 4.0
DIRECT HUMAN BENEFITS 1.5 3.5
SEW 2 Importance Confidence
ECOLOGICAL IMPORTANCE & SENSITIVITY 4.0 4.2
HYDROLOGICAL/FUNCTIONAL IMPORTANCE 2.1 4.0
DIRECT HUMAN BENEFITS 1.4 3.5
SEW 3 Importance Confidence
ECOLOGICAL IMPORTANCE & SENSITIVITY 2.7 4.2
HYDROLOGICAL/FUNCTIONAL IMPORTANCE 1.7 4.0
DIRECT HUMAN BENEFITS 1.0 3.5
D 4 Importance Confidence
ECOLOGICAL IMPORTANCE & SENSITIVITY 4.0 4.2
HYDROLOGICAL/FUNCTIONAL IMPORTANCE 1.4 4.0
DIRECT HUMAN BENEFITS 1.6 3.5
FGD Biodiversity & Wetland Assessment
Natural Scientific Services CC 119
8. Conservation Important Areas
Different levels of significance: - National, Provincial and Local for the study area and
surrounds are highlighted within this section.
8.1. National Significance
8.1.1 National Water Act (NWA; Act 36 of 1998)
All wetlands / watercourses are protected within South Africa, with their legal protection
extended to include buffer zones (Ferrar & Lotter, 2007). As highlighted in Section 4, South
Africa has various pieces of legislation governing activities in and around wetlands under
International, Regional and National legislation and Guidelines. The National Water Act,
1998, (Act 36 of 1998) (NWA) is the principle legal instrument relating to water resource
management in South Africa. All wetlands are protected under the NWA. The NWA
acknowledges:
“the National Government's overall responsibility for and authority over the nation's
water resources and their use, including the equitable allocation of water for
beneficial use, the redistribution of water, and international water matters.”
As per Chapter 3 of the NWA: Protection of Water Resources:
“The protection of water resources is fundamentally related to their use,
development, conservation, management and control. Parts 1, 2 and 3 of this
Chapter lay down a series of measures which are together intended to ensure the
comprehensive protection of all water resources. “
The Sandloop River, the Washes and Depressions are ephemeral in nature but are still
considered drainage features (watercourses) and would therefore be protected under the
NWA.
8.1.2 National Freshwater Ecosystem Priority Area
National Freshwater Ecosystem Priority Areas (NFEPAs) provides guidance on how many
rivers, wetlands and estuaries, and which ones, should remain in a natural or near-natural
condition. It supports the implementation of the National Water Act (NWA), the Biodiversity
Act (NEMBA) and the Protected Areas Act (NEMPAA).
For the study area, the NFEPA Project recognises the Sandloop System as a FEPA River
(Figure 8-1). This system is rated regionally as having a Moderately Modified (or C) PES.
The NFEPA guidelines indicate that FEPAs should be regarded as ecologically important
and as generally sensitive to changes in water quality and quantity, owing to their role in
protecting freshwater ecosystems and supporting sustainable use of water resources.

FGD Biodiversity & Wetland Assessment
Natural Scientific Services CC 120
Wetland and river FEPAs currently in a good ecological condition should be managed to
maintain this condition. Those currently not in a good condition should be rehabilitated to the
best attainable ecological condition. Land-use practices or activities that will lead to
deterioration in the current condition of a FEPA are considered unacceptable, and land-use
practices or activities that will make rehabilitation of a FEPA difficult or impossible are also
considered unacceptable.
“Applications for mining and prospecting in FEPAs and associated sub-quaternary
catchments should be subject to rigorous environmental and water assessment and
authorisation processes, as mining has a widespread and major negative impact on
freshwater ecosystems” (Driver et al. 2011). Furthermore: mining in any form should not be
permitted in FEPAs, or within 1km of a riverine FEPA buffer. No prospecting should occur in
FEPAs or within 1km of a riverine FEPA buffer. Care should be taken to reduce the risks of
aquifer penetration when drilling, wherever this occurs.
8.1.3 Priority Areas
During the National Spatial Biodiversity Assessment (NSBA), nine Priority Areas were
identified for biodiversity conservation in South Africa (Driver et al. 2004). Priority Areas were
allocated where broad-scale habitat remained unprotected or was inadequately conserved.
There are no listed SANBI Priority Areas within the study area.
8.1.4 Threatened Ecosystems
A list of Threatened Ecosystems within the nine national Priority Areas was gazetted on 9
December 2011 in NEM: BA (Act 10 of 2004). The identified Threatened Ecosystems occupy
9.5% of South Africa and were selected according to six criteria including: 1) irreversible
habitat loss; 2) ecosystem degradation; 3) rate of habitat loss; 4) limited habitat extent and
imminent threat; 5) threatened plant species associations; and 6) threatened animal species
associations. The purpose of listing threatened ecosystems is primarily to reduce the rate of
ecosystem and species extinction. This includes preventing further degradation and loss of
structure, function and composition of threatened ecosystems.
There are currently no Threatened Ecosystems within the larger region around the study site.
The closest vegetation type under threat is the Springbokflats Thornveld.
8.1.5 Mining and Biodiversity Guideline: Mainstreaming biodiversity into the mining
sector (2003).
The Mining and Biodiversity Guidelines document (MBG) (DEA et al. 2013), was consulted
for this project, as a number of activities on site are defined within GN704 (GG20119, June
1999) as a mining related activity. The MBG highlights the Sandloop River and surrounding
habitat as having Highest Importance for Biodiversity (Figure 8-4).

FGD Biodiversity & Wetland Assessment
Natural Scientific Services CC 121
8.2. Provincial Significance
8.2.1 Limpopo Biodiversity Conservation Plan (C-Plan 2)
According to the Limpopo C-Plan, the study area is situated within a provincial Ecological
Support Area (ESA) and Critical Biodiversity Area 1 (CBA). CBA’s “are the portfolio of sites
that are required to meet the region's biodiversity targets, and need to be maintained in the
appropriate condition for their category. ESAs “are not essential for meeting biodiversity
targets but play an important role in supporting the ecological functioning of Critical
Biodiversity Areas (CBA) and/or in delivering ecosystem services.” Landscape Corridors
provide the best landscape connectivity to support and enable biodiversity to adapt to the
impacts of climate change. Local corridors represent “fine scale connectivity pathways that
contribute to connectivity between climate change focal areas.” Species-specific ESAs are
“required for the persistence of specific species”.
8.2.2 Waterberg Bioregional Plan
The Waterberg District Bioregional Plan (WDBP; Desmet et al. 2016) was developed from
the Limpopo Conservation Plan (C-Plan) version 2 (Desmet et al. 2013) together with input
from stakeholders and available integrated spatial planning tools for the District.
Consequently, some differences exist between Terrestrial and Aquatic Critical Biodiversity
Areas (CBAs) that have been identified in the WDBP, and similar areas that were identified in
the Limpopo C-Plan. Draft WDBP data for the Medupi study area are depicted in Figure 8-3.
The primary conservation concern should be the preservation of a buffer around the
Sandloopspruit FEPA (where the C-Plan CBA 1 and the WDBP Aquatic ESA and Terrestrial
CBA 1 are indicated), whilst preservation of terrestrial habitat (where the C-Plan ESA and the
WDBP Terrestrial CBA 2 are indicated) should be regarded as a secondary priority.
8.3. Local Significance
Areas of local significance are those areas within the study area that have been highlighted
because of their:
Ecological Sensitivity (including renewability/success for rehabilitation);
Level/Extent of Disturbance.
Presence of CI species, (identified at the vegetation unit/habitat level); and
Conservation Value (at a regional, national, provincial and local scale);
The identified vegetation units within the study site were qualitatively assigned Low to High
biodiversity conservation importance or significance. This was based on results of the
different sampling runs over the years (as highlighted in the methodology), previous
assessments in the area, and our collective professional experience with ecological systems
and processes.

FGD Biodiversity & Wetland Assessment
Natural Scientific Services CC 122
It is important to bear in mind the 1:100 year floodline as delineated by Golder (2017) - see
Figure 7-12. As all wetlands are deemed Protected and Important (Sensitive), this map
therefore also highlights the following:
All Wetland Areas are marked as High
A 1km Medium-High Buffer is provided to the Sandloop System (in line with FEPA;
MBG and the Limpopo C-Plan).
As the area is so flat a 100m Buffer is placed on all Washes and Depressions – This is
marked as Medium-High
The qualitative assessment criteria are summarized in Table 8-1 and mapped in Figure 8-5.

FGD Biodiversity & Wetland Assessment
Natural Scientific Services CC 123
Figure 8-1 Freshwater Ecosystem Priority Areas and Limpopo Cplan for the greater study area

FGD Biodiversity & Wetland Assessment
Natural Scientific Services CC 124
Figure 8-2 Limpopo Plains Ecoregions and Present Ecological State
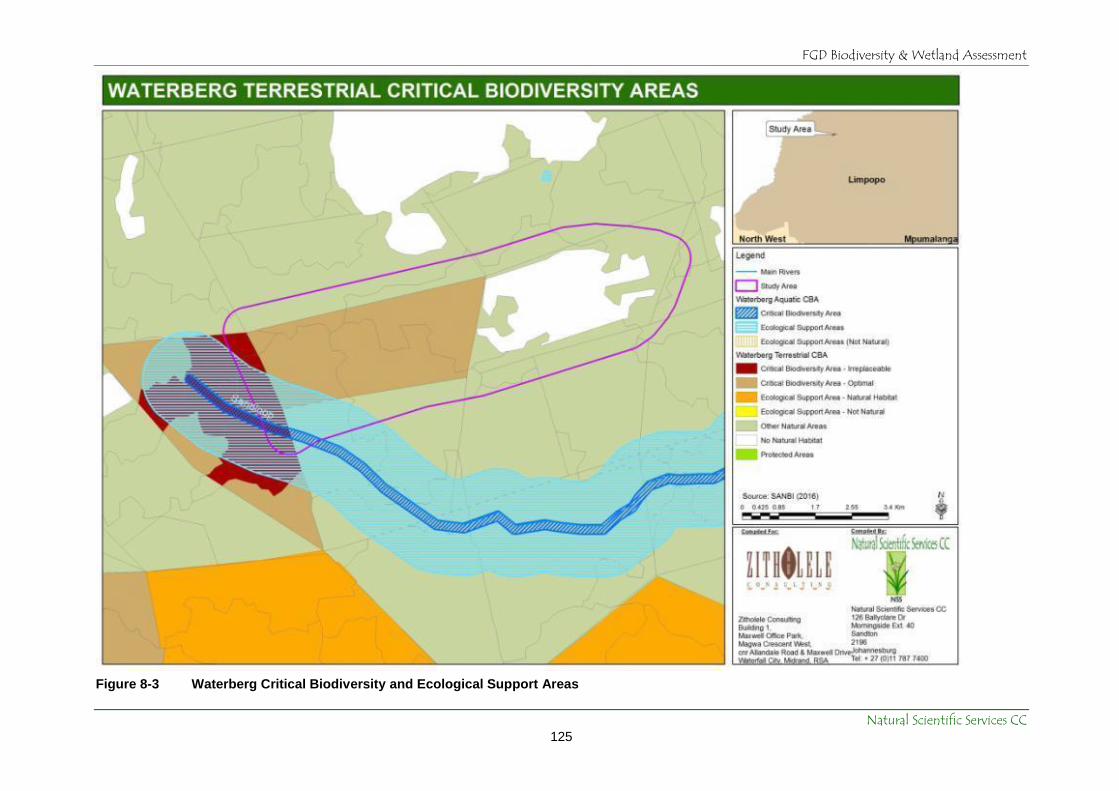
FGD Biodiversity & Wetland Assessment
Natural Scientific Services CC 125
Figure 8-3 Waterberg Critical Biodiversity and Ecological Support Areas

FGD Biodiversity & Wetland Assessment
Natural Scientific Services CC 126
Figure 8-4 Mining and Biodiversity Guidelines for the greater study area

FGD Biodiversity & Wetland Assessment
Natural Scientific Services CC 127
Table 8-1 Sensitivity rating of different habitats / floral communities in the study area.
UN
IT HABITAT &
FLORAL COMMUNITY
CURRENT CONDITION & IMPACTS SUCCESS FOR REHABILITA-
TION CI SPECIES
REGIONAL CONSERVATION VALUE
OVERALL SIGNIFICANCE
*
Natural Areas
Acacia erubescens - Grewia Thornveld
Understorey has limited herbaceous cover (sampling in the mid summer season) – only tree cover dominant.
Limited cover for faunal species and limited floral diversity
2.26% of the study area
Difficult to rehabilitate to a similar natural state due to the soil structure and arid conditions. Extended effort will be required to ensure successful rehabilitation. According to Kevin et al (2010), moisture is the most important ecological factor necessary for successful rehabilitation of denuded patches in semi-arid environments.
Limited Herpetofauna and avifaunal species utilise this area
Scattered PT species
Least Concern Vegetation Unit
Limpopo C-Plan – CBA and within FEPA buffer
MEDIUM
Acacia nigrescens - Grewia Open Veld
Typical Habitat for the region with a diversity of tree, grass and forb species
Understorey –grass layer more dominant than shrub
Limited alien invasives present
Fragmentation is occurring
9.19% of the study area
Habitat utilisation for numerous faunal species.
Potential foraging area for Giant Bullfrog
PT floral species present
Least Concern Vegetation Unit
Limpopo C-Plan - ESA
MEDIUM
Acacia nigrescens –Combretum apiculatum dominated woodland
Typical Habitat for the region with a diversity of tree, grass and forb species
Limited alien invasives present
Fragmentation is occurring
22.87% of the study area
Habitat utilisation for numerous faunal species.
Potential foraging area for Giant Bullfrog
PT floral species present
Least Concern Vegetation Unit
Limpopo C-Plan – CBA and ESA
MEDIUM-HIGH
A nigrescens-Dicrostachys-Grewia fragmented Thornveld
Although fragmented similar to the
Acacia nigrescens –Combretum apiculatum dominated woodland
Limited alien invasives present
Fragmentation is strong
8.27% of the study area
Habitat utilisation for numerous faunal species.
Potential foraging area for Giant Bullfrog
PT floral species present
Least Concern Vegetation Unit
Limpopo C-Plan – CBA and ESA
MEDIUM-LOW
Acacia mixed woodland
Highly fragmented
Alien Invasives present – edge effects occurring
Increase in species such as Dichrostachys cinerea
6.59% of the study area
Potential foraging area for Giant Bullfrog
PT floral species present
Least Concern Vegetation Unit
Limpopo C-Plan - ESA
MEDIUM-LOW
Wetland Areas
Acacia Similar habitat to the A nigrescens The flats will be difficult to Most faunal species rely on Least Concern Vegetation VERY HIGH

FGD Biodiversity & Wetland Assessment
Natural Scientific Services CC 128
UN
IT HABITAT &
FLORAL COMMUNITY
CURRENT CONDITION & IMPACTS SUCCESS FOR REHABILITA-
TION CI SPECIES
REGIONAL CONSERVATION VALUE
OVERALL SIGNIFICANCE
*
dominated Wetland Flat Depressions Artificial water points / Waterbodies
dominated woodlands. Depressions lack vegetation cover
+4% of the study area
rehabilitate, however, NSS in association with Eskom Engineers will be looking at reconstruction depressions outside of the FGD Study Area
these systems in such an arid environment
Breeding area for African and Giant Bullfrog as well as a range of other species
PT floral species present
Unit
NFEPA
CBA (Limpopo and Waterberg); as well as Limpopo C-Plan - ESA
Transformed Areas
Conveyor and associated areas; ADF, MPS, Cleared areas and stockpiles; Gravel road and fence line
Highly transformed
High human presence/activity
46.61% of the study area
As per statement above
Sclerocarya birrea seedlings present on edges of soil stockpile areas.
Potential for CI species to occur are limited
Least Concern Vegetation Unit
Limpopo C-Plan - ESA
LOW
KEY: ESA – Ecological Support Area; PT: Protected Tree

FGD Biodiversity & Wetland Assessment
Natural Scientific Services CC 129
Figure 8-5 Local Significance (Areas of Concern shown only within the study area)

FGD Biodiversity & Wetland Assessment
Natural Scientific Services CC 130
9. Impact Assessment
This impact assessment covers both the ADF and FGD plant and associated infrastructure
areas at Medupi Power Station as it pertains to wetlands and aquatic biota, as well as
terrestrial fauna and flora. Our assessment was completed according to the methodology
prescribed by Zitholele, and in the context of:
Various meetings with Zitholele and Eskom.
Meetings with DWS.
A workshop at Zitholele with all relevant specialists and engineers.
Results from the desktop and field based investigations of fauna, flora, wetlands and
aquatic invertebrates conducted over a period spanning 2014 to the present.
Based on request from Eskom Medupi Management this included the amalgamation
of three separate studies which included:
o Terrestrial Biodiversity Assessment for the ADF Site Alternatives.
o Medupi PowerStation: Railway Yard Ecological Assessment.
o Wetland Assessment for the Proposed Ash Disposal Facility at Medupi Power
Station.
Relevant international, national and provincial legislation and policies.
The national and provincial significance of wetlands and their local biodiversity, as
highlighted e.g. by the NFEPA, the Mining and Biodiversity Guideline, etc.
Significance Rating for the wetlands and associated buffer zones.
It is important to note that a number of mitigation measures have been specified in
conceptual engineering plans to prevent contamination of the environment as a result of the
FGD plant (refer to engineering reports). Additionally the design philosophy of the ADF and
associated infrastructure has incorporated a number of measures aimed at reducing adverse
effects to the environment. These are outlined in a number of reports as relevant to the ADF
from Jones & Wagner (PTY) LTD (Report Numbers.: JW057/10/B754; JW68/14/D650 – Rev
B; JW253/14/E009 – Rev0). Key mitigation measures as relevant from these reports are
summarised below:
The MPS ADF will be the first of Eskom’s ash disposal facilities to be lined.
Additionally the PCD and storm water management systems will be lined.
An amendment application by Eskom has been submitted to the respective authority
for the installation of a Class C liner system. This liner design is set in terms of the
norms and standards.
It should be noted that Eskom’s MPS received a Record of Decision (Ref: 12/12/20/695) on
19 September 2006 for the Construction of Medupi Power Station (MPS), that specifically
excluded Environmental Authorisation (EA) for the above-ground ashing facility, pending

FGD Biodiversity & Wetland Assessment
Natural Scientific Services CC 131
further investigation. On 23 October 2009 (Ref:12/9/11/L50/6), through further inputs
requested by DEAT, Eskom was granted EA for the Ash Disposal Facility (ADF). However,
the EIA process conducted in 2006 and in 2008 did not identify the presence of wetlands on
site. Subsequent investigations conducted by NSS in 2014 as part of the site selection for the
FGD waste disposal facility revealed the possibility for the presence of wetlands within the
current ADF area. NSS was commissioned to conduct a wetland assessment for this area.
Fieldwork in 2015 and again in late 2016 confirmed the presence of a number of depressions
and semi-arid ephemeral wash wetlands within the area earmarked for the construction of
the ADF. Discovery of wetlands within the proposed infrastructure footprint at such a late
stage, during site clearance and construction of the ADF, has obviously presented a number
of challenges regarding the protection of these water courses. Areas of current disturbance
are shown in Figure 9-8.
Ideally no development should occur within the 1:100 year floodline and 1 km buffer on the
Sandloop FEPA. However, given the circumstances NSS suggested that MPS should
develop several infrastructure design alternatives from an engineering perspective that seek
to primarily avoid development within this area altogether or, if impossible, illustrate designs
that minimise the extent and impact of the footprint on the various HGM units identified as
well as the 1:100 year floodline and Sandloop buffer. Since the initial drafting of this report
Eskom has commissioned a study by Golder to revisit the 1:100 year floodline which has
subsequently been reduced in extent and now only marginally clips the south western
boundary of Site 13. In terms of changes to the ADF design some changes have been made
but these are very small and still encroach similarly on the FEPA buffer and would still see
the loss of pans C20 (bullfrog breeding site) and C21 (possible bullfrog breeding site).
Encouragingly however, C11 appears to have been spared based on the current layout
supplied to NSS.
NOTE: The methodologies for this impact assessment require that impacts are grouped
according to activities. Therefore the most conservative risk rating for each activity has been
provided.
Definitions for the Existing, Cumulative and Residual impacts are provided below:
Existing impacts – The Coal stockpiles and associated traffic movement, the initial
construction of the Medupi ADF (including Earthworks, clearing of vegetation etc) as
well as the MPS.
Cumulative impacts - These include the Existing defined impacts as well as the
completion of the ADF, the FGD retrofit and the disposal of ash and gypsum at the
ADF, as well as the transport of sludge and salts to an existing licensed facility.
Residual impacts – This relates to post mitigation considering the Cumulative
Impacts and assumes that mitigation has been effectively implemented.

FGD Biodiversity & Wetland Assessment
Natural Scientific Services CC 132
Immense vegetation clearing Coal deposition on roads and
surrounds
Clearing of vegetation and topsoil
Seepage from the Pollution Control
Dams
Berms and impeded flow Unnecessary destruction of
surrounding vegetation
Storm water collection southern
portion of the ADF
Coal spills on railway Vegetation clearing
Vegetation clearing Large earthen trench around Site
13
Sources of sedimentation
Figure 9-1 Impacts in the Study Area

FGD Biodiversity & Wetland Assessment
Natural Scientific Services CC 133
9.1. Activity: Site clearing
9.1.1 Impact: Loss of wetland systems
Description: Clearing of vegetation can result in the destruction of wetland habitat
and ecosystem services. Although it is evident that a large portion of the vegetation
has already been cleared and potentially a number of Depressions (pans) and
extensions to the Semi-Ephemeral Washes, further loss of the systems that remain
within the boundary is inevitable, specifically within the current area set aside for the
ADF Footprint (Alternative 5). The existing overall impact risk of the historical clearing
of vegetation is, therefore, rated as Very High (or flawed). Without mitigation, the
overall cumulative impact risk of clearing vegetation for the ADF is rated as Very
High (or flawed).
Mitigation: With effective mitigation, the overall residual impact risk of clearing
vegetation could be reduced to High. The following mitigation is recommended:
Alternatives 1 and 3 present the least amount of wetland loss compared to
Alternatives 2, 4 and 5. Alternative 5 is the current proposed footprint area which
is not an ideal situation but is currently said to be the only practical solution after
some realignment of the ADF design in the south-western corner.
Within Site 13 efforts should be made to situate tools, materials and infrastructure
so as to minimise loss of wetland resources.
Continue to stockpile topsoil and avoid mixing with deeper layers to retain viability
of the seed bank.
Eskom’s EO should regularly monitor progress and implementation of mitigation
measures.
Vegetation should preferably be cleared during winter, when many fauna are less
active or have migrated. If this is not possible a faunal specialist should be on site
during clearing processes.
Clear approved areas only. Site visits reveal that this has the potential to spill
over into other areas very easily.
Demarcate and restrict anthropogenic disturbances to the construction area.
Where possible in the removal process, species such as geophytes should be
collected and stored in a nursery for future rehabilitative efforts around the mine.
Grass seeds can also be collected and stored and used during operation in a
number of rehabilitation exercises.
Construction crews should be informed about the importance of biodiversity
through an induction process. Awareness of potentially harmful animals such as
snakes should also be raised. The appointed EO on site should be trained to
handle snakes.
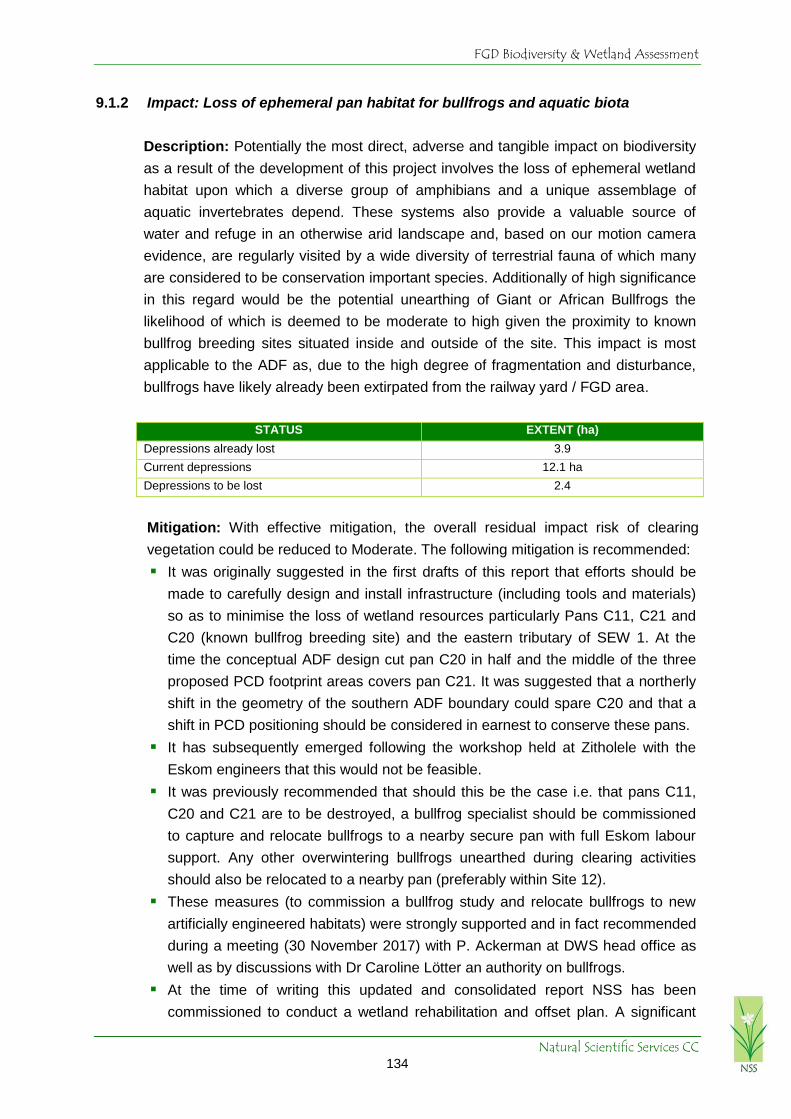
FGD Biodiversity & Wetland Assessment
Natural Scientific Services CC 134
9.1.2 Impact: Loss of ephemeral pan habitat for bullfrogs and aquatic biota
Description: Potentially the most direct, adverse and tangible impact on biodiversity
as a result of the development of this project involves the loss of ephemeral wetland
habitat upon which a diverse group of amphibians and a unique assemblage of
aquatic invertebrates depend. These systems also provide a valuable source of
water and refuge in an otherwise arid landscape and, based on our motion camera
evidence, are regularly visited by a wide diversity of terrestrial fauna of which many
are considered to be conservation important species. Additionally of high significance
in this regard would be the potential unearthing of Giant or African Bullfrogs the
likelihood of which is deemed to be moderate to high given the proximity to known
bullfrog breeding sites situated inside and outside of the site. This impact is most
applicable to the ADF as, due to the high degree of fragmentation and disturbance,
bullfrogs have likely already been extirpated from the railway yard / FGD area.
STATUS EXTENT (ha)
Depressions already lost 3.9
Current depressions 12.1 ha
Depressions to be lost 2.4
Mitigation: With effective mitigation, the overall residual impact risk of clearing
vegetation could be reduced to Moderate. The following mitigation is recommended:
It was originally suggested in the first drafts of this report that efforts should be
made to carefully design and install infrastructure (including tools and materials)
so as to minimise the loss of wetland resources particularly Pans C11, C21 and
C20 (known bullfrog breeding site) and the eastern tributary of SEW 1. At the
time the conceptual ADF design cut pan C20 in half and the middle of the three
proposed PCD footprint areas covers pan C21. It was suggested that a northerly
shift in the geometry of the southern ADF boundary could spare C20 and that a
shift in PCD positioning should be considered in earnest to conserve these pans.
It has subsequently emerged following the workshop held at Zitholele with the
Eskom engineers that this would not be feasible.
It was previously recommended that should this be the case i.e. that pans C11,
C20 and C21 are to be destroyed, a bullfrog specialist should be commissioned
to capture and relocate bullfrogs to a nearby secure pan with full Eskom labour
support. Any other overwintering bullfrogs unearthed during clearing activities
should also be relocated to a nearby pan (preferably within Site 12).
These measures (to commission a bullfrog study and relocate bullfrogs to new
artificially engineered habitats) were strongly supported and in fact recommended
during a meeting (30 November 2017) with P. Ackerman at DWS head office as
well as by discussions with Dr Caroline Lötter an authority on bullfrogs.
At the time of writing this updated and consolidated report NSS has been
commissioned to conduct a wetland rehabilitation and offset plan. A significant

FGD Biodiversity & Wetland Assessment
Natural Scientific Services CC 135
portion of this plan involves close collaboration with Eskom’s amphibian specialist
from EWT with the overarching aim of relocating bullfrogs to newly created pan
habitat outside of the site. Exact methodologies and mitigation measures in this
regard will be outlined in the reports which emanate from this relocation project.
At least some of the larger relocated individuals should be tracked through radio
telemetry or GPS data loggers.
Bullfrogs are explosive breeders that emerge for brief periods of the year
following strong downpours. As such the overall success of relocation efforts
relies heavily on diligent and accurate rainfall monitoring by Eskom and the
issuing of prompt alerts of high rainfall events to the relevant specialists (NSS
and Eskom’s amphibian specialist from EWT).
Any overwintering bullfrogs unearthed during clearing activities (or otherwise)
should be reported to the appointed EWT amphibian specialist or if unavailable
NSS.
The appointed EO and several other staff members on site should be trained to
handle bullfrogs and snakes.
Any bullfrogs found after the relocation efforts should be relocated to one off the
newly created pans that have shown signs of bullfrog establishment (consult
EWT or NSS for advice if necessary).
9.1.3 Impact: Loss of Acacia Woodland Habitat
Description: Clearing activities during construction will result in the direct loss of
remaining vegetation within the ADF and FGD. However, the area in which the rail
yard is to be constructed (eastern section) is already disturbed and contains soil
stockpiles. This section of the site has largely been transformed already and
therefore the impact is expected to be of low significance here. However, following
the workshop held at Zitholele it was suggested that a conservative approach should
be taken that the entire railyard / FGD area would be cleared. The potential loss of
these more natural pockets of Limpopo Sweet Bushveld within the railway yard /
FGD area as well as that within the much larger ADF area this impact is considered
to have a high cumulative impact and a moderate residual impact.
Mitigation: The following mitigation applies:
Clearing needs to occur only within the footprint of the proposed ADF (Alternative
5) and the FGD / railway yard area. If at all possible vegetation in the western
corner of the railway yard area must remain intact and undisturbed.
The area of construction should be fenced to prevent encroachment into
surrounding vegetation.
Any bulbous species or PT species that can be transplanted must be removed.
Alien species must be controlled under the MPS Alien Control Programme.

FGD Biodiversity & Wetland Assessment
Natural Scientific Services CC 136
Figure 9-2 Existing clearing of Acacia woodland for the ADF
9.1.4 Impact: Potential increase in alien vegetation species
Description: Clearing activities during construction will result in an initial decline in
the alien species that are currently on disturbed areas. This, although positive may
only last for the clearing phase of construction. During construction and operation
alien species can increase due to all the disturbances. Furthermore, seedbanks for
species such as Nicotina glauca have already established on site.
Mitigation: The following mitigation applies:
Clearing needs to occur only within the footprint areas and all Category species
must be removed during this process.
Alien species must be monitored and controlled under the MPS Alien Control
Programme.
Construction crew must be made aware of the species that occur on site
specifically Category 1 species and must be trained in the basics for recognition
and removal.
9.1.5 Impact: Potential loss of CI floral species
Description: Clearing activities during construction will result in the direct loss of
remaining vegetation and therefore specific CI species. There are a number of
Protected Tree species present in the area including Sclerocarya birrea subsp. caffra
(marula), Boscia albitrunca and Spirostachys Africana. Sclerocarya birrea is a
keystone plant species, which is rated as one of the most highly valued indigenous
trees because of its multiple uses. It is identified as a key species to support the

FGD Biodiversity & Wetland Assessment
Natural Scientific Services CC 137
livelihood of rural communities and it is central to various commercial activities. It is
also widely used by game in protected areas and by humans in communal areas for
its fruit, wood and medicinal properties (Tshimomola, 2017). As a keystone large tree
species in southern Africa it has been recorded as declining at an unprecedented
rate in areas such as the Kruger National Park (KNP) (Helm & Witkowski, 2012)).
Studies conducted in the KNP showed the loss of adult marula trees in some areas
over the last decade exceeded 25%, with rainfall having a strong influence on
mortality rates temporally and spatially. Overall, marula populations continue to
decline and further local extinctions are possible, not just in the KNP. Given the
clearly unacceptable trends of decline, it is imperative that these Protected species
be conserved across the country where possible.
Boscia albitrunca was not recognised as a Protected tree species in South Africa in
terms of section 12 of the National Forests Act, 1998 (Act No. 84 of 1998), but has
more recently been added due to its role as a Keystone species. This was clearly
evident during the NSS surveys where this species was providing browse to livestock
and game, shade and food and shelter to other species including invertebrates and
birds.
Mitigation: MPS has removed tree species successfully during the construction
phase of their MPS. Therefore the same would apply here. The Environmental
Officer (EO), or trained botanist will be required to tag all Protected Trees within the
footprint for removal and relocation. These individual plants will need to be monitored
over the long term. Permits will be required for the removal process with DAFF. Any
other species that may be identified as CI must either be translocated (if possible) or
specific mitigation must be compiled by a qualified botanist in collaboration with the
MPS EO.
9.1.6 Impact: Potential loss of CI faunal species (excluding bullfrogs and raptors)
Description: This impact relates to CI vertebrate species other than bullfrogs and
raptors. Impact to these faunal groups are discussed in isolation elsewhere in the
impact assessment. Clearing activities during construction may potentially result in
the direct mortality of CI faunal vertebrates or result in their displacement. Although a
wealth of CI species has been found to occur in the properties to the south of the
FGD study area (Site 12 and 2) the impact as it relates to the ADF and FGD
infrastructure is expected to be of Low significance. This is due to the area’s high
degree of vegetation and sensory disturbance levels which appears to have resulted
in a low diversity and conservation status of potentially occurring CI vertebrate
species (other than bullfrogs) within the FGD study area. This impact on the loss of
CI invertebrate species is deemed to have a low significance as well. This is because
although there is some chance of losing CI baboon spider and scorpion species

FGD Biodiversity & Wetland Assessment
Natural Scientific Services CC 138
during clearing, the severity at a regional scale is low given the expansiveness of
similar remaining bushveld habitat.
Mitigation: Clear in winter. It is recommended that immediately prior to clearing that
a walk down be conducted by in conjunction with a suitable specialist, preferably one
with expertise in arachnids, to intensively search the site preferably in the height of
the rainy season (December) to detect and relocate any baboon or trapdoor spiders
or scorpions frogs, tortoises. If any of these species are encountered during
development the specialist with should advise upon and oversee oversee relocation.
9.1.7 Impact: Potential loss of CI raptor species.
Description: This impact is deemed to be of low significance due to the very low
likelihood as no nests were observed on within the FGD study area. Although
suitable nesting structure (Trees > 5m) was present (but limited), disturbance levels
from the power station and current clearing activities is probably too high. However if
nests were overlooked and are destroyed the significance of this impact would be
high given the high (Vulnerable) conservation status of these raptors. Loss of
foraging habitat is considered to be of low significance due to small extent and
fragmented nature of the site that currently supports low game densities.
Mitigation: Mitigation is limited and likelihood is very low. However if a nest of CI
raptor species is encountered, its location should be marked, and it should be
reported to the relevant authorities before construction continues. Normally a
minimum 1km radius buffer or exclusion zone should is applied to such points but
given the complex nature of this project would require in depth consultation with an
appropriately experienced ornithologist. As far as possible large trees above 5m
should be marked and safeguarded in the unaffected areas.
9.1.8 Impact: Loss of foraging habitat for game species.
Description: This is an impact with greatest relevance to the rail way yard area. It is
considered to be of low likelihood but has the potential to be problematic if managed
incorrectly. The extent of remaining natural vegetation is already highly fragmented
and barely large enough to support viable herds of game without significant grazing
supplementation. Currently the proposed disturbance footprint within the railway yard
area does not encroach appreciably into the main patch of natural vegetation but if it
ends up exceeding this area the Kudu and Impala present on site may be left with too
little foraging habitat and would need to be captured and relocated.
Mitigation: Clearly demarcate the footprint area. Minimise disturbance footprint and
restrict construction and operation activities to within the proposed footprint area. The

FGD Biodiversity & Wetland Assessment
Natural Scientific Services CC 139
EO must monitor the carrying capacity relative the game within the Railyard area and
act accordingly to ensure that there is enough grazing land for the existing game
within this area, otherwise implement capture and relocation. If the game are to be
kept then standard game keeping management principles must be adhered to and a
management plan drawn up for the game. All relevant permits must then also be in
place.
9.2. Activity: Construction and operation of the ADF and FGD infrastructure
9.2.1 Impact: Loss of catchment area and consequent decrease in water inputs as a
result of the necessary containment of dirty water runoff
Description: Currently the MPS project as a whole has displaced a large proportion
of wetland catchment area and has undoubtedly acted to reduce water inputs. Flows
which do remain have been largely concentrated and directed into wetlands south of
the greater project area. This situation is likely to be exacerbated in the future under
the construction of the storm water infrastructure which is required to prevent dirty
water from the FGD and ADF from entering the environment. The ephemeral
depressions, washes and Sandloop FEPA in the focal area rely heavily on diffuse
source water inputs from surface and subsurface flows following rainfall events that
are in turn governed by the region’s erratic and intense summer rainfall patterns. The
contents of the ADF are classified as hazardous waste and therefore any water
runoff directly from the facility, by necessity (due to, inter alia, water quality
implications), will be contained within a closed system and separated from clean
water and the receiving environment. An unavoidable consequence of this is the loss
of a significant portion of the catchment area for the depressions and wash wetlands
on site, and the upper reaches of the Sandloop FEPA. The catchment of these
systems was modelled by NSS using USGS derived digital elevation data together
with a channel analysis. The resultant catchment area was calculated as 4320.5 ha.
It should be noted that our estimate on catchment area is largely congruent with that
of the surface water study (4467 ha) conducted by Zitholele (2016). This report
includes catchment losses as a result of the MPS which increases catchment losses
to 49.5 % (Zitholele, 2016). Our estimates are thus more conservative in that they
deal with catchment losses directly as a result of the construction of the ADF alone.
Results of the extent of catchment loss for the various infrastructure alternatives are
given in Table 9-1. This table shows that regardless of the alternative (Alternative 5)
opted for, the degree of catchment loss as a result of the construction of the ADF
remains high with the current footprint resulting in a loss of 584.93 ha (13.54%). This
level of catchment loss will likely result in a reduction in surface water inputs to these
wetland systems and should be regarded as significant especially in light of the arid,
water stressed nature of the receiving environment.

FGD Biodiversity & Wetland Assessment
Natural Scientific Services CC 140
Table 9-1 Extent of catchment loss for the various infrastructure alternatives
INFRASTRUCTURE ALTERNATIVE CATCHMENT LOSS
Alt 1 526.2 ha (12.2 %)
Alt 2 602 ha (13.9)
Alt 3 586.1 ha (13.6)
Alt 4 625.58 ha (14.5)
Alt 5 584.93 (13.54)
Mitigation: The mitigation with regards to catchment loss is limited and the residual
impact risk remains High. Efforts should be centred on minimising catchment loss by
minimizing the ADF, PCD, coal stockpile and other associated infrastructure to as
small an area as possible. Particularly, efforts should be made to minimise any
further encroachment into the Sandloop 1:100 year floodline and 1 km buffer.
Release of clean water into the environment needs to be carefully engineered such
that it enters the watercourses in a diffuse not concentrated flow to prevent erosion.
This involves the use of flow attenuation and spreading structures at outlet points.
The large earthen trench around the site compounds this issue and requires re-
thinking from an engineering perspective. If found to be of value it should constructed
so as to handle surface runoff in high rainfall events such as was observed during the
previous site visit. If its purpose cannot be convincingly motivated it should be
removed, re-landscaped and revalidated.
9.2.2 Impact: Increased faunal mortality
Description: Particularly relevant for species with low dispersal abilities e.g. fossorial
species, tortoises, chameleons and various other reptile and frog species. During
construction clearing will likely dispatch any species in the path of clearing. During
operation, continued mortality is expected as vehicle and train activity increases but
the effects of this are deemed to have Moderate impact..
Mitigation: The site should be searched prior to clearing by an appropriately
qualified specialist and any less mobile fauna relocated. Maintain existing tortoise
road signs and insert new ones where necessary. Continue to enforce speed
regulation controls such as speed humps and limits.
9.3. Activity: Harvesting of hillwash material (topsoil) within the ADF footprint
9.3.1 Impact: Potential loss of wetlands and deterioration in downstream Sandloop
wetland drivers
Description: These somewhat cryptic wetlands were originally not identified by the
appointed specialists during the environmental authorisation process for the MPS

FGD Biodiversity & Wetland Assessment
Natural Scientific Services CC 141
and subsequently the ADF. An EA was granted in 2009 (Ref12/9/11/L50/6). Some of
the depressions and washes were consequently lost through construction activities.
Nevertheless a number of these systems still remain and have the potential to retain
much of their integrity and ecological functioning. The main impact associated with
the harvesting of hillwash material is the potential direct loss of depressions and
semi-arid ephemeral wash wetlands and their vegetation as well as deterioration in
the downstream hydrological and geomorphological drivers of the Sandloop through
changes in water distribution and retention patterns and increased sedimentation
respectively. Without mitigation this impact has the potential to significantly impact
water courses on a national scale with legal ramifications but also the potential loss
of charismatic species such as bullfrogs.
Mitigation: Following mitigation measures and recommendations made in this report
these impacts can be reduced from a High to a Medium and construction could
conceivably occur without detrimentally damaging the ecological integrity and biotic
functioning of these systems. With effective mitigation, the overall cumulative
negative impact risk due to earth works could be reduced to Moderate. The residual
impact is rated as Medium and not Low as there is still the potential for a loss in
water inputs (due to a collection in scraped areas) to the depressions and washes
which rely so heavily on surface water inundation following rainfall events as well as
the ever present potential for increased sedimentation and biotic isolation and
fragmentation of these systems as connecting vegetation is cleared around them.
The following mitigation measures are recommended:
Harvesting of hill wash material must be prohibited within at least 100 m of
the delineated edge of all identified depressions and semi-arid ephemeral
wash wetlands.
Harvesting of hillwash material should not encroach upon the delineated
1:100 year floodline boundary and the 1 km buffer on the Sandloop FEPA).
Ensure that harvesting of hill wash material does not take place within a 500
m radial buffer of the identified bullfrog breeding site (Depression C 20) and
within a 100 m of C20 and C11.
Ensure that the responsible on site personnel have the delineated wetlands
and their associated buffers on their GPSs.
Make sure that these areas are clearly demarcated with high visibility fencing
and prohibit all activities within these areas with signage that indicates it is an
environmentally sensitive area. Keep scraping neat and systematic.
Stockpile topsoil in an area situated as far as possible from all identified
wetlands to avoid sedimentation.
Ensure that measures are taken to contain topsoil during rainfall events and
prevent it washing into the environment. Attempt to maintain the natural
stratigraphy of the topsoil when stockpiling.

FGD Biodiversity & Wetland Assessment
Natural Scientific Services CC 142
Ensure that all guidelines and standards are met with regards to the
stockpiling of topsoil.
The stipulations within the ROD (12/12/20/695) must be adhered to as well as
the EA (Ref: 12/9/11/L50/6).
Additionally a Risk Assessment performed by a suitably qualified professional
will need to be conducted that takes cognisance of the identified wetlands and
the national importance of the Sandloop FEPA.
9.4. Activity: Earth Works (associated with construction of the ADF)
9.4.1 Impact: Deterioration in wetland drivers
Description: Current impacts associated with the earth works specifically during the
current construction of the ADF were rated as High and include:
The clearing of the ADF which has displaced a number of pans and portions
of the upper Sandloop tributaries but also encroaches on the Sandloop FEPA
buffer. Additionally soil berms created adjacent to the ADF are impeding flow
- see Figure 9-2 above.
Erosion and sedimentation. Large V-drains have been dug around the ADF.
As these are not lined with concrete or other stabilising structures some
breakthrough has taken place along the southern boundary. Indeed some of
these breakthroughs have been facilitated by earthmoving equipment in an
attempt to drain the flooded trenches into one of the eastern-most tributary of
HGM unit 1. Currently these berms are not adequate for heavy rainfall and at
certain points, these trenches have failed with sediments etc been washed
downstream.
An increase in herbaceous alien flora is transported along these channels and
washes towards the Sandloop system.
Future impacts from excavating, levelling, compacting and dumping material can
cause:
Further dust, erosion and sedimentation downstream;
Further loss of fossorial fauna such as many of the frogs shown in Figure
7-10.
Proliferation of alien flora and therefore an increase in competition with
indigenous species.
As these activities are already underway the Cumulative Impact is seen to remain as
High. In terms of positive impacts, the earthworks through excavations etc have
created “wetland” habitat for faunal species such as the African and Giant Bullfrog.
These areas also are deep enough to stay wet for longer and provide a source of
drinking water to small animals. This is, however, considered of Moderate
significance (both current and cumulative).

FGD Biodiversity & Wetland Assessment
Natural Scientific Services CC 143
Mitigation: With effective mitigation, the overall cumulative negative impact risk due
to earth works could be reduced to Moderate.
The ultimate aim of the construction of the ADF and associated infrastructure
would have been to attempt to ideally remain outside of or at least opt for
infrastructure layout that minimises the disturbance footprint within the 1:100
year floodline and the 1 km FEPA buffer.
Eskom’s EO to be on site regularly, and to monitor progress and
implementation of mitigation measures.
Daily wetting of exposed surfaces during earth works to control dust (refer to
Air Quality IA for further mitigation measures).
Erosion Management Plan to be compiled and implemented. Measures that
could be considered include:
o Placing biodegradable sand bags around stockpiles, the construction
footprint, etc. As the topography is flat, these are recommended as
opposed to berms.
o Re-investigate the design of the Storm Water Management, specifically
the canals within the southern section of the current ADF footprint. These
are failing in large rainstorm events. The stormwater management and
water balance calculations need to be consulted or revisited to ensure
that the volumes of surface water floodpeaks have not been not
underestimated. The water entering channel immediately around the ADF
must be a closed system. The outer channel surrounding the entire ADF
needs to be reinforced with erosion protection measures such as concrete
or ground reinforcing materials like Terratame 2, particularly along the
southern and western boundaries of the ADF site. If this structure is not
deemed necessary by J&W following the installation of the planned
stormwater management infrastructure then it should be removed and
rehabilitated. Ideally design alternatives of the ADF, stormwater and
associated infrastructure by the engineers that takes cognisance of the
large erratic storm flows volumes and the sensitivity of pans, washes and
Sandloop FEPA needs to be conceived and presented to the relevant
specialists for comment.
o Prevent further overflow of water from the dams to the east of MPS.
o Rehabilitation of areas disturbed both inside and outside of Site 13, these
areas should be identified in the rehabilitation plan.
o Once an infrastructure footprint area has been finalised ensure
rehabilitation of all remaining disturbances outside this area, for example
removal of berms, infill and re-vegetation of borrow pits (Only locally
indigenous flora should be used for re-vegetation of disturbed areas).
o During earthwork sessions a faunal specialist should be on hand for any
species that will require translocation during the construction phase.

FGD Biodiversity & Wetland Assessment
Natural Scientific Services CC 144
o The new ADF ideally should be designed according to the Waste
Classification and Management Regulations and Supporting Norms and
Standards 2013.
9.5. Activity: Increased Traffic, Machinery & Human Activity
9.5.1 Impact: Increased sensory disturbance to fauna
Description: Increased sensory disturbance from lights, traffic, railway noise and
increased human activity is likely to displace a wide range of faunal species. Given
the site’s proximity to the heavily lit and noisy power station this impact is likely to
have a moderate effect on local fauna.
Mitigation: Keep lighting to a minimum during construction but most significantly
during operation. Lights should be angled downwards and hooded to lower light
pollution. Restrict unnecessary access to the remaining patches of natural vegetation.
9.5.2 Impact: Construction related increases in the deposition of residues and dust
as well as roadkill of wetland dependant fauna
Description: Current and future impacts in the study area include:
Coal transport and deposition of coal on the road and side surfaces. As the
topography is relatively flat, with heavy rains this material is transported by
the Semi-ephemeral Washes downstream towards the Sandloop. The
sediment sample analysis suggests potential links between the high heavy
metal content in a number of the samples close to or on site with the coal
operations.
Collision of vehicles with fauna, in particular, many of the frogs, which migrate
between their burrow and breeding sites following heavy rainfall.
An increase in dust and ultimately an increase in sedimentation towards the
NFEPA Sandloop system. It is important to note that the railway line that runs
adjacent to the southern boundary of the proposed ADF is subject to coal
spills. Although this is not a fault on Eskom Medupi’s part, the MPS staff do
proactively take measures to clean these spills on occasion (F. Sono, Eskom
pers. comm).
The existing overall impact risk from traffic and human activity was rated as
Moderate. Increased traffic, machinery and human activity, especially during
construction of the ADF, will likely cause increased pollution (refer to the sediment
analysis of the depressions on site), dust and erosion. Impacts from increased traffic,
machinery and human activity will be of greatest magnitude during the short-term

FGD Biodiversity & Wetland Assessment
Natural Scientific Services CC 145
construction phase. The overall cumulative impact risk from traffic and human activity
was rated as High.
Mitigation: With effective mitigation, the overall cumulative impact risk from
increased traffic and human activity could be reduced to a Moderate rating. To
mitigate impacts from traffic and human activity the following should be applied:
Remain outside of the Sandloop buffer area;
Service and maintain vehicles regularly;
Eskom must ensure that all trucks before leaving the storage area shall be
completely covered with a tarpaulin or any other effective measure/device.
Trucks must not be over-loaded to ensure no spillage during transportation;
Reduce coal movement as much as possible during high wind events;
Proper drainage system shall be provided in the coal storage area so that
water drained from sprinkling and runoff is collected at a common tank and
can be reused after treatment.
Traffic and construction activities should be limited to daylight hours.
Regular surface wetting is required;
Demarcate and restrict anthropogenic disturbances to the construction area.
Measures such as speed humps, signage and fines should be implemented
to reduce speeding and any off-road driving.
Off-road driving must be prohibited in all surrounding natural areas as this
could increase the risks of erosion.
9.6. Activity: Construction clearing and resultant increase in exposed surfaces
during construction of the FGD plant, ADF and associated infrastructure.
9.6.1 Impact: Increase in floodpeaks, sediment loads and erosion to wetlands
Description: Construction of the FGD, ADF and associated infrastructure is likely to
increase the extent of bare soil surfaces. Runoff from these large areas during high
rainfall events may significantly increase sediment loads into the receiving wetland
systems (mainly SEW 1 and 2). Soil erosivity associated with the aeolian sands on
site is high. Consequently any concentration in flow from the construction sites during
high rainfall events is likely to cause some erosion of the head of the wash systems.
Mitigation: The mitigation in this regard centres on stormwater management and
minimising the extent of unnecessarily cleared ground. It is important that earthen
drain around the outer boundary of Site 13 is improved to prevent break through as
was observed following heavy rains in December 2015. This drain should be lined
and reinforced. If any outlet or overflow points are made to release water
accumulated in this trench during construction then it should be done so at multiple
points, each fitted with flow attenuation structures and should tie in with the natural

FGD Biodiversity & Wetland Assessment
Natural Scientific Services CC 146
drainage patterns and not at arbitrary points (See Figure 7-12). Regarding the FGD
and associated infrastructure to the east it would be preferable if the planned
stormwater infrastructure could be constructed first. In any event attempt wherever
possible to conduct the majority of construction during winter. The design philosophy
of rehabilitation following the advancing face of the ADF should be implemented, with
the primary goal being to establish a stable, indigenously vegetated topsoil cap as
soon as possible.
Erosion and Storm Water Management Plan must be revised to allow for
heavy rainfall events.
Pamphlets should be designed and included into induction processes. These
should include as a minimum:
o Wetlands and their importance.
o The role of the nearby FEPA and surrounding habitat;
o General environmental management processes such as recycling;
littering, species (e.g. bullfrog) harvesting, etc.
9.7. Activity: Trucking Waste to Holfontein
9.7.1 Impact: Spills, roadkills and other traffic associated impacts
Description: There are no current impacts on this activity and the waste is yet to be
transported to a waste Disposal Facility. “The trucking of Type 1 wastes to Holfontein
will be carried out for a limited period, until the second EIA is approved and the salts
and sludge can be disposed of at Site 13 and the additional site” (pers.comm.
Zitholele). The cumulative impact risk from trucking the waste was rated as Moderate.
Potential future impacts could include:
Spills of this waste from trucking.
Collision of vehicles with fauna, in particular, many of the frogs, which migrate
between their burrow and breeding sites following heavy rainfall.
Vehicle accidents along the route, and potential spills.
Mitigation: With effective mitigation, the overall cumulative impact risk from
increased trucking could be reduced to Moderate. To mitigate impacts from trucking
the following should be applied:
Service and maintain vehicles regularly;
Drivers must undergo regular testing in terms of drivers skills etc;
Waste in the trucks must be sealed for the transportation;
Trucking should be limited to daylight hours, with frequent stopping along the
route to allow for rest breaks;
A Hazard Plan must be compiled with the procedure following a spill clearly
defined. This Plan must include the relevant ‘Clean-Up’ companies and their
contact details.

FGD Biodiversity & Wetland Assessment
Natural Scientific Services CC 147
9.8. Activity: Storage of substrates and by-products associated with the ADF
and FGD operation.
9.8.1 Impact: Contamination of wetlands from storage facilities associated with the
ADF and FGD– Consequences for bullfrogs and aquatic invertebrates.
Description: The cumulative impact is rated as High while the residual impact may
be reduced to Moderate. We have adopted a precautionary approach in not dropping
it to low given observed stormwater infrastructure and coal PCD failure and
overtopping respectively and given the increasing intensity of rainfall events that has
been observed.
The existing impacts of contamination to bullfrogs, aquatic invertebrates and other
biota dependant on the ephemeral pans and washes within the study area centre on
elevated coal and heavy metal concentrations within the sediments and water
column. Sediment analysis revealed heavy metal deposition within the ephemeral
systems particularly at pans closest to the current activities on the MPS and ADF
sites. In addition to this, the invertebrate hatching procedure yielded Fairy Shrimp
within the first three days. However, these hatchlings did not survive. Past studies
have shown that heavy metals have affected the population dynamics of this genus.
With the high levels recorded within the sediment samples, this may be the cause of
the hatchlings not surviving. Poor operation and maintenance of the FGD and ADF
could lead to further heavy metal deposition in the ephemeral systems and thereby
altering and reducing invertebrate population dynamics within these systems. A
cumulative effect on altering and reducing invertebrate population dynamics within
the ephemeral systems was also rated as High.
In the near future the flue gas desulphurisation process poses a potential
contamination hazard to nearby water courses (SEW 2) and associated biota.
Potential contaminants include the limestone which is used as a sorbent, gypsum the
by-product of the desulphurisation process and manganese a substance present in
the limestone. Although the limestone and gypsum themselves are not regarded as
toxic, the high pH levels associated with lime slurry (pH 12.5) may be lethal to aquatic
biota. Increased water hardness is an additional impact. SEW 2 is highly ephemeral
and likely does not support fish however it does support a number of amphibian and
aquatic invertebrate species. Effects to these organisms from highly alkaline waters
may include death, damage to outer surfaces such as eyes and skin and an inability
to dispose of metabolic wastes. Frog embryo development, in particular, has been to
shown to be drastically impaired at pH levels above 11.5 (Padhye & Ghate, 1988).
High pH may also increase the toxicity of other substances. For example, the toxicity

FGD Biodiversity & Wetland Assessment
Natural Scientific Services CC 148
of ammonia is ten times more severe at a pH of 8 than it is at pH 7. Ammonia is toxic
to aquatic life when it appears in alkaline conditions.
It emerged from the workshop held at Zitholele on 11 December 2017 that the exact
source for the limestone and therefore its exact composition was thus unknown. It
was further noted, however, that the limestone used usually comprises a high
manganese content. Manganese generally occurs at high concentrations in the
natural environment in South Africa especially in the Highveld. Our readings of
manganese from downstream pans taken prior to construction of the FGD show
acceptable levels within the sediments and slightly exceeding levels in the water
column. The manganese concentrations in the water exceeded the guideline at MD1
and MD6. Very little known about the effects on aquatic organisms but elevated levels
of manganese are toxic to fish (Heal, 2001). A thesis by Reimer (1999) investigated
the effects of manganese on aquatic fish, macroinvertebrates and algae in British
Columbia using lethal dose (LD50) testing for acute and chronic levels. The author
found that acute levels range between 0.6 mg/L to 3.8 (exposure less than 95
minutes) and chronic levels range between 0.6 to 1.9 mg/L but importantly that the
actual LD50 concentration decreased with increasing water hardness. Manganese
becomes biologically active when it enters its soluble state. Soluble manganese
mostly occurs under low dissolved oxygen conditions. Therefore the naturally low
dissolved oxygen levels and high water hardness within the regions pans together
with the potential for increased water hardness from the stockpiles of limestone
(calcium carbonate) to be stored within the FGD project area provide an environment
conducive to manganese toxicity. However the concentrations of manganese that
have the potential to be leached from the limestone stockpiles and slurry are
unknown and need to be established.
One of the potential sources for contamination includes spillages of gypsum during
transportation via the conveyor system from the waste water treatment plant to the
storage area and in turn from the storage area to its ultimate destination be it the ADF
or a prospective buyer. Under this scenario the main mitigating factor is likely to be
the dirty water system which feeds into the MPS dirty water dam. Another potential
source for contamination is spillages from trucks. Lastly the slurry / sorbent dams
themselves may be a source for contamination due to overtopping (mis-calculated
water balance and extreme rainfall events). The gypsum offtake structure itself is
another potential source for contamination following high rainfall events. Oil
transformer and pit areas pose a risk of hydrocarbon contamination. In the event of a
spill oil and other hydrocarbons are likely to have the most significant and long lasting
impact. Gypsum is not likely to a have a major toxicological impact although it may be
associated with increase pH levels as will be the case for lime slurry. However the
likelihood of such a contamination event is expected to be low given the proposed
mitigation in the design philosophy (KnightPiesold, 2017) together with the arid nature

FGD Biodiversity & Wetland Assessment
Natural Scientific Services CC 149
of the site, the ephemeral nature of the wetland systems and the distance of the
storage areas from SEW 2 (ca. 800 m) hence this impact has been given a Moderate
significance rating.
Mitigation: A number of mitigation measures are proposed from an engineering
perspective (KnightPiesold, 2017) which may assist in preventing such contaminants
from entering the receiving wetland (SEW 2):
Measures to reduce the risk of contamination from the trucking spills include a
concrete slab layer beneath roads and kerb inlets to the dirty water system.
It is however imperative that spilt material is regularly cleaned up and that all
drains inlets and stormwater infrastructure is regularly inspected for
blockages and cleared out.
The gypsum offtake structure may be a problem following high rainfall events,
however a concrete bunding and a central depression is proposed to prevent
spills. Again it is important to ensure this area is kept tidy and regularly
cleaned out.
At the oil transformer areas the pits are proposed to be bunded and have a
concrete base of 100 mm thick. These pits need to be emptied regularly.
Additionally manganese levels in the stockpiles as well as the environment
should be monitored through regular water quality testing at the pans
immediately south of the FGD and compared to current baseline levels.
All of these measures, however, are designed to cope with a 1 in 50 year
peak 24 hour rainfall event. However should an extreme rainfall event occur
that exceeds this estimate or if maintenance (clearing drains etc.) has been
inadequate these structures may fail and contaminants may enter SEW 2.
Other recommended mitigation includes:
Regular surface and ground water quality monitoring is required to be
continued at the current sediment sampling sites.
Investigate remediation options for current and potential future surface and
groundwater contamination e.g. phytoremediation.
Sediment analysis of depressions and the ephemeral washes must be
conducted yearly and compared with the current results for the site. This will
then indicate whether heavy metal concentrations are increasing during the
Operation Phase of MPS and its ADF.
Annual monitoring of the aquatic invertebrate assemblage should be
conducted at the various remaining sediment sampling sites.
Amphibian assemblages should be monitored at key sediment sampling sites
as well as the newly created pans once a year by means of acoustic, visual
encounter transects.

FGD Biodiversity & Wetland Assessment
Natural Scientific Services CC 150
Measures should be implemented to minimise erosion on site, and potential
sedimentation and contamination of the downstream ephemeral watercourse
and associated dams;
It is advised that water quality at local boreholes (if present) be monitored
before and during construction of the site. The exact duration, frequency and
positioning of the sampling points should be determined from the
geohydrological studies commissioned for the site.

FGD Biodiversity & Wetland Assessment
Natural Scientific Services CC 151
Table 9-2 Impact ratings – Construction Phase
CONSTRUCTION PHASE
Activity Nature of Impact Impact type Extent Duration Potential Intensity
Likelihood Rating Mitigation Interpretation
Site clearing Direct Impact: Loss of wetland systems.
Existing 1 5 16 1 22 - FLAW
With effective mitigation, the overall residual impact risk of clearing vegetation could be reduced to High. The following mitigation is recommended: • Efforts should be made to situate tools, materials and infrastructure so as to minimise loss of wetland resources. • Continue to stockpile topsoil and avoid mixing with deeper layers to retain viability of the seed bank. • EO should regularly monitor progress and implementation of mitigation measures. •Clear during winter. If this is not possible a faunal specialist should be on site during clearing processes. • Clear approved areas only. Site visits reveal that this has the potential to spill over into other areas very easily. • Demarcate and restrict disturbances to the construction area. • Where possible geophytes should be collected and stored in a nursery. Grass seeds can also be collected and stored. • Construction crews should be informed about the importance of biodiversity. The appointed EO on site should be trained to handle snakes and bullfrogs.
Loss of Wetlands and Watercourses/Washes on site for both MPS and the existing cleared area for the ADF and the impact on the NFEPA (Sandloop) is seen as a loss on a National scale.
Cumulative 3 5 16 1 24 - FLAW
With the further construction of the ADF and loss of more wetlands/ washes and pans, this will remain a Very High Impact
Residual 3 4 8 1 15 - HIGH
With mitigation (FGD) the residual impact will be slightly reduced due to a portion of the ADF staying out of the Sandloop buffer and implementing a wetland offset and rehabilitation plan.
Site clearing
Direct Impact: Loss of ephemeral pan habitat for bullfrogs
Existing 2 5 4 1 11 - HIGH
• It was previously recommended that pans C11, C20 and C21
To date operations at Medupi have seen the loss of 3.9 ha of suitable pan habitat.
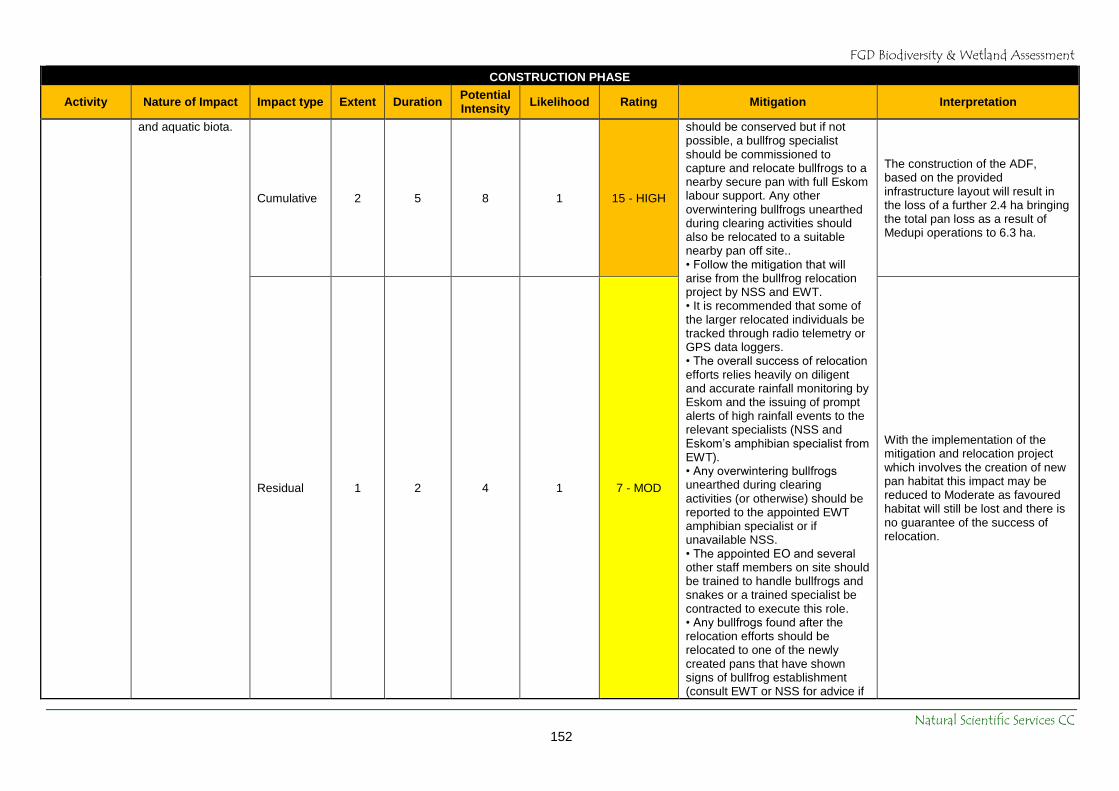
FGD Biodiversity & Wetland Assessment
Natural Scientific Services CC 152
CONSTRUCTION PHASE
Activity Nature of Impact Impact type Extent Duration Potential Intensity
Likelihood Rating Mitigation Interpretation
and aquatic biota.
Cumulative 2 5 8 1 15 - HIGH
should be conserved but if not possible, a bullfrog specialist should be commissioned to capture and relocate bullfrogs to a nearby secure pan with full Eskom labour support. Any other overwintering bullfrogs unearthed during clearing activities should also be relocated to a suitable nearby pan off site.. • Follow the mitigation that will arise from the bullfrog relocation project by NSS and EWT. • It is recommended that some of the larger relocated individuals be tracked through radio telemetry or GPS data loggers. • The overall success of relocation efforts relies heavily on diligent and accurate rainfall monitoring by Eskom and the issuing of prompt alerts of high rainfall events to the relevant specialists (NSS and Eskom’s amphibian specialist from EWT). • Any overwintering bullfrogs unearthed during clearing activities (or otherwise) should be reported to the appointed EWT amphibian specialist or if unavailable NSS. • The appointed EO and several other staff members on site should be trained to handle bullfrogs and snakes or a trained specialist be contracted to execute this role. • Any bullfrogs found after the relocation efforts should be relocated to one of the newly created pans that have shown signs of bullfrog establishment (consult EWT or NSS for advice if
The construction of the ADF, based on the provided infrastructure layout will result in the loss of a further 2.4 ha bringing the total pan loss as a result of Medupi operations to 6.3 ha.
Residual 1 2 4 1 7 - MOD
With the implementation of the mitigation and relocation project which involves the creation of new pan habitat this impact may be reduced to Moderate as favoured habitat will still be lost and there is no guarantee of the success of relocation.

FGD Biodiversity & Wetland Assessment
Natural Scientific Services CC 153
CONSTRUCTION PHASE
Activity Nature of Impact Impact type Extent Duration Potential Intensity
Likelihood Rating Mitigation Interpretation
necessary).
Site clearing Direct Impact: Potential loss of vegetation units.
Existing 1 5 2 1 8 - MOD
• Clearing needs to occur only as necessary for the footprint of the ADF (Alternative 5) and the FGD / railway yard area. If at all possible vegetation in the western corner of the railway yard area must remain intact and undisturbed. • The area of construction should be fencedto prevent encroachment into surrounding vegetation. • Any bulbous and PT species that can be transplanted must be removed. • Alien species must be controlled under the MPS Alien Control Programme.
Clearing has already commenced.
Cumulative 1 5 2 1 8 - MOD Loss of vegetation will continue to increase within infrastructure footprint area.
Residual 1 5 2 1 8 - MOD Mitigation is limited regarding the loss of vegetation.
Site clearing
Direct Impact: Potential increase in alien vegetation species.
Existing 1 3 4 1 8 - MOD
• Clearing needs to occur only as necessary for the footprint areas and all Category species must be removed during this process. • Alien species must be monitored and controlled under the MPS Alien Control Programme. • Construction crew must be made aware of the species that occur on site specifically Category 1 species and must be trained in the
Exists and is extensive (weedy annuals) particularly in disturbed areas within the railway yard area.
Cumulative 3 5 4 1 12 - HIGH Likely to increase without mitigation

FGD Biodiversity & Wetland Assessment
Natural Scientific Services CC 154
CONSTRUCTION PHASE
Activity Nature of Impact Impact type Extent Duration Potential Intensity
Likelihood Rating Mitigation Interpretation
Residual 1 1 2 0.5 2 - LOW
basics for recognition and removal.
With mitigation can be largely reduced and further spread prevented.
Site clearing Direct Impact: Potential loss of CI floral species.
Existing 1 5 4 1 10 - HIGH
MPS has removed tree species successfully during the construction phase of their power station. Therefore the same would apply here. The Environmental Officer (EO) or trained botanist will be required to tag all Protected Trees within the footprint for removal and relocation. These individual plants will need to be monitored over the long term. Permits will be required for the removal process with DAFF. Any other species that may be identified as CI must either be translocated (if possible) or specific mitigation must be compiled by a qualified botanist in collaboration with the MPS EO.
Many CI trees have been felled already.
Cumulative 1 5 4 1 10 - HIGH Situation likely to continue.
Residual 1 5 2 1 8 - MOD Loss is permanent.
Site clearing
Direct Impact: Potential loss of CI faunal species (excluding bullfrogs and raptors).
Existing 1 5 4 0.5 5 - MOD
Clear in winter if possible. It is recommended that immediately prior to clearing that a walkdown be conducted by Eskom and a suitable specialist, preferably one with expertise in arachnids, to intensively search the site preferably in the height of the rainy season (December) to detect and relocate any baboon or trapdoor spiders or scorpions frogs, tortoises. If any of these species are encountered during development the specialist the expertise should advise upon and oversee relocation.
Several species have likely been killed / extirpated as a result of current clearing activities.
Cumulative 1 5 8 0.5 7 - MOD Will be exacerbated.
Residual 1 5 4 0.2 2 - LOW
Can be reduced to low if efforts are taken to construct in winter and safely relocate any CI specie encountered.

FGD Biodiversity & Wetland Assessment
Natural Scientific Services CC 155
CONSTRUCTION PHASE
Activity Nature of Impact Impact type Extent Duration Potential Intensity
Likelihood Rating Mitigation Interpretation
Site clearing Direct Impact: Potential loss of CI raptor species .
Existing 1 5 4 0.5 5 - MOD
Mitigation is limited and likelihood is very low. However if a nest of CI raptor species is encountered its location should be marked and it should be reported to the relevant authorities before construction continues. Normally a minimum 1 km radius buffer or exclusion zone should is applied to such points but given the complex nature of this project would require in depth consultation with an appropriately experienced ornithologist. As far as possible large
Nests may have been destroyed already.
Cumulative 1 5 8 0.5 7 - MOD If raptor nests are destroyed it would be of a Moderate significance.
Residual 1 5 4 0.2 2 - LOW Following mitigation may be reduced to low.
Site clearing Direct Impact: Loss of foraging habitat for game species.
Existing 1 5 2 1 8 - MOD
Mitigation: Clearly demarcate the footprint area. Minimise disturbance footprint and restrict construction and operation activities to within the proposed footprint area. The EO must monitor the carrying capacity relative the game within the Railyard area and act accordingly to ensure that there is enough grazing land for the existing game within this area, otherwise implement capture and relocation. If the game are to be kept then standard game keeping management principles must be adhered to and a management plan drawn up for the game. All relevant permits must then also be in place.
Currently infrastructure is encroaching on grazing habitat for the game in the railway yard.
Cumulative 1 5 4 1 10 - HIGH Should this continue unabated the consequence would be high for the game resulting in mortalities.
Residual 1 5 2 0.2 2 - LOW If the game and their grazing are appropriately managed the impact can be reduced to low.

FGD Biodiversity & Wetland Assessment
Natural Scientific Services CC 156
CONSTRUCTION PHASE
Activity Nature of Impact Impact type Extent Duration Potential Intensity
Likelihood Rating Mitigation Interpretation
Construction and operation
of the ADF and FGD
stormwater infrastructure
Direct & Indirect: Loss of catchment area and consequent decrease in water inputs as a result of the necessary containment of dirty water runoff.
Existing 2 3 2 0.5 4 - MOD
Mitigation with regards to catchment loss is limited and the residual impact risk remains High. Efforts should be centred on minimising catchment loss by minimizing the ADF, PCD, coal stockpile and other associated infrastructure to as small an area as possible. Particularly, efforts should be made to minimise any further encroachment into the Sandloop 1:100 year floodline and 1 km buffer. Release of clean water into the environment needs to be carefully engineered such that it enters the watercourses in a diffuse not concentrated flow to prevent erosion. This involves the use of flow attenuation and spreading structures at outlet points. The large earthen trench around the ADF site compounds this issue and requires re-thinking from an engineering perspective. If found to be of value it should be constructed so as to handle surface runoff in high rainfall events such as was observed during the previous site visit. If its purpose cannot be convincingly motivated it should be removed, re-landscaped and revalidated.
Some loss of catchment area has already occurred due to construction activities. A large tar road and a railway bisect the catchment. Additionally earthen trenches around the ADF site impede inputs to a degree although a break in the south-western corner allows outflow. The pans washes and Sandloop still receive notable flow from the ADF site.
Cumulative 3 4 4 1 11 - HIGH
Without mitigation construction of the ash facility is likely to only result in a slight decrease in catchment water inputs into SEW 1 due to evaporative and dispersive losses. This loss is not anticipated to be as a high as it would be under the necessary mitigation scenario where v-drains and liners are installed that completely contain and isolate water from the facility (however a lack of these structures , as flow impeding as they may be, are required to avoid other serious environmental implications e.g. water quality) .

FGD Biodiversity & Wetland Assessment
Natural Scientific Services CC 157
CONSTRUCTION PHASE
Activity Nature of Impact Impact type Extent Duration Potential Intensity
Likelihood Rating Mitigation Interpretation
Residual 3 3 4 1 10 - HIGH
It is a necessity that clean and dirty water separation take place at the ADF and FGD. Runoff directly from these areas would be considered dirty water (the majority) and therefore need to be contained within a closed system to prevent it from entering the environment. Under Alternative 5 the ADF and associated PCDs and infrastructure would cover 584.93 (13.54%) of the Sandloop Catchment. Therefore construction of the ADF throughout the western and southern most extent of the study area would result in a loss of a large portion of the Sandloop catchment. This is likely to result in a considerable reduction in surface water (dominant source) input into the SEW 1 HGM unit.
Direct Impact: Increased faunal mortality.
Existing 1 2 2 1 5 - MOD
The site should be searched prior to clearing by an appropriately qualified specialist and any less mobile fauna relocated. Maintain existing tortoise road signs and insert new ones where necessary. Continue to enforce speed regulation controls such as speed humps and limits.
Cumulative 1 2 2 1 5 - MOD
Residual 1 2 2 0.5 3 - MOD

FGD Biodiversity & Wetland Assessment
Natural Scientific Services CC 158
CONSTRUCTION PHASE
Activity Nature of Impact Impact type Extent Duration Potential Intensity
Likelihood Rating Mitigation Interpretation
Harvesting of hill wash material (topsoil) within the ADF footprint
Potential direct loss of depressions and semi-arid ephemeral wash wetlands and their vegetation as well as in downstream hydrological and geomorphological drivers through changes in water distribution and retention patterns and increased sedimentation respectively.
Existing 2 5 2 1 9 - MOD
Collection of hill wash material must be prohibited within at least 100 m of the delineated edge of all identified depressions and semi-arid ephemeral wash wetlands. Additionally harvesting of hillwash material should not encroach upon the delineated 1:100 year floodline boundary (which largely mirrors the 1 km buffer on the Sandloop FEPA). Ensure that harvesting of hill wash material does not take place within a 500 m radial buffer of the identified bullfrog breeding site (Depression C 20). Ensure that the responsible on site personnel have the delineated wetlands and their associated buffers on their GPSs. Make sure that these areas are clearly demarcated with high visibility fencing or markings and prohibit all activities within these areas with signage that indicates it is an environmentally sensitive area. Keep scraping neat and systematic. Stockpile topsoil in an area situated as far as possible
These somewhat cryptic wetlands were originally not idenfied by the appointed specialists during the environmental authorisation process for the ADF. An EA was granted in 2008, an inevitable consequence of this, however, was that some of the depressions and washes were lost through construction activities. Nevertheless a number of these systems still remain and with proper management have the potential to retain much of their integrity and ecological functioning.
Cumulative 3 5 8 1 16 - HIGH
Without mitigation this impact has the potential to significantly impact water courses on a national scale and would pose legal challenges not least for encroaching on the 1:100 year floodline which supports the Sandloop FEPA but also for removing the identified wetlands.

FGD Biodiversity & Wetland Assessment
Natural Scientific Services CC 159
CONSTRUCTION PHASE
Activity Nature of Impact Impact type Extent Duration Potential Intensity
Likelihood Rating Mitigation Interpretation
Residual 2 5 4 0.5 6 - MOD
from all identified wetlands to avoid sedimentation. Ensure that measures are taken to contain topsoil during rainfall events and prevent it washing into the environment. Attempt to maintain the natural stratigraphy of the topsoil when stockpiling. Ensure that all guidelines and standards are met with regards to the stockpiling of topsoil.
Following mitigation measures and recommendations made in this report these impacts can be reduced from a High to a Medium and construction could conceivably occur without detrimentally damaging the ecological integrity and biotic functioning of these systems. The residual impact is rated as Medium as there is still the potential for a loss in water inputs (due to a collection in scraped areas) to the depressions and washes which rely so heavily on surface water inundation following rainfall events as well as the ever present potential for increased sedimentation and biotic isolation and fragmentation of these systems as connecting vegetation is cleared around them.
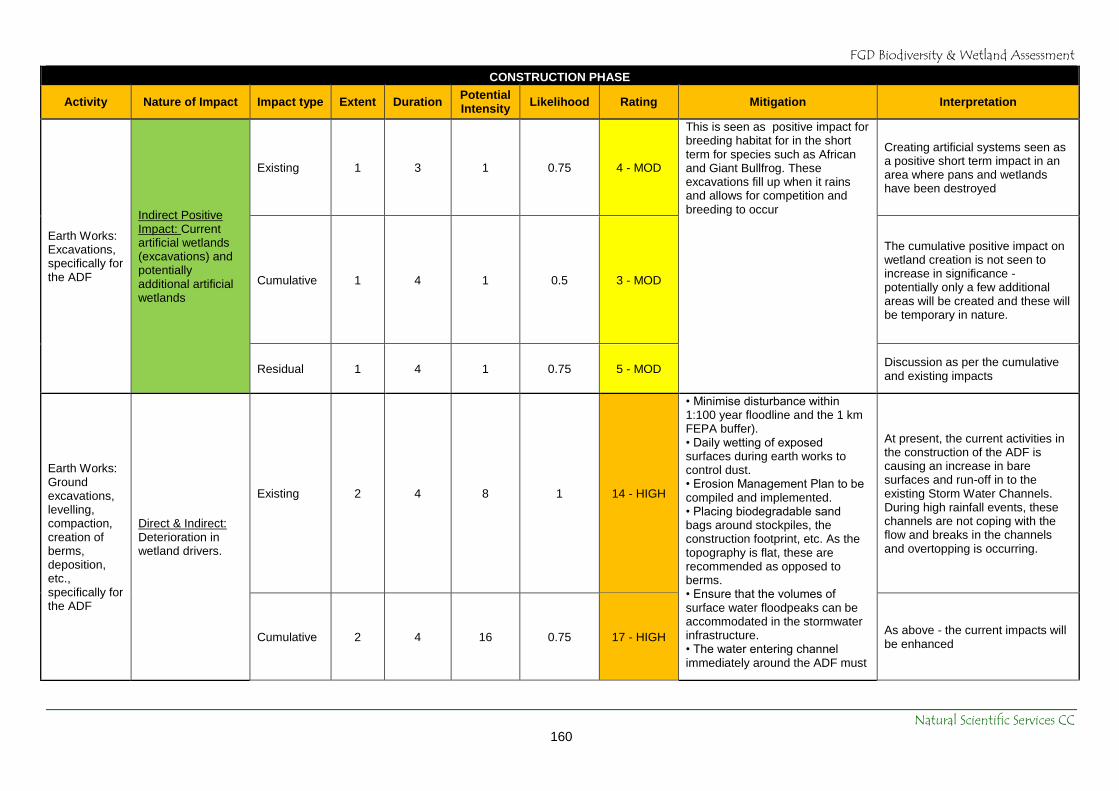
FGD Biodiversity & Wetland Assessment
Natural Scientific Services CC 160
CONSTRUCTION PHASE
Activity Nature of Impact Impact type Extent Duration Potential Intensity
Likelihood Rating Mitigation Interpretation
Earth Works: Excavations, specifically for the ADF
Indirect Positive Impact: Current artificial wetlands (excavations) and potentially additional artificial wetlands
Existing 1 3 1 0.75 4 - MOD
This is seen as positive impact for breeding habitat for in the short term for species such as African and Giant Bullfrog. These excavations fill up when it rains and allows for competition and breeding to occur
Creating artificial systems seen as a positive short term impact in an area where pans and wetlands have been destroyed
Cumulative 1 4 1 0.5 3 - MOD
The cumulative positive impact on wetland creation is not seen to increase in significance - potentially only a few additional areas will be created and these will be temporary in nature.
Residual 1 4 1 0.75 5 - MOD Discussion as per the cumulative and existing impacts
Earth Works: Ground excavations, levelling, compaction, creation of berms, deposition, etc., specifically for the ADF
Direct & Indirect: Deterioration in wetland drivers.
Existing 2 4 8 1 14 - HIGH
• Minimise disturbance within 1:100 year floodline and the 1 km FEPA buffer). • Daily wetting of exposed surfaces during earth works to control dust. • Erosion Management Plan to be compiled and implemented. • Placing biodegradable sand bags around stockpiles, the construction footprint, etc. As the topography is flat, these are recommended as opposed to berms. • Ensure that the volumes of surface water floodpeaks can be accommodated in the stormwater infrastructure. • The water entering channel immediately around the ADF must
At present, the current activities in the construction of the ADF is causing an increase in bare surfaces and run-off in to the existing Storm Water Channels. During high rainfall events, these channels are not coping with the flow and breaks in the channels and overtopping is occurring.
Cumulative 2 4 16 0.75 17 - HIGH As above - the current impacts will be enhanced

FGD Biodiversity & Wetland Assessment
Natural Scientific Services CC 161
CONSTRUCTION PHASE
Activity Nature of Impact Impact type Extent Duration Potential Intensity
Likelihood Rating Mitigation Interpretation
Residual 1 2 4 0.5 4 - MOD
be a closed system. The current outer channel surrounding the entire ADF needs to be reinforced with erosion protection measures such as concrete or ground reinforcing materials, particularly along the southern and western boundaries of the ADF site. The stormwater and associated infrastructure must take cognisance of the large erratic storm flows volumes. • Prevent further overflow of water from the current coal PCD. • Rehabilitation of areas disturbed both inside and outside of Site 13, these areas should be identified in the rehabilitation plan.
With mitigation (FGD) the residual impact will be moderate: *Activities will remain outside buffer of Sandloop; *Improved Storm Water Design; * Bare areas will be vegetated
Traffic, machinery & human activity
Indirect: Increased sensory disturbance to fauna
Existing 2 2 4 1 8 - MOD
Keep lighting to a minimum during construction but most significantly during operation. Lights should be angled downwards and hooded to lower light pollution. Restrict unnecessary access to the remaining patches of natural vegetation.
Currently fairly high levels of disturbance.
Cumulative 2 3 8 0.75 10 - HIGH Likely to increase.
Residual 1 2 4 0.5 4 - MOD Unlikely to decrease much below current levels.
Traffic, machinery & human activity
Direct & Indirect: Increased pollution; Increased dust & erosion and ultimately degradation of surrounding wetlands.
Existing 2 2 4 1 8 - MOD
Mitigation would require frequent maintenance of trucks, ongoing driver training, covering of vehicles. Maintenance of all machinery must be kept up to date; Regular wetting of the road network and revegetation of bare areas that are not required for lay
Current impacts on wetlands and associated biodiversity is seen in the sediment analysis and may be attributed to coal deposition along the road networks and in the storm water channels etc.

FGD Biodiversity & Wetland Assessment
Natural Scientific Services CC 162
CONSTRUCTION PHASE
Activity Nature of Impact Impact type Extent Duration Potential Intensity
Likelihood Rating Mitigation Interpretation
Cumulative 2 3 8 0.75 10 - HIGH
down areas etc.
With continued construction of the ADF and the use of the Coal Stockpile to the west, the impact on the watercourses and wetland is considered High
Residual 1 2 4 0.5 4 - MOD
With mitigation the impact will be reduced to a low Moderate as due to the immensity of the operations, it is not possible to completely prevent dust etc.
Clearing and resultant increase in exposed surfaces during construction of the FGD plant, ADF and associated infrastructure
Indirect: Increase in floodpeaks, sediment loads and erosion to wetlands.
Existing 2 3 4 1 9 - MOD
Implement planned stormwater management and minimise the extent of unnecessarily cleared ground. Upgrade the earthen drain around the outer boundary of the Site to prevent break through following heavy rains . This drain should be lined and reinforced (preferably concrete). Any outlet or overflow points for PCDs or drains should be done so at multiple points, each fitted with flow attenuation structures and should tie in with the natural drainage patterns and not at arbitrary points (See Figure 7 1).
Recent clearing has exposed large tracts of land within a portion of the proposed ADF. Stormwater infrastructure is rudimentary at present and there is a large potential for sediment runoff and erosion.

FGD Biodiversity & Wetland Assessment
Natural Scientific Services CC 163
CONSTRUCTION PHASE
Activity Nature of Impact Impact type Extent Duration Potential Intensity
Likelihood Rating Mitigation Interpretation
Cumulative 2 3 4 1 9 - MOD
Regarding the FGD and associated infrastructure it would be preferable if the planned stormwater infrastructure could be constructed first. Conduct the majority of construction during winter. Continuously rehabilitate following the advancing face of the ADF.
Without mitigation (appropriate stormwater infrastructure) the current situation would be exacerbated.
Residual 1 2 1 0.5 2 - LOW
With the installation of the proposed stormwater infrastructure the risk of sedimentation and erosion is really reduced.

FGD Biodiversity & Wetland Assessment
Natural Scientific Services CC 164
Table 9-3 Impact ratings – Operation / Decommissioning Phase
OPERATIONAL PHASE
Activity Nature of Impact Impact type Extent Duration Potential Intensity
Likelihood Rating Mitigation Interpretation
Operation of the ADF and FGD stormwater infrastructure
Direct & Indirect: Loss of catchment area and consequent decrease in water inputs as a result of the necessary containment of dirty water runoff.
Existing 2 3 2 0.5 4 - MOD
See related impacts in construction (Table 9.2).
See related impacts in construction (Table 9.2).
Cumulative 3 4 4 1 11 - HIGH
Residual 3 3 4 1 10 - HIGH
Direct Impact: Increased faunal mortality.
Existing 1 2 2 1 5 - MOD
See related impacts in construction (Table 9.2).
See related impacts in construction (Table 9.2). Cumulative 1 2 2 1 5 - MOD
Residual 1 2 2 0.5 3 - MOD
Trucking waste to a registered waste disposal facility
Direct Existing 0 0 0 0 0 - LOW One cannot predict how many and where accidents may occur. Mitigation would require frequent maintenance of trucks, ongoing driver training, frequent stopping etc.
N/A as not yet in commencement
Spills -Sedimentation and Surface water contamination
Cumulative 3 2 8 0.5 7 - MOD
With the trucking of the waste, there is a potential for spillages to occur along the route through accidents and uncovered trailers
Residual 3 2 4 0.5 5 - MOD
The number of incidences are expected to reduce with proper management - vehicle maintenance, driver training

FGD Biodiversity & Wetland Assessment
Natural Scientific Services CC 165
OPERATIONAL PHASE
Activity Nature of Impact Impact type Extent Duration Potential Intensity
Likelihood Rating Mitigation Interpretation
Storage of substrates and by-products associated with the FGD operation
Direct Existing 3 5 4 1 12 - HIGH
Prevent contaminants from entering the receiving wetland (SEW 2). Install planned concrete slab layer beneath roads and kerb inlets to the dirty water system. Regularly clean spilt materials and inspect drain inlets and stormwater infrastructure for blockages. Install planned concrete bunding and central depression at gypsum off take area. Keep this area tidy and regularly cleaned out. Install planned bunding on oil pits and have a concrete base of 100 mm thick. Empty regularly. Establish baseline manganese levels in the stockpiles as well as the environment. Thereafter monitor levels through regular water quality testing at the pans immediately south of the FGD and compare to current baseline levels.
N/A as not yet in commencement
Contamination of wetlands from storage facilities associated with the ADF and FGD– Consequences for bullfrogs and aquatic invertebrates.
Cumulative 3 5 8 1 16 - HIGH
With mitigation this impact could be reduced but is still regarded as a moderate impact as the risk of contamination can never be completely ruled out considering the extreme climatic events of late and the increased intensity of rainfall predicted with climate change in the near future especially considering that the infrastructure (including stormwater) is based on 1 in 50 year rainfall events and not 1 in 100 years.
Residual 3 3 4 0.5 5 - MOD

FGD Biodiversity & Wetland Assessment
Natural Scientific Services CC 166
Figure 9-3 Infrastructure Alternative 1 (1 km buffer on Sandloop FEPA)

FGD Biodiversity & Wetland Assessment
Natural Scientific Services CC 167
Figure 9-4 Infrastructure Alternative 2 (500 m buffer on Sandloop FEPA)

FGD Biodiversity & Wetland Assessment
Natural Scientific Services CC 168
Figure 9-5 Infrastructure Alternative 3 (1 km buffer on Sandloop FEPA excluding previously disturbed areas)

FGD Biodiversity & Wetland Assessment
Natural Scientific Services CC 169
Figure 9-6 Infrastructure Alternative 4 (entire Site 13)

FGD Biodiversity & Wetland Assessment
Natural Scientific Services CC 170
Figure 9-7 Infrastructure Alternative 5 (current proposed footprint area supplied by Jones and Wagner)

FGD Biodiversity & Wetland Assessment
Natural Scientific Services CC 171
Figure 9-8 Areas of current disturbance

FGD Biodiversity & Wetland Assessment
Natural Scientific Services CC 172
10. Predicted Ecological State: Targets and Strategies
Taking a proactive approach, in lieu of detailed infrastructure design alternatives (from an
engineering perspective) that seek to minimise the effects of the proposed development on
the Sandloop FEPA, NSS has generated five conceptual footprint area alternatives. These
alternatives are illustrated in Figure 9-3 to Figure 9-7 and can be summarised as follows:
Alternative 1: ADF and associated infrastructure is kept outside of a 1 km buffer on
the Sandloop FEPA. Optimal.
Alternative 2: ADF and associated Infrastructure is kept outside of the 500 m buffer
on the Sandloop FEPA
Alternative 3: ADF and associated Infrastructure is kept outside the 1 km buffer but
only for areas not already transformed by activities as defined in Figure 9-5.
Alternative 4: ADF and associated infrastructure fill Site 13.
Alternative 5: Current footprint area for the ADF and some of the associated
infrastructure as supplied by the commissioned engineers (Jones and Wagner).
10.1.1 Predicted Health Change to SEW 1 (Upper Sandloop Tributaries).
A comparison between the current and anticipated ecological health of the SEW 1 HGM unit
(Upper Sandloop Tributaries within 500 m Site 13) in terms of hydrology, geomorphology and
vegetation under the four layout alternatives for scenarios with and without mitigation is
provided in Table 10-1 below. The wetland drivers most adversely affected are likely to be
hydrology and geomorphology with the most adverse effects anticipated for Alternative 4
which is considered flawed and the least for Alternative 1 which is considered optimal.
Alternatives 3, 5 and 2 represent situations that are not optimal.
It is NSS’ opinion that Alternative 1 should be opted for, however, it has subsequently
emerged from extended correspondence with Eskom and the Engineering team that the
design cannot be adjusted to fit this area. Alternatives 1 and (to a lesser extent) 3 represent
the best case scenarios from an environmental perspective but are unlikely to be realised.
The chosen alternative at present is Alternative 5 which represents a better case scenario
than Alternative 2 but is still likely to have a significant negative effect on the health of SEW 1
and the downstream Sandloop. Under the current scenario (Alternative 5) and following
mitigation health scores are anticipated to decrease (from present state) by at least one
order of magnitude (post mitigation) on all wetland drivers (2.1 C to 3.5 D).
10.1.2 Predicted Health Change to SEW 2 (System downstream of FGD plant).
Although the ADF relates mostly to SEW 1 the FGD plant and associated storage facilities
relate mostly to SEW 2. A comparison between the current and anticipated ecological health
of the SEW 2 HGM unit in terms of hydrology, geomorphology and vegetation for scenarios
of with and without mitigation is provided in Table 10-2.

FGD Biodiversity & Wetland Assessment
Natural Scientific Services CC 173
Table 10-1 Predicted SEW 1 health scores for the four infrastructure alternatives with and
without mitigation showing anticipated change in wetland functionality.
MITIGATION
WETLAND HEALTH SCORE HECTARES (ha)
OPINION
Total Wetland Extent
Functional Wetland
Hydrology Geomorphology Vegetation Overall Extent
Loss From
Current State
Current
3 (C) 1.7(B) 1 (B)
2.1 (Lower
C) 71.5 56.8 - Goal
Alternative 1
With 4 (D) 2.1 (C) 2 (C) 2.9 (C) 61.4 43.8 13.1 Optimal
Without 4 (D) 2.7 (C) 2.4 (C) 3.2 (C) 61.4 42.0 14.8 -
Alternative 3
With 4 (D) 2.7 (C) 2.6 (C) 3.2 (C) 61.4 41.6 15.2 Not Optimal 1
Without 4 (D) 3.3 (C) 2.8 (C)
3.5 (C Upper) 61.4 40.2 16.6 -
Alternative 5
With 4 (D) 3.7 (C) 2.7(C) 3.5 (C) 55.9 36.3 20.5 Not Optimal 2
Without 4 (D) 4 (D) 3 (C)
3.7 (C Upper) 55.9 35.2 21.6 -
Alternative 2
With 6.5 (E) 2.6 (C) 2.8 (C)
4.15 (D) 53.5 30.4 26.5 Not Optimal 3
Without 6.5 (E) 4.5 (D) 3.5 (C) 5.1 (D) 53.5 24.9 31.9 -
Alternative 4
With 6.5 (E) 2.6 (C) 2.5 (C) 4.2 (D) 53.4 30.8 26.1 Flawed
Without 7 (E) 5.9 (D) 3.5 (C)
5.7 (D Upper) 53.4 23.0 33.8 -
*Red block represents the current design alternative presented by engineers.
Table 10-2 Predicted health scores for SEW 2 as a result of the FGD plant for scenarios
with and without mitigation showing anticipated change in wetland functionality.
MITIGATION
WETLAND HEALTH SCORE HECTARES (ha)
Total Wetland Extent
Functional Wetland
Hydrology Geomorphology Vegetation Overall Extent Loss From
Current State
Current State
3.5 (C) 3 (C) 4.2 (D) 3.6 (C) 38.0 24.3 -
Anticipated State
With 4 (D) 3.6 (C) 5.2 (D)
4.2 (D Lower) 61.4 22.0 2.3
Without 7 (E) 4.3 (D) 5.7 (D)
5.8 (D Upper) 61.4 16.0 8.3
Currently the system is rated as a having a C (Moderately Modified) ecological health.
However the construction of the FGD and associated storage facilities is anticipated to

FGD Biodiversity & Wetland Assessment
Natural Scientific Services CC 174
reduce the health of this system to a Upper D (Largely modified) without mitigation and a
Lower D with mitigation. The drivers likely to be most adversely affected include hydrology
and vegetation. In terms of hydrology, without mitigation, one would expect an increase in
floodpeaks as a result of the increase in exposed, impermeable surfaces such as compacted
areas, concrete, tar and other structures including the stockpiles themselves. This would
likely be accompanied by a greater concentration in flow and consequently increased risk for
erosion. Without appropriate mitigation the increased exposed surfaces, limestone and other
stockpiles would pose a risk of considerable sedimentation of the system following rainfall
events. Deposition and erosion in turn will decrease the state of the vegetation along this
system. With implementation of the planned stormwater infrastructure and other suggested
mitigation the it is anticipated that there will be less erosion and deposition , however there
will still be a reduction in overall water inputs due to catchment loss and the presence of
stormwater infrastructure channelling water into Medupi’s large eastern dams. Additionally all
the mitigation is designed under a 1 in 50 year flood event and considering the increasing
rainfall intensity in the past few years the risk remains that mitigation may fail hence the post
mitigation rating.
10.1.3 Strategic Approach.
In terms of biodiversity the overall goal of the project should be to minimise loss to
biodiversity wherever possible. This may be achieved through commitment to the listed
mitigation, effective rehabilitation of the ADF and the relocation of bullfrogs and other
amphibians to newly created habitat elsewhere. The overall objective of the project as it
relates to wetlands should be to ensure that there is no net loss in wetland functionality from
the current state as a result of the construction of the FGD plant (and associated storage
facilities / infrastructure) and the ADF. Given the relatively pristine state of the Sandloop in
the vicinity of the ADF this ideal situation may be best approached by ensuring that an
adequate area of the upper Sandloop is set aside for long term protection and that all
remaining natural areas within the railway yard and Site 13 which have been disturbed are
rehabilitated. Additionally it should be noted that the ephemeral pans within the FGD study
area are important havens for wildlife not least bullfrogs which have been confirmed breeding
within the study area. By the end of the said project, based on the infrastructure layout plans
provided MPS would have seen the loss of 3.6 ha of this pan habitat. Although this appears
to be a small size, it is significant when considering that this represents 20 possible breeding
locations. As per Macfarlane et al. (2014) long term protection of these wetland systems
entails, inter alia, “the implementation of legal mechanisms (e.g. declaration of a Protected
Environment or Nature Reserve under the National Environmental Management: Protected
Areas Act, a legally binding conservation servitude, or a long term Biodiversity Agreement
under NEMA) and putting in place appropriate management structures and actions”.
The predicted wetland health scores for SEW 1 and 2 allows for the estimation of the extent
of functional wetland that is likely to be lost from the present ecological state under each
infrastructure alternative both with and without mitigation (Table 10-1 and Table 10-2). It is

FGD Biodiversity & Wetland Assessment
Natural Scientific Services CC 175
important to note here that these values represent the basic hectare equivalents for one of
three offset themes as outlined in Wetland Offsets: A best Practice Guideline for South
Africa” Macfarlane et al. (2014) namely Ecosystem Services and Water Resources.
Assessment of the two other themes in terms of hectare equivalents namely Ecosystem
Conservation, and Species of Conservation Concern, lies beyond the scope of this report
and will need to be addressed in the subsequent wetland offset plan. Additionally, given the
nature of the project, presence of conservation important species (bullfrogs) and the national
importance of the Sandloop FEPA, the use of modifiers to augment default offset ratios
based on the three hectare equivalent theme estimations is strongly recommended.
Preliminary communications with Eskom affirm their commitment to commissioning a wetland
rehabilitation and stage 1 offset plan that will serve to offset functional losses to SEW 1,
SEW 2 and D4 (pans), by conserving the Sandloop and associated depressions within their
properties, specifically Site 12 as well as initiating the artificial recreation of pan habitat, the
extent to which is to be decided in the upcoming rehabilitation and offset plan by NSS. Two
pressing and urgent issues were recently identified after fieldwork on Google Earth. These
are depicted in Figure 9-8 and discussed in the bullet points below.
Coal contamination of watercourse from PCD 4 overflow
April 2016 March 2017
Transformation of depression C15
February 2016 March 2017
Figure 10-1 Areas of recent disturbance

FGD Biodiversity & Wetland Assessment
Natural Scientific Services CC 176
With this in mind the following preliminary strategy is advised:
Two urgent issues need to be addressed promptly:
o It is evident that an overflow event from the coal stockpile PCD 4 into the
watercourse on the south-western boundary of Site 13 via its spillway has
occurred. Spillways are designed to protect the integrity of the structure under
high capacity. The problem here is that the lined stormwater infrastructure has
not been constructed and this effluent is entering the environment. This is a
recent impact that needs to be dealt with swiftly to avoid further contamination
of the Sandloop. Clean up the coal spillage within the watercourse and
reassess the capacity of the coal PCD from an engineering perspective.
o One of the depressions (C15) in the centre of Site 13 has been completely re-
shaped into a square. Such alteration of the bed of any depression or wash
cannot be allowed to happen prior to the issuing of the water use licence from
DWS.
Eskom should support the recently commissioned wetland rehabilitation and bullfrog
relocation / pan restoration projects in terms of rainfall reporting, labour, machinery
and engineering resources to enable the successful creation of new pan habitat
within Site 12 and the successful relocation and establishment of bullfrogs therein.
A few issues emerged during the workshop held at Zitholele with the relevant
specialists and engineers that NSS feels needs addressing:
o The precise origin and composition of the limestone to be brought in for the
FGD process is yet unknown. It is advised that the source and manganese
content (and any other metals) as well as the pH of the slurry formed from a
combination with rain and groundwater be determined as soon as possible.
o It was mentioned that the rehabilitation of the ADF will follow the advancing
face. It was then mentioned that water coming off rehabilitated areas would be
considered clean water and would enter the clean water system. A question
was raised as to where this “clean water” would be stored prior to discharge
into the environment. The Eskom engineers pointed out that the ADF PCDs
closest to the rehabilitated side would be converted from dirty to clean water
facilities to hold this water. How this transition from dirty to clean water
systems is carried out is yet uncertain and may pose a significant challenge.
Although an attempt has been made to augment the south-western corner of the ADF
efforts should be taken to wherever possible minimise any further loss /
encroachment into pan habitat, the upper Sandloop catchment and areas, within the
1:100 year floodline and the 1 km buffer on the Sandloop FEPA.
Although Alternatives 1 and 3 (conservation of most of the western limb of SEW 1
within the site) were preferable correspondence with Eskom and the relevant
engineers suggests an infrastructure footprint congruent with Alternative 5 will be
opted for and is final. This not an optimal situation and will require stringent
rehabilitation and offset measures to be implemented.

FGD Biodiversity & Wetland Assessment
Natural Scientific Services CC 177
During the development of the FGD plant, storage facilities, ash facility and
associated infrastructure adhere to best practice guidelines and recommended
mitigation measures as outlined in this report.
Ensure that the stipulations within the ROD (12/12/20/695) are adhered to as well as
those stipulated in the EA (Ref: 12/9/11/L50/6).
Attempt wherever possible to avoid development within at least 100 m from any pan
or semi-arid ephemeral wash outside of the footprint area as depicted in Figure 7-12.
Although the loss of some wetland features on site is inevitable given the nature of
this project it is imperative that every effort be taken to ensure the long term, in situ,
conservation of the depressions C11 and where possible C20 (bullfrog breeding site)
and C21 together with a minimum 100 m radial buffer around their delineated edges.
Normally best practice guidelines on Giant Bullfrogs (Yetman and Fergusson, 2011)
advocate a minimum 500 m radial buffer and idealistic 1 km buffer on breeding sites.
However the froglets could not be positively distinguished as either Giant Bullfrog or
African Bullfrog. The latter being of lower conservation importance. However the,
bullfrog relocation project (in progress) would circumvent this situation through
capture and relocation of all adults, tadpoles and froglets during the peak of the
breeding season to newly created pans in Site 12. The full assistance of Eskom
labour should be at the specialist’s disposal for assistance in relocating the bullfrogs.
If it has not already been removed, the possibility of adjusting the eastern boundary of
the Phase 3A Temporary Storage Area to avoid the loss of depression C15 should be
considered in earnest.
Given the pristine nature of the upper Sandloop FEPA, long term protection and
management is advocated as the primary offset strategy supplemented by
rectification measures were deemed necessary.
Commission a comprehensive wetland rehabilitation and offset investigation.
The wetland delineations and preliminary ecosystem health based hectare
equivalents as outlined in this report should be used to inform the wetland offset plan,
and updated as deemed necessary. The two other themes in terms of hectare
equivalents namely Ecosystem Conservation and Species of Conservation Concern
need to be assessed in the wetland offset plan. Additionally, given the nature of the
project and the national importance of the Sandloop FEPA, the use of modifiers to
augment default offset ratios based on the three hectare equivalent theme
estimations is strongly recommended.
11. Conclusion
In spite of the study area being situated within the otherwise flat and relatively homogenous
Limpopo Sweet Bushveld (dominated by Acacia and Combretum species), fieldwork by NSS
has revealed a wealth of biodiversity and uncovered the presence of a number water
resources. It is the presence of these pans and semi-arid ephemeral washes wetlands, such

FGD Biodiversity & Wetland Assessment
Natural Scientific Services CC 178
as the Sandloop FEPA and associated tributaries that breathe life into the otherwise arid
landscape. In terms of fauna the MPS and immediate surrounds was found to support a large
proportion of the regions diversity of which many species are of conservation importance.
Perhaps most noteworthy and directly impacted in this regard are bullfrogs. At least one
breeding site was confirmed within the FGD study area with several others south and along
the Sandloop System. There remains some uncertainty regarding the identification of the
individuals observed on site as both bullfrog species may occur within the study area.
Regardless both are large, charismatic, explosive breeding frogs that are facing high levels
of habitat loss and persecution. Although limited in floral species, the pans also support an
exceptional diversity of other amphibian species, reptiles, birds and mammals and the
bullfrogs therefore act as good surrogates for the conservation of much wider range of
species. Naturally one of the most significant impacts emanating from ADF development is
the loss of the largely natural pans and water courses that support this diversity. The
importance of the matter and the need to rehabilitate and offset wetland loss as well as re-
create pan habitat was affirmed by DWS head office and has been duly acknowledged by
Eskom with such studies set in motion. Although not particularly diverse in terms of flora, a
significant amount of largely natural remaining Acacia veld remains which does support a
number of Protected tree species and potentially one Near-Threatened herbaceous species.
Vegetation units of particular significance included the Acacia nigrescens –Combretum
apiculatum dominated woodland and the vegetation associated with the pans and ephemeral
washes, which were rated Very High and Moderate -High sensitivity respectively for their
natural state and importance in supporting conservation important species.
In terms of wetlands our field surveys revealed a number of small Semi-arid Ephemeral
Washes and Depression wetlands within the study area (Site 13) earmarked for the
construction of the ADF. These and other wetlands were originally not identified by the
appointed specialists during the environmental authorisation process for the MPS and
subsequently the ADF (EA granted in 2009, Ref12/9/11/L50/6). An inevitable consequence of
this situation, however, is that some of the depressions and washes were lost through
construction activities. Nevertheless a number of these systems still remain and have the
potential to retain much of their integrity and ecological functioning. The wetlands identified
on site were all rated with High conservation importance. Of greatest importance are those
wetlands that are situated, and which feed into, the upper reaches of the Sandloop.
Maintenance of these wetlands that fall into the 1km buffer Sandloop FEPA, as well as
maintenance of the buffer itself is of utmost importance. Discovery of wetlands within the
proposed infrastructure footprint at such a late stage of the project, obviously presents a
number of challenges regarding the sustainable protection of these water courses. The only
pragmatic solution now lies in an approach that seeks to; (i) minimise further direct losses to
the wetland resources and dependant biota on site by means of strategic placement and
design of infrastructure, (ii) decrease the amount of functional loss to these wetlands and the
Sandloop FEPA through strict adherence to the stipulated mitigation and (iii) offset these
losses by means of setting aside a portion of the upper Sandloop for long term conservation

FGD Biodiversity & Wetland Assessment
Natural Scientific Services CC 179
following the outcomes of a comprehensive wetland offset and monitoring plan that takes
cognisance of the national conservation importance of the Sandloop FEPA.
12. References
ACOCKS, J.P.H. 1988. Veld types of South Africa 3rd Ed. Memoirs of the Botanical Survey
of South Africa. No 57. National Botanical Gardens/ Botanical Research Institute.
Pretoria.
AGIS, 2010. Agricultural Geo-Referenced Information System – land type data. Website:
www.agis.agric.za. Accessed: 2018.
ALEXANDER G. & MARAIS J. 2008. A Guide to the Reptiles of Southern Africa. Struik
Publishers, Cape Town.
ANZECC. 2000. Website: http://www.mfe.govt.nz/fresh-water/technical-guidance-and-
guidelines/anzecc-2000-guidelines. Accessed in 2018.
AVENANT-OLDEWAGE & MARX, 2000. A further investigation into the bioaccumulation of lead and
zinc in the organs and tissues of the African sharptooth catfish, Glorias gariepinus from two
localities in the Olifants River, Kruger National Park. Koedoe 43 (2): 17-33, Pretoria
ATSDR, 2018. Website: https://www.atsdr.cdc.gov/. Accessed: 2018.
BARNES K.N. 2000. The Eskom Red Data Book of Birds of South Africa, Lesotho &
Swaziland. Birdlife South Africa, Johannesburg.
BATES, M.F., BRANCH, W.R., BAUER, A.M., BURGER, M., MARAIS, J., ALEXANDER,
G.J., DE VILLIERS, M.S., (eds). In press. Atlas and Red List of the Reptiles of South
Africa, Lesotho and Swaziland (2014). Strelitzia 32. SANBI, Pretoria.
BEC, MARTIN-CREUZBERG & VON ELERT, 2006. Trophic upgrading of autotrophic
picoplankton by the heterotrophic nanoflagellate Paraphysomonas sp. Limnology &
Oceanography, Volume 51, Issue 4 July 2006 Pages 1699–1707
BIRDLIFE INTERNATIONAL. 2018. Website: www.birdlife.org. Accessed in 2018.
Botes & Van Staden. 2005. Investigation of trace element mobility in river sediments using
ICP-OES. Water SA Vol. 31 (2) 2005: pp.183-192
BRANCH B. 1990. Field Guide to Snakes and Other Reptiles of Southern Africa. Struik
Publishers, Cape Town.
CAMPBELL H.W. & CHRISTMAN S.P. 1982. Field Techniques for Herpetofaunal
Community Analysis. In SCOTT N.J. Jr. Wildlife Research Report 13, US Dept. of the
Interior and Wildlife Services.
COWLING R.M., RICHARDSON D.M. & PIERCE, S.M. 1997. Vegetation of Southern Africa.
Cambridge University Press, Cambridge.
FGD Biodiversity & Wetland Assessment
Natural Scientific Services CC 180
COLVIN, C., LE MAITRE, D., SAAYMAN, I. and HUGHES, S. (2007). Aquifer Dependent
Ecosystems in Key Hydrogeological Typesettings in South Africa. WRC Report No TT
301/07.
Crisinel et al. 1994. Cyst‐based ecotoxicological tests using Anostracans: Comparison of
two species of Streptocephalus.
HILTON-TAYLOR C. 1996. Red Data List of southern African plants. Strelitzia 4. National
Botanical Institute, Pretoria, South Africa.
DALLAS, H.F., 2005. River health programme: site characterisation field-manual and field-
data sheets. Resource quality services, Department of water affairs and forestry.
DALLAS, H.F., 2007. River Health Programme: South African Scoring System (SASS) Date
Interpretation Guidelines. The Freshwater Consulting Group/Freshwater Research
Unit, University of Cape Town. Prepared for Institute of Natural Resources and the
Department of Water Affairs and Forestry
DALLAS, H.F., DAY, D. J., 2004. The effect of water quality variables on aquatic
ecosystems. Water Research Commission, Cape Town.
DAVIES, B., & J., DAY., 1998. Vanishing Waters. University of Cape Town Press
DAVIS S.D., DROOP S.J.M., GREGERSON, P., HENSON L., LEON C.J., VILA-LOBOS
J.L., SYNGE H. & ZANTOVSKA J. 1986. Plants in Danger: What do we know? IUCN,
Gland.
DAY, J., DAY, E., ROSS-GILLESPIE, V. & KETLEY, A. 2010. The assessment of temporary
wetlands during dry conditions, March 2010. WRC Report No. TT 434/09.
DEA. (DEPARTMENT OF ENVIRONMENTAL AFFAIRS), DMR (DEPARTMENT OF
MINERAL RESOURCES), CoM (CHAMBER OF MINES), SAMBF (SOUTH AFRICAN
MINING & BIODIVERSITY FORUM) & SANBI (SOUTH AFRICAN NATIONAL
BIODIVERSITY INSTITUTE). 2013. Mining and Biodiversity Guideline: Mainstreaming
biodiversity into the mining sector. Pretoria.
DICKENS C.W.S & GRAHAM P.M., 2002: The South African Scoring System (SASS),
version 5, rapid bioassessment methods for rivers, Aftrican Journal of Aquatic Science,
27, 1 – 10.
DIPPENAAR-SCHOEMAN, A. S. 2002. Baboon and Trapdoor spiders of Southern Africa:
an identification manual. Plant Protection Research Institute Handbook 13, Agricultural
Research Council, Pretoria. 130 pp. LINK
DRIVER A., MAZE K., LOMBARD A.T., NEL J., ROUGET M. & TURPIE J.K. 2004. South
African National Spatial Biodiversity Assessment Summary Report.
DU PREEZ L. & CARRUTHERS V. 2009. A Complete Guide to the Frogs of Southern
Africa. Struik Nature, Cape Town.
DWA (2013). National Water Resource Strategy. Second Edition. Department of Water
Affairs. South Africa.

FGD Biodiversity & Wetland Assessment
Natural Scientific Services CC 181
DWAF (DEPARTMENT OF WATER AFFAIRS AND FORESTRY). 1999. Resource
Directed Measures for Protection of Water Resources. Volume 4. Wetland
Ecosystems. Version 1.0. DWAF, Pretoria.
DEPARTMENT OF WATER AFFAIRS AND FORESTRY, 1996. South African Water Quality
Guidelines, Vol 7: Aquatic Ecosystems.
DWAF (DEPARTMENT OF WATER AFFAIRS AND FORESTRY). 1999. Resource
Directed Measures for Protection of Water Resources. Volume 4. Wetland
Ecosystems. Version 1.0. DWAF, Pretoria.
DWAF. 2005. A practical field procedure for identification and delineation of wetland riparian
areas. DWAF, Pretoria.
DWAF. 2011. Website: http://www.dwaf.gov.za/WAR/systems.html. Accessed in August
2011.
FERRAR, A.A., & LÖTTER, M.C., 2007. Mpumalanga Biodiversity Conservation Plan
Handbook. Mpumalanga Tourism & Parks Agency, Nelspruit.
FERREIRA, J.G. 2012. Could the ‘evolution’ from biology to life sciences prevent ‘extinction’
of the subject field? South African Journal for Science and Technology 31(1):1-5
FILGUEIRAS et al. 2004. Evaluation of Distribution, Mobility and Binding Behaviour of
Heavy Metals in Surficial Sediments of Louro River (Galicia, Spain) Using
Chemometric Analysis: A Case Study. Science of The Total Environment. Vol 330 (1–
3), Pg 115-129
FRIEDMANN Y. & DALY B. 2004. Red Data Book of the Mammals of South Africa: A
Conservation Assessment. CBSG Southern Africa, Conservation Breeding Specialist
Group (SSC/IUCN), Endangered Wildlife Trust, South Africa.
FROGMAP. 2018. Website: http://vmus.adu.org.za. Accessed in 2018.
GDARD (GAUTENG DEPARTMENT OF AGRICULTURE AND RURAL DEVELOPMENT).
2011. Gauteng Conservation Plan Version 3.3 (C-Plan 3.3). GDARD, Johannesburg.
GDARD (GAUTENG DEPARTMENT OF AGRICULTURE AND RURAL DEVELOPMENT).
2012. GDARD Requirements for Biodiversity Assessments Version 2. GDARD,
Johannesburg.
GERMISHUIZEN G. & MEYER N.L. 2003. Plants of Southern Africa: An annotated
checklist. Strelitzia 17, SANBI, Pretoria.
HAMILTON, 2004. The Demographics of Bumphead Parrotfish (Bolbometopon Muricatum)
in Lightly and Heavily Fished Regions of the Western Solomon Islands: A Thesis.
University of Otago
HARRISON J.A., BURGER M, MINTER L.R., DE VILLIERS A.L., BAARD E.H.W, SCOTT
E., BISHOP P.J. & ELLIS S. 2001. Conservation Assessment and Management Plan
for Southern Africa Frogs. Final Report. Minnesota: IUCN/SSC Conservation Breeding
Specialist Group.

FGD Biodiversity & Wetland Assessment
Natural Scientific Services CC 182
HASAN, M. R.; HECHT, T. ; DE SILVA, S. S. ; TACON, A. G. J., 2007. Study and analysis
of feeds and fertilizers for sustainable aquaculture development. FAO Fisheries
Technical Paper. No. 497. Rome, FAO. 510p.
HENNING G.A., TERBLANCHE R.F. & BALL J.B. 2009. South African Red Data Book:
Butterflies. SANBI Biodiversity Series 13. South African National Biodiversity Institute,
Pretoria.
HILL M.O. 1979. TWINSPAN. A Fortran Program for Arranging Multivariate Data in an
Ordered Two-way Analysis. Cornell University, New York.
HILTON-TAYLOR C. 1996. Red Data List of Southern African Plants. Strelitzia 4. National
Botanical Institute, Pretoria.
HURFORD & SCHNEIDER. 2007. Monitoring Nature Conservation in Cultural Habitats: A
Practical Guide and Case Studies. Springer, Netherlands.
IUCN (INTERNATIONAL UNION FOR CONSERVATION OF NATURE AND NATURAL
RESOURCES). 2012. IUCN Red List Categories and Criteria: Version 3.1. IUCN,
Gland, Switzerland.
IUCN. 2013.1. The IUCN Red List of Threatened Species Version 2013.1. Website:
www.iucnredlist.org. Accessed in 2013.
JOHNSON, S. & STARKE, L. (EDS). 2006. Good Practice Guidance for Mining and
Biodiversity. International Council on Mining and Metals (ICMM), London, UK.
KNNCS (KWAZULU-NATAL NATURE CONSERVATION SERVICE). 1999. Nomination
Proposal for the Drakensberg Park alternatively known as Ukhahlamba Park to be
listed as a World Heritage Site. KwaZulu-Natal Nature Conservation Service.
KOTZE D.C., MARNEWECK G.C, BATCHELOR A.L., LINDLEY D.S. & COLLINS N.B.
2008. WET-EcoServices: A technique for rapidly assessing ecosystem services
supplied by wetlands. WRC Report No TT 339/08, Water Research Commission,
Pretoria.
KLEYNHANS C. J. & LOUW M. D., 2008. Module A: EcoClassification and Ecostatus
determination in River EcoClassification: Manual for ecostatus determination (version
2). Pretoria, South Africa: Joint Water Research Commission and the Department of
Water Affairs and Forestry.
KUNTONEN-VAN ‘T RIET, J. 2007. Strategic Review of the Status of Biodiversity
Management in the South African Mining Industry. Matrix+ Consulting, Johannesburg
LEDET. 2003. Limpopo Environmental Management Act, 2003 (Act 7 of 2003)
LEEMING J. 2003. Scorpions of Southern Africa. Struik Publishers, Cape Town.
LENNTECH, 2016. Website: https://www.lenntech.com/. Accessed in 2018.
LEVICK et al. 2008. The ecological and hydrological significance of ephemeral and
intermittent streams in the arid and semi-arid American southwest. U.S. Environmental
Protection Agency and USDA/ARS Southwest Watershed Research Center,
EPA/600/R-08/134, ARS/233046, 116 pp.
FGD Biodiversity & Wetland Assessment
Natural Scientific Services CC 183
LepiMap, 2018. Website: http://lepimap.adu.org.za/. Accessed in 2018.
LOW A.B. & REBELO A.G. 1996. Vegetation of South Africa, Lesotho and Swaziland. A
Companion to the Vegetation Map of South Africa, Lesotho and Swaziland.
Department of Environmental Affairs and Tourism, Pretoria.
MACFARLANE D.M., KOTZE D.C., ELLERY W.N., WALTERS D., KOOPMAN V.,
GOODMAN P., GOODMAN P. & GOGE C. 2008. Wetland Tools Assessment. WRC
Report.
MACKENZIE, J., & ROUNTREE, 2007. Draft riparian delineation methods prepared for the
Department of Water Affairs and Forestry, Version 1.0 (Unpublished Field Notes).
MAMMALMAP. 2018. Website: http://vmus.adu.org.za. Accessed in 2018.
MEASEY, G.J. 2011. Ensuring a Future for South Africa’s Frogs: A Strategy for
Conservation Research. SANBI Biodiversity Series 19. South African National
Biodiversity Institute, Pretoria.
MECENERO, S., BALL J.B., EDGE D.A., HAMER M.L., HENNING G.A., KRUGER M.A.,
PRINGLE, E.L., TERBLANCHE R.F. & WILLIAMS M.C. Conservation Assessment of
Butterflies of South Africa, Lesotho and Swaziland: Red List and Atlas. Saftronics and
the Animal Demography Unit, University of Cape Town.
Millennium Ecosystem Assessment, 2005. Website:
https://www.millenniumassessment.org/en/index.html. Accessed in 2018.
MINTER L., BURGER M., HARRISON J.A., BRAACK H.H., BISHOP P.J. & KLOEPFER D.
2004. Atlas and Red Data Book of the Frogs of South Africa, Lesotho and Swaziland.
SI/MAB Series #9. Smithsonian Institution, Washington, DC.
MONADJEM A., TAYLOR P.J., COTTERILL F.P.D. & SCHOEMAN M.C. 2010. Bats of
Southern and Central Africa – A Biogeographic and Taxonomic Synthesis. Wits
University Press, Johannesburg.
MUCINA L. & RUTHERFORD M.C. 2006. The Vegetation Map of South Africa, Lesotho and
Swaziland. Strelitzia 19, South African National Biodiversity Institute.
MUELLER-DOMBOIS & ELLENBERG. 1974. Aims and Methods of Vegetation Ecology.
John Wiley and Sons, New York.
NEL, L.J. & DRIVER, A. 2012: National Biodiversity Assessment 2011: Technical Report:
Volume 2: Freshwater Component. CSIR & SANBI, Pretoria.
NEL J., MAREE G., ROUX D., MOOLMAN D., KLEYNHANS N., SILBERBAUER N. &
DRIVER A. 2004. South African National Spatial Biodiversity Assessment. Technical
report, Volume 1. Pretoria: SANBI.
NEWMAN K. 2002. Newman’s Birds of Southern Africa. Struik Publishers, Cape Town.
Nriagu & Pacyna, 1988. Quantitative assessment of worldwide contamination of air, water
and soils by trace metals. Nature 333, 134–139.
O’FARRELL P. 2006. Ecosystem Services and Benefits to Farmers. Conservation Farming
Project.

FGD Biodiversity & Wetland Assessment
Natural Scientific Services CC 184
OLLIS D.J., SNADDON C.D., JOB N.M. & MBONA, N. 2013. Classification System for
Wetlands and other Aquatic Ecosystems in South Africa. User Manual: Inland
Systems. SANBI Biodiversity Series 22. South African National biodiversity Institute,
Pretoria. RAMSAR, 1999. People and Wetlands: The Vital Link, 7th Meeting of the
Conference of the Contracting Parties to the Convention on Wetlands (Ramsar, Iran,
1971), San José, Costa Rica.
PELLERIN & BOOKER, 2000. Reflections on hexavalent chromium: health hazards of an
industrial heavyweight. Environ Health Perspect. 2000 Sep;108(9):A402-7.
PFAB M.F. & VICTOR J.E. 2002. Threatened Plants of Gauteng, South Africa. South
African Journal of Botany 68: 370-375.
PICKETT S.T.A., OSTFELD R.S., SHACHAK M. & LICKENS G.E. 1997. The Ecological
Basis of Conservation: Heterogeneity, Ecosystems, and Biodiversity. Chapman and
Hall. New York.
POSA (PLANTS OF SOUTHERN AFRICA). 2013. Website:
http://posa.sanbi.org/searchspp.php. Accessed in 2013.
REPTILEMAP. 2018. Website: http://vmus.adu.org.za. Accessed in 2018.
ROWNTREE, K.M., & WADESON, R.A., 2000. Field manual for channel classification and
condition assessment. National Aquatic Ecosystem Biomonitoring Programme Report
Series No. 13.Institute for Water Quality Studies, Department of Water Affairs and
Forestry, Pretoria, South Africa.
SABAP 1 & 2 (FIRST AND SECOND SOUTHERN AFRICAN BIRD ATLAS PROJECTS).
2018. Website: http://sabap2.adu.org.za. Accessed in 2018.
SABCA (SOUTH AFRICAN BUTTERFLY CONSERVATION ASSESSMENT). 2018.
Website: http://sabca.adu.org.za. Accessed in 2018.
SAVANNAH ENVIRONMENTAL, 2013. Amendment of Environmental Management
Programme Report for Sekoko Waterberg Colliery, Limpopo Province. Mining Right
Ref No: LP30/5/1/2/2/184 MR
SAMWAYS, 2008. Dragonflies and Damselflies of South Africa. Pensoft Publishers. Sofia.
SAWS (SOUTH AFRICAN WEATHER SERVICE). 2018. Website: www.weathersa.co.za.
Accessed in November 2017.
SCORPIONMAP. 2018. Website: http://vmus.adu.org.za. Accessed in 2018.
SCOTT E., VISSER J.D., YETMAN C.A., OLIVER L. & BROADLEY D.G. 2013. Revalidation
of Pyxicephalus angusticeps Parry, 1982 (Anura: Natatanura: Pyxicephalidae), a
Bullfrog Endemic to the Lowlands of Eastern Africa. Zootaxa 3599: 201-228.
SHEPPARD PR, RIDENOUR G, SPEAKMAN RJ, WITTEN ML. Elevated tungsten and
cobalt in airborne particulates in Fallon, Nevada: possible implications for the childhood
leukemia cluster. Appl Geochem. 2006;21:152–165.
STUART C. & STUART T. 2000. Field Guide to the Mammals of Southern Africa. Struik
Publishers.

FGD Biodiversity & Wetland Assessment
Natural Scientific Services CC 185
TAYLOR, P.J., 2000. Bats of southern Africa. University of Natal Press, Pietermaritzburg.
TAINTON N.1999. Veld Management in South Africa. University of Natal Press,
Pietermaritzburg.
TICHY L. & HOLT J. 2006. JUICE Program for Management, Analysis and Classification of
Ecological Data. Vegetation Science Group, Czech Republic. Upgraded December
2009 from: http://www.sci.muni.cz/botany/juice.
TOOTH, S. 2015. Wetlands in drylands: “Hotspots” of Ecosystem Services in Marginal
Environments. GSDR 2015 Science Brief
VAN WYK B.E. 2002. Website: www.sawac.co.za. Accessed in 2018.
WIKUM D. & SHANHOLTZER G. 1978. Application of the Braun-Blanquet cover-abundance
scale for vegetation analysis in land development studies. Environmental Management
2: 323-329.
YETMAN C.A. 2012. Conservation Biology of the Giant Bullfrog, Pyxicephalus adspersus
(Tschudi, 1838). PhD thesis. University of Pretoria.
YETMAN, C.A. & VERBURGT, L., 2012. Geographic range extension for the Giant Bullfrog
(Pyxicephalus adspersus Tschudi, 1838). Natural Scientific Services. African Herp
News. 57: 18-20
ZITHOLELE, 2016. Website: http://www.zitholele.co.za/environmental/. Accessed in 2018.

FGD Biodiversity & Wetland Assessment
Natural Scientific Services CC 186
13. Appendices
13.1. Appendix 1 Floral species recorded in the QDGS
Family Species Threat status Growth forms
FABACEAE Abrus laevigatus E.Mey. LC Climber
MALVACEAE Abutilon austro-africanum Hochr. LC Dwarf shrub
MALVACEAE Abutilon pycnodon Hochr. LC Herb, shrub
FABACEAE Acacia caffra (Thunb.) Willd. LC Shrub, tree
FABACEAE Acacia fleckii Schinz LC Shrub, tree
FABACEAE Acacia mellifera (Vahl) Benth. subsp. detinens (Burch.) Brenan LC Shrub, tree
FABACEAE Acacia senegal (L.) Willd. var. rostrata Brenan LC Shrub, tree
FABACEAE Acacia tortilis (Forssk.) Hayne subsp. heteracantha (Burch.) Brenan LC Shrub, tree
EUPHORBIACEAE Acalypha caperonioides Baill. var. caperonioides DDT Dwarf shrub, herb
EUPHORBIACEAE Acalypha indica L. var. indica LC Dwarf shrub, herb, shrub
CUCURBITACEAE Acanthosicyos naudinianus (Sond.) C.Jeffrey LC Herb, succulent
POACEAE Acroceras macrum Stapf LC Graminoid
FABACEAE Aeschynomene indica L. LC Herb, shrub
RUBIACEAE Agathisanthemum bojeri Klotzsch subsp. bojeri LC Herb, shrub
FABACEAE Albizia harveyi E.Fourn. LC Tree
HYACINTHACEAE Albuca glauca Baker LC Geophyte
OROBANCHACEAE Alectra orobanchoides Benth. LC [No lifeform defined]
FABACEAE Alistilus bechuanicus N.E.Br. LC Herb
ASTERACEAE Ambrosia artemisiifolia L. Not Evaluated Herb
POACEAE Andropogon schirensis Hochst. ex A.Rich. LC Graminoid
POACEAE Anthephora pubescens Nees LC Graminoid
APONOGETONACEAE Aponogeton junceus Lehm. LC Geophyte, herb, hydrophyte, tenagophyte
POACEAE Aristida adscensionis L. LC Graminoid
POACEAE Aristida canescens Henrard subsp. canescens LC Graminoid
POACEAE Aristida congesta Roem. & Schult. subsp. congesta LC Graminoid
POACEAE Aristida spectabilis Hack. LC Graminoid
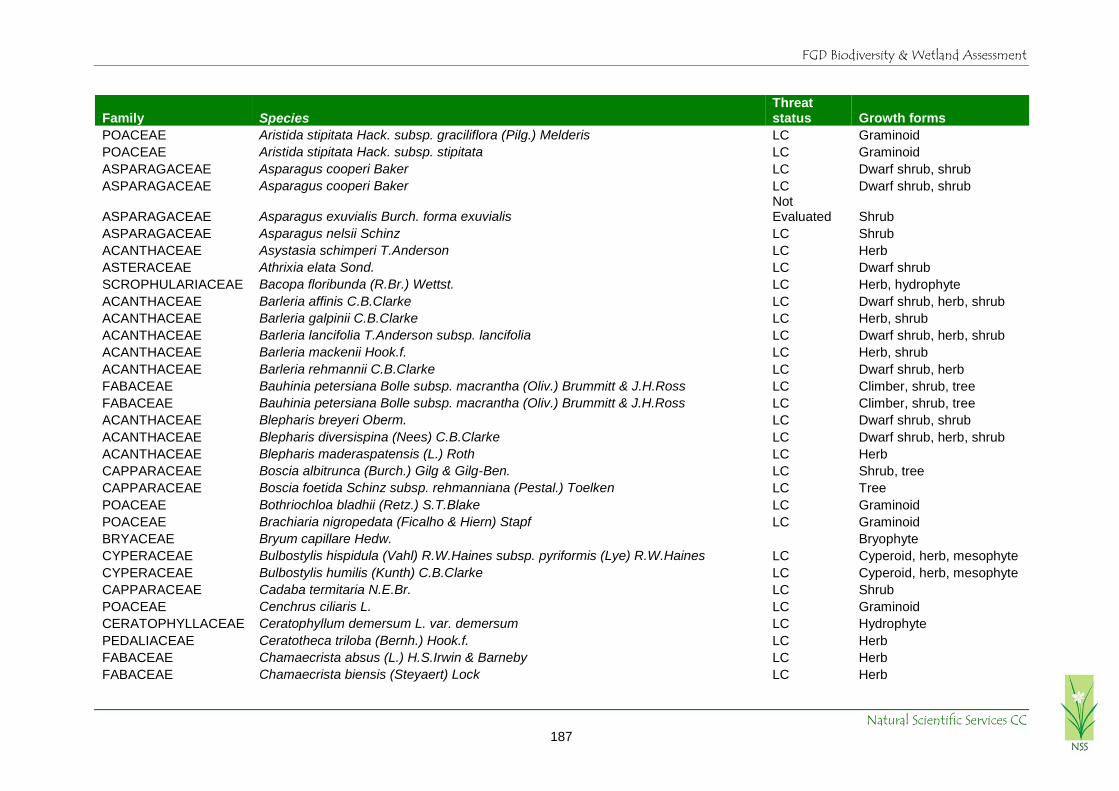
FGD Biodiversity & Wetland Assessment
Natural Scientific Services CC 187
Family Species Threat status Growth forms
POACEAE Aristida stipitata Hack. subsp. graciliflora (Pilg.) Melderis LC Graminoid
POACEAE Aristida stipitata Hack. subsp. stipitata LC Graminoid
ASPARAGACEAE Asparagus cooperi Baker LC Dwarf shrub, shrub
ASPARAGACEAE Asparagus cooperi Baker LC Dwarf shrub, shrub
ASPARAGACEAE Asparagus exuvialis Burch. forma exuvialis Not Evaluated Shrub
ASPARAGACEAE Asparagus nelsii Schinz LC Shrub
ACANTHACEAE Asystasia schimperi T.Anderson LC Herb
ASTERACEAE Athrixia elata Sond. LC Dwarf shrub
SCROPHULARIACEAE Bacopa floribunda (R.Br.) Wettst. LC Herb, hydrophyte
ACANTHACEAE Barleria affinis C.B.Clarke LC Dwarf shrub, herb, shrub
ACANTHACEAE Barleria galpinii C.B.Clarke LC Herb, shrub
ACANTHACEAE Barleria lancifolia T.Anderson subsp. lancifolia LC Dwarf shrub, herb, shrub
ACANTHACEAE Barleria mackenii Hook.f. LC Herb, shrub
ACANTHACEAE Barleria rehmannii C.B.Clarke LC Dwarf shrub, herb
FABACEAE Bauhinia petersiana Bolle subsp. macrantha (Oliv.) Brummitt & J.H.Ross LC Climber, shrub, tree
FABACEAE Bauhinia petersiana Bolle subsp. macrantha (Oliv.) Brummitt & J.H.Ross LC Climber, shrub, tree
ACANTHACEAE Blepharis breyeri Oberm. LC Dwarf shrub, shrub
ACANTHACEAE Blepharis diversispina (Nees) C.B.Clarke LC Dwarf shrub, herb, shrub
ACANTHACEAE Blepharis maderaspatensis (L.) Roth LC Herb
CAPPARACEAE Boscia albitrunca (Burch.) Gilg & Gilg-Ben. LC Shrub, tree
CAPPARACEAE Boscia foetida Schinz subsp. rehmanniana (Pestal.) Toelken LC Tree
POACEAE Bothriochloa bladhii (Retz.) S.T.Blake LC Graminoid
POACEAE Brachiaria nigropedata (Ficalho & Hiern) Stapf LC Graminoid
BRYACEAE Bryum capillare Hedw.
Bryophyte
CYPERACEAE Bulbostylis hispidula (Vahl) R.W.Haines subsp. pyriformis (Lye) R.W.Haines LC Cyperoid, herb, mesophyte
CYPERACEAE Bulbostylis humilis (Kunth) C.B.Clarke LC Cyperoid, herb, mesophyte
CAPPARACEAE Cadaba termitaria N.E.Br. LC Shrub
POACEAE Cenchrus ciliaris L. LC Graminoid
CERATOPHYLLACEAE Ceratophyllum demersum L. var. demersum LC Hydrophyte
PEDALIACEAE Ceratotheca triloba (Bernh.) Hook.f. LC Herb
FABACEAE Chamaecrista absus (L.) H.S.Irwin & Barneby LC Herb
FABACEAE Chamaecrista biensis (Steyaert) Lock LC Herb

FGD Biodiversity & Wetland Assessment
Natural Scientific Services CC 188
Family Species Threat status Growth forms
VERBENACEAE Chascanum hederaceum (Sond.) Moldenke var. hederaceum LC Herb
VERBENACEAE Chascanum incisum (H.Pearson) Moldenke LC Herb
VERBENACEAE Chascanum pinnatifidum (L.f.) E.Mey. var. pinnatifidum LC Herb
GENTIANACEAE Chironia purpurascens (E.Mey.) Benth. & Hook.f. subsp. humilis (Gilg) I.Verd. LC Herb
ANTHERICACEAE Chlorophytum recurvifolium (Baker) C.Archer & Kativu LC Herb
ACANTHACEAE Chorisochora transvaalensis (A.Meeuse) Vollesen LC Suffrutex
CAPPARACEAE Cleome angustifolia Forssk. subsp. petersiana (Klotzsch ex Sond.) Kers LC Herb
CAPPARACEAE Cleome hirta (Klotzsch) Oliv. LC Herb
CAPPARACEAE Cleome rubella Burch. LC Herb
LAMIACEAE Clerodendrum ternatum Schinz LC Dwarf shrub
EUPHORBIACEAE Clutia pulchella L. var. pulchella LC Dwarf shrub, herb, shrub
CUCURBITACEAE Coccinia sessilifolia (Sond.) Cogn. LC Climber, herb, succulent
COMBRETACEAE Combretum apiculatum Sond. subsp. apiculatum LC Shrub, tree
COMMELINACEAE Commelina benghalensis L. LC Herb
COMMELINACEAE Commelina erecta L. LC Herb
COMMELINACEAE Commelina livingstonii C.B.Clarke LC Herb
BURSERACEAE Commiphora mollis (Oliv.) Engl. LC Tree
BURSERACEAE Commiphora neglecta I.Verd. LC Succulent, tree
BURSERACEAE Commiphora pyracanthoides Engl. LC Shrub, tree
MALVACEAE Corchorus asplenifolius Burch. LC Herb
MALVACEAE Corchorus kirkii N.E.Br. LC Shrub
MALVACEAE Corchorus psammophilus Codd Threatened Herb
CARYOPHYLLACEAE Corrigiola litoralis L. subsp. litoralis var. litoralis LC Herb
ASTERACEAE Cotula anthemoides L. LC Herb
CRASSULACEAE Crassula capitella Thunb. subsp. sessilicymula (Mogg) Toelken LC Herb, succulent
FABACEAE Crotalaria distans Benth. subsp. distans LC Herb
FABACEAE Crotalaria orientalis Burtt Davy ex I.Verd. subsp. orientalis LC Dwarf shrub, herb
FABACEAE Crotalaria sphaerocarpa Perr. ex DC. subsp. sphaerocarpa LC Herb
APOCYNACEAE Cryptolepis oblongifolia (Meisn.) Schltr. LC Scrambler, shrub
CUCURBITACEAE Cucumis africanus L.f. LC Herb
CUCURBITACEAE Cucumis myriocarpus Naudin subsp. myriocarpus LC Herb
COMMELINACEAE Cyanotis speciosa (L.f.) Hassk. LC Herb, succulent
POACEAE Cymbopogon pospischilii (K.Schum.) C.E.Hubb. Not Graminoid

FGD Biodiversity & Wetland Assessment
Natural Scientific Services CC 189
Family Species Threat status Growth forms Evaluated
CYPERACEAE Cyperus chersinus (N.E.Br.) Kük. LC Cyperoid, herb, mesophyte
CYPERACEAE Cyperus margaritaceus Vahl var. margaritaceus LC Cyperoid, herb, mesophyte
POACEAE Dactyloctenium giganteum Fisher & Schweick. LC Graminoid
EUPHORBIACEAE Dalechampia capensis A.Spreng. LC Dwarf shrub
ASTERACEAE Denekia capensis Thunb. LC Herb
PEDALIACEAE Dicerocaryum senecioides (Klotzsch) Abels LC Herb
DICHAPETALACEAE Dichapetalum cymosum (Hook.) Engl. LC Dwarf shrub
FABACEAE Dichrostachys cinerea (L.) Wight & Arn. subsp. africana Brenan & Brummitt var. africana LC Shrub, tree
ACANTHACEAE Dicliptera minor C.B.Clarke subsp. minor LC Herb
ASTERACEAE Dicoma tomentosa Cass. LC Dwarf shrub, herb
POACEAE Digitaria debilis (Desf.) Willd. LC Graminoid
POACEAE Digitaria eriantha Steud. LC Graminoid
POACEAE Digitaria eriantha Steud. LC Graminoid
EBENACEAE Diospyros lycioides Desf. subsp. lycioides LC Shrub
EBENACEAE Diospyros lycioides Desf. subsp. nitens (Harv. ex Hiern) De Winter LC Shrub
HYACINTHACEAE Dipcadi glaucum (Burch. ex Ker Gawl.) Baker LC Geophyte
HYACINTHACEAE Dipcadi gracillimum Baker LC Geophyte
HYACINTHACEAE Dipcadi marlothii Engl. LC Geophyte
HYACINTHACEAE Dipcadi papillatum Oberm. LC Geophyte
HYACINTHACEAE Dipcadi platyphyllum Baker LC Geophyte
HYACINTHACEAE Dipcadi viride (L.) Moench LC Geophyte
APOCYNACEAE Diplorhynchus condylocarpon (Müll.Arg.) Pichon LC Shrub, tree
FABACEAE Dolichos junodii (Harms) Verdc. LC Herb
HYACINTHACEAE Drimia angustifolia Baker LC Geophyte
APOCYNACEAE Duvalia polita N.E.Br. LC Succulent
ACANTHACEAE Dyschoriste fischeri Lindau LC Dwarf shrub, shrub
ACANTHACEAE Dyschoriste rogersii S.Moore LC Dwarf shrub, shrub
POACEAE Echinochloa holubii (Stapf) Stapf LC Graminoid
CYPERACEAE Eleocharis limosa (Schrad.) Schult. LC
Cyperoid, emergent hydrophyte, helophyte, herb
POACEAE Eleusine coracana (L.) Gaertn. subsp. africana (Kenn.-O'Byrne) Hilu & de Wet LC Graminoid

FGD Biodiversity & Wetland Assessment
Natural Scientific Services CC 190
Family Species Threat status Growth forms
ENTODONTACEAE Entodon cymbifolius Wager & Dixon
Bryophyte, epiphyte
POACEAE Eragrostis aspera (Jacq.) Nees LC Graminoid
POACEAE Eragrostis barbinodis Hack. LC Graminoid
POACEAE Eragrostis biflora Hack. ex Schinz LC Graminoid
POACEAE Eragrostis hierniana Rendle LC Graminoid
POACEAE Eragrostis lehmanniana Nees var. chaunantha (Pilg.) De Winter LC Graminoid
POACEAE Eragrostis lehmanniana Nees var. lehmanniana LC Graminoid
POACEAE Eragrostis pallens Hack. LC Graminoid
POACEAE Eragrostis pallens Hack. LC Graminoid
POACEAE Eragrostis sarmentosa (Thunb.) Trin. LC Graminoid
POACEAE Eragrostis superba Peyr. LC Graminoid
ERIOCAULACEAE Eriocaulon abyssinicum Hochst. LC Herb, hydrophyte, tenagophyte
ERIOSPERMACEAE Eriospermum flagelliforme (Baker) J.C.Manning LC Geophyte
ERIOSPERMACEAE Eriospermum porphyrovalve Baker LC Geophyte
BRASSICACEAE Erucastrum griquense (N.E.Br.) O.E.Schulz LC Herb
EBENACEAE Euclea undulata Thunb. LC Shrub, tree
POACEAE Eulalia aurea (Bory) Kunth NT* Graminoid
EUPHORBIACEAE Euphorbia neopolycnemoides Pax & K.Hoffm. LC Herb
EUPHORBIACEAE Euphorbia rhombifolia Boiss. LC Shrub, succulent
EUPHORBIACEAE Euphorbia tirucalli L. LC Shrub, succulent, tree
EUPHORBIACEAE Euphorbia waterbergensis R.A.Dyer Rare Shrub, succulent
CONVOLVULACEAE Evolvulus alsinoides (L.) L. LC Herb
FABRONIACEAE Fabronia pilifera Hornsch.
Bryophyte, epiphyte
ASTERACEAE Felicia mossamedensis (Hiern) Mendonça LC Herb
MORACEAE Ficus glumosa Delile LC Succulent, tree
RUBIACEAE Gardenia volkensii K.Schum. subsp. spatulifolia (Stapf & Hutch.) Verdc. LC Tree
ASTERACEAE Geigeria burkei Harv. subsp. burkei var. burkei LC Herb
ASTERACEAE Geigeria filifolia Mattf. LC Herb
GISEKIACEAE Gisekia pharnacioides L. var. pharnacioides LC Herb
MOLLUGINACEAE Glinus bainesii (Oliv.) Pax LC Dwarf shrub
APOCYNACEAE Gomphocarpus tomentosus Burch. subsp. tomentosus LC Herb, shrub
MALVACEAE Gossypium herbaceum L. subsp. africanum (Watt) Vollesen LC Shrub

FGD Biodiversity & Wetland Assessment
Natural Scientific Services CC 191
Family Species Threat status Growth forms
MALVACEAE Grewia avellana Hiern LC Shrub
MALVACEAE Grewia avellana Hiern LC Shrub
MALVACEAE Grewia flava DC. LC Shrub
MALVACEAE Grewia flavescens Juss. LC Shrub
MALVACEAE Grewia occidentalis L. var. occidentalis LC Shrub, tree
MALVACEAE Grewia retinervis Burret LC Shrub
MALVACEAE Grewia subspathulata N.E.Br. LC Shrub
PEDALIACEAE Harpagophytum procumbens (Burch.) DC. ex Meisn. subsp. transvaalense Ihlenf. & H.E.K.Hartmann
Not Evaluated Herb
ASTERACEAE Helichrysum nudifolium (L.) Less. var. oxyphyllum (DC.) Beentje LC Herb
ASTERACEAE Helichrysum zeyheri Less. LC Dwarf shrub, shrub
BORAGINACEAE Heliotropium ciliatum Kaplan LC Herb
BORAGINACEAE Heliotropium ciliatum Kaplan LC Herb
BORAGINACEAE Heliotropium ovalifolium Forssk. LC Herb
MALVACEAE Hermannia boraginiflora Hook. LC Dwarf shrub
MALVACEAE Hermannia grisea Schinz LC Dwarf shrub
MALVACEAE Hermannia modesta (Ehrenb.) Mast. LC Dwarf shrub, herb
MALVACEAE Hermannia modesta (Ehrenb.) Mast. LC Dwarf shrub, herb
MALVACEAE Hermannia stellulata (Harv.) K.Schum. LC Herb
MALVACEAE Hermannia tomentosa (Turcz.) Schinz ex Engl. LC Herb
AMARANTHACEAE Hermbstaedtia odorata (Burch.) T.Cooke var. albi-rosea Suess. LC Herb
AMARANTHACEAE Hermbstaedtia odorata (Burch.) T.Cooke var. albi-rosea Suess. LC Herb
AMARANTHACEAE Hermbstaedtia odorata (Burch.) T.Cooke var. aurantiaca (Suess.) C.C.Towns. LC Herb
AMARANTHACEAE Hermbstaedtia odorata (Burch.) T.Cooke var. aurantiaca (Suess.) C.C.Towns. LC Herb
AMARANTHACEAE Hermbstaedtia odorata (Burch.) T.Cooke var. odorata LC Herb
POACEAE Heteropogon contortus (L.) Roem. & Schult. LC Graminoid
MALVACEAE Hibiscus calyphyllus Cav. LC Dwarf shrub, herb
MALVACEAE Hibiscus micranthus L.f. var. micranthus LC Herb, shrub
MALVACEAE Hibiscus nigricaulis Baker f. LC Herb
MALVACEAE Hibiscus physaloides Guill. & Perr. LC Herb
MALVACEAE Hibiscus platycalyx Mast. LC Shrub
MALVACEAE Hibiscus praeteritus R.A.Dyer LC Herb
MALVACEAE Hibiscus pusillus Thunb. LC Herb

FGD Biodiversity & Wetland Assessment
Natural Scientific Services CC 192
Family Species Threat status Growth forms
MALVACEAE Hibiscus schinzii Gürke LC Herb
MALVACEAE Hibiscus sidiformis Baill. LC Herb
MALVACEAE Hibiscus syriaca L. Not Evaluated Shrub
MALVACEAE Hibiscus vitifolius L. subsp. vulgaris Brenan & Exell LC Herb, shrub
ASTERACEAE Hirpicium bechuanense (S.Moore) Roessler LC Dwarf shrub
APOCYNACEAE Huernia transvaalensis Stent LC Succulent
APOCYNACEAE Huernia zebrina N.E.Br. subsp. magniflora (E.Phillips) L.C.Leach Not Evaluated Succulent
HYPERICACEAE Hypericum lalandii Choisy LC Herb
FABACEAE Indigofera bainesii Baker LC Dwarf shrub, herb
FABACEAE Indigofera daleoides Benth. ex Harv. var. daleoides LC Herb
FABACEAE Indigofera filipes Benth. ex Harv. LC Dwarf shrub, herb, shrub
FABACEAE Indigofera flavicans Baker LC Herb
FABACEAE Indigofera ingrata N.E.Br. LC Herb
FABACEAE Indigofera nebrowniana J.B.Gillett LC Dwarf shrub, herb
FABACEAE Indigofera sordida Benth. ex Harv. LC Herb
CONVOLVULACEAE Ipomoea adenioides Schinz var. adenioides LC Dwarf shrub, shrub
CONVOLVULACEAE Ipomoea coptica (L.) Roth ex Roem. & Schult. LC Climber, herb
CONVOLVULACEAE Ipomoea crassipes Hook. var. crassipes LC Herb, succulent
CONVOLVULACEAE Ipomoea gracilisepala Rendle LC Herb
CONVOLVULACEAE Ipomoea hackeliana (Schinz) Hallier f. LC Herb
CONVOLVULACEAE Ipomoea magnusiana Schinz LC Herb
CONVOLVULACEAE Ipomoea obscura (L.) Ker Gawl. var. obscura LC Herb
CONVOLVULACEAE Ipomoea robertsiana Rendle LC Suffrutex
ACANTHACEAE Justicia exigua S.Moore LC Herb
ACANTHACEAE Justicia exigua S.Moore LC Herb
ACANTHACEAE Justicia flava (Vahl) Vahl LC Dwarf shrub, herb
CUCURBITACEAE Kedrostis foetidissima (Jacq.) Cogn. LC Climber, herb, succulent
KIRKIACEAE Kirkia acuminata Oliv. LC Tree
KIRKIACEAE Kirkia wilmsii Engl. LC Tree
RUBIACEAE Kohautia caespitosa Schnizl. subsp. brachyloba (Sond.) D.Mantell LC Herb
RUBIACEAE Kohautia cynanchica DC. LC Herb

FGD Biodiversity & Wetland Assessment
Natural Scientific Services CC 193
Family Species Threat status Growth forms
RUBIACEAE Kohautia virgata (Willd.) Bremek. LC Herb
CYPERACEAE Kyllinga alba Nees LC Cyperoid, herb, mesophyte
AMARANTHACEAE Kyphocarpa angustifolia (Moq.) Lopr. LC Herb
FABACEAE Lablab purpureus (L.) Sweet subsp. uncinatus Verdc. LC Climber, herb
IRIDACEAE Lapeirousia sandersonii Baker LC Geophyte, herb
LAMIACEAE Leucas capensis (Benth.) Engl. LC Dwarf shrub
LAMIACEAE Leucas sexdentata Skan LC Herb
MOLLUGINACEAE Limeum fenestratum (Fenzl) Heimerl var. fenestratum LC Herb
LESKEACEAE Lindbergia pseudoleskeoides Dixon
Bryophyte, epiphyte
VERBENACEAE Lippia wilmsii H.Pearson LC Shrub
POACEAE Loudetia flavida (Stapf) C.E.Hubb. LC Graminoid
ONAGRACEAE Ludwigia adscendens (L.) Hara subsp. diffusa (Forssk.) P.H.Raven LC Herb, hydrophyte
CAPPARACEAE Maerua angolensis DC. subsp. angolensis LC Shrub, tree
APOCYNACEAE Marsdenia sylvestris (Retz.) P.I.Forst. LC Climber
POACEAE Megaloprotachne albescens C.E.Hubb. LC Graminoid
MALVACEAE Melhania acuminata Mast. var. acuminata LC Dwarf shrub
MALVACEAE Melhania forbesii Planch. ex Mast. LC Dwarf shrub, shrub
POACEAE Melinis repens (Willd.) Zizka subsp. grandiflora (Hochst.) Zizka LC Graminoid
CONVOLVULACEAE Merremia verecunda Rendle LC Herb
SAPOTACEAE Mimusops zeyheri Sond. LC Shrub, tree
CUCURBITACEAE Momordica repens Bremek. LC Herb, succulent
ACANTHACEAE Monechma divaricatum (Nees) C.B.Clarke LC Shrub, suffrutex
GERANIACEAE Monsonia angustifolia E.Mey. ex A.Rich. LC Herb
GERANIACEAE Monsonia glauca R.Knuth LC Herb
FABACEAE Neorautanenia ficifolia (Benth. ex Harv.) C.A.Sm. LC Climber, herb, succulent
FABACEAE Neorautanenia mitis (A.Rich.) Verdc. LC Dwarf shrub, herb, succulent
AMARYLLIDACEAE Nerine laticoma (Ker Gawl.) T.Durand & Schinz LC Geophyte
LYTHRACEAE Nesaea rigidula (Sond.) Koehne LC Herb
ASTERACEAE Nidorella resedifolia DC. subsp. resedifolia LC Herb
NYMPHAEACEAE Nymphaea nouchali Burm.f. var. caerulea (Savigny) Verdc. LC Epihydate, herb, hydrophyte
HYACINTHACEAE Ornithogalum tenuifolium F.Delaroche subsp. tenuifolium Not Evaluated Geophyte

FGD Biodiversity & Wetland Assessment
Natural Scientific Services CC 194
Family Species Threat status Growth forms
SANTALACEAE Osyris lanceolata Hochst. & Steud. LC Shrub
FABACEAE Otoptera burchellii DC. LC Climber, herb, shrub
POLYGONACEAE Oxygonum dregeanum Meisn. subsp. canescens (Sond.) Germish. var. canescens LC Herb
POLYGONACEAE Oxygonum sinuatum (Hochst. & Steud. ex Meisn.) Dammer Herb
ANACARDIACEAE Ozoroa paniculosa (Sond.) R.& A.Fern. var. paniculosa LC Shrub, tree
POACEAE Panicum maximum Jacq. LC Graminoid
POACEAE Panicum maximum Jacq. LC Graminoid
POACEAE Panicum repens L. LC Graminoid
POACEAE Panicum schinzii Hack. LC Graminoid
RUBIACEAE Pavetta harborii S.Moore LC Shrub
MALVACEAE Pavonia clathrata Mast. LC Herb, shrub
MALVACEAE Pavonia transvaalensis (Ulbr.) A.Meeuse LC Dwarf shrub, herb
RUBIACEAE Pentanisia angustifolia (Hochst.) Hochst. LC Herb
APOCYNACEAE Pergularia daemia (Forssk.) Chiov. subsp. daemia LC Climber
POACEAE Perotis patens Gand. LC Graminoid
POLYGONACEAE Persicaria attenuata (R.Br.) Soják subsp. africana K.L.Wilson LC Helophyte, herb, hydrophyte
POLYGONACEAE Persicaria limbata (Meisn.) H.Hara Not Evaluated Helophyte, herb
NYCTAGINACEAE Phaeoptilum spinosum Radlk. LC Shrub
VERBENACEAE Phyla nodiflora (L.) Greene var. nodiflora Not Evaluated Herb
APOCYNACEAE Piaranthus atrosanguineus (N.E.Br.) Bruyns LC Succulent
POACEAE Pogonarthria squarrosa (Roem. & Schult.) Pilg. LC Graminoid
POACEAE Pogonarthria squarrosa (Roem. & Schult.) Pilg. LC Graminoid
POLYGONACEAE Polygonum plebeium R.Br. LC Herb
FABACEAE Pomaria burchellii (DC.) B.B.Simpson & G.P.Lewis subsp. burchellii LC Herb
URTICACEAE Pouzolzia mixta Solms var. mixta LC Shrub, succulent, tree
VERBENACEAE Priva africana Moldenke LC Herb
ASTERACEAE Pseudognaphalium luteo-album (L.) Hilliard & B.L.Burtt Herb
LESKEACEAE Pseudoleskea leskeoides (Paris) Müll.Hal.
Bryophyte, epiphyte
PEDALIACEAE Pterodiscus ngamicus N.E.Br. ex Stapf LC Herb, succulent
FABACEAE Ptycholobium contortum (N.E.Br.) Brummitt LC Dwarf shrub, herb
CYPERACEAE Pycreus pelophilus (Ridl.) C.B.Clarke LC Cyperoid, helophyte, herb,

FGD Biodiversity & Wetland Assessment
Natural Scientific Services CC 195
Family Species Threat status Growth forms
mesophyte
CYPERACEAE Pycreus polystachyos (Rottb.) P.Beauv. var. polystachyos LC Cyperoid, helophyte, herb, mesophyte
FABACEAE Requienia pseudosphaerosperma (Schinz) Brummitt LC Herb, shrub
BIGNONIACEAE Rhigozum brevispinosum Kuntze LC Shrub
FABACEAE Rhynchosia spectabilis Schinz LC Dwarf shrub, herb, shrub
FABACEAE Rhynchosia totta (Thunb.) DC. var. totta LC Climber, herb
RICCIACEAE Riccia atropurpurea Sim
Bryophyte
RICCIACEAE Riccia congoana Steph.
Bryophyte
RICCIACEAE Riccia okahandjana S.W.Arnell
Bryophyte
RUBIACEAE Rubia horrida (Thunb.) Puff LC Herb
ACANTHACEAE Ruellia patula Jacq. LC Herb
APOCYNACEAE Sarcostemma viminale (L.) R.Br. subsp. viminale LC Climber, succulent
EUPHORBIACEAE Schinziophyton rautanenii (Schinz) Radcl.-Sm. LC Tree
POACEAE Schmidtia pappophoroides Steud. LC Graminoid
POACEAE Schmidtia pappophoroides Steud. LC Graminoid
ANACARDIACEAE Searsia rigida (Mill.) F.A.Barkley var. margaretae (Burtt Davy ex Moffett) Moffett LC Shrub
GENTIANACEAE Sebaea leiostyla Gilg LC Herb
APOCYNACEAE Secamone parvifolia (Oliv.) Bullock LC Climber
SCROPHULARIACEAE Selago lacunosa Klotzsch LC Herb
SCROPHULARIACEAE Selago welwitschii Rolfe var. australis Hilliard LC Suffrutex
AMARANTHACEAE Sericorema remotiflora (Hook.f.) Lopr. LC Herb
MALVACEAE Sida chrysantha Ulbr. LC Dwarf shrub
MALVACEAE Sida ovata Forssk. LC Dwarf shrub, herb
SOLANACEAE Solanum catombelense Peyr. LC Dwarf shrub, shrub
SOLANACEAE Solanum lichtensteinii Willd. LC Dwarf shrub, shrub
SOLANACEAE Solanum tomentosum L. var. tomentosum LC Dwarf shrub, herb, shrub
MALPIGHIACEAE Sphedamnocarpus pruriens (A.Juss.) Szyszyl. subsp. pruriens LC Climber, shrub
EUPHORBIACEAE Spirostachys africana Sond. LC Shrub, tree
POACEAE Stipagrostis uniplumis (Licht.) De Winter var. uniplumis LC Graminoid
OROBANCHACEAE Striga bilabiata (Thunb.) Kuntze subsp. bilabiata LC Herb, parasite
OROBANCHACEAE Striga elegans Benth. LC Herb, parasite
OROBANCHACEAE Striga gesnerioides (Willd.) Vatke LC Herb, parasite

FGD Biodiversity & Wetland Assessment
Natural Scientific Services CC 196
Family Species Threat status Growth forms
ARACEAE Stylochaeton natalensis Schott LC Herb
MYRTACEAE Syzygium cordatum Hochst. ex C.Krauss subsp. cordatum LC Shrub, tree
PORTULACACEAE Talinum arnotii Hook.f. LC Dwarf shrub, succulent
PORTULACACEAE Talinum crispatulum Dinter LC Dwarf shrub, succulent
ASTERACEAE Tarchonanthus camphoratus L. LC Shrub, tree
FABACEAE Tephrosia purpurea (L.) Pers. subsp. leptostachya (DC.) Brummitt var. leptostachya LC Herb
FABACEAE Tephrosia purpurea (L.) Pers. subsp. leptostachya (DC.) Brummitt var. pubescens Baker LC Herb
FABACEAE Tephrosia purpurea (L.) Pers. subsp. leptostachya (DC.) Brummitt var. pubescens Baker LC Herb
FABACEAE Tephrosia zoutpansbergensis Bremek. LC Dwarf shrub, shrub
COMBRETACEAE Terminalia sericea Burch. ex DC. LC Tree
SANTALACEAE Thesium resedoides A.W.Hill LC Herb, parasite, shrub
EUPHORBIACEAE Tragia dioica Sond. LC Dwarf shrub, herb
POACEAE Tragus berteronianus Schult. LC Graminoid
ZYGOPHYLLACEAE Tribulus terrestris L. LC Herb
ZYGOPHYLLACEAE Tribulus zeyheri Sond. subsp. zeyheri LC Dwarf shrub, herb
POACEAE Triraphis schinzii Hack. LC Graminoid
MALVACEAE Triumfetta pilosa Roth var. effusa (E.Mey. ex Harv.) Wild LC Shrub
CUCURBITACEAE Trochomeria macrocarpa (Sond.) Hook.f. subsp. macrocarpa LC Climber, herb, succulent
MELIACEAE Turraea obtusifolia Hochst. LC Climber, shrub, tree
POACEAE Urochloa brachyura (Hack.) Stapf LC Graminoid
POACEAE Urochloa brachyura (Hack.) Stapf LC Graminoid
VAHLIACEAE Vahlia capensis (L.f.) Thunb. subsp. vulgaris Bridson var. linearis E.Mey. ex Bridson LC Herb
RUBIACEAE Vangueria infausta Burch. subsp. infausta LC Tree
VERBENACEAE Verbena officinalis L. Not Evaluated Herb
ASTERACEAE Verbesina encelioides (Cav.) Benth. & Hook. var. encelioides Not Evaluated Herb
ASTERACEAE Vernonia fastigiata Oliv. & Hiern LC Herb
ASTERACEAE Vernonia sutherlandii Harv. LC Herb
FABACEAE Vigna frutescens A.Rich. subsp. frutescens var. frutescens LC Climber, herb
FABACEAE Vigna unguiculata (L.) Walp. subsp. protracta (E.Mey.) B.J.Pienaar LC Herb
VISCACEAE Viscum tuberculatum A.Rich. LC Parasite, shrub, succulent

FGD Biodiversity & Wetland Assessment
Natural Scientific Services CC 197
Family Species Threat status Growth forms
LAMIACEAE Vitex rehmannii Gürke LC Tree
CAMPANULACEAE Wahlenbergia undulata (L.f.) A.DC. LC Herb
MALVACEAE Waltheria indica L. LC Herb
FABACEAE Xanthocercis zambesiaca (Baker) Dumaz-le-Grand LC Tree
CONVOLVULACEAE Xenostegia tridentata (L.) D.F.Austin & Staples subsp. angustifolia (Jacq.) Lejoly & Lisowski LC Herb
OLACACEAE Ximenia americana L. var. microphylla Welw. ex Oliv. LC Shrub, tree
XYRIDACEAE Xyris capensis Thunb. LC Helophyte, herb, hydrophyte
RHAMNACEAE Ziziphus mucronata Willd. subsp. mucronata LC Shrub, tree
FABACEAE Zornia linearis E.Mey. LC Herb
13.2. Appendix 1a Additional photographic evidence of floral species on site
Clerodendrum ternatum Alistilus bechuanicus

FGD Biodiversity & Wetland Assessment
Natural Scientific Services CC 198
Evolvulus alsinoides Kyllinga alba Chlorophytum recurvifolium
Oxygonum dregeanum Heliotropium species Cyperus margaritaceus
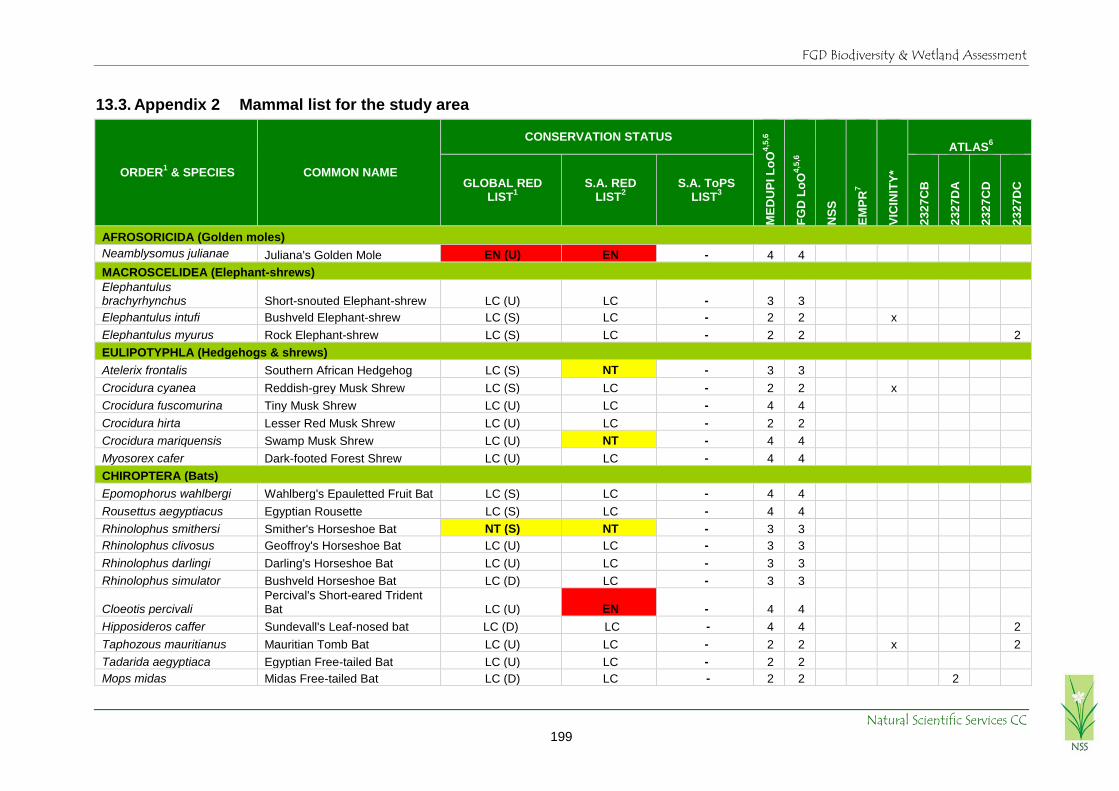
FGD Biodiversity & Wetland Assessment
Natural Scientific Services CC 199
13.3. Appendix 2 Mammal list for the study area
ORDER1 & SPECIES COMMON NAME
CONSERVATION STATUS
ME
DU
PI
Lo
O4
,5,6
FG
D L
oO
4,5
,6
NS
S
EM
PR
7
VIC
INIT
Y*
ATLAS6
GLOBAL RED LIST
1
S.A. RED LIST
2
S.A. ToPS LIST
3
23
27
CB
23
27
DA
23
27
CD
23
27
DC
AFROSORICIDA (Golden moles)
Neamblysomus julianae Juliana's Golden Mole EN (U) EN - 4 4
MACROSCELIDEA (Elephant-shrews)
Elephantulus brachyrhynchus Short-snouted Elephant-shrew LC (U) LC - 3 3
Elephantulus intufi Bushveld Elephant-shrew LC (S) LC - 2 2 x
Elephantulus myurus Rock Elephant-shrew LC (S) LC - 2 2 2
EULIPOTYPHLA (Hedgehogs & shrews)
Atelerix frontalis Southern African Hedgehog LC (S) NT - 3 3
Crocidura cyanea Reddish-grey Musk Shrew LC (S) LC - 2 2 x
Crocidura fuscomurina Tiny Musk Shrew LC (U) LC - 4 4
Crocidura hirta Lesser Red Musk Shrew LC (U) LC - 2 2
Crocidura mariquensis Swamp Musk Shrew LC (U) NT - 4 4
Myosorex cafer Dark-footed Forest Shrew LC (U) LC - 4 4
CHIROPTERA (Bats)
Epomophorus wahlbergi Wahlberg's Epauletted Fruit Bat LC (S) LC - 4 4
Rousettus aegyptiacus Egyptian Rousette LC (S) LC - 4 4
Rhinolophus smithersi Smither's Horseshoe Bat NT (S) NT - 3 3
Rhinolophus clivosus Geoffroy's Horseshoe Bat LC (U) LC - 3 3
Rhinolophus darlingi Darling's Horseshoe Bat LC (U) LC - 3 3
Rhinolophus simulator Bushveld Horseshoe Bat LC (D) LC - 3 3
Cloeotis percivali Percival's Short-eared Trident Bat LC (U) EN - 4 4
Hipposideros caffer Sundevall's Leaf-nosed bat LC (D) LC - 4 4 2
Taphozous mauritianus Mauritian Tomb Bat LC (U) LC - 2 2 x 2
Tadarida aegyptiaca Egyptian Free-tailed Bat LC (U) LC - 2 2
Mops midas Midas Free-tailed Bat LC (D) LC - 2 2 2

FGD Biodiversity & Wetland Assessment
Natural Scientific Services CC 200
ORDER1 & SPECIES COMMON NAME
CONSERVATION STATUS
ME
DU
PI
Lo
O4
,5,6
FG
D L
oO
4,5
,6
NS
S
EM
PR
7
VIC
INIT
Y*
ATLAS6
GLOBAL RED LIST
1
S.A. RED LIST
2
S.A. ToPS LIST
3
23
27
CB
23
27
DA
23
27
CD
23
27
DC
Miniopterus natalensis Natal Long-fingered Bat LC (U) LC - 4 4
Hypsugo anchietae Anchieta's Pipistrelle LC (U) LC - 4 4
Pipistrellus hesperidus Dusky Pipistrelle LC (U) LC - 3 3
Pipistrellus rusticus Rusty Pipistrelle LC (U) LC - 2 2 x 2
Neoromicia capensis Cape Serotine LC (S) LC - 1 1 x x 2
Pipistrellus zuluensis Zulu Serotine LC (U) LC - 3 3 2
Myotis welwitschii Welwitsch's Myotis LC (U) LC - 4 4
Myotis tricolor Temminck's Myotis LC (U) LC - 4 4
Laephotis botswanae Botswana Long-eared Bat LC (S) LC - 3 3
Scotophilus dinganii Yellow-bellied House Bat LC (U) LC - 2 2 x 4 3
Scotophilus viridis Green House Bat LC (U) LC - 1 1
Nycteris thebaica Egyptian Slit-faced Bat LC (U) LC - 2 2 2
PRIMATES (Primates)
Galago moholi Southern Lesser Galago LC (S) LC - 1 1 x 2
Papio ursinus Chacma Baboon LC (S) LC - 1 1 x x x
Cercopithecus pygerythrus Vervet Monkey LC (S) LC - 1 1 x x
PHOLIDOTA (Pangolin)
Manis temminckii Pangolin VU (D) VU VU 1 1* 2
LAGOMORPHA (Hares & rabbits)
Lepus saxatilis Scrub Hare LC (D) LC - 1 1 x x 1 3 1
Pronolagus randensis Jameson's Red Rock Rabbit LC (U) LC - 3 3 *
RODENTIA (Rodents)
Cryptomys hottentotus Common Mole-rat LC (S) LC - 1 1 x x
Hystrix africaeaustralis Porcupine LC (S) LC - 1 1 x x 2
Pedetes capensis Springhare LC (U) LC - 2 2 x 3
Xerus inauris Cape Ground Squirrel LC (S) LC - 2 2 x
Paraxerus cepapi Tree Squirrel LC (S) LC - 1 1 x x
Graphiurus murinus Woodland Dormouse LC (S) LC - 2 2

FGD Biodiversity & Wetland Assessment
Natural Scientific Services CC 201
ORDER1 & SPECIES COMMON NAME
CONSERVATION STATUS
ME
DU
PI
Lo
O4
,5,6
FG
D L
oO
4,5
,6
NS
S
EM
PR
7
VIC
INIT
Y*
ATLAS6
GLOBAL RED LIST
1
S.A. RED LIST
2
S.A. ToPS LIST
3
23
27
CB
23
27
DA
23
27
CD
23
27
DC
Acomys spinosissimus Spiny Mouse LC (S) LC - 2 2 1
Lemniscomys rosalia Single-striped Mouse LC (S) LC - 2 2
Rhabdomys pumilio Striped Mouse LC (S) LC - 4 4
Dasymys incomtus Water Rat LC (U) NT - 3 3
Mus indutus Desert Pygmy Mouse LC (S) LC - 3 3
Mus minutoides Pygmy Mouse LC (S) LC - 3 3 x
Mastomys coucha Multimammate Mouse LC (S) LC - 2 2 x
Mastomys sp. Multimammate mice - - - - 1
Thallomys paedulcus Tree Rat LC (U) LC - 2 2
Aethomys namaquensis Namaqua Rock Mouse LC (S) LC - 2 2
Aethomys ineptus Tete Veld Rat LC (U) LC - 4 4
Otomys angoniensis Angoni Vlei Rat LC (S) LC - 4 4
Otomys irroratus Vlei Rat LC (S) LC - 3 3
Gerbillurus paeba Hairy-footed Gerbil LC (S) LC - 3 3
Tatera leucogaster Bushveld Gerbil LC (S) LC - 1 1 x x x 2
Tatera brantsii Highveld Gerbil LC (U) LC - 4 4
Saccostomus campestris Pouched Mouse LC (S) LC - 2 2 x
Dendromus melanotis Grey Climbing Mouse LC (S) LC - 3 3
Dendromus mystacalis Chestnut Climbing Mouse LC (S) LC - 4 4
Steatomys pratensis Fat Mouse LC (S) LC - 3 3
CARNIVORA (Carnivores)
Proteles cristatus Aardwolf LC (S) LC - 1 1 x 2
Crocuta crocuta Spotted Hyaena LC (D) NT PS 4 4
Hyaena brunnea Brown hyaena NT (S) NT PS 1 1 x 3 3 2
Acinonyx jubatus Cheetah VU (D) VU VU 1 1* 4 1
Panthera pardus Leopard VU (D) VU PS 1 1* x 8 8 8 23
Panthera leo Lion VU (D) LC VU 5 5

FGD Biodiversity & Wetland Assessment
Natural Scientific Services CC 202
ORDER1 & SPECIES COMMON NAME
CONSERVATION STATUS
ME
DU
PI
Lo
O4
,5,6
FG
D L
oO
4,5
,6
NS
S
EM
PR
7
VIC
INIT
Y*
ATLAS6
GLOBAL RED LIST
1
S.A. RED LIST
2
S.A. ToPS LIST
3
23
27
CB
23
27
DA
23
27
CD
23
27
DC
Caracal caracal Caracal LC (U) LC - 1 1 4 2
Felis silvestris African Wild Cat LC (D) LC - 1 1* x
Felis nigripes Black-footed Cat VU (D) VU PS 3 3
Leptailurus serval Serval LC (S) NT PS 1 1
Civettictis civetta African Civet LC (U) LC - 1 1 x 1
Genetta genetta Small-spotted Genet LC (S) LC - 2 2 x 1
Genetta tigrina Large-spotted Genet LC (U) LC - 1 1 x 1
Cynictis penicillata Yellow Mongoose LC (S) LC - 4 4
Galerella sanguinea Slender Mongoose LC (S) LC - 1 1 x x
Ichneumia albicauda White-tailed Mongoose LC (S) LC - 2 2
Atilax paludinosus Water Mongoose LC (D) LC - 1 1 1
Mungos mungo Banded Mongoose LC (S) LC - 1 1 x 2
Helogale parvula Dwarf Mongoose LC (S) LC - 2 2
Otocyon megalotis Bat-eared Fox LC (U) LC PS 1 1* x 2
Lycaon pictus African Wild Dog EN (D) EN EN 1 1*
Vulpes chama Cape Fox LC (S) LC PS 2 2
Canis mesomelas Black-backed Jackal LC (S) LC - 1 1 x x 2 1 1
Aonyx capensis Cape Clawless Otter NT (D) NT - 3 3
Mellivora capensis Honey Badger LC (D) LC - 2 2 1
Poecilogale albinucha African Weasel LC (U) NT - 2 2
Ictonyx striatus Striped Polecat LC (S) LC - 2 2
TUBULIDENTATA (Aardvark)
Orycteropus afer Aardvark LC (U) LC PS 1 1 x x
PROBOSCIDEA (Elephant)
Loxodonta africana African Elephant VU (I) LC PS 5 5
HYRACOIDEA (Hyraxes)
Procavia capensis Rock Hyrax LC (U) LC - 3 3 x
Heterohyrax brucei Yellow-spotted Rock Hyrax LC (U) LC - 4 4

FGD Biodiversity & Wetland Assessment
Natural Scientific Services CC 203
ORDER1 & SPECIES COMMON NAME
CONSERVATION STATUS
ME
DU
PI
Lo
O4
,5,6
FG
D L
oO
4,5
,6
NS
S
EM
PR
7
VIC
INIT
Y*
ATLAS6
GLOBAL RED LIST
1
S.A. RED LIST
2
S.A. ToPS LIST
3
23
27
CB
23
27
DA
23
27
CD
23
27
DC
PERISSODACTYLA (Zebras)
Ceratotherium simum White Rhinoceros NT (I) NT PS 1 5 x x
Diceros bicornis Black Rhinoceros CR (I)* EN EN 5 5
Equus quagga Plains Zebra LC (S) LC PS** 1 1 x
SUIFORMES (Pigs & hogs)
Potamochoerus larvatus Bushpig LC (S) LC - 4 4 x
Phacochoerus africanus Warthog LC (S) LC - 1 1 x x x 1
RUMINATA (Even-toed ungulates)
Giraffa camelopardalis Giraffe LC (D) LC - 1 1 x 2 1
Syncerus caffer Cape Buffalo LC (D) LC - 5 5 x
Tragelaphus strepsiceros Kudu LC (S) LC - 1 1 x x x
Tragelaphus angasii Nyala LC (S) LC - 1 1 x
Tragelaphus scriptus Bushbuck LC (S) LC - 1 1* x x 1
Tragelaphus oryx Eland LC (S) LC - 1 1 x x 1
Connochaetes gnou Black Wildebeest LC (I) LC PS** 5 5
Connochaetes taurinus Blue Wildebeest LC (S) LC PS** 1 1 x 1
Alcelaphus buselaphus Red Hartebeest LC (D) LC PS** 1 1 x x 1 1
Damaliscus pygargus phillipsi Blesbok LC (S)* LC PS** 1 1 x x
Damaliscus lunatus Tsessebe LC (D) VU PS** 1 5 x x
Hippotragus equinus Roan LC (D) EN EN 5 5
Hippotragus niger Sable LC (S) VU VU 1 5 x x
Sylvicapra grimmia Common Duiker LC (S) LC - 1 1 x x
Redunca arundinum Reedbuck LC (S) LC - 4 4 1
Redunca fulvorufula Mountain Reedbuck EN (D) EN - 4 4 x
Kobus ellipsiprymnus Waterbuck LC (D) LC - 1 1 x 1
Pelea capreolus Grey Rhebok NT (D) NT - 1 1 x
Antidorcas marsupialis Springbok LC (I) LC - 5 5
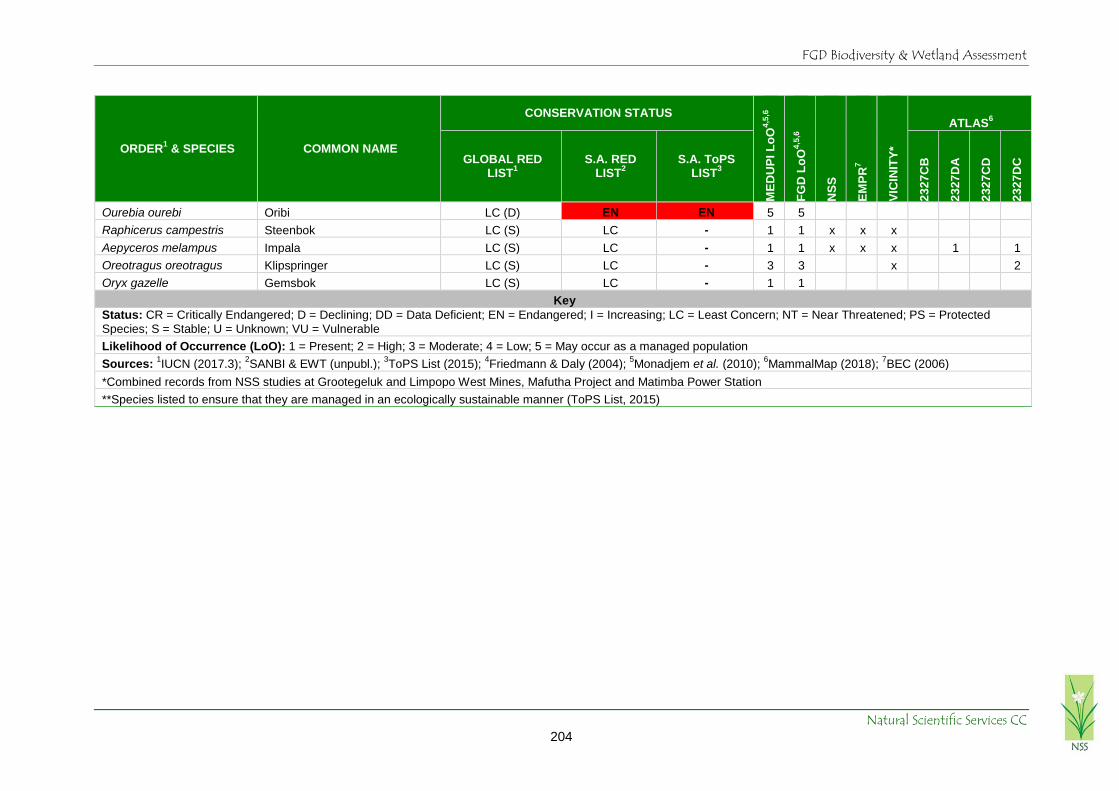
FGD Biodiversity & Wetland Assessment
Natural Scientific Services CC 204
ORDER1 & SPECIES COMMON NAME
CONSERVATION STATUS
ME
DU
PI
Lo
O4
,5,6
FG
D L
oO
4,5
,6
NS
S
EM
PR
7
VIC
INIT
Y*
ATLAS6
GLOBAL RED LIST
1
S.A. RED LIST
2
S.A. ToPS LIST
3
23
27
CB
23
27
DA
23
27
CD
23
27
DC
Ourebia ourebi Oribi LC (D) EN EN 5 5
Raphicerus campestris Steenbok LC (S) LC - 1 1 x x x
Aepyceros melampus Impala LC (S) LC - 1 1 x x x 1 1
Oreotragus oreotragus Klipspringer LC (S) LC - 3 3 x 2
Oryx gazelle Gemsbok LC (S) LC - 1 1
Key
Status: CR = Critically Endangered; D = Declining; DD = Data Deficient; EN = Endangered; I = Increasing; LC = Least Concern; NT = Near Threatened; PS = Protected
Species; S = Stable; U = Unknown; VU = Vulnerable
Likelihood of Occurrence (LoO): 1 = Present; 2 = High; 3 = Moderate; 4 = Low; 5 = May occur as a managed population
Sources: 1IUCN (2017.3);
2SANBI & EWT (unpubl.);
3ToPS List (2015);
4Friedmann & Daly (2004);
5Monadjem et al. (2010);
6MammalMap (2018);
7BEC (2006)
*Combined records from NSS studies at Grootegeluk and Limpopo West Mines, Mafutha Project and Matimba Power Station
**Species listed to ensure that they are managed in an ecologically sustainable manner (ToPS List, 2015)
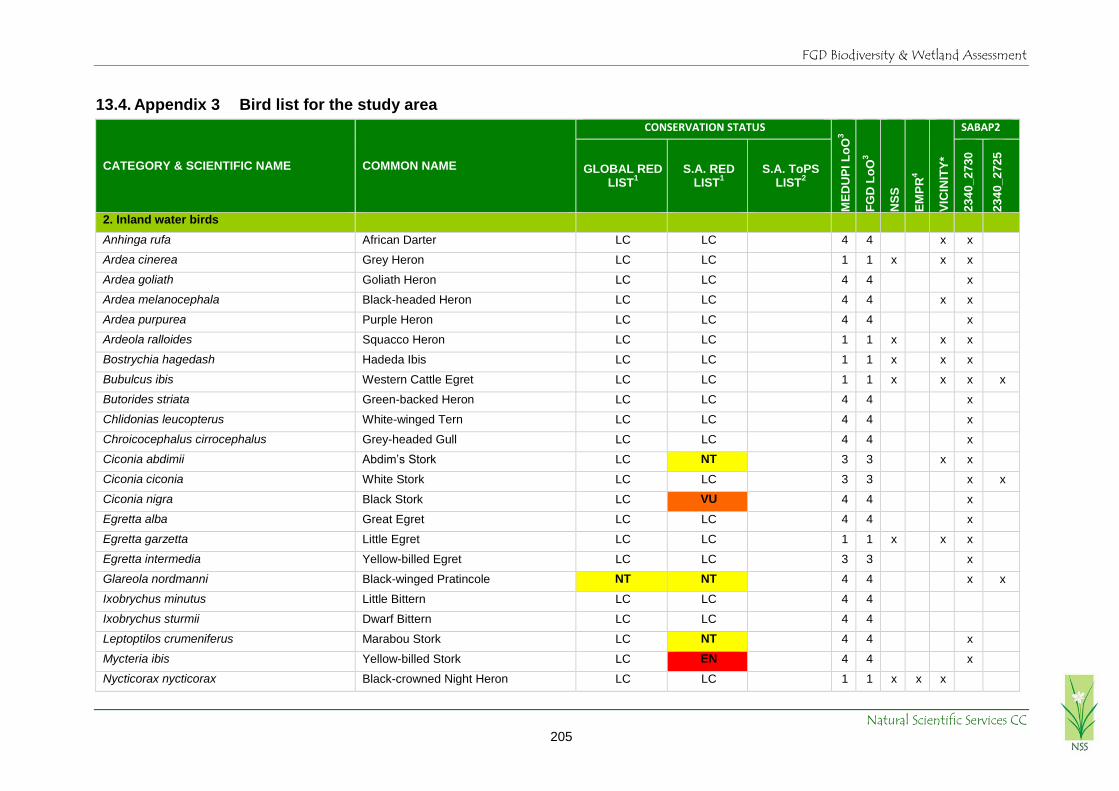
FGD Biodiversity & Wetland Assessment
Natural Scientific Services CC 205
13.4. Appendix 3 Bird list for the study area
CATEGORY & SCIENTIFIC NAME COMMON NAME
CONSERVATION STATUS
ME
DU
PI
Lo
O3
FG
D L
oO
3
NS
S
EM
PR
4
VIC
INIT
Y*
SABAP2
GLOBAL RED LIST
1 S.A. RED
LIST1
S.A. ToPS LIST
2
23
40
_2
730
23
40
_2
725
2. Inland water birds
Anhinga rufa African Darter LC LC 4 4 x x
Ardea cinerea Grey Heron LC LC 1 1 x x x
Ardea goliath Goliath Heron LC LC 4 4 x
Ardea melanocephala Black-headed Heron LC LC 4 4 x x
Ardea purpurea Purple Heron LC LC 4 4 x
Ardeola ralloides Squacco Heron LC LC 1 1 x x x
Bostrychia hagedash Hadeda Ibis LC LC 1 1 x x x
Bubulcus ibis Western Cattle Egret LC LC 1 1 x x x x
Butorides striata Green-backed Heron LC LC 4 4 x
Chlidonias leucopterus White-winged Tern LC LC 4 4 x
Chroicocephalus cirrocephalus Grey-headed Gull LC LC 4 4 x
Ciconia abdimii Abdim’s Stork LC NT 3 3 x x
Ciconia ciconia White Stork LC LC 3 3 x x
Ciconia nigra Black Stork LC VU 4 4 x
Egretta alba Great Egret LC LC 4 4 x
Egretta garzetta Little Egret LC LC 1 1 x x x
Egretta intermedia Yellow-billed Egret LC LC 3 3 x
Glareola nordmanni Black-winged Pratincole NT NT 4 4 x x
Ixobrychus minutus Little Bittern LC LC 4 4
Ixobrychus sturmii Dwarf Bittern LC LC 4 4
Leptoptilos crumeniferus Marabou Stork LC NT 4 4 x
Mycteria ibis Yellow-billed Stork LC EN 4 4 x
Nycticorax nycticorax Black-crowned Night Heron LC LC 1 1 x x x

FGD Biodiversity & Wetland Assessment
Natural Scientific Services CC 206
CATEGORY & SCIENTIFIC NAME COMMON NAME
CONSERVATION STATUS
ME
DU
PI
Lo
O3
FG
D L
oO
3
NS
S
EM
PR
4
VIC
INIT
Y*
SABAP2
GLOBAL RED LIST
1 S.A. RED
LIST1
S.A. ToPS LIST
2
23
40
_2
730
23
40
_2
725
Phalacrocorax africanus Reed Cormorant LC LC 1 1 x x x
Phalacrocorax lucidus White-breasted Cormorant LC LC 4 4 x x
Phoeniconaias minor Lesser Flamingo NT NT 4 4 x
Phoenicopterus roseus Greater Flamingo LC NT 4 4 x
Platalea alba African Spoonbill LC LC 1 1 x x x
Plegadis falcinellus Glossy Ibis LC LC 3 3 x
Scopus umbretta Hamerkop LC LC 1 1 x x x
Threskiornis aethiopicus African Sacred Ibis LC LC 2 2 x
3. Ducks & wading birds
Actitis hypoleucos Common Sandpiper LC LC 1 1 x x x
Actophilornis africanus African Jacana LC LC 4 4 x
Alopochen aegyptiaca Egyptian Goose LC LC 1 1 x x x x x
Amaurornis flavirostra Black Crake LC LC 4 4 x x
Anas capensis Cape Teal LC LC 4 4 x x
Anas erythrorhyncha Red-billed Teal LC LC 1 1 x x x
Anas hottentota Hottentot Teal LC LC 4 4 x
Anas smithii Cape Shoveler LC LC 4 4 x
Anas sparsa African Black Duck LC LC 4 4 x
Anas undulata Yellow-billed Duck LC LC 1 1 x x x
Calidris ferruginea Curlew Sandpiper NT LC 4 4
Calidris minuta Little Stint LC LC 4 4 x
Charadrius pecuarius Kittlitz’s Plover LC LC 1 1 x x
Charadrius tricollaris Three-banded Plover LC LC 1 1 x x x
Crecopsis egregia African Crake LC LC 4 4
Dendrocygna bicolor Fulvous Whistling Duck LC LC 4 4 x

FGD Biodiversity & Wetland Assessment
Natural Scientific Services CC 207
CATEGORY & SCIENTIFIC NAME COMMON NAME
CONSERVATION STATUS
ME
DU
PI
Lo
O3
FG
D L
oO
3
NS
S
EM
PR
4
VIC
INIT
Y*
SABAP2
GLOBAL RED LIST
1 S.A. RED
LIST1
S.A. ToPS LIST
2
23
40
_2
730
23
40
_2
725
Dendrocygna viduata White-faced Whistling Duck LC LC 1 1 x x x x
Fulica cristata Red-knobbed coot LC LC 1 1 x x x
Gallinago nigripennis African Snipe LC LC 4 4 x x
Gallinula chloropus Common Moorhen LC LC 1 1 x x x
Himantopus himantopus Black-winged Stilt LC LC 1 1 x x x
Netta erythrophthalma Southern Pochard LC LC 4 4 x x
Nettapus auritus African Pygmy Goose LC VU 4 4
Oxyura maccoa Maccoa Duck NT NT 4 4 x
Philomachus pugnax Ruff LC LC 1 1 x x x
Plectropterus gambensis Spur-winged Goose LC LC 1 1 x x x
Rallus caerulescens African Rail LC LC 4 4
Recurvirostra avosetta Pied Avocet LC LC 1 1 x x
Rostratula benghalensis Greater Painted-snipe LC NT 4 4 x
Sarkidiornis melanotos Knob-billed Duck LC LC 1 1 x x x x x
Tachybaptus ruficollis Little Grebe LC LC 1 1 x x x
Thalassornis leuconotus White-backed Duck LC LC 4 4 x
Tringa glareola Wood Sandpiper LC LC 1 1 x x x x
Tringa nebularia Common Greenshank LC LC 1 1 x x x
Tringa stagnatilis Marsh Sandpiper LC LC 4 4 x x
Tringa totanus Common Redshank 4 4
Vanellus armatus Blacksmith Lapwing LC LC 1 1 x x x x x
Vanellus coronatus Crowned Lapwing LC LC 1 1 x x x x x
Vanellus senegallus African Wattled Lapwing LC LC 1 1 x x
4. Large terrestrial birds
Afrotis afraoides Northern Black Korhaan LC LC 3 3

FGD Biodiversity & Wetland Assessment
Natural Scientific Services CC 208
CATEGORY & SCIENTIFIC NAME COMMON NAME
CONSERVATION STATUS
ME
DU
PI
Lo
O3
FG
D L
oO
3
NS
S
EM
PR
4
VIC
INIT
Y*
SABAP2
GLOBAL RED LIST
1 S.A. RED
LIST1
S.A. ToPS LIST
2
23
40
_2
730
23
40
_2
725
Ardeotis kori Kori Bustard NT NT PS 4 4 x x x
Burhinus capensis Spotted Thick-knee LC LC 2 2 x x x
Burhinus vermiculatus Water Thick-knee LC LC 4 4 x x
Coturnix coturnix Common Quail LC LC 1 1 x x x
Coturnix delegorguei Harlequin Quail LC LC 3 3 x
Cursorius temminckii Temminck's Courser LC LC 3 3 x x
Dendroperdix sephaena Crested Francolin LC LC 1 1 x x x x
Lophotis ruficrista Red-crested Korhaan LC LC 1 1 x x x x
Numida meleagris Helmeted Guineafowl LC LC 1 1 x x x x
Peliperdix coqui Coqui Francolin LC LC 2 2 x x
Pternistis natalensis Natal Spurfowl LC LC 1 1 x x x
Pternistis swainsonii Swainson’s Spurfowl LC LC 1 1 x x x x
Rhinoptilus chalcopterus Bronze-winged Courser LC LC 3 3 x x x
Sagittarius serpentarius Secretarybird VU VU 3 3 x x
Struthio camelus Common Ostrich LC LC 1 1 x x x x
Turnix sylvaticus Common (Kurrichane) Buttonquail LC LC 3 3 x
5. Raptors
Accipiter badius Shikra LC LC 1 1 x x
Accipiter melanoleucus Black Sparrowhawk LC LC 4 4
Accipiter minullus Little Sparrowhawk LC LC 2 2 x x x
Accipiter ovampensis Ovambo Sparrowhawk LC LC 2 2 x
Aquila nipalensis Steppe Eagle EN LC 3 3 x
Aquila rapax Tawny Eagle LC EN EN 1 1 x x x x
Aquila spilogaster African Hawk Eagle LC LC 1 1 x x
Aquila verreauxii Verreauxs' Eagle LC VU 2 2 x

FGD Biodiversity & Wetland Assessment
Natural Scientific Services CC 209
CATEGORY & SCIENTIFIC NAME COMMON NAME
CONSERVATION STATUS
ME
DU
PI
Lo
O3
FG
D L
oO
3
NS
S
EM
PR
4
VIC
INIT
Y*
SABAP2
GLOBAL RED LIST
1 S.A. RED
LIST1
S.A. ToPS LIST
2
23
40
_2
730
23
40
_2
725
Buteo buteo Common (Steppe) Buzzard LC LC 1 1 x x x
Buteo rufofuscus Jackal Buzzard LC LC 1 2 x x
Circaetus cinereus Brown Snake Eagle LC LC 1 1 x x x x
Circaetus pectoralis Black-chested Snake Eagle LC LC 1 1 x x x x
Circus pygargus Montagu's Harrier LC LC 4 4 x
Clanga pomarina Lesser Spotted Eagle LC LC 4 4
Elanus caeruleus Black-shouldered Kite LC LC 1 1 x x x x
Falco amurensis Amur Falcon LC LC 2 2 x x
Falco biarmicus Lanner Falcon LC VU 3 3
Falco rupicolus Rock Kestrel LC LC 4 4 x x
Gyps africanus White-backed Vulture CR CR EN 1 1 x x x x
Gyps coprotheres Cape Vulture EN EN EN 1 1 x x x
Haliaeetus vocifer African Fish Eagle LC LC 3 3 x x
Hieraaetus pennatus Booted Eagle LC LC 2 2 x
Hieraaetus wahlbergi Wahlberg’s Eagle LC LC 1 1 x x x x
Kaupifalco monogrammicus Lizard Buzzard LC LC 2 2 x x
Melierax canorus Pale Chanting Goshawk LC LC 1 1 x x x x
Melierax gabar Gabar Goshawk LC LC 1 1 x x x x
Milvus aegyptius Yellow-billed Kite LC LC 2 2 x
Milvus migrans Black Kite LC LC 2 2 x x
Pandion haliaetus Western Osprey LC LC 4 4
Polemaetus bellicosus Martial Eagle VU EN EN 2 2 x
Polyboroides typus African Harrier-Hawk LC LC 1 1 x x x
Terathopius ecaudatus Bateleur NT EN EN 4 4 x x
Torgos tracheliotos Lappet-faced Vulture EN EN EN 2 2 x x

FGD Biodiversity & Wetland Assessment
Natural Scientific Services CC 210
CATEGORY & SCIENTIFIC NAME COMMON NAME
CONSERVATION STATUS
ME
DU
PI
Lo
O3
FG
D L
oO
3
NS
S
EM
PR
4
VIC
INIT
Y*
SABAP2
GLOBAL RED LIST
1 S.A. RED
LIST1
S.A. ToPS LIST
2
23
40
_2
730
23
40
_2
725
6. Owls & nightjars
Bubo africanus Spotted Eagle-Owl LC LC 1 1 x x x x
Bubo lacteus Verreaux’s Eagle-Owl LC LC 1 1 x
Caprimulgus pectoralis Fiery-necked Nightjar LC LC 2 2 x x
Caprimulgus rufigena Rufous-cheeked Nightjar LC LC 1 1 x x x
Caprimulgus tristigma Freckled Nightjar LC LC 1 1 x x x
Glaucidium perlatum Pearl-spotted Owlet LC LC 1 1 x x x x x
Otus senegalensis African Scops Owl LC LC 1 1 x x
Ptilopsis granti Southern White-faced Owl LC LC 1 1 x x
Tyto alba Western Barn Owl LC LC 2 2 x x
7. Sandgrouse, doves etc
Centropus burchellii Burchell’s Coucal LC LC 1 1 x x x
Chrysococcyx caprius Diederik Cuckoo LC LC 1 1 x x x x x
Chrysococcyx klaas Klaas's Cuckoo LC LC 1 1 x x x x x
Clamator glandarius Great Spotted Cuckoo LC LC 2 2 x x
Clamator jacobinus Jacobin Cuckoo LC LC 1 1 x x x x x
Clamator levaillantii Levaillant's Cuckoo LC LC 2 2 x x x
Columba guinea Speckled Pigeon LC LC 1 1 x x x x
Columba livia Rock Dove LC LC 2 2 x
Corythaixoides concolor Grey Go-away-bird LC LC 1 1 x x x x x
Cuculus clamosus Black Cuckoo LC LC 1 1 x x x x x
Cuculus gularis African Cuckoo LC LC 2 2 x x
Cuculus solitarius Red-chested Cuckoo LC LC 1 1 x x x
Oena capensis Namaqua Dove LC LC 1 1 x x x x x
Poicephalus meyeri Meyer’s Parrot LC LC 2 2 x

FGD Biodiversity & Wetland Assessment
Natural Scientific Services CC 211
CATEGORY & SCIENTIFIC NAME COMMON NAME
CONSERVATION STATUS
ME
DU
PI
Lo
O3
FG
D L
oO
3
NS
S
EM
PR
4
VIC
INIT
Y*
SABAP2
GLOBAL RED LIST
1 S.A. RED
LIST1
S.A. ToPS LIST
2
23
40
_2
730
23
40
_2
725
Pterocles bicinctus Double-banded Sandgrouse LC LC 2 2 x x
Pterocles burchelli Burchell’s Sandgrouse LC LC 3 3 x x x
Streptopelia capicola Cape Turtle Dove LC LC 1 1 x x x x x
Streptopelia semitorquata Red-eyed Dove LC LC 1 1 x x x x x
Streptopelia senegalensis Laughing Dove LC LC 1 1 x x x x x
Treron calvus African Green Pigeon LC LC 3 3 x
Turtur chalcospilos Emerald-spotted Wood Dove LC LC 1 1 x x x x x
8. Aerial feeders, etc
Alcedo cristata Malachite Kingfisher LC LC 4 4 x
Apus affinis Little Swift LC LC 1 1 x x x x x
Apus apus Common Swift LC LC 1 1 x x x x x
Apus barbatus African Black Swift LC LC 2 2 x x
Apus caffer White-rumped Swift LC LC 1 1 x x x
Apus horus Horus Swift LC LC 3 3
Campethera abingoni Golden-tailed Woodpecker LC LC 1 1 x x x x x
Campethera bennettii Bennett’s Woodpecker LC LC 2 2 x
Cecropis abyssinica Lesser Striped Swallow LC LC 1 1 x x x x
Cecropis cucullata Greater Striped Swallow LC LC 1 2 x x x
Cecropis semirufa Red-breasted Swallow LC LC 1 1 x x x x x
Ceryle rudis Pied Kingfisher LC LC 1 1 x x x
Colius colius White-backed Mousebird LC LC 1 1 x x
Colius striatus Speckled Mousebird LC LC 2 2 x x x
Coracias caudatus Lilac-breasted Roller LC LC 1 1 x x x x
Coracias garrulus European Roller LC NT 2 2 x x x
Coracias naevius Purple Roller LC LC 1 1 x x x x

FGD Biodiversity & Wetland Assessment
Natural Scientific Services CC 212
CATEGORY & SCIENTIFIC NAME COMMON NAME
CONSERVATION STATUS
ME
DU
PI
Lo
O3
FG
D L
oO
3
NS
S
EM
PR
4
VIC
INIT
Y*
SABAP2
GLOBAL RED LIST
1 S.A. RED
LIST1
S.A. ToPS LIST
2
23
40
_2
730
23
40
_2
725
Cypsiurus parvus African Palm Swift LC LC 3 3 x
Delichon urbicum Common House Martin LC LC 2 2 x x
Dendropicos fuscescens Cardinal Woodpecker LC LC 1 1 x x x x
Dendropicos namaquus Bearded Woodpecker LC LC 1 1 x x x x x
Halcyon albiventris Brown-hooded Kingfisher LC LC 1 1 x x x x x
Halcyon chelicuti Striped Kingfisher LC LC 3 3
Halcyon leucocephala Grey-headed Kingfisher LC LC 3 3
Halcyon senegalensis Woodland Kingfisher LC LC 1 1 x x x
Hirundo albigularis White-throated Swallow LC LC 2 2 x x
Hirundo dimidiata Pearl-breasted Swallow LC LC 1 1 x x x
Hirundo fuligula Rock Martin LC LC 3 3 x x
Hirundo rustica Barn Swallow LC LC 1 1 x x x x x
Indicator indicator Greater Honeyguide LC LC 1 1 x x x x
Indicator minor Lesser Honeyguide LC LC 1 1 x x
Ispidina picta African Pygmy Kingfisher LC LC 4 4 x
Lybius torquatus Black-collared Barbet LC LC 2 2 x x
Megaceryle maxima Giant Kingfisher LC LC 3 3 x
Merops apiaster European Bee-eater LC LC 1 1 x x x x
Merops bullockoides White-fronted Bee-eater LC LC 2 2 x x x
Merops hirundineus Swallow-tailed Bee-eater LC LC 1 1 x x x x
Merops nubicoides Southern Carmine Bee-eater LC LC 2 2 x x x
Merops persicus Blue-cheeked Bee-eater LC LC 1 2 x x
Merops pusillus Little Bee-eater LC LC 1 1 x x x x x
Phoeniculus purpureus Green Wood-hoopoe LC LC 1 1 x x x x x
Pogoniulus chrysoconus Yellow-fronted Tinkerbird LC LC 1 1 x x

FGD Biodiversity & Wetland Assessment
Natural Scientific Services CC 213
CATEGORY & SCIENTIFIC NAME COMMON NAME
CONSERVATION STATUS
ME
DU
PI
Lo
O3
FG
D L
oO
3
NS
S
EM
PR
4
VIC
INIT
Y*
SABAP2
GLOBAL RED LIST
1 S.A. RED
LIST1
S.A. ToPS LIST
2
23
40
_2
730
23
40
_2
725
Prodotiscus regulus Brown-backed Honeybird LC LC 4 4 x
Rhinopomastus cyanomelas Common Scimitarbill LC LC 1 2 x x x x
Riparia cincta Banded Martin LC LC 4 4
Riparia paludicola Brown-throated Martin LC LC 1 1 x x
Riparia riparia Sand Martin LC LC 4 4 x
Tachymarptis melba Alpine Swift LC LC 2 2 x
Tockus leucomelas Southern Yellow-billed Hornbill LC LC 1 1 x x x x x
Tockus nasutus African Grey Hornbill LC LC 1 1 x x x x x
Tockus rufirostris Southern Red-billed Hornbill LC LC 1 1 x x x x x
Trachyphonus vaillantii Crested Barbet LC LC 1 1 x x x x x
Tricholaema leucomelas Acacia Pied Barbet LC LC 2 2 x x x
Upupa africana African Hoopoe LC LC 1 2 x x x x
Urocolius indicus Red-faced Mousebird LC LC 1 1 x x x x x
9. Cryptic & elusive insect-eaters
Acrocephalus arundinaceus Great Reed Warbler LC LC 3 3
Acrocephalus baeticatus African Reed Warbler LC LC 4 4 x
Acrocephalus gracilirostris Lesser Swamp Warbler LC LC 4 4 x
Acrocephalus palustris Marsh Warbler LC LC 4 4
Anthus caffer Bushveld Pipit LC LC 2 2 x
Anthus cinnamomeus African Pipit LC LC 2 2 x x x
Anthus leucophrys Plain-backed Pipit LC LC 2 2 x
Anthus lineiventris Striped Pipit LC LC 3 3
Anthus similis Long-billed Pipit LC LC 3 3 x
Anthus vaalensis Buffy Pipit LC LC 2 2
Apalis thoracica Bar-throated Apalis LC LC 2 2 x
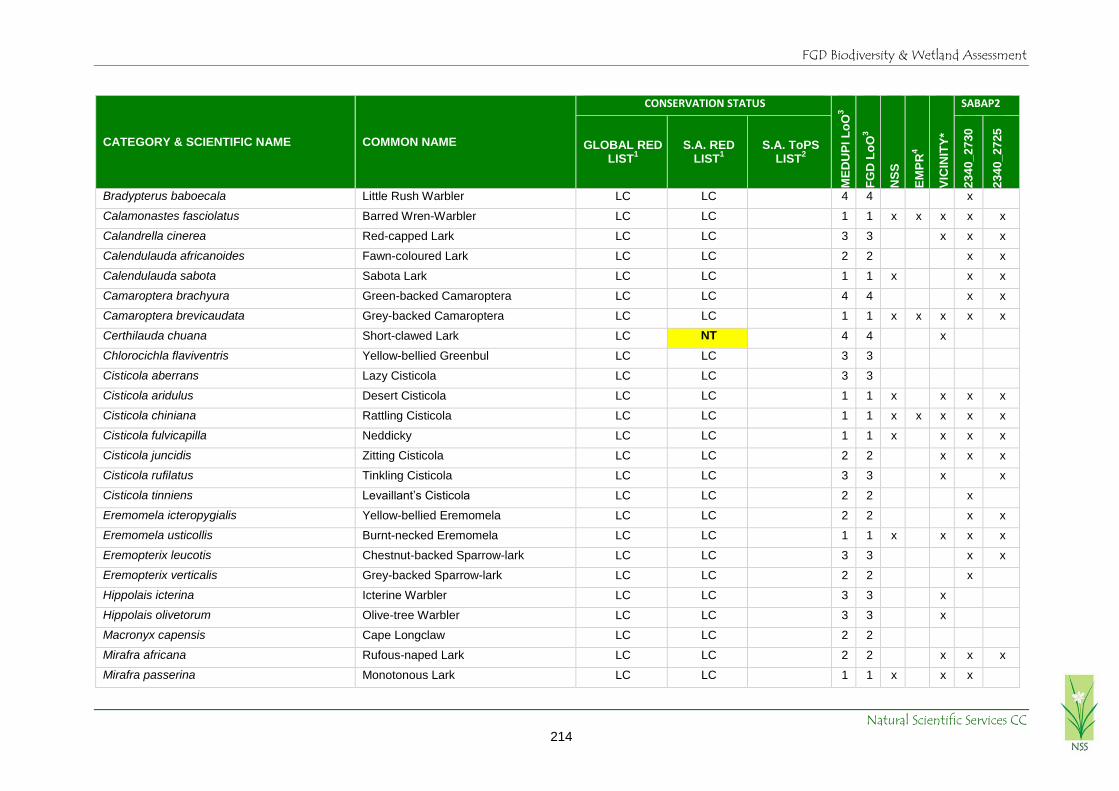
FGD Biodiversity & Wetland Assessment
Natural Scientific Services CC 214
CATEGORY & SCIENTIFIC NAME COMMON NAME
CONSERVATION STATUS
ME
DU
PI
Lo
O3
FG
D L
oO
3
NS
S
EM
PR
4
VIC
INIT
Y*
SABAP2
GLOBAL RED LIST
1 S.A. RED
LIST1
S.A. ToPS LIST
2
23
40
_2
730
23
40
_2
725
Bradypterus baboecala Little Rush Warbler LC LC 4 4 x
Calamonastes fasciolatus Barred Wren-Warbler LC LC 1 1 x x x x x
Calandrella cinerea Red-capped Lark LC LC 3 3 x x x
Calendulauda africanoides Fawn-coloured Lark LC LC 2 2 x x
Calendulauda sabota Sabota Lark LC LC 1 1 x x x
Camaroptera brachyura Green-backed Camaroptera LC LC 4 4 x x
Camaroptera brevicaudata Grey-backed Camaroptera LC LC 1 1 x x x x x
Certhilauda chuana Short-clawed Lark LC NT 4 4 x
Chlorocichla flaviventris Yellow-bellied Greenbul LC LC 3 3
Cisticola aberrans Lazy Cisticola LC LC 3 3
Cisticola aridulus Desert Cisticola LC LC 1 1 x x x x
Cisticola chiniana Rattling Cisticola LC LC 1 1 x x x x x
Cisticola fulvicapilla Neddicky LC LC 1 1 x x x x
Cisticola juncidis Zitting Cisticola LC LC 2 2 x x x
Cisticola rufilatus Tinkling Cisticola LC LC 3 3 x x
Cisticola tinniens Levaillant’s Cisticola LC LC 2 2 x
Eremomela icteropygialis Yellow-bellied Eremomela LC LC 2 2 x x
Eremomela usticollis Burnt-necked Eremomela LC LC 1 1 x x x x
Eremopterix leucotis Chestnut-backed Sparrow-lark LC LC 3 3 x x
Eremopterix verticalis Grey-backed Sparrow-lark LC LC 2 2 x
Hippolais icterina Icterine Warbler LC LC 3 3 x
Hippolais olivetorum Olive-tree Warbler LC LC 3 3 x
Macronyx capensis Cape Longclaw LC LC 2 2
Mirafra africana Rufous-naped Lark LC LC 2 2 x x x
Mirafra passerina Monotonous Lark LC LC 1 1 x x x

FGD Biodiversity & Wetland Assessment
Natural Scientific Services CC 215
CATEGORY & SCIENTIFIC NAME COMMON NAME
CONSERVATION STATUS
ME
DU
PI
Lo
O3
FG
D L
oO
3
NS
S
EM
PR
4
VIC
INIT
Y*
SABAP2
GLOBAL RED LIST
1 S.A. RED
LIST1
S.A. ToPS LIST
2
23
40
_2
730
23
40
_2
725
Mirafra rufocinnamomea Flappet Lark LC LC 3 3 x
Motacilla aguimp African Pied Wagtail LC LC 4 4 x x
Motacilla capensis Cape Wagtail LC LC 1 1 x x x
Phylloscopus trochilus Willow Warbler LC LC 1 2 x x x x
Pinarocorys nigricans Dusky Lark LC LC 4 4 x x
Prinia flavicans Black-chested Prinia LC LC 2 2 x x x
Prinia subflava Tawny-flanked Prinia LC LC 1 1 x x x x
Pycnonotus nigricans African Red-eyed Bulbul LC LC 2 2 x x x
Pycnonotus tricolor Dark-capped Bulbul LC LC 1 1 x x x x
Sylvietta rufescens Long-billed crombec LC LC 1 1 x x x x x
10. Regular insect-eaters
Acridotheres tristis Common Myna 1 1 x x
Anthoscopus caroli Grey Penduline-Tit LC LC 2 2
Anthoscopus minutus Cape Penduline-Tit LC LC 1 1 x x x
Batis molitor Chinspot Batis LC LC 1 1 x x x x x
Bradornis mariquensis Marico flycatcher LC LC 1 1 x x x x
Bradornis pallidus Pale flycatcher LC LC 3 3 x
Campephaga flava Black Cuckooshrike LC LC 1 1 x
Cercomela familiaris Familiar Chat LC LC 1 1 x x x
Chlorophoneus sulfureopectus Orange-breasted Bush-Shrike LC LC 1 1 x x
Cinnyricinclus leucogaster Violet-backed Starling LC LC 2 2 x x x
Corvinella melanoleuca Magpie Shrike LC LC 1 1 x x x x x
Corvus albus Pied Crow LC LC 1 1 x x x
Cossypha caffra Cape Robin-Chat LC LC 1 1 x x
Cossypha humeralis White-throated Robin-Chat LC LC 2 2 x x

FGD Biodiversity & Wetland Assessment
Natural Scientific Services CC 216
CATEGORY & SCIENTIFIC NAME COMMON NAME
CONSERVATION STATUS
ME
DU
PI
Lo
O3
FG
D L
oO
3
NS
S
EM
PR
4
VIC
INIT
Y*
SABAP2
GLOBAL RED LIST
1 S.A. RED
LIST1
S.A. ToPS LIST
2
23
40
_2
730
23
40
_2
725
Creatophora cinerea Wattled Starling LC LC 1 1 x x x x
Dicrurus adsimilis Fork-tailed Drongo LC LC 1 1 x x x x x
Dryoscopus cubla Black-backed Puffback LC LC 1 1 x x x x
Erythropygia leucophrys White-browed Scrub Robin LC LC 1 1 x x x
Erythropygia paena Kalahari Scrub Robin LC LC 1 1 x x x
Eurocephalus anguitimens Southern White-crowned Shrike LC LC 1 1 x x x x
Lamprotornis australis Burchell’s Starling LC LC 1 1 x x x x
Lamprotornis chalybaeus Greater Blue-eared Starling LC LC 2 2 x x x
Lamprotornis nitens Cape Glossy Starling LC LC 1 1 x x x x
Laniarius atrococcineus Crimson-breasted Shrike LC LC 1 1 x x x x x
Laniarius ferrugineus Southern Boubou LC LC 2 2
Lanius collaris Southern (Common) Fiscal LC LC 2 2 x x x
Lanius collurio Red-backed Shrike LC LC 1 1 x x x x x
Lanius minor Lesser Grey Shrike LC LC 1 1 x x x x
Malaconotus blanchoti Grey-headed Bush-Shrike LC LC 1 1 x x x x
Melaenornis pammelaina Southern Black flycatcher LC LC 2 2 x
Muscicapa caerulescens Ashy Flycatcher LC LC 4 4
Muscicapa striata Spotted flycatcher LC LC 1 1 x x x x
Myioparus plumbeus Grey Tit-flycatcher LC LC 2 2 x
Myrmecocichla formicivora Ant-eating Chat LC LC 2 2 x x x
Nilaus afer Brubru LC LC 1 1 x x x x x
Oenanthe pileata Capped Wheatear LC LC 2 2 x x x
Onychognathus morio Red-winged Starling LC LC 1 1 x x x
Oriolus larvatus Black-headed Oriole LC LC 1 1 x x x x x
Oriolus oriolus Eurasian Golden Oriole LC LC 3 3 x x

FGD Biodiversity & Wetland Assessment
Natural Scientific Services CC 217
CATEGORY & SCIENTIFIC NAME COMMON NAME
CONSERVATION STATUS
ME
DU
PI
Lo
O3
FG
D L
oO
3
NS
S
EM
PR
4
VIC
INIT
Y*
SABAP2
GLOBAL RED LIST
1 S.A. RED
LIST1
S.A. ToPS LIST
2
23
40
_2
730
23
40
_2
725
Parus cinerascens Ashy Tit LC LC 1 1 x x x
Parus niger Southern Black Tit LC LC 1 1 x x x x x
Prionops plumatus White-crested Helmet-Shrike LC LC 1 1 x x x
Saxicola torquatus African StoneChat LC LC 2 2 x
Sigelus silens Fiscal Flycatcher LC LC 1 1 x x
Sylvia communis Common Whitethroat LC LC 4 4
Sylvia subcaerulea Chestnut-vented Tit-Babbler LC LC 2 2 x x x
Tchagra australis Brown-crowned Tchagra LC LC 1 1 x x x x
Tchagra senegalus Black-crowned Tchagra LC LC 1 1 x x x x x
Terpsiphone viridis African Paradise Flycatcher LC LC 1 1 x x x x
Thamnolaea cinnamomeiventris Mocking Cliff Chat LC LC 3 3 x x
Turdoides bicolor Southern Pied Babbler LC LC 1 1 x x x x x
Turdoides jardineii Arrow-marked Babbler LC LC 1 1 x x x x
Turdus libonyanus Kurrichane Thrush LC LC 1 1 x x x
Turdus litsitsirupa Groundscraper Thrush LC LC 1 1 x x x x
Turdus smithi Karoo Thrush LC LC 2 2
11. Oxpeckers & nectar feeders
Buphagus erythrorynchus Red-billed Oxpecker LC LC 1 1 x x x
Chalcomitra amethystina Amethyst Sunbird LC LC 1 1 x x
Cinnyris mariquensis Marico Sunbird LC LC 1 1 x x x
Cinnyris talatala White-bellied Sunbird LC LC 1 1 x x x x
Zosterops pallidus Orange River White-eye LC LC 3 3 x
Zosterops virens Cape White-eye LC LC 1 1 x x x
12. Seedeaters
Amadina erythrocephala Red-headed Finch LC LC 2 2 x x

FGD Biodiversity & Wetland Assessment
Natural Scientific Services CC 218
CATEGORY & SCIENTIFIC NAME COMMON NAME
CONSERVATION STATUS
ME
DU
PI
Lo
O3
FG
D L
oO
3
NS
S
EM
PR
4
VIC
INIT
Y*
SABAP2
GLOBAL RED LIST
1 S.A. RED
LIST1
S.A. ToPS LIST
2
23
40
_2
730
23
40
_2
725
Amadina fasciata Cut-throat Finch LC LC 2 2 x x x
Amandava subflava Orange-breasted Waxbill LC LC 2 2 x
Anaplectes rubriceps Red-headed Weaver LC LC 1 1 x
Anomalospiza imberbis Cuckoo Finch LC LC 3 3 x
Bubalornis niger Red-billed Buffalo Weaver LC LC 1 1 x x x x x
Crithagra atrogularis Black-throated Canary LC LC 2 2 x x x
Crithagra flaviventris Yellow Canary LC LC 2 2 x x x
Crithagra mozambica Yellow-fronted Canary LC LC 2 2 x x
Emberiza capensis Cape Bunting LC LC 4 4
Emberiza flaviventris Golden-breasted Bunting LC LC 1 1 x x x x
Emberiza impetuani Lark-like Bunting LC LC 3 3 x
Emberiza tahapisi Cinnamon-breasted Bunting LC LC 3 3 x x x
Estrilda astrild Common Waxbill LC LC 1 1 x x
Estrilda erythronotos Black-faced Waxbill LC LC 1 1 x x x x
Euplectes afer Yellow-crowned Bishop LC LC 1 1 x x x
Euplectes albonotatus White-winged Widowbird LC LC 2 2 x x
Euplectes ardens Red-collared Widowbird LC LC 3 3 x
Euplectes orix Southern Red Bishop LC LC 2 2 x x
Gymnoris superciliaris Yellow-throated Petronia LC LC 3 3 x x x
Lagonosticta rhodopareia Jameson's Firefinch LC LC 1 1 x x x x
Lagonosticta senegala Red-billed Firefinch LC LC 1 1 x x x x
Lonchura cucullata Bronze Mannikin LC LC 2 2 x
Ortygospiza fuscocrissa African Quail-finch LC LC 1 1 x x x
Passer diffusus Southern Grey-headed Sparrow LC LC 1 1 x x x x
Passer domesticus House Sparrow 2 2 x x x

FGD Biodiversity & Wetland Assessment
Natural Scientific Services CC 219
CATEGORY & SCIENTIFIC NAME COMMON NAME
CONSERVATION STATUS
ME
DU
PI
Lo
O3
FG
D L
oO
3
NS
S
EM
PR
4
VIC
INIT
Y*
SABAP2
GLOBAL RED LIST
1 S.A. RED
LIST1
S.A. ToPS LIST
2
23
40
_2
730
23
40
_2
725
Passer melanurus Cape Sparrow LC LC 1 2 x x x
Passer motitensis Great Sparrow LC LC 2 2 x x
Plocepasser mahali White-browed Sparrow-Weaver LC LC 1 1 x x x x
Ploceus capensis Cape Weaver LC LC 3 3
Ploceus cucullatus Village Weaver LC LC 1 1 x x x x
Ploceus intermedius Lesser Masked Weaver LC LC 2 2 x
Ploceus ocularis Spectacled Weaver LC LC 4 4
Ploceus velatus Southern Masked Weaver LC LC 1 1 x x x x x
Pytilia melba Green-winged Pytilia LC LC 1 1 x x x x
Quelea quelea Red-billed Quelea LC LC 1 1 x x x x
Sporopipes squamifrons Scaly-feathered Finch LC LC 2 2 x x x
Uraeginthus angolensis Blue Waxbill LC LC 1 1 x x x x x
Uraeginthus granatinus Violet-eared Waxbill LC LC 1 1 x x x x
Vidua chalybeata Village Indigobird LC LC 1 1 x x x x
Vidua funerea Dusky Indigobird LC LC 3 3
Vidua macroura Pin-tailed Whydah LC LC 2 2 x x
Vidua paradisaea Long-tailed Paradise Whydah LC LC 1 1 x x x x
Vidua purpurascens Purple Indigobird LC LC 4 4
Vidua regia Shaft-tailed Whydah LC LC 1 1 x x x x x
Key
Status: CR = Critically Endangered; EN = Endangered; LC = Least Concern; NT = Near Threatened; PS = Protected Species; VU = Vulnerable
Likelihood of Occurrence (LoO): 1 = Present; 2 = High; 3 = Moderate; 4 = Low
Sources: 1Taylor et al. (2015);
2ToPS List (2015);
3SABAP2 (2018);
4BEC (2006)
*Combined records from NSS studies at Grootegeluk and Limpopo West Mines, Mafutha Project and Matimba Power Station

FGD Biodiversity & Wetland Assessment
Natural Scientific Services CC 220
13.5. Appendix 4 Reptile list for the study area
FAMILY & SPECIES COMMON NAME
CONSERVATION STATUS
ME
DU
PI
Lo
O1
,3
FG
D L
oO
1,3
NS
S
EM
PR
5
VIC
INIT
Y* ATLAS
3
RED LIST
1
S.A. ToPS LIST
2
23
27
CB
23
27
DA
23
27
CD
23
27
DC
PELOMEDUSIDAE (Terrapins)
Pelomedusa subrufa Marsh Terrapin 2LC - 1 1
x x
1 Pelusios sinuatus Serrated Hinged Terrapin 2LC - 2 2
TESTUDINIDAE (Tortoises)
Kinixys lobatsiana Lobatse Hinged Tortoise 1LC - 3 3 Kinixys spekii Speke’s Hinged-back Tortoise 2LC - 1 1 Psammobates oculifer Serrated Tent Tortoise 1LC - 2 3
x 2 1 Stigmochelys pardalis Leopard Tortoise 1LC - 1 1
x x 1 6
1
CROCODYLIDAE (Crocodiles)
Crocodylus niloticus Nile crocodile 2VU EN 5 5
x
GEKKONIDAE (Geckos)
Afroedura nov sp. 10 [waterbergensis] Flat Gecko - 4 4
7
Chondrodactylus turneri Turner’s Gecko 1LC - 2 2
x 1
Hemidactylus mabouia Common Tropical House Gecko 2LC - 1 1
x 1 1
2
Homopholis wahlbergii Wahlberg’s Velvet Gecko 1LC - 1 1
x
1
Lygodactylus capensis capensis Common Dwarf Gecko 1LC - 1 1
x 1 1
1
Lygodactylus ocellatus ocellatus Spotted Dwarf Gecko 1LC (End) - 2 2 Pachydactylus affinis Transvaal Gecko 1LC (End) - 2 2
2
Pachydactylus capensis Cape Gecko 2LC - 2 2
x
1
2
Pachydactylus punctatus Speckled Gecko 2LC - 4 4 Ptenopus garrulus garrulus Common Barking Gecko 1LC - 2 3
x 1
AMPHISBAENIDAE (Worm Lizards)
Monopeltis capensis Cape Worm Lizard 1LC - 3 3 Zygaspis quadrifrons Kalahari Dwarf Worm Lizard 2LC - 2 2
x 1 4
LACERTIDAE (Lacertid lizards)
Heliobolus lugubris Bushveld Lizard 2LC - 2 2
x
2 Ichnotropis capensis Ornate Rough-scaled Lizard 1LC - 2 2
x 1 3

FGD Biodiversity & Wetland Assessment
Natural Scientific Services CC 221
FAMILY & SPECIES COMMON NAME
CONSERVATION STATUS
ME
DU
PI
Lo
O1
,3
FG
D L
oO
1,3
NS
S
EM
PR
5
VIC
INIT
Y* ATLAS
3
RED LIST
1
S.A. ToPS LIST
2
23
27
CB
23
27
DA
23
27
CD
23
27
DC
Meroles squamulosus Savanna Lizard 1LC - 1 1
x
1
Nucras holubi Holub’s Sandveld Lizard 2LC - 2 3
x Nucras intertexta Spotted Sandveld Lizard 2LC - 2 3
x
Nucras ornata Ornate Sandveld Lizard 2LC - 3 3 Pedioplanis lineoocellata lineoocellata Spotted Sand Lizard 2LC - 1 1 x
1
Pedioplanis lineoocellata pulchella Spotted Sand lizard 1LC - 3 3
1
CORDYLIDAE (Girdled lizards)
Cordylus jonesii Jones’ Girdled Lizard 1LC - 3 3
x
2
2
Cordylus vittifer Common Girdled Lizard 1LC - 3 3 Smaug breyeri Waterberg Dragon Lizard 1LC (End) - 2 3
x
2
Smaug vandami Van Dam’s Dragon Lizard 1LC (End) - 3 4 Platysaurus minor Waterberg Flat Lizard 1LC (End) - 3 4
GERRHOSAURIDAE (Plated lizards)
Broadleysaurus major Rough-scaled Pated Lizard 2LC - 2 3
x Gerrhosaurus flavigularis Yellow-throated Plated Lizard 2LC - 2 2
x
1
Metabosaurus validus Common Giant Plated Lizard 1LC - 4 4
x Gerrhosaurus auritus Kalahari Plated Lizard NE - 2 3
1 1
SCINCIDAE (Skinks)
Acontias occidentalis Savanna Legless Skink LC - 3 3
1 Afroablepharus maculicollis Spotted-neck Snake-eyed Skink 2LC - 3 3
Afroablepharus wahlbergii Wahlberg's Snake-eyed Skink 2LC - 2 3
x
1 Mochlus sundevallii Sundevall’s Writhing Skink 2LC - 2 2
x 1 1
1
Trachylepis capensis Cape Skink 2LC - 2 2
x Trachylepis margaritifer Rainbow Skink 2LC - 3 4
Trachylepis punctatissima Speckled Rock Skink 2LC - 3 3
x
1
1
Trachylepis punctulata Speckled Sand Skink 2LC - 2 3 Trachylepis striata Striped Skink 2LC - 1 1
x
1
Trachylepis varia Variable Skink 2LC - 1 1 x
x
1
9
Trachylepis variegata Variegated Skink 2LC - 2 3
x

FGD Biodiversity & Wetland Assessment
Natural Scientific Services CC 222
FAMILY & SPECIES COMMON NAME
CONSERVATION STATUS
ME
DU
PI
Lo
O1
,3
FG
D L
oO
1,3
NS
S
EM
PR
5
VIC
INIT
Y* ATLAS
3
RED LIST
1
S.A. ToPS LIST
2
23
27
CB
23
27
DA
23
27
CD
23
27
DC
Scelotes limpopoensis limpopoensis Limpopo Dwarf Burrowing Skink 1LC - 3 3
VARANIDAE (Monitor lizards)
Varanus albigularis albigularis Southern Rock Monitor 2LC - 1 1
x x
2 Varanus niloticus Nile Monitor 2LC - 3 3
CHAMAELEONIDAE (Chamaeleons)
Chamaeleo dilepis Common Flap-neck Chameleon 2LC - 1 1*
x
3
AGAMIDAE (Agamas)
Agama aculeata distanti Eastern Ground Agama 1LC (End) - 2 2
x
1 Agama armata Northern Ground Agama 2LC - 2 2
x
Agama atra Southern Rock Agama 1LC - 3 3 Acanthocercus atricollis atricollis Southern Tree Agama 1LC - 1 1 x x x
1
1
TYPHLOPIDAE (Blind snakes)
Afrotyphlops bibronii Bibron’s Blind Snake 1LC - 4 4 Rhinotyphlops lalandei Delalande's Beaked Blind Snake 2LC - 3 3
LEPTOTYPHLOPIDAE (Worm & thread snakes)
Leptotyphlops distanti Distant’s Thread Snake 1LC - 3 3 Leptotyphlops incognitus Incognito Thread Snake 1LC - 3 3 Leptotyphlops scutifrons Peters’ Thread Snake 1LC - 2 2
x
PYTHONIDAE (Pythons)
Python natalensis Southern African Python 2LC PS 1 1*
x
1
VIPERIDAE (Adders & vipers)
Bitis arietans arietans Puff Adder 2LC - 1 1
x
1
1
Causus defilippii Snouted Night Adder 2LC - 2 3 Causus rhombeatus Rhombic Night Adder 2LC - 2 2
LAMPROPHIIDAE (Slug-eaters, house snakes, wolf snakes, grass snakes, sand snakes & mole snakes)
Amblyodipsas polylepis polylepis Common Purple-glossed Snake 1LC - 3 3 Amblyodipsasventrimaculata Kalahari Purple-glossed Snake 1LC - 3 3 1 1
Aparallactus capensis Black-headed Centipede-eater 2LC - 2 3
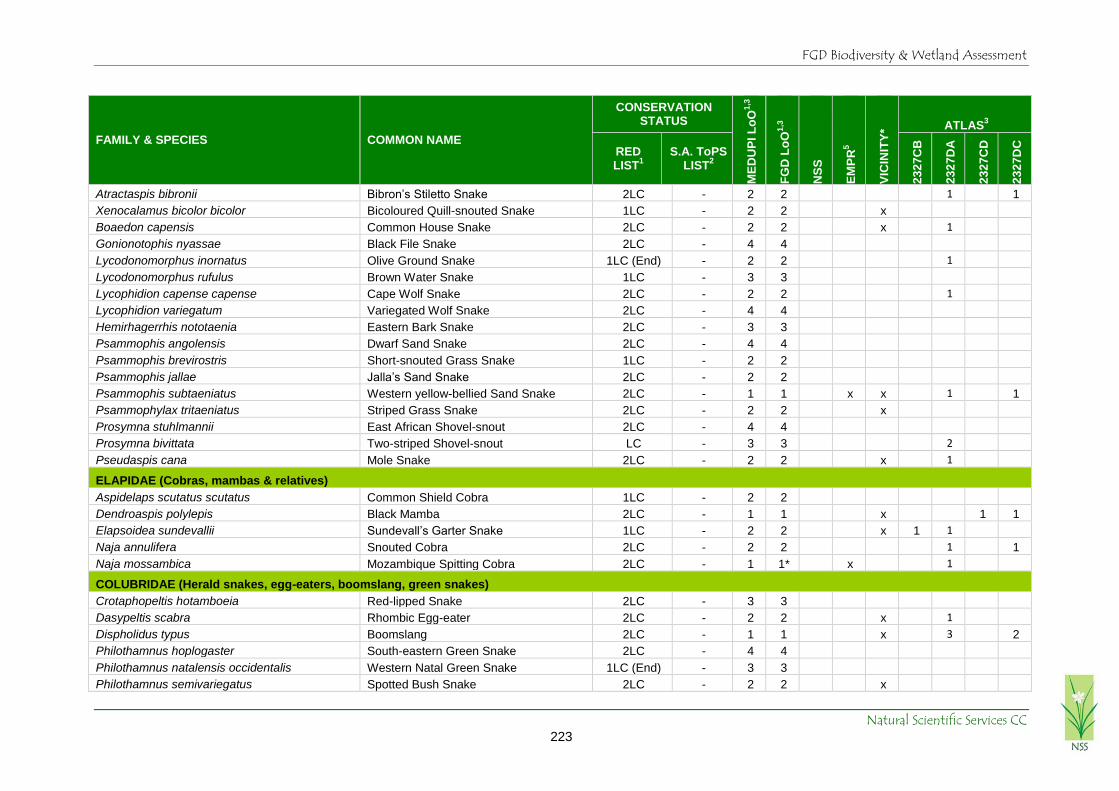
FGD Biodiversity & Wetland Assessment
Natural Scientific Services CC 223
FAMILY & SPECIES COMMON NAME
CONSERVATION STATUS
ME
DU
PI
Lo
O1
,3
FG
D L
oO
1,3
NS
S
EM
PR
5
VIC
INIT
Y* ATLAS
3
RED LIST
1
S.A. ToPS LIST
2
23
27
CB
23
27
DA
23
27
CD
23
27
DC
Atractaspis bibronii Bibron’s Stiletto Snake 2LC - 2 2
1
1
Xenocalamus bicolor bicolor Bicoloured Quill-snouted Snake 1LC - 2 2
x Boaedon capensis Common House Snake 2LC - 2 2
x
1 Gonionotophis nyassae Black File Snake 2LC - 4 4
Lycodonomorphus inornatus Olive Ground Snake 1LC (End) - 2 2
1 Lycodonomorphus rufulus Brown Water Snake 1LC - 3 3
Lycophidion capense capense Cape Wolf Snake 2LC - 2 2
1 Lycophidion variegatum Variegated Wolf Snake 2LC - 4 4
Hemirhagerrhis nototaenia Eastern Bark Snake 2LC - 3 3 Psammophis angolensis Dwarf Sand Snake 2LC - 4 4 Psammophis brevirostris Short-snouted Grass Snake 1LC - 2 2 Psammophis jallae Jalla’s Sand Snake 2LC - 2 2 Psammophis subtaeniatus Western yellow-bellied Sand Snake 2LC - 1 1
x x
1
1
Psammophylax tritaeniatus Striped Grass Snake 2LC - 2 2
x Prosymna stuhlmannii East African Shovel-snout 2LC - 4 4
Prosymna bivittata Two-striped Shovel-snout LC - 3 3
2 Pseudaspis cana Mole Snake 2LC - 2 2
x
1
ELAPIDAE (Cobras, mambas & relatives)
Aspidelaps scutatus scutatus Common Shield Cobra 1LC - 2 2 Dendroaspis polylepis Black Mamba 2LC - 1 1
x
1 1
Elapsoidea sundevallii Sundevall’s Garter Snake 1LC - 2 2
x 1 1 Naja annulifera Snouted Cobra 2LC - 2 2
1
1
Naja mossambica Mozambique Spitting Cobra 2LC - 1 1*
x
1
COLUBRIDAE (Herald snakes, egg-eaters, boomslang, green snakes)
Crotaphopeltis hotamboeia Red-lipped Snake 2LC - 3 3 Dasypeltis scabra Rhombic Egg-eater 2LC - 2 2
x
1 Dispholidus typus Boomslang 2LC - 1 1
x
3
2
Philothamnus hoplogaster South-eastern Green Snake 2LC - 4 4 Philothamnus natalensis occidentalis Western Natal Green Snake 1LC (End) - 3 3 Philothamnus semivariegatus Spotted Bush Snake 2LC - 2 2
x

FGD Biodiversity & Wetland Assessment
Natural Scientific Services CC 224
FAMILY & SPECIES COMMON NAME
CONSERVATION STATUS
ME
DU
PI
Lo
O1
,3
FG
D L
oO
1,3
NS
S
EM
PR
5
VIC
INIT
Y* ATLAS
3
RED LIST
1
S.A. ToPS LIST
2
23
27
CB
23
27
DA
23
27
CD
23
27
DC
Telescopus semiannulatus semiannulatus Eastern Tiger Snake 2LC - 2 2
x Thelotornis capensis capensis Southern Twig Snake 1LC - 2 2
Key
Status: D = Declining; End = Endemic; LC = Least Concern; NT = Near Threatened; PS = Protected Species; U = Unknown; VU = Vulnerable
Likelihood of Occurrence (LoO): 1 = Present; 2 = High; 3 = Moderate; 4 = Low; 5 = May occur as a managed population
Sources: 1Bates et al. (2014);
2ToPS List (2015);
3IUCN (2013.1);
4ReptileMap (2014);
5BEC (2006)
*Combined records from NSS studies at Grootegeluk and Limpopo West Mines, Mafutha Project and Matimba Power Station
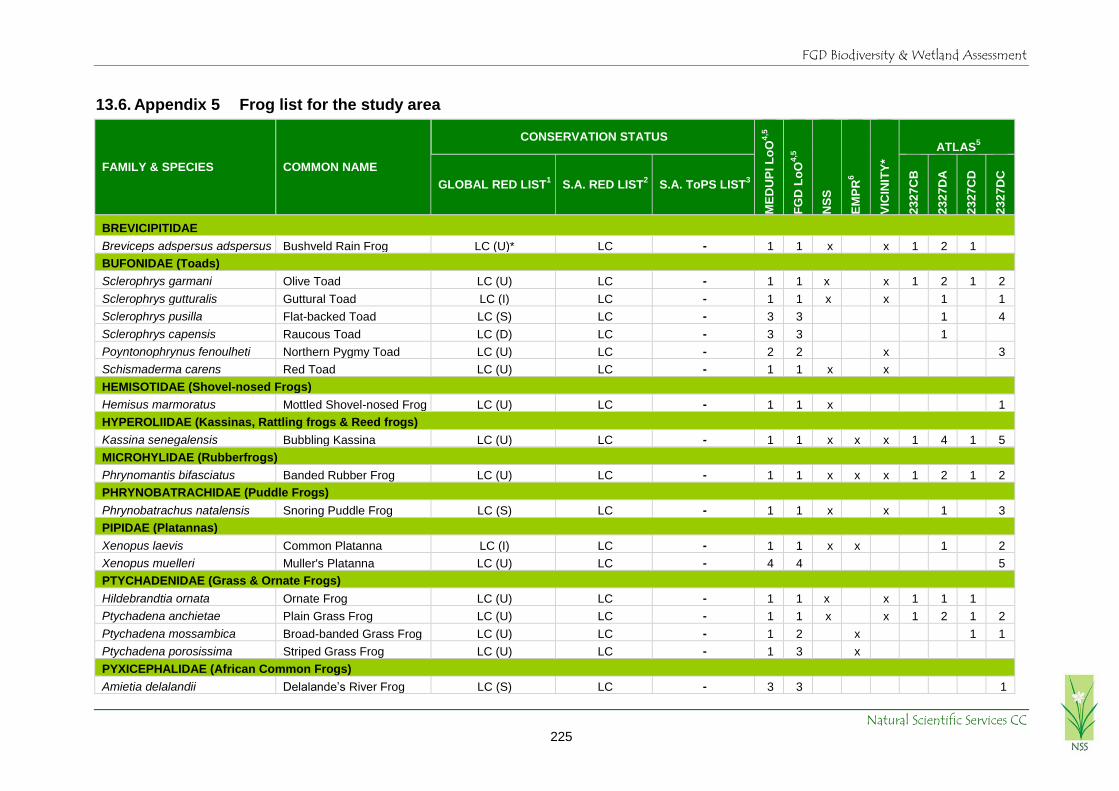
FGD Biodiversity & Wetland Assessment
Natural Scientific Services CC 225
13.6. Appendix 5 Frog list for the study area
FAMILY & SPECIES COMMON NAME
CONSERVATION STATUS
ME
DU
PI
Lo
O4
,5
FG
D L
oO
4,5
NS
S
EM
PR
6
VIC
INIT
Y*
ATLAS5
GLOBAL RED LIST1 S.A. RED LIST
2 S.A. ToPS LIST
3
23
27
CB
23
27
DA
23
27
CD
23
27
DC
BREVICIPITIDAE
Breviceps adspersus adspersus Bushveld Rain Frog LC (U)* LC - 1 1 x x 1 2 1
BUFONIDAE (Toads)
Sclerophrys garmani Olive Toad LC (U) LC - 1 1 x x 1 2 1 2
Sclerophrys gutturalis Guttural Toad LC (I) LC - 1 1 x x 1 1
Sclerophrys pusilla Flat-backed Toad LC (S) LC - 3 3 1 4
Sclerophrys capensis Raucous Toad LC (D) LC - 3 3 1
Poyntonophrynus fenoulheti Northern Pygmy Toad LC (U) LC - 2 2 x 3
Schismaderma carens Red Toad LC (U) LC - 1 1 x x
HEMISOTIDAE (Shovel-nosed Frogs)
Hemisus marmoratus Mottled Shovel-nosed Frog LC (U) LC - 1 1 x 1
HYPEROLIIDAE (Kassinas, Rattling frogs & Reed frogs)
Kassina senegalensis Bubbling Kassina LC (U) LC - 1 1 x x x 1 4 1 5
MICROHYLIDAE (Rubberfrogs)
Phrynomantis bifasciatus Banded Rubber Frog LC (U) LC - 1 1 x x x 1 2 1 2
PHRYNOBATRACHIDAE (Puddle Frogs)
Phrynobatrachus natalensis Snoring Puddle Frog LC (S) LC - 1 1 x x 1 3
PIPIDAE (Platannas)
Xenopus laevis Common Platanna LC (I) LC - 1 1 x x 1 2
Xenopus muelleri Muller's Platanna LC (U) LC - 4 4 5
PTYCHADENIDAE (Grass & Ornate Frogs)
Hildebrandtia ornata Ornate Frog LC (U) LC - 1 1 x x 1 1 1
Ptychadena anchietae Plain Grass Frog LC (U) LC - 1 1 x x 1 2 1 2
Ptychadena mossambica Broad-banded Grass Frog LC (U) LC - 1 2 x 1 1
Ptychadena porosissima Striped Grass Frog LC (U) LC - 1 3 x
PYXICEPHALIDAE (African Common Frogs)
Amietia delalandii Delalande’s River Frog LC (S) LC - 3 3 1

FGD Biodiversity & Wetland Assessment
Natural Scientific Services CC 226
FAMILY & SPECIES COMMON NAME
CONSERVATION STATUS
ME
DU
PI
Lo
O4
,5
FG
D L
oO
4,5
NS
S
EM
PR
6
VIC
INIT
Y*
ATLAS5
GLOBAL RED LIST1 S.A. RED LIST
2 S.A. ToPS LIST
3
23
27
CB
23
27
DA
23
27
CD
23
27
DC
Cacosternum boettgeri Boettger’s Caco LC (U) LC - 1 1 x x x 1
Pyxicephalus adspersus Giant Bullfrog LC (D) NT PS 3 1** x 1 2
Pyxicephalus edulis African Bullfrog LC (U) LC PS 1 1 x x 1 2 1 1
Tomopterna cryptotis Tremolo Sand Frog LC (S) LC - 1 1 x x 1 2 1 1
Tomopterna krugerensis Knocking Sand Frog LC (U) LC - 1 1 x x 1 1
Tomopterna marmorata Russet-backed Sand Frog LC (U) LC - 3 3
Tomopterna natalensis Natal Sand Frog LC (U) LC - 4 4
RHACOPHORIDAE (Foam Nest Frogs)
Chiromantis xerampelina Southern Foam Nest Frog LC (U) LC - 1 1 x x 2 1 2
Key
Status: LC = Least Concern; I = Increasing; NT = Near Threatened; PS = Protected Species; S = Stable; U = Unknown
Likelihood of Occurrence (LoO): 1 = Present; 2 = High; 3 = Moderate; 4 = Low
Sources: 1IUCN (2017.3);
2Minter et al. (2004);
3ToPS List (2007);
4Du Preez & Carruthers (2009);
5FrogMap (2018);
6BEC (2006)
*Combined records from NSS studies at Grootegeluk and Limpopo West Mines, Mafutha Project and Matimba Power Station
**Tentative identification

FGD Biodiversity & Wetland Assessment
Natural Scientific Services CC 227
13.7. Appendix 6 Butterfly list for the study area
FAMILY & SPECIES COMMON NAME STATUS1
ME
DU
PI
Lo
O1
,2
FG
D L
oO
1,2
NS
S
EM
PR
2
VIC
INIT
Y*
ATLAS
23
27
CB
23
27
DA
23
27
CD
23
27
DC
HESPERIIDAE (Sandmen, skippers, policemen & sylphs)
Abantis tettensis Spotted Paradise Skipper 1LC 2 2
Abantis venosa Veined Paradise Skipper 1LC 3 3
Afrogegenes hottentota Marsh Hottentot Skipper 1LC 3 3 1
Caprona pillaana Ragged Skipper 1LC 1 1 x
Coeliades forestan forestan Striped Policeman 1LC 3 3
Coeliades pisistratus Two-pip Policeman 1LC 2 2 1
Gegenes hottentota Marsh Hottentot Skipper 1LC 3 3 1
Gegenes niso niso Common Hottentot Skipper 1LC 3 3 1
Gegenes pumilio gambica Dark Hottentot 1LC 3 3 2
Gomalia elma elma Green-marbled Skipper 1LC 2 2 1
Kedestes callicles Pale Ranger LC 1 1 x x 1
Leucochitonea levubu White-cloaked Skipper 1LC 4 4
Metisella willemi Netted Sylph 1LC 4 4
Parosmodes morantii morantii Morant's Orange 1LC 3 3
Pelopidas mathias Black-banded Swift 1LC 3 3
Pelopidas thrax White-banded Swift 1LC 3 3 1
Platylesches neba Flower-girl Hopper 1LC 3 3 1
Sarangesa motozi Forest Elfin 1LC 2 2 1
Sarangesa phidyle Small Elfin 1LC 2 2 1
Spialia asterodia Star Sandman 1LC 4 4
Spialia colotes transvaaliae Bushveld Sandman 1LC 2 2 1
Spialia delagoae Delagoa Sandman 1LC 2 2
Spialia depauperata australis Wandering sandman 1LC 3 3
Spialia diomus ferax Common Sandman 1LC 1 1 x 1
Spialia dromus Forest Sandman 1LC 2 2
Spialia mafa mafa Mafa sandman 1LC 2 2 1
Spialia spio Mountain sandman 1LC 3 3 1

FGD Biodiversity & Wetland Assessment
Natural Scientific Services CC 228
FAMILY & SPECIES COMMON NAME STATUS1
ME
DU
PI
Lo
O1
,2
FG
D L
oO
1,2
NS
S
EM
PR
2
VIC
INIT
Y*
ATLAS
23
27
CB
23
27
DA
23
27
CD
23
27
DC
Tsitana tsita Dismal Sylph 1LC 3 3
PAPILIONIDAE (Swallowtails, swordtails & handkerchiefs)
Graphium antheus Large Striped Swordtail 1LC 1 1
Graphium morania White lady 1LC 3 3
Papilio dardanus cenea Flying handkerchief 1LC 4 4 1
Papilio demodocus demodocus Citrus swallowtail 1LC 2 2 1 2
Papilio nireus lyaeus Green-banded swallowtail 1LC 2 2 2 1
PIERIDAE (Whites, tips & travellers)
Belenois aurota Brown-veined white 1LC 1 1 x x x 8 1 4
Belenois creona severina African common white 1LC 1 1 x 1 1 3
Belenois gidica abyssinica African veined white 1LC 2 2 1
Belenois zochalia zochalia Forest White 1LC 4 4
Catopsilia florella African migrant 1LC 2 2 1 2
Colias electo electo African clouded yellow 1LC 2 2
Colotis annae annae Scarlet tip 1LC 1 2 x 2 1 4
Colotis antevippe gavisa Red tip 1LC 1 1 x 3
Colotis auxo auxo Sulphur orange tip 1LC 2 2 2
Colotis celimene amina Lilac tip 1LC RLD 3 3
Colotis euippe omphale Smoky orange tip 1LC 2 2 1 4
Colotis evagore antigone Small orange tip 1LC 2 2 2 1 5
Colotis evenina evenina Orange tip 1LC 2 2 5 1 2
Colotis ione Bushveld purple tip 1LC 2 2 1
Colotis pallene Bushveld orange tip 1LC 2 2 x 1 2
Colotis regina Queen purple tip 1LC 2 2 1 1 1
Colotis vesta argillaceus Veined Arab 1LC 1 1 x 2 1 5
Eurema brigitta brigitta Broad-bordered grass yellow 1LC 1 1 x x 3 1 3
Eurema hecabe solifera Common Grass Yellow 1LC 2 2
Mylothris agathina agathina Common dotted border 1LC 2 2 3 2
Mylothris rueppellii haemus Twin dotted border 1LC 2 2 1

FGD Biodiversity & Wetland Assessment
Natural Scientific Services CC 229
FAMILY & SPECIES COMMON NAME STATUS1
ME
DU
PI
Lo
O1
,2
FG
D L
oO
1,2
NS
S
EM
PR
2
VIC
INIT
Y*
ATLAS
23
27
CB
23
27
DA
23
27
CD
23
27
DC
Pinacopteryx eriphia eriphia Zebra white 1LC 1 1 x x 2 1 2
Pontia helice helice Common meadow white 1LC 2 2
Teracolus agoye agoye Speckled sulphur tip 1LC 2 2 2
Teracolus eris eris Banded gold tip 1LC 1 1 x 1 1 3
Teracolus subfasciatus Lemon traveller 1LC 2 2 1 3
NYMPHALIDAE (Acraeas, monarchs, pansies, browns, ringlets & charaxes)
Acraea acara acara Acara acraea 1LC 2 2
Acraea aglaonice Window Acraea 1LC 3 3
Acraea anemosa Broad-bordered acraea 1LC 1 1 x x
Acraea axina Little acraea 1LC 2 2 1 2
Acraea barberi Barber's acraea 1LC 2 2
Acraea caldarena caldarena Black-tipped acraea 1LC 2 2 1
Acraea horta Garden acraea 1LC 4 4
Acraea lygus Lygus acraea 1LC 3 3
Acraea natalica Natal acraea 1LC 2 2 1 1
Acraea neobule neobule Wandering donkey acraea 1LC 2 2 x 2 1
Acraea oncaea Rooibok Acraea 1LC 3 3 4 1
Acraea stenobea Suffused acraea 1LC 2 2 1
Brakefieldia perspicua perspicua Eyed Bush Brown 1LC 2 2 4
Byblia anvatara acheloia Joker 1LC 1 1 1 1
Byblia ilithyia Spotted joker 1LC 2 2 x 4 2 3
Catacroptera cloanthe cloanthe Pirate 1LC 3 3
Charaxes achaemenes achaemenes Bushveld charaxes 1LC 2 2 1 1 3
Charaxes brutus natalensis White-barred charaxes 1LC 3 3 2
Charaxes candiope Green-veined charaxes 1LC 2 2 1
Charaxes jahlusa rex Pearl-spotted charaxes 1LC 2 2
Charaxes phaeus Demon charaxes 1LC 2 2 1 1
Charaxes saturnus saturnus Foxy charaxes 1LC 2 2 1 1 3
Charaxes vansoni Van Son's charaxes 1LC 3 3 2
Charaxes varanes varanes Pearl charaxes 1LC 3 3 1

FGD Biodiversity & Wetland Assessment
Natural Scientific Services CC 230
FAMILY & SPECIES COMMON NAME STATUS1
ME
DU
PI
Lo
O1
,2
FG
D L
oO
1,2
NS
S
EM
PR
2
VIC
INIT
Y*
ATLAS
23
27
CB
23
27
DA
23
27
CD
23
27
DC
Charaxes zoolina Club-tailed charaxes 1LC 4 4
Coenyropsis natalii natalii Natal brown 1LC 1 1
Danaus chrysippus orientis African monarch 1LC 1 1 x x x 4 1 2
Hamanumida daedalus Guinea-fowl butterfly 1LC 1 1 x x 3 1 4
Heteropsis perspicua perspicua Eyed bush brown 1LC 2 2 4
Hypolimnas misippus Common diadem 1LC 1 1 x 2 2
Junonia hierta cebrene Yellow pansy 1LC 2 2 x 4 1 4
Junonia oenone oenone Blue pansy 1LC 2 2 x 1 2
Junonia orithya madagascariensis Eyed pansy 1LC 2 2 x 1
Melanitis leda Twilight brown 1LC 3 3 2
Neptis saclava marpessa Spotted sailer 1LC 4 4 1
Phalanta phalantha aethiopica African Leopard 1LC 2 2
Physcaeneura panda Dark-webbed ringlet 1LC 1 1
Precis antilope Darker commodore 1LC 3 3
Precis archesia archesia Garden commodore 1LC 2 2
Precis ceryne ceryne Marsh commodore 1LC 3 3
Precis octavia sesamus Gaudy Commodore 1LC 3 3
Protogoniomorpha anacardii nebulosa Clouded Mother-of-pearl 1LC 3 3 1
Stygionympha wichgrafi wichgrafi Wichgraf's hillside brown 1LC 3 3
Telchinia encedon encedon White-barred acraea 1LC 3 3
Telchinia rahira rahira Marsh acraea 1LC 2 2
Telchinia serena Dancing acraea 1LC 1 1 x 2 4
Vanessa cardui Painted lady 1LC 1 2 x x 1 2
Ypthima asterope hereroica African ringlet 1LC 2 2
Ypthima impura paupera Impure ringlet 1LC 3 3
LYCAENIDAE (Coppers, blues & relatives)
Actizera lucida Rayed blue 1LC 3 3
Alaena amazoula amazoula Yellow zulu 1LC 4 4
Aloeides aranda Aranda copper 1LC 3 3
Aloeides damarensis damarensis Damara copper 1LC 3 3 1

FGD Biodiversity & Wetland Assessment
Natural Scientific Services CC 231
FAMILY & SPECIES COMMON NAME STATUS1
ME
DU
PI
Lo
O1
,2
FG
D L
oO
1,2
NS
S
EM
PR
2
VIC
INIT
Y*
ATLAS
23
27
CB
23
27
DA
23
27
CD
23
27
DC
Aloeides damarensis mashona Damara copper 1LC 2 2
Aloeides taikosama Dusky copper 1LC 1 1 x
Anthene amarah amarah Black striped hairtail 1LC 2 2
Anthene definita definita Common hairtail 1LC 2 2
Anthene dulcis dulcis Mashuna hairtail 1LC 3 3
Anthene livida livida Pale hairtail 1LC 2 2
Anthene millari Millar's hairtail 1LC 3 3
Anthene otacilia otacilia Trimen’s hairtail 1LC 3 3
Axiocerses amanga amanga Bush scarlet 1LC 2 2 1 1
Axiocerses coalescens Black-tipped scarlet 1LC 4 4
Axiocerses tjoane tjoane Eastern scarlet 1LC 2 2
Azanus jesous Topaz babul blue 1LC 1 1 x 1 2
Azanus mirza Mirza babul blue 1LC 4 4
Azanus moriqua Thorn-tree babul blue 1LC 1 1 x
Azanus ubaldus Velvet-spotted babul blue 1LC 3 3 3
Cacyreus lingeus Bush bronze 1LC 4 4
Cacyreus marshalli Common geranium bronze 1LC 3 3 1
Cacyreus virilis Mocker bronze 1LC 3 3
Chilades trochylus Grass jewel 1LC 2 2 1 1 1
Cigaritis ella Ella's bar 1LC 4 4
Cigaritis mozambica Mozambique bar 1LC 3 3
Cigaritis natalensis Natal bar 1LC 2 2
Cigaritis phanes Silvery bar 1LC 4 4 1
Cnodontes penningtoni Pennington's buff 1LC 3 3 2
Crudaria leroma Silver spotted grey 1LC 2 2
Cupidopsis cissus cissus Common meadow blue 1LC 3 3
Cupidopsis jobates jobates Tailed meadow blue 1LC 2 2
Eicochrysops messapus mahallakoaena Cupreous blue 1LC 3 3
Eicochrysops messapus messapus Cupreous blue 1LC 3 3
Euchrysops dolorosa Sabie smoky blue 1LC 2 2

FGD Biodiversity & Wetland Assessment
Natural Scientific Services CC 232
FAMILY & SPECIES COMMON NAME STATUS1
ME
DU
PI
Lo
O1
,2
FG
D L
oO
1,2
NS
S
EM
PR
2
VIC
INIT
Y*
ATLAS
23
27
CB
23
27
DA
23
27
CD
23
27
DC
Euchrysops malathana Common smoky blue 1LC 3 3 1 1
Euchrysops osiris Osiris smoky blue 1LC 4 4 1
Euchrysops subpallida Ashen smoky blue 1LC 4 4
Hypolycaena philippus philippus Purplebrown hairstreak 1LC 2 2 1
Iolaus alienus alienus Brown-line sapphire 1LC 3 3 1
Iolaus pallene Saffron sapphire 1LC 3 3 1
Iolaus silarus silarus Straight-line sapphire 1LC 2 2 1
Iolaus silas Southern sapphire 1LC 4 4
Iolaus trimeni Trimen's sapphire 1LC 3 3
Lachnocnema durbani D'Urban's woolly legs 1LC 3 3
Lampides boeticus Pea blue 1LC 2 2 4 1
Lepidochrysops glauca Silvery blue 1LC 2 2
Lepidochrysops patricia Patricia blue 1LC 3 3
Lepidochrysops plebeia plebeia Twin-spot blue 1LC 4 4
Leptomyrina gorgias gorgias Common black-eye 1LC 3 3
Leptomyrina henningi henningi Henning's black-eye 1LC 1 1 x 1
Leptomyrina sp. - - - - 1
Leptotes babaulti Babault's zebra blue 1LC 1 1 x
Leptotes pirithous pirithous Common zebra blue 1LC 2 2 2
Pseudonacaduba sichela sichela Dusky blue 1LC 2 2 1
Stugeta bowkeri bowkeri Bowker's marbled sapphire 1LC 3 3
Stugeta bowkeri tearei Bowker's marbled sapphire 1LC 2 2
Tarucus sybaris sybaris Dotted blue 1LC 2 2 2 1
Tuxentius calice White pie 1LC 2 2 1
Tuxentius melaena melaena Black pie 1LC 2 2
Uranothauma nubifer nubifer Black heart 1LC 2 2
Virachola antalus Brown playboy 1LC 2 2 1 1
Virachola dinochares Apricot playboy 1LC 3 3 1
Zintha hintza hintza Hintza pierrot 1LC 2 2
Zizeeria knysna knysna Sooty blue 1LC 2 2 1

FGD Biodiversity & Wetland Assessment
Natural Scientific Services CC 233
FAMILY & SPECIES COMMON NAME STATUS1
ME
DU
PI
Lo
O1
,2
FG
D L
oO
1,2
NS
S
EM
PR
2
VIC
INIT
Y*
ATLAS
23
27
CB
23
27
DA
23
27
CD
23
27
DC
Zizula hylax Gaika blue 1LC 2 2 1
Key
Status: LC = Least Concern; RLD = Rare Low Density; 1 = Global
Likelihood of Occurrence (LoO): 1 = Present; 2 = High; 3 = Moderate; 4 = Low
Sources: 1Mecenero et al. (2013);
2LepiMap (2018);
3BEC (2006);
*Combined records from NSS studies at Grootegeluk and Limpopo West Mines, Mafutha Project and Matimba Power Station

FGD Biodiversity & Wetland Assessment
Natural Scientific Services CC 234
13.8. Appendix 7 Present and potentially occurring dragonfly and damselfly
species within the study area
FAMILY & SPECIES COMMON NAME
CONSERVATION STATUS
DB
I1
ME
DU
PI
Lo
O3
FG
D L
oO
3
NS
S
EM
PR
4
VIC
INIT
Y*
GLOBAL RED LIST
1
S.A. RED LIST
2
CALOPTERYGIDAE (Demoiselles)
Phaon iridipennis Glistening Demoiselle - - 2 2 2
CHLOROCYPHIDAE (Jewels)
Platycypha caligata Dancing Jewel - - 2 4 4
SYNLESTIDAE (Malachites)
Chlorolestes fasciatus Mountain Malachite - - 4 4 4
Chlorolestes tessellatus Forest Malachite - - 4 4 4
LESTIDAE (Spreadwings)
Lestes pallidus Pale Spreadwing - - 2 2 2
Lestes plagiatus Highland Spreadwing - - 2 3 3
Lestes tridens Spotted Spreadwing - - 3 2 2
PLATYCNEMIDIDAE (Featherlegs)
Mesocnemis singularis Riverjack - - 3 4 4
Elattoneura glauca Common Threadtail - - 1 3 3
COENAGRIONIDAE (Pond Damsels)
Ceriagrion glabrum Common Citril - - 0 2 2
Pseudagrion hamoni Drab Sprite - - 2 3 3
Pseudagrion kersteni Kersten's Sprite - - 1 4 4
Pseudagrion makabusiense Makabusi Sprite LC VU 4 4 4
Pseudagrion massaicum Masai Sprite - - 1 4 4
Pseudagrion salisburyense Slate Sprite - - 1 2 2
Pseudagrion sublacteum Cherry-eye Sprite - - 2 3 3
Pseudagrion sudanicum Sudan Sprite LC LC 4 3 3
Ischnura senegalensis Marsh Bluetail - - 0 2 2
Africallagma glaucum Swamp Bluet - - 1 2 2
Azuragrion nigridorsum Sailing Bluet - - 3 2 2
Agriocnemis exilis Little Wisp - - 4 3 3
Agriocnemis pinheyi Pinhey's Wisp - - 2 3 3
AESHNIDAE (Hawkers)
Anax ephippiger Vagrant Emperor - - 2 2 2
Anax imperator Blue Emperor - - 1 2 2
Anax speratus Orange Emperor - - 1 2 2
Anax tristis Black Emperor - - 4 3 3
GOMPHIDAE (Clubtails)
Ictinogomphus ferox Common Tigertail - - 2 3 3
Lestinogomphus angustus Spined Fairytail LC NT 4 4 4
Ceratogomphus pictus Common Thorntail - - 2 2 2
Paragomphus cognatus Boulder Hooktail - - 1 3 3
Paragomphus genei Green Hooktail - - 3 1 1 x
CORDULIIDAE (Emeralds)
Phyllomacromia contumax Two-banded Cruiser - - 3 2 2

FGD Biodiversity & Wetland Assessment
Natural Scientific Services CC 235
FAMILY & SPECIES COMMON NAME
CONSERVATION STATUS
DB
I1
ME
DU
PI
Lo
O3
FG
D L
oO
3
NS
S
EM
PR
4
VIC
INIT
Y*
GLOBAL RED LIST
1
S.A. RED LIST
2
LIBELLULIDAE (Skimmers & relatives)
Orthetrum abbotti Little Skimmer - - 2 3 3
Orthetrum chrysostigma Epaulet Skimmer - - 2 3 3
Orthetrum hintzi Hintz's Skimmer - - 3 3 3
Orthetrum icteromelas Spectacled Skimmer - - 2 3 3
Orthetrum julia Julia Skimmer - - 1 4 4
Orthetrum machadoi Machado's Skimmer - - 3 2 2
Orthetrum stemmale Strong Skimmer - - 4 3 3
Orthetrum trinacria Long Skimmer - - 1 2 2
Nesciothemis farinosa Black-tailed Skimmer - - 1 4 4
Palpopleura jucunda Yellow-veined Widow - - 2 2 2
Palpopleura lucia Lucia Widow - - 2 3 3
Palpopleura portia Portia Widow - - 2 3 3
Acisoma panorpoides Grizzled Pintail - - 2 4 4
Diplacodes lefebvrii Black Percher - - 3 4 4
Diplacodes luminans Barbet Percher - - 3 1 1 x
Crocothemis erythraea Broad Scarlet - - 0 2 2
Crocothemis sanguinolenta Little Scarlet - - 3 2 2
Brachythemis leucosticta Banded Groundling - - 2 1 1
x
Sympetrum fonscolombii Nomad - - 0 2 2
Trithemis annulata Violet Dropwing - - 1 4 4
Trithemis arteriosa Red-veined Dropwing - - 0 3 3
Trithemis donaldsoni Denim Dropwing - - 4 4 4
Trithemis furva Navy Dropwing - - 0 4 4
Trithemis hecate Silhouette Dropwing - - 4 3 3
Trithemis kirbyi Kirby's Dropwing - - 0 1 1 x
Trithemis pluvialis Riffle-and-Reed Dropwing - - 2 4 4
Trithemis stictica Jaunty Dropwing - - 1 4 4
Zygonyx torridus Ringed Cascader - - 2 4 4
Rhyothemis semihyalina Phantom Flutterer - - 1 3 3
Tholymis tillarga Twister - - 3 3 3
Pantala flavescens Pantala - - 0 2 2
Tramea basilaris Keyhole Glider - - 0 2 2
Urothemis assignata Red Basker - - 3 3 3
Urothemis edwardsii Blue Basker - - 2 3 3
Key
Status: LC = Least Concern; NT = Near Threatened; VU = Vulnerable;
Likelihood of Occurrence (LoO): 1 = Present; 2 = High; 3 = Moderate; 4 = Low
Dragonfly Biotic Index (DBI): An index developed by Samways (2008) based on three criteria: geographical
distribution, conservation status and sensitivity to change in habitat and ranges from a minimum of 0 (very common, widespread species which is highly tolerant of human disturbance) to 9 (range-restricted, threatened and sensitive endemic).
Sources: 1IUCN (2017.3);
2Samways (2006);
3Samways (2008);
4BEC (2006)

FGD Biodiversity & Wetland Assessment
Natural Scientific Services CC 236
13.9. Appendix 8 Present and potentially occurring scorpion species within the
study area
FAMILY & SPECIES COMMON NAME
ME
DU
PI
Lo
O1
FG
D L
oO
1
NS
S
EM
PR
2
VIC
INIT
Y*
Parabuthus mossambicensis Thick-tailed scorpions 2 2 x
Parabuthus granulatus Thick-tailed scorpions 3 3
Parabuthus transvaalicus Thick-tailed scorpions 3 3
Uroplectes planimanus Stinger scorpions 2 2
Uroplectes carinatus Stinger scorpions 1 2 x
Uroplectes vittatus Stinger scorpions 2 2 x
Opistacanthus asper Creeping scorpions 1 1 x
Hadogenes troglodytes Rock scorpions 3 3
Opistophthalmus glabifrons Burrowing scorpions 3 3
Opistophthalmus carinatus Burrowing scorpions 3 3
Opistophthalmus wahlbergii Burrowing scorpions 3 3 x
Key
Likelihood of Occurrence (LoO): 1 = Present; 2 = High; 3 = Moderate
Sources: 1Leeming (2003);
2BEC (2006)
*Combined records from NSS studies at Grootegeluk and Limpopo West Mines, Mafutha Project and Matimba Power Station
13.10. Appendix 9 Present and potentially occurring baboon spider species
within the study area
SPECIES COMMON NAME
ME
DU
PI
Lo
O1
FG
D L
oO
1
NS
S
EM
PR
2
VIC
INIT
Y*
Ceratogyrus bechuanicus Starbust Horned Baboon Spider 2 2 Ceratogyrus brachycephalus Rhino Horned Baboon Spider 2 2 Ceratogyrus sp. - 3 3 x
Pterinochilus junodi Soutpansberg Starburst Baboon Spider 4 4 Pterinochilus pluridentatus - 4 4 Harpactira sp. - 3 3 x
Key
Likelihood of Occurrence (LoO): 1 = Present; 2 = High; 3 = Moderate; 4 = Low
Sources: 1Dippenaar-Schoeman (2002);
2BEC (2006)
*Combined records from NSS studies at Grootegeluk and Limpopo West Mines, Mafutha Project and Matimba Power Station

Address: 480 Smuts Drive, Halfway Gardens | Postal: P O Box 5260, Halfway House, 1685 Tel: +27 (0)11 805 1940 | Fax: +27 (0)11 805 7010
www.airshed.co.za
Air Quality Specialist Report for the Proposed Medupi Flue Gas Desulphurisation (FGD) Retrofit Project
Project done on behalf of Zitholele Consulting
Project Compiled by: R von Gruenewaldt
L Burger G Kornelius
Report No: 14ZIT10 | Date: February 2018

Air Quality Specialist Report for the Proposed Medupi Flue Gas Desulphurisation (FGD) Retrofit Project
Report No.: 14ZIT10 i
Report Details
Report No. 14ZIT10
Status Rev 1
Report Title Air Quality Specialist Report for the Proposed Medupi Flue Gas Desulphurisation (FGD) Retrofit Project
Date December 2016
Client Zitholele Consulting
Prepared by
Reneé von Gruenewaldt (Pr. Sci. Nat.). MSc (University of Pretoria)
Lucian Burger. PHD (University of Natal)
Gerrit Kornelius. PHD (University of Pretoria)
Notice
Airshed Planning Professionals (Pty) Ltd is a consulting company located in Midrand, South Africa, specialising in all aspects of air quality, ranging from nearby neighbourhood concerns to regional air pollution impacts as well as noise impact assessments. The company originated in 1990 as Environmental Management Services, which amalgamated with its sister company, Matrix Environmental Consultants, in 2003.
Declaration Airshed is an independent consulting firm with no interest in the project other than to fulfil the contract between the client and the consultant for delivery of specialised services as stipulated in the terms of reference.
Copyright Warning
Unless otherwise noted, the copyright in all text and other matter (including the manner of presentation) is the exclusive property of Airshed Planning Professionals (Pty) Ltd. It is a criminal offence to reproduce and/or use, without written consent, any matter, technical procedure and/or technique contained in this document.

Air Quality Specialist Report for the Proposed Medupi Flue Gas Desulphurisation (FGD) Retrofit Project
Report No.: 14ZIT10 ii
Revision Record
Revision Number Date Reason for Revision
Draft 27 February 2015 Client review
Draft 2 March 2015 Minor grammatical changes
Rev 0.2 27 March 2015 Inclusion of additional information
Rev 0.3 16 April 2015 Incorporation of comments received by the client
Rev 0.4 7 May 2015 Incorporation of second round of comments received by the client
Rev 0.5 11 May 2015 Incorporation of third round of comments received by the client
Rev 0.6 11 May 2015 Incorporation of minor comments received by the client
Rev 0.7 24 November 2016 Inclusion of additional information regarding the waste disposal of the gypsum, salts and sludge
Rev 0.8 5 December 2016 Minor grammatical changes
Rev 0.9 18 January 2018 Incorporation of changes to authorisation and licencing approach in 2017
Rev 1.0 7 February 2018 Incorporation of comments received by the client

Air Quality Specialist Report for the Proposed Medupi Flue Gas Desulphurisation (FGD) Retrofit Project
Report No.: 14ZIT10 iii
List of Abbreviations
AQA Air quality act
APCS Air pollution control systems
ARM Ambient Ratio Method
As Arsenic
Cd Cadmium
Co Cobalt
CO Carbon monoxide
CO2 Carbon dioxide
Cr Chromium
Cu Copper
DEA Department of Environmental Affairs
ESP Electro static precipitator
g Gram
g/s Gram per second
HCl Hydrogen chloride
Hg Mercury
HNO3 Nitric acid
HF Hydrogen fluoride
LMo Monin-Obukhov length
m Meter
m² Meter squared
m³ Meter cubed
m/s Meters per second
Mn Manganese
NAAQS National ambient air quality standards
NH3 Ammonia
Ni Nickel
NO Nitrogen oxide
NO2 Nitrogen dioxide
NOx Oxides of nitrogen
O3 Ozone
OLM Ozone Limiting Method
PBL Planetary boundary layer
Pb Lead
PM Particulate matter
PM10 Particulate matter with diameter of less than 10 µm
PM2.5 Particulate matter with diameter of less than 2.5 µm
Sb Antimony
ppb Parts per billion
SO2 Sulfur dioxide
SO3 Sulfur trioxide
Tl Thalium
US EPA United States Environmental Protection Agency

Air Quality Specialist Report for the Proposed Medupi Flue Gas Desulphurisation (FGD) Retrofit Project
Report No.: 14ZIT10 iv
V Vanadium
VOC Volatile organic concentrations
µ micro
°C Degrees Celsius

Air Quality Specialist Report for the Proposed Medupi Flue Gas Desulphurisation (FGD) Retrofit Project
Report No.: 10ZIT10 v
Glossary
Airshed An area, bounded by topographical features, within which airborne contaminants can be retained for an extended period
Algorithm A mathematical process or set of rules used for calculation or problem-solving, which is usually undertaken by a computer
Assessment of environmental effects
A piece of expert advice submitted to regulators to support a claim that adverse effects will or will not occur as a result of an action, and usually developed in accordance with section 88 of the Resource Management Act 1991
Atmospheric chemistry The chemical changes that gases and particulates undergo after they are discharged from a source
Atmospheric dispersion model A mathematical representation of the physics governing the dispersion of pollutants in the atmosphere
Atmospheric stability A measure of the propensity for vertical motion in the atmosphere
Calm / stagnation A period when wind speeds of less than 0.5 m/s persist
Cartesian grid A co-ordinate system whose axes are straight lines intersecting at right angles
Causality The relationship between cause and effect
Complex terrain Terrain that contains features that cause deviations in direction and turbulence from larger-scale wind flows
Configuring a model Setting the parameters within a model to perform the desired task
Convection Vertical movement of air generated by surface heating
Convective boundary layer The layer of the atmosphere containing convective air movements
Diffusion Clean air mixing with contaminated air through the process of molecular motion. Diffusion is a very slow process compared to turbulent mixing.
Dispersion The lowering of the concentration of pollutants by the combined processes of advection and diffusion
Dispersion coefficients Variables that describe the lateral and vertical spread of a plume or a puff

Air Quality Specialist Report for the Proposed Medupi Flue Gas Desulphurisation (FGD) Retrofit Project
Report No.: 10ZIT10 vi
Executive Summary
Airshed Planning Professionals (Pty) Limited was appointed by Zitholele Consulting to undertake an air quality impact
assessment for a proposed Medupi Flue Gas Desulphurisation (FGD) retrofit project (hereafter referred to as the Project). The
FGD retrofit project will reduce the sulphur dioxide (SO2) emissions from the power station by 84% on average, to ensure
compliance with an SO2 emission limit of 500 mg/Nm3 (at 10% O2).
The aim of the investigation is to quantify the possible impacts resulting from the proposed activities on the surrounding
environment and human health. To achieve this, a good understanding of the local dispersion potential of the site is necessary
and subsequently an understanding of existing sources of air pollution in the region and the resulting air quality.
Scope of Work
Confirmed scope of work includes assessment of the following activities and infrastructure:
1. Construction and operation of a rail yard/siding to transport Limestone from a source defined point via the existing
rail network to the Medupi Power Station and proposed rail yard / siding. The rail yard infrastructure will include
storage of fuel (diesel) in above ground tanks and 15m deep excavation for tippler building infrastructure;
2. Construction and operation of limestone storage area, preparation area, handling and transport via truck and
conveyor to the FGD system located near the generation units of the Medupi Power Station;
3. The construction and operation of the wet FGD system that will reduce the SO2 content in the flue gas emitted;
4. Construction and operation of associated infrastructure required for operation of the FGD system and required
services to ensure optimal functioning of the wet FGD system. The associated FGD infrastructure include a facility
for storage of fuel (diesel), installation of storm water infrastructure and conservancy tanks for sewage;
5. The handling, treatment and conveyance of gypsum and effluent from the gypsum dewatering plant.
6. Pipeline for the transportation of waste water from the gypsum dewatering plant and its treatment at the waste water
treatment plant (WWTP) that will be located close to the FGD infrastructure within the Medupi Power Station;
7. Construction and operation of the WWTP;
8. Management, handling, transport and storage of salts and sludge generated through the waste water treatment
process at a temporary waste storage facility.
9. The transportation of salts and sludge via trucks from the temporary waste storage facility to a final Waste Disposal
Facility to be contracted by Eskom for the first 5 years of operation of the FGD system.
10. Disposal of gypsum together with ash on the existing licenced ash disposal facility (ADF), with resulting increase in
height of the ADF from 60m to 72m.
Study Approach and Methodology
The investigation followed the methodology required for a specialist report as prescribed in the Environmental Impact
Assessment (EIA) Regulations (Government Notice R.543 in Government Gazette 33306 of 18 June 2010).

Air Quality Specialist Report for the Proposed Medupi Flue Gas Desulphurisation (FGD) Retrofit Project
Report No.: 10ZIT10 vii
Potential Air Emissions from the Proposed Project
For the Air Quality Assessment initiated in 2014 the approach focussed on the impacts from the operation of the FGD (“the
Project”). The main pollutant that will be affected through the operations of the Project is SO2, as the FGD control aims at the
reduction of this pollutant. The emission concentrations of nitrogen dioxide (NO2) and particulate matter from the stack
releases was provided by Eskom personnel to remain the same with and without the control of FGD but the buoyancy of the
plume and its ability to disperse from the point of release will be altered due to changes in exit temperatures effecting the
ambient concentrations of the pollutant at ground level. The gypsum by-product will alter the potential wind-blown dust from
the ash storage facility (assuming the disposal of ash and gypsum together in an appropriate Class C facility) or may generate
additional dust from an independent disposal facility. For the current assessment, the assumption was made that the ash and
gypsum would be disposed of in a single facility.
Towards the middle of 2017 changes to the authorisation and licencing approach for the Medupi FGD Retrofit Project
applications were proposed in order to streamline the application processes to ensure compliance with the NEMAQA
compliance requirements by the year 2021. The changes that influence potential air emissions include the application for
activities associated with the construction and operation of the FGD system within the Medupi PS footprint and the railway
yard and siding, including limestone and gypsum handling facilities and diesel storage facilities new access roads. The impacts
from the construction activities were not assessed further as their impacts would be localised and of a temporary nature. The
impacts from the railway siding and handling operations as well as vehicle entrainment from the new access road would
contribute to the particulate matter. The diesel storage facility would contribute to volatile organic compounds. Impacts from
these activities, however, will be localised and will not exceed National Ambient Air Quality Standards offsite. These changes
were therefore not deemed significant and were thus not assessed further.
Baseline Assessment
The baseline study encompassed the analysis of meteorological data. Local meteorological data (including wind speed, wind
direction and temperature) was obtained from MM51 data for the period 2011 to 2013. The identification of sources of
emissions in the study area also formed part of the baseline assessment.
Two scenarios were assessed which consisted of (i) 2014 baseline (including operations of the Matimba Power Station) and
(ii) 2020 baseline (including the operations of the Matimba Power Station and the Medupi Power Station with all six units
excluding FGD).
Emissions Inventory
Emissions inventories provide the source input required for the simulation of ambient air concentrations. Windblown fugitive
source emissions from the ash disposal facilities were quantified. Point source emissions and parameters for the proposed
operations were provided by Eskom personnel.
1 The MM5 (short for Fifth-Generation Penn State/NCAR Mesoscale Model) is a regional mesoscale model used for creating weather
forecasts and climate projections. It is a community model maintained by Penn State University and the National Centre for Atmospheric Research.

Air Quality Specialist Report for the Proposed Medupi Flue Gas Desulphurisation (FGD) Retrofit Project
Report No.: 10ZIT10 viii
Impact Prediction Study
SO2, NO2 and particulate concentrations due to the baseline and proposed operations were simulated using the
CALMET/CALPUFF dispersion modelling suite. Ambient concentrations were simulated to ascertain highest hourly, daily and
annual averaging levels occurring as a result of the baseline and proposed Project operations.
Three scenarios were assessed: (i) 2014 baseline: the potential impacts due to the Matimba Power Station operations, (ii)
2020 baseline: the potential impacts due to the Matimba Power Station operations and the Medupi Power Station operations
including all six units without FGD, and (iii) proposed Project operations: the potential impacts due to the Matimba Power
Station operations and the Medupi Power Station operations including all six units with FGD. The fugitive emissions due to
windblown dust from the disposal of ash and gypsum at the ash disposal facility was also quantified at the existing Ash
Disposal Facility (ADF) as an unmitigated operation (no controls in place) and as a mitigated operation (80% control efficiency
in place through active re-vegetation and wetting). Stack emissions and parameters were provided by Eskom personnel for
the study.
Assessment Criteria
For the current study, the impacts were assessed against published National Ambient Air Quality Standards (NAAQS).
Assumptions, Exclusions and Limitations
• Emissions emanating from all existing sources in the area were not quantified nor were resultant ambient air pollutant
concentrations due to such sources simulated, with the exception of the existing Matimba Power Station and its
associated ashing operations. Given that Matimba Power Station is the most significant source of ambient SO2
concentrations in the region, this study limitation is not significant for assessing compliance and health risk potentials
due to SO2. Matimba Power Station is, however, not the major contributor to ambient fine particulate concentrations.
In order to project cumulative particulate concentrations other significant sources, particularly local mining operation
emissions, would need to be quantified.
• Routine emissions from power station operations were estimated and modelled. Atmospheric releases occurring as
a result of accidents were not accounted for.
• For the current assessment, the assumption was made that the ash and gypsum would be disposed together in the
same facility, until there is an opportunity in the market for alternative use of gypsum. The gypsum material on the
disposal facility is expected to provide a crust when mixed with water. To what extent this material will crust will
depend on how the material is disposed (i.e. mixed with the ash or deposited as layers of gypsum material in between
the ash material) and how much water is added to the disposal facility. The crust may also be disturbed from time
to time with activity on the disposal facility. For the current assessment, the effectiveness of this crust in lowering
windblown emissions could not be quantified.
• MM5 was used as the “initial guess” field for the CALMET model. Although two monitoring stations are located within
the study area, MM5 could not be used together with the surface measurements as the Eskom-operated Marapong
station is sited incorrectly providing questionable wind direction and, with one representative station (South African
Weather Service Station located at Lephalale), CALMET requires 100% data availability which was not present.
The most important assumptions made during the air quality impact assessment are as follows:

Air Quality Specialist Report for the Proposed Medupi Flue Gas Desulphurisation (FGD) Retrofit Project
Report No.: 10ZIT10 ix
• Source parameters and emission rates for these emission scenarios required for input to the dispersion modelling
study were provided by Eskom personnel. The assumption was made that this information was accurate and correct.
• A constant NH3 background concentration of 20 ppb was used in Calpuff (Scorgie et al, 2006). Measured ozone
data from the Marapong station was included for the background data required for the chemical transformation
module in Calpuff.
Main Findings
The main findings from the baseline air quality characterisation study (prior to the operation of the Medupi Power Station),
which was based on information from both monitoring and modelling studies, are as follows:
• SO2 concentrations have been measured to infrequently exceed short-term NAAQ limits at the monitoring stations
located at Marapong and Lephalale. Modelled SO2 concentrations also indicate infrequent short-term exceedances
of the NAAQ limits at these sensitive receptors. There is however compliance with the NAAQS.
• Currently, the Matimba Power Station is likely to be the main contributing source to the ambient SO2 ground level
concentrations in the study area due to the magnitude of its emissions. Other sources which may contribute
significantly due to their low release level include: spontaneous combustion of coal discards associated with mining
operations, clamp firing emissions during brickmaking at Hanglip and potentially household fuel burning within
Marapong. The highest ground level SO2 concentrations due to the Matimba Power Station stack emissions are
expected to occur during unstable conditions, usually occurring during the day, when the plume is brought to ground
in relatively close proximity to the power station.
• NO2 concentrations have been measured to infrequently exceed short-term NAAQ limits (but are in compliance with
NAAQS) at the monitoring stations located at Marapong and Lephalale, which is reiterated in the modelled results.
Low level sources of NOx in the region include combustion within coal discard dumps, brick firing operations and
possibly also household fuel burning and infrequent veld burning.
• Measured PM10 concentrations exceed the daily NAAQS at Marapong for the period 2014 but are lower at Lephalale
(where levels comply with daily NAAQS). The measured PM2.5 concentrations are within the daily NAAQS applicable
till 2030 at Marapong and Lephalale, but exceed the more stringent daily NAAQS applicable in 2030. The annual
average PM10 and PM2.5 concentrations measured at Lephalale are within NAAQS. Measured annual PM10
concentrations at Marapong during the period 2013 exceed annual NAAQS.
• 2014 Baseline simulations:
o The contribution of Matimba Power Station to primary and secondary particulates was simulated, with no
exceedances of the SO2, NO2, PM10 and PM2.5 NAAQS at Marapong and Lephalale. Secondary
particulates form in the atmosphere through the conversion of SOx and NOx emissions to sulfate and
nitrate.
• 2020 Baseline simulations:
o The area of non-compliance with the hourly and daily SO2 NAAQS extended ~30km southwest of the
Medupi Power Station due to the cumulative operations of Matimba Power Station and Medupi Power

Air Quality Specialist Report for the Proposed Medupi Flue Gas Desulphurisation (FGD) Retrofit Project
Report No.: 10ZIT10 x
Station without FGD control. Non-compliance with the hourly and daily SO2 NAAQS was simulated at the
residential settlement to the northwest of the Matimba Power Station under these conditions.
• Various local (informed through observation from site visits) and far-field (informed by literature) sources are
expected to contribute to the suspended fine particulate concentrations in the region. Local dust sources include
wind erosion from exposed areas, fugitive dust from mining and brickmaking operations, vehicle entrainment from
roadways and veld burning. Household fuel burning may also constitute a local source of low-level emissions. Long-
range transport of particulates emitted from remote tall stacks and from biomass burning in countries to the north of
Republic of South Africa (RSA) and the accumulation and recirculation of such regional air masses over the interior
is well documented (Andreae et al., 1996; Garstang et al., 1996; Piketh, 1996) (detail pertaining to the recirculation
of air masses is provided in Section 3.3.1.9).
The main findings of the impact assessment for the proposed Project are provided as follows:
• The area of exceedance of the hourly and daily SO2 NAAQS was significantly reduced when FGD controls on the
Medupi Power Station are considered, bringing the simulated ground level concentrations within compliance of the
hourly and daily SO2 NAAQS at all sensitive receptors in the study area.
• Simulated impacts from the Matimba Power Station and the Medupi Power Station without FGD (2020 baseline)
was in non-compliance with SO2 NAAQS on a regional scale resulting in a MODERATE significance. The area of
non-compliance of SO2 concentrations reduces significantly for proposed Project operations (i.e. Matimba Power
Station operations and Medupi Power Station operations with FGD) and reduces the significance to LOW as no
exceedances of the NAAQS are simulated at the closest sensitive receptors in the study area. No exceedances of
the NAAQS for NO2, PM10 and PM2.5 were simulated at sensitive receptors due to proposed Project operations
resulting in LOW significance. The available monitoring data shows that the PM10 concentrations are in non-
compliance with the daily NAAQS at Marapong. Simulated impacts due to proposed Project operations, however,
do not contribute significantly to current ambient particulate concentrations.
Recommendation
As the proposed Project operations will significantly reduce SO2 impacts from the Medupi Power Station, it is recommended
that the FGD Retrofit Project (including the increase in height of 12 m at the ADF) be implemented.

Air Quality Specialist Report for the Proposed Medupi Flue Gas Desulphurisation (FGD) Retrofit Project
Report No.: 10ZIT10 xi
Table of Contents
1 Introduction....................................................................................................................................................................... 1
1.1 Description of Project Activities from an Air Quality Perspective ............................................................................ 1
1.2 Approach and Methodology .................................................................................................................................... 2
1.2.1 Potential Air Emissions from the Proposed Project ........................................................................................... 2
1.2.2 Regulatory Requirements and Assessment Criteria .......................................................................................... 2
1.2.3 Description of the Baseline Environment ........................................................................................................... 3
1.2.4 Existing Ambient Air Quality .............................................................................................................................. 3
1.2.5 Emissions Inventory ........................................................................................................................................... 3
1.2.6 Atmospheric Dispersion Modelling .................................................................................................................... 3
1.3 Assumptions, Exclusions and Limitations ............................................................................................................... 8
1.4 Outline of Report .................................................................................................................................................... 9
2 Regulatory Requirements and Assessment Criteria ...................................................................................................... 10
2.1 Minimum Emission Standards .............................................................................................................................. 10
2.2 National Ambient Air Quality Standards for Criteria Pollutants ............................................................................. 11
2.3 Code of Practice for Air Dispersion Modelling in Air Quality Management in South Africa, 2014 ........................ 12
2.4 Waterberg-Bojanala Priority Area ......................................................................................................................... 12
3 Description of the Receiving/Baseline Environment....................................................................................................... 14
3.1 Air Quality Sensitive Receptors ............................................................................................................................ 14
3.2 Atmospheric Dispersion Potential ......................................................................................................................... 14
3.2.1 Surface Wind Field .......................................................................................................................................... 15
3.2.2 Temperature .................................................................................................................................................... 16
3.2.3 Atmospheric Stability ....................................................................................................................................... 16
3.3 Status Quo Ambient Air Quality ............................................................................................................................ 17
3.3.1 Atmospheric Emissions ................................................................................................................................... 17
3.3.2 Measured Ambient Air Pollutant Concentrations ............................................................................................. 21
3.3.3 Simulated Ambient Air Pollutant Concentrations ............................................................................................. 28
3.3.4 Conclusions Regarding Baseline Air Quality ................................................................................................... 37
4 Impact of Proposed Project on Human Health ............................................................................................................... 39
4.1 Atmospheric Emissions ........................................................................................................................................ 39
4.2 Impact Assessment .............................................................................................................................................. 40
4.2.1 Qualitative Assessment ................................................................................................................................... 40
4.2.2 Quantitative Assessment ................................................................................................................................. 42
4.3 Impact Significance Rating ................................................................................................................................... 45

Air Quality Specialist Report for the Proposed Medupi Flue Gas Desulphurisation (FGD) Retrofit Project
Report No.: 10ZIT10 xii
4.3.1 Existing Status ................................................................................................................................................. 45
4.3.2 Cumulative Impact ........................................................................................................................................... 45
4.3.3 Mitigation Measures ......................................................................................................................................... 45
4.3.4 Residual Impact ............................................................................................................................................... 45
5 Conclusions .................................................................................................................................................................... 48
5.1 Baseline Air Quality Study Findings ..................................................................................................................... 48
5.2 Impact Assessment for Proposed Project ............................................................................................................ 49
5.3 Recommendation ................................................................................................................................................. 49
6 References ..................................................................................................................................................................... 50
7 Appendix A - The NO2/NOx Conversion Ratios For NO2 Formation ............................................................................... 52
8 Appendix B - Summary Of: Status Of Trace Element Emission In A Coal Combustion Process: A Review (Xua, et al.,
2003) ....................................................................................................................................................................................... 54

Air Quality Specialist Report for the Proposed Medupi Flue Gas Desulphurisation (FGD) Retrofit Project
Report No.: 10ZIT10 xiii
List of Tables
Table 1-1: Summary description of CALPUFF/CALMET model suite with versions used in the investigation .......................... 5
Table 2-1: Subcategory 1.1: Solid fuel combustion installations .............................................................................................. 10
Table 2-2: National Ambient Air Quality Standards ................................................................................................................. 11
Table 3-1: Atmospheric Stability Classes ................................................................................................................................ 17
Table 3-2: Summary of the data availability and compliance with NAAQS for the ambient data measured at Lephalale ....... 24
Table 3-3: Summary of the data availability and compliance with NAAQS for the ambient data measured at Marapong ...... 27
Table 3-4: Stack parameters for the Matimba Power Station .................................................................................................. 28
Table 3-5: Annual emissions (in tonnes) for the Matimba Power Station operating conditions (as obtained from the Matimba
Atmospheric Impact Report (Zunckel & Raghunandan, 2014)) ............................................................................................... 28
Table 3-6: Particle size distribution for the ash dump .............................................................................................................. 29
Table 3-7: Stack parameters for the Medupi Power Station(a) ................................................................................................. 30
Table 3-8: Annual emissions (in tonnes) for Medupi Power Station operating conditions (as calculated based on information
provided by Eskom personnel) ................................................................................................................................................ 30
Table 3-9: Simulated SO2, NO2, PM10 and PM2.5 ground level concentrations at the closest sensitive receptors due to 2014
baseline and 2020 baseline operating conditions .................................................................................................................... 35
Table 4-1: Stack parameters for the Medupi Power Station(a) ................................................................................................. 39
Table 4-2: Annual emissions (in tonnes) for Medupi Power Station operating conditions (as calculated based on information
provided by Eskom personnel) ................................................................................................................................................ 39
Table 4-3: Simulated SO2, NO2, PM10 and PM2.5 ground level concentrations at the closest sensitive receptors due to Matimba
Power Station operations and Medupi with FGD ..................................................................................................................... 43
Table 4-4: Impact rating matrix for the proposed project operations ....................................................................................... 47

Air Quality Specialist Report for the Proposed Medupi Flue Gas Desulphurisation (FGD) Retrofit Project
Report No.: 10ZIT10 xiv
List of Figures
Figure 2-1: Location of the Medupi Power Station within the Waterberg-Bojanala Priority Area (Scott, 2012) ....................... 12
Figure 3-1: Location of sensitive receptors in the vicinity of the Medupi Power Station .......................................................... 14
Figure 3-2: Period, day- and night-time wind roses for the period 2011-2013 ......................................................................... 15
Figure 3-3: Monthly diurnal temperature averages for the Medupi Power Station Site (as extracted from MM5 data) ........... 16
Figure 3-4: Schematic representation of major low-level transport trajectory models likely to result easterly or westerly exiting
of material from southern African or in recirculation over the subcontinent (Tyson et al, 1996c) ............................................ 20
Figure 3-5: Hourly NO2 measured at the Lephalale monitoring station for the period January 2013 to November 2014 ........ 21
Figure 3-6: Daily PM10 measured at the Lephalale monitoring station for the period January 2013 to November 2014 ......... 22
Figure 3-7: Daily PM2.5 measured at the Lephalale monitoring station for the period January 2013 to November 2014 ........ 22
Figure 3-8: Hourly SO2 measured at the Lephalale monitoring station for the period January 2013 to November 2014 ........ 23
Figure 3-9: Daily SO2 measured at the Lephalale monitoring station for the period January 2013 to November 2014 .......... 23
Figure 3-10: Hourly NO2 measured at the Marapong monitoring station for the period January 2013 to November 2014 ..... 25
Figure 3-11: Daily PM10 measured at the Marapong monitoring station for the period January 2013 to November 2014 ...... 25
Figure 3-12: Daily PM2.5 measured at the Marapong monitoring station for the period January 2013 to November 2014 ...... 26
Figure 3-13: Hourly SO2 measured at the Marapong monitoring station for the period January 2013 to November 2014...... 26
Figure 3-14: Daily SO2 measured at the Marapong monitoring station for the period January 2013 to November 2014 ........ 27
Figure 3-15: Area of exceedance of the hourly SO2 NAAQS due to the 2014 baseline conditions ......................................... 32
Figure 3-16: Area of exceedance of the daily SO2 NAAQS due to the 2014 baseline conditions............................................ 33
Figure 3-17: Area of exceedance of the hourly SO2 NAAQS due to the 2020 baseline conditions ......................................... 34
Figure 3-18: Area of exceedance of the daily SO2 NAAQS due to the 2020 baseline conditions............................................ 35
Figure 4-1: Estimated highest daily and annual average PM10 ground level concentrations, due to vehicle entrainment, at set
distances from the emission source ......................................................................................................................................... 41
Figure 4-2: Estimated highest daily and annual average PM2.5 ground level concentrations, due to vehicle entrainment, at set
distances from the emission source ......................................................................................................................................... 41
Figure 4-3: Area of exceedance of the hourly SO2 NAAQS due to Matimba Power Station operations and Medupi with FGD
................................................................................................................................................................................................. 42
Figure 4-4: Area of exceedance of the daily SO2 NAAQS due to Matimba Power Station operations and Medupi with FGD 43

Air Quality Specialist Report for the Proposed Medupi Flue Gas Desulphurisation (FGD) Retrofit Project
Report No.: 10ZIT10 1
Air Quality Specialist Report for the Proposed Medupi Flue Gas Desulphurisation (FGD) Retrofit Project
1 INTRODUCTION
Airshed Planning Professionals (Pty) Limited was appointed by Zitholele Consulting to undertake an air quality impact
assessment for a proposed Medupi Flue Gas Desulphurisation (FGD) retrofit project (hereafter referred to as the Project). The
FGD retrofit project will reduce the sulphur dioxide (SO2) emissions from the power station by 84%.
The aim of the investigation is to quantify the possible impacts resulting from the proposed activities on the surrounding
environment and human health. To achieve this, a good understanding of the regional climate and local dispersion potential
of the site is necessary and subsequently an understanding of existing sources of air pollution in the region and the resulting
air quality is required.
Typical of specialist investigations conducted, the air quality investigation comprises both a baseline study and an impact
assessment. The baseline study includes the review of site-specific atmospheric dispersion potentials, and existing ambient
air quality in the region, in addition to the identification of potentially sensitive receptors. The ambient air quality impact
assessment comprised the establishment of an emissions inventory for the proposed activities, the simulation of ambient air
pollutant concentrations occurring due to Project operations, and the evaluation of the resultant potential for impacts and non-
compliance.
1.1 Description of Project Activities from an Air Quality Perspective
Confirmed scope of work includes assessment of the following activities and infrastructure:
11. Construction and operation of a rail yard/siding to transport Limestone from a source defined point via the existing
rail network to the Medupi Power Station and proposed rail yard / siding. The rail yard infrastructure will include
storage of fuel (diesel) in above ground tanks and 15m deep excavation for tippler building infrastructure;
12. Construction and operation of limestone storage area, preparation area, handling and transport via truck and
conveyor to the FGD system located near the generation units of the Medupi Power Station;
13. The construction and operation of the wet FGD system that will reduce the SO2 content in the flue gas emitted;
14. Construction and operation of associated infrastructure required for operation of the FGD system and required
services to ensure optimal functioning of the wet FGD system. The associated FGD infrastructure include a facility
for storage of fuel (diesel), installation of storm water infrastructure and conservancy tanks for sewage;
15. The handling, treatment and conveyance of gypsum and effluent from the gypsum dewatering plant.
16. Pipeline for the transportation of waste water from the gypsum dewatering plant and its treatment at the waste water
treatment plant (WWTP) that will be located close to the FGD infrastructure within the Medupi Power Station;
17. Construction and operation of the WWTP;
18. Management, handling, transport and storage of salts and sludge generated through the waste water treatment
process at a temporary waste storage facility.
19. The transportation of salts and sludge via trucks from the temporary waste storage facility to a final Waste Disposal
Facility to be contracted by Eskom for the first 5 years of operation of the FGD system.
20. Disposal of gypsum together with ash on the existing licenced ash disposal facility (ADF), with resulting increase in
height of the ADF from 60m to 72m.
Air Quality Specialist Report for the Proposed Medupi Flue Gas Desulphurisation (FGD) Retrofit Project
Report No.: 10ZIT10 2
1.2 Approach and Methodology
The methodology followed in the assessment to quantify the air quality impacts associated with the proposed Project is
discussed below. The general tasks included:
• The establishment of the baseline air quality (based on available information);
• Quantification of air emissions from the proposed Project;
• Discussion of meteorological parameters required to establish the atmospheric dispersion potential;
• Calculation of the air concentrations from the proposed Project using a suitable atmospheric dispersion model;
• Assessment of the significance of the impact through the comparison of simulated air concentrations with local
National Ambient Air Quality Standards (for compliance).
1.2.1 Potential Air Emissions from the Proposed Project
For the Air Quality Assessment initiated in 2014 the approach focussed on the impacts from the operation of the FGD (“the
Project”). The main pollutant that will be affected through the operations of the Project is SO2, as the FGD control aims at the
reduction of this pollutant. The emission concentrations of nitrogen dioxide (NO2) and particulate matter from the stack
releases was provided by Eskom personnel to remain the same with and without the control of FGD but the buoyancy of the
plume and its ability to disperse from the point of release will be altered due to changes in exit temperatures effecting the
ambient concentrations of the pollutant at ground level. The gypsum by-product will alter the potential wind-blown dust from
the ash storage facility (assuming the disposal of ash and gypsum together in an appropriate Class C facility) or may generate
additional dust from an independent disposal facility. For the current assessment, the assumption was made that the ash and
gypsum would be disposed of in a single facility.
Towards the middle of 2017 changes to the authorisation and licencing approach for the Medupi FGD Retrofit Project
applications were proposed in order to streamline the application processes to ensure compliance with the NEMAQA
compliance requirements by the year 2021. The changes that influence potential air emissions include the application for
activities associated with the construction and operation of the FGD system within the Medupi PS footprint and the railway
yard and siding, including limestone and gypsum handling facilities and diesel storage facilities new access roads. The impacts
from the construction activities were not assessed further as their impacts would be localised and of a temporary nature. The
impacts from the railway siding and handling operations as well as vehicle entrainment from the new access road would
contribute to the particulate matter. The diesel storage facility would contribute to volatile organic compounds. Impacts from
these activities, however, will be localised and will not exceed National Ambient Air Quality Standards offsite. These changes
were therefore not deemed significant and were thus not assessed further.
1.2.2 Regulatory Requirements and Assessment Criteria
In the evaluation of air emissions and ambient air quality impacts reference is made to National Ambient Air Quality Standards
(NAAQS) for compliance. These standards generally apply only to a number of common air pollutants, collectively known as
criteria pollutants. Criteria pollutants typically include SO2, NO2, carbon monoxide (CO), inhalable particulate matter (including
thoracic particulate matter with an aerodynamic diameter of equal to or less than 10 µm or PM10 and Inhalable particulate
matter with an aerodynamic diameter equal to or less than 2.5 µm or PM2.5), benzene, ozone and lead. For the proposed
Project, pollutants of concern included SO2, NO2, PM10 and PM2.5 (screened against NAAQS) and metals within the ash
deposition facility (screened against international health effect screening levels).
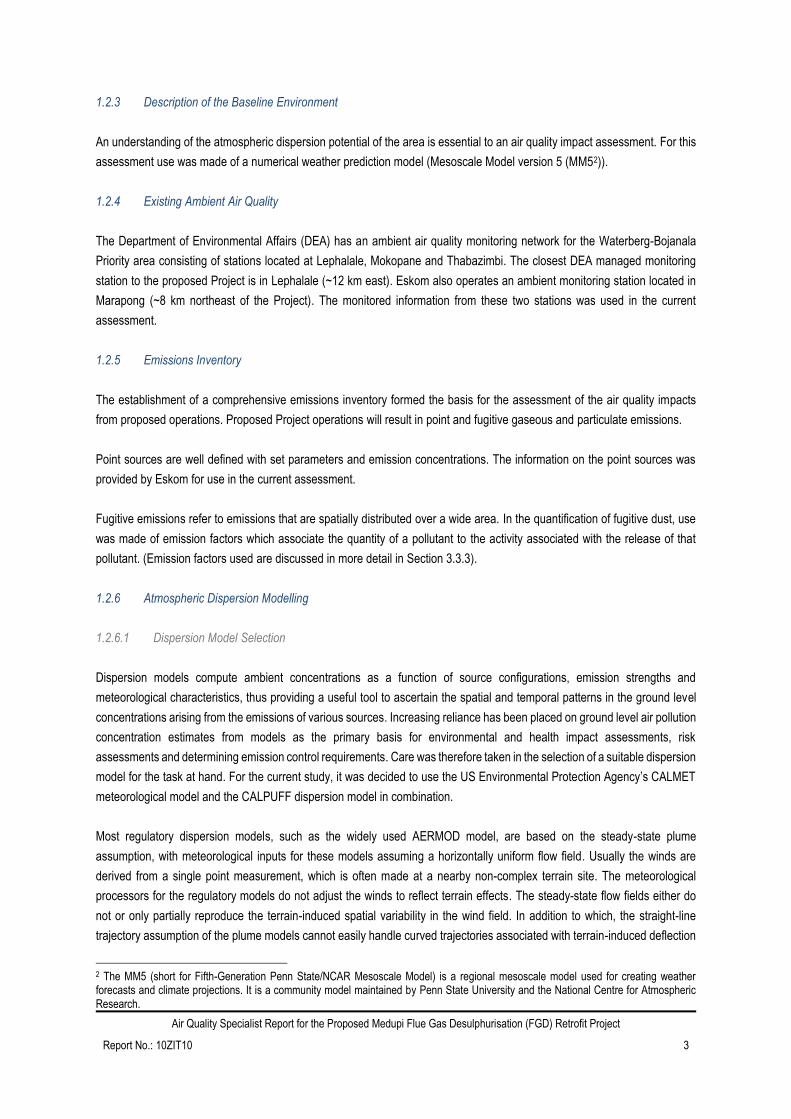
Air Quality Specialist Report for the Proposed Medupi Flue Gas Desulphurisation (FGD) Retrofit Project
Report No.: 10ZIT10 3
1.2.3 Description of the Baseline Environment
An understanding of the atmospheric dispersion potential of the area is essential to an air quality impact assessment. For this
assessment use was made of a numerical weather prediction model (Mesoscale Model version 5 (MM52)).
1.2.4 Existing Ambient Air Quality
The Department of Environmental Affairs (DEA) has an ambient air quality monitoring network for the Waterberg-Bojanala
Priority area consisting of stations located at Lephalale, Mokopane and Thabazimbi. The closest DEA managed monitoring
station to the proposed Project is in Lephalale (~12 km east). Eskom also operates an ambient monitoring station located in
Marapong (~8 km northeast of the Project). The monitored information from these two stations was used in the current
assessment.
1.2.5 Emissions Inventory
The establishment of a comprehensive emissions inventory formed the basis for the assessment of the air quality impacts
from proposed operations. Proposed Project operations will result in point and fugitive gaseous and particulate emissions.
Point sources are well defined with set parameters and emission concentrations. The information on the point sources was
provided by Eskom for use in the current assessment.
Fugitive emissions refer to emissions that are spatially distributed over a wide area. In the quantification of fugitive dust, use
was made of emission factors which associate the quantity of a pollutant to the activity associated with the release of that
pollutant. (Emission factors used are discussed in more detail in Section 3.3.3).
1.2.6 Atmospheric Dispersion Modelling
1.2.6.1 Dispersion Model Selection
Dispersion models compute ambient concentrations as a function of source configurations, emission strengths and
meteorological characteristics, thus providing a useful tool to ascertain the spatial and temporal patterns in the ground level
concentrations arising from the emissions of various sources. Increasing reliance has been placed on ground level air pollution
concentration estimates from models as the primary basis for environmental and health impact assessments, risk
assessments and determining emission control requirements. Care was therefore taken in the selection of a suitable dispersion
model for the task at hand. For the current study, it was decided to use the US Environmental Protection Agency’s CALMET
meteorological model and the CALPUFF dispersion model in combination.
Most regulatory dispersion models, such as the widely used AERMOD model, are based on the steady-state plume
assumption, with meteorological inputs for these models assuming a horizontally uniform flow field. Usually the winds are
derived from a single point measurement, which is often made at a nearby non-complex terrain site. The meteorological
processors for the regulatory models do not adjust the winds to reflect terrain effects. The steady-state flow fields either do
not or only partially reproduce the terrain-induced spatial variability in the wind field. In addition to which, the straight-line
trajectory assumption of the plume models cannot easily handle curved trajectories associated with terrain-induced deflection
2 The MM5 (short for Fifth-Generation Penn State/NCAR Mesoscale Model) is a regional mesoscale model used for creating weather forecasts and climate projections. It is a community model maintained by Penn State University and the National Centre for Atmospheric Research.

Air Quality Specialist Report for the Proposed Medupi Flue Gas Desulphurisation (FGD) Retrofit Project
Report No.: 10ZIT10 4
or channelling. These limitations of plume models can significantly affect the models ability to correctly represent the spatial
area of impact from sources in complex terrain, in addition to the magnitude of the peak values in certain instances.
CALPUFF is a regional Lagrangian Puff model intended for use on scales from tens of metres to hundreds of kilometres from
a source (US EPA 1998). A number of dispersion coefficients options are accommodated, including
• stability‐based empirical relationships such as the Pasquill‐Gifford or McElroy‐Pooler dispersion coefficients;
• turbulence‐based dispersion coefficients (based on measured standard deviations of the vertical and crosswind
horizontal components of the wind); and
• similarity theory to estimate the turbulent quantities using the micrometeorological variables calculated by CALMET.
The most desirable approach is to use turbulence‐based dispersion coefficients using measured turbulent velocity variances
or intensity components, if such data are readily available and they are of good quality. However, since reliable turbulent
measurements are generally not available, use can be made of the similarity approach.
CALPUFF also has the capability to model the effects of vertical wind shear by explicitly allowing different puffs to be
independently advected by their local average wind speed and direction, as well as by optionally allowing well‐mixed puffs to
split into two or more puffs when across-puff shear becomes important. Another option is to use a probability density function
(pdf) model to simulate vertical dispersion during convective conditions.
CALPUFF includes parameterized chemistry modules for the formation of secondary sulfate and nitrate from the oxidation of
the emitted primary pollutants, SO2 and NOx. The conversion processes are assumed to be linearly dependent (first‐order) on
the relevant primary species concentrations. Two options are included, namely the MESOPUFF II and RIVAD/ARM3 chemistry
options. In both options, a fairly simple stoichiometric thermodynamic model is used to estimate the partitioning of total
inorganic nitrate between gas‐phase nitric acid and particle‐phase ammonium nitrate. Ammonia and ozone concentrations
are required as background values to the model.
CALPUFF uses dry deposition velocities to calculate the dry deposition of gaseous and particulate pollutants to the surface.
These dry deposition velocities can either be user-specified or calculated internally in CALPUFF. A resistance‐based model
is used for the latter option. For gaseous pollutants, the resistances that are considered are the atmospheric resistance, the
deposition layer resistance, and the canopy resistance. For particles, a gravitational settling term is included and the canopy
resistance is assumed to be negligible. CALPUFF uses the scavenging coefficient approach to parameterize wet deposition
of gases and particles. The scavenging coefficient depends on pollutant characteristics (e.g., solubility and reactivity), as well
as the precipitation rate and type of precipitation. The model provides default values for the scavenging coefficient for various
species and two types of precipitation (liquid and frozen). These values may be overridden by the user.
The CALPUFF modelling system consists of a number of components, as summarised in Table 1-1. However only CALMET
and CALPUFF contain the simulation engines to calculate the three-dimensional atmospheric boundary layer conditions and
the dispersion and removal mechanisms of pollutants released into this boundary layer. The other codes are mainly used to
assist with the preparation of input and output data. Table 1-1 also includes the development versions of each of the codes
used in the investigation.

Air Quality Specialist Report for the Proposed Medupi Flue Gas Desulphurisation (FGD) Retrofit Project
Report No.: 10ZIT10 5
Table 1-1: Summary description of CALPUFF/CALMET model suite with versions used in the investigation
Module Version Description
CALMET v6.334 Three-dimensional, diagnostic meteorological model
CALPUFF v6.42
Non-steady-state Gaussian puff dispersion model with chemical removal, wet and dry
deposition, complex terrain algorithms, building downwash, plume fumigation and other
effects.
CALPOST V6.292 A post-processing program for the output fields of meteorological data, concentrations and
deposition fluxes.
CALSUM v1.4 (1) Sums and scales concentrations or wet/dry fluxes from two or more source groups from
different CALPUFF runs
PRTMET v 4.495(1) Lists selected meteorological data from CALMET and creates plot files
POSTUTIL v1.641(1)
Processes CALPUFF concentration and wet/dry flux files. Creates new species as weighted
combinations of modelled species; merges species from different runs into a single output
file; sums and scales results from different runs; repartitions nitric acid/nitrate based on total
available sulfate and ammonia.
TERREL v3.69(1) Combines dna grids terrain data
CTGPROC v3.5(1) processes and grids land use data
MAKEGEO v3.2(1) merges land use and terrain data to produce the geophysical data file for CALMET
Note (1): These modules indicate version number as listed on http://www.src.com/calpuff/download/mod6_codes.htm (for CALPro Plus v6)
[version number not given in GUI interface or ‘About’ information].
1.2.6.2 Atmospheric Dispersion Processes
CALPUFF initiates the simulation of point source plumes with a calculation of buoyant plume rise. Transport winds are
extracted from the meteorological data file at the location of the stack and at the effective plume height (stack height plus
plume rise). For near-field effects, the height of the plume in transition to the final plume height is taken into account. The puff
release rate is calculated internally, based on the transport speed and the distance to the closest receptor.
As the puff is transported downwind, it grows due to dispersion and wind shear, and the trajectory is determined by advection
winds at the puff location and height at each time step. The pollutant mass within each puff is initially a function of the emission
rate from the original source. The pollutant mass is also subject to chemical transformation, washout by rain and dry deposition,
when these options are selected, as is the case in this application. Chemical transformation and removal are calculated based
on a one-hour time step.
Both wet and dry deposition fluxes are calculated by CALPUFF, based on a full resistance model for dry deposition and the
use of precipitation rate-dependent scavenging coefficients for wet deposition. Pollutant mass is removed from the puff due
to deposition at each time step. For the present modelling analyses, most options were set at “default” values, including the
MESOPUFF II transformation scheme and the treatment of terrain.
Nitrogen Dioxide Formation
Of the several species of nitrogen oxides, only NO2 is specified in the NAAQS. Since most sources emit uncertain ratios of
these species and these ratios change further in the atmosphere due to chemical reactions, a method for determining the
amount of NO2 in the plume must be selected.
Estimation of this conversion normally follows a tiered approach, as discussed in the Regulations Regarding Air Dispersion
Modelling (Gazette No 37804 published 11 July 2014), which presents a scheme for annual averages:

Air Quality Specialist Report for the Proposed Medupi Flue Gas Desulphurisation (FGD) Retrofit Project
Report No.: 10ZIT10 6
• Tier 1: Total Conversion Method
Use any of the appropriate models recommended to estimate the maximum annual average NO2 concentrations by
assuming a total conversion of NO to NO2. If the maximum NOx concentrations are less than the NAAQS for NO2, then
no further refinement of the conversion factor is required. If the maximum NOx concentrations are greater than the NAAQS
for NO2, or if a more "realistic" estimate of NO2 is desired, proceed to the second tier level.
• Tier 2: Ambient Ratio Method (ARM) - Multiply NOx by a national ratio of NO2/NO. = 0.80
Assume a wide area quasi-equilibrium state and multiply the Tier 1 empirical estimate NOx by a ratio of NO2/NOx = 0.80.
The ratio is recommended for South Africa as the conservative ratio based on a review of ambient air quality monitoring
data from the country. If representative ambient NO and NO2 monitoring data is available (for at least one year of
monitoring), and the data is considered to represent a quasi-equilibrium condition3 where further significant changes of
the NO/NO2 ratio is not expected, then the NO/NO2 ratio based on the monitoring data can be applied to derive NO2 as
an alternative to the national ratio of 0.80 (as stipulated in the Regulations (Gazette No 37804 published 11 July 2014)).
In the Total Conversion Method, the emission rate of all NOx species is used in the dispersion model to predict ground-level
concentrations of total NOx. These levels of NOx are assumed to exist as 100% NO2, and are directly compared to the NAAQS
for NO2. If the NAAQS are met, the Tier 2 methods are not necessary.
Although not provided in the Regulations (Gazette No 37804 published 11 July 2014), the conversion of NO to NO2 may also
be based on the amount of ozone available within the volume of the plume. The NO2/NOx conversion ratio is therefore coupled
with the dispersion of the plume. This is known as the Ozone Limiting Method (OLM). Use of onsite ozone data is always
preferred for the OLM method.
The MESOPUFF II chemical transformation scheme, used in the current assessment, included in the CALPUFF model
accommodates NOx reactions, these are only considering the formation of nitrates and not the NO/NO2 reactions.
Given all of the above limitations, it was decided to employ the Ambient Ratio Method (ARM), i.e. the second version of the
DEA Tier 2 option. The ARM ambient ratio method is based upon the premise that the NO2/NOx ratio in a plume changes as
it is transported but attains an equilibrium value some distance away from the source (Scire and Borissova, 2011). In their
study, Scire and Borissova analysed hourly monitored NO2 and NOx data for 2006 at 325 monitoring sites throughout USA,
which amounted to approximately 2.8 million data points for each species. These observations were grouped into a number
of concentration ranges (bins), and the binned data were used to compute bin maximums and bin average curves. Short-term
(1-hr) NO2/NOx ratios were subsequently developed based on bin-maximum data. Similarly, long-term (annual average)
NO2/NOx ratios were based on bin-averaged data. The method was tested using the NO2/NOx ratios applied to the observed
NOx at selected stations to predict NO2, and then compared to observed NO2 concentrations at that station. The comparison
of NO2 derived from observed NOx using these empirical curves was shown to be a conservative estimate of observed NO2
(as obtained from measurements at Marapong), whilst at the same time arriving at a more realistic approximation than if simply
assuming a 100% conversion rate. More details of the adopted conversion factors are given in Appendix A.
3 A process is called a quasi-equilibrium process if the intermediate steps in the process are all close to equilibrium.

Air Quality Specialist Report for the Proposed Medupi Flue Gas Desulphurisation (FGD) Retrofit Project
Report No.: 10ZIT10 7
Particulate Formation
CALPUFF includes two chemical transformation schemes for the calculation of sulfate and nitrate formation from SO2 and
NOx emissions. These are the MESOPUFF II and the RIVAD / ARM3 chemical formulations. The chemical transformation
scheme chosen for this analysis was the MESOPUFF II scheme (as recommended via personal communication with Joe
Scire4). As described in the CALPUFF User Guide it is a “pseudo first-order chemical reaction mechanism” and involves five
pollutant species namely SO2, sulphates (SO4), NOx, nitric acid (HNO3) and particulate nitrate. CALPUFF calculates the rate
of transformation of SO2 to SO4, and the rate of transformation of NOx to NO3, based on environmental conditions including
the ozone concentration, atmospheric stability, solar radiation, relative humidity, and the plume NOx concentration. The
daytime reaction formulation depends on solar radiation and the transformation increases non-linearly with the solar radiation
(see the SO2 to SO4 transformation rate equation (equation 2-253 in the CALPUFF User Guide). At night, the transformation
rate defaults to a constant value of 0.2% per hour. Calculations based on these formulas show that the transformation rate
can reach about 3 per cent per hour at noon on a cloudless day with 100 ppb of ozone.
With the MESOPUFF-II mechanism, NOx transformation rates depend on the concentration levels of NOx and O3 (equations
2-254 and 2-255 in the CALPUFF User Guide) and both organic nitrates (RNO3) and HNO3 are formed. According to the
scheme, the formation of RNO3 is irreversible and is not subject to wet or dry deposition. The formation of HNO3, however, is
reversible and is a function of temperature and relative humidity. The formation of particulate nitrate is further determined
through the reaction of HNO3 and NH3. Background NH3 concentrations5 are therefore required as input to calculate the
equilibrium between HNO3 and particulate nitrate. At night, the NOx transformation rate defaults to a constant value of 2.0%
per hour. Hourly average ozone and ammonia concentrations were included as input in the CALPUFF model to facilitate these
sulfate and nitrate formation calculations.
The limitation of the CALPUFF model is that each puff is treated in isolation, i.e. any interaction between puffs from the same
or different points of emission is not accounted for in these transformation schemes. CALPUFF first assumes that ammonia
reacts preferentially with sulfate, and that there is always sufficient ammonia to react with the entire sulfate present within a
single puff. The CALPUFF model performs a calculation to determine how much NH3 remains after the particulate ammonium
sulfate has been formed and the balance would then be available for reaction with NO3 within the puff to form ammonium
nitrate. The formation of particulate nitrate is subsequently limited by the amount of available NH3. Although this may be
regarded as a limitation, in this application the particulate formation is considered as a group and not necessarily per species.
Ozone Formation
Similar to sulphate, nitrate and nitrogen dioxide, ozone (O3) is also formed through chemical reactions between pollutants
released into the atmosphere. As a secondary pollutant, O3 is formed in the lower part of the atmosphere, from complex
photochemical reactions following emissions of precursor gases such as NOx and VOCs (Seinfeld and Pandis, 1998). O3 is
produced during the oxidation of CO and hydrocarbons by hydroxyls (OH) in the presence of NOx and sunlight (Seinfeld and
Pandis, 1998). The rate of ozone production can therefore be limited by CO, VOCs or NOx. In densely populated regions with
high emissions of NOx and hydrocarbons, rapid O3 production can take place and result in a surface air pollution problem. In
these urban areas O3 formation is often VOC-limited. O3 is generally NOx-limited in rural areas and downwind suburban areas
(Seinfeld and Pandis, 1998).
4 Joe Scire is the primary developer of the CALMET/CALPUFF modelling suite. 5 Background NH3 information was obtained from the previous impacts assessment undertaken for the Medupi Power Station (Scorgie et al., 2006).

Air Quality Specialist Report for the Proposed Medupi Flue Gas Desulphurisation (FGD) Retrofit Project
Report No.: 10ZIT10 8
O3 concentration levels have the potential to become particularly high in areas where considerable O3 precursor emissions
combine with stagnant wind conditions during the summer, when high insolation and temperatures occur (Seinfeld and Pandis,
1998). The effects of sunlight on O3 formation depend on its intensity and its spectral distribution.
In general, the main sectors that emit ozone precursors are road transport, power and heat generation plants, household
(heating), industry, and petrol storage and distribution. In many urban areas, O3 nonattainment is not caused by emissions
from the local area alone (Seinfeld and Pandis, 1998). Due to atmospheric transport, contributions of precursors from the
surrounding region can also be important. The transport of O3 is determined by meteorological and chemical processes which
typically extend over spatial scales of several hundred kilometres. Thus, in an attempt to study O3 concentrations in a local
area, it is necessary to include regional emissions and transport. This requires a significantly larger study domain with the
inclusion of a significantly more comprehensive emissions inventory of NOx and VOCs sources (e.g. vehicle emissions). Such
a study was not within the scope of this report.
For the current assessment, onsite O3 data from the Marapong monitoring station was used.
1.2.6.3 Model Input
Modelling Domain
A modelling domain of 50 km (east-west) x 50 km (north-south) with a regular Cartesian receptor grid resolution of 200 m by
200 m was selected for the current assessment. The meteorology (based on MM5 data at 4 km resolution) was modelled for
the entire area covering 50 km (east-west) x 50 km (north-south) with a resolution of 1000 m by 1000 m.
Meteorological inputs
CALMET was used to simulate the meteorological field within the study area, including the spatial variations – both in the
horizontal and in the vertical - and temporal variations in the wind field and atmospheric stability. The initial guess field required
by CALMET was informed by MM5-prognostic model data for surface and upper air profiles for the period 2011-2013.
Source Data Requirements
A three dimensional meteorological data set for the region was output by the CALMET model for application in the CALPUFF
model. This data set provides spatial (horizontal and vertical) and temporal variations in the parameters required for modelling
the dispersion and removal of pollutants, including: vertical wind speed, wind direction, temperature, mixing depths,
atmospheric stability, (etc.). Meteorological parameters were projected at various heights above the ground, viz.: 20 m, 40 m,
80 m, 160 m, 300 m, 600 m, 1000 m, 1500 m, 2200 m and 3000 m. In projecting vertical changes in the wind field, temperature,
etc. it was possible to accurately parameterize the atmospheric conditions characteristic of within valley layers, transitional
layers and atmospheric layers located above the terrain.
1.3 Assumptions, Exclusions and Limitations
In interpreting the study findings it is important to note the limitations and assumptions on which the assessment was based.
The most important limitations of the air quality impact assessment are as follows:
• Emissions emanating from all existing sources in the area were not quantified nor were resultant ambient air pollutant
concentrations due to such sources simulated, with the exception of the existing Matimba Power Station and its

Air Quality Specialist Report for the Proposed Medupi Flue Gas Desulphurisation (FGD) Retrofit Project
Report No.: 10ZIT10 9
associated ashing operations. Given that Matimba Power Station is currently the most significant source of ambient
SO2 concentrations in the region, this study limitation is not significant for assessing compliance and health risk
potentials due to SO2. Matimba Power Station is, however, not the major contributor to ambient fine particulate
concentrations (Scorgie et al, 2006). In order to project cumulative particulate concentrations other significant
sources, particularly local mining operation emissions, would need to be quantified.
• Routine emissions from power station operations were estimated and modelled. Atmospheric releases occurring as
a result of incidences that would result in shutdown, maintenance or change in routine emissions from the power
station was not accounted for.
• For the current assessment, the assumption was made that the ash and gypsum would be disposed together in the
same facility, until there is an opportunity in the market for alternative use of gypsum. The gypsum material mixed
with the ash for disposal at the existing facility is expected to provide a crust when mixed with water. To what extent
this material will crust will depend on how the material is disposed (i.e. mixed with the ash or deposited as layers of
gypsum material in between the ash material) and how much water is added to the disposal facility. The crust may
also be disturbed from time to time with activity on the disposal facility. For the current assessment, the effectiveness
of this crust in lowering windblown emissions could not be quantified.
• MM5 was used as the “initial guess” field for the CALMET model. Although two monitoring stations are located within
the study area, MM5 could not be used together with the surface measurements as the Eskom-operated Marapong
station is sited incorrectly providing questionable wind direction and, with one representative station (South African
Weather Service Station located at Lephalale), CALMET requires 100% data availability which was not present.
• The modelling guidelines stipulate that three years of off-site meteorological data should be used from a period no
older than five years to the year of assessment. As the onset of the Air Quality Assessment was in 2014,
meteorological data for the period 2011 – 2013 was used. Presently two of the three years falls outside of the last
five-year period. This limitation is not found to be significant, however, as the meteorological conditions within the
study area have not shown any significant historical changes.
The most important assumptions made during the air quality impact assessment are as follows:
• Source parameters and emission rates for these emission scenarios required for input to the dispersion modelling
study were provided by Eskom personnel. The assumption was made that this information was accurate and correct.
• A constant NH3 background concentration of 20 ppb was used in Calpuff (Scorgie et al, 2006). Measured ozone
data from the Marapong station was included for the background data required for the chemical transformation
module in Calpuff6.
1.4 Outline of Report
Minimum Emission Standards and National Ambient Air Quality Standards applicable to power station operations and their
ancillary infrastructure are presented in Section 2. The synoptic climatology and atmospheric dispersion potential of the area
as well as information on existing sources and baseline air quality are discussed in Section 3. Section 4 presents the impact
assessment of the proposed Project. Conclusions are presented in Section 5.
6 Measured NH3 concentrations within the study area are only available from the Marapong monitoring station.
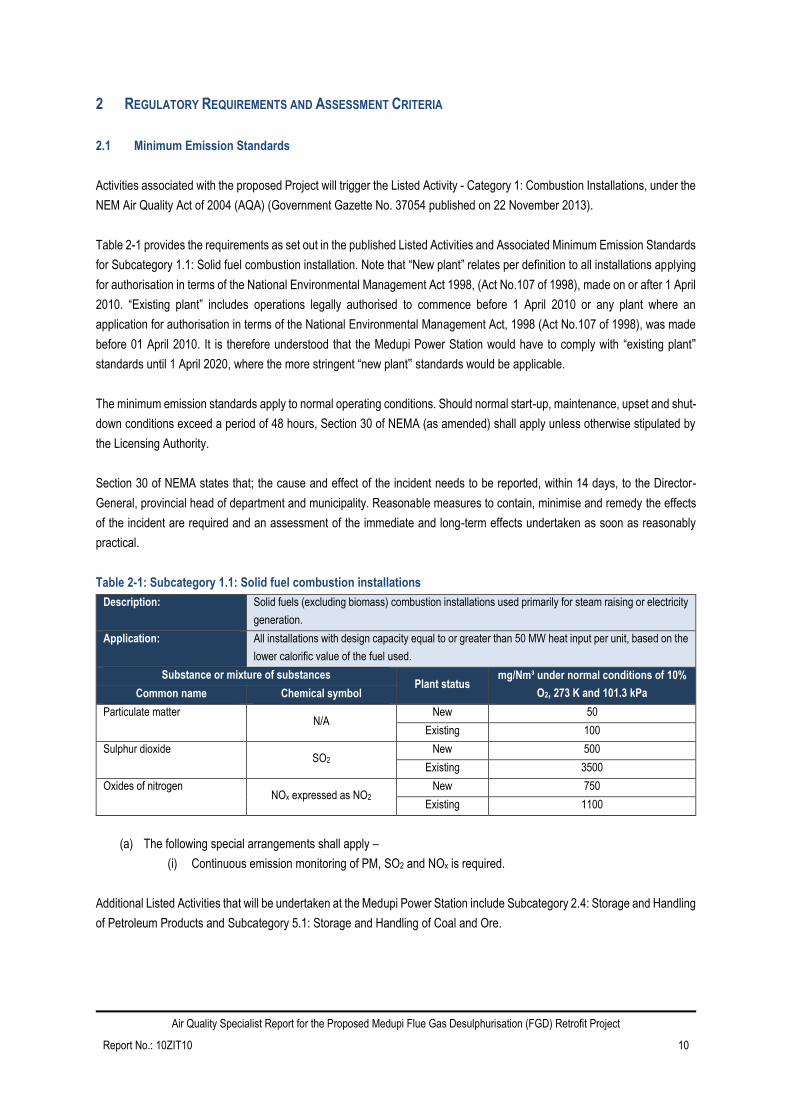
Air Quality Specialist Report for the Proposed Medupi Flue Gas Desulphurisation (FGD) Retrofit Project
Report No.: 10ZIT10 10
2 REGULATORY REQUIREMENTS AND ASSESSMENT CRITERIA
2.1 Minimum Emission Standards
Activities associated with the proposed Project will trigger the Listed Activity - Category 1: Combustion Installations, under the
NEM Air Quality Act of 2004 (AQA) (Government Gazette No. 37054 published on 22 November 2013).
Table 2-1 provides the requirements as set out in the published Listed Activities and Associated Minimum Emission Standards
for Subcategory 1.1: Solid fuel combustion installation. Note that “New plant” relates per definition to all installations applying
for authorisation in terms of the National Environmental Management Act 1998, (Act No.107 of 1998), made on or after 1 April
2010. “Existing plant” includes operations legally authorised to commence before 1 April 2010 or any plant where an
application for authorisation in terms of the National Environmental Management Act, 1998 (Act No.107 of 1998), was made
before 01 April 2010. It is therefore understood that the Medupi Power Station would have to comply with “existing plant‟
standards until 1 April 2020, where the more stringent “new plant‟ standards would be applicable.
The minimum emission standards apply to normal operating conditions. Should normal start-up, maintenance, upset and shut-
down conditions exceed a period of 48 hours, Section 30 of NEMA (as amended) shall apply unless otherwise stipulated by
the Licensing Authority.
Section 30 of NEMA states that; the cause and effect of the incident needs to be reported, within 14 days, to the Director-
General, provincial head of department and municipality. Reasonable measures to contain, minimise and remedy the effects
of the incident are required and an assessment of the immediate and long-term effects undertaken as soon as reasonably
practical.
Table 2-1: Subcategory 1.1: Solid fuel combustion installations
Description: Solid fuels (excluding biomass) combustion installations used primarily for steam raising or electricity
generation.
Application: All installations with design capacity equal to or greater than 50 MW heat input per unit, based on the
lower calorific value of the fuel used.
Substance or mixture of substances Plant status
mg/Nm³ under normal conditions of 10%
O2, 273 K and 101.3 kPa Common name Chemical symbol
Particulate matter N/A
New 50
Existing 100
Sulphur dioxide SO2
New 500
Existing 3500
Oxides of nitrogen NOx expressed as NO2
New 750
Existing 1100
(a) The following special arrangements shall apply –
(i) Continuous emission monitoring of PM, SO2 and NOx is required.
Additional Listed Activities that will be undertaken at the Medupi Power Station include Subcategory 2.4: Storage and Handling
of Petroleum Products and Subcategory 5.1: Storage and Handling of Coal and Ore.

Air Quality Specialist Report for the Proposed Medupi Flue Gas Desulphurisation (FGD) Retrofit Project
Report No.: 10ZIT10 11
2.2 National Ambient Air Quality Standards for Criteria Pollutants
The air quality guidelines and standards are fundamental to effective air quality management, providing the link between the
source of atmospheric emissions and the user of that air at the downstream receptor site. The ambient air quality standards
are intended to provide safe hourly, daily and annual exposure levels for the majority of the population, including the very
young and the elderly, throughout an individual’s lifetime.
The South African Bureau of Standards (SABS) was engaged to assist the Department of Environmental Affairs (DEA) in the
facilitation of the development of ambient air quality standards. This included the establishment of a technical committee to
oversee the development of standards. National Ambient Air Quality Standards (NAAQS) were determined based on
international best practice for PM2.5, PM10, SO2, NO2, carbon monoxide (CO), ozone (O3), lead (Pb) and benzene (C6H6) (Table
2-2).
Table 2-2: National Ambient Air Quality Standards
Pollutant Averaging
Period
Concentration
(µg/m³)
Permitted
Frequency of
Exceedance
Compliance Date
Benzene (C6H6) 1 year 5 0 1 January 2015
Carbon Monoxide
(CO)
1 hour 30000 88 Immediate
8 hour(a) 10000 11 Immediate
Lead (Pb) 1 year 0.5 0 Immediate
Nitrogen Dioxide
(NO2)
1 hour 200 88 Immediate
1 year 40 0 Immediate
Ozone (O3) 8 hour(b) 120 11 Immediate
PM2.5
24 hour 65 4 Immediate till 31 December 2015
24 hour 40 4 1 January 2016 till 31 December 2029
24 hour 25 4 1 January 2030
1 year 25 0 Immediate till 31 December 2015
1 year 20 0 1 January 2016 till 31 December 2029
1 year 15 0 1 January 2030
PM10 24 hour 75 4 1 January 2015
1 year 40 0 1 January 2015
Sulfur Dioxide (SO2)
10 minutes 500 526 Immediate
1 hour 350 88 Immediate
24 hour 125 4 Immediate
1 year 50 0 Immediate
Notes: (a) Calculated on 1 hour averages. (b) Running average.

Air Quality Specialist Report for the Proposed Medupi Flue Gas Desulphurisation (FGD) Retrofit Project
Report No.: 10ZIT10 12
2.3 Code of Practice for Air Dispersion Modelling in Air Quality Management in South Africa, 2014
Air dispersion modelling provides a cost-effective means for assessing the impact of air emission sources, the major focus of
which is to determine compliance with the relevant ambient air quality standards. Regulations Regarding Air Dispersion
Modelling was published in Government Gazette No. 37804 (11 July 2014), and recommends a suite of dispersion models to
be applied for regulatory practices as well as guidance on modelling input requirements, protocols and procedures to be
followed. This code of practice was followed in the current assessment.
2.4 Waterberg-Bojanala Priority Area
The Medupi Power Station falls within the Waterberg-Bojanala Priority Area (Figure 2-1). Under the National Environmental
Management: Air Quality Act (Act No. 39 of 2004), airshed priority areas can be declared where there is concern of elevated
atmospheric pollutant concentrations within the area. The DEA identified the potential of an airshed priority area in the vicinity
of the Waterberg District Municipality (Government Gazette, Number 33600; 8 October 2010). This was later expanded to
include the Bojanala Platinum District Municipality, North-West Province (Government Gazette, Number 34631; 30 September
2011) and the Waterberg-Bojanala Priority Area (WBPA) was officially declared on 15th June 2012 (Government Gazette,
Number 35435).
Figure 2-1: Location of the Medupi Power Station within the Waterberg-Bojanala Priority Area (Scott, 2012)

Air Quality Specialist Report for the Proposed Medupi Flue Gas Desulphurisation (FGD) Retrofit Project
Report No.: 10ZIT10 13
The Waterberg-Bojanala Priority Area Air Quality Management Plan: Baseline Characterisation was released for public
comment on the 7th August 2014 (SAAQIS, 2014, access date: 2014-08-21). The Baseline Characterisation of the WBPA
reported that power generation activities contribute 95% of SO2, 93% of NO2 and 68% of the particulate emissions across the
Waterberg District Municipality.

Air Quality Specialist Report for the Proposed Medupi Flue Gas Desulphurisation (FGD) Retrofit Project
Report No.: 10ZIT10 14
3 DESCRIPTION OF THE RECEIVING/BASELINE ENVIRONMENT
3.1 Air Quality Sensitive Receptors
Given that the Project will be associated with low level emissions (e.g. from ashing operations) and elevated emissions (power
station stacks), the proposed Project has the potential of impacting on receptors in the near and medium fields7.
Residential areas in the vicinity of the proposed operations include Marapong northeast of the existing Matimba Power Station,
a residential settlement to the northwest of Matimba Power Station and Lephalale situated to the southeast and east of the
existing power station respectively. Farm households are scattered through the area, with livestock farming (primarily cattle
and game) representing the main agricultural land-use in the area. The closest schools, hospitals and clinics included in the
study area are indicated in Figure 3-1.
Figure 3-1: Location of sensitive receptors in the vicinity of the Medupi Power Station
3.2 Atmospheric Dispersion Potential
In the assessment of the possible impacts from air pollutants on the surrounding environment and human health, a good
understanding of the regional climate and local air dispersion potential of a site is essential. Meteorological characteristics of
a site govern the dispersion, transformation and eventual removal of pollutants from the atmosphere (Pasquill and Smith,
1983; Godish, 1990). The extent to which pollution will accumulate or disperse in the atmosphere is dependent on the degree
of thermal and mechanical turbulence within the earth’s boundary layer as well as advection.
Dispersion comprises vertical and horizontal components of motion. The vertical component is defined by the stability of the
atmosphere and the depth of the surface mixing layer. The horizontal dispersion of pollution in the boundary layer is primarily
a function of the wind field. The wind speed determines both the distance of downwind transport and the rate of dilution as a
7 Near field would constitute as a distance of 0 km to 1 km from the operations and medium field as 1 km to 20 km from operations.

Air Quality Specialist Report for the Proposed Medupi Flue Gas Desulphurisation (FGD) Retrofit Project
Report No.: 10ZIT10 15
result of plume ‘stretching’. The generation of mechanical turbulence is similarly a function of the wind speed, in combination
with the surface roughness.
The wind direction and its variability, determine the general path pollutants will follow, and the extent of cross-wind spreading
(Shaw and Munn, 1971; Pasquill and Smith, 1983; Oke, 1990).
Pollution concentration levels fluctuate in response to changes in atmospheric stability, to concurrent variations in the mixing
depth, and to shifts in the wind field. Spatial variations, and diurnal and seasonal changes, in the wind field and stability regime
are functions of atmospheric processes operating at various temporal and spatial scales (Goldreich and Tyson, 1988).
Atmospheric processes at macro- and meso-scales need therefore be taken into account in order to understand the
atmospheric dispersion potential of a particular area.
3.2.1 Surface Wind Field
In characterising the dispersion potential of the site, reference was made to calculated MM5 meteorological data (extracted at
the Medupi Power Station site) for the period 2011-2013.
Period, day- and night-time wind roses for the study area are illustrated in Figure 3-2.
Figure 3-2: Period, day- and night-time wind roses for the period 2011-2013

Air Quality Specialist Report for the Proposed Medupi Flue Gas Desulphurisation (FGD) Retrofit Project
Report No.: 10ZIT10 16
Wind roses represent wind frequencies for the 16 cardinal wind directions. Wind frequencies are indicated by the length of the
shaft when compared to the circles drawn to represent frequency of occurrence. Wind speed classes are assigned to illustrate
the frequencies of high and low wind for each wind vector. The frequency of calm periods, defined as periods for which wind
speeds are below 1 m/s, are indicated below the wind rose.
The flow field is dominated by north-easterly winds. Winds are infrequently experienced from the westerly and southerly
sectors. The wind speeds are generally low (1-3 m/s) to moderate (3-5 m/s) throughout the period.
3.2.2 Temperature
A summary of the monthly diurnal temperature averages of the Medupi Power Station site (as extracted from MM5 data) is
provided in Figure 3-3.
Figure 3-3: Monthly diurnal temperature averages for the Medupi Power Station Site (as extracted from MM5 data)
3.2.3 Atmospheric Stability
The vertical component of dispersion is a function of the extent of thermal turbulence and the depth of the surface mixing
layer. Unfortunately, the mixing layer is not easily measured, and must therefore often be estimated using prognostic models
that derive the depth from some of the other parameters that are routinely measured, e.g. solar radiation and temperature.
During the daytime, the atmospheric boundary layer is characterised by thermal turbulence due to the heating of the earth’s
surface and the extension of the mixing layer to the lowest elevated inversion. Radiative flux divergence during the night
usually results in the establishment of ground based inversions.
Atmospheric stability is frequently categorised into one of six stability classes. These are briefly described in Table 3-1.

Air Quality Specialist Report for the Proposed Medupi Flue Gas Desulphurisation (FGD) Retrofit Project
Report No.: 10ZIT10 17
Table 3-1: Atmospheric Stability Classes
A very unstable calm wind, clear skies, hot daytime conditions
B moderately unstable clear skies, daytime conditions
C unstable moderate wind, slightly overcast daytime conditions
D neutral high winds or cloudy days and nights
E stable moderate wind, slightly overcast night-time conditions
F very stable low winds, clear skies, cold night-time conditions
The atmospheric boundary layer is normally unstable during the day as a result of the turbulence due to the sun's heating
effect on the earth's surface. The thickness of this mixing layer depends predominantly on the extent of solar radiation, growing
gradually from sunrise to reach a maximum at about 5-6 hours after sunrise. This situation is more pronounced during the
winter months due to strong night-time inversions and a slower developing mixing layer. During the night a stable layer, with
limited vertical mixing, exists. During windy and/or cloudy conditions, the atmosphere is normally neutral.
3.3 Status Quo Ambient Air Quality
3.3.1 Atmospheric Emissions
Source types present in the area and the pollutants associated with such source types are noted with the aim of identifying
pollutants that may be of importance in terms of cumulative impact potentials.
Existing sources of atmospheric emissions which occur in the vicinity of the proposed development sites include:
• Matimba Power Station and its associated ash dump;
• Coal mining operations;
• Brickworks operating at Hanglip;
• Household fuel combustion;
• Potential veld fires (infrequent);
• Sewage works (Farm Nelsonskop);
• Windblown dust from open areas and agricultural activities;
• Vehicle exhaust releases and road dust entrainment along paved and unpaved roads in the area.
Emissions from the Matimba Power Station are simulated together with the Medupi Power Station in order to determine
resultant cumulative concentrations of key pollutants such as SO2 and NO2.
3.3.1.1 Matimba Power Station
The existing Matimba Power Station is a dry-cooled, coal-fired pulverised fuel power station comprising six 665 MW units,
representing a total nominal capacity of 3990 MW and a total net maximum capacity of 3690 MW.
Air pollutants released by coal-fired power stations primarily include particulates, SO2, NOx, carbon monoxide, carbon dioxide
(CO2), nitrous oxide (N2O), and trace amounts of mercury. CO2 and N2O represent greenhouse gases (i.e. gases associated

Air Quality Specialist Report for the Proposed Medupi Flue Gas Desulphurisation (FGD) Retrofit Project
Report No.: 10ZIT10 18
with global warming) and are therefore of concern despite not resulting in direct health effects. Air pollutants associated with
health effects include SO2, NOx (primarily as NO2) and particulates. South African coals have relatively high ash contents and
therefore hold the potential for releasing significant particulate emissions. Eskom however currently implements highly
effective particulate abatement technology which reduces its particulate emission concentrations substantially. No SO2 or NO2
abatement measures are currently in place at the existing Matimba Power Station.
3.3.1.2 Coal Mining Operations
Open-cast coal mining operations, such as that undertaken at Grootgeluk, are frequently significant sources of fugitive dust
emissions, particularly if poorly controlled. Sources of fugitive dust include operations such as drilling, blasting, dragline and/or
truck and shovel activities, in addition to vehicle entrainment and materials handling operations. Depending on the type of
explosives used, blasting operations are also associated with gaseous emissions, e.g. nitrogen oxides, carbon monoxide and
smaller quantities of sulphur dioxide. Gaseous and particulate emissions may also occur as a result of spontaneous
combustion of coal discards and dumps.
3.3.1.3 Sewage Works
Volatile organic compounds (VOCs) emissions are associated with wastewater treatment works. Species measured at local
works have included: hydrogen sulphide, mercaptans, ammonia, formaldehyde, acetone, toluene, ethyl benzene, xylenes,
perchloroethylene (tetrachloroethylene), butyric acid, propionic acid, valeric acid and acetic acid. Species that represent the
most important odorants included: hydrogen sulphide, mercaptans, ammonia, and various fatty acids (butyric, propionic,
valeric and acetic).
3.3.1.4 Household Fuel Burning
Within the Waterberg District Municipality, 92% and 95% of cooking and space heating respectively in rural areas is undertaken
by means of wood and paraffin as an energy source (StatsSA, 2011).
Domestic coal burning emits a large amount of gaseous and particulate pollutants including sulphur dioxide, heavy metals,
total and respirable particulates including heavy metals and inorganic ash, carbon monoxide, polycyclic aromatic
hydrocarbons, and benzo(a)pyrene. Polyaromatic hydrocarbons are recognised as carcinogens. Pollutants arising due to the
combustion of wood include respirable particulates, nitrogen dioxide, carbon monoxide, polycyclic aromatic hydrocarbons,
particulate benzo(a)pyrene and formaldehyde. Particulate emissions from wood burning within South Africa have been found
to contain about 50% elemental carbon and about 50% condensed hydrocarbons (Terblanche et al., 1992). The main
pollutants emitted from the combustion of paraffin are NO2, particulates, carbon monoxide and polycyclic aromatic
hydrocarbons.
3.3.1.5 Veld Burning
Biomass burning is an incomplete combustion process with carbon monoxide, methane and nitrogen dioxide being emitted
during the process. About 40% of the nitrogen in biomass is emitted as nitrogen, 10% remains in the ashes and it is assumed
that 20% of the nitrogen is emitted as higher molecular weight nitrogen compounds. Unlike N species, only small amount of
sulphur dioxide and sulphate aerosols are emitted. The visibility of smoke plumes from vegetation fires is due to their aerosol
content (Helas and Pienaar, 1996).

Air Quality Specialist Report for the Proposed Medupi Flue Gas Desulphurisation (FGD) Retrofit Project
Report No.: 10ZIT10 19
The extent of emissions from veld burning is dependent on the quantity of material (biomass) available for combustion. The
quantity of dry, combustible matter per unit area is on average 4.5 ton per hectare for savannah areas.
Crop-residue burning and general wild fires (veld fires) represent significant sources of combustion-related emissions
associated with agricultural areas. Given that livestock agriculture prevails in the Lephalale area, it is anticipated that general
wild fires are likely to be more important than controlled burning related to agricultural activities. Fires are however reported
to occur relatively infrequently in the area (Scorgie et al, 2006).
3.3.1.6 Vehicle Exhaust Emissions
Air pollution from vehicle emissions may be grouped into primary and secondary pollutants. Primary pollutants are those
emitted directly into the atmosphere, and secondary, those pollutants formed in the atmosphere as a result of chemical
reactions, such as hydrolysis, oxidation, or photochemical reactions. The significant primary pollutants emitted by motor
vehicles include CO2, CO, hydrocarbons (HCs), SO2, NOx, particulates and lead. Secondary pollutants include: NO2,
photochemical oxidants (e.g. ozone), HCs, sulphur acid, sulphates, nitric acid, sulphates, nitric acid and nitrate aerosols. Toxic
hydrocarbons emitted include benzene, 1.2-butadiene, aldehydes and polycyclic aromatic hydrocarbons (PAH). Benzene
represents an aromatic HC present in petrol, with 85% to 90% of benzene emissions emanating from the exhaust and the
remainder from evaporative losses.
3.3.1.7 Fugitive Dust Emissions
Fugitive dust emissions may occur as a result of vehicle entrainment of dust from local paved and unpaved roads, wind erosion
from open areas and dust generated by agricultural activities (e.g. tilling). The extent, nature and duration of agricultural
activities, the moisture and silt content of soils and the extent of open areas is required to be known in order to quantify fugitive
emissions from this source. The quantity of windblown dust is similarly a function of the wind speed, the extent of exposed
areas and the moisture and silt content of such areas.
3.3.1.8 Brickworks operating at Hanglip
Hendrik Pieterse, the owner of the farm Hanglip, runs the existing brickworks in the vicinity of the Medupi Power Station. The
brickworks manufactures approximately 2 million bricks per month, fired by using veld ovens (clamp kilns). Firing by clamp is
one of the oldest methods of brickmaking. Despite no longer being used in most parts of the world – having been replaced by
coal- and gas-fired kiln operations – firing by clamp is still fairly widely used in South Africa.
The manufacturing of bricks involve quarry operations, crushing, screening, blending of raw materials, and the forming of,
cutting or shaping, drying or curing, and firing of the final product. Emissions from brick manufacturing facilities (EPA 1997)
include particulate matter (PM10 and PM2.5), SO2, sulphur trioxide (SO3), NOx, CO, CO2, total organic compounds (TOC)
(including methane, ethane, VOC and some hazardous air pollutants (HAP), hydrochloric acid and fluoride compounds). Other
factors that may influence emissions are raw material composition and moisture content as well as firing parameters and fuel
type.
The primary sources of particulate matter are material handling (grinding, drying, screening and storing), fuel handling and
fugitive dust sources such as paved roads, unpaved roads and storage piles. The combustion products (SO2, NOx, CO, CO2)
are emitted from fuel combustion during firing. The main source of SO2 emissions is the raw materials that sometimes contain
sulphur compounds. The organic compounds (methane, ethane, VOC and HAP) are emitted from the firing and drying

Air Quality Specialist Report for the Proposed Medupi Flue Gas Desulphurisation (FGD) Retrofit Project
Report No.: 10ZIT10 20
processes. Hydrogen fluoride (HF) is emitted as a result of the fluorine compounds contained in the raw materials (where
applicable).
3.3.1.9 Trans-Boundary Transportation of Air Masses over Southern Africa
The two main transport modes of air masses consist of direct transport, in which air masses are advected directly from the
subcontinent to the oceans beyond, and re-circulated transport, in which air masses re-circulates to the point of origin (Tyson
et al., 1996a, Tyson et al., 1996c) (Figure 3-4). Direct transport is made up of the four cardinal compass directions, viz.
westerly, easterly, northerly and southerly. Westerly transport (within the Natal Plume) is influenced by the westerly waves
(Fishman, 1991; Pickering et al., 1994; Krishnamurti et al., 1993; Benkovitz et al., 1994; Tyson et al., 1996a, Tyson et al.,
1996b) moving air from the highveld to the Indian Ocean at north-to-central Kwa-Zulu Natal or southern Mozambique (Tyson
et al., 1996a). Air transported in the Natal Plume takes place at high levels of ~525 hPa (Tyson et al., 1996a). Easterly
transport takes place by means of easterly waves to move air masses to the Atlantic Ocean. Air masses that move towards
the Atlantic Ocean are transported in the Angolan Plume at low levels due to the subsidence over the western subcontinent
and South Atlantic Ocean. Northerly and southerly transport moves air masses to equatorial Africa and to the South Indian
Ocean respectively (Tyson et al., 1996a).
Figure 3-4: Schematic representation of major low-level transport trajectory models likely to result easterly or
westerly exiting of material from southern African or in recirculation over the subcontinent (Tyson et al, 1996c)

Air Quality Specialist Report for the Proposed Medupi Flue Gas Desulphurisation (FGD) Retrofit Project
Report No.: 10ZIT10 21
Re-circulated transport is confined to levels of less than 200 hPa and is mainly anticyclonic (Tyson et al., 1996a). Local and
regional recirculation extends over the highveld and surrounding neighbouring countries, such as Mozambique, Zimbabwe
and Botswana (Tyson et al., 1996a; Tyson and Gatebe, 2001). Analysis of trajectory fields undertaken by Tyson et al. (1996c)
has revealed that air masses emanating from a particular point of origin follow anticyclonic curving streams with radii of 500 –
700 km. The recirculation vortex is evident from the surface to the persistent stable layer of 500 hPa. Above 500 hPa, due
to the influence of the circumpolar westerlies, recirculation diminishes rapidly and transport patterns become more zonal.
Local and sub-continental re-circulation over the interior makes up for ~44% of total air mass transportation (Tyson et al.,
1996c; Tyson and Gatebe, 2001) with a recirculation time frame of 2-9 days (Tyson et al., 1996a). Up to a quarter of re-
circulated air masses are observed to re-circulate a second time (Tyson et al., 1996c). Thus, the greatest impact of pollutants
on neighbouring countries is under re-circulating air and prolonged residence time (Tyson et al., 1996a).
More than 75% of all air circulating over the southern African continent exits to the Indian Ocean, either by direct or re-
circulated transportation (Tyson and Gatebe, 2001).
3.3.2 Measured Ambient Air Pollutant Concentrations
3.3.2.1 Monitoring Stations Operated by the Department of Environmental Affairs
The DEA has ambient monitors to measure the ambient air quality in the Waterberg area. These ambient monitoring stations
are located at Lephalale, Mokopane and Thabazimbi. The closest DEA monitoring station, with sufficient data, to the proposed
Project is in Lephalale (~12 km east). The measured NO2, PM10, PM2.5 and SO2 short-term ground level concentrations from
the Lephalale monitoring station for the period January 2013 to November 2014 are provided in Figure 3-5 to Figure 3-9 (as
obtained from SAAQIS, 2014). A summary of the data availability and compliance with NAAQS is provided in Table 3-2.
Figure 3-5: Hourly NO2 measured at the Lephalale monitoring station for the period January 2013 to November 2014

Air Quality Specialist Report for the Proposed Medupi Flue Gas Desulphurisation (FGD) Retrofit Project
Report No.: 10ZIT10 22
Figure 3-6: Daily PM10 measured at the Lephalale monitoring station for the period January 2013 to November 2014
Figure 3-7: Daily PM2.5 measured at the Lephalale monitoring station for the period January 2013 to November 2014

Air Quality Specialist Report for the Proposed Medupi Flue Gas Desulphurisation (FGD) Retrofit Project
Report No.: 10ZIT10 23
Figure 3-8: Hourly SO2 measured at the Lephalale monitoring station for the period January 2013 to November 2014
Figure 3-9: Daily SO2 measured at the Lephalale monitoring station for the period January 2013 to November 2014

Air Quality Specialist Report for the Proposed Medupi Flue Gas Desulphurisation (FGD) Retrofit Project
Report No.: 10ZIT10 24
Table 3-2: Summary of the data availability and compliance with NAAQS for the ambient data measured at Lephalale
Pollutant Monitoring
Period
Data
Availability (%)
Frequency of
Exceedance of
Hourly NAAQ
Limit
Frequency of
Exceedence
of Daily
NAAQ Limit
Annual
Average
Ground Level
Concentrations
(µg/m³)
Within
Compliance
with NAAQS
(Y/N)
SO2 2013 93 0 0 7 Y
2014 96 2 0 6 Y
NO2 2013 93 0 14 Y
2014 98 2 13 Y
PM10 2013 93 NA 4 32 Y
2014 98 NA 0 23 Y
PM2.5
2013 93
NA 0 (a)
14
Y
NA 4 (b) Y
NA 40 (c) N
2014 98
NA 0 (a)
12
Y
NA 1 (b) Y
NA 17 (c) N
NA: Not applicable
(a) Applicable immediately till 31 December 2015
(b) Applicable from 1 January 2016 till 31 December 2029
(c) Applicable from 1 January 2030
The measured SO2, NO2 and PM10 concentrations are within NAAQS at Lephalale for the period January 2013 to November
2014. The PM2.5 concentrations measured at Lephalale are within the NAAQS applicable till 2029 but exceed the more
stringent NAAQS applicable in 2030.
3.3.2.2 Monitoring Station Operated by Eskom
Eskom manages an ambient monitoring station located at Marapong. The measured NO2, PM10, PM2.5 and SO2 short-term
ground level concentrations from the Marapong monitoring station for the period January 2013 to November 2014 are provided
in Figure 3-10 to Figure 3-14. A summary of the data availability and compliance with NAAQS is provided in Table 3-3.
The data availability (with the exception of PM2.5) is poor for the year 2014 and should be kept in mind when assessing the
measured data for this period. The measured SO2 and NO2 concentrations are within NAAQS at Marapong for the period
January 2013 to November 2014. The PM10 concentrations exceed the NAAQS at Marapong for the period 2013 and 2014.
PM2.5 concentrations at Marapong are within the NAAQS applicable till 2029 but exceed the more stringent NAAQS applicable
in 2030.

Air Quality Specialist Report for the Proposed Medupi Flue Gas Desulphurisation (FGD) Retrofit Project
Report No.: 10ZIT10 25
Figure 3-10: Hourly NO2 measured at the Marapong monitoring station for the period January 2013 to November 2014
Figure 3-11: Daily PM10 measured at the Marapong monitoring station for the period January 2013 to November 2014
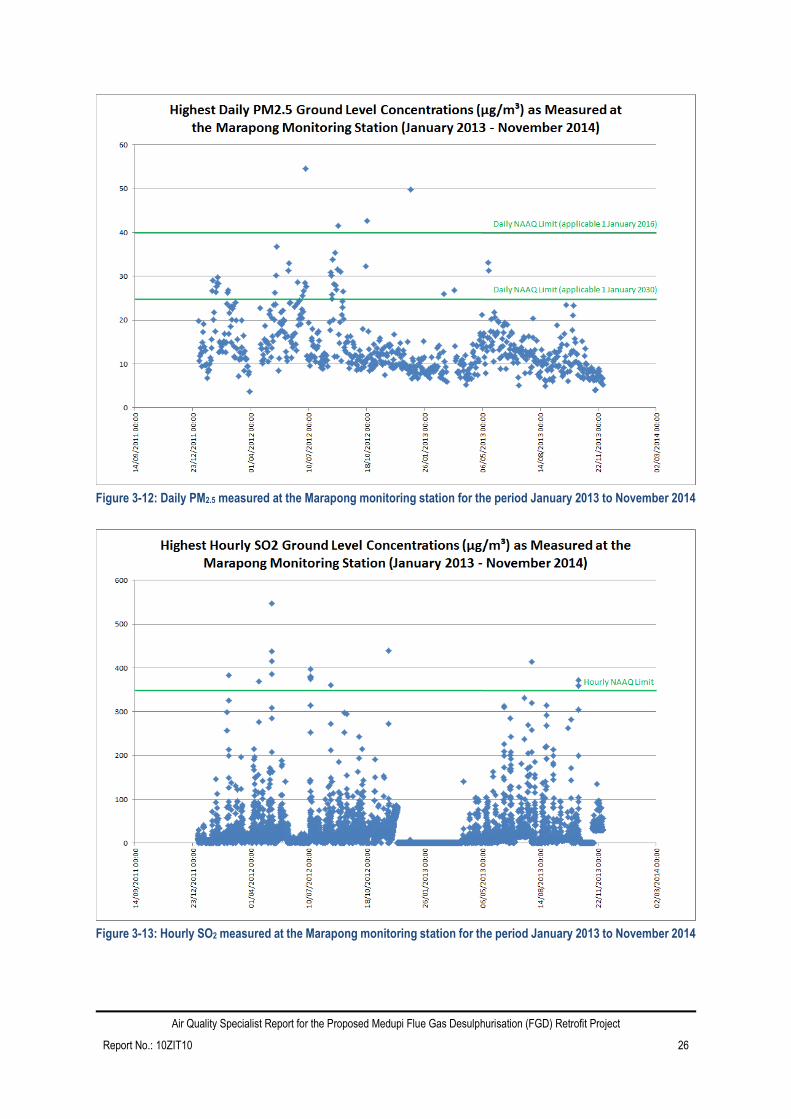
Air Quality Specialist Report for the Proposed Medupi Flue Gas Desulphurisation (FGD) Retrofit Project
Report No.: 10ZIT10 26
Figure 3-12: Daily PM2.5 measured at the Marapong monitoring station for the period January 2013 to November 2014
Figure 3-13: Hourly SO2 measured at the Marapong monitoring station for the period January 2013 to November 2014

Air Quality Specialist Report for the Proposed Medupi Flue Gas Desulphurisation (FGD) Retrofit Project
Report No.: 10ZIT10 27
Figure 3-14: Daily SO2 measured at the Marapong monitoring station for the period January 2013 to November 2014
Table 3-3: Summary of the data availability and compliance with NAAQS for the ambient data measured at Marapong
Pollutant Monitoring
Period
Data
Availability (%)
Frequency of
Exceedence of
Hourly NAAQ
Limit
Frequency of
Exceedence
of Daily
NAAQ Limit
Annual
Average
Ground Level
Concentrations
(µg/m³)
Within
Compliance
with NAAQS
(Y/N)
SO2 2013 92 12 1 19 Y
2014 66 3 0 17 Y
NO2 2013 98 21 18 Y
2014 47 0 15 Y
PM10 2013 94 NA 87 59 N
2014 36 18 40 N
PM2.5
2013 90
0 (a)
15
Y
3 (b) Y
34 (c) N
2014 94
0 (a)
11
Y
1 (b) Y
5 (c) N
NA: Not applicable
(a) Applicable immediately till 31 December 2015
(b) Applicable from 1 January 2016 till 31 December 2029
(c) Applicable from 1 January 2030

Air Quality Specialist Report for the Proposed Medupi Flue Gas Desulphurisation (FGD) Retrofit Project
Report No.: 10ZIT10 28
3.3.3 Simulated Ambient Air Pollutant Concentrations
The baseline air quality impact assessment consisted of two scenarios:
• 2014 Baseline: Matimba Power Station operations, and
• 2020 Baseline: Matimba Power Station operations and Medupi Power Station operations including all six units
without FGD.
3.3.3.1 Emissions Inventory
Matimba Power Station and Associated Ash Facility
The main source of emissions from the Matimba Power Station comprises two stacks. Source parameters for these sources,
required for input to the dispersion modelling study, include stack height and diameter, gas exit velocity and gas exit
temperature. Such information was obtained from the air quality impact assessment study undertaken for the Medupi Power
Station and is provided in Table 3-4 (Scorgie et al, 2006).
Table 3-4: Stack parameters for the Matimba Power Station
Number of Stacks Height
(m)
Diameter
(m) Exit Velocity (m/s)
Temperature
(°K)
2 250 12.82 24.84 405
Estimated emission rates for SO2, NOx, and PM, were obtained from the Matimba Atmospheric Impact Report completed in
2014 and are provided in Table 3-5. Although emissions were provided as total particulates released, such emissions were
assumed to comprise primarily of PM10 given the abatement measures in place (coarser particles readily removed) and as a
conservative approach PM2.5 for assessment of this pollutant.
Table 3-5: Annual emissions (in tonnes) for the Matimba Power Station operating conditions (as obtained from the
Matimba Atmospheric Impact Report (Zunckel & Raghunandan, 2014))
Compound Quantity (tpa)
SO2 309 262
NOx 67 592
PM 4 904
A fugitive source of particulate emissions (in the form of wind erosion) from the Matimba Power Station operations is the ash
disposal facility. Wind erosion is a complex process, including three different phases of particle entrainment, transport and
deposition. It is primarily influenced by atmospheric conditions (e.g. wind, precipitation and temperature), soil properties (e.g.
soil texture, composition and aggregation), land-surface characteristics (e.g. topography, moisture, aerodynamic roughness
length, vegetation and non-erodible elements) and land-use practice (e.g. farming, grazing and mining) (Shao, 2008).
Windblown dust is generated from natural and anthropogenic sources. For wind erosion to occur, the wind speed needs to
exceed a certain threshold, called the threshold velocity. This relates to gravity and the inter-particle cohesion that resists
removal. Surface properties such as soil texture, soil moisture and vegetation cover influence the removal potential.
Conversely, the friction velocity or wind shear at the surface, is related to atmospheric flow conditions and surface aerodynamic
properties. Thus, for particles to become airborne, the wind shear at the surface must exceed the gravitational and cohesive
forces acting upon them, called the threshold friction velocity (Shao, 2008).

Air Quality Specialist Report for the Proposed Medupi Flue Gas Desulphurisation (FGD) Retrofit Project
Report No.: 10ZIT10 29
Saltation and suspension are the two modes of airborne particles in the atmosphere. The former relates to larger sand particles
that hop and can be deposited as the wind speed reduces or changes. Suspension refers to the finer dust particles that remain
suspended in the atmosphere for longer and can disperse and be transported over large distances. It should be noted that
wind erosion involves complex physics that is not yet fully understood (Shao, 2008).
Airshed has developed an in-house wind erosion model called ADDAS (Burger & Held, 1997; Burger, 2010). This model,
developed for specific use by Eskom in the quantification of fugitive emissions from its ash dumps, is based on the dust
emission model proposed by (Marticorena & Bergametti, 1995)8. The model attempts to account for the variability in source
erodibility through the parameterisation of the erosion threshold (based on the particle size distribution of the source) and the
roughness length of the surface. In the quantification of wind erosion emissions, the model incorporates the calculation of two
important parameters, viz. the threshold friction velocity of each particle size, and the vertically integrated horizontal dust flux,
in the quantification of the vertical dust flux (i.e. the emission rate).
Significant emissions arise due to the mechanical disturbance of granular material from open areas. Parameters which have
the potential to impact on the rate of emission of fugitive dust include the extent of surface compaction, moisture content,
ground cover, the shape of the storage pile, particle size distribution, wind speed and precipitation. Any factor that binds the
erodible material, or otherwise reduces the availability of erodible material on the surface, decreases the erosion potential of
the fugitive source. High moisture contents, whether due to precipitation or deliberate wetting, promote the aggregation and
cementation of fines to the surfaces of larger particles, thus decreasing the potential for dust emissions. Surface compaction
and ground cover similarly reduce the potential for dust generation. The shape of a disposal dump influences the potential for
dust emissions through the alteration of the airflow field. The particle size distribution of the material on the disposal site is
important since it determines the rate of entrainment of material from the surface, the nature of dispersion of the dust plume,
and the rate of deposition, which may be anticipated (Burger, 1994; Burger et al., 1995).
An hourly emissions file was created for each source group, i.e. the topsoil and ash sections of the ash dump. The calculation
of an emission rate for every hour of the simulation period was carried out using the ADDAS model.
The particle size distribution used in the simulations as obtained from the previous Medupi air quality impact assessment
(Scorgie et al, 2006) is provided in Table 3-6.
Table 3-6: Particle size distribution for the ash dump
Size (µm) Fraction
600 0.0472
404.21 0.0269
331.77 0.0296
272.31 0.0336
223.51 0.0404
183.44 0.0503
150.57 0.0609
123.59 0.0687
101.44 0.0728
83.26 0.0739
68.33 0.072
56.09 0.0669
8 The applicability of the Marticorena and Bergametti methodology used in ADDAS for use in impact assessments was demonstrated in a PhD thesis (Liebenberg-Enslin, 2014).

Air Quality Specialist Report for the Proposed Medupi Flue Gas Desulphurisation (FGD) Retrofit Project
Report No.: 10ZIT10 30
Size (µm) Fraction
46.03 0.0607
37.79 0.0537
31.01 0.0471
25.46 0.0407
17.15 0.0628
14.08 0.0528
7.78 0.0285
3.53 0.0105
Medupi Power Station and Associated Ash Disposal Facility
Sources associated with the construction phase of the Medupi Power Station are discussed in the air quality study undertaken
in 2006 (Scorgie et al, 2006). The focus of this study, therefore, investigates the potential impacts due to Medupi Power Station
operations only.
The main source of emissions from the Medupi Power Station comprises two stacks. For the 2020 baseline conditions, the
Medupi Power Station without FGD is assessed (emissions provided in Table 3-7), with the Matimba Power Station operations
(emissions provided above).
Table 3-7: Stack parameters for the Medupi Power Station(a)
Scenario Number of Stacks Height
(m)
Diameter
(m)
Exit Velocity
(m/s)
Temperature
(°K)
Medupi Power
Station without
FGD
2 220 15.4 15.81 410
(a) Parameters and emissions provided by Eskom personnel
Emission rates for SO2, NOx, and PM, calculated on the basis of information provided by Eskom personnel, are presented in
Table 3-8.
Table 3-8: Annual emissions (in tonnes) for Medupi Power Station operating conditions (as calculated based on
information provided by Eskom personnel)
Scenario Compound Quantity (tpa)
Medupi Power Station without FGD
SO2 449 396
NOx 85 670
PM 5 711
Fugitive dust from the proposed ash dump was assumed to be similar to 2014 baseline operations with the methodological
approach outlined in this Section having been applied. Only the locations at which the emissions occur are different, as will
be reflected in the atmospheric dispersion simulation results. This source was assessed as an unmitigated operation (no
controls in place) and as a mitigated operation (80% control efficiency in place through active re-vegetation and wetting).
3.3.3.2 Impact Assessment
Isopleth plots illustrating exceedance of the NAAQS are provided in Figure 3-15 to Figure 3-18. A synopsis of compliance with
NAAQS for SO2, NO2, PM10 and PM2.5 ground level concentrations occurring due to the 2014 baseline and 2020 baseline
conditions is given in Table 3-9.

Air Quality Specialist Report for the Proposed Medupi Flue Gas Desulphurisation (FGD) Retrofit Project
Report No.: 10ZIT10 31
2014 Baseline Conditions
Simulated SO2 ground level concentrations exceed NAAQS for hourly and daily averaging periods within the zone of maximum
impact (i.e. southwest of the Matimba Power Station) (Figure 3-15 and Figure 3-16). The simulated SO2 concentrations also
exceeded the hourly NAAQ limit infrequently within the residential area of Marapong and the residential settlement to the
northwest of the Matimba Power Station but were within the requirements of the NAAQS.
Simulated NO2, PM10 and PM2.5 concentrations are well within NAAQS at the closest identified sensitive receptors.
2020 Baseline Conditions
The area of non-compliance of the hourly and daily SO2 NAAQS extends ~30km southwest of the Medupi Power Station due
to the cumulative operations of Matimba Power Station and Medupi Power Station without FGD control (Figure 3-17 and
Figure 3-18). Exceedances of the hourly and daily SO2 NAAQS are simulated at the residential settlement to the northwest of
the Matimba Power Station under these conditions.
The simulated NO2 concentrations at the closest sensitive receptors are within NAAQS due to operations of Matimba Power
Station and the Medupi Power Station without FGD (Table 3-9).
Simulated PM10 and PM2.5 concentrations are similar in magnitude at the closest sensitive receptors (Table 3-9) due to
operations of Matimba power Station and the Medupi Power Station with and without controls on the Medupi ash disposal
facility and are well within NAAQS.

Air Quality Specialist Report for the Proposed Medupi Flue Gas Desulphurisation (FGD) Retrofit Project
Report No.: 10ZIT10 32
Figure 3-15: Area of exceedance of the hourly SO2 NAAQS due to the 2014 baseline conditions

Air Quality Specialist Report for the Proposed Medupi Flue Gas Desulphurisation (FGD) Retrofit Project
Report No.: 10ZIT10 33
Figure 3-16: Area of exceedance of the daily SO2 NAAQS due to the 2014 baseline conditions

Air Quality Specialist Report for the Proposed Medupi Flue Gas Desulphurisation (FGD) Retrofit Project
Report No.: 10ZIT10 34
Figure 3-17: Area of exceedance of the hourly SO2 NAAQS due to the 2020 baseline conditions

Air Quality Specialist Report for the Proposed Medupi Flue Gas Desulphurisation (FGD) Retrofit Project
Report No.: 10ZIT10 35
Figure 3-18: Area of exceedance of the daily SO2 NAAQS due to the 2020 baseline conditions
Table 3-9: Simulated SO2, NO2, PM10 and PM2.5 ground level concentrations at the closest sensitive receptors due to
2014 baseline and 2020 baseline operating conditions
Pollutant Scenario Receptor
Frequency of Exceedence of hourly NAAQ
limit
Frequency of Exceedence of
daily NAAQ limit
Annual Average
Concentration (µg/m³)
Within PM10 NAAQS (Y/N)
SO2
2014 Baseline (Matimba
Power Station operations)
Settlement (NW of Matimba
Power Station) 31 1 5.6 Y
Marapong 22 2 4.3 Y
Lephalale 24 1 4.2 Y
2020 Baseline (Matimba
Power Station operations and Medupi Power
Station operations – all six units without
FGD)
Settlement (NW of Matimba
Power Station) 89 6 11.8 N
Marapong 67 4 9.4 Y
Lephalale 55 1 8.7 Y
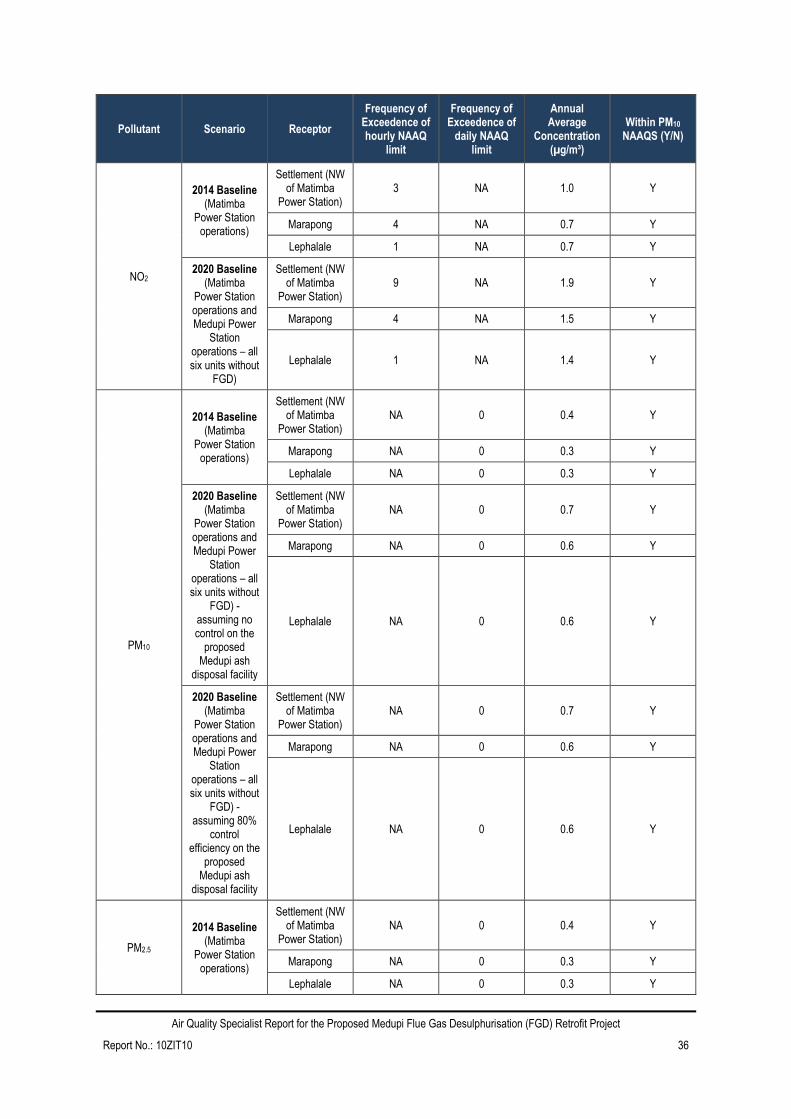
Air Quality Specialist Report for the Proposed Medupi Flue Gas Desulphurisation (FGD) Retrofit Project
Report No.: 10ZIT10 36
Pollutant Scenario Receptor
Frequency of Exceedence of hourly NAAQ
limit
Frequency of Exceedence of
daily NAAQ limit
Annual Average
Concentration (µg/m³)
Within PM10 NAAQS (Y/N)
NO2
2014 Baseline (Matimba
Power Station operations)
Settlement (NW of Matimba
Power Station) 3 NA 1.0 Y
Marapong 4 NA 0.7 Y
Lephalale 1 NA 0.7 Y
2020 Baseline (Matimba
Power Station operations and Medupi Power
Station operations – all six units without
FGD)
Settlement (NW of Matimba
Power Station) 9 NA 1.9 Y
Marapong 4 NA 1.5 Y
Lephalale 1 NA 1.4 Y
PM10
2014 Baseline (Matimba
Power Station operations)
Settlement (NW of Matimba
Power Station) NA 0 0.4 Y
Marapong NA 0 0.3 Y
Lephalale NA 0 0.3 Y
2020 Baseline (Matimba
Power Station operations and Medupi Power
Station operations – all six units without
FGD) - assuming no control on the
proposed Medupi ash
disposal facility
Settlement (NW of Matimba
Power Station) NA 0 0.7 Y
Marapong NA 0 0.6 Y
Lephalale NA 0 0.6 Y
2020 Baseline (Matimba
Power Station operations and Medupi Power
Station operations – all six units without
FGD) - assuming 80%
control efficiency on the
proposed Medupi ash
disposal facility
Settlement (NW of Matimba
Power Station) NA 0 0.7 Y
Marapong NA 0 0.6 Y
Lephalale NA 0 0.6 Y
PM2.5
2014 Baseline (Matimba
Power Station operations)
Settlement (NW of Matimba
Power Station) NA 0 0.4 Y
Marapong NA 0 0.3 Y
Lephalale NA 0 0.3 Y
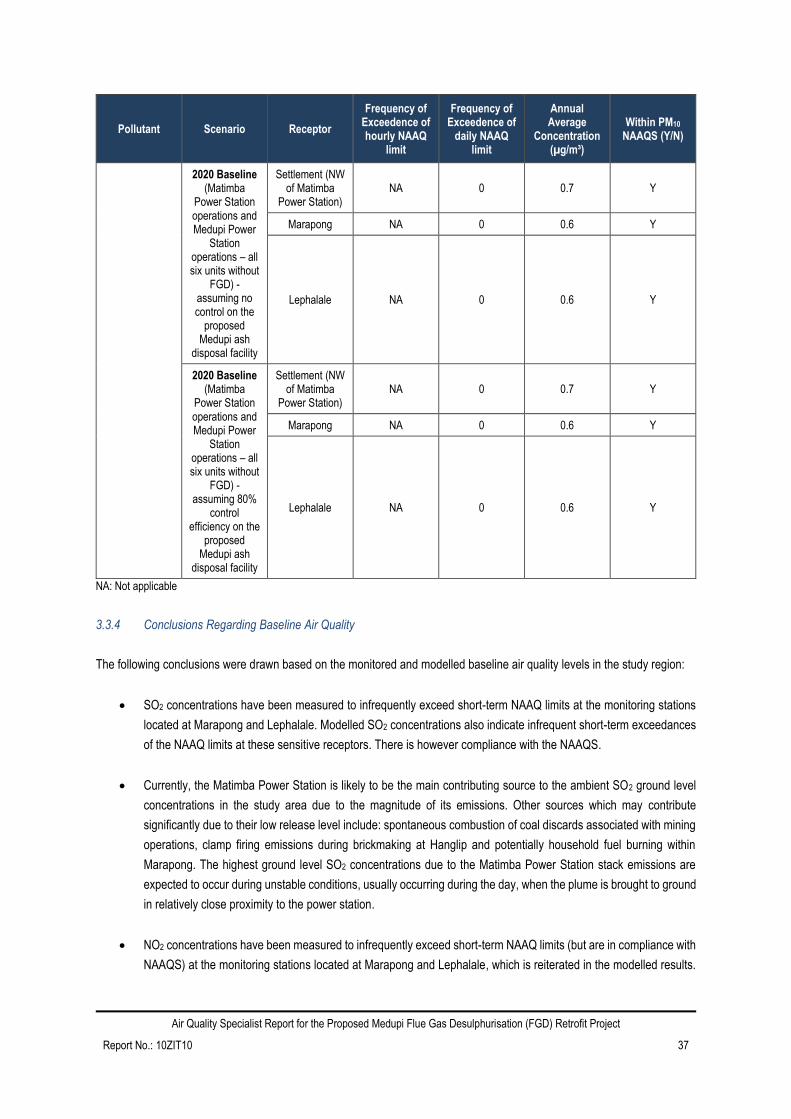
Air Quality Specialist Report for the Proposed Medupi Flue Gas Desulphurisation (FGD) Retrofit Project
Report No.: 10ZIT10 37
Pollutant Scenario Receptor
Frequency of Exceedence of hourly NAAQ
limit
Frequency of Exceedence of
daily NAAQ limit
Annual Average
Concentration (µg/m³)
Within PM10 NAAQS (Y/N)
2020 Baseline (Matimba
Power Station operations and Medupi Power
Station operations – all six units without
FGD) - assuming no control on the
proposed Medupi ash
disposal facility
Settlement (NW of Matimba
Power Station) NA 0 0.7 Y
Marapong NA 0 0.6 Y
Lephalale NA 0 0.6 Y
2020 Baseline (Matimba
Power Station operations and Medupi Power
Station operations – all six units without
FGD) - assuming 80%
control efficiency on the
proposed Medupi ash
disposal facility
Settlement (NW of Matimba
Power Station) NA 0 0.7 Y
Marapong NA 0 0.6 Y
Lephalale NA 0 0.6 Y
NA: Not applicable
3.3.4 Conclusions Regarding Baseline Air Quality
The following conclusions were drawn based on the monitored and modelled baseline air quality levels in the study region:
• SO2 concentrations have been measured to infrequently exceed short-term NAAQ limits at the monitoring stations
located at Marapong and Lephalale. Modelled SO2 concentrations also indicate infrequent short-term exceedances
of the NAAQ limits at these sensitive receptors. There is however compliance with the NAAQS.
• Currently, the Matimba Power Station is likely to be the main contributing source to the ambient SO2 ground level
concentrations in the study area due to the magnitude of its emissions. Other sources which may contribute
significantly due to their low release level include: spontaneous combustion of coal discards associated with mining
operations, clamp firing emissions during brickmaking at Hanglip and potentially household fuel burning within
Marapong. The highest ground level SO2 concentrations due to the Matimba Power Station stack emissions are
expected to occur during unstable conditions, usually occurring during the day, when the plume is brought to ground
in relatively close proximity to the power station.
• NO2 concentrations have been measured to infrequently exceed short-term NAAQ limits (but are in compliance with
NAAQS) at the monitoring stations located at Marapong and Lephalale, which is reiterated in the modelled results.

Air Quality Specialist Report for the Proposed Medupi Flue Gas Desulphurisation (FGD) Retrofit Project
Report No.: 10ZIT10 38
Low level sources of NOx in the region include combustion within coal discard dumps, brick firing operations and
possibly also household fuel burning and infrequent veld burning.
• Measured PM10 concentrations exceed the daily NAAQS at Marapong for the period 2014 but are lower at Lephalale
(where levels comply with daily NAAQS). The measured PM2.5 concentrations are within the daily NAAQS applicable
till 2030 at Marapong and Lephalale, but exceed the more stringent daily NAAQS applicable in 2030. The annual
average PM10 and PM2.5 concentrations measured at Lephalale are within NAAQS. Measured annual PM10
concentrations at Marapong during the period 2013 exceed annual NAAQS.
• 2014 Baseline simulations:
o The contribution of Matimba Power Station to primary and secondary particulates was simulated, with no
exceedances of the SO2, NO2, PM10 and PM2.5 NAAQS at Marapong and Lephalale. Secondary
particulates form in the atmosphere through the conversion of SOx and NOx emissions to sulfate and
nitrate.
• 2020 Baseline simulations:
o The area of non-compliance with the hourly and daily SO2 NAAQS extended ~30km southwest of the
Medupi Power Station due to the cumulative operations of Matimba Power Station and Medupi Power
Station without FGD control. Non-compliance with the hourly and daily SO2 NAAQS was simulated at the
residential settlement to the northwest of the Matimba Power Station under these conditions.
• Various local (informed through observation from site visits) and far-field (informed by literature) sources are
expected to contribute to the suspended fine particulate concentrations in the region. Local dust sources include
wind erosion from exposed areas, fugitive dust from mining and brickmaking operations, vehicle entrainment from
roadways and veld burning. Household fuel burning may also constitute a local source of low-level emissions. Long-
range transport of particulates emitted from remote tall stacks and from biomass burning in countries to the north of
Republic of South Africa (RSA) and the accumulation and recirculation of such regional air masses over the interior
is well documented (Andreae et al., 1996; Garstang et al., 1996; Piketh, 1996) (detail pertaining to the recirculation
of air masses is provided in Section 3.3.1.9).

Air Quality Specialist Report for the Proposed Medupi Flue Gas Desulphurisation (FGD) Retrofit Project
Report No.: 10ZIT10 39
4 IMPACT OF PROPOSED PROJECT ON HUMAN HEALTH
The impact assessment for the proposed Project operations includes activities at the Medupi Power station; six units with
FGD. To assess this impact with background concentrations in the area, the proposed Project operations have been
considered with the Matimba Power Station operations. In order to understand the reduction in ambient SO2 impacts that the
proposed Project provides, the 2020 baseline activities (Matimba Power Station activities provided in Section 3.3.3 and Figure
3-17 and Figure 3-18) should be compared to the assessment provided in this section (Matimba Power Station activities with
proposed Project operations) to realise the differential between the two scenarios.
4.1 Atmospheric Emissions
The emissions for the Matimba Power Station operations are provided in Section 3.3.3.1 and of the Medupi Power Station
operations with FGD in Table 4-1.
Table 4-1: Stack parameters for the Medupi Power Station(a)
Scenario Number of Stacks Height
(m)
Diameter
(m)
Exit Velocity
(m/s)
Temperature
(°K)
Medupi Power
Station with FGD 2 220 15.4 15.96 324
(a) Parameters and emissions provided by Eskom personnel
Emission rates for SO2, NOx, and PM, calculated on the basis of information provided by Eskom personnel, are presented in
Table 4-2.
Table 4-2: Annual emissions (in tonnes) for Medupi Power Station operating conditions (as calculated based on
information provided by Eskom personnel)
Scenario Compound Quantity (tpa)
Medupi Power Station with FGD
SO2 71 605
NOx 85 670
PM 5 711
The gypsum from the FGD activities is proposed to be mixed with the ash on the existing ash disposal facility. The gypsum
material is expected to provide a crust when mixed with water. To what extent this material will crust will depend on how the
material is disposed (i.e. mixed with the ash or deposited as layers of gypsum material in between the ash material) and how
much water is added to the disposal facility. The crust may also be disturbed from time to time with activity on the disposal
facility. It is therefore not possible to determine the effectiveness of the gypsum material in mitigating the windblown dust from
this source. Fugitive dust from the proposed ash dump were therefore assumed to be similar to 2020 baseline operations with
approach outlined in Section 3.3.3.1 having been applied.
Limestone will need to be transported to site for the FGD and the sludge and salts will be temporarily stored on a prepared
waste storage facility prior to being transported from site to a licenced facility. The transport of the waste will be undertaken
via trucks. The limestone will initially be transported via trucks but will later be transported via rail. The trips per day (as
provided by the proponent) were given as 13 and 69 for waste (salts and sludge) and limestone respectively when all six units
are operational. The calculated PM10 and PM2.5 emissions as calculated using the US-EPA emission factor for paved roads
was 2.95 x 10⁻⁵ g/s/m² and 7.15 x 10⁻⁶ g/s/m² respectively. As part of the air quality assessment, a qualitative assessment of
the potential impacts from the road was requested and is provided in Section 4.2.

Air Quality Specialist Report for the Proposed Medupi Flue Gas Desulphurisation (FGD) Retrofit Project
Report No.: 10ZIT10 40
4.2 Impact Assessment
4.2.1 Qualitative Assessment
To provide an indication of the potential distance and significance of impacts from these activities, the US EPA screening
model (Screen View version 3.5.0) is used. This model represents a quick method to calculate and “flag” the “worst-case”
concentration that might occur. Screening models require very little input and have a built-in set of meteorological conditions
based on stability classes. It is a quick screening tool to identify possible sources that might require more detailed modelling.
It is important to note that these models do not use actual meteorological data, but rather set stability classes that will produce
the highest impacts. The impacts are therefore not related to the actual wind directions or speeds. More sophisticated
Gaussian plume and puff models such as the US EPA regulatory AERMOD and CALPUFF models use actual meteorological
conditions. For the purpose of providing a professional opinion on the potential impacts from the road (due to vehicle
entrainment), a screening model is sufficient as the focus is merely to provide an indication of the potential significance of the
operations on the surrounding environment.
The output from the screening model is provided as highest hourly concentrations. In order to obtain the highest daily and
annual average concentrations to compare to ambient air quality guidelines, equivalent concentrations were extrapolated. For
extrapolating time averaging periods from 1 hour to 24 hours and 1 year, Beychock (2005) recommends the following equation:
𝐶𝑥𝐶𝑝
⁄ = (𝑡𝑝
𝑡𝑥⁄ )
0.2
where:
Cx and Cp are concentrations over any two averaging periods;
tx and tp are corresponding averaging times.
Figure 4-1 and Figure 4-2 provides a graphic representation of the possible PM10 and PM2.5 concentrations at set distances
from the proposed road. The concentrations are irrespective of actual wind speed and direction and reflect the worst-case
scenario. The PM10 and PM2.5 concentrations due to vehicle entrainment as a result of transporting limestone, salts and sludge
on a paved road surface (assuming all six units are operational) are well below the NAAQS.

Air Quality Specialist Report for the Proposed Medupi Flue Gas Desulphurisation (FGD) Retrofit Project
Report No.: 10ZIT10 41
Figure 4-1: Estimated highest daily and annual average PM10 ground level concentrations, due to vehicle entrainment,
at set distances from the emission source
Figure 4-2: Estimated highest daily and annual average PM2.5 ground level concentrations, due to vehicle entrainment,
at set distances from the emission source

Air Quality Specialist Report for the Proposed Medupi Flue Gas Desulphurisation (FGD) Retrofit Project
Report No.: 10ZIT10 42
4.2.2 Quantitative Assessment
Isopleth plots illustrating exceedance of the NAAQS for the operations of Matimba and Medupi with FGD are provided in
Figure 4-3 and Figure 4-4 (to be seen in comparison with 2020 baseline – Figure 3-17 and Figure 3-18). A synopsis of the
compliance of SO2, NO2, PM10 and PM2.5 concentrations with the NAAQS due to proposed Project operations is provided in
Table 4-3 (to be seen in comparison to Table 3-9 – 2020 baseline).
The area of exceedance of the SO2 NAAQS due to Matimba Power Station and Medupi with FGD (Figure 4-3 and Figure 4-
4) is significantly reduced from the 2020 baseline operations (Figure 3-17 and Figure 3-18) bringing the simulated ground level
concentrations into compliance with the hourly and daily NAAQS at all sensitive receptors in the study area.
Simulated NO2 ground level concentrations due to proposed Project operations (Table 4-3) increase slightly from the 2020
baseline conditions due to the decrease in dispersion potential with the introduction of FGD (i.e. with FGD, the stack exit
temperature decreases). The simulated NO2 concentrations at the closest sensitive receptors are, however, within NAAQS
due to Matimba Power Station activities and proposed Project operations.
Simulated PM10 and PM2.5 concentrations due to Matimba Power Station activities and proposed Project operations (Table 4-
3) are similar in magnitude to the 2020 baseline operations (Table 3-9) and are well within NAAQS.
Figure 4-3: Area of exceedance of the hourly SO2 NAAQS due to Matimba Power Station operations and Medupi with
FGD

Air Quality Specialist Report for the Proposed Medupi Flue Gas Desulphurisation (FGD) Retrofit Project
Report No.: 10ZIT10 43
Figure 4-4: Area of exceedance of the daily SO2 NAAQS due to Matimba Power Station operations and Medupi with
FGD
Table 4-3: Simulated SO2, NO2, PM10 and PM2.5 ground level concentrations at the closest sensitive receptors due to
Matimba Power Station operations and Medupi with FGD
Pollutant Scenario Receptor
Frequency of Exceedence of hourly NAAQ
limit
Frequency of Exceedence of
daily NAAQ limit
Annual Average
Concentration (µg/m³)
Within PM10 NAAQS (Y/N)
SO2
Proposed Project
operations: Matimba Power
Station and Medupi Power Station (with
FGD)
Settlement (NW of Matimba
Power Station) 34 2 8.0 Y
Marapong 22 2 5.8 Y
Lephalale 25 1 5.6 Y
NO2
Proposed Project
operations: Matimba Power
Station and Medupi Power
Settlement (NW of Matimba
Power Station) 27 NA 3.4 Y
Marapong 14 NA 2.6 Y
Lephalale 5 NA 2.0 Y

Air Quality Specialist Report for the Proposed Medupi Flue Gas Desulphurisation (FGD) Retrofit Project
Report No.: 10ZIT10 44
Pollutant Scenario Receptor
Frequency of Exceedence of hourly NAAQ
limit
Frequency of Exceedence of
daily NAAQ limit
Annual Average
Concentration (µg/m³)
Within PM10 NAAQS (Y/N)
Station (with FGD)
PM10
Proposed Project
operations: Matimba Power
Station and Medupi Power Station (with
FGD) – assuming no control on the
proposed Medupi ash
disposal facility
Settlement (NW of Matimba
Power Station) NA 0 0.7 Y
Marapong NA 0 0.6 Y
Lephalale NA 0 0.6 Y
Proposed Project
operations: Matimba Power
Station and Medupi Power Station (with
FGD) – assuming 80%
control efficiency on the
proposed Medupi ash
disposal facility
Settlement (NW of Matimba
Power Station) NA 0 0.7 Y
Marapong NA 0 0.6 Y
Lephalale NA 0 0.6 Y
PM2.5
Proposed Project
operations: Matimba Power
Station and Medupi Power Station (with
FGD) – assuming no control on the
proposed Medupi ash
disposal facility
Settlement (NW of Matimba
Power Station) NA 0 0.7 Y
Marapong NA 0 0.6 Y
Lephalale NA 0 0.6 Y
Proposed Project
operations: Matimba Power
Station and Medupi Power Station (with
FGD) – assuming 80%
control efficiency on the
proposed Medupi ash
disposal facility
Settlement (NW of Matimba
Power Station) NA 0 0.7 Y
Marapong NA 0 0.6 Y
Lephalale NA 0 0.6 Y
NA: Not applicable

Air Quality Specialist Report for the Proposed Medupi Flue Gas Desulphurisation (FGD) Retrofit Project
Report No.: 10ZIT10 45
Although the quantification of trace element emissions from the coal combustion process did not form part of the scope of the
assessment, an overview of these emissions and the control thereof are provided in Appendix B.
4.3 Impact Significance Rating
The operational phase is considered to be the phase with the largest impact on ambient air quality. The Construction and
Rehabilitation (Closure) phases are not likely to impact the ambient air quality more than the existing (status quo) status. All
impacts are based on the dispersion modelling results. The impact significance rating for the operational scenario is presented
in Table 4-4.
4.3.1 Existing Status
The 2020 baseline conditions were assessed as the existing status which includes the operations of the Matimba Power
Station and the Medupi Power Station including six units without FGD.
Simulated impacts from the Matimba Power Station and the Medupi Power Station without FGD (2020 baseline) was in non-
compliance with SO2 NAAQS on a regional scale resulting in a MODERATE significance.
No exceedances of the NAAQS for NO2, PM10 and PM2.5 were simulated at sensitive receptors due to 2020 baseline operations
resulting in LOW significance.
4.3.2 Cumulative Impact
The proposed Project operations were assessed as the cumulative impact which includes the operations of the Matimba
Power Station and the Medupi Power Station including six units with FGD.
The area of non-compliance of cumulative SO2 concentrations reduces significantly with FGD with no exceedances of the
NAAQS at sensitive receptors, reducing the significance to LOW.
No exceedances of the NAAQS for NO2, PM10 and PM2.5 were simulated at sensitive receptors due to proposed Project
operations resulting in LOW significance.
4.3.3 Mitigation Measures
Effective mitigation of particulate emissions on the Medupi ash disposal facility will include:
• Regular wetting of exposed areas of disposal facility;
• Stabilization of the exposed areas with a top-soil covering;
• Wetting of exposed top-soil for additional mitigation of dust emissions from the top-soil layer;
• Re-vegetation of the ash disposal facility through application of a deeper top-soil layer and seeding with appropriate
grass seeds.
4.3.4 Residual Impact
The residual impact of the ash disposal facility (including the increase in height of 12 m) shows little impact in magnitude at
the sensitive receptors (located upwind of the facility) on a daily and annual averaging period providing no change in

Air Quality Specialist Report for the Proposed Medupi Flue Gas Desulphurisation (FGD) Retrofit Project
Report No.: 10ZIT10 46
significance on PM from cumulative to residual operations. As only mitigation of PM is considered, it is the only pollutant that
could be assessed in terms of residual.

Air Quality Specialist Report for the Proposed Medupi Flue Gas Desulphurisation (FGD) Retrofit Project
Report No.: 10ZIT10 47
Table 4-4: Impact rating matrix for the proposed project operations
OPERATIONAL PHASE
Activity Description of Impact
Impact type Spatial Scale
Duration Significance Probability Rating Mitigation Measures Interpretation
Operational phase for the
proposed Project
SO2
Existing(a) 4 3 4 4 2.9 - MOD The FGD control is considered a scenario of the assessment and not a mitigation measure for the significance rating as it is an operational activity that is to take place. The significance of the residual impact for SO2 and NO2 therefore remain unchanged.
The significance rating was provided taking into consideration the area of non-compliance with current NAAQS and the location of residential areas. No significant change in PM daily and annual impact in terms of magnitude were simulated at residential areas for mitigated and unmitigated ash facility activities providing little change in significance for cumulative and residual impacts. This is due to high incidental impacts occurring due to ash disposal facility operations, but the incidental impacts average over daily and annual time frames. The measured ambient air quality for PM10 is currently in non-compliance with NAAQS at Marapong but no significant change in magnitude and spatial distribution from measured ambient concentrations is simulated due to proposed Project operations.
Cumulative(b) 3 3 3 3 1.8 - LOW
Residual 3 3 3 3 1.8 - LOW
NO2
Existing(a) 2 3 3 3 1.6 - LOW
Cumulative(b) 2 3 3 3 1.6 - LOW
Residual 2 3 3 3 1.6 - LOW
PM10
Existing(a) 2 3 3 3 1.6 - LOW An unmitigated and mitigated (80% control efficiency) scenario on the proposed Medupi ash disposal facility was considered. The mitigation that can be implemented in continual re-vegetation and wetting of the disposal facility.
Cumulative(b) 2 3 3 3 1.6 - LOW
Residual 2 3 3 3 1.6 - LOW
PM2.5
Existing(a) 2 3 3 3 1.6 - LOW
Cumulative(b) 2 3 3 3 1.6 - LOW
Residual 2 3 3 3 1.6 - LOW
(a) Existing conditions is based on the simulated 2020 baseline operations which includes the activities of the Matimba Power Station and the Medupi Power Station operations with six units excluding FGD
(b) Cumulative conditions are based on the simulated proposed Project operations which includes the activities of the Matimba Power Station and the Medupi Power Station operations with six units including
FGD
Air Quality Specialist Report for the Proposed Medupi Flue Gas Desulphurisation (FGD) Retrofit Project
Report No.: 10ZIT10 48
5 CONCLUSIONS
5.1 Baseline Air Quality Study Findings
The main findings from the baseline air quality characterisation study, which was based on information from both monitoring
and modelling studies, are as follows:
• SO2 concentrations have been measured to infrequently exceed short-term NAAQ limits at the monitoring stations
located at Marapong and Lephalale. Modelled SO2 concentrations also indicate infrequent short-term exceedances
of the NAAQ limits at these sensitive receptors. There is however compliance with the NAAQS.
• Currently, the Matimba Power Station is likely to be the main contributing source to the ambient SO2 ground level
concentrations in the study area due to the magnitude of its emissions. Other sources which may contribute
significantly due to their low release level include: spontaneous combustion of coal discards associated with mining
operations, clamp firing emissions during brickmaking at Hanglip and potentially household fuel burning within
Marapong. The highest ground level SO2 concentrations due to the Matimba Power Station stack emissions are
expected to occur during unstable conditions, usually occurring during the day, when the plume is brought to ground
in relatively close proximity to the power station.
• NO2 concentrations have been measured to infrequently exceed short-term NAAQ limits (but are in compliance with
NAAQS) at the monitoring stations located at Marapong and Lephalale, which is reiterated in the modelled results.
Low level sources of NOx in the region include combustion within coal discard dumps, brick firing operations and
possibly also household fuel burning and infrequent veld burning.
• Measured PM10 concentrations exceed the daily NAAQS at Marapong for the period 2014 but are lower at Lephalale
(where levels comply with daily NAAQS). The measured PM2.5 concentrations are within the daily NAAQS applicable
till 2030 at Marapong and Lephalale, but exceed the more stringent daily NAAQS applicable in 2030. The annual
average PM10 and PM2.5 concentrations measured at Lephalale are within NAAQS. Measured annual PM10
concentrations at Marapong during the period 2013 exceed annual NAAQS.
• 2014 Baseline simulations:
o The contribution of current Matimba Power Station operations to primary and secondary particulates was
simulated, with no exceedances of the SO2, NO2, PM10 and PM2.5 NAAQS at Marapong and Lephalale.
Secondary particulates form in the atmosphere through the conversion of SOx and NOx emissions to
sulfate and nitrate.
• 2020 Baseline simulations:
o The area of non-compliance with the hourly and daily SO2 NAAQS extended ~30km southwest of the
Medupi Power Station due to the cumulative operations of the current Matimba Power Station and
proposed Medupi Power Station (all 6 units) without FGD control. Non-compliance with the hourly and
daily SO2 NAAQS was simulated at the residential settlement to the northwest of the Matimba Power
Station under these conditions.
• Various local (informed through observation from site visits) and far-field (informed by literature) sources are
expected to contribute to the suspended fine particulate concentrations in the region. Local dust sources include

Air Quality Specialist Report for the Proposed Medupi Flue Gas Desulphurisation (FGD) Retrofit Project
Report No.: 10ZIT10 49
wind erosion from exposed areas, fugitive dust from mining and brickmaking operations, vehicle entrainment from
roadways and veld burning. Household fuel burning may also constitute a local source of low-level emissions. Long-
range transport of particulates emitted from remote tall stacks and from biomass burning in countries to the north of
Republic of South Africa (RSA) and the accumulation and recirculation of such regional air masses over the interior
is well documented (Andreae et al., 1996; Garstang et al., 1996; Piketh, 1996) (detail pertaining to the recirculation
of air masses is provided in Section 3.3.1.9).
5.2 Impact Assessment for Proposed Project
It should be noted that proposed impacts were assessed taking into consideration current Matimba Power Station operations
and the proposed Medupi Power Station operations (all 6 units) with FGD. The main findings of the impact assessment for the
proposed Project are provided as follows:
• The area of exceedance of the hourly and daily SO2 NAAQS was significantly reduced when FGD controls on the
Medupi Power Station is considered, bringing the simulated ground level concentrations within compliance of the
hourly and daily SO2 NAAQS at all sensitive receptors in the study area.
• Simulated impacts from the Matimba Power Station and the Medupi Power Station without FGD (2020 baseline)
was in non-compliance with SO2 NAAQS on a regional scale resulting in a MODERATE significance. The area of
non-compliance of SO2 concentrations reduces significantly for proposed Project operations (i.e. Matimba Power
Station operations and Medupi Power Station operations with FGD) and reduces the significance to LOW as no
exceedances of the NAAQS are simulated at the closest sensitive receptors in the study area. No exceedances of
the NAAQS for NO2, PM10 and PM2.5 were simulated at sensitive receptors due to proposed Project operations
resulting in LOW significance. The available monitoring data shows that the PM10 concentrations are in non-
compliance with the daily NAAQS at Marapong. Simulated impacts due to proposed Project operations, however,
do not contribute significantly to current ambient particulate concentrations.
5.3 Recommendation
As the proposed Project operations will significantly reduce SO2 impacts from the Medupi Power Station, it is recommended
that the FGD Retrofit Project (including the increase in height of the ADF with 12 m) be implemented. The movement of sludge
and salt off-site to a licenced facility will contribute to fugitive vehicle entrainment emissions. It is recommended that the access
road being used is properly maintained to minimise the impacts from this source.

Air Quality Specialist Report for the Proposed Medupi Flue Gas Desulphurisation (FGD) Retrofit Project
Report No.: 10ZIT10 50
6 REFERENCES
Andreae, M.O., Atlas, E., Cachier, H., Cofer, W.R., Harris, G.W., Helas, G., Koppman, R., Lacaux, J. and Ward, D.E., (1996):
Trace gas and aerosol emissions from savanna fires, J.S. Levine (ed.), Biomass Burning and Global Change, MIT
Press, Cambridge, 278-294.
Burger L W (1994). Ash Dump Dispersion Modeling, in Held G: Modeling of Blow-Off Dust From Ash Dumps, Eskom Report
TRR/S94/185, Cleveland, 40 pp.
Burger, L. (2010). Complexities in the estimation of emissions and impacts of wind generated fugitive dust. Polokwane: NACA.
Burger L W, Held G and Snow N H (1995). Ash Dump Dispersion Modeling Sensitivity Analysis of Meteorological and Ash
Dump Parameters, Eskom Report TRR/S95/077, Cleveland, 18 pp.
Burger, L., & Held, G. S. (1997). Revised User's Manual for the Airborne Dust Dispersion Model from Area Sources (ADDAS).
Eskom TSI Report No. TRR/T97?066.
Garstang, M., Tyson, P.D., Swap, R. and Edwards, M., (1996). Horizontal and vertical transport of air over southern Africa,
submitted to Journal of Geophysical Research.
Godish T. (1990). Air Quality, Lewis Publishers, Michigan, 422 pp.
Goldreich Y and Tyson P D (1988). Diurnal and Inter-Diurnal Variations in Large-Scale Atmospheric Turbulence over Southern
Africa, South African Geographical Journal, 70(1), 48-56.
Liebenberg-Enslin, H. (2014). A Functional Dependence Analysis of Wind Erosion Modelling System Parameters to Determine
a Practical Approach for Wind Erosion Assessments. Johannesburg: Doctoral dissertation: University of
Johannesburg.
Marticorena, B., & Bergametti, G. (1995). Modelling the Atmospheric Dust Cycle 1 Design of a Soil-Derived Dust Emission
Scheme. Journal of Geophysical Research, 100, 16415 - 16430.
Oke T T (1990). Boundary Layer Climates, Routledge, London and New York, 435 pp.
Pasquill F and Smith F B (1983). Atmospheric Diffusion: Study of the Dispersion of Windborne Material from Industrial and
Other Sources, Ellis Horwood Ltd, Chichester, 437 pp.
Piketh, S.J., Annegarn, H.J. and Kneen, M.A., (1996). Regional scale impacts of biomass burning emissions over southern
Africa, in J.S. Levine (ed.), Biomass Burning and Global Change, MIT Press, Cambridge, 320-326.
Scire, J. and Borissova M (2011). An Empirical Method for Modeling Short-Term and Annual NO2 Concentrations in Regulatory
Models, TRC Energy & Environment Conference (EUEC), Phoenix, Arizona.
Scorgie, Y; Krause, N and Petzer, G (2006). Air Quality Impact Assessment for the Proposed New Coal-Fired Power Station
in the Lephalale Area, Limpopo Province. Report No. APP/06/BWK-01 Rev 1.0.

Air Quality Specialist Report for the Proposed Medupi Flue Gas Desulphurisation (FGD) Retrofit Project
Report No.: 10ZIT10 51
Seinfeld, J.H. and S. N. Pandis, 1998: Atmospheric Chemistry and Physics. John Wiley & Sons, New York.
Shao, Y. (2008). Physics ad Modelling of Wind Erosion. Atmospheric and Oceanographic Science Library, 2nd Revised and
Expanded Edition. Springer Science.
Shaw, R. W., & Munn, R. E. (1971). Air Pollution Meteorology. In B. M. McCormac, Introduction to the Scientific Study of Air
Pollution (pp. 53-96). Dordrecht-Holland: Reidel Publishing Company.
Strimaitis D.G., Scire J.S. and Chang J.C., (1998). Evaluation of the CALPUFF Dispersion Model with Two Power Plant Data
Sets, Preprints 10th Joint Conference on the Applications of Air Pollution Meteorology, 11-16 January 1998,
Phoenix, Arizona.
Xua, M., Yanb, R., Zhengaa, C., Qiaoa, Y., Hana, J., & Shenga, C. (2003). Status of Trace Element Emission in Coal
Combustion Process. Fuel Processing Technology.
Zunckel, M., & Raghunandan, A. (2014). Atmospheric Impact Report in support of Eskom’s application for postponement of
the Minimum Emission Standards compliance timeframes for the Matimba Power Station. uMoya-NILU Consulting
(Pty) Ltd.
U.S. EPA (1992). Protocol for Determining the Best Performing Model. U.S. Environmental Protection Agency. Research
Triangle Park, 2 NC. EPA-454/R-92-025.
US EPA (1998). Interagency Workgroup on Air Quality Modeling (IWAQM) Phase 2 Summary Report and Recommendations
for Modeling Long-Range Transport Impacts, U.S. Environmental Protection Agency EPA‐454/R‐98‐019, Research
Triangle Park, NC.
US EPA (2005). Revision to the Guideline on Air Quality Models: Adoption of a Preferred General Purpose (Flat and Complex
Terrain) Dispersion Model and Other Revisions. North Carolina, U.S. Environmental Protection Agency, 2005.
Federal Register / Vol. 70, No. 216 / Rules and Regulations. Appendix W of 40 CRF Part 51.

Air Quality Specialist Report for the Proposed Medupi Flue Gas Desulphurisation (FGD) Retrofit Project
Report No.: 10ZIT10 52
7 APPENDIX A - THE NO2/NOX CONVERSION RATIOS FOR NO2 FORMATION
As a starting basis, the NO2/NOx conversion factors described by Scire and Borissova (2011) as given in Table A-1 will be
employed. Observed NO2/NOx ratios at the Marapong monitoring station were also analysed and compared to the factors in
the table (Figure A-1).
Table A-1: NO2/NOx conversation ratios for NO2 formation
Bin
Concentration (ppb) NO2/NOx Ratios
Eskom Scire and Borissova 2011
Min Max Ave Marapong
Bin Average 1-Hour Max
2012-2014
1 0 10 5 0.722 0.798 0.994
2 10 20 15 0.647 0.813 0.992
3 20 40 30 0.629 0.731 0.984
4 40 60 50 0.500 0.554 0.909
5 60 80 70 0.430 0.437 0.748
6 80 100 90 0.360 0.355 0.609
7 100 125 112.5 0.312 0.301 0.498
8 125 150 137.5 0.270 0.256 0.417
9 150 175 162.5 0.248 0.228 0.354
10 175 200 187.5 0.203 0.208 0.306
11 200 225 212.5 0.235 0.185 0.268
12 225 250 237.5 0.187 0.181 0.240
13 250 275 262.5 0.189 0.177 0.219
14 275 300 287.5 0.155 0.204
15 300 325 312.5 0.156 0.152 0.191
16 325 350 337.5 0.148 0.181
17 350 375 362.5 0.140 0.173
18 375 400 387.5 0.136 0.165
19 400 450 425 0.142 0.153
20 450 500 475 0.122 0.151
21 500 600 550 0.109 0.147
22 600 700 650 0.111 0.143
23 700 800 750 0.111 0.139
24 800 950 875 0.117 0.134

Air Quality Specialist Report for the Proposed Medupi Flue Gas Desulphurisation (FGD) Retrofit Project
Report No.: 10ZIT10 53
Figure A-1: NO2/NOx conversation ratios for the Marapong monitoring station

Air Quality Specialist Report for the Proposed Medupi Flue Gas Desulphurisation (FGD) Retrofit Project
Report No.: 10ZIT10 54
8 APPENDIX B - SUMMARY OF: STATUS OF TRACE ELEMENT EMISSION IN A COAL COMBUSTION PROCESS:
A REVIEW (XUA, ET AL., 2003)
After numerous studies carried out on the occurrence and distribution of trace elements in coal, it is accepted that the trace
elements (TEs’) combination and contents differ from one coal to another due to the different coalification processes. However,
knowledge of TE distribution in coal is very important since it permits the possible prediction of TE release from combustion.
Both TE concentration and their chemical affinity vary strongly with the coals from different sources. The comparison between
results concerning studies about worldwide coals is useful to find out some general rules. However, it still needs a long time
to achieve a general understanding of partitioning in the coal-fired flue gases.
The main proportion of almost all elements is bound with the fly ash and collected in the electrostatic precipitator (ESP). Boron
(B) and selenium (Se) are partially discharged in the vapour phase, and mercury (Hg), which exhibits a very high vapour
pressure at typical stack outlet temperature, is almost fully released with the flue gas. The elements associated mostly with
the organic and sulfide fractions (for example As, Cd, Hg) tend to vaporise firstly and then adsorb onto fine particles during
flue gas cooling. In contrast elements combined with the discrete mineral matter (such as Mn) more possibly remain in the
ash matrix.
The TE enrichment trends in submicron particles have been reported by many authors. Most TEs, which are partially or fully
vaporized during coal combustion, tend to condense and enrich in the submicron particles with a significant surface-to-volume
ratio. The submicron particles have more harmful impacts than the super-micron particles since they have long residence time
in the atmosphere and a high probability to deposit in human being lungs. Moreover, they can be collected by air pollution
control devices (APC) with very low efficiency only.
Based on partition and enrichment behaviour of elements, three basic classes of trace elements can be defined:
• Class I: Elements approximately equally distributed between the bottom ash and fly ash, or show no significant
enrichment or depletion in the bottom ash.
• Class II: Elements enriched in the fly ash and depleted in the bottom ash, or show increasing enrichment with
decreasing fly ash particle size.
• Class III: Elements totally emitted in the vapor phase.
Mercury is present in coal in trace amounts. During combustion the mercury is released into the exhaust gas as elemental
mercury vapour Hg0. As the combustion gases cool, this elemental mercury is then oxidized to Hg2+ via homogeneous mercury
chlorination reaction or heterogeneous reaction promoted by fly ash and unburnt carbon. Oxidised mercury is more easily
captured in PM control device. Factors affecting the oxidation processes include: coal chlorine content, gas temperature,
surface reaction with ash and unburnt carbon and plant operating conditions. There seems to be an important relationship
between the chlorine content of coal and the percentage of oxidized mercury. Coals with higher chlorine contents produced
greater amounts of oxidized mercury. It has also been reported that other flue gas species especially SO3 and H2O tend to
suppress the oxidation to Hg2+. This is probably due to competition for active sites on the surface of carbon or other flue gas
solids.
The most volatile TEs (Hg, Se, As), to which we have often paid more attention, and halogens, etc., remain mostly in the
vapour phase as they pass through heat transfer sections of a boiler. The percentages of the total in-stack concentrations of
these elements in the vapour phase have been reported to be: Cl, up to 99% as HCl; F, up to 90% as HF; Br, 25–98% as HBr;
Hg, up to 98% as Hg, HgO and CH3Hg; Se, up to 59% as Se and SeO2; As, 0.7–52% as As2O3; and I, 90–99% as HI. Although

Air Quality Specialist Report for the Proposed Medupi Flue Gas Desulphurisation (FGD) Retrofit Project
Report No.: 10ZIT10 55
mercury (Hg) concentration in coal is usually extremely low, significant attention is focused on its emission because its capture
by APC systems is problematic, and moreover, it is highly toxic to human health and it bioaccumulates.
Emission controls
Donnelly reported a review about metal emission control technologies for waste incineration. The major fraction of toxic metals
found in flue gases exists as fine-particle matter; nevertheless, a significant fraction of certain metals (such as B, Hg, Se)
exists in the vapour phase at typical incinerator (or boiler) exit flue gas conditions. The control of the particulate fraction is
achieved by utilizing traditional particulate control devices. Fabric filter and electrostatic precipitators (ESPs) efficiently trap
trace elements in the particulate phase with removal efficiency of the order of 99-99.9% for Class I elements, 95-99% for some
Class II elements such as Pb, Cd, Ni & Mn and less for the Class III elements.). As the efficiencies of particulate control
devices are generally low in the 0.1–1.5 µm particle size range, there has been concern that trace elements may escape
ESPs if they are ‘preferentially enriched’ on these fine particles.
Control of the vapour phase fraction is achieved through cooling of the flue gas and collection of the fine particulate thus
formed. Below, more details about the control methods of toxic metals are given.
Spray dryer absorption systems
Spray dryer absorption (SDA) has been widely applied for waste incinerator emission control, and it has demonstrated high
collection efficiencies for most toxic metals present in the flue gas. SDA has been specified as the best available control
technology in a number of municipal waste incinerator air permits.
Toxic metal removal in the dust collector is enhanced by cooling the incoming flue gas (from 2000 to 450 jC) as it passes
through the spray dryer. Because of the cooling, some vaporized metals condense to form fine particulates, which grow
through impaction and agglomeration with the very high number of lime droplets produced by atomization devices. Then these
agglomerated particles are easily removed. Generally, the lower the spray dryer outlet temperature, the higher the efficiency
of the acid gas absorption and the vaporized toxic metal removal. The minimum reliable operating outlet temperature depends
on the spray dryer and dust collector design, and on the composition of the dry fly ash reaction product. The spray dryer outlet
temperature must be maintained high enough to ensure complete reagent evaporation and the production of a free-flowing
product.
Wet scrubbers
Wet scrubbers control the vapour phase emissions through gas cooling and collection of the resulting condensed fine toxic
metal particulates. The most commonly used wet scrubbers for this type of service are the electrostatically (or ionizing)
enhanced wet scrubbers and the condensing wet scrubber.
Sorbent injection
It should be noticed that the high volatility and existence in the vapour phase make such trace element control a very difficult
task to accomplish. In principle, trace elements in vapour phase can be condensed by lowering the temperature. However, as
indicated above, the resulting loss in buoyancy of the flue gas would require reheating the flue gas, which would not be
economical. Furthermore, the resultant particles may be in the sub-micrometre sizes, and these particles are not effectively
captured in conventional particulate control devices. Capture of these species on sorbents by physical or chemical means is
therefore a very attractive alternative.

Air Quality Specialist Report for the Proposed Medupi Flue Gas Desulphurisation (FGD) Retrofit Project
Report No.: 10ZIT10 56
The sorbent–metal interaction can be physical or chemical in nature, or it can be a combination of these two processes
depending on the temperature under consideration. Mineral sorbents such as hydrated lime, limestone and kaolinite were
shown to be effective for arsenic, cadmium and lead capture at 1000–1300 °C range. In a fluidized bed combustor, optimum
capture of lead and cadmium using mineral sorbents takes place at around 700 °C. Other sorbents such as fly ash and
activated carbon have shown to be possible alternatives to these mineral sorbents. Trace elements such as As, Cu, Mo, Pb
and Zn have been shown to be concentrated on fly ash in a power station flue gas.
In the past few years, dry sorbent injection for in situ capture of metal from hot flue gas has been studied with the aim of
developing a potential control technique. Due to the occurrence of multiple trace elements in flue gas in addition to SO2, NOx,
etc. recent efforts of the research community have been geared towards developing a multifunctional sorbent which is capable
of reducing emission of most of the pollutants below a certain acceptable standard. Activated carbon offers an attractive option
for use as a multifunctional sorbent in the low temperature range because of its performance in capturing mercury and SO2.
Direct injection of activated carbon into the flue gas stream in the duct region has been proposed to be an effective technology
since it has the potential for high mercury removal efficiencies. Calcium-based sorbents, because of their low cost, have been
used extensively for the capture of acidic species such as sulfur dioxide. These sorbents also offer an attractive option to be
used as multifunctional sorbents because of their ability to capture sulfur species as well as trace elements such as selenium
and arsenic species. When used as a sorbent to capture the toxic species in the flue gas, the sorbent interacts with various
components and the extent of interaction kinetics depends on the individual sorbent species.
Emissions levels of toxic metals from incinerators equipped with modern air-pollution control systems are several orders of
magnitude lower than levels in 1980. High collection efficiencies are achieved for the 10 toxic metals proposed for regulation
(Ag, As, Ba, Be, Cd, Cr, Hg, Pb, Sb and Tl).

Address: 480 Smuts Drive, Halfway Gardens | Postal: P O Box 5260, Halfway House, 1685 Tel: +27 (0)11 805 1940 | Fax: +27 (0)11 805 7010
www.airshed.co.za
Prepared by:
Reneé von Gruenewaldt
Technical support:
Nicolette von Reiche
Report No: 14ZIT08_N Rev 0 | Date: February 2018
Noise Specialist Report for the Proposed Medupi Flue Gas Desulphurisation (FGD) Retrofit Project
Project done for Zitholele Consulting

Noise Specialist Report for the Proposed Medupi Flue Gas Desulphurisation (FGD) Retrofit Project
Report Number: 14ZIT08_N i
Report Details
Report Title Noise Specialist Report for the Proposed Medupi Flue Gas Desulphurisation (FGD) Retrofit Project
Client Zitholele Consulting
Report Number 14ZIT08_N
Report Version Rev 0.3
Date February 2018
Prepared by Reneé von Gruenewaldt (Pr. Sci. Nat.), MSc (University of Pretoria)
Technical support Nicolette von Reiche, BEng Hons (Mech.) (University of Pretoria)
Notice
Airshed Planning Professionals (Pty) Ltd is a consulting company located in Midrand, South Africa, specialising in all aspects of air quality, ranging from nearby neighbourhood concerns to regional air pollution impacts as well as noise impact assessments. The company originated in 1990 as Environmental Management Services, which amalgamated with its sister company, Matrix Environmental Consultants, in 2003.
Declaration Airshed is an independent consulting firm with no interest in the project other than to fulfil the contract between the client and the consultant for delivery of specialised services as stipulated in the terms of reference.
Copyright Warning
Unless otherwise noted, the copyright in all text and other matter (including the manner of presentation) is the exclusive property of Airshed Planning Professionals (Pty) Ltd. It is a criminal offence to reproduce and/or use, without written consent, any matter, technical procedure and/or technique contained in this document.
Revision Record
Version Date Section(s) Revised Summary Description of Revision(s)
Rev 0 24 November 2016 Draft report For client review
Rev 0.1 5 December 2016 Whole report Grammatical changes
Rev 0.2 18 January 2018 Section 4 Incorporation of changes to authorisation and licencing approach in 2017
Rev 0.3 7 February 2018 Executive summary and Section 1 Incorporation of comments from client

Noise Specialist Report for the Proposed Medupi Flue Gas Desulphurisation (FGD) Retrofit Project
Report Number: 14ZIT08_N ii
NEMA Regulation (2014), Appendix 6
NEMA Regulations (2014) - Appendix 6 Relevant section in report
Details of the specialist who prepared the report. Report Details (page i)
The expertise of that person to compile a specialist report including curriculum vitae.
Section 7: Annex A – Specialist’s Curriculum Vitae
A declaration that the person is independent in a form as may be specified by the competent authority.
Report Details (page i)
An indication of the scope of, and the purpose for which, the report was prepared.
Section 1.1: Purpose
Section 1.2: Scope of Work
The date and season of the site investigation and the relevance of the season to the outcome of the assessment.
Section 3.3: Sampled Baseline and Representative Pre-Development Noise Levels
Note: Seasonal changes immaterial to study outcome
A description of the methodology adopted in preparing the report or carrying out the specialised process.
Section 1.5: Approach and Methodology
The specific identified sensitivity of the site related to the activity and its associated structures and infrastructure.
Section 3: Description of the Receiving Environment
An identification of any areas to be avoided, including buffers.
Not applicable
A map superimposing the activity including the associated structures and infrastructure on the environmental sensitivities of the site including areas to be avoided, including buffers.
Not applicable
A description of any assumptions made and any uncertainties or gaps in knowledge.
Section 1.6: Limitations and Assumptions
A description of the findings and potential implications of such findings on the impact of the proposed activity, including identified alternatives, on the environment.
Section 4: Impact Assessment
Site alternatives were not considered
Any mitigation measures for inclusion in the EMPr. Section 5: Management, Mitigation and Recommendations
Any conditions for inclusion in the environmental authorisation
Section 5: Management, Mitigation and Recommendations
Any monitoring requirements for inclusion in the EMPr or environmental authorisation.
Section 5.3: Monitoring
A reasoned opinion as to whether the proposed activity or portions thereof should be authorised.
Section 5: Management, Mitigation and Recommendations
If the opinion is that the proposed activity or portions thereof should be authorised, any avoidance, management and mitigation measures that should be included in the EMPr, and where applicable, the closure plan.
Section 5: Management, Mitigation and Recommendations
A description of any consultation process that was undertaken during the course of carrying out the study.
Not applicable
A summary and copies if any comments that were received during any consultation process.
No comments received
Any other information requested by the competent authority.
Not applicable

Noise Specialist Report for the Proposed Medupi Flue Gas Desulphurisation (FGD) Retrofit Project
Report Number: 14ZIT08_N iii
Glossary and Abbreviations
Airshed Airshed Planning Professionals (Pty) Ltd
dB Descriptor that is used to indicate 10 times a logarithmic ratio of quantities that have the same units, in this case sound pressure.
dBA Descriptor that is used to indicate 10 times a logarithmic ratio of quantities that have the same units, in this case sound pressure that has been A-weighted to simulate human hearing.
EMP Environmental Management Plan
FGD Flue Gas Desulphurisation
IFC International Finance Corporation
ISO International Standards Organisation
kW Power in kilo Watt
LAeq (T) The A-weighted equivalent sound pressure level, where T indicates the time over which the noise is averaged (calculated or measured) (in dBA)
LAIeq (T) The impulse corrected A-weighted equivalent sound pressure level, where T indicates the time over which the noise is averaged (calculated or measured) (in dBA)
LReq,d The LAeq rated for impulsive sound and tonality in accordance with SANS 10103 for the day-time period, i.e. from 06:00 to 22:00.
LReq,n The LAeq rated for impulsive sound and tonality in accordance with SANS 10103 for the night-time period, i.e. from 22:00 to 06:00.
LR,dn The LAeq rated for impulsive sound and tonality in accordance with SANS 10103 for the period of a day and night, i.e. 24 hours, and wherein the LReq,n has been weighted with 10dB in order to account for the additional disturbance caused by noise during the night.
LA90 The A-weighted 90% statistical noise level, i.e. the noise level that is exceeded during 90% of the measurement period. It is a very useful descriptor which provides an indication of what the LAeq could have been in the absence of noisy single events and is considered representative of background noise levels (LA90) (in dBA)
LAFmax The A-weighted maximum sound pressure level recorded during the measurement period
LAFmin The A-weighted minimum sound pressure level recorded during the measurement period
LP Sound pressure level (in dB)
LPA A-weighted sound pressure level (in dBA)
LPZ Un-weighted sound pressure level (in dB)
LW Sound Power Level (in dB)
MW Power in mega Watt
NEMAQA National Environment Management Air Quality Act
NSR Noise sensitive receptor
SABS South African Bureau of Standards
SANS South African National Standards
SLM Sound Level Meter
SoW Scope of Work
WHO World Health Organisation

Noise Specialist Report for the Proposed Medupi Flue Gas Desulphurisation (FGD) Retrofit Project
Report Number: 14ZIT08_N iv
Executive Summary
Airshed Planning Professionals (Pty) Limited was appointed by Zitholele Consulting to undertake a noise impact assessment
for a proposed Medupi Flue Gas Desulphurisation (FGD) Retrofit Project (hereafter referred to as the project).
Confirmed scope of work includes assessment of the following activities and infrastructure:
1. Construction and operation of a rail yard/siding to transport Limestone from a source defined point via the existing
rail network to the Medupi Power Station and proposed rail yard / siding. The rail yard infrastructure will include
storage of fuel (diesel) in above ground tanks and 15m deep excavation for tippler building infrastructure;
2. Construction and operation of limestone storage area, preparation area, handling and transport via truck and
conveyor to the FGD system located near the generation units of the Medupi Power Station;
3. The construction and operation of the wet FGD system that will reduce the SO2 content in the flue gas emitted;
4. Construction and operation of associated infrastructure required for operation of the FGD system and required
services to ensure optimal functioning of the wet FGD system. The associated FGD infrastructure include a facility
for storage of fuel (diesel), installation of storm water infrastructure and conservancy tanks for sewage;
5. The handling, treatment and conveyance of gypsum and effluent from the gypsum dewatering plant.
6. Pipeline for the transportation of waste water from the gypsum dewatering plant and its treatment at the waste water
treatment plant (WWTP) that will be located close to the FGD infrastructure within the Medupi Power Station;
7. Construction and operation of the WWTP;
8. Management, handling, transport and storage of salts and sludge generated through the waste water treatment
process at a temporary waste storage facility.
9. The transportation of salts and sludge via trucks from the temporary waste storage facility to a final Waste Disposal
Facility to be contracted by Eskom for the first 5 years of operation of the FGD system.
10. Disposal of gypsum together with ash on the existing licenced ash disposal facility (ADF), with resulting increase in
height of the ADF from 60m to 72m.
The main objective of this study was to establish baseline/pre-development noise levels in the study area and to quantify the
extent to which ambient noise levels will change as a result of the project. The baseline and impact study then informed the
noise management and mitigation measures recommended for adoption as part of the project’s Environmental Management
Plan (EMP).
To achieve this objective, the following tasks were included in the scope of work (SoW):
1. A review of technical project information;
2. A review of the legal requirements and applicable environmental noise guidelines;
3. A study of the receiving (baseline) acoustic environment, including:
a. The identification of noise sensitive receptors (NSRs) from available maps;
b. A study of environmental noise attenuation potential by referring to available weather records and land
use data sources; and
c. Determining representative baseline noise levels through the analysis of sampled environmental noise
levels obtained from a survey conducted in September 2015.
4. An impact assessment, including:
a. The establishment of a source inventory for the project;
b. Noise propagation simulations to determine environmental noise levels; and,
c. The screening of simulated noise levels against environmental noise criteria.
5. The identification and recommendation of suitable mitigation measures and monitoring requirements; and,
6. A specialist noise impact assessment report.

Noise Specialist Report for the Proposed Medupi Flue Gas Desulphurisation (FGD) Retrofit Project
Report Number: 14ZIT08_N v
In the assessment of sampled and simulated noise levels reference was made to the International Finance Corporation (IFC)
guidelines for residential, institutional and educational receptors (55 dBA during the day and 45 dBA during the night) since
these (a) are applicable to nearby NSRs and (b) in-line with South African National Standards (SANS) 10103 guidelines for
urban districts. The IFC’s 3 dBA increase criterion is used to determine the potential for noise impact.
The baseline acoustic environment was described in terms of the location of NSRs in relation to proposed activities, the ability
of the environment to attenuate noise over long distances and existing or pre-development noise levels. The following was
found:
• Several individual residential dwellings are located within a few kilometres from the Medupi Power Station. There
are also residential areas to the north and northeast of the Matimba Power Station.
• Baseline noise levels are affected by road traffic, mining activities, birds and insects. Noise levels in the vicinity of
the Medupi Power Station are currently comparable to levels typically found in suburban districts. Representative
day- and night-time as well as 24-hour baseline noise levels of 48.3 dBA, 43.7 dBA and 50.9 dBA respectively were
calculated from survey results.
Sound power levels for main equipment were determined from equipment specifications. The source inventory, local
meteorological conditions and information on local land use were used to populate the noise propagation model (CadnaA,
ISO 9613). The propagation of noise was calculated over an area of 10 km east-west by 10 km north-south. The area was
divided into a grid matrix with a 10 m resolution and NSRs were included as discrete receptors. The following was found:
• Noise impacts during the operational phase will be more notable at night.
• The operational phase will result in noise levels that do not exceed the selected impact criteria at the nearest NSR.
‘Little’ to no reaction from individuals within this impacted area may be expected.
It is important to note the following conservative assumption when interpreting results summarised above. Shielding effects
due to infrastructure and land topography were also not taken into account providing a conservative aspect in the simulated
noise levels.
It was concluded that, given the conservative nature of the assessment, the implementation of the basic good practice
management measures recommended in this report will ensure low noise impact levels. From a noise perspective, the project
may proceed.

Noise Specialist Report for the Proposed Medupi Flue Gas Desulphurisation (FGD) Retrofit Project
Report Number: 14ZIT08_N vi
Table of Contents
1 INTRODUCTION ................................................................................................................................................. 1
1.1 Purpose .................................................................................................................................................................. 1
1.2 Scope of Work ........................................................................................................................................................ 1
1.3 Description of Activities from a Noise Perspective and Selection of Assessment Scenarios ................................. 2
1.4 Background to Environmental Noise and the Assessment Thereof ....................................................................... 2
1.5 Approach and Methodology .................................................................................................................................... 5
1.6 Limitations and Assumptions .................................................................................................................................. 7
2 LEGAL REQUIREMENTS AND NOISE LEVEL GUIDELINES ..................................................................................... 8
2.1 SANS 10103 (2008) ............................................................................................................................................... 8
2.2 IFC Guidelines on Environmental Noise ................................................................................................................. 9
2.3 Criteria Applied in this Assessment ........................................................................................................................ 9
3 DESCRIPTION OF THE RECEIVING ENVIRONMENT ............................................................................................. 10
3.1 Noise Sensitive Receptors ................................................................................................................................... 10
3.2 Environmental Noise Propagation and Attenuation Potential ............................................................................... 11
3.3 Sampled Baseline and Representative Pre-Development Noise Levels .............................................................. 12
4 IMPACT ASSESSMENT .................................................................................................................................... 20
4.1 Noise Sources and Sound Power Levels ............................................................................................................. 20
4.2 Noise Propagation and Simulated Noise Levels .................................................................................................. 22
4.3 Impact Significance Rating ................................................................................................................................... 26
5 MANAGEMENT, MITIGATION AND RECOMMENDATIONS ..................................................................................... 28
5.1 Good Engineering and Operational Practices ...................................................................................................... 28
5.2 Traffic .................................................................................................................................................................... 28
5.3 Monitoring ............................................................................................................................................................. 29
5.4 Conclusion ............................................................................................................................................................ 29
6 REFERENCES ................................................................................................................................................. 30
7 ANNEX A – SPECIALIST’S CURRICULUM VITAE ................................................................................................ 31

Noise Specialist Report for the Proposed Medupi Flue Gas Desulphurisation (FGD) Retrofit Project
Report Number: 14ZIT08_N vii
List of Tables
Table 1: Typical rating levels for outdoor noise, SANS 10103 (2008) ....................................................................................... 8
Table 2: IFC noise level guidelines ............................................................................................................................................ 9
Table 3: Summary of the noise survey conducted by Airshed on 3 September 2015 ............................................................. 13
Table 4: Equivalent continuous ratings for measured noise levels in the existing Medupi waste disposal facility area undertaken
by JKA during April 2005 (Jorgens Keet Associates, 2014) .................................................................................................... 19
Table 5: Operational phase source noise inventory for the project.......................................................................................... 21
Table 6: Impact rating matrix for the proposed project operations ........................................................................................... 26
List of Figures
Figure 1: A-weighting curve ....................................................................................................................................................... 3
Figure 2: Location of NSRs ...................................................................................................................................................... 10
Figure 3: Wind roses for day- and night-time conditions at the Medupi Power Station site (MM5 data) ................................. 11
Figure 4: Pictures of baseline noise measurement locations undertaken for the project ......................................................... 15
Figure 5: Baseline day-time noise measurement at noise sampling site 1 .............................................................................. 16
Figure 6: Baseline night-time noise measurement at noise sampling site 1 ............................................................................ 16
Figure 7: Baseline day-time noise measurement at noise sampling site 2 .............................................................................. 17
Figure 8: Baseline night-time noise measurement at noise sampling site 2 ............................................................................ 17
Figure 9: Baseline day-time noise measurement at noise sampling site 3 .............................................................................. 18
Figure 10: Baseline night-time noise measurement at noise sampling site 3 .......................................................................... 18
Figure 11: Simulated equivalent continuous day-time rating level (LReq,d) for project activities ............................................... 23
Figure 12: Simulated increase in equivalent continuous day-time rating level (LReq,d) above the baseline ........................... 23
Figure 13: Simulated equivalent continuous night-time rating level (LReq,n) for project activities ............................................. 24
Figure 14: Simulated increase in equivalent continuous night-time rating level (LReq,n) above the baseline ......................... 24
Figure 15: Simulated equivalent continuous day/night rating level (LReq,dn) for project activities ............................................. 25
Figure 16: Simulated increase in equivalent continuous day/night rating level (LReq,dn) above the baseline ......................... 25

Noise Specialist Report for the Proposed Medupi Flue Gas Desulphurisation (FGD) Retrofit Project
Report Number: 14ZIT08_N 1
1 INTRODUCTION
Airshed Planning Professionals (Pty) Limited was appointed by Zitholele Consulting to undertake a noise impact assessment
for a proposed Medupi Flue Gas Desulphurisation (FGD) Retrofit Project (hereafter referred to as the project).
1.1 Purpose
The main purpose of the noise study is to determine the potential impact on the acoustic climate and noise sensitive receptors
(NSRs) given activities proposed as part of the project.
1.2 Scope of Work
Confirmed Scope of Work (SoW) includes assessment of the following activities and infrastructure:
1. Construction and operation of a rail yard/siding to transport Limestone from a source defined point via the existing
rail network to the Medupi Power Station and proposed rail yard / siding. The rail yard infrastructure will include
storage of fuel (diesel) in above ground tanks and 15m deep excavation for tippler building infrastructure;
2. Construction and operation of limestone storage area, preparation area, handling and transport via truck and
conveyor to the FGD system located near the generation units of the Medupi Power Station;
3. The construction and operation of the wet FGD system that will reduce the SO2 content in the flue gas emitted;
4. Construction and operation of associated infrastructure required for operation of the FGD system and required
services to ensure optimal functioning of the wet FGD system. The associated FGD infrastructure include a facility
for storage of fuel (diesel), installation of storm water infrastructure and conservancy tanks for sewage;
5. The handling, treatment and conveyance of gypsum and effluent from the gypsum dewatering plant.
6. Pipeline for the transportation of waste water from the gypsum dewatering plant and its treatment at the waste water
treatment plant (WWTP) that will be located close to the FGD infrastructure within the Medupi Power Station;
7. Construction and operation of the WWTP;
8. Management, handling, transport and storage of salts and sludge generated through the waste water treatment
process at a temporary waste storage facility.
9. The transportation of salts and sludge via trucks from the temporary waste storage facility to a final Waste Disposal
Facility to be contracted by Eskom for the first 5 years of operation of the FGD system.
10. Disposal of gypsum together with ash on the existing licenced ash disposal facility (ADF), with resulting increase in
height of the ADF from 60m to 72m.
The following tasks were included in the SoW:
1. A review of technical project information;
2. A review of the legal requirements and applicable environmental noise guidelines;
3. A study of the receiving (baseline) acoustic environment, including:
a. The identification of NSRs from available maps;
b. A study of environmental noise attenuation potential by referring to available weather records and land
use data sources; and
c. Determining representative baseline noise levels through the analysis of sampled environmental noise
levels obtained from a survey conducted in September 2015.
4. An impact assessment, including:
a. The establishment of a source inventory for the project;
b. Noise propagation simulations to determine environmental noise levels; and,
c. The screening of simulated noise levels against environmental noise criteria.

Noise Specialist Report for the Proposed Medupi Flue Gas Desulphurisation (FGD) Retrofit Project
Report Number: 14ZIT08_N 2
5. The identification and recommendation of suitable mitigation measures and monitoring requirements; and,
6. A specialist noise impact assessment report.
1.3 Description of Activities from a Noise Perspective and Selection of Assessment Scenarios
Noise will be generated during the project’s construction, operational and decommissioning/closure phases. Construction and
decommissioning/closure phase activities, however, will be for limited time frames and was not assessed in detail for the
current study.
1.3.1 Construction Phase
During the construction phase several facilities need to be established. These include; contractor’s laydown areas, workshops,
stores for the storing and handling of construction materials, a parking area for cars and equipment, etc. These facilities will
likely be removed at the end of the construction phase.
It is anticipated the construction phase activities would result in noise from mobile construction equipment, metal and
masonry/concrete works, ancillary equipment such as welders, compressors and generators as well as traffic for the delivery
of materials and construction staff transport.
1.3.2 Operational Phase
The proposed project will comprise of operations at the Power Station including boilers, turbines, ball mills, pumps, fans,
conveyors, stackers, and road activity. The detail of the sources is provided in Section 4.1.
1.3.3 Decommissioning and Closure Phase
The removal of infrastructure will take place during the decommission phase. Diesel mobile equipment and demolition activities
will generate noise.
1.4 Background to Environmental Noise and the Assessment Thereof
Before more details regarding the approach and methodology adopted in the assessment is given, the reader is provided with
some background, definitions and conventions used in the measurement, calculation and assessment of environmental noise.
Noise is generally defined as unwanted sound transmitted through a compressible medium such as air. Sound in turn, is
defined as any pressure variation that the ear can detect. Human response to noise is complex and highly variable as it is
subjective rather than objective.
Noise is reported in decibels (dB). “dB” is the descriptor that is used to indicate 10 times a logarithmic ratio of quantities that
have the same units, in this case sound pressure. The relationship between sound pressure and sound pressure level is
illustrated in this equation.
𝐿𝑝 = 20 ∙ log10 (𝑝
𝑝𝑟𝑒𝑓)
Where:

Noise Specialist Report for the Proposed Medupi Flue Gas Desulphurisation (FGD) Retrofit Project
Report Number: 14ZIT08_N 3
Lp is the sound pressure level in dB;
p is the actual sound pressure in Pa; and
pref is the reference sound pressure (pref in air is 20 µPa)
1.4.1 Perception of Sound
Sound has already been defined as any pressure variation that can be detected by the human ear. The number of pressure
variations per second is referred to as the frequency of sound and is measured in hertz (Hz). The hearing of a young, healthy
person ranges between 20 Hz and 20 000 Hz.
In terms of LP, audible sound ranges from the threshold of hearing at 0 dB to the pain threshold of 130 dB and above. Even
though an increase in sound pressure level of 6 dB represents a doubling in sound pressure, an increase of 8 to 10 dB is
required before the sound subjectively appears to be significantly louder. Similarly, the smallest perceptible change is about
1 dB (Brüel & Kjær Sound & Vibration Measurement A/S, 2000).
1.4.2 Frequency Weighting
Since human hearing is not equally sensitive to all frequencies, a ‘filter’ has been developed to simulate human hearing. The
‘A-weighting’ filter simulates the human hearing characteristic, which is less sensitive to sounds at low frequencies than at
high frequencies (Figure 1). “dBA” is the descriptor that is used to indicate 10 times a logarithmic ratio of quantities, that have
the same units (in this case sound pressure) that has been A-weighted.
Figure 1: A-weighting curve

Noise Specialist Report for the Proposed Medupi Flue Gas Desulphurisation (FGD) Retrofit Project
Report Number: 14ZIT08_N 4
1.4.3 Adding Sound Pressure Levels
Since sound pressure levels are logarithmic values, the sound pressure levels as a result of two or more sources cannot just
simply be added together. To obtain the combined sound pressure level of a combination of sources such as those at an
industrial plant, individual sound pressure levels must be converted to their linear values and added using:
𝐿𝑝_𝑐𝑜𝑚𝑏𝑖𝑛𝑒𝑑 = 10 ∙ log (10𝐿𝑝110 + 10
𝐿𝑝210 + 10
𝐿𝑝310 +⋯10
𝐿𝑝𝑖10 )
This implies that if the difference between the sound pressure levels of two sources is nil the combined sound pressure level
is 3 dB more than the sound pressure level of one source alone. Similarly, if the difference between the sound pressure levels
of two sources is more than 10 dB, the contribution of the quietest source can be disregarded (Brüel & Kjær Sound & Vibration
Measurement A/S, 2000).
1.4.4 Environmental Noise Propagation
Many factors affect the propagation of noise from source to receiver. The most important of these are:
• The type of source and its sound power (LW);
• The distance between the source and the receiver;
• Atmospheric conditions (wind speed and direction, temperature and temperature gradient, humidity etc.);
• Obstacles such as barriers or buildings between the source and receiver;
• Ground absorption; and
• Reflections.
To arrive at a representative result from either measurement or calculation, all these factors must be taken into account (Brüel
& Kjær Sound & Vibration Measurement A/S, 2000).
1.4.5 Environmental Noise Indices
In assessing environmental noise either by measurement or calculation, reference is generally made to the following indices:
• LAeq (T) – The A-weighted equivalent sound pressure level, where T indicates the time over which the noise is
averaged (calculated or measured). The International Finance Corporation (IFC) provides guidance with respect to
LAeq (1 hour), the A-weighted equivalent sound pressure level, averaged over 1 hour.
• LAIeq (T) – The impulse corrected A-weighted equivalent sound pressure level, where T indicates the time over which
the noise is averaged (calculated or measured). In the South African Bureau of Standards’ (SABS) South African
National Standard (SANS) 10103 of 2008 for ‘The measurement and rating of environmental noise with respect to
annoyance and to speech communication’ prescribes the sampling of LAIeq (T).
• LReq,d – The LAeq rated for impulsive sound (LAIeq) and tonality in accordance with SANS 10103 for the day-time
period, i.e. from 06:00 to 22:00.
• LReq,n – The LAeq rated for impulsive sound (LAIeq) and tonality in accordance with SANS 10103 for the night-time
period, i.e. from 22:00 to 06:00.
• LR,dn – The LAeq rated for impulsive sound (LAIeq) and tonality in accordance with SANS 10103 for the period of a day
and night, i.e. 24 hours, and wherein the LReq,n has been weighted with 10 dB in order to account for the additional
disturbance caused by noise during the night.

Noise Specialist Report for the Proposed Medupi Flue Gas Desulphurisation (FGD) Retrofit Project
Report Number: 14ZIT08_N 5
• LA90 – The A-weighted 90% statistical noise level, i.e. the noise level that is exceeded during 90% of the
measurement period. It is a very useful descriptor which provides an indication of what the LAeq could have been in
the absence of noisy single events and is considered representative of background noise levels.
• LAFmax – The maximum A-weighted noise level measured with the fast time weighting. It’s the highest level of noise
that occurred during a sampling period.
• LAFmin – The minimum A-weighted noise level measured with the fast time weighting. It’s the lowest level of noise
that occurred during a sampling period.
1.5 Approach and Methodology
The assessment included a study of the legal requirements pertaining to noise impacts, a study of the physical environment
of the area surrounding the project and the analyses of existing noise levels in the area. The impact assessment focused on
the estimation of sound power levels (LW’s) (noise ‘emissions’) and sound pressure levels (LP’s) (noise impacts) associated
with the operational phase. The findings of the assessment components informed recommendations of management
measures, including mitigation and monitoring. Individual aspects of the noise impact assessment methodology are discussed
in more detail below.
1.5.1 Review of Assessment Criteria
In South Africa, provision is made for the regulation of noise under the National Environmental Management Air Quality Act
(NEMAQA) (Act. 39 of 2004) but environmental noise limits have yet to be set. It is believed that when published, national
criteria will make extensive reference to South African National Standard (SANS) 10103 of 2008 ‘The measurement and rating
of environmental noise with respect to annoyance and to speech communication’. These guidelines, which are in line with
those published by the International Finance Corporation (IFC) and World Health Organisation (WHO), were considered in
the assessment.
1.5.2 Study of the Receiving Environment
NSRs generally include private residences, community buildings such as schools, hospitals and any publicly accessible areas
outside the industrial facility’s property. Homesteads and residential areas which were included in the assessment as NSRs
were identified from available maps and satellite imagery.
The ability of the environment to attenuate noise as it travels through the air was studied by considering local meteorology
and land use. The atmospheric attenuation potential was described based on MM5 meteorological data for the period 2011 to
2013. Land cover data was obtained from Google Earth satellite.
The extent of noise impacts as a result of an intruding noise depends largely on existing noise levels in an area. Higher
ambient noise levels will result in less noticeable noise impacts and a smaller impact area. The opposite also holds true.
Increases in noise will be more noticeable in areas with low ambient noise levels. Data from a baseline noise survey conducted
by Airshed as part of the scope of work was studied to determine representative baseline noise levels for use in the assessment
of cumulative impacts.
1.5.3 Source Inventory
The source noise inventory was informed by:
• Equipment specific LW predictive equations for industrial equipment as published by Crocker (1998);

Noise Specialist Report for the Proposed Medupi Flue Gas Desulphurisation (FGD) Retrofit Project
Report Number: 14ZIT08_N 6
• Generic area wide LW’s for industrial areas as published by the European Commission (EC WG-AEN, 2003); and
• Sound power levels measured by acoustic consultants.
1.5.4 Noise Propagation Simulations
The propagation of noise from proposed activities was simulated with the DataKustic CadnaA software. Use was made of the
International Organisation for Standardization’s (ISO) 9613 module for outdoor noise propagation from industrial noise
sources.
ISO 9613 specifies an engineering method for calculating the attenuation of sound during propagation outdoors in order to
predict the levels of environmental noise at a distance from a variety of sources. The method predicts the equivalent continuous
Α-weighted sound pressure level under meteorological conditions favourable to propagation from sources of known sound
emission.
These conditions are for downwind propagation or, equivalently, propagation under a well-developed moderate ground based
temperature inversion, which commonly occurs at night.
The method also predicts an average A-weighted sound pressure level. The average A-weighted sound pressure level
encompasses levels for a wide variety of meteorological conditions. The method specified in ISO 9613 consists specifically of
octave-band algorithms (with nominal midband frequencies from 63 Hz to 8 kHz) for calculating the attenuation of sound which
originates from a point sound source, or an assembly of point sources. The source (or sources) may be moving or stationary.
Specific terms are provided in the algorithms for the following physical effects. A basic representation of the model is given:
𝐿𝑃 = 𝐿𝑊 −∑[𝐾1, 𝐾2, 𝐾3, 𝐾4, 𝐾5, 𝐾6]
Where;
LP is the sound pressure level at the receiver
LW is the sound power level of the source
K1 is the correction for geometrical divergence
K2 is the correction for atmospheric absorption
K3 is the correction for the effect of ground surface
K4 is the correction for reflection from surfaces
K5 is the correction for screening by obstacles
This method is applicable in practice to a great variety of noise sources and environments. It is applicable, directly or indirectly,
to most situations concerning road or rail traffic, industrial noise sources, construction activities, and many other ground-based
noise sources.
To apply the method of ISO 9613, several parameters need to be known with respect to the geometry of the source and of
the environment, the ground surface characteristics, and the source strength in terms of octave-band sound power levels for
directions relevant to the propagation.
If the dimensions of a noise source are small compared with the distance to the listener, it is called a point source. All sources
at noise at the proposed plant were quantified as point sources. The sound energy from a point source spreads out spherically,
so that the sound pressure level is the same for all points at the same distance from the source, and decreases by 6 dB per
doubling of distance. This holds true until ground and air attenuation noticeably affect the level. The impact of an intruding

Noise Specialist Report for the Proposed Medupi Flue Gas Desulphurisation (FGD) Retrofit Project
Report Number: 14ZIT08_N 7
industrial/mining noise on the environment will therefore rarely extend over more than 5 km from the source and is therefore
always considered “local” in extent.
The propagation of noise was calculated over an area of 10 km east-west by 10 km north-south with the proposed project
located centrally. The area was divided into a grid matrix with a 10 m resolution and NSRs were included as discrete receptors.
The model calculates LP’s at each grid and discrete receptor point at a height of 1.5 m above ground level.
1.5.5 Presentation of Results
Noise impacts were calculated in terms of:
• Equivalent continuous day, night and day-night rating levels (LReq,d, LReq,n and LR,dn) in comparison with guidelines.
These levels were assessed for the project activities;
• The effective increase ambient day, night and day-night noise levels over estimated baseline LReq,d, LReq,n and LR,dn
as a result of the project.
Results are presented in isopleth form. An isopleth is a line on a map connecting points at which a given variable (in this case
LP) has a specified constant value. This is analogous to contour lines on a map showing terrain elevation. In the assessment
of environmental noise, isopleths present lines of constant noise level as a function of distance.
Simulated noise levels were assessed according to guidelines published in SANS 10103 and by the IFC. To assess annoyance
at nearby places of residence, reference was made to guidelines published in SANS 10103.
1.5.6 Recommendations of Management and Mitigation
The findings of the noise specialist study informed the recommendation of suitable noise management and mitigation
measures.
1.6 Limitations and Assumptions
The main assumptions and limitations for the current assessment are as follows:
• The quantification of sources of noise was restricted to activities associated with the project scope.
• Shielding effect of infrastructure was not considered in simulations. This approach will provide a conservative
estimate of the estimated sound pressure levels from the project.
• Terrain was not accounted for in this assessment, providing a conservative estimate of noise levels as no natural
shielding is taken into account.
• Source strength calculations were based on theoretical estimates not taking into account acoustic shielding or
mitigation as a conservative estimate.
• The background used for the estimation of cumulative change in noise levels was selected from measured data
points within the study area.

Noise Specialist Report for the Proposed Medupi Flue Gas Desulphurisation (FGD) Retrofit Project
Report Number: 14ZIT08_N 8
2 LEGAL REQUIREMENTS AND NOISE LEVEL GUIDELINES
2.1 SANS 10103 (2008)
SANS 10103 (2008) successfully addresses the manner in which environmental noise measurements are to be taken and
assessed in South Africa, and is fully aligned with the WHO guidelines for Community Noise (WHO, 1999). The values given
in Table 1 are typical rating levels that should not be exceeded outdoors in the different districts specified. Outdoor ambient
noise exceeding these levels will be considered to be annoying to local noise sensitive receptors.
Table 1: Typical rating levels for outdoor noise, SANS 10103 (2008)
Type of district
Equivalent Continuous Rating Level (LReq,T) for Outdoor Noise
Day/night
LR,dn(c) (dBA)
Day-time
LReq,d(a) (dBA)
Night-time
LReq,n(b) (dBA)
Rural districts 45 45 35
Suburban districts with little road traffic 50 50 40
Urban districts 55 55 45
Urban districts with one or more of the following; business premises; and main roads
60 60 50
Central business districts 65 65 55
Industrial districts 70 70 60
Notes
(a) LReq,d =The LAeq1 rated for impulsive sound and tonality in accordance with SANS 10103 for the day-time period, i.e. from 06:00
to 22:00.
(b) LReq,n =The LAeq rated for impulsive sound and tonality in accordance with SANS 10103 for the night-time period, i.e. from 22:00
to 06:00.
(c) LR,dn =The LAeq rated for impulsive sound and tonality in accordance with SANS 10103 for the period of a day and night, i.e. 24
hours, and wherein the LReq,n has been weighted with 10dB in order to account for the additional disturbance caused by noise
during the night.
SANS 10103 also provides a useful guideline for estimating community response to an increase in the general ambient noise
level caused by intruding noise. If Δ is the increase in noise level, the following criteria are of relevance:
• “ 0 dB: There will be no community reaction;
• 0 dB < 10 dB: There will be ‘little’ reaction with ‘sporadic complaints’;
• 5 dB < 15 dB: There will be a ‘medium’ reaction with ‘widespread complaints’. = 10 dB is subjectively perceived
as a doubling in the loudness of the noise;
• 10 dB < 20 dB: There will be a ‘strong’ reaction with ‘threats of community action’; and
• 15 dB < : There will be a ‘very strong’ reaction with ‘vigorous community action’.
The categories of community response overlap because the response of a community does not occur as a stepwise function,
but rather as a gradual change.
1 LAeq, T is the A-weighted equivalent sound pressure level, where T indicates the time over which the noise is averaged (calculated or measured).

Noise Specialist Report for the Proposed Medupi Flue Gas Desulphurisation (FGD) Retrofit Project
Report Number: 14ZIT08_N 9
2.2 IFC Guidelines on Environmental Noise
The IFC General Environmental Health and Safety Guidelines on noise address impacts of noise beyond the property
boundary of the facility under consideration and provides noise level guidelines.
The IFC states that noise impacts should not exceed the levels presented in Table 2, or result in a maximum increase above
background levels of 3 dBA at the nearest receptor location off-site (IFC, 2007). For a person with average hearing acuity an
increase of less than 3 dBA in the general ambient noise level is not detectable. = 3 dBA is, therefore, a useful significance
indicator for a noise impact.
It is further important to note that the IFC noise level guidelines for residential, institutional and educational receptors
correspond with the SANS 10103 guidelines for urban districts.
Table 2: IFC noise level guidelines
Area One Hour LAeq (dBA)
07:00 to 22:00
One Hour LAeq (dBA)
22:00 to 07:00
Industrial receptors 70 70
Residential, institutional and educational receptors 55 45
2.3 Criteria Applied in this Assessment
Reference is made to the IFC guidelines for residential, institutional and educational receptors (55 dBA during the day and 45
dBA during the night) since these are -
(a) applicable to nearby NSRs; and
(b) in-line with SANS 10103 guidelines for urban districts.
For that reason, the SANS 10103 24-hour limit of 55 dBA for urban districts is also used. The IFC’s 3 dBA increase criterion
is used to determine the potential for noise impact together with the SANS 10103 guideline for community response of ‘little’
reaction with ‘sporadic complaints’ (0 dB < 10 dB).
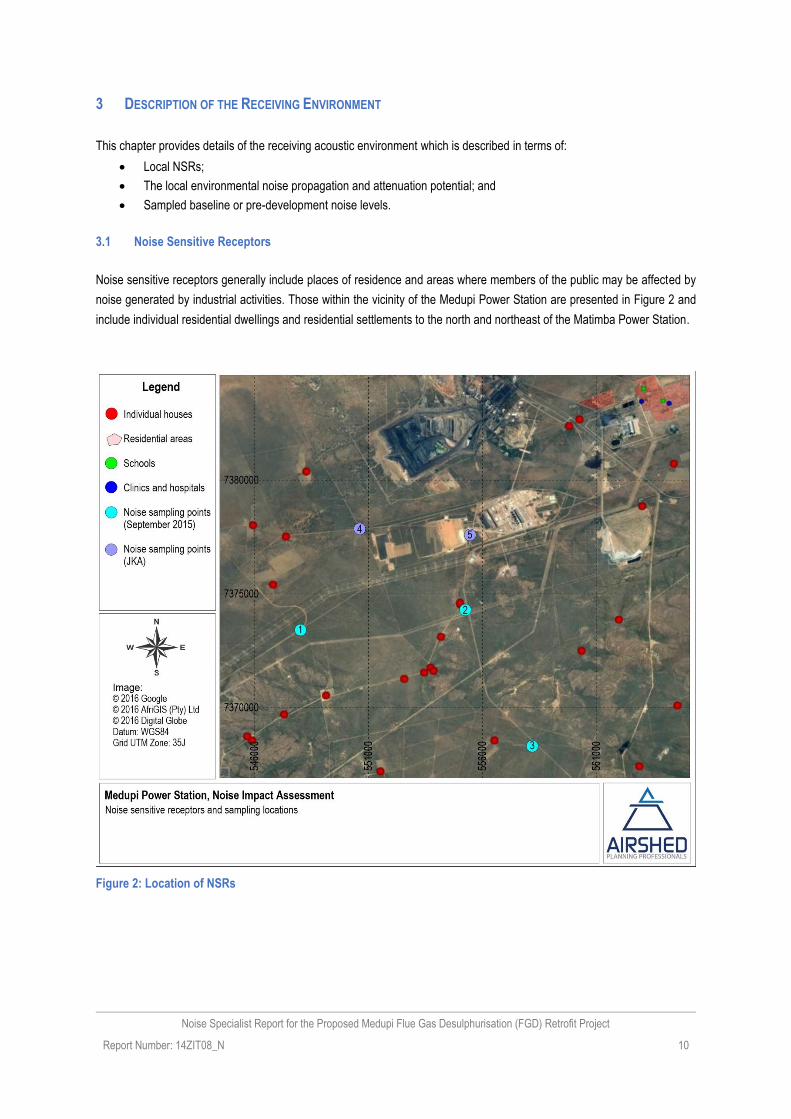
Noise Specialist Report for the Proposed Medupi Flue Gas Desulphurisation (FGD) Retrofit Project
Report Number: 14ZIT08_N 10
3 DESCRIPTION OF THE RECEIVING ENVIRONMENT
This chapter provides details of the receiving acoustic environment which is described in terms of:
• Local NSRs;
• The local environmental noise propagation and attenuation potential; and
• Sampled baseline or pre-development noise levels.
3.1 Noise Sensitive Receptors
Noise sensitive receptors generally include places of residence and areas where members of the public may be affected by
noise generated by industrial activities. Those within the vicinity of the Medupi Power Station are presented in Figure 2 and
include individual residential dwellings and residential settlements to the north and northeast of the Matimba Power Station.
Figure 2: Location of NSRs

Noise Specialist Report for the Proposed Medupi Flue Gas Desulphurisation (FGD) Retrofit Project
Report Number: 14ZIT08_N 11
3.2 Environmental Noise Propagation and Attenuation Potential
3.2.1 Atmospheric Absorption and Meteorology
Atmospheric absorption and meteorological conditions have already been mentioned with regards to its role in the propagation
on noise from a source to receiver (Section 1.4.4). The main meteorological parameters affecting the propagation of noise
include wind speed, wind direction and temperature. These along with other parameters such as relative humidity, air pressure,
solar radiation and cloud cover affect the stability of the atmosphere and the ability of the atmosphere to absorb sound energy.
Reference is made to MM5 modelled data for the period 2011 to 2013.
Wind speed increases with altitude. This results in the ‘bending’ of the path of sound to ‘focus’ it on the downwind side and
creating a ‘shadow’ on the upwind side of the source. Depending on the wind speed, the downwind level may increase by a
few dB but the upwind level can drop by more than 20 dB (Brüel & Kjær Sound & Vibration Measurement A/S, 2000). It should
be noted that at wind speeds of more than 5 m/s ambient noise levels are mostly dominated by wind generated noise.
The diurnal wind field is presented in Figure 3. Wind roses represent wind frequencies for the 16 cardinal wind directions.
Frequencies are indicated by the length of the shaft when compared to the circles drawn to represent a frequency of
occurrence. Wind speed classes are assigned to illustrate the frequencies with high and low winds occurring for each wind
vector. The frequencies of calms, defined as periods for which wind speeds are below 1 m/s, are also indicated.
(a) Day-time wind field (06:00 to 22:00) (b) Night-time wind field (22:00 to 06:00)
Figure 3: Wind roses for day- and night-time conditions at the Medupi Power Station site (MM5 data)
Temperature gradients in the atmosphere create effects that are uniform in all directions from a source. On a sunny day with
no wind, temperature decreases with altitude and creates a ‘shadowing’ effect for sounds. On a clear night, temperatures may
increase with altitude thereby ‘focusing’ sound on the ground surface. Noise impacts are therefore generally more notable
during the night. An average temperature of 15°C and a humidity of 62% were applied in simulations.

Noise Specialist Report for the Proposed Medupi Flue Gas Desulphurisation (FGD) Retrofit Project
Report Number: 14ZIT08_N 12
3.2.2 Terrain, Ground Absorption and Reflection
Noise reduction caused by a barrier (i.e. natural terrain, installed acoustic barrier, building) feature depends on two factors
namely the path difference of the sound waves as it travels over the barrier compared with direct transmission to the receiver
and the frequency content of the noise (Brüel & Kjær Sound & Vibration Measurement A/S, 2000). With exception of the boiler
building, shielding effect of other infrastructure was not taken into account for this assessment. Terrain and thus natural
shielding effect was conservatively not included in this study.
Sound reflected by the ground interferes with the directly propagated sound. The effect of the ground is different for acoustically
hard (e.g., concrete or water), soft (e.g., grass, trees or vegetation) and mixed surfaces. Ground attenuation is often calculated
in frequency bands to take into account the frequency content of the noise source and the type of ground between the source
and the receiver (Brüel & Kjær Sound & Vibration Measurement A/S, 2000). Based on observations, the ground cover was
taken to be acoustically mixed.
3.3 Sampled Baseline and Representative Pre-Development Noise Levels
Airshed conducted a baseline noise survey on 3 September 2015 at three locations (Figure 2). Pictures of these locations and
surround areas are presented in Figure 4. The survey consisted of 60 minute samples during the day and 30 minute samples
during the night (results summarised in Table 3 with measured levels provided in Figure 5 to Figure 10).
For noise measurements conducted in September, the equivalent day/night noise levels at location 1 and 2 correspond to
typical noise levels prevalent in suburban districts. The equivalent day/night noise levels at location 3 correspond to typical
noise levels prevalent in a central business district. This is as a result of fast travelling heavy vehicles on the road in the vicinity
of the sampler.
Noise measurements for the area were also conducted by Jorgens Keet Associates (JKA) (as documented in Noise Impact
Assessment for the ash disposal facility at Matimba Power Station (Jorgens Keet Associates, 2014)). In the vicinity of the
potential Medupi waste disposal facility sites, two noise measurements from this study have been extracted and provided in
Table 4 (see Figure 2). It should be noted that these measurements were taken in April 2005 (prior to the construction of the
Medupi Power Station) and may not be representative of the current noise levels at the study area. It is unlikely however that
the current noise levels at these sites will be lower than the JKA 2005 measurements.
For the JKA noise measurements conducted in April 2005, the equivalent day/night noise levels at location 4 correspond to
typical noise levels prevalent in suburban to urban districts. The equivalent day/night noise levels at location 5 correspond to
typical noise levels prevalent in rural to suburban districts.
For estimating the increase in ambient noise levels as a result of the project, the following representative background noise
levels (based on Site 1, 2, 4 and 5) were calculated from survey results.
• LReq,d – 48.3 dBA;
• LReq,n – 43.7 dBA; and
• LR,dn – 50.9 dBA.
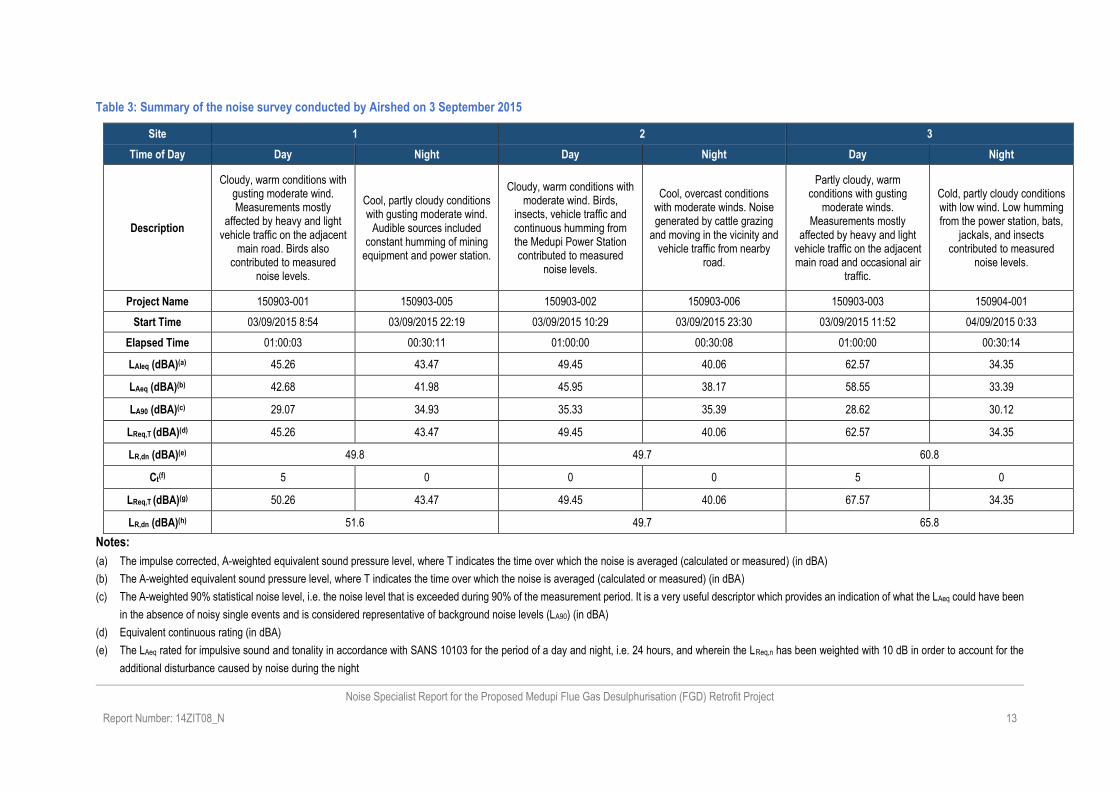
Noise Specialist Report for the Proposed Medupi Flue Gas Desulphurisation (FGD) Retrofit Project
Report Number: 14ZIT08_N 13
Table 3: Summary of the noise survey conducted by Airshed on 3 September 2015
Site 1 2 3
Time of Day Day Night Day Night Day Night
Description
Cloudy, warm conditions with gusting moderate wind. Measurements mostly
affected by heavy and light vehicle traffic on the adjacent
main road. Birds also contributed to measured
noise levels.
Cool, partly cloudy conditions with gusting moderate wind.
Audible sources included constant humming of mining
equipment and power station.
Cloudy, warm conditions with moderate wind. Birds,
insects, vehicle traffic and continuous humming from the Medupi Power Station contributed to measured
noise levels.
Cool, overcast conditions with moderate winds. Noise generated by cattle grazing
and moving in the vicinity and vehicle traffic from nearby
road.
Partly cloudy, warm conditions with gusting
moderate winds. Measurements mostly
affected by heavy and light vehicle traffic on the adjacent main road and occasional air
traffic.
Cold, partly cloudy conditions with low wind. Low humming from the power station, bats,
jackals, and insects contributed to measured
noise levels.
Project Name 150903-001 150903-005 150903-002 150903-006 150903-003 150904-001
Start Time 03/09/2015 8:54 03/09/2015 22:19 03/09/2015 10:29 03/09/2015 23:30 03/09/2015 11:52 04/09/2015 0:33
Elapsed Time 01:00:03 00:30:11 01:00:00 00:30:08 01:00:00 00:30:14
LAIeq (dBA)(a) 45.26 43.47 49.45 40.06 62.57 34.35
LAeq (dBA)(b) 42.68 41.98 45.95 38.17 58.55 33.39
LA90 (dBA)(c) 29.07 34.93 35.33 35.39 28.62 30.12
LReq,T (dBA)(d) 45.26 43.47 49.45 40.06 62.57 34.35
LR,dn (dBA)(e) 49.8 49.7 60.8
Ct(f) 5 0 0 0 5 0
LReq,T (dBA)(g) 50.26 43.47 49.45 40.06 67.57 34.35
LR,dn (dBA)(h) 51.6 49.7 65.8
Notes:
(a) The impulse corrected, A-weighted equivalent sound pressure level, where T indicates the time over which the noise is averaged (calculated or measured) (in dBA)
(b) The A-weighted equivalent sound pressure level, where T indicates the time over which the noise is averaged (calculated or measured) (in dBA)
(c) The A-weighted 90% statistical noise level, i.e. the noise level that is exceeded during 90% of the measurement period. It is a very useful descriptor which provides an indication of what the LAeq could have been
in the absence of noisy single events and is considered representative of background noise levels (LA90) (in dBA)
(d) Equivalent continuous rating (in dBA)
(e) The LAeq rated for impulsive sound and tonality in accordance with SANS 10103 for the period of a day and night, i.e. 24 hours, and wherein the LReq,n has been weighted with 10 dB in order to account for the
additional disturbance caused by noise during the night

Noise Specialist Report for the Proposed Medupi Flue Gas Desulphurisation (FGD) Retrofit Project
Report Number: 14ZIT08_N 14
(f) Correction factor for tonal character determined in accordance with SANS 10103 (2008)
(g) Equivalent continuous rating (in dBA) with tonal character penalty
(h) The LAeq rated for impulsive sound and tonality in accordance with SANS 10103 for the period of a day and night, i.e. 24 hours, and wherein tonal character penalty has been taken into account and the LReq,n
has been weighted with 10 dB in order to account for the additional disturbance caused by noise during the night

Noise Specialist Report for the Proposed Medupi Flue Gas Desulphurisation (FGD) Retrofit Project
Report Number: 14ZIT08_N 15
Location Site1
Eskom property; leased to farmer. Opposite entrance to Eskom
game farm
Location Site2
~3 km south of the existing ADF
Location Site 3
Approximately ~10 km south east of the existing ADF
Figure 4: Pictures of baseline noise measurement locations undertaken for the project
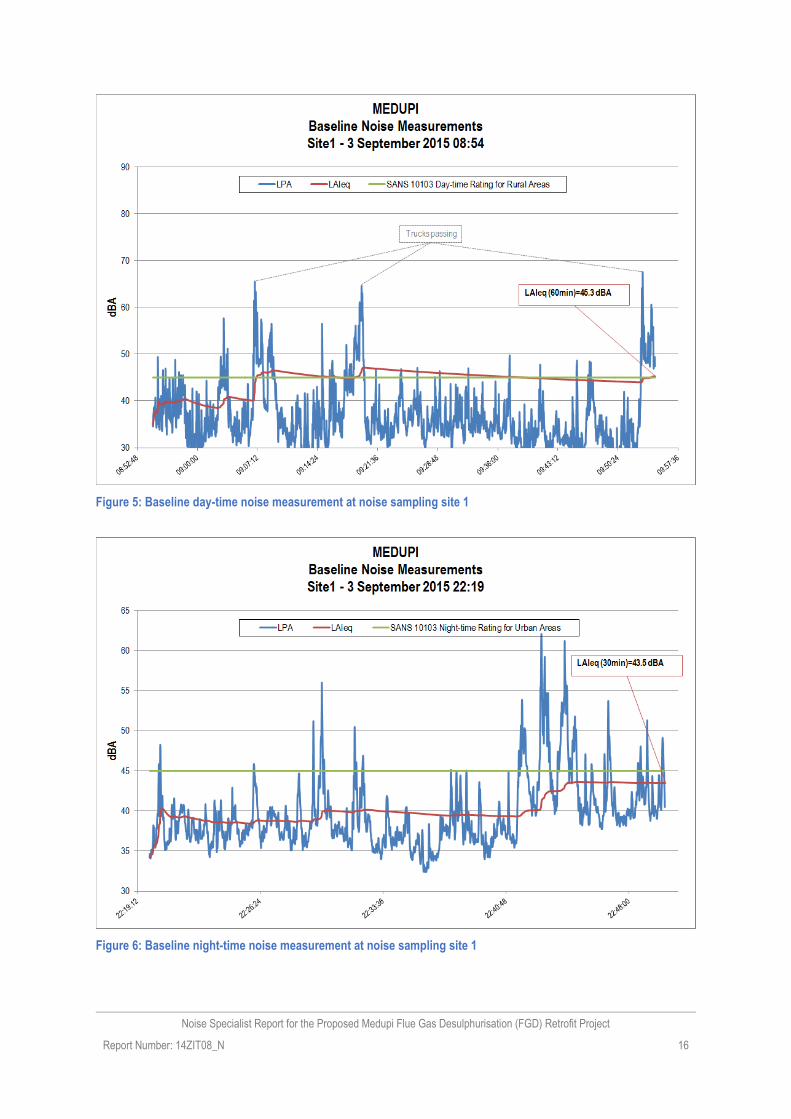
Noise Specialist Report for the Proposed Medupi Flue Gas Desulphurisation (FGD) Retrofit Project
Report Number: 14ZIT08_N 16
Figure 5: Baseline day-time noise measurement at noise sampling site 1
Figure 6: Baseline night-time noise measurement at noise sampling site 1

Noise Specialist Report for the Proposed Medupi Flue Gas Desulphurisation (FGD) Retrofit Project
Report Number: 14ZIT08_N 17
Figure 7: Baseline day-time noise measurement at noise sampling site 2
Figure 8: Baseline night-time noise measurement at noise sampling site 2

Noise Specialist Report for the Proposed Medupi Flue Gas Desulphurisation (FGD) Retrofit Project
Report Number: 14ZIT08_N 18
Figure 9: Baseline day-time noise measurement at noise sampling site 3
Figure 10: Baseline night-time noise measurement at noise sampling site 3

Noise Specialist Report for the Proposed Medupi Flue Gas Desulphurisation (FGD) Retrofit Project
Report Number: 14ZIT08_N 19
Table 4: Equivalent continuous ratings for measured noise levels in the existing Medupi waste disposal facility area
undertaken by JKA during April 2005 (Jorgens Keet Associates, 2014)
Location LReq,d (dBA) LReq,n (dBA) LR,dn (dBA)
4 46.2 47.2 53.1
5 45.1 39.6 47.2

Noise Specialist Report for the Proposed Medupi Flue Gas Desulphurisation (FGD) Retrofit Project
Report Number: 14ZIT08_N 20
4 IMPACT ASSESSMENT
The noise source inventory, noise propagation modelling and results for the operational phase of the project are discussed in
Section 4.
4.1 Noise Sources and Sound Power Levels
Sound power levels (LW’s or noise “emissions”) from activities associated with the project were estimated based on technical
source data from information gathered during the document review, sound power level predictions for industrial machinery as
published in the ‘Handbook of Acoustics’ (Crocker, 1998), sound power level measurements as undertaken by acoustic
consultants F Malherbe and B van Zyl and the ‘Good Practice Guide for Strategic Noise Mapping and the Production of
Associated Data on Noise Exposure’ (EC WG-AEN, 2003).
The following noise sources were included in simulations; main steam boilers, steam turbine-generator units, ball mills, ash
stacker, coal and ash conveyors, conveyor transfer stations, general industrial noise (i.e. small pumps, conveyors, motors,
coal handling etc.) and access road to transport the salts and sludge offsite. LW’s for these sources are summarised in Table
5. It should be noted that if the difference between the sound pressure levels of two sources is more than 10 dB, the
contribution of the quietest source can be disregarded. Other less notable sources of noise such as pumps, fans, electrical
motors, etc. were included as an area wide industrial source emitting 65 dBA/m².

Noise Specialist Report for the Proposed Medupi Flue Gas Desulphurisation (FGD) Retrofit Project
Report Number: 14ZIT08_N 21
Table 5: Operational phase source noise inventory for the project
Source Type
Description and information
used in calculations
Qty
LWi (in dB) at octave band centre frequencies (in Hz)
LWA (dBA) Source 31.5 63 125 250 500 1000 2000 4000 8000
Main Steam Boilers
800 MW 8 123.5 122.5 117.5 111.5 110.5 108.5 106.5 106.5 106.5 114.9 LW Equation,Handbook of Acoustics,Crocker (2008)
Steam-Turbine Generator Units
800 MW 8 115.6 121.6 119.6 114.6 110.6 106.6 103.6 95.6 89.6 113.1 LW Equation,Handbook of Acoustics,Crocker (2008)
Ball Mills 3 106.9 108.2 109.3 106.8 106.2 101.1 97.2 110.1 F Malherbe Acoustic Consulting
Ash Stacker 1 108.1 103.4 102.3 103.1 99.9 97.3 89.6 104.9 Airshed Database, Kendal Ash
Stacker Measurements
Highway Truck 300 kW assuming speed of 60 km/h
82/day 119.8 108.8 113.8 116.8 111.8 109.8 106.8 100.8 94.8 115.1 LW Equation,Handbook of Acoustics,Crocker (2008)
Heavy Industry 1 18.6 31.8 41.9 49.4 54.8 58 59.2 59 56.9 65 EC WG-AEN (2006)
Standard Conveyor
5 m/s 9 83.4 86.5 84.5 88.7 82.9 76.5 67.3 88.2 Francois Malherbe Acoustic
Consulting & B van Zyl
Conveyor Transfer Station
10 102.7 102.6 107.6 104.6 102.4 99.2 94.4 107.3 Francois Malherbe Acoustic
Consulting
Handling at railway yard and siding
6 80 90 98.8 97.6 100.7 101.4 95.4 105.8 Francois Malherbe Acoustic
Consulting

Noise Specialist Report for the Proposed Medupi Flue Gas Desulfurisation (FGD) Retrofit Project
Report Number: 14ZIT08_N 22
4.2 Noise Propagation and Simulated Noise Levels
The propagation of noise generated during the operational phase was calculated with CadnaA in accordance with ISO 9613.
Meteorological and site specific acoustic parameters as discussed in Section 3.2.1 along with source data discussed in 4.1,
were applied in the model.
Results are presented in isopleth form (Figure 11 to Figure 16). An isopleth is a line on a map connecting points at which a
given variable (in this case LP) has a specified constant value. This is analogous to contour lines on a map showing terrain
elevation. In the assessment of environmental noise, isopleths present lines of constant noise level as a function of distance.
For the assessment, an access road was assumed for the transport of the sludge and salts from the site for illustrative
purposes. The simulated equivalent continuous day-time rating level (LReq,d) of 55 dBA (noise guideline level) extends ~70m
from the road. The simulated equivalent continuous night-time rating level (LReq,n) of 45 dBA (noise guideline level) extends
~100m from the road. These distances can be assumed for any road that will be utilised for the transport of the sludge and
salts from the site.
Operational phase related noise due to the project is not predicted to exceed the selected noise guidelines at NSR surrounding
the Medupi Power Station with an increase above the baseline of less than 3 dBA at all of the identified NSR. For a person
with average hearing acuity an increase of less than 3 dBA in the general ambient noise level is not detectable. According to
SANS 10103 (2008); ‘little’ reaction with ‘sporadic complaints’ may be expected from the community for increased noise levels
up to 10 dBA. With the conservative approach adopted for the assessment (detailed in Section 1.6) the predicted increase in
noise levels is not expected to be higher than 1 dBA at any of the identified NSR. ‘Little’ reaction is therefore expected from
the community due to the project with changes in the general ambient noise levels barely being detectable (for a person with
average hearing acuity).

Noise Specialist Report for the Proposed Medupi Flue Gas Desulfurisation (FGD) Retrofit Project
Report Number: 14ZIT08_N 23
Figure 11: Simulated equivalent continuous day-time rating level (LReq,d) for project
activities
Figure 12: Simulated increase in equivalent continuous day-time rating level (LReq,d)
above the baseline

Noise Specialist Report for the Proposed Medupi Flue Gas Desulfurisation (FGD) Retrofit Project
Report Number: 14ZIT08_N 24
Figure 13: Simulated equivalent continuous night-time rating level (LReq,n) for project
activities
Figure 14: Simulated increase in equivalent continuous night-time rating level (LReq,n)
above the baseline

Noise Specialist Report for the Proposed Medupi Flue Gas Desulfurisation (FGD) Retrofit Project
Report Number: 14ZIT08_N 25
Figure 15: Simulated equivalent continuous day/night rating level (LReq,dn) for project
activities
Figure 16: Simulated increase in equivalent continuous day/night rating level (LReq,dn)
above the baseline

Noise Specialist Report for the Proposed Medupi Flue Gas Desulphurisation (FGD) Retrofit Project
Report Number: 14ZIT08_N 26
4.3 Impact Significance Rating
The impact significance rating for the project is presented in Table 6.
Table 6: Impact rating matrix for the proposed project operations
Activity Nature
of Impact
Impact type
Extent Duration Potential Intensity
Likelihood Rating Mitigation Interpretation
PRE-CONSTRUCTION PHASE
Noise Levels
Indirect Impact:
Existing 2 1 1 0.5 2 - LOW
With noise mitigation, noise levels from the project will be low.
Noise levels in the area are representative of suburban districts.
Increase in noise levels
Cumulative 2 1 1 0.5 2 - LOW
Noise levels due to pre-construction will be similar to baseline levels.
Residual 2 1 1 0.5 2 - LOW Not applicable as no activities will have taken place.
CONSTRUCTION PHASE
Noise Levels
Indirect Impact:
Existing 2 1 1 0.5 2 - LOW
With noise mitigation, noise levels from the project will be low.
Noise levels in the area are representative of suburban districts.
Increase in noise levels
Cumulative 2 1 2 0.5 3 - MOD
Noise levels due to construction will be local and can be notable.
Residual 2 1 1 0.5 2 - LOW
With mitigation, the residual noise impact will be reduced (similar to existing levels).
OPERATIONAL PHASE
Noise Levels
Indirect Impact:
Existing 2 1 1 0.5 2 - LOW
With noise mitigation, noise levels from the project will be low.
Noise levels in the area are representative of suburban districts.
Increase in noise levels
Cumulative 2 1 1 0.5 2 - LOW
Change in noise levels due to operation is slight at NSRs.
Residual 2 1 1 0.5 2 - LOW
With mitigation, the residual noise impact will be reduced (similar to existing levels).
DECOMMISSIONING PHASE
Noise Levels
Indirect Impact:
Existing 2 1 1 0.5 2 - LOW
With noise mitigation, noise levels from the project will be low.
Noise levels in the area are representative of suburban districts.
Increase in noise levels Cumulative 2 1 2 0.5 3 - MOD
Noise levels due to decommissioning will be local and can be notable.

Noise Specialist Report for the Proposed Medupi Flue Gas Desulphurisation (FGD) Retrofit Project
Report Number: 14ZIT08_N 27
Activity Nature
of Impact
Impact type
Extent Duration Potential Intensity
Likelihood Rating Mitigation Interpretation
Residual 2 1 1 0.5 2 - LOW
With mitigation the residual noise impact will be reduced (similar to existing levels).

Noise Specialist Report for the Proposed Medupi Flue Gas Desulphurisation (FGD) Retrofit Project
Report Number: 14ZIT08_N 28
5 MANAGEMENT, MITIGATION AND RECOMMENDATIONS
In the quantification of noise emissions and simulation of noise levels as a result of the proposed project, it was calculated
that ambient noise evaluation criteria for human receptors will not be exceeded at NSRs. ‘Little’ reaction can be expected from
members of the community within this impact area.
From a noise perspective, the project may proceed. It is recommended, however, that mitigation measures be implemented
to ensure minimal impacts on the surrounding environment.
5.1 Good Engineering and Operational Practices
For general activities, the following good engineering practice should be applied:
• To minimise noise generation, vendors should be required to guarantee optimised equipment design noise levels.
• A mechanism to monitor noise levels, record and respond to complaints and mitigate impacts should be developed.
5.2 Traffic
The measures described below are considered good practice in reducing traffic related noise. In general, road traffic noise is
the combination of noise from individual vehicles in a traffic stream and is considered as a line source if the density of the
traffic is high enough to distinguish it from a point source. The following general factors are considered the most significant
with respect to road traffic noise generation:
• Traffic volumes i.e. average daily traffic.
• Average speed of traffic.
• Traffic composition i.e. percentage heavy vehicles.
• Road gradient.
• Road surface type and condition.
• Individual vehicle noise including engine noise, transmission noise, contact noise (the interaction of tyres and the
road surface, body, tray and load vibration and aerodynamic noise
In managing transport noise specifically related to trucks, efforts should be directed at:
• Minimizing individual vehicle engine, transmission and body noise/vibration. This is achieved through the
implementation of an equipment maintenance program.
• Minimize slopes by managing and planning road gradients to avoid the need for excessive acceleration/deceleration.
• Maintain road surface regularly to avoid corrugations, potholes etc.
• Avoid unnecessary idling times.
• Minimizing the need for trucks/equipment to reverse. This will reduce the frequency at which disturbing but
necessary reverse warnings will occur. Alternatives to the traditional reverse ‘beeper’ alarm such as a ‘self-adjusting’
or ‘smart’ alarm should be considered. These alarms include a mechanism to detect the local noise level and
automatically adjust the output of the alarm is so that it is 5 to 10 dB above the noise level in the vicinity of the
moving equipment. The promotional material for some smart alarms does state that the ability to adjust the level of
the alarm is of advantage to those sites ‘with low ambient noise level’ (Burgess & McCarty, 2009).

Noise Specialist Report for the Proposed Medupi Flue Gas Desulphurisation (FGD) Retrofit Project
Report Number: 14ZIT08_N 29
5.3 Monitoring
In the event that noise related complaints are received, short term (24-hour) ambient noise measurements should be
conducted as part of investigating the complaints. The results of the measurements should be used to inform any follow up
interventions.
The following procedure should be adopted for all noise surveys:
• Any surveys should be designed and conducted by a trained specialist.
• Sampling should be carried out using a Type 1 sound level meter (SLM) that meets all appropriate International
Electrotechnical Commission (IEC) standards and is subject to annual calibration by an accredited laboratory.
• The acoustic sensitivity of the SLM should be tested with a portable acoustic calibrator before and after each
sampling session.
• Samples of at least 24 hours in duration and sufficient for statistical analysis should be taken with the use of portable
SLM’s capable of logging data continuously over the time period. Samples representative of the day- and night-time
acoustic climate should be taken.
• The following acoustic indices should be recoded and reported:
o LAeq (T)
o LAIeq (T)
o Statistical noise level LA90
o LAmin and LAmax
o Octave band or 3rd octave band frequency spectra.
• The SLM should be located approximately 1.5 m above the ground and no closer than 3 m to any reflecting surface.
• Efforts should be made to ensure that measurements are not affected by the residual noise and extraneous
influences, e.g. wind, electrical interference and any other non-acoustic interference, and that the instrument is
operated under the conditions specified by the manufacturer. It is good practice to avoid conducting measurements
when the wind speed is more than 5 m/s, while it is raining or when the ground is wet.
• A detailed log and record should be kept. Records should include site details, weather conditions during sampling
and observations made regarding the acoustic climate of each site.
5.4 Conclusion
It was concluded that, given the conservative nature of the assessment, the implementation of the basic good practice
management measures recommended in this report will ensure low noise impact levels. From a noise perspective, the project
may proceed.

Noise Specialist Report for the Proposed Medupi Flue Gas Desulphurisation (FGD) Retrofit Project
Report Number: 14ZIT08_N 30
6 REFERENCES
Brüel & Kjær Sound & Vibration Measurement A/S, 2000. www.bksv.com. [Online]
Available at: http://www.bksv.com
[Accessed 14 October 2011].
Burgess, M. & McCarty, M., 2009. Review of Alternatives to 'Beeper' Alarms for Construction Equipment, Canberra: University
of New South Wales.
Crocker, M. J., 1998. Handbook of Acoustics. s.l.:John Wiley & Sons, Inc.
EC WG-AEN, 2003. Good Practice Guide for Strategic Noise Mapping and the Production of Associated Data on Noise
Exposure, s.l.: s.n.
IFC, 2007. General Environmental, Health and Safety Guidelines, s.l.: s.n.
Jongens Keet Associates (2014). Noise Impact Assessment of the Proposed Continuous Ash Disposal Facility for the Matimba
Power Station, Lephalale, Limpopo Province. Report No. JKA627r006.
SANS 10103, 2008. The measurement and rating of environmental noise with respect to annoyance and to speech
communication, Pretoria: Standards South Africa.
WHO, 1999. Guidelines to Community Noise. s.l.:s.n.

Noise Specialist Report for the Proposed Medupi Flue Gas Desulphurisation (FGD) Retrofit Project
Report Number: 14ZIT08_N 31
7 ANNEX A – SPECIALIST’S CURRICULUM VITAE

Noise Specialist Report for the Proposed Medupi Flue Gas Desulphurisation (FGD) Retrofit Project
Report Number: 14ZIT08_N 32

Noise Specialist Report for the Proposed Medupi Flue Gas Desulphurisation (FGD) Retrofit Project
Report Number: 14ZIT08_N 33
Noise Specialist Report for the Proposed Medupi Flue Gas Desulphurisation (FGD) Retrofit Project
Report Number: 14ZIT08_N 34

Noise Specialist Report for the Proposed Medupi Flue Gas Desulphurisation (FGD) Retrofit Project
Report Number: 14ZIT08_N 35

Noise Specialist Report for the Proposed Medupi Flue Gas Desulphurisation (FGD) Retrofit Project
Report Number: 14ZIT08_N 36

Noise Specialist Report for the Proposed Medupi Flue Gas Desulphurisation (FGD) Retrofit Project
Report Number: 14ZIT08_N 37

Noise Specialist Report for the Proposed Medupi Flue Gas Desulphurisation (FGD) Retrofit Project
Report Number: 14ZIT08_N 38

Noise Specialist Report for the Proposed Medupi Flue Gas Desulphurisation (FGD) Retrofit Project
Report Number: 14ZIT08_N 39

Noise Specialist Report for the Proposed Medupi Flue Gas Desulphurisation (FGD) Retrofit Project
Report Number: 14ZIT08_N 40

Noise Specialist Report for the Proposed Medupi Flue Gas Desulphurisation (FGD) Retrofit Project
Report Number: 14ZIT08_N 41

Noise Specialist Report for the Proposed Medupi Flue Gas Desulphurisation (FGD) Retrofit Project
Report Number: 14ZIT08_N 42
POJECTTITLE:MedupiPSFGRetrofitProject
PROJECTNUMBER:
12949
DATEOFISSUE:17February2018
SPECIALISTREPORT:
SocialImpactAssessmentfortheProposedMedupiPowerStationFlueGasDesulphurisationRetrofit
ProjectandtheExistingMedupiPowerStationAshDisposalFacility,Lephalale,LimpopoProvince,South
Africa
CONTACT PERSON: CHIEF EXECUTIVE OFFICER AND PRINCIPAL CONSULTANT
HAND SIGN:
CONTACT PERSON: DIRECTOR- STRATEGY AND BUSINESS DEVELOPMENT
HAND SIGN:
ACKNOWLEDGEMENT OF RECEIPT
CONSULTANT: NGT HOLDINGS (PTY) LTD
AUTHORS Mr Nkosinathi Tomose
RESEARCH Ms Zetu Damane
FIELD WORK / STAKEHOLDER INTERVIEWS Ms Zetu Damane, Ms Zanele Tomose, Ms Taryn Aspeling
IDEPENDENT REVIEWER Ms Sarah Allan
PROJECT MAPPING Mr Andre Zanoli
TELEPHONE NUMBER 011 888 0209
CELL PHONE NUMBER 078 163 0657
E-MAIL ADDRESS: [email protected]
CLIENT: ZITHOLELE CONSULTING (PTY) LTD
CONTACT PERSON Dr. Mathys Vosloo
TELEPHONE NUMBER +27 11 207 2060
FAX NUMBER +27 76 993 2242
E-MAIL ADDRESS: [email protected]

3
SIA prepared on behalf Zitholele Consulting and Eskom Holdings
COPYRIGHT
This report (including all the associated data, project results and recommendations) whether manually or
electronically produced, forms part of the submission in addition to any other subsequent reports or
project documents, such as the inclusion in the Environmental Impact Assessment (EIA) and the
Environmental Management Programme report (EMPr) documents for which it is intended for totally vest
with the authors, Mr Nkosinathi Tomose and the company he represents; viz. NGT Holdings (Pty) Ltd
(hereafter referred NGT). This limitation is with exception to Zitholele Consulting (Pty) Ltd (hereafter
referred to as Zitholele Consulting) and Eskom Holdings SOC Ltd (hereafter referred to as Eskom).
The limitation for the transmission of the report includes, both manually and electronically without
changing or altering the report’s results and recommendations, shall also be lifted for the purposes of
submission, circulation and adjudication by the relevant environmental and economic development
departments and/or any other interested legally mandated government authority such as the Department
of Environmental Affairs (DEA) and the Department of Water and Sanitation (DWS).
NGT takes full liability for its specialists working on the project for all the social impact assessment related
matters. We will not take any liability for any other environmental related issues or challenges for the
project other than those services appointed for - these are the liability of the client.
This report has been compiled by NGT on behalf of Zitholele and Eskom. The views expressed in this
report are entirely those of the author and no other interest was displayed during the decision-making
process for the project.

4
SIA prepared on behalf Zitholele Consulting and Eskom Holdings
EXECUTIVE SUMMARY
NGT was appointed by Zitholele Consulting to undertake a Social Impact Assessment (SIA) study for the
proposed Medupi Flue Gas Desulphurisation retrofit project (FGD-RP) and the associated ancillary
infrastructure. The associated ancillary infrastructure includes the use of the existing Ash Disposal Facility
(ADF) for gypsum disposal and the railway yard for lime and gypsum off-loading (Annexure 10). The aim
of the FGD is to reduce sulphur dioxide (SO2). The role of the ADF is for the final disposal of ash
(conventional by-product of coal fired station) and gypsum (by-product of the FGD). According to Eskom,
the proposed FGD will reduce SO2 emissions from Medupi Power Station by 93% from worst case coal.
Water allocation and demand for operation of the Medupi Power Station with and without the
implementation of the FGD is interrogated
The objectives of this SIA study include:
• The assessment of social impacts of the proposed Medupi Power Station Flue Gas
Desulphurisation retrofit project;
• The assessment of potential social impacts of the FGD retrofit (Annexure 9 – FGD Retrofit layout),
the existing ash disposal facility (ADF) and the prosed railway yard The impact assessment will
focus on the social benefits of the proposed FGD on the surrounding communities and industries
as well as impacts on the ecosystem such as the biosphere and its natural resources like water
and ecology. With regards to water, the SIA looks at the current allocation and future demand
for optimal operation of Medupi Power Station (MPS) and the potential pollution resulting from
the project. Water is considered one of the ecological services under threat from the project.
• The study aims to make conclusions on the nature of identified social impacts resulting from the
associated with the implementation of the FGD (e.g. with water demand flagged as key important
issues to consider with the operationalisation of the FGD), the potential environmental threats
associated with the AFD (e.g. surface overflow and spillages to the surrounding which has
happened more recently). It also make conclusion on impacts associated with the development
of the railway siding and the disposal of the FGD by-products such as gypsum, salts and sludge.
• To make recommendations on strategies that should be implemented to enhance the significance
of positive social benefits that result with the implementation of the FGD, the associated ADF and
5
SIA prepared on behalf Zitholele Consulting and Eskom Holdings
railway siding while reducing the negative impacts. In line with the proposed recommendations,
it is acknowledged that the information and the output of this SIA should assist with problem
solving solutions rather than only mentioning the negative effects of the project. It also
acknowledges that the recommendations made should be acceptable and practical for the project
proponent to implement for the achievement of sustainable development goals.
The assessments are based on four stages of the project, from planning, construction, operation to
decommissioning phase. Based on the various impact assessment and impact rating processes, the
following conclusion and recommendations are made about the proposed Medupi FGD, the existing ADF
and the proposed railway siding.
Conclusions:
• It is concluded that the significance of positive social impacts generally exceeds the significance
of negative social impacts in the implementation of the FGD, the ADF and the railway siding
throughout all four stages of the project.
• It is also concluded that implementation of the proposed FGD technology at Medupi will result in
reduced levels of SO2 in the medium and long term in the region and South Africa. It will also
contribute to reduction of global SO2 atmospheric levels. As the result of this, the significance of
health risks associated with the SO2 emissions will be minimized on a long-term basis.
• The results will be an improved biosphere in the region and South Africa, this will translate to
improved quality of life for the citizens of Lephalale and the communities located south and
southwest of the study area who are also affected by pollutants containing SO2.
• Based on issues raised by some of the affected communities during the SIA fieldwork, it is
concluded that one of the most pressing issues identified during the survey relates to stakeholder
relations and project communication.
• The above issue was put forward for the attention of the project proponent; a meeting was
scheduled between the project proponent representatives in Lephalale dealing with
environmental and social issues on the ground. The aim was to come up with solution on how to
best address the communication impasse. Through this meeting and the information made
available to the SIA team, it has been determined that Eskom and its stakeholders have done a
6
SIA prepared on behalf Zitholele Consulting and Eskom Holdings
significant amount of work in dealing with concerns of the various interested and affected parties
on the ground. They have contributed to the establishment structures entrusted with the
management of stakeholder relations and communication as part of the Medupi project. A
committee has been established to deal with such issues; for example, the Medupi Environmental
Monitoring Committee (EMC) as well as the Stakeholder Relations Office in the region. It is
therefore concluded that necessary strategies and measures have been put in place to deal with
and manage stakeholder relations and communication.
• In terms of ecosystem services, the study assessed how the Medupi FGD, its by-products, the
existing AFD and the proposed railway siding would negatively impact on the ecosystems and how
such negative impacts will influence ecosystem services that support the health and wellbeing of
the affected communities i.e. municipality, other industries, the farmers and households in the
regions. In this assessment, the SIA team considered the following (Table 11 and recommendation
section of this report):
o Direct drivers of the ecosystem change: e.g. change in local land use and cover; resources
consumption; pollution; increase in population
o Indirect drivers of the ecosystem change: e.g. demographic change; economic change;
socio- political change; cultural and religious change; scientific and technological change.
o The wellbeing of ecosystem services beneficiaries: e.g. these included among others,
change in demand for ecosystem service for basic material for good life; change in
demand for ecosystem service for health; change in demand for ecosystem service or
security; change in demand for ecosystem service for good social relations.
• Taking into consideration of ecosystem services beneficiaries and drivers; we assessed the
potential impacts of the proposed railway siding for lime off-taking. The land on which the
proposed siding is to be constructed is already reformed or altered. It is therefore, concluded
that the railway siding will not have any adverse negative social and economic impacts in terms
of increase in traffic volumes and possible road carnage resulting from trucks transporting lime to
Medupi.
• In terms of the existing ADF facility (and other infrastructure on site such as slime dams, coal
stockpiles etc.), necessary measures have been put in place to mitigate any possible leakage to
groundwater resulting in ground water contamination. Approximately 21 boreholes have been

7
SIA prepared on behalf Zitholele Consulting and Eskom Holdings
drilled to compile data that would assist the project proponent to assess sulphates levels in the
ground water with the aim of mitigating areas where there is groundwater contamination.
• The water issue is concluded to be the biggest threat in the project lifespan, the current allocation
to Medupi will be able to operate the six generation units at Medupi. Water for the other 3 of the
FGD absorber units are expected to come from MCWAP Phase. The current raw water abstraction
from Mokolo Dam of which the Lephalale LM is also dependent on for clear water to support its
domestic and farming communities’ poses is a biggest socio-economic threat in terms of
ecosystems support services.
• From a social impact assessment perspective; it is concluded that the FGD technology retrofit
project, the use of the existing ADF to dispose of ash and excess gypsum and the development of
the railway siding should proceed as planned provided that the following recommendations are
implemented and adhered to:
Recommendations
Below is the list of recommendation proposed to the project proponent to mitigate against any negative
impacts and improve the positive benefits of the proposed project:
• Mitigation measures in this report must be included in the Environmental Management Programme
(EMPr), which will be approved as condition of environmental authorisation.
• The specialist responsible for compiling the EMPr must consult and consider the findings and the
recommendations of the SIA.
• The issue of communication was flagged by some of the communities as a pressing issue. Through
engagement with project proponent representatives it has been determined that necessary
measures have been put in place to mitigate issues pertaining to stakeholder engagement in the
broader Lephalale area.
o Although Eskom has done a lot to address this concern, it is recommended that the EMC
should further strengthen its multi-stakeholder engagement strategy or adopt new forms
of communication that resonate with the interests of I & APs in the region.
o This should be done in a manner that does not polarise relations between existing
stakeholders. One way of addressing this issue is to develop a sub-committee for the
EMC.

8
SIA prepared on behalf Zitholele Consulting and Eskom Holdings
o The sub-committee should include a representative from each of the affected
communities. This should be in addition to those communities’ representatives already
listed in the EMC Terms of Reference (ToR).
o Community representatives from Steenbokpan (Leseding) and the farms (farming
community) should form part of the EMC sub-committee due to the fact that they feel
excluded in programmes and workshops that deal with issues arising from Medupi
construction and the associated infrastructure and technology such as the FGD.
o In addition to EMC public meetings and workshops, the sub-committee will ensure that
all community concerns and grievances are deliberated on and addressed directly by the
EMC and outside the EMC public meetings. The EMC ToR allows for the election of
alternates. Therefore, this recommendation for EMC sub-committee is in line with EMC
ToR.
• In projects of similar nature to Medupi, a grievance mechanism committee is often established and
communicated to the community in line with best practice. The Medupi EMC is a sufficient structure
to handle all issues relating to the environment, monitoring and auditing. However, without
increasing bureaucracy, Eskom should consider appointing an independent company/specialist that
specialises in the management of Social Risks. The task of the appointee would be to advise and
strengthen the following:
o Working with the Eskom Community Liaison Officer (Stakeholder Engagement
Representative) to independently advise on the facilitation of relations between the
various project stakeholders such as the appointed contractors, the EMC, the
Environmental Control Officer (ECO), the affected community and community
organisations such as NGOs, local labourers, local Small Medium Enterprises (SMMEs) as
well as big industries.
o The Social Risk company or specialist should be experienced in multi-stakeholder
management, conflict resolution, labour relations, and negotiation of contracts, skills
audits, and training and facilitation of skills transfer programmes.
o If there is already an existing contract for an independent Social Risk company/specialist
for the construction of Medupi Power Station – Eskom should consider extending such a
contract since the company/specialist will already be familiar with issues on the ground
and be well acquainted with community and government structures in Lephalale.

9
SIA prepared on behalf Zitholele Consulting and Eskom Holdings
o There will be no need for additional infrastructure for this specialist or company; she/he
can use the existing stakeholder relations office and its satellite offices.
This is important because the construction activities at Medupi have on many occasions been subject to
disruption due to labour unrest and protest by locals who demand job opportunities. This is something
that came out strongly during the public consultation for the proposed FGD project. Some locals who
claimed that they were overlooked in the Medupi projects and that they will be overlooked in the current
project too disrupted one of the Public Participation (PP) meetings. The inclusion of a social risk company
or specialist in the EMC will ensure that the EMC has enough capacity and skills to deal with and address
social and socio-economic issues without overly relying on Eskom Communication, CSI and Stakeholder
Relations Departments. Furthermore, it will play a key role in reporting, monitoring and auditing of Eskom
commitments to addressing social issues in line with ToR of the EMC. The social risk company will work
hand in hand with the appointed Environmental Control Officer responsible for the implementation of the
EMPr.
Both the SIA impact assessment analysis and stakeholder engagement concluded that the proposed
Medupi FGD-RP will result in positive biospheric and social benefits in the receiving environment and the
improvement of the quality of life for the affected communities in terms of reduced number of health
incidents that result from exposure to high levels of SO2. There are however disagreements on how the
FGD-RP should be implemented; some argue it should be built into the Medupi Units before their
synchronisation while the project proponent proposes to retrofit the technology. Those in favour of
constructing the FGD with Medupi Units argue that the coming in of Medupi units will results to further
increase in SO2 levels in the region and will compromise the health of citizens who are already suffering
from SO2 health related challenges such as high prevalence of respiratory diseases.
From a SIA perspective, it is recommended that Eskom should prioritise retrofitting and synchronising the
FGD technology to Unit 6, 5 and 4 which have been completed and have been operational since 2016 (unit
5) and early in 2017 (Unit 6). These will allay the fears of those in favour of constructing the FGD with the
unit stacks and will also increase Eskom compliance levels in terms of reducing SO2 and increasing
atmospheric and air quality. Technically, this will assist them understand the challenges and opportunities
of the technology prior to its retrofitting to Units 1, 2 and 3.

10
SIA prepared on behalf Zitholele Consulting and Eskom Holdings
In terms of material transport to and from site for the construction of the FGD and to transport gypsum,
salts and sludge which are by-products of the FGD; it is recommended that Eskom should speed up the
construction of the proposed railway siding and prioritise the railway as the preferred construction
material transport mode as well as for the off-take of the FGD by-products to appropriate licensed disposal
facilities specially for salts and sludge. This will help mitigate environmental risks associated with the use
of public roads to transport these hazardous materials. It will also assist alleviate possible increase in
traffic volumes associated with the FGD construction material transportation.
In terms of FGD by-products it is recommended that Eskom should consider tendering the offtake of
gypsum for commercial purposes instead of its combined disposal with the ash.
Eskom is highly commended for its zero liquid disposal strategy at Medupi which encourages water
recycling and circulation within the footprint. However, this will only assist in meeting the current water
demand on site and is not sufficient enough to meet and address the demand with the implementation
of the FGD. Water and water allocation however falls outside the statutory mandate of Eskom, but the
responsibility of the National Department of Water and Sanitation (DWS). Through the various bargaining
platforms available to Eskom and the surrounding industries such as mines and Sasol – it is recommended
that Eskom should lobby (together with other industries) DWS to speed up the implementation of Phase
2 MCWAP. This will guarantee Eskom and other industries in Lephalale appropriate water allocation to
support the FGD and the growing industries around it such as expanded coal mining due to coal reserves
in the Waterberg region. The speeding up of the Phase 2 MCWAP by DWS would also assist mitigate the
potential water risk to Lephalale associated with the abstraction of raw water by industries from Mokolo
Dam of which the municipality and its constituencies is also directly dependent on for potable water.

11
SIA prepared on behalf Zitholele Consulting and Eskom Holdings
TABLE OF CONTENTS
ACKNOWLEDGEMENT OF RECEIPT .......................................................................................................... 2
EXECUTIVE SUMMARY ............................................................................................................................ 4
LIST OF FIGURES .................................................................................................................................... 13
LIST OF TABLES ...................................................................................................................................... 15
LIST OF ABBREVIATIONS ........................................................................................................................ 16
1.INTRODUCTION .................................................................................................................................. 18
1.1.Project Description and Background ............................................................................................ 18
1.2. Declaration of independence ..................................................................................................... 23
1.3. Terms of Reference and Scope of Work ..................................................................................... 26
1.4. Assumptions and Limitations ..................................................................................................... 26
1.5. Study Method and Report Format.............................................................................................. 27
2. LEGAL FRAMEWORK AND GUIDELINES.............................................................................................. 30
2.1. Legal Mandate to Address Social Issues in Environmental Imapct Assessment ............................ 30
Constitution of the Republic of South Africa ................................................................................... 30
National Environmental Management Act ..................................................................................... 30
Environmental Impact Assessment Regulations ............................................................................. 32
National Environmental Management Air Quality Act No. 39 of 2004 ............................................ 33
National Environmental Waste Management Act (No.59 of 1998) ................................................. 33
The Occupational and Safety Act, No. 85 of 1993 ........................................................................... 34
2.2. Guideline and other documents consulted and adhered to ......................................................... 34
3. BASELINE STUDY ............................................................................................................................... 38
3.1. Affected Environment and Description ....................................................................................... 38
3.2. Population Dynamics in Lephalale LM ......................................................................................... 43
3.3. Education and Skills Levels in Lephalale LM................................................................................. 45
3.4. Community Health and Wellness in Lephalale LM ....................................................................... 48
3.5.Economic Activities in Lephalale LM ............................................................................................ 53
3.6. Employment Rate and Occupation in Lephalale LM..................................................................... 57
3.7. Income Distribution in Lephalale LM ........................................................................................... 59
3.8. Housing and Human Settlements in Lephalale LM ...................................................................... 61
3.9.Water and Sanitation ................................................................................................................... 66

12
SIA prepared on behalf Zitholele Consulting and Eskom Holdings
3.9.1. Water Availability and Water Allocation in Lephalale LM...................................................... 66
3.9.2. Sanitation ............................................................................................................................ 72
3.10. Access to electricity .................................................................................................................. 73
3.11. Road Infrastructure and Access to Transportion........................................................................ 74
3.12. Conclusions of the Baseline Assessment ................................................................................... 76
4. STAKEHOLDER IDENTIFICATION AND FIELD WORK ............................................................................ 78
4.1. Legal requirements for Public Participation in this SIA................................................................. 78
4.2.The meetings were held with the following stakeholders between February and May 2015 (Annexures 1 -4, see also Annexure 5). ............................................................................................... 78
4.3. Summary of Key Issues Raised in the Meetings and Public Participation Forum Relating to the Proposed Medupi FGD Technology .................................................................................................... 79
5. SIGNIFICANCE ASSESSMENT METHODOLOGY .................................................................................. 101
5.1. Nature of the impact................................................................................................................ 101
5.2. Extent of the impact ................................................................................................................ 101
5.3. Duration of the impact ............................................................................................................. 102
5.4. Potential intensity of the impact .............................................................................................. 103
5.5. Likelihood of the impact .......................................................................................................... 104
5.6. Cumulative Impacts ................................................................................................................. 105
5.7. Significance Assessment .......................................................................................................... 106
6. IMPACT IDENTIFICATION AND DESCRIPTION ................................................................................... 108
IMPACT ASSESSMENT AND RATING ..................................................................................................... 109
6.1. Impact Rating: Project Planning /Pre-Construction Phase......................................................... 109
6.2. Impact Rating: Project Construction Phase ............................................................................... 110
6.3. Impact Rating: Project Operational Phase ................................................................................ 115
6.4. Impact Rating: Project Decommissioning Phase ....................................................................... 117
7. CONCLUSIONS ................................................................................................................................. 112
8. RECOMMENDATIONS ...................................................................................................................... 112
9. REFERENCES .................................................................................................................................... 119
8. ANNEXURES .................................................................................................................................... 122
ANNEXURE 1- NOTICE OF THE FGD PROJECT TO INTERESTED AND AFFECTED PARTIES ..................... 122
ANNEXURE 2- NOTICES FOR PUBLIC MEETING TO DISCUSS THE PROPOSED MEDUPI FGD RETROFIT PROJECT IN LEPHALALE LOCAL MUNICIPALITY ................................................................................. 124

13
SIA prepared on behalf Zitholele Consulting and Eskom Holdings
ANNEXURE 3 – EXAMPLE OF SITE NOTICES PLACED AT VARIOUS VENUES AND PHOTOS TAKEN DURING PUBLIC MEETINGS THAT TOOK PLACE AS PART OF THE SIA CONSULTATIVE PROCESS ...................... 128
ANNEXURE 4- GENERAL SITE CONDITION OF THE EXISTING MEDUPI ADF ........................................ 137
ANNEXURE 5 – EXAMPLE OF A PUBLIC MEETING WHERE THERE WAS A NEED FOR PUBLIC ENFORCEMENT ............................................................................................................................... 146
ANNEXURE 6 – UPDATES TO PROJECT SCOPE 2017-2018 ................................................................ 148
ANNEXTURE 7: ESKOM MEDUPI POWER STATION ASH DISPOSAL FACILITY 4 TO 2O YEARS STORM WATER MANAGEMENT PLAN .......................................................................................................... 149
ANNEXTURE 8: MEDUPI PGD RETROFIT PROJECT CATCHMENT AREAS AND SUB-CATHCMENT LAYOUT ....................................................................................................................................................... 150
ANNEXTURE 9: ESKOM MEDUPI POWER STATION FGD RETROFIT PROJECT SITE ARRANGMENT ...... 151
ANNEXTURE 10: ESKOM MEDUPI POWER STATION RAILWAY YARD LAYOUT ................................... 152
LIST OF FIGURES
Figure 1– Location of the project area in Lephalale Local Municipality within Waterberg District
Municipality, Limpopo Province, South Africa. ....................................................................................... 20 Figure 2- Social Impact Assessment map showing zones of influence for the SIA study ........................... 21 Figure 3- Layout of the Medupi ADF in relation to Medupi Power Station (x is excluded in current study)
(Source: Zitholele Consulting, 2015) ....................................................................................................... 24 Figure 4- 3D model of the existing ash ADF (Source: Jones & Wagener, 2013) ........................................ 25 Figure 5- Location of the study area in relation to Lephalale Local Municipality of Waterberg District.... 39 Figure 6- Map showing aspects of Matimba, Grootegeluk, Medupi and settlement areas and water
bodies ................................................................................................................................................... 42 Figure 7 - Total Population of LLM 2001-2014 ....................................................................................... 43 Figure 8 - Total Population of Waterberg Municipalities 2001 – 2014 .................................................... 44 Figure 9 : Source of Migration into Lephalale LM ................................................................................... 44 Figure 10 : Education Levels................................................................................................................... 46 Figure 11- Diagnoses of those who went to seek medical assistance for Lephalale, Marapong and
Steenbokpan (represented as average number per household) (Itzkin, 2015) ......................................... 50 Figure 12- This graph presents the number of people with respiratory problems who experienced each of
the symptoms listed. These are measured as average per household for Lephalale, Marapong and
Steenbokpan (Itzkin, 2015) .................................................................................................................... 51 Figure 13- Sector Contribution to GDP ................................................................................................... 54 Figure 14 -Employment by Skill Level ..................................................................................................... 58 Figure 15 : Sector Employment within LLM ............................................................................................ 59 Figure 16 - Household Income and Expenditure in Lephalale .................................................................. 61 Figure 17- Location of Medupi in relation to Steenbokpan, Marapong, Onverwacht and Lephalale ........ 62

14
SIA prepared on behalf Zitholele Consulting and Eskom Holdings
Figure 18-Human Settlements in LLM 1995 – 2013 ................................................................................ 65 Figure 19 : Access to electricity within LLM ............................................................................................ 74 Figure 20 - Transport services LLM......................................................................................................... 75 Figure 21- Site notice at Lephalale FM ................................................................................................. 128 Figure 22- Site notice at the entrance of one of the local Zion church ................................................... 129 Figure 23-Site Notice at a local Spaza Shop Marapong ........................................................................ 129 Figure 24- Site notice at Marapong Clinic ............................................................................................ 130 Figure 25- Site notice near one of the Spaza Shops in Marapong ......................................................... 130 Figure 26- Site notice at Marapong Library .......................................................................................... 131 Figure 27- Site notice at Spar Onverwacht ........................................................................................... 132 Figure 28- Notice at Steenbokpan community hall (first row) and local Spaza shop (second row) ......... 133 Figure 29- Site notice at a Sasol donated facility in Steenbokpan ......................................................... 133 Figure 30- Site notice at Lephalale FET and Ellisras District Hospital ..................................................... 134 Figure 31 – Picture showing attendents and the meeting proceeding at Marpong Library on the 16 April
2015.................................................................................................................................................... 135 Figure 32 – Meeting proceeding at Leseding Community (Steenbokpan) .............................................. 136 Figure 33-Signage at the Medupi Ash Disposal Facility entrance point ................................................. 137 Figure 34- Available land that has been cleared for the growth of the Ash Disposal Facility (AFD). Image
taken from the west facing east .......................................................................................................... 138 Figure 35- The width of the facility facing Medupi from the west end of the ADF ................................. 138 Figure 36 – The western end on the AFD .............................................................................................. 139 Figure 37- Northern end of the AFD ..................................................................................................... 139 Figure 38- Northern dam associated with the AFD ............................................................................... 140 Figure 39- Current ash heap at the facility ........................................................................................... 141 Figure 40- Conveyor belt system associated with the AFD .................................................................... 142 Figure 41- Land dedicated to the facility. Taken south of the facility facing north ................................ 143 Figure 42- Image of the land dedicated to the facility and ash heap from Medupi power station. Taken
from the south facing north-east ......................................................................................................... 143 Figure 43- Two dams associated with the facility located south-west of the current ash heap .............. 143 Figure 44- Fence line demarcating the facility with the southern property and the railway line ............ 144 Figure 45- Machine that loads ash onto the facility from conveyor belt................................................ 144 Figure 46- Sprinkler system developed to suppress dust ....................................................................... 145

15
SIA prepared on behalf Zitholele Consulting and Eskom Holdings
LIST OF TABLES
Table 1- Meeting dates, venues and time .............................................................................................. 29 Table 2-Categories of social variables .................................................................................................... 36 Table 3 -ICGP lists of social variables ..................................................................................................... 37 Table 4- Scarce Skills within the Lephalale Municipality ......................................................................... 47 Table 5 : Chronicle of Health Conditions within the Lephalale Municipality ............................................ 52 Table 6- HIV Prevalence by District, Municipality and province .............................................................. 53 Table 7 – List of companies that participated in the water argumentation projection process (then DWA,
2009) .................................................................................................................................................... 69 Table 8- Projection of required water by key water users in Lephalale LM based on Scenario 9 of the DWS
(then DWA, 2009).................................................................................................................................. 70 Table 9-Sanitation within the LLM ......................................................................................................... 73 Table 10 – Identified Social Parameters during Stakeholder Engagement Forums for the Social Impact
Assessment in Lephalale in 2015 ........................................................................................................... 81 Table 11- Key Issues Discussed with Eskom EMC representatives .......................................................... 93 Table 12- Ecosystems change drivers associated with the project .......................................................... 98 Table 13- Criteria for the assessment of the extent of the impact. ........................................................ 101 Table 14- Criteria for the rating of the duration of an impact. .............................................................. 102 Table 15- Criteria for impact rating of potential intensity of a negative impact. ................................... 103 Table 16-Criteria for the impact rating of potential intensity of a positive impact. ............................... 104 Table 17- Criteria for the rating of the likelihood of the impact occurring ............................................. 105 Table 18- Significance rating formulas. ................................................................................................ 106 Table 19- Example of Rating Scale based on impacts associated with preconstruction of the FGD ........ 107

16
SIA prepared on behalf Zitholele Consulting and Eskom Holdings
LIST OF ABBREVIATIONS
Acronyms Description
ALADF Appropriately Licensed Waste Disposal Facility
DWA Department of Water Affairs
DWS Department of Water and Sanitation
CPC Community Participation Consultant
DEAT Department of Environmental Affairs and Tourism
EIA Environmental Impact Assessment
FGD Flue Gas Desulphurisation
IAR Impact Assessment Report
IDPs Integrated Development Plans
IEA Integrated Environmental Assessment
IFC International Finance Corporation
MW Megawatts
MCWAP Mokolo Crocodile (West) Water Argumentation Project
Medupi EMC Medupi Environmental Monitoring Committee
NO2 Nitrogen Oxide
O3 Ozone
PM Particulate Matter

17
SIA prepared on behalf Zitholele Consulting and Eskom Holdings
SDBIPs Service Delivery and Budget Implementation Plans
SMMEs Small Medium Enterprises
SIA Social Impact Assessment
SO2 Sulphur dioxide
SRMC Social Risk Management Company
ADF Waste Disposal Facility
WHO World Health Organisation
WMA Water Management Area

18
SIA prepared on behalf Zitholele Consulting and Eskom Holdings
1.INTRODUCTION
1.1.Project Description and Background
The current study is a Social Impact Assessment (SIA) for the proposed Medupi Power Station FGD-RP, the
operation of the existing Medupi Power Station ADF and the proposed railway siding (south-west of
Medupi six units and south of conveyor transport Medupi FGD-RP waste materials). The study also
assesses the issue of water usage within Medupi footprint and water demand for current and future
operation of Medupi Power Station with the FGD. How these activities positively and negatively impact
on the environmental and social fabric of communities of Lephalale and the Waterberg District
Municipality is assessed.
The project is located in Lephalale Local Municipality, within Waterberg District, Limpopo Province, South
Africa (Figure 1). Medupi Power Station (hereafter referred to as Medupi) is one of two South African
mega power generation projects under construction, with other being Kusile Power Station in
Mpumalanga Province. Medupi, like Kusile Power Station, is a coal fired power station in its completion
stages located on an Eskom owned property, Farm Naauw Ontkomen 509 LQ, in Lephalale Local
Municipality. The power station (Medupi) consists of six units with a total power generation capacity of
4800 Megawatts (MW) (Eskom, 2006). The first of the six units came online on mid-2015.
Coal fired power stations are known to emit pollutants such as sulphur dioxide (SO2). SO2 is one of the
most harmful gases produced through combustion of solid fossil fuel such as coal (World Health
Organisation, 2014). Coal is the main solid fossil fuel that will be used in Medupi to generate electricity
through combustion. Like with combustion of fossil fuel, there are other emissions that are produced
throughout the coal life cycle such as nitrogen oxide (NO2), ozone (O3) and particulate matter (PM) of
various sizes (World Health Organisation, 2014).

19
SIA prepared on behalf Zitholele Consulting and Eskom Holdings
Electricity and access to electricity are essential to improved human quality. The South African Bill of
Rights puts electricity as one of the three pillars of social service resource, others being water and
sanitation (Constitution of the Republic of South Africa, 1996). However, this essential social service
comes at a detrimental cost to both human health and the wellbeing the environment affecting
biodiversity and aquatic life particularly in the economies that are highly dependent on coal as a source
of energy for their power generation. South Africa is one such economy whose energy mix is 80%
dependent on coal fired power stations. The legislated government department responsible for energy
in South Africa is the Department of Energy. In its website, the department asserts that, “access to
electricity in 1994 was at lower percentage. Since 1994 the Department of Energy (through INEP) make it
possible to electrify 6.954 million households using grid technology and over 103 000 households from off-
grid technology to connect houses in SA which resemble 90% access to electricity” (Department of Energy,
2017). The generation, transmission and distribution of power are however the responsibility of Eskom,
a State-Owned Enterprise (SOE) which generates approximately 95% of the electricity used in South Africa
and approximately 45% of the electricity used in Africa.
Medupi Power Station is built in an area with an existing coal fired power station, Matimba Power Station,
located approximately 4.5km north-east of Medupi Power Station and south-west of the town of
Marapong (see Figure 2). During the feasibility phase, various impact assessment studies were carried
out to determine environmental and social impacts of the project locally, regional and globally. These
included air quality studies and the social impacts of Matimba Power Station. Among the gases detected
were high levels of SO2 and exposure to particulate matter (PM) from Matimba and Grootegeluk mine.
One of the planning objectives for the Medupi project is to reduce the high levels of SO2 in the receiving
environment and to comply with South Africa’s Air Quality Minimum Emission Standards. In order for
the Medupi Power Station to comply with its Air Emissions License targets for SO2 reduction, it is proposed
the Wet FGD technology be retrofitted to the power station. Based on the engineering feasibility studies
(please reference the conceptual design report) the proposed FGD technology will reduce SO2 emission
levels by 93% at worst case coal scenario. The social impacts of SO2 will be discussed at length in the
report; the discussion will also include the mechanism by which SO2 negatively impacts on environmental
and public health.

20
SIA prepared on behalf Zitholele Consulting and Eskom Holdings
Figure 1– Location of the project area in Lephalale Local Municipality within Waterberg District
Municipality, Limpopo Province, South Africa.
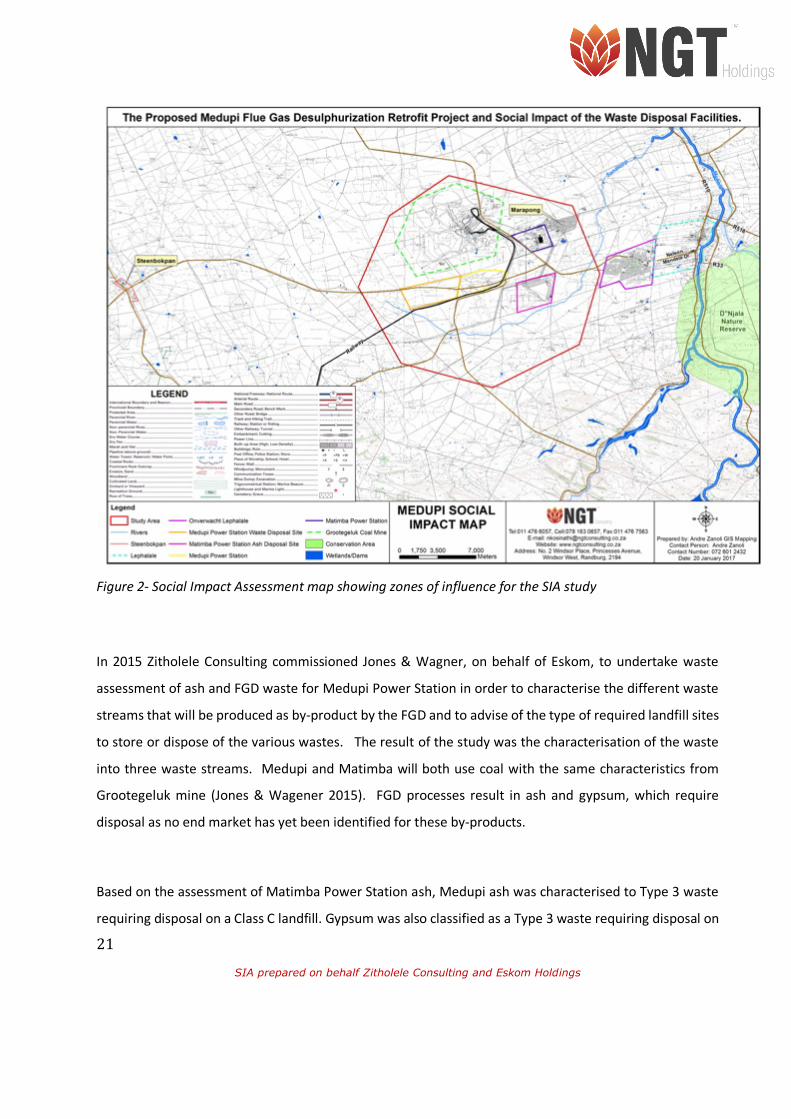
21
SIA prepared on behalf Zitholele Consulting and Eskom Holdings
Figure 2- Social Impact Assessment map showing zones of influence for the SIA study
In 2015 Zitholele Consulting commissioned Jones & Wagner, on behalf of Eskom, to undertake waste
assessment of ash and FGD waste for Medupi Power Station in order to characterise the different waste
streams that will be produced as by-product by the FGD and to advise of the type of required landfill sites
to store or dispose of the various wastes. The result of the study was the characterisation of the waste
into three waste streams. Medupi and Matimba will both use coal with the same characteristics from
Grootegeluk mine (Jones & Wagener 2015). FGD processes result in ash and gypsum, which require
disposal as no end market has yet been identified for these by-products.
Based on the assessment of Matimba Power Station ash, Medupi ash was characterised to Type 3 waste
requiring disposal on a Class C landfill. Gypsum was also classified as a Type 3 waste requiring disposal on
22
SIA prepared on behalf Zitholele Consulting and Eskom Holdings
a Class C landfill, showing very similar characteristics to the Medupi ash (Jones & Wagener 2015). Sludge
was classified as either Type 1 or 2, which requires disposal “…in a Class A or Class B landfill for material
using 96% of calcium carbonate and 85% of calcium carbonate” (Jones & Wagener 2015). The chemical
salts will require disposal in a Class A landfill site because they were classified as “…Type 1 waste due to
likely leachable TDS concentration as a result of high concentration of sodium chloride in the solid
material...” (Jones & Wagener 2015). According to Jones & Wagener (2015), the Class A landfill offers the
highest level of environmental protection of landfill barrier in South Africa and [would be the most suitable
landfill for both sludge and salts produced at Medupi Power Station].
The ash and gypsum that will be produced from Medupi (retrofitted FGD) will be disposed in the existing
Class C facility on an Eskom owned property on Farm Eenzaamheid 687 LQ (Figure 3 & Figure 4 (3 D model
of the ADF)).
Other by-products of the FGD processes include chemical salts and sludge. The chemical salts and sludge
will be disposed at an appropriately licensed waste disposal facility (ALADF). A decision on the ALADF is
still to be made by Eskom in consultation with its stakeholders, but the facility should be a Class A facility
as per Jones & Wagener (2015) recommendations.
The FGD technology and the operation of the ADF for disposing of Medupi ash and the gypsum require
high levels of water usage in a region with scarce water resources. This SIA report, therefore also assesses
the social impacts associated with the water requirements of the FGD technology in Medupi and the
existing ADF in a region known to be experiencing water constraints.
Zitholele Consulting was appointed by Eskom to manage the Environmental Assessment process (and the
associated specialists’ impact assessment studies) for the proposed Medupi Flue Gas Desulphurisation
(FGD) retrofit project and for the existing waste disposal facility (Annexure 5). Zitholele Consulting, in
turn, sub-contracted NGT to conduct a Social Impact Assessment (SIA) to inform the impact assessment
phase of the IEA for the FGD and the ADF for ash and gypsum.

23
SIA prepared on behalf Zitholele Consulting and Eskom Holdings
1.2. Declaration of independence
I, Nkosinathi Godfrey Tomose, confirm that I have no conflicting interests in the undertaking of the
proposed activity, that I am independent and conduct my work in an objective manner, that this report
complies with the requirements for specialist reports as contained in Appendix 6 of the EIA Regulations
published in December 2014, that I have the necessary expertise to conduct studies of this nature and
that I will disclose any information I have that I may deem necessary and relevant to the proposed project.
17/February/2018

24
SIA prepared on behalf Zitholele Consulting and Eskom Holdings
Figure 3- Layout of the Medupi ADF in relation to Medupi Power Station (x is excluded in current study) (Source: Zitholele Consulting, 2015)
ExistingAshDisposalFacility(ash&gypsum)
MedupiPowerStation
X
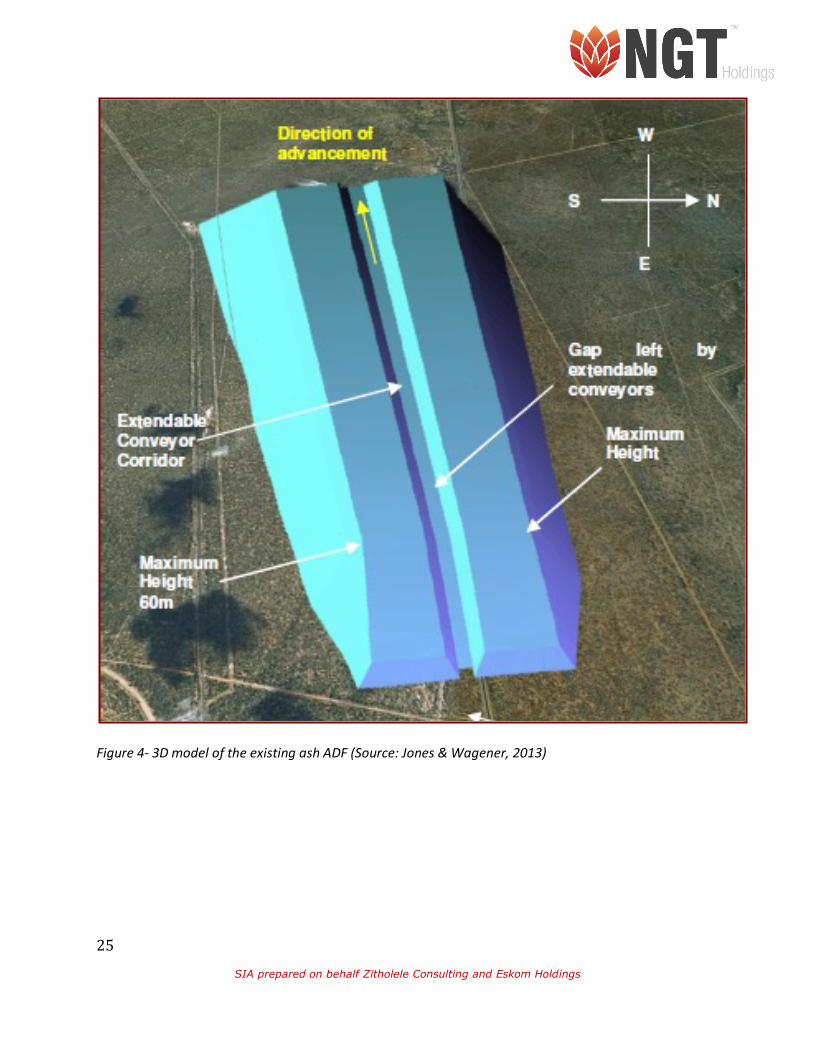
25
SIA prepared on behalf Zitholele Consulting and Eskom Holdings
Figure 4- 3D model of the existing ash ADF (Source: Jones & Wagener, 2013)

26
SIA prepared on behalf Zitholele Consulting and Eskom Holdings
1.3. Terms of Reference and Scope of Work
This SIA forms part of the project scope deliverables for the study, (EIA) for the proposed Medupi Power
Station FGD retrofit project Impact Assessment (IA) Phase (inclusive of waste management licensing and
water licensing). This SIA involves:
• The assessment of social impacts of the proposed Medupi Power Station FGD-RP (and the
associated infrastructure like the proposed railway yard), with specific focus on how the project
will positively or negatively impact on the environment and the social fabric of the Lephalale and
the Waterberg District communities and the available ecosystem services.
• Assessment of potential social impacts associated with the operation and decommissioning of the
existing and authorised waste multi disposal facility for ash and gypsum disposal.
• Provision of specialist opinion on the potential social impacts for the proposed trucking of sludge
and salts to an authorised waste disposal facility outside of the study area. A separate process
for the disposal of salt and sludge will be undertaken separately from the current application
(Zitholele BID – Annexure 6)
• Discussion of the ratings and integrate the assessment for the purpose of the EIA.
• To compile a Social Impact Assessment (SIA) documenting the findings.
• To make recommendations and conclusions on how the positive social impacts should be
enhanced for societal benefits while minimising the project negative social impacts.
• Public participation meetings were held in Lephalale, Limpopo Province as part of the EIA (with
Zitholele) and the SIA process (NGT and I & APs including the project proponent); the results of
these meetings are utilised to inform the discussions, conclusions and recommendation made
about the Medupi FGD-RP.
1.4. Assumptions and Limitations
The following assumptions and limitations are applicable to this study:
• In order to understand the social environment and to predict impacts, complex systems have to be
reduced to simple representations of reality (DEAT, 2002a). The experience of impacts is subjective
on what one person may see as a negative impact may not be perceived as such by another person.

27
SIA prepared on behalf Zitholele Consulting and Eskom Holdings
• The study was based on information available to the author during the assessment process and at
the time of compilation of this report.
• In addition to the various drafts of the SIA for the FGD-RP report compiled by NGT, information on
stakeholders and comments received during the various public participation meetings for the project
was utilised, as is usually the case with SIAs that form part of the Environmental Impact Assessment
(EIA) process. SIAs normally draw heavily from information gathered during public participation
(identified stakeholders as well as comments received).
• No economic modelling or analysis was done as part of the SIA. Any data relating to the economic
profile of the area was obtained from municipal sources, such as municipality/provincial websites,
Integrated Development Plans (IDPs), Service Delivery and Budget Implementation Plans (SDBIPs)
and census data.
• This report only applies to the Medupi Power Station FGD-RP, the existing authorised ADF, the
proposed railway yard with its associated infrastructure and it will not necessarily be accurate for
and applicable to similar activities at other sites.
1.5. Study Method and Report Format
The following steps were followed during the process of conducting the SIA:
• Literature review and information gathering;
• Social baseline compilation;
• Sensitivity analysis (scoping);
• Stakeholder identification;
• Field work preparation and arrangements;
• Undertaking of field work;
• Data analysis and interpretation;
• Project, site and route description;
• Impact description and analysis;
• Identification of mitigation measures; and
• Report compilation.

28
SIA prepared on behalf Zitholele Consulting and Eskom Holdings
These steps loosely form the basis of the format of the report, which is as follows:
• INTRODUCTION:
o Project description and background
o Declaration of independence
o Terms of reference and scope of work
o Assumptions and limitations
o Study method and report format
• LEGAL FRAMEWORK AND GUIDELINES
o Legal mandate to address social issues in EIA
o Guideline documents consulted and adhered to
• BASELINE STUDY: Provincial, District and Local Municipal levels
• STAKEHOLDER IDENTIFICATION AND FIELD WORK
• ASSESSMENT METHODOLOGY
• SENSITIVITY ANALYSIS
• IMPACT ASSESSMENT AND RATING
• MITIGATION
• RECOMMENDATIONS
• BIBLIOGRAPHY
Fieldwork for the project was carried out on two occasions:
• Fieldwork that solely focused on the social impacts of the FGD-RP which involved setting up
meeting at key zones of influences such as Marapong, Steenbokpan, Onverwacht and Lephalale.
This included site meeting with Eskom environmental management team (Table 1). The dates for
this field work were as follows (Refer to Annexure 1-4: FGD project notices; notice of proposed
public meetings; site notices placed at various venues and photos of the meetings. Results have
been summarised in Table 10, Chapter 4 of this SIA):

29
SIA prepared on behalf Zitholele Consulting and Eskom Holdings
Table 1- Meeting dates, venues and time
Date of issue Meeting Date Venue Time
07 March 2015 18 March 2015 Marapong Library 09:00am to 2:00pm
07 March 2015 19 March 2015 Mogol Club 1:00pm to 3:00pm
07 March 2015 19 March 2015 Steenbokpan Leseding
Community Hall
09:00am to 12:00pm
Meeting proposal
12 January 2018
16 January 2018 Eskom Environmental
Management Office,
Medupi Power Station
11:00am to 3:30pm
(meeting inclusive of
site walk-about)
• Fieldwork that looked at the waste disposal facility for ash and gypsum which are by-products of
Medupi Power Station as well as attendance of the public participation meeting with Zitholele
Consulting Public Participation team: in February 2016
• Meeting with farmers and other property owners: in February 2016
• Fieldwork for the waste disposal facility was conducted by Mr Nkosinathi Tomose and Miss Zanele
Tomose to verify the site and current conditions: on Friday 25 November 2016.
• The field survey of the proposed railway siding as well as the Medupi construction sites and
existing stockpiles and dams was conducted by Nkosinathi Tomose (NGT) and Miss Taryn Aspeling
(NGT) in company of Mr Emile Marell (Eskom) and Mr Dovhani Mudzielwana (Eskom) on Tuesday
the 16th
of January 2018.
SIA is not as seasonal as biodiversity assessments as the human population affected by the project are
resident throughout the year/constant throughout the year.
30
SIA prepared on behalf Zitholele Consulting and Eskom Holdings
2. LEGAL FRAMEWORK AND GUIDELINES
2.1. Legal Mandate to Address Social Issues in Environmental Imapct Assessment
Constitution of the Republic of South Africa
Aucamp (2009a) writes that there is a clear mandate in the Constitution of the Republic of South Africa
(Act 108 of 1996) to include social issues in the EIA process. The Bill of Rights in the Constitution states:
Everyone has the right –
(a) to an environment that is not harmful to their health and wellbeing; and
(b) to have the environment protected, for the benefit of present and future generations, through
reasonable legislative and other measures that –
(i) prevent pollution;
(ii) promote conservation; and
(iii) secure ecologically sustainable development and use of natural resources while promoting
justifiable economic and social development.
National Environmental Management Act
The National Environmental Management Act (Act 107 of 1998) (NEMA) states that, whereas many
inhabitants of South Africa live in an environment that is harmful to their health and well-being, the
following (relating to the social environment) are acknowledged.
• Everyone has the right to an environment that is not harmful to his or her health or well-being.
• The State must respect, protect, promote and fulfil the social, economic and environmental rights of
everyone and strive to meet the basic needs of previously disadvantaged communities.
• Inequality in the distribution of wealth and resources, and the resultant poverty, are among the
important causes as well as the results of environmentally harmful practices.

31
SIA prepared on behalf Zitholele Consulting and Eskom Holdings
• Sustainable development requires the integration of social, economic and environmental factors in
the planning, implementation and evaluation of decisions to ensure that development serves present
and future generations.
• Everyone has the right to have the environment protected, for the benefit of present and future
generations, through reasonable legislative and other measures that -
o prevent pollution and ecological degradation;
o promote conservation; and
o secure ecologically sustainable development and use of natural resources while promoting
justifiable economic and social development.
Aucamp (2009b) lists environmental principles that must be adhered to in all Acts pertaining to the
environment. The following NEMA principles listed refer directly to the human/social environment.
• Environmental management must place people and their needs at the forefront of its concern, and
serve their physical, psychological, developmental, cultural and social interests equitably.
• Development must be socially, environmentally and economically sustainable.
• Environmental justice must be pursued as to not unfairly discriminate unfairly discriminate against
any person, particularly vulnerable and disadvantaged persons.
• Equitable access to environmental resources, benefits and services to meet basic human needs and
ensure human wellbeing must be pursued.
• Decisions must take into account the interests, needs and values of all interested and affected parties,
including all forms of traditional and ordinary knowledge.
• The social, economic and environmental impacts of activities, including disadvantages and benefits,
must be considered, assessed and evaluated, and decisions must be appropriate in the light of such
consideration and assessment.

32
SIA prepared on behalf Zitholele Consulting and Eskom Holdings
Section 24 of NEMA states that the potential impact on the environment, socio-economic conditions and
cultural heritage of activities that require authorisation must be considered, investigated and assessed
prior to implementation, in order to give effect to the general objectives of integrated environmental
management.
Environmental Impact Assessment Regulations
According to Regulation 10 (c) of the Environmental Impact Assessment (EIA) Regulations that were
passed in terms of Chapter 5 of NEMA in December 2014 the competent (decision-making) authority is
entitled to all information that has or may have the potential of influencing any decision with regard to
an application. It can be argued that, since social impacts have the potential of influencing the authority’s
decision, as much information on potential social impacts as practicably possible should be supplied to
the decision-making authority as part of the application (Bezuidenhout, 2009).
The EIA Regulations also prescribe the content of Basic Assessment Reports, Scoping Reports and
Environmental Impact Assessment Reports and include features applicable to social impacts, including: A
full description of the process followed to reach the proposed preferred alternative (BAR) / activity, site
and location (SR) / development footprint (EIR) within the site, including:
• (iv) the environmental attributes associated with the alternatives focusing on the geographical,
physical, biological, social, economic, heritage and cultural aspects; and
• (vii) positive and negative impacts that the proposed activity and alternatives will have on the
environment and on the community that may be affected focusing on the geographical, physical,
biological, social, economic, heritage and cultural aspects.
(Content of Basic Assessment Reports: Appendix 1(3)(1)(h), Scoping Reports: Appendix 2(2)(h) and
Environmental Impact Assessment Reports: Appendix 3(3)(h)).
It is clear from the above that, although there are no explicit requirements for conducting comprehensive
SIAs in NEMA or the EIA Regulations, environmental and social interests should be considered equally
important.

33
SIA prepared on behalf Zitholele Consulting and Eskom Holdings
National Environmental Management Air Quality Act No. 39 of 2004
This Act sets norms and standards for regulating air quality in South Africa in order to protect the
environment by providing reasonable measures for the prevention of pollution and ecological degradation
and for securing ecologically sustainable development while promoting justifiable economic and social
development. To also regulate air quality monitoring, management and control, for both specific air
quality measures and matters incidental thereof. It promulgation is triggered by the fact that the quality
of ambient air in many areas of the country are not conducive to a healthy environment for the people
living in those areas let alone promoting their social and economic advancement. This is true in the case
of the Waterberg which has been declared as one of South Africa’s priority areas in terms of pollution.
The application of this Act in terms of the SIA is important considering the fact that the burden of health
impacts associated with polluted ambient air falls most heavily on the poor, whereas air pollution carries
a high social, economic and environmental cost that is seldom borne by the polluter.
National Environmental Waste Management Act (No.59 of 1998)
In terms of Section 44 of the National Environmental Waste Management Act (NEWMA) No. 59 of 1999
all listed waste management activities must be licensed and in terms of the Act. The Act makes provisions
that the licensing procedure must be integrated with the environmental impact assessment (EIA) process.
The FGD proposed at Medupi Power Station will result to production of hazardous waste materials such
as chemical salts and sludge as well as gypsum and ash. All these by-products of the FGD required
application in terms of the NEWMA. The current SIA evaluates the provisions made in the Act for the
protection of human health and their ecology through provision of reasonable measures for the
prevention of pollution and damage to human environment. This is important in the case of the proposed
Medupi FGD which will produce by-products such as chemical salts, sludge, ash and gypsum. All these by-
products require special licensing at certified landfill sites. The process of disposing and storing these by-
products of the FGD have direct consequence to potential negative or positive impacts of the project to
human health and the environment in which they live in.

34
SIA prepared on behalf Zitholele Consulting and Eskom Holdings
The Occupational and Safety Act, No. 85 of 1993
The nature of activities associated with the proposed FGD retrofit project have health and safety
dimension to them and this triggered provisions of Occupational Health and Safety Act (OHSA), No. 85 of
1993. The objective of this Act is to provide for health and safety of persons at work and for the health
and safety of persons in connection with the use of plant and Machinery; the protection of persons other
than persons at work against hazards to health and safety arising out of or in connection with the activities
of persons at work. It also aims to establish an advisory council for occupational health and safety; and
to provide for matters connected therewith. Section 12 of the OHSA is particularly relevant to this SIA
because it stipulates that every employer whose employees undertake listed work or are liable to be
exposed to the hazards emanating from listed work shall:
• Identify the hazards and evaluate the risks associated with such work constituting a hazard to the
health and safety of such employees and take the necessary steps to avoid such risks
• Prevent the exposure of such employees from such hazards as far as reasonably possible.
2.2. Guideline and other documents consulted and adhered to
The following international and local guidelines and standards were adhered to during the process of
conducting the SIA:
• Inter-organisational Committee on Guidelines and Principles for SIA (2003);
• Social Impact Assessment: Guidance for assessing and managing the social impacts (Vanclay F. E.,
2015);
• EIA Regulations, 2014: Appendix 6 – Specialist reports;
• Department of Environmental Affairs and Tourism, Information Series 4: Specialist studies;
• Department of Environmental Affairs and Tourism, Information Series 22: Socio-Economic Impact
Assessment;
• IFC Performance Standards on Environmental and Social Sustainability Effective January 2012
• International Principles for Social Impact Assessment
• International Association for Public Participation (http://www.iap2.org/)

35
SIA prepared on behalf Zitholele Consulting and Eskom Holdings
In addition, a PhD thesis titled “Social Impact Assessment as a tool for social development in South Africa:
An exploratory study” by Aucamp (2015) was used. This thesis investigated whether SIA can be used
effectively as a tool for social development in South Africa; to what extent the SIA methodology currently
practiced in South Africa reflects social development, and whether guidelines for SIA can assist SIA
practitioners with achieving social development outcomes.
Lastly, two lists of social variables as identified by Vanclay (cited in DEAT, 2006) and the Inter-
organisational Committee on Guidelines and Principles for SIA (2003) respectively were used to ensure
that all potential social impacts of the development were identified and assessed for all four the project
stages. The two table below lists categories of social variable (Table 2) and list of social variable (Table 3).
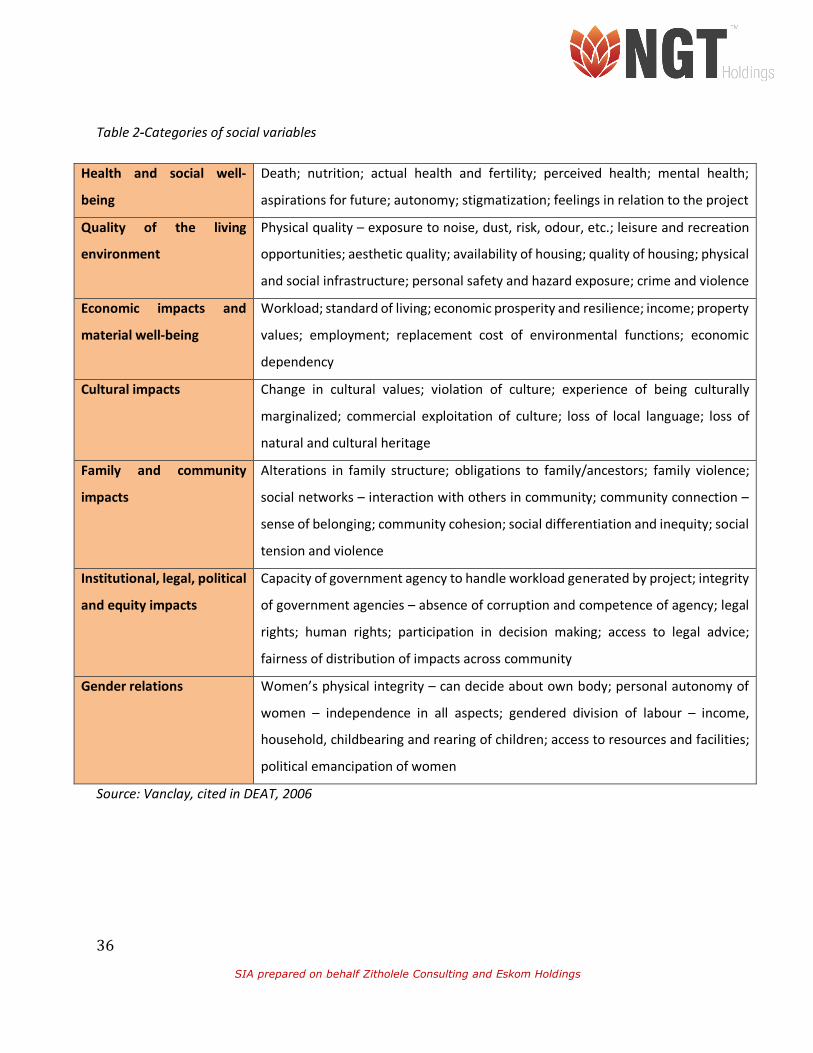
36
SIA prepared on behalf Zitholele Consulting and Eskom Holdings
Table 2-Categories of social variables
Health and social well-
being
Death; nutrition; actual health and fertility; perceived health; mental health;
aspirations for future; autonomy; stigmatization; feelings in relation to the project
Quality of the living
environment
Physical quality – exposure to noise, dust, risk, odour, etc.; leisure and recreation
opportunities; aesthetic quality; availability of housing; quality of housing; physical
and social infrastructure; personal safety and hazard exposure; crime and violence
Economic impacts and
material well-being
Workload; standard of living; economic prosperity and resilience; income; property
values; employment; replacement cost of environmental functions; economic
dependency
Cultural impacts Change in cultural values; violation of culture; experience of being culturally
marginalized; commercial exploitation of culture; loss of local language; loss of
natural and cultural heritage
Family and community
impacts
Alterations in family structure; obligations to family/ancestors; family violence;
social networks – interaction with others in community; community connection –
sense of belonging; community cohesion; social differentiation and inequity; social
tension and violence
Institutional, legal, political
and equity impacts
Capacity of government agency to handle workload generated by project; integrity
of government agencies – absence of corruption and competence of agency; legal
rights; human rights; participation in decision making; access to legal advice;
fairness of distribution of impacts across community
Gender relations Women’s physical integrity – can decide about own body; personal autonomy of
women – independence in all aspects; gendered division of labour – income,
household, childbearing and rearing of children; access to resources and facilities;
political emancipation of women
Source: Vanclay, cited in DEAT, 2006

37
SIA prepared on behalf Zitholele Consulting and Eskom Holdings
Table 3 -ICGP lists of social variables
Population change
Population size, density and change; influx and outflow of temporary workers;
presence of seasonal (leisure) residents; relocation of individuals or families; racial and
ethnic composition and distribution
Community/
Institutional
arrangements
Voluntary associations; interest group activity; size and structure of local government;
industrial/commercial diversification; employment/income characteristics;
local/regional/ national linkages; employment equity of disadvantaged groups;
historical experience of change
Political and social
resources
Distribution of power and authority; inter-organisational cooperation; conflict
between newcomers and long term residents; identification of stakeholders;
interested and affected parties; leadership capability and characteristics
Individual and
family level
impacts
Displacement/relocation concerns; trust in political and social institutions; residential
stability; family and friendship networks; density of acquaintanceships; perceptions of
risk, health and safety; attitudes towards the proposed action; concerns about social
well-being
Community
resources
Change in community infrastructure; indigenous populations; changing land use
patterns; family and friendship networks; effects on known cultural, historical, sacred
and archaeological resources
Source: ICGP, 2003
38
SIA prepared on behalf Zitholele Consulting and Eskom Holdings
3. BASELINE STUDY
The most common source of quantitative data in SIA is census data, which is used to produce demographic
profiles. It is commonly used to provide baseline information. Other sources include Integrated
Development Plans (IDPs), Spatial Development Frameworks (SDFs), Service Delivery and Budget
Implementation Plans (SDBIPs) and Employment, Growth and Development Plans (EGDPs).
Baseline conditions are the existing conditions and past trends associated with the human environment
in which the proposed activity is to take place (DEAT, 2006).
Establishing the baseline conditions is essential for describing the receiving environment, the status quo
and for identifying and predicting potential impacts. “A prediction of change can only be as effective as
the baseline information from which it is derived. It is thus important that the specialist puts the proposed
project in perspective by comparing the current state with the potential future state” (DEAT, 2002a).
3.1. Affected Environment and Description
Medupi Power Station is located west of Lephalale in Limpopo Province a little east of the South African
border with Botswana, in Lephalale Local Municipality of Waterberg District (Figure 5). The SIA covered a
30km radius from Medupi in order to include all the human settlement areas such as Steenbokpan and
villages north of Lephalale Town.
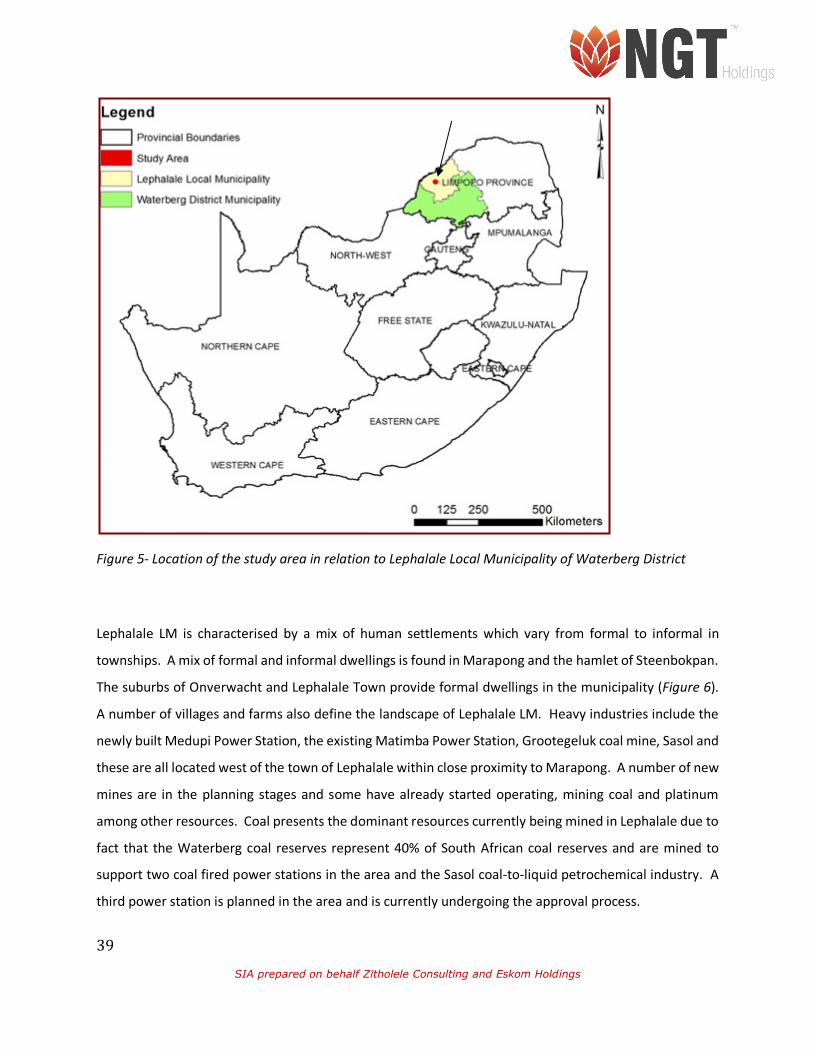
39
SIA prepared on behalf Zitholele Consulting and Eskom Holdings
Figure 5- Location of the study area in relation to Lephalale Local Municipality of Waterberg District
Lephalale LM is characterised by a mix of human settlements which vary from formal to informal in
townships. A mix of formal and informal dwellings is found in Marapong and the hamlet of Steenbokpan.
The suburbs of Onverwacht and Lephalale Town provide formal dwellings in the municipality (Figure 6).
A number of villages and farms also define the landscape of Lephalale LM. Heavy industries include the
newly built Medupi Power Station, the existing Matimba Power Station, Grootegeluk coal mine, Sasol and
these are all located west of the town of Lephalale within close proximity to Marapong. A number of new
mines are in the planning stages and some have already started operating, mining coal and platinum
among other resources. Coal presents the dominant resources currently being mined in Lephalale due to
fact that the Waterberg coal reserves represent 40% of South African coal reserves and are mined to
support two coal fired power stations in the area and the Sasol coal-to-liquid petrochemical industry. A
third power station is planned in the area and is currently undergoing the approval process.
Botswana

40
SIA prepared on behalf Zitholele Consulting and Eskom Holdings
Land uses of Lephalale LM can therefore be described as a mix of agricultural activities, game farming,
cattle ranching, industrial activities such as mining, power generation, domestic and industrial water
supply. These activities make up 87% of the total land use of Lephalale LM. Lephalale LM and the
Waterberg District are characterised by a number of game farms and conservation areas, with the
Waterberg Mountains boasting a national conservation status. Within Lephalale LM only one declared
conservation area is found and it is situated south-east of the town of Lephalale i.e. D”Njala Nature
Reserve (Figure 6).
The study area is characterised by a number of secondary roads, with Nelson Mandela Drive cutting across
the Town of Lephalale, past Onverwacht towards Medupi Power Station (Figure 6). In the east, it joins
the R510 (linking Lephalale to Thabazimbi in the south) west of Mokolo River. Other secondary roads that
are linked to the R510 which provide access to Lephalale include the R518 and R33. A railway line from
Grootegeluk mine passes east and south of Medupi Power Station and extends westwards south of the
existing ADF, then south towards Thabazimbi. This is the only documented railway line within the study
area.
Marapong is the closest human settlement to Medupi Power Station. It is located approximately 8.6km
north-east of the power station and falls within the 10km radius determined as the key priority area/zone
of influence. The second closest location is Onverwacht at approximately 10.5km east of the power
station. It falls outside the 10km buffer zone defined as the priority area. Lephalale Town is third human
settlement situated in close proximity to the power station; it is located approximately 12.6km east of
Medupi and east of Onverwacht. It also falls outside the 10km priority area. All these three human
settlements are located north and east of Medupi and the existing ADF with prevailing winds blowing
north-south and north-east to south-west towards Thabazimbi and the village of Steenbokpan (located
some 27km west of Medupi). This means that Marapong, Onverwacht and Lephalale will not be directly
significantly affected by emissions from Medupi as determined by the direction of winds and its variables.

41
SIA prepared on behalf Zitholele Consulting and Eskom Holdings
The following landmark features can be observed in Figure 6 below:
• Mokolo River is situated east of the Town of Lephalale and adjoin by a small tributary called
Sandloop which extends south to west of Medupi Power Station and the ADF.
• A number of pans and wetlands are found throughout Lephalale LM with a large number of
wetlands found along Mokolo River and southwest of D”Njala Nature Reserve.
• In close proximity to the study area, three wetlands have been recorded near the Matimba ADF,
east of Matimba Power Station and south of Grootegeluk coal mine.

42
SIA prepared on behalf Zitholele Consulting and Eskom Holdings
Figure 6- Map showing aspects of Matimba, Grootegeluk, Medupi and settlement areas and water
bodies

43
SIA prepared on behalf Zitholele Consulting and Eskom Holdings
3.2. Population Dynamics in Lephalale LM
The Local Economic Development Strategy for Lephalale LM show that the population in Lephalale has
increased by 45% between 2001 and 2014 (from 85,155 to 123,869) (Figure 7) (LM IDP, 2016-2017).
Population growth in the Lephalale town node is among the highest in the Limpopo Province. The surge
in population is also experienced south of Lephalale LM; for example, Thabazimbi has experienced a
population increase of 35%, Mookgopong an increase of 13%, Modimolle an increase of 11%, Bela-Bela
an increase of 36% and Mogalakwena recorded an increase 11% in the same period (Figure 8). In
Lephalale LM the influx can be directly attributed to the construction of the Medupi built coal fired power
station project and associated ancillary infrastructure. An assumption was also made that the overall
increase in population in the region could be as a result of projected future projects associated with the
Waterberg coal fields e.g. the expansion of the mining industry as well as coal-to-liquid petrochemical
industry project such as Sasol Mafutha 1 in Lephalale.
Figure 7 - Total Population of LLM 2001-2014
0
20 000
40 000
60 000
80 000
100 000
120 000
140 000
2001 2005 2010 2014
Lephalale

44
SIA prepared on behalf Zitholele Consulting and Eskom Holdings
Figure 8 - Total Population of Waterberg Municipalities 2001 – 2014
According to Lephalale LM IDP (2015-2016), 83% of the population migration into Lephalale LM came from
within the Limpopo Province, 11% from other South African provinces and 6% from outside South Africa
borders (Figure 9).
Figure 9 : Source of Migration into Lephalale LM
0
50 000
100 000
150 000
200 000
250 000
300 000
350 000
2001 2005 2010 2014
Population Waterbeg Municipalities
Thabazimbi Lephalale Mookgopong
Modimolle Bela-Bela Mogalakwena

45
SIA prepared on behalf Zitholele Consulting and Eskom Holdings
Based on the above figures, it can be concluded that Lephalale LM is the fastest growing South African
LM. Other major influencers are projected projects in the region associated with the Waterberg coal fields
such as the expansion of the coal mining industry (new mines), the developing coal to liquid petrochemical
industry such as Sasol Mafutha 1, the expansion of Grootegeluk coal mine as well as associated
infrastructure built industry such as road construction, water and sanitation built infrastructure, property
and housing development.
Section 3.5 below discusses the various economic activities in the LM, it is preceded by the discussion of
education and skills levels section (3.3) and health and wellbeing of people in Lephalale LM (section 3.4).
Both section 3.3 and 3.4 are seen as important indirect drivers of the economy.
3.3. Education and Skills Levels in Lephalale LM
Lephalale LM has a total of 94 various educational facilities spread throughout the municipality. According
to the LM’s IDP report (2015-2016), more than 95% of the population is within 30 minutes walking
distance to the nearest education facility. Accessibility to schools in the rural areas is relatively good
particularly for primary schools. This is not the case with regards to secondary schools as there are still
students who stay more than 10km away from the nearest education facility. Access to secondary
education has resulted in low numbers of pupils proceeding to tertiary education. The assumption is
made that this could be as the result of learners being despondent of traveling long distance to go to
school and the cost of public transport resulting in absenteeism and poor learner performance at the end
of the year prohibiting them to proceed further with their education.
However, there could be other social and socio-economic influencers to the situation such as the
availability of reading materials, qualified teachers and poor school infrastructure. One of the challenges
that the municipality has listed is that most of the secondary schools in the rural areas do not have enough
teachers to offer mathematics and science subjects, and a lack of technical high schools limits career paths
for students.

46
SIA prepared on behalf Zitholele Consulting and Eskom Holdings
In terms of overall performance, the LM seems to be slightly higher than the Waterberg and Limpopo in
terms of education levels but not sufficient to respond to the needs of the growing economy such as the
Lephalale one. Research from Quantec Regional Database and PD Consulting found that 75% of the
Lephalale population has schooling below Grade 12 levels (some secondary, complete primary, some
primary, and no schooling at all) (Figure 10).
Figure 10 : Education Levels
It has to be noted that not all of Lephalale citizens are below Grade 12 in terms of their educational
achievements. There are those who have proceeded beyond Grade 12 and who have obtained post-Grade
12 qualifications such as Diplomas, Degrees and Post-Graduates, but the numbers are very low (Figure 8).
This fast-growing economic hub only has one FET College, located in Onverwacht with the other campus
in Modimolle. The FET College offers a wide range of vocational and diploma courses
(http://www.careersportal.co.za/colleges/fet-colleges-public/881-lephalale-fet-college.html /22 January
2017).
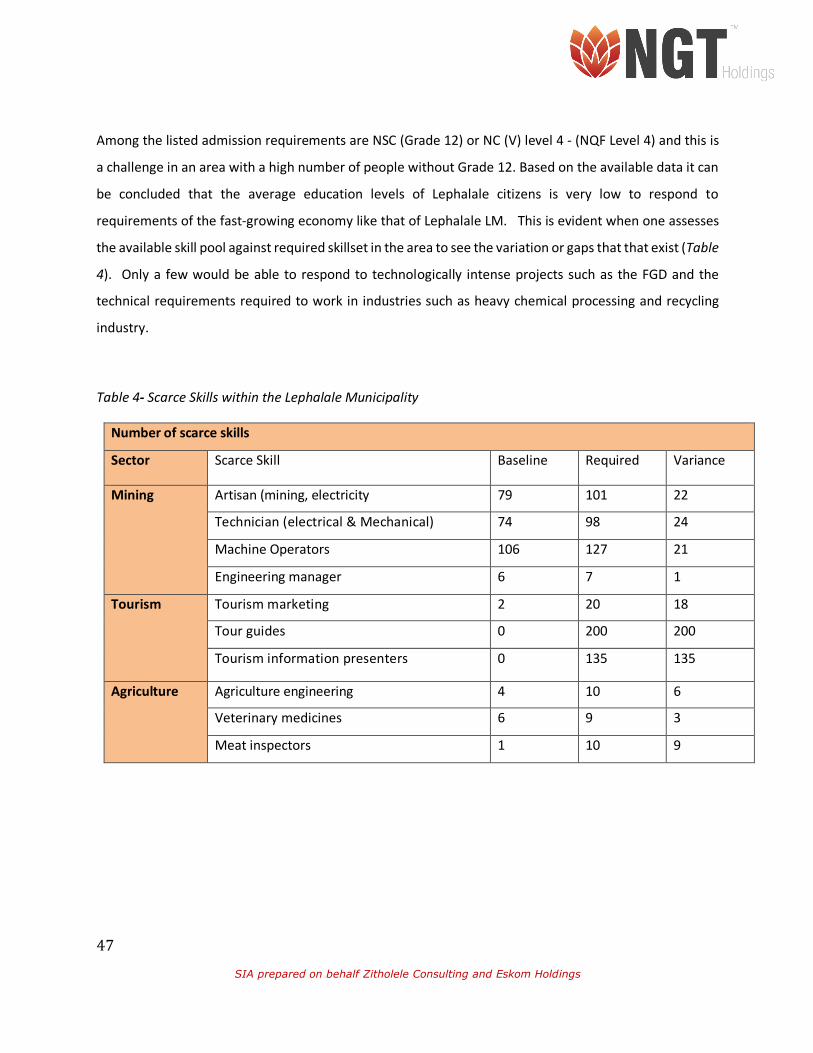
47
SIA prepared on behalf Zitholele Consulting and Eskom Holdings
Among the listed admission requirements are NSC (Grade 12) or NC (V) level 4 - (NQF Level 4) and this is
a challenge in an area with a high number of people without Grade 12. Based on the available data it can
be concluded that the average education levels of Lephalale citizens is very low to respond to
requirements of the fast-growing economy like that of Lephalale LM. This is evident when one assesses
the available skill pool against required skillset in the area to see the variation or gaps that that exist (Table
4). Only a few would be able to respond to technologically intense projects such as the FGD and the
technical requirements required to work in industries such as heavy chemical processing and recycling
industry.
Table 4- Scarce Skills within the Lephalale Municipality
Number of scarce skills
Sector Scarce Skill Baseline Required Variance
Mining Artisan (mining, electricity 79 101 22
Technician (electrical & Mechanical) 74 98 24
Machine Operators 106 127 21
Engineering manager 6 7 1
Tourism Tourism marketing 2 20 18
Tour guides 0 200 200
Tourism information presenters 0 135 135
Agriculture Agriculture engineering 4 10 6
Veterinary medicines 6 9 3
Meat inspectors 1 10 9

48
SIA prepared on behalf Zitholele Consulting and Eskom Holdings
3.4. Community Health and Wellness in Lephalale LM
The World Health Organisation (WHO) in 2012 reported that one in eight deaths in the world is due to air
pollution. The pollution is either ambient (outdoor) or indoor. WHO further concluded that 88% of
premature deaths in middle and low income countries whose economy is coal based to ambient pollution.
South Africa is one of such countries whose economy is coal based economy. To understand the
community health and wellness in Lephalale and the type of health challenges faced by those affected,
one has to understand the various types of polluters and the types of pollutants emitted and how these
negatively impact on human health.
Four main polluters have been identified in the study area and they include:
• Eskom through combustion of coal in its Matimba Power Station and the currently built Medupi
without the retrofitted FGD technology (Unit 6 was synchronised into the grid in 2015), and
disposal of ash from Matimba and Medupi;
• Grootegeluk coal mine through coal extraction and processing, fossil fuel combustion;
• Domestic fossil fuel combustion; and
• Fossil fuel combustion to support the thriving commercial and agricultural industries in the study
area.
In South Africa, like in many other parts of the world, there are three main anthropogenic polluters:
industrial combustion of fossil fuels, domestic burning of fossil fuels, and exhaust fuel from motor vehicles
and trucks. There are also sporadic veld fires, which contribute to the combustion of organic matter and
solid fossil fuel materials. Combustion of fossil fuel contributes to pollution of ambient and domestic air.
In Lephalale, coal is the main source of pollution throughout its life cycle: from extraction, combustion
through to disposal. It contributes to pollution of both ambient and domestic air through a wide range of
pollutants such as PM (particulates/dust), SO2 (Sulphur dioxide), NO2 (Nitrous oxide), O3 (Ozone) (Itzkin,
2015). Liquid fossil fuel burnt/used by cars contributes to carbon monoxide (CO), while other known
general pollutants include lead and volatile organic compounds.

49
SIA prepared on behalf Zitholele Consulting and Eskom Holdings
Exposure to some of the aforementioned pollutants, namely PM (i.e. PM10 and PM 2.5 µm), SO2, NO2, O3
can result to great harm to human health and wellbeing (WHO, 2014). The harm to human health as the
result of exposure to these pollutants is directly dependent on their spatial distribution and concentration
(McGranaham & Murray 20003). Most of the identified pollutants are a local phenomenon, with
concentration at a particular location dependent on the rate of emissions, geography, climate
combination and meteorological dispersion factors.
From a human health perspective, a number of illnesses or diseases are associated with the identified
pollutants, mostly produced throughout the coal life cycle, and these are mostly respiratory related or
cardiovascular in nature or cancer. Abnormal neurological development such as poor fetus growth is
known to occur in in children as the result of some of the pollutants, especially those that are coal based.
SO2 contributes a great deal to respiratory effects as the airways and lungs become damaged by exposure
to SO2 leading to inflammation, cytotoxicity and cell death. PM varies in size between 10 and 2.5 µm and
is known to cause asthma, decrease in lung function in children and also causes pulmonary disease. A
higher number of patients with lung cancer is often reported in areas with a higher concentration of
particular matter (PM) over a long period (Burt, Orris & Buchanon, 2013). SO2 is known to result in
increased severity and incidents of respiratory illnesses in communities that are exposed to high
concentrations. The gas is also known to cause inflammation and hyper-responsiveness of airways,
aggravate bronchitis and decrease lung function (ibid). There is a strong association between high levels
of exposure in a community and hospitalization as the result of SO2, including those with other respiratory
conditions (ibid). According to Burt, Orris and Buchanon, those highly susceptible to health risks
associated with high levels concentration of SO2 include people older than 60 years, children and
asthmatic patients. Low concentrations of the gas can also lead to death as the result of heart and lung
disease in susceptible patients.
Adel Itzkin (2015) Master of Science Thesis titled “Health in the Waterberg, Up in Smokes?” provides a
good insight into amount of pollution experienced by the people in the Waterberg as the result of the

50
SIA prepared on behalf Zitholele Consulting and Eskom Holdings
combustion of coal. The two graphs below provide a good example of the type of illness and disease
associated with some of the above mentioned gases and PM resulting from combustion of coal in power
generation efforts (Figure 11 & 12). The two graphs show that there is a correlation between illnesses
and disease associated with the combustion of coal and disease and illnesses experienced by the people
of Lephalale LM.
Figure 11- Diagnoses of those who went to seek medical assistance for Lephalale, Marapong and
Steenbokpan (represented as average number per household) (Itzkin, 2015)
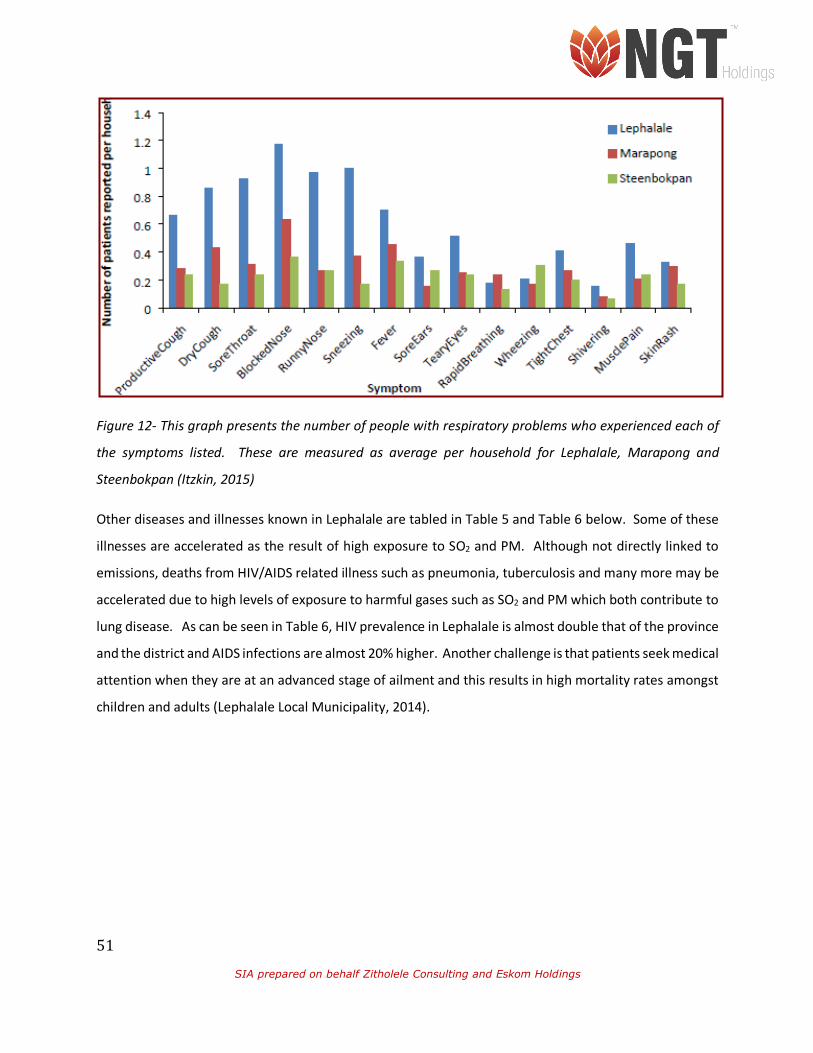
51
SIA prepared on behalf Zitholele Consulting and Eskom Holdings
Figure 12- This graph presents the number of people with respiratory problems who experienced each of
the symptoms listed. These are measured as average per household for Lephalale, Marapong and
Steenbokpan (Itzkin, 2015)
Other diseases and illnesses known in Lephalale are tabled in Table 5 and Table 6 below. Some of these
illnesses are accelerated as the result of high exposure to SO2 and PM. Although not directly linked to
emissions, deaths from HIV/AIDS related illness such as pneumonia, tuberculosis and many more may be
accelerated due to high levels of exposure to harmful gases such as SO2 and PM which both contribute to
lung disease. As can be seen in Table 6, HIV prevalence in Lephalale is almost double that of the province
and the district and AIDS infections are almost 20% higher. Another challenge is that patients seek medical
attention when they are at an advanced stage of ailment and this results in high mortality rates amongst
children and adults (Lephalale Local Municipality, 2014).

52
SIA prepared on behalf Zitholele Consulting and Eskom Holdings
Table 5 : Chronicle of Health Conditions within the Lephalale Municipality
Chronical health condition In thousands
Tuberculosis Male 10
Female 10
Total 20
Heart attack Male 5
Female 8
Total 13
Stroke Male 5
Female 4
Total 9
Asthma Male 27
Female 38
Total 65
Diabetics Male 33
Female 44
Total 76
Cancer Male *
Female 6
Total 7

53
SIA prepared on behalf Zitholele Consulting and Eskom Holdings
Table 6- HIV Prevalence by District, Municipality and province
Geography Years 2001 2007 2011 2013 2007 -2013
Percentage Increase
Limpopo HIV+ estimates 211,106 339,034 371,439 379,718 12%
AIDS estimates 6,433 14,868 19,587 21,559 45%
Waterberg HIV + estimates 28,362 49,114 54,327 55,164 12%
AIDS estimates 885 2,201 2,921 3,191 45%
Lephalale HIV + estimates 4,335 8,203 9,901 10,309 26%
AIDS estimates 136 367 529 590 61%
3.5.Economic Activities in Lephalale LM
The 2013 Quantec regional database on economic activities in Lephalale LM shows that mining is the
biggest contributor to the municipality GDP, with a total of 34% contribution (Figure 11). It is followed by
electricity which contributes 23% to the LM GDP. Community services are the next biggest contributor at
16% and Trade at 9% respectively (Figure 11).
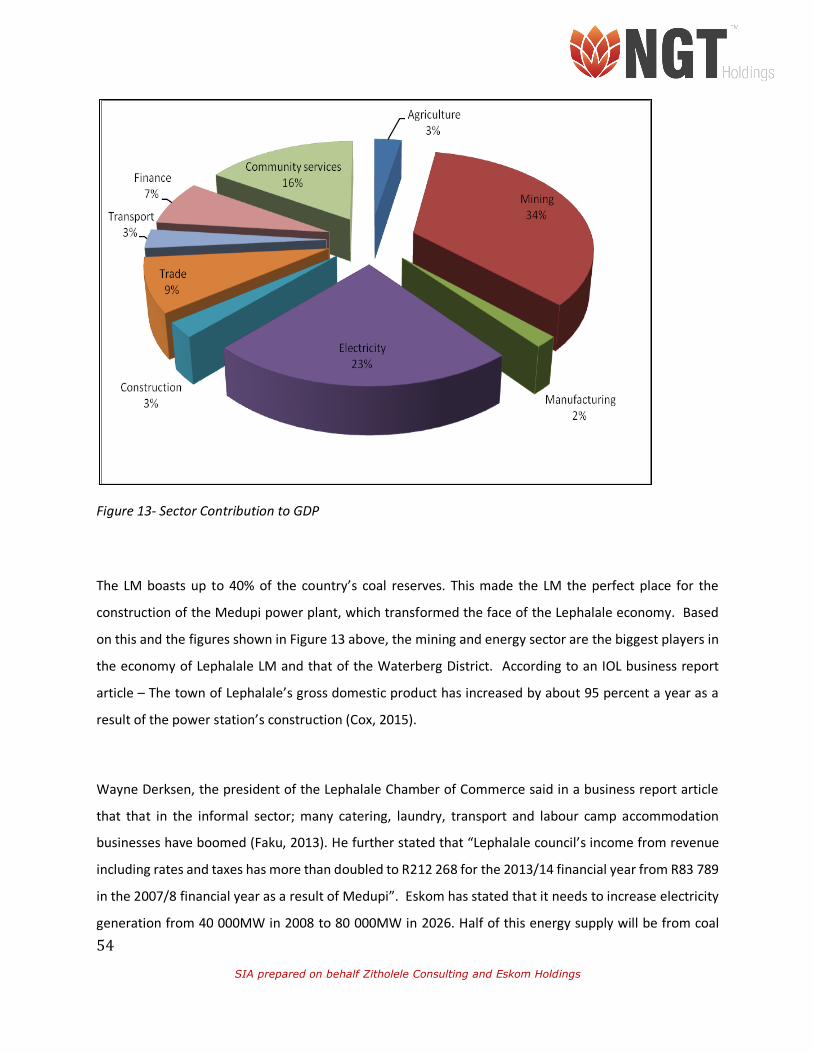
54
SIA prepared on behalf Zitholele Consulting and Eskom Holdings
Figure 13- Sector Contribution to GDP
The LM boasts up to 40% of the country’s coal reserves. This made the LM the perfect place for the
construction of the Medupi power plant, which transformed the face of the Lephalale economy. Based
on this and the figures shown in Figure 13 above, the mining and energy sector are the biggest players in
the economy of Lephalale LM and that of the Waterberg District. According to an IOL business report
article – The town of Lephalale’s gross domestic product has increased by about 95 percent a year as a
result of the power station’s construction (Cox, 2015).
Wayne Derksen, the president of the Lephalale Chamber of Commerce said in a business report article
that that in the informal sector; many catering, laundry, transport and labour camp accommodation
businesses have boomed (Faku, 2013). He further stated that “Lephalale council’s income from revenue
including rates and taxes has more than doubled to R212 268 for the 2013/14 financial year from R83 789
in the 2007/8 financial year as a result of Medupi”. Eskom has stated that it needs to increase electricity
generation from 40 000MW in 2008 to 80 000MW in 2026. Half of this energy supply will be from coal
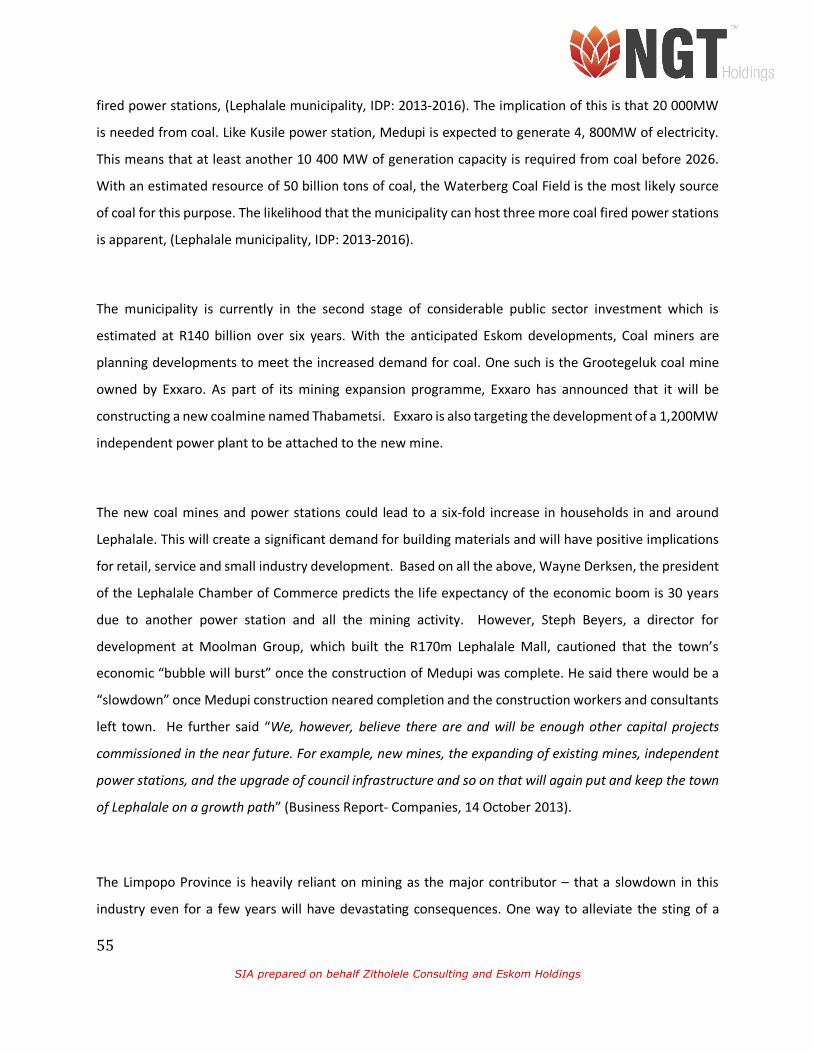
55
SIA prepared on behalf Zitholele Consulting and Eskom Holdings
fired power stations, (Lephalale municipality, IDP: 2013-2016). The implication of this is that 20 000MW
is needed from coal. Like Kusile power station, Medupi is expected to generate 4, 800MW of electricity.
This means that at least another 10 400 MW of generation capacity is required from coal before 2026.
With an estimated resource of 50 billion tons of coal, the Waterberg Coal Field is the most likely source
of coal for this purpose. The likelihood that the municipality can host three more coal fired power stations
is apparent, (Lephalale municipality, IDP: 2013-2016).
The municipality is currently in the second stage of considerable public sector investment which is
estimated at R140 billion over six years. With the anticipated Eskom developments, Coal miners are
planning developments to meet the increased demand for coal. One such is the Grootegeluk coal mine
owned by Exxaro. As part of its mining expansion programme, Exxaro has announced that it will be
constructing a new coalmine named Thabametsi. Exxaro is also targeting the development of a 1,200MW
independent power plant to be attached to the new mine.
The new coal mines and power stations could lead to a six-fold increase in households in and around
Lephalale. This will create a significant demand for building materials and will have positive implications
for retail, service and small industry development. Based on all the above, Wayne Derksen, the president
of the Lephalale Chamber of Commerce predicts the life expectancy of the economic boom is 30 years
due to another power station and all the mining activity. However, Steph Beyers, a director for
development at Moolman Group, which built the R170m Lephalale Mall, cautioned that the town’s
economic “bubble will burst” once the construction of Medupi was complete. He said there would be a
“slowdown” once Medupi construction neared completion and the construction workers and consultants
left town. He further said “We, however, believe there are and will be enough other capital projects
commissioned in the near future. For example, new mines, the expanding of existing mines, independent
power stations, and the upgrade of council infrastructure and so on that will again put and keep the town
of Lephalale on a growth path” (Business Report- Companies, 14 October 2013).
The Limpopo Province is heavily reliant on mining as the major contributor – that a slowdown in this
industry even for a few years will have devastating consequences. One way to alleviate the sting of a
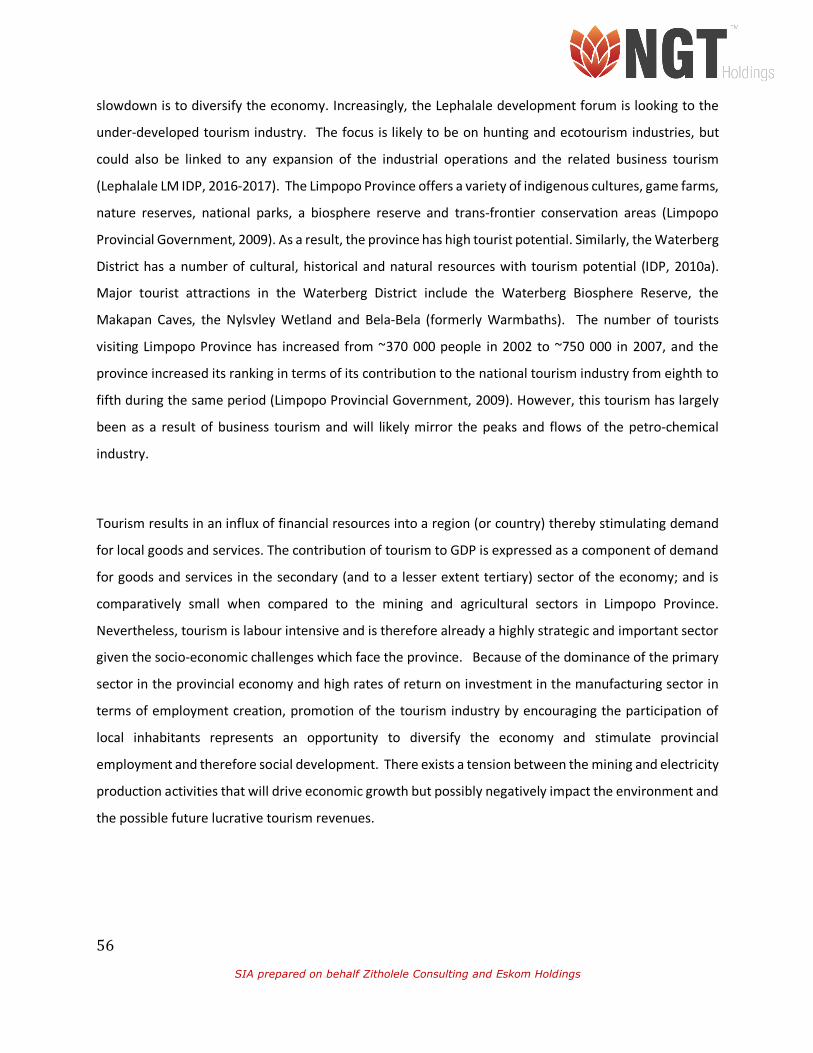
56
SIA prepared on behalf Zitholele Consulting and Eskom Holdings
slowdown is to diversify the economy. Increasingly, the Lephalale development forum is looking to the
under-developed tourism industry. The focus is likely to be on hunting and ecotourism industries, but
could also be linked to any expansion of the industrial operations and the related business tourism
(Lephalale LM IDP, 2016-2017). The Limpopo Province offers a variety of indigenous cultures, game farms,
nature reserves, national parks, a biosphere reserve and trans-frontier conservation areas (Limpopo
Provincial Government, 2009). As a result, the province has high tourist potential. Similarly, the Waterberg
District has a number of cultural, historical and natural resources with tourism potential (IDP, 2010a).
Major tourist attractions in the Waterberg District include the Waterberg Biosphere Reserve, the
Makapan Caves, the Nylsvley Wetland and Bela-Bela (formerly Warmbaths). The number of tourists
visiting Limpopo Province has increased from ~370 000 people in 2002 to ~750 000 in 2007, and the
province increased its ranking in terms of its contribution to the national tourism industry from eighth to
fifth during the same period (Limpopo Provincial Government, 2009). However, this tourism has largely
been as a result of business tourism and will likely mirror the peaks and flows of the petro-chemical
industry.
Tourism results in an influx of financial resources into a region (or country) thereby stimulating demand
for local goods and services. The contribution of tourism to GDP is expressed as a component of demand
for goods and services in the secondary (and to a lesser extent tertiary) sector of the economy; and is
comparatively small when compared to the mining and agricultural sectors in Limpopo Province.
Nevertheless, tourism is labour intensive and is therefore already a highly strategic and important sector
given the socio-economic challenges which face the province. Because of the dominance of the primary
sector in the provincial economy and high rates of return on investment in the manufacturing sector in
terms of employment creation, promotion of the tourism industry by encouraging the participation of
local inhabitants represents an opportunity to diversify the economy and stimulate provincial
employment and therefore social development. There exists a tension between the mining and electricity
production activities that will drive economic growth but possibly negatively impact the environment and
the possible future lucrative tourism revenues.

57
SIA prepared on behalf Zitholele Consulting and Eskom Holdings
These industries have also stimulated the growth in other sectors of the economy such as property and
property development. For example, over the past three-and-a-half years, new property worth R2 billion
has been developed in Lephalale, among them, 25 000 houses and a R170-million shopping mall.
3.6. Employment Rate and Occupation in Lephalale LM
The rate of unemployment in Lephalale is at 22.2%, which is well below the provincial average of 32.4%
as per the 2011 national census. Unemployment amongst the youth currently stands at 27%, also below
the Limpopo provincial average of 42%. This is due in large measure to local developments associated
with Medupi power station and the expansion of coal production from the mines which can be taken to
have absorbed a lot of the latent labour force.
Using data from Statistics South Africa that covered Waterberg district municipality, it was found that the
municipality of Lephalale’ s unemployment rate had been rising steadily in the ten-year period from 2001
to 2011. In 2001 the unemployment rate stood at 18.5 % and in 2011 was at 22.2 %. The Youth
unemployment rate stood at 24.0% in 2001 and at 26.9%, (StatsSA, 2011 census). At a District Municipality
level, the overall unemployment rate in the Waterberg DM was at 31.7% in 2001 and youth
unemployment rate was at 41.1% in the same period. In 2011 the Waterberg DM unemployment rate
was at 28.1% and in and youth unemployment rate was at 35.5%. This increase in unemployment in
Lephalale but a decrease in the Waterberg DM could be because of an influx of labourers who were unable
to secure job opportunities and increased the population and local unemployment rate. For example,
Figure 14 below shows that between the years 1996 – 2009 there was a decrease in employment in all
skills category. This trend reversed between 2009-2013, which can be attributed to the construction of
Medupi power station and also the discovery of coal deposits. The highest increase in employment is with
the informal, semi and unskilled employees. Figure 15 shows that the while Agriculture is still the major
employer in the municipality, its contribution to employment has decreased from 52% (14631) in 1995 to
25% (7644) in 2013. Wholesale and retail trade is the second largest employer. It has increased from 13%
(3676) to 20% (6349). Mining contribution to employment grew from 6% (1663) in 1995 to 17% (5278) in
2013. Community, social and personal services, the fourth largest employer, contributes 13% (4057) to
employment (Figure 15) (Quantec Regional Economic Database, 2013).

58
SIA prepared on behalf Zitholele Consulting and Eskom Holdings
The rate of employment or employability of the people of Lephalale is directly linked to their education
and skills levels. The health and wellbeing of a society also influences to response of its citizens to
available employment opportunities as these are some of the social dynamics that should also be
considered in the assessment of employment rate at a given society (Figure 14).
Figure 14 -Employment by Skill Level
0
10000
20000
30000
40000
50000
1995
1996
1997
1998
1999
2000
2001
2002
2003
2004
2005
2006
2007
2008
2009
2010
2011
2012
2013
EmployedPopulation
Years
EmploymentbySkillTotal
Employme
ntHighly
Skilled
Skilled
Semiand
Unskilled
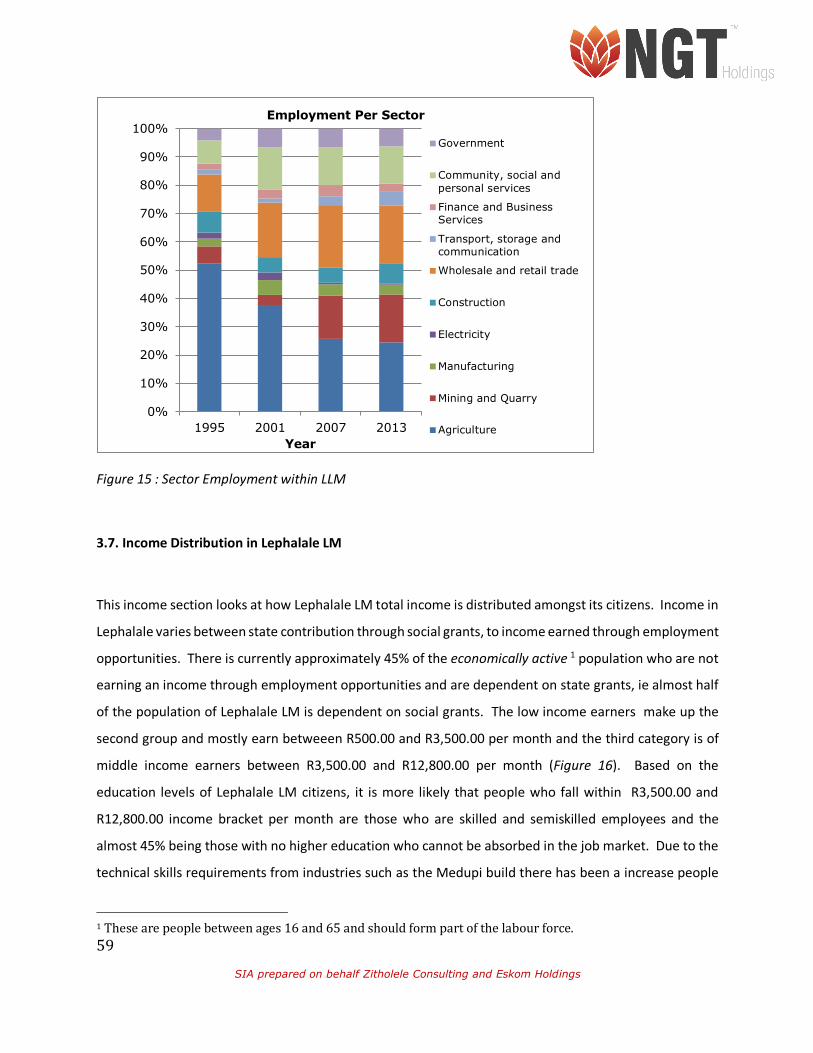
59
SIA prepared on behalf Zitholele Consulting and Eskom Holdings
Figure 15 : Sector Employment within LLM
3.7. Income Distribution in Lephalale LM
This income section looks at how Lephalale LM total income is distributed amongst its citizens. Income in
Lephalale varies between state contribution through social grants, to income earned through employment
opportunities. There is currently approximately 45% of the economically active 1 population who are not
earning an income through employment opportunities and are dependent on state grants, ie almost half
of the population of Lephalale LM is dependent on social grants. The low income earners make up the
second group and mostly earn betweeen R500.00 and R3,500.00 per month and the third category is of
middle income earners between R3,500.00 and R12,800.00 per month (Figure 16). Based on the
education levels of Lephalale LM citizens, it is more likely that people who fall within R3,500.00 and
R12,800.00 income bracket per month are those who are skilled and semiskilled employees and the
almost 45% being those with no higher education who cannot be absorbed in the job market. Due to the
technical skills requirements from industries such as the Medupi build there has been a increase people
1Thesearepeoplebetweenages16and65andshouldformpartofthelabourforce.
0%
10%
20%
30%
40%
50%
60%
70%
80%
90%
100%
1995 2001 2007 2013Year
Employment Per Sector
Government
Community, social andpersonal services
Finance and BusinessServices
Transport, storage andcommunication
Wholesale and retail trade
Construction
Electricity
Manufacturing
Mining and Quarry
Agriculture

60
SIA prepared on behalf Zitholele Consulting and Eskom Holdings
earning between R 3,500.00 and R 12,800.00 per month in the period 2001 to 2011 and this by grew at
17.42% per annum. This could also be attributed to inward migration of people with higher skills levels.
During the same period there has been a steady decline in those earning less than R3, 500.00 per month
of 0.69% per annum. The disparities in income distribution is evident when one assesses access to social
services such as housing, health, electricity among other social service resources. For income earned to
translate to the affordability rate of citizens, the more income earned by individuals per households the
more disposable money available per household to afford basic social services such as better housing,
electric connection, etc.
For example, a 2013 Financial Mail article asserts that there is very little flow of money to Marapong
Township. The article goes further to describe the bad environmental situation in Marapong which when
compared to Lephalale Town paints a bad picture about the socio-economic conditions of those who live
in townships such as Marapong. For example, four shopping malls have been built in Lephalale Town and
are tenanted by large chain stores like Mr Price, Checkers and Game.
The disparities in income distribution have resulted in some labour representatives complaining that the
township and the workers are not getting a good deal from the new money that flows into Lephalale.
However, there seems be a misunderstanding of what causes these disparities such as low levels of
available skills and qualifications. This has on many occasions resulted in volatile labour relations in the
area. The assessment also shows low levels of saving by the locals with high consumption rate (Figure
16).

61
SIA prepared on behalf Zitholele Consulting and Eskom Holdings
Figure 16 - Household Income and Expenditure in Lephalale
3.8. Housing and Human Settlements in Lephalale LM
Lephalale LM is a host to a number of current and future coal mines and coal fired power station with one
nearing completion (Medupi Power Station). A number of human settlements are located in close
proximity to some of the known industries (such as coal fired power stations) and the mines. The close
proximity of human settlements to heavy industries such as mines and power station is important when
evaluating and assessing the social impacts of the FGD technology at Medupi and the impacts of the
existing ADF. The various types of human settlements and their conditions also play an important role in
understanding the social dynamics of the kind of communities that will be positively and negatively
affected by the proposed Medupi Power Station FGD technology retrofit project and operations of the
existing ADF for ash and gypsum.
The discovery of coal and its subsequent mining at Grootegeluk coal mine resulted in the establishment
of Lephalale (previously known as Ellisras) (Itzkin, 2015). Most of the published literature still refers to
Ellisras as a mining town in the Waterberg region. The town of Lephalale has also grown significantly
accommodating an influx of job seekers in the LM. There are four main human settlements considered in
the current SIA study, namely Marapong Township, Onverwacht Township (suburb), Lephalale Town and
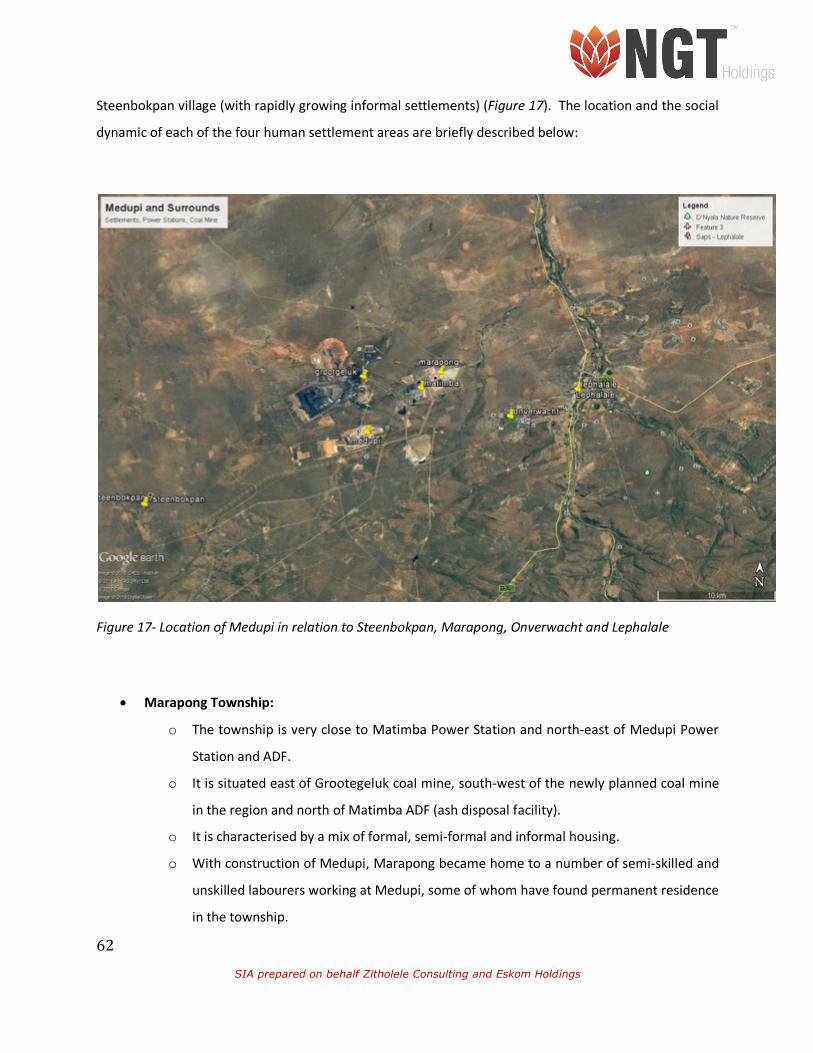
62
SIA prepared on behalf Zitholele Consulting and Eskom Holdings
Steenbokpan village (with rapidly growing informal settlements) (Figure 17). The location and the social
dynamic of each of the four human settlement areas are briefly described below:
Figure 17- Location of Medupi in relation to Steenbokpan, Marapong, Onverwacht and Lephalale
• Marapong Township:
o The township is very close to Matimba Power Station and north-east of Medupi Power
Station and ADF.
o It is situated east of Grootegeluk coal mine, south-west of the newly planned coal mine
in the region and north of Matimba ADF (ash disposal facility).
o It is characterised by a mix of formal, semi-formal and informal housing.
o With construction of Medupi, Marapong became home to a number of semi-skilled and
unskilled labourers working at Medupi, some of whom have found permanent residence
in the township.

63
SIA prepared on behalf Zitholele Consulting and Eskom Holdings
o The formal houses include Eskom compound for Eskom employees and houses which
accommodated Grootegeluk mine and Eskom employees.
o Semi-formal houses include extensions to old houses and recently built backrooms to
house either extended members of the family or for rental purpose triggered by the
development of Medupi Power Station and associated ancillary infrastructure.
o Shacks have been built within the formalized stands (for rental purposes) and some have
encroached informally on public space (most likely from those who do not want to rent).
• Steenbokpan Village:
o A former village located south-west of Grootegeluk coal mine, Matimba Power Station
and Matimba AFD.
o It is situated south-west of newly Medupi Power Station and the associated the ADF for
ash and gypsum.
o Currently, a host to a number of informal settlements with dwellings predominately
characterised by shacks and crudely built houses without access to electricity, water and
sanitation.
o People still use a combination of pit latrines and bucket system.
• Onverwacht Township:
o A suburb located immediate west of the Town of Lephalale characterised by a formal
housing scheme with all the social services required.
o It is for the middle and upper income earning citizens of Lephalale Town.
• Lephalale Town:
o The main business hub of Lephalale LM.
o Characterised by formal houses occupied by middle to upper income earning citizens of
Lephalale.
o Has the necessary town or central business district support infrastructure.
o Together with Onverwacht, the town is situated further east of Matimba Power Station,
Medupi Power Station and the associated ADF.

64
SIA prepared on behalf Zitholele Consulting and Eskom Holdings
o These two suburbs (Onverwacht and Lephalale town) are far (approx. 10km) from the
mining area of Grootegeluk coal mine and other heavy industries (approx. 5-10km)
located in the west.
o They are further north of Matimba AFD.
o Like Marapong and Steenbokpan, Lephalale Town and Onverwacht are also growing at a
rapid rate mostly triggered by the construction of Medupi and projected future projects
within Lephalale LM.
Current and projected future projects in Lephalale LM have resulted in a population increase and housing
shortage and demand. According to a January 2015 Mail and Guardian article – property prices in formal
suburbs/ areas in Lephalale have increased significantly. According to a 2014 Q3 Pay Prop Rental Index
Mail and Guardian article, “Residential properties in Lephalale formal suburbs command some of the
highest rental prices in South Africa. The average monthly house rental in the suburbs was R19, 986.00.
By comparison, the weighted average rental in the up-market Johannesburg suburb of Bryanston was R19,
016. The demand for living space far outstrips supply because there are numerous obstacles to the
construction of new homes: there is not enough water, the sewerage system is inadequate and there is a
power shortage” (GEDYE, 2015). This has led to a boom in guest houses and B&B’s particularly in the
suburbs. Before 2007, there were only a handful of guesthouses and bed-and-breakfasts; now there are
more than 3 000. According to Wayne Derksen, the president of the local chamber of commerce, 2 500
new houses were built between 2009 and 2010, and more than 1000 new flats were constructed in the
past two years. However, this is not enough to support the massive increase in population. Figure 18
shows the number of households by dwelling type in the Lephalale region (Quantec Regional Economic
Database, 2013). The biggest percentage increase in dwelling type is in Informal dwelling/shack in
backyard which increased by 381%. This is followed by apartments in a block of flats that increased by
292% and Informal dwelling not in backyard e.g. informal settlement which increased by 142%. House or
brick structure on a separate stand or yard grew by a significant 127%, while town and cluster houses
grew by 75%. In total, informal dwellings increased by 214% whereas formal housing grew by 99% in total.
The growth in informal housing demonstrates that demand for housing far outstrips supply. Another
telling statistic is the decrease in traditional huts which speaks to the growing urbanization of Lephalale
and the decline of rural development.

65
SIA prepared on behalf Zitholele Consulting and Eskom Holdings
Figure 18-Human Settlements in LLM 1995 – 2013
The housing shortage is so severe, that even the informal dwellings do not come cheap. In Marapong, the
township that houses mainly employees of Medupi and the Grootegeluk mine, the price for
accommodation is steep. A back room could cost up to R1 200 per month, while a shack costs R600/month
to rent according to Lephalale municipality executive director for strategy, Khoroshi Motebele. The
Lephalale municipality had been inundated with requests from residents to transform their homes into
guest houses. Margie Geyser, from the property company Remax, said demand for accommodation in
Lephalale peaked in 2012 and 2013, when there was a zero percent vacancy rate. But 2014 had seen the
demand drop off. She said there was a 5% vacancy rate in 2015 and demand was expected to drop off
Human Settlements 1995 2013 Percentage Increase
House or brick structure on a separate stand or
yard (out of graph as the high number compared
to the rest of the data it throws out scale of graph.
10328 23410 127%
Tradition
al
dwelling/
made of
tradition
al
materials
Flat in a
block of
flats
Town/clu
ster/hous
e
House/fl
at/backr
oom in
backyard
Informal
dwelling/
shack in
backyard
Informal
dwelling
not in
backyard
eg
informal
settlem…
Total
informal
dwelling/
shack
Room/fla
tlet not
in
backyard
but on a
shared
property
Other/un
specified
/NA
1995 4428 225 153 1552 450 1060 1510 426 775
2013 416 882 267 344 2165 2570 4735 340 343
Percentage Increase -91% 292% 75% -78% 381% 142% 214% -20% -56%
-200%
-100%
0%
100%
200%
300%
400%
500%
0500
100015002000250030003500400045005000
Human Settlements
1995 2013 Percentage Increase
66
SIA prepared on behalf Zitholele Consulting and Eskom Holdings
significantly in 2016. Abrie van Vuuren, who provides accommodation to Medupi contractors, said a 100%
occupancy rate in 2012 and 2013 had dropped to 70% for 2014.
Substantial areas have been cleared for new residential development which may impact on the sense of
place older inhabitants have of the area. The provincial government has also allocated 1.2 billion on a
three-year basis for the establishment of 500 Erven in Altoodstyd Farm; Altoostyd 506-LQ is located west
of Onverwacht and east of Medupi power station. The project is expected to provide housing for middle
income and other designated groups, which forms natural extension of the existing housing scheme. The
scattered nature of the township development area has prompted the local municipality to follow an infill
approach for integrated human settlement (Lephalale Municipality, IDP 2013/16). As regards to the area
on the urban periphery, it is noted that development tends to take on a minimum intervention mode. This
is due to the fact that rural areas have low growth potential. Challenges around housing are focused on
questions about the lack of well located, developed land for housing, as most of the land which is well
located and well suited is privately owned and insufficient for housing subsidies. There is also a question
of a high number of people with RDP housing needs. Other issues include the fact that the municipality
does not own the land around provincial growth point areas, illegal occupation of land (informal settlers)
and traditional leaders allocating residential sites without consultation with the municipality, (Lephalale
Municipality, IDP 2013/16).
3.9.Water and Sanitation
3.9.1. Water Availability and Water Allocation in Lephalale LM
Water is one the scarce resources in the Waterberg DM and South Africa. Its availability plays a critical
role in the planning and the implementation of mega infrastructure projects such as the current
construction of Medupi Power Station FGD retrofit project and the associated ancillary infrastructure like
the ADF for ash and gypsum. The availability of water is also important in stimulating investment in some
sectors of the economy such as the mining sector which uses significant amounts of water. The success
of the agricultural and food sector is directly linked to water and useable water availability. Water is also
67
SIA prepared on behalf Zitholele Consulting and Eskom Holdings
an essential resource for various domestic uses in our daily lives and the most critical one is the availability
of drinkable water for both human and animal consumption.
South Africa, like most developing economies, is on a fast industrialization and urbanization trajectory and
this requires access to energy to support such growth which has both positive and negative impacts to
human and natural environment. Water is an essential resource to support both industrialization and
urbanization. In Lephalale LM key water users include Eskom (for power generation), independent power
producers (IPPs), coal mining (for power), other mining activities, fuel-liquid gas industry and for domestic
and commercial uses by the municipality (Nemai Consulting, 2010). The question is where do all these
water stakeholders receive their water from and whether it is sufficient to meet their future water
demands?
A Department of Water Affairs (2009) (now Department of Water & Sanitation) report (P RSA
A000/00/9209) states that Lephalale receives its water from the Mokolo Dam constructed on the Mokolo
River catchment which forms part of the Limpopo Management Area. The river flows from Modimolle,
south-east of Lephalale, to the Limpopo River in the north. Mokolo Dam is a large dam that was
constructed in the late 1970s and completed in July 1980 (DWS, 2009). The aim of the dam was to supply
water to Matimba Power Station, Grootegeluk coal mine, Lephalale LM for irrigation purposes
downstream of the dam (agricultural activities) (DWS, 2009). Therefore, it can be argued that before 2008
Lephalale LM solely depended on the Mokolo Dam for its water.
On the question of future water demand by the various stakeholders with interest in water, in 2008 the
South African custodian of water, the Department of Water and Sanitation (DWS) (previously referred to
as Department of Water Affair or Department of Water Affair and Forestry), commissioned a number of
due diligence studies to look at future water options for the Waterberg and the growing industries as well
as rapid urbanizing Lephalale. One of known catalysts of such growth are the Waterberg coal field known
to contain approximately 40% of South Africa’s mineable coal that can be used to support future energy
needs of the country such as power generation and extraction of other fossil fuel such as coal to liquid
and coal for domestic international needs. Based on this premised growth trajectory of the area and the

68
SIA prepared on behalf Zitholele Consulting and Eskom Holdings
available water infrastructure, DWS determined that the water availability and water use in Lephalale
allowed for limited spare yield but could not support the future allocations (DWA, 2009). In summary,
what this says is that between 2008 and 2009 Mokolo Dam alone could not support the industrialisation
and growth of Lephalale. The future development associated with the Waterberg coal fields meant that
there would be additional requirements of water in Lephalale LM.
Due to limited water availability in Lephalale, mostly triggered by the need to achieve developmental
goals such as the establishment of industries that would support South African Economy; more water
infrastructure was required. In 2008 the DWS (then DWA) commissioned the Mokolo Crocodile (West)
Water Argumentation Project (MCWAP) to meet future water demands in Lephalale LM. The options
included augmentation of existing water supplies from Mokolo Dam and Mokolo River catchment within
Limpopo WMA in Lephalale LM. This is high quality water suitable for domestic consumption. This
included transferring the surplus effluent2 return flow from the Crocodile River (West) / Marico WMA to
Lephalale and the area around Steenbokpan (DWA, 2009). This is low quality water that is suitable for
industries and not for domestic use - a positive strategic position by the DWS. This undertaking by the
DWA to plan and lead the implementation of such a mega water augmentation project was a positive one
by the Department which is the primary custodian of water in South Africa. MCWAP was staged into two
phases, namely Phase 1 and Phase 2.
Phase 1 (augmentation of existing water supplies) aimed at providing drinking quality water to industries
and municipality and Phase 2 (transferring the surplus effluent return flow from the Crocodile River (West)
/ Marico WMA) aimed at providing low quality water to industries. Among the known stakeholders who
participated in the project and who require water in the area for current and future needs are (also see
Table 7):
• The Lephalale LM;
• Eskom;
• IPPs;
2“Liquidwastethatissentoutfromfactoriesorplaceswheresewageisdealtwith,usuallyflowinginto
rivers,lakes,orthesea”(http://dictionary.cambridge.org/dictionary/english/effluent/2017/Januray/20)

69
SIA prepared on behalf Zitholele Consulting and Eskom Holdings
• Grootegeluk Mine (coal mining);
• Exxaro Projects;
• Sasol (Mafutha 1).
Table 7 – List of companies that participated in the water argumentation projection process (then DWA,
2009)
The projected volumes and rate of requirements per use based on Scenario 9 planning in 2010 show that
the municipality required more water from the MCWAP in the period 2009 and 2014 than most of the
other water users, while in the projected period 2015 to 2030 Sasol required more water that most
industries and the municipality (Table 8). The projected water requirements for the local municipality
were derived using the existing number of households in Lephalale and adding the projected growth in
households as a result of the establishment of new mines, power stations and coal-to-liquid fuel facilities
(Nemai, 2010). A planning horizon for the period 2009 to 2030 was considered.

70
SIA prepared on behalf Zitholele Consulting and Eskom Holdings
Table 8- Projection of required water by key water users in Lephalale LM based on Scenario 9 of the DWS
(then DWA, 2009)
Other than the MCWAP project as the predominant source of water in Lephalale LM, Lephalale is known
to contain good ground water which has the potential for exploitation particularly for domestic and
agricultural consumption. The area is known to contain good aquifers although retention of surface water
due to sandy nature of geomorphology is not very good.
A total of 8 main dams, 138 boreholes and 15 wetlands have been recorded in Lephalale LM. The LM also
plays an important role in managing and conserving its water resources. Lephalale LM is known to be the
best performing municipality in the Waterberg DM in terms of providing quality drinking water to its
citizens. Its Blue drop status is at 92.84% and better than that of the Waterberg DM which is at 64.38%
(Lephalale LM, 2014).
Based on the available data on water in the LM, it seems that the existing Mokolo Dam water scheme
mostly services the needs of the urban area and the nearby industries. The rural areas in Lephalale LM
71
SIA prepared on behalf Zitholele Consulting and Eskom Holdings
are highly dependent on borehole water for sustenance. According to the Municipality IDP (2014) 85%
of Lephalale LM water comes from boreholes and only 15% from well-field-type boreholes in the riverbed
alluvium which are all owned and operated by the Municipality (Lephalale LM, 2014). The rural areas
include farms, conservation areas and rural villages.
In terms of water allocation and water distribution within Lephalale LM, the Municipality is designated as
both the Water Service Authority and Water Service Provider in Lephalale, but the primary water
custodian is the DWA. Exxaro and Eskom play an important role in the provision of the water service
through their investments in Water Treatment Plants. For example,
• Exxaro’s Zeeland Water Treatment Works, situated south of the town of Lephalale, has a total
capacity of 3Ml/d (1.095 Million m/a)
• Matimba Power Station supplies water to Marapong via the Marapong Treatment Works which
has a capacity of 6.0 Ml/d (2.19 Million m3/a).
According to Nemai (2010), both Exxaro and Eskom are the main suppliers of quality water to the
municipality.
It should be noted, though, that ninety two (92%) percent of water infrastructure in the Municipality is
over 20 years old. Sixteen percent (16%) of the water service system has been identified as being in poor
to very poor condition. These are some of the challenges that are faced around water infrastructure
(Lephalale Municipality, IDP 2013/14):
• Poor borehole yields in rural areas.
• Bulk water services in urban areas have reached full utilization.
• Illegal connections in rural areas.
• Lack of accountability to water losses.
• Limited availability of ground water in rural areas.
• Low quality of drinking water in rural areas.

72
SIA prepared on behalf Zitholele Consulting and Eskom Holdings
These issues provide challenges in terms of social impacts in the receiving environment with the planned
FGD technology to be retrofitted at Medupi and the existing ADF which both require large volumes of
water for their operations and sustenance.
In meeting these challenges, some of the envisaged water supply projects include:
• Booster pump station for Onverwacht 10ML reservoir.
• Witpoort water treatment plant Relocation.
• Determination of suitable pipelines for water allocation depending of the various stakeholder
water requirements. Currently these are the envisaged pipelines based on current and immediate
water requirements:
o New 6ML reservoir for HangKlip industrial area;
o New 400mm diameter pipe taking treated effluent;
o New 300mm diameter bulk pipeline to supply Altoostyd reservoir.
• There is also an analysis of capacity of existing reservoirs to handle upgrading of existing water
supply from standpipe (ongoing).
3.9.2. Sanitation
Sanitation3 is another social service that is directly linked to the availability of water resources. Therefore,
the availability of water infrastructure such as water treatment plants directly talks to sanitation. Equally
important is the use of effluent water derived from sanitary programmes for industrial stimulation and
other initiatives such as farming. The question is what is the state of Lephalale LM sanitary infrastructure
and how is it integrated to Phase 2 MCWAP to supplement the available water for industrial use in the
Municipality?
3“Thesystemsfortakingdirtywaterandotherwasteproductsawayfrombuildingsinordertoprotect
people'shealth”
(http://dictionary.cambridge.org/dictionary/english/sanitation?q=Sanitation+/January/20/2017)

73
SIA prepared on behalf Zitholele Consulting and Eskom Holdings
The assessment of this infrastructure within the project area around Medupi power station has found that
94% of waterborne sanitation infrastructure in the municipality is over 20 years old. About 15% of the
sanitation network had been identified as being in very poor condition. The assets have experienced
significant deterioration and may be experience impairment in functionality and will require renewal and
upgrading (Lephalale Local Municipality, 2014). Problems noted around the question of sanitation are
that there is a need to redesign the existing sewer networks in Lephalale Town and Onverwacht to reduce
the number of pump stations. Further, the area does not have sufficient water resources and
infrastructure to accommodate a waterborne sanitation system for all households. More than 50% of
households in the municipality are without hygienic toilets (Table 9). Sanitation backlog is estimated to
be 14,250 units, mostly in the farms and rural village. Other than what will be distributed by the Phase 2
MCWAP, there is no clear indication on what percentage of low quality (effluent) water will be derived
from the existing Lephalale LM sanitary infrastructure.
Table 9-Sanitation within the LLM
Type of Toilet 1995 2001 2007 2013
No of
household
% No of
household
% No of
household
% No of
household
%
Flush or chemical
toilet
6,367 33% 9,190 45% 12,119 44% 13,784 45%
Pit latrine 9,647 50% 11,240 54% 12,723 46% 14,435 47%
Below RDP 3,384 17% 207 1% 2,835 10% 2,518 8%
Total 19,397 100% 20,638 100% 27,677 100% 30,737 100%
3.10. Access to electricity
This section of the SIA looks at the current accessibility to electricity within Lephalale LM as an essential
social service resource as enshrined in the South African Bill of Rights (1996). According to Stats SA, out
of the total number of households in Lephalale LM which is standing at 27 950, only 21 846 households

74
SIA prepared on behalf Zitholele Consulting and Eskom Holdings
have access to electricity (e.g. Figure 19). Matimba has not been able to meet the need for electricity in
Lephalale. It is assumed that Medupi will relieve the constraints on the supply of electricity to the area
and assist supply an adequate reliable supply of electricity to the country
Figure 19 : Access to electricity within LLM
3.11. Road Infrastructure and Access to Transportion
Lephalale LM is situated in an area with no national roads passing through it. There are two major national
roads some distance away, viz the N1 linking Tshwane and Polokwane in the east, and the N4 linking
Tshwane and Rustenburg in the south. From these two national roads, three provincial arterial roads can
be used to access Lephalale and these include the R518 and the R517 that both adjoin the N1 in the east
and the R510 to the south. The N11 is another national road that could be used to access Lephalale via
provincial arterial road R572, especially by those coming from the northern Highveld coal fields. Within
Lephalale the Nelson Mandela Drive is the main road linking Lephalale and the power stations and coal
mines.
24%
3%0%
70%
2%
26%
2% 0%
71%
1%
18%
1% 0%
80%
1%
14%
0% 0%
85%
1%
0%
10%
20%
30%
40%
50%
60%
70%
80%
90%
Candles Paraffin Gas Electricity Solar
Percentage of households by energy
1995 2001 2007 2013

75
SIA prepared on behalf Zitholele Consulting and Eskom Holdings
According to the 2012 Integrated Transport plan the majority of people in Lephalale walk to work (37%)
and hitchhikers make up a total 11% (Figure 20). Vehicle drivers make up 8% and those who use public
transport to work such as mini bus taxis make up 11% and buses make up 6% (Waterberg District
Municipality, 2012). The high incidence of people commuting as passengers in private vehicles could be
evidence of hitch-hiking because the number of people who own cars is very low in Lephalale LM. Most
commuters depend on public transport, and taxis emerged as the most used public transport service in
the Waterberg District Municipality.
According to the 2014 – 2016 IDP, the current economic development in Lephalale has brought about an
increase in demand for public transport. There is a total of seven taxi ranks in Lephalale to date of which:
• Four are formal
• Three are informal.
• Four of the seven ranks have no ablution facilities.
• There is one bus rank and bus shelters provided by the Lephalale LM at some of the villages can
only accommodate 5 people.
Figure 20 - Transport services LLM
There are several factors determining the nature, distance and utilisation of routes for transportation in
Lephalale. Lephalale Economic Development Forum (LEDF) shows influencers as:
37%
1%
11%
8%6%
11%
0%
26%
0%
5%
10%
15%
20%
25%
30%
35%
40%
Walking Motorcylce Vehicle as
passenger
Vehicle as
driver
Bus Minibus Taxi Train Not
Applicable
Transport Mode

76
SIA prepared on behalf Zitholele Consulting and Eskom Holdings
• There are 38 rural villages in Lephalale LM, many of them located 40 km or more from the CBD of
Lephalale.
• The geographical location of the villages and work opportunities in Lephalale are the determining
factors in transport demand, specifically.
• Relatively short distances between Marapong, Town, the mine and power stations – commuters
in these areas typically cover distances of less than 25 km, and taxis operating on these routes are
able to make 2 to 3 trips per peak time period
• The CBD and town are located close to the coal mines and power stations, whereas the villages
developed historically along Lephalale River.
The above factors contribute to the following transport challenges
• Public transport has a poor level of service as a result of distance between the economic activities,
the location of towns, villages and area of employment.
• Bus stop shelters do not provide enough under-roof protection against rain; and long queues of
passengers are exposed to the sun or rain.
• No ablution facilities are provided at taxi ranks. Commuters must pay R2 for the service at some
locations (close to filing stations).
• Road safety conditions along Nelson Mandela and other Municipal roads have deteriorated,
mainly because there are inadequate road shoulders and/or pedestrian walkways and taxi layby
areas.
• Increased number of abnormal load vehicles creating bottlenecks on the main access routes
through town to the mine and power station.
3.12. Conclusions of the Baseline Assessment
The study area is characterized by the following:
• Low levels of education
• Few opportunities for skills development

77
SIA prepared on behalf Zitholele Consulting and Eskom Holdings
• Inadequate water and sanitation infrastructure
• Road network in reasonable condition but challenges with public transport
• Settlement areas within prevailing winds from power stations and coal mine/s

78
SIA prepared on behalf Zitholele Consulting and Eskom Holdings
4. STAKEHOLDER IDENTIFICATION AND FIELD WORK
This chapter describes the various processes followed in discussion the project with interested and
affected parties (I &APs) and summarises the findings of such engagements.
4.1. Legal requirements for Public Participation in this SIA
Section 24 of the National Environmental Management Act, No 107 of 1998 sets prescripts for the
management of the cultural environment. This section of the Act puts emphasis on integrated
management of the environment and encourages a multi-stakeholder engagement from social aspects
such as Public Participation or engagement to the management of heritage resources. The public
participation process is defined in terms of the environmental impact assessment application for
environmental authorisation, as a “process by which potential interested and affected parties are given
the opportunity to comment on, or raise issues relevant to, the application of the environmental process”
(Section 4 (1), 2014 EIA Regulation). The objective of this process is to ensure adequate and appropriate
opportunity for public participation in decisions that may affect the environment. The NGT (Department:
NGT Socio-Economic Studies) team followed prescripts of Section 24 of the NEMA in conducting its public
participation process for the Socio-Economic Impact Assessment (SEIA) and this process involved:
• The identification of key stakeholders;
• Development of a stakeholders or Interested and Affected Parties (I&APs) database;
• Communicating with I&APs – telephonic, e-mails, and legal notices;
• Setting up meetings and stakeholder interface forums or public meetings (e.g. Annexures 1 to 4);
• Requesting comments and submissions from I&APs
• Holding public meetings for stakeholder engagement.
4.2.The meetings were held with the following stakeholders between February and May 2015
(Annexures 1 -4, see also Annexure 5).

79
SIA prepared on behalf Zitholele Consulting and Eskom Holdings
• Zitholele Consulting –Zitholele Consulting, Waterfall Business Park, Midrand, Gauteng Province;
• The Waterberg Environmental Justice – Mokolo Hall, Lephalale, Waterberg District, Limpopo
Province;
• Lephalale Development Forum – Mokolo Hall, Lephalale, Waterberg District, Limpopo Province;
• Eskom in Eskom Megawatt Park, Sunninghill, Gauteng Province;
• Marapong community in Marapong Library, Marapong Township, Lephalale, Waterberg District,
Limpopo Province;
• Leseding Community in Leseding Hall, Lesedi (Steenbokpan), Lephalale, Waterberg District,
Limpopo Province;
• Mokolo Hall, Onverwacht, Lephalale, Waterberg District, Limpopo Province
• Medupi Power Station with Eskom environmental management team on site. Location Lephalale,
Waterberg District, Limpopo Province.
4.3. Summary of Key Issues Raised in the Meetings and Public Participation Forum Relating to the
Proposed Medupi FGD Technology
The interested and affected parties (I&APs) were predominantly well informed about the proposed
Medupi FGD technology proposed at Medupi. In total four meetings were held in Lephalale, two meetings
in Mokolo Hall in Onverwacht, one meeting in Marapong Library and one meeting in Leseding Community.
Below are issues and concerns raised by communities of Marapong and other interested and affected
parties such as the Waterberg Environmental Justice, SANCO and the Lephalale Development Forum. It
excluded comments and inputs given by the Leseding community which will be attached as an annexure
to the report. Key issues of interest were raised in all the public forums and these included among others:
• Gas and particulate emissions – resulting in risk to health.
• Water Allocation.
• Waste Management.
• Increased population size, service delivery and land allocation.
• Disturbance in the pattern of life.
• Economy: employment and labour relations.
• Cultural Heritage- burial grounds and graves.

80
SIA prepared on behalf Zitholele Consulting and Eskom Holdings
• Communication: Public Participation and Consultation.
In recommendations made in the public forums it is concluded that the most fundamental
recommendation made to the developer (Eskom) regarding the FGD technology in Medupi is that it should
not be retrofitted but included in the actual construction of the remaining 4 Units since Medupi lost an
opportunity to include the FGD technology in the construction of Unit 6 (completed) and Unit 5 which is
on the verge of being completed.

81
SIA prepared on behalf Zitholele Consulting and Eskom Holdings
Table 10 – Identified Social Parameters during Stakeholder Engagement Forums for the Social Impact Assessment in Lephalale in 2015
SOCIO-ECONOMICPARAMETERIDENTIFIEDBYINTERESTEDANDAFFECTEDPARTIES
ISSUESANDQUESTIONSRAISEDREGARDINGTHEIDENTIFIEDSOCIO-ECONOMICPARAMTERS
MITIGATORYMEASURESPROPOSEDBYAFFECTEDCOMMUNITIES/STAKEHOLDERS/I&APS
1. SO2– resulting to risk tohumanhealth.
IssuesRelatingtoHealth:• Accordingtothecommunity,thedeveloperisaddingmorecoalfiredstationsin
Lephalale–MedupiPowerStationisjustoneofthefewstationsplannedinthearea.ThereisalsoathirdcoalfiredstationplannedintheareacalledCoal3PowerStation.
• TheconcernisthattheproposedMedupiFlueGasDesulphurisation(FGD)technologyisretrofittedinsteadofbeingbuiltinwiththeunits.ThismeansthatduringtheretrofittingtherewillbesignificantadditionstothealreadyhighlevelsofpollutantsintheatmospherewithinLephalale(incl.Marapong)resultingfromMatimbaPowerStationanotherEskomcoalfiredstation.
• GasesemittedfromMatimbaPowerStationarearguedtohavehadagreatnegativeimpacttothecommunityofMarapong.Itisarguedthatmanymembersofthecommunityaresufferingfromrespiratoryrelatedillnessessuchas:Tuberculosis(TB),Asthma.Somehavebeendiagnosedwithunknowndiseasesuchascontinuousdryeyesandheadachesetc.
• Amajorconcernisthat,regardingMatimbathedeveloperofMedupiPowerStationhasmostlyfocuseducatingthecommunityaboutCarbonDioxide(CO2)asthemostdangerousgasemissionhidingtheeffectsofSulphurDioxide(SO2).TheyhavefilteredMatimbawithelectrostaticprecipitatorsorpulsejetfabricfilterstoremoveparticulatematterandtoreducetheamountsofparticulatesandCO2intheatmosphere.ThecommunitywouldliketoknowwhyisthatonlyMedupiPowerStationisretrofittedwiththeFGDandnotMatimbatoosincetheybothusethesamefossilfuelwhichiscoal?
ProposedMitigations:• To mitigate emissions from Medupi PowerStation, particularly SO2, the community isproposing that the proposed Medupi FGDtechnologyshouldbebuilt inwiththe6Unitsinsteadofbeingretrofittedlater.
• Theyargue that thedeveloperhasmissedtheopportunitywith2ofthe6Units,withUnit6already completed and synchronised the 2March2015. Unit5 isabout tobecompletedsoontoo.
• Therefore,theargumentisthattheremaining4UnitsshouldbebuiltwiththeFGDtechnologyto curb the levels of SO2 in the atmospherewhileUnit6and5areoperational.
• To curb emissions at Matimba which is notdirectly related to the current study but hassocio-economic implication to the health andwellbeing of the people of Marapong, thecommunity argues that the developer shouldalso consider retrofitting Matimba with theFGDtechnology.

82
SIA prepared on behalf Zitholele Consulting and Eskom Holdings
SOCIO-ECONOMICPARAMETER IDENTIFIEDBY INTERESTED ANDAFFECTEDPARTIES
ISSUESANDQUESTIONSRAISEDREGARDINGTHEIDENTIFIEDSOCIO-ECONOMICPARAMTERS
MITIGATORYMEASURESPROPOSEDBYAFFECTEDCOMMUNITIES/STAKEHOLDERS/I&APS
SO2– resulting to risk tohumanhealth(Continue).
• BasedontheknownprevailingwindsdirectionintheLephalale,mostwindsflownorth-southmeaningthatmanyoftheemissionswillflowsouthaffectedmorethecommunitiesthatareinthesouth.ThecommunityofMarapongfeltstrongthatthebrothersandsistersinLesediformallyknownasSteenbokpanshouldalsobeconsideredastheyaremostlylikelytobeaffectedbyMedupiemissionduringtheretrofittingprocessandaremorelikelytosufferfromhealthrelatedproblemsresultingfromSO2andothergases.
• Basedontheexistingdocumentspublishedbythedeveloperanditsconsultants,theMarapongcommunityarguesthatthepollutantsoremissionsfromMedupiPowerStationwillcrosstheSouthAfricanbordertotheneighbouringcountryofBotswana–thereisthereforeaninterestonwhetherornothastheSocio-EconomicImpactAssessment(SEIA)andEnvironmentalImpactAssessment(EIA)PublicParticipationProcess(PPP)beenextendedtoBotswanasincetheMedupiemissionswillalsoaffectthehealthofthepeopleinBotswanaparticularlythosewhoareneighbouringSouthAfrica?Otherquestionsrelatingtotheprojectincluded:
TheWorldBankandtheDevelopmentBankofSouthernAfrica(DBSA),investorsintheproject,approvedMedupionthepremisethatitwillhaveanFGDtechnologywithit;whatistheirtakeonit.
The community make an assertion that thedeveloperofMedupi argues that to retrofit FGDtechnologyatMatimbawillbeexpensiveandthecommunity argues that should not be at the“expensesofthelifeandhealth”.

83
SIA prepared on behalf Zitholele Consulting and Eskom Holdings
SOCIO-ECONOMICPARAMETERIDENTIFIED BY INTERESTEDANDAFFECTEDPARTIES
ISSUESANDQUESTIONSRAISEDREGARDINGTHEIDENTIFIEDSOCIO-ECONOMICPARAMTERS MITIGATORY MEASURES PROPOSED BY AFFECTEDCOMMUNITIES/STAKEHOLDERS/I&APS
SO2– resulting to risk tohumanhealth(Continue).
IssuesRelatingtoHealth:
• FGDbeingretrofitted?• WhatmeasuresaregoingtobeimplementedtoprotectcommunitieswhiletheFGDtechnologyisbeingretrofittedyetsomeoftheUnitslikeUnit6havebeensynchronized?
Summary:• TheMedupiPowerStationisseenasathreattohealthbyMarapong
Community,theWaterbergEnvironmentalJustice,SANCOandtheLephalaleDevelopmentForum.
• Theseinterestedandaffectedparties(I&APs)arearguingthatiftheFGDtechnologyisretrofitteditmightcontributenegativelytohighlylevelsofemissionsintheareassincetheretrofittedtechnologywillonlystartoperating6yearsfromthecompletionofMedupiPowerStation.
• TheyarguethatbythetimetheretrofittedtechnologybecomesoperationalmanycommunitieswillhavealreadybeenaffectedbySO2andgasessuchasCO2asisinthecaseofMatimbaandsurroundingExxaroandthenewlyestablishedBoikarabeloCoalMine.
Summary:• There is a general feeling that the FGDtechnologyatMedupishouldbebuiltwitheachoftheremainingunitssinceEskomhasmissedtheopportunitywithUnits6and5.
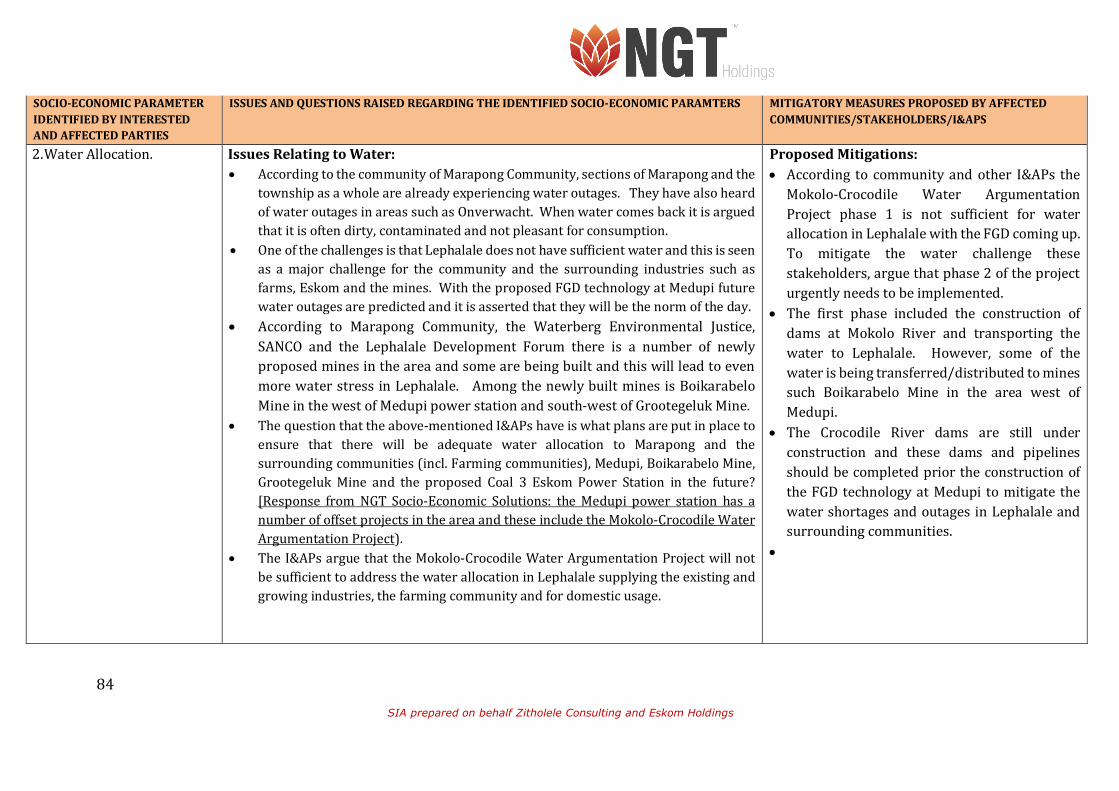
84
SIA prepared on behalf Zitholele Consulting and Eskom Holdings
SOCIO-ECONOMICPARAMETERIDENTIFIEDBYINTERESTEDANDAFFECTEDPARTIES
ISSUESANDQUESTIONSRAISEDREGARDINGTHEIDENTIFIEDSOCIO-ECONOMICPARAMTERS MITIGATORYMEASURESPROPOSEDBYAFFECTEDCOMMUNITIES/STAKEHOLDERS/I&APS
2. WaterAllocation. IssuesRelatingtoWater:• AccordingtothecommunityofMarapongCommunity,sectionsofMarapongandthe
townshipasawholearealreadyexperiencingwateroutages.TheyhavealsoheardofwateroutagesinareassuchasOnverwacht.Whenwatercomesbackitisarguedthatitisoftendirty,contaminatedandnotpleasantforconsumption.
• OneofthechallengesisthatLephalaledoesnothavesufficientwaterandthisisseenas amajor challenge for the community and the surrounding industries such asfarms,Eskomandthemines.WiththeproposedFGDtechnologyatMedupifuturewateroutagesarepredictedanditisassertedthattheywillbethenormoftheday.
• According to Marapong Community, the Waterberg Environmental Justice,SANCO and the Lephalale Development Forum there is a number of newlyproposedminesintheareaandsomearebeingbuiltandthiswillleadtoevenmorewaterstressinLephalale. AmongthenewlybuiltminesisBoikarabeloMineinthewestofMedupipowerstationandsouth-westofGrootegelukMine.
• Thequestionthattheabove-mentionedI&APshaveiswhatplansareputinplacetoensure that there will be adequate water allocation to Marapong and thesurroundingcommunities(incl.Farmingcommunities),Medupi,BoikarabeloMine,GrootegelukMine and the proposed Coal 3 Eskom Power Station in the future?[Response from NGT Socio-Economic Solutions: theMedupi power station has anumberofoffsetprojectsintheareaandtheseincludetheMokolo-CrocodileWaterArgumentationProject).
• TheI&APsarguethattheMokolo-CrocodileWaterArgumentationProjectwillnotbesufficienttoaddressthewaterallocationinLephalalesupplyingtheexistingandgrowingindustries,thefarmingcommunityandfordomesticusage.
ProposedMitigations:• According to communityandother I&APs theMokolo-Crocodile Water ArgumentationProject phase 1 is not sufficient for waterallocationinLephalalewiththeFGDcomingup.To mitigate the water challenge thesestakeholders,arguethatphase2oftheprojecturgentlyneedstobeimplemented.
• The first phase included the construction ofdams at Mokolo River and transporting thewater to Lephalale. However, some of thewaterisbeingtransferred/distributedtominessuch Boikarabelo Mine in the area west ofMedupi.
• The Crocodile River dams are still underconstruction and these dams and pipelinesshouldbecompletedpriortheconstructionoftheFGDtechnologyatMedupi tomitigate thewatershortagesandoutagesinLephalaleandsurroundingcommunities.
•

85
SIA prepared on behalf Zitholele Consulting and Eskom Holdings
SOCIO-ECONOMIC PARAMETERIDENTIFIED BY INTERESTEDANDAFFECTEDPARTIES
ISSUESANDQUESTIONSRAISEDREGARDINGTHEIDENTIFIEDSOCIO-ECONOMICPARAMTERS MITIGATORY MEASURES PROPOSED BY AFFECTEDCOMMUNITIES/STAKEHOLDERS/I&APS
WaterAllocation(continues) Theothercontributingfactortotheimplementationofphase2ofthiswaterargumentationschemeisthatcompaniesorstakeholderssteeringtheprojectdonotevenagreeonwhatneedstohappentoeffectivelyimplementthescheme.
• Even so, this water argumentation scheme isnotseensufficientenoughtocaterfortheneedsof the ever growing Lephalale and thecommunityarguesthatmoreeffortsshouldbeconsideredtoaddressthewatershortageinthefuture and there is a proposition that otherwaterschemeprojectsshouldbeconsideredinthenearfuture.
Summary:• Thereisagrowingconcernaboutfuturewatershortagesintheareaandthat
thecurrentMokolo-CrocodileWaterArgumentationSchemeisnotsufficienttoaccommodatetheevergrowingmunicipalityandassociatedindustries.
• Secondly,thecurrentwatershortages/cutsareassociatedwithuncleanandcontaminatedwaterinLephalale.
Summary:• Itisproposedthatthedeveloperandassociated
stakeholders such as the local, district,provincialandnationalgovernmentaswellascompanies involved in the Mokolo-CrocodileWater Argumentation Project should firstimplement phase 2 of the scheme beforeconsideringtheimplementationoftheFGDoritsoperation.

86
SIA prepared on behalf Zitholele Consulting and Eskom Holdings
SOCIO-ECONOMICPARAMETERIDENTIFIEDBYINTERESTEDANDAFFECTEDPARTIES
ISSUESANDQUESTIONSRAISEDREGARDINGTHEIDENTIFIEDSOCIO-ECONOMICPARAMTERS
MITIGATORYMEASURESPROPOSEDBYAFFECTEDCOMMUNITIES/STAKEHOLDERS/I&APS
3. WasteManagement. IssuesRelatingtoWasteManagement:• Thereisamajorconcernregardingthemanagementofby-productsofthe
proposedFGDtechnologyandthesearesomeoftheby-productsconsideredashighontheagenda:gypsumandeffluentwater.
• Accordingtothecommunity,fromthediscussionsabouttheFGDtechnologythattheyhaveattendedatMedupitherehasbeenlimiteddiscussionaroundtheissuesofwastedisposaloftheFGDtechnologyby-products.Thereisthereforeastrongdemandtoknowthelocationofthetreatmentplantsfortheeffluentwaterandstoragesitesforthegypsum.
ProposedMitigations:• Thecommunitysuggested that theywillneedto be consulted during the site selectionprocess for the gypsum storage and effluentwatertreatmentplants.
Summary:• Thereisconcernthattheby-productsoftheFGDtechnologywillalsohave
negativeimpactinthecommunityandtheyneedtoknowwheretheywillbelocated.
Summary:• CommunityandotherI&APsfeeltheneedtobe
consultedduringsiteselectionprocess.

87
SIA prepared on behalf Zitholele Consulting and Eskom Holdings
SOCIO-ECONOMICPARAMETERIDENTIFIEDBYINTERESTEDANDAFFECTEDPARTIES
ISSUESANDQUESTIONSRAISEDREGARDINGTHEIDENTIFIEDSOCIO-ECONOMICPARAMTERS MITIGATORY MEASURES PROPOSED BY AFFECTEDCOMMUNITIES/STAKEHOLDERS/I&APS
4. Increased populationsize, service deliver andlandallocation.
IssuesRelatingtoGrowingPopulationSizeandLandDemand:• AccordingtothecommunitysincetheinceptionofMedupipowerprojecttherehas
been an increase in population size inMarapong and surrounding communities.ThereisahighdemandforhousingtoaccommodateMedupilabourers.
• EskomcontractorvillagehasnotbeenabletoaccommodateallitscontractorsandmanyofthesecontractorshavehadtofindaccommodationinMarapong.Asaresult,thereisnowanincreaseinthenumberofsquatterdwellers.
• ItisarguedthatthenumberofsquattersandinsufficientprovisionofservicestothepeopleofMarapongmeanthatthelocalgovernmentdoesnothaveenoughresourcestocaterforallitspeopleandthenewcomersprovidingthemwithhousing,water,electricityamongothers.AssuchitisdeemedimportantthatEskomdeviseaplantoaccommodateitscontractors.
• TheproposedFGDtechnologyconstructionphase isseenashavingapotentialtothreatenthealreadyinsufficientresourcesinLephalaleandMarapongspecificallysuchashousing,water,availablelandtothelocalcommunitiesandelectricity.
• ThecommunityisconcernedaboutmostofthelandinandaroundMarapongandLephalaleatlargebeingownedbythetwoentities:EskomandExxarowhomtheydefineasmajorpollutersinthearea.
ProposedMitigations:• They argue that if Eskom and Exxaro (whomthey define asmajor polluters) own somuchland in and around Lephalale, they shouldconsider allocating more land to thecommunityofMarapongtoaccommodatetheiremployees and allow for the growth ofMarapongTownship.
• They further argue that if Eskom,Exxaro andthe Municipality plan to expand moreindustries near Marapong in the near futurewhich will threaten their health and socialstructure maybe the three parties shouldconsiderallocating land for theestablishmentof new township elsewhere where they willaccommodatethepeopleofMarapong.
IssuesRelatingtoGrowingPopulationSizeandLandDemand:• AnotherconcernforthecommunityofMarapong isthatnotonlydotheyhaveto
sharetheirresourceswithEskomlabourerscomingfromotherprovinceandareaswithinLimpopoProvince;Eskomhasinthepastdeliberatelyexcludedthemintheprovisionofitsresourcesbyestablishingitscontractorscampwithallthenecessaryresources such as cleanwaterandelectricity. For theMedupi plant there is adedicated village that has been developed to house Medupi employees andcontractors.

88
SIA prepared on behalf Zitholele Consulting and Eskom Holdings
SOCIO-ECONOMIC PARAMETERIDENTIFIED BY INTERESTEDANDAFFECTEDPARTIES
ISSUESANDQUESTIONSRAISEDREGARDINGTHEIDENTIFIEDSOCIO-ECONOMICPARAMTERS
MITIGATORYMEASURESPROPOSEDBYAFFECTEDCOMMUNITIES/STAKEHOLDERS/I&APS
Increased population size,service deliver and landallocation(continues)
• Therefore,thecommunityfeelsthattheinfluxoflabourerfortheconstructionoftheFGDtechnologyatMedupiwillfurtherleadtothreattothealreadystretchedresourceswithintheircommunity.
ThecommunityseekaplanfromthedeveloperonhowthedeveloperwillprotectthelandoftheLocalsbecausecurrentlythedeveloperisonlytakingcareofitsworkersfromthevillagesitbuiltforMedupii.e.theMedupicontractor’svillage?
Summary:• TheincreaseinpopulationsizeintheareaasaresultofMedupiconstructionis
seenasachallengebythecommunityandthreattotheiralreadylimitedresources.
• ThecommunityalsofeelstrongaboutthefactthattheywilleventualbeabsorbedinanindustrialzoneofLephalalewheretheirhealthandsocialstructure/wellbeingwillbecompromised.
Summary:• Some community members are considering
relocation from their current location moretowards Lephalale central business district(CBD) or past Onverwacht where they arguetheywillbelesssusceptibletopollutions

89
SIA prepared on behalf Zitholele Consulting and Eskom Holdings
SOCIO-ECONOMIC PARAMETERIDENTIFIED BY INTERESTEDANDAFFECTEDPARTIES
ISSUESANDQUESTIONSRAISEDREGARDINGTHEIDENTIFIEDSOCIO-ECONOMICPARAMTERS
MITIGATORYMEASURESPROPOSEDBYAFFECTEDCOMMUNITIES/STAKEHOLDERS/I&APS
5. Disturbance in thepatternoflife
IssuestoPopulationGrowthandChangeintheLocalPatternofLife:• ThecommunityofMarapongarguethatsincetheestablishmentofMedupithere
thecommunityhasexperiencedasignificantgrowthandthishasbroughtaboutmanychangesinthepatternoflifeinthecommunity,surroundingcommunitiesandLephalaleasawhole.Amongissuesthatareofconcerntothemistheincreaseinnumberofliquoroutlets,increasenumberofaccidentsanddeaths.
• Aneweconomicphenomenonorculturethatmanymalecommunitymembersraised is the introduction of prostitution in the communitywhich they feel issomethingnotendemictotheprovinceandLephalale.
• Some of the members argued that Medupi has hiredmoremale figures thanfemalesandnowtheirwomenarebeingpoachedbytheMedupilabourerswhohavemoreresourcesat theirdisposaltoaffordthenewlyacquired lifestylebywomeninthetownshipsandtheyarealsotakingtheirwives.
ProposedMitigations:• The issue seems contentious and some
community members recommended that allmale Eskom construction workers should beaccommodated in camps away from thetownshipofMarapong.
• Others recommended that Eskom should bemorevocalonHIV/AidsonitsnewcontractorsfortheFGDtechnologyinstallation.
IssuestoPopulationGrowthandChangeintheLocalPatternofLife:Summary:• Theincreaseinpopulationisseenasacatalysttothechangeinthepatternof
lifeinMarapongandthesurroundingcommunities,resultingtosocialillssuchasprostitution,alcoholabuses(alcoholisreadilyavailable),highaccidentsrates,murderetc.
Summary:• The recommendation is that more HIV/Aids
relatedcampaignsshouldbedevelopedbythedeveloper educating its contractorsand theseshouldbeextendingtoMarapong.
IssuestoPopulationGrowthandChangeintheLocalPatternofLife:ProstitutionandthenewlydevelopedintimaterelationshipsbetweenwhatiscalledMedupi labourers or contractor is linked by some of the communitymembers toHIV/AidsscourgethatiscurrentfacingMarapongandLephalaleLocalMunicipality.This, however, seem to be gender biased as more blame for prostitution andpromiscuityislinkedtowomeninthetownship.
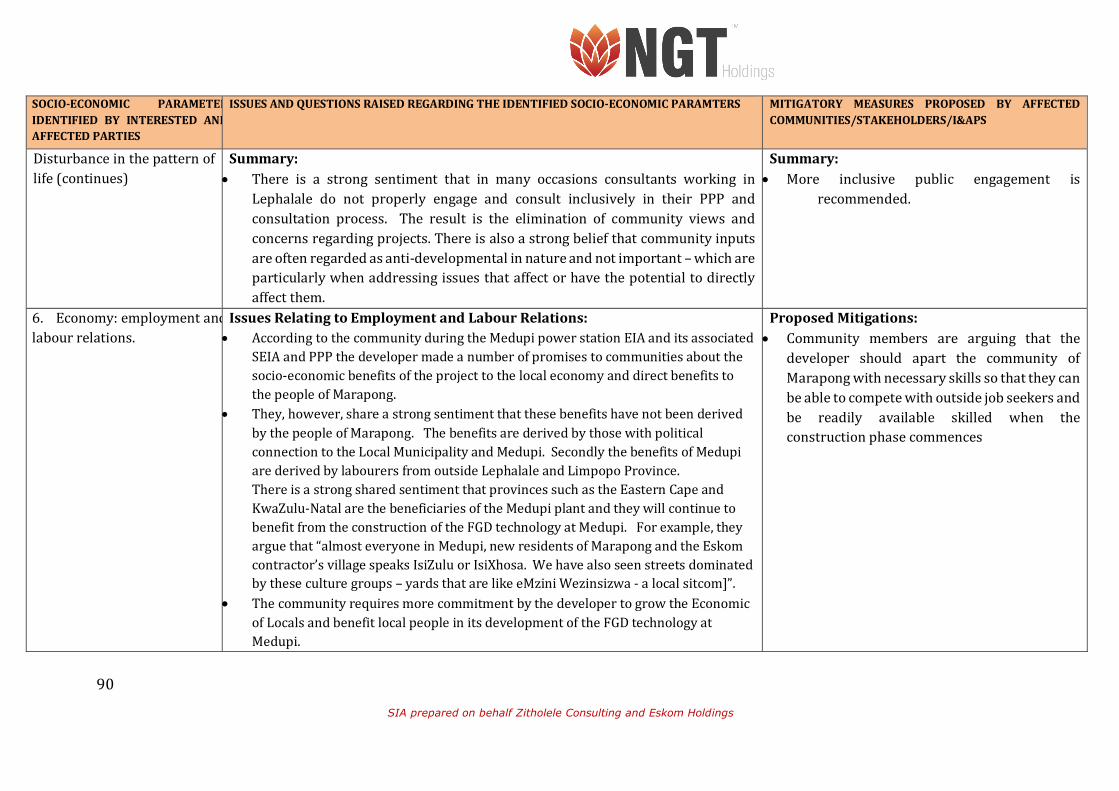
90
SIA prepared on behalf Zitholele Consulting and Eskom Holdings
SOCIO-ECONOMIC PARAMETERIDENTIFIED BY INTERESTED ANDAFFECTEDPARTIES
ISSUESANDQUESTIONSRAISEDREGARDINGTHEIDENTIFIEDSOCIO-ECONOMICPARAMTERS MITIGATORY MEASURES PROPOSED BY AFFECTEDCOMMUNITIES/STAKEHOLDERS/I&APS
Disturbanceinthepatternoflife(continues)
Summary:• There is a strong sentiment that in many occasions consultants working in
Lephalale do not properly engage and consult inclusively in their PPP andconsultation process. The result is the elimination of community views andconcernsregardingprojects.Thereisalsoastrongbeliefthatcommunityinputsareoftenregardedasanti-developmentalinnatureandnotimportant–whichareparticularlywhenaddressingissuesthataffectorhavethepotentialtodirectlyaffectthem.
Summary:• More inclusive public engagement is
recommended.
6. Economy:employmentandlabourrelations.
IssuesRelatingtoEmploymentandLabourRelations:• AccordingtothecommunityduringtheMedupipowerstationEIAanditsassociated
SEIAandPPPthedevelopermadeanumberofpromisestocommunitiesaboutthesocio-economicbenefitsoftheprojecttothelocaleconomyanddirectbenefitstothepeopleofMarapong.
• They,however,shareastrongsentimentthatthesebenefitshavenotbeenderivedbythepeopleofMarapong.ThebenefitsarederivedbythosewithpoliticalconnectiontotheLocalMunicipalityandMedupi.SecondlythebenefitsofMedupiarederivedbylabourersfromoutsideLephalaleandLimpopoProvince.ThereisastrongsharedsentimentthatprovincessuchastheEasternCapeandKwaZulu-NatalarethebeneficiariesoftheMedupiplantandtheywillcontinuetobenefitfromtheconstructionoftheFGDtechnologyatMedupi.Forexample,theyarguethat“almosteveryoneinMedupi,newresidentsofMarapongandtheEskomcontractor’svillagespeaksIsiZuluorIsiXhosa.Wehavealsoseenstreetsdominatedbytheseculturegroups–yardsthatarelikeeMziniWezinsizwa-alocalsitcom]”.
• ThecommunityrequiresmorecommitmentbythedevelopertogrowtheEconomicofLocalsandbenefitlocalpeopleinitsdevelopmentoftheFGDtechnologyatMedupi.
ProposedMitigations:• Community members are arguing that the
developer should apart the community ofMarapongwithnecessaryskillssothattheycanbeabletocompetewithoutsidejobseekersandbe readily available skilled when theconstructionphasecommences

91
SIA prepared on behalf Zitholele Consulting and Eskom Holdings
SOCIO-ECONOMICPARAMETER IDENTIFIED BYINTERESTED AND AFFECTEDPARTIES
ISSUESANDQUESTIONSRAISEDREGARDINGTHEIDENTIFIEDSOCIO-ECONOMICPARAMTERS
MITIGATORYMEASURESPROPOSEDBYAFFECTEDCOMMUNITIES/STAKEHOLDERS/I&APS
employmentandlabourrelations(continues)
IssuesRelatingtoEmploymentandLabourRelations:Summary:OutsidersormigrantjobseekersareseenasathreattothelocallabourersandpeoplefromtwoofSouthAfricanprovincesareseenasbeinggivenpreferentialretreatmentwhenitcomestojobopportunitiesbythelocalindustriesoperatinginandaroundMarapong.
Summary:• Skills transfer is seen as the most basic and
fundamentaltoolofempoweringthepeopleofMarapong in order to participate in theeconomyandEskomplants.
7. Cultural Heritage- burialgroundsandgraves.
IssuesRelatingtoCulturalHeritage:• Thecommunityfeelsthattheirancestralgraveswerenotproperlyhandled
duringtheconstructionofMedupiandtheyarenotpleasedwithhowtheprocesshasbeendealtwith.Theyarguethatsomeofthecommunitygraveswererelocatedwithoutanyofthecommunityconcernsandsomeofthegraveswerefencedofffromtheconstructionwithoutthembeingconsulted.Furthermore,theyarerestrictedfromvisitingtheirancestralgraveswithinMedupiprecinct–“Eskomisrefusingusaccesstovisitourancestralgraveslocatedwithinitsproperty”.
• OneoftheresidentknowsonlyfourofMolwantwagraveswereremovedandfewofMokoenaweretakentoPretoriawithouttheirconsentandtheyrequireawayforwardonhowtodealwiththeissue.
ProposedMitigations:• Thedevelopershouldsenditsnewlyappointed
heritageconsultanttoconsultwiththepeopleof Marapong and this should be in a publicplatformratherthanindividualfamilies
Summary:• There is general sense of disquiet around the issue of graves and their
handlingaswellasaccesstograveslocatedwithinEskomprecinct.
Summary:The community want the issue of gravesaddressedand require a consultativeprocess sothattheycangiveinputsintheprocess.

92
SIA prepared on behalf Zitholele Consulting and Eskom Holdings
SOCIO-ECONOMIC PARAMETERIDENTIFIED BY INTERESTEDANDAFFECTEDPARTIES
ISSUESANDQUESTIONSRAISEDREGARDINGTHEIDENTIFIEDSOCIO-ECONOMICPARAMTERS
MITIGATORYMEASURESPROPOSEDBYAFFECTEDCOMMUNITIES/STAKEHOLDERS/I&APS
8. Communication: PublicParticipation andConsultation
IssuesRelatingtoThePublicParticipationProcess&Consultation:• ThereisconsensusamongmembersoftheMarapongCommunity,theWaterberg
Environmental Justice, SANCO and the Lephalale Development Forum thatLephalale andWaterberg people and associated organisations are not againstdevelopment taking place in their district andmunicipality. The challenge iseminent with many development taking place within their region is thatstakeholderarenotalwaysconsultedandpublicparticipationprocessesarenotalwaysinclusive;theyareoftenlimitedtocommunitiessuchasLephalale(CBD)andOnverwacht.
• This,theysuggest,posesagreatchallengetomanydevelopmentsthatarenowtakingplacewithinLephalalebecauselocalcommunitiesoftenfeelexcludedfromprocess.
ProposedMitigations:• Itisrecommendedthatconsultantsshouldnot
only limit their notices to site notices andnewspaper notice, but should also engagecommunity leaders such as councillors, tribalandtraditionalleaders.
Summary:• There is a strong sentiment that in many occasions consultants working in
Lephalale do not properly engage and consult inclusively in their PPP andconsultation process. The result is the elimination of community views andconcernsregardprojects.Thereisalsoastrongbeliefthatcommunityinputsareoftenregardedasanti-developmentalinnatureandnotimportant–whichareparticularlywhenaddressingissuesthataffectorhavethepotentialtodirectlyaffectthem.
Summary:• More inclusive public engagement is
recommended.

93
SIA prepared on behalf Zitholele Consulting and Eskom Holdings
SummaryofEskomInterviewandsitesurvey Table 11- Key Issues Discussed with Eskom EMC representatives
Issues CommentonIssues
Wateruseandwaterallocation
aspartoftheMedupiproject
1.WaterSupply
• ThecurrentwatersourceinLephalaletosupportindustryandmunicipalneedsisMokoloDam.Industriessuchas
Eskom(MedupiandMatimbaPowerStation)andtheminessuchasGrootegelukabstractrawwaterfromthisdam.
• TherawwaterissuppliedtothenewwaterreservoirfromtheexistingpipelinefromWolvenfonteinReservoirwhich
issuppliedfromtheMokolodam.
• ThispipelinecurrentlysuppliesMatimbaPowerStation,theGrootegelukMineandlocalMunicipality–thissupply
formspartofthePhase1MokoloCrocodileWaterAugmentationProject(MCWAP)
• Provision for future supply of rawwater from Crocodile West will also be made available once the DWS has
completedthePhase2MCWAP. Twopipelinesareproposedtobeconstructedinparalleltothenewrawwater
reservoirandpipelinewithina12mservitude.
• ThecurrentsupplyisbasedonthewaterallocationthatEskomhasbeengrantedfollowingitsWaterUseLicense
Application(WULA).
• TheallocatedwaterissufficientenoughtooperateMedupiunits1to6.Forotherauxiliaryprogrammesonsitesuch
asdustsuppressionEskomuseswaterthathasbeencapturedwithintheEskomwatercatchment. Itcleansand
circulatesthiswatertocomplementthewaterthatitreceivesfromMokoloDamonapproximately80%(Mokolo
rawwater)/20%(capturedandcirculatedwater)

94
SIA prepared on behalf Zitholele Consulting and Eskom Holdings
2. WaterDemand• WiththeconstructionoftheFGD,therewillbenotenoughwatertooperateboththeMedupiUnitsandtheFGDand
assuchthePhase2MCWAPwouldneedtobeurgentlyimplementedbytheDWS.
• Eskomwouldcontinuetouserawwaterfromthisschemewithcleanwaterallocatedtomunicipalityandthefarming
communities.
• EvenifEskomcaptures,cleanandcirculateitsstormwaterwithintheWaterCatchmentitwillnotbeenoughtoaid
thecurrentrawwatersupplyfromMokoloDam.
3. WaterPollution• Eskomhasdesignandimplementastormwatermanagementsystemsandacreatedwatercatchmentforthethat
willensurethatitlivesuptowaterphilosophyofZeroLiquidDischarge(e.g.Annexure8).
o Itcollects, cleanandcirculatesurfaceanddirtywater. Effluentwater iscollectedanddirectedtoWaste
Water Treatment Plant and recirculated to complement the raw water fromMokolo Dam. This assist
mitigatesanypollutiontonearbywaterbodiessuchasthewetlandwestofMedupiPrecinct.
o EastofMedupiPowerStationcleananddirtywaterdamshavebeenconstructed.
o The coal stock piles, the existing ADF have all been designedwith a liner to ensure that they do not
contaminate ground water which some of the farmers are reliant on. Furthermore, a storm water
managementplanhasbeendesignedaroundtheexistingADF(Annexure7).
o In terms of the assessment of potential pollution/contamination of ground water, Eskom has drilled
approximately21boreholestocollectbaselinedatathatwillassistanalysethelevelsofphosphatesandother
contaminantsinthegroundwater.

95
SIA prepared on behalf Zitholele Consulting and Eskom Holdings
StakeholderEngagement
• According to the Eskom environmental team, the Eskom Medupi stakeholders include: Non-Governmental
Organizations (NGO’s), Non-Profit Organizations (NPO’s), Lephalale Local Municipality and local communities
(MarapongandGa-Seleka,).
• WithregardtotheissueofconsultationwhichwasflaggedbysomecommunitiesduringtheSIApublicmeetings,
EskomarguesthatithasconductedstakeholdermeetingsthroughouttheprojectlifeofMedupi.Theaimhasbeen
to listen topeoples interests in theproject andhas givenplatform to all I&APs to give inputson theproject.
However,italsobelievesthattheinterestintheprojecthavebeenmostlylimitedtoissuesrelatingtojobsandjob
opportunity. Withlimitedinterestintheenvironmentwellbeingwhichalsohavedirecteffectonthehealthand
social wellbeing of the affected communities – the Waterberg Environment Justice Forum (WEJF) has been
complementedasaveryassistingstakeholdergivingconstructiveinputs.
• IntermsofStakeholderdatabase,allstakeholdersaresaidtobekeptonEnvironmentalControlOfficers(ECO’s)list
andattendmeetingsthatinformontheprojectprocessoftheMedupiPowerStation.Amongotherorganisations
thatEskomEMCconsidertobeI&APsintheprojectare:
o Greenpeace
o Earth350.org
o EarthAfrica
o WEJF
SocialandEconomicImpacts
1.EmploymentCreated
In total, the Medupi Power Station project has created over 14000 jobs and has contributed to vast infrastructure
development.EskomProcurementCentreensuredthatpreferencebegiventolocalpersonsandbusinesses,whereby30%

96
SIA prepared on behalf Zitholele Consulting and Eskom Holdings
oftheworkforceisallocatedtolocalpeopleonly.Localbuilders,cleaners,caterersandgeneralworkershavebeenhired.
Alongside,Eskompartneredwiththelocaltaxiassociationtoprovideshuttleservicesforon-sitepurposes.Localpersons
andlocalbusiness(small-to-medium-enterprises)weretrainedthroughtheSkillDevelopmentProgramme(SDP)setupby
Eskomtoprovidelocalcommunitieswiththerequiredskillsandtrainingneededfortheproject.Inaddition,EskomSDP
alsoensuredthatavastpercentageoffemalesaretrainedintheyearprogrammeandemployedbytheMedupiPowerStation
project.ThroughpartnershipwithDepartmentofWaterandSanitation(DWS),DepartmentofEnvironmentalAffairs(DEA),
DepartmentofPublicWorks(DPW)andDepartmentofAgricultureandRuralDevelopment(DARD),Eskomhasaidedinthe
establishmentoflocalfarmersprovidinggoodsandservicesthroughtothelocalworkforce.Thisalsoensurethatthereis
directprocurementsofproductsfromlocalfarmerstosupportamongotherthingsfoodproductstocateringcompaniesthat
providemealstocontractorsonsite.
2.LayoffofLabourpostMedupiConstructionPhase
EskomhasmadeprovisionforanexitplanattheendoftheMedupiPowerStationprojectconstructionphase.Thisexist
planmakesuseofbothaninternalandexternalplan.Intermofthestabilityoftheproject,Eskomhasintroducedupskilling
initiative.ThisinitiativeissetuptotraincurrentemployeesoftheMedupiprojectinotherrelevantfieldssothattheycan
maintainthelevelofemploymentintheareaofLephalale.AnotherinitiativecalledtheMedupiLeadershipInitiative(MLI)
formspart of this exitplanwhereby a local entrepreneurshipprogrammehasbeen created toprovide localsand local
businesses,specificallyBlackyouthandwomen;thetrainingfocusesonbusinessandfinancialtraininginordertoeducate
and expand local businesses capabilities beyond theMedupi project and ensure that they become self-sustainable. In
additiontoMLI,EskomhasinvestedR14milliontoconstructionofafacilityfortrainingelectricalengineersandweldersto
developskilledstaffforfutureemploymentopportunitieswithintheMedupiprojectandbeyond.

97
SIA prepared on behalf Zitholele Consulting and Eskom Holdings
Environmental and Social
Awareness
Awarenessprogrammesamongstcurrentemployees(mainlycontractors)andlocalcommunityhavebeenconstructedto
create environmental and sustainability awareness.TheEMC currentlyused as aplatform to informandeducate local
populations. EMCmembers are sent out to communities to conduct environmental and social awareness programmes
throughpublicmeetingsandworkshopswiththeaimofeducatingthelocalsonenvironmentalissues,suchaswaterquality,
airquality, landdegradation,wastemanagementandmonitoringandreportingonenvironmentalimpacts.TheEMChas
alsodevelopedoutreachprogrammesaimedatlocalschoolsandtheFETColleges(FurtherEducationandTrainingColleges).
Theobjectiveofalltheseawareness,educationandoutreachprogrammesistoeducateandprovideadirectlinkbetween
thepublicandtheenvironment. It isalsoasserted that I&APssuchasGreenpeace,Earth3050.organdEarthAfricaare
invitedtothesecommunityprogrammes(orforums)togiveinputsonkeyenvironmentalandsocialissues.
Othermilestone thatEskomprides itselfonachieving is thedevelopmentofacontractorvillagewhich tookadifferent
approach from theold/historichostel dwelling associatedwith theold SouthAfricamining and industry approach top
housinglabours.ItisassertedthattheEskomvillageismoreinclusiveandmorefamilybasedorfamilyoriented:
“Inordertoensurethesafetyofourcontractors,wedidnotbuildacontractorvillagethatistypicaloftheoldhosteldwelling.
Wecreatedavillagethatencouragesclosenessbetweenworkersandtheirfamilies,preventingfamiliesbeingbrokenup,
alcoholism,depression,SexuallyTransmittedDiseases(STD’s),potentialspreadofHIV/AIDS.Workersaretransportedto
andfromtheirhomesandfamilies,onadailybasis.Specialisedpersonnelhavebeencontractedtoprovidemedicalservices,
laundryservices,abar,andasoccerpitchtosub-contractors”(EmileMarell,pers.com,16January,2018).

98
SIA prepared on behalf Zitholele Consulting and Eskom Holdings
Table 12- Ecosystems change drivers associated with the project
Type of ecosystem change drivers Ecosystem change drivers likely to be associated with the project: Yes; No; Not sure
Supporting information
Direct drivers of ecosystem change
Change in local land use and cover Yes • The project has and will continue to impact on the land use and cover.
Harvest and resources consumption Yes • The abstraction of water from Mokolo Dam which the municipality, the farmers and the domestic use is also reliant on will also result to change in the ecosystem change.
• Medupi currently abstracts its water from Mokolo Dam to support its facility functionality.
Pollution Yes • For the first 5 years of Medupi Power Station operation and before the implementation of the FGD the project will contribute to air quality pollution and degradation
• Within the Medupi precinct there is various machinery and plant that is fuel based operated, some of it which may result to oil leakage and spills.

99
SIA prepared on behalf Zitholele Consulting and Eskom Holdings
Indirect drivers of ecosystem change
Demographic change Yes • Due to job expectations there has been an increase in population in Lephalale and the surround since the commencement of the Medupi Construction Programme (MCP).
• Furthermore, the infrastructure that has been developed to offset the MCP such as upgraded and newly constructed roads has also resulted to accessibility of Lephalale thus the increase in population size.
Economic change Yes • On the positive side, the municipality and local businesses have benefited significantly from increase in economic activities related to the MCP and will continue to benefit with the construction of the FGD.
Socio-political change Yes • There has also, however, been a downside of increase in political stakes in the region where different stakeholders have different expectation and bargaining powers on who should benefit and who should not.
Cultural change Not sure • The Medupi Power Station has contributed to cultural change through the destruction of burial grounds and graves; however, the current project will not result to cultural change.
• This being said there is a separate heritage management process underway to identify and map cultural areas that were previous impacted.
• Therefore, there is no certainty that the area where the FGD technology is proposed will not form part of the map.

100
SIA prepared on behalf Zitholele Consulting and Eskom Holdings
Scientific and technological change Yes The FGD will result to an improvement to science and technology for the reduction of SO2 levels in the atmosphere. The data collected post the introduction of the FGD will also inform future technology developments for the coal fired power stations in the country.
Wellbeing of ecosystem services beneficiaries
Change in demand for ecosystem service for basic material for good life
No • The FGD technology and the associated proposed infrastructure are highly technical and there will be very few jobs for the locals in the implementation of the FGD.
• The FGD is a technology that will require highly skilled labour, thus the limited jobs for the locals in the implementation of the FGD.
Change in demand for ecosystem service for health
Yes • The implementation of the FGD will result to improved atmosphere and reduced pollution levels that will result to improved quality of life for the locals.
Change in demand for ecosystem service or security
No • The FGD will not result to large number of labour polls in Lephalale like it has been the case with the construction of Medupi six units. As such, there will be no demand for ecosystem services for security.
Change in demand for ecosystem service for good social relations
Not sure • There high technical nature of the project and the fact that the project will absorb less of local labour in its implementation may result to contestation for job opportunities and challenges of social relations between the developer.

101
SIA prepared on behalf Zitholele Consulting and Eskom Holdings
5. SIGNIFICANCE ASSESSMENT METHODOLOGY
The assessment methodology used was taken from Zitholele Consulting recommended methodology for
the EIA and it has been adapted to suit the needs of the current SIA study. A number of criteria are used
to determine the significance of an impact. These criteria and their ratings are listed below.
5.1. Nature of the impact
Each impact should be described in terms of the features and qualities of the impact. A detailed
description of the impact will allow for contextualisation of the assessment.
5.2. Extent of the impact
Extent intends to assess the footprint of the impact. The larger the footprint, the higher the impact rating
will be. The table below provides the descriptors and criteria for assessment (Table 13).
Table 13- Criteria for the assessment of the extent of the impact.
Extent Descriptor Definition Rating
Site Impact footprint remains within the boundary of the site. 1
Local Impact footprint extends beyond the boundary of the site
to the adjacent surrounding areas.
2
Regional Impact footprint includes the greater surrounds and may
include an entire municipal or provincial jurisdiction.
3
National The scale of the impact is applicable to the Republic of South
Africa.
4
Global The impact has global implications 5

102
SIA prepared on behalf Zitholele Consulting and Eskom Holdings
5.3. Duration of the impact
The duration of the impact is the period of time that the impact will manifest on the receiving environment.
Importantly, the concept of reversibility is reflected in the duration rating. The longer the impact endures,
the less likely it is to be reversible. Refer to Table 14 for criteria for rating duration of impacts.
Table 14- Criteria for the rating of the duration of an impact.
Duration
Descriptor
Definition Rating
Construction /
Decommissioning
phase only
The impact endures for only as long as the construction or
the decommissioning period of the project activity. This
implies that the impact is fully reversible.
1
Short term The impact continues to manifest for a period of between 3
and 5 years beyond construction or decommissioning. The
impact is still reversible.
2
Medium term The impact continues between 6 and 15 years beyond the
construction or decommissioning phase. The impact is still
reversible with relevant and applicable mitigation and
management actions.
3
Long term The impact continues for a period in excess of 15 years
beyond construction or decommissioning. The impact is
only reversible with considerable effort in implementation
of rigorous mitigation actions.
4
Permanent The impact will continue indefinitely and is not reversible. 5

103
SIA prepared on behalf Zitholele Consulting and Eskom Holdings
5.4. Potential intensity of the impact
The concept of the potential intensity of an impact is the acknowledgement at the outset of the project
of the potential significance of the impact on the receiving environment. For example, SO2 emissions have
the potential to result in significant adverse human health effects, and this potential intensity must be
accommodated within the significance rating. The importance of the potential intensity must be
emphasised within the rating methodology to indicate that, for an adverse impact to human health, even
a limited extent and duration will still yield a significant impact.
Within potential intensity, the concept of irreplaceable loss is taken into account. Irreplaceable loss may
relate to losses of entire faunal or floral species at an extent greater than regional, or the permanent loss
of significant environmental resources. Potential intensity provides a measure for comparing significance
across different specialist assessments. This is possible by aligning specialist ratings with the potential
intensity rating provided here. This allows for better integration of specialist studies into the
environmental impact assessment. See Table 15 and Table 16 below.
Table 15- Criteria for impact rating of potential intensity of a negative impact.
Potential
Intensity
Descriptor
Definition of negative impact Rating
High Significant impact to human health linked to mortality/loss
of a species/endemic habitat.
16
Moderate-High Significant impact to faunal or floral populations/loss of
livelihoods/individual economic loss.
8
Moderate Reduction in environmental quality/loss of habitat/loss of
heritage/loss of welfare amenity
4
Moderate-Low Nuisance impact 2
Low Negative change with no associated consequences. 1

104
SIA prepared on behalf Zitholele Consulting and Eskom Holdings
Table 16-Criteria for the impact rating of potential intensity of a positive impact.
Potential
Intensity
Descriptor
Definition of positive impact Rating
Moderate-High Net improvement in human welfare 8
Moderate Improved environmental quality/improved individual
livelihoods.
4
Moderate-Low Economic development 2
Low Positive change with no other consequences. 1
It must be noted that there is no HIGH rating for positive impacts under potential intensity, as it must be
understood that no positive spinoff of an activity can possibly raise a similar significance rating to a
negative impact that affects human health or causes the irreplaceable loss of a species.
5.5. Likelihood of the impact
This is the likelihood of the impact potential intensity manifesting. This is not the likelihood of the activity
occurring. If an impact is unlikely to manifest, then the likelihood rating will reduce the overall significance.
Table 17 provides the rating methodology for likelihood.
The rating for likelihood is provided in fractions in order to provide an indication of percentage probability,
although it is noted that mathematical connotation cannot be implied to numbers utilised for ratings.

105
SIA prepared on behalf Zitholele Consulting and Eskom Holdings
Table 17- Criteria for the rating of the likelihood of the impact occurring
Likelihood
Descriptor
Definition Rating
Improbable The possibility of the impact occurring is negligible and only
under exceptional circumstances.
0.1
Unlikely The possibility of the impact occurring is low with a less than
10% chance of occurring. The impact has not occurred
before.
0.2
Probable The impact has a 10% to 40% chance of occurring. Only likely
to happen once in every 3 years or more.
0.5
Highly Probable It is most likely that the impact will occur and there is a 41%
to 75% chance of occurrence.
0.75
Definite More than a 75% chance of occurrence. The impact will
occur regularly.
1
5.6. Cumulative Impacts
Cumulative impacts are reflected in the in the potential intensity of the rating system. In order to assess
any impact on the environment, cumulative impacts must be considered in order to determine an
accurate significance. Impacts cannot be assessed in isolation. An integrated approach requires that
cumulative impacts be included in the assessment of individual impacts. The nature of the impact should
be described in such a way as to detail the potential cumulative impact of the activity.

106
SIA prepared on behalf Zitholele Consulting and Eskom Holdings
5.7. Significance Assessment
The significance assessment assigns numbers to rate impacts in order to provide a more quantitative
description of impacts for purposes of decision making. Significance is an expression of the risk of damage
to the environment, should the proposed activity be authorised.
To allow for impacts to be described in a quantitative manner in addition to the qualitative description
given above, a rating scale of between 1 and 5 was used for each of the assessment criteria. Thus the
total value of the impact is described as the function of significance, which takes cognisance of extent,
duration, potential intensity and likelihood.
Impact Significance = (extent + duration + potential intensity) x likelihood
Table 18 provides the resulting significance rating of the impact as defined by the equation as above.
Table 18- Significance rating formulas.
Score Rating Implications for Decision-making
< 3 Low Project can be authorised with low risk of environmental degradation
3 – 9 Moderate Project can be authorised but with conditions and routine inspections. Mitigation measures must be implemented.
10 – 20 High Project can be authorised but with strict conditions and high levels of compliance and enforcement. Monitoring and mitigation are essential.
21 – 26 Fatally Flawed Project cannot be authorized

107
SIA prepared on behalf Zitholele Consulting and Eskom Holdings
An example of how this rating scale is applied is shown below in Table 19.
Table 19- Example of Rating Scale based on impacts associated with preconstruction of the FGD
Activity Nature of Impact
Impact type Extent Duration Potential
Intensity Likelihood
Rating
Mitigation Interpretation
Publication of FGD project
Direct Impact:
Existing
3 2 2 0.75 5 - MOD
Advertise the type of available jobs and the required skillset
Lephalale has high rate of unemployment
Employment expectations and influx of migrant labour.
Cumulative
4 3 8 0.75 11 - HIGH
Job seekers will increase levels of unemployment in the area if not employed in the FGD.
Residual
1 2 1 0.5 2 - LOW
With mitigation the number of job seekers will be reduced to those with necessary skills and qualifications to take up advertised job opportunities.

108
SIA prepared on behalf Zitholele Consulting and Eskom Holdings
6. IMPACT IDENTIFICATION AND DESCRIPTION
As per the EIA Regulations, 2014 – Appendix 6 (adapted to be applicable to SIA), the anticipated impacts
of the proposed Medupi Ash Disposal Facility (MADF) on the social environment are described. These
include initial impacts, cumulative impacts and residual impacts, both positive and negative, during all the
phases of the project. The two lists of variables described in Table 2 (Categories of social variables) and
Table 3 (ICGP list of social variables) were used during the impact identification process. It is important to
consider that the goal of all projects should be sustainable social development and that no development
should hamper that. Human Rights should also under no circumstances be compromised or infringed
upon.

109
SIA prepared on behalf Zitholele Consulting and Eskom Holdings
IMPACT ASSESSMENT AND RATING
Two positive impacts were identified and rated for the preconstruction phase of the FGD. These were both positive impacts associated with
the project.
6.1. Impact Rating: Project Planning /Pre-Construction Phase
PRE-CONSTRUCTION PHASE
Activity Nature of Impact Impact type Extent Duration Potential Intensity Likelihood Rating Mitigation Interpretation
Publication of the FGD project
Indirect Impact: Existing 2 3 8 1 13 – HIGH Two mitigation measures are
proposed: – There could be initiatives developed to contribute towards educating and developing necessary skills for the locals to take advantage of opportunities associated with the FGD construction and operation. – Local businesses could be incubated and developed to be able to take opportunities in the FGD BID.
The area is in need of employment opportunities
Developing spin off businesses to support FGD construction phase (B&Bs). (PI)
Cumulative 2 3 8 1 13 – HIGH There will be increase in economic development.
Residual 2 2 8 1 12 – HIGH
There will be growth in the Lephalale LM GDP.
Indirect Impact: Existing 3 2 2 0.75 5 – MOD Re-employ existing
workforce who are currently working at the station.
Lephalale has high rate of unemployment
Employment expectations and influx of migrant labour. (NI)
Cumulative 4 3 8 0.75 11 – HIGH Unqualified job seekers will increase levels of unemployment in the area if not all employed in the FGD.
Residual 1 2 1 0.5 2 – LOW With mitigation the number of job seekers will be reduced to those with necessary skills and qualifications to take up advertised job opportunities.
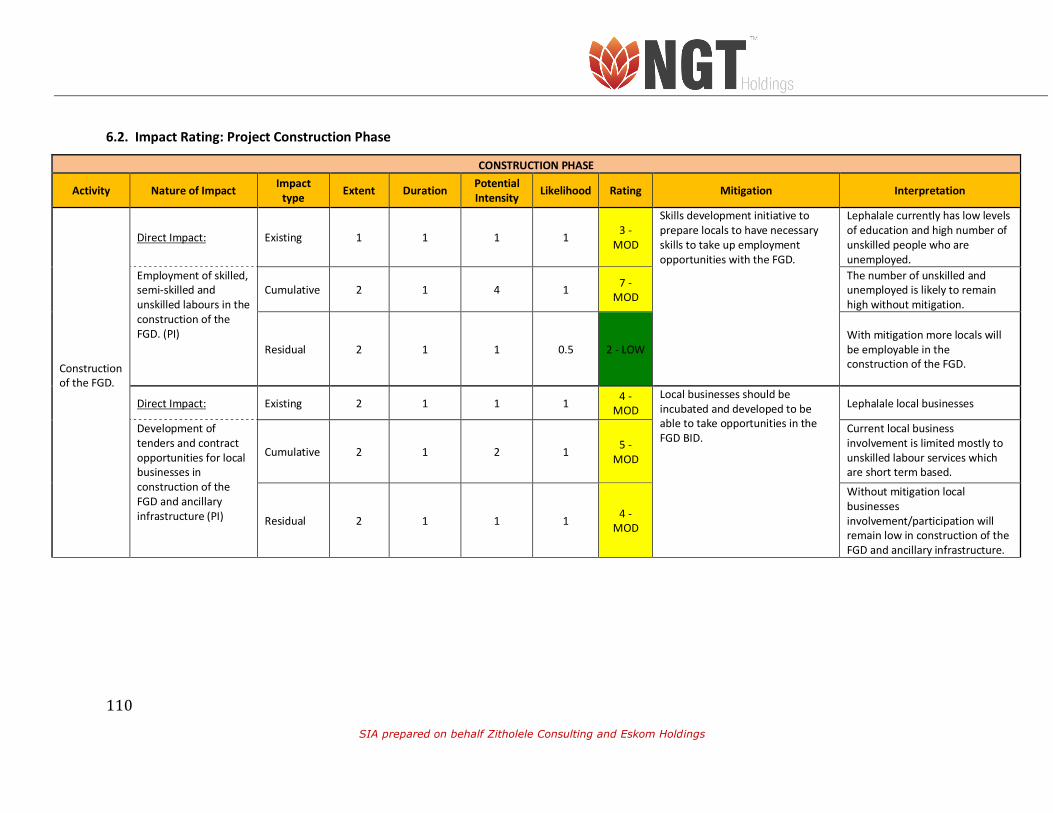
110
SIA prepared on behalf Zitholele Consulting and Eskom Holdings
6.2. Impact Rating: Project Construction Phase
CONSTRUCTION PHASE
Activity Nature of Impact Impact type Extent Duration Potential
Intensity Likelihood Rating Mitigation Interpretation
Construction of the FGD.
Direct Impact: Existing 1 1 1 1 3 - MOD
Skills development initiative to prepare locals to have necessary skills to take up employment opportunities with the FGD.
Lephalale currently has low levels of education and high number of unskilled people who are unemployed.
Employment of skilled, semi-skilled and unskilled labours in the construction of the FGD. (PI)
Cumulative 2 1 4 1 7 - MOD
The number of unskilled and unemployed is likely to remain high without mitigation.
Residual 2 1 1 0.5 2 - LOW With mitigation more locals will be employable in the construction of the FGD.
Direct Impact: Existing 2 1 1 1 4 - MOD
Local businesses should be incubated and developed to be able to take opportunities in the FGD BID.
Lephalale local businesses
Development of tenders and contract opportunities for local businesses in construction of the FGD and ancillary infrastructure (PI)
Cumulative 2 1 2 1 5 - MOD
Current local business involvement is limited mostly to unskilled labour services which are short term based.
Residual 2 1 1 1 4 - MOD
Without mitigation local businesses involvement/participation will remain low in construction of the FGD and ancillary infrastructure.

111
SIA prepared on behalf Zitholele Consulting and Eskom Holdings
CONSTRUCTION PHASE
Activity Nature of Impact Impact type
Extent Duration Potential Intensity
Likelihood Rating Mitigation Interpretation
Construction of the FGD.
Indirect Impact: Existing 2 4 1 1 7 - MOD
Mitigation for FGD will benefit other road users.
There are high volumes of traffic and limited traffic control mechanism put in place to control traffic in the area of Medupi.
Improvement in local road conditions with the construction of the FGD, such as the development urban type road infrastructure with traffic lights and speed humps aimed at mitigating risk of uncontrolled traffic during and off peak hours of the construction phase. (PI). The traffic impact assessment shows that the road infrastructure is already stressed.
Cumulative 2 1 1 1 4 - MOD
With increase in traffic volumes as a result of prolonged construction at Medupi will result to further congestion.
Residual 2 2 1 0.5 3 - MOD
With mitigation there will be improved traffic management and easy flow of traffic.
Direct Impact: Existing 1 5 1 1 7 - MOD
Construction activities for the FGD should be restricted within the existing Medupi footprint
Construction activities at Medupi have already altered the receiving environment.
Change in local land use in the affected area for the development of the FGD and operations of the ADF. (NI)
Cumulative 1 5 1 0.75 5 - MOD
Construction activities of the FGD, the railway siding will be limited within the existing footprint.
Residual 1 1 1 0.5 2 - LOW
With mitigation construction activities will be restricted to the Medupi footprint. There is therefore no change in landuse as the development is taking place within the already disturbed area.

112
SIA prepared on behalf Zitholele Consulting and Eskom Holdings
CONSTRUCTION PHASE
Activity Nature of Impact Impact type
Extent Duration Potential Intensity
Likelihood Rating Mitigation Interpretation
Direct Impact: Existing 1 1 1 1 3 - MOD
Prioritising local business or contractors in some of the contracts associated with the construction of the FGD.
The Medupi built project construction activities are benefit Lephalale LM economy.
Extension of the construction phase currently underway in Medupi resulting to prolonged contractor activity in Lephalale which benefit local businesses (PI).
Cumulative 2 1 2 1 5 - MOD
There will be extension of economic benefits to the municipality with extension of construction activities at Medupi.
Residual 1 1 2 0.5 2 - LOW
With mitigation and prioritisation of local business positive spinoff of the extended construction at Medupi can be increased
Indirect Impact: Existing 2 1 1 1 4 - MOD
Traffic management systems should be developed to manage traffic during pick hours and off pick hours especially for construction trucks during the construction phase of the FGD retrofit project. This should include installation of traffic lights and traffic circles at major intersections such as D1675, Afguns and Nelson Mandela Drive near Medupi and Matimba Power Station (Hatch Goba, 2016).
The area of Medupi current does not have traffic management systems in place causing congestion.
Increase in traffic volumes resulting from a combination of existing road users such as mine trucks, buses and mini bus/taxis, private car owners, Matimba trucks and an increase in construction vehicles/trucks transporting materials to and from Medupi for the construction of the FGD. (NI)
Cumulative 2 1 1 0.75 3 - MOD
There will be increased in traffic volumes with the construction of the FGD.
Residual 2 1 1 0.5 2 - LOW
Traffic volume will remain high but with controlled management system there will be flow in traffic.

113
SIA prepared on behalf Zitholele Consulting and Eskom Holdings
CONSTRUCTION PHASE
Activity Nature of Impact Impact type
Extent Duration Potential Intensity
Likelihood Rating Mitigation Interpretation
Indirect Impact: Existing 2 1 1 0.5 2 - LOW
Installation of traffic lights and traffic circles at major intersections such as D1675, Afguns and Nelson Mandela Drive near Medupi and Matimba Power Station (Hatch Goba, 2016). The other proposition is that a four way stop should be considered as an alternative to traffic lights at the above mentioned intersections. Appropriate traffic calming devices should be implemented
The absence of traffic management systems near Medupi are causing health and safety risk for drivers to and from Medupi.
Increase in occupation health and safety risks resulting from increase in traffic volumes associated with construction vehicles/trucks working on the FGD as well risks associated with the actual prolonged construction phase at Medupi. (NI)
Cumulative 2 1 1 0.75 3 - MOD
With construction of the FGD and increase in traffic volumes the risk will increase.
Residual 2 1 1 0.2 1 - LOW
Installation of traffic lights, speed humps and circles will reduce the risk. Appropriate traffic calming devices should be implemented
Indirect Impact: Existing 2 2 2 0.5 3 - MOD
The Department of Water and Sanitation (DWS), the custodian of water in the country, should ensure that implements both Phase 1 and Phase 2 of MCWAP with coming live of Medupi and FGD. Eskom should explore other alternatives water sources in its water use licenses to minimise the risk of overly depending to MCWAP Phase 2 for the implementation of the FGD. Both Eskom and DWS should align their project schedule and ensure that there are no delays in implementing the MCWAP Phase 2
Lephalale is currently under a lot of water constraint
Increase in pressure for water demand and allocation to support the construction of the FGD, the ADF, and existing industries and for domestic uses. (NI)
Cumulative 3 2 4 0.75 7 - MOD
Construction of the FGD will increase water demand in the area.
Residual 3 3 8 1 14 - HIGH
With mitigation more water allocation alternatives will be considered and water demand met.
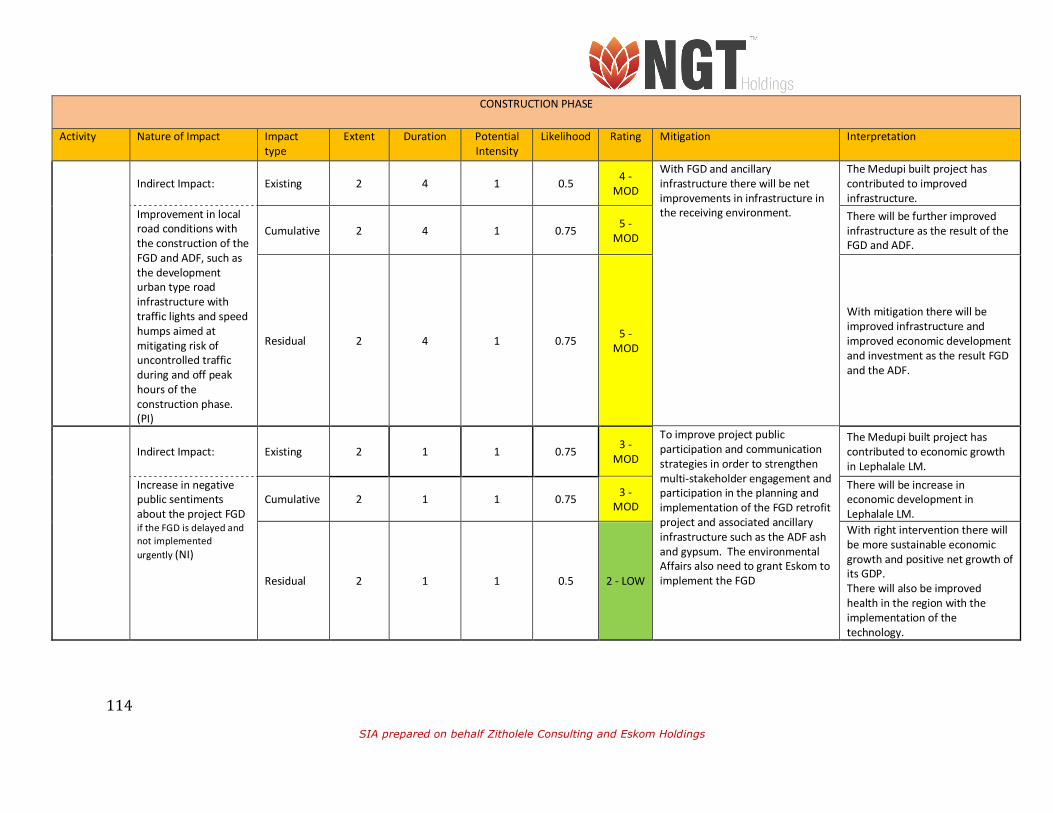
114
SIA prepared on behalf Zitholele Consulting and Eskom Holdings
CONSTRUCTION PHASE
Activity Nature of Impact Impact type
Extent Duration Potential Intensity
Likelihood Rating Mitigation Interpretation
Indirect Impact: Existing 2 4 1 0.5 4 - MOD
With FGD and ancillary infrastructure there will be net improvements in infrastructure in the receiving environment.
The Medupi built project has contributed to improved infrastructure.
Improvement in local road conditions with the construction of the FGD and ADF, such as the development urban type road infrastructure with traffic lights and speed humps aimed at mitigating risk of uncontrolled traffic during and off peak hours of the construction phase. (PI)
Cumulative 2 4 1 0.75 5 - MOD
There will be further improved infrastructure as the result of the FGD and ADF.
Residual 2 4 1 0.75 5 - MOD
With mitigation there will be improved infrastructure and improved economic development and investment as the result FGD and the ADF.
Indirect Impact: Existing 2 1 1 0.75 3 - MOD
To improve project public participation and communication strategies in order to strengthen multi-stakeholder engagement and participation in the planning and implementation of the FGD retrofit project and associated ancillary infrastructure such as the ADF ash and gypsum. The environmental Affairs also need to grant Eskom to implement the FGD
The Medupi built project has contributed to economic growth in Lephalale LM.
Increase in negative public sentiments about the project FGD if the FGD is delayed and not implemented urgently (NI)
Cumulative 2 1 1 0.75 3 - MOD
There will be increase in economic development in Lephalale LM.
Residual 2 1 1 0.5 2 - LOW
With right intervention there will be more sustainable economic growth and positive net growth of its GDP. There will also be improved health in the region with the implementation of the technology.

115
SIA prepared on behalf Zitholele Consulting and Eskom Holdings
6.3. Impact Rating: Project Operational Phase
OPERATIONAL PHASE
Activity Nature of Impact Impact type Extent Duration Potential Intensity Likelihood Rating Mitigation Interpretation
Synchronisation and operation of the FGD technology to Medupi PS six units.
Direct Impact: Existing 2 4 8 1 14 - HIGH
Eskom should prioritize the tender for construction of the FGD and prioritize retrofitting the FGD within time and budget to ensure compliance with AEL timeframes for SO2 reduction targets.
There are currently high levels of SO2 gas in the atmosphere
Synchronisation and operation of the FGD technology at Medupi will result to reduction in SO2 levels in the atmosphere resulting to improved ambient air quality and improved human health as the result of the FGD.(PI)
Cumulative 4 4 8 1 16 - HIGH
The FGD will contribute to reduction of the SO2
Residual 5 4 8 0.1 2 - LOW
There will be 93% reduction in the SO2 levels in Lephalale and reduction in global stats of SO2 levels
Direct Impact: Existing 2 2 8 1 12 - HIGH
Urgent implementation of the FGD technology in Medupi
There is existence of illnesses that are resulting from high levels of SO2.
Reduction is respiratory related diseases such as asthma, bronchitis, lung cancer, eye irritations, pneumonia and cardiovascular disease resulting from emission such as SO2. The result is overall improvements to human health and quality of life for the locals and labourers through improved ambient air quality in the receiving environment as the result of implementing the FGD. (PI)
Cumulative 2 2 4 0.75 6 - MOD The implementation of the FGD will reduce respiratory diseases
Residual 2 1 8 0.1 1 – LOW There will be net improvement in health and quality of life by human in Lephalale.

116
SIA prepared on behalf Zitholele Consulting and Eskom Holdings
OPERATIONAL PHASE
Activity Nature of Impact Impact type Extent Duration Potential Intensity
Likelihood Rating Mitigation Interpretation
Indirect Impact: Existing 4 2 2 1 8 - MOD Implementing the FGD on time will result to avoidance of potential labour unrest which may hamper the supply of power.
Medupi construction has often resulted to labour unrest.
Stabilization of the National Grid and improved electric supply to support the growing economy and achievement of social imperative such as provision of power for domestic use throughout the country. (PI)
Cumulative 4 2 2 0.75 6 - MOD The FGD will contribute to success full implementation operation of the power station
Residual 4 4 2 0.1 1 - LOW With mitigation the FGD will contribute to positive supply in power grid
Direct Impact: Existing 1 1 2 1 4 - MOD
Local businesses should be incubated and equipped with necessary skills to be able to develop the secondary industry associated with commercial viable gypsum industry. A programme can be initiated to assist local users to obtain the necessary waste management licenses for utilization of gypsum.
The area has low skills and education to allow for the development of secondary gypsum industry.
Development of the secondary industries as the result of implementation of the FGD through sales of its commercial suitable gypsum to the farming industry- locally, regional, nationally and possibly internationally (if well packaged). Or secondary industry such as manufacturing of construction materials like the gypsum boards for ceilings and partitions. (PI)
Cumulative 1 1 2 0.75 3 - MOD With implementation of the FGD
Residual 1 1 2 0.5 2 - LOW With mitigation the locals will be able to develop the secondary industry.

117
SIA prepared on behalf Zitholele Consulting and Eskom Holdings
6.4. Impact Rating: Project Decommissioning Phase
DECCOMMISSIONING PHASE
Activity Nature of Impact Impact type Extent Duration Potential
Intensity Likelihood Rating Mitigation Interpretation
Decommission of the FGD technology and the ADF in 50 years
Indirect Impact: Existing
1 3 1 0.5 3 – MOD
With interventions in skills development, there will be will be necessary skills and employment opportunities for the locals. Eskom
The area has low education and skills levels among the locals and this had negatively impacted on them in the Medupi built project.
Employment opportunities in disassembling and recycling of recyclable materials from the FGD and the ADF. (PI)
Cumulative
2 1 2 1 5 – MOD
Unemployment by the locals will remain high with decommissioning of the FGD and ADF (highly technical projects) without mitigating the situation.
Residual
2 1 8 1 11 – HIGH
With mitigation there will be improved employment opportunities for the locals in the decommissioning of the FGD and the ADF.

112
SIA prepared on behalf Zitholele Consulting and Eskom Holdings
7. CONCLUSIONS
Conclusions:
• It is concluded that the significance of positive social impacts generally exceeds the significance
of negative social impacts in the implementation of the FGD, the ADF and the railway siding
throughout all four stages of the project.
• It is also concluded that implementation of the proposed FGD technology at Medupi will result in
reduced levels of SO2 in the medium and long term in the region and South Africa. It will also
contribute to reduction of global SO2 atmospheric levels. As the result of this, the significance of
health risks associated with the SO2 emissions will be minimized on a long-term basis.
• The results will be an improved biosphere in the region and South Africa, this will translate to
improved quality of life for the citizens of Lephalale and the communities located south and
southwest of the study area who are also affected by pollutants containing SO2.
• Based on issues raised by some of the affected communities during the SIA fieldwork, it is
concluded that one of the most pressing issues identified during the survey relates to stakeholder
relations and project communication.
• The above issue was put forward for the attention of the project proponent; a meeting was
scheduled between the project proponent representatives in Lephalale dealing with
environmental and social issues on the ground. The aim was to come up with solution on how to
best address the communication impasse. Through this meeting and the information made
available to the SIA team, it has been determined that Eskom and its stakeholders have done a
significant amount of work in dealing with concerns of the various interested and affected parties
on the ground. They have contributed to the establishment structures entrusted with the
management of stakeholder relations and communication as part of the Medupi project. A
committee has been established to deal with such issues; for example, the Medupi Environmental
Monitoring Committee (EMC) as well as the Stakeholder Relations Office in the region. It is
therefore concluded that necessary strategies and measures have been put in place to deal with
and manage stakeholder relations and communication.
• In terms of ecosystem services, the study assessed how the Medupi FGD, its by-products, the
existing AFD and the proposed railway siding would negatively impact on the ecosystems and how
such negative impacts will influence ecosystem services that support the health and wellbeing of
113
SIA prepared on behalf Zitholele Consulting and Eskom Holdings
the affected communities i.e. municipality, other industries, the farmers and households in the
regions. In this assessment, the SIA team considered the following (Table 11 and recommendation
section of this report):
o Direct drivers of the ecosystem change: e.g. change in local land use and cover; resources
consumption; pollution; increase in population
o Indirect drivers of the ecosystem change: e.g. demographic change; economic change;
socio- political change; cultural and religious change; scientific and technological change.
o The wellbeing of ecosystem services beneficiaries: e.g. these included among others,
change in demand for ecosystem service for basic material for good life; change in
demand for ecosystem service for health; change in demand for ecosystem service or
security; change in demand for ecosystem service for good social relations.
• Taking into consideration of ecosystem services beneficiaries and drivers; we assessed the
potential impacts of the proposed railway siding for lime off-taking. The land on which the
proposed siding is to be constructed is already reformed or altered. It is therefore, concluded
that the railway siding will not have any adverse negative social and economic impacts in terms
of increase in traffic volumes and possible road carnage resulting from trucks transporting lime to
Medupi.
• In terms of the existing ADF facility (and other infrastructure on site such as slime dams, coal
stockpiles etc.), necessary measures have been put in place to mitigate any possible leakage to
groundwater resulting in ground water contamination. Approximately 21 boreholes have been
drilled to compile data that would assist the project proponent to assess sulphates levels in the
ground water with the aim of mitigating areas where there is groundwater contamination.
• The water issue is concluded to be the biggest threat in the project lifespan, the current allocation
to Medupi will be able to operate the six generation units at Medupi. Water for the other 3 of the
FGD absorber units are expected to come from MCWAP Phase. The current raw water abstraction
from Mokolo Dam of which the Lephalale LM is also dependent on for clear water to support its
domestic and farming communities’ poses is a biggest socio-economic threat in terms of
ecosystems support services.
• From a social impact assessment perspective; it is concluded that the FGD technology retrofit
project, the use of the existing ADF to dispose of ash and excess gypsum and the development of

114
SIA prepared on behalf Zitholele Consulting and Eskom Holdings
the railway siding should proceed as planned provided that the following recommendations are
implemented and adhered to:
115
SIA prepared on behalf Zitholele Consulting and Eskom Holdings
8. RECOMMENDATIONS
Below is the list of recommendation proposed to the project proponent to mitigate against any negative
impacts and improve the positive benefits of the proposed project:
• Mitigation measures in this report must be included in the Environmental Management Programme
(EMPr), which will be approved as condition of environmental authorisation.
• The specialist responsible for compiling the EMPr must consult and consider the findings and the
recommendations of the SIA.
• The issue of communication was flagged by some of the communities as a pressing issue. Through
engagement with project proponent representatives it has been determined that necessary
measures have been put in place to mitigate issues pertaining to stakeholder engagement in the
broader Lephalale area.
o Although Eskom has done a lot to address this concern, it is recommended that the EMC
should further strengthen its multi-stakeholder engagement strategy or adopt new forms
of communication that resonate with the interests of I & APs in the region.
o This should be done in a manner that does not polarise relations between existing
stakeholders. One way of addressing this issue is to develop a sub-committee for the
EMC.
o The sub-committee should include a representative from each of the affected
communities. This should be in addition to those communities’ representatives already
listed in the EMC Terms of Reference (ToR).
o Community representatives from Steenbokpan (Leseding) and the farms (farming
community) should form part of the EMC sub-committee due to the fact that they feel
excluded in programmes and workshops that deal with issues arising from Medupi
construction and the associated infrastructure and technology such as the FGD.
o In addition to EMC public meetings and workshops, the sub-committee will ensure that
all community concerns and grievances are deliberated on and addressed directly by the
EMC and outside the EMC public meetings. The EMC ToR allows for the election of
alternates. Therefore, this recommendation for EMC sub-committee is in line with EMC
ToR.
116
SIA prepared on behalf Zitholele Consulting and Eskom Holdings
• In projects of similar nature to Medupi, a grievance mechanism committee is often established and
communicated to the community in line with best practice. The Medupi EMC is a sufficient structure
to handle all issues relating to the environment, monitoring and auditing. However, without
increasing bureaucracy, Eskom should consider appointing an independent company/specialist that
specialises in the management of Social Risks. The task of the appointee would be to advise and
strengthen the following:
o Working with the Eskom Community Liaison Officer (Stakeholder Engagement
Representative) to independently advise on the facilitation of relations between the
various project stakeholders such as the appointed contractors, the EMC, the
Environmental Control Officer (ECO), the affected community and community
organisations such as NGOs, local labourers, local Small Medium Enterprises (SMMEs) as
well as big industries.
o The Social Risk company or specialist should be experienced in multi-stakeholder
management, conflict resolution, labour relations, and negotiation of contracts, skills
audits, and training and facilitation of skills transfer programmes.
o If there is already an existing contract for an independent Social Risk company/specialist
for the construction of Medupi Power Station – Eskom should consider extending such a
contract since the company/specialist will already be familiar with issues on the ground
and be well acquainted with community and government structures in Lephalale.
o There will be no need for additional infrastructure for this specialist or company; she/he
can use the existing stakeholder relations office and its satellite offices.
This is important because the construction activities at Medupi have on many occasions been subject to
disruption due to labour unrest and protest by locals who demand job opportunities. This is something
that came out strongly during the public consultation for the proposed FGD project. Some locals who
claimed that they were overlooked in the Medupi projects and that they will be overlooked in the current
project too disrupted one of the Public Participation (PP) meetings. The inclusion of a social risk company
or specialist in the EMC will ensure that the EMC has enough capacity and skills to deal with and address
social and socio-economic issues without overly relying on Eskom Communication, CSI and Stakeholder
Relations Departments. Furthermore, it will play a key role in reporting, monitoring and auditing of Eskom
commitments to addressing social issues in line with ToR of the EMC. The social risk company will work
117
SIA prepared on behalf Zitholele Consulting and Eskom Holdings
hand in hand with the appointed Environmental Control Officer responsible for the implementation of the
EMPr.
Both the SIA impact assessment analysis and stakeholder engagement concluded that the proposed
Medupi FGD-RP will result in positive biospheric and social benefits in the receiving environment and the
improvement of the quality of life for the affected communities in terms of reduced number of health
incidents that result from exposure to high levels of SO2. There are however disagreements on how the
FGD-RP should be implemented; some argue it should be built into the Medupi Units before their
synchronisation while the project proponent proposes to retrofit the technology. Those in favour of
constructing the FGD with Medupi Units argue that the coming in of Medupi units will results to further
increase in SO2 levels in the region and will compromise the health of citizens who are already suffering
from SO2 health related challenges such as high prevalence of respiratory diseases.
From a SIA perspective, it is recommended that Eskom should prioritise retrofitting and synchronising the
FGD technology to Unit 6, 5 and 4 which have been completed and have been operational since 2016 (unit
5) and early in 2017 (Unit 6). These will allay the fears of those in favour of constructing the FGD with the
unit stacks and will also increase Eskom compliance levels in terms of reducing SO2 and increasing
atmospheric and air quality. Technically, this will assist them understand the challenges and opportunities
of the technology prior to its retrofitting to Units 1, 2 and 3.
In terms of material transport to and from site for the construction of the FGD and to transport gypsum,
salts and sludge which are by-products of the FGD; it is recommended that Eskom should speed up the
construction of the proposed railway siding and prioritise the railway as the preferred construction
material transport mode as well as for the off-take of the FGD by-products to appropriate licensed disposal
facilities specially for salts and sludge. This will help mitigate environmental risks associated with the use
of public roads to transport these hazardous materials. It will also assist alleviate possible increase in
traffic volumes associated with the FGD construction material transportation.
In terms of FGD by-products it is recommended that Eskom should consider tendering the offtake of
gypsum for commercial purposes instead of its combined disposal with the ash.

118
SIA prepared on behalf Zitholele Consulting and Eskom Holdings
Eskom is highly commended for its zero liquid disposal strategy at Medupi which encourages water
recycling and circulation within the footprint. However, this will only assist in meeting the current water
demand on site and is not sufficient enough to meet and address the demand with the implementation
of the FGD. Water and water allocation however falls outside the statutory mandate of Eskom, but the
responsibility of the National Department of Water and Sanitation (DWS). Through the various bargaining
platforms available to Eskom and the surrounding industries such as mines and Sasol – it is recommended
that Eskom should lobby (together with other industries) DWS to speed up the implementation of Phase
2 MCWAP. This will guarantee Eskom and other industries in Lephalale appropriate water allocation to
support the FGD and the growing industries around it such as expanded coal mining due to coal reserves
in the Waterberg region. The speeding up of the Phase 2 MCWAP by DWS would also assist mitigate the
potential water risk to Lephalale associated with the abstraction of raw water by industries from Mokolo
Dam of which the municipality and its constituencies is also directly dependent on for potable water.

119
SIA prepared on behalf Zitholele Consulting and Eskom Holdings
9. REFERENCES
Aucamp, I. (2009a). Social Impact Assessments. In P. Aucamp, Environmental Impact Assessment: A
Practical Guide for the Discerning Practitioner (pp. 109-120). Pretoria: Van Schaik Publishers.
Aucamp, I. (2015, April). Social Impact Assessment as a tool for Social Development in South Africa: An
exploratory study. A thesis submitted in partial fulfilment of the requirements for the degree Doctor
Philosophiae. University of Pretoria.
Aucamp, P. (2009b). Environmental Impact Assessment: A Practical Guide for the Discerning Practitioner.
Pretoria: Van Schaik Publishers.
Bezuidenhout, H. (2009). An improved social impact evaluation framework for the completion of SIA
sections during the environmental impact assessment process for residential developments in South
Africa. Pretoria: MA dissertation, University of Pretoria.
Burt, E., Orris, P., & S. Buchanan. (2013). Scientific Evidence of Health Effects from Coal Use in Energy
Generation. Healthcare Research Collaborative
Burdge, R.J. and Vanclay, F. (1996). Social Impact Assessment: a contribution to the state of the art
series. Impact Assessment, 14, 59-86.
Bussiness Day Live. (2015). Bussiness Day Live. Retrieved March 28, 2016, from
http://www.bdlive.co.za/national/2015/05/26/sas-urban-population-growing-larger-and-younger
Constitution of the Republic of South Africa, 1996 (Act no. 108 of 1996). (n.d.).
DEAT. (2002a). Specialist Studies. Information Series 4. Pretoria: Department of Environmental Affairs
and Tourism (DEAT).
DEAT. (2002b). Impact Significance, Integrated Environmental Management. Information Series 5.
Pretoria: Department of Environmental Affairs and Tourism (DEAT).
DEAT. (2006). Socio-Economic Impact Assessment. Integrated Environmental Management Series 22.
Pretoria: Department of Environmental Affairs and Tourism (DEAT).
Eskom Holdings Limited. (2011). The Eskom Factor .

120
SIA prepared on behalf Zitholele Consulting and Eskom Holdings
Gibson, R. (2006). Sustainability assessment: basic compounds of a practical approach. Impact
Assessment and Project Appraisal, 24(3), 170-182.
Interorganizational Committee on Guidelines and Principles. (1994). Guidelines and Principles for Social
Impact Assessment. Washington DC: Department of Commerce.
Interorganizational Committee on Guidelines and Principles for SIA (ICGP). (2003). Principles and
Guidelines for Social Impact Assessment. Impact Assessment and Project Appraisal, 21(3), 231-250.
Itzkin, A. (2015). Health in Waterberg,Up in Smoke? Unpublished MSc. University of the Witwatersrand,
Johannesburg
McGranahan, G. & Murray, F. (2003). Air Pollution and Health in Rapidly Developing Countries.
Management of Environmental Quality: An International Journal, 14(4), 542 - 543.
National Environmental Management Act, 1998 (Act no. 107 of 1998). (n.d.).
Regulations in terms of Chapter 5 of the National Environmental Management Act, 1998 (Environmental
Impact Assessment Regulations) of 4 December 2014. (n.d.).
South Africa. (2014). South African National Environmental Management Laws Amendment Act (NEMLA)
of 2014.
Statistics South Africa. (2011). Statistics by place. Retrieved March 22, 2016, from
http://www.statssa.gov.za/?page_id=964
The International Bank for Reconstruction and Development / THE WORLD BANK. (1998). Participation
and Social Assessment: Tools and Techniques. Compiled by J. Rietbergen-McCracken and D. Narayan.
Vanclay, F. E. (2015). Guidance for assessing and managing the social impacts of projects. Fargo ND:
International Association for Impact Assessment.
World Bank. (1995). Social Assessment. Environmental Department Dissemination Notes Number 36.
Washington DC: World Bank.

121
SIA prepared on behalf Zitholele Consulting and Eskom Holdings
Internet Sources:
http://www.miningweekly.com/article/high-court-rules-in-favour-of-earthlife-africa-in-south-africas-
first-climate-change-case-2017-03-08 (15/05/2017)
http://cer.org.za/news/eskom-flouts-air-pollution-laws-and-world-bank-loan-conditions (15/05/2017)
http://www.eskom.co.za/OurCompany/CSI/AboutUs/Pages/default.aspx (18/05/2017)
Business Report- Companies Section, 14 October 2013. http://www.iol.co.za/business-
report/companies/eskom-plant-brings-boom-to-lephalale-1591263 (18/05/2017)

122
SIA prepared on behalf Zitholele Consulting and Eskom Holdings
8. ANNEXURES
ANNEXURE 1- NOTICE OF THE FGD PROJECT TO INTERESTED AND AFFECTED PARTIES
123
SIA prepared on behalf Zitholele Consulting and Eskom Holdings

124
SIA prepared on behalf Zitholele Consulting and Eskom Holdings
ANNEXURE 2- NOTICES FOR PUBLIC MEETING TO DISCUSS THE PROPOSED MEDUPI FGD RETROFIT PROJECT IN LEPHALALE LOCAL MUNICIPALITY
.

125
SIA prepared on behalf Zitholele Consulting and Eskom Holdings

126
SIA prepared on behalf Zitholele Consulting and Eskom Holdings

127
SIA prepared on behalf Zitholele Consulting and Eskom Holdings
128
SIA prepared on behalf Zitholele Consulting and Eskom Holdings
ANNEXURE 3 – EXAMPLE OF SITE NOTICES PLACED AT VARIOUS VENUES AND PHOTOS TAKEN DURING PUBLIC MEETINGS THAT TOOK PLACE AS PART OF THE SIA CONSULTATIVE PROCESS
Figure 21- Site notice at Lephalale FM

129
SIA prepared on behalf Zitholele Consulting and Eskom Holdings
Figure 22- Site notice at the entrance of one of the local Zion church
Figure 23-Site Notice at a local Spaza Shop Marapong

130
SIA prepared on behalf Zitholele Consulting and Eskom Holdings
Figure 24- Site notice at Marapong Clinic
Figure 25- Site notice near one of the Spaza Shops in Marapong

131
SIA prepared on behalf Zitholele Consulting and Eskom Holdings
Figure 26- Site notice at Marapong Library

132
SIA prepared on behalf Zitholele Consulting and Eskom Holdings
Figure 27- Site notice at Spar Onverwacht

133
SIA prepared on behalf Zitholele Consulting and Eskom Holdings
Figure 28- Notice at Steenbokpan community hall (first row) and local Spaza shop (second row)
Figure 29- Site notice at a Sasol donated facility in Steenbokpan

134
SIA prepared on behalf Zitholele Consulting and Eskom Holdings
Figure 30- Site notice at Lephalale FET and Ellisras District Hospital
135
SIA prepared on behalf Zitholele Consulting and Eskom Holdings
Figure 31 – Picture showing attendents and the meeting proceeding at Marpong Library on the 16 April
2015
136
SIA prepared on behalf Zitholele Consulting and Eskom Holdings
Figure 32 – Meeting proceeding at Leseding Community (Steenbokpan)

137
SIA prepared on behalf Zitholele Consulting and Eskom Holdings
ANNEXURE 4- GENERAL SITE CONDITION OF THE EXISTING MEDUPI ADF
Figure 33-Signage at the Medupi Ash Disposal Facility entrance point

138
SIA prepared on behalf Zitholele Consulting and Eskom Holdings
Figure 34- Available land that has been cleared for the growth of the Ash Disposal Facility (AFD). Image
taken from the west facing east
Figure 35- The width of the facility facing Medupi from the west end of the ADF

139
SIA prepared on behalf Zitholele Consulting and Eskom Holdings
Figure 36 – The western end on the AFD
Figure 37- Northern end of the AFD
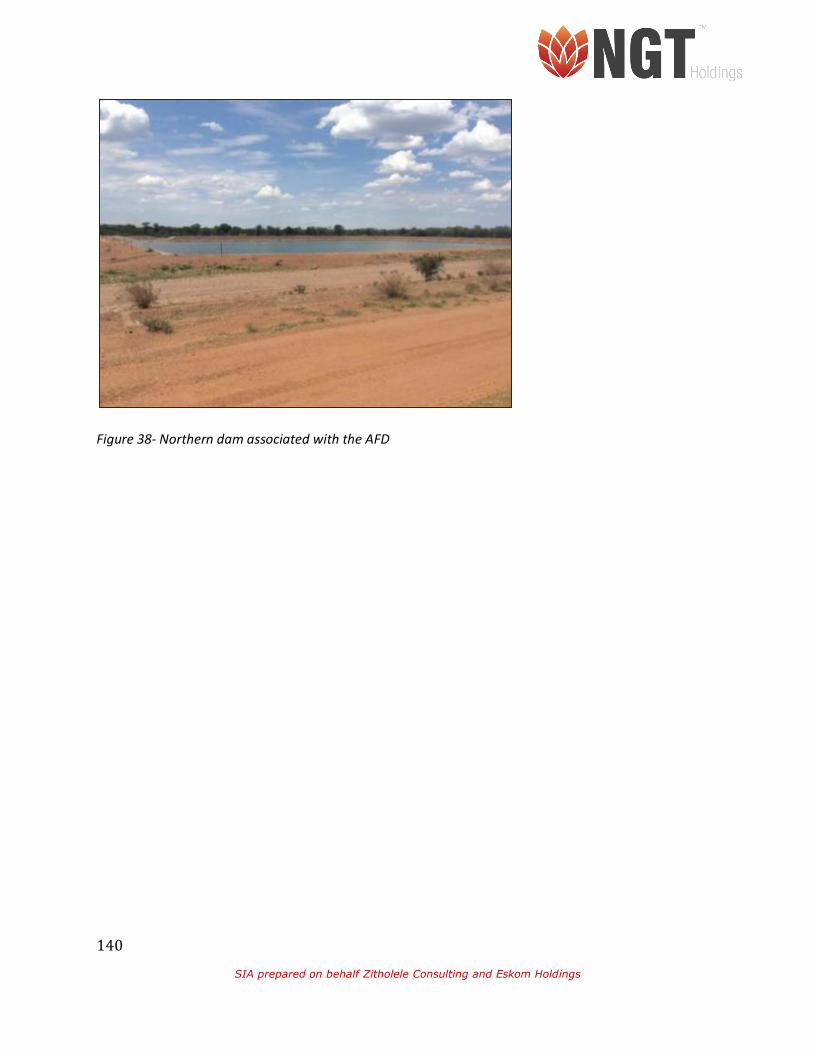
140
SIA prepared on behalf Zitholele Consulting and Eskom Holdings
Figure 38- Northern dam associated with the AFD

141
SIA prepared on behalf Zitholele Consulting and Eskom Holdings
Figure 39- Current ash heap at the facility
Dustsuppressionsprinklersystem

142
SIA prepared on behalf Zitholele Consulting and Eskom Holdings
Figure 40- Conveyor belt system associated with the AFD
ConveyorbeltfromthepowerstationtotheAshDisposalFacility
Raingauge

143
SIA prepared on behalf Zitholele Consulting and Eskom Holdings
Figure 41- Land dedicated to the facility. Taken south of the facility facing north
Figure 42- Image of the land dedicated to the facility and ash heap from Medupi power station. Taken
from the south facing north-east
Figure 43- Two dams associated with the facility located south-west of the current ash heap

144
SIA prepared on behalf Zitholele Consulting and Eskom Holdings
Figure 44- Fence line demarcating the facility with the southern property and the railway line
Figure 45- Machine that loads ash onto the facility from conveyor belt
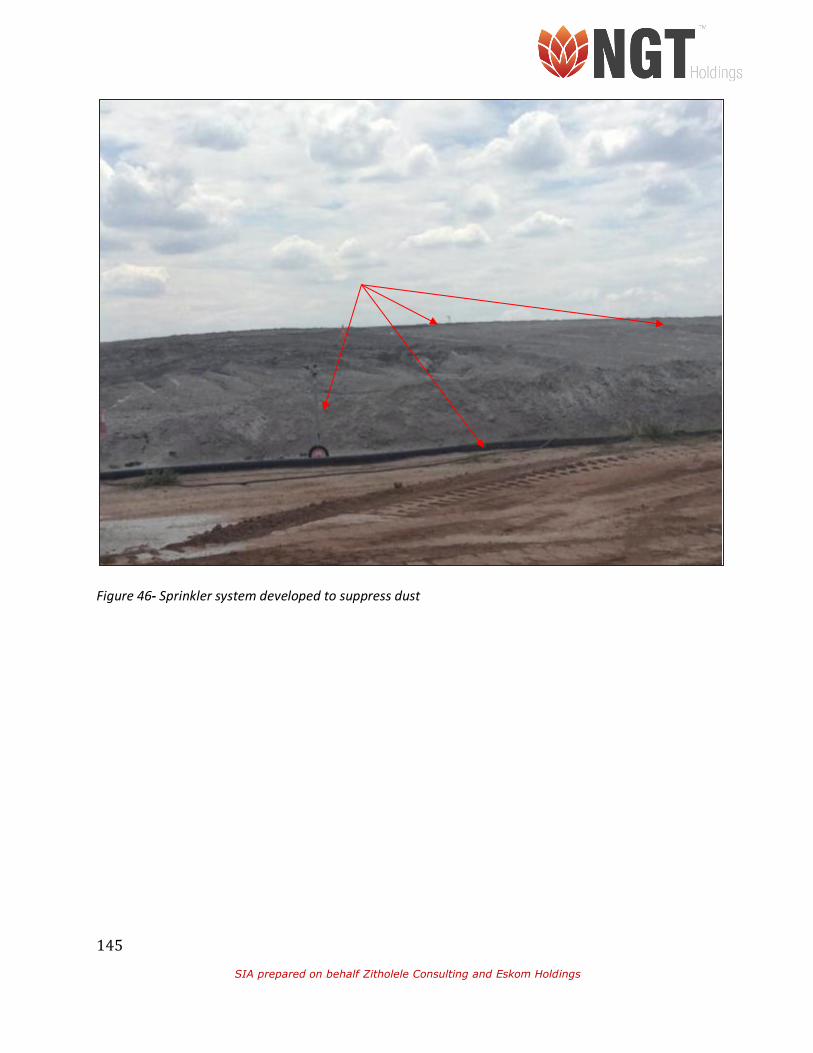
145
SIA prepared on behalf Zitholele Consulting and Eskom Holdings
Figure 46- Sprinkler system developed to suppress dust

146
SIA prepared on behalf Zitholele Consulting and Eskom Holdings
ANNEXURE 5 – EXAMPLE OF A PUBLIC MEETING WHERE THERE WAS A NEED FOR PUBLIC ENFORCEMENT The meeting was held in 2016 and was disrupted by angry disgruntled youth who threatened violence if
the meeting was not disbanded or they were engaged by senior Eskom representatives. Chants of
“iAgenda yama Capitalists asiyifuni, we want jobs” which loosely translated means “We do not support
capitalist agenda’s, we want jobs”. The youth spoke at length about the scourge of unemployment and
lack of consideration for the locals in Medupi construction activities currently underway at Medupi.
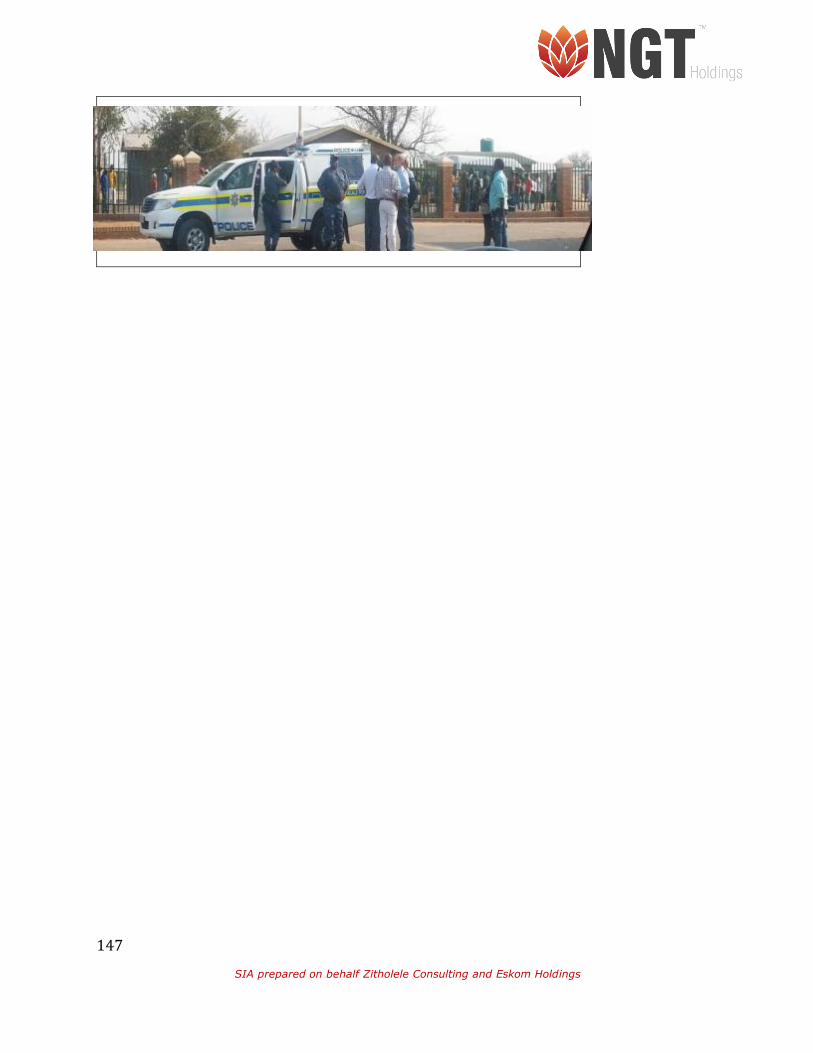
147
SIA prepared on behalf Zitholele Consulting and Eskom Holdings

148
SIA prepared on behalf Zitholele Consulting and Eskom Holdings
ANNEXURE 6 – UPDATES TO PROJECT SCOPE 2017-2018

149
SIA prepared on behalf Zitholele Consulting and Eskom Holdings
ANNEXTURE 7: ESKOM MEDUPI POWER STATION ASH DISPOSAL FACILITY 4 TO 2O YEARS STORM WATER MANAGEMENT PLAN
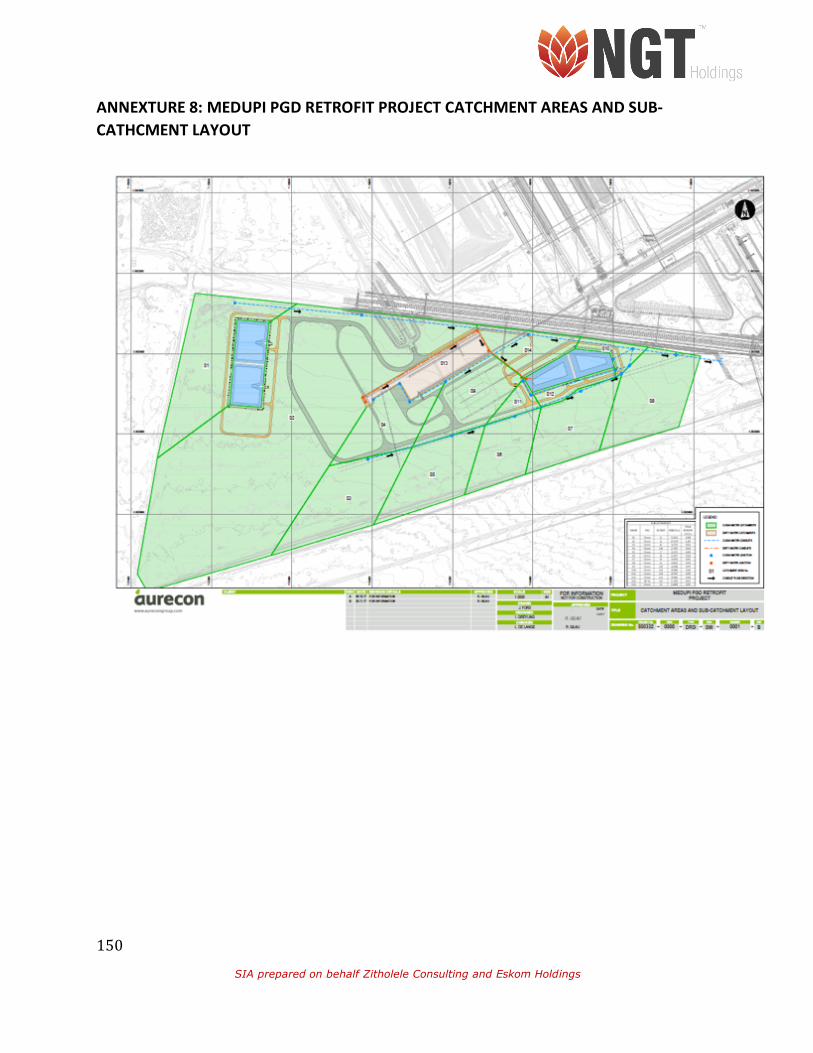
150
SIA prepared on behalf Zitholele Consulting and Eskom Holdings
ANNEXTURE 8: MEDUPI PGD RETROFIT PROJECT CATCHMENT AREAS AND SUB-CATHCMENT LAYOUT

151
SIA prepared on behalf Zitholele Consulting and Eskom Holdings
ANNEXTURE 9: ESKOM MEDUPI POWER STATION FGD RETROFIT PROJECT SITE ARRANGMENT

152
SIA prepared on behalf Zitholele Consulting and Eskom Holdings
ANNEXTURE 10: ESKOM MEDUPI POWER STATION RAILWAY YARD LAYOUT