Page 1 of 33 Materials Analyses and Electrochemical Impedance of Implantable Metal Electrodes
35
This is an Accepted Manuscript, which has been through the Royal Society of Chemistry peer review process and has been accepted for publication. Accepted Manuscripts are published online shortly after acceptance, before technical editing, formatting and proof reading. Using this free service, authors can make their results available to the community, in citable form, before we publish the edited article. We will replace this Accepted Manuscript with the edited and formatted Advance Article as soon as it is available. You can find more information about Accepted Manuscripts in the Information for Authors. Please note that technical editing may introduce minor changes to the text and/or graphics, which may alter content. The journal’s standard Terms & Conditions and the Ethical guidelines still apply. In no event shall the Royal Society of Chemistry be held responsible for any errors or omissions in this Accepted Manuscript or any consequences arising from the use of any information it contains. Accepted Manuscript www.rsc.org/pccp PCCP View Article Online View Journal This article can be cited before page numbers have been issued, to do this please use: M. Howlader, A. U. Alam, R. Sharma and M. J. Deen, Phys. Chem. Chem. Phys., 2015, DOI: 10.1039/C4CP05899B.
Transcript of Page 1 of 33 Materials Analyses and Electrochemical Impedance of Implantable Metal Electrodes

This is an Accepted Manuscript, which has been through the Royal Society of Chemistry peer review process and has been accepted for publication.
Accepted Manuscripts are published online shortly after acceptance, before technical editing, formatting and proof reading. Using this free service, authors can make their results available to the community, in citable form, before we publish the edited article. We will replace this Accepted Manuscript with the edited and formatted Advance Article as soon as it is available.
You can find more information about Accepted Manuscripts in the Information for Authors.
Please note that technical editing may introduce minor changes to the text and/or graphics, which may alter content. The journal’s standard Terms & Conditions and the Ethical guidelines still apply. In no event shall the Royal Society of Chemistry be held responsible for any errors or omissions in this Accepted Manuscript or any consequences arising from the use of any information it contains.
Accepted Manuscript
www.rsc.org/pccp
PCCP
View Article OnlineView Journal
This article can be cited before page numbers have been issued, to do this please use: M. Howlader, A.
U. Alam, R. Sharma and M. J. Deen, Phys. Chem. Chem. Phys., 2015, DOI: 10.1039/C4CP05899B.

Graphical Abstract: The increase of electrochemical impedance of the
implantable electrodes was influenced by the oxidation of the
electrode/adhesion-layers confirmed by XPS.
Page 1 of 34 Physical Chemistry Chemical Physics
Phy
sica
lChe
mis
try
Che
mic
alP
hysi
csA
ccep
ted
Man
uscr
ipt
Publ
ishe
d on
12
Mar
ch 2
015.
Dow
nloa
ded
by M
cMas
ter
Uni
vers
ity o
n 12
/03/
2015
12:
36:0
5.
View Article OnlineDOI: 10.1039/C4CP05899B

Page 1 of 33
Materials Analyses and Electrochemical Impedance of Implantable Metal
Electrodes Matiar M. R. Howlader*, Arif Ul Alam, Rahul P. Sharma, M. Jamal Deen
Department of Electrical and Computer Engineering, McMaster University, Hamilton, Ontario
L8S 4K1, Canada 5
*Email: [email protected]
Abstract— Implantable electrodes with high flexibility, high mechanical fixation and low
electrochemical impedance are desirable for neuromuscular activation because they provide safe,
effective and stable stimulation. In this paper, we report on detailed materials and electrical 10
analyses of three metal implantable electrodes - gold (Au), platinum (Pt) and titanium (Ti) -
using X-ray photoelectron spectroscopy (XPS), scanning acoustic microscopy, drop shape
analysis and electrochemical impedance spectroscopy. We investigated the cause of changes in
electrochemical impedance of long-term immersed Au, Pt and Ti electrodes on liquid crystal
polymer (LCP) in phosphate buffered saline (PBS). We analyzed the surface wettability, surface 15
and interface defects and elemental depth profile of the electrode-adhesion layers on the LCP.
The impedance of the electrodes decreased at lower frequencies, but increased at higher
frequencies compared with that of the short-term immersion. The increase of impedances was
influenced by the oxidation of the electrode/adhesion-layers that affected the double layer
capacitance behavior of the electrode/PBS. The oxidation of the adhesion layer for all the 20
electrodes was confirmed by XPS. Alkali ion (sodium) was adsorbed on the Au and Pt surfaces,
but diffused into the Ti electrode and LCP. Pt electrode showed higher sensitivity to surface and
interface defects than that of Ti and Au electrodes. These findings may be useful when designing
electrodes for long-term implantable devices.
25 Key Words: - Implantable metal electrodes, electrochemical impedance, liquid crystal polymer,
phosphate buffered saline, electrode-adhesion layers oxidation, X-ray photo-electron
spectroscopy, scanning acoustic microscopy, drop shape analysis
30
Page 2 of 34Physical Chemistry Chemical Physics
Phy
sica
lChe
mis
try
Che
mic
alP
hysi
csA
ccep
ted
Man
uscr
ipt
Publ
ishe
d on
12
Mar
ch 2
015.
Dow
nloa
ded
by M
cMas
ter
Uni
vers
ity o
n 12
/03/
2015
12:
36:0
5.
View Article OnlineDOI: 10.1039/C4CP05899B

Page 2 of 33
1. INTRODUCTION
Implantable electrodes can be used to electrically stimulate impaired muscle and nerves. The
electrical stimulation requires generating electrical pulses, easy routing of the pulses, and
delivering effective stimulus from the electrodes to the tissue. For such applications, the
electrodes with high flexibility, high mechanical fixation and low electrochemical impedance are 5
desirable. The stringent requirements of the electrodes are the essence of high electrochemical
stability and easy transfer of electrical impulses from the electrodes to ions in the surrounding
electrolyte at low injected charge.1,2,3,4,5 Flexibility reduces abrasive or compressive injuries and
improves mechanical fixation. Low electrochemical impedance between electrode/electrolyte
(i.e., tissue) is a critical requirement because it is essential in order to reduce tissue injuries, 10
lower stimulation current (for low/no irritation) and increase the longevity of the implants.1,2,3,6,7
Typically, ideal electrodes possess those characteristics and offer reversible charge transfer
(Faradaic) at the electrode/electrolyte interface without provoking the host tissues, which results
in safe, effective and stable stimulation. In contrast, non-ideal electrodes cause deleterious
chemical changes and harmful effects due to irreversible charge transfer (non-Faradaic).6,7,8,9 15
Flexible polymer substrates such as polyimide (PI), parylene and liquid crystal polymer (LCP)
have been demonstrated for implantable electrode arrays, telemetric coils and structural
membranes.10,11,12,13 Among these substrates, LCP has lower water absorption, a lower
coefficient of thermal expansion, and higher biocompatibility.14,15,16,17 Therefore, LCP is
regarded as one of the best implantable substrate materials, providing reliable functionality in the 20
warm, moist, and mobile environment of the human body.
A wide range of materials, including titanium (Ti), platinum (Pt) and gold (Au) have been used
for implantable electrodes7 because of their high biocompatibility, high charge transfer capability
and low/non-reactivity in the in vivo environments.18,19,20,21,22 Electrodes made of these materials 25
have been tested in phosphate buffered saline (PBS) solution to mimic the operating environment
of the implants. While Ti is used as an electrode and adhesion material on polymers23, oxidation
of Ti24 in the implantable environments may degrade its performance. Also, oxidation of Pt25,
oxygen reduction of Au26 and Pt, and their electrolysis in water25,26 degrades the reversible
charge transfer capability of the long-term implanted electrodes and damages surrounding 30
tissues. Therefore, the electrochemical impedance of Pt-Ti electrodes on flexible substrate was
Page 3 of 34 Physical Chemistry Chemical Physics
Phy
sica
lChe
mis
try
Che
mic
alP
hysi
csA
ccep
ted
Man
uscr
ipt
Publ
ishe
d on
12
Mar
ch 2
015.
Dow
nloa
ded
by M
cMas
ter
Uni
vers
ity o
n 12
/03/
2015
12:
36:0
5.
View Article OnlineDOI: 10.1039/C4CP05899B

Page 3 of 33
increased in PBS solution.27,28 Also, Au electrode covered with poly(3,4-
ethylenedioxythiophene) doped poly(styrene-sulfonate) (PEDOT:PSS) on a copper laminated
Kapton® PI substrate showed higher stability in its electrochemical impedance properties than
that of a bare Au electrode dipped in saline for 40 days.29 Furthermore, an increase in the
impedance at the electrode interface was reported due to the foreign body reaction with 5
organisms.30 Therefore, the operating environment, and the type of polymer substrates, electrode
materials and surface/interfacial adhesion layers affect the performance of the implantable
electrodes.
Recently, we observed the change of electrical impedance for Pt, Au and Ti electrodes on LCP 10
after long-term-immersion in PBS.1,3 The impedance behavior was investigated through
analyzing the surface roughness and the double layer capacitive (signified as β) behavior of the
electrodes. The roughness of the Au electrode was significantly increased as compared to Ti. The
value of β significantly dropped for the Pt and Ti electrodes as opposed to the Au electrodes. The
significant decrease of β value was induced by the prolonged immersion in PBS. The increase of 15
the impedance of the electrodes was believed to be due to the amount of hydroxyls on the
surface.1,31 Also, the increased surface roughness was also attributed to the increase in the
interfacial electrochemical impedance of the electrode. Moreover, the physical changes in the
chemical environment on the surface and inside the immersed Au, Ti and Pt electrodes (i.e.,
pores due to chemical elements of PBS)32,33,34,35 may control the interfacial impedance of 20
electrode/electrolyte. To the best of our knowledge, there is no experimental observation on the
surface wettability, surface and interface defects and elemental depth profile to explain the
change of the impedance of the implantable electrodes after long-term PBS immersion. These
queries are critical to address design challenges for the longevity of implantable devices.
25
This article investigates the cause of changing electrochemical impedance of long-term PBS-
immersed Au, Ti and Pt electrodes on LCP. We measured the water contact angle using a drop
shape analyzer, analyzed defects using a scanning acoustic microscope, and observed chemical
elements using an X-ray photoelectron spectroscope to investigate the impedance change
mechanisms of these electrodes. These results were correlated to understand the increased 30
impedance that would provide important insights about long-term implanted electrodes.
Page 4 of 34Physical Chemistry Chemical Physics
Phy
sica
lChe
mis
try
Che
mic
alP
hysi
csA
ccep
ted
Man
uscr
ipt
Publ
ishe
d on
12
Mar
ch 2
015.
Dow
nloa
ded
by M
cMas
ter
Uni
vers
ity o
n 12
/03/
2015
12:
36:0
5.
View Article OnlineDOI: 10.1039/C4CP05899B

Page 4 of 33
2. EXPERIMENTS
1.1. Fabrication of Flexible Electrodes
For this study, we used the Pt, Ti and Au electrodes fabricated on LCP substrate that were used 5
for electrochemical impedance measurements after dipping for 42 days in PBS solution in our
previous study.1,3 In fact, we measured the electrochemical impedances for the electrodes dipped
for 1, 3, 7, 14, 21, 28, 35 and 42 days. After 42 days of immersion, we observed significant
changes in the impedance as opposed to other shorter (e.g., 21 days) immersion time.1 Ti was
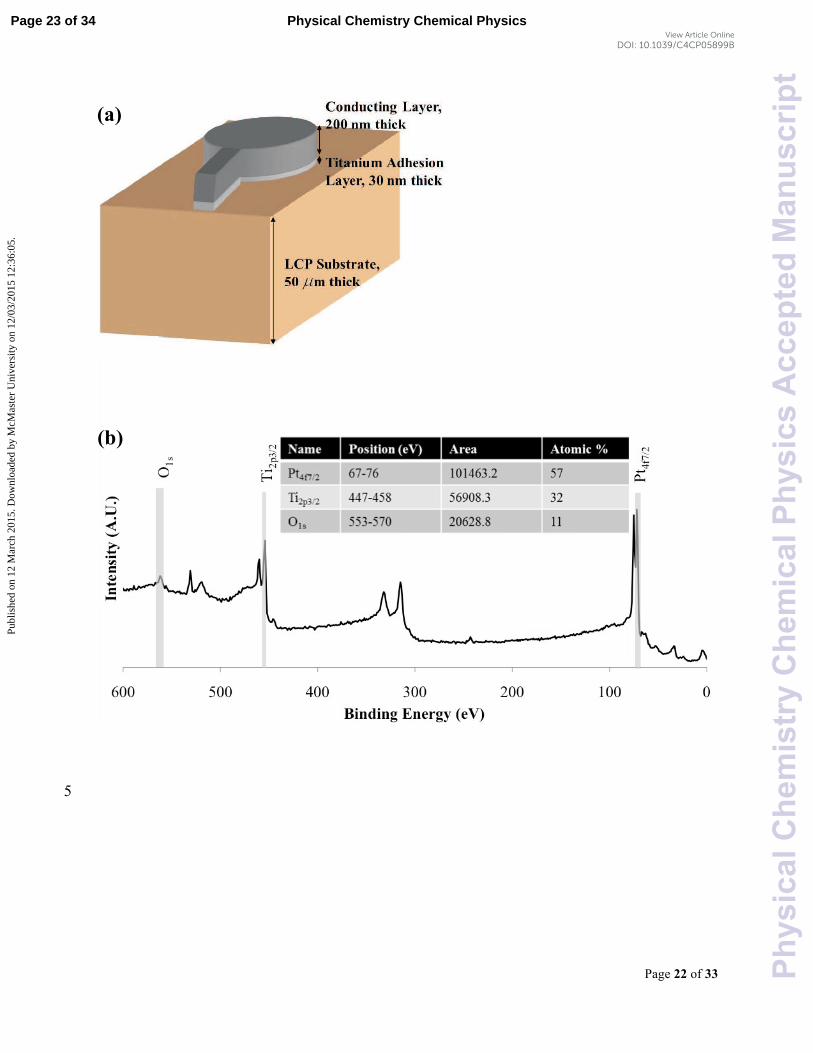
used as the adhesion layer between the substrate and the electrode. The thicknesses of the 10
adhesion layer and the electrode were 30 and 200 nm, respectively (Figure 1(a)). The electrode
was deposited by a low cost process36 on the LCP substrate of a size about (15 mm × 15 mm)
that was cut from an A4 size LCP sheet. A 100 µm thick copper mask with a hole of 8 mm
diameter was placed on top of the LCP during the deposition. So the diameter of the electrode
would be around 8 mm. The adhesion and conducting layers were deposited using electron beam 15
evaporation. The deposition rate was 1.5 Angstroms/s and the background pressure was 1E−4 Pa.
The purities of the Pt, Au and Ti targets were 99.99%, 99.999% and 99.99% respectively. All the
deposition conditions such as target location, sample location, target parameters, and chamber
conditions were kept constant for the deposition of all electrodes and no post-deposition heat
treatments were used. The electrodes dipped in PBS were not encapsulated. The three-electrode 20
electrochemical impedance spectroscopy (EIS) was taken by using a Gamry framework
workstation.1,3 An alternating current excitation with a voltage of 10 mV was used at a frequency
range from 0.1 Hz to 100 kHz. Equivalent circuits and parameters were determined with ZPlot
software. Further details of the LCP substrate, fabrication of electrodes and impedance
measurements can be found in Refs.1,4,37 25
1.2. Contact Angle Measurement
The water contact angle was measured using a drop shape analysis system (DSA100) from
KRÜSS with a 5 µl de-ionized water droplet using the sessile drop method (Figure 1(d)).38,39
The water contact angle shows the affinity of the surface with hydroxyl groups. The contact 30
Page 5 of 34 Physical Chemistry Chemical Physics
Phy
sica
lChe
mis
try
Che
mic
alP
hysi
csA
ccep
ted
Man
uscr
ipt
Publ
ishe
d on
12
Mar
ch 2
015.
Dow
nloa
ded
by M
cMas
ter
Uni
vers
ity o
n 12
/03/
2015
12:
36:0
5.
View Article OnlineDOI: 10.1039/C4CP05899B

Page 5 of 33
angles of each specimen were measured once every 2 seconds for 2 minutes of elapsed time to
achieve an average contact angle.
1.3. Scanning Acoustic Microscopy
Acoustic microscopy is a non-destructive testing method of defects through high-resolution 5
imaging of objects created by high frequency ultrasound. The sound waves are captured either
when passing through (transmission mode) or echoing back (reflection mode) from an object.40
A digital image is generated by digitizing those sound waves. Therefore, any internal structures
and defects present in the objects are identified. The Scanning Acoustic Microscopy (SAM) in
this article was done using GEN5TM C-SAM® from Sonoscan® with high frequency (230 MHz) 10
Surface Wave transducer (230SW). We observed surface and interface defects of the electrodes
with a resolution of 4 microns (Figure 4). During scanning, the first echo encountered is called
the surface echo (Figure 1(c)). At this position, the distance between the bottom of the
transducer and the top of the specimen (Z) is approximately equal to the focal length of the
transducer (F). It provides the surface profile of the specimen. As the transducer is moved closer 15
to the surface and the focus moves into the specimen (i.e., Z<F), a second echo will start
appearing to the right of the surface echo and increase in amplitude (Figure 1(c)). Focusing up
and down helps to observe any changes at the boundary between two materials, e.g., defects
between the electrode adhesion layer and the polymer.
20
1.4. X-ray Photoelectron Spectroscopy
X-ray photoelectron spectroscopy (XPS) spectra were acquired by the JPS-9200 from JEOL. The
Magnesium (Mg-α) X-ray source with 10 keV and 15 mA was used for acquiring wide-scan and
narrow-scan spectra with binding energy resolution of 0.1 eV. Also, the Ar-ion etching (with 3
keV and 20 mA) was done with 0.08 Pa pressure. The XPS instrument was calibrated using an 25
Au sample.31
Depth profile XPS spectra of Ti, Pt and Au electrodes were quantified in terms of the peak
intensities, areas and positions of different elements. Generally, the peak intensities signify the
amount of a particular element, whereas the peak positions suggest the elemental and chemical 30
composition. In this experiment, we measured the atomic concentration of each element by
Page 6 of 34Physical Chemistry Chemical Physics
Phy
sica
lChe
mis
try
Che
mic
alP
hysi
csA
ccep
ted
Man
uscr
ipt
Publ
ishe
d on
12
Mar
ch 2
015.
Dow
nloa
ded
by M
cMas
ter
Uni
vers
ity o
n 12
/03/
2015
12:
36:0
5.
View Article OnlineDOI: 10.1039/C4CP05899B

Page 6 of 33
calculating the area of the quantification region (shaded area in Figure 1(b)) using CasaXPS
software.41 Figure 1(b) illustrates a survey spectrum of Pt electrode where the atomic
concentration was calculated based on the area of the quantification regions as shown in the
quantification table (inset). Auger peaks (e.g., NaKLL) were not considered in the calculation of
the atomic concentration of the chemical elements. The quantification regions were specified by 5
selecting an appropriate range of energies as well as subtracting background signals.
All specimens showed charging effect due to the dielectric nature of the LCP. Charge corrections
were accomplished using Au4f7/2, Pt4f7/2 and O1s for Au, Pt and Ti electrodes, respectively. Au4f7/2
and Pt4f7/2 were chosen as references for the charge correction due to their non-oxidizing 10
behavior. On the other hand, O1s was taken as the reference for Ti because of its oxidizing
nature.
3. RESULTS & DISCUSSION
15 3.1 Electrical Impedance of the Electrodes
Following our previous study on the electrochemical impedance of Au, Ti and Pt electrodes
immersed in PBS solution up to 42 days at room temperature,1,3 we extracted their impedances as
a function of frequency only for “Day 1” and “Day 42” to investigate the fundamental
mechanism responsible for the change in the impedance of long-term immersed implantable 20
electrodes. Figure 2 shows the electrochemical impedance of Au, Ti and Pt electrodes immersed
in PBS solution for “Day 1” and “Day 42”. After 42 days of immersion, the impedances of the
electrodes were increased at higher frequencies (i.e., above 1 Hz) which is in contrast to the
impedance of Au electrode on nickel phosphorus/copper/PI.29 For Au, the cut-off frequency was
shifted to higher frequency. In the case of Ti and Pt, no significant cut-off frequency was 25
observed. The change of impedances for “Day 42” compared to “Day 1” may be correlated with
the chemical compositions and surface/interface behavior of the electrodes and their capacitive
interfacial behavior (β).1,3 For a pure capacitor, the value of β is 1. In our previous study,1 we
observed that the value of β for “Day 42” Au was 0.85, but for Ti and Pt, it was 0.25 and 0.38,
respectively. Also, the values of the constant phase element capacitance, K (at angular frequency, 30
ω = 1 rad s−1) for Ti and Pt were decreased significantly at “Day 42” as compared to Au. These
Page 7 of 34 Physical Chemistry Chemical Physics
Phy
sica
lChe
mis
try
Che
mic
alP
hysi
csA
ccep
ted
Man
uscr
ipt
Publ
ishe
d on
12
Mar
ch 2
015.
Dow
nloa
ded
by M
cMas
ter
Uni
vers
ity o
n 12
/03/
2015
12:
36:0
5.
View Article OnlineDOI: 10.1039/C4CP05899B

Page 7 of 33
significant drops in β and K values for Pt and Ti electrodes as compared to that of Au imply that
distinct mechanisms were associated with the oxidation and reactivity of the surface and
interfaces of the electrodes.1,42 Therefore, we focused only on the “Day 42” electrodes to identify
the surface wettability, surface and interface defects, and elemental compositions towards
understanding the increase of impedance. 5
3.2 Surface Wettability of the Electrodes
The water contact angle quantifies the wettability of a solid-state surface. Hence, this is critical
to understand the reactions of the PBS solution with the electrode surfaces. A higher contact
angle renders a hydrophobic surface. In contrast, a lower contact angle indicates a hydrophilic
surface.43 In general the demarcation line between these two surfaces is the contact angle in the 10
ranges of 30°-45°.44,31 Our result shows that the contact angle for Ti electrodes is 54°. After 2
min, the contact angle decreases to 45° (Figure 3). On the other hand, the contact angle for Pt
starts at 94˚ and after 2 minutes it decreases to 76˚. Also, the contact angle of Au starts at 72˚ and
becomes 66˚ after two minutes. Therefore, the contact angles of Pt and Au electrodes indicate
that they are more hydrophobic than Ti electrode. 15
Surface roughness and porosity control the water contact angle.45,31,49 In our previous study, we
found that the surface roughness of Au, Pt and Ti electrode on LCP before immersion in the PBS
solution was 3.18, 3.44, and 4.49 nm, respectively.1 After immersion in the PBS solution for 42
days, the roughness of Au and Ti was 11 and 6.03 nm, respectively. The surface roughness of Pt
was not measureable due to delamination from LCP. The higher contact angle for Au than that of 20
Ti may be due to its high surface roughness and adsorbed hydrophobic contaminants.46 One of
the examples of the contaminants would be Na that comes from the PBS solution. Also, the high
contact angle of Pt may be attributed to its high surface roughness. On the other hand, the low
surface roughness of Ti and its high reactivity to alkaline and oxides resulted in a reduced
contact angle with a high number of pores.47 The high surface roughness of the Pt electrode and 25
the high number of pores of the Ti electrode are responsible for their non-ideal (i.e., β<<1)
capacitive behavior.48
3.3 Surface and Interface Defects of the Electrodes
Figure 4(a) shows the SAM image for the top surface of an Au electrode that has been immersed 30
for 42 days in PBS solution. The image shows four things: (1) the white area is the electrode area
Page 8 of 34Physical Chemistry Chemical Physics
Phy
sica
lChe
mis
try
Che
mic
alP
hysi
csA
ccep
ted
Man
uscr
ipt
Publ
ishe
d on
12
Mar
ch 2
015.
Dow
nloa
ded
by M
cMas
ter
Uni
vers
ity o
n 12
/03/
2015
12:
36:0
5.
View Article OnlineDOI: 10.1039/C4CP05899B

Page 8 of 33
showing the surface topography, (2) the square black mark is the ion etching area resulting from
the depth profile experiments (as given in the section 3.3), (3) the big black dots due to
delamination of Au and (4) the small dots over the white area are a result of defects due to the
prolonged immersion in PBS solution.
Figure 4(b) shows the SAM image of the interface of the long-term immersed Au electrode. 5
Small holes are observed over the ion treated area. Ion etching induces these defects. Also, these
defects do not match with that of the surface. Therefore, these are likely to be artifacts rather
than interfacial pores. The big dots seen in Figure 4(a) are being shadowed in Figure 4(b). In
Figure 4(b), the identified white area is due to the bending of the specimen. The density of
defects in the ion etched and non-etched areas are identical. The defects in the ion-etched area 10
are more visible than that of the non-etched area. This may be attributed to the thinner layer of
Au caused by ion etching.
Figure 4(c) and (d) show the top surface of Pt electrode and interface of Pt/LCP, respectively.
The specimen surface shows Pt delamination. This delamination is due to the reactivity of the 15
adhesion layer with the PBS solution (i.e., sodium chloride, sodium phosphate, potassium
phosphate and potassium chloride). In comparison to the Au electrode, the Pt electrode shows a
smaller but higher density of pores. The majority of the pores are identical in size. The surface
pores are connected to that of the interface of Pt/LCP, as shown in Figure 4(d). However, a
couple of large sized defects are observed which could be some artifacts. 20
Figure 4(e) and (f) show the top surface of Ti electrode and interface of Ti/LCP, respectively.
The top surface of Ti shows few pores. The white area of the Ti/LCP interface (Figure 4(f)) is
due to bending of the specimen. The interfacial pores are observed all over the interfacial area.49
The sizes of the pores are identical to that of Au/LCP interface, but larger than that of Pt/LCP 25
interface.
The surface pores and oxides can be correlated to the hydrophilicity and hydrophobicity of the
surfaces. The lower contact angle of the Ti electrode could be due to the higher alkaline and
oxides on the surface. In contrast, the higher contact angle of the Pt electrode than that of Au and 30
Ti may result from the higher number of pores on the surface. Au also has a higher number of
Page 9 of 34 Physical Chemistry Chemical Physics
Phy
sica
lChe
mis
try
Che
mic
alP
hysi
csA
ccep
ted
Man
uscr
ipt
Publ
ishe
d on
12
Mar
ch 2
015.
Dow
nloa
ded
by M
cMas
ter
Uni
vers
ity o
n 12
/03/
2015
12:
36:0
5.
View Article OnlineDOI: 10.1039/C4CP05899B

Page 9 of 33
pores on the surfaces than that of Ti, which can be correlated with the higher contact angle and
higher surface roughness.48 On the other hand, the Ti/LCP interface has a greater number of
pores than that of Pt and Au. This behavior indicates that the bulk of the Ti electrode is also
prone to the alkaline and oxides as compared to Au and Pt resulting in higher pores in the Ti
electrode. These pores may be permeable to defects favoring diffusion of the electrode materials 5
into the LCP49 and resulting in varying defects across the depth of the electrodes. Therefore, the
elemental distribution of the electrodes could be associated with their oxidation and diffusion
behavior.
3.4 Elemental Analysis of the Electrodes
3.4.1 Depth Profile of Au Electrode 10
Elemental analysis of the surface and interface has been investigated to understand the role of the
chemical compositions on the changes of the electrochemical impedance of the electrode. Figure
5 shows the (a) wide scan spectra as a function of etching time and (b) the depth profile of Au
electrode dipped in PBS dipped for 42 days. The etching step was 60 s. The major peaks
identified were Au4f, Ti2p, O1s and C1s. Before etching (0 s), two strong peaks of Au4f, two 15
moderately strong peaks of Au4d and a weak peak of Au4p were observed. No carbon was
detected on the surface. Also, an Auger peak for NaKLL was observed. The peak positions for the
peak near O1s, and NaKLL were 514 and 262 eV, respectively.50,51 Since Au does not oxidize, the
peak near O1s could be due to the oxidation of NaKLL adsorbed on the surface. After 60 s of
etching, oxygen and Alkali disappeared. All the peaks for Au became stronger. After 1080 s of 20
etching, Ti appeared and Au became weaker. After 3000 s of etching, all other peaks disappeared
except Au4f, but remained as a weak peak. A strong peak for carbon appeared from LCP.
The detailed elemental distribution in atomic concentration as a function of etching time can be
seen in Figure 5(b). Before etching, Au was highest followed by oxygen. Au increased after 25
etching for 60 s and remained constant until 780 s. Then Au decreased and Ti increased with the
increase of etching time. Ti peaked at 1140 s. From 960 s, oxygen started appearing, then
increased and peaked at 1260 s. Carbon began to appear from 1140 s, then gradually increased,
and finally saturated around 2000 s. The depth profile indicates an interfacial region between 840
s and 1800 s that consists of curves for oxygen and Ti with almost Gaussian shapes, and 30
decreasing and increasing curves for Au and C, respectively. The curves for Ti and oxygen
Page 10 of 34Physical Chemistry Chemical Physics
Phy
sica
lChe
mis
try
Che
mic
alP
hysi
csA
ccep
ted
Man
uscr
ipt
Publ
ishe
d on
12
Mar
ch 2
015.
Dow
nloa
ded
by M
cMas
ter
Uni
vers
ity o
n 12
/03/
2015
12:
36:0
5.
View Article OnlineDOI: 10.1039/C4CP05899B

Page 10 of 33
indicate that the adhesion layer underneath the Au electrode was completely oxidized. Also, Au
was detected even after the complete elimination of the Ti and O signals. The disappearance of O
signal in Au electrode may indicate the replacement of oxygen from LCP due to the diffusion of
Au into LCP. Based on the estimated etching rate of Au electrode (i.e., ~0.22 nm/s), the interface
and diffusion depth would be 65 and 100 nm, respectively. This depth is larger than the thickness 5
of the adhesion layer (i.e., 30 nm). This discrepancy could be due to the different etching rate of
Au at the interfacial region where Au, Ti, C and O are diffused together. However, the cause of
the diffusion of Au into LCP is not known from this study.
In order to understand the route for the oxidation, we investigated the depth profile of the Au
electrode before immersing into PBS, as shown in Figure 5(c). The pristine Au electrode clearly 10
shows Au, Ti and C at the interfacial region without any oxidation. This indicates that the
interfacial oxides observed in the electrodes immersed for 42 days (Figure 5(b)) did not
originate from the fabrication process of the electrodes.
Literature has shown that adhesion layers with the types of deposited materials and chemical 15
elements for the electrodes control the surface and interface properties of the
electrodes/electrolytes.52,53,54 The effect of the Cr adhesion layer between gold electrodes and
quartz was investigated from the response of an electrochemical quartz crystal microbalance
(EQCM) in HClO4 and phosphate buffer.52 The gold electrode in the buffer solution was attacked
by oxygen chemisorption and further it was dissolved in the presence of a small amount of 20
chloride. Gold films were contaminated due to the poor Cr adhesion layer. Also, a significant
amount of extraneous metal atoms were present on the gold electrode surface. However, gold
electrode with a Ti adhesion layer showed negligible dissolution of gold. In an electrochemical
study of gold electrodes with anodic oxide films, it was found that two monolayers of anodically
formed gold oxides on the surface completely inhibited electrochemical redox reactions.53 25
Furthermore, gold electrode was electrically characterized with a thiol self-assembled monolayer
(SAM) for biosensing applications.54 A cyclic voltammogram on fresh gold electrode before and
after thiol deposition in PBS showed that the oxidation reaction at the interface was reduced after
thiol deposition and no further reduction was taken place.54 Therefore, these results support the
presence of alkali materials on Au electrodes and the absence of alkali inside the electrode 30
surface due to strong adhesion of Au and Ti with LCP.
Page 11 of 34 Physical Chemistry Chemical Physics
Phy
sica
lChe
mis
try
Che
mic
alP
hysi
csA
ccep
ted
Man
uscr
ipt
Publ
ishe
d on
12
Mar
ch 2
015.
Dow
nloa
ded
by M
cMas
ter
Uni
vers
ity o
n 12
/03/
2015
12:
36:0
5.
View Article OnlineDOI: 10.1039/C4CP05899B

Page 11 of 33
3.4.2 Depth Profile of Pt Electrode
Figure 6(a) shows the wide scan spectra during depth profile of Pt electrode immersed in PBS
for 42 days. The spectra contain Pt4f, Pt4d, Ti2p, O1s and C1s peaks. Before etching (0 s), peaks for
Pt4f, NaKLL (Auger) and O1s with identical intensities were observed. Also, Pt4d peak with lower 5
intensity compared to other peaks was observed. No carbon was detected on the surface. This
behavior is similar to that of the Au surface. Ar ion etching of the Pt surface for 60 s eliminated
the oxide and alkaline elements. In this step, a new peak for Pt4p and the high intensity peaks for
Pt4f and Pt4d were observed. After 960 s of etching, Ti and oxygen appeared, and Pt signals
became weaker than that of the 60 s etched surface. After 1860 s of etching, all other peaks 10
disappeared except C1s. This high intensity peak may be due to the carbon from LCP.
In the depth profile (Figure 6(b)), the atomic concentration of carbon before etching of the Pt
electrode was highest followed by oxygen and carbon. After etching the Pt electrode surface for
60 s, oxygen disappeared completely and Pt remained constant until 780 s. Then Pt started to
decrease with the increase of etching time. At that stage, Ti started to appear and peaked at 960 s. 15
After 840 s of etching, oxygen again appeared and peaked at 1080 s. Carbon appeared from 1020
s, then gradually increased, and finally saturated around 1700 s. The increase of Ti was followed
by the increase of oxygen and carbon, but Pt was decreased with the increase of etching time. All
the curves were intersected at an interfacial region between 780 and 1380 s. In this region, Ti and
oxygen showed curves with shapes of Gaussian distribution. Also, decreasing and increasing 20
curves for Pt and C, respectively, were observed. After that, Ti was terminated but Pt, C and O
were detected. The elimination of Ti in Pt electrode is similar to that in Au electrode. Also, while
the Pt detection in LCP is similar to that of Au, O signal was present in the LCP of Pt electrode.
This behavior may indicate diffusion of Pt into LCP. The interface and diffusion depth for Pt
would be 40 and 60 nm, respectively if we follow the similar calculation (i.e., etching rate = 0.22 25
nm/s) as Au. Again the observed depth is larger than the thickness of the adhesion layer (i.e., 30
nm) that may be attributed to the identical phenomena to that of Au electrode.
A few monolayers of the Pt surface (Figure 6(a)) were oxidized rather than the complete
oxidation of the inner layers (bulk). These results are identical to the cyclic voltammogram study
of Pt electrodes in PBS solution with dissolved oxygen at potential range of -1.0 V to +1.7 V.55 30
Formation and reduction of oxide and adsorption and desorption of hydrogen were observed. In
Page 12 of 34Physical Chemistry Chemical Physics
Phy
sica
lChe
mis
try
Che
mic
alP
hysi
csA
ccep
ted
Man
uscr
ipt
Publ
ishe
d on
12
Mar
ch 2
015.
Dow
nloa
ded
by M
cMas
ter
Uni
vers
ity o
n 12
/03/
2015
12:
36:0
5.
View Article OnlineDOI: 10.1039/C4CP05899B

Page 12 of 33
addition, oxidation of chloride ions, and oxidation and reduction of phosphate groups were
found.55 In another study, the electrochemistry of Pt electrodes in PBS showed the role of bovine
serum albumin (BSA) on oxygen reduction and electrode dissolution of Pt electrode.56 It was
found that irreversible O2 and H2 evolution occurs with the presence of BSA when applying
shorter pulses resulting in inhibited Pt dissolution. On the other hand, the inhibitory effect of O2 5
reduction may change with deoxygenated BSA-containing PBS. Identical results on the
formation and reduction of oxide and adsorption and desorption of hydrogen were reported in the
cyclic voltammogram study of Pt electrode in PBS in Ref.1 However, the XPS results from this
study on the surface oxidation of Pt do not support the hydrophobicity (contact angle is 94°)
identified in the water contact angle measurements. The high contact angle may be due to the 10
scattered surface oxide of Pt instead of being continuous. Therefore, the top layers of Pt
electrode act as hydrophobic surface.
In fact, the depth profile indicates isolated oxide layers of the adhesion layer at the interface
between the bulk (Figure 6(b)) and LCP. Also, only the Pt electrode of the three electrodes was
delaminated. Furthermore, the optical image of the Pt electrode shows higher delamination on 15
the areas other than that of the edges (Figure 6(b), Inset 2). This delamination may be associated
with the significant number of pores (Figure 4(c)) created through the scattered surface oxide
(Figure 6(a)). The chemical elements (Alkali) of the PBS solution permeate through the pores
and attack the oxidized adhesion layer of the Pt electrode system. On the other hand, the
adhesion layer in the Au electrode system without immersing in PBS (Figure 5(c)) was not 20
oxidized. Therefore, this study does not provide evidence whether the contact between the
electrolyte and the Ti adhesion layer causes the corrosion of Ti adhesion layer. In fact, the purity,
processing conditions and surface porosity of the electrodes may control the corrosion behavior.
3.4.3 Depth Profile of Ti Electrode 25
Figure 7(a) shows the wide scan spectra during depth profile of Ti electrode immersed in PBS
for 42 days. The spectra contain Ti2p, O1s and C1s peaks. Before etching (0 s), peaks for Ti2p,
NaKLL (Auger) and O1s were observed. Also, Ti3p and Ti3s peak with relatively lower intensity
compared to other peaks was observed. No carbon was detected on the surface. In contrast, Ti
had the penetrated Alkali throughout the adhesion and electrode to the LCP. Ar ion etching of 30
the Ti surface for 60 s could not eliminate the oxide and alkaline elements. After 1500 s of
Page 13 of 34 Physical Chemistry Chemical Physics
Phy
sica
lChe
mis
try
Che
mic
alP
hysi
csA
ccep
ted
Man
uscr
ipt
Publ
ishe
d on
12
Mar
ch 2
015.
Dow
nloa
ded
by M
cMas
ter
Uni
vers
ity o
n 12
/03/
2015
12:
36:0
5.
View Article OnlineDOI: 10.1039/C4CP05899B
Page 13 of 33
etching, the oxygen peak became stronger, and Ti peaks became weaker than that of the 60 s
etched surface. After 2400 s of etching, all other peaks disappeared except C1s. This peak with
high intensity may be due to carbon appearing from the LCP.
In the depth profile (Figure 7(b)), the atomic concentration of Ti was higher than that of oxygen 5
before etching and after 1500 s of etching. However, there was a gradual increase of oxygen and
vice versa for Ti until 1500 s of etching. After 1560 s of etching, the amount of oxygen became
higher than that of Ti and both the peaks became diminished. Carbon started appearing from 960
s, then gradually increased, and finally saturated around 2100 s. All the curves were intersected
between 1500 s and 1560 s. Since both the electrode layer and adhesion layer were made of Ti, 10
the interfacial region appears to be broader between 960 s and 2100 s. In this region, decreasing
and increasing of Ti and C, respectively, were observed. NaKLL was detected even after the
elimination of Ti (Figure 7(a)). This behavior may indicate diffusion of alkaline elements into
LCP. A similar calculation for the interface and diffusion depth of Ti (etching rate=0.20 nm/s) to
that of the Au and Pt electrodes shows that it would be about 84 and 100 nm, respectively. The 15
depth of the interface is larger than the thickness of the adhesion layer (i.e., 30 nm), which may
be due to the different etching rate of diffused Ti, C and O at the interfacial region.
The XPS results reveal continuous oxidation of the Ti electrode and the adhesion layer. This
behavior may be comparable to that in the extracellular electrolyte that is separated from the 20
electrode by a molecular layer of water adsorbed on the metal surface.35 In the literature, it is
shown that passive oxide film can be formed on Ti electrodes immersed in PBS with significant
increase of electrical resistance.24,57,58 The increase of the electrical resistance was reported due
to the passivation of oxides, growth of oxides and partial reduction of Ti.48,58 The depth profile
results also show that Ti diffuses in LCP. This diffusion may be due to the presence of pores in 25
the inner layers of the Ti electrode.24
Table 1 summarizes the chemical compositions of Au, Pt and Ti in atomic concentration at
different positions across the depth of the electrodes. The binding energy for the O1s peak on Au
surface was observed at 514 eV, which is different from that of Ti (531 eV) and Pt (533 eV). The 30
oxide peak on Au is due to the oxidation of NaKLL adsorbed on the surface.50,51 On the other
Page 14 of 34Physical Chemistry Chemical Physics
Phy
sica
lChe
mis
try
Che
mic
alP
hysi
csA
ccep
ted
Man
uscr
ipt
Publ
ishe
d on
12
Mar
ch 2
015.
Dow
nloa
ded
by M
cMas
ter
Uni
vers
ity o
n 12
/03/
2015
12:
36:0
5.
View Article OnlineDOI: 10.1039/C4CP05899B

Page 14 of 33
hand, the O1s peak for Ti and Pt was due to the oxidation of the electrode surfaces. A comparison
in the change of the chemical compositions for the Ti electrode at the surface, bulk, interface and
LCP shows that the electrode material gradually oxidizes and diffuses into LCP. In contrast, the
adhesion layer oxidizes in the Au and Pt electrodes that localize and stop diffusion of oxygen and
carbon from LCP. For all the electrodes, electrode materials were diffused into LCP. The 5
approximate widths of the interfacial regions for Au, Pt and Ti electrodes were 65, 40 and 84 nm,
respectively. The largest interfacial width for Ti is due to the ease of diffusion in the Ti
electrode system through the highest number of pores and its continuous oxidation. On the other
hand, the non-oxidation of Au and Pt electrodes and the localized oxidation of the adhesion layer
in their electrode systems were responsible for the narrower diffusion depth. 10
4. IMPEDANCE CHANGE MECHANISMS
Previously, the impedance change for the long-term-PBS-immersed (Day 42) Au, Pt and Ti
electrodes has been explained using the estimated parameters for the empirical constant (i.e., β)
and the double layer capacitance (i.e., Cdl = K) of the constant phase element as described in 15
equations (1) and (2).1,3,42
(1)
€
fc =1
2πReK
(2)
20
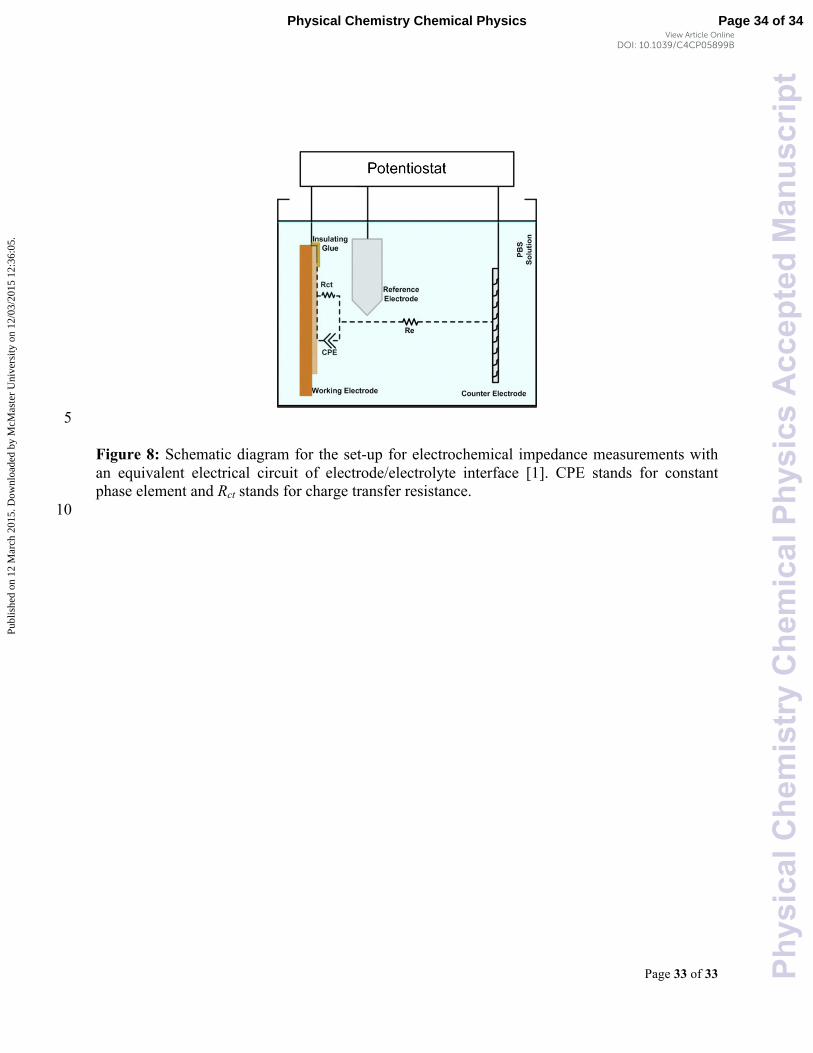
where, ZCPE, ω, fc, and Re are the constant phase element (CPE) impedance, angular frequency,
cut-off frequency and electrolyte resistance, respectively (Figure 8). The β and K parameters
deviated from the ideal values due to the hydrolytic attack to the electrodes. However, the
underlying physical and chemical mechanisms for the impedance change were not known. The
surface wettability, surface-interface defects and elemental depth profile results discussed in this 25
article provide us with useful insights to the mechanisms. While the impedances in the lower
frequencies (below 1.2 Hz for Au, 1.3 Hz for Ti and 12 Hz for Ti) changed into lower values, the
impedances at higher frequencies changed into higher values compared with that of “Day 1”.
Page 15 of 34 Physical Chemistry Chemical Physics
Phy
sica
lChe
mis
try
Che
mic
alP
hysi
csA
ccep
ted
Man
uscr
ipt
Publ
ishe
d on
12
Mar
ch 2
015.
Dow
nloa
ded
by M
cMas
ter
Uni
vers
ity o
n 12
/03/
2015
12:
36:0
5.
View Article OnlineDOI: 10.1039/C4CP05899B

Page 15 of 33
The changes of the impedance in the lower and higher frequency ranges are attributed to the
behavior of surface, bulk and interface of the electrodes. The total impedance of the equivalent
circuit for the model shown in Figure 8 can be expressed by4,
€
Ztotal = Re + Rct ||1
jωCdl
= Re + Rct
1+ jω ReRctCdl
Re + Rct
⎛
⎝ ⎜
⎞
⎠ ⎟
1+ jω ReRct( )
⎛
⎝
⎜ ⎜ ⎜ ⎜
⎞
⎠
⎟ ⎟ ⎟ ⎟
(3)
At lower frequencies, the double layer capacitance (Cdl) behaves as an open circuit (from 5
equation 3). Therefore, for “Day 1”, the equivalent impedance (Ztotal) of the electrodes at lower
frequencies becomes approximately Re + Rct. For “Day 42”, the oxidation behavior in the
electrode systems may affect Cdl that can reduce ZCPE. This behavior is supported by the distinct
parameters of β and K for Au, Pt and Ti electrodes. While β and K values for the Au electrode
after 42 days immersion in PBS were not significantly changed, these values for the Pt and Ti 10
electrodes were considerably reduced.1 Also, Rct is dominant at lower frequencies and it is lower
than ZCPE for “Day 42”. Then the resulting parallel impedance of Rct and ZCPE for “Day 42” is
reduced than that of “Day 1” at lower frequencies. It is worth noting that the value of Re for all
the electrodes varies between 18 and 55.2 Ω3 and may remain unchanged with immersion time.
Therefore, the impedance of the electrodes at lower frequencies for “Day 42” is lower than that 15
of “Day 1”. At high frequencies, on the other hand, Cdl dominates the impedance. Then the
equivalent impedance of the electrodes at high frequencies is approximately the electrolyte
resistance (Re) in series with ZCPE.
Although water contact angle is dependent on the surface behavior such as surface roughness and 20
adsorbed contaminants, it does not have a straightforward relationship with the impedance of the
electrodes. The high water contact angle of Au may be attributed to its non-oxidation and high
surface roughness.1,3 These behaviors, in addition to the adsorbed surface contaminants, NaKLL
(Figure 5(a)) and diffused Au into LCP may be responsible for the change of the impedance of
Au. The increased impedance for Pt electrode may be associated with the large number of pores. 25 31,45,47,49 Also, the interfacial oxidation of Ti (adhesion layer), the delamination of Pt electrode as
well as the diffusion of Pt into LCP in the Pt electrode system may be attributed to the change of
the impedance. In fact, the oxidation of the adhesion layer in all the electrode systems, confirmed
Page 16 of 34Physical Chemistry Chemical Physics
Phy
sica
lChe
mis
try
Che
mic
alP
hysi
csA
ccep
ted
Man
uscr
ipt
Publ
ishe
d on
12
Mar
ch 2
015.
Dow
nloa
ded
by M
cMas
ter
Uni
vers
ity o
n 12
/03/
2015
12:
36:0
5.
View Article OnlineDOI: 10.1039/C4CP05899B

Page 16 of 33
by XPS depth profiles, may cause increased impedance of all the electrodes.
Ti showed similar change in the impedance to that of Pt due to the large number of pores that are
infused from the surface through the interface to the LCP. On the other hand, the lowest contact
angle of Ti electrode was due to its continuous oxides. Ti electrode showed similar behavior of 5
the impedance to that of Pt due to the continuous oxidation from the electrode into the interfacial
region and the presence of pores through the interface. Therefore, the distinct behavior of the
impedances for different electrodes at higher frequencies is due to the influence of the oxidation
that affected the double layer capacitance associated with the frequency of electrical signal.
10
5. CONCLUSION
The electrochemical impedances of long-term immersed Au, Pt and Ti electrodes in PBS
solution decreased at lower frequencies, but increased at higher frequencies compared with those
of the short-term immersed electrodes. The increased impedance of the Au electrode could not
be explained in terms of its oxide-free surface and pore-free interface. This increase could be due 15
to the oxidation of the adhesion layer in the Au electrode system. For Pt, the increased
impedance may be associated with the largest number of pores among the electrodes, the
oxidation of the adhesion layer, the delamination of the electrode or the diffusion of the electrode
into LCP. The alkali ion (sodium) in the PBS solution might permeate through the pores and
attack the oxidized Ti adhesion layer, resulting in the delamination of the Pt electrode. Similar 20
changes in the impedance for the Ti electrode to that of Pt were due to a larger number of pores
than that of Au infused from the surface through the interface to LCP. The oxidation of the
adhesion layer identified from the XPS spectra for all the electrode systems considerably
influences the increase of the impedances. The adhesion layer was continuously oxidized only
for the Ti electrode. Also, while alkali ion (sodium) was present only on the surfaces of Au and 25
Pt electrodes, it penetrated the Ti electrode from the surface all the way to the LCP. The XPS
depth profile indicates diffusion of all the electrode materials into the LCP. Further research is
needed to investigate the mechanisms for the diffusion. In summary, the oxidation of the
adhesion layer, the formation of pores on the surface and interface and the diffusion of the
electrode materials into the electrodes and the substrate influence not only the impedance of the 30
implantable electrodes, but also influences its charge transfer characteristics.
Page 17 of 34 Physical Chemistry Chemical Physics
Phy
sica
lChe
mis
try
Che
mic
alP
hysi
csA
ccep
ted
Man
uscr
ipt
Publ
ishe
d on
12
Mar
ch 2
015.
Dow
nloa
ded
by M
cMas
ter
Uni
vers
ity o
n 12
/03/
2015
12:
36:0
5.
View Article OnlineDOI: 10.1039/C4CP05899B

Page 17 of 33
ACKNOWLEDGMENT
This research is supported by Discovery Grants from the Natural Science and Engineering
Research Council (NSERC) of Canada, an infrastructure grant from the Canada Foundation for
Innovation, an Ontario Research Fund for Research Excellence Funding Grant, a FedDev of
Southern Ontario grant, the Canada Research Chair program, and grants from NCE IC-5
IMPACTS and NSERC Strategic Network Res’Eau. The authors acknowledge Saba Mohtashami
and Fangfang Zhang for their help in the fabrication of the electrodes and the measurements of
the electrochemical impedance, water contact angle and X-ray photoelectron spectroscopy. The
authors also acknowledge Professors Thomas E. Doyle and Joey R. Kish of McMaster
University for their contributions to this work. 10
REFERENCES
1 M.M.R. Howlader, T.E. Doyle, S. Mohtashami and J.R. Kish, Sensors and Actuators B: Chemical, 2013, 178, 132–139.
2 K. Wang, C. Liu and D. M. Durand, IEEE Trans Biomed Engineering, 2009, 56, 6–14. 15 3 S. Mohtashami, Electrochemical Properties of Flexible Electrodes for Implanted
Neuromuscular Excitation Applications, M.A.Sc Thesis, McMaster University, 2011. 4 S. Mohtashamia, M. M. R. Howlader and T. Doyle, ECS Trans., 2011, 35, 23-33. 5 M. W. Shinwari, M. J. Deen and D. Landheer, Microelectronics Reliability, 2007, 47, 2025–
2057. 20 6 S. -Ling Wu, et al., Electrochimica Acta, 2014, 131, 3–12. 7 L. A. Geddes and R. Roeder, Annals of Biomedical Engineering, 2003, 31, 879–890. 8 M. W. Shinwari and M. J. Deen, Journal of Electrochemical Society, 2011, 158, J189–J194. 9 M. W. Shinwari, M. J. Deen, E. B. Starikov and G. Cuniberti, Advanced Functional
Materials, 2010, 20, 1865–1883. 25 10 B. Rubehn and T. Stieglitz, Biomaterials, 2010, 31, 3449–3458. 11 C. Lin, Y. Lee, S. Yeh and W. Fang, Biosensors and Bioelectronics, 2009, 24, 2791–2797. 12 N. Chou, S. Yoo and S. Kim, IEEE Transactions on Neural Systems and Rehabilitation
Engineering, 2013, 21, 554–553. 13 Y. Qin, M. M. R. Howlader, M. J. Deen, Y. M. Haddara and P. R. Selvaganapathy, Sensors 30
and Actuators B: Chemical, 2014, 202, 758–778. 14 K. Jayaraj and B. Farrell, Advancing Mincroelectronics Magazine, 1998, 25, 15–18. 15 T. Suga, A. Takahashi, M. Howlader, K. Saijo and S. Oosawa, POLYTRONIC 2002 Second
International IEEE Conference on Polymers and Adhesives in Microelectronics and Photonics, Zalaegerszeg, Hungary, 2002, pp. 177–182. 35
16 M. M. R. Howlader, T Suga, A Takahashi, K Saijo, S Ozawa and K Nanbu, Journal of Materials Science, 2005, 40, 3177–3184.
17 M. M. R. Howlader, M. Iwashita, K. Nanbu, K. Saijo and T. Suga, IEEE Transactions on Advanced Packaging, 2005, 28, 495–502.
Page 18 of 34Physical Chemistry Chemical Physics
Phy
sica
lChe
mis
try
Che
mic
alP
hysi
csA
ccep
ted
Man
uscr
ipt
Publ
ishe
d on
12
Mar
ch 2
015.
Dow
nloa
ded
by M
cMas
ter
Uni
vers
ity o
n 12
/03/
2015
12:
36:0
5.
View Article OnlineDOI: 10.1039/C4CP05899B

Page 18 of 33
18 S. Bauer, P. Schmuki, K. Mark and J. Park, Progress in Materials Science, 2013, 58, 261–326.
19 J. D. Weiland, D. J. Anderson and M. S. Humayun, IEEE Transactions on Biomedical Engineering, 2002, 49, 1574 –1579.
20 E. Jan, J. L. Hendricks, V. Husaini, S. M. Richardson-Burns, A. Sereno, D. C. Martin and N. 5 A. Kotov, Nano Letters, 2009, 9, 4012–4018.
21 A. M. Dymond, IEEE Transactions Biomedical Engineering, 1976, 23, 274–280. 22 K. Kang, I. S. Choi and Y. Nam, Biomaterials, 2011, 32, 6374–6380. 23 F. Keohan, X. F. Wei, A. Wongsarnpigoon, E. Lazaro, J. E. Darga and W. M. Grill, Journal
of Biomaterials Science, 2007, 18, 1057–1073. 10 24 S. A. Fadl-allaha and Q. Mohsen, Applied Surface Science, 2010, 256, 5849–5855. 25 S. Musa, D. R. Rand, D. J. Cott, J. Loo, C. Bartic, W. Eberle, B. Nuttin and G. Borghs, ACS
Nano, 2012, 6, 4615–4628. 26 S. L. Morton, M. L. Daroux and J. T. Mortimer, Electrochem. Soc. J., 1994, 141, 122-130. 27 J. Riistama and J. Lekkala, Proceedings of IEEE Engineering Medical Biology Society 2006, 15
pp. 6021–4. 28 H. Gensler, R. Sheybani, P.-Y. Li, R. Lo, S. Zhu, K.-T. Yong, I. Roy, P. N. Prasad, R.
Masood, U. K. Sinha and E. Meng, IEEE 23rd International Conf. on Micro-Electro- Mechanical Systems (MEMS), 2010, pp. 23–26.
29 A. Bozkurt, IEEE Topical Conf. on Biomedical Wireless Technologies, Networks, and 20 Sensing Systems (BioWireleSS), 2012, pp. 45–48.
30 A. S. Widge, Self-Assembled Monolayers of Polythiophene “Molecular Wires”: A New Electrode Technology for Neuro-Robotic Interfaces, Doctoral Thesis, CMU-RI-TR-07-03.
31 A. Alam, M. M. R. Howlader and M. Deen, Journal of Micromechanics and 25 Microengineering, 2014, 24, 035010–035024.
32 S.B. Hall, E.A. Khudaish and A.L. Hart, Electrochimica Acta, 1998, 43, 2015–2024. 33 S. Andreescu, D. Andreescu and O.A. Sadik, Electrochemistry Communications, 2003, 5,
681–688. 34 S. Tamilselvi, R. Murugaraj and N. Rajendran, Materials and Corrosion, 2007, 58, 113–120. 30 35 A. B. Majji, M. S. Humayun, J. D. Weiland, S. Suzuki, S. A. D’Anna and E. de Juan,
Investigative Ophthalmology and Visual Science, 1999, 40, 2073–2081. 36 A. Santos, M. J. Deen and L. F. Marsal, Nanotechnology, 2015, 26, 042001 (20pp). 37 M. J. Deen and F. Pascal, Journal of Materials Science: Materials in Electronics, 2006, 17,
549–575. 35 38 M. M. R. Howlader, J. G. Wang and M. J. Kim, Materials Letters, 2010, 64, 445–448. 39 A. Dimitrov, P. Kralchevsky, A. Nikolov, H. Noshi and M. Matsumoto, Journal of Colloid
Interface Science, 1991, 145, 279–282. 40 Sonoscan, Sonoscan GEN5 C-SAM Operation & Maintenance Manual. 2007. 41 CasaXPS Manual 2.3.15 Rev 1.2. Link: 40
http://www.casaxps.com/ebooks/XPS%20AES%20Book%20new%20margins%20rev%201.2%20for%20web.pdf
42 J. -B. Jorcin, M.E. Orazem, N. Pebere and B. Tribollet, Electrochimica Acta, 2006, 51, 1473–1479.
43 M. M. R Howlader, G. Kagami, S. H. Lee, J. G. Wang, M. Kim and A. Yamauchi, Journal of 45 Microelectromechanical Systems, 2010, 19, 840–848.
Page 19 of 34 Physical Chemistry Chemical Physics
Phy
sica
lChe
mis
try
Che
mic
alP
hysi
csA
ccep
ted
Man
uscr
ipt
Publ
ishe
d on
12
Mar
ch 2
015.
Dow
nloa
ded
by M
cMas
ter
Uni
vers
ity o
n 12
/03/
2015
12:
36:0
5.
View Article OnlineDOI: 10.1039/C4CP05899B

Page 19 of 33
44 M. G. Kibria, F. Zhang, T. H. Lee, M. J. Kim and M. M. R. Howlader, Nanotechnology 2010, 21, 134011 (10 pp).
45 H. Nakae, R. Inui, Y. Hirata, H. Saito, Acta Materialia, 1998, 46, 2313–2318. 46 K. W. Bewig, W. A. Zisman, Journal of Physical Chemistry, 1965, 69, 4238–4242. 47 N. Eliaz, S. Shmueli, I. Shur, D. Benayahu, D. Aronov and G. Rosenman, Acta 5
Biomaterialia, 2009, 5, 3178–3191. 48 A. Norlin, J. Pan and C. Leygrafa, Journal of the Electrochemical Society, 2005, 152, J7-J15. 49 C. Liu, Q. Bi, A. Leyland and A. Matthews, Corrosion Science, 2003, 45, 1257-1273. 50 A.U. Alam, M. M. R. Howlader and M. J. Deen, ECS Journal of Solid State Science and
Technology, 2013, 2, 515-523. 10 51 M. M. R. Howlader, F. Zhang and M. J. Deen, Nanotechnology, 2013, 24, 315301 (8pp). 52 J. Hoogvliet and W. Bennekom, Electrochimica Acta, 2001, 47, 599–611. 53 U. Oesch and J. Janata, Electrochimica Acta, 1983, 28, 1247–1253. 54 A. Tlili, A. Abdelghani, S. Hleli and M. A. Maaref, Sensors 2004, 4, 105–114. 55 E. M. Hudak, J. T. Mortimer and H. B. Martin, Journal of Neural Engineering, 2010, 7, 15
026005 (7 pp). 56 S. Musa, D. R. Rand, C. Bartic, W. Eberle, B. Nuttin and G. Borghs, Analytical Chemistry,
2011, 83, 4012–4022. 57 J. Pan, D. Thierry and C. Leygraft, Electrochimica Acta, 1996, 41, 1143–l153. 58 J. Pan, D. Thierry and C. Leygraft, Journal of Biomedical Materials Research, 1994, 28, 20
113–122.
Page 20 of 34Physical Chemistry Chemical Physics
Phy
sica
lChe
mis
try
Che
mic
alP
hysi
csA
ccep
ted
Man
uscr
ipt
Publ
ishe
d on
12
Mar
ch 2
015.
Dow
nloa
ded
by M
cMas
ter
Uni
vers
ity o
n 12
/03/
2015
12:
36:0
5.
View Article OnlineDOI: 10.1039/C4CP05899B

Page 20 of 33
TABLE AND FIGURE CAPTIONS
Table 1: Summary of the chemical compositions of gold (Au), platinum (Pt) and titanium (Ti) in atomic percentage at different positions across the depth of the electrodes. 5 10 Figure 1: (a) Schematic diagram of the deposited electrode on the LCP substrate. (b) Peak area quantification method for atomic percentage calculation from XPS wide scan spectra using CasaXPS [41]. (c) Focusing diagram in Scanning Acoustic Microscopy (SAM) [40]. (d) Contact angle measurement using sessile drop technique. 15 Figure 2: Electrochemical impedance of (a) Au, (b) Pt and (c) Ti electrodes immersed in PBS solution for “Day 1” and “Day 42” as a function of frequency [1]. The diameters of the electrodes are 8 mm. 20 Figure 3: Contact angle variation with time for the Au, Pt and Ti electrodes after immersing for 42 days. Figure 4: Scanning acoustic microscope (SAM) images of (a) top surface of Au on LCP, (b) interface of Au/LCP, (c) top surface of Pt on LCP, (d) interface of Pt/LCP, (e) top surface of Ti 25 on LCP, and (d) interface of Ti/LCP. Figure 5: (a) XPS wide scan spectra during etching for Au electrode. (b) Depth profile for Au electrode, with optical image of the etched Au electrode. The white area of the optical image on the inset shows the top surface of the Ar-ion etched Au electrode. (c) Depth profile for pristine 30 Au electrode (i.e., without PBS immersion). Figure 6: (a) XPS wide scan spectra during etching for Pt electrode. (b) Depth profile for Pt electrode with optical image of the etched Pt electrode. The white area of the optical image on the inset 1 shows the top surface of the Ar-ion etched Pt electrode. Inset 2 shows the 35 delamination of Pt electrode after immersion in PBS. Figure 7: (a) XPS wide scan spectra during etching for Ti electrode. (b) Depth profile for Ti electrode with optical image of the etched Ti electrode. The white area of the optical image on the inset shows the top surface of the Ar-ion etched Ti electrode. 40 Figure 8: Schematic diagram for the set-up for electrochemical impedance measurements with an equivalent electrical circuit of electrode/electrolyte interface [1]. CPE stands for constant phase element and Rct stands for charge transfer resistance.
Page 21 of 34 Physical Chemistry Chemical Physics
Phy
sica
lChe
mis
try
Che
mic
alP
hysi
csA
ccep
ted
Man
uscr
ipt
Publ
ishe
d on
12
Mar
ch 2
015.
Dow
nloa
ded
by M
cMas
ter
Uni
vers
ity o
n 12
/03/
2015
12:
36:0
5.
View Article OnlineDOI: 10.1039/C4CP05899B

Page 21 of 33
Table 1. Summary of the chemical compositions of Au, Pt and Ti in atomic percentage at different positions across the depth of the electrodes.
Atomic percentage (%) of elements at
positions with respect to electrodes Electrodes Elements Binding energy (eV)
Surface Bulk Interface LCP
Diffusion of
adhesion layer (Ti) into LCP
Electrode diffusion into LCP
Interface (nm)
Diffusion (nm) Remarks
O1s 514 14 0 0 - 26 0 C1s 284 0 0 0!90 93 - 97
Ti2p3/2 445 0 0 8-59 0 Au4f7/2 85 86 100 92!6 3 - 7
Au
NaKLL 262 Yes None None None
None Yes 65 100 Discontinuous
adhesion layer
O1s 533 59 0 2 - 24 6!3 C1s 285 9 0 0!90 90!95
Ti2p3/2 455 0 0 3 - 44 3!2 Pt4f7/2 71 32 100 91!2 1-2
Pt
NaKLL 265 Yes None None None
Yes Yes 40 60 Discontinuous
adhesion layer
O1s 531 21 18!38 37!7 ~7 C1s 285 0 0 4!89 ~88
Ti2p3/2 456 79 81!62 59!4 ~5 Ti
NaKLL 270 Yes Yes Yes None
Yes Yes 85 100 Continuous
adhesion layer
5
Page 22 of 34Physical Chemistry Chemical Physics
Phy
sica
lChe
mis
try
Che
mic
alP
hysi
csA
ccep
ted
Man
uscr
ipt
Publ
ishe
d on
12
Mar
ch 2
015.
Dow
nloa
ded
by M
cMas
ter
Uni
vers
ity o
n 12
/03/
2015
12:
36:0
5.
View Article OnlineDOI: 10.1039/C4CP05899B
Page 22 of 33
5
(a)
(b)
Page 23 of 34 Physical Chemistry Chemical Physics
Phy
sica
lChe
mis
try
Che
mic
alP
hysi
csA
ccep
ted
Man
uscr
ipt
Publ
ishe
d on
12
Mar
ch 2
015.
Dow
nloa
ded
by M
cMas
ter
Uni
vers
ity o
n 12
/03/
2015
12:
36:0
5.
View Article OnlineDOI: 10.1039/C4CP05899B

Page 23 of 33
5
10
20 30 40 45 Figure 1: (a) Schematic diagram of the deposited electrode on the LCP substrate. (b) Peak area quantification method for atomic percentage calculation from XPS wide scan spectra using CasaXPS [41], (c) Focusing diagram in Scanning Acoustic Microscopy (SAM) [40], and (d) Contact angle measurement using sessile drop technique. 50
!
(d)
Page 24 of 34Physical Chemistry Chemical Physics
Phy
sica
lChe
mis
try
Che
mic
alP
hysi
csA
ccep
ted
Man
uscr
ipt
Publ
ishe
d on
12
Mar
ch 2
015.
Dow
nloa
ded
by M
cMas
ter
Uni
vers
ity o
n 12
/03/
2015
12:
36:0
5.
View Article OnlineDOI: 10.1039/C4CP05899B

Page 24 of 33
5
(a)
(b)
Page 25 of 34 Physical Chemistry Chemical Physics
Phy
sica
lChe
mis
try
Che
mic
alP
hysi
csA
ccep
ted
Man
uscr
ipt
Publ
ishe
d on
12
Mar
ch 2
015.
Dow
nloa
ded
by M
cMas
ter
Uni
vers
ity o
n 12
/03/
2015
12:
36:0
5.
View Article OnlineDOI: 10.1039/C4CP05899B

Page 25 of 33
Figure 2: Electrochemical interfacial impedance of (a) Au, (b) Pt and (c) Ti electrodes of 8 mm 5 diameter surface area as a function of frequency at Day 1 and Day 42 [1].
(c)
Page 26 of 34Physical Chemistry Chemical Physics
Phy
sica
lChe
mis
try
Che
mic
alP
hysi
csA
ccep
ted
Man
uscr
ipt
Publ
ishe
d on
12
Mar
ch 2
015.
Dow
nloa
ded
by M
cMas
ter
Uni
vers
ity o
n 12
/03/
2015
12:
36:0
5.
View Article OnlineDOI: 10.1039/C4CP05899B

Page 26 of 33
Figure 3: Contact angle variation for gold (Au), platinum (Pt) and titanium (Ti) electrodes after
immersing for 42 days.
Page 27 of 34 Physical Chemistry Chemical Physics
Phy
sica
lChe
mis
try
Che
mic
alP
hysi
csA
ccep
ted
Man
uscr
ipt
Publ
ishe
d on
12
Mar
ch 2
015.
Dow
nloa
ded
by M
cMas
ter
Uni
vers
ity o
n 12
/03/
2015
12:
36:0
5.
View Article OnlineDOI: 10.1039/C4CP05899B

Page 27 of 33
Figure 4: Scanning acoustic microscope (SAM) images of (a) top surface of Au on LCP, (b) interface of Au/LCP, (c) top surface of Pt on LCP, (d) interface of Pt/LCP, (e) top surface of Ti on LCP, and (d) interface of Ti/LCP. 5
Page 28 of 34Physical Chemistry Chemical Physics
Phy
sica
lChe
mis
try
Che
mic
alP
hysi
csA
ccep
ted
Man
uscr
ipt
Publ
ishe
d on
12
Mar
ch 2
015.
Dow
nloa
ded
by M
cMas
ter
Uni
vers
ity o
n 12
/03/
2015
12:
36:0
5.
View Article OnlineDOI: 10.1039/C4CP05899B

Page 28 of 33
5
(b)
(a)
Page 29 of 34 Physical Chemistry Chemical Physics
Phy
sica
lChe
mis
try
Che
mic
alP
hysi
csA
ccep
ted
Man
uscr
ipt
Publ
ishe
d on
12
Mar
ch 2
015.
Dow
nloa
ded
by M
cMas
ter
Uni
vers
ity o
n 12
/03/
2015
12:
36:0
5.
View Article OnlineDOI: 10.1039/C4CP05899B

Page 29 of 33
Figure 5: (a) XPS wide scan spectra during etching for Au electrode. (b) Depth profile for Au electrode, with optical image of the etched Au electrode. The white area of the optical image on 5 the inset shows the top surface of the Ar-ion etched Au electrode. (c) Depth profile for pristine Au electrode (i.e., without PBS immersion).
(c)
Page 30 of 34Physical Chemistry Chemical Physics
Phy
sica
lChe
mis
try
Che
mic
alP
hysi
csA
ccep
ted
Man
uscr
ipt
Publ
ishe
d on
12
Mar
ch 2
015.
Dow
nloa
ded
by M
cMas
ter
Uni
vers
ity o
n 12
/03/
2015
12:
36:0
5.
View Article OnlineDOI: 10.1039/C4CP05899B

Page 30 of 33
Figure 6: (a) XPS wide scan spectra during etching for Pt electrode. (b) Depth profile for Pt electrode with optical image of the etched Pt electrode. The white area of the optical image on 5
(a)
(b)
Inset 2
Inset 1
Page 31 of 34 Physical Chemistry Chemical Physics
Phy
sica
lChe
mis
try
Che
mic
alP
hysi
csA
ccep
ted
Man
uscr
ipt
Publ
ishe
d on
12
Mar
ch 2
015.
Dow
nloa
ded
by M
cMas
ter
Uni
vers
ity o
n 12
/03/
2015
12:
36:0
5.
View Article OnlineDOI: 10.1039/C4CP05899B

Page 31 of 33
the inset 1 shows the top surface of the Ar-ion etched Pt electrode. Inset 2 shows the delamination of Pt electrode after immersion in PBS.
Page 32 of 34Physical Chemistry Chemical Physics
Phy
sica
lChe
mis
try
Che
mic
alP
hysi
csA
ccep
ted
Man
uscr
ipt
Publ
ishe
d on
12
Mar
ch 2
015.
Dow
nloa
ded
by M
cMas
ter
Uni
vers
ity o
n 12
/03/
2015
12:
36:0
5.
View Article OnlineDOI: 10.1039/C4CP05899B

Page 32 of 33
10
20
30 35 45
55
65
75 Figure 7: (a) XPS wide scan spectra during etching for Ti electrode. (b) Depth profile for Ti electrode with optical image of the etched Ti electrode. The white area of the optical image on the inset shows the top surface of the Ar-ion etched Ti electrode. 85
!
(b)
Page 33 of 34 Physical Chemistry Chemical Physics
Phy
sica
lChe
mis
try
Che
mic
alP
hysi
csA
ccep
ted
Man
uscr
ipt
Publ
ishe
d on
12
Mar
ch 2
015.
Dow
nloa
ded
by M
cMas
ter
Uni
vers
ity o
n 12
/03/
2015
12:
36:0
5.
View Article OnlineDOI: 10.1039/C4CP05899B
Page 33 of 33
5
Figure 8: Schematic diagram for the set-up for electrochemical impedance measurements with an equivalent electrical circuit of electrode/electrolyte interface [1]. CPE stands for constant phase element and Rct stands for charge transfer resistance. 10
Page 34 of 34Physical Chemistry Chemical Physics
Phy
sica
lChe
mis
try
Che
mic
alP
hysi
csA
ccep
ted
Man
uscr
ipt
Publ
ishe
d on
12
Mar
ch 2
015.
Dow
nloa
ded
by M
cMas
ter
Uni
vers
ity o
n 12
/03/
2015
12:
36:0
5.
View Article OnlineDOI: 10.1039/C4CP05899B