optimal strategies for electrical stimulation with implantable ...
188
OPTIMAL STRATEGIES FOR ELECTRICAL STIMULATION WITH IMPLANTABLE NEUROMODULATION DEVICES Steffen Eickhoff, MSc, BEng A thesis submitted in partial fulfilment of the requirements of Liverpool John Moores University for the degree of Doctor of Philosophy This research programme was carried out in collaboration with MED-EL Medical Electronics July 2020
-
Upload
khangminh22 -
Category
Documents
-
view
0 -
download
0
Transcript of optimal strategies for electrical stimulation with implantable ...

OPTIMAL STRATEGIES FOR ELECTRICAL
STIMULATION WITH IMPLANTABLE
NEUROMODULATION DEVICES
Steffen Eickhoff, MSc, BEng
A thesis submitted in partial fulfilment of the requirements of
Liverpool John Moores University for the degree of
Doctor of Philosophy
This research programme was carried out in collaboration with
MED-EL Medical Electronics
July 2020

i
DECLARATION
This dissertation was written by me and is the result of my own work. It has not been
previously submitted, in part or whole, to any university of institution for any degree,
diploma, or other qualification.
Signed:______________________________________________________________
Steffen Eickhoff, MSc, BEng
Liverpool, 07.07.2020
ii
ABSTRACT
Electrical stimulation (ES) is a neuromodulation technique that uses electrical pulses to
modulate the activity of excitable cells to provide a therapeutic effect. Many past and
present ES applications use rectangular current waveforms that have been well studied
and are easy to generate. However, an extensive body of scientific literature describes
different stimulation waveforms and their potential benefits. A key measure of
stimulation performance is the amplitude required to reach a certain percentual threshold
of activation, as it directly influences important ES parameters such as energy
consumption per pulse and charge density. The research summarized in this thesis was
conducted to re-examine some of the most-commonly suggested ES waveform variations
in a rodent in-vivo nerve-muscle preparation. A key feature of our experimental model is
the ability to test stimulation with both principal electrode configurations, monopolar and
bipolar, under computer control and in randomized order. Among the rectangular
stimulation waveforms, we investigated the effect of interphase gaps (IPGs), asymmetric
charge balanced pulses, and subthreshold conditioning pre-pulses. For all these
rectangular waveforms, we surprisingly observed opposite effects in the monopolar
compared to the bipolar stimulation electrode configuration. The rationale for this
consistent observation was identified by analyzing electroneurograms (ENGs) of the
stimulated nerve. In the monopolar configuration, biphasic pulses first evoked compound
action potentials (eCAPs) as a response to the first field transition. In the bipolar electrode
configuration, that is the mode in which many contemporary ES devices, including the
envisioned miniaturized electroceuticals, operate, eCAPs were first elicited at the return
electrode in response to the middle field transition of biphasic pulses. As all rectangular
waveform variations achieve their effect by modulating the amplitude and timing of
cathodic (excitatory) and anodic (inhibitory) field transitions, the inverted current profile
at the bipolar return electrode explains these observed opposite effects.
Further we investigated the claimed benefits of non-rectangular, Gaussian stimulation
waveforms in our animal model. In our study only moderate energy savings of up to 17%
were observed, a finding that is surprising in light of the predicted range of benefits of up
to 60% energy savings with this novel waveform in question. Additionally, we identified
a major disadvantage in terms of substantially increased maximum instantaneous power
requirements with Gaussian compared to rectangular stimuli.

iii
We examined physiological changes in fast twitch muscle following motor nerve injury,
and optimal stimulation strategies for activation of denervated muscle. While a high
frequency doublet has previously been identified to enhance stimulation efficiency of
healthy fast twitch muscle, an effect that has been termed “doublet effect”, we here show
that this benefit is gradually lost in muscle during denervation. Lastly, the effect of long
duration stimulation pulses, that are required to activate denervated muscle, on nerve is
examined. We show that these long pulses can activate nerves up to three times when the
three field transition within the biphasic pulses are separated by more than (i.e., when the
phase width is above) the refractory period of that nerve. This observation challenges
state-of-the-art computational models of extracellular nerve stimulation that do not seem
to predict such multiple activations. Further, an undesired up to threefold co-activation of
innervated structures nearby the denervated stimulation target warrants further research
to study whether these co-activations can be lessened with alternative stimulation
waveforms such as ramped sawtooth pulses.

iv
ACKNOWLEDGEMENTS
With this I would like to express my thanks and gratitude to all those who supported me
on my PhD journey. First and foremost, I want to thank my supervisory team, led by my
director of studies Professor Jonathan Jarvis. His tireless, detail-oriented work mentality
as well as his genuine passion to solve complex research questions have been an
inspiration throughout my PhD studies. I remain in admiration of Jonathan’s deep subject
knowledge both of muscle physiology and biomedical engineering to which I was
provided access in countless meetings and discussions. The guidance and feedback that I
received from Jonathan accelerated my academic and personal development and I
continue to profit from my time in his research group. Further, my gratitude is towards
the extended supervisory team: I thank my second supervisor Professor Gabor Barton,
Professor Winfried Mayr from the Center for Medical Physics and Biomedical
Engineering at Medical University of Vienna, and Werner Lindenthaler who is leading
the emerging applications division of MED-EL Medical Electronics, our industrial
partner. I thank Dr Hazel Sutherland and Mark Viggars for all their help with the animal
experiments. Further I am grateful to Steve Broadfoot and his team for their help with
animal care and handling, and I acknowledge that their practical support and experience
was crucial to guarantee successful data collection. I thank Professor Frank Rattay and
Dr Andreas Fellner from the Institute of Analysis and Scientific Computing at Vienna
University of Technology for the many most stimulating discussions and their
collaboration in an ongoing research project. I am thankful for the joint research project
with Dr Daniel Owens and Andrew Nolan and the opportunity to get valuable insights in
a new area of research, applying electrical stimulation to muscle cell cultures. I thank my
former host family Phil and Kate Hammersley, who welcomed me in when I was a
stranger in Liverpool, supported me in so many ways and became very good friends.
Finally, I want to thank my family and especially my wife Emma for all her
encouragement and support throughout the many challenges that accompanied us on my
PhD journey. Thank you all so much!

v
CONTENTS
1 INTRODUCTION ........................................................................................................ 1
1.1 MOTIVATION AND STRUCTURE OF THE THESIS .......................................................... 1
1.2 THE NEUROMUSCULAR SYSTEM ................................................................................ 2
1.2.1 The motor neuron ............................................................................................. 4
1.2.2 The neuromuscular junction .......................................................................... 13
1.2.3 Skeletal muscle contraction ........................................................................... 16
1.3 ELECTRICAL STIMULATION ..................................................................................... 17
1.3.1 Basic terminologies and physical quantities .................................................. 19
1.3.2 Electrically evoked action potentials ............................................................. 20
1.3.3 Electrical stimulators ..................................................................................... 25
1.3.4 Electrodes for electrical stimulation .............................................................. 27
1.3.5 Stimulation waveforms ................................................................................... 34
1.3.6 Recruitment and pulse duration relationships ............................................... 36
2 GENERAL METHODS ............................................................................................ 40
2.1 SURGICAL PROCEDURE ........................................................................................... 40
2.2 STIMULATION ......................................................................................................... 43
2.3 RECORDING AND DATA ANALYSIS .......................................................................... 44
2.3.1 Isometric twitch force ..................................................................................... 45
2.3.2 Electroneurogram .......................................................................................... 48
3 WAVEFORMS FOR NEURAL STIMULATION .................................................. 51
3.1 SUBTHRESHOLD CONDITIONING PRE-PULSES .......................................................... 52
3.1.1 Published literature on pre-pulses is contradictory ...................................... 53
3.1.2 Comprehensive range of pre-pulse parameters to be tested .......................... 55
3.1.3 Pre-pulses have opposite effects in bipolar compared to monopolar stimulation
mode ........................................................................................................................ 60
3.1.4 In the bipolar configuration, excitation first occurs at the return electrode . 64
3.1.5 Implications for devices operating in bipolar mode warrant further research
................................................................................................................................. 67
3.2 INTERPHASE GAPS (IPGS) AND ASYMMETRIC PULSES ............................................. 69
3.2.1 Authoritative literature on the effect of IPGs investigated only monopolar
stimulation configurations ...................................................................................... 69
3.2.2 Experimental model to test waveform variations in both principal electrode
configurations ......................................................................................................... 73

vi
3.2.3 IPGs and pulse asymmetry have opposite effects in bipolar compared to
monopolar stimulation mode .................................................................................. 76
3.2.4 Excitation at the bipolar return electrode explains opposite effects of pulse
shaping .................................................................................................................... 82
3.2.5 IPGs could significantly decrease battery life of stimulation implants operating
in bipolar mode ....................................................................................................... 88
3.3 GAUSSIAN SHAPED PULSES ..................................................................................... 90
3.3.1 Computational studies identified Gaussian shaped waveforms as energy
optimal .................................................................................................................... 91
3.3.2 In-vivo experiment design .............................................................................. 94
3.3.3 Moderate energy savings with Gaussian waveform are accompanied with
substantially increased power requirements ........................................................... 99
3.3.4 Experimental findings set into perspective with published literature on non-
rectangular waveforms ......................................................................................... 103
3.3.5 Gaussian shaped stimulation waveforms not beneficial for neuromodulation
implants ................................................................................................................. 105
3.3.6 Addendum: Gaussian and “Gaussian-like” waveforms .............................. 107
4 DENERVATED MUSCLE STIMULATION ........................................................ 115
4.1 TIME COURSE OF DENERVATION OF THE RAT HINDLIMB DORSIFLEXORS ............... 120
4.2 N-LET STIMULATION OF DENERVATED MUSCLE .................................................... 123
5 THE INFLUENCE OF LONG PULSE DURATION ON NERVE ACTIVATION
126
5.1 OBSERVATION OF ADDITIONAL NEUROMUSCULAR RECRUITMENT WITH LONG
DURATION PULSES ...................................................................................................... 126
5.2 EXPERIMENTAL JOURNEY TO INVESTIGATE THE ADDITIONAL RECRUITMENT ........ 128
5.3 TRANSITIONS WITHIN BIPHASIC LONG DURATION PULSES CAN ELICIT UP TO 3
SEPARATE APS ........................................................................................................... 131
5.4 DISCUSSION AND IMPLICATION FOR STIMULATION OF (PARTIALLY) DENERVATED
MUSCLE ...................................................................................................................... 139
6 FUTURE WORK ..................................................................................................... 143
6.1 CELL STIMULATION SYSTEM ................................................................................. 143
6.2 DEVELOPMENT OF AN ELECTROPORATOR ............................................................. 145
7 CONCLUSION AND OUTLOOK ......................................................................... 147
8 REFERENCES ......................................................................................................... 149
9 APPENDICES .......................................................................................................... 163

vii
LIST OF TABLES
TABLE 1.1 NERVE AND MUSCLE FIBRE TYPES. ................................................................... 6
TABLE 1.2 DISTRIBUTION OF OSMOTICALLY ACTIVE PARTICLES ....................................... 8
TABLE 1.3 REVERSIBLE CHARGE STORAGE CAPACITY AND OTHER PARAMETERS IN
ELECTRODE MATERIAL SELECTION. .......................................................................... 32
viii
LIST OF FIGURES
FIGURE 1.1 THE NEURON 3
FIGURE 1.2 THE PERIPHERAL NERVE AND ITS COMPONENTS. 5
FIGURE 1.3 HISTORICAL RECORDINGS OF THE ACTION POTENTIAL 10
FIGURE 1.4 MEMBRANE CONDUCTANCES DURING THE ACTION POTENTIAL. 12
FIGURE 1.5 SCHEMATIC REPRESENTATION OF THE NEUROMUSCULAR SYSTEM. 14
FIGURE 1.6 SKELETAL MUSCLE MODEL. 17
FIGURE 1.7 MODEL OF EXTRACELLULAR CHARGE INJECTION WITH A MONOPOLAR
STIMULATION POINT SOURCE. 22
FIGURE 1.8 AXON-SIZE INFLUENCE ON ACTIVATING FUNCTION FOR EXTRACELLULAR
STIMULATION. 24
FIGURE 1.9 VOLTAGE-CONTROLLED STIMULATION. 26
FIGURE 1.10 CURRENT-CONTROLLED STIMULATION. 27
FIGURE 1.11 RISK VERSUS POTENTIAL BENEFIT OF NEURAL STIMULATION ELECTRODES. 28
FIGURE 1.12 PRINCIPAL STIMULATION ELECTRODE CONFIGURATIONS. 30
FIGURE 1.13 PLOT OF SHANNON EQUATION FOR SAFE STIMULATION. 34
FIGURE 1.14 RECRUITMENT BEHAVIOUR OF A HOMOGENEOUS FIBRE POPULATION. 37
FIGURE 1.15 PULSE DURATION RELATIONSHIPS. 39
FIGURE 2.1 LOOP ELECTRODES 41
FIGURE 2.2 RODENT IN-VIVO NERVE-MUSCLE PREPARATION 42
FIGURE 2.3 EDL TWITCH FORCE CORRELATES WITH CPN ECAPS. 45
FIGURE 2.4 DEVELOPED ISOMETRIC TWITCH FORCE 46
FIGURE 2.5 DETERMINATION OF 50% ACTIVATION THRESHOLDS. 47
FIGURE 2.6 ARTIFACT REMOVAL OF SHORT STIMULATION PULSES. 49
FIGURE 2.7 ARTIFACT REMOVAL OF LONG STIMULATION PULSES. 50
FIGURE 3.1 EXPERIMENTAL MODEL 55

ix
FIGURE 3.2 ELECTRICAL FIELDS INTRODUCED DURING MONOPOLAR AND BIPOLAR
EXTRACELLULAR NERVE STIMULATION 57
FIGURE 3.3 RECRUITMENT CURVES 58
FIGURE 3.4 CHANGES IN 50% ACTIVATION THRESHOLD WITH DPPS. 61
FIGURE 3.5 CHANGES IN 50% ACTIVATION THRESHOLD WITH HPPS. 62
FIGURE 3.6 ELECTRONEUROGRAM RECORDINGS OF COMPOUND ACTION POTENTIALS 64
FIGURE 3.7 ELECTRODE CONFIGURATIONS AND STIMULATION WAVEFORMS. 72
FIGURE 3.8 EFFECT OF DECREASING THE ANODIC AMPLITUDE FROM BIPHASIC SYMMETRIC
PULSES 77
FIGURE 3.9 EFFECT OF INTRODUCING IPGS OF DIFFERENT DURATIONS 79
FIGURE 3.10 ENG RECORDINGS DURING MAXIMAL (I95%) AND SUPRAMAXIMAL AMPLITUDE
STIMULATION. 81
FIGURE 3.11 MODEL OF EXTRACELLULAR STIMULATION WITH PRACTICAL ELECTRODE
CONFIGURATIONS. 84
FIGURE 3.12 EXPERIMENTAL MODEL: NERVE-MUSCLE-PREPARATION WITH COMMON
PERONEAL NERVE (CPN) AND EXTENSOR DIGITORUM LONGUS (EDL). 94
FIGURE 3.13 EXEMPLARY RECRUITMENT DATA FOR GAUSSIAN AND RECTANGULAR PULSES
WITH BIPOLAR ELECTRODES. 96
FIGURE 3.14 ELECTRICAL RECORDINGS 98
FIGURE 3.15 ENERGY EFFICIENCY OF BIPHASIC GAUSSIAN WAVEFORM COMPARED TO
BIPHASIC RECTANGULAR STIMULI. 100
FIGURE 3.16 CHARGE EFFICIENCY OF BIPHASIC GAUSSIAN WAVEFORM COMPARED TO
BIPHASIC RECTANGULAR STIMULI. 101
FIGURE 3.17 DIFFERENCE IN MAXIMUM INSTANTANEOUS POWER OF GAUSSIAN WAVEFORM
COMPARED TO RECTANGULAR 103
FIGURE 3.18 BIPHASIC GA WAVEFORM. 112
FIGURE 3.19 PROPOSED FURTHER COMPARISON TO DISCRIMINATE BETWEEN THE EFFECT TO
LOWER ENERGY CONSUMPTION OF A PARTICULAR CATHODIC KURTOSIS AND OTHER
WAVEFORM VARIATIONS. 113
x
FIGURE 4.1 MONOPOLAR NERVE VERSUS MUSCLE SURFACE VERSUS INTRAMUSCULAR
STIMULATION IN A HEALTHY PREPARATION. 116
FIGURE 4.2 NERVE VERSUS MUSCLE SURFACE STIMULATION IN A HEALTHY PREPARATION.
117
FIGURE 4.3 DOUBLET STIMULATION IN A HEALTHY PREPARATION 120
FIGURE 4.4 RECRUITMENT CURVES AND DOUBLET TEST 1 AND 3 DAYS AFTER NERVE CRUSH
INJURY 121
FIGURE 4.5 N-LET TEST 124
FIGURE 4.6 4-LET FORCE-FREQUENCY TEST 125
FIGURE 5.1 EXPERIMENTAL SETUP: IN-VIVO NERVE MUSCLE PREPARATION IN
ANAESTHETIZED RATS. 128
FIGURE 5.2 RECRUITMENT CURVES FOR BIPHASIC RECTANGULAR STIMULATION IN BIPOLAR
ELECTRODE CONFIGURATION 132
FIGURE 5.3 RESULTS EXPERIMENT 3 134
FIGURE 5.4 RESULTS EXPERIMENT 4 136
FIGURE 5.5 RESULTS EXPERIMENT 5 138
FIGURE 6.1 CELL CULTURE STIMULATION SYSTEM. 143
FIGURE 6.2 CELL CULTURE STIMULATION ARTIFACT RECORDING. 144
FIGURE 6.3 ELECTROPORATOR. 145
FIGURE 6.4 BENCH TESTING OF THE ELECTROPORATOR. 146

xi
LIST OF ABBREVIATIONS AND ACRONYMS
°C Degree Celsius
W Ohm
Å Angstrom
A-band Anisotropic band
AC Alternating current
ACh Acetylcholine
ANOVA Analysis of variance
AP Action potential
ARP Absolute refractory period
ATP Adenosine triphosphate
Ca2+ Calcium ion
CAP Compound action potential
CaV Voltage gated calcium ion channel
ce Extracellular ion concentration
CE Contractile element (in Hill-type muscle model)
ci Intracellular ion concentration
Cl- Chloride ion
Cle Extracellular chloride concentration
Cli Intracellular chloride concentration
CNS Central nervous system
CPN Common peroneal nerve
CSC Charge storage capacity
DBS Deep brain stimulation
DC Direct current
DPP Depolarizing pre-pulse
e Euler constant
E Electrical energy
eCAP Electrically evoked compound action potential
EDL Extensor digitorum longus muscle
e.g. Latin: “exempli gratia” – for example
Em Transmembrane potential
EMG Electromyogram
ENG Electroneurogram
epp endplate potential
xii
ES Electrical stimulation
Eth Threshold energy
F Faraday constant
FTI Force time integral
G Gauge
GA Genetic algorithm
GHK Goldman-Hodgkin-Katz (equation)
gK, gNa, gCl Membrane conductance to potassium, sodium, chloride
h Sodium channel inactivation variable
HPP Hyperpolarizing pre-pulse
Hz Hertz
I, Istim Current, Stimulation amplitude
I50%, I95% 50%, 95% Threshold current
Ian Amplitude of anodic phase
I-band Isotropic band
Ica Amplitude of cathodic phase
i.e. Latin: “id est” – that is
IPG Interphase gap
IPI Inter pulse interval
Ir Rheobase
Ith Threshold current
J Joule
k Adjustable parameter
K Kelvin
K+ Potassium ion
Ke Extracellular potassium concentration
kg Kilogram
KHFAC Kilohertz frequency alternating current
Ki Intracellular potassium concentration
kS Kilo-sample = 1,000 samples
KV Voltage gated potassium ion channel
L Litre
ln Natural logarithm
log10 Common logarithm
mAChR Muscarinic acetylcholine receptors
mepp Miniature endplate potential

xiii
MFCV Muscle fibre conduction velocity
MS Mega-sample = 1,000,000 sample
N Newton
Na+ Sodium ion
nAChR Nicotinic acetylcholine receptors
Nae Extracellular sodium concentration
Nai Intracellular sodium concentration
NA/K-ATPase Sodium-potassium adenosine triphosphatase
NaV Voltage gated sodium ion channel
nFTI Normalized force time integral
NMJ Neuromuscular junction
NoR Node of Ranvier
OPA Operational Amplifier
P Power
PE Parallel elastic element (in Hill-type muscle model)
PhW Phase width
PK, PNa, PCl Membrane permeabilities to Potassium, Sodium, Chloride
PNS Peripheral nervous system
PPL Home Office project licence
pps Pulses per second
PSC Perisynaptic Schwann cell
PW Pulse width
Q Electric charge
Qth Threshold charge
R Gas constant
RMS Room mean square
RRP Relative refractory period
SD Standard deviation
SE Series elastic element (in Hill-type muscle model)
SEM Standard error of the mean
SI International System of Units (Système international d'unités)
T Temperature
TC Chronaxie
t-SNARE Target-soluble N-ethylmaleimide sensitive fusion attachment protein
receptor
T-tubules Transverse tubules

xiv
V Volt
Ve,n, Ve,n-1, Ve,n+1 Extracellular potential at the central, previous, and next node of
Ranvier
v-SNARE Vesicle-soluble N-ethylmaleimide sensitive fusion attachment protein
receptor
W Watt
Z Impedance
Z-disc German: "Zwischenscheibe" - the disc in between the I-bands

xv
LIST OF APPENDICES
APPENDIX 1 LABVIEW STIMULATION CODE .................................................................. 164
APPENDIX 2 MATLAB TWITCH FORCE ANALYSIS CODES .............................................. 169
APPENDIX 3A MATLAB ENG ANALYSIS CODES (SHORT PHW) ..................................... 170
APPENDIX 3B MATLAB ENG ANALYSIS CODES (LONG PHW) ....................................... 171
APPENDIX 4 LABCHART CELL STIMULATION PROGRAM ................................................. 172

Chapter 1: Introduction
S. Eickhoff - January 2021 1
1 INTRODUCTION
1.1 Motivation and structure of the thesis
Many medical devices and treatments use electrical stimulation (ES) to achieve a
therapeutic effect. Often, especially when the ES equipment is battery powered, as is the
case with many wearable or implanted devices, energy efficient stimulation is of
paramount importance. Optimization of the waveform used for stimulation can influence
the amount of electrical energy consumed per pulse and a number of rectangular and non-
rectangular waveform variations have been suggested in scientific literature to improve
efficiency of ES. However, these published experimental and computational studies about
the effect of many stimulation waveforms are unclear and report contradictory findings.
Further, most authoritative literature on such pulse shaping strategies only investigated
the monopolar electrode configuration that is different from the bipolar mode in which
many contemporary ES devices operate. Thus, this PhD project aimed to
comprehensively re-examine commonly suggested ES waveforms in an in-vivo animal
model with a particular focus on the influence of the stimulation electrode configuration.
After providing the essential background knowledge about the neuromuscular system
(Section 1.2) and electrical stimulation (Section 1.3), Chapter 2 describes the
development and refinement of a rodent nerve-muscle model, suitable to answer the
relevant research questions outlined above. This model includes a sophisticated
instrumentational setup for neural stimulation and recording, and effective methods for
data normalization, as well as analysis of complex bioelectric signals.
In Chapter 3, three studies arising from the examination of rectangular and non-
rectangular stimulation waveform variations are presented:

Chapter 1: Introduction
S. Eickhoff - January 2021 2
• Subthreshold conditioning pre-pulses (Section 3.1)
• Interphase gaps and asymmetric pulses (Section 3.2)
• Gaussian shaped pulses (Section 3.3)
A set of experimental observations on muscle surface stimulation with standard
rectangular pulses in healthy (innervated) and impaired preparations with different time
courses of denervation is presented in Chapter 4. These experiments raise fundamental
questions on differences in recruitment behaviour with nerve and muscle surface
stimulation and warrant further research.
The study presented in Chapter 5 closely examines a series of experiments on the
influence of long phase width stimuli, such as are used for stimulation of partially or
complete denervated muscle, on nerve. This investigation is of interest since in many
scenarios of denervated muscle stimulation, nearby innervated structures may be affected
by these long duration ES pulses.
1.2 The neuromuscular system
Neuromuscular systems can even be found in some of the lowest developed multicellular
organisms with differentiated tissues. Sedentary sea anemones, for example, possess cell
networks that combine sensory reception with locomotive response, enabling the
organism to catch food or withdraw as defence (Katz, 1966).
There are two principal methods of communication within living organisms. The first
way of conveying information relies on transmission of chemical messenger substances,
the hormones. Following a specific stimulus, the transmitter organ A releases the
hormones, e.g. into the blood stream, which then travel through the system until they find
the receiver organs B and C that are equipped with the corresponding receptors. While
communication via hormones plays a critical role in numerous systemic regulatory and
metabolic processes, it is inappropriate for many functions that required fast and accurate
transmission of information. The second path of communication relies on the
transmission of electrical signals and meets these demands for speed and accuracy. The
nervous system provides the necessary infrastructure for this electrical communication.
The nervous system of vertebrates consists of the peripheral nervous system (PNS) and
the central nervous system (CNS), which is the organisms central processing unit. The
CNS is comprised of the brain and spinal cord, both these delicate structures are safely
suspended in a shock absorbing fluid inside their bony protective shells, the skull and the

Chapter 1: Introduction
S. Eickhoff - January 2021 3
spinal canal. The PNS is a network of conductive pathways, the nerve fibres or axons,
that connect the CNS to every other part of the organism. While the PNS contains some
peripheral processing units, the ganglia, its two main tasks are providing sensory input to
the CNS, via afferent fibres, and transmitting commands from the CNS to the periphery
via efferent fibres. The structural base units fulfilling these tasks are the individual
neurons.
Neurons are comprised of a cell body, the soma, from which a network of fine processes
is spreading in various directions and is contacting neighbouring cells (Figure 1.1). A
neuron can be seen as a miniature nervous system itself: It receives input via synapses on
the cell body and the nearby dendritic processes, integrates these received input data, and
generates an output signal, an action potential, which it sends along its efferent pathway
to its axonal terminals. On both sides, the dendritic/somatic input and the terminal output,
the neuron is in close contact with its neighbouring cells. Further, most nerves cells are
almost entirely enveloped by tightly connected satellite cells, like the Schwann cells that
form an insulating myelin sheath around most mammalian nerve axons. The intimate
nature of these cell interactions divided late 19th and early 20th century physiologists into
two schools of thinking. One group, championed by Italian biologist Camillo Golgi,
thought the cells are penetrating each other, forming a smooth reticular network, while
Figure 1.1 The neuron is the structural unit of the nervous system. Dendritic processes (b) and
the myelinated axon (c) originate from the cell soma (a). Myelination is interrupted at nodes of
Ranvier (d), where the axonal membrane is exposed. (Ramón y Cajal, 1911) Copyright by
Wellcome Collection. CC BY. Adapted with permission.
Chapter 1: Introduction
S. Eickhoff - January 2021 4
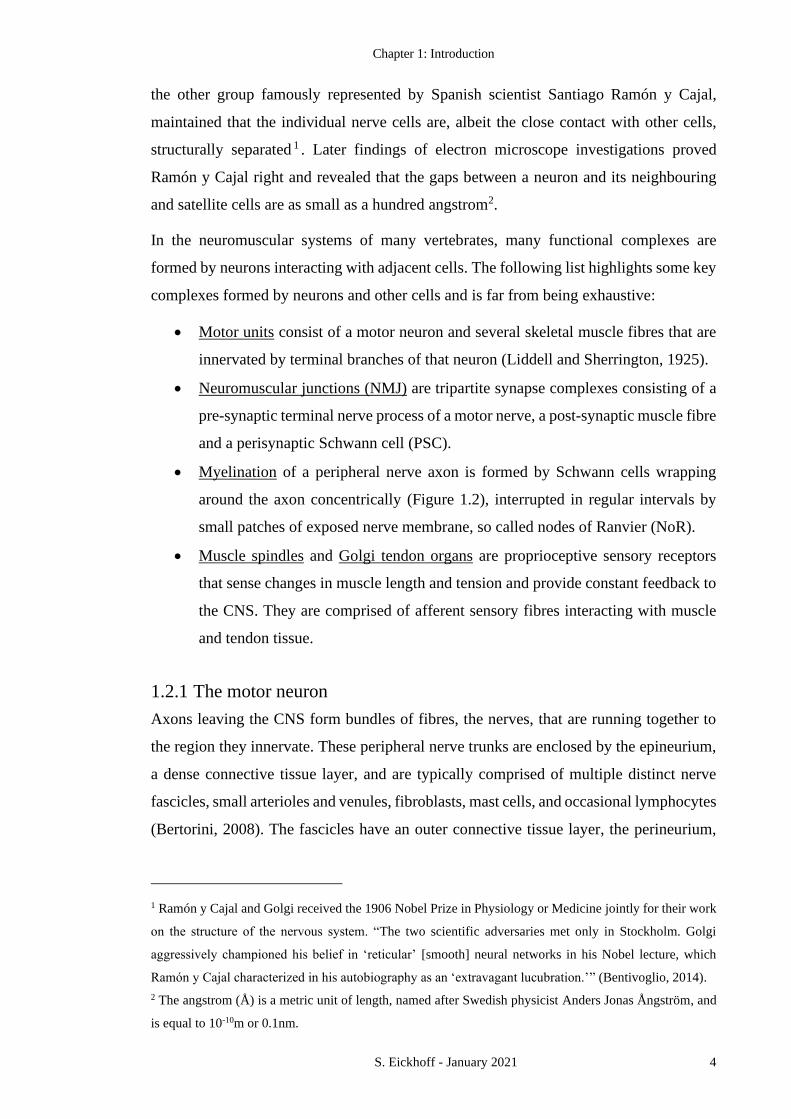
the other group famously represented by Spanish scientist Santiago Ramón y Cajal,
maintained that the individual nerve cells are, albeit the close contact with other cells,
structurally separated 1 . Later findings of electron microscope investigations proved
Ramón y Cajal right and revealed that the gaps between a neuron and its neighbouring
and satellite cells are as small as a hundred angstrom2.
In the neuromuscular systems of many vertebrates, many functional complexes are
formed by neurons interacting with adjacent cells. The following list highlights some key
complexes formed by neurons and other cells and is far from being exhaustive:
• Motor units consist of a motor neuron and several skeletal muscle fibres that are
innervated by terminal branches of that neuron (Liddell and Sherrington, 1925).
• Neuromuscular junctions (NMJ) are tripartite synapse complexes consisting of a
pre-synaptic terminal nerve process of a motor nerve, a post-synaptic muscle fibre
and a perisynaptic Schwann cell (PSC).
• Myelination of a peripheral nerve axon is formed by Schwann cells wrapping
around the axon concentrically (Figure 1.2), interrupted in regular intervals by
small patches of exposed nerve membrane, so called nodes of Ranvier (NoR).
• Muscle spindles and Golgi tendon organs are proprioceptive sensory receptors
that sense changes in muscle length and tension and provide constant feedback to
the CNS. They are comprised of afferent sensory fibres interacting with muscle
and tendon tissue.
1.2.1 The motor neuron
Axons leaving the CNS form bundles of fibres, the nerves, that are running together to
the region they innervate. These peripheral nerve trunks are enclosed by the epineurium,
a dense connective tissue layer, and are typically comprised of multiple distinct nerve
fascicles, small arterioles and venules, fibroblasts, mast cells, and occasional lymphocytes
(Bertorini, 2008). The fascicles have an outer connective tissue layer, the perineurium,
1 Ramón y Cajal and Golgi received the 1906 Nobel Prize in Physiology or Medicine jointly for their work
on the structure of the nervous system. “The two scientific adversaries met only in Stockholm. Golgi
aggressively championed his belief in ‘reticular’ [smooth] neural networks in his Nobel lecture, which
Ramón y Cajal characterized in his autobiography as an ‘extravagant lucubration.’” (Bentivoglio, 2014).
2 The angstrom (Å) is a metric unit of length, named after Swedish physicist Anders Jonas Ångström, and
is equal to 10-10m or 0.1nm.

Chapter 1: Introduction
S. Eickhoff - January 2021 5
and are bundles of individual axons. The individual nerve axons have yet another thin
connective tissue sheath wrapped around them, the endoneurium (Figure 1.2).
Peripheral nerves typically contain a distribution of small and large, unmyelinated and
myelinated fibres of different fibre types. One fibre type most relevant to the
neuromuscular system is the group of large diameter myelinated Aα fibres that innervate
muscle fibres and thus form the motor units. Table 1.1 summarizes the key characteristics
of Aα and other nerve and muscle fibre types. The myelination is an insulating multilayer
structure, formed by Schwann cells concentrically wrapped around the axon (Figure 1.2).
The myelin sheath of large Aα nerve fibres is normally composed of 80 to 160 individual
myelin lamellae (Bertorini, 2008). In regular intervals, at the nodes of Ranvier, the
insulation myelin sheath is interrupted and the axonal nerve membrane is exposed.
Figure 1.2 The peripheral nerve and its components. (Bertorini, 2008) Copyright by Elsevier.
Adapted with permission. Insets: Electron micrograph illustrating the ultrastructure of the myelin
sheath. a) Transverse section of an axon with myelination composed of multiple layers of
Schwann cell membrane (arrowheads). b) Examination of the myelin sheath at higher
magnification. (Johns, 2014) Copyright by Elsevier. Adapted with permission.

Chapter 1: Introduction
S. Eickhoff - January 2021 6
The nerve membrane
In order to understand the generation and propagation of electrical signals, the action
potentials, in the nervous system, a brief description of the nerve membrane structure, its
electrical potential and the function of its transmembrane ion channels will be given
below.
The plasma membrane of excitable cells not only provides structural integrity, but it is
crucial in maintaining a concentration gradient between the intracellular and extracellular
space and controls the cells nutrient supply and waste disposal. The membrane is built
from carbohydrates, lipids, and proteins. The lipid bilayer is formed of phospholipids,
glycolipids, and contains cholesterol molecules (Koester, 1985a) and prevents large
water-soluble molecules to pass across the membrane. To allow for the passage of specific
water-soluble molecules and ions across the lipid bilayer, channel proteins are situated in
Table 1.1 Nerve and muscle fibre types. a (Bertorini, 2008; Marani and Lakke, 2012)
Nerve fibre types
Classification Myelination Diameter (µm) //
conduction velocity (m/s) Function and associated cells
Aα myelinated 12-20 // 70-120 motor somatic muscle fibre
Aα Ia myelinated 12-20 // 70-120 proprioception; muscle spindle annulospiral
Aα Ib myelinated 12-20 // 70-120 proprioception; Golgi tendon organ
Aβ II myelinated 5-12 // 30-70 proprioception; muscle spindle flower spray
Aβ II myelinated 5-12 // 30-70 exteroception; touch and pressure
Aγ myelinated 2-8 // 10-50 motor somatic muscle spindle
Aδ III myelinated 1-5 // 3-30 exteroception; pain temperature (some) touch
B unmyelinated 1-3 // 3-15 motor autonomic preganglionic
C IV unmyelinated <1 // <2 exteroception; pain reflex responses
C unmyelinated <1 // <2 motor autonomic postganglionic sympathetic
Muscle fibre types
Type Speed Strength Fatigability ATPase Colour Motor unit Axon
I slow weak fatigue resistant low red slow small
IIB fast strong fatigable high white fast, fatigable large
IIA fast intermediate fatigue resistant high red fast, fatigue resistant large
a Note that these numbers are means from several publications.
Chapter 1: Introduction
S. Eickhoff - January 2021 7
the membrane, connecting the intracellular and extracellular space over a water filled
channel or pore. Some forms of transmembrane transport involve carrier proteins that
bind to a substance, undergo a conformational change, and release the substance on the
other side of the membrane.
Some special types on transmembrane channel proteins, that enable selective passage of
electrical charge carrying ions, are fundamentally important for the generation and
propagation of action potentials in nervous tissue (Koester, 1985b). Some channels, the
so-called leak channels, are in an open state when the nerve membrane is at rest and let
specific ions pass the membrane following their electrical and/or concentration gradient.
Other channels undergo a conformational change when a specific neurotransmitter binds
to them and thus change from the closed to the open state (or vice versa). This group of
channels is called ligand-gated and an example is the nicotinic acetylcholine receptor
(nAChR) that is of central importance for the excitation-contraction coupling at the
neuromuscular junction. Voltage-gated channels change their conformation to open or
closed state based on local changes of the transmembrane potential. A common and
helpful notation for voltage-gated ion channels is a subscript v behind the ions symbol as
example NaV for voltage gated sodium ion channels or KV for voltage gated potassium
channels. Besides these passive ion transport mechanisms, that do not require energy for
operation, active transport mechanisms use energy, e.g. chemical energy in form of
adenosine triphosphate (ATP), to move ions against their concentration gradient across
the cell membrane. For nerve cells to maintain their resting potential, the sodium-
potassium pump (Na-K ATPase pump) is an important example of active transmembrane
transport (Bertorini, 2008).
The membrane resting potential
In 1868, Julius Bernstein published his famous Bernstein-hypothesis (Bernstein, 1868)
and advanced it in 1902 with his “membrane theory” (Bernstein, 1902), proposing that
the intracellular space of living cells contains ions at different concentrations than the
extracellular space. Bernstein hypothesized that the thin, relatively impermeable cell
membrane prevents the ions to follow their concentration gradient and that the interior
space of excitable cells is at rest more negative than the extracellular space.
Today, more than a century after his original proposal, Bernstein’s hypothesis of
transmembrane ionic concentration gradients is still the prevailing paradigm in
neurophysiology. In excitable cells, the concentration and electrical gradients of

Chapter 1: Introduction
S. Eickhoff - January 2021 8
osmotically active particles create a membrane resting potential. Depending on the
specific cell type, the cell interior is between approximately 60 to 90mV more negative
than the extracellular space. The concentration gradient causes ions on both sides of the
membrane to try to equilibrate. In the intracellular space large polyanionic3 proteins and
positive charge carrying potassium ions K+ are present in high concentrations (Table 1.2).
Following their concentration gradient K+ ions tend to move, or leak, into the
extracellular space. This loss of positive charge creates an electrical gradient across the
membrane that counteracts the tendency of K+ ions to leave the cell. The transmembrane
potential at which the K+ outflux due to the concentration gradient is balanced by the K+
influx following the electrical gradient, i.e. the potential at which no net K+ flux occurs
across the membrane, is called the equilibrium potential.
The equilibrium membrane potential Em for individual ion types can be calculated using
the Nernst equation:
𝑬𝒎 =𝑹 ∙ 𝑻
𝒛 ∙ 𝑭∙ 𝐥𝐧 (
𝒄𝒆
𝒄𝒊) = 𝟐. 𝟑𝟎𝟑 ∙
𝑹 ∙ 𝑻
𝒛 ∙ 𝑭∙ 𝐥𝐨𝐠𝟏𝟎 (
𝒄𝒆
𝒄𝒊), (1.1)
where R is the gas constant (8.31446 J K-1 mol-1), T the temperature, F the Faraday’s
constant (96.485 J V-1 mol-1), z the charge of the ion, ce the extracellular ion concentration,
and ci the intracellular ion concentration. At a physiological temperature of 37°C
𝟐. 𝟑𝟎𝟑 ∙𝑹∙𝑻
𝑭= 𝟔𝟏. 𝟏𝐦𝐕, (1.2)
3 Polyanions are complexes that have multiple negative charges.
Table 1.2 Distribution of osmotically active particles in a peripheral nerve and its surrounding
fluid (Dwyer, 2018). Copyright by Elsevier. Reprint with permission.
Free ion concentration
Ion Molecular charge Intracellular Extracellular Equilibrium
potential (mV)
Sodium +1 10mM 142mM +70
Potassium +1 100mM 4mM -86
Calcium +2 0.0001mM 1.2mM +126
Chloride -1 5.5mM 103mM -78
Protein Polyanion [-x] 200-300mg/mL Cerebrospinal fluid: 0.2-0.5mg/mL
Interstitium: ~20mg/mL
Plasma: 55-80mg/mL
None possible
Chapter 1: Introduction
S. Eickhoff - January 2021 9
and thus, the Nernst equation (1.1) can be simplified with (1.2) at this temperature:
Em=61.6mV
z∙ log10 (
ce
ci) . (1.3)
Thereby we can determine the equilibrium potential for a specific ion, for example, for
chloride:
𝑬𝒎 =𝟔𝟏. 𝟔𝐦𝐕
−𝟏∙ 𝐥𝐨𝐠𝟏𝟎 (
𝟏𝟎𝟑
𝟓. 𝟓) = −𝟕𝟖𝐦𝐕. (1.4)
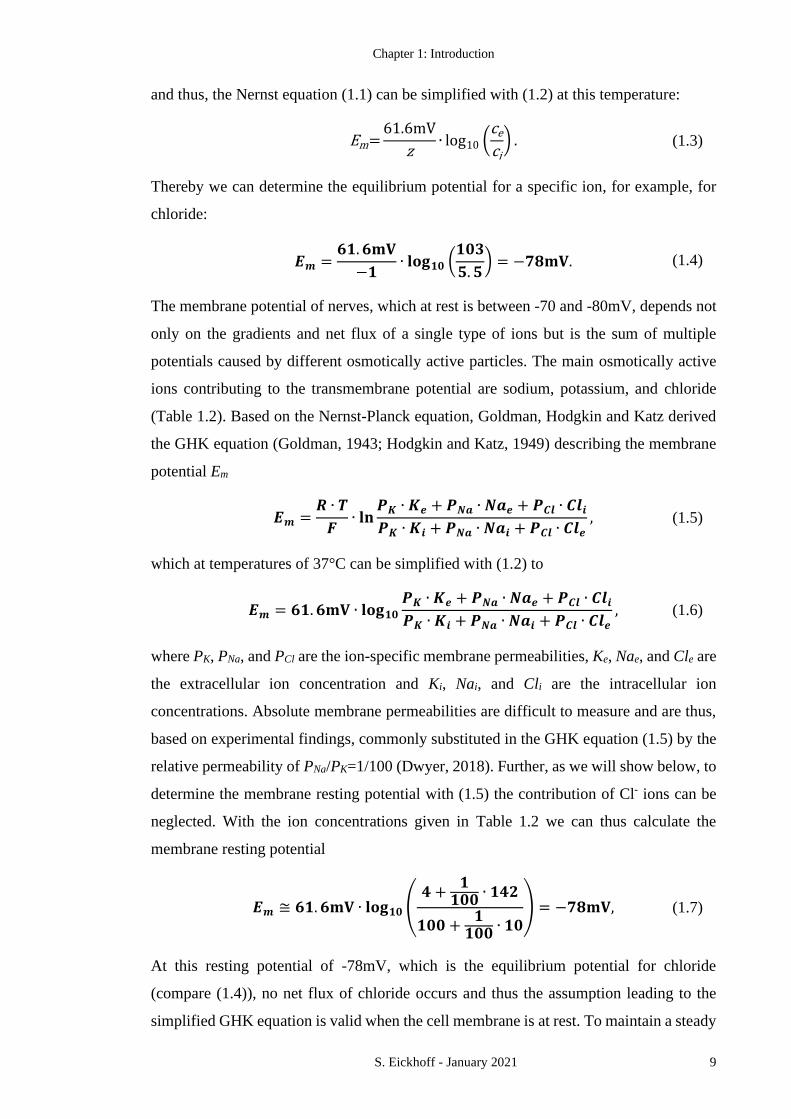
The membrane potential of nerves, which at rest is between -70 and -80mV, depends not
only on the gradients and net flux of a single type of ions but is the sum of multiple
potentials caused by different osmotically active particles. The main osmotically active
ions contributing to the transmembrane potential are sodium, potassium, and chloride
(Table 1.2). Based on the Nernst-Planck equation, Goldman, Hodgkin and Katz derived
the GHK equation (Goldman, 1943; Hodgkin and Katz, 1949) describing the membrane
potential Em
𝑬𝒎 =𝑹 ∙ 𝑻
𝑭∙ 𝐥𝐧
𝑷𝑲 ∙ 𝑲𝒆 + 𝑷𝑵𝒂 ∙ 𝑵𝒂𝒆 + 𝑷𝑪𝒍 ∙ 𝑪𝒍𝒊
𝑷𝑲 ∙ 𝑲𝒊 + 𝑷𝑵𝒂 ∙ 𝑵𝒂𝒊 + 𝑷𝑪𝒍 ∙ 𝑪𝒍𝒆, (1.5)
which at temperatures of 37°C can be simplified with (1.2) to
𝑬𝒎 = 𝟔𝟏. 𝟔𝐦𝐕 ∙ 𝐥𝐨𝐠𝟏𝟎
𝑷𝑲 ∙ 𝑲𝒆 + 𝑷𝑵𝒂 ∙ 𝑵𝒂𝒆 + 𝑷𝑪𝒍 ∙ 𝑪𝒍𝒊
𝑷𝑲 ∙ 𝑲𝒊 + 𝑷𝑵𝒂 ∙ 𝑵𝒂𝒊 + 𝑷𝑪𝒍 ∙ 𝑪𝒍𝒆, (1.6)
where PK, PNa, and PCl are the ion-specific membrane permeabilities, Ke, Nae, and Cle are
the extracellular ion concentration and Ki, Nai, and Cli are the intracellular ion
concentrations. Absolute membrane permeabilities are difficult to measure and are thus,
based on experimental findings, commonly substituted in the GHK equation (1.5) by the
relative permeability of PNa/PK=1/100 (Dwyer, 2018). Further, as we will show below, to
determine the membrane resting potential with (1.5) the contribution of Cl- ions can be
neglected. With the ion concentrations given in Table 1.2 we can thus calculate the
membrane resting potential
𝑬𝒎 ≅ 𝟔𝟏. 𝟔𝐦𝐕 ∙ 𝐥𝐨𝐠𝟏𝟎 (𝟒 +
𝟏𝟏𝟎𝟎 ∙ 𝟏𝟒𝟐
𝟏𝟎𝟎 +𝟏
𝟏𝟎𝟎 ∙ 𝟏𝟎) = −𝟕𝟖𝐦𝐕, (1.7)
At this resting potential of -78mV, which is the equilibrium potential for chloride
(compare (1.4)), no net flux of chloride occurs and thus the assumption leading to the
simplified GHK equation is valid when the cell membrane is at rest. To maintain a steady

Chapter 1: Introduction
S. Eickhoff - January 2021 10
membrane potential, at rest the influx of sodium and outflux of potassium ions is actively
reversed by the sodium-potassium pump (Na-K ATPase pump).
The action potential
Action potentials (APs) are the principal signals with which the nervous system operates,
brief and defined periods of membrane potential discharge, or depolarization, that
propagate along the membrane of excitable tissue. The first recording of these electrical
signals was published by Bernstein in 1868 (Figure 1.3.a), long before many fundamental
properties of the nerve membrane were fully understood. Due to slow response recordings
possible with the galvanometers of his days, Bernstein developed the differential
rheotome that enabled him to integrate the transmembrane potential responses to several
stimuli and thus reconstruct the AP (Carmeliet, 2019). The invention of the thermionic
amplifier and the cathode ray oscilloscope in the early 20th century enabled
electrophysiologists like Hodgkin and Huxley (Figure 1.3.b) or Curtis and Cole (Figure
1.3.c) to do direct and accurate measurements of the AP.
The cylindrical fibres of nerve and muscle cells can be considered as electrical cables: an
electrolytic, conductive interior is surrounded by the insulating cell membrane. The poor
cable properties of these cells would, due to resistive and conductive losses, result in
strong signal distortion and attenuation within a few mm. However, experimental
observations with varying separation between stimulation source and site of recording
show that APs can travel long distances without any distortion (Katz, 1966). This
discrepancy of insufficient cable properties of nerve and muscle fibres and observations
of APs being conveyed over long distances without attenuation suggests that other
mechanisms must be involved in AP propagation.
Figure 1.3 Historical recordings of the action potential by a) (Bernstein, 1868), b) (Hodgkin
and Huxley, 1939), and c) (Curtis and Cole, 1942). a) and b) Copyright by Springer Nature. c)
Copyright by John Wiley and Sons. Reprint with permission.
Chapter 1: Introduction
S. Eickhoff - January 2021 11
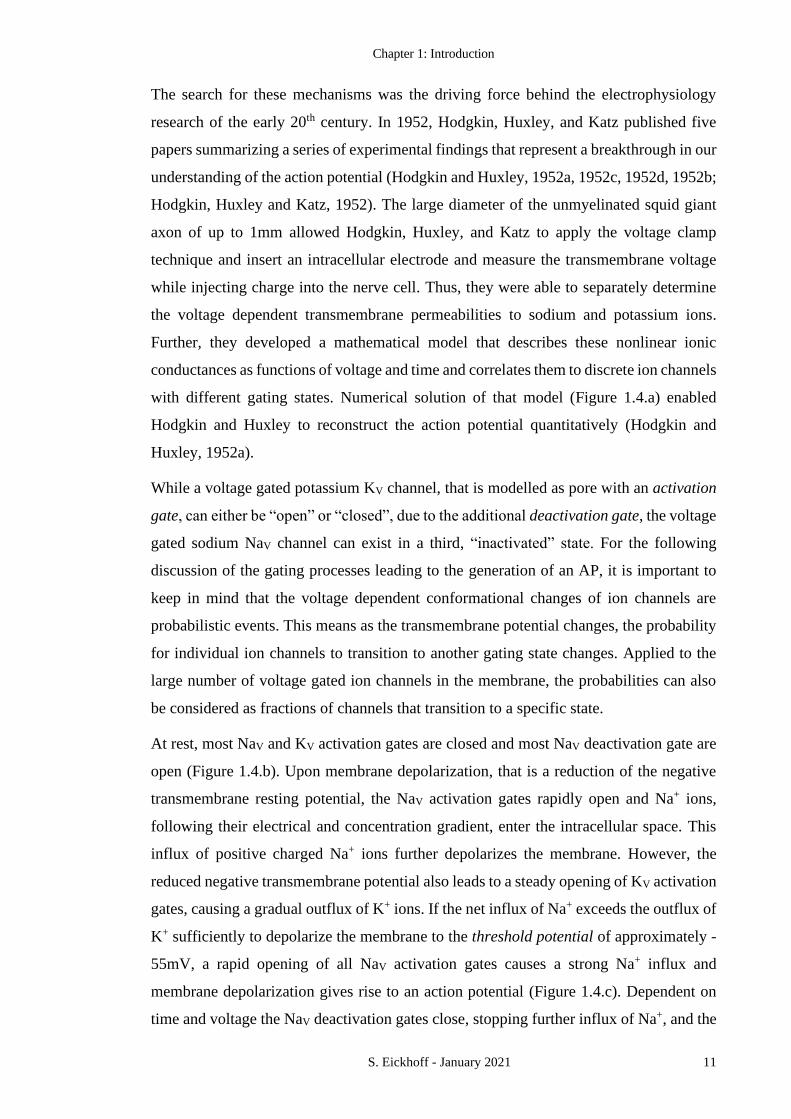
The search for these mechanisms was the driving force behind the electrophysiology
research of the early 20th century. In 1952, Hodgkin, Huxley, and Katz published five
papers summarizing a series of experimental findings that represent a breakthrough in our
understanding of the action potential (Hodgkin and Huxley, 1952a, 1952c, 1952d, 1952b;
Hodgkin, Huxley and Katz, 1952). The large diameter of the unmyelinated squid giant
axon of up to 1mm allowed Hodgkin, Huxley, and Katz to apply the voltage clamp
technique and insert an intracellular electrode and measure the transmembrane voltage
while injecting charge into the nerve cell. Thus, they were able to separately determine
the voltage dependent transmembrane permeabilities to sodium and potassium ions.
Further, they developed a mathematical model that describes these nonlinear ionic
conductances as functions of voltage and time and correlates them to discrete ion channels
with different gating states. Numerical solution of that model (Figure 1.4.a) enabled
Hodgkin and Huxley to reconstruct the action potential quantitatively (Hodgkin and
Huxley, 1952a).
While a voltage gated potassium KV channel, that is modelled as pore with an activation
gate, can either be “open” or “closed”, due to the additional deactivation gate, the voltage
gated sodium NaV channel can exist in a third, “inactivated” state. For the following
discussion of the gating processes leading to the generation of an AP, it is important to
keep in mind that the voltage dependent conformational changes of ion channels are
probabilistic events. This means as the transmembrane potential changes, the probability
for individual ion channels to transition to another gating state changes. Applied to the
large number of voltage gated ion channels in the membrane, the probabilities can also
be considered as fractions of channels that transition to a specific state.
At rest, most NaV and KV activation gates are closed and most NaV deactivation gate are
open (Figure 1.4.b). Upon membrane depolarization, that is a reduction of the negative
transmembrane resting potential, the NaV activation gates rapidly open and Na+ ions,
following their electrical and concentration gradient, enter the intracellular space. This
influx of positive charged Na+ ions further depolarizes the membrane. However, the
reduced negative transmembrane potential also leads to a steady opening of KV activation
gates, causing a gradual outflux of K+ ions. If the net influx of Na+ exceeds the outflux of
K+ sufficiently to depolarize the membrane to the threshold potential of approximately -
55mV, a rapid opening of all NaV activation gates causes a strong Na+ influx and
membrane depolarization gives rise to an action potential (Figure 1.4.c). Dependent on
time and voltage the NaV deactivation gates close, stopping further influx of Na+, and the

Chapter 1: Introduction
S. Eickhoff - January 2021 12
continuing outflux of K+ leads to a repolarization of the membrane. During this period of
repolarization, the NaV channels gradually return to their resting state, closing their
activation gates and opening their deactivation gates (Figure 1.4.d). Due to the slower
closing behaviour of K+ activation gates, that can as analogy be considered as heavy (and
thus inert) doors, K+ outflux continues for a relatively long time causing a
hyperpolarization of the membrane (Figure 1.4.e). Once the KV activation gates are closed
the membrane returns to its resting potential.
Figure 1.4 Membrane conductances during the action potential. a) Numerical solution of
Hodgkin and Huxley membrane model reconstructs the voltage profile V of an action potential
quantitatively. g is the total ionic conductance across the membrane, gNa the sodium conductance,
and gK the potassium conductance. (Hodgkin and Huxley, 1952b) Copyright by John Wiley and
Sons. Reprint with permission, colouration added. b) At rest, the activation gates of NaV and KV
channels are closed, while the NaV deactivation gate is open. c) A depolarization of the membrane
rapidly opens the NaV activation gate, allowing Na+ to the enter the cell. KV activation gates open
more slowly, resulting in moderate potassium outflux. d) Repolarization of the membrane is
initiated by the gradual closing of the NaV deactivation gate, whereas the KV activation gate
remains open, allowing K+ ions to leave the cell. e) The membrane hyperpolarizes when it is not
conductive to Na+ ions anymore, while K+ ions still leave the cell. f) The membrane restores its
resting potential by closing the NaV and KV activation gates and opening the NaV deactivation
gate.

Chapter 1: Introduction
S. Eickhoff - January 2021 13
Physiologically, the initial stimulus of gradual membrane depolarization occurs at the
neuron’s cell body. Here many subthreshold input signals, that arrive via synapses either
at the dendrites or at the cell soma membrane, are integrated and, if the integrated input
signal reaches the threshold, an action potential is triggered. From there the AP propagates
along the axon, leaving the membrane that it passed in a state of refractoriness. During
what is called the absolute refractory period (ARP), the NaV deactivation gates are closed
and the membrane cannot be excited to trigger a second AP (Figure 1.4.e). Once the NaV
deactivations gates are open again but the KV activation gates are not yet completely shut,
the membrane is in the relative refractory period (RRP). During this period, the
membrane can be excited a second time but the increased outflux of K+ (with respect to
the fully recovered membrane at rest) leads to an increased threshold for AP generation
(Figure 1.4.f). These refractory periods, especially the ARP, are responsible for the
unidirectional propagation of APs in the nervous system. APs triggered at the cell soma
travel along the peripheral axon to the axonal terminals where they release
neurotransmitters to convey the signal to neighbouring cells. APs do not reflect or
“bounce back” since the membrane behind the spike is in an ARP and only the membrane
region in front of the spike can be excited to convey the AP in this forward direction.
This propagation occurs in a saltatory, i.e. “jumping”, manner in myelinated axons. Due
to the insulating myelin sheath, that reduces the internodal membrane capacitance and
increases its resistance, APs can only be triggered at the nodes of Ranvier where the
membrane is exposed (Huxley and Stämpfli, 1949). This saltatory propagation results in
increased conduction velocities of myelinated compared to unmyelinated nerve fibres
(compare Table 1.1).
1.2.2 The neuromuscular junction
At the neuromuscular junction (NMJ), also called motor endplate, the presynaptic action
potential of a motor nerve terminal is conveyed, via release of the neurotransmitter
acetylcholine ACh, to a skeletal muscle fibre, where the postsynaptic action potential
propagates along the muscle membrane and initiates muscle contraction. Besides the
muscle fibre and the motor nerve terminal, which are separated by a synaptic cleft of
approximately 50nm, the third element of the tripartite NMJ is the perisynaptic Schwann
cell that caps the synapse. In general, each skeletal muscle fibre is innervated by a single
terminal branch of a motor neuron and the NMJ is typically located in the middle of that
muscle fibre (Figure 1.5.a).

Chapter 1: Introduction
S. Eickhoff - January 2021 14
While the axons of motor nerves are myelinated, the terminal regions are only capped by
a single layer of the perisynaptic Schwann cell. The terminal motor nerve branches into
grape-like varicosities, the synaptic boutons, that contain vesicles of the neurotransmitter
ACh. These vesicles cluster around regions of specialized presynaptic membrane, the
active zones, where voltage gated Ca2+ channels prevail with an increased density. The
active zones are located opposite of junctional folds in the postsynaptic muscle
membrane, where also an increased density of ACh receptors is found (Figure 1.5.b). The
precise alignments of CaV channels at the presynaptic active zones and the ACh receptors
at the junctional folds are important for the performance of signal transmission at the
NMJ.
Upon arrival of a motor nerve action potential at the presynaptic membrane, the changes
in transmembrane potential increase the conductance of the CaV channels at the active
zones and Ca2+ enters the synaptic bouton following both its electrical and concentration
gradient. Increased presynaptic Ca2+ concentration triggers an exocytosis of synaptic ACh
vesicles, which involves binding of specialized proteins in the vesicle membrane, called
v-SNARES, with their counter parts in the nerve terminal membrane, called t-SNARES.
After release of the neurotransmitter ACh into the synaptic cleft, the membranes of the
empty vesicles are retrieved in a process called endocytosis. This transmitter release is a
quantal process that can either happen upon arrival of a motor nerve AP, in which case
Figure 1.5 Schematic representation of the neuromuscular system. a) The neuromuscular
junction where the terminal branch of a motor nerve is in synaptic contact with a single muscle
fibre. b) Cross-sectional representation of a synaptic bouton at the neuromuscular junction. c) An
electron microscopic representation of a longitudinal section of a single muscle fibre segment.
(Ko, 2001) Copyright by Elsevier. Reprint with permission.

Chapter 1: Introduction
S. Eickhoff - January 2021 15
many vesicles release ACh almost simultaneously, creating a strong endplate potential
(epp) that is sufficient to trigger an AP in the postsynaptic muscle membrane, or randomly
with a much lower probability (Katz, 1966). In this later case, which is thought to happen
at a frequency of about 1Hz, a single vesicle releases approximately 10,000 acetylcholine
molecules into the synaptic cleft and produces a miniature endplate potential (mepp) of
about 0.5mV (Ko, 2001).
Both mepps and epps are caused by binding of the released ACh to nicotinic 4
acetylcholine receptors (nAChRs) in the muscle membrane. A nAChR is a non-selective
ligand gated cation channel that, when two ACh molecules bind to its two α-subunits,
becomes permeable to Na+ and K+. The increased permeability of the postsynaptic muscle
membrane to Na+ and K+, results in changes of the transmembrane potential. When the
sum of the depolarizing epps reaches the threshold potential, as outlined above on the
example of a nerve membrane depolarization (Chapter 1.2.1), a self-propagating action
potential is triggered in the muscle membrane. Through a protein called agrin, which is
synthesized by the motor neuron and released in the extracellular matrix at the NMJ, the
presence of the motor nerve terminal triggers an aggregation of nAChRs at the endplates.
Here the receptors prevail at a density of approximately 10,000 per µm2, a spatial
concentration much higher than at the rest of the muscle membrane, where less than 10
nAChRs are found in a space of 1 µm2 (Ko, 2001). This aggregation of nAChR at the
endplates is lost following nerve damage, i.e. in denervated muscle, where the receptors
disperse evenly over the muscle membrane, a phenomenon which is termed denervation
supersensitivity.
Besides agrin, the extracellular matrix at the NMJ, which is also called the basal lamina,
contains further important molecules such as the laminin glycoproteins that play an
important role in in nerve growth and nerve terminal differentiation. Another crucial
molecule of the basal lamina is the enzyme acetylcholinesterase, which hydrolyses ACh
molecules that did not bind to nAChRs, and thus prevents those receptors to become
desensitized through continuous exposure to ACh.
4 nAChR receptors belong to the group of nicotinic receptors that can be activated by nicotine derived from
the tobacco plant. They are thus distinguished from muscarinic acetylcholine receptors (mAChRs) that are
more sensitive to the mushroom derived muscarine than to nicotine.
Chapter 1: Introduction
S. Eickhoff - January 2021 16
1.2.3 Skeletal muscle contraction
Skeletal muscles consist of multiple bundles (fascicles) of individual muscle fibres.
Human muscle fibres are multinucleated myocytes with diameters of 10-100µm and
lengths between 1mm (stapedius muscle) and 30cm (sartorius muscle). Each muscle fibre
consists of many myofibrils, longitudinal contractile elements, in parallel. The myofibrils
are chains of repeated contractile units, the sarcomeres, that are composed of thin actin
and thick myosin filaments. Actin and myosin filaments are arranged in parallel, partially
overlapping each other, and together form the so-called A-band. The I-Band is composed
of actin, the Z-discs, and the elastic titin elements, which are connected in series to the
thick myosin filaments. The repetitive pattern of A and I bands gives the skeletal muscle,
when viewed under the microscope, a striated appearance which is why it is also referred
to as striated muscle (Figure 1.5.c).
The transmission of electrical action potentials at the muscle membrane to contractions
is termed excitation-contraction coupling and relies on the release of Ca2+ into the
cytoplasm. The motor nerve action potential is transmitted at the NMJ via ACh release to
trigger an action potential in the postsynaptic muscle membrane. The AP propagates
along the membrane invaginations, called transverse tubules (or T-tubules), where it
initiates Ca2+ release from the sarcoplasmic reticulum into the cytosol. According to the
sliding filament theory (Huxley and Hanson, 1954; Huxley and Niedergerke, 1954), Ca2+
causes conformational changes of tropomyosin complexes, unblocking actin binding
sides and enabling the myosin power stroke. This process is referred to as crossbridge
cycle and it is the basis for muscle contraction. Once the Ca2+ is pumped back into the
sarcoplasmic reticulum the actin binding site are blocked again and the muscle relaxes.
Thus, calcium is not only essential for the ACh release at the NMJ, but it is also of central
importance in the excitation-contraction coupling.
In isometric condition, the mechanical muscle response to a stimulus can be modelled
with a three-element Hill muscle model (Hill, 1938). The absolute muscle force is the
sum of the active, or developed, muscle twitch force of the contractile element CE and
the passive muscle tension. The developed contractile tension is a function of muscle
length as it influences the relative amount of actin and myosin filament overlap and the
proportion of myosin heads that can perform the power stroke. The two model
components contributing to the length-dependent passive tension are the elastic series
element SE and the elastic parallel element PE (Figure 1.6.a). While the SE represents
the passive tension of the elastic titin element in the sarcomere units and the mainly

Chapter 1: Introduction
S. Eickhoff - January 2021 17
collagenous connective tissue of the tendons, the PE models connective tissue that is
parallel to the sarcomeres. As both the active and the passive muscle tension depend on
muscle length, there is an ideal isometric muscle length where the developed muscle
twitch force is maximal while the passive tension is not yet excessively increasing (Figure
1.6.b).
1.3 Electrical stimulation
Electrical stimulation (ES) is a neuromodulation technique that finds application in a
broad array of therapeutic fields and medical devices including:
• the cardiac pacemaker,
• auditory prosthesis for deaf subjects,
• visual prosthesis for blind subjects,
• chronic pain treatment,
• improving bladder control in paraplegics,
• restoration of locomotive functions for paralysed subjects,
• and muscle rehabilitation and recovery.
Figure 1.6 Skeletal muscle model. a) Three element Hill-type muscle model consists of a
contractile element CE and an elastic element in series SE and an elastic element in parallel PE.
b) The isometric muscle tension is the is the sum of the active, or developed, twitch force and the
passive tension. Both elements that contribute to total muscle tension are functions of muscle
length.

Chapter 1: Introduction
S. Eickhoff - January 2021 18
Beside these contemporary applications of ES, recent advances in nanoelectronics give
rise to promising research and developments in the emerging field of bioelectronic
devices. These miniaturized devices, also called electroceuticals, are envisioned to be
placed minimally invasively to the central or peripheral nervous system and to deliver ES
to provide treatment for a range of diseases including type 2 diabetes (Sacramento et al.,
2018; Fjordbakk et al., 2019), renal fibrosis, and hypertension (Okusa, Rosin and Tracey,
2017).
Despite this wide-reaching range of ES applications and research endeavours, the
underlying mechanism by which the therapeutic effect is achieved or pursued is the same
in all cases: Electrical charge is delivered to a target excitable structure in order to
influence voltage gated channels, usually to generate action potentials, and thereby to
control the release of neurotransmitters.
This injected charge creates an artificial potential field between the poles of the
stimulation source, altering the state of voltage-gated ion channels affected by that field.
This modulation effect can either be inhibitory or excitatory, and can in the latter case, if
sufficiently intense, evoke self-propagating action potentials leading to neurotransmitter
release at the axonal terminals. While some electrical stimulation therapies are claimed
to be “subthreshold”, the targeted control of neurotransmitter release provides the basis
for the therapeutic effects of most well-studied ES applications. Increased
neurotransmitter release may for example be used to activate muscle fibres and thus
generate locomotion or to provide visual or auditory perception. A decreased
neurotransmitter release can be achieved by blocking action potential conduction
pathways. Such a block can be achieved both with kilohertz frequency alternating current
(KHFAC) or with direct current (DC) and may be used to inactivate or downregulate the
nervous system (Bhadra and Kilgore, 2018), e.g. to reduce spasticity or chronic pain.
Besides a general introduction of the above outlined mechanisms underlying ES, in this
chapter the principal technical components and parameters of ES systems will be
discussed. This discussion includes the general topologies of stimulator output stages,
waveforms commonly used for neural stimulation, principal electrode arrangements and
the electrode-tissue interface as well as electrochemical processes that may occur at the
latter. Lastly, some important relationships between stimulation parameters such as
stimulus duration and amplitude, charge injection, and energy consumption at a given
activation threshold will be introduced.

Chapter 1: Introduction
S. Eickhoff - January 2021 19
Prior to these technical discussions it will be useful to introduce some basic terminologies,
physical quantities and the laws describing their relations.
1.3.1 Basic terminologies and physical quantities
Electric charge is a fundamental property of matter, causing it to experience a force when
placed in an electromagnetic field. Electric charge, quantified in the SI unit5 coulomb,
can either be positive or negative. Charge can neither be generated nor destroyed, but it
can be separated. Like charges exert a repulsive force on each other, while opposite
charges attract each other. For our discussion of processes occurring during extracellular
stimulation, atomic or molecular carriers of electric charge, so-called ions, will have a
central place. The amount of work required to move an electric charge through an
electromagnetic field, which can also be understood as energy carried per unit of charge,
is termed voltage and its SI unit is volt. The rate of charge flow (coulomb per second)
through a specific point or region is the electric current, quantified in ampere, and is one
of the seven SI base quantities. Conventional current flow is defined as movement of
positive charge, from the positive pole (i.e. the anode) of a stimulation source to the
negative pole (i.e. the cathode). Electrons flow in the opposite direction, from the cathode
to the anode.
The terms cathode and anode are grounded in the electrochemical processes occurring at
physical electrodes at a specific time. In extracellular electrical stimulation the anode is
the electrode through which conventional current (positive charge) is applied and at
which, following the increased positive valence, oxidation reactions take place. The
cathode is defined as the electrode at which conventional current is removed, which
represents a decreased positive valence or an electron gain, and at which reduction occurs.
In practical applications of ES, it is important not to confuse these terms, as sadly often
is the case even in peer-reviewed literature, with physical electrode descriptions such as
active, return or stimulation electrode. As we elaborate below, most waveforms used for
neural stimulation are biphasic, meaning that they are comprised of a cathodic (typically
first) and anodic phase to achieve charge balance. This means that both physical
5 The International System of Units (SI) is comprised of the seven base units: kilogram, second, metre,
ampere, candela, kelvin, and mole for the base quantities mass, time, length, electric current, luminous
intensity, temperature, and amount of a substance. These units are the backbone of the modern metric
system and the basis for all derived units.

Chapter 1: Introduction
S. Eickhoff - January 2021 20
electrodes of the stimulation system will act as a cathode as well as an anode at some
point during the stimulation.
Further, possible misunderstandings can be avoided when we clearly differentiate the
terms monophasic and biphasic from monopolar and bipolar. As we started to outline
above, the terms monophasic and biphasic describe waveform characteristics. A
monophasic pulse is comprised of charge injection with only one polarity, while a
biphasic pulse has a positive and a negative phase (Chapter 1.3.5). The terms monopolar
and bipolar on the other hand describe two principal electrode configurations used for ES
and will be explained in more detail in Chapter 1.3.4.
1.3.2 Electrically evoked action potentials
For this introduction of the mechanisms leading to action potential generation through
ES, we assume that an electrical charge is injected at the active electrode, which can be
idealized as a point source, in the extracellular space6 near the target nervous structure
and returned over a large, remotely placed return electrode. This stimulation electrode
arrangement, which is called monopolar, is the configuration used in most early
experiments and computational models of ES and is the operational mode of many
contemporary ES applications. The electric potential field that arises between both
electrodes during the injection of a negative (i.e. cathodic) charge has its highest field
density at the active electrode near the target nerve. Here the injected negative charge
(electron gain) counters the predominantly positive charge at the outside of the nerve
membrane. The less positive charge at the outside of the membrane leads to a flow of
negative charge on the inside, along the long axis of the axon and away from the site of
(extracellular) stimulation. This displacement of negative charge along the axon, away
from the site of stimulation can effectively be understood as a positive charge crossing
6 Action potentials can also be electrically evoked using intracellular injection of positive (i.e. anodic)
charge, as was done in many early electro-neurophysiology investigations. Most famously, based on Cole’s
voltage clamp experiment, Hodgkin and Huxley inserted microelectrodes inside giant squid axons to study
how ionic currents give rise to the action potential, a work for which they received the 1963 Nobel Prize in
Physiology or Medicine. However, intracellular stimulation has obvious limitations for its clinical use in
human subjects as the diameter of mammalian axons, unlike the axons of the giant squid which have
diameters of up to 1mm, ranges only from 0.2 to 20µm. Since both principal ES electrode types that find
clinical application in human subjects, transcutaneous surface electrodes and implanted electrodes,
stimulate nerve or muscle fibres extracellularly, we will focus on extracellular charge injection.

Chapter 1: Introduction
S. Eickhoff - January 2021 21
the membrane from the inside to the outside. This is called capacitive current, as the
stimulation pulse discharges the membrane capacitance. The capacitive current
predominately flows through the uninsulated part of the axon membrane, i.e. the node of
Ranvier, closest to the stimulating electrode. The equalizing, inward flowing currents are
distributed over the adjacent nodes at reduced current densities. The transmembrane
currents flowing through the nodes of Ranvier, with the highest current density at the
node closest to the stimulation electrode, change the transmembrane potential. In our
example of an extracellular cathodic charge injection, leading to a positive capacitive
current with the highest density at the node closest to the stimulation electrode, the
negative transmembrane resting potential is reduced (i.e. depolarized) at the site of
stimulation. The reduced transmembrane potential increases the probability of activatable
voltage gated Na+ channels, which are found in their highest spatial density of 2000
channels/µm2 at the nodes of Ranvier, to transition to the open state. NaV channel opening
is a stochastic event and an increased probability for transitioning to the open state (of the
tens of thousands of Nav channels in a single node of Ranvier) results in an increased
influx of Na+ ions following both the potential and the concentration gradient. If the influx
of Na+ ions exceeds the net outward flow of K+ ions sufficiently to reduce the
transmembrane potential below the threshold of approximately -55mV, a rapid opening
of all activatable Nav channels takes place and thus a self-propagating action potential is
generated. The peripherally evoked action potential travels (in both directions) along the
stimulated axon and leads to a release of neurotransmitters at the neuron’s terminals.
If the membrane depolarization following the cathodic charge injection is insufficient to
reach the threshold membrane, no self-propagating action potential is evoked, and the
stimulation is called subthreshold.

Chapter 1: Introduction
S. Eickhoff - January 2021 22
As described above, the highest density of transmembrane capacitive current occurs at
the node closest to the stimulation electrode. In the case of cathodic stimulation this was
the location where the action potential was elicited following a chain of events set in
motion by that maximal capacitive current density. However, this is not always the case.
If we inject a positive (i.e. anodic) charge in the extracellular space, we find that the
capacitive current profile along the axon is inverted. The highest current density will still
be through the membrane of the node closest to the stimulation electrode, only this time
it is equivalent to an inward flow of positive charge, causing a hyperpolarization at this
location. Equalizing this capacitive inward flow, less dense outward currents will flow
through the adjacent nodes on both sides, creating zones of depolarization. Given
sufficient strength of the anodic stimulation, the potential across the membrane in those
zones of depolarization can be reduced to reach the threshold and action potentials are
elicited.
Another mechanism that can lead to the electrical elicitation of action potentials is the so-
called anodic break excitation. Here, an excitatory (positive) capacitive current flows
through the central node of Ranvier following the electric field change after termination
of a prolonged anodic pulse. The anodic pulse hyperpolarizes the membrane (increases
the transmembrane potential) under the stimulation electrode which causes the majority
Figure 1.7 Model of extracellular charge injection with a monopolar stimulation point
source. a) An injection of cathodic (negative) charge in the extracellular space results in a
depolarization (i.e. a reduction of the transmembrane potential) of the axon’s membrane at the
central node of Ranvier. b) The injection of anodic (positive) charge in the extracellular space
leads to a hyperpolarization (i.e. an increase of the transmembrane potential) at the central node.
These changes in the transmembrane potential can be understood as capacitive currents across the
membrane, positive charge crossing the membrane from the inside to the outside are visualized
as upward arrows, and currents of positive charge entering the cell are indicated by downward
arrows. Equalizing currents through the adjacent nodes have opposite directions and reduced
current densities than the capacitive currents through the central node of Ranvier.

Chapter 1: Introduction
S. Eickhoff - January 2021 23
of Nav deactivation gates to fully open7 and thus renders the membrane more excitable
(Grill and Mortimer, 1995). The termination of the anodic pulse can be understood as a
cathodic field transition, re-establishing the resting potential. This cathodic field
transition finds the nerve membrane in its hyperexcitable (nearly 100% of Nav channels
are activatable) state and causes Nav channel opening, leading to increased Na+ influx. If
this influx is not countered by K+ outward currents, and depolarizes the membrane
sufficiently to reach the threshold, an action potential is elicited.
Even though a detailed discussion of computational approaches to describe these
mechanisms leading to excitation would exceed the scope of the present thesis, the above
considerations of capacitive currents along the axon during extracellular stimulation lead
to the introduction of an important concept of numerical nerve simulations: the activating
function.
The activating function is a mathematical description of the transmembrane potential
change induced by an applied stimulation. It is derived from the McNeal cable model
(McNeal, 1976) and based on the second difference quotient of the extracellular field
along the axon (Rattay, 1986).
𝑽𝒆,𝒏−𝟏 − 𝟐𝑽𝒆,𝒏 + 𝑽𝒆,𝒏+𝟏 (1.8)
In this generalized form of the activating function, Ve,n represents the magnitude of the
extracellular potential at the central node of Ranvier, while Ve,n-1 and Ve,n+1 represent these
measures for the adjacent nodes respectively. Where the activating function is positive,
the membrane at that location experiences a depolarizing effect, while a negative
activating function represents a hyperpolarization respectively. The potential generated
by the stimulation point source at any point (in the two-dimensional space) is proportional
to 1/r, where r is the radial distance from the electrode:
𝒓 = √𝒛𝟐 + 𝒙𝟐 (1.9)
The essential influence of the activating function on simulation of peripheral nerve
stimulation will be illustrated in brief to provide a mechanistic explanation for an
7 At resting state, the inactivation variable h is approximately 0.8, meaning that the probability for the
deactivation gate of a NaV channel to be open is 80%. Upon hyperpolarization of the membrane this value
approaches 1 so that the membrane becomes hyperexcitable (Grill and Mortimer, 1995).

Chapter 1: Introduction
S. Eickhoff - January 2021 24
experimental observation called inverse recruitment, that describes how electrical
stimulation tends to recruit large diameter fibres first, which are physiologically recruited
at last8.
Figure 1.8 shows segments of two myelinated axons of different sizes. Importantly, the
internodal spacing scales proportionally with myelin outer diameter and equals
approximately 100 times that diameter (Hursh, 1939; Rushton, 1951). For larger fibres,
the increased internodal distance results in increased radial distance of the adjacent nodes
n-1 and n+1 from the stimulation electrode and thus decreases their influence in the
activation function of the central node of Ranvier n. This results in lower activation
threshold for peripheral stimulation of larger diameter axons and thus in an inverse order
of recruitment.
8 Physiologically, the neuromuscular system first recruits small motor neurons that innervate fatigue
resistant slow twitch muscle fibres and only later, if that higher twitch force is required, large diameter
motor neurons that innervate the less fatigue resistant fast twitch muscle fibres. This neuromuscular
recruitment order is known as Henneman’s size principle. Inverse recruitment describes a recruitment of
large diameter nerve fibres prior to smaller diameter fibres, such as is the case with ES of peripheral efferent
nerves. This inversed order of recruitment presents challenges to neuromuscular stimulation endeavours
because the large fibres that are preferably activated generate intense muscle twitches, unfit for many fine
locomotive operations and are prone to fatigue early.
Figure 1.8 Axon-size influence on activating function for extracellular stimulation. Two
axons are stimulated via a monopolar stimulation point source, centrally located over a node of
Ranvier at distance z. The smaller diameter axon a) has a proportionally smaller internodal
distance x1 than the larger diameter axon b) with internodal distance x2. The magnitude of the
potential at the central node Ve,n is equal for both axon sizes (since z is equal). However, due to
the larger radial distance of the adjacent nodes to the stimulation source for the larger diameter
axon (r2>r1), the magnitude of the extracellular potential at these neighbouring nodes Ve,n-1 and
Ve,n+1 is reduced in case of the larger axon. This reduction of Ve,n-1 and Ve,n+1 increases the
activating function at the central node for larger diameter axons, rendering them more excitable
to extracellular stimulation than smaller axons and results in lower thresholds for activation.

Chapter 1: Introduction
S. Eickhoff - January 2021 25
1.3.3 Electrical stimulators
The electrical stimulator is the central piece of hardware of any ES system. Its main tasks
are the generation and amplification of the simulation pulses that are then applied over
the electrodes to the target excitable structure. The basic elements comprising an electrical
stimulator are the pulse generation circuitry, a voltage supply, and an output stage. While
many contemporary stimulators combine all these elements in a single device, the
ongoing endeavour to miniaturize stimulation implants lead to numerous developments
of stimulators that receive power wirelessly from an external power supply. Moving on
from the original proposal of the wirelessly powered BION micro-stimulation implants
(Loeb et al., 1991), passive stimulation implants are under development that do not
contain any active circuitry and instantly convert the wirelessly received energy (e.g. via
acoustic waves, infrared light, or radio frequency) into an electrical impulse for neural
stimulation (Sahin and Pikov, 2011). Independent of those design differences regarding
the separation of power supply, active and passive circuitry components, a main
functional distinction can be made based on the output stage topology.
Voltage-controlled stimulation
Voltage-controlled stimulation output stages deliver the desired stimulation pulse,
independent of the load impedance and output current, as a voltage waveform. Figure 1.9
illustrates the controlled voltage across as well as the resulting current through the
stimulation electrodes qualitatively for basic waveforms.
Generally, the design of output stages for voltage-controlled stimulation is simpler than
that of current-controlled stimulators as most power sources (e.g. batteries, mains
electricity) are voltage sources. Basic output stages for voltage-controlled stimulation can
be comprised of a simple network of switches, disconnecting and connecting the voltage
source in the desired polarity (and with appropriate patient coupling, e.g. over capacitors)
with the electrodes. Such low circuit complexity results in higher energy efficiency
compared to output stages that incorporate operational amplifiers. Stimulation amplitude
modulation can be achieved with linear or with switching regulators. While linear
regulators are the simpler solution, their inherent low energy efficiency represents a major
disadvantage for battery powered stimulation systems, where energy consumption is a
main performance parameter.
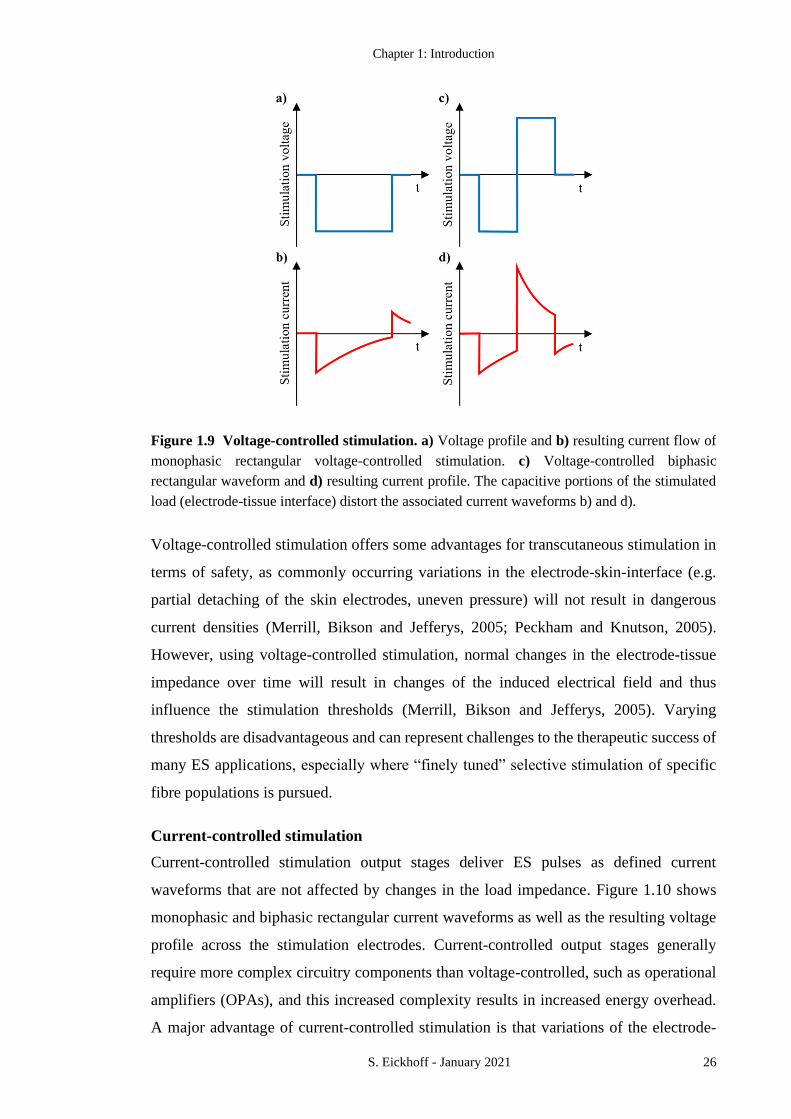
Chapter 1: Introduction
S. Eickhoff - January 2021 26
Voltage-controlled stimulation offers some advantages for transcutaneous stimulation in
terms of safety, as commonly occurring variations in the electrode-skin-interface (e.g.
partial detaching of the skin electrodes, uneven pressure) will not result in dangerous
current densities (Merrill, Bikson and Jefferys, 2005; Peckham and Knutson, 2005).
However, using voltage-controlled stimulation, normal changes in the electrode-tissue
impedance over time will result in changes of the induced electrical field and thus
influence the stimulation thresholds (Merrill, Bikson and Jefferys, 2005). Varying
thresholds are disadvantageous and can represent challenges to the therapeutic success of
many ES applications, especially where “finely tuned” selective stimulation of specific
fibre populations is pursued.
Current-controlled stimulation
Current-controlled stimulation output stages deliver ES pulses as defined current
waveforms that are not affected by changes in the load impedance. Figure 1.10 shows
monophasic and biphasic rectangular current waveforms as well as the resulting voltage
profile across the stimulation electrodes. Current-controlled output stages generally
require more complex circuitry components than voltage-controlled, such as operational
amplifiers (OPAs), and this increased complexity results in increased energy overhead.
A major advantage of current-controlled stimulation is that variations of the electrode-
Figure 1.9 Voltage-controlled stimulation. a) Voltage profile and b) resulting current flow of
monophasic rectangular voltage-controlled stimulation. c) Voltage-controlled biphasic
rectangular waveform and d) resulting current profile. The capacitive portions of the stimulated
load (electrode-tissue interface) distort the associated current waveforms b) and d).
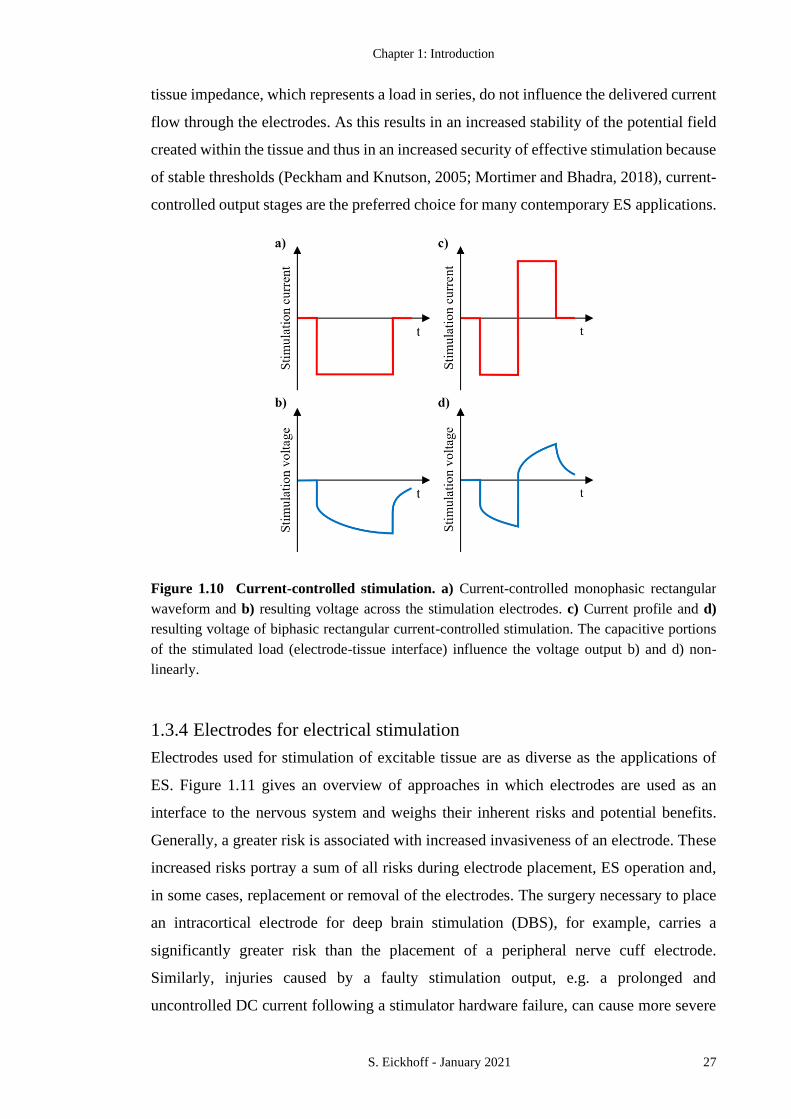
Chapter 1: Introduction
S. Eickhoff - January 2021 27
tissue impedance, which represents a load in series, do not influence the delivered current
flow through the electrodes. As this results in an increased stability of the potential field
created within the tissue and thus in an increased security of effective stimulation because
of stable thresholds (Peckham and Knutson, 2005; Mortimer and Bhadra, 2018), current-
controlled output stages are the preferred choice for many contemporary ES applications.
1.3.4 Electrodes for electrical stimulation
Electrodes used for stimulation of excitable tissue are as diverse as the applications of
ES. Figure 1.11 gives an overview of approaches in which electrodes are used as an
interface to the nervous system and weighs their inherent risks and potential benefits.
Generally, a greater risk is associated with increased invasiveness of an electrode. These
increased risks portray a sum of all risks during electrode placement, ES operation and,
in some cases, replacement or removal of the electrodes. The surgery necessary to place
an intracortical electrode for deep brain stimulation (DBS), for example, carries a
significantly greater risk than the placement of a peripheral nerve cuff electrode.
Similarly, injuries caused by a faulty stimulation output, e.g. a prolonged and
uncontrolled DC current following a stimulator hardware failure, can cause more severe
Figure 1.10 Current-controlled stimulation. a) Current-controlled monophasic rectangular
waveform and b) resulting voltage across the stimulation electrodes. c) Current profile and d)
resulting voltage of biphasic rectangular current-controlled stimulation. The capacitive portions
of the stimulated load (electrode-tissue interface) influence the voltage output b) and d) non-
linearly.
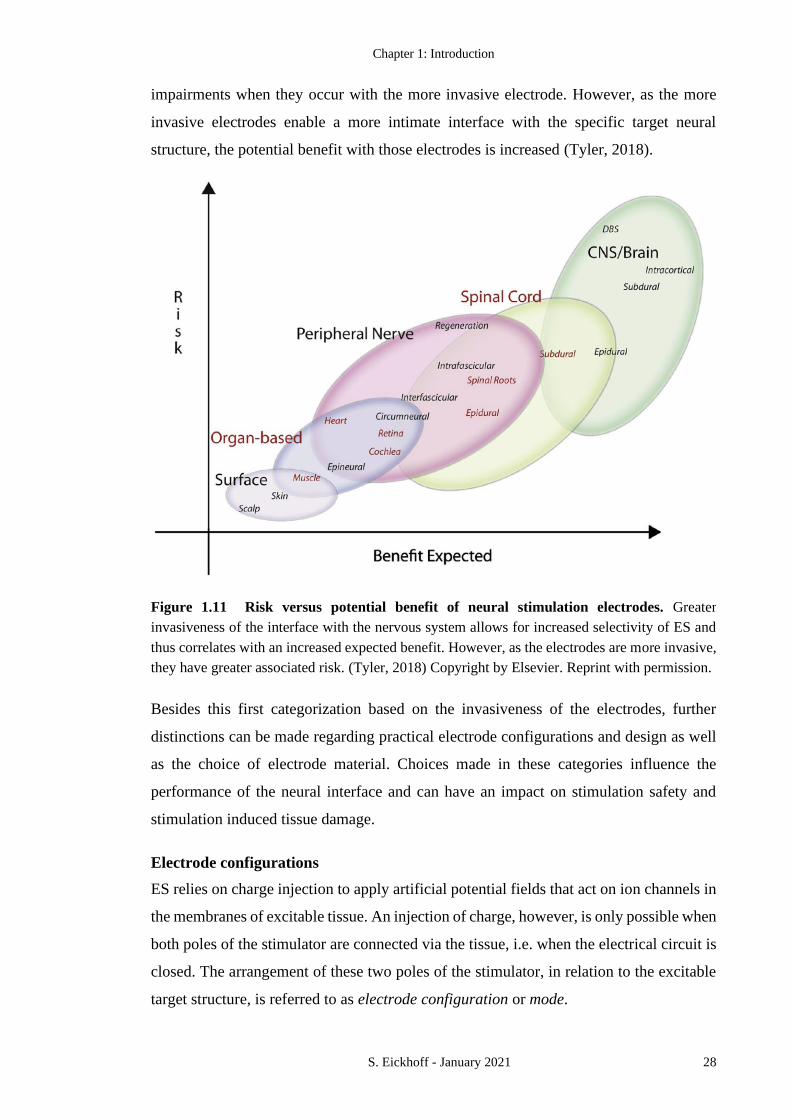
Chapter 1: Introduction
S. Eickhoff - January 2021 28
impairments when they occur with the more invasive electrode. However, as the more
invasive electrodes enable a more intimate interface with the specific target neural
structure, the potential benefit with those electrodes is increased (Tyler, 2018).
Besides this first categorization based on the invasiveness of the electrodes, further
distinctions can be made regarding practical electrode configurations and design as well
as the choice of electrode material. Choices made in these categories influence the
performance of the neural interface and can have an impact on stimulation safety and
stimulation induced tissue damage.
Electrode configurations
ES relies on charge injection to apply artificial potential fields that act on ion channels in
the membranes of excitable tissue. An injection of charge, however, is only possible when
both poles of the stimulator are connected via the tissue, i.e. when the electrical circuit is
closed. The arrangement of these two poles of the stimulator, in relation to the excitable
target structure, is referred to as electrode configuration or mode.
Figure 1.11 Risk versus potential benefit of neural stimulation electrodes. Greater
invasiveness of the interface with the nervous system allows for increased selectivity of ES and
thus correlates with an increased expected benefit. However, as the electrodes are more invasive,
they have greater associated risk. (Tyler, 2018) Copyright by Elsevier. Reprint with permission.

Chapter 1: Introduction
S. Eickhoff - January 2021 29
While there is a broad range of proposed electrode configurations for neural stimulation,
monopolar and bipolar stimulation configurations are by far the most commonly used
modes in contemporary neuromodulation devices (Fallon and Carter, 2016).
Monopolar
In a monopolar stimulation configuration, the stimulation waveform is applied via an
active electrode which is typically in close proximity to the target structure. Despite the
name monopolar, it is important to remember that charge injection can only be achieved
when both poles, active and return, of the stimulator are connected. In monopolar
configurations the charge is returned over a large, typically remotely placed electrode.
Often this charge return is achieved via the conductive casing of the stimulator itself.
Advantages of monopolar configurations are that, in many applications, the high field
density at the (usually small) active electrode (near the target excitable structure) results
in lower thresholds for activation. Monopolar electrode configurations have been the
standard mode for most of the early ES devices, such as cardiac pacemakers, and are still
used in many contemporary applications. Also, most early computational investigations
of extracellular nerve stimulation, like the landmark studies by McNeal (1976) and Rattay
(1986), have modelled the stimulation electrode as a monopolar point source.
Bipolar
In the bipolar configuration however, the stimulation pulses are delivered between two
electrodes of similar size and typically similar proximity to the targeted structure. This
creates a much more contained potential field within the tissue, allowing for finer
adjustments of the activating field and thus reducing unwanted co-activation. Thresholds
for activations in terms of current or voltage are generally higher with bipolar compared
to monopolar stimulation, which results in increased energy consumption and thus
represents a disadvantage, especially for battery powered devices. While in some
contemporary applications, e.g. those operating with electrode arrays like cochlear
implants or epidural spinal cord stimulators, one can typically choose between using the
monopolar and the bipolar configuration, in other cases application specific parameters
predetermine the electrode configuration. For example, in the emerging field of
miniaturized bioelectronic implants, so called electroceuticals (Famm et al., 2013;
Birmingham et al., 2014), the electrodes are envisioned as integral with the stimulator.
The small overall device size does not allow substantial electrode separation, and so the
stimulation configuration is inevitably bipolar.
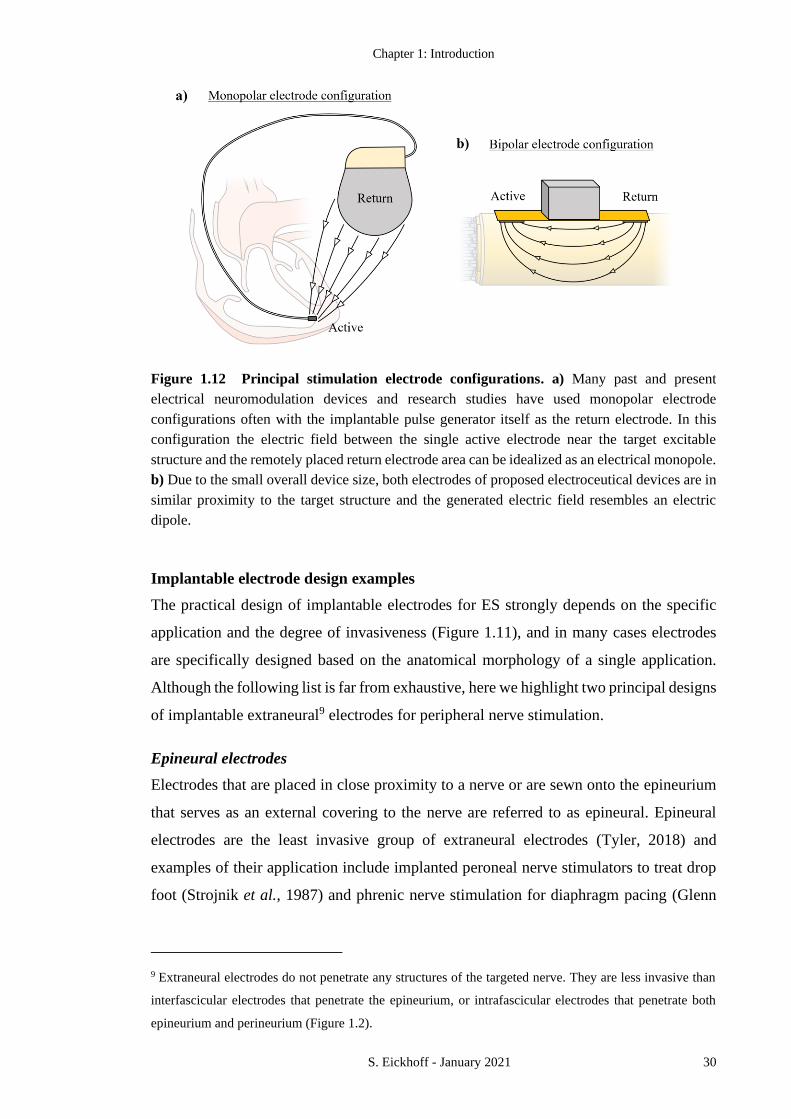
Chapter 1: Introduction
S. Eickhoff - January 2021 30
Implantable electrode design examples
The practical design of implantable electrodes for ES strongly depends on the specific
application and the degree of invasiveness (Figure 1.11), and in many cases electrodes
are specifically designed based on the anatomical morphology of a single application.
Although the following list is far from exhaustive, here we highlight two principal designs
of implantable extraneural9 electrodes for peripheral nerve stimulation.
Epineural electrodes
Electrodes that are placed in close proximity to a nerve or are sewn onto the epineurium
that serves as an external covering to the nerve are referred to as epineural. Epineural
electrodes are the least invasive group of extraneural electrodes (Tyler, 2018) and
examples of their application include implanted peroneal nerve stimulators to treat drop
foot (Strojnik et al., 1987) and phrenic nerve stimulation for diaphragm pacing (Glenn
9 Extraneural electrodes do not penetrate any structures of the targeted nerve. They are less invasive than
interfascicular electrodes that penetrate the epineurium, or intrafascicular electrodes that penetrate both
epineurium and perineurium (Figure 1.2).
Figure 1.12 Principal stimulation electrode configurations. a) Many past and present
electrical neuromodulation devices and research studies have used monopolar electrode
configurations often with the implantable pulse generator itself as the return electrode. In this
configuration the electric field between the single active electrode near the target excitable
structure and the remotely placed return electrode area can be idealized as an electrical monopole.
b) Due to the small overall device size, both electrodes of proposed electroceutical devices are in
similar proximity to the target structure and the generated electric field resembles an electric
dipole.

Chapter 1: Introduction
S. Eickhoff - January 2021 31
and Phelps, 1985). They are advantageous in applications where whole peripheral nerves
are to be stimulated, e.g. to activate synergistic muscle groups, like the dorsiflexors in the
example of drop foot stimulators, rather than single muscles. The benefits of relatively
low invasiveness, however, are bought at the expense of limited selectivity of the induced
electrical field. This presents challenges when only a subpopulation of a nerve is to be
stimulated and increases the potential for unwanted coactivation of nearby nervous
structures.
Circumneural electrodes
Circumneural, or nerve cuff, electrodes encircle a peripheral nerve and thus create an
intimate interface between that nerve and multiple electrode contacts incorporated into
the inner surface of the cuff. The cuffs are made of an insulating material, typically
silicone, which confines the electrical field within them. Selective stimulation with cuff
electrodes has been demonstrated in various clinical applications including standing
systems in paraplegic subjects (Fisher et al., 2006) and control of the upper extremity in
human subjects (Polasek et al., 2007). The increased invasiveness of cuff electrodes
compared to other extraneural electrodes is associated with greater risks. A major
challenge of circumneural electrode interfaces is the risk of squeezing the nerve and thus
restricting blood flow. In order not to exceed safe levels of intraneural pressure (Rydevik,
Lundborg and Bagge, 1981) self-sizing spiral (Naples et al., 1988) and helix (Agnew et
al., 1989) electrode cuffs have been developed. These cuffs can accommodate some
swelling of the nerve, which might, for example, occur during an inflammation, without
dangerously increasing intraneural pressure, while maintaining a tight fit after the
swelling is gone.
Materials for implantable stimulation electrodes
Besides the general requirements regarding biocompatibility that many biomedical
implants have in common, materials for implantable neural stimulation electrodes must
be electrochemically stable under pulsed conditions. Gold for example, a material that
exhibits a good general biocompatibility and is used in many medical implants, is not
suitable to be used as stimulation electrode material, as it readily dissolves when its
potential is raised a few hundred millivolts above the resting potential (Fallon and Carter,
2016). The main parameter that determines the performance of chronically implanted
electrodes under pulsed condition is the reversible charge storage capacity (CSC), that is
the amount of charge that may be stored at the electrode-tissue interface without causing

Chapter 1: Introduction
S. Eickhoff - January 2021 32
irreversible electrochemical processes, such as the formation of toxic molecular species.
Craggs et al. highlighted the central role of the electrode resting potential and introduced
the electrode limit-voltage plane to predict the maximum safe charge injection with a
given electrode without the formation of noxious molecular species (Craggs, Donaldson
and Donaldson, 1986).
a (Brummer and Turner, 1977).
b (Rose and Robblee, 1990).
c (Beebe and Rose, 1988).
d (Kelliher and Rose, 1987).
e (Agnew et al., 1986).
f (Robblee, 1983).
g (Guyton and Hambrecht, 1973, 1974).
h (Rose, Kelliher and Robblee, 1985).
i (Bernstein et al., 1977).
j (Donaldson, 1974).
k (Johnson et al., 1977).
l (Lagow, Sladek and Richardson, 1971).
Table 1.3 Reversible charge storage capacity and other parameters in electrode material
selection. (Merrill, Bikson and Jefferys, 2005) Copyright by Elsevier. Reprint with permission.
Reversible charge
storage capacity
(µC/cm2)
Reversible charge
injection processes
Corrosion
characteristics
Mechanical
characteristics
Platinum 300-350 ra; AF,
200µs: 50-100 gb;
CF, 200µs: 100-150
gb
Double layer
charging, hydrogen
atom plating, and
oxide formation and
reduction
Relatively resistant;
greatly increased
resistance with
protein
Relatively soft
Platinum-iridium
alloys
Similar CSC to Pt Stronger than Pt
Iridium Similar CSC to Pt Stronger than Pt
Iridium oxide AF: ±2200 gc,d; CF:
±1200 gc,d; AB:
±3500 gc,d,e
Oxide valency
changes
Highly resistante,f
316LVM stainless
steel
40-50 g Passive film
formation and
reduction
Resistant in passive
region; rapid
breakdown in trans-
passive region
Strong and flexible
Tantalum/tantalum
pentoxide
700 gg; 200 gh Capacitive only Corrosion
resistanti,j,k,l
r = real area; g = geometric area; AF = anodic first, charge-balanced; CF = cathodic first, charge-balanced; AB =
cathodic first, charge-balanced, with anodic bias.

Chapter 1: Introduction
S. Eickhoff - January 2021 33
Merrill el al. (2005) reviewed biocompatible materials that exhibit suitable reversible
charge storage capacities and other parameters of interest for neural stimulation
electrodes (Table 1.3). Most commercially available electrodes are manufactured from
electrochemically stable noble metals such as platinum, titanium or iridium.
Stimulation induced tissue damage
Although the exact mechanisms leading to stimulation induced tissue damage are yet be
fully understood, they have been categorized into detrimental electrochemical reactions
at the electrode-tissue interface and electrotoxicity (Cogan, Hara and Ludwig, 2018).
Stimulation electrodes that are operated within their specific charge injection capacity
achieve the desired charged injection by means of capacitive, non-faradaic, processes in
which no species are oxidised or reduced. If limits for charge injection are exceeded,
faradaic, irreversible reactions occur at the electrode-tissue interface. These reactions can
cause the formation of species, for example through oxidation or reduction of water
molecules, that are damaging to neural tissue as they induce local pH-changes. Further, a
disintegration of the electrode material itself might not only lead to failure of the
stimulation system over time, but dissolution products of common electrode materials
such as platinum or titanium nitride have been shown to induce neurotoxicity (Guenther
et al., 1999; Kumsa et al., 2017).
Mechanisms of tissue damage induced by electrotoxicity are less well understood than
these detrimental electrochemical reactions. For example, they can occur at intensities
below maximum charge injection capacities and might thus not be related to the formation
of noxious species (McCreery et al., 1988). Investigations incorporating anaesthetic
suppression of nerve activity showed that stimulation of a silenced nerve, at intensities
where damage would occur in activatable nerves, caused little to no electrotoxic damage
and suggest that these mechanisms are directly related to nerve hyperactivity (Agnew et
al., 1990).
A mathematical description to predict the safety of electrical charge injection, the
Shannon equation (1.10), has been developed based on empirical data (Shannon, 1992):
𝒍𝒐𝒈 (𝑸
𝑨) = 𝒌 − 𝒍𝒐𝒈(𝑸) (1.10)
Here Q/A is the charge density and Q the injected charge. The adjustable parameter k is
typically between 1.5 and 2. Charge density - charge combinations to the left and below
the so-called Shannon line are deemed safe, whereas values to the right and above the line

Chapter 1: Introduction
S. Eickhoff - January 2021 34
are predicted to be damaging (Cogan et al., 2016). Limitations and applicability of the
Shannon model are discussed in detail by Cogan et al. (2016).
1.3.5 Stimulation waveforms
Some of the earliest devices used for electrical stimulation were alternating current (AC)
generators that used sinusoidal waveforms to activate nerve and muscle tissue. However,
most present neuromodulation devices use, not least because of the ease of generating
them with simple electronic circuits, rectangular stimulation waveforms. While
monophasic rectangular pulses may be used to achieve neural stimulation with charge
injection of only one polarity, in order to reduce detrimental electrochemical reactions at
the electrode-tissue interface, biphasic charge-balanced pulses are commonly
Figure 1.13 Plot of Shannon equation for safe stimulation. Data shown here are derived from
published and unpublished experiments. Filled symbols were deemed unsafe by the investigators,
whereas open symbols indicate safe stimulation parameters. (Mortimer and Bhadra, 2018)
Copyright by Elsevier. Reprint with permission.

Chapter 1: Introduction
S. Eickhoff - January 2021 35
incorporated in contemporary ES devices (Merrill, Bikson and Jefferys, 2005).
Stimulation pattern comprised of such monophasic or symmetrical biphasic rectangular
pulses are further parameterised by the stimulation amplitude, the duration of the
phase(s), often referred to as phase width (PhW), and the frequency of pulse delivery in
Hz or pulses per second (pps).
It has been shown that variations of the rectangular biphasic pulse such as interphase gaps
(IPGs) (van den Honert and Mortimer, 1979; Gorman and Mortimer, 1983), charge
balanced asymmetric pulses, and subthreshold conditioning pre-pulses (Grill and
Mortimer, 1993, 1995, 1997) can be used to increase stimulation efficiency or selectivity.
Merrill et al. (2005) reviewed the findings of studies that investigated rectangular pulse
shape variations (Gorman and Mortimer, 1983; Scheiner, Mortimer and Roessmann,
1990) in monopolar stimulation configurations. However, the significant influence of the
electrode configuration on the efficiency of stimulation waveforms is highlighted by our
own experimental work presented in Chapter 3.
Besides these variations in rectangular pulse shapes, non-rectangular waveforms have
also been investigated in the pursuit of energy efficient neural stimulation. These non-
rectangular waveforms include exponentially rising or decaying pulses (Jezernik and
Morari, 2005), sinusoidal and Gaussian pulses, as well as linearly rising or decaying
ramps (Sahin and Tie, 2007). While some waveforms performed better than others with
regard to energy efficiency, these benefits were accompanied with decreased performance
in other measures of efficiency (such as charge or peak power), so that no one waveform
was found to be simultaneously optimal in all measures of efficiency (Wongsarnpigoon,
Woock and Grill, 2010). Further, it was recognized that the optimal (with regard to a
specific measure of efficiency, e.g. energy efficiency) stimulation waveform may depend
on phase width.
Promisingly three recent computational studies identified Gaussian-shaped stimulation
waveforms independently, and using different approaches, to use the least amount of
electrical energy to activate nerves (Wongsarnpigoon and Grill, 2010; Forger, Paydarfar
and Clay, 2011; Krouchev et al., 2014). We have investigated these predictions in a rodent
in-vivo nerve-muscle model (Chapter 3.3).

Chapter 1: Introduction
S. Eickhoff - January 2021 36
1.3.6 Recruitment and pulse duration relationships
Recruitment behaviour
For an ES pulse of any given waveform (e.g. monophasic, cathodic rectangular) to evoke
an action potential, it needs to be of sufficient intensity. The stimulation intensity of single
stimuli depends on the stimulation amplitude and duration (or phase width). For a fixed
stimulation phase width one can thus define the stimulation amplitude required to evoke
an action potential (in the target excitable fibre) as a threshold (Lapicque, 1907). An
amplitude below the threshold is insufficient to elicit excitation and is termed
subthreshold, whereas an amplitude above this minimum required intensity for activation
is called suprathreshold. While reaching the threshold for activation, and thus action
potential generation, is an all-or-none event for a single fibre, activation happens
gradually, i.e. over a range of threshold amplitudes, in a stimulated population of fibres.
As we have discussed for myelinated axons in Section 1.3.2, two main determinants for
activation (via the magnitude of the extracellular potential) are the distance of the central
NoR from the electrode and the internodal distance, which is correlated to axon diameter.
In a homogenous nerve both these parameters, electrode distance to central NoR for
individual fibres and individual fibre diameter, are normally distributed and the
recruitment is thus typically described by a sigmoidal curve (Figure 1.14). For stimulation
of a whole nerve one can thus express relative activation as a percentage threshold, e.g.
the 50% activation threshold Ith50% is the amplitude required to activate 50% of the
individual nerve fibres in that nerve. Further, dynamic ranges, e.g. the range of amplitudes
between 5 and 95% relative activation, which are of interest for many ES applications
that seek to stimulate specific subpopulations selectively, can be determined (Figure
1.14.b).
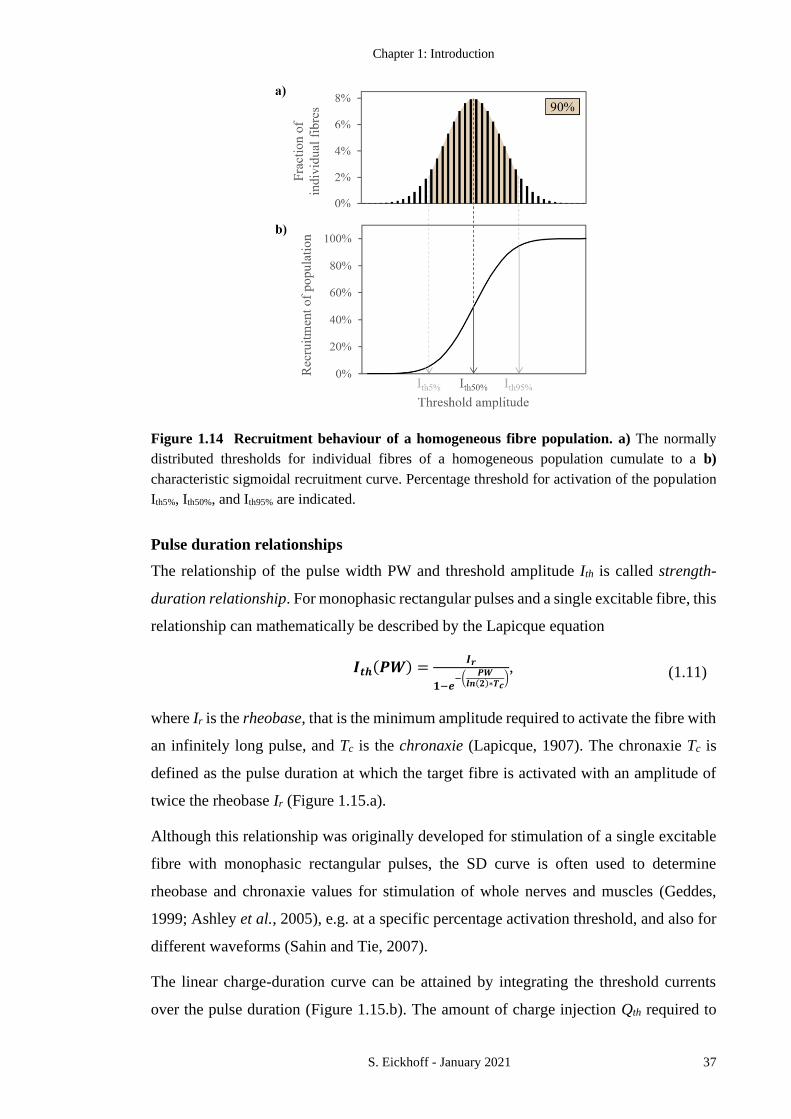
Chapter 1: Introduction
S. Eickhoff - January 2021 37
Pulse duration relationships
The relationship of the pulse width PW and threshold amplitude Ith is called strength-
duration relationship. For monophasic rectangular pulses and a single excitable fibre, this
relationship can mathematically be described by the Lapicque equation
𝑰𝒕𝒉(𝑷𝑾) =𝑰𝒓
𝟏−𝒆−(
𝑷𝑾𝒍𝒏(𝟐)∗𝑻𝒄
), (1.11)
where Ir is the rheobase, that is the minimum amplitude required to activate the fibre with
an infinitely long pulse, and Tc is the chronaxie (Lapicque, 1907). The chronaxie Tc is
defined as the pulse duration at which the target fibre is activated with an amplitude of
twice the rheobase Ir (Figure 1.15.a).
Although this relationship was originally developed for stimulation of a single excitable
fibre with monophasic rectangular pulses, the SD curve is often used to determine
rheobase and chronaxie values for stimulation of whole nerves and muscles (Geddes,
1999; Ashley et al., 2005), e.g. at a specific percentage activation threshold, and also for
different waveforms (Sahin and Tie, 2007).
The linear charge-duration curve can be attained by integrating the threshold currents
over the pulse duration (Figure 1.15.b). The amount of charge injection Qth required to
Figure 1.14 Recruitment behaviour of a homogeneous fibre population. a) The normally
distributed thresholds for individual fibres of a homogeneous population cumulate to a b)
characteristic sigmoidal recruitment curve. Percentage threshold for activation of the population
Ith5%, Ith50%, and Ith95% are indicated.

Chapter 1: Introduction
S. Eickhoff - January 2021 38
reach threshold, and thus, when extrapolated to the whole stimulated excitable structure,
to achieve the desired neuromodulation effect, is a critical parameter. Since charge
injection is a main determinant of stimulation safety (compare Shannon model, Figure
1.13) and scales directly proportional to pulse duration, many ES applications typically
use the shortest feasible pulses.
𝑸𝒕𝒉(𝑷𝑾) = ∫ 𝑰𝒕𝒉(𝑷𝑾)𝒅𝒕𝑷𝑾
𝟎
. (1.12)
Integration of the power at threshold, which is proportional to Ith squared for a given load
Z, over the pulse duration gives us the electrical energy Eth which is “consumed” to reach
the threshold for activation:
𝑬𝒕𝒉(𝑷𝑾) ∝ ∫ 𝑰𝒕𝒉(𝑷𝑾)𝟐𝒅𝒕𝑷𝑾
𝟎
. (1.13)

Chapter 1: Introduction
S. Eickhoff - January 2021 39
An important characteristic of the energy-duration relationship (Figure 1.15.c) is that it
has a local minimum at a pulse duration equal to the chronaxie Tc. Using the least amount
of electrical energy to achieve neural activation is desired in many battery powered ES
implants, as the energy consumption per pulse directly impacts the battery life for a given
battery technology and volume. More energy efficient stimulation would therefore enable
increased battery life and/or reduced battery volume (and thus overall implant volume).
Figure 1.15 Pulse duration relationships. a) Strength-duration curve as described by the
Lapicque equation (1.11), normalized to multiples of the rheobase Ir. The pulse duration at which
twice Ir is required to reach threshold is termed chronaxie Tc. b) Normalized charge-duration
curve and c) normalized energy-duration curve with local minimum at Tc are based on the
threshold current Ith determined with (1.11).

Chapter 2: General methods
S. Eickhoff - January 2021 40
2 GENERAL METHODS
The development and refinement of a rodent nerve-muscle model, a sophisticated neural
stimulation and recording system, and effective methods for data normalization as well
as analysis of complex bioelectric signals were main parts of my three-year PhD journey
and are summarized below. This chapter describes the general methods that were used in
our in-vivo experiments to attain and analyse the data presented in Chapters 3 to 5. The
“Materials and Methods” sections of published and unpublished studies in those chapters
are reduced to brief summaries of the study-specific methods.
2.1 Surgical procedure
Experiments were carried out in adult Wistar rats under adherence to the Animals
(Scientific Procedures) Act of 1986. All procedures were approved by the Home Office
under the project licence (PPL 40/3743).
Animals were anaesthetised with isoflurane in oxygen at an initial concentration of 3%.
For analgesia 0.05 mg kg-1 of Buprenorphine (Temgesic, Indivior, Slough, UK) was
administered intra muscularly in the quadriceps of the contralateral (right) hindlimb. In
order to maintain a stable deep level of anaesthesia throughout the experimental
procedures, respiration rates were monitored and the isoflurane concentration was
adjusted accordingly between 1.5% and 2%. Thus, the respiration rate was kept between
40 and 60 breaths per minute, approximately 50% of the normal respiratory rate of awake
and undisturbed rats. The animals were placed on an adjustable heat pad (E-Z Systems
Corporation, Palmer, Pennsylvania, USA) to keep the body core temperature between 37-
38°C which was monitored using a rectal temperature probe. While hypothermia is, due
to the relatively large ratio of animal surface area to body mass, a common concern in
small animal anaesthesia, preventing malignant hyperthermia, which may lead to muscle
rigidity and even death, was crucial as well. We found that, besides close monitoring of
the body core temperature and adjusting of the heat pad, using the least concentration of
isoflurane, while maintaining a deep and stable level of anaesthesia, and setting the
oxygen flow rate to at least 1 L min-1 reduced the risk of hyperthermia.
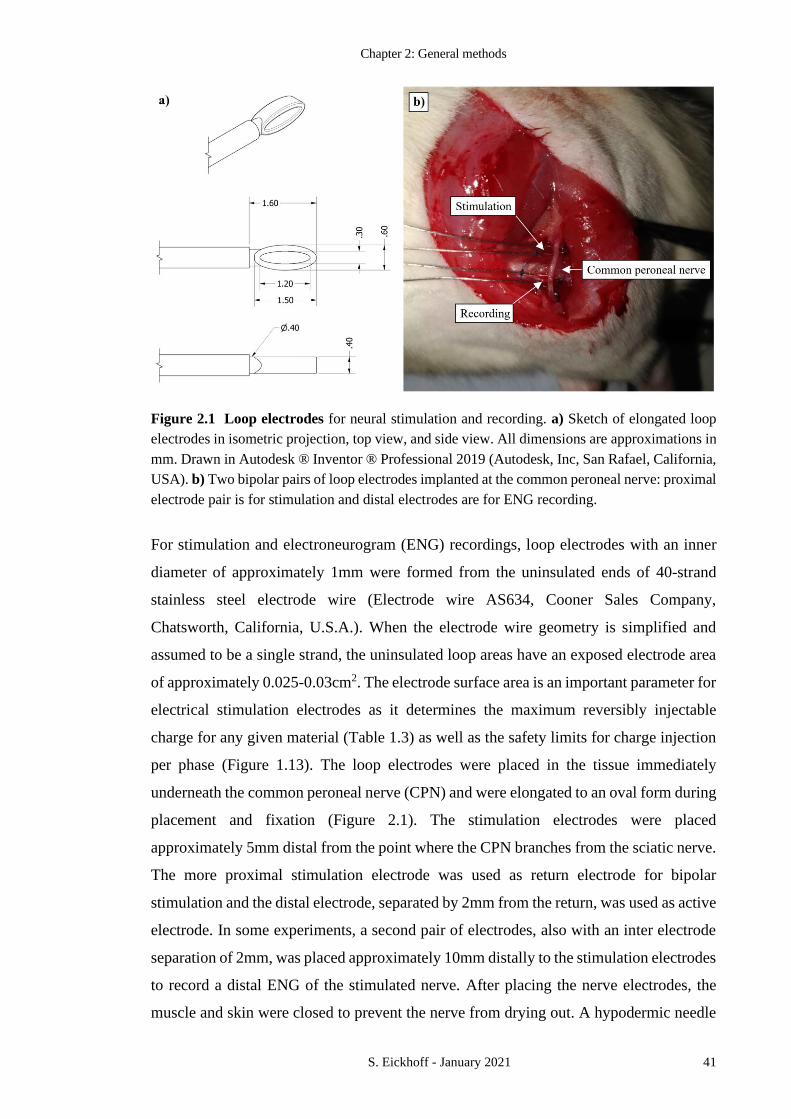
Chapter 2: General methods
S. Eickhoff - January 2021 41
For stimulation and electroneurogram (ENG) recordings, loop electrodes with an inner
diameter of approximately 1mm were formed from the uninsulated ends of 40-strand
stainless steel electrode wire (Electrode wire AS634, Cooner Sales Company,
Chatsworth, California, U.S.A.). When the electrode wire geometry is simplified and
assumed to be a single strand, the uninsulated loop areas have an exposed electrode area
of approximately 0.025-0.03cm2. The electrode surface area is an important parameter for
electrical stimulation electrodes as it determines the maximum reversibly injectable
charge for any given material (Table 1.3) as well as the safety limits for charge injection
per phase (Figure 1.13). The loop electrodes were placed in the tissue immediately
underneath the common peroneal nerve (CPN) and were elongated to an oval form during
placement and fixation (Figure 2.1). The stimulation electrodes were placed
approximately 5mm distal from the point where the CPN branches from the sciatic nerve.
The more proximal stimulation electrode was used as return electrode for bipolar
stimulation and the distal electrode, separated by 2mm from the return, was used as active
electrode. In some experiments, a second pair of electrodes, also with an inter electrode
separation of 2mm, was placed approximately 10mm distally to the stimulation electrodes
to record a distal ENG of the stimulated nerve. After placing the nerve electrodes, the
muscle and skin were closed to prevent the nerve from drying out. A hypodermic needle
Figure 2.1 Loop electrodes for neural stimulation and recording. a) Sketch of elongated loop
electrodes in isometric projection, top view, and side view. All dimensions are approximations in
mm. Drawn in Autodesk ® Inventor ® Professional 2019 (Autodesk, Inc, San Rafael, California,
USA). b) Two bipolar pairs of loop electrodes implanted at the common peroneal nerve: proximal
electrode pair is for stimulation and distal electrodes are for ENG recording.

Chapter 2: General methods
S. Eickhoff - January 2021 42
(21G x 1-1/2") was placed in the dorsal skin of the animals and was used as return
electrode for the monopolar configuration. In some early experiments an additional loop
electrode, fixed to the muscle tissue approximately 10mm away from the CPN, served as
return electrode in the monopolar configuration. This configuration can also be called
“near monopolar” and was replaced in later experiments by the hypodermic needle, as the
high current density at the near monopolar loop return electrode could lead to unwanted
coactivation.
To access the extensor digitorum longus (EDL) muscle, the distal tendon of the tibialis
anterior muscle was cut and the muscle belly carefully blunt dissected from the deeper
lying EDL. The proximal EDL tendon was exposed and clamped with a sturdy artery
forceps that was firmly mounted on the experimental steel table. The distal EDL tendon
was dissected and connected with a miniature titanium alloy hook to a force transducer
(Gould Inc, Statham Instrument Division, Oxnard, California, U.S.A.) which was also
mounted on the steel table. Thus, the EDL was mechanically isolated and held in an
isometric condition while innervation and blood supply were preserved (Figure 2.2). The
ideal muscle length was set by increasing it from slack in 0.5mm increments to that length
Figure 2.2 Rodent in-vivo nerve-muscle preparation with both principal stimulation electrode
configurations. The common peroneal nerve (CPN) in anaesthetized rats is stimulated and the
isometric twitch force response of the extensor digitorum longus (EDL) muscle recorded.
Depending on which return electrode is connected, the stimulation setup is either monopolar (with
Return M) or bipolar (with Return B). In some early experiments a loop electrode, approximately
10mm away from the CPN long axis was used as “near monopolar” return electrode (Return nM).
ENG recordings of the CPN were measured distally to stimulation.
Chapter 2: General methods
S. Eickhoff - January 2021 43
at which the developed isometric twitch force response to single stimuli was maximal but
without excessive passive muscle tension (compare Figure 1.6). Heated liquid paraffin
oil was delivered by a peristaltic pump (Watson-Marlow Ltd., Falmouth, Cornwall, UK)
at a rate of 0.1ml min-1 to the EDL muscle surface to maintain physiological temperature
and to prevent the muscle from drying. Normal fluid loss during the experimental
procedures was replaced by administering approximately 1ml of sterilized saline solution
(OXOID Ltd., Basingstoke, Hampshire, UK) per hour subcutaneously.
2.2 Stimulation
Stimulation pulses were generated in a custom written LabVIEW™ 2016 (National
Instruments Corporation, Austin, Texas, U.S.A.) program (Appendix 1) and delivered at
1MS/s resolution over the analog output of a NI PCIe 6351 Data Acquisition Card
(National Instruments Corporation, Austin, Texas, U.S.A.) to a galvanically isolated
voltage-to-current converter. The pulses were delivered to the active electrode at the CPN
at a rate of one pulse every three seconds. In some experiments, where a series of strong
twitch forces were elicited or where spinal reflex activity was investigated, this rate was
reduced up to one pulse every ten seconds to allow for full recovery and prevent
neuromuscular fatigue. A relay unit switched under computer control between the return
electrode at the nerve (for bipolar stimulation) and the hypodermic needle acting as return
electrode under the dorsal skin (for monopolar stimulation). In some early experiments,
the return electrodes were disconnected and connected manually between recording
periods. However, this made it difficult to distinguish between small threshold changes
due to electrode configuration and normal variations due to depth of anaesthesia, fatigue,
or body temperature that might occur between one recording period and another.
Pulses with combinations of the pulse parameters to be tested (e.g. amplitude, phase
widths, interphase gap, and return electrode configuration) were delivered in randomized
order. This means recruitment curves were assembled from test pulses that were randomly
placed from start to finish of a recording period. Every 20 test stimulations a control pulse
which was set to elicit full neural activation was delivered to use for normalization. The
control pulses were standard biphasic rectangular pulses with 200µs phase width,
cathodic phase first and amplitudes set for each experiment separately (typically 1mA) to
elicit maximal isometric twitch force. Twitch force responses to the test stimulations were
measured relative to the control pulses and thus normalized. The randomized order of test
stimulation parameter delivery and normalization with control pulses allowed us to attain

Chapter 2: General methods
S. Eickhoff - January 2021 44
recordings that produced meaningful relationships within the parameter space and that
were not affected by progressive or cyclic variations in body temperature, depth of
anaesthesia or fatigue.
The shorter the duration of one recording period, that is of one set containing all
stimulations (in randomized order) that comprise the recruitment curves that are to be
compared against each other, the better and smoother are the recorded recruitment curves.
We found that recording periods of 20 minutes and below are ideal because they resulted
in data with a steady normalization level (i.e. data with minor influence of fatigue or
cyclic variations in depth of anaesthesia), while still enabling to compare several pulse
shape variations. With a pulse delivery rate of one pulse every 3 seconds and one control
pulse every 20 test pulses, a 20-minute recording session allows to test 380 pulses. With
typically 20 pulses comprising one recruitment curve, one such 20-minute recording
period enables to record and later compare 19 recruitment curves. To further reduce
variations within those recording periods and thus increase the data quality, we found it
helpful to precede all recording periods by a brief series of approximately 10 warmup
pulses at the normal rate of one pulse every 3 seconds. These warmup pulses were not
part of the recording period and the rationale for their incorporation was that the first few
twitch force responses after a pause were generally weaker than during the recording.
2.3 Recording and data analysis
The isometric twitch force of the EDL muscle was used as main indication of motor pool
activation with CPN stimulation. To verify the correlation between EDL twitch force and
CPN nerve activation and to further investigate temporal aspects of AP elicitation, in most
later experiments, an electroneurogram (ENG) recording was added distal to the site of
stimulation (Figure 2.2). This additional ENG was used to analyse the root mean square
(RMS) of the evoked compound action potential (eCAP) in the CPN. The RMS is the
square root of the average power across the electrical signal or wave, and it is commonly
used to report the amplitude of bioelectric signals10. The ENG RMS correlates closely
with isometric EDL twitch force (Figure 2.3). validate the use of EDL twitch force as
indication of CPN activation.
10 While there is no clearly defined standard for analysing epineural ENG recordings, RMS is a standard
method for reporting EMG data (Merletti, 1997), which is a similar bioelectric signal.

Chapter 2: General methods
S. Eickhoff - January 2021 45
In experiments that were conducted to investigate the energy consumption required to
achieve neural activation with different stimulation waveforms (Chapter 3.3), stimulation
voltage across the electrodes and stimulation current through a resistor in series were
recorded in addition.
2.3.1 Isometric twitch force
The isometric twitch force responses of the extensor digitorum longus (EDL) muscle were
recorded at a sample rate of 100kS/s. Triggered by the stimulation system, the signals
were recorded with a PowerLab 16/35 (ADInstruments Pty Ltd, Bella Vista, New South
Wales, Australia) and stored, pre-processed and exported using LabChart 7 Pro
(ADInstruments Pty Ltd, Bella Vista, New South Wales, Australia). The developed
isometric twitch force was determined by subtracting the passive muscle tension
(typically between 0.05 and 0.1N) from the peak recorded muscle tension (Figure 2.4).
Figure 2.3 EDL twitch force correlates with CPN eCAPs. One representative normalized
recruitment curve for 200μs biphasic stimulation in the monopolar electrode configuration. 50%
activation threshold is determined by linear interpolation. Normalized peak twitch force and ENG
root mean square (RMS) are correlated.

Chapter 2: General methods
S. Eickhoff - January 2021 46
As introduced in Section 2.2, to minimize any effects of variations in depths of
anaesthesia, temperature or fatigue on the recordings, test stimulations were delivered in
randomized order. Force responses to each test stimulation were normalized by division
by the interpolated control pulse level (dashed line in Figure 2.5.a) at the time of that
stimulation.
Figure 2.4 Developed isometric twitch force responses of the EDL are determined by
subtraction of the passive muscle tension from the peak recorded muscle tension during
stimulation.

Chapter 2: General methods
S. Eickhoff - January 2021 47
The normalized twitch force responses (Figure 2.5.b) are sorted by ascending stimulation
amplitude and thus build the recruitment curves (Figure 2.5.c). By linear interpolation of
the experimental data points the 50% activation thresholds were determined for all tested
pulses shape variations (MATLAB code in Appendix 2). This allowed us to express the
efficiencies of tested pulse shape variations, such as interphase gaps (IPGs), as a
Figure 2.5 Determination of 50% activation thresholds. a) Test stimulation were delivered in
randomized order and control pulses were incorporated in regular intervals: one control pulse
every 20 test stimuli. Linear interpolation between the control pulses provides a control level (red
dashed line) for full neuromuscular activation. b) Developed twitch force values are normalized
in relation to the normalization level before they are c) sorted to reveal the recruitment curves for
the tested pulse variations. 50% activation thresholds are determined by linear interpolation of the
recruitment data points. Data is from one representative recording period that compared
monophasic and biphasic pulses with and without interphase gaps in the monopolar (black) and
bipolar (blue) electrode configuration.
Chapter 2: General methods
S. Eickhoff - January 2021 48
percentage difference, e.g. in amplitude required, to reach 50% activation compared to a
standard comparator pulse shape. In the exemplary data from Figure 2.5.c for instance, in
the bipolar electrode configuration (blue traces) adding and increasing the length of IPGs
increased the amplitude required to reach 50% activation up to approximately 28% with
1ms IPG (compared to the amplitude required with biphasic pulses without IPG in that
same electrode configuration).
2.3.2 Electroneurogram
In most later experiments, an electroneurogram of the CPN was recorded approximately
10mm distal to the site of stimulation. The purpose of incorporating ENG recordings was
to investigate fine temporal aspects of action potential generation, in particular, to identify
the part or field transition within the stimulation waveform at which neural excitation
occurs. Since most commonly used waveforms for neural stimulation have phase widths
of 200µs and less, identifying such small temporal differences in the mechanical muscle
twitch response, which even for the fast type EDL muscle that we studied was about 30-
50ms in duration (Figure 2.4), is not practical. Analysis of the shift in the recorded
bioelectric eCAP signal, which has a duration of approximately 1ms, allowed for
identification of such fine temporal aspects. We concede that the signals we recorded, and
that we call ENG, might have (in some cases, e.g. in Figures 2.6 and 2.7) a substantial
interference from the electrical activity of the surrounding muscle tissue (EMG). While
this EMG influence would prohibit the direct assessment of nerve conduction velocities,
as long as the recorded signal shape is consistent, it allows for analysis of shifts in the
signal-to-artifact latency and thus to evaluate what part of the stimulation pulse elicited
excitation. Possible ways to reduce the EMG interference are increased insulation, e.g.
by using cuff electrodes with conductive shield layers (Sabetian et al., 2017), silencing
of the surround muscle tissue by denervation, or using pulse doublets to harness
differences in nerve and muscle refractory periods and mask out the EMG. Since, as we
outlined above, the potential EMG interference did not prohibit us to analyse relative
differences in signal-to-artifact latencies, we did not take any of those steps in the
experiments presented in this thesis.
The ENG was recorded at a sample rate of 100kS/s with a PowerLab 16/35
(ADInstruments Pty Ltd, Bella Vista, New South Wales, Australia) and stored, pre-
processed and exported using LabChart 7 Pro (ADInstruments Pty Ltd, Bella Vista, New
South Wales, Australia). The ENG recordings were filtered to extract the 50Hz noise and

Chapter 2: General methods
S. Eickhoff - January 2021 49
stimulation artifacts were removed. For short stimulation pulses (Figure 2.6) this artifact
reduction was achieved automatically with a custom written MATLAB code (Appendix
3a).
For stimulations with longer phase widths (Figure 2.7.a), the eCAPs were merged with
the stimulation artifacts, often on the slopes of capacitive charging/discharging during the
stimulation phases, as in Figure 2.7.b. These artifact characteristics do not scale purely
proportional with stimulation amplitude and vary strongly between experiments, and so
manual input was necessary to fit a spline as baseline on which the eCAP laid (Figure
2.7.c) and which was then used to remove the artifact (Appendix 3b). As this method of
artifact removal relied strongly on user input, the resulting eCAP recordings (Figure
2.7.d) might be biased and where therefore not used for further quantitative analysis, such
as determination of precise eCAP-latencies. ENG plots were typically smoothed with a
10-sample moving average MA-filter. All ENG processing and plotting was done in
MATLAB (MATLAB (R2018a), The MathWorks Inc., Natick, MA, USA).
Figure 2.6 Artifact removal of short stimulation pulses. a) ENG recording during stimulation
of the CPN with short biphasic rectangular pulse (phase width 200µs). Artifact and eCAP are not
merged so that the former can easily be removed. b) The stimulation artifact onset can
automatically be detected (first red circle) and a fixed interval (to second red circle) from there
(here 600µs) is identified as stimulation artifact and c) removed from the ENG recording. Arrows
indicate stimulation onset.

Chapter 2: General methods
S. Eickhoff - January 2021 50
Figure 2.7 Artifact removal of long stimulation pulses. a) ENG recording during stimulation
of the CPN with long biphasic rectangular pulse (phase width 3ms). b) eCAP is merged with the
stimulation artifact and c) manual input (blue circles) is required to fit a spline (red trace) on the
slope of the artifact. d) The fitted spline is subtracted from the merged signal and thus the artifact
is removed from the ENG recording. Arrows indicate stimulation onset.
Chapter 3: Waveforms for neural stimulation
S. Eickhoff - January 2021 51
3 WAVEFORMS FOR NEURAL
STIMULATION
Extensive research has been carried out to investigate the influence of stimulation
waveforms on efficiency, selectivity, and safety of electrical neuromodulation. While
most published literature in this field is concerned with waveforms that are variations of
rectangular pulses, as these are the standard waveform shapes used in many past and
present stimulation devices, some studies investigated non-rectangular stimulation
waveforms. The research summarized in this chapter focuses on detailed re-examinations
of four proposed waveforms:
• Subthreshold conditioning pre-pulses have been suggested to selectively alter the
thresholds for activation of fibre populations that are, due to fibre size or
proximity to the stimulation electrode, activated first when standard rectangular
pulses are used. However, since their original proposal in the mid-1990s,
published literature on the effect of subthreshold pre-pulses is contradictory. Our
experimental efforts described in Chapter 3.1 provide an explanation for this two-
decade longstanding controversy in published literature and show how the choice
of the practical electrode configuration influences the effect of those pre-pulses.
• Based on these findings we extended our investigations to interphase gaps (IPGs)
and asymmetric biphasic pulses with reduced anodic amplitude, two of the most
suggested and used pulse shape variations. This study (Chapter 3.2) shows how
the effect of those waveforms, that have previously predominantly been studied
using monopolar electrode configurations, is opposite in the bipolar compared to
the monopolar stimulation mode. This finding is of particular relevance to many
miniature stimulation systems, such as the envisioned field of electroceuticals,
where the small overall device size does not allow for substantial separation of
the electrodes, so that they inevitably operate in a bipolar mode.
• Gaussian shaped stimulation waveforms have recently been identified by three
independent computational studies to require the least amount of energy to
activate nerves. However, there has not been a comprehensive in-vivo

Chapter 3: Waveforms for neural stimulation
S. Eickhoff - January 2021 52
investigation of these findings. We studied the efficiency of Gaussian shaped
stimulation waveforms in our rodent model (Chapter 3.3) and found that only
moderate energy savings are achievable with this novel pulse shape. In addition,
further challenging the proposed benefits of this waveform, we found that those
limited energy savings were accompanied by substantial increases of the
maximum instantaneous power required to activate a target nerve.
3.1 Subthreshold conditioning pre-pulses
The study presented in this chapter is published and copyrighted:
© [2020] IEEE. Reprinted, with permission, from [Eickhoff and Jarvis, The Effect of
Sub-Threshold Pre-Pulses on Neural Activation Depends on Electrode Configuration,
IEEE Transactions on Biomedical Engineering, 01/2020]
The only main differences between the published article and the present chapter are:
• Figure and equation numbers were adjusted to match the thesis chapter
numbering.
• Parts of the “Materials and Methods” section, such as the surgical procedure,
which are described in detail in the General Methods (Chapter 2), are left out and
the omissions are indicated by “[…]”. Instead, key methodological information
such as number of animals, electrode configurations, and recording sampling rates
are summarized in inserted boxes.
• To avoid redundant chapter names, the paper section-headings such as
“Introduction”, “Results”, and “Discussion” have been replaced by brief
summarizing descriptions of each section’s main message.
(Abstract)
Objective: Published research on nerve stimulation with sub-threshold conditioning pre-
pulses is contradictory. Like most early research on electrical stimulation (ES), the
pioneer work on the use of pre-pulses was modelled and measured only for monopolar
electrodes. However, many contemporary ES applications, including miniaturized
neuromodulation implants, known as electroceuticals, operate in bipolar mode. Methods:
We compared depolarizing (DPPs) and hyperpolarizing (HPPs) pre-pulses on neural
excitability in rat nerve with monopolar and bipolar electrodes. The rat common peroneal
nerve was stimulated with biphasic stimuli with and without ramp and square DPPs or
HPPs of 1, 5 and 10ms duration and 10% - 20% of the amplitude of the following pulse.
Chapter 3: Waveforms for neural stimulation
S. Eickhoff - January 2021 53
Results: The effects were opposite for the monopolar and bipolar configurations. With
monopolar electrodes DPPs increased the amplitude required to activate 50% of the
motoneuron pool (between 0.7% and 10.3%) and HPPs decreased the threshold (between
1.7% and 4.7%). With bipolar electrodes both pre-pulse types had the opposite effect:
DPPs decreased thresholds (between 1.8% and 5.5%) whereas HPPs increased thresholds
(between 0.5% and 4.1%). Electroneurograms from the stimulated nerve revealed spatial
and temporal differences in action potential generation for monopolar and bipolar
electrodes. In bipolar biphasic stimulation, excitation first occurred at the return electrode
as a response to the transition between the cathodic and anodic phase. Conclusion: These
data help to resolve the contradictions in the published data over two decades.
Significance: They also show that fundamental research carried out in monopolar
configuration is not directly applicable to contemporary bipolar ES applications.
Index Terms — Action potential, Bipolar stimulation, Electrical stimulation, Sub-
threshold pre-pulses
3.1.1 Published literature on pre-pulses is contradictory
(I. Introduction)
Electrical stimulation (ES) is a neuromodulation technique that applies artificial electrical
stimuli to alter the activity of target nervous structures. The stimuli are delivered via an
active electrode near the target nerve. The charge can either be returned via a second
electrode, often of similar size and situated in similar proximity to the target structure,
this configuration is clinically called bipolar. If the charge is returned over a large,
remotely placed electrode area, such as the casing of an implant, the configuration is
known as monopolar. Although there are other electrode configurations, such as focused
multipolar electrodes, monopolar and bipolar setups are the most commonly used in
contemporary neuromodulation devices (Fallon and Carter, 2016). For some applications
of ES either electrode setup might be used, but for others specific requirements
predetermine the electrode configuration. For example, in the emerging field of
miniaturized neuromodulation implants, so called “electroceuticals” (Horn, Ardell and
Fisher, 2019) the electrodes are envisaged as integral with the stimulator. The small
device size does not allow substantial electrode separation, so the configuration is
inevitably bipolar. The same limitation applies to electrode arrays in which the maximum
separation of electrodes is not much greater than the size of the target neural structure.
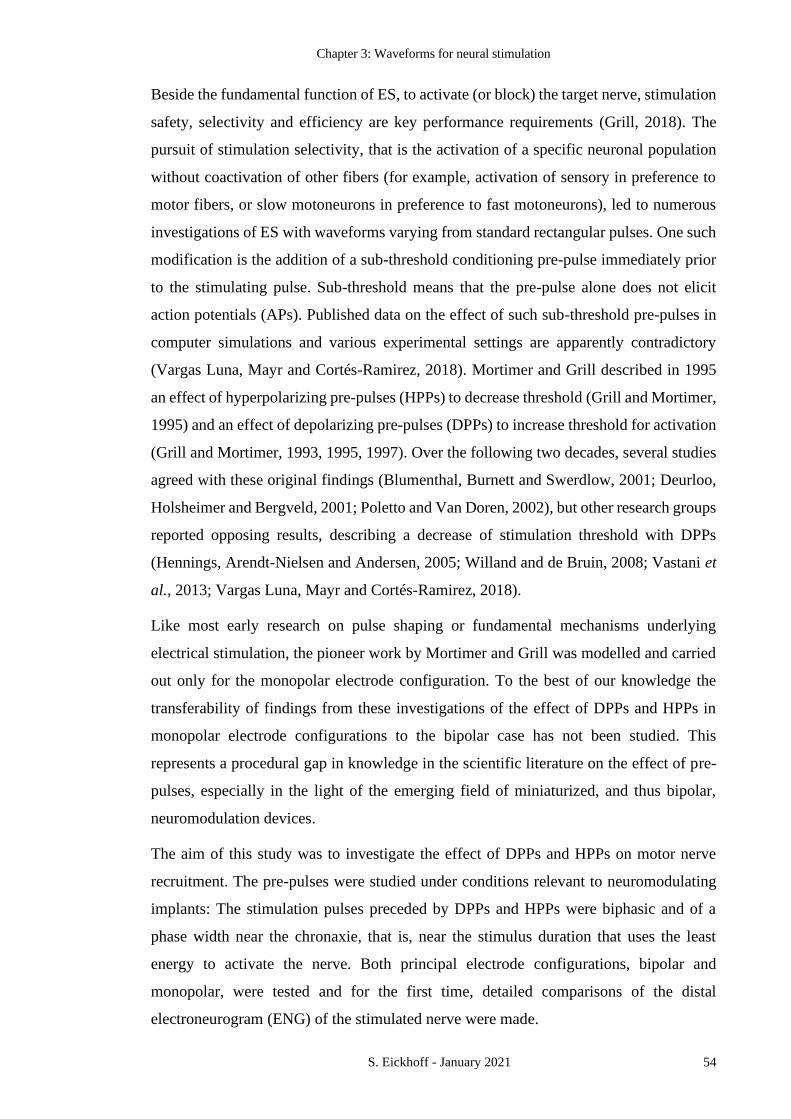
Chapter 3: Waveforms for neural stimulation
S. Eickhoff - January 2021 54
Beside the fundamental function of ES, to activate (or block) the target nerve, stimulation
safety, selectivity and efficiency are key performance requirements (Grill, 2018). The
pursuit of stimulation selectivity, that is the activation of a specific neuronal population
without coactivation of other fibers (for example, activation of sensory in preference to
motor fibers, or slow motoneurons in preference to fast motoneurons), led to numerous
investigations of ES with waveforms varying from standard rectangular pulses. One such
modification is the addition of a sub-threshold conditioning pre-pulse immediately prior
to the stimulating pulse. Sub-threshold means that the pre-pulse alone does not elicit
action potentials (APs). Published data on the effect of such sub-threshold pre-pulses in
computer simulations and various experimental settings are apparently contradictory
(Vargas Luna, Mayr and Cortés-Ramirez, 2018). Mortimer and Grill described in 1995
an effect of hyperpolarizing pre-pulses (HPPs) to decrease threshold (Grill and Mortimer,
1995) and an effect of depolarizing pre-pulses (DPPs) to increase threshold for activation
(Grill and Mortimer, 1993, 1995, 1997). Over the following two decades, several studies
agreed with these original findings (Blumenthal, Burnett and Swerdlow, 2001; Deurloo,
Holsheimer and Bergveld, 2001; Poletto and Van Doren, 2002), but other research groups
reported opposing results, describing a decrease of stimulation threshold with DPPs
(Hennings, Arendt-Nielsen and Andersen, 2005; Willand and de Bruin, 2008; Vastani et
al., 2013; Vargas Luna, Mayr and Cortés-Ramirez, 2018).
Like most early research on pulse shaping or fundamental mechanisms underlying
electrical stimulation, the pioneer work by Mortimer and Grill was modelled and carried
out only for the monopolar electrode configuration. To the best of our knowledge the
transferability of findings from these investigations of the effect of DPPs and HPPs in
monopolar electrode configurations to the bipolar case has not been studied. This
represents a procedural gap in knowledge in the scientific literature on the effect of pre-
pulses, especially in the light of the emerging field of miniaturized, and thus bipolar,
neuromodulation devices.
The aim of this study was to investigate the effect of DPPs and HPPs on motor nerve
recruitment. The pre-pulses were studied under conditions relevant to neuromodulating
implants: The stimulation pulses preceded by DPPs and HPPs were biphasic and of a
phase width near the chronaxie, that is, near the stimulus duration that uses the least
energy to activate the nerve. Both principal electrode configurations, bipolar and
monopolar, were tested and for the first time, detailed comparisons of the distal
electroneurogram (ENG) of the stimulated nerve were made.

Chapter 3: Waveforms for neural stimulation
S. Eickhoff - January 2021 55
3.1.2 Comprehensive range of pre-pulse parameters to be tested
(II. Materials and Methods)
Surgical Procedure
[…]
Experiments were carried out in n=5 adult Wistar rats.
Home Office project licence: PPL 40/3743.
Stimulation electrodes: Active electrode distal, bipolar return electrode proximal, and
hypodermic needle in dorsal skin as monopolar return
electrode (return electrode switched by relay unit).
Recording electrodes: Approximately 10mm distal to stimulation electrodes.
Figure 3.1 Experimental model: a) Nerve-muscle-preparation of Common Peroneal Nerve
(CPN) and Extensor Digitorum Longus (EDL). Electrodes: A pair of ENG recording electrodes
(reference most distal) was placed distal to the bipolar stimulation electrode pair (active electrode
more distal). For monopolar stimulation, the nerve return electrode (Return B) was disconnected
and a hypodermic needle (Return M) under the dorsal skin of the animal was used as return
electrode. b) Parameterization of pre-pulses: Square (solid line) and ramped (dashed line) pre-
pulses are parameterized by pre-pulse duration of 1, 5 or 10ms and intensities of 10 or 20% of the
stimulation amplitude (waveform is not to scale). […]

Chapter 3: Waveforms for neural stimulation
S. Eickhoff - January 2021 56
Stimulation
[…] The maximal stimulation amplitude was capped at 2mA, which was sufficient in
every one of the five experiments and with every tested waveform to elicit full nerve
activation.
Subthreshold Pre-pulses
Terminology: Pre-pulses were defined by the current waveform at the active, charge
injecting, electrode (Figure 3.2, left column). The injection of negative charge, i.e. a
cathodic phase, decreases the transmembrane potential and thus depolarizes the
membrane of axons near the active electrode (Figure 3.2.a, left). The injection of a
positive, anodic charge increases the transmembrane potential at the site of injection and
thus hyperpolarizes the membrane (Mortimer and Bhadra, 2018). Hence a pre-pulse in
the cathodic phase (at the active electrode) is referred to as a depolarizing pre-pulse (DPP)
and a pre-pulse in the anodic phase as a hyperpolarizing pre-pulse (HPP).
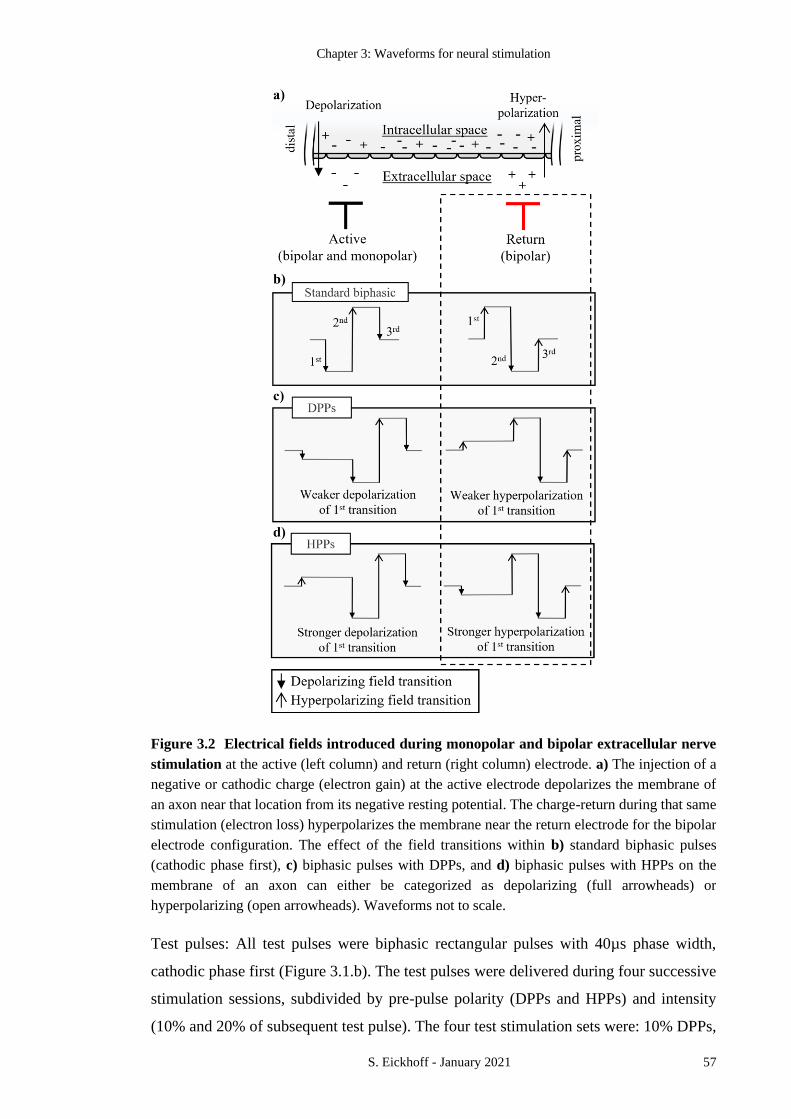
Chapter 3: Waveforms for neural stimulation
S. Eickhoff - January 2021 57
Test pulses: All test pulses were biphasic rectangular pulses with 40µs phase width,
cathodic phase first (Figure 3.1.b). The test pulses were delivered during four successive
stimulation sessions, subdivided by pre-pulse polarity (DPPs and HPPs) and intensity
(10% and 20% of subsequent test pulse). The four test stimulation sets were: 10% DPPs,
Figure 3.2 Electrical fields introduced during monopolar and bipolar extracellular nerve
stimulation at the active (left column) and return (right column) electrode. a) The injection of a
negative or cathodic charge (electron gain) at the active electrode depolarizes the membrane of
an axon near that location from its negative resting potential. The charge-return during that same
stimulation (electron loss) hyperpolarizes the membrane near the return electrode for the bipolar
electrode configuration. The effect of the field transitions within b) standard biphasic pulses
(cathodic phase first), c) biphasic pulses with DPPs, and d) biphasic pulses with HPPs on the
membrane of an axon can either be categorized as depolarizing (full arrowheads) or
hyperpolarizing (open arrowheads). Waveforms not to scale.

Chapter 3: Waveforms for neural stimulation
S. Eickhoff - January 2021 58
20% DPPs, 10% HPPs, and 20% HPPs. Within each of these recording sessions, the
following pulse parameters were tested: Pre-pulse type (no pre-pulse, ramp, and square),
pre-pulse duration (1, 5, and 10ms), and electrode configuration (monopolar and bipolar).
For each parameter combination, e.g. 5ms square DPPs of 20% stimulus intensity applied
via monopolar electrode configuration, a full recruitment curve in 20 steps of 50µA
stimulation amplitude (typically ranging from 400-1350µA) was recorded (Figure 3.3.a).
All combinations of these stimulation parameters were applied in randomized order.
Figure 3.3 Recruitment curves a) Recruitment curves for 40µs biphasic stimulation with and
without 5ms DPPs of 20% stimulus intensity in monopolar (black) and bipolar (blue) setup. Force
responses of test stimulations were normalized to the closest control pulse (in total n=16 control
pulses (mean=0.39N, SD=0.01N) were used for normalization of this exemplary data set). b)
Recruitment curve for 200µs biphasic stimulation in monopolar electrode configuration. Arrows
indicate 50% and 95% thresholds (I50% and I95%) determined by linear interpolation of normalized
peak twitch force. Root mean square (RMS) of ENG recordings of the stimulated nerve correlate
with isometric peak twitch force.

Chapter 3: Waveforms for neural stimulation
S. Eickhoff - January 2021 59
The upper limit of pre-pulse intensity (20% of subsequent test pulse) was chosen based
on strength duration curves as a value with which no excitation was to be expected. To
verify that all tested pre-pulses were indeed sub-threshold, the ENG recording of the
stimulated nerve was checked. No early excitations as a response to the pre-pulse were
observed, proving their amplitude never reached threshold. […]
Supramaximal amplitude stimulation
In two animals, temporal differences in action potential generation between monopolar
and bipolar electrode configurations were investigated. Amplitudes that ensured 95%
neural activation (I95%), that is 95% of maximal isometric twitch force, were determined
for phase width 100 and 200µs standard biphasic stimulations (without pre-pulses). Ten
repetitions of biphasic stimulation at this 95% activation threshold I95% were recorded for
both phase widths and both electrode configurations. Further repeated recordings were
made during stimulation at supramaximal amplitudes in 50µA increments up to
I95%+350µA.
Recording
[…]
Data analysis and statistics
Force responses
[…] The effect of each pre-pulse on the 50% activation threshold was expressed as the
percentage difference between I50% without pre-pulse (i.e. standard biphasic stimulation)
and I50% with that pre-pulse.
Paired t-tests were performed for each pre-pulse duration (1, 5 and 10ms), polarity (DPPs
and HPPs) and intensity (10 and 20%) to search for significant differences between the
changes in 50% threshold in the monopolar and bipolar electrode configurations. The data
for both pre-pulse shapes (square and ramp) were grouped together for these statistical
tests. […]
Extensor digitorum longus muscle twitch force recorded at 100kS/s.
Common peroneal nerve ENG recorded at 100kS/s.

Chapter 3: Waveforms for neural stimulation
S. Eickhoff - January 2021 60
3.1.3 Pre-pulses have opposite effects in bipolar compared to monopolar
stimulation mode
(III. Results)
Subthreshold Pre-pulses
The dataset presented here is generated from 5900 individual responses, 1180 from each
of the five experiments. The data is consistent, has only minor influence of fatigue or
cyclic variations in depth of anaesthesia (Figure 3.3 - Figure 3.5) and demonstrates the
value of computer-controlled experiments to extract a large amount of well controlled
data from a small number of preparations, and thus achieve a reduction in the use of
animals.
To ensure that all tested pre-pulses were indeed sub-threshold, the ENG recording of the
CPN distal to the stimulation electrodes was checked. No early excitations as a response
to the pre-pulse were observed, proving their amplitude never reached threshold.
Depolarizing Pre-pulses
DPPs increased the 50% activation thresholds in the monopolar electrode configuration
and decreased stimulation thresholds in the bipolar configuration (Figure 3.4). On average
across subjects, DPPs (square and ramp; 1, 5, and 10ms duration) with 10% of the
stimulation pulse amplitude increased thresholds in the monopolar configuration between
1.2% and 6.0% and decreased thresholds between 1.8% and 3.5% in the bipolar
configuration. The difference of the effect of 10% DPPs with monopolar and bipolar
electrode configuration was significant for all tested pre-pulse durations (p<0.001).
Larger average threshold changes between 0.7% and 10.3% increase in monopolar and
between 3.9% and 5.5% decrease in bipolar configurations were observed across subjects
when the DPP amplitude was set to 20% of the stimulus amplitude. For all tested pre-
pulse durations, the percentile threshold changes with DPPs of 20% stimulus intensity
were found to be significantly different between monopolar and bipolar electrodes (1ms:
p=0.002, 5ms, and 10ms p<0.001).

Chapter 3: Waveforms for neural stimulation
S. Eickhoff - January 2021 61
Hyperpolarizing Pre-pulses
HPPs decreased stimulation thresholds in monopolar and increased thresholds in bipolar
configurations (Figure 3.5). The average threshold decreases across subjects with 10%
HPPs (square and ramp; 1, 5, and 10ms duration) ranged from 1.7% to 3.3% for
monopolar stimulation. The same pre-pulses increased thresholds on average between
0.5% and 4.1% in the bipolar case. 10% HPPs of 5ms and 10ms duration showed
significant differences in the threshold changing effect between the two compared
electrode configurations (p<0.01). On average across subjects, thresholds were decreased
Figure 3.4 Changes in 50% activation threshold with DPPs. Threshold changes with a) square
and b) ramp 10% and 20% DPPs of 1, 5 and 10ms duration in monopolar (black) and bipolar
(blue) setup. Negative values of “Difference in 50% threshold” indicate that the activation
threshold with biphasic stimulation phase width=40µs decreased with the tested pre-pulse
compared to stimulation without pre-pulse. Dashed lines represent mean ±SEM for 10% DPPs,
solid lines represent mean ±SEM for 20% DPPs of n=4 animals (except for 5ms and 10ms 10%
DPPs with n=5). 0% (dotted line) represents the baseline of 50% thresholds with biphasic pulses
without pre-pulse. Waveforms in legend not to scale.

Chapter 3: Waveforms for neural stimulation
S. Eickhoff - January 2021 62
between 1.7% and 4.7% in monopolar and increased between 1.2% and 2.5% in bipolar
setup, when HPPs of 20% stimulus amplitude were used. The effect of 20% HPPs was
significantly different in monopolar compared to bipolar stimulation for all tested pre-
pulse durations (1ms: p=0.017, 5ms: p=0.003, 10ms: p<0.001).
Figure 3.5 Changes in 50% activation threshold with HPPs. Threshold changes with a) square
and b) ramp 10% and 20% HPPs of 1, 5 and 10ms duration in monopolar (black) and bipolar
(blue) setup. Negative values of “Difference in 50% threshold” indicate that the activation
threshold with biphasic stimulation phase width=40µs decreased with the tested pre-pulse
compared to stimulation without pre-pulse. Dashed lines represent mean ±SEM for 10% HPPs,
solid lines represent mean ±SEM for 20% HPPs of n=4 animals. 0% (dotted line) represents the
baseline of 50% thresholds with biphasic pulses without pre-pulse. Waveforms in legend not to
scale.

Chapter 3: Waveforms for neural stimulation
S. Eickhoff - January 2021 63
ENG during supramaximal amplitude stimulation
ENG recordings of compound action potentials (CAPs) evoked by 100µs biphasic
stimulation at 95% activation threshold I95% had an average delay of 1.67ms ±7.2µs of
the peak of the prominent first downward signal deflection from the stimulus artifact with
monopolar electrodes, and an approximately one phase width greater delay of 1.78ms
±4.9µs with bipolar electrodes (Figure 3.6.a). Higher stimulation amplitudes led to shorter
delays between artifact and ENG. In Monopolar stimulation the delay decreased by up to
60µs to 1.61ms ±6.4µs with 250µA above I95%. In the bipolar configuration the delay
shortened by up to 170µs to 1.61ms ±6.5µs with stimulation amplitudes 300µA above
I95% (Figure 3.6.b), so that there was no difference between monopolar and bipolar.
Biphasic stimulation with 200µs phase width at 95% activation threshold I95% led to a
delay of 1.73ms ±6.2µs in the monopolar and 1.91ms ±4.7µs, approximately one phase
width greater, in the bipolar setup (Figure 3.6.c). Stimulation amplitude exceeding I95%
led to shorter delays between artifact and signal in both electrode configurations. In the
monopolar case the delay shortened up to 69µs to 1.67ms ±7.8µs at 250µA above I95%
and in the bipolar case greater reductions of the delay of up to 245µs to 1.67ms ±7.5µs at
350µA above I95% were observed (Figure 3.6.d). Thereby, difference in response delay
between monopolar and bipolar electrode setup diminished with increasing
suprathreshold stimulation amplitude.
These are the data for one of the two rats in which ENG recordings were performed.
Although absolute latency values differed, the general finding of activation one phase
width later in bipolar compared to monopolar stimulation, as well as the reduction of this
difference with increasing supramaximal amplitude was observed in both animals.

Chapter 3: Waveforms for neural stimulation
S. Eickhoff - January 2021 64
3.1.4 In the bipolar configuration, excitation first occurs at the return
electrode
(IV. Discussion)
Our data on the effects of DPPs and HPPs to alter the excitability of the nerve to a
subsequent stimulus in monopolar electrode configuration are in good agreement with the
original research by Mortimer and Grill. In their first publication on subthreshold pre-
pulses, the authors used a cable model of the mammalian myelinated axon with 500µs
monophasic stimuli applied via a monopolar point source. They reported increased
thresholds when the stimulation pulse was preceded by 500µs DPPs of 95% threshold
amplitude (Grill and Mortimer, 1993). Further computer simulations employed a single
space-clamped Node of Ranvier as well as a compartment cable model of a mammalian
nerve fiber, both modelled exclusively with a monopolar stimulation point source and
described threshold increases with 500µs DPPs of 90% threshold amplitude and threshold
decreases with similarly parametrized HPPs (Grill and Mortimer, 1995). The authors root
these effects of sub-threshold pre-pulses in their influence on the inactivation variable h:
DPPs decrease h and thus render the neural membrane less excitable, whereas HPPs
Figure 3.6 Electroneurogram recordings of compound action potentials recorded in one
example during standard biphasic a) phase width 100µs and c) 200µs stimulation without pre-
pulse at 95% activation threshold I95%. Ten repeated recordings are superimposed, arrows indicate
the mean delay of the first prominent downward deflection towards the stimulation artifact t0.
Signal-to-Artifact delays of b) phase width 100µs and d) 200µs decrease with increasing
supramaximal amplitude above I95%. Data represents mean ±SEM of 10 repeated ENG recordings
at each amplitude and phase width in monopolar (black) and bipolar (blue) electrode
configuration. With phase width of 100µs (a and b) I95% corresponds to 1000µA in bipolar and
750µA in monopolar configuration, for phase width of 200µs (c and d) I95% corresponds to 900µA
in bipolar and 600µA in monopolar configuration.

Chapter 3: Waveforms for neural stimulation
S. Eickhoff - January 2021 65
increase h which increases the membrane excitability. In later in-vivo experiments on cat
sciatic nerve, Mortimer and Grill demonstrated that 500µs DPPs of 90% threshold
amplitude applied via a monopolar electrode contact selectively increased stimulation
thresholds of nerve fibers that otherwise showed the lowest threshold for recruitment
(Grill and Mortimer, 1997).
Using the bipolar electrode configuration that is relevant to stimulation via many nerve
cuffs, electrode arrays and proposed electroceutical devices, we observed opposite effects
of pre-pulses on stimulation threshold that are also in line with other published literature
that does not follow the pioneer work by Grill and Mortimer (Hennings, Arendt-Nielsen
and Andersen, 2005; Willand and de Bruin, 2008; Vastani et al., 2013; Vargas Luna,
Mayr and Cortés-Ramirez, 2018). Most of these studies were carried out with human
transcutaneous stimulation, either in a clearly bipolar configuration (Hennings, Arendt-
Nielsen and Andersen, 2005; Willand and de Bruin, 2008) or in a monopolar setting in
which the reference electrode was relatively close to the stimulated nervous structure
(Vargas Luna, Mayr and Cortés-Ramirez, 2018).
The consistent differences of pre-pulse effects in monopolar and bipolar electrode setup
in both the data described in the present study and in previously published literature, led
to the hypothesis that the return electrode might be the effective electrode in bipolar
stimulation setups at near threshold conditions. This hypothesis of threshold excitation at
the return electrode provides a satisfying explanation for the opposite effects of pre-pulses
in bipolar versus monopolar stimulation described in this study. Since the stimulation
waveform is inverted at the return electrode, not only do the stimulation phases have
opposite effects here but also the pre-pulses: DPPs (defined by the current waveform
injected at the active electrode, compare methods section “Subthreshold Pre-pulses”)
have a hyperpolarizing effect and thus decrease thresholds in the tissue surrounding the
return electrode (Figure 3.2.c), whereas HPPs have depolarizing effects that render the
membrane less excitable at this location (Figure 3.2.d). The ENG recordings support our
hypothesis by showing a shift correlating to the duration of one phase width between
responses elicited by monopolar and bipolar stimulation setups at amplitudes near full
activation threshold I95% (Figure 3.6.a & .c). It was interpreted that while in monopolar
stimulation excitation occurred near the active electrode as a response to the cathodic
(first) phase (Figure 3.2.b, left), for the bipolar setup the return electrode was the effective
electrode during the second phase, which here acts cathodically (Figure 3.2.b, right). In
the bipolar case, the first phase effectively acts as a HPP at the return electrode and

Chapter 3: Waveforms for neural stimulation
S. Eickhoff - January 2021 66
increases the resting potential of nerve fibers in proximity to this electrode. The
subsequent middle field transition acts from this increased resting potential with a strong
depolarizing influence on the axons in the field (compare 2nd field transition in Figure
3.2.b, right). The hypothesis is further supported by the changes in delay of elicited CAPs
at supramaximal stimulation intensities (Figure 3.6.b & .d). For both tested phase widths,
the reductions in the delay with increasing amplitude in monopolar setup were less than
one phase width. This implies that the threshold for excitation was first reached late within
the cathodic (first) phase and then gradually synchronized with the transition edge at the
beginning of that phase as the amplitude increased. In bipolar stimulation however, the
observed CAP delays consistently shifted more than one phase width with increasing
supramaximal stimulation amplitude. This greater reduction in CAP delay supports our
hypothesis that excitation begins at the return electrode during the second phase and shifts
with increasing amplitude to the first phase and the more distal active electrode (compare
Figure 3.2.b). The smooth nature of the curve of reduction of delay with increasing
amplitude must represent the variation among the population of motoneurons. This
provides a potent explanation for the differences in pre-pulse effects that were observed
between monopolar and bipolar configurations in this study. Furthermore, the possibility
of excitation at the return electrode explains work in which an “unexpected” reduction of
stimulation thresholds with DPPs has been reported with bipolar electrodes (Hennings,
Arendt-Nielsen and Andersen, 2005; Willand and de Bruin, 2008).
In one experiment, 5ms and 10ms HPPs of 20% stimulation intensity led, against the
generally observed trend, to lower stimulation thresholds in bipolar configuration. This
caused the average threshold changes across subjects with 20% HPPs to be smaller than
those observed with 10% HPPs in bipolar setup. The rationale for this might be that some
aspect of the electrode configuration in this specific preparation caused the HPP to
increase the stimulation thresholds at the return electrode sufficiently (and decrease
thresholds at the active electrode respectively) to shift the site of AP generation from the
proximal return to the distal active electrode.
Especially in the bipolar case, no significant effect of increasing the pre-pulse duration
above 1ms could be observed. The rationale for this could be the separation of the pre-
pulse from the effective part of stimulation (i.e. the middle field transition) by the first
phase of the stimulation pulse. In this case, the pre-pulse effect might predominantly
originate in a decrease (with DPPs, Figure 3.2.c) or increase (with HPPs, Figure 3.2.d) of
the first pulse transition. As this transition has a hyperpolarizing effect on axons near the

Chapter 3: Waveforms for neural stimulation
S. Eickhoff - January 2021 67
return electrode, a decrease of this transition edge will result in decreased thresholds for
activation, as was in fact observed with DPPs in bipolar configuration. The same
explanation applies to HPPs in bipolar electrode configuration: Independent from pre-
pulse duration the HPPs increase the inhibitory effect of the first pulse transition (compare
Figure 3.2.d, right) at the return electrode and thus lead to increased stimulation
thresholds. The general finding of limited influence of increasing pre-pulse durations
above 1ms is in agreement with the model-based work by Grill and Mortimer, who
showed that increasing the DPP duration from 0.5ms to 1ms had little to no effect on the
stimulation threshold of a space clamped Node of Ranvier (Grill and Mortimer, 1997). In
the same study, using a nerve cuff to stimulate the sciatic nerve in cat, the investigators
described a diminishing additional effect of increasing pre-pulse duration above 5ms. All
studies that tested multiple pre-pulse durations and describe a significant effect of
increasing it above a duration of approximately 5ms were conducted using transcutaneous
stimulation (Hennings, Arendt-Nielsen and Andersen, 2005; Willand and de Bruin, 2008;
Vargas Luna, Mayr and Cortés-Ramirez, 2018), where the tissue separating the target
nerve from the electrodes is likely to influence these temporal aspects.
In general, the presented data suggests that the principal effect of any given pre-pulse
may chiefly depend on the intensity and polarity of that pre-pulse at the effective location
of AP generation (i.e. at the effective physical or virtual electrode). This would imply that
the depolarizing effect of a sub-threshold pre-pulse at this location would also increase
stimulation thresholds for other waveforms, such as monophasic or biphasic pulses with
inverse phase order.
3.1.5 Implications for devices operating in bipolar mode warrant further
research
(V. Conclusion)
The present study is the first to investigate the effect of DPPs and HPPs on activation
thresholds with biphasic stimulation under conditions of direct relevance to contemporary
miniature implantable neuromodulation devices. The significant and consistent finding
of reversed pre-pulse effects in bipolar setup due to excitation at the return electrode not
only helps to resolve two decades of conflicting data in the published literature on pre-
pulses, but also stresses the strong influence of electrode configuration on the effect of
variations in pulse shape. While the generation of action potentials at the return electrode
of a bipolar electrode pair is the subject of recent research in the field of clinical nerve
Chapter 3: Waveforms for neural stimulation
S. Eickhoff - January 2021 68
conduction studies (Leote, Pereira and Valls-Sole, 2017), it has not yet been studied in
terms of its influence on the performance of implantable neuromodulation devices. A
better understanding of the differences between monopolar and bipolar stimulation is of
particular relevance to the emerging field of miniaturized neuromodulators, so called
electroceuticals, where the small implant size does not allow for substantial separation of
the electrodes. Most published data on well-established pulse shape variations such as
inter phase gaps (van den Honert and Mortimer, 1979; Gorman and Mortimer, 1983), like
the pioneer literature on subthreshold pre-pulses, is based on the monopolar case and
therefore not directly applicable to these bipolar scenarios. We report major differences
in spatial and temporal mechanisms of excitation between stimulation with monopolar
and bipolar electrode positions. These findings must be taken into account when
designing activation patterns delivered by miniaturized neuromodulation devices. Further
investigations of action potential generation at the return electrode of a bipolar pair and
its influence on the performance of implantable neuromodulators are warranted.

Chapter 3: Waveforms for neural stimulation
S. Eickhoff - January 2021 69
3.2 Interphase gaps (IPGs) and asymmetric pulses
(Abstract)
Interphase gaps (IPGs) are among the most commonly suggested pulse shape variations
to try to enhance neural stimulation efficiency by reducing the action potential (AP)
suppressing effect of an early anodic hyperpolarization. The majority of published
literature on the effect of IPGs is based on investigations of monopolar stimulation
configurations. However, many contemporary neuromodulation applications including
the emerging field of electroceutical devices must operate in a bipolar electrode
configuration. We investigated the effect of IPGs and asymmetric biphasic pulses with
reduced anodic amplitude on neural activation thresholds in both principal electrode
configurations in a rodent in-vivo nerve muscle preparation. In the monopolar electrode
configuration, our findings of 10.9 ± 1.5% decreased activation thresholds with 200µs
IPGs in biphasic pulses of 40µs phase width are in agreement with published literature in
this configuration. Surprisingly, using the bipolar electrode configuration, opposite
effects of IPGs were observed and activation thresholds were increased up to 18.6 ± 3.1%
(phase width 100µs, IPG=1000µs). Electroneurogram (ENG) recordings of the stimulated
nerve revealed temporal and spatial differences in AP generation between the monopolar
and bipolar configuration. In the bipolar configuration excitation first occurred at the
return electrode in response to the middle field transition of biphasic pulses. This is the
first study to report consistently increased activation thresholds with IPGs in a bipolar
stimulation configuration. Our findings must be taken into consideration when designing
stimulation waveforms for neuromodulation devices that operate in a bipolar mode to
avoid increased amplitude requirements that result in increased energy consumption
3.2.1 Authoritative literature on the effect of IPGs investigated only
monopolar stimulation configurations
(I. Introduction)
Electroceuticals are miniature neuromodulation devices in development to treat a wide
array of medical conditions by selectively delivering electrical stimuli to specific target
neural structures (Famm et al., 2013). Recent research assesses the potential of this novel
therapeutic strategy to treat a range of diseases including type 2 diabetes (Sacramento et
al., 2018; Fjordbakk et al., 2019), renal fibrosis, and hypertension (Okusa, Rosin and
Tracey, 2017). The high degree of selectivity necessary to target specific populations of
nerve fibres or specific brain circuits is a major challenge to the success of these therapies.

Chapter 3: Waveforms for neural stimulation
S. Eickhoff - January 2021 70
One approach to work toward this selectivity is by means of device miniaturization,
especially of the electrodes via which the electrical stimuli are applied, to close the gap
between the size of the target neural structure and the electrodes. This ongoing trend for
device miniaturization has led to a number of remarkable developments of millimetre-
scale implantable devices, most prominently of the so-called “neural dust” or “stim dust”
for recording and stimulation of nerves (Neely et al., 2018; Piech et al., 2020). Moving
on from the original proposal of the wirelessly powered BION micro-stimulation implants
(Loeb et al., 1991), implantable stimulators with ever smaller dimensions have been
developed (Luo et al., 2013; Freeman et al., 2017; Tanabe et al., 2017; Charthad et al.,
2018; Lee et al., 2018). The smallest neural stimulator using wireless transfer of
stimulating energy that has been reported and tested in-vivo has an overall volume of less
than 0.01 mm3 (Khalifa et al., 2019).
The underlying principle of these novel bioelectronics is the same as in other electrical
neuromodulation devices that already find broad clinical application such as cochlear
implants, pacemakers, and spinal cord stimulators: electrical pulses are used to alter the
generation and/or transmission of action potentials (APs) in the target excitable tissues.
Modulation of nerve activity can either be to reduce pathological activity, for example to
treat chronic pain or reduce spasticity in spinal cord injured subjects, or to elicit desired
therapeutic neural activity, for example, the stimulation of the auditory nerve to restore
the sense of hearing. Beside the main objectives to activate or block a target population
of nerve fibres, stimulation efficiency, selectivity and safety are key requirements of
electrical neuromodulation applications (Grill, 2018). Biphasic waveforms are essential
to achieve charged balanced stimulation which is a critical safety requirement to minimise
tissue damage and electrode disintegration that is caused by unbalanced charge injection
through electrochemical processes at the tissue-electrode interface (Merrill, Bikson and
Jefferys, 2005). Not least because they are easy to generate, rectangular biphasic
stimulation pulses have commonly been used. Although it has been shown that non-
rectangular waveforms can have advantages in terms of stimulation efficiency (Sahin and
Tie, 2007; Wongsarnpigoon, Woock and Grill, 2010; Eickhoff and Jarvis, 2019), most
contemporary devices use variations of the standard biphasic rectangular waveform. One
of the most widely used pulse shape variations is the introduction of an interphase gap
(IPG), sometimes also referred to as an interphase interval, between the cathodic and
anodic phases of the biphasic rectangular pulse.

Chapter 3: Waveforms for neural stimulation
S. Eickhoff - January 2021 71
In their pioneer research on IPGs, van den Honert and Mortimer (van den Honert and
Mortimer, 1979) studied a single voltage-clamped Node of Ranvier (NoR)
(Frankenhauser, 1957) and showed how an AP elicited by the cathodic (first) phase can
be abolished in near threshold conditions by an anodic (second) phase. Separation of the
two stimulation phases by an IPG removed the suppression by the anodic phase. The
authors tested their finding in an in-vivo experiment stimulating the tibialis anterior
muscle of cat with a monopolar intra-muscular electrode and reported increased motor
unit recruitment (that is, increased force) with increasing IPG durations from 0 to 100µs.
In a later study, the laboratory confirmed these findings of decreased activation thresholds
with the introduction of IPGs in biphasic pulses in a computational model of myelinated
axons (McNeal, 1976) stimulated via a monopolar point source, as well as in-vivo
experiments on monopolar tibial nerve stimulation in cat (Gorman and Mortimer, 1983).
Although conducted four decades ago and using exclusively monopolar electrode
configurations, these studies still stand, as far as we can determine, as the only
authoritative literature on the basic principles underlying the effect of IPGs for neural
stimulation. While the effect of IPGs has been studied in numerous applications including
the stimulation of the auditory nerve (Shepherd and Javel, 1999; McKay and Henshall,
2003; Carlyon et al., 2005; Prado-Guitierrez et al., 2006a; Kim et al., 2010; Ramekers et
al., 2014; Schvartz-Leyzac and Pfingst, 2016; Hughes, Choi and Glickman, 2018),
transcutaneous neuromuscular stimulation (Kaczmarek et al., 2010; Springer et al., 2014;
Vargas Luna et al., 2017), and epiretinal prostheses (Weitz et al., 2014), the majority of
these studies investigated only the monopolar case (Figure 3.7.a). Although it is
commonly assumed that IPGs are advantageous in any stimulation configuration, there
has not been any research to test the transferability of the early investigations of IPGs in
the monopolar configuration (van den Honert and Mortimer, 1979; Gorman and
Mortimer, 1983) to the bipolar configuration. This represents a fundamental gap in
knowledge especially in view of the emerging field of electroceutical devices and
electrode systems that due to their small size do not allow for substantial electrode
separation and are therefore inevitably bipolar, that is, the interelectrode distance is of a
similar size to the structure to be activated (Figure 3.7.b). Closing this gap in the scientific
literature is a crucial first step toward the development of stimulation pattern that are
optimized for next generation bioelectronic devices.

Chapter 3: Waveforms for neural stimulation
S. Eickhoff - January 2021 72
We designed our study specifically to meet this need and to catalyse a re-examination of
published pulse shaping strategies for their transferability to novel neuromodulation
applications. We studied the effect of biphasic charge balanced pulses with a range of
amplitudes of the anodic (second) phase and with different IPG durations on neural
activation thresholds in an in-vivo nerve-muscle preparation in anesthetized rats (Figure
3.7.c). Under computer control our stimulation system switched between the monopolar
electrode configuration (so that we can put our findings into perspective with the pioneer
research on IPGs (van den Honert and Mortimer, 1979; Gorman and Mortimer, 1983))
and the bipolar electrode configuration, to inform the emerging field of miniaturized
Figure 3.7 Electrode configurations and stimulation waveforms. (a) Many past and present
electrical neuromodulation devices and research studies have used monopolar electrode
configurations often with the implantable pulse generator itself as the return electrode. In this
configuration the electric field between the single active electrode near the target excitable
structure and the remotely placed return electrode area can be idealized as an electrical monopole.
(b) Due to the small overall device size, both electrodes of proposed electroceutical devices are
in similar proximity to the target structure and the generated electric field resembles an electric
dipole. (c) In our experimental model, a rodent in-vivo nerve-muscle preparation, we compared
both principal electrode configurations. The common peroneal nerve (CPN) in anaesthetized rats
was stimulated and the isometric twitch force response of the extensor digitorum longus (EDL)
muscle recorded. Depending on which return electrode was connected, the stimulation setup was
either monopolar (with Return M) or bipolar (with Return B). ENG recordings of the CPN were
measured distally to stimulation. We investigated the influence of different (d) asymmetric
stimulation waveforms as well as different (e) IPG durations on neural activation thresholds.

Chapter 3: Waveforms for neural stimulation
S. Eickhoff - January 2021 73
neuromodulation implants. In 5 adult Wistar rats, we recorded the isometric twitch force
response of the extensor digitorum longus muscle (EDL) to monophasic and biphasic
charge balanced stimulation of the common peroneal nerve (CPN).
First, following the approach of van den Honert and Mortimer (van den Honert and
Mortimer, 1979), we investigated the AP suppressive effect of anodic (second) phases of
biphasic pulses, when they were not separated by an IPG. Biphasic pulses with cathodic
(first) phase widths of 40µs and anodic (second) phases of 1, 2, 3, 4, and 8 times lower
amplitude than the first phase, were tested (Figure 3.7.d). The reduction in amplitude of
the anodic phase was compensated to achieve charge balance by a proportionally longer
phase width. Further we examined neural activation thresholds using biphasic symmetric
pulses with phase widths of 40, 100, 200, and 1000µs with and without IPGs of 25, 50,
100, 200, and 1000µs duration in both principal electrode configurations (Figure 3.7.e).
The EDL force response gives a reliable estimation of neural recruitment in the CPN
(Eickhoff and Jarvis, 2020b). In one representative nerve preparation, electroneurogram
(ENG) recordings during monopolar and bipolar stimulation with maximal (95%
activation threshold) and supramaximal amplitudes were analysed and presented here to
investigate the temporal aspects of AP generation in both electrode configurations and to
explain the differences found between the monopolar and bipolar cases.
3.2.2 Experimental model to test waveform variations in both principal
electrode configurations
(II. Materials and Methods)
A detailed description of the experimental model, surgical procedures, and
recording/stimulation instrumentation can be found in Chapter 2.
Stimulation protocol
Pulses with combinations of the pulse parameters to be tested (amplitude, phase widths,
asymmetric amplitude ratio, IPG, and return electrode configuration) were delivered in
Experiments were carried out in n=5 adult Wistar rats.
Home Office project licence: PPL 40/3743.
Stimulation electrodes: Active electrode distal, bipolar return electrode proximal, and
hypodermic needle in dorsal skin as monopolar return
electrode (return electrode switched by relay unit).
Recording electrodes: Approximately 10mm distal to stimulation electrodes.

Chapter 3: Waveforms for neural stimulation
S. Eickhoff - January 2021 74
randomized order. This means recruitment curves were assembled from test pulses that
were randomly placed from start to finish of a recording period. Every 20 test stimulations
a control pulse which was set to elicit full neural activation was delivered to use for
normalization. The control pulses were standard biphasic rectangular pulses with 200µs
phase width, cathodic phase first and amplitudes set for each experiment separately
(typically 1mA) to elicit maximal isometric twitch force. Twitch force responses to the
test stimulations were measured relative to the closest control pulse and thus normalized.
The randomized order of test stimulation parameter delivery and normalization with
control pulses allowed us to attain recordings that produced meaningful relationships
within the parameter space and are not affected by progressive or cyclic variations in body
temperature, depth of anaesthesia or fatigue.
Biphasic asymmetric pulses: In order to investigate the influence of the anodic (second)
phase of a charge balanced biphasic stimulation pulse, various ratios of cathodic to anodic
amplitude Ica/Ian were tested. The cathodic phase duration was set to 40µs, a typical
chronaxie value (i.e. the phase duration at which neural activation can be achieved with
minimum energy consumption) for our nerve-muscle preparation. The anodic phase
duration was 40µs multiplied by the asymmetry ratio Ica / Ian in order to achieve charge
balance. Symmetric biphasic pulses (amplitude ratio Ica/Ian=1) provided baseline values
for activation threshold in both electrode configurations separately. Asymmetric biphasic
pulses with ratios of Ica/Ian of 2, 3, 4, and 8 as well as monophasic cathodic pulses were
tested in both monopolar and bipolar electrode configurations. For every tested pulse
shape variation (e.g. asymmetric biphasic pulses with amplitude ratio Ica/Ian=4 in
monopolar electrode configuration) a full recruitment curve in 20 steps of 50µA was
recorded. In each of the 5 comprehensive animal experiments, all 240 test pulses for this
investigation of asymmetric pulses were applied in one recording period in randomized
order and interspersed with control pulses as described above.
Biphasic symmetric pulses with IPGs: The effect of IPGs on neural activation thresholds
in bipolar and monopolar electrode configuration was tested in four different stimulation
phase widths. Biphasic symmetric pulses of phase width 40, 100, 200, and 1000µs were
tested with IPGs of 0 (standard biphasic pulses as baseline), 25, 50, 100, 200, and 1000µs.
For each combination of phase widths, IPG duration and electrode configuration (e.g.
phase width of 100µs with 50µs IPGs applied via bipolar electrodes), a full recruitment
curve in 20 steps of 50µA was recorded. The four phase widths were tested in separate
recording periods, each consisting of 240 test pulses. All test pulses within each recording

Chapter 3: Waveforms for neural stimulation
S. Eickhoff - January 2021 75
period were applied in randomized order and interspersed with control pulses as described
above.
Maximal and Supramaximal stimulation: In two nerve-muscle preparations, temporal
aspects of AP generation were investigated in detail in monopolar and bipolar electrode
configurations. In both electrode setups thresholds for full motor unit activation (I95%)
were determined for standard biphasic pulses of 100µs and 200µs phase width. First using
stimuli with phase width of 100µs, ten maximal amplitude (I95%) stimulations were
applied at a rate of one pulse every 3 seconds in monopolar electrode configuration,
followed by ten repetitions at I95% in bipolar configuration. Amplitudes were increased to
supramaximal intensities in 7 steps of 50µA up to I95% + 350µA. For every amplitude
increment, ten repetitions were applied in monopolar and bipolar configuration. The same
procedure was repeated for biphasic stimuli with phase widths of 200µs.
Data analysis and statistical tests
For every tested pulse shape variation (e.g. an IPG of 200µs duration), the difference of
the 50% threshold with that specific variation was compared to the 50% threshold with
standard symmetric biphasic pulses (cathodic phase first) in the same electrode
configuration. The difference in 50% threshold for each tested pulse shape variation was
expressed as a percentage, negative values representing a reduction of the amplitude
required to reach 50% neural activation. Paired t-Tests were performed on the percentage
threshold changes between bipolar and monopolar electrode configurations.

Chapter 3: Waveforms for neural stimulation
S. Eickhoff - January 2021 76
3.2.3 IPGs and pulse asymmetry have opposite effects in bipolar compared
to monopolar stimulation mode
(III. Results)
The data on the effect of asymmetric biphasic pulses (Figure 3.8) and symmetric biphasic
pulses with IPG (Figure 3.9) on neural activation threshold presented here were generated
from 6300 individual recordings, 1260 from each of the 5 comprehensive experiments.
The data exhibits only minor influence of fatigue or cyclic variations in depth of
anaesthesia and thus demonstrates the value of computer-controlled stimulation protocols
in which we used a randomized order of stimulus parameter delivery as well as control
pulses for normalization across the duration of the experiment. These aspects of our
model are crucial to answer relevant research questions with a small number of
experimental animals.
Absolute amplitude values used in the experiments presented here ranged from 50 to
2000µA and the absolute amount of charge injected per phase did not exceed 1µC. This
means the maximum charge density per phase was below 40µC/cm2, so the stainless steel
electrodes were operated safely (Shannon, 1992) and within their specific charge injection
capacity (Merrill, Bikson and Jefferys, 2005). Monophasic pulses (maximum phase width
40µs) were separated by at least 3 seconds to allow charge dissipation.

Chapter 3: Waveforms for neural stimulation
S. Eickhoff - January 2021 77
Asymmetric biphasic charge balanced pulses.
Decreasing the amplitude of the anodic (second) phase of a biphasic pulse below the
absolute amplitude of the cathodic phase (biphasic symmetric pulse) to 2, 3, 4, and 8 times
lower values and finally to zero (monophasic pulse) led to decreased neural activation
thresholds with the monopolar electrode configuration (Figure 3.8). The average
Figure 3.8 Effect of decreasing the anodic amplitude from biphasic symmetric pulses over
different ratios of asymmetric charge balanced pulses to monophasic stimulation. (a) Recruitment
curves from one representative experiment: Decreasing the anodic amplitude decreases neural
activation thresholds in monopolar (black) configuration but surprisingly increases thresholds in
bipolar (blue) electrode configuration. Waveform in legend not to scale. (b) Average change of
50% activation threshold across subjects. A negative percentage change means that a lower
amplitude is needed to activate 50% of the motoneuron pool. Data represents mean of n=5 animals
± SEM.
Chapter 3: Waveforms for neural stimulation
S. Eickhoff - January 2021 78
threshold reduction across subjects increased with decreasing anodic amplitude ratio up
to 8.4 ± 1.1% with 8 times lower anodic amplitude. Monophasic stimulation achieved
neural activation with 11.4 ± 3.9% lower thresholds than those required with symmetric
biphasic pulses in monopolar configuration. Surprisingly, the same relative reduction of
the anodic amplitude consistently increased threshold for neural activation when the
electrode configuration was bipolar (Figure 3.8): Asymmetric biphasic pulses with 8
times lower anodic amplitudes showed 20.6 ± 4.2% higher thresholds than biphasic
symmetric pulses. Stimulation with monophasic pulses led to 16.5 ± 3.9% higher neural
activation thresholds than for biphasic symmetric pulses. The difference in threshold
(from the baseline threshold with biphasic symmetric pulses) of all tested asymmetry
ratios as well as monophasic stimulation was significant between monopolar and bipolar
electrode configuration (p<0.01).
Symmetric biphasic pulses with IPGs.
The introduction of IPGs in between the cathodic (first) and anodic (second) phases of
symmetric biphasic stimulation pulses decreased stimulation thresholds in monopolar
electrode configuration (Figure 3.9) in agreement with the common expectation based on
van den Honert and Mortimer’s original work (van den Honert and Mortimer, 1979). This
threshold decreasing effect was more profound for short phase widths and decreased with
increasing phase durations. Increasing IPG durations above 50µs did not significantly
enhance this threshold lowering effect in the monopolar configuration. With 40µs phase
width IPGs lowered the activation threshold by 10.9 ± 1.5% (IPG=200µs, n=5). We
observed lower threshold reductions of 4.9 ± 0.8% for phase width of 100µs
(IPG=1000µs, n=5) and up 2.9 ± 0.9% with phase width of 200µs (IPG=100µs, n=5).
With the longest tested stimulation phase width of 1000µs no consistent effect to change
threshold was observed.
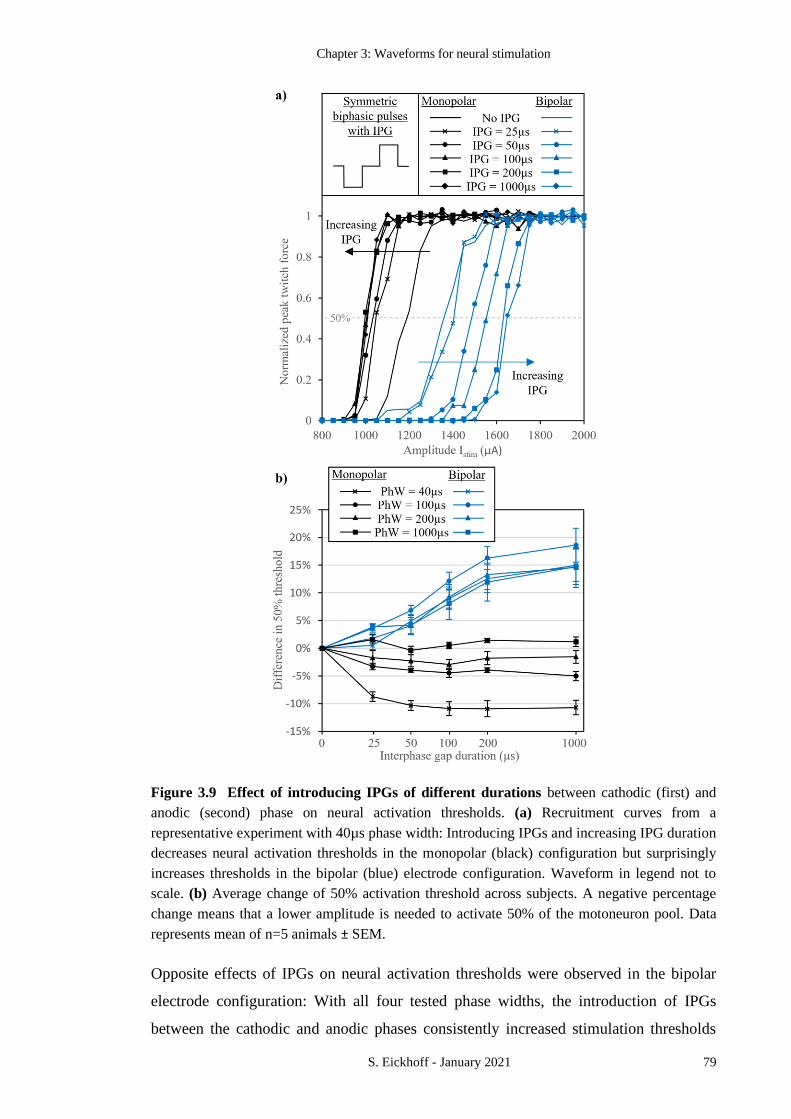
Chapter 3: Waveforms for neural stimulation
S. Eickhoff - January 2021 79
Opposite effects of IPGs on neural activation thresholds were observed in the bipolar
electrode configuration: With all four tested phase widths, the introduction of IPGs
between the cathodic and anodic phases consistently increased stimulation thresholds
Figure 3.9 Effect of introducing IPGs of different durations between cathodic (first) and
anodic (second) phase on neural activation thresholds. (a) Recruitment curves from a
representative experiment with 40µs phase width: Introducing IPGs and increasing IPG duration
decreases neural activation thresholds in the monopolar (black) configuration but surprisingly
increases thresholds in the bipolar (blue) electrode configuration. Waveform in legend not to
scale. (b) Average change of 50% activation threshold across subjects. A negative percentage
change means that a lower amplitude is needed to activate 50% of the motoneuron pool. Data
represents mean of n=5 animals ± SEM.

Chapter 3: Waveforms for neural stimulation
S. Eickhoff - January 2021 80
(Figure 3.9). This effect increased with increasing IPG duration and elevated thresholds
by 14.9 ± 2.9% (IPG=1000µs, n=5) with 40µs phase width stimuli. The longest IPG
duration of 1000µs increased thresholds by 18.6 ± 3.1% (IPG=1000µs, n=5) for 100µs
phase width pulses, 14.6 ± 3.6% (IPG=1000µs, n=5) for 200µs phase width stimuli, and
14.7 ± 3.2% (IPG=1000µs, n=5) for 1000µs phase width pulses.
The effect of IPGs on the 50% activation threshold was significantly different (p<0.05)
between the monopolar and bipolar electrode configurations for all combinations of phase
width and IPG duration except for phase width 200µs with 25µs IPGs and phase width
1000µs with 25, 50, and 100µs IGPs. The divergence between monopolar and bipolar
increased with increasing IPG (Figure 3.9.b).
Electroneurography during biphasic stimulation at supramaximal amplitude.
ENG recordings during repeated monopolar and bipolar stimulation with maximal (95%
activation threshold I95%) and supramaximal amplitudes are presented here from a
representative nerve preparation (Figure 3.10). The compound action potentials (eCAP)
evoked with biphasic pulses of 100µs phase width at maximal amplitude I95% were
recorded and had a latency of 1.67 ± 0.007ms (mean of n=10, ± SEM) between the
stimulation artifact and the first prominent downward deflection of the eCAP with the
monopolar electrode configuration (Fig. 4.a). With the bipolar electrode configuration,
maximal amplitude stimulation (I95%) elicited eCAPs with an approximately one phase
width greater latency of 1.78 ± 0.005ms. Increasing the amplitude in 50µA increments
from I95% to I95% +350µA reduced the delay by 60µs to 1.61 ± 0.006ms with monopolar
electrode configuration and by 170µs us to 1.61 ± 0.007ms with bipolar electrodes, so
that there was no longer a difference in the eCAP latencies between monopolar and
bipolar stimulation (Fig. 4.i).
Stimulation with 200µs phase width biphasic pulses at 95% activation threshold elicited
eCAPs with a latency of 1.73 ± 0.006ms in the monopolar case, whereas the delay was
1.91 ± 0.005ms, approximately one phase width greater with bipolar configuration
(Figure 3.10.e). Increasing the stimulation amplitude to I95% +350µA decreased the eCAP
latencies in monopolar stimulation by 69µs to 1.67 ± 0.008ms and by 245µs to 1.67 ±
0.008ms with bipolar electrode configuration. To summarize, the approximately one
phase width difference in eCAP delay between monopolar and bipolar stimulation
progressively decreased between maximal and supramaximal stimulation amplitudes
(Figure 3.10.j).

Chapter 3: Waveforms for neural stimulation
S. Eickhoff - January 2021 81
Figure 3.10 ENG recordings during maximal (I95%) and supramaximal amplitude
stimulation. eCAPs were recorded during stimulation with standard biphasic rectangular pulses
with phase width 100µs and amplitude a) I95%, b) I95%+100µA, c) I95%+200µA, and d) I95%+300µA
and with phase width 200µs and amplitude e) I95%, f) I95%+100µA, g) I95%+200µA, and h)
I95%+300µA. Each plot shows ten superimposed ENG recordings for stimulation via monopolar
(black) and bipolar (blue) electrode configuration. Arrowheads indicate mean eCAP latencies.
Mean eCAP latencies of stimulation with amplitudes equal to I95% are approximately one phase
width greater with bipolar (blue) than with monopolar (black) electrode configuration. The
difference in eCAP latencies between the two electrode configurations diminishes progressively
as the amplitude increases for phase widths i) 100µs and j) 200µs. Data represents mean ±SEM
of n=10 recordings. k) One representative normalized recruitment curve for 200μs biphasic
stimulation in the monopolar electrode configuration. 50% and 95% activation thresholds are
determined by linear interpolation. Normalized peak twitch force and ENG root mean square
(RMS) are correlated. (Eickhoff and Jarvis, 2020b) Copyright by IEEE. Adapted with permission.

Chapter 3: Waveforms for neural stimulation
S. Eickhoff - January 2021 82
3.2.4 Excitation at the bipolar return electrode explains opposite effects of
pulse shaping
(IV. Discussions)
We investigated the effects of decreasing the anodic (second) amplitude of a biphasic
pulse and introducing IPGs in biphasic pulses on neural activation thresholds in the
monopolar and bipolar electrode configurations. In agreement with the pioneering
research on IPGs (van den Honert and Mortimer, 1979; Gorman and Mortimer, 1983),
we observed an AP suppressing effect of the secondary anodic phase of a biphasic pulse
when we used a monopolar electrode configuration. Thresholds were decreased for neural
activation with asymmetric biphasic pulses that had reduced anodic amplitudes (Figure
3.8, black traces) and with separation of the anodic phase from the cathodic phase by an
IPG (Figure 3.9, black traces). Furthermore, our data obtained with the monopolar
stimulation configuration are remarkably concurrent with earlier observations that the
benefit of an IPG is greater for short phase width stimulation (Gorman and Mortimer,
1983) and that there is little additional advantage in increasing IPG durations above
approximately 100µs (van den Honert and Mortimer, 1979; Shepherd and Javel, 1999).
The rationale for both these observations is the so-called vulnerable period of axons that
just reached activation threshold in response to the cathodic (first) stimulation phase.
During this period, an early anodic phase can suppress self-propagating APs. Once the
IPG sufficiently separates the onset of the anodic phase from the timepoint of AP
elicitation during the cathodic phase, the AP has “escaped” the stimulation site and can
not be easily abolished by hyperpolarisation through the anodic phase. Further increasing
of IPG duration does not bring any additional advantage. As this separation is already
achieved by the relatively long phase widths of standard biphasic pulses (approximately
100µs or greater), there is limited practical benefit in introducing IPGs to such pulses.
Surprisingly in the bipolar electrode configuration that is most relevant to many
contemporary neuromodulation implants, especially to the emerging field of miniaturized
bioelectronic devices, we observed opposite and therefore detrimental effects of the pulse
shape variations that we tested. When we reduced the amplitude of the anodic (second)
phase of biphasic stimuli (Figure 3.8, blue traces) or introduced an IPG (Figure 3.9, blue
traces) both changes consistently led to increased stimulation thresholds for neural
activation.
As both of these pulse shape variations reduce the effective slope and/or amplitude of the
middle field transition of biphasic pulses (compare Figure 3.11.c-e), we formed the

Chapter 3: Waveforms for neural stimulation
S. Eickhoff - January 2021 83
hypothesis that in the bipolar electrode configuration excitation is first elicited by this
middle transition. While the middle field transition of a standard biphasic (cathodic phase
first) pulse has a hyperpolarizing effect at the active electrode, the same transition of the
mirrored or inverted current waveform at the return electrode has a strong depolarizing
effect (Figure 3.11.c). In addition, at the return electrode the first stimulation phase might
act as a hyperpolarizing pre-pulse, which has been shown to render axons more excitable
(Grill and Mortimer, 1995; Eickhoff and Jarvis, 2020b). Since in the bipolar configuration
both electrodes were placed at the same distance from the nerve, which setup resembles
the operational mode of many miniaturized implanted systems, the preconditioning effect
of the first phase followed by the strongly depolarizing middle field transition supports
our hypothesis of excitation at the return electrode.

Chapter 3: Waveforms for neural stimulation
S. Eickhoff - January 2021 84
Figure 3.11 Model of extracellular stimulation with practical electrode configurations. a)
Electrical field induced during cathodic stimulation in bipolar electrode configuration. b)
Cathodic stimulation leads to an extracellular electron gain at the active electrode (I.) which
results in depolarization of the neural membrane, whereas the charge return causes an increased
positive valence at the return electrode (II.) which hyperpolarizes the membrane. Thus, the effect
of the field transitions within a c) standard biphasic, d) asymmetric charge balanced, and e)
biphasic pulse with IPG on neural stimulation is the opposite at the return as compared to the
active electrode. Full arrowheads indicate depolarizing effects of field transition, open
arrowheads represent hyperpolarizing effects.

Chapter 3: Waveforms for neural stimulation
S. Eickhoff - January 2021 85
In order to test this hypothesis, we analysed ENG recordings distal to the stimulation site
during maximal (I95%) and supramaximal stimulation with standard biphasic pulses in two
nerve-muscle preparations. The results were consistent, and representative records are
presented from one of the preparations. During maximal stimulation amplitude I95%, the
eCAP latencies were consistently greater with the bipolar than with the monopolar
electrode configuration. The difference in eCAP latency was very close to the duration of
one stimulation phase, verifying the hypothesis that APs in the bipolar configuration were
elicited first in response to the second phase or the middle transition. Following our
hypothesis, this implies that in the bipolar configuration excitation first occurred at, or
near to, the return electrode. When amplitudes were increased above I95%, the eCAP
latencies progressively decreased. In the case of monopolar stimulation this decrease in
delay was less than one phase width, indicating that the threshold for activation was first
reached late in the first phase and then gradually synchronized with the onset of that first
phase (i.e. the first field transition). In the bipolar configuration we consistently observed
a reduction of the delay greater than one phase width. The rationale for this observation
may be that in this electrode setup excitation threshold was first reached within the second
phase at the return electrode. Upon increasing the supramaximal intensity, the event of
AP generation shifted temporally to the beginning of the first phase and spatially,
according to our hypothesis, from the return to the more distal active electrode. The
progressive nature of these shifts in delay must represent the distribution of threshold
values among the motoneuron population.
Due to the small size of our nerve preparation, an experimental verification of the site
(i.e. the electrode) of AP generation, e.g. by flipping the electrode polarities or changing
the inter electrode spacing, is not practical in our rodent model. With an interelectrode
distance of 2mm and a typical range of motor neuron conduction velocities of 70 to
120m/s, the difference in conduction time of an eCAP elicited at the more proximal return
electrode and one generated at the more distal active electrode would be between 28 and
16µs. These calculations are based on the assumption that the activated NORs are located
centrally over the electrode; if they are located towards the inside of the bipolar pair,
which is where the electrical field is likely to exhibit its highest density, the temporal
differences due to conduction velocity would be even smaller. This investigation of the
exact location of eCAP elicitation would however be an interesting follow up study in a
larger preparation such a human median nerve stimulation experiment. Here a greater
interelectrode separation would be possible and thus a reduction of the relative error due
Chapter 3: Waveforms for neural stimulation
S. Eickhoff - January 2021 86
to uncertainties such as the location of the activated NORs relative to the electrode
location as outlined above.
Despite the extensive body of scientific literature on the incorporation of IPGs in
waveforms for direct neural stimulation, this is the first study to report significantly
increased stimulation thresholds with IPGs in biphasic pulses in the bipolar electrode
configuration. A thorough review of the published literature on IPGs reveals that the
majority of these studies, including the early pioneer research in this field (van den Honert
and Mortimer, 1979; Gorman and Mortimer, 1983), investigated the effect of IPGs only
in the monopolar stimulation configuration (McKay and Henshall, 2003; Kim et al., 2010;
Ramekers et al., 2014; Weitz et al., 2014; Schvartz-Leyzac and Pfingst, 2016; Hughes,
Choi and Glickman, 2018). The common conclusion of these studies of reduced
thresholds for neural activation with IPGs is in agreement with our findings in the
monopolar electrode configuration. Fewer studies have investigated the effect of IPGs on
neural stimulation thresholds in bipolar the configuration (Shepherd and Javel, 1999;
Prado-Guitierrez et al., 2006b; Cappaert et al., 2013), and only two studies examined both
principal electrode configurations (Carlyon et al., 2005; Maciejasz et al., 2015). The
general consensus of these studies is that lower thresholds for neural activation may also
be achieved with IPGs in the bipolar electrode configuration. These therefore oppose our
findings in this configuration, but a number of methodological differences weaken this
opposition. First, as in many auditory nerve stimulation studies, the study by Prado-
Guitierrez et al. (Prado-Guitierrez et al., 2006b), and in one group of cochlear implant
users in the study by Carlyon et al. (Carlyon et al., 2005), biphasic pulses with 8µs IPG
instead of biphasic pulses without IPG were used as baseline. From this baseline both
studies describe decreasing thresholds with increasing IPG duration. This short IPG might
already have elevated the threshold for activation at the return electrode sufficiently, so
that the mechanism of activation as a response to the middle field transition, as we
describe it, could not be observed. Furthermore, although a detailed comparison of IPG
effects in the different electrode configurations was not the authors main objective and so
it was not subjected to further discussion or statistical tests, Carlyon et al. describe less
IPG effect in bipolar than in monopolar electrode mode (Carlyon et al., 2005). The
rationale for this could be that in bipolar configuration a subset of axons was excited at
the return electrode, where the increasing IPG weakens the depolarizing effect of the
middle field transition (compare Figure 3.11.e), and another subset of axons was excited
at the active electrode where the IPG reduces the AP abolishing effect of the anodic
Chapter 3: Waveforms for neural stimulation
S. Eickhoff - January 2021 87
(second) phase. Maciejasz et al. investigated the effect of IPGs in asymmetric pulses
consisting of a rectangular cathodic phase and a passive capacitive discharge as the anodic
phase (Maciejasz et al., 2015). As this passive discharge only reached a peak amplitude
of approximately 20% of the cathodic phase, the middle field transition of these
asymmetric pulses might not have been sufficient to elicit any activation at the return
electrode.
Our findings of increased thresholds for neural activation with biphasic pulses with
reduced anodic amplitude and IPG in the bipolar configuration are of direct importance
for many neuromodulation devices that operate in a bipolar mode. If these findings are
not considered in the design of stimulation patterns, the desired benefit of adding an IPG
or reducing the anodic amplitude might, depending on the electrode configuration,
represent a significant disadvantage. As the energy consumption per pulse is a crucial
parameter for neuromodulation devices that are battery powered or rely on wireless
energy transmission, we present two example calculations of this parameter to illustrate
the potential disadvantage. Since the electrical energy consumption per pulse is
proportional to the square of the stimulation current (Eickhoff and Jarvis, 2019), the
threshold increase of 12.2% that we observed with biphasic pulses with phase width
100µs and 100µs IPG (compared to standard biphasic pulses of phase width 100µs and
no IPG) in the bipolar configuration would increase the energy required to elicit the same
neural activation by 25%. Similarly, the 20% threshold increase we report for asymmetric
biphasic pulses with a ratio of Ica/Ian = 3 compared to symmetric biphasic pulses in the
bipolar configuration would lead to 44% increased energy consumption. These increased
energy requirements clearly oppose the ambition of device (and battery) miniaturization
as well as the reduction of recharge frequency or even battery replacement surgeries.
However, we argue that an understanding of the different mechanisms of AP generation
in the bipolar electrode configuration (that is details about the effective transition within
the stimulation waveform as well as the effective electrode) can not only prevent possible
disadvantages, but might also be harnessed to improve stimulation selectivity. As we have
demonstrated for asymmetric pulses and IPGs, any given pulse shape variation will (due
to the inverted current profile at the bipolar return electrode) have opposite effects at the
two bipolar electrodes. This effectively creates a zone of lower activation thresholds near
one electrode while at the same time thresholds for activation are elevated near the other
electrode and thus might offer a twofold opportunity for improved selectivity. Utilization
of this principle might offer crucial advantages for selective stimulation of

Chapter 3: Waveforms for neural stimulation
S. Eickhoff - January 2021 88
morphologically or physiologically complex neural structures that carry an array of
functions, such as in recent explorations to stimulate the carotid sinus nerve as treatment
for type 2 diabetes (Sacramento et al., 2018; Fjordbakk et al., 2019).
Besides the relative threshold changing effect of the investigated pulse shape variations
(i.e. the percentile difference from a baseline with standard biphasic pulses), which was
the main objective of the present study, in some experiments we observed significant
differences in absolute thresholds between the monopolar and the bipolar stimulation
configuration. In the data presented in Figure 3.8.a and Figure 3.9.a, for instance,
stimulation with monopolar configuration required less amplitude to elicit neural
activation than stimulation in the bipolar mode. Although we stated that miniaturized
electroceutical implants must, due to their small, operate in the bipolar configuration, it
can be argued that even with very small implants electrode arrangements could be used
that exhibit features of the classical monopolar stimulation mode. The miniaturized
implants could, for instance, be oriented so that one electrode is in contact with the nerve
while the other electrode surface is pointed away from it. Further, as long as maximal
charge density limits are not exceeded, the electrode design could incorporate a smaller
active electrode surface area and a larger return electrode area. These and other electrode
design parameters for miniaturized implants should be investigated in future research as
they might be beneficial in applications where (like in the representative data in Figure
3.8.a and Figure 3.9.a) stimulation with monopolar electrodes achieves activation with
lower amplitudes than stimulation in bipolar mode.
3.2.5 IPGs could significantly decrease battery life of stimulation implants
operating in bipolar mode
(V. Conclusion)
We examined the transferability of earlier published studies on the effect of IPGs for
neural stimulation thresholds that were predominantly carried out in monopolar electrode
configuration, to the bipolar stimulation configuration that is the operational mode of
many contemporary and future devices, such as the proposed class of electroceuticals.
Surprisingly we found opposite effects of IPGs in the bipolar compared to the monopolar
electrode configuration. This is the first study to report consistently increased thresholds
for neural activation with IPGs in the bipolar mode. We identified temporal differences
of AP generation as the cause for opposite effects of IPGs and biphasic asymmetric pulses
in the two principal electrode configurations. In the bipolar configuration excitation first

Chapter 3: Waveforms for neural stimulation
S. Eickhoff - January 2021 89
occurred in response to the middle field transition. This experimental observation
supports our hypothesis that, in the bipolar case, APs were first generated at the return
electrode. These findings must be taken into consideration when designing stimulation
patterns for neuromodulation devices that operate in bipolar mode to avoid increased
activation thresholds and thus over 40% increased energy consumption. Further research
is warranted to bridge the apparent gap between the findings of this study and earlier
published work that described a threshold lowering effect of IPGs for bipolar stimulation
of the auditory nerve (Shepherd and Javel, 1999; Carlyon et al., 2005; Prado-Guitierrez
et al., 2006a). Furthermore, a deeper understanding of the opposite threshold changing
effects of pulse shape variations that we describe at the active compared to the return
electrode of a bipolar stimulation configuration, may enhance selectivity of neural
stimulation and should be investigated in further research.
Chapter 3: Waveforms for neural stimulation
S. Eickhoff - January 2021 90
3.3 Gaussian shaped pulses
The study presented in this chapter is published and copyrighted:
© [2019] IEEE. Reprinted, with permission, from [Eickhoff and Jarvis, An Investigation
of Neural Stimulation Efficiency with Gaussian Waveforms, IEEE Transactions on
Neural Systems and Rehabilitation Engineering, 01/2020]
The only main differences between the published article and the present chapter are:
• Figure and equation numbers were adjusted to match the thesis chapter
numbering.
• Parts of the “Materials and Methods” section, such as the surgical procedure,
which are described in detail in the General Methods (Chapter 2), are left out and
the omissions are indicated by “[…]”. Instead, key methodological information
such as number of animals, electrode configurations, and recording sampling rates
are summarized in inserted boxes.
• To avoid redundant chapter names, the paper section-headings such as
“Introduction”, “Results”, and “Discussion” have been replaced by brief
summarizing descriptions of each section’s main message.
(Abstract)
Objective: Previous computational studies predict that Gaussian shaped waveforms use
the least energy to activate nerves. The primary goal of this study was to examine the
claimed potential of up to 60% energy savings with these waveforms over a range of
phase widths (50-200µs) in an animal model. Methods: The common peroneal nerve of
anaesthetized rats was stimulated via monopolar and bipolar electrodes with single
stimuli. The isometric peak twitch force of the extensor digitorum longus muscle was
recorded to indicate the extent of neural activation. The energy consumption, charge
injection and maximum instantaneous power values required to reach 50% neural
activation were compared between Gaussian pulses and standard rectangular stimuli.
Results: Energy savings in the 50-200µs range of phase widths did not exceed 17% and
were accompanied by significant increases in maximum instantaneous power of 110-
200%. Charge efficiency was found to be increased over the whole range of tested phase
widths with Gaussian compared to rectangular pulses and reached up to 55% at 1ms phase
width. Conclusion: These findings are surprising in light of the claims of up to 60%
Chapter 3: Waveforms for neural stimulation
S. Eickhoff - January 2021 91
energy savings with Gaussian like stimulation waveforms. The moderate energy savings
achieved with the novel waveform are accompanied with considerable increases in
maximal instantaneous power. Larger power sources would therefore be required, and
this opposes the trend for implant miniaturization. Significance: This is the first study to
comprehensively investigate stimulation efficiency of Gaussian waveforms. It sheds new
light on the practical potential of such stimulation waveforms.
Index Terms—Electrical stimulation, Gaussian waveform, Energy efficiency, Charge
efficiency, Peak power
3.3.1 Computational studies identified Gaussian shaped waveforms as
energy optimal
(I. Introduction)
Electrical stimulation (ES) of excitable tissues successfully finds application in a number
of therapeutic systems and medical devices such as the cochlear implant, the cardiac
pacemaker, deep brain and spinal cord stimulators. Electrical impulses are used to activate
or inhibit activation in a target excitable structure, which might be a block of cardiac
tissue, a region of the brain, or a peripheral nerve. This can be achieved using voltage- or
current-controlled stimulation waveforms: the latter has the benefit of eliminating
threshold variations that result from changes in electrode-tissue impedance and is
therefore commonly used today.
While the basic requirement of a stimulation waveform is to activate (or block) the target
structure, energy efficiency as well as stimulation selectivity and safety are of high
importance (Grill, 2018). In view of the many implantable ES devices and the trend
towards miniaturized applications such as so-called electroceutical systems for
stimulation of the autonomic nervous system (Horn, Ardell and Fisher, 2019), energy
efficient stimulation is important to the whole field as it enables increased battery lifetime
or the use of smaller batteries. There are recent early successes in wireless power delivery,
for example to a passive miniature radio-frequency identification (RFID) tag placed
inside a central organ of pigs (Ma et al., 2018). However, the higher amounts of electrical
energy required by active implants such as neural stimulators as well as the safety limits
of human exposure to radio frequency electromagnetic fields (IEEE, 2006) indicate that
the need to optimize stimulation efficiency remains. Superficially placed implants, such
as cochlear implants, that use transcutaneous power transmission can also benefit from

Chapter 3: Waveforms for neural stimulation
S. Eickhoff - January 2021 92
increased energy efficiency. Although not as critical as for devices with implanted
batteries, a more economical use of energy allows reduction in size and fewer recharge
cycles from an external power source. Although it is not often mentioned as a key
parameter of electrical stimulation, charge efficiency is also an important cofactor as it
can influence both selectivity and safety. An increased charge efficiency, that is, a
reduction of the charge injection required to activate a nerve, can increase the stimulation
safety due to reduced charge density at the electrode-tissue interface and/or increase
selectivity because electrode size may be reduced without exceeding safe limits for charge
density. Furthermore, the maximum instantaneous electrical power delivered via the
stimulation electrodes is an important criterion for implantable stimulators. Battery size
scales directly proportionally with maximum power since the specific power (W/kg) is
constant for any specific battery technology.
In many cases, rectangular current waveforms are used in electrical nerve stimulation, not
least because of the ease of generating them with simple electronic circuits. They are often
biphasic so that the overall net charge injection is near zero. Many studies have been
conducted to investigate variations of the rectangular biphasic waveform such as
interphase gaps (IPGs), asymmetric pulses (van den Honert and Mortimer, 1979; Gorman
and Mortimer, 1983; Reilly and Diamant, 2011) and pre pulses (Sassen and Zimmermann,
1973; Grill and Mortimer, 1995, 1997; Vargas Luna, Mayr and Cortés-Ramirez, 2018).
Some of these studies sought to discover whether non-rectangular stimulation waveforms
might have an advantage in terms of efficiency or selectivity. Several programmes also
incorporated computational simulations. Employing the Hodgkin-Huxley nerve
membrane model (Hodgkin and Huxley, 1952a; McNeal, 1976) Jezernik and Morari
predicted that an exponentially rising stimulation waveform would provide the best
energy efficiency (Jezernik and Morari, 2005). Comparing this and other non-rectangular
waveforms to standard rectangular stimuli applied to a computational model of a single
mammalian axon (Sweeney, Mortimer and Durand, 1987), exponentially rising and
decaying waveforms were found to be most charge efficient across the whole range of
phase widths. When the threshold charge was expressed as a fraction of the charge
injection capacity with practical titanium nitride microelectrodes, exponential and
linearly decreasing (i.e. reverse ramp) waveforms were most charge efficient. Both
exponential waveforms were most energy efficient at long phase durations (>250µs).
Gaussian shaped stimuli achieved the best energy efficiency at shorter phase widths
(Sahin and Tie, 2007). Using a more sophisticated computational simulation of a
Chapter 3: Waveforms for neural stimulation
S. Eickhoff - January 2021 93
population of mammalian myelinated axons (McIntyre, Richardson and Grill, 2002) as
well as in vivo experiments, the apparent superiority of exponential waveforms in terms
of charge and energy efficiency at long phase widths was shown to be misleading and
therefore over-estimated because the waveform shape became insensitive to the phase
duration since only the low amplitude ‘tail’ of the computed current waveform grew with
increasing phase width. Furthermore, exponential waveforms had significantly higher
peak power requirements than rectangular stimuli and triangular pulses were most charge
efficient for phase widths ≤ 200µs. It was shown that none of the tested rectangular,
exponential or ramp waveforms was simultaneously most efficient in terms of energy,
charge and peak power (Wongsarnpigoon, Woock and Grill, 2010).
Promisingly, three recent studies independently found a Gaussian shaped stimulation
waveform to be optimal in terms of minimized energy consumption using model-based
approaches probed by a genetic algorithm (Wongsarnpigoon and Grill, 2010), the
calculus of variation (Forger, Paydarfar and Clay, 2011) and the least action principle
(Krouchev et al., 2014). While these studies agree that a Gaussian stimulation waveform
shows increased energy efficiency over rectangular stimuli, there are considerable
differences in the claimed potential to save energy by replacing simple rectangular
waveforms with modified pulses. The largest claim of 5-60% increased energy efficiency
over a clinically relevant range of phase widths (~ 50-200µs) can be found in the genetic
algorithm study of Wongsarnpigoon and Grill, based on the outcome of their
computational and in vivo work (Wongsarnpigoon and Grill, 2010). However, these
studies on Gaussian shaped stimulation waveforms recognize that the energy costs of
generating such complex waveforms may decrease the achievable benefit in energy
efficiency of neuro stimulators and conclude that more practical investigations of the
incorporation of Gaussian waveforms are warranted. We here respond to this challenge.
To the best of our knowledge, the practical implementation of the Gaussian stimulation
waveform has not been studied further till now. The primary goal of our study was to
explore the findings of these recent computational studies in an animal model. Single
electrical stimuli were used to activate the common peroneal nerve (CPN) of
anaesthetized rats via monopolar or bipolar electrodes. The isometric peak twitch force
of the extensor digitorum longus muscle (EDL) was recorded to indicate the extent of
neural activation. To bring the detailed computational findings closer to practical
application, we reduced the phase-width-dependent variation of the optimal waveforms.
Only one fixed Gaussian waveform, which was chosen to closely resemble the waveforms

Chapter 3: Waveforms for neural stimulation
S. Eickhoff - January 2021 94
used by (Wongsarnpigoon and Grill, 2010) in the range of 50-200µs phase widths, was
compared to rectangular stimulation. Since charge balance is a key requirement of most
electrical stimulation applications, only biphasic stimuli were incorporated in this study.
As well as a comparison of energy efficiency between Gaussian and rectangular stimuli,
charge efficiency and peak power of stimulation with these waveforms were also
investigated, as these are important parameters of stimulation for the design of
implantable devices.
3.3.2 In-vivo experiment design
(II. Materials and Methods)
Surgical procedure
[…]
Stimulation
[…] To achieve charge balanced stimulation, all impulses were biphasic with the cathodic
phase first. The kurtosis of the Gaussian waveform is described by
Experiments were carried out in n=7 adult Wistar rats.
Home Office project licence: PPL 40/3743.
Stimulation electrodes: Active electrode distal, bipolar return electrode proximal, and
monopolar return electrode (in 3 animals) 10mm away from
the CPN long axis (return electrode switched manually
between recordings).
Figure 3.12 Experimental model: Nerve-muscle-preparation with Common Peroneal Nerve
(CPN) and Extensor Digitorum Longus (EDL). Electrodes: The active electrode was placed
most distal at the CPN. For bipolar stimulation “Return B” was used, for monopolar stimulation
“Return M” served as return electrode.

Chapter 3: Waveforms for neural stimulation
S. Eickhoff - January 2021 95
𝑰(𝒕) = 𝒆−
(𝒕
𝑷𝒉𝑾−𝟎.𝟓)
𝟐
𝟎.𝟎𝟒𝟓 , (3.1)
as this current profile was a close match to the waveforms used by Wongsarnpigoon and
Grill in what they called the clinically relevant range of phase widths (Wongsarnpigoon
and Grill, 2010). Recruitment curves (that is peak muscle force plotted against pulse
amplitude, see Figure 3.13.a) for phase widths of 40, 60, 80, 100, 120, 140, 160, 180, 200,
250, 325, 425, 550, 775 and 1000µs were recorded with 100µA amplitude increments for
biphasic Gaussian and rectangular pulses. For both waveforms and both electrode
configurations, the different combinations of stimulation parameters, that is, amplitudes
and phase widths, were applied in randomized order. Every 20 test stimulations a standard
control stimulation pulse (biphasic rectangular, 200µs PhW), with an amplitude set for
each subject to elicit supramaximal nerve recruitment (typically 1mA) was delivered and
the resultant force recorded.

Chapter 3: Waveforms for neural stimulation
S. Eickhoff - January 2021 96
Recording
[…] We wished to record the electrode current at a higher sample rate, so stimulation
current through a resistor in series and stimulation voltage across the electrodes, were
recorded separately at 500kS/sec with an NI PCIe 6351 Data Acquisition Card, which
was also used for stimulation.
Data analysis and statistics
The isometric peak twitch force values elicited by the randomly applied test stimulations
were normalized to the force response of the nearest control pulse. The normalized peak
Figure 3.13 Exemplary recruitment data for Gaussian and rectangular pulses with bipolar
electrodes. a) Normalized recruitment curves for PhW=60µs. 10%, 50%, and 90% of maximum
isometric twitch force were determined by linear interpolation of experimental measurement
points. b) Strength-duration curves for 50% activation (black traces) and dynamic ranges (gray
area) between 10% (lower traces) and 90% (upper traces) activation levels. Data are means of
n=7.
Extensor digitorum longus muscle twitch force recorded at 100kS/s.

Chapter 3: Waveforms for neural stimulation
S. Eickhoff - January 2021 97
force values were then sorted by pulse shape, phase width and stimulation amplitudes, to
reveal the normalized recruitment data. Thus, the final recruitment curves were assembled
from test pulses that were placed randomly from start to end of the respective recording
period, and therefore are not affected by variations of temperature, level of anaesthesia or
fatigue. Linear interpolation between data points was used to determine the 50%
activation thresholds of all recruitment curves (Figure 3.13.a). The energy consumption
(3.2) and charge injection (3.3) values for all applied stimuli were attained by integration
of the electrical stimulation recordings:
𝑬 = ∫ 𝑽(𝒕)𝑰(𝒕)𝒅𝒕𝟐𝑷𝒉𝑾
𝟎, (3.2)
𝑄 = ∫ |𝐼(𝑡)|2𝑃ℎ𝑊
0
𝑑𝑡. (3.3)
Energy and charge values at 50% activation level were scaled according to the threshold
interpolation. Furthermore, the percentage differences in energy consumption (3.4) and
charge injection (3.5) with Gaussian pulses compared to rectangular stimuli at 50%
activation threshold were calculated:
𝐃𝐢𝐟𝐟𝐞𝐫𝐞𝐧𝐜𝐞 𝐢𝐧 𝐞𝐧𝐞𝐫𝐠𝐲 = (𝟏 −𝑬𝒈𝒂𝒖𝒔
𝑬𝒓𝒆𝒄𝒕) ∗ 𝟏𝟎𝟎%, (3.4)
Difference in charge = (1 −𝑄𝑔𝑎𝑢𝑠
𝑄𝑟𝑒𝑐𝑡) ∗ 100%. (3.5)
In addition to these integrated measures of stimulation efficiency, the maximum
instantaneous power across the electrodes was also calculated
𝑷(𝒕) = 𝑽(𝒕) ∗ 𝑰(𝒕) (3.6)
for both tested waveforms and expressed as a percentage difference between the response
to rectangular and Gaussian pulses:
𝐃𝐢𝐟𝐟. 𝐢𝐧 𝐦𝐚𝐱. 𝐢𝐧𝐬𝐭. 𝐩𝐨𝐰𝐞𝐫 = (𝟏 −𝑷𝒈𝒂𝒖𝒔
𝑷𝒓𝒆𝒄𝒕) ∗ 𝟏𝟎𝟎%. (3.7)
Figure 3.14 shows an example of the electrical recordings (stimulation current and
voltage) as well as of the computed efficiency measures (energy, charge, and maximum
instantaneous power) with rectangular and gaussian pulses of 100µs PhW near 50%
activation level.

Chapter 3: Waveforms for neural stimulation
S. Eickhoff - January 2021 98
A two-way repeated measures analysis of variance (ANOVA) was performed for each
measure of stimulation efficiency separately. The dependent variable was the normalized
charge, energy or maximum instantaneous power value at 50% activation level. The
independent variables were waveform (rectangular or Gaussian), PhW, and rat (subject).
Where the effect of the waveform was found to be significant (p<0.05), Sidak’s multiple
comparisons were conducted post hoc for the means of the respective efficiency measure
(charge, energy or power) of Gaussian and rectangular stimuli at each PhW separately.
Figure 3.14 Electrical recordings of rectangular (left column: a, c, e) and Gaussian (right
column: b, d, f) stimulation (PhW=100µs) near 50% activation threshold. Stimulation current and
charge: a) Rectangular stimulus with 500µA amplitude and 100nC overall charge injection; b)
Gaussian pulse with 900µA amplitude and 69nC (31% reduction) charge injection. Stimulation
voltage across electrodes during rectangular c) and Gaussian d) stimulation. Instantaneous power
and energy consumption: e) Rectangular pulse consumes 36nJ energy and has a max. inst. power
of 231µW; f) Gaussian pulse consumes 31nJ energy (14% reduction) and has a max inst. power
of 584µW (153% increase).

Chapter 3: Waveforms for neural stimulation
S. Eickhoff - January 2021 99
3.3.3 Moderate energy savings with Gaussian waveform are accompanied
with substantially increased power requirements
(III. Results)
The recruitment data underlying the calculations of the efficiency measures exhibit only
minor influence of fatigue or cyclic variations in depth of anaesthesia. Figure 3.13.a
shows examples of typical recruitment curves with their characteristic sigmoidal shape.
Strength-duration curves at 50% activation level as well as the dynamic ranges (10% to
90% activation) exhibit the characteristic hyperbolic shapes (Figure 3.13.b).
Energy efficiency
Bipolar case: The energy-duration curves for 50% activation with Gaussian and
rectangular stimuli applied via bipolar electrodes (in n=7 animals) intersect at a phase
width between 60 and 80µs (Figure 3.15.a). After this intersection the energy
consumption values of Gaussian stimuli increase less with increasing PhWs than for
rectangular stimulation. This implies an increasing energy efficiency of Gaussian
compared to rectangular pulses with increasing PhW (Figure 3.15.c). The effect of
waveform on energy efficiency was significant (P<0.001). However, stimulation with
Gaussian pulses of the shortest tested phase width of 40µs required on average 17.7%
(±4.8% SEM) more energy than rectangular stimuli of the same PhW. In the range of 50-
200µs PhWs the differences in mean energy efficiency of Gaussian compared to
rectangular pulses ranged from -5.8% (±1.4% SEM) at 60µs to +17.1% (±2.4% SEM) at
200µs. At the longest tested PhW of 1000µs, excitation with Gaussian pulses was
achieved with 46.7% (±5.9% SEM) less energy than with rectangular impulses (Figure
3.15.c).
Monopolar case: Energy duration curves for stimulation via a monopolar electrode
configuration (in n=3 animals) intersect at a phase width of 100µs; for shorter pulses
rectangular stimulation appear to require less energy while Gaussian stimuli are more
energy efficient at PhWs over 100µs (Figure 3.15.b), although ANOVA revealed no
significant effect of waveform (P=0.11). At 40µs PhW stimulation with Gaussian pulses
was on average 17.6% (±4.7% SEM) less energy efficient than stimulation with
rectangular pulses. As the energy duration curves intersect within the range of 50-200µs
PhWs, the energy efficiency of Gaussian compared to rectangular pulses ranged from -
7.5% (±4.9% SEM) at 60µs to +17.5% (±5.9% SEM) at 140µs. The highest difference in
energy efficiency of 61.6% (±3.9% SEM) was observed at 1000µs (Figure 3.15.d).
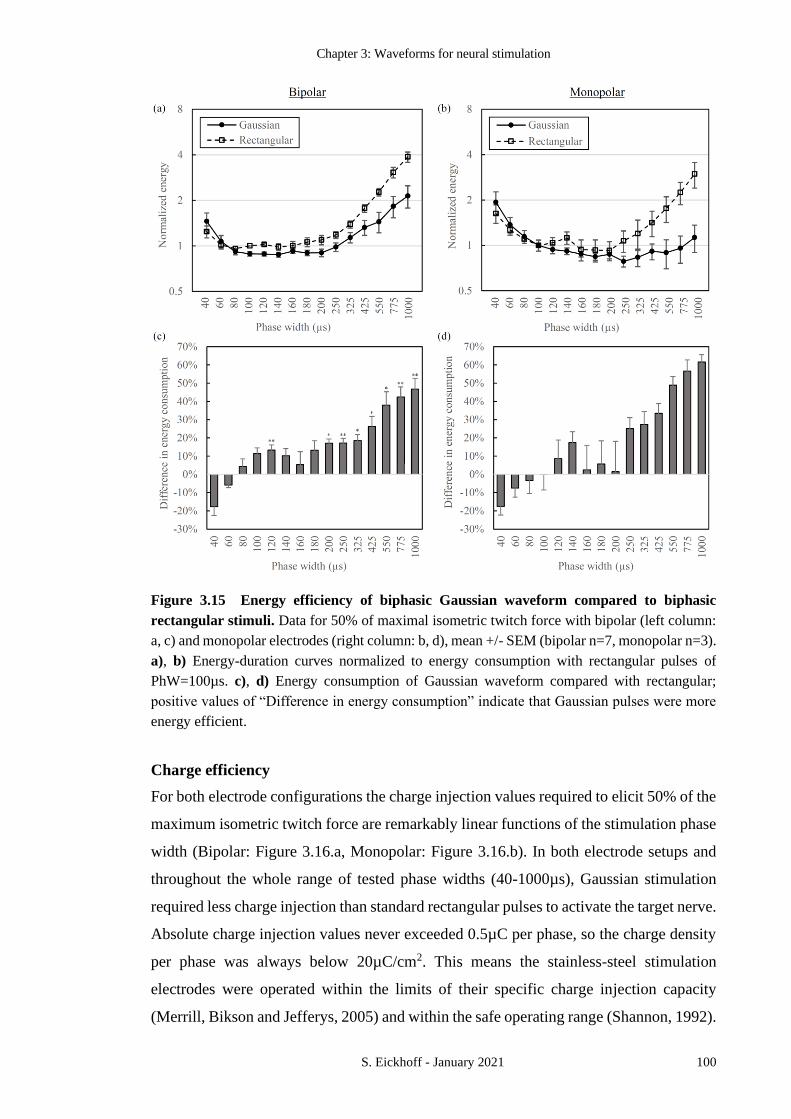
Chapter 3: Waveforms for neural stimulation
S. Eickhoff - January 2021 100
Charge efficiency
For both electrode configurations the charge injection values required to elicit 50% of the
maximum isometric twitch force are remarkably linear functions of the stimulation phase
width (Bipolar: Figure 3.16.a, Monopolar: Figure 3.16.b). In both electrode setups and
throughout the whole range of tested phase widths (40-1000µs), Gaussian stimulation
required less charge injection than standard rectangular pulses to activate the target nerve.
Absolute charge injection values never exceeded 0.5µC per phase, so the charge density
per phase was always below 20µC/cm2. This means the stainless-steel stimulation
electrodes were operated within the limits of their specific charge injection capacity
(Merrill, Bikson and Jefferys, 2005) and within the safe operating range (Shannon, 1992).
Figure 3.15 Energy efficiency of biphasic Gaussian waveform compared to biphasic
rectangular stimuli. Data for 50% of maximal isometric twitch force with bipolar (left column:
a, c) and monopolar electrodes (right column: b, d), mean +/- SEM (bipolar n=7, monopolar n=3).
a), b) Energy-duration curves normalized to energy consumption with rectangular pulses of
PhW=100µs. c), d) Energy consumption of Gaussian waveform compared with rectangular;
positive values of “Difference in energy consumption” indicate that Gaussian pulses were more
energy efficient.
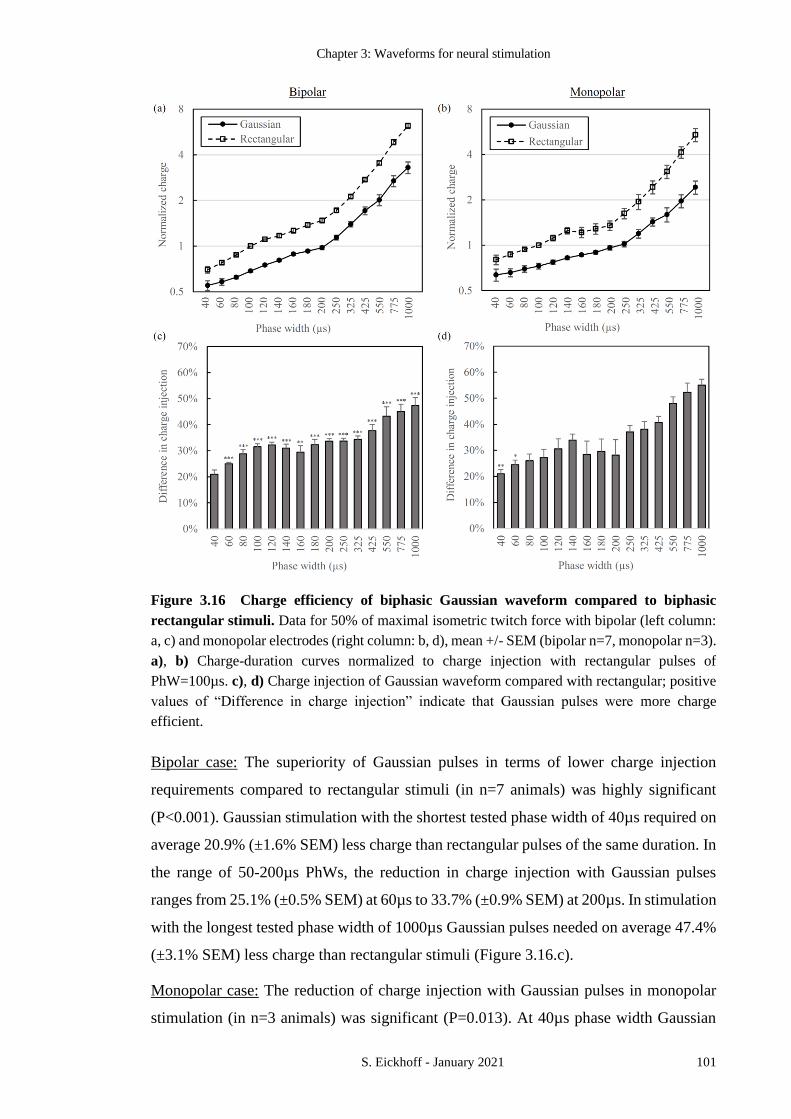
Chapter 3: Waveforms for neural stimulation
S. Eickhoff - January 2021 101
Bipolar case: The superiority of Gaussian pulses in terms of lower charge injection
requirements compared to rectangular stimuli (in n=7 animals) was highly significant
(P<0.001). Gaussian stimulation with the shortest tested phase width of 40µs required on
average 20.9% (±1.6% SEM) less charge than rectangular pulses of the same duration. In
the range of 50-200µs PhWs, the reduction in charge injection with Gaussian pulses
ranges from 25.1% (±0.5% SEM) at 60µs to 33.7% (±0.9% SEM) at 200µs. In stimulation
with the longest tested phase width of 1000µs Gaussian pulses needed on average 47.4%
(±3.1% SEM) less charge than rectangular stimuli (Figure 3.16.c).
Monopolar case: The reduction of charge injection with Gaussian pulses in monopolar
stimulation (in n=3 animals) was significant (P=0.013). At 40µs phase width Gaussian
Figure 3.16 Charge efficiency of biphasic Gaussian waveform compared to biphasic
rectangular stimuli. Data for 50% of maximal isometric twitch force with bipolar (left column:
a, c) and monopolar electrodes (right column: b, d), mean +/- SEM (bipolar n=7, monopolar n=3).
a), b) Charge-duration curves normalized to charge injection with rectangular pulses of
PhW=100µs. c), d) Charge injection of Gaussian waveform compared with rectangular; positive
values of “Difference in charge injection” indicate that Gaussian pulses were more charge
efficient.

Chapter 3: Waveforms for neural stimulation
S. Eickhoff - January 2021 102
pulses needed 21.0% (±1.6% SEM) less charge than rectangular stimuli to elicit the same
force response. The average charge reduction achieved within the range of 50-200µs
PhWs ranged from 24.5% (±1.8% SEM) at 60µs to 33.9% (±2.3% SEM) at 140µs.
Stimulation with 1000µs phase width was on average 54.9% (±2.3% SEM) more charge
efficient with Gaussian pulses (Figure 3.16.d).
Peak power
Throughout all tested phase widths and in both electrode configurations, the Gaussian
stimulation waveforms were less power efficient, i.e. they required a higher maximal
instantaneous power than the rectangular stimuli. ANOVA revealed the effect of
waveform to be significant in both electrode configurations (bipolar: P<0.001,
monopolar: P=0.017). The difference in maximum power between the compared
waveforms decreased with increasing phase duration from approximately 230% at 40µs
to 31.1% (±14.7% SEM, bipolar in n=7 animals) or 7.5% (±10.9% SEM, monopolar in
n=3 animals) at 1000µs (Figure 3.17).
These substantially increased values of maximal instantaneous power are due to the
higher stimulation amplitudes required with Gaussian pulses. The exemplar recordings in
Figure 3.14 show two pulses (phase width 100µs) near the 50% threshold. The rectangular
pulse has a stimulation amplitude of 500µA (Figure 3.14.a), whereas the Gaussian pulse
needed 900µA to elicit the same level of neural activation (Figure 3.14.b). The increased
current is associated with a higher voltage across the electrodes for the Gaussian (Figure
3.14.d) than for the rectangular pulse (Figure 3.14.c). As the instantaneous power across
the electrodes is the product of stimulation current and voltage (see Equation 3.6), it scales
approximately quadratically with the current. In the exemplary data of Figure 3.14, the
higher stimulation amplitude led to a 153% increase in maximum instantaneous power.
It increased from 231µW with the rectangular pulse (Figure 3.14.e) to 584µW with the
Gaussian pulse (Figure 3.14.f).

Chapter 3: Waveforms for neural stimulation
S. Eickhoff - January 2021 103
3.3.4 Experimental findings set into perspective with published literature
on non-rectangular waveforms
(IV. Discussion)
Following the findings of recent computational studies on energy optimal stimulation
waveforms (Wongsarnpigoon and Grill, 2010; Forger, Paydarfar and Clay, 2011;
Krouchev et al., 2014), Gaussian shaped stimuli were compared against standard
rectangular stimulation in a nerve-muscle preparation in anaesthetized rats in terms of
energy, charge and peak power efficiency. In order to attain results that can be applied
for practical applications such as cochlear implants or neuromuscular prosthetics, both
commonly used electrode configurations, monopolar and bipolar stimulation, were tested.
To further bring this investigation closer to practical implementation, instead of duration-
dependent pulse shapes only one fixed Gaussian waveform was used for all phase widths
and all tested stimuli were biphasic and charge balanced. In both electrode configurations,
Figure 3.17 Difference in maximum instantaneous power of Gaussian waveform compared
to rectangular in a) bipolar (n=7 animals) and b) monopolar stimulation (n=3 animals). Negative
values of “Difference in max. power” indicate that Gaussian pulses had higher values of max
instantaneous power.
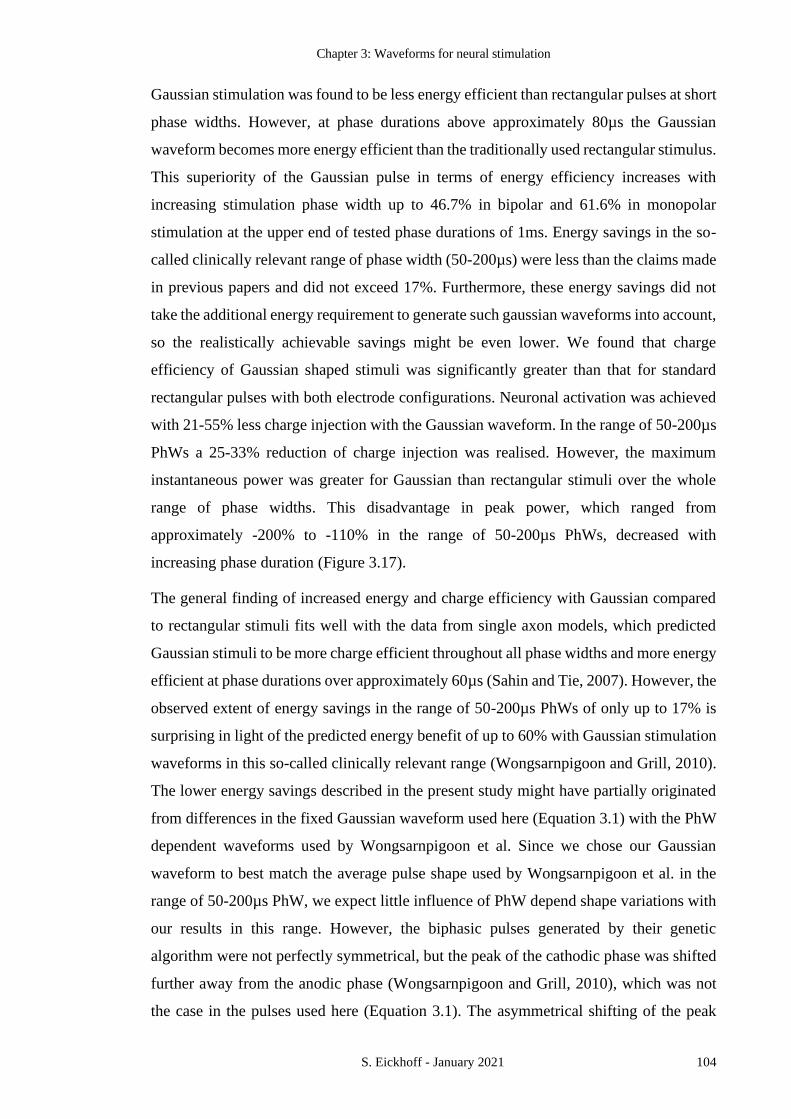
Chapter 3: Waveforms for neural stimulation
S. Eickhoff - January 2021 104
Gaussian stimulation was found to be less energy efficient than rectangular pulses at short
phase widths. However, at phase durations above approximately 80µs the Gaussian
waveform becomes more energy efficient than the traditionally used rectangular stimulus.
This superiority of the Gaussian pulse in terms of energy efficiency increases with
increasing stimulation phase width up to 46.7% in bipolar and 61.6% in monopolar
stimulation at the upper end of tested phase durations of 1ms. Energy savings in the so-
called clinically relevant range of phase width (50-200µs) were less than the claims made
in previous papers and did not exceed 17%. Furthermore, these energy savings did not
take the additional energy requirement to generate such gaussian waveforms into account,
so the realistically achievable savings might be even lower. We found that charge
efficiency of Gaussian shaped stimuli was significantly greater than that for standard
rectangular pulses with both electrode configurations. Neuronal activation was achieved
with 21-55% less charge injection with the Gaussian waveform. In the range of 50-200µs
PhWs a 25-33% reduction of charge injection was realised. However, the maximum
instantaneous power was greater for Gaussian than rectangular stimuli over the whole
range of phase widths. This disadvantage in peak power, which ranged from
approximately -200% to -110% in the range of 50-200µs PhWs, decreased with
increasing phase duration (Figure 3.17).
The general finding of increased energy and charge efficiency with Gaussian compared
to rectangular stimuli fits well with the data from single axon models, which predicted
Gaussian stimuli to be more charge efficient throughout all phase widths and more energy
efficient at phase durations over approximately 60µs (Sahin and Tie, 2007). However, the
observed extent of energy savings in the range of 50-200µs PhWs of only up to 17% is
surprising in light of the predicted energy benefit of up to 60% with Gaussian stimulation
waveforms in this so-called clinically relevant range (Wongsarnpigoon and Grill, 2010).
The lower energy savings described in the present study might have partially originated
from differences in the fixed Gaussian waveform used here (Equation 3.1) with the PhW
dependent waveforms used by Wongsarnpigoon et al. Since we chose our Gaussian
waveform to best match the average pulse shape used by Wongsarnpigoon et al. in the
range of 50-200µs PhW, we expect little influence of PhW depend shape variations with
our results in this range. However, the biphasic pulses generated by their genetic
algorithm were not perfectly symmetrical, but the peak of the cathodic phase was shifted
further away from the anodic phase (Wongsarnpigoon and Grill, 2010), which was not
the case in the pulses used here (Equation 3.1). The asymmetrical shifting of the peak

Chapter 3: Waveforms for neural stimulation
S. Eickhoff - January 2021 105
effectively introduces a greater interphase gap (IPG) than a symmetric Gaussian pulse
would have. It is known that the anodic phase of a biphasic pulse can abolish action
potentials in near threshold scenarios at short PhWs (van den Honert and Mortimer, 1979;
Gorman and Mortimer, 1983). Thus, the introduction of a (greater) IPG might lead to
greater stimulation efficiency. It might be argued that the (limited) energy savings with
biphasic Gaussian pulses at short PhWs are also a result of the separation of the
stimulation phases compared to a biphasic rectangular pulse without IPG (compare Figure
3.14.a-b). Investigations of this hypothesis would require new experiments.
We found that the increase in energy and charge efficiency was accompanied by a
increased peak power requirements, which extends the finding of Wongsarnpigoon et al.
that no rectangular, exponential or ramp waveform was at the same time most efficient
for energy, charge and power (Wongsarnpigoon, Woock and Grill, 2010). The benefits in
charge efficiency in the range of 50-200µs PhWs with the Gaussian waveform were
greater than those reported by Wongsarnpigoon et al., who found ramp pulses to be most
charge efficient for 20-200µs phase duration with 5-18% less charge injection than
required with standard rectangular pulses. Energy savings at long phase widths were
similar to those reported for exponential waveforms based on a population model and in
vivo work (Wongsarnpigoon, Woock and Grill, 2010). However, due to certain
constraints in pulse shaping the effective part of the exponential pulses used in that study
did not change as the phase width increased over approximately 0.3ms. The results were
therefore misleading for longer phase durations as the authors conceded. By contrast, the
Gaussian waveform used in the present study was scaled to fill the whole phase duration
(compare Figure 3.14.b).
3.3.5 Gaussian shaped stimulation waveforms not beneficial for
neuromodulation implants
(V. Conclusion)
The results of this study in terms of improved energy efficiency with Gaussian stimulation
waveforms must surprise any dispassionate researcher in light of the predicted range of
up to 60% energy savings in a so-called clinically relevant range of phase widths (50-
200µs) (Wongsarnpigoon and Grill, 2010) since only moderate savings of up to 17% were
observed. Furthermore, the comparison of maximum instantaneous power required with
Gaussian and rectangular stimuli revealed that in the range of 50-200µs PhWs, these
moderate energy savings were accompanied with profound increases in peak power.

Chapter 3: Waveforms for neural stimulation
S. Eickhoff - January 2021 106
While the energy savings could (if the additional instrumentational energy consumption
is neglected) increase the number of pulses that a given battery can deliver by up to 17%,
the 110% to 200% higher maximum power requirements would necessarily lead to an
undesired increase in battery size. Thus, the tested Gaussian waveform is not
advantageous to improve performance of implanted stimulation devices that operate at
the range of 50-200µs phase widths. The need for a larger energy source clearly opposes
the ambition for device miniaturization.
As all three measures of stimulation efficiency improved with increasing phase duration
(in the case of peak power, a decrease in the disadvantage) we conclude that the
implementation of the Gaussian stimulation waveform may have great potential
especially for applications with long phase widths such as stimulation of denervated or
partially denervated muscle (Salmons et al., 2005; Kern, 2014). And for stationary
therapeutic devices, where energy efficiency might not be as crucial as it is for battery
powered devices, the significant increase of charge efficiency could increase stimulation
selectivity by allowing electrode size to be reduced without exceeding safe limits of
charge density. The significant improvement in charge efficiency of over 50% which we
observed at 1ms phase width would allow the safe use of electrodes only half the size of
those required with conventional stimuli. Such a reduction in electrode size would enable
major improvements in applications like laryngeal (Cheetham et al., 2015) or facial
stimulation (Targan, Alon and Kay, 2000), where space is highly limited and coactivation
of nearby innervated structures is undesired and may be painful.
This study provides promising results and limitations related to the practical
implementation of Gaussian stimulation waveforms.

Chapter 3: Waveforms for neural stimulation
S. Eickhoff - January 2021 107
3.3.6 Addendum: Gaussian and “Gaussian-like” waveforms
Following the publication of the above study of neural stimulation efficiency with
Gaussian shaped stimulation waveforms, the discussion of this subject was further
advanced, commenced by a Letter to the Editor (Grill and Wongsarnpigoon, 2020). In
their letter Grill and Wongsarnpigoon, authors of one of the three computational studies
that identified Gaussian shaped waveforms as energy optimal, claiming up to 60% energy
savings (Wongsarnpigoon and Grill, 2010), who also hold an U.S. patent for their method
of deriving these Gaussian shaped stimuli with a genetic algorithm (GA) (Grill and
Wongsarnpigoon, 2015), raised the following point:
The waveforms used in our study (Eickhoff and Jarvis, 2019) are so different from their
GA waveform, that the limited extend of energy savings we reported does not challenge
their predicted range of 5-60% relative energy savings with GA waveforms
(Wongsarnpigoon and Grill, 2010). The differences between the waveforms are:
• Phase widths dependency: We used a fixed, phase widths independent Gaussian
waveform, whereas their optimal GA waveform was phase widths dependent.
• Kurtosis: The peaks of the Gaussian waveform studied in our investigation were
“less sharp” than those of the GA waveforms. The tails of our Gaussian
waveforms approached zero, while their GA waveforms were truncated.
• Symmetry: We studied symmetrical biphasic Gaussian pulses, whereas the
biphasic GA waveforms were coupled to rectangular anodic phases for charge
balance.
Our response to their letter reiterates that we did neither intend nor claim to have used the
exact GA waveforms described in their study (Eickhoff and Jarvis, 2020a). We discuss
that our findings of only up to 17% relative energy savings are, despite of the described
differences in the studied waveforms, very surprising in light of the predicted range of
“5-60%” energy savings and propose further research to reconcile the reported ranges of
potential energy savings.
The editorial letter presented below is published and copyrighted:
© [2020] IEEE. Reprinted, with permission, from [Eickhoff and Jarvis, "Reply to “Energy
Optimal Stimulation Waveforms, or Not: Comments on ‘An Investigation of Neural
Stimulation Efficiency with Gaussian Waveforms’”", IEEE Transactions on Neural
Systems and Rehabilitation Engineering, 05/2020]

Chapter 3: Waveforms for neural stimulation
S. Eickhoff - January 2021 108
The only main differences between the published article and the present chapter are:
• Figure and equation numbers were adjusted to match the thesis chapter
numbering.
• In the following letter we repeatedly refer to specific figures in our study as well
as in the genetic algorithm study by (Wongsarnpigoon and Grill, 2010). For the
sake of readability, we substituted the figure references to our study with cross
references to the same figures as they appear in the present thesis. References to
figures in the study by Wongsarnpigoon and Grill are indicated by an asterisk (e.g.
*Fig 7.a-b).
Dear Editor,
We thank Professors Grill and Wongsarnpigoon for their detailed responses prompted by
our recent publication (Eickhoff and Jarvis, 2019) in this journal. We welcome the
opportunity we have had for discussion and thank the Editor for his invitation to make
this further contribution.
We made our experiments partly in the light of the statements in the abstract of their
relevant paper (Wongsarnpigoon and Grill, 2010) that energy optimal genetic algorithm
(GA) waveforms “resembled truncated Gaussian curves” and that “if used in
implantable neural stimulators, GA-optimized waveforms could prolong battery life,
thereby reducing the frequency of recharge intervals, the volume of implanted pulse
generators, and the costs and risks of battery-replacement surgeries.”
The authors discussed the practical consequences of both a 5% increase and a 60%
increase in energy efficiency in the final statement of the paper and acknowledged that to
include the cost of generating the GA waveforms might change the predicted optimal
shape. Although mentioned only once, a claim of up to 60% relative energy savings is of
great interest to those who design and use neural stimulators. Based on our in-vivo
investigation of neural stimulation efficiency with biphasic Gaussian waveforms, we
reported an upper potential of 17% energy savings over rectangular biphasic pulses.
Furthermore, we added the consideration of instantaneous power requirement in our paper
to further inform this discussion. This is a crucial parameter, especially to set the practical
performance of the sharp-peaked GA waveforms into perspective, given that they deliver
the majority of the cathodic charge in a time much shorter than the nominal phase
duration.

Chapter 3: Waveforms for neural stimulation
S. Eickhoff - January 2021 109
Gaussian-like stimulation waveforms
We examined the practical implications of three recent independent computational studies
that identified Gaussian-like waveforms as energy optimal (Wongsarnpigoon and Grill,
2010; Forger, Paydarfar and Clay, 2011; Krouchev et al., 2014). We chose our waveform
based on the cathodic GA waveform in the “clinically relevant range”, identified by
Wongsarnpigoon and Grill, of 50-200µs phase width (PhW). However our intention, as
we described in the study, was not to rebuild the exact GA waveforms but rather “to
explore the findings of these recent computational studies in an animal model.”
Selection of waveform kurtosis
The waveform we tested was modeled on the kurtosis of the effective (cathodic charge
injecting) part of the biphasic GA waveforms shown in *Fig 6, as nearly as they could be
reconstructed from that figure. While the monophasic GA waveforms were truncated at
the tails (*Fig 2), this was not the case for the biphasic GA waveforms (*Fig 6) which
approached zero amplitude towards the tails and based on which we modeled our biphasic
Gaussian waveforms (Figure 3.14.b). Although the waveform defined by equation (3.1)
was a close match for the effective part of the GA waveforms in the range of 50-200µs
phase width and we expected “little influence of PhW dependent shape variations with
our results in this range”, we did not claim to have used the exact GA waveforms but
rather stated the differences between the waveforms.
Differences to GA waveforms
We acknowledge the differences between the Gaussian and GA waveforms and discussed
the main variations between the waveforms in our paper:
Pulse symmetry
The “biphasic pulses generated by their genetic algorithm were not perfectly
symmetrical, but the peak of the cathodic phase was shifted further away from the anodic
phase (Wongsarnpigoon and Grill, 2010), which was not the case in the pulses used” in
our study (Eickhoff and Jarvis, 2019) and “The asymmetrical shifting of the peak
effectively introduces a greater interphase gap (IPG) than a symmetric Gaussian pulse
would have.” The IPGs introduced by the near zero amplitude tails are most pronounced
in longer duration GA waveforms that deliver the majority of the cathodic charge in a
time much shorter than the nominal phase duration. This is not the case in our symmetric
Gaussian pulses, that were “scaled to fill the whole phase duration.”

Chapter 3: Waveforms for neural stimulation
S. Eickhoff - January 2021 110
Phase width dependency
“To bring the detailed computational findings closer to practical application, we reduced
the phase-width-dependent variation of the optimal waveforms” to “one fixed Gaussian
waveform”. We acknowledged that “the lower energy savings described in the present
study might have partially originated from differences in the fixed Gaussian waveform
used here (Eickhoff and Jarvis, 2019) with the PhW dependent waveforms used by
Wongsarnpigoon et al.”
Because of these differences in the waveforms studied, we carefully chose our words to
recognize that earlier predictions of up to 60% energy savings with Gaussian-like
waveforms are still worth exploring.
Although we mentioned these differences between our fixed symmetrical waveform and
the phase width dependent, asymmetrical waveforms used by (Wongsarnpigoon and
Grill, 2010), we did not explicitly discuss the difference in shape of the anodic charge
balancing phase. The biphasic GA waveforms used by Wongsarnpigoon and Grill had
“rectangular charge-balancing anodic pulses”, whereas we investigated symmetrical
biphasic Gaussian pulses. Especially in light of the gap between the reported upper limits
for relative energy savings (17% vs. 60%) with similar Gaussian-like cathodic
waveforms, we believe further exploration of this detail as follows might be helpful to
reconcile the two reported ranges of energy savings.
Further analysis to reconcile reported ranges of energy saving
Origin of 17% upper energy saving potential (Eickhoff and Jarvis, 2019)
We compared the energy consumption to reach 50% neural activation with biphasic
Gaussian compared to biphasic rectangular pulses of same phase durations in a murine
in-vivo model. All pulses were symmetric with equal cathodic and anodic phase durations,
and the polarity was cathodic phase first. The kurtosis of the Gaussian waveform is
described by equation (3.1) and was chosen based on the effective (cathodic charge
injecting) part of the biphasic GA waveforms (*Fig. 6). The greatest relative energy
savings of Gaussian pulses (in the 50-200µs range) of 17.1 ± 2.4% (mean of n=7, ± SEM)
were observed with phase width of 200µs (Eickhoff and Jarvis, 2019).
Origin of 5-60% energy saving range (Wongsarnpigoon and Grill, 2010)
Although the authors provided calculations on the implications for battery replacement
surgeries with this 60% figure, it was not stated in the paper whether this figure is based
on in-vivo or computational investigations, nor if it was attained with monophasic or

Chapter 3: Waveforms for neural stimulation
S. Eickhoff - January 2021 111
cathodic GA paired with rectangular anodic stimuli. As we understand the paper, it does
not originate from the in-vivo experiments, in which monophasic GA waveforms were
compared against monophasic conventional waveforms and realized a maximum relative
energy saving (in the 50-200µs range) of approximately 22% at 200µs phase width (*Fig.
5.b). Therefore, we assumed that the 60% figure might rather be rooted in the examination
of biphasic GA waveforms in the computational population model (*Fig 7.c-d). Here the
relative energy savings with cathodic GA waveforms (*Fig 6, PWanodic/PWcathodic = 1)
coupled to “rectangular charge-balancing anodic pulses” were investigated (compare
Figure 3.18.a). Cathodic phase first (*Fig 7.d) reached maximum energy savings of
almost 50% and the highest energy savings achieved with anodic phase first (*Fig 7.c)
appear to be approximately 70% compared to symmetrical rectangular pulses.
Proposed further investigations
Although the full biphasic waveforms are not depicted in the paper, in order to illustrate
the following considerations, we reconstructed the GA waveforms from *Fig. 6 and added
rectangular anodic pulses of the same nominal phase duration and equivalent amount of
charge injection.
When energy consumption, which is proportional to I2, is calculated across both phases
of the biphasic GA pulses (as was the case in (Wongsarnpigoon and Grill, 2010)) it
becomes apparent that the overall energy consumption of these waveforms is highly
asymmetric with limited contribution of the anodic phase (Figure 3.18.b). This is not the
case for conventional waveforms, such as the (symmetric) biphasic rectangular pulse,
which Wongsarnpigoon and Grill used as comparator (*Fig 7.c-d), nor was it the case in
our energy comparison of symmetric Gaussian versus symmetric rectangular waveforms
(Figure 3.14.e-f) in which both phases contributed similarly to the overall energy
consumption.

Chapter 3: Waveforms for neural stimulation
S. Eickhoff - January 2021 112
The anodic phase of the GA waveform has such low energy consumption because of its
lower anodic amplitude. The use of this lower anodic amplitude is made possible by the
effectively shorter cathodic phase width of the GA waveform. The GA waveform
therefore delivers its cathodic charge in a time frame much shorter than the nominal phase
width. Most biphasic GA waveforms delivered over 90% of the cathodic charge in much
less than half of the nominal phase duration, while during the rest of the phase charge
injection was near zero. It is well known that the energy-duration relationship has a
minimum at the so-called chronaxie, and so the use of the term “phase width” is more
than just a matter of nomenclature. It could be argued that the comparison made in *Fig
7.c-d (which may be the origin of the 60% energy saving figure) is a comparison of pulses
of different phase widths, with the GA waveforms being closer to chronaxie. We agree
with the authors, that the charge delivery in a time shorter than the nominal phase width
can not be the sole mechanism by which GA waveforms perform better than conventional
waveforms, because as they state “one would expect that at a given PW, the GA could
produce any waveform that was produced at a shorter PW bounded by tails of zero
amplitude”, which was not observed (Wongsarnpigoon and Grill, 2010).
For charge balance however, the biphasic GA waveforms harness the whole anodic phase
duration, and thus achieve a low anodic amplitude resulting in a very low anodic energy
consumption. This explanation for the much larger energy savings in *Fig 7.c-d is further
supported by the fact that once the phase duration ratio (PWanodic/PWcathodic) was
increased, the anodic energy consumption of all waveforms was reduced (*Fig 7.e-h). In
this case, the superiority in energy efficiency of the biphasic GA waveforms was
Figure 3.18 Biphasic GA waveform. a) Biphasic GA current waveform delivers the majority
of its cathodic charge in a time frame much shorter than the nominal PhW, while using the whole
nominal PhW for low anodic amplitude charge balancing (reconstructed from *Fig 6,
PWanodic/PWcathodic = 1, PhW=0.1ms, cathodic phase first). b) Integration of Istim2, which is
proportional to energy consumption, reveals a strong asymmetry with limited influence of the
anodic phase to the overall energy consumption.

Chapter 3: Waveforms for neural stimulation
S. Eickhoff - January 2021 113
significantly reduced and closer to the range reported for monophasic GA waveforms (up
to approx. 22% at 200µs phase width *Fig. 5.b) or symmetrical Gaussian waveforms
(17.1 ± 2.4% at 200µs phase width (Eickhoff and Jarvis, 2019)).
Conclusion
In order to reconcile the gap between the reported upper ranges of energy saving potential
with Gaussian and Gaussian-like stimulation waveforms (17% vs 60%), we have
highlighted the differences between our Gaussian stimuli and the GA waveforms used in
previous computational investigations (*Fig 6). Further we explore the principle that the
benefit of biphasic GA waveforms (*Fig 7.c-d) of up to 60% energy savings might
partially be the outcome of an effectively shorter (and thus closer to chronaxie) cathodic
phase width, while still using the whole nominal phase width (which determines the
comparator symmetrical rectangular pulse) for low amplitude anodic charge balance.
Both these pulse variations (shorter effective phase width and asymmetric, low amplitude
charge balance) are not, we would argue, properties of a particular waveform. To
discriminate between the effect to reduce energy consumption of a particular waveform
kurtosis or other waveform variations such as IPGs, asymmetric low amplitude anodic
phases and phase duration, further research is warranted (Figure 3.19).
Further, the above considerations clearly illustrate why we feel it is crucial to take into
account and to report maximum instantaneous power as well as energy consumed. The
Figure 3.19 Proposed further comparison to discriminate between the effect to lower energy
consumption of a particular cathodic kurtosis and other waveform variations. a) Biphasic
GA waveform effectively delivers majority of its cathodic charge in a time much shorter than the
nominal PhW (90% charge injection highlighted in dashed bars), has an IPG and an asymmetric
low amplitude anodic phase (reconstructed from *Fig 6, PWanodic/PWcathodic = 1, PhW=0.1ms,
cathodic phase first). In order to assess the performance of a particular cathodic waveform
kurtosis, the ideal conventional comparator pulse b) should perhaps have other waveform
variations such as IPG, effective PhW and anodic amplitude in common.

Chapter 3: Waveforms for neural stimulation
S. Eickhoff - January 2021 114
concentration of charge delivery into a small part of the phase width inevitably increases
this parameter, which has implications for battery size or voltage multiplication circuitry.
Jonathan C. Jarvis, PhD
Professor of Sport and Exercise Sciences
Liverpool John Moores University
Steffen Eickhoff, M.S.
PhD Candidate in Biomedical Engineering
Liverpool John Moores University

Chapter 4: Denervated muscle stimulation
S. Eickhoff - January 2021 115
4 DENERVATED MUSCLE
STIMULATION
In this chapter, a series of 7 terminal rat experiments is presented that investigated
properties of the denervated extensor digitorum longus muscle as well as strategies to use
electrical stimulation to activate such muscle in the absence of innervation. Many findings
reported here are of preliminary nature and raise some fundamental research questions.
The summary of our first observations and unanswered questions in this chapter is
intended to encourage future investigations.
The stimulation of denervated muscle will require the use of muscle surface electrodes, a
configuration dissimilar from the general methods (as described in Chapter 2) used in the
nerve stimulation studies. Therefore, in order to relate the observations with muscle
surface electrodes with the body on knowledge attained with nerve stimulation (Chapters
3 and 5), two initial experiments were conducted in healthy rats without nerve
impairment.
In the first experiment recruitment curves for monophasic rectangular pulses with
amplitudes from 50 to 1000µA (in steps of 50 µA) and 100µs phase width applied over
monopolar electrode configurations were recorded. We compared monopolar nerve
stimulation of the CPN, monopolar EDL muscle surface stimulation with a centrally
placed stainless steel disk electrode (diameter of 4mm), and monopolar intramuscular
stimulation with an approximately 5mm long inserted uninsulated stainless steel electrode
wire (Figure 4.1.a). A relay unit was used to switch between the active stimulation
electrodes under computer control while the return electrode was in all cases a
hypodermic needle under the dorsal skin of the animal.

Chapter 4: Denervated muscle stimulation
S. Eickhoff - January 2021 116
In the second experiment with a healthy rat, a bipolar pair of loop electrodes was placed
at the common peroneal nerve, approximately 5mm distal to the point it branches off the
sciatic nerve. The more distal electrode was used as active stimulation electrode and the
charge was returned over the more proximal nerve electrode. For muscle surface
stimulation, a bipolar pair of circular electrodes (diameter of 4mm) was manufactured
from thin stainless steel sheet metal and placed opposite to each other, centrally on the
EDL muscle (Figure 4.2.a). A relay unit was used under computer control to switch
between the muscle surface and nerve electrodes. Monophasic rectangular pulses with
phase widths of 200, 400, 600, 800, and 1000µs and amplitudes from 200µA to 5mA (in
increments of 200µA) were applied in random order via both sets of stimulation
electrodes (Figure 4.2.b).
Figure 4.1 Monopolar nerve versus muscle surface versus intramuscular stimulation in a
healthy preparation. a) Experimental setup to compare stimulation via a monopolar loop
electrode at the CPN against stimulation with a monopolar circular (4mm) EDL muscle surface
electrode and a monopolar intramuscular electrode wire. b) Recruitment curves for monophasic
100µs stimulation with nerve (black) and muscle (red) electrodes. Twitch force responses to nerve
stimulation reach a stable full recruitment plateau at approximately 0.7N. Stimulation via muscle
electrodes begins to elicit neuromuscular recruitment at lower amplitudes (200-500µA).
Stimulation with muscle surface electrodes exceeds the full activation plateau of nerve stimulation
at high amplitudes (of approx. 700µA and above).

Chapter 4: Denervated muscle stimulation
S. Eickhoff - January 2021 117
Stimulations applied over the nerve electrodes resulted in the characteristic recruitment
behaviour which we regularly observed using this configuration. Upon increasing the
amplitude, the elicited twitch force increases until it reaches a full activation plateau
which it does not exceed, not even at very high supramaximal intensities. The recruitment
behaviour in Figure 4.2.b appears to be rather step-like than sigmoidal, but this is only
due to the wide amplitude increments of 200µA that we chose in order to probe a wide
Figure 4.2 Nerve versus muscle surface stimulation in a healthy preparation. a)
Experimental setup to compare stimulation via a bipolar pair of loop electrodes at the CPN against
stimulation with a bipolar pair of circular (4mm) muscle surface electrodes. b) Recruitment curves
for stimulation with nerve (black) and muscle surface (red) electrodes. Twitch force responses to
nerve stimulation reach a stable full recruitment plateau at approximately 0.3N. Stimulation via
muscle surface electrodes begins to elicit neuromuscular recruitment at lower amplitudes (200-
600µA) and exceeds the full activation plateau of nerve stimulation at high amplitudes (of approx.
2mA and above).

Chapter 4: Denervated muscle stimulation
S. Eickhoff - January 2021 118
parameter space in a well-controlled timeframe. Finer amplitude increments would result
in the typical sigmoidal recruitment curve but would require a higher number of pulses
and thus a longer recording period.
The recruitment behaviour with stimulations applied over the muscle electrodes surprised
us in multiple ways. Due to the lower charge density with the larger surface electrodes
(5mm uninsulated length of the intramuscular electrode and 4mm diameter of the muscle
surface electrodes), we expected to activate the terminal nerve branches at higher
amplitudes than those required with the smaller nerve loop electrodes. Further it was
anticipated that the partial covering of the EDL with the relatively small muscle surface
electrodes (the two circular 4mm electrodes of experiment 2 (Figure 4.2) covered
approximately 10% of the EDL surface) would lead to would lead to partial motor pool
activation and lower twitch force responses. However, the experimental observations
dismissed both these expectations as the threshold for activation was lower with muscle
surface (and intramuscular) stimulation and the elicited twitch force responses exceeded
those with nerve stimulation (in case of the muscle surface electrodes). Further, and this
observation represents some challenges to the experiments with denervated muscle
stimulation that are described below, no clear full activation plateau was reached with
muscle surface stimulation. Both, increasing phase width and stimulation amplitudes,
even up to the instrumentational limit of 5mA, continued to increase the generated twitch
force. This makes it difficult to determine control pulse parameter for normalization, as
no obvious full activation level can be defined.
These fundamental questions remain open and further research towards answering them
be strongly encouraged:
• What causes the lower thresholds for activation with muscle surface compared to
(smaller) nerve loop electrodes in a healthy preparation? In healthy neuromuscular
preparations, stimulation at the muscle surface (and intramuscular stimulation)
will lead to activation of the terminal nerve branches rather than direct activation
of muscle tissue as the later has significantly higher threshold for activation.
Might the epineurium connective tissue sheath have an electrically shielding
effect at the proximal nerve stimulation site and thus lead to higher activation
threshold than compared to stimulation at the muscle surface? Further research
could investigate this hypothesis by carefully dissection of the connective tissue
at the nerve stimulation site.
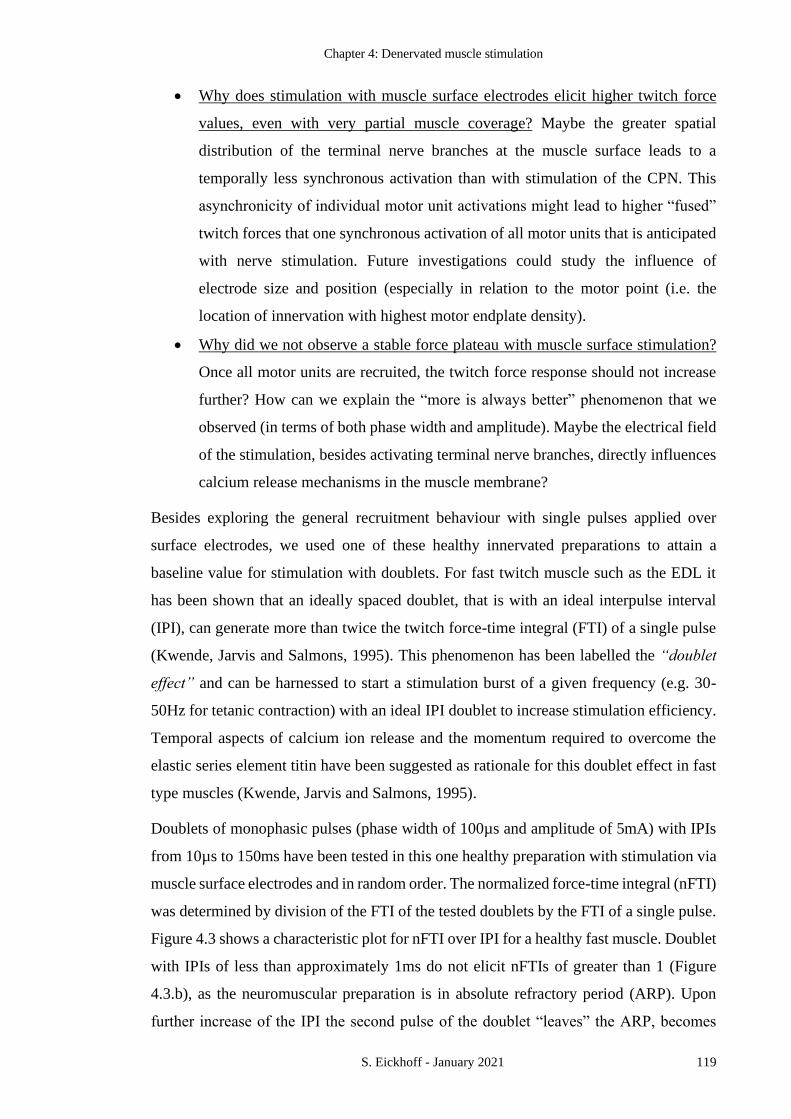
Chapter 4: Denervated muscle stimulation
S. Eickhoff - January 2021 119
• Why does stimulation with muscle surface electrodes elicit higher twitch force
values, even with very partial muscle coverage? Maybe the greater spatial
distribution of the terminal nerve branches at the muscle surface leads to a
temporally less synchronous activation than with stimulation of the CPN. This
asynchronicity of individual motor unit activations might lead to higher “fused”
twitch forces that one synchronous activation of all motor units that is anticipated
with nerve stimulation. Future investigations could study the influence of
electrode size and position (especially in relation to the motor point (i.e. the
location of innervation with highest motor endplate density).
• Why did we not observe a stable force plateau with muscle surface stimulation?
Once all motor units are recruited, the twitch force response should not increase
further? How can we explain the “more is always better” phenomenon that we
observed (in terms of both phase width and amplitude). Maybe the electrical field
of the stimulation, besides activating terminal nerve branches, directly influences
calcium release mechanisms in the muscle membrane?
Besides exploring the general recruitment behaviour with single pulses applied over
surface electrodes, we used one of these healthy innervated preparations to attain a
baseline value for stimulation with doublets. For fast twitch muscle such as the EDL it
has been shown that an ideally spaced doublet, that is with an ideal interpulse interval
(IPI), can generate more than twice the twitch force-time integral (FTI) of a single pulse
(Kwende, Jarvis and Salmons, 1995). This phenomenon has been labelled the “doublet
effect” and can be harnessed to start a stimulation burst of a given frequency (e.g. 30-
50Hz for tetanic contraction) with an ideal IPI doublet to increase stimulation efficiency.
Temporal aspects of calcium ion release and the momentum required to overcome the
elastic series element titin have been suggested as rationale for this doublet effect in fast
type muscles (Kwende, Jarvis and Salmons, 1995).
Doublets of monophasic pulses (phase width of 100µs and amplitude of 5mA) with IPIs
from 10µs to 150ms have been tested in this one healthy preparation with stimulation via
muscle surface electrodes and in random order. The normalized force-time integral (nFTI)
was determined by division of the FTI of the tested doublets by the FTI of a single pulse.
Figure 4.3 shows a characteristic plot for nFTI over IPI for a healthy fast muscle. Doublet
with IPIs of less than approximately 1ms do not elicit nFTIs of greater than 1 (Figure
4.3.b), as the neuromuscular preparation is in absolute refractory period (ARP). Upon
further increase of the IPI the second pulse of the doublet “leaves” the ARP, becomes
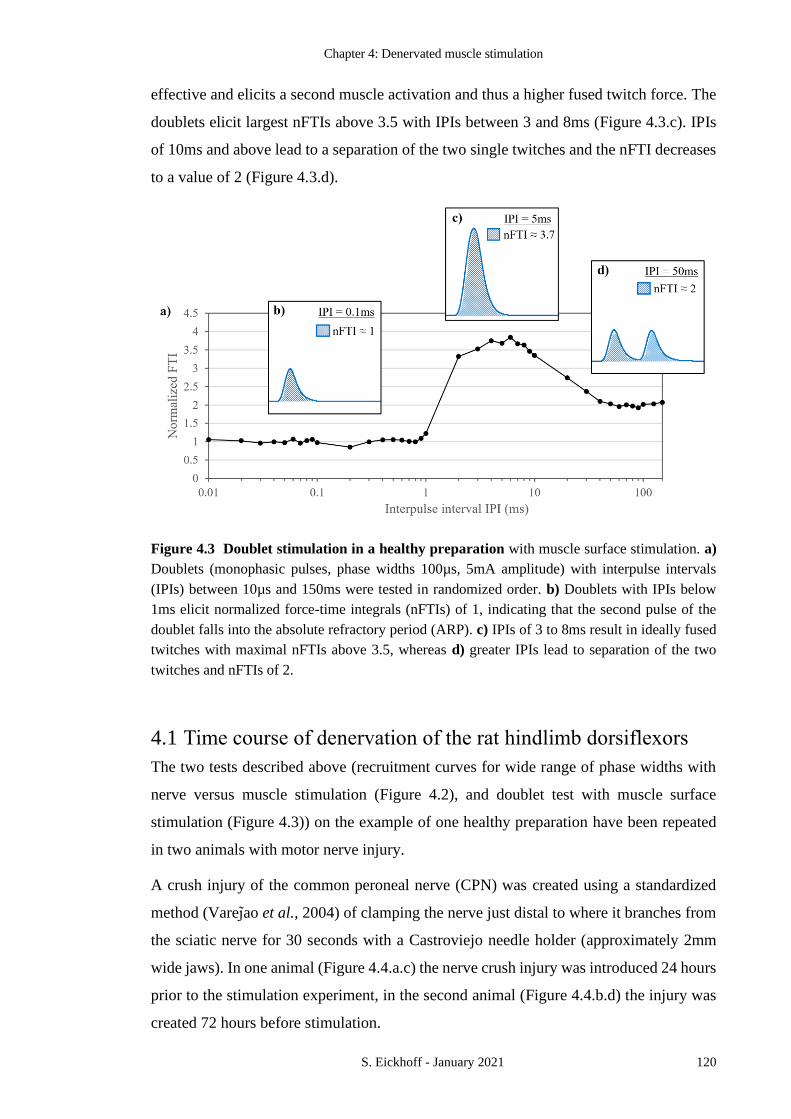
Chapter 4: Denervated muscle stimulation
S. Eickhoff - January 2021 120
effective and elicits a second muscle activation and thus a higher fused twitch force. The
doublets elicit largest nFTIs above 3.5 with IPIs between 3 and 8ms (Figure 4.3.c). IPIs
of 10ms and above lead to a separation of the two single twitches and the nFTI decreases
to a value of 2 (Figure 4.3.d).
4.1 Time course of denervation of the rat hindlimb dorsiflexors
The two tests described above (recruitment curves for wide range of phase widths with
nerve versus muscle stimulation (Figure 4.2), and doublet test with muscle surface
stimulation (Figure 4.3)) on the example of one healthy preparation have been repeated
in two animals with motor nerve injury.
A crush injury of the common peroneal nerve (CPN) was created using a standardized
method (Varejao et al., 2004) of clamping the nerve just distal to where it branches from
the sciatic nerve for 30 seconds with a Castroviejo needle holder (approximately 2mm
wide jaws). In one animal (Figure 4.4.a.c) the nerve crush injury was introduced 24 hours
prior to the stimulation experiment, in the second animal (Figure 4.4.b.d) the injury was
created 72 hours before stimulation.
Figure 4.3 Doublet stimulation in a healthy preparation with muscle surface stimulation. a)
Doublets (monophasic pulses, phase widths 100µs, 5mA amplitude) with interpulse intervals
(IPIs) between 10µs and 150ms were tested in randomized order. b) Doublets with IPIs below
1ms elicit normalized force-time integrals (nFTIs) of 1, indicating that the second pulse of the
doublet falls into the absolute refractory period (ARP). c) IPIs of 3 to 8ms result in ideally fused
twitches with maximal nFTIs above 3.5, whereas d) greater IPIs lead to separation of the two
twitches and nFTIs of 2.

Chapter 4: Denervated muscle stimulation
S. Eickhoff - January 2021 121
24 hours after the introduction of the CPN crush injury, excitability via nerve stimulation
(approximately 5mm distal to the nerve injury) was already drastically reduced to
approximately 25% of the twitch force generated with muscle surface stimulation (Figure
4.4.a). After 72 hours no muscle twitch could be elicited with nerve stimulation (Figure
4.4.b), indicating that the motor axons have fully degenerated by that time. A doublet test
with muscle surface stimulation further revealed gradual changes in the maximal
achievable nFTI (Figure 4.4.c-d). One day after the nerve crush injury a maximal nFTI of
3.2, a value still in the range of typical healthy preparations as we will show below (Figure
4.5.b), was achievable with an ideal IPI of 6ms. Three days after the injury, the maximal
nFTI decreased to approximately 2.7, indicating that the denervated muscle transitions to
the physiological behaviour of slow twitch muscle.
Figure 4.4 Recruitment curves and doublet test 1 and 3 days after nerve crush injury a) and
b) recruitment curves for stimulation with phase width 200 to 1000µs via muscle surface
electrodes (red) and nerve electrodes (distal to nerve crush injury, black). Excitation via nerve
stimulation is strongly reduced 24 hours after nerve crush injury, and completely lost 72 hours
after the injury. Doublet test with muscle surface stimulation indicates a decrease of the
achievable doublet effect with increasing time after nerve crush injury. c) One day after nerve
injury the nFTI reaches a maximum of approximately 3.2, whereas d) the maximum nFTI after
three days lowered to approximately 2.7.

Chapter 4: Denervated muscle stimulation
S. Eickhoff - January 2021 122
While it is a well-established fact that, following spinal cord injury, muscles lose their
characteristic mosaic type I and type II fibre pattern and become composed predominantly
of fast (type II) fibres, this fibre re-composition does not take place immediately.
Reviewing the literature on analyses of biopsies obtained from various muscles of human
spinal cord injured subjects, Castro et al. describe an almost complete absence of type I
(slow) fibres 2–11 years after the injury. However, there was no clear evidence that any
significant fibre type transformation occurred in the first 1 to 6 months after injury (Castro
et al., 1999). While there is not a comprehensive body of literature on the acute
physiological changes of denervated muscle within the first days of injury with regard to
single twitch to tetanic contraction ratios, the shift toward slow twitch characteristics that
we describe agrees well with an earlier report by Yeagle et al. In their study on the
contractile properties of denervated fast twitch rodent muscle, the authors reported
significantly increased contraction times (that are characteristic for slow twitch muscle)
within the first 8 to 11 days following nerve injury and discuss the possibility of a
decreased muscle fibre conduction velocity (MFCV) as rationale for this observation
(Yeagle, Mayer and Max, 1983). Decreased MFCV might explain the early changes in
muscle twitch characteristics towards those of slow twitch muscle that we observed three
days after the nerve injury, as lower MFCV has been identified as one of the earliest
changes in denervated muscle (Wu et al., 2014). Further investigations, including MFCV
measurements and twitch force recordings, ideally in a time course from acute nerve
injury over complete denervation to fully reinnervated muscle, are warranted to test this
assumption.
With increasing time of denervation, it became increasingly difficult to identify a sensible
force value that might represent full motor pool activation with muscle surface
stimulation. For this reason, in the following experiments described below (that studied
ten day denervated muscles), a qualitative comparison was sought by studying both the
denervated test muscle and the healthy control muscle of the contralateral (right)
hindlimb.

Chapter 4: Denervated muscle stimulation
S. Eickhoff - January 2021 123
4.2 N-let stimulation of denervated muscle
While we observed a complete loss of excitability with nerve stimulation three days after
the nerve crush injury, literature on denervation of the rat hindlimb suggests that
functional and morphological changes are most severe 1 to 2 weeks after the nerve injury
(Varejao et al., 2004). Therefore, the following study that seeks to investigate optimal
stimulation strategies for fully denervated muscle was carried out in three rats ten days
after a nerve crush injury to the left CPN. The aim of the experiments described below
was to identify if ideally spaced doublets, 3-lets, and 4-lets can be used to optimize
stimulation patterns to activate denervated muscles most efficiently. The following tests
were conducted on both the ten day denervated test muscle (left EDL) and the
contralateral, healthy control muscle (right EDL).
First, a strength duration curve was probed for the first visible twitch force response with
biphasic rectangular pulses. This allowed to measure the rheobase amplitude and thus to
determine the chronaxie. A typical chronaxie value for the denervated test muscle was
2ms, significantly higher than for the healthy control muscle with chronaxie values of 100
to 200µs. This observation is in line with published literature on denervated muscle
stimulation, reporting that longer phase widths (of even up to several hundred
milliseconds in severe, long term denervation) are required to activate denervated muscle
(Hofer et al., 2002; Mayr et al., 2002). In Chapter 5 we summarize a study of the influence
of such long stimulation pulses, used to active denervated muscle tissue, on nerves.
Once the chronaxie time was determined, a recruitment curve was recorded to identify
the amplitude at which full neuromuscular activation (i.e. maximal twitch force) was
achieved. As discussed above (Figure 4.2.b), the determination of this full activation level
for muscle surface stimulation was complicated as the twitch force did not plateau but
kept increasing even at very high amplitudes. For this reason, we typically chose the
maximum deliverable amplitude (due to instrumentational limitations) of 5mA as “full
activation” amplitude when no other value could sensibly be chosen.
Pulses parameterized with these two values, phase width equal to the chronaxie time and
the amplitude set to reach full recruitment, were now used to determine the ideal
interpulse intervals (IPIs) for doublets, 3-lets, and 4-lets. First, in randomized order,
doublets with varying IPIs between 100µs and 150ms were tested and the value resulting
in the largest nFTI identified as ideal doublet. This doublet was then used as basis for the
3-let test, where a third pulse with varying IPI was added. Again, the ideal IPI was

Chapter 4: Denervated muscle stimulation
S. Eickhoff - January 2021 124
determined and used as basis for the 4-let test. On the 10 day denervated test side, ideal
IPIs were typically between 30 and 100ms but with very little increase in the achievable
nFTI. Never did the nFTI of an additional pulse add more than 1 to the nFTI of the
previous n-let, in other words, in denervated muscle no doublet effect was observed
(Figure 4.5.a). On the healthy control muscle however, ideal IPIs were shorter, typically
between 3 and 20ms, and achieved significant increases in nFTI in this “sweet spot”
(Figure 4.5.b). The ideal IPI was shorter for the first pulse pair, i.e. the initial doublet,
with values between 3 and 10ms. This observation is in line with previous reports of the
benefit of a single high frequency doublet at the beginning of a fixed frequency
stimulation burst (e.g. 50Hz = 20ms IPIs) to activate healthy muscle (Kwende, Jarvis and
Salmons, 1995).
The data presented in Figure 4.5 stresses the physiological differences between healthy
and denervated muscle and shows that there is no benefit in using a high frequency
doublet at the beginning of a stimulation burst to enhance the activation of denervated
muscle. The maximal nFTI of an ideally spaced 4-let only reaches a value of
approximately 3 in denervated muscle, whereas it exceeds 7 in the healthy control muscle.
As these values are normalized by the FTI of a single twitch, they can also be understood
as twitch to (n-let) tetanus ratios in terms of force-time integral. Figure 4.6 shows force
frequency plots of the ten day denervated and the healthy control muscle for one
representative experiment. The 10 day denervated muscle shows many properties that are
Figure 4.5 N-let test in a) 10 day denervated EDL and b) healthy control EDL muscles. IPIs
between 0.1 and 150ms were tested in randomized order and the IPIs resulting in the largest
normalized force-time integral (nFTI) were used as basis for the next n-let. Data are mean of n=3
animals.
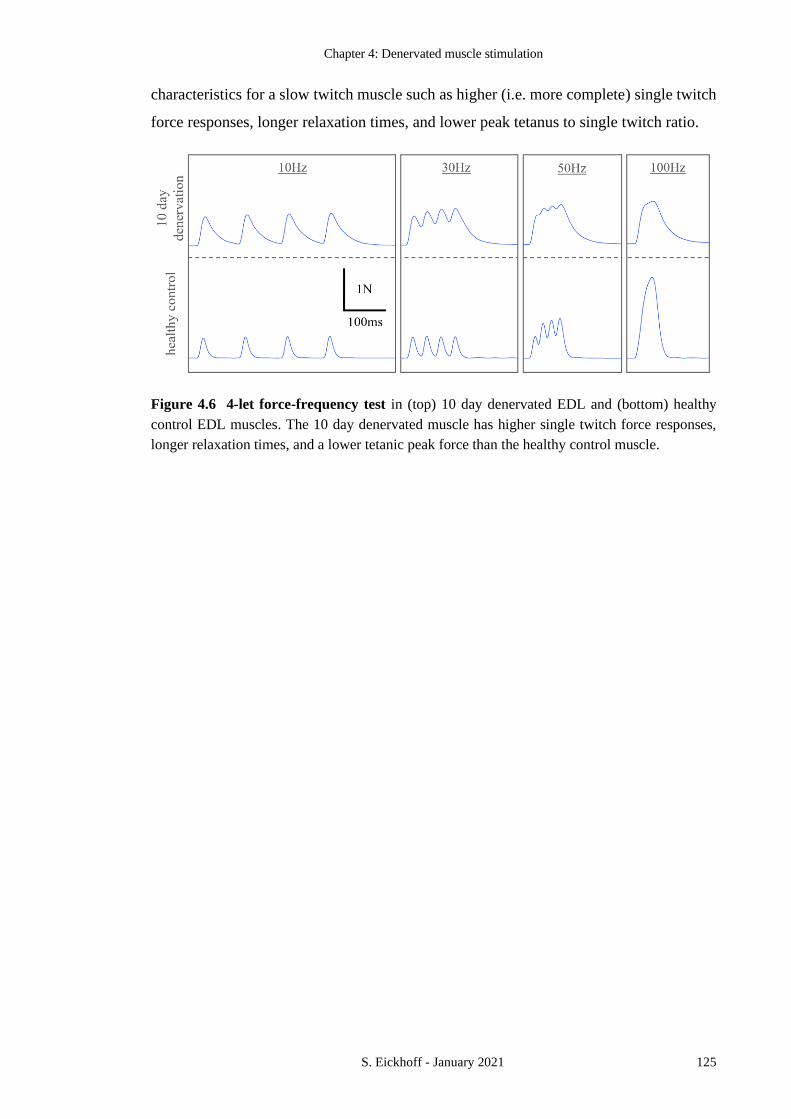
Chapter 4: Denervated muscle stimulation
S. Eickhoff - January 2021 125
characteristics for a slow twitch muscle such as higher (i.e. more complete) single twitch
force responses, longer relaxation times, and lower peak tetanus to single twitch ratio.
Figure 4.6 4-let force-frequency test in (top) 10 day denervated EDL and (bottom) healthy
control EDL muscles. The 10 day denervated muscle has higher single twitch force responses,
longer relaxation times, and a lower tetanic peak force than the healthy control muscle.
Chapter 5: The influence of long pulse duration on nerve activation
S. Eickhoff - January 2021 126
5 THE INFLUENCE OF LONG
PULSE DURATION ON NERVE
ACTIVATION
5.1 Observation of additional neuromuscular recruitment with
long duration pulses
(I. Introduction)
Electrical stimulation (ES) is a collective term for the application of electrical charge to
modify the activity of a target excitable tissue. This target tissue can either be a central or
peripheral nervous structure or a muscle. The modulatory effect is achieved by the
interaction of the electric field, induced by the (extracellular) charge injection, with
voltage gated ion channels in membranes within the excitable target. Electrical nerve
stimulation finds broad application in medical devices and therapies such as cochlea
stimulation for hearing loss, cardiac pacemaking to correct arrythmias, and therapeutic
and functional spinal cord and deep brain stimulation. Electrical stimuli are delivered via
implanted or transcutaneous electrodes and are typically biphasic to achieve zero net
charge injection, and thus to reduce detrimental electrochemical processes at the
electrode-tissue interface (Shannon, 1992), (Merrill, Bikson and Jefferys, 2005). Besides
overall charge balance, stimulation waveform, frequency and phase duration (or phase
width) are important parameters that influence the efficiency and safety of ES protocols
(Grill, 2018). Phase widths commonly used for nerve stimulation are below 1ms and
typically, to allow to use the least amount of electrical charge (which is the product of
phase duration and amplitude) to activate the nervous target, one chooses the shortest
feasible stimulation phase width. This feasibility depends on a function called
“strength/duration-curve” and is limited by the amplitude that the stimulator can safely
deliver. Usually in commercially available nerve stimulation devices the range of phase
widths between approximately 90-200µs finds application and a wider range of phase
widths is investigated in ES research.
Chapter 5: The influence of long pulse duration on nerve activation
S. Eickhoff - January 2021 127
In ES applications to activate muscle contractions, it is important to recognize the known
difference between stimulation of healthy (i.e. innervated) and denervated muscle.
Because nerve tissue has much lower thresholds for activation with ES than muscle tissue,
in the innervated case, even if the stimulation is directly applied to a muscle belly, the
electric field is considered first to activate the terminal nerve branches which then activate
the muscle fibres of their respective motor units. Since in such scenarios the electric field
does not directly activate muscle tissue but actually elicits activity in neural tissue, even
though muscle contraction is desired, such applications are to be categorized as nerve
stimulation. Direct activation of muscle tissue with ES is relevant in absence of neural
innervation, i.e. in the case of denervated muscle. Direct stimulation of denervated muscle
requires significantly higher stimulation amplitudes (Ashley et al., 2005; Cheetham et al.,
2015) and longer stimulation durations of, in cases of severe denervation, up to several
hundred milliseconds (Hofer et al., 2002; Mayr et al., 2002). This latter parameter
represents a major challenge when the aim is to elicit tetanic contractions, e.g. for muscle
training to prevent or reverse atrophy, as these long stimulation durations limit the
maximal possible pulse frequency (Salmons et al., 2005). Our laboratory investigated the
influence of rectangular and non-rectangular waveform variations, such as subthreshold
pre-pulses (Eickhoff and Jarvis, 2020b), interphase gaps and Gaussian shaped pulses
(Eickhoff and Jarvis, 2019), on neural stimulation efficiency (Chapter 3). For these
investigations we used a rodent in vivo nerve muscle preparation, stimulating the nerve
and measuring the muscle force or in some cases the distal ENG signal to measure neural
activation, and studied a range of stimulation phase widths from 20 to 1000µs. While for
most of this range the neuromuscular recruitment behaviour followed the characteristic
sigmoidal dose-response relationship, at the upper end of the investigated range of phase
widths we consistently observed unexpected additional recruitment, above the level of
full motor unit activation. We conducted a series of experiments to try to explain this
observation and here we report 5 experiments that represent milestones on our
investigative journey. We discuss potential implications of these findings for stimulation
of denervated and partially denervated muscle, where long duration electrical pulses are
used. Further, these observations represent a challenge to state-of-the-art biophysical
computational models of extracellular nerve stimulation.
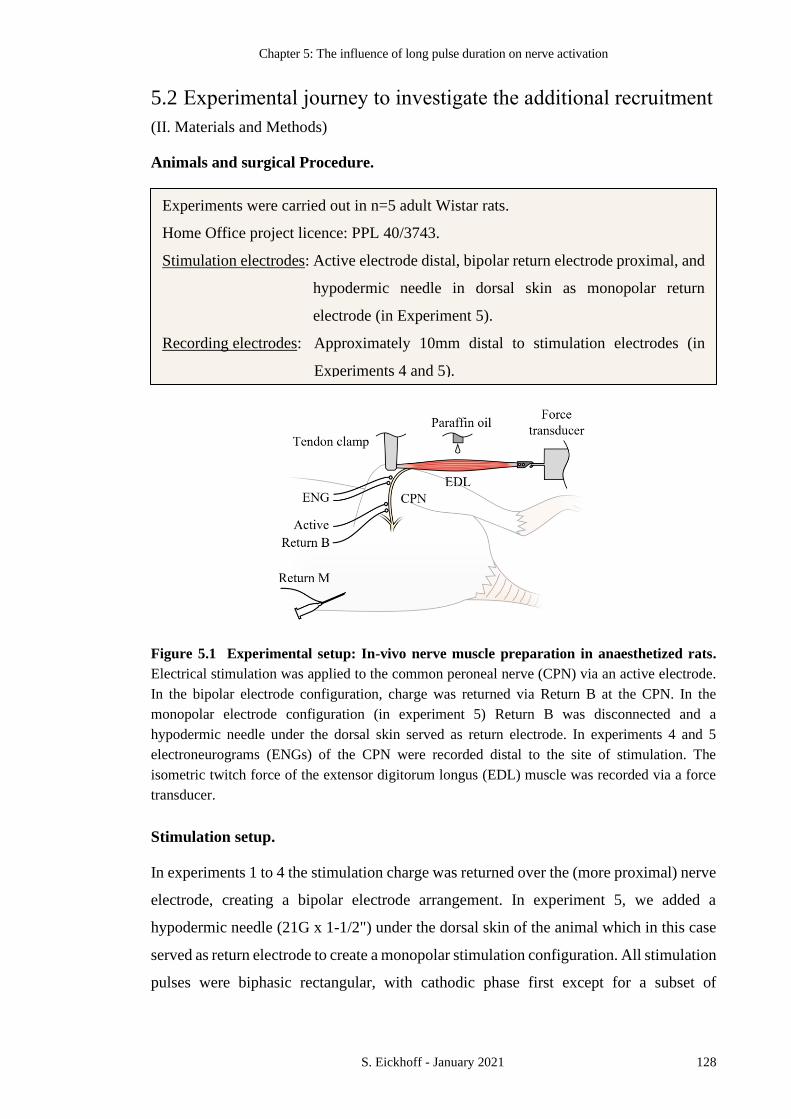
Chapter 5: The influence of long pulse duration on nerve activation
S. Eickhoff - January 2021 128
5.2 Experimental journey to investigate the additional recruitment
(II. Materials and Methods)
Animals and surgical Procedure.
Stimulation setup.
In experiments 1 to 4 the stimulation charge was returned over the (more proximal) nerve
electrode, creating a bipolar electrode arrangement. In experiment 5, we added a
hypodermic needle (21G x 1-1/2") under the dorsal skin of the animal which in this case
served as return electrode to create a monopolar stimulation configuration. All stimulation
pulses were biphasic rectangular, with cathodic phase first except for a subset of
Experiments were carried out in n=5 adult Wistar rats.
Home Office project licence: PPL 40/3743.
Stimulation electrodes: Active electrode distal, bipolar return electrode proximal, and
hypodermic needle in dorsal skin as monopolar return
electrode (in Experiment 5).
Recording electrodes: Approximately 10mm distal to stimulation electrodes (in
Experiments 4 and 5).
Figure 5.1 Experimental setup: In-vivo nerve muscle preparation in anaesthetized rats.
Electrical stimulation was applied to the common peroneal nerve (CPN) via an active electrode.
In the bipolar electrode configuration, charge was returned via Return B at the CPN. In the
monopolar electrode configuration (in experiment 5) Return B was disconnected and a
hypodermic needle under the dorsal skin served as return electrode. In experiments 4 and 5
electroneurograms (ENGs) of the CPN were recorded distal to the site of stimulation. The
isometric twitch force of the extensor digitorum longus (EDL) muscle was recorded via a force
transducer.

Chapter 5: The influence of long pulse duration on nerve activation
S. Eickhoff - January 2021 129
experiment 4, where monophasic (cathodic) rectangular pulses were used. Stimulation
pulses were applied at a rate of one pulse every 3 seconds.
Recording settings.
Stimulation protocols and experiment-specific methods.
Experiment 1 represents a typical measurement conducted in our lab to examine the
efficiency of Gaussian compared to rectangular waveforms for neural activation
(Eickhoff and Jarvis, 2019). In this experiment we recorded recruitment curves for
biphasic pulses with phase widths of 20, 40, 60, 80, 100, 120, 140, 160, 180, 200, 250,
325, 425, 550, 775, and 1000µs in 100µA amplitude increments. The single pulses that
comprise these 16 recruitment curves were delivered in randomized order via a bipolar
stimulation configuration.
Experiment 2 investigated the possibility that some unexpectedly high twitch force
responses, that we observed at long stimulation phase widths in Experiment 1, might have
been additional activation as a result of spinal reflex activity. Here we dissected the CPN
proximal to the site of stimulation where it branches from the sciatic nerve to eliminate
direct afferent activation of spinal circuits. We stimulated the nerve with biphasic pulses
of 1ms phase width and amplitudes ranging from 100µA, in 100µA increments, to 5mA.
For amplitudes 100µA to 3mA we recorded 3 repetitions at each stimulation intensity, for
amplitudes above 3mA we recorded a single repetition. All pulses were applied in
randomized order and via bipolar stimulation electrodes.
Experiment 3 was conducted to attain insight into the recruitment behaviour with a wider
range of stimulation phase widths. In two separate recording sessions we recorded
recruitment curves, first for biphasic and later for monophasic (cathodic) pulses of phase
widths ranging from 200µs, in 200µs increments, to 4ms. For every phase width,
stimulation intensities from 200µA, in 200µA increments, to 5mA were used. All
combinations of phase widths and amplitudes were tested in randomized order. Following
every 20 of these test stimulations a fixed control stimulation was delivered (2mA, phase
width 200µs), set to elicit one full nerve activation. Following these two recording
sessions we conducted a doublet test to probe the time course of refractoriness of our
preparation. For this test we stimulated with pulse doublets comprised of two biphasic
Extensor digitorum longus muscle twitch force recorded at 100kS/s.
Common peroneal nerve ENG recorded at 100kS/s (in Experiments 4 and 5).

Chapter 5: The influence of long pulse duration on nerve activation
S. Eickhoff - January 2021 130
pulses (5mA, phase width 100µs) separated by inter pulse intervals (IPIs) of durations
from 10µs up to 500ms. Doublets with this range of IPI values were tested in randomized
order and control pulses were delivered at regular intervals. All pulses for this experiment
were delivered via the bipolar stimulation electrode configuration.
Experiment 4 investigated the hypothesis that a biphasic, long duration (phase width
above absolute refractory period) pulse might be substituted with a triplet, comprised of
three separate short pulses, spaced at the field transitions of the longer pulse to achieve
equivalent neuromuscular recruitment. Recruitment curves for single biphasic pulses of
phase widths 3ms and 200µs as well as for a pulse triplet comprised of three biphasic
pulses of phase width 60µs and IPI 2880µs were recorded for amplitudes from 100µA, in
100µA increments, to 5mA. All combinations of pulse-type and amplitude were tested in
randomized order and every 20 test stimulations a fixed control stimulation (2mA, phase
width 200µs) was delivered. Additionally, we conducted a doublet test to probe the time
course of escape from the refractory period. Doublets of two biphasic pulses (1.5mA,
phase widths 60µs) with IPIs of duration from 100µs to 20ms were tested in randomized
order with control pulses delivered at regular intervals. In addition to the isometric twitch
force, in this experiment we recorded the ENG from the stimulated nerve distal to the
stimulation site. All pulses were applied via bipolar electrode configuration.
Experiment 5 was conducted to probe thresholds for activation with a higher resolution
(i.e. smaller stimulation amplitude increments) and to investigate differences between
monopolar and bipolar electrode configuration. Biphasic pulses of 5ms phase width and
amplitudes from 50µA to 2mA (in 50µA increments) were tested in ascending order first
in the bipolar and afterwards in the monopolar configuration. Isometric twitch force and
the distal ENG responses were recorded.
Data analysis and normalization. The developed isometric peak twitch force was
determined by subtracting the passive muscle tension, which was typically between 0.05
and 0.1N, from the peak recorded force value. For the longer stimulation and recording
periods in experiments 3 and 4, in order to minimize any effects of variations in depths
of anaesthesia, temperature or fatigue on the recordings, force responses to test
stimulations were normalized by division by the response to the nearest control pulse.
The ENG recordings were filtered to extract the 50Hz noise and stimulation artifacts were
removed. For short stimulation pulses this artifact reduction was achieved automatically
with a custom written MATLAB code (MATLAB (R2018a), The MathWorks Inc.,

Chapter 5: The influence of long pulse duration on nerve activation
S. Eickhoff - January 2021 131
Natick, MA, USA). For stimulations with longer phase widths, where the eCAPs were
merged with the stimulation artifacts (often on the slopes of capacitive
charging/discharging during the stimulation phases), manual input was necessary to fit a
spline as baseline on which the eCAP laid and which was then used to remove the artifact.
The ENG plots were smoothed with a 10-sample moving average MA-filter. All ENG
processing and plotting was done in MATLAB (MATLAB (R2018a), The MathWorks
Inc., Natick, MA, USA).
5.3 Transitions within biphasic long duration pulses can elicit up
to 3 separate APs
(III. Results)
Experiment 1: The recruitment curves for biphasic pulses with phase widths from 20µs
to 1ms are of the typical sigmoidal shape, which is characteristic for stimulation of
healthy, homogeneous nerves (Figure 5.2.a). All recruitment curves plateau at an
isometric peak twitch force level between 0.4 to 0.5N, typical values for this nerve-muscle
preparation (Eickhoff and Jarvis, 2019). Stimulation with pulses of the three longest
tested phase widths (550, 775, and 1000µs) elicited additional twitch force, exceeding
this plateau, at high amplitudes.
Experiment 2: The recruitment curve for biphasic 1ms phase width pulses, applied distal
to a complete dissection of the CPN, shows three distinct plateaus between zero and 5mA
(Figure 5.2.b). Pulses with amplitudes between 400µA and 1.3mA elicited twitch forces
of approximately 0.4N, typical values for full activation of all motor units in this
preparation. The second plateau of approximately 0.75N was evoked by stimuli with
amplitudes between 1.8 and 2.7mA. The last plateau is comprised of force responses to
stimuli with amplitudes above 3.3mA which elicited approximately 0.87N peak twitch
force.
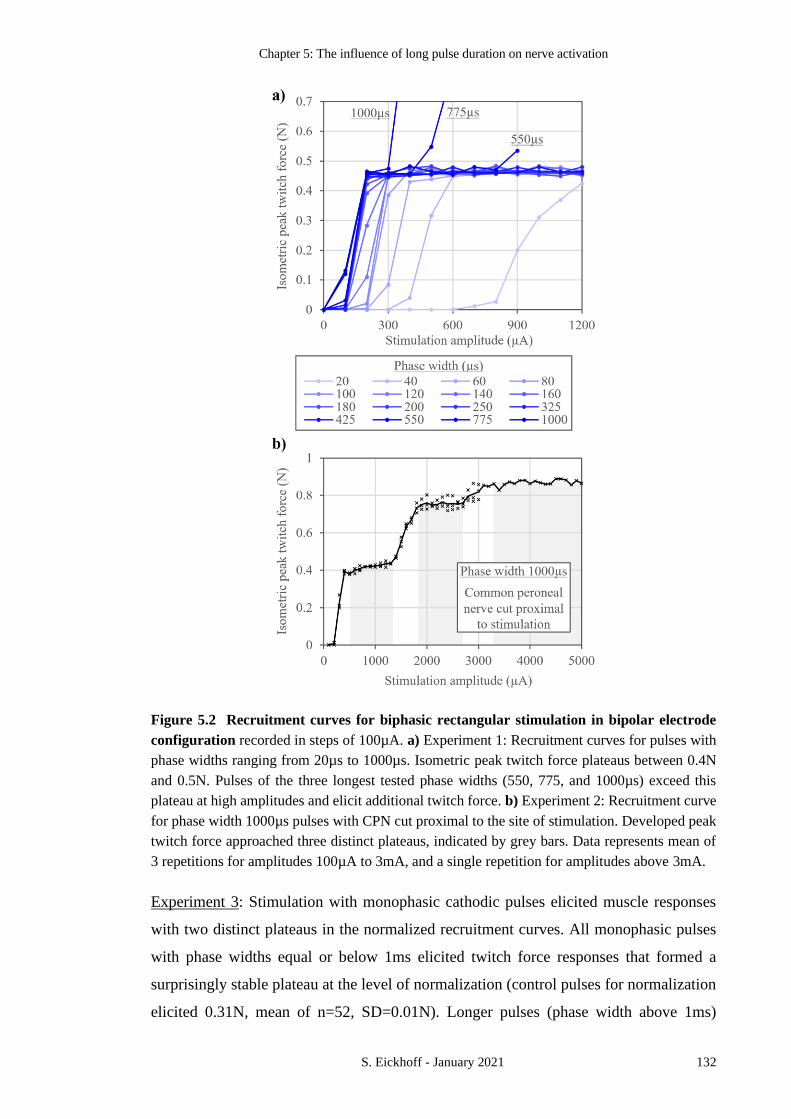
Chapter 5: The influence of long pulse duration on nerve activation
S. Eickhoff - January 2021 132
Experiment 3: Stimulation with monophasic cathodic pulses elicited muscle responses
with two distinct plateaus in the normalized recruitment curves. All monophasic pulses
with phase widths equal or below 1ms elicited twitch force responses that formed a
surprisingly stable plateau at the level of normalization (control pulses for normalization
elicited 0.31N, mean of n=52, SD=0.01N). Longer pulses (phase width above 1ms)
Figure 5.2 Recruitment curves for biphasic rectangular stimulation in bipolar electrode
configuration recorded in steps of 100µA. a) Experiment 1: Recruitment curves for pulses with
phase widths ranging from 20µs to 1000µs. Isometric peak twitch force plateaus between 0.4N
and 0.5N. Pulses of the three longest tested phase widths (550, 775, and 1000µs) exceed this
plateau at high amplitudes and elicit additional twitch force. b) Experiment 2: Recruitment curve
for phase width 1000µs pulses with CPN cut proximal to the site of stimulation. Developed peak
twitch force approached three distinct plateaus, indicated by grey bars. Data represents mean of
3 repetitions for amplitudes 100µA to 3mA, and a single repetition for amplitudes above 3mA.

Chapter 5: The influence of long pulse duration on nerve activation
S. Eickhoff - January 2021 133
elicited additional normalized force responses and stimulation with phase widths above
2ms formed the second plateau at approximately 2.9 (Figure 5.3.a-b). Biphasic pulses
lead to normalized twitch force responses in three distinct steps. The shortest pulses of
phase widths 200, 400 and 600µs formed a plateau at the normalization level 1 (control
pulses for normalization elicited 0.44N, mean of n=51, SD=0.05N). With increasing
amplitude, biphasic pulses above approximately 2ms phase width lead to two additional
steps in normalized force responses. The second step was at 2.8 and the third plateau
formed at approximately 3.5 times normalization (Figure 5.3.c-d). Doublets with IPIs
below 1ms did not elicit additional peak twitch force above the level of normalization
(control pulses for normalization elicited 0.32N, mean of n=6, SD=0.01N), signifying
that the nerve-muscle preparation is still in absolute refractory period (ARP). Doublets
with longer IPIs gradually resulted in additional twitch force up to approximately 2.7 to
2.9 with IPIs between 2 and 10ms, indicating that two ideally spaced single activations
(of all motor units) elicit an isometric twitch force almost 3 times higher than with a single
activation (Figure 5.3.e).

Chapter 5: The influence of long pulse duration on nerve activation
S. Eickhoff - January 2021 134
Experiment 4: Stimulation with biphasic pulses with phase width 200µs evoked stable
twitch force responses at the level of normalization (Figure 5.4.a). The recruitment curve
for biphasic 3ms pulses, shows 2 steps above this level of normalization, the first at
approximately 2.1 and the second at 2.5. Recruitment with triplets of biphasic 60µs
Figure 5.3 Results Experiment 3: Normalized recruitment curves for phase widths from 200µs
to 4ms and amplitudes from 200µA to 5mA in 200µA increments. Stimulation presented in the
bipolar electrode configuration. Recruitment curves for monophasic stimulation represented in
the classical two-dimensional plot (a) and as surface plot (b). Normalized peak force approached
two distinct plateaus: The first plateau is formed by all monophasic pulses of phase width equal
or below 1ms, the second plateau is formed by pulses of approximately 2ms phase widths and
above at sufficiently high amplitudes. Panels (c) and (d) show recruitment data for biphasic
stimulation represented as a two-dimensional plot (c) and as a surface plot (d). Normalized peak
force approached three distinct plateaus: The first plateau is formed by the responses to all
biphasic pulses of phase width equal to or below 600µs, the second and third plateaus are formed
by pulses of approximately 2.4ms phase width and above at sufficiently high amplitudes. (e)
Doublet test with two biphasic 100µs pulses of high amplitude (5mA) and varying inter pulse
interval (IPI) presented in the bipolar electrode configuration. The second pulse of doublets with
less than 1ms IPI does not elicit any additional twitch force, indicating that this value is near the
absolute refractory period for the preparation. Doublets with IPIs between 2ms and 10ms elicit
maximal normalized peak force of approximately 2.7 to 2.9.

Chapter 5: The influence of long pulse duration on nerve activation
S. Eickhoff - January 2021 135
pulses, modelled to match the transitions within a biphasic 3ms pulse, lead to similar
twitch forces at a level of 2.5 times normalization (control pulses for normalization
elicited 0.52N, mean of n=12, SD=0.02N). Force responses to doublets with IPIs below
1ms did not exceed the normalization level (control pulses for normalization elicited
0.6N, mean of n=8, SD=0.07N). Doublets with 3ms IPI elicited normalized force
responses of 2.1 (Figure 5.4.b). Distal ENG recordings during stimulation with biphasic
3ms pulses show up to 3 evoked compound action potentials (eCAPs) elicited with a
single pulse. The earliest (that is lowest threshold) eCAP is elicited as a response to the
middle transition of the biphasic pulse at an amplitude of 400µA. At 500µA, an additional
eCAP is elicited at the first transition and a third eCAP gradually develops at amplitudes
above 1.3mA after the third transition of the biphasic pulse (Figure 5.4.c). ENG
recordings during stimulation with the triplet of short pulses start to show three
submaximal eCAPs at an amplitude of 600µA, which reach maximal peak-to-peak
amplitude at 700µA stimulation intensity (Figure 5.4.d). ENGs recorded during
stimulation with single biphasic pulses of 200µs phase width exhibit maximal eCAPs at
amplitudes of 500µA and above (Figure 5.4.e). Latencies of the eCAP onset (i.e. delay of
the start of the first eCAP deflection to the respective triggering field transition) were
constant for all maximal eCAPs and across all pulses at approximately 600 to 700µs.

Chapter 5: The influence of long pulse duration on nerve activation
S. Eickhoff - January 2021 136
Experiment 5: Recruitment curves for biphasic stimulation with 5ms phase width lead to
force responses in three steps (Figure 5.5.a). Stimulation via bipolar electrodes gradually
reached a first level of just below 0.5N at amplitudes of 550 to 650µA, a second step of
approximately 1.3N with amplitudes ranging from 850 to 1150µA, and a third force level
of approximately 1.8N at amplitudes above 1.5mA. Stimulation delivered via a
Figure 5.4 Results Experiment 4: a) Normalized recruitment data for single 3ms biphasic
stimuli (green), triplet consisting of three biphasic 60µs pulses every 3ms (blue), and single 200µs
biphasic stimuli (black) presented in the bipolar electrode configuration. b) Doublet test with two
biphasic 60µs pulses of maximal amplitude and varying inter pulse interval (IPI). The second
pulse of doublets with IPI less than 1ms does not elicit any additional twitch force, indicating that
this value is near the absolute refractory period for the preparation. Doublets with 3ms IPI elicit
normalized peak force of 2.1. ENG recordings of the CPN during stimulation with amplitudes
from 100µA to 2mA with c) single 3ms biphasic stimuli, d) triplet consisting of three biphasic
60µs pulses every 3ms, and e) single 200µs biphasic stimuli. ENG recordings for 2mA amplitude
stimulation are raw recordings (filtered) consisting of stimulation artifact and evoked compound
action potentials (eCAPs). Stimulation artifacts have been removed from ENGs for amplitudes
below 2mA and dashed lines indicate position of artifact onset or transitions within the artifact in
case of c). Curves a) and b) have been fitted using a 3-sample moving average filter.

Chapter 5: The influence of long pulse duration on nerve activation
S. Eickhoff - January 2021 137
monopolar electrode arrangement reached a first stable force plateau of just above 0.5N
with amplitudes between 450 and 950µA. The second short plateau in the elicited force
response was at 1.25N with stimulation amplitudes of 1200 to 1250µA before the twitch
force reached the third plateau of 1.8N with amplitude above approximately 1.5mA. ENG
recordings during stimulation via bipolar and monopolar electrode configurations
exhibited up to three separate eCAPs for a single stimulation. The first eCAPs were
elicited at the second field transition within the biphasic pulse at an amplitude 450µA, the
second eCAPs started to develop with amplitudes above 650µA as a response to the first
pulse transition, and the third eCAPs start to develop with amplitudes above 1150µA after
the third pulse transition (Figure 5.5.b). Applying stimulation via a monopolar electrode
configuration, eCAPs were first elicited at the first pulse transition with amplitudes of
350µA. Stimulation with amplitudes of 950µA and above started to elicit a second eCAP
after the middle field transition of the biphasic pulse. The third eCAPs gradually develop
as a response to the third pulse transition at amplitudes above 1.3mA (Figure 5.5.c).
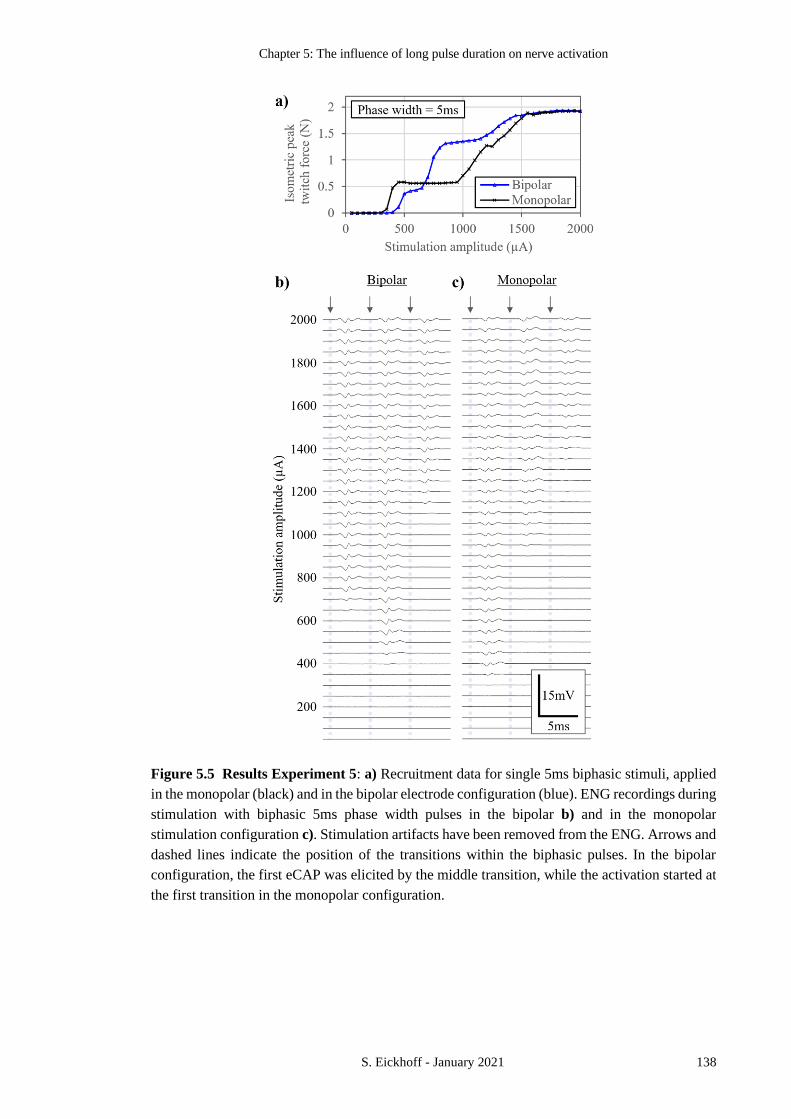
Chapter 5: The influence of long pulse duration on nerve activation
S. Eickhoff - January 2021 138
Figure 5.5 Results Experiment 5: a) Recruitment data for single 5ms biphasic stimuli, applied
in the monopolar (black) and in the bipolar electrode configuration (blue). ENG recordings during
stimulation with biphasic 5ms phase width pulses in the bipolar b) and in the monopolar
stimulation configuration c). Stimulation artifacts have been removed from the ENG. Arrows and
dashed lines indicate the position of the transitions within the biphasic pulses. In the bipolar
configuration, the first eCAP was elicited by the middle transition, while the activation started at
the first transition in the monopolar configuration.

Chapter 5: The influence of long pulse duration on nerve activation
S. Eickhoff - January 2021 139
5.4 Discussion and implication for stimulation of (partially)
denervated muscle
(IV. Discussion)
Experiments 1 clearly illustrates an unexpected yet consistent observation of our
electrical stimulation experiments using an in vivo nerve-muscle preparation (Eickhoff
and Jarvis, 2019, 2020b): biphasic stimulation with phase widths below approximately
550µs showed a characteristic sigmoidal recruitment behaviour, followed by a stable full
recruitment level, whereas longer pulses elicited additional muscle twitch force at high
amplitudes (Figure 5.2.a). In order to understand this consistent observation, we
conducted a series of experiments.
First the hypothesis was tested that long phase width pulses might elicit a spinal reflex
(H-reflex) at high amplitudes (Gozariu et al., 1998). In order to test this hypothesis, in
Experiment 2 the CPN was dissected proximal to the site of stimulation, just distal to
where it branches from the sciatic nerve. As stimulation with biphasic pulses of 1ms phase
width still showed additional twitch force above the first plateau (at a typical twitch force
value for full recruitment of approx. 0.4N), we could reject the hypothesis that this
observation might derive from central reflex activity (Figure 5.2.b). Further, we extended
the amplitude range and observed that the elicited twitch force response not only exceeded
the first plateau, which represents full activation for all phase widths below 550µs, but
instead approached three distinct plateaus.
This surprising observation led us to form the hypothesis that the three field transitions
within a single biphasic stimulation pulse can elicit three separate nerve activations, if
separated enough not to fall within the preparation’s refractory period and given sufficient
amplitude. This would provide an explanation for the observations so far: with a typically
anticipated ARP for fast twitch motor units of approximately 1ms, biphasic pulses of
550µs phase widths would be among the shortest pulses to elicit more than a single nerve
activation (compare Figure 5.2.a), as the first and the last field transition are separated by
more than 1ms. Longer biphasic pulses with phase widths above the ARP could elicit up
three activations as the separation of each field transition to the next one allows for
(partial) recovery from refractoriness (compare Figure 5.2.b).
The findings of Experiment 3 strongly support this hypothesis. Monophasic pulses of
phase widths of 1ms and below did not exceed the level of normalization (i.e. the force
response representing one full neuromuscular recruitment), whereas an additional

Chapter 5: The influence of long pulse duration on nerve activation
S. Eickhoff - January 2021 140
recruitment was evidenced with monophasic pulses of longer phase durations (Figure
5.3.a-b). This additional recruitment formed a remarkably stable second plateau in the
normalized force response at approximately 2.9. The rationale for both, the minimum
phase width at which additional recruitment can take place as well as the amount of
normalized twitch force at which the second plateau forms, can be attained from the
doublet test (Figure 5.3.e). First, it is shown that the minimum phase width at which
additional recruitment can take place with monophasic stimuli correlates with the ARP
of our preparation of approximately 1ms. Secondly, the doublet test shows that two
ideally spaced motor nerve activations, in this case with an IPI of 2 to 10ms, elicit twitch
force responses of approximately 2.7 to 2.9 times normalization level, correlating with
the “height” of the second force plateau (compare Figure 5.3.b). These are typical values
for fast twitch motor units (Burke, 1967), of which the EDL is predominantly comprised
(Green et al., 1984; Larsson and Yu, 1997), and the rationale for the high relative peak
twitch force of an ideally spaced doublet is rooted in calcium release mechanics of fast
twitch muscle fibres (Kwende, Jarvis and Salmons, 1995). Using biphasic stimulation, a
maximum now of three distinct activation levels could be observed, correlating with the
three field transitions within a biphasic pulse (Figure 5.3.c-d). Again, the phase widths at
which no additional activation (above normalization level) occurred, correlated with
approximately half of the ARP. Once the phase widths of biphasic pulses exceeded 600µs,
meaning that the first pulse transition was separated by more than 1.2ms from the third
transition which thus did not fall within the ARP anymore, additional recruitment above
the level of normalization was observed.
The addition of ENG recordings distal to the site of stimulation in Experiments 4 and 5
shed further light on our observations. In Experiment 4 we proved that the threefold
neuromuscular activation elicited by biphasic pulses of 3ms phase width can reliably be
replicated using triplets consisting of three short pulses located at the field transitions of
the 3ms biphasic pulse (Figure 5.4.a). Again, the doublet test illustrates how a doublet of
3ms IPI elicits force responses correlating to those elicited at intermediary amplitude
(600-1500µA) with biphasic 3ms pulses that evoke two of the possible three activations
(compare Figure 5.4.b and .c). While triplets elicit eCAPs at all three pulses at the same
amplitude (Figure 5.4.d), the thresholds for activation at the three transitions of the
biphasic 3ms are not equal (Figure 5.4.c). Interestingly, the lowest threshold, i.e. the
“part” of the biphasic pulse at which the first eCAP is evoked, is the middle field
transition, followed first by the first transition and later by the third transition. This is in

Chapter 5: The influence of long pulse duration on nerve activation
S. Eickhoff - January 2021 141
line with earlier findings from our laboratory, that the middle field transition of biphasic
pulses can be the effective transition in the bipolar electrode configuration (Eickhoff and
Jarvis, 2020b). In this configuration, the cathodic (first) phase of the biphasic pulse acts
as hyperpolarizing pre-pulse at the return electrode, rendering the nerve membrane more
excitable in this location (Grill and Mortimer, 1995), and the middle field transition
depolarizes the nerve at the bipolar return electrode where the current profile is inverted
(Eickhoff and Jarvis, 2020b).
Experiment 5 provides further insight into the different thresholds for activation at the
three field transitions within biphasic stimuli in the monopolar and bipolar electrode
configuration. In contrast to the order of thresholds in the bipolar configuration described
above, with a monopolar electrode arrangement excitation first occurred at the first field
transition followed by the middle and later by the third field transition (Figure 5.5.c).
Further, the finer amplitude increments of 50µA used in Experiment 5 allow for an
exploration of the different mechanisms leading to excitation at the different field
transitions and in different electrode configurations. For this exploration we will compare
the dynamic ranges, i.e. the range of amplitudes from the elicitation of the first APs to a
complete activation of all motor units, at different transitions within the biphasic pulse in
both electrode configurations (Figure 5.5.b-c). This dynamic range, which can also be
assessed by examining the slope of the steps in the recruitment curves (Figure 5.5.a), is
greater for the second and third activation in the monopolar configuration and the third
activation in the bipolar configuration than it is for the first activation in the monopolar
and the first and second activations in the bipolar configuration. The rationale for this
could be that the activations exhibiting a greater dynamic range represent activation by
anodic excitation, where APs are not elicited at the central (i.e. closest to the respective
electrode) nodes of Ranvier but rather at adjacent nodes. At these adjacent nodes, the
extracellular field density is reduced (Rattay, 1986) so that the here effectively smaller
stimulation increments could be the origin of the greater dynamic range. In-depth
investigation of the mechanisms leading to excitation at the different field transitions
warrants further experimental and computational research.
These observations of multiple activations with single, long duration electrical
stimulations have implications for medical devices and therapies that seek to activate
partially or complete denervated muscle. Especially in scenarios where innervated
structures are nearby the denervated stimulation target, a single twitch activation of the
denervated muscle might be accompanied by an undesired strong (effectively up to
Chapter 5: The influence of long pulse duration on nerve activation
S. Eickhoff - January 2021 142
threefold) coactivation of the innervated structures. Further research could investigate the
effect of different “slopes” of the field transitions within biphasic stimuli or altogether
different waveforms, such as variations of the sawtooth shape, on those multiple
activations.
Further, an ongoing collaboration with the Scientific Computing research group around
Prof. Frank Ratty (Vienna University of Technology) investigates parameters of state-of-
the-art biophysical stimulation models that might enable those models to predict the
threefold activations we observed. With none of the well-studied and described
computational models, a practical straight forward prediction of three separate activations
as response to the three field transitions within a biphasic ES pulse seems to be possible.
However, preliminary results of this ongoing research collaboration suggest that
implementation of the stimulator output stage circuitry, along with the capacitive
properties of the tissue-electrode interface may be of central importance to model such
triple activations.
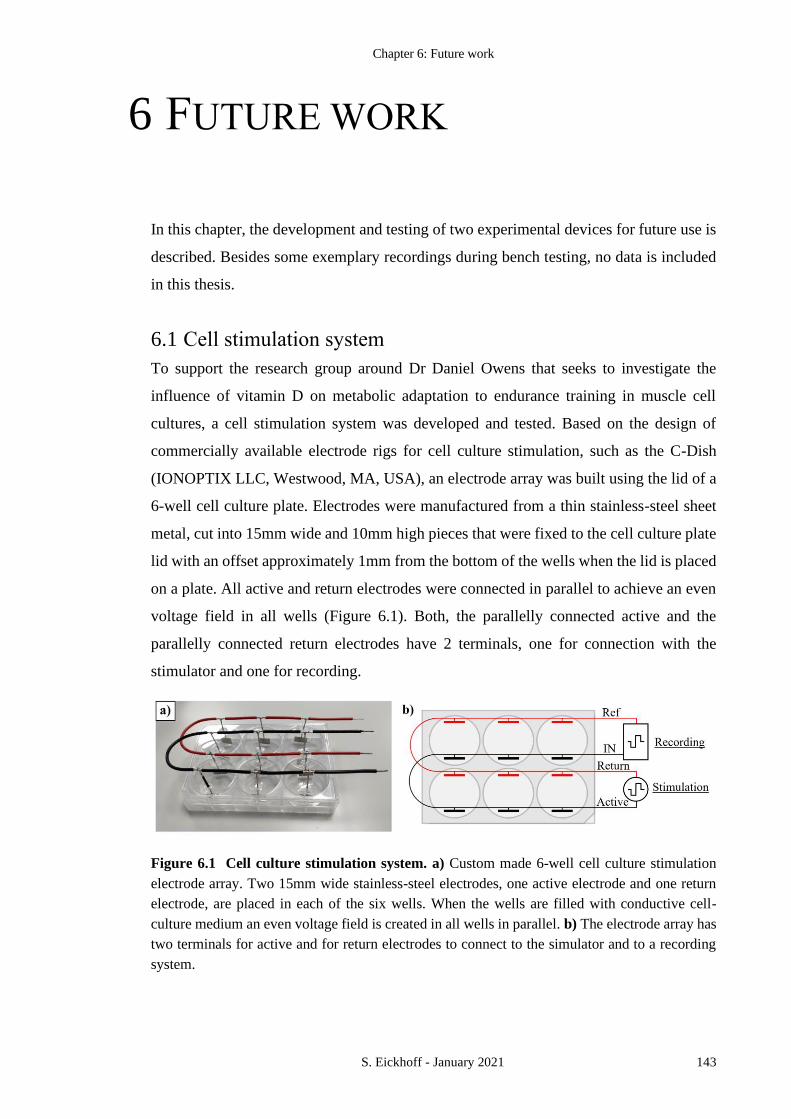
Chapter 6: Future work
S. Eickhoff - January 2021 143
6 FUTURE WORK
In this chapter, the development and testing of two experimental devices for future use is
described. Besides some exemplary recordings during bench testing, no data is included
in this thesis.
6.1 Cell stimulation system
To support the research group around Dr Daniel Owens that seeks to investigate the
influence of vitamin D on metabolic adaptation to endurance training in muscle cell
cultures, a cell stimulation system was developed and tested. Based on the design of
commercially available electrode rigs for cell culture stimulation, such as the C-Dish
(IONOPTIX LLC, Westwood, MA, USA), an electrode array was built using the lid of a
6-well cell culture plate. Electrodes were manufactured from a thin stainless-steel sheet
metal, cut into 15mm wide and 10mm high pieces that were fixed to the cell culture plate
lid with an offset approximately 1mm from the bottom of the wells when the lid is placed
on a plate. All active and return electrodes were connected in parallel to achieve an even
voltage field in all wells (Figure 6.1). Both, the parallelly connected active and the
parallelly connected return electrodes have 2 terminals, one for connection with the
stimulator and one for recording.
Figure 6.1 Cell culture stimulation system. a) Custom made 6-well cell culture stimulation
electrode array. Two 15mm wide stainless-steel electrodes, one active electrode and one return
electrode, are placed in each of the six wells. When the wells are filled with conductive cell-
culture medium an even voltage field is created in all wells in parallel. b) The electrode array has
two terminals for active and for return electrodes to connect to the simulator and to a recording
system.

Chapter 6: Future work
S. Eickhoff - January 2021 144
For stimulation and recording of the stimulation artifact, a PowerLab 16/35
(ADInstruments Pty Ltd, Bella Vista, New South Wales, Australia) was used. For the first
tests, following stimulation protocols suggested in literature (Son et al., 2019),
rectangular voltage pulses of ±10V amplitude and 1ms phase width were delivered over
one of the PowerLab analog outputs at a rate of 10Hz. The PowerLab 16/35 analog output
can drive a maximum output current of ±50mA so that 10V stimulation amplitude can be
delivered to any load of 200W or greater. To verify that the stimulation pulses were indeed
delivered at full amplitude, a scheduler was set up to record a 10-second block of
stimulation artifacts every 10 minutes during the whole duration of the 3 or 24-hour
experiments (Figure 6.2). Recordings were made at a sample rate of 100kS/s. Pulse
generation as well as artifact recordings were done using macros (Appendix 4) in
LabChart 7 Pro (ADInstruments Pty Ltd, Bella Vista, New South Wales, Australia).
Figure 6.2 Cell culture stimulation artifact recording. a) One representative 10-seconds
recording block. b) Single stimulation artifacts during 10Hz stimulation with biphasic rectangular
pulses of 1ms phase widths and 10V amplitude.
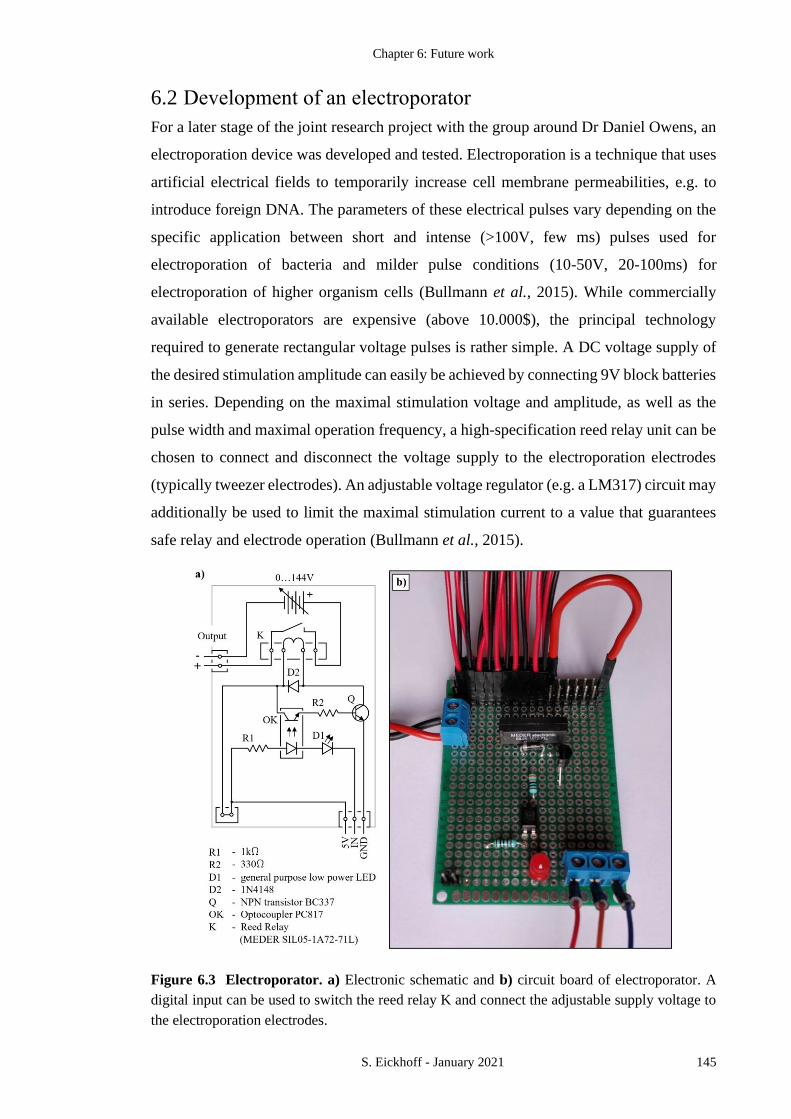
Chapter 6: Future work
S. Eickhoff - January 2021 145
6.2 Development of an electroporator
For a later stage of the joint research project with the group around Dr Daniel Owens, an
electroporation device was developed and tested. Electroporation is a technique that uses
artificial electrical fields to temporarily increase cell membrane permeabilities, e.g. to
introduce foreign DNA. The parameters of these electrical pulses vary depending on the
specific application between short and intense (>100V, few ms) pulses used for
electroporation of bacteria and milder pulse conditions (10-50V, 20-100ms) for
electroporation of higher organism cells (Bullmann et al., 2015). While commercially
available electroporators are expensive (above 10.000$), the principal technology
required to generate rectangular voltage pulses is rather simple. A DC voltage supply of
the desired stimulation amplitude can easily be achieved by connecting 9V block batteries
in series. Depending on the maximal stimulation voltage and amplitude, as well as the
pulse width and maximal operation frequency, a high-specification reed relay unit can be
chosen to connect and disconnect the voltage supply to the electroporation electrodes
(typically tweezer electrodes). An adjustable voltage regulator (e.g. a LM317) circuit may
additionally be used to limit the maximal stimulation current to a value that guarantees
safe relay and electrode operation (Bullmann et al., 2015).
Figure 6.3 Electroporator. a) Electronic schematic and b) circuit board of electroporator. A
digital input can be used to switch the reed relay K and connect the adjustable supply voltage to
the electroporation electrodes.

Chapter 6: Future work
S. Eickhoff - January 2021 146
To cover a wide range of possible stimulation parameters, we designed a simple circuit
with a high-quality reed relay, capable of switching up to 200VDC or 500mA (maximum
of 10W) with a operation time of 0.7ms and a release time of 0.05ms. While connections
have been prepared to attach up to 16 9V block batteries in series (maximum supply
voltage of 144V), with the upper limit of typical operation range of 50V (Bullmann et al.,
2015) a maximum current of 200mA can be switched. The relay is controlled by the
digital output of a NI PCIe 6351 Data Acquisition Card (National Instruments
Corporation, Austin, Texas, U.S.A.) Figure 6.4 shows a basic LabVIEW™ 2016
(National Instruments Corporation, Austin, Texas, U.S.A.) program as well as a bench
top setup to test the electroporation device with five 9V block batteries connected. The
relay unit is switched and thus connects the supply voltage with the electrodes and outputs
a monophasic 48V stimulation11 with pulse width of 50ms.
11 The 9V block batteries used for this test were new and had voltages of approximately 9.6V each. The
stimulation amplitude with five such batteries in series was therefore approximately 48V.
Figure 6.4 Bench testing of the electroporator. a), b) A basic LabVIEW program provides a
digital input signal to control the reed relay and thus c) connected the supply voltage of 48VDC
for the controlled pulse width of 50ms with the electroporation output. Oscilloscope divisions are
10V (vertical) and 10ms (horizontal).

Chapter 7: Conclusion and outlook
S. Eickhoff - January 2021 147
7 CONCLUSION AND OUTLOOK
The research summarized in this thesis sheds important new light on the effect of many
pulse shape parameters and variations, commonly suggested to enhance the efficiency of
ES. We identified that most original research and published, authoritative literature on
the effect of these pulse shape variations was modelled and conducted only for the
monopolar electrode configuration that is different from the bipolar stimulation mode in
which many contemporary ES devices operate. Therefore, in the design of our
experimental in-vivo model (Chapter 2) to re-examine the effect of these ES waveforms,
a special focus was laid on methods to compare the monopolar and the bipolar electrode
configuration.
A comprehensive comparison of the effect of subthreshold pre-pulses in both principal
configurations revealed opposite effects of those pre-pulses with monopolar compared to
bipolar stimulation (Chapter 3.1). The rationale for this surprisingly strong influence of
the return electrode position (and thereby of the stimulation configuration) was identified
by analysis of the distal ENG of the stimulated nerve. As it is commonly anticipated, in
the monopolar configuration, we observed AP elicitation at the active electrode as a
response to the first (cathodic) field transition of biphasic pulses. Using the bipolar
configuration however, excitation first occurred at the return electrode in response to the
middle field transition of biphasic pulses. This study helps to explain the apparent
contradictions of over two decades of published literature on the effect of subthreshold
pre-pulses. We extended our investigation and reported that by the same mechanisms of
excitation, the effect of interphase gaps (IPGs) and asymmetric biphasic pulses (with
lower anodic amplitude) is opposite in the monopolar compared to the bipolar stimulation
mode (3.2). These are two of the most commonly suggested pulse shape variations and
their use in ES devices operating in bipolar mode could significantly decrease energy
efficiency as they result in higher excitation thresholds than standard biphasic rectangular
pulses. Further research is warranted to study this effect of activation at the bipolar return
electrode, and thus reversed effects of pulse shape variations such as IPGs, asymmetric
pulse ratios, and pre-pulses, with commercially used cuff and array electrodes. In
addition, future research could investigate the influence of the bipolar inter-electrode

Chapter 7: Conclusion and outlook
S. Eickhoff - January 2021 148
separation, as well as of the electrode areas on the described effect of activation at the
bipolar return.
Among the non-rectangular ES waveforms, Gaussian-like pulses have been identified by
three independent computational studies to consume the least amount of electrical energy
and predictions of up to 60% energy saving potential with this waveform have been made.
In the study presented in Chapter 3.3, we investigated these claims in a comprehensive
series of in-vivo experiments and not only reported lower energy saving potentials of only
up to 17%, but further, for the first time, reported major disadvantages in terms of peak
power requirements with these novel stimulation waveforms. We proposed further
research to reconcile the surprising gap between predicted energy savings of up to 60%
and our moderate energy saving observations of only up to 17% in section 3.3.6.
In Chapter 4 a series of experiments is highlighted that investigated the time course of
loss of excitability with nerve stimulation following a standardized nerve crush injury.
All excitability over the injured motor nerve was lost 3 days after the nerve crush. Further,
we report how the complete denervated EDL muscle changed its physiological
characteristics towards that of a slow twitch muscle after 10 days of the nerve crush
injury. As we demonstrate on experiments investigating ideal n-let spacings, such
changes in the denervated muscle’s physiological behaviour lead to significant
differences in the optimal ES strategies to activate these muscles. While in healthy fast
twitch muscle, a high frequency doublet may be used at the beginning of a stimulation
burst to enhance the efficiency of ES to generate tetanic contractions, we show that this
so called “doublet effect” is lost in fully denervated muscle. Another difference in the
stimulation strategies to activate denervated muscle, and one that is already well known
and described in literature, is the need for longer stimulation pulse durations. However,
the effect of those long duration pulses on nerves has not been studied comprehensively.
In Chapter 5 we highlighted a series of experiments, demonstrating how biphasic pulses
with phase durations greater than the refractory period of nerves (approx. 1ms) can elicit
up to 3 separate eCAPs. These findings are of interest for ES applications and therapies
that seek to activate denervated muscles with innervated structures nearby. These
innervated structures might experience an undesired, up to threefold coactivation for a
single activation of the denervated stimulation target. Further research could extend this
investigation and test long duration pulses with different field transition slopes, e.g. a
series of slopes from rectangular to a “sawtooth” waveform, and their effect on
denervated muscle as well as on nerves.

Chapter 8: References
S. Eickhoff - January 2021 149
8 REFERENCES
Agnew, W. F. et al. (1986) ‘Histopathologic evaluation of prolonged intracortical
electrical stimulation’, Experimental Neurology. doi: 10.1016/0014-4886(86)90132-9.
Agnew, W. F. et al. (1989) ‘Histologic and physiologic evaluation of electrically
stimulated peripheral nerve: Considerations for the selection of parameters’, Annals of
Biomedical Engineering. doi: 10.1007/BF02364272.
Agnew, W. F. et al. (1990) ‘Local anaesthetic block protects against electrically-induced
damage in peripheral nerve’, Journal of Biomedical Engineering. doi: 10.1016/0141-
5425(90)90004-7.
Ashley, Z. et al. (2005) ‘Determination of the chronaxie and rheobase of denervated limb
muscles in conscious rabbits’, Artificial Organs. doi: 10.1111/j.1525-1594.2005.29037.x.
Beebe, X. and Rose, T. L. (1988) ‘Charge Injection Limits of Activated Iridium Oxide
Electrodes with 0.2 ms Pulses in Bicarbonate Bufered Saline’, IEEE Transactions on
Biomedical Engineering. doi: 10.1109/10.2122.
Bentivoglio, M. (2014) ‘Ramón y Cajal, Santiago’, in Encyclopedia of the Neurological
Sciences. 2nd edn, pp. 1061–1065.
Bernstein, J. (1868) ‘Ueber den zeitlichen Verlauf der negativen Schwankung des
Nervenstroms’, Pflüger, Archiv für die Gesammte Physiologie des Menschen und der
Thiere. doi: 10.1007/BF01640316.
Bernstein, J. (1902) ‘Untersuchungen zur Thermodynamik der bioelektrischen Ströme -
Erster Theil’, Pflüger Archiv für die Gesammte Physiologie des Menschen und der Thiere.
doi: 10.1007/BF01790181.
Bernstein, J. et al. (1977) ‘Electrical stimulation of the cortex with Ta2O5 capacitive
electrodes.’, in Hambrecht, F. and Reswick, J. (eds) Functional electrical stimulation.
New York: Marcel Dekker, pp. 465–77.
Bertorini, T. (2008) ‘Neuromuscular Anatomy and Function’, in Neuromuscular Case
Studies, pp. 1–25. doi: https://doi.org/10.1016/B978-0-7506-7332-7.50005-2.
Bhadra, N. and Kilgore, K. L. (2018) ‘Fundamentals of Kilohertz Frequency Alternating
Chapter 8: References
S. Eickhoff - January 2021 150
Current Nerve Conduction Block of the Peripheral Nervous System’, in
Neuromodulation. doi: 10.1016/b978-0-12-805353-9.00010-3.
Birmingham, K. et al. (2014) ‘Bioelectronic medicines: A research roadmap’, Nature
Reviews Drug Discovery. doi: 10.1038/nrd4351.
Blumenthal, T. D., Burnett, T. T. and Swerdlow, C. D. (2001) ‘Prepulses reduce the pain
of cutaneous electrical shocks’, Psychosomatic Medicine. doi: 10.1097/00006842-
200103000-00012.
Brummer, S. B. and Turner, M. J. (1977) ‘Electrical Stimulation with Pt Electrodes: II–
Estimation of Maximum Surface Redox (Theoretical Non-Gassing) Limits’, IEEE
Transactions on Biomedical Engineering. doi: 10.1109/TBME.1977.326179.
Bullmann, T. et al. (2015) ‘A transportable, inexpensive electroporator for in utero
electroporation’, Development Growth and Differentiation. doi: 10.1111/dgd.12216.
Burke, R. E. (1967) ‘Motor unit types of cat triceps surae muscle’, The Journal of
Physiology. doi: 10.1113/jphysiol.1967.sp008348.
Cappaert, N. L. M. et al. (2013) ‘Efficacy of a new charge-balanced biphasic electrical
stimulus in the isolated sciatic nerve and the hippocampal slice’, International Journal of
Neural Systems. doi: 10.1142/S0129065712500311.
Carlyon, R. P. et al. (2005) ‘Effect of inter-phase gap on the sensitivity of cochlear
implant users to electrical stimulation’, Hearing Research, 205(1–2), pp. 210–224. doi:
10.1016/j.heares.2005.03.021.
Carmeliet, E. (2019) ‘From Bernstein’s rheotome to Neher-Sakmann’s patch electrode.
The action potential’, Physiological Reports. doi: 10.14814/phy2.13861.
Castro, M. J. et al. (1999) ‘Influence of complete spinal cord injury on skeletal muscle
within 6 mo of injury’, Journal of Applied Physiology. doi: 10.1152/jappl.1999.86.1.350.
Charthad, J. et al. (2018) ‘A mm-Sized wireless implantable device for electrical
stimulation of peripheral nerves’, IEEE Transactions on Biomedical Circuits and
Systems. doi: 10.1109/TBCAS.2018.2799623.
Cheetham, J. et al. (2015) ‘Effects of Functional Electrical Stimulation on Denervated
Laryngeal Muscle in a Large Animal Model’, Artificial Organs. doi: 10.1111/aor.12624.
Cogan, S. F. et al. (2016) ‘Tissue damage thresholds during therapeutic electrical
stimulation’, Journal of Neural Engineering. doi: 10.1088/1741-2560/13/2/021001.
Chapter 8: References
S. Eickhoff - January 2021 151
Cogan, S. F., Hara, S. and Ludwig, K. A. (2018) ‘The Safe Delivery of Electrical Currents
and Neuromodulation’, in Neuromodulation. doi: 10.1016/b978-0-12-805353-9.00007-3.
Craggs, M. D., Donaldson, N. de N. and Donaldson, P. E. K. (1986) ‘Performance of
platinum stimulating electrodes, mapped on the limitvoltage plane - Part 1 Charge
injection in vivo’, Medical & Biological Engineering & Computing. doi:
10.1007/BF02442699.
Curtis, H. J. and Cole, K. S. (1942) ‘Membrane resting and action potentials from the
squid giant axon’, Journal of Cellular and Comparative Physiology. doi:
10.1002/jcp.1030190202.
Deurloo, K. E. I., Holsheimer, J. and Bergveld, P. (2001) ‘The effect of subthreshold
prepulses on the recruitment order in a nerve trunk analyzed in a simple and a realistic
volume conductor model’, Biological Cybernetics. doi: 10.1007/s004220100253.
Donaldson, P. (1974) ‘The stability of tantalum-pentoxide films in vivo’, Med Biol Eng,
(12), pp. 131–5.
Dwyer, T. (2018) ‘The Electrochemical Basis of Nerve Function’, in Fundamental
Neuroscience for Basic and Clinical Applications. 5th edn, pp. 34–53.
Eickhoff, S. and Jarvis, J. C. (2019) ‘An Investigation of Neural Stimulation Efficiency
with Gaussian Waveforms’, IEEE Transactions on Neural Systems and Rehabilitation
Engineering. doi: 10.1109/TNSRE.2019.2954004.
Eickhoff, S. and Jarvis, J. C. (2020a) ‘Reply to “Energy Optimal Stimulation Waveforms,
Or Not: Comments on ‘An Investigation of Neural Stimulation Efficiency With Gaussian
Waveforms’”’, IEEE Transactions on Neural Systems and Rehabilitation Engineering,
pp. 1–1. doi: 10.1109/TNSRE.2020.2984294.
Eickhoff, S. and Jarvis, J. C. (2020b) ‘The Effect of Sub-Threshold Pre-Pulses on Neural
Activation Depends on Electrode Configuration’, IEEE Transactions on Biomedical
Engineering. doi: DOI: 10.1109/TBME.2020.2964071.
Fallon, J. B. and Carter, P. M. (2016) ‘Principles of Recording from and Electrical
Stimulation of Neural Tissue’, in Shepherd, R. K. (ed.) Neurobionics: The Biomedical
Engineering of Neural Prostheses. Wiley Blackwell, pp. 89–120.
Famm, K. et al. (2013) ‘Drug discovery: A jump-start for electroceuticals’, Nature. doi:
10.1038/496159a.

Chapter 8: References
S. Eickhoff - January 2021 152
Fisher, L. E. et al. (2006) ‘Preliminary evaluation of a neural prosthesis for standing after
spinal cord injury with four contact nerve-cuff electrodes for quadriceps stimulation’, in
Annual International Conference of the IEEE Engineering in Medicine and Biology -
Proceedings. doi: 10.1109/IEMBS.2006.260833.
Fjordbakk, C. T. et al. (2019) ‘Feasibility of kilohertz frequency alternating current
neuromodulation of carotid sinus nerve activity in the pig’, Scientific Reports, 9(1). doi:
10.1038/s41598-019-53566-8.
Forger, D. B., Paydarfar, D. and Clay, J. R. (2011) ‘Optimal stimulus shapes for neuronal
excitation’, PLoS Computational Biology. doi: 10.1371/journal.pcbi.1002089.
Frankenhauser, B. (1957) ‘A method for recording resting and action potentials in the
isolated myelinated nerve fibre of the frog’, The Journal of physiology. doi:
10.1113/jphysiol.1957.sp005729.
Freeman, D. K. et al. (2017) ‘A sub-millimeter, inductively powered neural stimulator’,
Frontiers in Neuroscience. doi: 10.3389/fnins.2017.00659.
Geddes, L. A. (1999) ‘Chronaxie’, Australasian Physical and Engineering Sciences in
Medicine.
Glenn, W. W. L. and Phelps, M. L. (1985) ‘Diaphragm pacing by electrical stimulation
of the phrenic nerve’, Neurosurgery. doi: 10.1227/00006123-198512000-00021.
Goldman, D. E. (1943) ‘Potential, impedance, and rectification in membranes’, Journal
of General Physiology. doi: 10.1085/jgp.27.1.37.
Gorman, P. H. and Mortimer, J. T. (1983) ‘The Effect of Stimulus Parameters on the
Recruitment Characteristics of Direct Nerve Stimulation’, IEEE Transactions on
Biomedical Engineering. doi: 10.1109/TBME.1983.325041.
Gozariu, M. et al. (1998) ‘An electrophysiological investigation into the monosynaptic
H-reflex in the rat’, Brain Research. doi: 10.1016/S0006-8993(97)01402-9.
Green, H. J. et al. (1984) ‘Exercise-induced fibre type transitions with regard to myosin,
parvalbumin, and sarcoplasmic reticulum in muscles of the rat’, Pflügers Archiv
European Journal of Physiology. doi: 10.1007/BF00587545.
Grill, W. M. (2018) ‘Waveforms for Neural Stimulation’, in Neuromodulation (Second
Edition), pp. 95–102.
Grill, W. M. and Mortimer, J. T. (1993) ‘Selective activation of distant nerve fibers’, in
Chapter 8: References
S. Eickhoff - January 2021 153
Proc. 15th Annu. Int. Conf. IEEE Eng. Med. Biol. Soc. IEEE, pp. 1249–1250. doi:
10.1109/iembs.1993.979119.
Grill, W. M. and Mortimer, J. T. (1995) ‘Stimulus Waveforms for Selective Neural
Stimulation’, IEEE Engineering in Medicine and Biology Magazine. doi:
10.1109/51.395310.
Grill, W. M. and Mortimer, J. T. (1997) ‘Inversion of the current-distance relationship by
transient depolarization’, IEEE Transactions on Biomedical Engineering. doi:
10.1109/10.553708.
Grill, W. M. and Wongsarnpigoon, A. (2015) ‘Methods for generating waveform shapes
optimized for energy efficiency for treating neurological disorders’.
Grill, W. M. and Wongsarnpigoon, A. (2020) ‘Energy Optimal Stimulation Waveforms,
Or Not: Comments on “An Investigation of Neural Stimulation Efficiency With Gaussian
Waveforms”’, IEEE Transactions on Neural Systems and Rehabilitation Engineering, pp.
1–1. doi: 10.1109/TNSRE.2020.2984402.
Guenther, E. et al. (1999) ‘Long-term survival of retinal cell cultures on retinal implant
materials’, Vision Research. doi: 10.1016/S0042-6989(99)00128-5.
Guyton, D. L. and Hambrecht, F. T. (1973) ‘Capacitor electrode stimulates nerve or
muscle without oxidation-reduction reactions’, Science. doi:
10.1126/science.181.4094.74.
Guyton, D. L. and Hambrecht, F. T. (1974) ‘Theory and design of capacitor electrodes
for chronic stimulation’, Medical & Biological Engineering. doi: 10.1007/BF02477223.
Hennings, K., Arendt-Nielsen, L. and Andersen, O. K. (2005) ‘Orderly activation of
human motor neurons using electrical ramp prepulses’, Clinical Neurophysiology. doi:
10.1016/j.clinph.2004.09.011.
Hill, A. V. (1938) ‘The Heat of Shortening and the Dynamic Constants of Muscle’,
Proceedings of the Royal Society B: Biological Sciences. doi: 10.1098/rspb.1938.0050.
Hodgkin, A. L. and Huxley, A. F. (1939) ‘Action potentials recorded from inside a nerve
fibre’, Nature. doi: 10.1038/144710a0.
Hodgkin, A. L. and Huxley, A. F. (1952a) ‘A quantitative description of membrane
current and its application to conduction and excitation in nerve’, J Physiol, 117(4), pp.
500–544. doi: https://doi.org/10.1113/jphysiol.1952.sp004764.
Chapter 8: References
S. Eickhoff - January 2021 154
Hodgkin, A. L. and Huxley, A. F. (1952b) ‘A quantitative description of membrane
current and its application to conduction and excitation in nerve’, The Journal of
Physiology. doi: 10.1113/jphysiol.1952.sp004764.
Hodgkin, A. L. and Huxley, A. F. (1952c) ‘Currents carried by sodium and potassium
ions through the membrane of the giant axon of Loligo’, The Journal of Physiology. doi:
10.1113/jphysiol.1952.sp004717.
Hodgkin, A. L. and Huxley, A. F. (1952d) ‘The dual effect of membrane potential on
sodium conductance in the giant axon of Loligo’, The Journal of Physiology. doi:
10.1113/jphysiol.1952.sp004719.
Hodgkin, A. L., Huxley, A. F. and Katz, B. (1952) ‘Measurement of current‐voltage
relations in the membrane of the giant axon of Loligo’, The Journal of Physiology. doi:
10.1113/jphysiol.1952.sp004716.
Hodgkin, A. L. and Katz, B. (1949) ‘The effect of sodium ions on the electrical activity
of the giant axon of the squid’, The Journal of Physiology. doi:
10.1113/jphysiol.1949.sp004310.
Hofer, C. et al. (2002) ‘A stimulator for functional activation of denervated muscles’, in
Artificial Organs. doi: 10.1046/j.1525-1594.2002.06951.x.
van den Honert, C. and Mortimer, J. T. (1979) ‘The response of the myelinated nerve
fiber to short duration biphasic stimulating currents’, Annals of Biomedical Engineering.
doi: 10.1007/BF02363130.
Horn, C. C., Ardell, J. L. and Fisher, L. E. (2019) ‘Electroceutical Targeting of the
Autonomic Nervous System’, Physiology, 34(2), pp. 150–162. doi:
https://doi.org/10.1152/physiol.00030.2018.
Hughes, M. L., Choi, S. and Glickman, E. (2018) ‘What can stimulus polarity and
interphase gap tell us about auditory nerve function in cochlear-implant recipients?’,
Hearing Research. doi: 10.1016/j.heares.2017.12.015.
Hursh, J. B. (1939) ‘CONDUCTION VELOCITY AND DIAMETER OF NERVE
FIBERS’, American Journal of Physiology-Legacy Content. doi:
10.1152/ajplegacy.1939.127.1.131.
Huxley, A. F. and Niedergerke, R. (1954) ‘Structural changes in muscle during
contraction: Interference microscopy of living muscle fibres’, Nature. doi:
10.1038/173971a0.

Chapter 8: References
S. Eickhoff - January 2021 155
Huxley, A. F. and Stämpfli, R. (1949) ‘Evidence for saltatory conduction in peripheral
myelinated nerve fibres’, The Journal of Physiology. doi:
10.1113/jphysiol.1949.sp004335.
Huxley, H. and Hanson, J. (1954) ‘Changes in the Cross-striations of muscle during
contraction and stretch and their structural interpretation’, Nature. doi:
10.1038/173973a0.
IEEE (2006) IEEE Standard for Safety Levels With Respect to Human Exposure to Radio
Frequency Electromagnetic Fields, 3 kHz to 300 GHz, IEEE Std C95.1-2005 (Revision
of IEEE Std C95.1-1991). doi: 10.1109/IEEESTD.2006.99501.
Jezernik, S. and Morari, M. (2005) ‘Energy-optimal electrical excitation of nerve fibers’,
IEEE Transactions on Biomedical Engineering. doi: 10.1109/TBME.2005.844050.
Johns, P. (2014) ‘Neurons and glial cells’, in Clinical Neuroscience, pp. 61–69. doi:
https://doi.org/10.1016/B978-0-443-10321-6.00005-9.
Johnson, P. F. et al. (1977) ‘An in vitro and in vivo analysis of anodized tantalum
capacitive electrodes: Corrosion response, physiology, and histology’, Journal of
Biomedical Materials Research. doi: 10.1002/jbm.820110502.
Kaczmarek, P. et al. (2010) ‘Investigation of the relationship between stimulus
parameters and a human muscle contraction force during stimulation of the gastrocnemius
muscle’, Artificial Organs. doi: 10.1111/j.1525-1594.2009.00759.x.
Katz, B. (1966) Nerve, muscle, and synapse. McGraw-Hill.
Kelliher, E. M. and Rose, T. L. (1987) ‘Evaluation of Charge Injection Properties of Thin
Film Redox Materials for use as Neural Stimulation Electrodes’, MRS Proceedings. doi:
10.1557/proc-110-23.
Kern, H. (2014) ‘Funktionelle Elektrostimulation paraplegischer Patienten’,
Östereichische Zeitschrift für Physikalische Medizin 1995. doi: 10.4081/ejtm.2014.2940.
Khalifa, A. et al. (2019) ‘The Microbead: A 0.009 mm3 Implantable Wireless Neural
Stimulator’, IEEE Transactions on Biomedical Circuits and Systems. doi:
10.1109/TBCAS.2019.2939014.
Kim, J. R. et al. (2010) ‘The relationship between electrically evoked compound action
potential and speech perception: A study in cochlear implant users with short electrode
array’, Otology and Neurotology. doi: 10.1097/MAO.0b013e3181ec1d92.

Chapter 8: References
S. Eickhoff - January 2021 156
Ko, C. P. (2001) ‘Neuromuscular System’, in International Encyclopedia of the Social &
Behavioral Sciences, pp. 10595–10600. doi: https://doi.org/10.1016/B0-08-043076-
7/03482-3.
Koester, J. (1985a) ‘Resting membrane potential and action potential’, in Kandel, E. R.
and Schwartz, J. H. (eds) Principles of Neural Science. 2nd edn. New York: Elsevier, pp.
49–57.
Koester, J. (1985b) ‘Voltage gated channels and the generation of the action potential’,
in Kandel, E. R. and Schwartz, J. H. (eds) Principles of Neural Science. 2nd edn. New
York: Elsevier, pp. 75–86.
Krouchev, N. I. et al. (2014) ‘Energy-optimal electrical-stimulation pulses shaped by the
least-action principle’, PLoS ONE. doi: 10.1371/journal.pone.0090480.
Kumsa, D. W. et al. (2017) ‘Electron transfer processes occurring on platinum neural
stimulating electrodes: Pulsing experiments for cathodic-first, charge-balanced, biphasic
pulses for 0.566 ≤ k ≤ 2.3 in rat subcutaneous tissues’, Journal of Neural Engineering.
doi: 10.1088/1741-2552/aa7a4a.
Kwende, M. M. N., Jarvis, J. C. and Salmons, S. (1995) ‘The input-output relations of
skeletal muscle’, Proceedings of the Royal Society B: Biological Sciences. doi:
10.1098/rspb.1995.0136.
Lagow, C. H., Sladek, K. J. and Richardson, P. C. (1971) ‘Anodic Insulated Tantalum
Oxide Electrocardiograph Electrodes’, IEEE Transactions on Biomedical Engineering.
doi: 10.1109/TBME.1971.4502820.
Lapicque, L. (1907) ‘Recherches quantitatives sur l’excitation électrique des nerfs traitée
comme une polarisation’, J. Physiol. Pathol. Gen. doi: 10.1007/s00422-007-0189-6.
Larsson, L. and Yu, F. (1997) ‘Gender-related differences in the regulatory influence of
thyroid hormone on the expression of myosin isoforms in young and old rats’, Acta
Physiologica Scandinavica. doi: 10.1046/j.1365-201X.1997.559328000.x.
Lee, B. et al. (2018) ‘An Implantable Peripheral Nerve Recording and Stimulation
System for Experiments on Freely Moving Animal Subjects’, Scientific Reports. doi:
10.1038/s41598-018-24465-1.
Leote, J., Pereira, P. and Valls-Sole, J. (2017) ‘Double peak sensory nerve action
potentials to single stimuli in nerve conduction studies’, Muscle and Nerve. doi:
10.1002/mus.25486.

Chapter 8: References
S. Eickhoff - January 2021 157
Liddell, E. and Sherrington, C. (1925) ‘Recruitment and some other features of reflex
inhibition’, Proceedings of the Royal Society of London. Series B, Containing Papers of
a Biological Character. doi: 10.1098/rspb.1925.0016.
Loeb, G. E. et al. (1991) ‘Injectable microstimulator for functional electrical stimulation’,
Medical & Biological Engineering & Computing. doi: 10.1007/BF02446097.
Luo, Y. S. et al. (2013) ‘Ultrasonic power/data telemetry and neural stimulator with
OOK-PM signaling’, IEEE Transactions on Circuits and Systems II: Express Briefs. doi:
10.1109/TCSII.2013.2286000.
Ma, Y. et al. (2018) ‘Enabling deep-tissue networking for miniature medical devices’, in.
doi: 10.1145/3230543.3230566.
Maciejasz, P. et al. (2015) ‘Delaying discharge after the stimulus significantly decreases
muscle activation thresholds with small impact on the selectivity: an in vivo study using
TIME’, Medical and Biological Engineering and Computing. doi: 10.1007/s11517-015-
1244-4.
Mayr, W. et al. (2002) ‘Functional Electrical Stimulation ( FES ) of Denervated Muscles :
Existing and Prospective Technological Solutions’, European Journal of Translational
Myology.
McCreery, D. B. et al. (1988) ‘Comparison of neural damage induced by electrical
stimulation with faradaic and capacitor electrodes’, Annals of Biomedical Engineering.
doi: 10.1007/BF02368010.
McIntyre, C. C., Richardson, A. G. and Grill, W. M. (2002) ‘Modeling the Excitability
of Mammalian Nerve Fibers: Influence of Afterpotentials on the Recovery Cycle’,
Journal of Neurophysiology. doi: 10.1152/jn.00353.2001.
McKay, C. M. and Henshall, K. R. (2003) ‘The perceptual effects of interphase gap
duration in cochlear implant stimulation’, Hearing Research, 181(1–2), pp. 94–99. doi:
10.1016/S0378-5955(03)00177-1.
McNeal, D. R. (1976) ‘Analysis of a Model for Excitation of Myelinated Nerve’, IEEE
Transactions on Biomedical Engineering. doi: 10.1109/TBME.1976.324593.
Merletti, R. (1997) ‘Standards for reporting EMG data’, Journal of Electromyography
and Kinesiology. doi: 10.1016/s1050-6411(97)90001-8.
Merrill, D. R., Bikson, M. and Jefferys, J. G. R. (2005) ‘Electrical stimulation of excitable

Chapter 8: References
S. Eickhoff - January 2021 158
tissue: Design of efficacious and safe protocols’, Journal of Neuroscience Methods. doi:
10.1016/j.jneumeth.2004.10.020.
Mortimer, J. T. and Bhadra, N. (2018) ‘Fundamentals of Electrical Stimulation’, in
Neuromodulation. 2nd edn. Elsevier, pp. 71–82. doi: 10.1016/B978-0-12-805353-
9.00006-1.
Naples, G. G. et al. (1988) ‘A Spiral Nerve Cuff Electrode for Peripheral Nerve
Stimulation’, IEEE Transactions on Biomedical Engineering. doi: 10.1109/10.8670.
Neely, R. M. et al. (2018) ‘Recent advances in neural dust: towards a neural interface
platform’, Current Opinion in Neurobiology. doi: 10.1016/j.conb.2017.12.010.
Okusa, M. D., Rosin, D. L. and Tracey, K. J. (2017) ‘Targeting neural reflex circuits in
immunity to treat kidney disease’, Nature Reviews Nephrology. doi:
10.1038/nrneph.2017.132.
Peckham, P. H. and Knutson, J. S. (2005) ‘Functional Electrical Stimulation for
Neuromuscular Applications’, Annual Review of Biomedical Engineering. doi:
10.1146/annurev.bioeng.6.040803.140103.
Piech, D. K. et al. (2020) ‘A wireless millimetre-scale implantable neural stimulator with
ultrasonically powered bidirectional communication’, Nature Biomedical Engineering.
doi: 10.1038/s41551-020-0518-9.
Polasek, K. H. et al. (2007) ‘Human nerve stimulation thresholds and selectivity using a
multi-contact nerve cuff electrode’, IEEE Transactions on Neural Systems and
Rehabilitation Engineering. doi: 10.1109/TNSRE.2007.891383.
Poletto, C. J. and Van Doren, C. L. (2002) ‘Elevating pain thresholds in humans using
depolarizing prepulses’, IEEE Transactions on Biomedical Engineering. doi:
10.1109/TBME.2002.803563.
Prado-Guitierrez, P. et al. (2006a) ‘Effect of interphase gap and pulse duration on
electrically evoked potentials is correlated with auditory nerve survival’, Hearing
Research, 215(1–2), pp. 47–55. doi: 10.1016/j.heares.2006.03.006.
Prado-Guitierrez, P. et al. (2006b) ‘Effect of interphase gap and pulse duration on
electrically evoked potentials is correlated with auditory nerve survival’, Hearing
Research. doi: 10.1016/j.heares.2006.03.006.
Ramekers, D. et al. (2014) ‘Auditory-nerve responses to varied inter-phase gap and phase

Chapter 8: References
S. Eickhoff - January 2021 159
duration of the electric pulse stimulus as predictors for neuronal degeneration’, JARO -
Journal of the Association for Research in Otolaryngology. doi: 10.1007/s10162-013-
0440-x.
Ramón y Cajal, S. (1911) ‘Histologie du systeme nerveux de l’homme et des vertebres’,
Paris Maloine. doi: 10.1109/WiCom.2008.1401.
Rattay, F. (1986) ‘Analysis of Models for External Stimulation of Axons’, IEEE
Transactions on Biomedical Engineering. doi: 10.1109/TBME.1986.325670.
Reilly, J. and Diamant, A. (2011) Electrostimulation: Theory, Applications, and
Computational Model. Artech House Publishers.
Robblee, L. S. (1983) ‘Activated Ir: An Electrode Suitable for Reversible Charge
Injection in Saline Solution’, Journal of The Electrochemical Society. doi:
10.1149/1.2119793.
Rose, T. L., Kelliher, E. M. and Robblee, L. S. (1985) ‘Assessment of capacitor electrodes
for intracortical neural stimulation’, Journal of Neuroscience Methods. doi:
10.1016/0165-0270(85)90001-9.
Rose, T. L. and Robblee, L. S. (1990) ‘Electrical Stimulation with Pt Electrodes. VIII.
Electrochemically Safe Charge Injection Limits with 0.2 MS Pulses’, IEEE Transactions
on Biomedical Engineering. doi: 10.1109/10.61038.
Rushton, W. A. H. (1951) ‘A theory of the effects of fibre size in medullated nerve’, The
Journal of Physiology. doi: 10.1113/jphysiol.1951.sp004655.
Rydevik, B., Lundborg, G. and Bagge, U. (1981) ‘Effects of graded compression on
intraneural blood flow: An in vivo study on rabbit tibial nerve’, Journal of Hand Surgery.
doi: 10.1016/S0363-5023(81)80003-2.
Sabetian, P. et al. (2017) ‘Characterizing the reduction of stimulation artifact noise in a
tripolar nerve cuff electrode by application of a conductive shield layer’, Medical
Engineering and Physics. doi: 10.1016/j.medengphy.2016.11.010.
Sacramento, J. F. et al. (2018) ‘Bioelectronic modulation of carotid sinus nerve activity
in the rat: a potential therapeutic approach for type 2 diabetes’, Diabetologia. doi:
10.1007/s00125-017-4533-7.
Sahin, M. and Pikov, V. (2011) ‘Wireless microstimulators for neural prosthetics’,
Critical Reviews in Biomedical Engineering. doi: 10.1615/CritRevBiomedEng.v39.i1.50.

Chapter 8: References
S. Eickhoff - January 2021 160
Sahin, M. and Tie, Y. (2007) ‘Non-rectangular waveforms for neural stimulation with
practical electrodes.’, Journal of neural engineering, 4(3), pp. 227–233. doi:
10.1088/1741-2560/4/3/008.
Salmons, S. et al. (2005) ‘Functional electrical stimulation of denervated muscles: Basic
issues’, Artificial Organs. doi: 10.1111/j.1525-1594.2005.29034.x.
Sassen, M. and Zimmermann, M. (1973) ‘Differential blocking of myelinated nerve fibres
by transient depolarization’, Pflügers Archiv European Journal of Physiology. doi:
10.1007/BF00592788.
Scheiner, A., Mortimer, J. T. and Roessmann, U. (1990) ‘Imbalanced biphasic electrical
stimulation: Muscle tissue damage’, Annals of Biomedical Engineering. doi:
10.1007/BF02364157.
Schvartz-Leyzac, K. C. and Pfingst, B. E. (2016) ‘Across-site patterns of electrically
evoked compound action potential amplitude-growth functions in multichannel cochlear
implant recipients and the effects of the interphase gap’, Hearing Research. doi:
10.1016/j.heares.2016.08.002.
Shannon, R. V. (1992) ‘A Model of Safe Levels for Electrical Stimulation’, IEEE
Transactions on Biomedical Engineering. doi: 10.1109/10.126616.
Shepherd, R. K. and Javel, E. (1999) ‘Electrical stimulation of the auditory nerve: II.
Effect of stimulus waveshape on single fibre response properties’, Hearing Research. doi:
10.1016/S0378-5955(99)00011-8.
Son, Y. H. et al. (2019) ‘Comparative molecular analysis of endurance exercise in vivo
with electrically stimulated in vitro myotube contraction’, Journal of Applied Physiology.
doi: 10.1152/japplphysiol.00091.2019.
Springer, S. et al. (2014) ‘The Effect of Electrode Placement and Interphase Interval on
Force Production During Stimulation of the Dorsiflexor Muscles’, Artificial Organs. doi:
10.1111/aor.12346.
Strojnik, P. et al. (1987) ‘Treatment of drop foot using an implantable peroneal underknee
stimulator’, Scandinavian Journal of Rehabilitation Medicine. doi: 10.1016/0268-
0033(87)90024-6.
Sweeney, J. D., Mortimer, J. T. and Durand, D. M. (1987) ‘Modeling of mammalian
myelinated nerve for functional neuromuscular stimulation’, IEEE 9th Annual
Conference of the Engineering in Medicine and Biology Society.

Chapter 8: References
S. Eickhoff - January 2021 161
Tanabe, Y. et al. (2017) ‘High-performance wireless powering for peripheral nerve
neuromodulation systems’, PLoS ONE. doi: 10.1371/journal.pone.0186698.
Targan, R. S., Alon, G. and Kay, S. L. (2000) ‘Effect of long-term electrical stimulation
on motor recovery and improvement of clinical residuals in patients with unresolved
facial nerve palsy’, Otolaryngology - Head and Neck Surgery. doi: 10.1016/S0194-
5998(00)70248-8.
Tyler, D. J. (2018) ‘Electrodes for the Neural Interface’, in Neuromodulation (Second
Edition), pp. 239–274.
Varejao, A. S. P. et al. (2004) ‘Functional and morphological assessment of a
standardized rat sciatic nerve crush injury with a non-serrated clamp’, Journal of
Neurotrauma. doi: 10.1089/neu.2004.21.1652.
Vargas Luna, J. L. et al. (2017) ‘Optimization of Interphase Intervals to Enhance the
Evoked Muscular Responses of Transcutaneous Neuromuscular Electrical Stimulation’,
Artificial Organs. doi: 10.1111/aor.12921.
Vargas Luna, J. L., Mayr, W. and Cortés-Ramirez, J. A. (2018) ‘Sub-threshold
depolarizing pre-pulses can enhance the efficiency of biphasic stimuli in transcutaneous
neuromuscular electrical stimulation’, Medical and Biological Engineering and
Computing. doi: 10.1007/s11517-018-1851-y.
Vastani, N. et al. (2013) ‘Preconditioning depolarizing ramp currents enhance the effect
of sodium channel blockers in primary sensory afferents’, Neuromodulation. doi:
10.1111/ner.12031.
Weitz, A. C. et al. (2014) ‘Interphase gap as a means to reduce electrical stimulation
thresholds for epiretinal prostheses’, Journal of Neural Engineering, 11(1). doi:
10.1088/1741-2560/11/1/016007.
Willand, M. P. and de Bruin, H. (2008) ‘Design and testing of an instrumentation system
to reduce stimulus pulse amplitude requirements during FES.’, Conference proceedings :
... Annual International Conference of the IEEE Engineering in Medicine and Biology
Society. IEEE Engineering in Medicine and Biology Society. Conference. doi:
10.1109/IEMBS.2008.4649775.
Wongsarnpigoon, A. and Grill, W. M. (2010) ‘Energy-efficient waveform shapes for
neural stimulation revealed with a genetic algorithm’, Journal of Neural Engineering,
7(4). doi: 10.1088/1741-2560/7/4/046009.

Chapter 8: References
S. Eickhoff - January 2021 162
Wongsarnpigoon, A., Woock, J. P. and Grill, W. M. (2010) ‘Efficiency analysis of
waveform shape for electrical excitation of nerve fibers’, IEEE Transactions on Neural
Systems and Rehabilitation Engineering, 18(3), pp. 319–328. doi:
10.1109/TNSRE.2010.2047610.
Wu, P. et al. (2014) ‘Key changes in denervated muscles and their impact on regeneration
and reinnervation’, Neural Regeneration Research. doi: 10.4103/1673-5374.143424.
Yeagle, S. P., Mayer, R. F. and Max, S. R. (1983) ‘Contractile properties of rat fast-twitch
skeletal muscle during reinnervation: Effects of testosterone and castration’,
Experimental Neurology. doi: 10.1016/0014-4886(83)90407-7.

Chapter 9: Appendices
S. Eickhoff - January 2021 163
9 APPENDICES
APPENDIX 1 LABVIEW STIMULATION CODE .................................................................. 164
APPENDIX 2 MATLAB TWITCH FORCE ANALYSIS CODES .............................................. 169
APPENDIX 3A MATLAB ENG ANALYSIS CODES (SHORT PHW) ..................................... 170
APPENDIX 3B MATLAB ENG ANALYSIS CODES (LONG PHW) ....................................... 171
APPENDIX 4 LABCHART CELL STIMULATION PROGRAM ................................................. 172
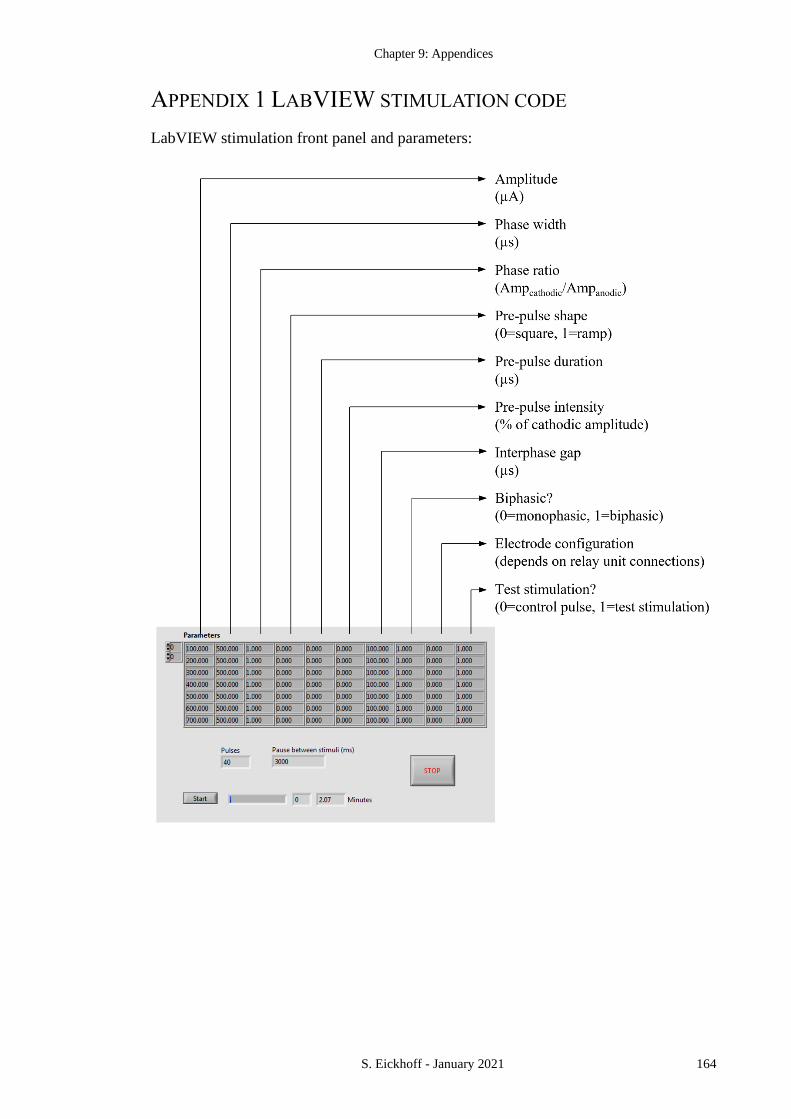
Chapter 9: Appendices
S. Eickhoff - January 2021 164
APPENDIX 1 LABVIEW STIMULATION CODE
LabVIEW stimulation front panel and parameters:
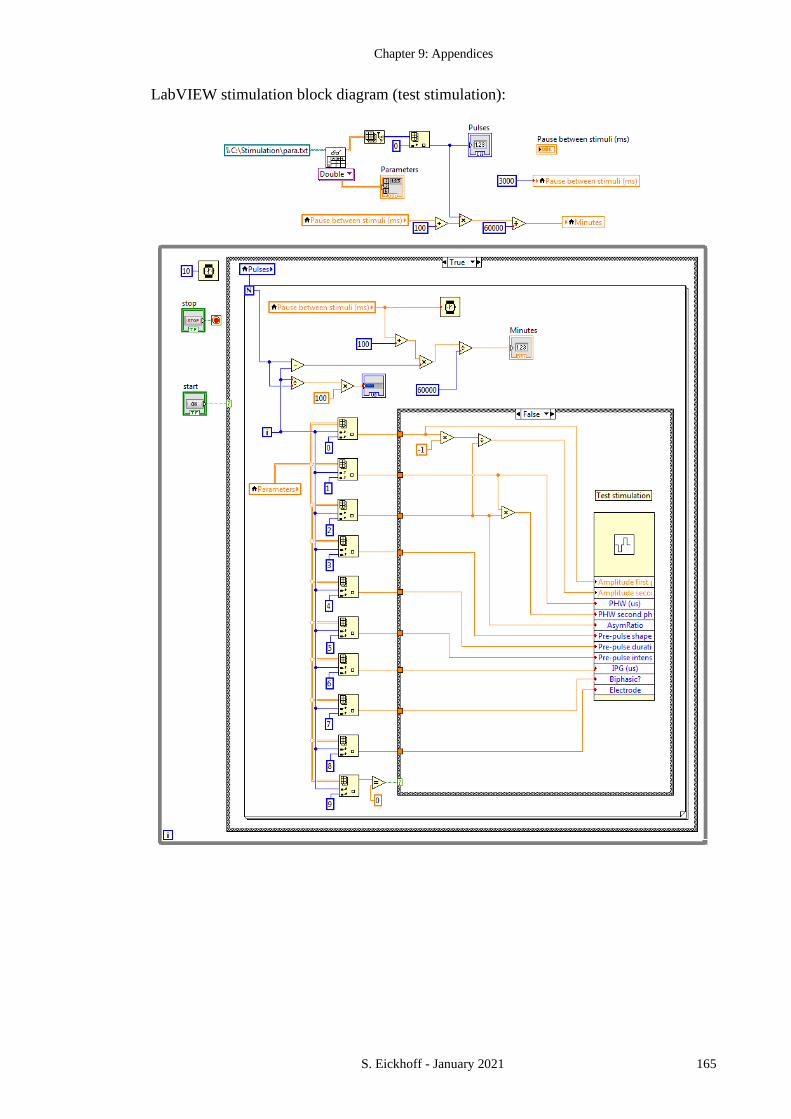
Chapter 9: Appendices
S. Eickhoff - January 2021 165
LabVIEW stimulation block diagram (test stimulation):
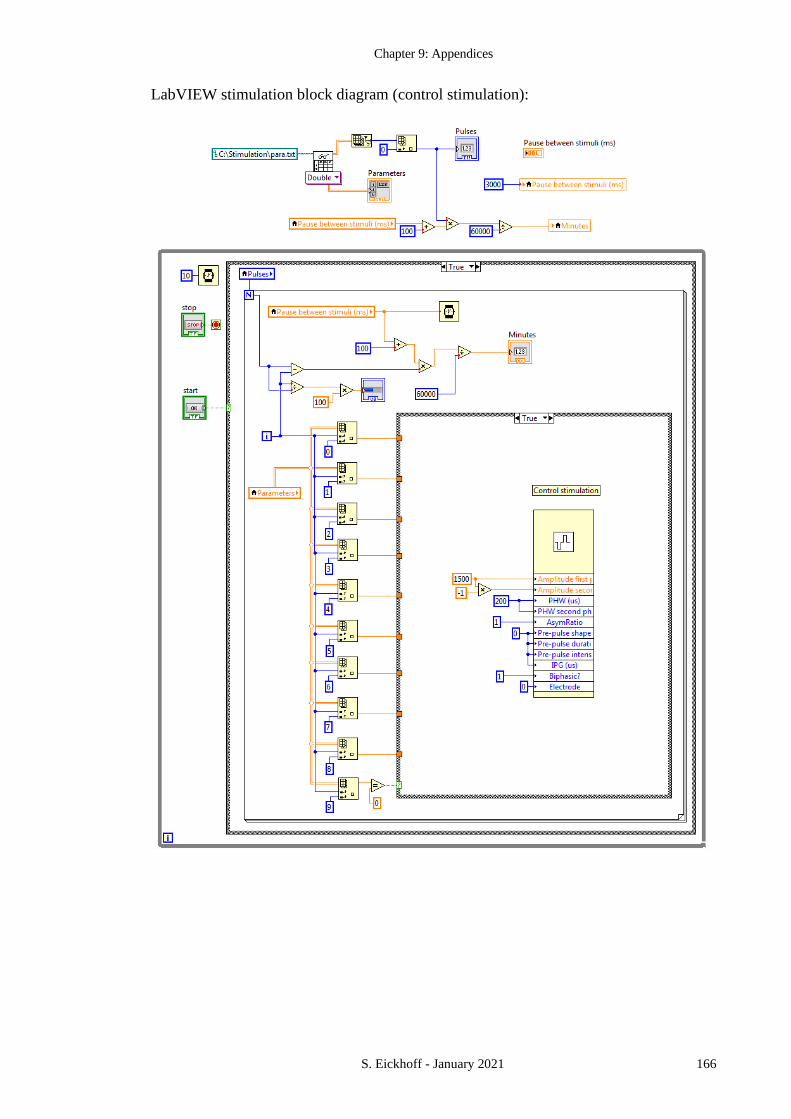
Chapter 9: Appendices
S. Eickhoff - January 2021 166
LabVIEW stimulation block diagram (control stimulation):

Chapter 9: Appendices
S. Eickhoff - January 2021 167
LabVIEW pulse generator sub-VI
(exemplary block diagram for biphasic pulse with square pre-pulses)
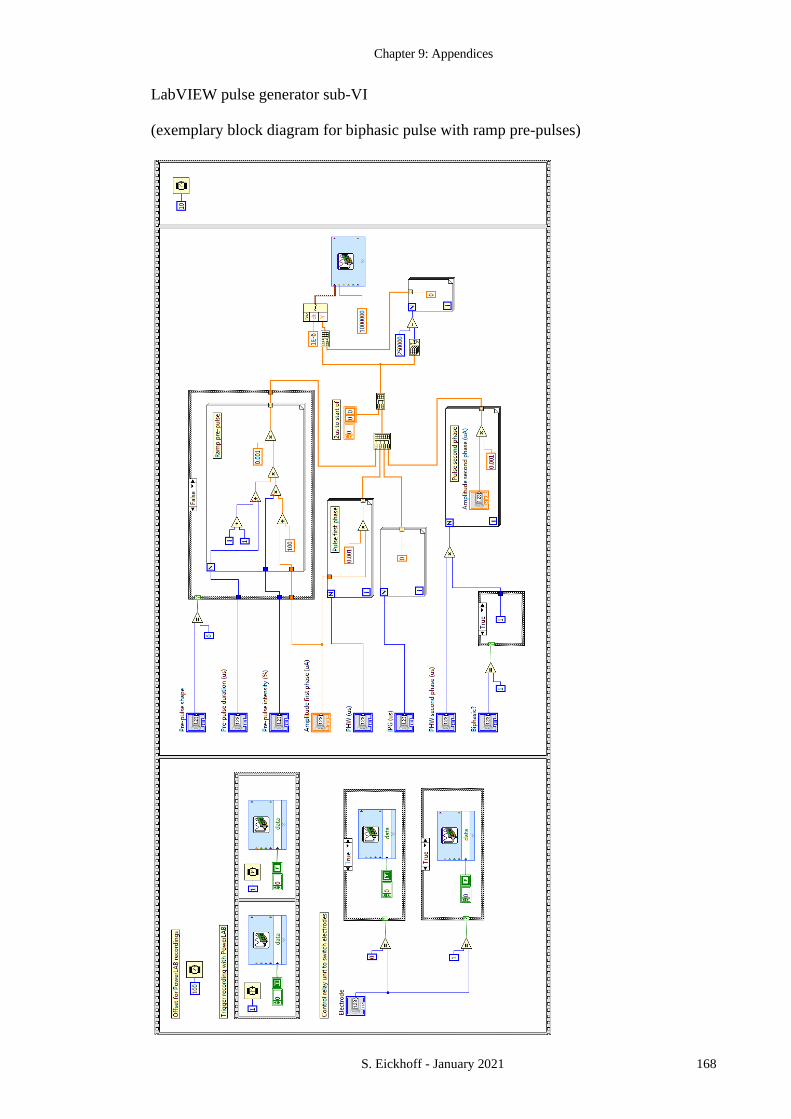
Chapter 9: Appendices
S. Eickhoff - January 2021 168
LabVIEW pulse generator sub-VI
(exemplary block diagram for biphasic pulse with ramp pre-pulses)

Chapter 9: Appendices
S. Eickhoff - January 2021 169
APPENDIX 2 MATLAB TWITCH FORCE ANALYSIS CODES
This first code section analyses the raw twitch force recordings and normalizes the data
to the control pulse level:
The normalized data set is then, depending on the specific series (i.e. recruitment curves)
contained within it, sorted and fed as matrix RC into the following program. This next
code section is used to determine the 10, 50, and 90% activation thresholds by linear
interpolation of the recorded twitch force measurements:

Chapter 9: Appendices
S. Eickhoff - January 2021 170
APPENDIX 3A MATLAB ENG ANALYSIS CODES (SHORT
PHW)

Chapter 9: Appendices
S. Eickhoff - January 2021 171
APPENDIX 3B MATLAB ENG ANALYSIS CODES (LONG
PHW)

Chapter 9: Appendices
S. Eickhoff - January 2021 172
APPENDIX 4 LABCHART CELL STIMULATION PROGRAM
(Exemplary settings: 10V amplitude, biphasic, phase width 1ms, 10Hz frequency)