Oxidative stress, nitric oxide, and the mechanisms of cell death in Lurcher Purkinje cells
15
Oxidative Stress, Nitric Oxide, and the Mechanisms of Cell Death in Lurcher Purkinje Cells Rebecca McFarland, 1,2 Andrei Blokhin, 2 James Sydnor, 2 Jean Mariani, 3,4 Michael W. Vogel 2 1 Department of Biology, University of Maryland Baltimore County, Baltimore, Maryland 21250 2 Department of Psychiatry, Maryland Psychiatric Research Center, University of Maryland School of Medicine, Baltimore, Maryland 21228 3 Equipe De ´ veloppement et Vieillissement du Syste ` me Nerveux, UMR NPA 7102, CNRS et Universite Pierre and Marie Curie, 9, Quai St. Bernard, 75005 Paris, France 4 AP-HP, Hopital Charles Foix, UEF, Ivry sur Seine, 94200 France Received 6 October 2006; revised 22 December 2006; accepted 25 December 2006 ABSTRACT: Oxidative stress is postulated to play a role in cell death in many neurodegenerative diseases. As a model of neonatal neuronal cell death, we have examined the role of oxidative stress in Pur- kinje cell death in the heterozygous Lurcher mutant (þ/Lc). Lurcher is a gain of function mutation in the d2 glutamate receptor (GluRd2) that turns the recep- tor into a leaky membrane channel, resulting in chronic depolarization of þ/Lc Purkinje cells starting around the first week of postnatal development. Virtu- ally, all þ/Lc Purkinje cells die by the end of the first postnatal month. To investigate the role of oxidative stress in þ/Lc Purkinje cell death, we have examined nitric oxide synthase (NOS) activity and the expression of two markers for oxidative stress, nitrotyrosine and manganese super oxide dismutase (MnSOD), in wild type and þ/Lc Purkinje cells at P10, P15, and P25. The results show that NOS activity and immunolabel- ing for nitrotyrosine and MnSOD are increased in þ/Lc Purkinje cells. To determine whether peroxynitrite formation is a prerequisite for þ/Lc Purkinje cell death, þ/Lc mutants were crossed with an a-nNOS knockout mutant (nNOSa / ) to reduce the produc- tion of NO. Analysis of the double mutants showed that blocking a-nNOS expression does not rescue þ/Lc Purkinje cells. However, we present evidence for sus- tained NOS activity and nitrotyrosine formation in the GluRd2 þ/Lc :nNOS / double mutant Purkinje cells, which suggests that the failure to rescue GluRd2 þ/Lc : nNOS / Purkinje cells may be explained by the induction of alternative nNOS isoforms. ' 2007 Wiley Periodicals, Inc. Develop Neurobiol 67: 1032–1046, 2007 Keywords: excitotoxicity; nitric oxide; cell death; caspase-3; d2 glutamate receptors; nitrotyrosine INTRODUCTION The Lurcher mouse mutant has an autosomal domi- nant mutation in the d2 glutamate receptor (GluRd2) that causes the cell autonomous death of virtually all cerebellar Purkinje cells (Phillips, 1960; Caddy and Biscoe, 1979; Yue et al., 2002). GluRd2 is preferen- tially expressed in high levels at parallel fiber synap- Correspondence to: M.W. Vogel ([email protected]. edu). Contract grant sponsor: NINDS; contract grant number: NS34309. This article contains supplementary material available via the Internet at http://www.interscience.wiley.com/jpages/1932-8451/ suppmat. ' 2007 Wiley Periodicals, Inc. Published online 6 March 2007 in Wiley InterScience (www. interscience.wiley.com). DOI 10.1002/dneu.20391 1032
-
Upload
independent -
Category
Documents
-
view
3 -
download
0
Transcript of Oxidative stress, nitric oxide, and the mechanisms of cell death in Lurcher Purkinje cells

Oxidative Stress, Nitric Oxide, and the Mechanismsof Cell Death in Lurcher Purkinje Cells
Rebecca McFarland,1,2 Andrei Blokhin,2 James Sydnor,2 Jean Mariani,3,4
Michael W. Vogel2
1 Department of Biology, University of Maryland Baltimore County, Baltimore, Maryland 21250
2 Department of Psychiatry, Maryland Psychiatric Research Center, University of MarylandSchool of Medicine, Baltimore, Maryland 21228
3 Equipe Developpement et Vieillissement du Systeme Nerveux, UMR NPA 7102, CNRS etUniversite Pierre and Marie Curie, 9, Quai St. Bernard, 75005 Paris, France
4 AP-HP, Hopital Charles Foix, UEF, Ivry sur Seine, 94200 France
Received 6 October 2006; revised 22 December 2006; accepted 25 December 2006
ABSTRACT: Oxidative stress is postulated to
play a role in cell death in many neurodegenerative
diseases. As a model of neonatal neuronal cell death,
we have examined the role of oxidative stress in Pur-
kinje cell death in the heterozygous Lurcher mutant
(þ/Lc). Lurcher is a gain of function mutation in the
d2 glutamate receptor (GluRd2) that turns the recep-
tor into a leaky membrane channel, resulting in
chronic depolarization of þ/Lc Purkinje cells starting
around the first week of postnatal development. Virtu-
ally, all þ/Lc Purkinje cells die by the end of the first
postnatal month. To investigate the role of oxidative
stress in þ/Lc Purkinje cell death, we have examined
nitric oxide synthase (NOS) activity and the expression
of two markers for oxidative stress, nitrotyrosine and
manganese super oxide dismutase (MnSOD), in wild
type and þ/Lc Purkinje cells at P10, P15, and P25.
The results show that NOS activity and immunolabel-
ing for nitrotyrosine and MnSOD are increased in þ/Lc
Purkinje cells. To determine whether peroxynitrite
formation is a prerequisite for þ/Lc Purkinje cell
death, þ/Lc mutants were crossed with an a-nNOS
knockout mutant (nNOSa�/�) to reduce the produc-
tion of NO. Analysis of the double mutants showed
that blocking a-nNOS expression does not rescue þ/LcPurkinje cells. However, we present evidence for sus-
tained NOS activity and nitrotyrosine formation in the
GluRd2þ/Lc:nNOS�/� double mutant Purkinje cells,
which suggests that the failure to rescue GluRd2þ/Lc:
nNOS�/�
Purkinje cells may be explained by the
induction of alternative nNOS isoforms. ' 2007 Wiley
Periodicals, Inc. Develop Neurobiol 67: 1032–1046, 2007
Keywords: excitotoxicity; nitric oxide; cell death;
caspase-3; d2 glutamate receptors; nitrotyrosine
INTRODUCTION
The Lurcher mouse mutant has an autosomal domi-
nant mutation in the d2 glutamate receptor (GluRd2)
that causes the cell autonomous death of virtually all
cerebellar Purkinje cells (Phillips, 1960; Caddy and
Biscoe, 1979; Yue et al., 2002). GluRd2 is preferen-
tially expressed in high levels at parallel fiber synap-
Correspondence to: M.W. Vogel ([email protected]).
Contract grant sponsor: NINDS; contract grant number:NS34309.
This article contains supplementary material available via theInternet at http://www.interscience.wiley.com/jpages/1932-8451/suppmat.
' 2007 Wiley Periodicals, Inc.Published online 6 March 2007 in Wiley InterScience (www.interscience.wiley.com).DOI 10.1002/dneu.20391
1032

ses in cerebellar Purkinje cells and at lower levels in
hindbrain neurons (Araki et al., 1993; Lomeli et al.,
1993; Takayama et al., 1996; Landsend et al., 1997).
The Lurcher mutation in GluRd2 is a base-pair substi-
tution that changes an alanine to threonine in the
highly conserved third hydrophobic segment of
GluRd2 (Zuo et al., 1997). The mutation changes the
GluRd2 receptor into a leaky membrane channel that
carries a constitutively-active inward cation current
into the cells that express the subunit, causing a
chronic depolarization. Homozygous Lc/Lc pups die
around birth (Cheng and Heintz, 1997), while in the
þ/Lc mutant the chronic depolarization of Purkinje
cells starts by at least P5-6 (Selimi et al., 2003). þ/LcPurkinje cell death begins around P7 to P10 and
nearly all have died by the end of the first postnatal
month (Caddy and Biscoe, 1979).
þ/Lc Purkinje cell death has been alternately
described as necrotic, apoptotic, and autophagic
based on a variety of criteria. Ultrastructural descrip-
tions have suggested necrotic cell death (Dumesnil-
Bousez and Sotelo, 1992), but GluRd2Lc receptors
may also trigger an autophagic cell death pathway
through their failure to sequester Beclin (Yue et al.,
2002). There is also evidence for apoptotic pathways:
TUNEL labeled þ/Lc Purkinje cells have been
detected in three studies (Norman et al., 1995; Wull-
ner et al., 1995; Selimi et al., 2000) and BAX and
Bcl-x expression are increased in dying þ/Lc Pur-
kinje cells (Wullner et al., 1995). Pro-caspase 3 levels
are increased in *25% of þ/Lc Purkinje cells at P12
to P20 and activated caspase-3 is expressed in a much
lower percentage of þ/Lc Purkinje cells at P12 to P25
(Selimi et al., 2000). Presumably, the percentage is
low because the þ/Lc Purkinje cells die soon after
pro-caspase-3 is activated. In addition, there is
increased c-Jun phosphorylation in þ/Lc Purkinje
cells along with increases in caspase-8 and -9 expres-
sion (Lu and Tsirka, 2002).
The goal of this study is to test the hypothesis that
oxidative stress and nitric oxide (NO) production
induce þ/Lc Purkinje cell death. The chronic cation
leak mediated by the GluRd2Lc channel suggests that
excitotoxicity is a likely mechanism for the induction
of þ/Lc Purkinje cell pathology (Zuo et al., 1997). As
a test of this hypothesis, we have examined nitric ox-
ide synthase (NOS) activity and the expression of two
markers for oxidative stress, nitrotyrosine and manga-
nese super oxide dismutase (MnSOD), in wild type
and þ/Lc Purkinje cells. Nitrotyrosine in the product
of peroxynitrite nitration of tyrosine residues on tar-
get proteins. MnSOD is the principal scavenger of
superoxide in mitochondria and is induced by a vari-
ety of cytotoxic and proapoptotic agents (Fridovich,
1975). To determine whether peroxynitrite formation
is a prerequisite for þ/Lc Purkinje cell death, þ/Lcmutants were crossed with a-nNOS knockout mutants
to reduce the production of NO. Analysis of the dou-
ble mutants showed that blocking a-nNOS expression
might not rescue þ/Lc Purkinje cells from death
because there is an induction of alternate NOS activ-
ities.
METHODS
Animals
GluRd2þ/Lc mutant and wild type pups were generated by
mating B6CBACa Aw-J/A-Grid2Lc/J males with wild type
females (C57BL/6J), both from Jackson Laboratories
(GRID2 is an alternative abbreviation for GluRd2).
GluRd2þ/Lc; NOS�/� double mutants and heterozygous
controls were generated by mating male GluRd2þ/Lc
mutants with female B6;129S4-Nos1tm1Plh/J NOS homozy-
gotes (from Jackson Laboratories; nNOS�/�). The F1 gen-
eration of mice were genotyped and males and females
identified as double heterozygotes (GluRd2þ/Lc:NOSþ/�)
were harem mated with GluRd2þ/þ:NOSþ/� heterozygotes
to generate F2 generations that contained GluRd2þ/Lc:
NOS�/� double mutants as well as heterozygous and homo-
zygous controls (GluRd2þ/Lc:nNOSþ/� or GluRd2þ/Lc:
nNOSþ/þ and GluRd2þ/þ:nNOSþ/� or GluRd2þ/þ:nNOSþ/þ).
All animals were housed in standard conditions (14 h light,
10 h dark) in the animal facilities at the Maryland Psychiat-
ric Research Center and provided with food and water adlibitum. Males were harem mated with 1 male to 2 or 3
females. The day of birth was counted as postnatal day 0
(P0). The animal facilities are fully accredited by the Amer-
ican Association for the Accreditation of Laboratory Ani-
mal Care (AAALAC) and the studies were conducted in ac-
cordance with the Guide for Care and Use of Laboratory
Animals provided by the NIH.
Depending on the requirements of the experiment, mice
were either euthanized by cardiac perfusion with 0.9% sa-
line followed by 4% paraformaldehyde (while deeply anes-
thetized with Avertin) or by decapitation when fresh brains
were required for measuring protein levels in Western blots.
Following the perfusions with 4% paraformaldehyde, the
brains were removed from the skull and postfixed for 2–
24 h. For freshly dissected brains, the cerebellum and fron-
tal cortex was removed and quickly frozen in microcentri-
fuge tubes on crushed dry ice.
Immunocytochemistry
Fixed brains were either cut at 30 lm and collected as float-
ing sections in 10 mM PBS or were cut at 12 lm on a Leica
cryostat and collected directly on slides. The slide-mounted
sections were stored at �708C until stained. For immuno-
labeling experiments, the floating sections or slides were
Lurcher Purkinje Cells 1033
Developmental Neurobiology. DOI 10.1002/dneu

rinsed in 10 mM PBS, followed by incubation in two
changes of 0.1 M glycine for 5 min each. Endogenous fluo-
rescence was reduced by incubating the sections in 50 mMammonium chloride for 1 h. The sections were then rinsed
three times in 10 mM PBS and then incubated for an hour
in blocking solution containing 3% normal goat serum and
0.3% Triton X-100. Sections were then incubated in the pri-
mary antibodies overnight at 48C. All sections were double
labeled with mouse anticalbindin (Sigma: 1/10,000) or rab-
bit anticalbindin (Calbiochem: 1/1000) and either mouse
antinitrotyrosine (Upstate: 1/1000), rabbit anti-N-terminal
nNOS (Zymed: 1/250), rabbit anti-C-terminal nNOS
(Upstate: 1/100), or rabbit anti-MnSOD (Stressgen: 1/
1000). The sections were rinsed three times in PBS and
then incubated for 2 h with fluorescent labeled secondary
antibodies (anti-mouse or anti-rabbit Alexa 594 and Alexa
488: Molecular Probes: 1/200). After incubation, they were
rinsed three times in 10 mM PBS, once in distilled water,
and then coverslipped with gelmount. The finished slides
were then photographed using either a Leica TCS scanning
confocal microscope or Olympus BH-2 or Zeiss Axioplan
fluorescence microscopes. All immunolabeling experiments
included slides (wild type and þ/Lc) with no 18 antibody
incubation as a control for nonspecific immunolabeling.
Digital images of immunolabeling for each antigen in wild
type and þ/Lc cerebella were taken with the same exposure
times, adjusted for hue, brightness and contrast the same
amount and cropped in Photoshop and then assembled in
photo plates with Adobe Illustrator.
For the semi-quantitative comparison of MnSOD immu-
nolabeling in wild type and þ/Lc cerebella digital images
of MnSOD and calbindin immunolabeling were taken at
403 on a Zeiss Axioplan with an Olympus DP70 CCD
camera within the first 2 days after staining all sections (to
avoid uneven fading artifacts). Images were taken from
more than five sections per cerebellum systematically ran-
domly selected from throughout the medial to lateral extent
of the vermis in randomly selected lobules that still con-
tained Purkinje cells. The raw images were then analyzed
using Metamorph Version 7.0r1. Threshold and colocaliza-
tion functions were used to selectively measure the inten-
sity of MnSOD immunolabeling in areas that colocalized
with calbindin-stained Purkinje cells in the same section. In
the deep cerebellar nuclei (DCN), the threshold and coloc-
alization functions were used to measure the intensity of
MnSOD immunolabeling in the DCN excluding calbindin-
positive axons. The intensity of MnSOD labeling at P15
and P25 is expressed as a percent change from the baseline
labeling in control regions at P15.
NADPH Histochemistry
Fixed brains (2 h postfixation) were cut at 12 lm on a cryo-
stat and collected on slides. The sections were rinsed in
10 mM PBS and then incubated with 0.5 mg/mL nitroblue
tetrazolium, 1 mg/mL NADPH, 0.3% Triton X-100 in phos-
phate buffer for 3 h at 378C. The sections were rinsed again
with PBS and coverslipped with gelmount.
Purkinje Cell Counts
The number of Purkinje cells per cerebellum were esti-
mated in þ/Lc:nNOS�/� double mutants and controls
using the optical fractionator technique (West, 1999; Fan
et al., 2001). Fixed cerebella, embedded in paraffin, were
sectioned sagittally at 25 lm on a Leitz microtome. Every
20th to 25th section (every 4th or 5th slide) from a ran-
dom start was selected for counts and stained for cresyl
violet. Purkinje cells were counted on a BH-2 Olympus
microscope using Nomarski optics and an oil immersion
1003 objective and an oil immersion condenser. The cer-
ebellar cortex was used as reference volume for counting
Purkinje cells. The optical dissector used to count Pur-
kinje cells was 15 lm deep and 500 lm2, spaced 200 lm
apart. These parameters were chosen to obtain a coeffi-
cient of error for the cell counts of less than 0.1. The
nuclei of Purkinje cells at their maximum diameter within
the counting box or touching the top and/or right sides
were included in the counts.
Western Blot Analysis
Wild type and þ/Lc cerebella were collected from
freshly dissected brains, rapidly frozen in dry ice, and
stored at �708C until processed. Each cerebellum was
homogenized in a buffer containing 50 mM Tris (pH
8.0), 150 mM NaCl, 5 mM EDTA, 1% SDS, 10 lL/mL
Protease inhibitor cocktail (Sigma), 1 mM PMSF, and
1 mM NaVO4. The homogenate was centrifuged at
15,000 rpm for 15 min. Protein concentration in the su-
pernatant was measured using a BioRad protein assay
kit. Protein extracts were diluted in Laemmli sample
buffer with b-mercaptoethanol and 20 lg of protein per
well was resolved on a Tris-glycine gel. Protein was
transferred overnight at 48C onto a PVDF membrane.
The membrane was rinsed with 5% nonfat dry milk dis-
solved in 13 TBS. It was then incubated in the primary
antibody, diluted in TBS/0.1% Tween (TBS-T) with 1%
milk overnight at 48C and then rinsed 3 3 10 min each
with PBS-T. The sample membrane was incubated in
alkaline phosphatase-conjugated secondary antibody,
diluted, and the protein detected using Bio-Rad immun-
Star chemiluminescence kit. Film exposed to the chemi-
luminescent signal was digitized using a light box and
Pixera digital camera connected to a PowerMacintosh.
The optical density of the images was calibrated using a
photographic calibration step tablet (Kodak) so that data
is collected in the linear range of the O.D. The relative
density of the labeled protein bands was determined
using densitometric measurements with the AIS image
analysis system. In all studies, once data from the anti-
gen of interest had been collected, the membrane was
stripped and labeled for total protein with India ink as a
loading control. The density of protein bands was
expressed as a percent of the density of protein bands
from P10 controls and corrected for total amounts of
protein.
1034 McFarland et al.
Developmental Neurobiology. DOI 10.1002/dneu

Statistical Analyses
Statistical comparisons between experimental and control
groups were made using two-way or one-way analysis of
variance (ANOVA) and post hoc comparisons were made
using Fisher’s PLSD (Statview 5.01).
RESULTS
nNOS Histochemistry in þ/LcPurkinje Cells
As an assay for NO production in the þ/Lc cerebel-
lum, the histochemical activity of formaldehyde-sta-
ble NADPH diaphorase (NADPH-d) was examined
in fixed, frozen sections of wild type and þ/Lc cere-
bella from P5 through P25. Formaldehyde-stable
NADPH-d histochemistry is considered a marker for
the presence of NOS (Matsumoto et al., 1993). No
differences were observed between wild type and
þ/Lc cerebella at P5 (data not shown), so we have
concentrated on analyzing older age groups. Images
of NADPH-d labeling at P10, P15, and P25 are
shown in Figure 1. Multiple sections from at least
three separate wild type and þ/Lc cerebella were
examined at each age. As has been reported previ-
ously (Bruning, 1993), NADPH-d staining is high
throughout the wild type cerebellar cortex at P10.
Both wild type and þ/Lc Purkinje cells at P10 show
high levels of staining throughout their cell bodies
and dendritic trees [Fig. 1(A,B)]. By P15, however,
NADPH-d staining has disappeared in wild type Pur-
kinje cells although labeling remains high in the gran-
ule cell and molecular layers [Fig. 1(C,E)]. White
arrows indicate NADPH-d labeled interneurons
(basket or stellate neurons) in the molecular layer of
wild type cerebella. In contrast, virtually all þ/LcPurkinje cells still stain for NADPH-d histochemical
activity at P15 [Fig. 1(D)] and many surviving Pur-
kinje cells are still labeled at P25 [Fig. 1(F)]. A single
labeled þ/Lc Purkinje cell is shown in Figure 1(D,F)
for P15 and P25, respectively. NADPH-d staining
remains especially high in the þ/Lc Purkinje cells
dendrites through P25. The difference in the pattern
of NADPH-d between wild type and þ/Lc Purkinje
cells is apparent in comparing Figure 1(C,E) with
(D,F) wherein the cell bodies and primary dendrites
of wild type Purkinje cells are clear with their out-
lines defined by NADPH-d staining in the surround-
ing molecular layer. In contrast, the cell bodies and
dendrites of þ/Lc Purkinje cells stand out against the
background because the NADPH-d staining is within
the cell.
Oxidative Stress in þ/Lc Purkinje Cells
To assay for evidence of oxidative stress in þ/Lc Pur-
kinje cells, we have examined the distribution of
nitrotyrosine immunolabeling in wild type and þ/Lccerebella at P10, P15, and P25. (Fig. 2; n > 3 for
each genotype at each age). The red immunolabeling
in Figure 2 shows the expression of Purkinje cell cal-
bindin, while the green staining represents immuno-
labeling for nitrotyrosine. In control experiments to
confirm the specificity of the antibody, the mouse
monoclonal antibody to nitrotyrosine was preab-
sorbed with either free nitrotyrosine or phosphotyro-
sine. No immunolabeling was observed in control þ/
Figure 1 Developmental progression of NADPH-d histo-
chemistry activity in the cerebellar cortex of a wild type
mouse (A, C, E) and þ/Lc mutant (B, D, F) at P10 (A, B),
P15 (C, D), and P25 (E, F). NADPH-d activity disappears
in wild type Purkinje cells before P15, but þ/Lc Purkinje
cell bodies and dendrites remain heavily stained through
P25. Purkinje cell bodies are indicated by black arrowheads
and dendrites by black arrows. The white arrows indicate
molecular layer interneurons heavily stained for NADPH-d
activity. Scale bar is 20 lm.
Lurcher Purkinje Cells 1035
Developmental Neurobiology. DOI 10.1002/dneu
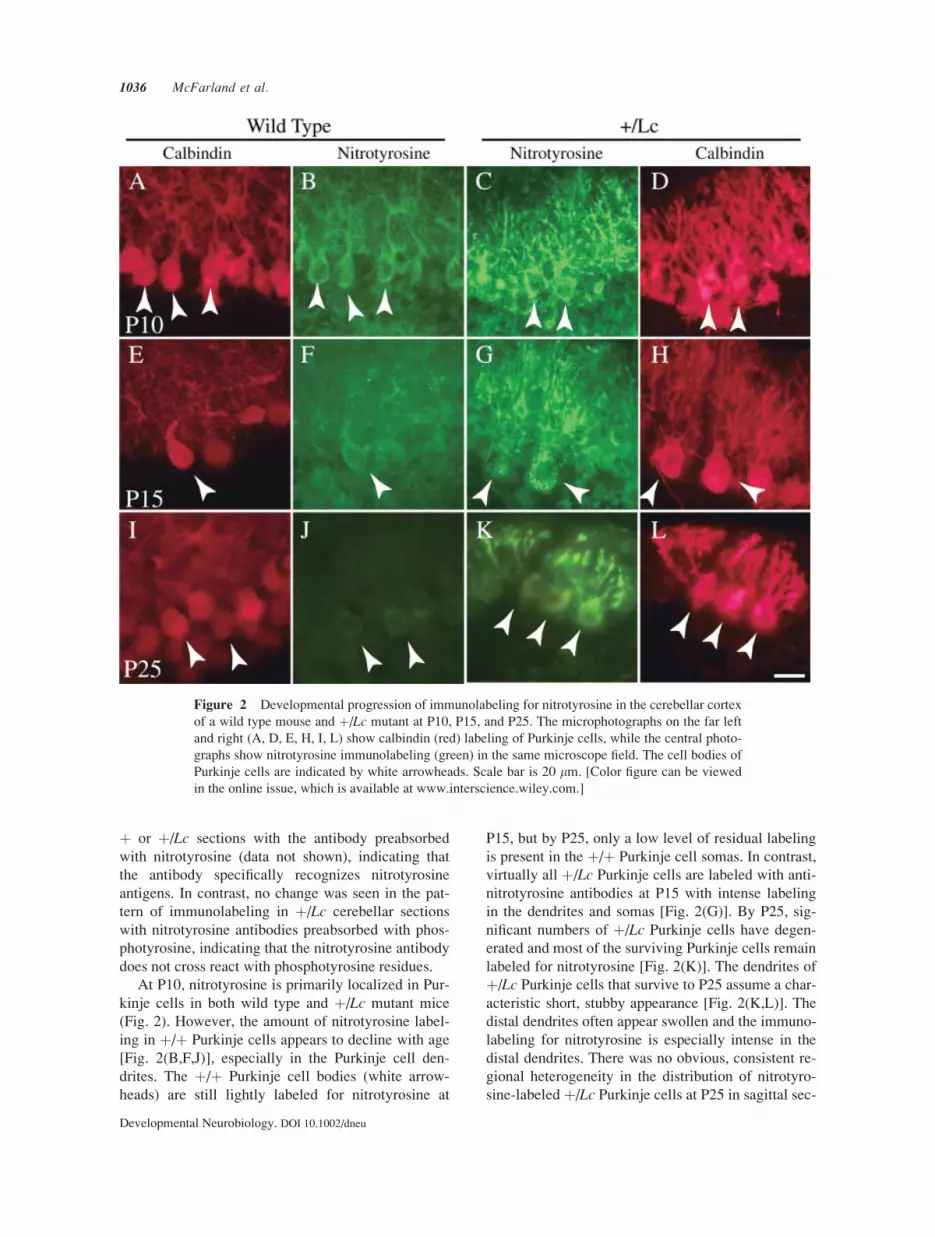
þ or þ/Lc sections with the antibody preabsorbed
with nitrotyrosine (data not shown), indicating that
the antibody specifically recognizes nitrotyrosine
antigens. In contrast, no change was seen in the pat-
tern of immunolabeling in þ/Lc cerebellar sections
with nitrotyrosine antibodies preabsorbed with phos-
photyrosine, indicating that the nitrotyrosine antibody
does not cross react with phosphotyrosine residues.
At P10, nitrotyrosine is primarily localized in Pur-
kinje cells in both wild type and þ/Lc mutant mice
(Fig. 2). However, the amount of nitrotyrosine label-
ing in þ/þ Purkinje cells appears to decline with age
[Fig. 2(B,F,J)], especially in the Purkinje cell den-
drites. The þ/þ Purkinje cell bodies (white arrow-
heads) are still lightly labeled for nitrotyrosine at
P15, but by P25, only a low level of residual labeling
is present in the þ/þ Purkinje cell somas. In contrast,
virtually all þ/Lc Purkinje cells are labeled with anti-
nitrotyrosine antibodies at P15 with intense labeling
in the dendrites and somas [Fig. 2(G)]. By P25, sig-
nificant numbers of þ/Lc Purkinje cells have degen-
erated and most of the surviving Purkinje cells remain
labeled for nitrotyrosine [Fig. 2(K)]. The dendrites of
þ/Lc Purkinje cells that survive to P25 assume a char-
acteristic short, stubby appearance [Fig. 2(K,L)]. The
distal dendrites often appear swollen and the immuno-
labeling for nitrotyrosine is especially intense in the
distal dendrites. There was no obvious, consistent re-
gional heterogeneity in the distribution of nitrotyro-
sine-labeled þ/Lc Purkinje cells at P25 in sagittal sec-
Figure 2 Developmental progression of immunolabeling for nitrotyrosine in the cerebellar cortex
of a wild type mouse and þ/Lc mutant at P10, P15, and P25. The microphotographs on the far left
and right (A, D, E, H, I, L) show calbindin (red) labeling of Purkinje cells, while the central photo-
graphs show nitrotyrosine immunolabeling (green) in the same microscope field. The cell bodies of
Purkinje cells are indicated by white arrowheads. Scale bar is 20 lm. [Color figure can be viewed
in the online issue, which is available at www.interscience.wiley.com.]
1036 McFarland et al.
Developmental Neurobiology. DOI 10.1002/dneu

tions. However, the medial to lateral distribution of
immunolabeled þ/Lc Purkinje cells was not exam-
ined in coronal sections so parasagittal patterns of þ/
Lc Purkinje cell degeneration may have been missed.
A second hallmark of the þ/Lc cerebellum is the
appearance of swellings on Purkinje cell axons in the
granule cell layer, white matter, and in the DCN. A
few of these axonal swellings are apparent by P7 to
P10 (see Dumesnil-Bousez and Sotelo, 1992; Wang
et al., 2006) and they are present in large numbers by
15. By 25, most of the swellings have disappeared,
presumably as many of the cell bodies and axons of
þ/Lc Purkinje cells have degenerated. Overlays of
confocal images of calbindin (red) and nitrotyrosine
(green) labeling in the Purkinje cell layer from a P15
wild type (A) and þ/Lc cerebella (B) are shown in
Figure 3. This figure illustrates that there is virtually
no nitrotyrosine immunolabeling in the dendritic trees
of wild type Purkinje cells, although there is a low
level of labeling in the cell bodies (white arrow-
heads). In contrast, the yellow dendritic and cell body
labeling (white arrowheads) in þ/Lc Purkinje cells
shows that there is spatial overlap between calbindin
in Purkinje cells and proteins that have been nitrated
by peroxynitrite. Many of the calbindin-positive
Figure 3 Confocal images of overlays of calbindin (red)
and nitrotyrosine (green) immunolabeling of wild type (A) and
þ/Lc Purkinje cells (B) at P15. The arrowheads indicate dou-
ble labeled (yellow) þ/Lc Purkinje cell bodies while the arrow
indicates a Purkinje cell axonal swelling that is colabeled for
nitrotyrosine.
Figure 4 Immunolabeling for calbindin and MnSOD in the cerebellar cortex of wild type con-
trols and þ/Lc mutants at P10, P15, and P25. The panels on the far left and right are merged images
of calbindin (red) and MnSOD (green) immunolabeling, while the central panes show the same
field with only MnSOD immunolabeling. The white arrowheads indicate Purkinje cell bodies. The
white arrows in D and L indicated calbindin positive axonal swellings. ML, molecular layer; GCL,
granule cell layer. Scale bar 20 lm.
Lurcher Purkinje Cells 1037
Developmental Neurobiology. DOI 10.1002/dneu

swellings on þ/Lc Purkinje cell axons are also la-
beled for nitrotyrosine [white arrow in Fig. 3(B)],
indicating that there is a source of reactive oxygen
species (ROS) and NO in the þ/Lc Purkinje cell axo-
nal swellings.
As an independent measure of oxidative stress
in þ/Lc Purkinje cells, we have examined the cellu-
lar distribution and expression levels of MnSOD
(Figs. 4–6). MnSOD is the principal scavenger of
superoxide in mitochondria (Fridovich, 1975) and is
induced by a variety of cytotoxic and proapoptotic
agents. The expression pattern of MnSOD is dramat-
ically altered in þ/Lc cerebella compared with the
wild type as shown by immunolabeling for MnSOD
in Figure 4. At P10, MnSOD immunolabeling in the
cerebellum is primarily found in Purkinje cells
(Fig. 4) and DCN neurons (data not shown). MnSOD
immunolabeling is distributed throughout the Pur-
kinje cell body (arrowheads) and dendrites in both
wild type and þ/Lc Purkinje cells [Fig. 4(A–D)].
The arrow in Figure 4(D) indicates one of the calbin-
din positive axonal swellings that start to appear in
the þ/Lc cerebellum by P10. By P15, punctate
immunolabeling for MnSOD is most apparent in the
cell bodies of wild type Purkinje cells while the
labeling in the molecular layer has become more dif-
fuse so it is no longer possible to resolve individual
Purkinje cell dendrites based on MnSOD immuno-
labeling [Fig. 4(E,F)]. In contrast, P15 þ/Lc Pur-
kinje cells retain the intense immunolabeling for
MnSOD throughout their cell bodies and dendrites
as shown by double labeling for calbindin (red) and
MnSOD [green; Fig. 4(G,H)]. There are many cal-
bindin positive axonal swellings in the white matter
and DCN and some are also double labeled for
MnSOD, indicating that the swellings contain mito-
chondria (data not shown). By P25, MnSOD immu-
nolabeling has become even more diffuse in the mo-
lecular layer of wild type cerebella, although punc-
tate labeling is still present in wild type Purkinje cell
bodies. Relatively few þ/Lc Purkinje cells survive
to P25 and there is a great deal of variability in the
appearance of their dendritic trees [Fig. 4(K,L)].
However, the dendrites and cell bodies of many of
the degenerating þ/Lc Purkinje cells are still
delineated by intense MnSOD immunolabeling.
There is relatively little labeling in the þ/Lc granule
cell layer through P25 compared to wild type cere-
bella. Immunolabeling for MnSOD is present in the
cell bodies of all DCN neurons through P25 in both
wild type and þ/Lc cerebella (Fig. 5). The intensity
of MnSOD immunolabeling within the DCN cell
bodies appears higher at P15 when compared with
P25, especially in the þ/Lc mutant cerebella.
Semi-quantitative comparisons of the intensity of
MnSOD immunolabeling between þ/þ and þ/LcPurkinje cells at P15 and P25 throughout lobules in
the cerebellar vermis showed that there is a signifi-
cant increase in the overall intensity of MnSOD label-
ing in the þ/Lc Purkinje cells [Fig. 6(A)]. Calbindin
labeling was used to identify þ/þ and þ/Lc Purkinje
cells in cerebellar sections double labeled for calbin-
din and MnSOD immunohistochemistry and the
colocalize function in Metamorph was used to mea-
sure the intensity of MnSOD immunolabeling in cal-
bindin labeled Purkinje cells. A two-way analysis of
variance showed that there was a significant genotype
effect (F1,13 ¼ 17.4, p < 0.002), but no significant
effect of age or age by genotype interaction (p > 0.5).
If the results are split by age, a one-way analysis of
variance showed that MnSOD immunolabeling in þ/
Lc Purkinje cells is significantly different from wild
type at both P15 and P25 (P15; F1,7 ¼ 16.3, p < 0.005;
P25; F1,6 ¼ 6.7, p < 0.05). Although the mean inten-
sities of MnSOD immunolabeling are similar in þ/LcPurkinje cells at P15 and P25, the variance is consi-
derably higher in the P25 Purkinje cells. There are con-
siderably fewer þ/Lc Purkinje cells by P25 and some
of these did not show any MnSOD immunolabeling.
A similar analysis of MnSOD immunolabeling
was performed among the DCN neurons, except that
MnSOD immunolabeling in calbindin labeled axons
Figure 5 Immunolabeling for MnSOD in the DCN of
wild type controls (A, C) and þ/Lc mutants (B, D) at P15
(A, B) and P25 (C, D). The white arrowheads indicate the
cell bodies of DCN neurons. Scale bar 20 lm. A color pho-
tomontage of double labeling for MnSOD and calbindin in
the DCN is shown in a supplementary figure.
1038 McFarland et al.
Developmental Neurobiology. DOI 10.1002/dneu

in the DCN were excluded from the measurements
[Fig. 6(B)]. A two-way analysis of variance showed
that there were significant effects for genotype (F1,9
¼ 13.8, p < 0.005), age (F1,9 ¼ 13.2, p < 0.01), and
age 3 genotype interactions (F1,9 ¼ 6.1, p < 0.05).
The intensity of MnSOD immunolabeling in the
DCN of þ/Lc mutants was significantly increased
when compared with controls at P15 (one-way
ANOVA, F1,7 ¼ 12.4, p < 0.02), but by P25 MnSOD
immunolabeling in the þ/Lc DCN had decreased
to control levels (one-way ANOVA, F1,4 ¼ 4.3,
p > 0.1).
Figure 6 Semi-quantitative analysis of MnSOD immunohistochemistry and protein expression
in wild type controls and þ/Lc mutants. (A, B) Graphs showing the percent change in the intensity
of MnSOD immunolabeling in þ/Lc Purkinje cells (A) and DCN neurons (B) when compared with
wild type levels. *P15; F1,7 ¼ 16.3, p < 0.005; #P25; F1,6 ¼ 6.7, p < 0.05; **P15; F1,7 ¼ 12.4, p <0.02 C) Western blots for MnSOD from wild type and þ/Lc mutants at P10, P15, and P25. A single
band at 24 kD was obtained as shown in the top panel in (C). The relative density of the bands was
compared to wild type values at P10 within each Western blot and the results are plotted in the
lower panel, after correcting for total protein levels (stained with India ink) in the transfer blot.
Lurcher Purkinje Cells 1039
Developmental Neurobiology. DOI 10.1002/dneu

The increased intensity of immunolabeling for
MnSOD in þ/Lc Purkinje cells from P10 through P25
is consistent with previous studies, suggesting that mi-
tochondrial activity or density is increased in þ/Lc Pur-
kinje cells, especially in the distal dendrites (Dumesnil-
Bousez and Sotelo, 1992; Vogel et al., 2001). To deter-
mine whether relative MnSOD protein levels are
affected by the þ/Lc mutation, MnSOD protein levels
from whole wild type and þ/Lc cerebella were ana-
lyzed by Western blots [Fig. 6(C); n ¼ 5 per each ge-
notype and age group]. The overall relative expression
levels of MnSOD protein increase with age with signif-
icant effects for both genotype and age (Genotype:
two-way ANOVA, F1,24 ¼ 5.0, p < 0.05; Age: F2,24 ¼5.4, p < 0.02), although the genotype by age interac-
tion is not significant (Genotype 3 Age ANOVA,
F2,24 ¼ 1.4, p > 0.1). If the analysis is split by age, the
relative MnSOD protein levels are not significantly dif-
ferent between wild type and þ/Lc cerebella at P10
and P15, although they approach statistical significance
by P25 (one-way ANOVA, F1,8 ¼ 5.3, p ¼ 0.051).
Role of nNOS in þ/Lc Purkinje Cell Death
The increased expression of markers for oxidative
stress and NO production in þ/Lc Purkinje cells sug-
gest that the production of peroxynitrites may be a
key step in the pathway for þ/Lc Purkinje cell degen-
eration. To test this hypothesis, we crossed þ/Lcmutants with a nNOS knockout mutant (nNOS�/�) to
reduce the production of NO (Huang et al., 1993).
The nNOS knockout mice have a targeted deletion of
the first translated exon, which includes the coding
region for the PDZ domain of the a nNOS isoform.
The deletion of this exon dramatically reduces NOS
activity in the cerebellum as shown in a previous
study (Huang et al., 1993) and by the lack of
NADPH-d staining of cerebellar sections from
GluRd2þ/þ:nNOS�/� mutants in this study (data not
shown). Counts of the number of surviving Purkinje
cells at P24 to P26 in control and GluRd2þ/Lc:
nNOS�/� double mutants showed that the loss of the
a-subunit of nNOS does not prevent the death of þ/
Lc Purkinje cells (Fig. 7). Estimates of Purkinje
cell numbers in wild type cerebella (GluRd2þ/þ:
nNOSþ/þ and GluRd2þ/þ:nNOS þ/�) and nNOS
knock-out mice (GluRd2þ/þ:nNOS�/�) were signifi-
cantly higher when compared with all þ/Lc mutants,
regardless of the nNOS genotype (GluRd2þ/Lc:
nNOSþ/þ, n ¼ 3, GluRd2þ/Lc:nNOSþ/�, n ¼ 4;
GluRd2þ/Lc:nNOS�/�, n ¼ 6; ANOVA, F3,14 ¼124.2, p < 0.0001). There was no significant differ-
ence between the number of þ/Lc Purkinje cells in
nNOS þ/þ or þ/� cerebella (GluRd2þ/Lc:nNOSþ/þ
and GluRd2þ/Lc:nNOSþ/�) and GluRd2þ/Lc:nNOS�/�
double mutants (Fisher’s PLSD, p > 0.1) and there
was also no significant difference between the num-
bers of Purkinje cells in wild type cerebella
(GluRd2þ/þ
:nNOSþ/þ and GluRd2þ/þ:nNOSþ/�) and
nNOS knock-out mice (GluRd2þ/þ:nNOS�/�, Fish-
er’s PLSD, p > 0.1).
The failure to rescue þ/Lc Purkinje cells by delet-
ing a nNOS expression does not necessarily rule out
a role for NO production in þ/Lc Purkinje cell death.
A subsequent examination of NADPH-d activity in
the cerebella of GluRd2þ/Lc:nNOS�/� double mutants
showed that the GluRd2þ/Lc:nNOS�/� Purkinje cells
are still stained for NADPH-d activity, suggesting
that there is persistent NOS activity in the degenerat-
ing neurons [Fig. 8(A,B)]. The rest of the brain in the
GluRd2þ/Lc:nNOS�/� double mutants showed very
little NADPH-d activity, confirming that most anNOS activity was deleted (data not shown). The
NADPH-d labeling appears more distinctly in the
GluRd2þ/Lc:nNOS�/� Purkinje cells at least in part
because there is virtually no background labeling of
granule cell parallel fibers and molecular layer inter-
neurons [see Fig. 8(D)]. The persistence of NADPH-
d staining in GluRd2þ/Lc:nNOS�/� Purkinje cells
with no labeling of surrounding cells supports our
Figure 7 Estimates of Purkinje cell number per hemicer-
ebellum in GluRd2þ/þ:nNOSþ/þ,þ/� (WT:WT), GluRd2þ/þ:
nNOS�/� (WT:NOS�/�), and GluRd2þ/Lc:nNOSþ/þ, þ/�controls (þ/Lc:NOS-WT) and GluRd2þ/Lc:nNOS�/� dou-
ble mutants (þ/Lc:NOS�/�) at P23 to P25.
1040 McFarland et al.
Developmental Neurobiology. DOI 10.1002/dneu

conclusion that the NADPH-d staining is within þ/LcPurkinje cells and does not represent staining on the
exterior surface of Purkinje cell membranes.
The continued expression of NO in GluRd2þ/Lc:
nNOS�/� Purkinje cells is also shown by the persist-
ence of nitrotyrosine immunolabeling in the double
mutant [Fig. 8(E)]. The pattern of nitrotyrosine label-
ing is noticeably altered in the double mutant with
less nitrotyrosine immunolabeling in the dendrites
and more in the cell body of the Purkinje cells [com-
pare Fig. 8(B), P25 GluRd2þ/Lc:nNOSþ/þ with Fig.
8(E), P25 GluRd2þ/Lc:nNOS�/�]. The mechanism of
cell death does not appear to be altered in GluRd2þ/Lc:
nNOS�/� mutants because occasional GluRd2þ/Lc:
nNOS�/� Purkinje cells (1–3 per section) are still
immunolabeled for activated caspase-3 as in þ/Lcmutants [Fig. 8(C,F)].
Formaldehyde stable-NADPH-d activity in
GluRd2þ/Lc:nNOS�/� Purkinje cells could be due to
inducible NOS (iNOS), endothelial NOS (eNOS), or
nNOS enzyme activity. Immunohistochemical stain-
ing for iNOS and eNOS showed no labeling of either
WT or þ/Lc Purkinje cells at any age or background
genotype so we focused on the possible expression of
other nNOS isoforms (data not shown). There are
three main isoforms of nNOS in the rodent, a, b, and
c. The most prevalent is the a isoform, which
accounts for *95% of the nNOS in the cerebellum
(Eliasson et al., 1997). The nNOS�/� knockout mu-
tant used in this study only deletes the a isoform,
leaving the b- and c-subunits (Eliasson et al., 1997).
In wild type mice, b isoforms make up *5% of the
nNOS expressed in the cerebellum and deletion of
the a isoform does not change the expression level of
the b form (Eliasson et al., 1997; Putzke et al., 2000).
However, we hypothesized that the deletion of the a-
subunit of nNOS fails to block þ/Lc Purkinje cell
death because other NOS enzymes are upregulated in
the absence of a nNOS. To test this hypothesis we la-
beled sections of GluRd2þ/þ:NOSþ/þ, GluRd2þ/þ:
NOS�/�, GluRd2þ/Lc:nNOSþ/þ, and GluRd2þ/Lc:
nNOS�/� cerebella with antibodies to the N- and C-
terminus of nNOS. The N-terminal antibody labels
only the a isoform while the C-terminus antibody
labels all three major isoforms, a, b, and c. Photomi-
crographs of nNOS immunolabeling of the þ/Lc cer-
Figure 8 NADPH-d histochemistry (P25; A, D), nitrotyrosine (P25; B, E), and activated cas-
pase-3 (P15; C, F) immunolabeling in GluRd2þ/Lc:nNOSþ/þ (A, B, C) and GluRd2þ/Lc:nNOS�/�
mutants (D, E, F). Arrowheads indicate Purkinje cell bodies, while arrows indicate labeled Purkinje
cell dendrites. Scale bar is 20 lm.
Lurcher Purkinje Cells 1041
Developmental Neurobiology. DOI 10.1002/dneu

ebella are shown in Figure 9. As expected, the N-
terminus antibody labels the molecular and granule
cell layer in the GluRd2þ/Lc:nNOSþ/þ cerebella
[Fig. 9(A)], but there is no labeling in the GluRd2þ/Lc:
nNOS�/� cerebella, indicating that the a isoform
has been deleted in the a nNOS knock-out mutant
[Fig. 9(C)]. A similar pattern of labeling was observed
in the GluRd2þ/þ:NOSþ/þ and GluRd2þ/þ:nNOS�/�
cerebella (N-terminal labeling in nNOSþ/þ cerebella
and no N-terminal labeling in nNOS�/� cerebella;
data not shown). In contrast, C-terminus immunolab-
eling shows distinct labeling of the þ/Lc Purkinje cell
body and, to a lesser extent, labeling of the dendrites
in both GluRd2þ/Lc:nNOSþ/þ and GluRd2þ/Lc:
nNOS�/� cerebella [Fig. 9(B,D)]. The C-terminus
labeling appears to be more broadly distributed
throughout the cytoplasm of the Purkinje cell soma in
GluRd2þ/Lc:nNOS�/� Purkinje cells [Fig. 9(D)],
which is consistent with the cytoplasmic distribution
of the b and c isoforms which lack the PDZ binding
domain that links a nNOS to the membrane. The qual-
itative intensity of C-terminus labeling appears simi-
lar in both GluRd2þ/Lc:nNOSþ/þ and GluRd2þ/Lc:
nNOS�/� Purkinje cells, suggesting that there is an
upregulation of the b and/or c isoforms in both
GluRd2þ/Lc:nNOSþ/þ and GluRd2þ/Lc:nNOS�/� Pur-
kinje cells.
DISCUSSION
There is evidence for oxidative stress in a number of
neurodegenerative diseases, but it is not always clear
whether the oxidative stress is a cause of neuronal
death or the result of the degenerative processes
(Klein and Ackerman, 2003; Andersen, 2004). The
altered expression of NADPH-d activity, and MnSOD
and nitrotyrosine immunolabeling in degenerating
þ/Lc Purkinje cells suggests that these neurons are
experiencing an increase in oxidative stress as a result
of their chronic depolarization. However, deletion of
a major neuronal source of NO in the CNS, the a-sub-
unit of nNOS, does not affect þ/Lc Purkinje cell sur-
vival. Although unexpected, this result does not rule
out a role for oxidative stress in þ/Lc Purkinje cell
death since there is evidence for an increase in alter-
native NOS activity that compensates for the missing
a nNOS subunit activity. These results highlight the
plasticity of cellular metabolic and cell death path-
ways in response to stress.
Previous studies of the cerebellum have shown
that NOS activity is transiently expressed during
early postnatal development in cerebellar Purkinje
cells, but it can also be induced in mature Purkinje
cells in response to trauma or injury (Bruning, 1993;
Chen and Aston-Jones, 1994; O’Hearn et al., 1995;
Saxon and Beitz, 1996; Ikeda et al., 1999). In this
study, we observed increased NADPH-d activity and
immunolabeling for isoforms of nNOS in þ/Lc Pur-
kinje cells after P10. The leak current mediated by
the GluRd2Lc receptor begins around P5-P6 (Selimi
et al., 2003), so we hypothesize that the sustained
NADPH-d activity and nNOS expression is a
response to the chronic depolarization of the þ/LcPurkinje cells. The NADPH-d activity is abolished in
cerebellar neurons in the a-nNOS knockout mutant,
indicating that virtually all of the NADPH-d activity
in cerebellar neurons is normally supplied by the a-
subunit of nNOS. In contrast, in the GluRd2þ/Lc:
nNOS�/� double mutant, NADPH-d labeling persists
in Purkinje cells, suggesting that cellular injury from
the chronic cation leak has induced alternate sources
of NOS activity. The induction of NOS in þ/Lc
Figure 9 Immunolabeling for N-terminal (A, C) and C-
terminal (B, D) nNOS in GluRd2þ/Lc:nNOSþ/þ (A, B) and
GluRd2þ/Lc:nNOS�/� Purkinje cells (C, D). Arrowheads
indicate Purkinje cell bodies, while arrows indicate labeled
Purkinje cell dendrites. The immunolabeling for the N-ter-
minal of nNOS is relatively indistinct when compared with
the NADPH-d histochemistry, possibly due to the relatively
poor binding qualities of many nNOS antibodies (see coers
et al., 1998). We have tried at least three different commer-
cially available antibodies to the N-terminal of nNOS and
obtained the best results with Zymed (1/250). No N-terminal
nNOS immunolabeling was observed in the GluRd2þ/Lc:
nNOS�/� cerebellar cortex (C), but C-terminal nNOS im-
munlabeling is observed in the Purkinje cells of the
GluRd2þ/Lc:nNOSþ/þ (B) and GluRd2þ/Lc:nNOS�/� (D)
mutants. Scale bar is 20 lm.
1042 McFarland et al.
Developmental Neurobiology. DOI 10.1002/dneu

Purkinje cells by chronic depolarization may be simi-
lar to the induction of NOS in adult Purkinje cells by
overstimulation of olivary fiber inputs with ibogaine
(O’Hearn and Molliver, 1993, 1997; O’Hearn et al.,
1995).
There are two main classes of NOS enzymes,
iNOS and constitutively expressed nNOS and eNOS
(Forstermann et al., 1998; Rodrigo et al., 2001). The
expression of iNOS is normally triggered in response
to cellular stress while n- and eNOS expression is
regulated by intracellular calcium levels (Rodrigo
et al., 2001). We have not detected the expression of
iNOS in þ/Lc Purkinje cells but we cannot rule out
the possibility that the antibodies we tried could not
detect iNOS expression in our tissue. Immunolabel-
ing did detect evidence of nNOS expression. Each of
the genes for nNOS has many isoforms based on dif-
ferential splicing of the N- and C-terminal regions
and they are often preferentially expressed in specific
tissues (Eliasson et al., 1997; Putzke et al., 2000).
The three principal isoforms, a, b, and c, are differen-
tiated by alternate splicing in the N-terminal domain.
The a isoform contains the PDZ domain that allows
for a nNOS binding to PSD-95 at synaptic mem-
branes (Brenmand et al., 1996). The b and c isoforms
lack the PDZ domain and are distributed in the cyto-
plasm, but they are only 80 and 1% as active as the aform, respectively (Eliasson et al., 1997; Putzke
et al., 2000). The immunolabeling of þ/Lc Purkinje
cells in the a nNOSþ/þ and �/� double mutants
with N-terminal and C-terminal nNOS antibodies
(see Fig. 9) suggests that while the a isoform is
deleted in the knock-out mutants, it has been replaced
by the upregulation of the b and/or c isoforms in þ/
Lc Purkinje cells. This hypothesis is supported by the
apparent change in the distribution of C-terminal
immunolabeling in the GluRd2þ/Lc:nNOSþ/þ Pur-
kinje cells to a more cytoplasmic localization in
GluRd2þ/Lc:nNOS�/� Purkinje cells.
The apparent changes in nNOS expression in þ/LcPurkinje cells are accompanied by increases in two
markers for oxidative stress, nitrotyrosine and
MnSOD. Nitrotyrosine immunolabeling indicates the
presence of both reactive oxygen (O2�) and NO, while
MnSOD is a major mitochondrial superoxide scav-
enger and its expression is induced by a variety of cy-
totoxic and proapoptotic agents (Fridovich, 1975).
The increased labeling for both is especially pro-
nounced in the distal dendrites of þ/Lc Purkinje cells,
where previous studies have noted an increase in the
density of mitochondria (Caddy and Biscoe, 1979;
Dumesnil-Bousez and Sotelo, 1992). Cytochrome ox-
idase histochemical labeling is also increased in þ/LcPurkinje cell dendrites, which suggests that mito-
chondrial activity is increased in the depolarized cells
(Vogel et al., 2001). The qualitative and semi-quanti-
tative analysis of MnSOD immunolabeling intensity
shows that the distribution of MnSOD is significantly
altered in þ/Lc Purkinje cells with more intense
labeling in the dendritic tree. The quantitative West-
ern blot data does not show a significant change in
overall MnSOD concentrations at P10 and P15 in þ/
Lc cerebella, although by P25 the difference between
mean MnSOD levels in the þ/Lc and wild type cere-
bella approaches statistical significance. However,
specific increases in MnSOD protein levels in þ/LcPurkinje cells may be obscured by the overall varia-
tion in MnSOD levels in the whole cerebellum.
Taken together, the immunolabeling and Western
blot data suggests that, at the very least, there is a sig-
nificant redistribution of MnSOD in þ/Lc Purkinje
cells. In particular, there is an increase in dendritic
localization of MnSOD and it is likely that overall
MnSOD protein levels are increasing in þ/Lc Pur-
kinje cells through the period of þ/Lc Purkinje cell
death. The continued rise in MnSOD levels through
P25 þ/Lc cerebella is striking considering that many
Purkinje cells and granule cells have died by P25.
The analysis of MnSOD immunolabeling in the DCN
suggests that the continued rise in MnSOD protein
levels in þ/Lc cerebella cannot be attributed to
increases in MnSOD protein expression in þ/Lc DCN
neurons since the levels of MnSOD immunolabeling
decrease to wild type levels by P25 in the þ/Lccerebella.
The increase in the density of mitochondria and
the expression of markers for oxidative stress in þ/LcPurkinje cell dendrites suggests a cell death pathway
linked to energy metabolism. It seems likely that mi-
tochondrial oxidative respiration is increased in
response to the greater demand for ATP in depolar-
ized þ/Lc Purkinje cells. The chronic cation leak cur-
rent mediated by the GluRd2Lc channel will increase
not only intracellular Naþ levels, but may also
increase intracellular Ca2þ levels by activating volt-
age-gated Ca2þ channels (VGCCs) (Mouginot et al.,
1997). The increased Naþ and Ca2þ load will increase
metabolic demands for ATP as the þ/Lc Purkinje cells
try to maintain their membrane potential and intracel-
lular Naþ and Ca2þ levels. ATP is required for the ion
pumps that restore intracellular Naþ and Ca2þ levels;
about 50% of CNS ATP is used for the outward trans-
port of Naþ by Naþ/Kþ-ATPase (Ames, 1997). There
are metabolic costs associated with increased mito-
chondrial respiratory activity. Approximately 1–2%
of the oxygen not consumed by mitochondrial cyto-
chrome c oxidase is reduced to O2� and H2O2 at mito-
chondrial and extra-mitochondrial sites (Radi et al.,
Lurcher Purkinje Cells 1043
Developmental Neurobiology. DOI 10.1002/dneu

1997). Therefore, any increases in cellular respiration
rates may increase ROS production as a by-product.
Increased Ca2þ levels and ROS production may stim-
ulate the production of NO by nNOS, leading to the
formation of peroxynitrite (ONOO�; Beckman and
Crow, 1993; Kamii et al., 1996; Keller et al., 1998;
Bredt, 1999). Peroxynitrite will oxidize thiol groups,
nitrate tyrosines, or nitrosylate cysteines in both struc-
tural proteins and enzymes. It was originally thought
that peroxynitrite would indiscriminately react with
any available protein or lipid substrates, but there is
evidence that it may specifically nitrate or nitrosylate
specific signaling proteins, with the effect of either
aberrantly activating or deactivating the proteins
(Klotz et al., 2002). In particular, the reaction of per-
oxynitrite with select target proteins may trigger cell
death pathways by activating key pathways that pro-
mote cell death (e.g. stress activated MAP kinase
pathways) or by inactivating pathways that inhibit cell
death (e.g. PI/AKT; Minetti et al., 2002; Monteiro,
2002).
A number of cell death pathways have been impli-
cated in the death of þ/Lc Purkinje cells. The discov-
ery that Beclin 1 is constitutively activated by the
GluRd2Lc channel has led to the suggestion that
excess autophagy plays a role in þ/Lc Purkinje cell
death (Yue et al., 2002). While there is clear evidence
for the induction of autophagosomes in the swellings
of þ/Lc Purkinje cell axons, the incidence of auto-
phagosomes was much less within the cell bodies and
dendrites of þ/Lc Purkinje cells (Wang et al., 2006).
The results of this study show that þ/Lc Purkinje
cells express signs of oxidative stress that may trigger
apoptotic cell death pathways. It is likely that there
are a variety of cellular mechanisms that contribute to
þ/Lc Purkinje cell death with oxidative stress as one
contributing factor. Autophagy may be induced in
þ/Lc Purkinje cells, not only by the failure of
GluRd2Lc channels to sequester Beclin 1, but also as
a cellular response to metabolic stress, including
decreasing ATP levels as þ/Lc Purkinje cells mature
with a chronic overload of Naþ and Ca2þ ions. This
raises the possibility that if the induction of limited
autophagy cannot rescue the þ/Lc Purkinje cells from
death, autophagy regulatory mechanisms may also
activate or enhance apoptotic pathways (Furuya
et al., 2005). The excessive stimulation of autophagy
alone may induce Purkinje cell death as suggested by
the dissociation between the leak current and Purkinje
cell death in Lurcher/hotfoot (Lc/ho) double mutants
(Selimi et al., 2003). Nevertheless, the conditions
for cell death in the Lc/ho mutant do not rule out a
role for oxidative stress and apoptosis in the þ/Lcmutant.
We thank Drs. Ann Lohof and Hadi Zanjani for their
helpful comments on the manuscript.
REFERENCES
Ames A. 1997. Energy requirements of brain function: When
is energy limiting? In: Beal MF, Howell N, Bodis-Wollner
I, editors. Mitochondria and Free Radicals in Neurodege-
nerative Diseases. New York: Wiley, pp 17–27.
Andersen JK. 2004. Oxidative stress in neurodegeneration:
Cause or consequence? Nat Med 10:S18–S25.
Araki K, Meguro H, Kushiya E, Takayama C, Inoue Y,
Mishina M. 1993. Selective expression of the glutamate
receptor channel d2 subunit in cerebellar Purkinje cells.
Biochem Biophys Res Commun 197:1267–1276.
Beckman JS, Crow JP. 1993. Pathological implications of
nitric oxide, superoxide and peroxynitrite formation. Bio-
chem Soc Trans 21:330–334.
Bredt DS. 1999. Endogenous nitric oxide synthesis: Biolog-
ical functions and pathophysiology. Free Radic Res
31:577–596.
Brenmand J, Daniel S, Gee S, McGeee A, Craven S, Santil-
lano D, Wu Z, et al. 1996. Interaction of nitric oxide syn-
thase with the postsynaptic density protein PSD-95 and
a1-Syntrophin mediated by PDZ domains. Cell 84:757–
767.
Bruning G. 1993. NADPH-diaphorase histochemistry in
the postnatal mouse cerebellum suggests specific develop-
mental functions for nitric oxide. J Neurosci Res 36:580–
587.
Caddy KW, Biscoe TJ. 1979. Structural and quantitative
studies on the normal C3H and Lurcher mutant mouse.
Philos Trans R Soc Lond B Biol Sci 287:167–201.
Chen S, Aston-Jones G. 1994. Cerebellar injury induces
NADPH diaphorase in Purkinje and inferior olivary neu-
rons in the rat. Exp Neurol 126:270–276.
Cheng SSW, Heintz N. 1997. Massive loss of mid-
and hindbrain neurons during embryonic development
of homozygous Lurcher mice. J Neurosci 17:2400–
2407.
Coers W, Timens W, Kempinga C, Klok PA, Han Moshage
H. 1998. Specificity of antibodies to nitric oxide synthase
isoforms in human, guinea pig, rat, and mouse tissues.
J Histochem Cytochem 46:1385–1391.
Dumesnil-Bousez N, Sotelo C. 1992. Early development
of the Lurcher cerebellum: Purkinje cell alterations and
impairment of synaptogenesis. J Neurocytol 21:506–
529.
Eliasson MJ, Blackshaw S, Schell MJ, Snyder SH. 1997.
Neuronal nitric oxide synthase alternatively spliced
forms: Prominent functional localizations in the brain.
Proc Natl Acad Sci USA 94:3396–3401.
Fan H, Favero M, Vogel MW. 2001. Elimination of Bax
expression in mice increases cerebellar Purkinje cell
numbers but not the number of granule cells. J Comp
Neurol 436:82–91.
1044 McFarland et al.
Developmental Neurobiology. DOI 10.1002/dneu

Forstermann U, Boissel JP, Kleinert H. 1998. Expres-
sional control of the ‘constitutive’ isoforms of nitric
oxide synthase (NOS I and NOS III). FASEB J 12:773–
790.
Fridovich I. 1975. Superoxide dismutases. Annu Rev Bio-
chem 44:147–159.
Furuya D, Tsuji N, Yagihashi A, Watanabe N. 2005. Beclin
1 augmented cis-diamminedichloroplatinum induced ap-
optosis via enhancing caspase-9 activity. Exp Cell Res
307:26–40. Epub 2005 Mar 2031.
Huang PL, Dawson TM, Bredt DS, Snyder SH, Fishman
MC. 1993. Targeted disruption of the neuronal nitric ox-
ide synthase gene. Cell 75:1273–1286.
Ikeda M, Komachi H, Sato I, Himi T, Yuasa T, Murota S.
1999. Induction of neuronal nitric oxide synthase by
methylmercury in the cerebellum. J Neurosci Res 55:
352–356.
Kamii H, Mikawa S, Murakami K, Kinouchi H, Yoshimoto
T, Reola L, Carlson E, et al. 1996. Effects of nitric oxide
synthase inhibition on brain infarction in SOD-1-trans-
genic mice following transient focal cerebral ischemia.
J Cereb Blood Flow Metab 16:1153–1157.
Keller JN, Kindy MS, Holtsberg FW, St. Clair DK, Yen
H-C, Germeyer A, Steiner SM, et al. 1998. Mitochon-
drial manganese superoxide dismutase prevents neural
apoptosis and reduces ischemic brain injury: Suppres-
sion of peroxynitrite production, lipib peroxidation,
and mitochondrial dysfunction. J Neurosci 18:687–
697.
Klein JA, Ackerman SL. 2003. Oxidative stress, cell cycle,
and neurodegeneration. J Clin Invest 111:785–793.
Klotz LO, Schroeder P, Sies H. 2002. Peroxynitrite sig-
naling: Receptor tyrosine kinases and activation of
stress-responsive pathways. Free Radic Biol Med
33:737–743.
Landsend AS, Amiry-Moghaddam M, Matsubara A, Ber-
gersen L, Usami S, Wenthold RJ, Ottersen O. 1997.
Differential localization of d glutamate receptors in
the rat cerebelum: Coexpression with AMPA recep-
tors in parallel fiber-spine synapses and absence from
climbing fiber-spine synapses. J Neurosci 15:834–
842.
Lomeli H, Sprengel R, Lauris DJ, Kohr G, Herb A, Seeburg
PH, Wisden W. 1993. The rat d-1 and d-2 subunits
extend the excitatory amino acid receptor family. FEBS
Lett 315:318–322.
Lu W, Tsirka SE. 2002. Partial rescue of neural apoptosis
in the Lurcher mutant mouse through elimination of tis-
sue plasminogen activator. Development 129:2043–
2050.
Matsumoto T, Nakane M, Pollock JS, Kuk JE, Forstermann
U. 1993. A correlation between soluble brain nitric oxide
synthase and NADPH-diaphorase activity in only seen
after exposure of the tissue to fixative. Neurosci Lett
155:61–64.
Minetti M, Mallozzi C, Di Stasi AM. 2002. Peroxynitrite
activates kinases of the src family and upregulates tyro-
sine phosphorylation signaling. Free Radic Biol Med
33:744–754.
Monteiro HP. 2002. Signal transduction by protein tyrosine
nitration: Competition or cooperation with tyrosine phos-
phorylation-dependent signaling events? Free Radic Biol
Med 33:765–773.
Mouginot D, Bossu JL, Gahwiler BH. 1997. Low-thresh-
old Ca2þ currents in dendritic recordings from Purkinje
cells in rat cerebellar slice cultures. J Neurosci 17:160–
170.
Norman D, Feng L, Gubbay J, Chan E, Heintz N.
1995. The Lurcher gene induces apoptotic death in
cerebellar Purkinje cells. Development 121:1183–
1184.
O’Hearn E, Molliver ME. 1993. Degeneration of Purkinje
cells in parasagittal zones of the cerebellar vermis after
treatment with ibogaine or harmaline. Neuroscience
55:303–310.
O’Hearn E, Molliver ME. 1997. The olivocerebellar projec-
tion mediates ibogaine-induced degeneration of Purkinje
cells—A model of indirect, trans-synaptic excitotoxicity.
J Neurosci 17:8828–8841.
O’Hearn E, Zhang P, Molliver ME. 1995. Excitotoxic
insult due to ibogaine leads to delayed induction of
neuronal NOS in Purkinje cells. Neuroreport 6:1611–
1616.
Phillips RJS. 1960. \Lurcher," a new gene in linkage group
XI of the house mouse. J Genet 57:35–42.
Putzke J, Seidel B, Huang PL, Wolf G. 2000. Differential
expression of alternatively spliced isoforms of neuronal
nitric oxide synthase (nNOS) and N-methyl-D-aspartate
receptors (NMDAR) in knockout mice deficient in nNOS
a (nNOS a(d/d) mice). Brain Res Mol Brain Res 85:13–
23.
Radi R, Castro L, Rodriguez M, Cassina A, Thomson L.
1997. Free radical damage to mitochondria. In: Beal MF,
Howell N, Bodis-Wollner I, editors. Mitochondria and
Free Radicals in Neurodegenerative Diseases. New
York: Wiley, pp 57–89.
Rodrigo J, Alonso D, Fernandez AP, Serrano J, Richart A,
Lopez JC, Santacana M, et al. 2001. Neuronal and induc-
ible nitric oxide synthase expression and protein nitration
in rat cerebellum after oxygen and glucose deprivation.
Brain Res 909:20–45.
Saxon DW, Beitz AJ. 1996. An experimental model for the
non-invasive trans-synaptic induction of nitric oxide syn-
thase in Purkinje cells of the rat cerebellum. Neuro-
science 72:157–165.
Selimi F, Doughty M, Delhaye-Bouchaud N, Mariani J.
2000. Target-related and intrinsic neuronal death in
Lurcher mutant mice are both mediated by caspase-3
activation. J Neurosci 20:992–1000.
Selimi F, Lohof AM, Heitz S, Lalouette A, Jarvis CI, Bailly
Y, Mariani J. 2003. Lurcher GRID2-induced death and
depolarization can be dissociated in cerebellar Purkinje
cells. Neuron 37:813–819.
Takayama C, Nakagawa S, Watanabe M, Mishina M, Inoue
Y. 1996. Developmental changes in expression and dis-
tribution of the glutamate receptor channel d2 subunit
according to the Purkinje cell maturation. Brain Res Dev
Brain Res 92:147–155.
Lurcher Purkinje Cells 1045
Developmental Neurobiology. DOI 10.1002/dneu

Vogel MW, Fan H, Sydnor J, Guidetti P. 2001. Cytochrome
oxidase activity is increased in þ/Lc Purkinje cells des-
tined to die. Neuroreport 12:3039–3043.
Wang QJ, Ding Y, Kohtz DS, Mizushima N, Cristea IM, Rout
MP, Chait BT, et al. 2006. Induction of autophagy in axonal
dystrophy and degeneration. J Neurosci 26:8057–8068.
West MJ. 1999. Stereological methods for estimating the
total number of neurons and synapses: Issues of precision
and bias. Trends Neurosci 22:51–61.
Wullner U, Loschmann P-A, Weller M, Klockgether T.
1995. Apoptotic cell death in the cerebellum of
mutant weaver and lurcher mice. Neurocsi Lett 200:109–
112.
Yue Z, Horton A, Bravin M, DeJager PL, Selimi F,
Heintz N. 2002. A novel protein complex linking the
d 2 glutamate receptor and autophagy: Implications
for neurodegeneration in Lurcher mice. Neuron
35:921–933.
Zuo J, De Jager PL, Takahashi KA, Jiang W, Linden DJ,
Heintz N. 1997. Neurodegeneration in Lurcher mice
caused by mutation in d2 glutamate receptor. Nature
388:769–773.
1046 McFarland et al.
Developmental Neurobiology. DOI 10.1002/dneu