
Structural study of Purkinje cell axonal torpedoes in essential tremor
Upload
independentCategory
view
0download
0
Intraocular lens alignment from an en face opticalcoherence tomography image Purkinje-like method
Mengchan SunAlberto de CastroSergio OrtizPablo Perez-MerinoJudith BirkenfeldSusana MarcosInstituto de Óptica “Daza de Valdés”Consejo Superior de Investigaciones CientíficasSerrano 12128006 Madrid, SpainE-mail: [email protected]
Abstract. Measurement of intraocular lens (IOL) alignment implanted inpatients in cataract surgery is important to understand their optical perfor-mance. We present a method to estimate tilt and decentration of IOLsbased on optical coherence tomography (OCT) images. En face OCTimages show Purkinje-like images that correspond to the specular reflec-tions from the corneal and IOL surfaces. Unlike in standard Purkinje-imaging, the tomographic nature of OCT allows unequivocal associationof the reflection with the corresponding surface. The locations of thePurkinje-like images are linear combinations of IOL tilt, IOL decentration,and eye rotation. The weighting coefficients depend on the individualanterior segment geometry, obtained from the same OCT datasets.The methodology was demonstrated on an artificial model eye withset amounts of lens tilt and decentration and five pseudophakic eyes.Measured tilt and decentration in the artificial eye differed by 3.7% and0.9%, respectively, from nominal values. In patients, average IOL tilt anddecentration from Purkinje were 3.30� 4.68 deg and 0.16� 0.16 mm,respectively, and differed on average by 0.5 deg and 0.09 mm, respec-tively, from direct measurements on distortion-corrected OCT images.Purkinje-based methodology from anterior segment en face OCT imagingprovided, therefore, reliable measurements of IOL tilt and decentration.© The Authors. Published by SPIE under a Creative Commons Attribution 3.0 UnportedLicense. Distribution or reproduction of this work in whole or in part requires full attributionof the original publication, including its DOI. [DOI: 10.1117/1.OE.53.6.061704]
Subject terms: Purkinje; optical coherence tomography; intraocular lens; alignment.
Paper 131481SS received Sep. 25, 2013; revised manuscript received Nov. 4,2013; accepted for publication Nov. 11, 2013; published online Jan. 10, 2014.
1 IntroductionCataract is one of the major causes of vision loss in the agingpopulation. The common treatment for cataract is thereplacement of the natural lens by an intraocular lens(IOL). IOLs are implanted in the capsular bag, followingphacoemulsification and aspiration of the crystalline lensmaterial. In an intracapsular procedure, the IOL is insertedin the capsular bag through a circular window in the anteriorcapsule (capsulorhexis), with the lens haptics pressingagainst the equatorial region of the capsular bag. The stabil-ity of the IOL in the capsular bag depends on the materialand design of the haptics. With state-of-the art monofocalIOLs, IOL tilt and decentration are generally of similaramounts of those of the natural crystalline lens.1
Although originally the main goal of a cataract treatmentwas to eliminate scattering, IOLs have evolved enormously,first to additionally correct for refractive errors, but morerecently, to compensate for high order aberrations (HOA),particularly spherical aberration. Also, new IOL designsaim at correcting presbyopia, either by expanding thedepth-of-focus of the eye (multifocal IOLs—M-IOLs) orby dynamic changes of refractive power (accommodatingIOLs—A-IOLs). With the increased sophistication of IOLdesigns, the impact of the IOL position becomes morecritical. The aimed correction of corneal HOA by asphericIOLs may be compromised by the induction of other HOAby a tilted/decentered lens.2 The performance of refractiveM-IOLs (generally with concentric or segmented near/farregions) is critically affected by potential misalignments of
the IOL.3 Finally, tilts and decentrations occurring with theonly U.S. Food and Drug Administration (FDA)-approvedA-IOL may also play a role in its function.4 Measurementof tilt and decentration of IOLs in pseudophakic eyes istherefore important as an endpoint for treatment, particularlywith premium IOLs. On the other hand, in combination withbiometrical and anatomical ocular data, knowledge of IOLand eye alignment is important in the development of cus-tomized computer eye models, which give insights intothe relative contribution of different factors to optical per-formance with IOLs (Refs. 5 and 6). Several methodshave been presented to measure IOL tilt and decentration.Purkinje imaging relies on the acquisition of pupillaryimages containing the image formed by the reflexes of theanterior cornea and anterior and posterior lens (Purkinjeimages I, III, and IV). The relative positions of PI, PIII,and PIV with respect to the pupil center are proportionalto the eye rotation, IOL tilt, and IOL decentration.7,8
Purkinje imaging has been used successfully for lens phak-ometry,6,9–11 and for measurements of tilt and decentrationof the natural lens,12,13 and IOLs (Refs. 1 and 14–16).The device is simple and the measurement typically robust,although it may be subject to some limitations: difficultiesin the association of the images to the corresponding reflect-ing surfaces [some authors have solved this by projectinga semicircular ring of light-emitting diodes (LEDs) yieldingrelative inverted images for PI and PIV (Ref. 17)]; overlap-ping of the different Purkinje images (usually overcome byeccentric illumination and image acquisitions at different
Optical Engineering 061704-1 June 2014/Vol. 53(6)
Optical Engineering 53(6), 061704 (June 2014)
Downloaded From: http://opticalengineering.spiedigitallibrary.org/ on 01/17/2014 Terms of Use: http://spiedl.org/terms

eccentric fixations);9 and requirement of ocular geometricaland biometrical information (normally obtained from theother instruments).
Scheimpflug imaging has also been used to estimate tiltand decentration of IOLs, by the analysis of the orientationand shift of the lens in cross-sectional images of anteriorsegment of the eye.1,18 The three-dimensional (3-D) tiltand decentration can be obtained from sinusoidal fittingof the two-dimensional (2-D) coordinates. Although themethod is direct (i.e., relies on the direct viewing of thelens), it is subject to several limitations: refraction distor-tion of the lens images and relatively sparse meridionalsampling. IOL tilt and (to a lesser extent) decentrationfrom this technique were in good agreement withPurkinje-based measurements.1 The accuracy and precisionof the Scheimpflug data were tested in measurements in anartificial eye, with a discrepancy from nominal values of0.24 deg, on average, for tilt (0.28 deg for Purkinje-based tilt), and 0.23 mm, on average, for decentration(0.01 mm for Purkinje-based decentration).
Spectral OCT (sOCT) has been recently demonstrated asa quantitative 3-D full anterior segment biometer.19 Afterquantitative image analysis (including fan and optical distor-tion corrections), OCT provides accurate anterior andposterior corneal topography and pachymetry,20,21 anteriorand posterior lens topography,22 pupilometry, and anteriorchamber depth.19 In addition, the direct view of the lensalso allowed estimates of tilt and decentration.4,19,23,24
In this study, we developed Purkinje-based methodologyfrom the anterior segment en face OCT images. The technol-ogy resembles the Purkinje method, since three spots areobserved in the en face OCT images. These spots are origi-nated from the reflections of light in the anterior surface ofthe cornea and anterior and posterior surfaces of the lens,although, in contrast to the standard Purkinje method, thespots are not formed by the entire area of the ocular surfaces.Instead, the OCT system collects the scattered light reflectedback from the tissue, and when the reflected ray directioncoincides with the OCT axis, a strong specular reflectionis captured in the test arm of the OCT, producing a brightspot in the en face OCT images. Unlike in the standardPurkinje method, which relies on the images in a singleplane of focus, the tomographic information of the OCTimages allows one to relate each reflection with the corre-sponding surface, as well as to avoid image overlapping.The Purkinje image analysis (estimation of coefficients ina set of linear equations) requires assumption of an eyemodel. The assumption of a general computer eye modelresults in a decrease in the accuracy of the tilt and decentra-tion estimates in Ref. 9. Instead, individual anatomical andbiometrical parameters are used, generally obtained fromcorneal topography or keratometry, optical biometry, andPurkinje phakometry. These parameters can be retrievedfrom the same OCT dataset.19,25
In this study, we demonstrate the measurement of IOL tiltand decentration from OCT images, which used a Purkinje-based analysis. The method was validated on an artificialmodel eye (with set values of lens tilt and decentration)and tested in five pseudophakic eyes with implanted A-IOLs (where the en face OCT Purkinje-based estimates ofIOL tilt and decentration were compared to direct estimatesfrom distortion-corrected 3-D OCT images).
2 Materials and Methods
2.1 Laboratory-Based Spectral Optical CoherenceTomography (sOCT) System
The sOCT system is based on a fiber-optics Michelson inter-ferometer configuration with a superluminescent diode SLD(λ0 ¼ 840 nm, Δλ ¼ 50 nm; Superlum, Ireland) as a lightsource and a spectrometer consisting of a volume diffractiongrating and a 12-bit line-scan CMOS camera with 4096pixels (Basler sprint spL4096-140k; Basler AG, Germany)as a detector. The sOCT system used in the measurementshas been described in detail in previous publications.26
The acquisition rate was set to 25; 000 A-Scans∕s, resultingin a typical 3-D dataset acquisition time of 0.72 s. Thehorizontal and vertical scanning is produced by galva-nometer optical scanners (Cambridge Technology Inc.,Bedford, Massachusetts), driven by an analog input/outputcard (National Instruments, Austin, Texas). The axialrange of the instrument is 7 mm in depth, resulting ina theoretical pixel resolution of 3.4 μm. The axial resolutionpredicted by the coherence length of the superluminescentdiode laser source is 6.4 μm. The lateral sampling resolutionranged between 0.04 and 0.2 mm. Custom-algorithmscorrect the OCT data from fan distortion (arising fromthe scanning architecture) and optical distortion (due tothe refraction in the optical surfaces).20 Dedicated imageprocessing routines allow the segmentation of the opticalsurfaces and quantification of their geometry.20–22,25
2.2 Artificial Eye
A water-cell model with a PMMA contact lens simulatinga spherical cornea (7.80 mm and 6.48 mm anterior and pos-terior radii of curvature, respectively, and 0.5 mm centralthickness) and an IOL (aspheric biconvex IOL) mountedon a XYZ micrometer stage and rotational stage was used fortesting. The water-cell eye model is similar to that reportedin previous work,1,19 except for the IOL. In this work, weused in the artificial eye the same A-IOL type (CrystalensAO 23.5 D) that was implanted in the patients under test.
The geometry of the A-IOL was characterized using amicroscopy-based noncontact optical profilometry(Sensofar, PLu2300, Barcelona, Spain) with 0.1-μm nominalprecision in vertical measurements.27 Both anterior andposterior surface topographies of the lens were measuredin a 5.5 × 5.5 mm range (50 × 50 points equispaced by0.11 mm). The profiles were fitted with conics using customroutines written in MATLAB (Mathworks, USA). Potentialtilts of the mounted IOL in the profilometric measurementswere considered and removed.27 The measurements wererepeated five times and the mean values are shown in Table 1.
The refractive index of the cornea at the OCTwavelengthwas calculated by dividing the central optical path lengthobtained from the OCT images by the nominal geometricalcentral thickness (n ¼ 1.486, group refractive index at840 nm). The thickness of the IOL (Crystalens AO 23.5 D)was measured using the profilometry system, and its refrac-tive index was also calculated from the OCT images (n ¼1.427, group refractive index at 840 nm). Measurementswere obtained for the artificial eye with the lens in air(i.e., cell not filled in with water) and in water. The IOLwas tilted inside the water-cell eye from −5 to 5 deg in
Optical Engineering 061704-2 June 2014/Vol. 53(6)
Sun et al.: Intraocular lens alignment from an en face optical coherence tomography. . .
Downloaded From: http://opticalengineering.spiedigitallibrary.org/ on 01/17/2014 Terms of Use: http://spiedl.org/terms
1-deg steps and decentered from −1.9 to 1.9 mm in 0.6-mm steps.
2.3 Patients
Images were collected in five eyes of four patients (74� 2.3years old) 90 days after the IOL implantation (CrystalensA-IOL, Bausch and Lomb, Rochester, New York).Biometrical data on these patients have been previouslyreported as part of a larger study aiming at characterizingthe performance of these IOLs (Ref. 4). Onlypatientsimplanted with 23.5-D power IOLs were selected (as thisIOL was available for in vitro measurements). This studywas approved by the Institutional Review Boards andfollowed the tenets of the Declaration of Helsinki. Clinicalophthalmological examination and surgery were performedat the Fundación Jiménez-Díaz Hospital (Madrid, Spain).
Measurements in postoperative patients were performedunder mydriasis (phenylephrine 10%). The subjects werestabilized using a bite bar and aligned with the OCT axiscentered at the specular corneal reflection while the patientfixated on a reference E-letter target projected on a minidis-play at optical infinity. A total of six sets of postoperative(three repeated images for the cornea and IOL, respectively)measurements were obtained. All 3-D sets of data containedthe iris volume, which was used as the reference for mergingthe images. In order to minimize the impact of motionartifacts, the image acquisition time to complete the wholemeasurement was set to 0.72 s. The SLD power exposurewas fixed at 800 μWand focus was changed by an automaticdisplacement system to achieve optimal imaging of the
different anterior segment structures (cornea and IOL).Measurements were collected on a 7 × 15 mm zone, using50 B-Scans composed of a collection of 360 A-Scans, pro-viding a sampling resolution of 0.04 mm for horizontal and0.2 mm for vertical meridians.
2.4 OCT Image Processing
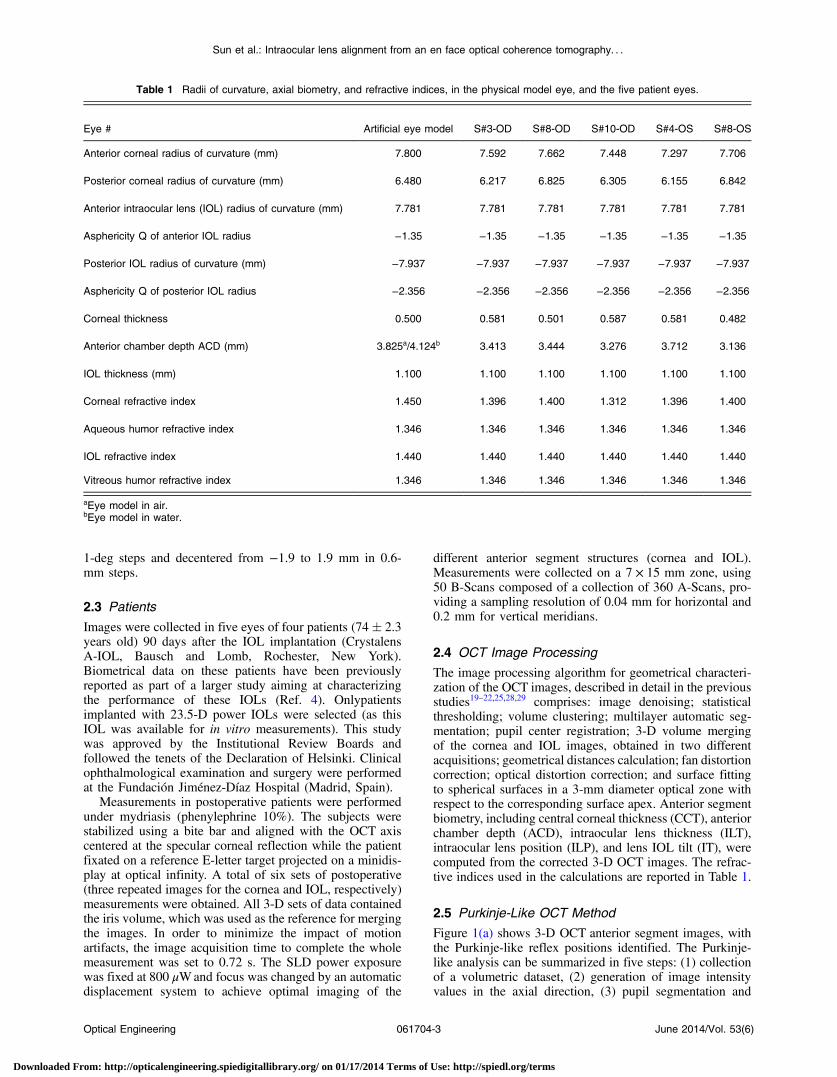
The image processing algorithm for geometrical characteri-zation of the OCT images, described in detail in the previousstudies19–22,25,28,29 comprises: image denoising; statisticalthresholding; volume clustering; multilayer automatic seg-mentation; pupil center registration; 3-D volume mergingof the cornea and IOL images, obtained in two differentacquisitions; geometrical distances calculation; fan distortioncorrection; optical distortion correction; and surface fittingto spherical surfaces in a 3-mm diameter optical zone withrespect to the corresponding surface apex. Anterior segmentbiometry, including central corneal thickness (CCT), anteriorchamber depth (ACD), intraocular lens thickness (ILT),intraocular lens position (ILP), and lens IOL tilt (IT), werecomputed from the corrected 3-D OCT images. The refrac-tive indices used in the calculations are reported in Table 1.
2.5 Purkinje-Like OCT Method
Figure 1(a) shows 3-D OCT anterior segment images, withthe Purkinje-like reflex positions identified. The Purkinje-like analysis can be summarized in five steps: (1) collectionof a volumetric dataset, (2) generation of image intensityvalues in the axial direction, (3) pupil segmentation and
Table 1 Radii of curvature, axial biometry, and refractive indices, in the physical model eye, and the five patient eyes.
Eye # Artificial eye model S#3-OD S#8-OD S#10-OD S#4-OS S#8-OS
Anterior corneal radius of curvature (mm) 7.800 7.592 7.662 7.448 7.297 7.706
Posterior corneal radius of curvature (mm) 6.480 6.217 6.825 6.305 6.155 6.842
Anterior intraocular lens (IOL) radius of curvature (mm) 7.781 7.781 7.781 7.781 7.781 7.781
Asphericity Q of anterior IOL radius −1.35 −1.35 −1.35 −1.35 −1.35 −1.35
Posterior IOL radius of curvature (mm) −7.937 −7.937 −7.937 −7.937 −7.937 −7.937
Asphericity Q of posterior IOL radius −2.356 −2.356 −2.356 −2.356 −2.356 −2.356
Corneal thickness 0.500 0.581 0.501 0.587 0.581 0.482
Anterior chamber depth ACD (mm) 3.825a/4.124b 3.413 3.444 3.276 3.712 3.136
IOL thickness (mm) 1.100 1.100 1.100 1.100 1.100 1.100
Corneal refractive index 1.450 1.396 1.400 1.312 1.396 1.400
Aqueous humor refractive index 1.346 1.346 1.346 1.346 1.346 1.346
IOL refractive index 1.440 1.440 1.440 1.440 1.440 1.440
Vitreous humor refractive index 1.346 1.346 1.346 1.346 1.346 1.346
aEye model in air.bEye model in water.
Optical Engineering 061704-3 June 2014/Vol. 53(6)
Sun et al.: Intraocular lens alignment from an en face optical coherence tomography. . .
Downloaded From: http://opticalengineering.spiedigitallibrary.org/ on 01/17/2014 Terms of Use: http://spiedl.org/terms

identification of the positions of the specular reflexes in thedifferent surfaces (Purkinje-like images positions, PI, PIII,and PIV) [Fig. 1(b)]. The reflexes PI, PIII, and PIVare easilyidentified by checking the corresponding OCT B-Scanimage [Fig. 1(c)]. The position of the reflexes is referredto the center of the pupil.
The method for estimating IOL alignment is based on thatdescribed in the previous works.7–9 This method assumesa linear relationship between Purkinje-like image positions(PI, PIII, PIV) and rotation of the eye (β), tilt (α), and decen-tration (d):
PI ¼ E × β
PIII ¼ F × β þ A × αþ C × d
PIV ¼ G × β þ B × αþD × d: (1)
A computer eye model was set in ZEMAX using biomet-rical information of anterior and posterior surfaces of the
cornea obtained from OCT measurements19 and the IOLgeometry obtained from noncontact profilometry, asdescribed in Sec. 2.2. To calculate the position of the reflexon the different surfaces, routines were written in ZEMAXto search the rays that, following reflection from a surface,exit the eye parallel to the optical axis. Although the standardPurkinje method studies the image created by all the rayspassing through the pupil, the spots visible in en face OCTimages are created by a few rays only. Although different, thestandard Purkinje images and the Purkinje-like reflectionsin OCT en face images are very close. We calculated in astandard computer eye model that the difference in positionof the images between the two methods (for PI, PIII, andPIV) was always below 20 μm.
To obtain coefficients E, F, and G, in Eq. (1), α ¼ 0 andd ¼ 0 (no tilt and no decentration) were set in the computereye model, and the Purkinje-like reflex positions were esti-mated for different rotation angles. A linear fit of the dis-placement of the reflex provided the value of the coefficientsE, F, and G. The same procedure was repeated for A and B(setting β ¼ 0 and d ¼ 0) and C and D (with β ¼ 0 andα ¼ 0).8 Eye rotation (β) and lens tilt and decentration (αand d) were obtained from the inversion in Eq. (2), usingthe positions of the experimental reflexes (P1, P3, and P4).
β ¼ P1E
− roatation angles
α ¼ β × ðD × F − C × FÞ þ C × P4 −D × P3C × B −D × A
− tilt angles
d ¼ P3 − β × F − α × AC
− decentration: (2)
3 Results
3.1 Validation on a Water-Cell Physical Model Eye
The developed methodology was tested on the physicalmodel eye described before. The corresponding coefficientsof Eq. (1) were computed for the artificial eye (see Table 2for both the model eye in air and filled in with water).
Figure 2 shows the experimental tilt and decentrationmeasured in the physical model eye, against the nominalset values of tilt and decentration, for the IOL in air (a, c)and water (b, d). There is a high correspondence between
Fig. 1 (a) Three-dimensional (3-D) optical coherence tomography(OCT) image (example is for S#3, OD); (b) en face OCT imageshowing the pupil merging, the locations of PI, PIII, and PIV in redand pupil center in yellow; (c) PI (left), PIII (center), and PIV (right)in OCT B-Scan images.
Table 2 A–G coefficients in Eq. (1) for the physical model eye in air and water and the five eyes of the study.
A B C D E F G
Artificial eye modela 0.112–0.248 −0.074 to −0.120 0.899 to 1.830 0.968 to 1.028 0.130 to 0.143 0.192 to 0.336 −0.017 to 0.020
S#3 OD 0.213 −0.108 1.644 0.937 0.064 0.187 −0.094
S#8 OD 0.213 −0.108 1.645 0.936 0.066 0.187 −0.093
S#10 OD 0.220 −0.107 1.688 0.924 0.064 0.192 −0.092
S#4 OS 0.224 −0.109 1.720 0.943 0.054 0.200 −0.094
S#8 OS 0.208 −0.107 1.606 0.926 0.073 0.179 −0.091
aRange corresponding to different realizations (air and water) of the model eye.
Optical Engineering 061704-4 June 2014/Vol. 53(6)
Sun et al.: Intraocular lens alignment from an en face optical coherence tomography. . .
Downloaded From: http://opticalengineering.spiedigitallibrary.org/ on 01/17/2014 Terms of Use: http://spiedl.org/terms

the experimental and nominal values: slope ¼ 1.007,r ¼ 0.9902, p < 0.0001 for IOL tilt in air; slope ¼ 1.037,r ¼ 0.9973, p < 0.0001 for IOL tilt in water; slope ¼0.991, r ¼ 0.9878, p < 0.0001 for IOL decentration in air;slope ¼ 0.993, r ¼ 0.9993, p < 0.0001 for IOL decentrationin water. The average difference between nominal and exper-imental values was 0.254 � 0.170 deg for tilt and 0.066�0.017 mm for decentration.
3.2 IOL Tilt and Decentration in Patients
Measurements were performed on five eyes of four patients,all implanted with a 23.5 D Crystalens AIOL. The biomet-rical parameters necessary to build the computer eye modelwere obtained from OCT (anterior and posterior cornealradius, corneal thickness, ACD)4 and from noncontact pro-filometry (anterior and posterior IOL radii of curvature andthickness). Table 1 shows the corresponding parameters forall five eyes. The two sets of coefficients for tilt and decen-tration correspond to two different realizations of the artifi-cial eye model. (The anterior chamber depth was enlargedfor IOL tilt measurements to allow proper positioning ofthe platform holding inside the chamber).
IOL tilt is defined as the angle between the IOL axis andthe pupillary axis, where the IOL axis is the line joining thecenters of curvature of the IOL and the pupillary axis joiningthe center of curvature of the cornea and the pupil center. IOL
decentration is defined as the distance between the IOLcenter and the pupil center. According to the existing con-ventions,6 positive horizontal decentration stands for nasaldecentration (in right eyes) and temporal decentration (inleft eyes), and vice versa for negative; and positive verticaldecentration for superior, and negative for inferior. Positivetilt around the horizontal axis (tilt x) indicates that the supe-rior edge of the lens is moved forward. Negative tilt aroundthe vertical axis (tilt y), in right eyes, indicates that the tem-poral edge of the lens is moved forward, and, in left eyes,indicates that the nasal edge of the lens is moved forward.
We did not find consistent mirror symmetry in the orien-tation of tilt or decentration in these eyes (Fig. 3). The aver-age tilt around x-axis was −0.14 deg in right eyes and−1.88 deg in left eyes (Purkinje-like), and −0.59 deg inright eyes and −2.02 deg in left eyes (OCT). Average tiltaround the y-axis was 2.15 deg in right eyes and 1.65 degin left eyes (Purkinje-like) and 2.93 deg in right eye and2.14 deg in left eyes (OCT). Average decentration in thehorizontal axis was −0.10 mm in right eyes and 0.00 mmin left eyes (Purkinje-like), and −0.10 mm in right eyesand 0.11 mm in left eyes (OCT). Average decentration inthe vertical axis was −0.08 mm. The average standard devi-ations for repeated measurements of tilt were 0.47 deg(Purkinje-like) and 0.58 deg (OCT). The standard deviationfor repeated measurements of decentration was 0.04 mm(Purkinje-like) and 0.06 mm (OCT).
Fig. 2 Experimental data versus nominal data in the artificial eye model: (a) intraocular lens (IOL) tilt (in air), (b) IOL tilt (in water), (c) IOL decen-tration (in air), and (d) IOL decentration (in water).
Optical Engineering 061704-5 June 2014/Vol. 53(6)
Sun et al.: Intraocular lens alignment from an en face optical coherence tomography. . .
Downloaded From: http://opticalengineering.spiedigitallibrary.org/ on 01/17/2014 Terms of Use: http://spiedl.org/terms

Figure 4 compares the coordinates of tilt (a, b) and decen-tration (c, d) measured with both techniques. There wasa high correlation between both estimates particularlyfor tilt (slope: 1.18, r ¼ 0.95, p < 0.012, for tilt aroundx-axis; slope: 0.92, r ¼ 0.98, p < 0.004 for tilt aroundy-axis), and slightly lower, not reaching statistical signifi-cance, for decentration (slope: 0.62, r ¼ 0.67, p < 0.22,
for decentration on x-axis; slope: −0.35, r ¼ −0.44, p <0.46 for decentration on y-axis). Figure 5 shows a Bland–Altman plot for tilt measurements (a) and for decentrationmeasurements (b), i.e., average of tilt/decentration coordi-nates from Purkinje and OCT versus difference of tilt/decentration coordinates from both methods. The averagedifference in tilt from both methods was −0.17 deg, with
Fig. 3 Coordinates of IOL tilt (a) and (b) decentration (b) in right and left eyes, in all five eyes of the study. Solid symbols represent data obtainedusing the Purkinje-like OCT-based method. Open symbols represent data obtained directly from distortion-corrected 3-D OCT images (Ref. 19).Square, rhombus, and round represent right eyes (OD) while triangle and rectangle represent left eyes (OS). Each color (color online only) rep-resents a different eye. Error bars stand for standard deviations of repeated measurements.
Fig. 4 Correlation between data obtained from Purkinje-like and OCT methods for IOL tilt (a, b) and decentration (c, d) in all five eyes of the study.
Optical Engineering 061704-6 June 2014/Vol. 53(6)
Sun et al.: Intraocular lens alignment from an en face optical coherence tomography. . .
Downloaded From: http://opticalengineering.spiedigitallibrary.org/ on 01/17/2014 Terms of Use: http://spiedl.org/terms

the 95% limits of agreement −0.754 to 0.416 deg. All tiltcoordinates from either method were within the confidenceinterval and 40% differed by <0.5 deg. The average differ-ence in decentration from both methods was −0.086 mm,with the 95% limits of agreement −0.205 to 0.033 mm.All decentration coordinates from either method were withinthe confidence interval and 50% differed by <0.1 mm.
Although all the estimates are obtained from the sameimage dataset, the causes for the slight discrepancies mayarise from the 3-D nature of the reference axes in OCTand the 2-D nature in Purkinje. The center of the pupil inthe OCT images is given by lateral and axial coordinates,which may result in a slightly different pupillary axis.Besides, the pupil plane itself may show some tilt, whilethe pupil edges in the Purkinje-like method are obtainedfrom the frontal projection (2-D coordinates) in the enface OCT images. We simulated the Purkinje images of acomputer 3-D model eye built using the estimates for tilt,decentration, and eye rotation obtained from the Purkinje-like method, using ZEMAX and found that the positionsof the simulated PI, PIII, and PIV were within 0.004 mm,0.011 mm, and 0.004 mm, respectively, from the experimen-tal Purkinje images (see Fig. 6, showing an example fromeye S# 8 OS).
4 DiscussionWe have developed and validated a new method of measure-ment of IOL tilt and IOL decentration from the en face OCT
anterior segment images showing Purkinje-like reflectionsfrom the anterior cornea and anterior and posterior lens.The images are similar to those obtained by the standardPurkinje method images, which are specular reflectionsformed at the ocular surfaces and matched in position.The Purkinje-like reflex locations are assumed to be linearcombinations of eye rotation, lens tilt and decentration,with the weighting coefficients dependent on the eye’s biom-etry (and easily derived by computations on computer eyemodels), lens tilt, and decentration. The method has beentested in an artificial model with and without water, andshows accuracies similar to those of standard Purkinje imag-ing methods.
The proposed methodology shares analysis with the stan-dard Purkinje-based method, where pupil conjugate imagesare retrieved by the use of CCD camera provided with a tele-centric lens. However, the availability of tomographic datafrom OCT allows identifying unequivocally the correspond-ing ocular surface producing the reflection, with no limita-tions arising from potential overlapping of the Purkinjeimages (one of the main drawbacks of the standard method).The dense lateral sampling of our spectral OCT configura-tion prevents the limitations produced by sparse meridionalsampling (such as that used in Scheimpflug instruments).Besides, the availability of geometrical and biometricalinformation (corneal keratometry, lens phakometry, anteriorchamber depth), required in the Purkinje method and nor-mally gathered from different other instruments in the stan-dard Purkinje approach, can be retrieved from the same 3-DOCT dataset. Despite the high acquisition rates of the OCTsystem the collection of 3-D en face OCT images in our cur-rent configuration is significantly slower (0.72 s) than thePurkinje method with a standard CCD camera (30 Hz),which imposes limitations to the dynamic measurement ofIOL tilt and decentration, which may be of interest in someapplications.30 High acquisition rates are important to avoidpotential limitations imposed by eye motions. However,it is conceivable to limit the acquisition of OCT 2-D crosssections in selected regions, which would considerablydiminish acquisition times.
We have compared the tilts and decentrations measureddirectly from fan/optical distortion-corrected OCT imageswith those obtained from the en face OCT Purkinje-likemethod, and found, in general, high agreement betweenthe data, particularly for tilt. We have identified slight
Fig. 5 Bland–Altman plot-differences between Purkinje-like and OCTestimates of tilt (a) and decentration (b). Horizontal lines representthe mean difference (−0.17 deg and −0.09 mm, respectively) and95% limits of agreement.
Fig. 6 Experimental en faceOCT image (a) and simulated (b) PI, PIII,and PIV, for S# 8 OS.
Optical Engineering 061704-7 June 2014/Vol. 53(6)
Sun et al.: Intraocular lens alignment from an en face optical coherence tomography. . .
Downloaded From: http://opticalengineering.spiedigitallibrary.org/ on 01/17/2014 Terms of Use: http://spiedl.org/terms

differences in the definition of the pupillary axis as a poten-tial source of the discrepancies. However, using the appro-priate references in a computer eye model should result inthe description of the same eye.
Measurements of tilt and decentration of IOLs, along withthe biometrical and anatomical parameters are of great valueto evaluate optical quality in patients after cataract surgery,and to provide understanding of their relative role in opticaldegradation. Furthermore, measurements of IOL tilt anddecentration in patients will help to optimize IOL and hapticdesign. Tilt and decentration are therefore critical parameterswhen building customized computer eye models that canpredict optical performance of IOLs (Refs. 5 and 31). Thequantitative 3-D anatomical information provided by OCTallows building these eye models with all geometrical andbiometrical information obtained from a single instrument.Anterior 3-D OCT images allow direct estimation of IOLtilt and decentration, but the analysis requires correctionof both fan and optical distortion.20 However, the Purkinjemethod only requires knowledge of axial biometry, anteriorcorneal radius of curvature, and IOL radii of curvature, easilyaccessible following fan distortion correction of the imagesand from geometrical data of the IOL.
The amounts of tilt and decentration found in this study(3.30� 4.68 deg and 0.16� 0.16 mm, respectively) arecomparable with those found in the prior literature(3.01� 1.39 deg and 0.38� 030 mm in Ref. 1;4.30� 2.67 deg and 0.45� 0.0.26 mm in Ref. 32; and3.73� 1.18 deg and 0.45� 0.23 mm in Ref. 33) in eyesimplanted with standard monofocal IOLs. However, thelack of clear symmetry between right and left eyes, andparticularly, the large tilts found in some eyes (i.e., S#3OD) are likely associated with the fact that A-IOLs withhinged haptics may experience larger misalignments thanstandard monofocal IOLs (Ref. 4), among others due toasymmetric fibrosis in the haptic region (Z-syndrome inCrystalens).34
In summary, robust measurements of IOL tilt and decen-tration can be obtained from a Purkinje-like based analysison a volumetric set of OCT anterior segment data. OCT-based corneal topography data along with those IOL align-ment and eye rotation data from the Purkinje method andIOL geometry can be used in customized pseudophakiceye models allowing estimates of the optical quality andthe factors contributing to optical degradation in theseeyes. The Purkinje-like method allowed characterizationof the eye rotation, lens tilt, and decentration, giving insightson the performance of implanted accommodative IOLs.These data, along with the biometrical data obtained fromOCT, can be easily transferred into computer eye modelsfor the evaluation of the contributed factors to optical deg-radation in eyes implanted with IOLs and the impact of IOLmisalignment in particular.
AcknowledgmentsThis study has been funded by Spanish Government GrantNo. FIS2011-25637 and European Research Council ERC-2011 AdG-294099 “Bio-inspired optical correction ofpresbyopia” to S. Marcos, and Marie Curie Actions-Networks of Initial Training (ITN) FP7-PEOPLE-2010-ITN264605 (OpAL-Optical and adaptational limits of vision).The authors acknowledge the collaborative agreement
“Unidad Asociada Tecnología e Innovación sanitaria enOftalmología” (IIS FundaciónJiménezDíaz/ IO-CSIC).
References
1. A. de Castro, P. Rosales, and S. Marcos, “Tilt and decentration ofintraocular lenses in vivo from Purkinje and Scheimpflug imaging:validation study,” J. Cataract. Refract. Surg. 33(3), 418–429 (2007).
2. D. A. Atchison, “Design of aspheric intraocular lenses,” OphthalmicPhysiol. Opt. 11(2), 137–146 (1991).
3. R. Menapace et al., “Accommodating intraocular lenses: a criticalreview of present and future concepts,” Graefe’s Arch. Clin. Exp.Ophthalmol. 245(4), 473–489 (2007).
4. S. Marcos et al., “Three-dimensional evaluation of accommodatingintraocular lens shift and alignment in vivo,” Ophthalmology, inpress (2013).
5. P. Rosales and S. Marcos, “Customized computer models of eyes withintraocular lenses,” Opt. Express 15(5), 2204–2218 (2007).
6. P. Rosales et al., “Changes in crystalline lens radii of curvature andlens tilt and decentration during dynamic accommodation in rhesusmonkeys,” J. Vis. 8(1), 18.1–18.12 (2008).
7. P. Phillips et al., “Measurement of intraocular lens decentration andtilt in vivo,” J. Cataract. Refract. Surg. 14(2), 129–135 (1988).
8. J. C. Barry, M. Dunne, and T. Kirschkamp, “Phakometric measurementof ocular surface radius of curvature and alignment: evaluation ofmethod with physical model eyes,” Ophthalmic Physiol. Opt. 21(6),450–460 (2001).
9. P. Rosales and S. Marcos, “Phakometry and lens tilt and decentrationusing a custom-developed Purkinje imaging apparatus: validation andmeasurements,” J. Opt. Soc. Am. A 23(3), 509–520 (2006).
10. M. C. Dunne et al., “Non-invasive phakometric measurement of cornealand crystalline lens alignment in human eyes,” Ophthalmic Physiol.Opt. 25(2), 143–152 (2005).
11. T. Kirschkamp, M. Dunne, and J. C. Barry, “Phakometric measurementof ocular surface radii of curvature, axial separations and alignmentin relaxed and accommodated human eyes,” Ophthalmic Physiol. Opt.24(2), 65–73 (2004).
12. P. Rosales et al., “Crystalline lens radii of curvature from Purkinje andScheimpflug imaging,” J. Vis. 6(10), 1057–1067 (2006).
13. D. O. Mutti, K. Zadnik, and A. J. Adams, “A video technique for phak-ometry of the human crystalline lens,” Invest. Ophthalmol. Vis. Sci.33(5), 1771–1782 (1992).
14. Y. Nishi et al., “Reproducibility of intraocular lens decentration and tiltmeasurement using a clinical Purkinje meter,” J. Cataract. Refract.Surg. 36(9), 1529–1535 (2010).
15. S. Marcos et al., “Balance of corneal horizontal coma by internal opticsin eyes with intraocular artificial lenses: evidence of a passive mecha-nism,” Vision Res. 48(1), 70–79 (2008).
16. P. Rosales et al., “Intraocular lens alignment from Purkinje andScheimpflug imaging,” Clin. Exp. Optometry 93(6), 400–408 (2010).
17. J. Tabernero et al., “Instrument for measuring the misalignments ofocular surfaces,” Opt. Express 14(22), 10945–10956 (2006).
18. J. E. Coppens, T. J. van den Berg, and C. J. Budo, “Biometry of phakicintraocular lens using Scheimpflug photography,” J. Cataract. Refract.Surg. 31(10), 1904–1914 (2005).
19. S. Ortiz et al., “Full OCT anterior segment biometry: an application incataract surgery,” Biomed. Opt. Express 4(3), 387–396 (2013).
20. S. Ortiz et al., “Optical distortion correction in optical coherence tomog-raphy for quantitative ocular anterior segment by three-dimensionalimaging,” Opt. Express 18(3), 2782–2796 (2010).
21. S. Ortiz et al., “Corneal topography from spectral optical coherencetomography (sOCT),” Biomed. Opt. Express 2(12), 3232–3247 (2011).
22. S. Ortiz et al., “In vivo human crystalline lens topography,” Biomed.Opt. Express 3(10), 2471–2488 (2012).
23. X. Wang et al., “IOL tilt and decentration estimation from 3 dimensionalreconstruction of OCT image,” PLoS One 8(3), e59109 (2013).
24. L. Li et al., “Research on calculation of the IOL tilt and decentrationbased on surface fitting,” Comput. Math. Methods Med. 2013, 572530(2013).
25. S. Ortiz et al., “Quantitative OCT-based corneal topography in kerato-conus with intracorneal ring segments,” Biomed. Opt. Express 3(5),814–824 (2012).
26. I. Grulkowski et al., “Anterior segment imaging with Spectral OCT sys-tem using a high-speed CMOS camera,”Opt. Express 17(6), 4842–4858(2009).
27. A. Perez-Escudero, C. Dorronsoro, and S. Marcos, “Correlationbetween radius and asphericity in surfaces fitted by conics,” J. Opt.Soc. Am. A 27(7), 1541–1548 (2010).
28. S. Ortiz et al., “Three-dimensional ray tracing on Delaunay-basedreconstructed surfaces,” Appl. Opt. 48(20), 3886–3893 (2009).
29. S. Ortiz et al., “Optical coherence tomography for quantitative surfacetopography,” Appl. Opt. 48(35), 6708–6715 (2009).
30. J. Tabernero et al., “Determining the stability of implanted Iols witha dynamic purkinje-meter system,” Invest. Ophthalmol. Vis. Sci. 53,E-Abstract 1373, ARVO (2012).
Optical Engineering 061704-8 June 2014/Vol. 53(6)
Sun et al.: Intraocular lens alignment from an en face optical coherence tomography. . .
Downloaded From: http://opticalengineering.spiedigitallibrary.org/ on 01/17/2014 Terms of Use: http://spiedl.org/terms

31. J. Tabernero et al., “Predicting the optical performance of eyesimplanted with IOLs to correct spherical aberration,” Invest.Ophthalmol. Vis. Sci. 47(10), 4651–4658 (2006).
32. M. C. Wang et al., “Position of poly(methyl methacrylate) and siliconeintraocular lenses after phacoemulsification,” J. Cataract. Refract. Surg.24(12), 1652–1657 (1998).
33. J. S. Kim and K. H. Shyn, “Biometry of 3 types of intraocular lensesusing Scheimpflug photography,” J. Cataract. Refract. Surg. 27(4),533–536 (2001).
34. L. Yuen, W. Trattler, and B. S. Boxer Wachler, “Two cases ofZ syndrome with the Crystalens after uneventful cataract surgery,”J. Cataract. Refract. Surg. 34(11), 1986–1989 (2008).
Mengchan Sun is currently an early stage researcher at the Institutode Optica, Consejo Superior de Investigaciones Científicas (CSIC),which she joined in 2012 and where she works under the supervision
of Prof. Susana Marcos at the Visual Optics and Biophotonics Labo-ratory. She is a Marie Curie Fellow of the Initial Training Network (ITN)OPAL (Optical and Adaptational Limits of Vision) funded by the Euro-pean Commission’s Seventh Framework Programme (FP7) under theMarie Curie Actions. Prior to this position, she was a master’s studentat the Department of Information Communication Techniques, KTH—Kungliga Tekniska Högskolan (Royal Institute of Technology) inStockholm, Sweden. Her previous professional experience includesOptical Engineer in MECAL, Eindhoven, The Netherlands (2010)and member at the Energy Research Centre of the Netherlands(2009).
Biographies of the other authors not available.
Optical Engineering 061704-9 June 2014/Vol. 53(6)
Sun et al.: Intraocular lens alignment from an en face optical coherence tomography. . .
Downloaded From: http://opticalengineering.spiedigitallibrary.org/ on 01/17/2014 Terms of Use: http://spiedl.org/terms
Copyright © 2022 FDOKUMEN