Determining corneal power using Orbscan II videokeratography for intraocular lens calculation after...
10
ARTICLES Determining corneal power using Orbscan II videokeratography for intraocular lens calculation after excimer laser surgery for myopia Mujtaba A. Qazi, MD, Irwin Y. Cua, MD, Cynthia J. Roberts, PhD, Jay S. Pepose, MD, PhD PURPOSE: To assess the accuracy of Orbscan II slit-scanning videokeratography for intraocular lens (IOL) calculation in eyes with previous photorefractive surgery for myopia. SETTING: Private practice, St. Louis, Missouri, USA. METHODS: Corneal power (K) was measured by manual keratometry, Placido-based videokeratogra- phy (Atlas), slit-scanning videokeratography (Orbscan II), and contact lens overrefraction in 21 post- photoablation eyes having cataract surgery. Postoperative data collected after phacoemulsification were used to back-calculate corneal power (BCK). The BCK values were statistically compared at 3.0 to 6.0 mm central Orbscan II curvature and power measurements, including total axial power, total tangential power, total mean power, and total optical power. Similar comparisons were made to Atlas curvature at the 0.0 to 10.0 mm zones. RESULTS: The mean corneal power after refractive surgery based on BCK values using the Holladay 2 formula (BCK H2) was 39.35 diopters (D) G 2.58 (SD). The mean manual value (40.52 G 1.95 D) and Atlas-based values were statistically higher than BCK H2 values (P<.001). The mean corneal power cal- culated from historical data was 39.33 G 2.70 D (P Z .83 to BCK H2; n Z 19) and from contact lens overrefraction, 41.38 G 3.11 D (P Z .19; n Z 5). Orbscan II parameters (n Z 21) of the total mean power (3.0 mm, 39.10 G 2.63 D), total tangential power (3.0 mm, 39.11 G 2.60), total axial power (5.0 mm, 39.19 G 2.55 D), and total optical power (3.0 mm, 39.08 G 2.78 D; 4.0 mm, 39.39 G 2.76 D) were statistically similar to both the historical and BCK H2 values (P>.11). If used prospectively, 80.9% of eyes would have been within G0.50 D of the targeted refraction using a 4.0 mm total optical power, 76.2% using a 5.0 mm total axial power, and 42.1% using the historical method. CONCLUSION: The Orbscan II 5.0 mm total axial power and 4.0 mm total optical power can be used to more accurately predict true corneal power than the history-based method and may be particularly useful when pre-LASIK data are unavailable. J Cataract Refract Surg 2007; 33:21–30 Q 2007 ASCRS and ESCRS Manual and automated keratometry are the most fre- quently used techniques for measuring central corneal refractive power (K) to calculate intraocular lens (IOL) power in cataract surgery. Although these instruments offer good accuracy when applied to healthy, unoperated cor- neas with regular astigmatism, their use in measuring cor- neal power in patients with irregular astigmatism 1 or who have had keratorefractive surgery 2–12 can lead to significant residual postoperative refractive errors. These ‘‘surprises’’ stem partly from the fact that the manual keratometer aver- ages measurements from only 4 discrete paracentral points on the anterior cornea and that it assumes a spherical cen- tral cornea, with the posterior cornea having a radius of curvature 1.2 mm smaller than its anterior counterpart. Eyes that have had keratorefractive laser surgery have altered corneal asphericity 13 and variations in the relation- ship between the anterior and posterior corneal radii of curvature. 14,15 Q 2007 ASCRS and ESCRS Published by Elsevier Inc. 0886-3350/07/$-see front matter doi:10.1016/j.jcrs.2006.08.026 21 J CATARACT REFRACT SURG - VOL 33, JANUARY 2007
-
Upload
independent -
Category
Documents
-
view
0 -
download
0
Transcript of Determining corneal power using Orbscan II videokeratography for intraocular lens calculation after...

J CATARACT REFRACT SURG - VOL 33, JANUARY 2007
ARTICLES
Determining corneal power using
Orbscan II videokeratography for intraocular
lens calculation after excimer laser
surgery for myopia
Mujtaba A. Qazi, MD, Irwin Y. Cua, MD, Cynthia J. Roberts, PhD, Jay S. Pepose, MD, PhD
PURPOSE: To assess the accuracy of Orbscan II slit-scanning videokeratography for intraocular lens(IOL) calculation in eyes with previous photorefractive surgery for myopia.
SETTING: Private practice, St. Louis, Missouri, USA.
METHODS: Corneal power (K) was measured by manual keratometry, Placido-based videokeratogra-phy (Atlas), slit-scanning videokeratography (Orbscan II), and contact lens overrefraction in 21 post-photoablation eyes having cataract surgery. Postoperative data collected after phacoemulsificationwere used to back-calculate corneal power (BCK). The BCK values were statistically compared at 3.0to 6.0 mm central Orbscan II curvature and power measurements, including total axial power, totaltangential power, total mean power, and total optical power. Similar comparisons were made to Atlascurvature at the 0.0 to 10.0 mm zones.
RESULTS: The mean corneal power after refractive surgery based on BCK values using the Holladay 2formula (BCK H2) was 39.35 diopters (D) G 2.58 (SD). The mean manual value (40.52 G 1.95 D) andAtlas-based values were statistically higher than BCK H2 values (P<.001). The mean corneal power cal-culated from historical data was 39.33 G 2.70 D (P Z .83 to BCK H2; n Z 19) and from contact lensoverrefraction, 41.38 G 3.11 D (P Z .19; n Z 5). Orbscan II parameters (n Z 21) of the total meanpower (3.0 mm, 39.10 G 2.63 D), total tangential power (3.0 mm, 39.11 G 2.60), total axial power(5.0 mm, 39.19 G 2.55 D), and total optical power (3.0 mm, 39.08 G 2.78 D; 4.0 mm, 39.39 G 2.76 D)were statistically similar to both the historical and BCK H2 values (P>.11). If used prospectively, 80.9% ofeyes would have been within G0.50 D of the targeted refraction using a 4.0 mm total optical power,76.2% using a 5.0 mm total axial power, and 42.1% using the historical method.
CONCLUSION: The Orbscan II 5.0 mm total axial power and 4.0 mm total optical power can be used tomore accurately predict true corneal power than the history-based method and may be particularlyuseful when pre-LASIK data are unavailable.
J Cataract Refract Surg 2007; 33:21–30 Q 2007 ASCRS and ESCRS
Manual and automated keratometry are the most fre-quently used techniques for measuring central corneal
refractive power (K) to calculate intraocular lens (IOL)
power in cataract surgery. Although these instruments offer
good accuracy when applied to healthy, unoperated cor-
neas with regular astigmatism, their use in measuring cor-
neal power in patients with irregular astigmatism1 or who
have had keratorefractive surgery2–12 can lead to significant
residual postoperative refractive errors. These ‘‘surprises’’
Q 2007 ASCRS and ESCRS
Published by Elsevier Inc.
stem partly from the fact that the manual keratometer aver-ages measurements from only 4 discrete paracentral points
on the anterior cornea and that it assumes a spherical cen-
tral cornea, with the posterior cornea having a radius of
curvature 1.2 mm smaller than its anterior counterpart.
Eyes that have had keratorefractive laser surgery have
altered corneal asphericity13 and variations in the relation-
ship between the anterior and posterior corneal radii of
curvature.14,15
0886-3350/07/$-see front matterdoi:10.1016/j.jcrs.2006.08.026
21
CORNEAL POWER DETERMINATION FOR IOL CALCULATION USING ORBSCAN II AFTER LASER REFRACTIVE SURGERY
The literature is replete with strategies to better deter-
mine corneal power in eyes that have had refractive surgery
including photorefractive keratectomy (PRK) and laser insitu keratomileusis (LASIK). Among the most commonly
used methods are refraction-based calculations,3–11,16–19
rigid gas-permeable contact lens (RGP) overrefrac-
tion,1,3,8,10,11,17,18,20 and computerized videokeratography
(CVK).1–4,6,9–11,14,16,18,21–26 The latter 2 techniques be-
come particularly important when the preoperative refrac-
tive surgical history is unavailable. Srivannaboon et al.23
describe using slit-scanning videokeratography to detectthe change in corneal refractive power after LASIK for
myopia. They note that the total optical power map of the
Orbscan topography system (Bausch & Lomb) provides
K-values that correlate closely with changes in manifest
refraction produced by LASIK.
The present study evaluated the use of CVK parameters
of corneal power for calculating IOL power in a myopic
LASIK cohort. Predictability of the CVK power measure-ments was compared to ‘‘actual’’ post-keratorefractive sur-
gery corneal power derived from back-calculating corneal
power (BCK) from refractive data collected at least 1 month
after uneventful phacoemulsification. Back-calculated cor-
neal power was statistically compared to manually derived
corneal power, corneal power calculated from preoperative
refractive surgery data (historical method) and contact lens
overrefraction, Placido disk–based topography (Atlas), andOrbscan-derived corneal power at 3.0 to 6.0 mm central
diameters.
PATIENTS AND METHODS
Preoperative Testing
Standard preoperative testing, including manifest refraction,tonometry, and slitlamp biomicroscopy, was performed on post-keratorefractive surgery patients scheduled for phacoemulsifica-tion over a 12-month period. Eyes were excluded if they had
Accepted for publication August 13, 2006.
From a private practice (Qazi, Pepose) and the Department ofOphthalmology and Visual Sciences (Qazi, Pepose), WashingtonUniversity School of Medicine, St. Louis, Missouri, and the Depart-ment of Ophthalmology and Biomedical Engineering Depart-ment (Roberts), Ohio State University, Columbus, Ohio, USA;St. Luke’s Medical Center (Cua), Quezon City, Philippines.
Supported in part by the Midwest Cornea Research Foundation,St. Louis, Missouri, USA.
Dr. Pepose received research and travel support from Bausch &Lomb. Dr. Roberts is a consultant to Bausch & Lomb. No otherauthor has a financial or proprietary interest in any material ormethod mentioned.
Corresponding author: Jay S. Pepose, MD, PhD, Pepose VisionInstitute, 16216 Baxter Road, Suite 205, Chesterfield, Missouri63017, USA. E-mail: [email protected].
J CATARACT REFRACT SURG22
best spectacle-corrected visual acuity (BSCVA) worse than 20/30after phacoemulsification, a history of flap complications, or sig-nificant systemic or ocular co-morbidity including diabetes melli-tus, retinopathy or maculopathy, glaucoma, and optic neuropathy.
Patients included in the study had myopic PRK or LASIKa mean of 52.2 months before their cataract surgery. Manual kera-tometry (Reichert), Atlas topography, and Orbscan II slit-scanningvideokeratography were prospectively obtained in 21 eyes of 16patients. The axial length (AL) was measured using ultrasound bi-ometry (Echograph Axis-II, Quantel Medica) in contact mode (15)and immersion mode (6).
Pre-LASIK or pre-PRK refractive history was available for 19eyes. Before cataract surgery RGP overrefraction3 was performedin 5 eyes, all with a BSCVA of 20/70 or better. Refraction was per-formed before and after placement of the contact lens. The cornealpower was estimated using the following formula:
KZBCþDþ ðOR� SEÞ
where K is the corneal power, BC is the base curve of rigid contactlens, D is the contact lens power, OR is the spherical equivalent ofcontact lens overrefraction, and SE is the spherical equivalentwithout the contact lens.
Orbscan simulated K-values, mean power at the 3.0 mm and5.0 mm zones, anterior axial power, total anterior power, total tan-gential power, total mean power, and total optical power mapswere evaluated for each eye. The ‘‘Tools’’ menu was used to obtain‘‘analyze area – statistics’’ for 3.0, 4.0, 5.0, and 6.0 mm of the centralcornea (Bausch & Lomb. Orbscan II, Orbscan IIz, Operator’s Man-ual, version 3.12, March, 2002). The numerical display menu wasselected for the Atlas to determine corneal power at the 0.0, 1.0,and 2.0 to 10.0 mm zones. These data were also statistically com-pared to mathematical derivation of central corneal power basedon a technique by Smith et al.27 (Atlas power at 0 mm � (376/337.5) � 4.90 diopters [D]) and Wang et al.18 modification ofthe previous method (Atlas power at 0 mm� [376/337.5]�6.1 D).
Intraocular Lens Power Calculation
Intraocular lens power was determined using the HolladayIOL Consultant (Holladay Consulting), which includes a modein which IOL power calculation can be modified in cases of previ-ous refractive surgery. In all cases, the boxed marked ‘‘PreviousRefractive Surgery’’ was checked. This allowed for IOL powercalculation using the historical method, RGP overrefractiontechnique, and surgeon-entered corneal power values. Once his-torical refractive data were entered, the Holladay IOL Consultantused the pre-refractive surgery K-values in the Holladay 2 formulawhen calculating the effective lens position (ELP). When pre-LASIK K-values were unavailable, a default preoperative K of43.86 D was used to calculate the ELP rather than the flatterpostoperative K-values, which can significantly offset the ELP.25
Because of this advantage, the Holladay 2 formula was prospec-tively used to calculate IOL power in the present study.
The IOL power was calculated with all applicable techniquesincluding manually derived corneal power, historical method,contact lens overrefraction, and 4.0 mm Orbscan-derived totaloptical power. The flattest K-value was then used in the Holladay2 formula to determine the power of the implanted IOL, generallytargeting a �0.50 to �2.00 D refractive outcome depending onwhether the patient wanted better distance or near vision. Orbs-can white-to-white (WTW) corneal diameter measurements,ultrasound-based anterior chamber depth (ACD), and lens thick-ness (LT) were included in the Holladay 2 IOL calculations.
- VOL 33, JANUARY 2007
CORNEAL POWER DETERMINATION FOR IOL CALCULATION USING ORBSCAN II AFTER LASER REFRACTIVE SURGERY
Uneventful small-incision phacoemulsification with in-the-bagposterior chamber IOL implantation was performed by 1 of 2surgeons (M.A.Q., J.S.P.) using standard techniques.
Back-Calculation of Corneal Power
Uncorrected visual acuity, BSCVA, and manifest refractionwere measured at least 1 month after cataract surgery. Post-pha-coemulsification refractive data were entered into the HolladayIOL Consultant to determine the BCK values, which correct for re-sidual postoperative refractive error without altering other preop-erative biometry values such as AL, WTW, ACD, and LT. The BCKvalues were calculated using the Holladay 2 (BCK H2). These werestatistically compared to the historical method, contact lens over-refraction, manually derived corneal power, and Atlas-derivedand Orbscan-derived corneal curvature and power.
Given that adjusting corneal power by 1.00 D changesthe IOL power by almost the same value28 and that every1.00 D change in IOL power affects the spectacle planerefraction by approximately 0.70 D,29 the error in corneal power(Kmethod � KBCK H2) for each technique was multiplied by 0.7 tocalculate the amount of residual post-phacoemulsification SEerror if Orbscan parameters had been used prospectively in theHolladay 2 formula to calculate IOL power.
RESULTS
Demographics
Sixteen patients (5 women) with a mean age of 60.7
years G 8.1 (SD) (Table 1) who had uneventful phacoemul-
sification after myopic LASIK (18 eyes) or PRK (3 eyes)
were included in the study. There were 8 right eyes and 13
left eyes. Historical data were unavailable for 2 eyes. Themean manifest refraction spherical equivalent (MRSE)
before keratorefractive surgery was �5.88 G 2.55 D. The
Table 1. Demographic data of eyes with cataract that had previous
excimer-based keratorefractive vision-correction surgery.
Characteristic n Mean G SD
Age (y) 21 60.7 G 8.1LASIK (eyes) 18/21 dPRK (eyes) 3/21 dPre-LASIK/PRK SE (D) 19 �5.88 G 2.55Pre-LASIK/PRK K (D) 19 44.04 G 1.36Interval between LASIK & phaco (mo) 21 52.20 G 16.2Pre-phaco SE (D) 21 �1.02 G 1.76Pre-phaco UCVA (20/) 21 94.8 G 80.0Pre-phaco BSCVA (20/) 21 33.4 G 12.2AL (mm) 21 26.15 G 1.10White-to-white (mm) 21 11.75 G 0.41Ultrasound ACD (mm) 21 3.69 G 0.45Ultrasound LT (mm) 20 4.37 G 0.46
ACD Z anterior chamber depth; AL Z axial length; BSCVA Z best spec-
tacle-corrected visual acuity; K Z corneal power; LASIK Z laser in situ
keratomileusis; LT Z lens thickness; PRK Z photorefractive keratectomy;
SE Z spherical equivalent; UCVA Z uncorrected visual acuity
J CATARACT REFRACT SURG
MRSE after keratorefractive surgery but before cataract for-
mation was �1.02 G 1.76 D. The mean AL was 26.15 G1.10 mm (median 25.91 mm, range 23.94 to 28.83 mm).
Refractive Outcomes
Patients were evaluated a mean of 3.7 G 5.8 months
after cataract surgery and had a mean postoperative MRSEof �0.95 G 0.79 D. The mean predicted postoperative SE
for the IOLs implanted, based on the Holladay 2 formula,
was �0.71 G 0.61 D, indicating these eyes were a mean of
�0.24 G 0.75 D more minus postoperatively than pre-
dicted. The paired Student t test comparing actual post-
cataract surgery SE and targeted SE for IOLs implanted gave
a value of 0.15. There was a low correlation (R2!0.001)
between AL and the difference between the predicted SEand the SE after phacoemulsification (SEactual postoperative –
SEH2 predicted postoperative).
Comparison to Back-Calculated Corneal Power
Table 2 shows the mean values for corneal power ob-
tained from various methods, including their deviation
from BCK H2 values. Central corneal power calculated us-
ing the historical method (Pearson [r] Z 0.90) correlated
more closely than RGP overrefraction-based values (r Z0.45) with BCK H2 values. Although the difference be-tween BCK H2 and contact lens overrefraction-derived
K-values was not statistically different because of the large
standard deviation (G3.11 D) and small sample size of the
latter technique, all 5 eyes in which contact lens overrefrac-
tion was available would have had a hyperopic outcome
after cataract surgery outcome if contact lens overrefraction
data had been prospectively used to calculate IOL power.
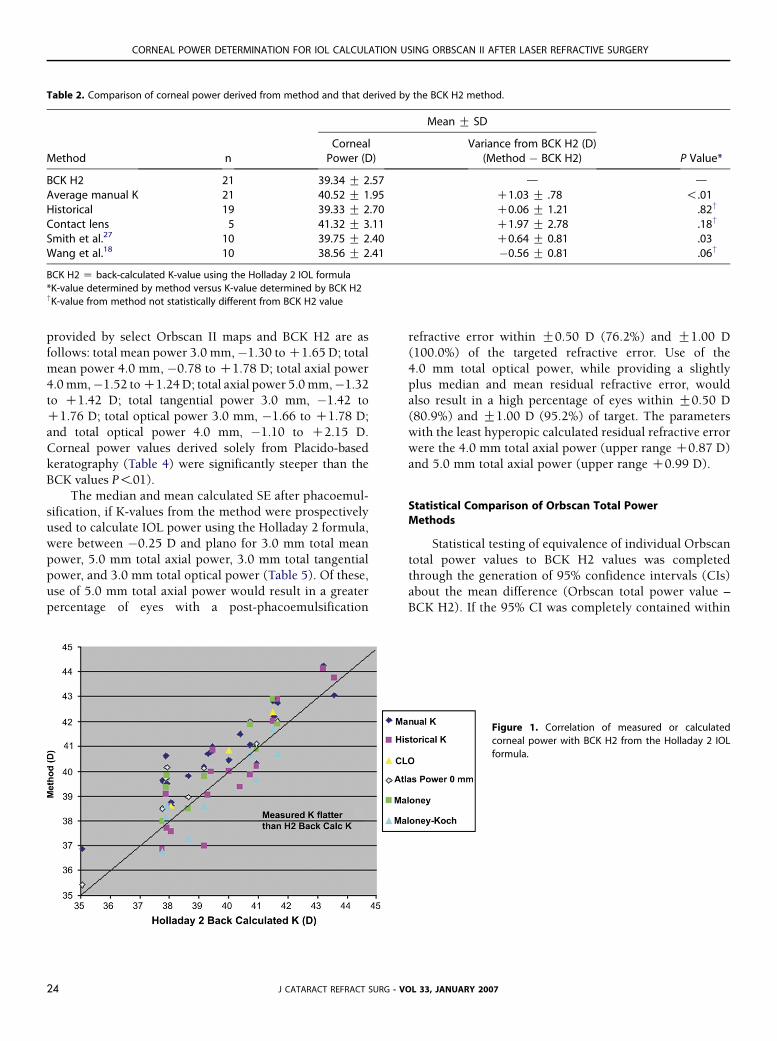
Figure 1 shows the close correlation between BCK valuesand measured K-values. The historical method calculated
corneal power values closest to those of the BCK method
and in several cases provided values flatter than the BCK
H2 method, minimizing the risk for a hyperopic refractive
outcome.
Several parameters (Table 3) from the Orbscan II were
not statistically different from ‘‘actual’’ corneal power (BCK
H2, 39.34 G 2.57 D). These include the central 3.0 mmtotal mean power, 5.0 mm total axial power, 6.0 mm total
axial power, 3.0 mm total tangential power, 3.0 mm total
optical power, and 4.0 mm total optical power. The central
4.0 mm total axial power, because its values were statisti-
cally flatter on average than those of the BCK H2 method,
would provide the fewest hyperopic outcomes after cataract
surgery and thus may offer an alternative measure if
surgeons are particularly interested in a myopic refractiveresult. Figure 2 shows the distribution of central corneal
power measured via different Orbscan II curvature and
power maps. Ranges for the difference between K-values
- VOL 33, JANUARY 2007 23
CORNEAL POWER DETERMINATION FOR IOL CALCULATION USING ORBSCAN II AFTER LASER REFRACTIVE SURGERY
Table 2. Comparison of corneal power derived from method and that derived by the BCK H2 method.
Mean G SD
Method nCorneal
Power (D)Variance from BCK H2 (D)
(Method � BCK H2) P Value*
BCK H2 21 39.34 G 2.57 d dAverage manual K 21 40.52 G 1.95 C1.03 G .78 !.01Historical 19 39.33 G 2.70 C0.06 G 1.21 .82†
Contact lens 5 41.32 G 3.11 C1.97 G 2.78 .18†
Smith et al.27 10 39.75 G 2.40 C0.64 G 0.81 .03Wang et al.18 10 38.56 G 2.41 �0.56 G 0.81 .06†
BCK H2 Z back-calculated K-value using the Holladay 2 IOL formula
*K-value determined by method versus K-value determined by BCK H2†K-value from method not statistically different from BCK H2 value
provided by select Orbscan II maps and BCK H2 are as
follows: total mean power 3.0 mm,�1.30 to C1.65 D; total
mean power 4.0 mm, �0.78 to C1.78 D; total axial power
4.0 mm,�1.52 to C1.24 D; total axial power 5.0 mm,�1.32to C1.42 D; total tangential power 3.0 mm, �1.42 to
C1.76 D; total optical power 3.0 mm, �1.66 to C1.78 D;
and total optical power 4.0 mm, �1.10 to C2.15 D.
Corneal power values derived solely from Placido-based
keratography (Table 4) were significantly steeper than the
BCK values P!.01).
The median and mean calculated SE after phacoemul-
sification, if K-values from the method were prospectivelyused to calculate IOL power using the Holladay 2 formula,
were between �0.25 D and plano for 3.0 mm total mean
power, 5.0 mm total axial power, 3.0 mm total tangential
power, and 3.0 mm total optical power (Table 5). Of these,
use of 5.0 mm total axial power would result in a greater
percentage of eyes with a post-phacoemulsification
J CATARACT REFRACT SURG24
refractive error within G0.50 D (76.2%) and G1.00 D
(100.0%) of the targeted refractive error. Use of the
4.0 mm total optical power, while providing a slightly
plus median and mean residual refractive error, wouldalso result in a high percentage of eyes within G0.50 D
(80.9%) and G1.00 D (95.2%) of target. The parameters
with the least hyperopic calculated residual refractive error
were the 4.0 mm total axial power (upper range C0.87 D)
and 5.0 mm total axial power (upper range C0.99 D).
Statistical Comparison of Orbscan Total PowerMethods
Statistical testing of equivalence of individual Orbscan
total power values to BCK H2 values was completed
through the generation of 95% confidence intervals (CIs)
about the mean difference (Orbscan total power value –
BCK H2). If the 95% CI was completely contained within
Figure 1. Correlation of measured or calculated
corneal power with BCK H2 from the Holladay 2 IOL
formula.
- VOL 33, JANUARY 2007

CORNEAL POWER DETERMINATION FOR IOL CALCULATION USING ORBSCAN II AFTER LASER REFRACTIVE SURGERY
Table 3. Comparison of BCK H2 and Orbscan parameters (N Z 21).
Mean G SD
Method Corneal Power (D) Variance from BCK H2 (D) (Method � BCK H2) P Value BCK H2*
Average simulated K 40.81 G 2.33 C1.46 G 0.73 !.001Mean power 3.0 mm 41.12 G 2.33 C1.78 G 0.69 !.001Mean power 5.0 mm 42.53 G 1.76 C3.19 G 1.21 !.001Total mean power 3.0 mm 39.10 G 2.63 �0.24 G 0.68† .12z
Total mean power 4.0 mm 39.64 G 2.46 C0.29 G 0.73 .09z
Total mean power 5.0 mm 40.52 G 2.11 C1.18 G 0.96 !.001Total axial power 4.0 mm 38.88 G 2.65 �0.47 G 0.64† .003Total axial power 5.0 mm 39.19 G 2.55 �0.16 G 0.64† .26z
Total axial power 6.0 mm 39.52 G 2.48 C0.22 G 0.70 .22z
Total tangential power 3.0 mm 39.11 G 2.60 �0.24 G 0.71† .15z
Total tangential power 4.0 mm 39.94 G 2.37 C0.59 G 0.91 .007Total tangential power 5.0 mm 41.04 G 2.04 C1.69 G 1.27 !.001Total optical power 3.0 mm 39.07 G 2.78 �0.27 G 0.78† .13z
Total optical power 4.0 mm 39.39 G 2.76 C0.04 G 0.72 .77z
Total optical power 5.0 mm 39.90 G 2.68 C0.56 G 0.71 .002
BCK H2 Z back-calculated K-value using the Holladay 2 IOL formula
*K-value determined by method versus K-value determined by BCK H2†Mean K-value of method flatter than mean BCK H2 valuezMean K-value of method not statistically different from BCK H2 value
the equivalence limits (�0.50, 0.50), the Orbscan total
power value was concluded to be equivalent to the BCK
H2 value. Although several Orbscan total power values
were not statistically different from BCK H2 values and
correlated highly with BCK H2 values, only mean total axial
power 5.0 mm and mean total optical power 4.0 mmprovided a 95% CI within G0.50 D of the mean BCK H2
value (Table 6). A stepwise multivariate regression analysis
identified the 5.0 mm total axial power as providing the
highest predictive value for BCK H2 (P!.0001). Three
assessments of statistical power were completed using a
clinically meaningful difference of 0.50 D (between method
J CATARACT REFRACT SUR
and BCK H2) and 3 representative standard deviations
(0.65, 0.70, and 0.75); the statistical power of this study
was 91%, 87%, and 82%, respectively, assuming a 2-sided
paired test with a Z 0.05 for a sample size of 21.
DISCUSSION
Manual keratometry, automated keratometry, and
Placido disk–based topography are the most frequently
used techniques for measuring central power in normal,
unoperated corneas. Most manual keratometers and topog-
raphy systems use a corneal index of refraction of 1.3375,
Figure 2. The analysis tool on the Orbscan was used to
calculate the average power of the central 3.0 mm of
several total power maps, which use slit-scanning
technology to incorporate the contributions of both
posterior and anterior corneal surfaces.
G - VOL 33, JANUARY 2007 25
CORNEAL POWER DETERMINATION FOR IOL CALCULATION USING ORBSCAN II AFTER LASER REFRACTIVE SURGERY
Table 4. Comparison of BCK H2 and Atlas axial map K-values averaged from central regions of the cornea (N Z 10).
Mean G SD
Method Corneal Power (D)Variance from BCK H2 (D)
(Method � BCK H2) P Value*
Average simulated K 40.25 G 1.93 C1.14 G 0.77 .001Axial power 0 mm 40.09 G 2.16 C0.97 G 0.71 .002Axial power 3.0 mm 40.21 G 1.19 C1.09 G 0.74 .001Axial power 4.0 mm 40.52 G 1.95 C1.34 G 0.87 .006
BCK H2 Z back-calculated K-value using the Holladay 2 IOL formula
*K-value determined by method versus K-value determined by BCK H2 comparing K determined by method to BCK H2
which is based on the assumption that the posterior cornea
has a radius of curvature 1.2 mm less than its anterior coun-
terpart, its power is negative due to the difference in index
of refraction between the cornea and the aqueous, and the
central 2.0 to 3.0 mm corneal zone is spherical. Laser abla-
tion changes this fixed ratio as well as the central corneal
sphericity. For these reasons, manual keratometry is inac-
curate in estimating corneal power in eyes that have hadlaser refractive surgery.2–11
Computerized videokeratography is based on com-
puter analysis of Placido disk images projected onto the
corneal surface. Computerized videokeratography mea-
sures more than 5000 points over the entire cornea and
more than 1000 points within the central 3.0 mm.4 This ad-
ditional information can provide greater accuracy than
manual keratometry for measuring corneal power in nor-mal eyes2 and in eyes after radial keratotomy (RK).25 How-
ever, Seitz and Langenbucher6 showed that topography
J CATARACT REFRACT SURG26
may overestimate true corneal power in patients with pre-
vious PRK as the ratio of anterior to posterior curvature has
been surgically altered. Therefore, the default index of re-
fraction used by these instruments is no longer accurate
in determining the true power of the cornea. The present
study confirms that axial map parameters from the Atlas
topography system, which are based on direct measurement
of only the anterior surface curvature, overestimate centralcorneal power by a mean of 1.00 D or greater (Table 4).
Calculations not based on topography have, therefore,
been developed to provide alternative approaches for esti-
mating central corneal power after PRK and LASIK. These
include refraction-derived keratometric value calculation
and hard or RGP overrefraction. The refraction-based or
historical technique requires availability of K-values and
the SE before laser refractive surgery. The advantages ofthe contact lens overrefraction technique include detection
of vision loss from corneal surface irregularities and the use
Table 5. Calculation of the residual post-phacoemulsification SE refractive error if K-values based on each method were prospectively used in the Holladay
2 formula to calculate IOL power.
Calculated Residual SE Refractive Error (D)
Method
PearsonCorrelationto BCK H2 Median Mean G SD Range
WithinG0.50 Dof Target
(%)
WithinG1.00 Dof Target
(%)
Manual K 0.94 C0.78 C0.82 G 0.69 � 0.50 to C3.96 33.3 71.4Historical 0.90 �0.15 C0.04 G 0.85 � 0.71 to C2.27 42.1 89.4RGP 0.45 C0.87 C1.70 G 2.06 C0.60 to C5.36 0.0 40.0Wang et al.18 0.95 �0.53 � 0.39 G 0.57 � 1.18 to C0.50 50.0 90.0Total mean power 3.0 mm 0.97* �0.19 �0.17 G 0.48 � 0.89 to C1.16 66.6 95.2Total mean power 4.0 mm 0.96 C0.17 C0.20 G 0.52 � 0.45 to C1.24 66.6 90.4Total axial power 4.0 mm 0.97* �0.31 �0.33 G 0.45 � 1.07 to C0.87* 61.9 90.4Total axial power 5.0 mm 0.97* �0.03* �0.11 G 0.44* � 0.93 to C0.99 76.2 100.0*Total tangential power 3.0 mm 0.96 �0.17 � 0.17 G 0.50 � 0.99 to C1.23 71.4 95.2Total tangential power 4.0 mm 0.94 C0.37 C0.42 G 0.63 � 0.56 to C1.81 47.6 85.7Total optical power 3.0 mm 0.96 �0.13 �0.19 G 0.54 � 1.16 to C1.25 66.6 86.7Total optical power 4.0 mm 0.97* C0.06 C0.03 G 0.50 � 0.75 to C1.50 80.9* 95.2
BCK H2 Z back-calculated K-value using the Holladay 2 IOL formula; RGP Z rigid gas permeable
*Metric(s) with best value in each column
- VOL 33, JANUARY 2007
CORNEAL POWER DETERMINATION FOR IOL CALCULATION USING ORBSCAN II AFTER LASER REFRACTIVE SURGERY
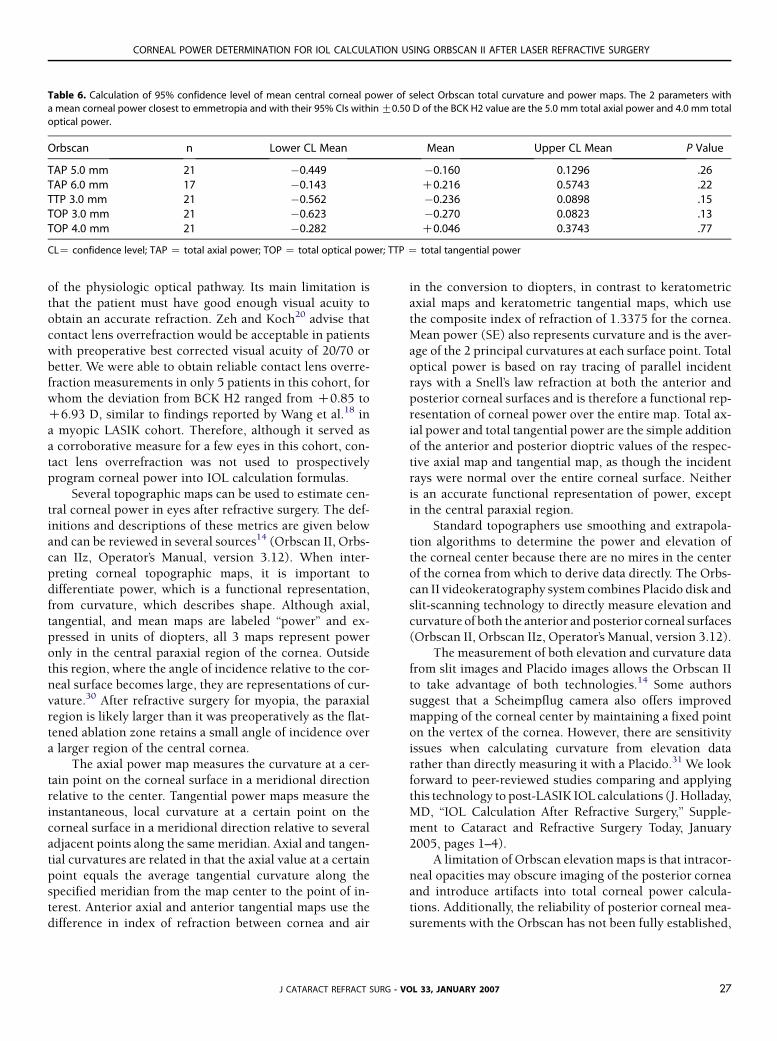
Table 6. Calculation of 95% confidence level of mean central corneal power of select Orbscan total curvature and power maps. The 2 parameters with
a mean corneal power closest to emmetropia and with their 95% CIs within G0.50 D of the BCK H2 value are the 5.0 mm total axial power and 4.0 mm total
optical power.
Orbscan n Lower CL Mean Mean Upper CL Mean P Value
TAP 5.0 mm 21 �0.449 �0.160 0.1296 .26TAP 6.0 mm 17 �0.143 C0.216 0.5743 .22TTP 3.0 mm 21 �0.562 �0.236 0.0898 .15TOP 3.0 mm 21 �0.623 �0.270 0.0823 .13TOP 4.0 mm 21 �0.282 C0.046 0.3743 .77
CLZ confidence level; TAP Z total axial power; TOP Z total optical power; TTP Z total tangential power
of the physiologic optical pathway. Its main limitation is
that the patient must have good enough visual acuity to
obtain an accurate refraction. Zeh and Koch20 advise that
contact lens overrefraction would be acceptable in patients
with preoperative best corrected visual acuity of 20/70 or
better. We were able to obtain reliable contact lens overre-fraction measurements in only 5 patients in this cohort, for
whom the deviation from BCK H2 ranged from C0.85 to
C6.93 D, similar to findings reported by Wang et al.18 in
a myopic LASIK cohort. Therefore, although it served as
a corroborative measure for a few eyes in this cohort, con-
tact lens overrefraction was not used to prospectively
program corneal power into IOL calculation formulas.
Several topographic maps can be used to estimate cen-tral corneal power in eyes after refractive surgery. The def-
initions and descriptions of these metrics are given below
and can be reviewed in several sources14 (Orbscan II, Orbs-
can IIz, Operator’s Manual, version 3.12). When inter-
preting corneal topographic maps, it is important to
differentiate power, which is a functional representation,
from curvature, which describes shape. Although axial,
tangential, and mean maps are labeled ‘‘power’’ and ex-pressed in units of diopters, all 3 maps represent power
only in the central paraxial region of the cornea. Outside
this region, where the angle of incidence relative to the cor-
neal surface becomes large, they are representations of cur-
vature.30 After refractive surgery for myopia, the paraxial
region is likely larger than it was preoperatively as the flat-
tened ablation zone retains a small angle of incidence over
a larger region of the central cornea.The axial power map measures the curvature at a cer-
tain point on the corneal surface in a meridional direction
relative to the center. Tangential power maps measure the
instantaneous, local curvature at a certain point on the
corneal surface in a meridional direction relative to several
adjacent points along the same meridian. Axial and tangen-
tial curvatures are related in that the axial value at a certain
point equals the average tangential curvature along thespecified meridian from the map center to the point of in-
terest. Anterior axial and anterior tangential maps use the
difference in index of refraction between cornea and air
J CATARACT REFRACT SURG
in the conversion to diopters, in contrast to keratometric
axial maps and keratometric tangential maps, which use
the composite index of refraction of 1.3375 for the cornea.
Mean power (SE) also represents curvature and is the aver-
age of the 2 principal curvatures at each surface point. Total
optical power is based on ray tracing of parallel incidentrays with a Snell’s law refraction at both the anterior and
posterior corneal surfaces and is therefore a functional rep-
resentation of corneal power over the entire map. Total ax-
ial power and total tangential power are the simple addition
of the anterior and posterior dioptric values of the respec-
tive axial map and tangential map, as though the incident
rays were normal over the entire corneal surface. Neither
is an accurate functional representation of power, exceptin the central paraxial region.
Standard topographers use smoothing and extrapola-
tion algorithms to determine the power and elevation of
the corneal center because there are no mires in the center
of the cornea from which to derive data directly. The Orbs-
can II videokeratography system combines Placido disk and
slit-scanning technology to directly measure elevation and
curvature of both the anterior and posteriorcorneal surfaces(Orbscan II, Orbscan IIz, Operator’s Manual, version 3.12).
The measurement of both elevation and curvature data
from slit images and Placido images allows the Orbscan II
to take advantage of both technologies.14 Some authors
suggest that a Scheimpflug camera also offers improved
mapping of the corneal center by maintaining a fixed point
on the vertex of the cornea. However, there are sensitivity
issues when calculating curvature from elevation datarather than directly measuring it with a Placido.31 We look
forward to peer-reviewed studies comparing and applying
this technology to post-LASIK IOL calculations (J. Holladay,
MD, ‘‘IOL Calculation After Refractive Surgery,’’ Supple-
ment to Cataract and Refractive Surgery Today, January
2005, pages 1–4).
A limitation of Orbscan elevation maps is that intracor-
neal opacities may obscure imaging of the posterior corneaand introduce artifacts into total corneal power calcula-
tions. Additionally, the reliability of posterior corneal mea-
surements with the Orbscan has not been fully established,
- VOL 33, JANUARY 2007 27
CORNEAL POWER DETERMINATION FOR IOL CALCULATION USING ORBSCAN II AFTER LASER REFRACTIVE SURGERY
particularly for post-refractive surgery eyes in which im-
age-detection software may have difficulty identifying the
posterior aspect of the corneal slit beam because of the
change in contrast (Roberts CJ, et al. IOVS 2003;
44:ARVO E-Abstract 2543).31–33 However, the anterior
surface is heavily weighted in the total power calculationsbecause of the 10-fold greater index of refraction difference
at the anterior corneal surface versus the posterior corneal
surface. Therefore, potential errors of the posterior surface
are minimized in the conversion to diopters.
Cheng and Lam26 incorporated Orbscan-derived ante-
rior (central 5.0 mm) and posterior (central 10.0 mm) radii
of curvature into a Gaussian optics formula to calculate
post-LASIK corneal power in 121 eyes. They describe closecorrelation between historical-based values and their
method (r Z 0.97; P!.001). Sonego-Krone et al.14 deter-
mined that direct measurement of central corneal power af-
ter myopic LASIK using total mean power and total optical
power Orbscan maps provides accurate post-refractive sur-
gery corneal power independent of historical refractive
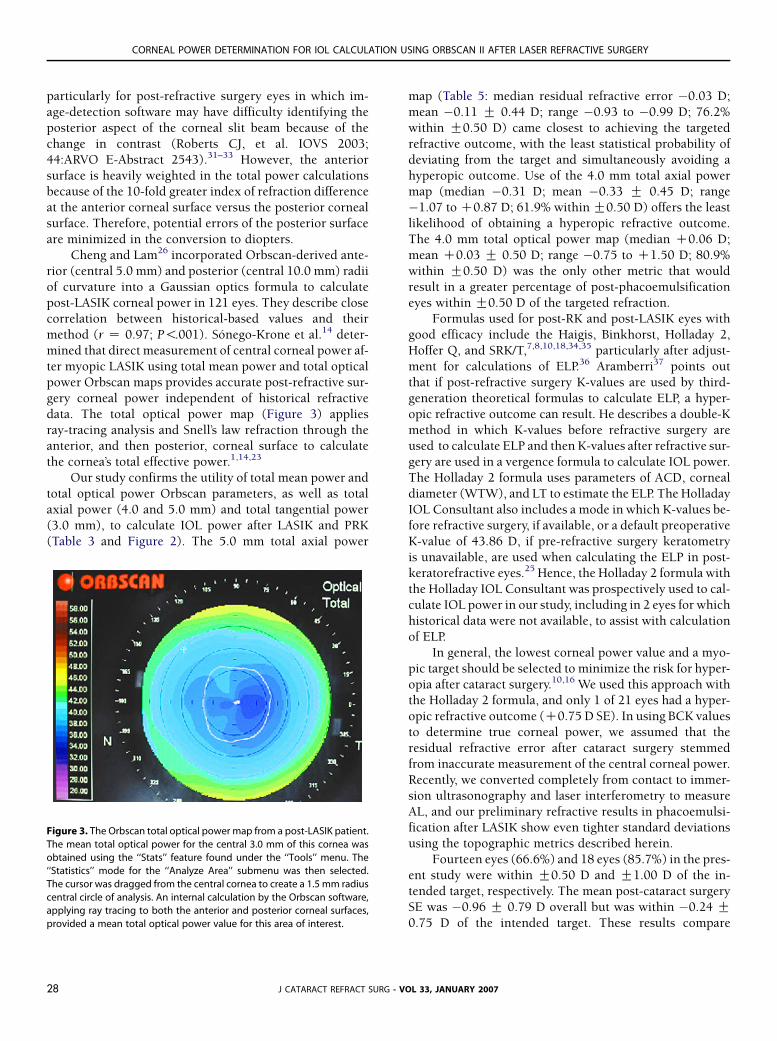
data. The total optical power map (Figure 3) applies
ray-tracing analysis and Snell’s law refraction through theanterior, and then posterior, corneal surface to calculate
the cornea’s total effective power.1,14,23
Our study confirms the utility of total mean power and
total optical power Orbscan parameters, as well as total
axial power (4.0 and 5.0 mm) and total tangential power
(3.0 mm), to calculate IOL power after LASIK and PRK
(Table 3 and Figure 2). The 5.0 mm total axial power
Figure 3. The Orbscan total optical power map from a post-LASIK patient.
The mean total optical power for the central 3.0 mm of this cornea was
obtained using the ‘‘Stats’’ feature found under the ‘‘Tools’’ menu. The
‘‘Statistics’’ mode for the ‘‘Analyze Area’’ submenu was then selected.
The cursor was dragged from the central cornea to create a 1.5 mm radius
central circle of analysis. An internal calculation by the Orbscan software,
applying ray tracing to both the anterior and posterior corneal surfaces,
provided a mean total optical power value for this area of interest.
J CATARACT REFRACT SURG -28
map (Table 5: median residual refractive error �0.03 D;
mean �0.11 G 0.44 D; range �0.93 to �0.99 D; 76.2%
within G0.50 D) came closest to achieving the targeted
refractive outcome, with the least statistical probability of
deviating from the target and simultaneously avoiding a
hyperopic outcome. Use of the 4.0 mm total axial powermap (median �0.31 D; mean �0.33 G 0.45 D; range
�1.07 to C0.87 D; 61.9% within G0.50 D) offers the least
likelihood of obtaining a hyperopic refractive outcome.
The 4.0 mm total optical power map (median C0.06 D;
mean C0.03 G 0.50 D; range �0.75 to C1.50 D; 80.9%
within G0.50 D) was the only other metric that would
result in a greater percentage of post-phacoemulsification
eyes within G0.50 D of the targeted refraction.Formulas used for post-RK and post-LASIK eyes with
good efficacy include the Haigis, Binkhorst, Holladay 2,
Hoffer Q, and SRK/T,7,8,10,18,34,35 particularly after adjust-
ment for calculations of ELP.36 Aramberri37 points out
that if post-refractive surgery K-values are used by third-
generation theoretical formulas to calculate ELP, a hyper-
opic refractive outcome can result. He describes a double-K
method in which K-values before refractive surgery areused to calculate ELP and then K-values after refractive sur-
gery are used in a vergence formula to calculate IOL power.
The Holladay 2 formula uses parameters of ACD, corneal
diameter (WTW), and LT to estimate the ELP. The Holladay
IOL Consultant also includes a mode in which K-values be-
fore refractive surgery, if available, or a default preoperative
K-value of 43.86 D, if pre-refractive surgery keratometry
is unavailable, are used when calculating the ELP in post-keratorefractive eyes.25 Hence, the Holladay 2 formula with
the Holladay IOL Consultant was prospectively used to cal-
culate IOL power in our study, including in 2 eyes for which
historical data were not available, to assist with calculation
of ELP.
In general, the lowest corneal power value and a myo-
pic target should be selected to minimize the risk for hyper-
opia after cataract surgery.10,16 We used this approach withthe Holladay 2 formula, and only 1 of 21 eyes had a hyper-
opic refractive outcome (C0.75 D SE). In using BCK values
to determine true corneal power, we assumed that the
residual refractive error after cataract surgery stemmed
from inaccurate measurement of the central corneal power.
Recently, we converted completely from contact to immer-
sion ultrasonography and laser interferometry to measure
AL, and our preliminary refractive results in phacoemulsi-fication after LASIK show even tighter standard deviations
using the topographic metrics described herein.
Fourteen eyes (66.6%) and 18 eyes (85.7%) in the pres-
ent study were within G0.50 D and G1.00 D of the in-
tended target, respectively. The mean post-cataract surgery
SE was �0.96 G 0.79 D overall but was within �0.24 G0.75 D of the intended target. These results compare
VOL 33, JANUARY 2007
CORNEAL POWER DETERMINATION FOR IOL CALCULATION USING ORBSCAN II AFTER LASER REFRACTIVE SURGERY
favorably to those reported using the double-K method
(mean post-cataract surgery SE C0.13 G 0.62 D), in which
a greater percentage of patients had a hyperopic result,37
and those reported using intraoperative autorefractive ret-
inoscopy (n Z 6; 83% within G1.00 D).38 Rosa et al.39
used a regression formula with correcting factors as a func-tion of AL to recalculate post-refractive surgery corneal
power so that pre-LASIK refractive data were not required.
With this approach, in the SRK/T formula, 47.4% of eyes
were within G1.00 D of emmetropia. Feiz et al.40 applied
a nomogram that adjusted IOL power based on post-LASIK
keratometry and the refractive change induced by LASIK.
Using their method, 63.2% and 84.2% of eyes were within
G0.50 D and G1.00 D of the intended target, respectively.However, as with the historical method, the preoperative
refraction data required for the Feiz-Mannis method is
not always available.
CONCLUSION
In patients with a history of keratorefractive surgery,
including LASIK and PRK, slit-scanning computerized
videokeratography that analyzes both the anterior and
posterior corneal surfaces more accurately predicts true
corneal power than manual keratometry or maps that
analyze the anterior surface alone. This study shows the
utility of parameters extracted from central Orbscan totalpower maps, particularly the averaged total axial power
in the central 5.0 mm of the cornea and the total optical
power in the central 4.0 mm, combined with the Holladay
2 IOL calculation formula in the Holladay IOL Consultant
software for preventing hyperopic refractive surprises after
phacoemulsification with IOL implantation. This method
offers the advantage of not relying on the availability of
pre-LASIK/PRK data or the accuracy of refraction-based cal-culations and, in our series, achieved a better refractive out-
come than the history method. Future studies are planned
to compare K-values derived from Orbscan total power
maps to values of other mathematical derivations of corneal
power such as those proposed by Masket and Masket,41
Cheng and Lam,26 Feiz and Mannis,11 among others,42–44
and to recalculate the Orbscan II posterior elevation directly
from the slit images using a more advanced software version.
REFERENCES
1. Cua IY, Qazi MA, Lee SF, Pepose JS. Intraocular lens calculations in
patients with corneal scarring and irregular astigmatism. J Cataract
Refract Surg 2003; 29:1352–1357
2. Cuaycong MJ, Gay CA, Emery J, et al. Comparison of the accuracy of
computerized videokeratography and keratometry for use in intraoc-
ular lens calculations. J Cataract Refract Surg 1993; 19:178–181
3. Hoffer KJ. Intraocular lens power calculation for eyes after refractive
keratotomy. J Refract Surg 1995; 11:490–493
J CATARACT REFRACT SURG
4. Seitz B, Langenbucher A, Nguyen NX, et al. Underestimation of intra-
ocular lens power for cataract surgery after myopic photorefractive
keratectomy. Ophthalmology 1999; 106:693–702
5. Seitz B, Langenbucher A. Intraocular lens calculations status after cor-
neal refractive surgery. Curr Opin Ophthalmol 2000; 11:35–46
6. Seitz B, Langenbucher A. Intraocular lens power calculation in eyes
after corneal refractive surgery. J Refract Surg 2000; 16:349–361
7. Gimbel HV, Sun R. Accuracy and predictability of intraocular lens
power calculation after laser in situ keratomileusis. J Cataract Refract
Surg 2001; 27:571–576
8. Speicher L. Intra-ocular lens calculation status after corneal refractive
surgery. Curr Opin Ophthalmol 2001; 12:17–29
9. Hamilton DR, Hardten DR. Cataract surgery in patients with prior
refractive surgery. Curr Opin Ophthalmol 2003; 14:44–53
10. Argento C, Cosentino MJ, Badoza D. Intraocular lens power calcula-
tion after refractive surgery. J Cataract Refract Surg 2003; 29:1346–
1351
11. Feiz V, Mannis MJ. Intraocular lens power calculation after corneal
refractive surgery. Curr Opin Ophthalmol 2004; 15:342–349
12. Schafer S, Kurzinger G, Spraul CW, Kampmeier J. Vergleichende Ergeb-
nisse der Hornhautbrechkraftbestimmung dreier Messgerate nach
LASIK. Klin Monatsbl Augenheilkd 2005; 222:419–423
13. Anera RG, Jimenez JR, Jimenez del Barco L, et al. Changes in corneal
asphericity after laser in situ keratomileusis. J Cataract Refract Surg
2003; 29:762–768
14. Sonego-Krone S, Lopez-Moreno G, Beaujon-Balbi OV, et al. A direct
method to measure the power of the central cornea after myopic in
situ keratomileusis. Arch Ophthalmol 2004; 122:159–166
15. Twa MD, Roberts C, Mahmoud AM, Chang JS. Response of the poste-
rior corneal surface to laser in situ keratomileusis for myopia. J Cata-
ract Refract Surg 2005; 31:61–71
16. Hamed AM, Wang L, Misra M, Koch DD. A comparative analysis of five
methods of determining corneal refractive power in eyes that have
undergone myopic laser in situ keratomileusis. Ophthalmology
2002; 109:651–658
17. Kim J-H, Lee D-H, Joo C-K. Measuring corneal power for intraocular
lens power calculation after refractive surgery; comparison of
methods. J Cataract Refract Surg 2002; 28:1932–1938
18. Wang L, Booth MA, Koch DD. Comparison of intraocular lens power
calculation methods in eyes that have undergone LASIK. Ophthalmol-
ogy 2004; 111:1825–1831
19. Latkany RA, Chokshi AR, Speaker MG, et al. Intraocular lens calcu-
lations after refractive surgery. J Cataract Refract Surg 2005; 31:
562–570
20. Zeh WG, Koch DD. Comparison of contact lens overrefraction and
standard keratometry for measuring corneal curvature in eyes with
lenticular opacity. J Cataract Refract Surg 1999; 25:898–903
21. Celikkol L, Pavlopoulos G, Weinstein B, et al. Calculation of intraocular
lens power after radial keratotomy with computerized videokeratog-
raphy. Am J Ophthalmol 1995; 120:739–750
22. Husain SE, Kohnen T, Maturi R, et al. Computerized videokeratography
and keratometry in determining intraocular lens calculations. J Cata-
ract Refract Surg 1996; 22:362–366
23. Srivannaboon S, Reinstein DZ, Sutton HFS, Holland SP. Accuracy of
Orbscan total optical power maps in detecting refractive change after
myopic laser in situ keratomileusis. J Cataract Refract Surg 1999;
25:1596–1599
24. Ladas JG, Boxer Wachler BS, Hunkeler JD, Durrie DS. Intraocular lens
power calculations using corneal topography after photorefractive
keratectomy. Am J Ophthalmol 2001; 132:254–255
25. Packer M, Brown LK, Hoffman RS, Fine IH. Intraocular lens power cal-
culation after incisional and thermal keratorefractive surgery. J Cata-
ract Refract Surg 2004; 30:1430–1434
- VOL 33, JANUARY 2007 29
CORNEAL POWER DETERMINATION FOR IOL CALCULATION USING ORBSCAN II AFTER LASER REFRACTIVE SURGERY
26. Cheng ACK, Lam DSC. Keratometry for intraocular lens power calcula-
tion using Orbscan II in eyes with laser in situ keratomileusis. J Refract
Surg 2005; 21:365–368
27. Smith RJ, Chan W-K, Maloney RK. The prediction of surgically induced
refractive change from corneal topography. Am J Ophthalmol 1998;
125:44–53
28. Sanders DR, Retzlaff J, Kraff MC. Comparison of the SRK II� formula
and other second generation formulas. J Cataract Refract Surg 1998;
14:136–141
29. Feiz V, Mannis MJ, Garcia-Ferrer F, et al. Intraocular lens power calcu-
lation after laser in situ keratomileusis for myopia and hyperopia;
a standardized approach. Cornea 2001; 20:792–797
30. Roberts C. The accuracy of ‘‘power’’ maps to display curvature data
in corneal topography systems. Invest Ophthalmol Vis Sci 1994;
35:3525–3532
31. Roberts C. Corneal topography: basic principles. In: Azar DT, Gatinel D,
Hoand-Xuan T, II, eds, Refractive Surgery, 2nd ed. St Louis, MO,
Mosby, 2006; In Press
32. Chakrabarti HS, Craig JP, Brahma A, et al. Comparison of corneal thick-
ness measurements using ultrasound and Orbscan slit-scanning to-
pography in normal and post-LASIK eyes. J Cataract Refract Surg
2001; 27:1823–1828
33. Prisant O, Calderon N, Chastang P, et al. Reliability of pachymetric
measurements using Orbscan after excimer refractive surgery. Oph-
thalmology 2003; 110:511–515
34. Odenthal MTP, Eggink CA, Melles G, et al. Clinical and theoretical
results of intraocular lens power calculation for cataract surgery after
photorefractive keratectomy for myopia. Arch Ophthalmol 2002;
120:421–438
35. Koo OS, Kim J-G, Song BJ. Comparison of IOL powers by corrected
method in eyes after PRK and LASIK. Korean J Ophthalmol 2002;
16:26–31
J CATARACT REFRACT SURG30
36. Koch DD, Wang L. Calculating IOL power in eyes that have had
refractive surgery [editorial]. J Cataract Refract Surg 2003; 29:
2039–2042
37. Aramberri J. Intraocular lens power calculation after corneal refractive
surgery: double-K method. J Cataract Refract Surg 2003; 29:2063–
2068
38. Ianchulev T, Salz J, Hoffer K, et al. Intraoperative optical refractive
biometry for intraocular lens power estimation without axial length
and keratometry measurements. J Cataract Refract Surg 2005; 31:
1530–1536
39. Rosa N, Capasso L, Lanza M, et al. Reliability of a new correcting factor
in calculating intraocular lens power after refractive corneal surgery.
J Cataract Refract Surg 2005; 31:1020–1024
40. Feiz V, Moshirfar M, Mannis MJ, et al. Nomogram-based intraocu-
lar lens power adjustment after myopic photorefractive keratec-
tomy and LASIK; a new approach. Ophthalmology 2005; 112:
1381–1387
41. Masket S, Masket SE. Simple regression formula for intraocular
lens power adjustment in eyes requiring cataract surgery after ex-
cimer laser photoablation. J Cataract Refract Surg 2006; 32:430–
434
42. Shammas HJ, Shammas MC, Garabet A, et al. Correcting the corneal
power measurements for intraocular lens power calculations after
myopic laser in situ keratomileusis. Am J Ophthalmol 2003; 136:
426–432
43. Jin GJC, Crandall AS, Jin Y. Analysis of intraocular lens power calcula-
tion for eyes with previous myopic LASIK. J Refract Surg 2006; 22:
387–395
44. Walter KA, Gagnon MR, Hoopes PC Jr, Dickinson PJ. Accurate intra-
ocular lens power calculation after myopic laser in situ keratomi-
leusis, bypassing corneal power. J Cataract Refract Surg 2006;
32:425–429
- VOL 33, JANUARY 2007


![Ratiometry of Monomer/Excimer Emissions of Dipyrenyl Calix[4]arene in Aqueous Media](https://static.fdokumen.com/doc/165x107/63155d5385333559270d17fd/ratiometry-of-monomerexcimer-emissions-of-dipyrenyl-calix4arene-in-aqueous-media.jpg)