Oxidation pathways and emission sources of atmospheric ...
17
Atmos. Chem. Phys., 22, 5099–5115, 2022 https://doi.org/10.5194/acp-22-5099-2022 © Author(s) 2022. This work is distributed under the Creative Commons Attribution 4.0 License. Research article Oxidation pathways and emission sources of atmospheric particulate nitrate in Seoul: based on δ 15 N and Δ 17 O measurements Saehee Lim 1 , Meehye Lee 1 , Joel Savarino 2 , and Paolo Laj 2 1 Department of Earth and Environmental Sciences, Korea University, Seoul 02841, South Korea 2 Institute of Environmental Geosciences (IGE), Univ. Grenoble Alpes, CNRS, IRD, Grenoble INP, 38000 Grenoble, France Correspondence: Meehye Lee ([email protected]) Received: 10 June 2021 – Discussion started: 19 July 2021 Revised: 4 January 2022 – Accepted: 25 January 2022 – Published: 19 April 2022 Abstract. PM 2.5 haze pollution driven by secondary inorganic NO - 3 has been a great concern in East Asia. It is, therefore, imperative to identify its sources and oxidation processes, for which nitrogen and oxygen stable isotopes are powerful tracers. Here, we determined the δ 15 N (NO - 3 ) and 1 17 O (NO - 3 ) of PM 2.5 in Seoul dur- ing the summer of 2018 and the winter of 2018–2019 and estimated quantitatively the relative contribution of oxidation pathways for particulate NO - 3 and investigated major NO x emission sources. In the range of PM 2.5 mass concentration from 7.5 μg m -3 (summer) to 139.0 μg m -3 (winter), the mean δ 15 N was -0.7‰ ± 3.3 ‰ and 3.8‰ ± 3.7 ‰, and the mean 1 17 O was 23.2‰ ± 2.2 ‰ and 27.7‰ ± 2.2 ‰ in the summer and winter, respectively. While OH oxidation was the dominant pathway for NO - 3 during the summer (87 %), nighttime formation via N 2 O 5 and NO 3 was relatively more important (38 %) during the winter, when aerosol liquid water content (ALWC) and nitrogen oxidation ratio (NOR) were higher. Interestingly, the highest 1 17 O was coupled with the lowest δ 15 N and highest NOR during the record-breaking winter PM 2.5 episodes, revealing the criti- cal role of photochemical oxidation process in severe winter haze development. For NO x sources, atmospheric δ 15 N (NO x ) estimated from measured δ 15 N (NO - 3 ) considering isotope fractionation effects indicates vehicle emissions as the most important emission source of NO x in Seoul. The contribution from biogenic soil and coal combustion was slightly increased in summer and winter, respectively. Our results built on a multiple-isotope approach provide the first explicit evidence for NO - 3 formation processes and major NO x emission sources in the Seoul megacity and suggest an effective mitigation measure to improve PM 2.5 pollution. 1 Introduction In northeast Asia, air pollution characterized by high PM 2.5 (particulate matter with aerodynamic diameter smaller than 2.5 μm) and ozone concentrations has received significant at- tention due to its serious effects on human health (Lelieveld et al., 2015; Xie et al., 2019). As a result of extensive efforts by East Asian countries to improve the ambient air quality, anthropogenic emissions of SO x , NO x , and CO have been significantly reduced, particularly in China (Cheng et al., 2019). Nonetheless, the number of severe haze events and the duration have been increased, which is not understood clearly. It is also noteworthy that there are common chemical and meteorological characteristics in the occurrence of the PM 2.5 haze pollution in northeast Asia, such as inorganic-species- dominated chemical composition (Liu et al., 2018; Shao et al., 2018; Wang et al., 2019a) and transboundary transport of haze aerosol depending on the synoptic atmospheric cir- culation (Quan et al., 2020; Shi et al., 2020; Zheng et al., 2019). Overall, approximately 40 % of PM 2.5 consists of NO - 3 , SO 2- 4 , and NH + 4 (secondary inorganic aerosol, SIA) in both urban and background sites in China (Liu et al., 2018) Published by Copernicus Publications on behalf of the European Geosciences Union.
-
Upload
khangminh22 -
Category
Documents
-
view
2 -
download
0
Transcript of Oxidation pathways and emission sources of atmospheric ...

Atmos. Chem. Phys., 22, 5099–5115, 2022https://doi.org/10.5194/acp-22-5099-2022© Author(s) 2022. This work is distributed underthe Creative Commons Attribution 4.0 License.
Research
article
Oxidation pathways and emission sources ofatmospheric particulate nitrate in Seoul:based on δ15N and ∆17O measurements
Saehee Lim1, Meehye Lee1, Joel Savarino2, and Paolo Laj2
1Department of Earth and Environmental Sciences, Korea University, Seoul 02841, South Korea2Institute of Environmental Geosciences (IGE), Univ. Grenoble Alpes,
CNRS, IRD, Grenoble INP, 38000 Grenoble, France
Correspondence: Meehye Lee ([email protected])
Received: 10 June 2021 – Discussion started: 19 July 2021Revised: 4 January 2022 – Accepted: 25 January 2022 – Published: 19 April 2022
Abstract. PM2.5 haze pollution driven by secondary inorganic NO−3 has been a great concern in East Asia. Itis, therefore, imperative to identify its sources and oxidation processes, for which nitrogen and oxygen stableisotopes are powerful tracers. Here, we determined the δ15N (NO−3 ) and 117O (NO−3 ) of PM2.5 in Seoul dur-ing the summer of 2018 and the winter of 2018–2019 and estimated quantitatively the relative contribution ofoxidation pathways for particulate NO−3 and investigated major NOx emission sources. In the range of PM2.5
mass concentration from 7.5 µg m−3 (summer) to 139.0 µg m−3 (winter), the mean δ15N was −0.7 ‰± 3.3 ‰and 3.8 ‰± 3.7 ‰, and the mean 117O was 23.2 ‰± 2.2 ‰ and 27.7 ‰± 2.2 ‰ in the summer and winter,respectively. While OH oxidation was the dominant pathway for NO−3 during the summer (87 %), nighttimeformation via N2O5 and NO3 was relatively more important (38 %) during the winter, when aerosol liquid watercontent (ALWC) and nitrogen oxidation ratio (NOR) were higher. Interestingly, the highest 117O was coupledwith the lowest δ15N and highest NOR during the record-breaking winter PM2.5 episodes, revealing the criti-cal role of photochemical oxidation process in severe winter haze development. For NOx sources, atmosphericδ15N (NOx) estimated from measured δ15N (NO−3 ) considering isotope fractionation effects indicates vehicleemissions as the most important emission source of NOx in Seoul. The contribution from biogenic soil and coalcombustion was slightly increased in summer and winter, respectively. Our results built on a multiple-isotopeapproach provide the first explicit evidence for NO−3 formation processes and major NOx emission sources inthe Seoul megacity and suggest an effective mitigation measure to improve PM2.5 pollution.
1 Introduction
In northeast Asia, air pollution characterized by high PM2.5(particulate matter with aerodynamic diameter smaller than2.5 µm) and ozone concentrations has received significant at-tention due to its serious effects on human health (Lelieveldet al., 2015; Xie et al., 2019). As a result of extensive effortsby East Asian countries to improve the ambient air quality,anthropogenic emissions of SOx , NOx , and CO have beensignificantly reduced, particularly in China (Cheng et al.,2019). Nonetheless, the number of severe haze events and
the duration have been increased, which is not understoodclearly.
It is also noteworthy that there are common chemical andmeteorological characteristics in the occurrence of the PM2.5haze pollution in northeast Asia, such as inorganic-species-dominated chemical composition (Liu et al., 2018; Shao etal., 2018; Wang et al., 2019a) and transboundary transportof haze aerosol depending on the synoptic atmospheric cir-culation (Quan et al., 2020; Shi et al., 2020; Zheng et al.,2019). Overall, approximately 40 % of PM2.5 consists ofNO−3 , SO2−
4 , and NH+4 (secondary inorganic aerosol, SIA) inboth urban and background sites in China (Liu et al., 2018)
Published by Copernicus Publications on behalf of the European Geosciences Union.

5100 S. Lim et al.: Oxidation pathways and emission sources of atmospheric particulate nitrate in Seoul
for the period of 2012–2013. The mass contribution of SIAwas further augmented up to 69 % at urban Beijing and islandsites (Changdao) in the North China Plain (NCP) during the2016 spring (Lim et al., 2020). A large increase in SIA massis particularly associated with efficient formation of NO−3 incold months (most frequently in December to March), lead-ing to a rapid increase in PM2.5 concentration and develop-ing a persistent haze pollution on a regional scale (Li et al.,2018; Xu et al., 2019). Recent studies suggest that the re-gional occurrence of the PM2.5 haze events derived by NO−3across the Asian continent has been associated with long-range transport of air pollutants promoted by cold fronts andtheir intrusion in downward regions by the development ofthe atmospheric boundary layer (Kang et al., 2019; Lee et al.,2019). However, scientific understanding is still limited be-cause the rapid increase of fine-aerosol NO−3 is the result ofthe complex interplay of oxidation and transformation mech-anisms producing NO−3 from various fossil and non-fossilsources of NOx with micro-to-synoptic meteorology creatingthe conditions for NO−3 formation. In addition, consideringthat NOx emissions from bottom-up emission inventory aresmaller than top-down estimates by satellites (e.g., Goldberget al., 2019), our understanding of NOx emissions is poor.
In order to better understand processes of NO−3 forma-tion including NOx emission sources in East Asia, a growingnumber of recent studies have suggested nitrogen and oxy-gen stable-isotope-based measurement as a robust and usefultool for providing important clues for NO−3 formation as wellas NOx emission sources (He et al., 2018; Lim et al., 2019,2020; Song et al., 2019; Zong et al., 2017, 2020). The iso-topic composition is expressed in parts per thousand (‰) andreported as δ (‰)= (Rsample/Rstandard−1)×1000 withR be-ing the ratio of the heavy isotope over the light isotope (e.g.,15N/14N, 18O/16O, 17O/16O) in a sample (Rsample) and inthe international standard (Rstandard). The international stan-dards are the Vienna Standard Mean Ocean Water (VSMOW)and atmospheric N2 for oxygen and nitrogen ratios. In termsof NOx emission sources, the major NOx sources are dis-tinguished in their nitrogen isotopic compositions: biogenicsoil (driven by fertilizer use; −35.1 ‰± 10.2 ‰) (Felix andElliott, 2014; Li and Wang, 2008; Yu and Elliott, 2017),biomass burning (1.8 ‰± 1.8 ‰) (Fibiger and Hastings,2016), vehicle emissions (−2.5 ‰± 1.5 ‰) (Walters et al.,2015), and coal combustion (14.2 ‰± 4.5 ‰) (Felix et al.,2012; Heaton, 1990). Despite evidence that δ15N (NOx) canserve as a useful tracer of NOx emission sources, during NOyphotochemical cycling and its loss processes, the δ15N ofinitial NOx can be significantly altered by both kinetic andequilibrium isotopic fractionation effects (εN), complicatingthe link between δ15N (NO−3 ) and δ15N (NOx) (Freyer et al.,1993; Li et al., 2020).
The formation processes of HNO3 in the atmosphere con-sist of NO−NO2 photochemical cycle Reactions (R1)–(R3)and post NO2 oxidation Reactions (R4)–(R8). During theNOx cycling, nitrogen isotopic fractionation is affected by
unidirectional reactions of the Leighton cycle and NOx iso-tope exchange equilibrium. A recent laboratory experimenthas shown that the Leighton cycle isotope effect (LCIE) as-sociated solely with O3 Reaction (R1) and equilibrium iso-topic effect (EIE) were−10 ‰ and 28.9 ‰ at room tempera-ture, respectively (Li et al., 2020). The relative importance ofthese two effects on δ15N (NO2) also depends on NOx levels,leading to an increase (decrease) in δ15N (NO2) relative toδ15N (NOx) values at high (low) NOx conditions (Kamezakiet al., 2019; Li et al., 2020; Walters et al., 2018). Overall, thenitrogen isotope exchange equilibrium has been suggestedto be the dominant fractionation process in NO−NO2 cy-cling at urban atmosphere (Freyer et al., 1993) and oxidationreactions forming nitric acid (HNO3) and particulate NO−3(Savarino et al., 2013).
NO+O3→ NO2+O2, (R1)NO+RO2 (HO2)→ NO2+RO(OH) , (R2)
NO2+ hv→ NO+O(3P), (R3)NO2+OH→ HNO3, (R4)NO2+O3→ NO3+O2, (R5)
NO2+NO3+M←→ N2O5, (R6)
N2O5+H2O 2HNO3 (aq) , (R7)NO3+RH→ HNO3+R, (R8)
where M is an unreactive third body and R is any organicgroup.
The kinetic fractionation effect during daytime oxidationof NO2 to HNO3 Reaction (R4) is relatively minor, beingestimated to be −3 ‰ (Freyer, 1991). During the nighttimewhen most NO is oxidized to NO2 without NOx photoly-sis, the isotopic equilibrium between NO2, NO3, and N2O5should be achieved (Reaction R6). The nighttime thermalequilibrium likely favors the partitioning of 15N into N2O5relative to NO2 and consequently induces a large isotopicfractionation effect of 25.5 ‰ (Reactions R5–R6; Waltersand Michalski, 2015). On the other hand, the nitrogen par-titioning between NO2 and NO3 Reaction (R5) may inducea fractionation effect of about −18 ‰ (Walters and Michal-ski, 2015). These N isotope fractionation effects should befirst evaluated to explore NOx source contributions, whichshould be based on combining with a robust tracer for thecontributions of NO−3 oxidation pathways.
Lately, 117O (NO−3 ) has been used for tracing NO−3 ox-idation pathways (Alexander et al., 2009, 2020; Morin etal., 2009; Savarino et al., 2007, 2013). Earlier researchesobserved that atmospheric NO−3 is anomalously enrichedin 17O (Michalski et al., 2003), which stems from O3 for-mation reactions, where a rare isotope effect leads to ex-cess 17O enrichment relative to what is expected based onthe 18O enrichments (Thiemens, 1999, 2006). This enrich-ment is quantified by 117O notation (17O excess, definedas δ17O−0.52×δ18O). Since non-zero117O strictly reflects
Atmos. Chem. Phys., 22, 5099–5115, 2022 https://doi.org/10.5194/acp-22-5099-2022

S. Lim et al.: Oxidation pathways and emission sources of atmospheric particulate nitrate in Seoul 5101
a photochemical effect, NO−3 produced by denitrification insoils should have117O of zero. The mass-independent117Osignature of O3 is transferred to NOx , in which the numberof oxygen atoms from O3 is involved in NOx . In this way,the 117O (NO−3 ) is served as a conservative marker to trackthe chemical formation of atmospheric NO−3 . Photochemi-cal formation by peroxy radicals (HO2 and RO2) leads toa relatively low 117O (NO−3 ), whereas nighttime formationthrough N2O5 and NO3 results in high 117O (Michalski etal., 2003; Morin et al., 2009; Savarino et al., 2007). Conse-quently, the difference in117O (NO−3 ) suggests approachinga proportional contribution of daytime and nighttime oxida-tion of NO−3 .
To date, few field studies have coupled 117O (NO−3 )and δ15N (NO−3 ) to investigate NOx-to-NO−3 oxidation pro-cesses and emission sources of NOx , e.g., field researches inJapan (Nelson et al., 2018); West Virginia, USA (Rose et al.,2019); Shanghai, China (He et al., 2020); and Beijing, China(He et al., 2018; Song et al., 2020).
In this study, we present the measurement results of δ15Nand 117O of NO−3 in Seoul during the summer of 2018 andthe winter of 2018–2019, when we encountered the record-breaking PM2.5 concentrations. Then, the δ15N and 117Omeasurements are used to evaluate seasonally distinct atmo-spheric oxidation pathways of NO−3 and to explore majorNOx source contributions in the study region.
2 Measurements and methods
2.1 Sampling
We collected PM2.5 filter samples on the rooftop of the six-story Asan science building at the Korea University cam-pus located in northeast Seoul, the capital of South Korea(37.59◦ N, 127.02◦ E; Fig. 1) during the summer of 2018(26 May to 22 August; n= 13) and the winter of 2018–2019(27 December to 8 March; n= 18). Seoul is a metropolitanarea with a population of 9.77 million and known to be in-fluenced by heavy road traffic all around. The PM2.5 particu-lates were collected on quartz filters (20 cm× 25 cm; PallflexProducts, Putnam, USA) at a nominal flow rate of 96 m3 hr−1
for 1 to 3 d using a high-volume air sampler (3000 series,Ecotech, Australia). Filters were analyzed for water-solubleions, carbonaceous compounds, total nitrogen (TN) and car-bon (TC), and stable nitrogen and oxygen isotopic ratios.Reactive gases including O3, NO, NO2, SO2, and CO anda meteorological suite including air temperature, relative hu-midity, and wind speed and direction were measured hourlyat the nearby monitoring sites run by the National Institute ofEnvironmental Research (NIER) and the Korea Meteorologi-cal Administration (KAM), respectively. These data were av-eraged daily for comparison with filter-based chemical com-position data, if necessary.
2.2 Chemical analyses
Filters were stored in a freezer pending chemical analysis.Chemical composition of PM2.5 was determined for eightwater-soluble ions (Cl−, NO−3 , SO2−
4 , Na+, NH+4 , K+, Ca2+,and Mg2+) by ion chromatography (IC; Eco IC, Metrohm,Switzerland), organic carbon (OC) and elemental carbon(EC) by an OC-EC analyzer (Sunset Laboratory Inc., US)using the thermo-optical transmittance method (NIOSH870),and TC and total nitrogen (TN) by an elemental analyzer(EA, Fisons NA-1500NC, Thermo, Waltham, MA, USA).Mass concentrations of these constituents were corrected forlaboratory and field blanks. The detection limit, determinedas 3 standard deviations (SD) above blank concentrations,was<0.1 ppm for ionic species, 0.5 µg cm−3 for TC (the sumof OC and EC), and 0.8 g µgN and 0.5 µgC per punched fil-ter area for TN and TC, respectively. Details of the analyticalmethods can be found elsewhere (Lim et al., 2020).
Following the bacterial denitrifier method (Casciotti et al.,2002; McIlvin and Casciotti, 2011), the 117O of NO−3 wasmeasured simultaneously with δ18O and δ15N coupled withan isotope ratio mass spectrometry (IRMS) measurement us-ing an in-house peripheral system at the Université GrenobleAlpes (Morin et al., 2009). In brief, NO−3 of samples wasconverted to N2O via bacterial denitrification, and the N2Owas further converted into O2 and N2, which were separatedvia a gas chromatography column before being introduced tothe IRMS system (Thermo Finnigan MAT 253 isotope ratiomass spectrometer). Samples were measured in batch withreference materials following strictly the identical treatmentprinciples, including the same water matrix for standards andsamples. Together with samples, a subset of international ni-trate reference materials (US Geological Survey 32, 34, and35, as well as their mixtures) was measured for correctionand calibration of117O and δ18O values relative to VSMOWand δ15N values relative to air N2. The overall accuracy ofthe method is estimated as the reduced standard deviationof the residuals from the linear regression between the mea-sured reference materials and their expected values (Morinet al., 2009). For these sets of analyses, the obtained uncer-tainties (1σ ) were 0.4 ‰ and 0.3 ‰ for 117O (NO−3 ) andδ15N (NO−3 ), respectively. The analytical procedure used inthis study strictly followed the method described in Morinet al. (2009), which adheres to the new standard bacterialmethod coupled with the gold catalyst for the thermal de-composition of N2O into N2 and O2 (Kaiser et al., 2007).
2.3 Quantifying isotope fractionation effects
2.3.1 Isotope fractionation effects of NO2 oxidation toatmospheric particulate NO−
3: δ15N (NO−
3)
The HNO3 forms through three major pathways including(i) OH pathway, (ii) O3 pathway associated with N2O5, and(iii) O3 pathway associated with NO3.
https://doi.org/10.5194/acp-22-5099-2022 Atmos. Chem. Phys., 22, 5099–5115, 2022

5102 S. Lim et al.: Oxidation pathways and emission sources of atmospheric particulate nitrate in Seoul
Figure 1. Location of the study region. (a) Seoul metropolitan area in South Korea; the map was generated using the open-source software R(http://www.R-project.org/, last access: 2 February 2021). (b) Sampling site of the Korea University campus in the northeast Seoul; the mapwas taken from © Kakao maps (https://map.kakao.com/, last access: 29 December 2021).
OH pathway
When NO and NO2 coexist in similar quantities due to theLeighton cycle, 15N is preferentially partitioned into NO2via the equilibrium isotope effect, leading to higher δ15N inNO2 relative to NO and NOx (Freyer et al., 1993; Walters etal., 2016). Considering the comparable concentrations of NOand NO2 over a year in Seoul (Fig. S1 in the Supplement),the N isotope effects on δ15N (NO−3 ) should be significantlyaffected by NOx photochemical interactions. The relative im-portance of EIE and LCIE to δ15N(NO2) can be assessedby comparing lifetimes of NO2 with respect to isotope ex-change with NO (τexchange) and photolysis (τNO2+hv). In thisregard, the “A” factor was defined as τexchange/τNO2+hv =
jNO2/k1×[NO](k1 = 8.14× 10−14 cm3 s−1, Sharma et al.,1970) by Li et al. (2020, 2021). These studies demonstratedthat A was as small as 0.01–0.5 in the EIE-dominated regimewith NOx >20 ppbv and the ratio of NO2/NOx <0.6. InSeoul, to simply evaluate the relative importance of EIE andLCIE only (not for 15N correction), the A factor was esti-mated to be 0.08±0.20 (median ±SD) and 0.60±0.51 dur-ing the winter and summer months, respectively, indicatingthe significant influence of the equilibrium isotope effect onNO−NO2 isotopic fractionation. The time series jNO2 wascalculated using the Master Chemical Mechanism (MCM)model (Saunders et al., 2003).
After NOx photochemical cycling, NO2 is oxidized by thereaction with OH radical to form atmospheric HNO3 (HNO3Reaction R4 pathway). The N fractionation effect of partic-ulate NO−3 produced via the HNO3 Reaction (R4) pathway(ε1, unit in ‰) can be expressed as the following, neglect-ing kinetic isotope effects associated with the HNO3 Reac-tion (R4) pathway (Walters and Michalski, 2016):
δ15N(HNO3) (R4)= δ15N(NO2)= δ15N(NOx)+ ε1, (1a)
ε1 =((
15αNO2/NO−1
)(1− fNO2
))/((
1− fNO2
)+
(15αNO2/NO× fNO2
)), (1b)
where fNO2 is the fraction of NO2 relative to the total NOx ,and 15αNO2/NO is the temperature-dependent isotope equi-librium exchange fractionation factor for NO2/NO (Walterset al., 2016). In the present study, the measured fNO2 wasused individually for summer samples, and a seasonal meanfNO2 (0.69) was applied to winter samples due to the lack ofavailability of continuous NO−NO2 measurement data.
Oxidation of NOx to HNO3 is regarded as the formationpathway of particulate NO−3 via the HNO3 Reaction (R4)pathway due to the unconstrained isotope fractionation effectbetween HNO3 and NO−3 , resulting in the following equa-tion:
δ15N(HNO3) (R4)= δ15N(NO−3
)(R4) . (1c)
O3 pathways associated with N2O5 and NO3
During the nighttime when NO is oxidized into NO2 with-out photolyzing back to NO and fresh emissions of NO arenegligible, NOx exists almost as NO2, and thus δ15N (NO2)should be reflective of the δ15N of NOx sources. If NO2 isoxidized to N2O5, the isotopic equilibrium is likely to beachieved between NO2, NO3, and N2O5 by chemical equi-librium Reaction (R6), and the δ15N values of N2O5 andNO3 will reflect the isotope equilibrium fractionation fac-tors relative to NO2 (i.e., 15αN2O5/NO2 and 15αNO3/NO2 ; val-ues were adopted from the Supplement Table S5 in Walters
Atmos. Chem. Phys., 22, 5099–5115, 2022 https://doi.org/10.5194/acp-22-5099-2022

S. Lim et al.: Oxidation pathways and emission sources of atmospheric particulate nitrate in Seoul 5103
and Michalski, 2016). Finally, δ15N of particulate NO−3 pro-duced from dark pathways can be expressed as the following,neglecting currently unconstrained kinetic isotopic fraction-ation associated with Reactions (R7) and (R8) (Walters andMichalski, 2016):
δ15N(HNO3) (R7)= δ15N(N2O5)= δ15N(NO2)+ ε2, (2a)
ε2 =(
15αN2O5/NO2−1
), (2b)
δ15N(HNO3) (R7)= δ15N(NO−3
)(R7) , (2c)
δ15N(HNO3) (R8)= δ15N(NO3)= δ15N(NO2)+ ε3, (3a)
ε3 =(
15αNO3/NO2−1
), (3b)
δ15N(HNO3) (R8)= δ15N(NO−3
)(R8) . (3c)
Therefore, the δ15N (NOx) in the atmosphere can be ex-pressed using measured δ15N (NO−3 ) and the net N isotopefractionation effect, εN.
δ15N(NOx)atmosphere = δ15N
(NO−3
)measured− εN, (4a)
εN = ε1× f1+ ε2× f2+ ε3× f3, (4b)
where ε1, ε2, and ε3 are the abovementioned N isotope frac-tionation effect of pathways (i), (ii), and (iii), respectively,and the proportional contributions (f1, f2, and f3) of thethree NO−3 formation pathways were estimated from 117Omeasurements (Sect. 2.3.2).
2.3.2 Proportional contributions of three formationpathways to atmospheric particulateNO−
3: ∆17O (NO−
3)
Due to its mass-independent nature, 117O of particulateNO−3 is a conservative tracer of photochemical NO−3 for-mation (Michalski et al., 2003, 2004). At photochemicalsteady state, the 117O of NO2 is determined by the rela-tive production rate of NO2 via O3 oxidation Reaction (R1)in NO2 production Reactions (R1) and (R2) (fO3 ) and themass-independent 117O anomaly transferred from O3 dur-ing Reaction (R1) (117O−O∗3):
117O(NO2) (‰)= fO3 ×117O−O∗3. (5)
fO3 was adopted from a previous study conducted in Beijing(Wang et al., 2019b), where the seasonal mean was 0.858 and0.918 for summer and winter, respectively. 117O−O∗3 canbe approximated as 1.5×117O−O3 because of the isotopicasymmetry of O3 (Michalski and Bhattacharya, 2009). In thisstudy, the 117O−O∗3 is 37.5 ‰± 2.2 ‰ (mean±SD) aver-aged from literature sources as the isotopic composition ofozone shows a remarkable stability in the lower troposphere(Ishino et al., 2017; Vicars et al., 2012; Vicars and Savarino,2014)
The 117O of particulate NO−3 produced via the three for-mation pathways can be predicted by distinct 117O transferfunctions as the following (Morin et al., 2011):
117O(NO−3
)(R4)(‰)= 2/3117O(NO2)
= 2/3fO3 ×117O−O∗3, (6a)
117O(NO−3
)(R7)(‰)= 5/6117O(N2O5)
= 1/3117O(NO2)+ 1/2117O(NO3)
= 1/6117O−O∗3(4fO3 + 1
), (6b)
117O(NO−3
)(R8)(‰)=117O(NO3)
= 2/3117O(NO2)+ 1/3117O−O∗3= 1/3117O−O∗3
(2fO3 + 1
). (6c)
Finally, the 117O (NO−3 ) can be expressed as the following:
117O(NO−3
)measured =1
17O(NO−3
)(R4)× f1
+117O(NO−3
)(R7)× f2
+117O(NO−3
)(R8)× f3, (7)
where 117O (NO−3 )measured is the measured value in thisstudy, and the three endmember values of 117O (NO−3 ) Re-action (R4), 117O (NO−3 ) Reaction (R7), and 117O (NO−3 )Reaction (R8) are calculated using Eqs. (6a)–(6c). The pro-portional contributions of the three NO−3 formation pathways(f1+f2+f3 = 1) were estimated by the Stable Isotope Anal-ysis in R (SIAR) model (Sect. 2.5) for the winter and thesummer months.
2.4 Estimation of PM2.5 aerosol liquid watercontent (ALWC) and aerosol pH
ISORROPIA II is a thermodynamic equilibrium model forthe Cl−, NO−3 , SO2−
4 , Na+, NH+4 , K+, Ca2+, Mg2+, andH2O aerosol system (Fountoukis and Nenes, 2007). In thepresent study, the model was run as a forward and metastablemode to calculate aerosol liquid water content (ALWC) andpH. The detailed information of the model is found in Foun-toukis and Nenes (2007). As input parameters, the concen-trations of water-soluble ions that were measured by NIERand ambient RH and temperature were used for the model.
2.5 Bayesian stable isotope mixing model (stableisotope analysis in R, SIAR)
For quantifying proportional contribution of three NO−3 for-mation pathways (f1, f2, and f3 in Eq. 4b), we used theBayesian stable isotope mixing model (Parnell et al., 2013)implemented in the simmr package in R software, which isavailable at https://cran.r-project.org/web/packages/simmr/
https://doi.org/10.5194/acp-22-5099-2022 Atmos. Chem. Phys., 22, 5099–5115, 2022

5104 S. Lim et al.: Oxidation pathways and emission sources of atmospheric particulate nitrate in Seoul
index.html (last access: 10 March 2021). The BayesianMarkov chain Monte Carlo approach is adequate to providethe relative contribution of the endmembers. Detailed infor-mation of the SIAR can be found in Parnell et al. (2010).As input data, measured 117O (NO−3 ) and estimated 117O(NO−3 ) endmember values of each pathway were treated inthe SIAR model. Similar use of the SIAR model can be foundelsewhere (Song et al., 2020; Wang et al., 2019b).
2.6 Backward air mass trajectory
Two-day air mass backward trajectories were analyzed us-ing the HYSPLIT (Hybrid Single-Particle Lagrangian Inte-grated Trajectory) model with meteorological input from theglobal data assimilation system (a regular 1◦× 1 ◦ longitude–latitude grid) (Stein et al., 2015; https://ready.arl.noaa.gov/HYSPLIT.php, last access: 27 May 2020). The trajectorieswere calculated every 6 h at an elevation of 500 m a.s.l. Thepotential source contribution function (PSCF) was then ap-plied to calculate the probable source location (latitude i andlongitude j ), which is determined here as the ratio of thenumber of trajectory end points associated with measuredδ15N (NO−3 ) values higher than a threshold value (set tothe 95th percentile of δ15N (NO−3 ) (mij ) to the total num-ber of points (nij ) in the ij th grid cell). The PSCF calcu-lation and the determination of the gridded trajectory fre-quencies were made in the openair R package (https://cran.r-project.org/web/packages/openair/index.html, last access:4 January 2021) (Carslaw and Ropkins, 2012).
3 Results and discussion
3.1 Seasonal characteristics of PM2.5 concentration,δ15N (NO−
3), and ∆17O (NO−
3)
PM2.5 mass concentration varied from 7.5 to 139.0 µg m−3
for the whole sampling period. According to the typical syn-optic weather patterns of East Asia (Kim et al., 2007), themeasurements are divided into summer (May–August) andwinter (October–March) groups. A clear seasonal differencein PM2.5 concentration and its composition were observedwith significantly higher concentrations of mass and inor-ganic constituent in the winter than in the summer (Table 1and Fig. S1).
During the summer, PM2.5 concentration ranged from 7.5to 34.5 µg m−3 with a mean of 22.7± 6.9 µg m−3. The meanconcentration of TC and TN was 4.6±1.4 µgC m−3 and 1.9±1.0 µgN m−3, respectively, resulting in the mean TC /TN ra-tio of 2.7± 2.0. The mass concentrations of all measuredspecies were much higher in the winter, during which PM2.5concentration was raised up to 139.0 from 10.6 µg m−3 witha mean of 61.7± 39.2 µg m−3. Accordingly, the mean of TCand TN was 15.2±4.5 µgC m−3 and 11.8±7.7 µgN m−3, re-spectively, and the mean TC /TN ratio of 0.9± 0.7 was no-ticeably lower than that of the summer.
For the entire experiment, the mean mass fraction againstPM2.5 was the highest for NO−3 (26 %± 23 %), followed bySO2−
4 (20 %± 1 %) and NH+4 (14 %± 1 %), highlighting thecontribution of SIA to PM2.5 mass. The NO−3 mass con-centration varied from 0.2 to 69.3 µg m−3 with a mean of17.6± 22.1 µg m−3. Seasonally, the NO−3 concentration wassignificantly higher in the winter (29.7± 22.1 µg m−3) thansummer (0.8± 0.9 µg m−3). TN existed completely as inor-ganic N from both NO−3 and NH+4 during the winter (regres-sion slope of 1.0). During the summer, NO−3 and NH+4 com-prised 67 % of TN, and the rest (33 %) was assumed to be or-ganic nitrogen (ON) components. In contrast, the mass frac-tion of SO2−
4 against PM2.5 was higher in the summer (23 %)than winter (19 %). The seasonal characteristics of chemicalcomposition imply the significant role of inorganic nitrogenspecies in PM2.5 mass increase in winter and ON and sulfatein summer.
Both δ15N (NO−3 ) and 117O (NO−3 ) exhibited an inversecorrelation with ambient temperature (r = −0.87 and r =−0.55, respectively). The δ15N (NO−3 ) exhibited higher val-ues in winter with a weight mean of −0.7 ‰± 3.3 ‰ and3.8 ‰± 3.7 ‰ in the summer and the winter, respectively.This seasonal pattern of δ15N (NO−3 ) has been typically ob-served in East Asia regions (Li et al., 2019; Song et al., 2019;Zong et al., 2020). Analysis of backward air mass trajec-tory indicates that the lower and the upper bound of δ15N(NO−3 ) were associated with air masses from the ocean bysoutherly and easterly winds in the summer and from Siberiaby northerly winds in winter, respectively (Fig. S3 in the Sup-plement). In comparison with urban China (Fig. 2a), aver-aged summer δ15N (NO−3 ) values were comparable betweenSeoul and all urban Chinese sites reported here, whereas inwinter, δ15N (NO−3 ) of Seoul was similar to that of Shanghaiand Guangzhou rather than δ15N (NO−3 ) of Beijing, whichwas higher than 10 ‰. Another observation at a mountainstation in Taiwan shows that the highest δ15N (NO−3 ) wasfound in spring when the level of anthropogenic constituentswas elevated (Guha et al., 2017). These observations overEast Asia may suggest to some extent that the seasonal pat-tern of δ15N (NO−3 ) is basically associated with a synopticmeteorological condition that controls the type and strengthof emission sources, where low and high δ15N (NO−3 ) val-ues indicate biogenic soil emissions and fossil combustion,respectively (Elliott et al., 2019).
Along with nitrogen isotope, heavier oxygen isotopeswere also enriched in NO−3 during the winter compared tothe summer, when the weight-mean values of δ17O, δ18O,and 117O in NO−3 were 70.4 ‰± 5.4 ‰, 82.0 ‰± 6.2 ‰,and 27.7 ‰± 2.2 ‰ for the winter and 57.3 ‰± 4.9 ‰,65.7 ‰± 6.2 ‰, and 23.2 ‰± 2.2 ‰ for the summer. Theseresults of high winter and low summer 117O (NO−3 ) wereconsistent with previous observations at urban Beijing (Heet al., 2018; Wang et al., 2019b; Fig. 2b), indicative of rel-atively greater contribution of nighttime oxidation pathways
Atmos. Chem. Phys., 22, 5099–5115, 2022 https://doi.org/10.5194/acp-22-5099-2022

S. Lim et al.: Oxidation pathways and emission sources of atmospheric particulate nitrate in Seoul 5105
Table 1. Measurement summary of PM2.5 chemical constituents and isotopic compositions in Seoul during the sampling period of May2018–March 2019. Arithmetic mean± 1 SD (mass fraction, %) for mass concentrations and concentration-weighted mean± 1 SD for isotoperatios.
Constituents Summer (n= 13) Winter (n= 18)
PM2.5 (µg m−3) 22.7± 6.9 61.7± 39.2TC 4.6± 1.4 (20 %) 15.2± 4.5 (25 %)TN 1.9± 1.0 (8 %) 11.8± 7.7 (19 %)NO−3 0.8± 0.9 (4 %) 29.7± 22.1 (48 %)NH+4 1.9± 0.8 (8 %) 11.7± 8.4 (19 %)SO2−
4 5.3± 2.1 (23 %) 11.5± 9.2 (19 %)[NH+4 ] / ([SO2−
4 ]+[NO−3 ]) equiv. ratio 0.83± 0.08 0.94± 0.09δ15N (NO−3 ) −0.7± 3.3 3.8± 3.7δ17O 57.3± 4.9 70.4± 5.4δ18O 65.7± 6.2 82.0± 6.2117O 23.2± 2.2 27.7± 2.2
Figure 2. (a) δ15N (NO−3 ) and (b)117O (NO−3 ) PM2.5 observed in northeast Asia are compared: Seoul in this study (red); Beijing (brown),Shanghai (orange), and Guangzhou (light) in China; and Rishiri (green) and Sapporo (blue) in Japan during summer (circle) and win-ter (square). Annual ranges were presented for Rishiri and Sapporo. Marker indicates mean value (concentration-weighted average for Seoulsamples of the present study), and lower and upper whiskers denote minimum and maximum values (this study; He et al., 2018; Lim et al.,2020; Nelson et al., 2018), mean ±SD (Song et al., 2019; Wang et al., 2019b), or 25th and 75th percentiles (Zong et al., 2020). Differentmarker shapes indicate different seasons.
in winter. It is also noteworthy that our summer and winter117O (NO−3 ) values were similar to annual117O (NO−3 ) val-ues of an urban (Sapporo) and a rural (Rishiri) site in Japan,respectively (Nelson et al., 2018). It is likely suggestive thatthe winter117O value in Seoul has undergone a considerableatmospheric processing on a regional scale.
Given that PM2.5 concentrations reflect the seasonal-ity, atmospheric chemical composition and meteorologicalproperties were examined in relation to PM2.5 concentra-tions (Fig. 3). Clearly, for the winter samples with PM2.5concentration greater than 40 µg m−3, meteorological condi-tions varied relative to low PM2.5 samples; relatively hightemperature and RH staying at 0 to 10◦ and 45 % to 65 %,respectively, and a low wind speed of 1 to 2 m s−1, repre-senting the meteorological characteristics of winter PM2.5
episodes. Particularly in winter, a strong linearity of PM2.5was found with most chemical constituents considered in thisstudy, such as SIA species, TN, NOR, and SOR (sulfur oxi-dation ratio). However, although elevated in level, NO2 andO3 mixing ratios showed non-linearity with PM2.5 concen-trations. Isotope ratios were correlated either linearly or in-versely with PM2.5 concentrations. In winter, 117O (NO−3 )showed the best correlation with PM2.5 concentrations, butδ15N (NO−3 ) was inversely related with PM2.5 level.
3.2 Graphical representation of dual isotopes: ∆17Oand δ15N of NO−
3
The isotope ratios of source endmembers are scarce in thestudy region and in the aerosol measurements, and the iso-
https://doi.org/10.5194/acp-22-5099-2022 Atmos. Chem. Phys., 22, 5099–5115, 2022

5106 S. Lim et al.: Oxidation pathways and emission sources of atmospheric particulate nitrate in Seoul
Figure 3. Relationships of PM2.5 mass concentration with meteorological parameters (a–c), concentrations of reactive gases (d–f, k) andaerosol chemical constituents (g–j, l–n), and N and O isotopic compositions (o–q) measured in Seoul during the summer (open circle) andthe winter (blue ribbon).
Atmos. Chem. Phys., 22, 5099–5115, 2022 https://doi.org/10.5194/acp-22-5099-2022

S. Lim et al.: Oxidation pathways and emission sources of atmospheric particulate nitrate in Seoul 5107
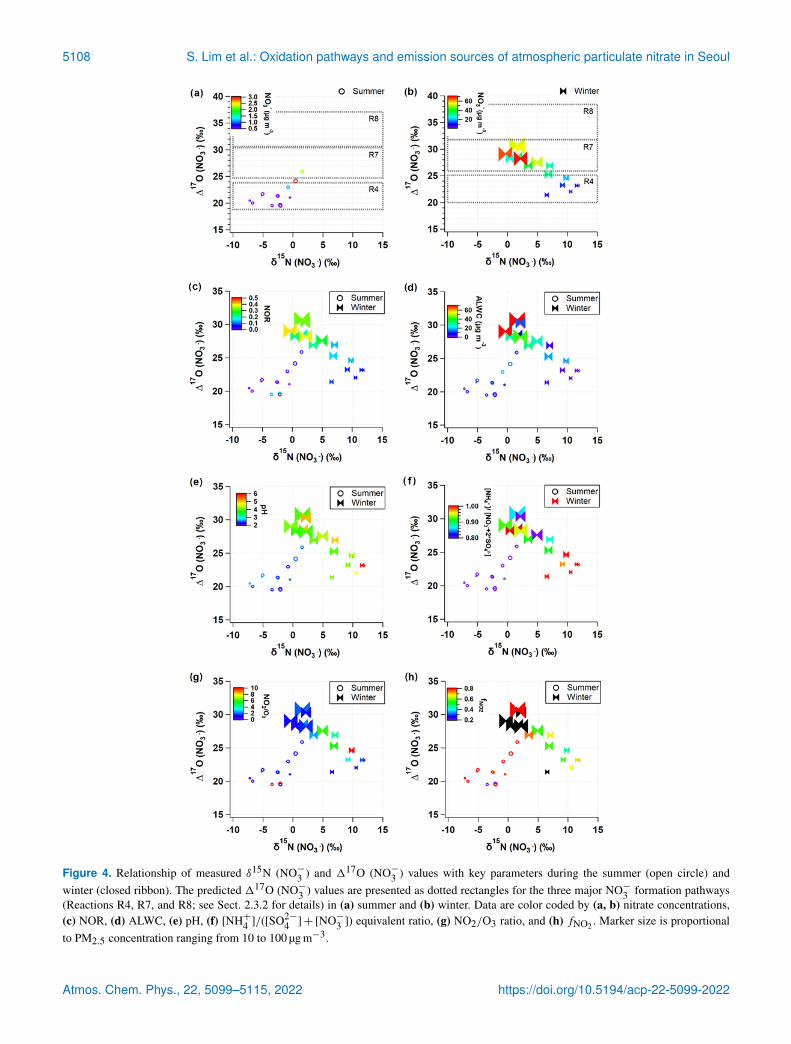
tope fractionation effect during gas-to-particle conversion isoften estimated with thermodynamic constants and reason-able assumptions. In this regard, the graphical representa-tion of dual isotopes enables the complex signatures of at-mospheric samples to be distinguished and allows their ox-idation processes to be constrained. Figure 4 displays mea-sured δ15N (NO−3 ) and117O (NO−3 ) coordinates with relatedchemical parameters in colors.
In Fig. 4a and b, the range of 117O (NO−3 ) endmem-bers for the three NO−3 oxidation pathways calculated inSect. 2.3.2 is presented by black dotted boxes, which are suc-cessfully distinguished. The 117O (NO−3 ) values of all sam-ples fell into the predicted ranges of the 117O endmembersbut were separated into seasonal groups. Most of summer117O (NO−3 ) values indicate the NO−3 Reaction (R4) path-way. It is in accordance with what has been reported in tem-perate areas during summer (Alexander et al., 2009; Michal-ski et al., 2003). In field measurements of δ15N (NO−3 ) andδ18O (NO−3 ) in Chinese cities, the proportional contributionof the OH-oxidation pathway was significantly correlatedwith latitudes (Zong et al., 2020), confirming the evidenceof the NO−3 formation through OH oxidation depending onUV radiation intensity.
In comparison, more than half of winter samples arelocated in the domains indicating NO−3 Reactions (R7)and (R8) pathways. In particular, for winter sampleswith NO−3 mass concentration higher than ∼ 30 µg m−3,117O (NO−3 ) values clearly represent the Reaction (R7)pathway. The winter 117O (NO−3 ) was proportional to theNOR (Fig. 4c), which is indicative of the efficient conver-sion of NOx to NO−3 via O3 oxidation pathways. In the sum-mer periods when NO−3 concentrations were relatively high(above ∼ 3 µg m−3), the contributions of O3 oxidation path-ways became elevated, which is a similar pattern to what wasobserved in the winter. This result suggests that the O3 ox-idation pathways are likely to be responsible for the rapidconversion of particulate NO−3 observed during winter andsummer PM2.5 episodes in the study region.
The formation of N2O5 Reaction (R6) is dependent onboth NO2 and O3, which are reciprocally correlated in sourceregions. The equilibrium of Reaction (R6) shifts to N2O5 atlow temperature, and its lifetime against photolysis is longunder the low sunlight. For these reasons, the dark formationof NO−3 Reaction (R7) would be favorable in urban outflowsin winter. The hydrolysis of N2O5 on aerosol surface Re-action (R7) is highly dependent on RH, aerosol liquid wa-ter content (ALWC), and chemical composition (Hallquistet al., 2003; Wahner et al., 1998). To evaluate the 117O(NO−3 ) signature observed, we calculated ALWC and acidityof aerosol, pH, using the ISORROPIA II model (Sect. 2.4).Given the high concentration of nano-particles from varioussources in the urban areas, it is assured that aerosol sur-face is enough for the NO−3 Reaction (R7) pathway. Thecalculated ALWC was higher by 90 % (19.1± 22.8 µg m−3)in the winter and lower by 21 % (7.8± 5.2 µg m−3) in the
summer relative to the annual mean of the 2 years. WhenNO−3 mass concentrations were greater than ∼ 3 µg m−3 inthe summer and ∼ 30 µg m−3 in the winter, ALWC was 14.3and 31.7 µg m−3, respectively, which were greater by 166 %and 183 % than the seasonal mean, respectively (Fig. 4d).Furthermore, the high 117O (NO−3 ) and ALWC coincidedwith the lower bound (about 4) of winter pH varying from4 to 6, whereas aerosol pH was 2–3 during the summer. Thelow aerosol pH concurrent with the high 117O (NO−3 ) andALWC is coherent with the aqueous-phase HNO3 formationon liquid aerosol through Reaction (R7).
While 117O (NO−3 ) allows insights into the oxidationpathway of NO−3 , δ15N (NO−3 ) values are affected by vari-ous factors, most of which are not well constrained due to thecomplicated chemistry of nitrogen oxides in the Earth’s envi-ronment. In this study, δ15N (NO−3 ) variability versus PM2.5concentration resembled the variability of NO2 versus PM2.5concentration (Fig. 3f and o), implying a close link betweenNO2 oxidation and δ15N (NO−3 ). Therefore, in addition to therole of 117O (NO−3 ) as a tracer of an NO−3 oxidation path-way, we evaluated whether a variation of δ15N (NO−3 ) indi-cates NOx oxidation efficiency between NO and NO2 (Freyeret al., 1993; Nelson et al., 2018; Walters et al., 2016). A pos-sible effect on δ15N during NOx photochemical cycling can-not be predicted in the same way under varying conditions ofNO, NO2, and O3 abundances. The shift in δ15N (NO2) rela-tive to δ15N (NOx) in the atmosphere will change dependingon fNO2 and temperature-dependent αNO2/NO (Freyer et al.,1993; Li et al., 2020; Walters et al., 2016). When O3 mixingratio is high, NO is almost completely oxidized to NO2, lead-ing to an increasing fNO2 value, and the δ15N (NO2) shouldcorrespond to the δ15N of NOx sources (Freyer et al., 1993).
In the dual isotope coordinates of δ15N (NO−3 ) and117O (NO−3 ) (Fig. 4), it is evident that the samples takenduring a record-breaking winter’s PM2.5 pollution eventsare associated with the lower bound values of δ15N (NO−3 )(−1 ‰ to 4 ‰) and the highest 117O (NO−3 ) values (28 ‰to 31 ‰). Simultaneous measurements of PM1 chemicalcomposition in Seoul and Beijing demonstrated that the re-gionally processed air masses were long-range transportedto Seoul within approximately 2 d during these episodes(H. Kim et al., 2020). Their NO2/O3 ratio (1 to 2) wasclearly lower with higher fNO2 (0.7 to 0.8) compared tothe other winter samples (Fig. 4g and h). This result im-plies that O3 level was high enough to efficiently oxidizeNO to NO2 during the severe PM2.5 pollution events. In thiscondition, the shift in δ15N (NO2) relative to δ15N (NOx)is insignificant, and, consequently, δ15N (NO2) would belower than those of other winter samples unless both emis-sion sources and αNO2/NO changed significantly. Consider-ing that NO−3 is the key driver of the high PM2.5 in Seoul,the higher degree of NOx oxidation efficiency is worth high-lighting, in conjunction with a strong linear relationship be-tween117O (NO−3 ) and NOR (Fig. 4c) revealing an efficient
https://doi.org/10.5194/acp-22-5099-2022 Atmos. Chem. Phys., 22, 5099–5115, 2022
5108 S. Lim et al.: Oxidation pathways and emission sources of atmospheric particulate nitrate in Seoul
Figure 4. Relationship of measured δ15N (NO−3 ) and 117O (NO−3 ) values with key parameters during the summer (open circle) andwinter (closed ribbon). The predicted 117O (NO−3 ) values are presented as dotted rectangles for the three major NO−3 formation pathways(Reactions R4, R7, and R8; see Sect. 2.3.2 for details) in (a) summer and (b) winter. Data are color coded by (a, b) nitrate concentrations,(c) NOR, (d) ALWC, (e) pH, (f) [NH+4 ]/([SO2−
4 ] + [NO−3 ]) equivalent ratio, (g) NO2/O3 ratio, and (h) fNO2 . Marker size is proportionalto PM2.5 concentration ranging from 10 to 100 µg m−3.
Atmos. Chem. Phys., 22, 5099–5115, 2022 https://doi.org/10.5194/acp-22-5099-2022

S. Lim et al.: Oxidation pathways and emission sources of atmospheric particulate nitrate in Seoul 5109
conversion of NO2 to NO−3 through NO−3 pathway Reac-tions (R5)+(R6)+(R7)+(R8) via O3.
3.3 Contributions of major HNO3 oxidation pathways
Combining the 117O (NO−3 ) measurements and the calcula-tion of117O transferred from O3 to HNO3, the contributionsof three major NO−3 formation pathways were quantitativelyaccounted for, despite the inherent uncertainties in the calcu-lation (Sect. 2.5).
NO−3 pathway Reaction (R4) dominated the total NO−3 for-mation (87 %± 6 %) in summer. In contrast, the nighttimepathways through N2O5 and NO3 (pathways Reactions R7and R8) were responsible for 24 % and 14 % of the NO−3formation in the winter, respectively. The contributions in-creased further to 40 % and 30 %, respectively, on haze dayswhen PM2.5 concentration exceeded 75 µg m−3, the “verybad” alert of the national air quality standard. The significantnighttime oxidation of NO−3 has been observed broadly at ur-ban sites in northeast Asia. The results of this study are con-sistent with those conducted in Beijing, showing low 117Ovalues in summertime (about 17 ‰ to 25 ‰) and substan-tially high 117O values (about 25 ‰ to 34 ‰ ) in winter-time when NO−3 -driven PM2.5 haze pollution occurred (Heet al., 2018; Song et al., 2020; Wang et al., 2019b). In gen-eral, nighttime pathways accounted for more than 60 % andup to 97 % in Beijing (He et al., 2018; Song et al., 2020;Wang et al., 2019b). From a global perspective, the chemicaltransport model demonstrated that N2O5 heterogeneous hy-drolysis was of comparable importance to NO2+OH (41 %)for NO−3 formation at below 1 km altitude (Alexander et al.,2020).
It is noteworthy that although the seasonal patterns aresimilar in northeast Asia, the average proportional contribu-tions estimated from 117O (NO−3 ) are highly sensitive to in-put parameters (i.e, fO3 and 117O−O∗3). In this study, theseasonal fO3 was assumed to be equal to those estimatedfor Beijing and set to 0.858± 0.05 and 0.918± 0.05 for thewarm and cold months, respectively (Wang et al., 2019b),which are comparable to other estimates for Beijing (0.86)and Shanghai (0.97) (He et al., 2018, 2020) and the annualmean of 0.85 in a global model (Alexander et al., 2020).
The uncertainty associated with 117O−O∗3 has been rec-ognized as the largest source of uncertainty in estimat-ing NO−3 production pathways from 117O (NO−3 ) (Alexan-der et al., 2009, 2020). In this study, the 117O−O∗3 of37.5 ‰± 2.2 ‰ was averaged from previous observations,corresponding to117O-bulk O3 of 25 ‰ (Ishino et al., 2017;Vicars et al., 2012; Vicars and Savarino, 2014). Our mean117O−O∗3 of 37.5 ‰ was 2.8 ‰ higher and 1.5 ‰ lower thanwhat was used in the field studies (Song et al., 2020; Wanget al., 2019b) and other studies (He et al., 2018, 2020), re-spectively, for urban Beijing and Shanghai. When a sensi-tivity test was conducted for the proportional contribution ofthe three oxidation pathways, a 2.8 ‰ change in 117O−O∗3
value caused a 1.6 ‰, 2.1 ‰, and 2.5 ‰ change in the end-member for the pathways for Reactions (R4), (R7), and(R8), respectively. As a result, the average contribution ofthe nighttime pathways, including NO−3 Reaction (R7) andNO−3 Reaction (R8), increased to 23 % in summer and 65 %in winter. This suggests that a proper use of key parametersdriving endmember values is a prerequisite for more realisticquantification of NO−3 oxidation pathway contributions.
3.4 Major NOx emission sources
To investigate major emission sources of atmospheric NOx inSeoul, δ15N (NOx) in the atmosphere (δ15N (NOx)atmosphere)was estimated from measured δ15N (NO−3 ) considering ni-trogen isotopic fractionation effects (εN) based on a dualisotopes approach (117O and δ15N). Estimated εN val-ues were 5.9 ‰± 1.5 ‰ and 12.2 ‰± 0.5 ‰, and accord-ingly the δ15N (NOx)atmosphere was −8.7 ‰± 3.3 ‰ and−5.8 ‰± 4.2 ‰ in summer and winter, respectively. Thelarger winter εN reveals the enhanced contribution of thenighttime oxidation pathway via N2O5. As a result, a sea-sonal difference in δ15N (NOx)atmosphere was as small as2.9 ‰ on average, which is suggestive of little seasonal dif-ference in major NOx emission sources in Seoul.
Figure 5 displays the measured δ15N (NO−3 ) and esti-mated δ15N (NOx)atmosphere of individual samples togetherwith δ15N (NOx) domains of emission source endmem-bers reported in literature: biogenic soil (driven by fer-tilizer use, −35.1 ‰± 10.2 ‰; Felix and Elliott, 2014; Liand Wang, 2008; Yu and Elliott, 2017), biomass burning(1.8 ‰± 1.8 ‰; Fibiger and Hastings, 2016), vehicle emis-sions (−2.5 ‰± 1.5 ‰; Walters et al., 2015), and coal com-bustion (14.2 ‰± 4.5 ‰; Felix et al., 2012; Heaton, 1990).Both in summer and winter, δ15N (NOx)atmosphere values arethe closest to the domain of vehicle emissions δ15N (NOx),highlighting the largest contribution of vehicle emissions toNOx in Seoul (Fig. 5). However, the winter δ15N (NO−3 )without isotope fractionation effect apparently points to coalemissions, which could lead to misleading conclusions aboutmajor NOx sources. This result is supported by a better cor-relation of NO2 with CO than with SO2 for both seasons.According to an (anthropogenic) bottom-up emissions inven-tory, the Clean Air Policy Support System (CAPSS), totalmobile sources account for about two-thirds of NOx emis-sions in Korea, followed by combustion sources such as en-ergy and manufacturing industries (33 %). The highest NO2column densities are distinct in Seoul metropolitan areas,which is mostly due to the emissions from transportation(H. C. Kim et al., 2020). Our results of the isotope measure-ments are in fairly good agreement with the national emis-sion inventories and satellite observations, highlighting thelargest contribution of vehicle emissions to NOx sources inSeoul.
Other than vehicle emissions, the lower bound sum-mer δ15N (NOx)atmosphere and the upper bound win-
https://doi.org/10.5194/acp-22-5099-2022 Atmos. Chem. Phys., 22, 5099–5115, 2022

5110 S. Lim et al.: Oxidation pathways and emission sources of atmospheric particulate nitrate in Seoul
Figure 5. Variations in measured δ15N (NO−3 ) (open) and estimated δ15N (NOx )atmosphere (closed) in Seoul during the summer (circle)and winter (triangle). The δ15N (NOx ) range (mean± 1 SD) of source endmembers is distinguished by dotted boxes in different colors:coal combustion (14.2 ‰±4.5 ‰; Felix et al., 2012; Heaton, 1990), biomass burning (1.8 ‰± 1.8 ‰; Fibiger and Hastings, 2016), vehicleemissions (−2.5 ‰± 1.5 ‰; Walters et al., 2015), and biogenic soil emissions (−35.1 ‰± 10.2 ‰; Felix and Elliott, 2014; Li and Wang,2008; Yu and Elliott, 2017).
ter δ15N (NOx)atmosphere were relatively closer to theδ15N (NOx) of fertilized soil emissions and coal combustion,respectively. These seasonally distinct contributions fromsoil emissions and coal combustion were consistent with theresults from previous studies conducted in China, reveal-ing common seasonal emission characteristics on a regionalscale in East Asia. It was evident that the upper bound winterδ15N (NOx)atmosphere coincided with an elevated SO2−
4 /NO−3mass ratio by 2–3 times. During these periods, trajectoryanalysis indicates that air masses originated from cold re-gions in northeastern China, such as Liaoning province,where heavy and coal-fired industries are located. In Bei-jing, located in northeastern China, coal combustion is an im-portant fossil-fuel source as the highest contribution sourceto atmospheric NOx emissions during winter, about 30 % to40 %, regardless of approaches used for estimating NO−3 ox-idation pathways, either 117O or δ18O (Li et al., 2019; Songet al., 2019, 2020; Zong et al., 2020). Thus, in this study, theupper bound winter δ15N (NOx)atmosphere suggests enhancedcontributions of coal combustion to atmospheric NOx emis-sions. It is particularly noteworthy that the lower winter δ15N(NO−3 ) and thus relatively lower contribution of coal com-bustion of the present study confirms the recent trend thatemissions from coal combustion have been reduced in China(Cheng et al., 2019; Tong et al., 2018). Our study was con-ducted in later years (2018–2019) than their studies (2013–2017), in which δ15N (NO−3 ) values were rather comparable
to the winter mean δ15N (NO−3 ) observed in Seoul duringJanuary 2014 to February 2016 (11.9 ‰± 2.5 ‰; Park et al.,2018). The lower bound of winter δ15N (NO−3 ) values associ-ated with the highest NO−3 and PM2.5 concentrations (Figs. 3and 4) was considered a result of complex effects of isotopicfractionation, as discussed above.
This study region is under the influence of various biomassburning sources throughout a year, such as agricultural com-bustion in the vicinities of Seoul and over eastern Chinafrom spring to fall (Chen et al., 2017; Zhao et al., 2017),wild fires over Siberia and the Russian Far East in summer(van der Werf et al., 2010), and residential biomass com-bustion for heating over east Asia in winter. Some winterδ15N (NOx)atmosphere values fell in the δ15N (NOx) range ofbiomass burning endmembers (Fibiger and Hastings, 2016;Fig. 5). When assessing contributions of biomass burningbased on few endmember δ15N (NOx), however, cautionshould be exerted considering the fact that δ15N (NOx) var-ied among biomass types from −7 ‰ to 12 ‰ (Fibiger andHastings, 2016), and there is currently a lack of understand-ing of biomass combustion that could potentially affect airquality in Seoul.
Atmos. Chem. Phys., 22, 5099–5115, 2022 https://doi.org/10.5194/acp-22-5099-2022

S. Lim et al.: Oxidation pathways and emission sources of atmospheric particulate nitrate in Seoul 5111
4 Conclusions and outlook
Our δ15N- and117O-based study confirms that vehicle emis-sions are the main source of NO−3 in PM2.5 in Seoul dur-ing the summer and the winter. In addition, the qualitativeestimates of NOx emission sources provide suggestive evi-dence for enhanced contributions from coal combustion andbiogenic soil emissions in the winter and the summer, re-spectively. Moreover, severe winter haze events with dailyPM2.5 exceeding 100 µg m−3 were mainly driven by NO−3(up to ∼ 60 % in PM2.5). Reducing NOx emissions from ve-hicles is, therefore, essential for an effective mitigation mea-sure to improve fine aerosol pollution in the study region. Inparticular, the highest PM2.5 was concurrent with the low-est δ15N (NO−3 ) and the highest 117O (NO−3 ) and NOR,revealing the efficient NO-to-NO2 conversion and hetero-geneous conversion of HNO3 to particulate NO−3 throughthe O3 oxidation pathway during the winter haze episodes.The multiple-isotope signatures of particulate NO−3 , includ-ing 17O, 18O, and 15N, highlight the secondary nature of fineaerosol pollution intimately coupled with the photochemicaloxidation process.
While our results demonstrate that δ15N and 117O are ro-bust tracers for major NOx sources, quantitative source ap-portionment using the isotope method requires further elabo-ration of isotope equilibrium and/or kinetic fractionation ef-fects involved in photochemical cycling of nitrogen oxidesand δ15N of NOx source endmembers representing local orregional emissions in East Asia. In well-designed field stud-ies, the δ15N and 117O measurements of multiphase andtheir vertical structures allow us to test the isotope fraction-ation effects suggested by laboratory experiments and the-oretical calculations, as well as to characterize the atmo-spheric processing that influences them. In addition, thereis an urgent need to document the δ15N (NOx) values ofemissions from vehicles with/without selective catalytic re-duction (SCR) and from biomass combustion as a functionof biomass type and combustion conditions. Consequently, acomprehensive and quantitative understanding of the oxida-tion pathways and emission sources of nitrogen oxides us-ing δ15N and 117O measurements will be able to elucidatethe detailed mechanisms driving severe haze development inmegacities of northeast Asia, including Seoul.
Data availability. Data used in this study are available upon re-quest to the corresponding author.
Supplement. The supplement related to this article is availableonline at: https://doi.org/10.5194/acp-22-5099-2022-supplement.
Author contributions. SL and ML conceived the project and car-ried out the aerosol sampling and the analysis of aerosol chemical
compositions. SL conceptualized and wrote the article. ML super-vised the study and wrote the article. JS conducted stable isotopeanalysis on the samples and helped SL in interpreting the results.The results of the study were discussed by all authors but especiallyby PL.
Competing interests. The contact author has declared that nei-ther they nor their co-authors have any competing interests.
Disclaimer. Publisher’s note: Copernicus Publications remainsneutral with regard to jurisdictional claims in published maps andinstitutional affiliations.
Special issue statement. This article is part of the special issue“Effect of Megacities on the Transport and Transformation of Pol-lutants at Regional and Global Scales (EMeRGe) (ACP/AMT inter-journal SI)”. It is not associated with a conference.
Acknowledgements. This research was supported by the Na-tional Strategic Project Fine Particle of the National ResearchFoundation of Korea (NRF), funded by the Ministry of Scienceand ICT (MSIT), Ministry of Environment (ME), and Ministry ofHealth and Welfare (MOHW) (grant no. 2017M3D8A1092015).Funding to Saehee Lim was provided by the National ResearchFoundation of Korea (NRF) from the Ministry of Science and ICT(grant no. 2018R1D1A1B07050849). Meehye Lee thanks for thesupport from NRF (grant no. 2020R1A2C3014592). Joel Savarinothanks the French National Research Agency (Investissementsd’avenir grant no. ANR-15-IDEX-02) and the INSU programLEFE-CHAT for supporting the stable isotope laboratory. This ispublication 4 of PANDA platform on which isotope analyses wereperformed. The authors especially thank Nicolas Caillon for per-forming the analysis of the ammonium–nitrogen isotope ratio. Theauthors thank the Korea National Institute of Environmental Re-search (NIER) and Korea Meteorological Administration (KMA)for their monitoring data used in this study.
Financial support. This research has been supportedby the National Research Foundation of Korea (grantnos. 2017M3D8A1092015, 2018R1D1A1B07050849, and2020R1A2C3014592).
Review statement. This paper was edited by Manabu Shiraiwaand reviewed by two anonymous referees.
References
Alexander, B., Hastings, M. G., Allman, D. J., Dachs, J., Thorn-ton, J. A., and Kunasek, S. A.: Quantifying atmospheric nitrateformation pathways based on a global model of the oxygen iso-topic composition (117O) of atmospheric nitrate, Atmos. Chem.
https://doi.org/10.5194/acp-22-5099-2022 Atmos. Chem. Phys., 22, 5099–5115, 2022

5112 S. Lim et al.: Oxidation pathways and emission sources of atmospheric particulate nitrate in Seoul
Phys., 9, 5043–5056, https://doi.org/10.5194/acp-9-5043-2009,2009.
Alexander, B., Sherwen, T., Holmes, C. D., Fisher, J. A., Chen,Q., Evans, M. J., and Kasibhatla, P.: Global inorganic nitrateproduction mechanisms: comparison of a global model with ni-trate isotope observations, Atmos. Chem. Phys., 20, 3859–3877,https://doi.org/10.5194/acp-20-3859-2020, 2020.
Carslaw, D. C. and Ropkins, K.: openair – An R package for airquality data analysis, Environ. Model. Softw., 27–28, 52–61,https://doi.org/10.1016/j.envsoft.2011.09.008, 2012.
Casciotti, K. L., Sigman, D. M., Hastings, M. G., Bohlke,J. K., and Hilkert, A.: Measurement of the oxygen iso-topic composition of nitrate in seawater and freshwater us-ing the denitrifier method, Anal. Chem., 74, 4905–4912,https://doi.org/10.1021/ac020113w, 2002.
Chen, J., Li, C., Ristovski, Z., Milic, A., Gu, Y., Islam, M.S., Wang, S., Hao, J., Zhang, H., He, C., Guo, H., Fu, H.,Miljevic, B., Morawska, L., Thai, P., LAM, Y. F., Pereira,G., Ding, A., Huang, X., and Dumka, U. C.: A review ofbiomass burning: Emissions and impacts on air quality, healthand climate in China, Sci. Total Environ., 579, 1000–1034,https://doi.org/10.1016/j.scitotenv.2016.11.025, 2017.
Cheng, J., Su, J., Cui, T., Li, X., Dong, X., Sun, F., Yang, Y.,Tong, D., Zheng, Y., Li, Y., Li, J., Zhang, Q., and He, K.:Dominant role of emission reduction in PM2.5 air quality im-provement in Beijing during 2013–2017: a model-based de-composition analysis, Atmos. Chem. Phys., 19, 6125–6146,https://doi.org/10.5194/acp-19-6125-2019, 2019
Elliott, E. M., Yu, Z., Cole, A. S., and Coughlin, J. G.: Iso-topic advances in understanding reactive nitrogen depositionand atmospheric processing, Sci. Total Environ., 662, 393–403,https://doi.org/10.1016/J.SCITOTENV.2018.12.177, 2019.
Felix, J. D. and Elliott, E. M.: Isotopic composition of pas-sively collected nitrogen dioxide emissions: Vehicle, soil andlivestock source signatures, Atmos. Environ., 92, 359–366,https://doi.org/10.1016/j.atmosenv.2014.04.005, 2014.
Felix, J. D., Elliott, E. M., and Shaw, S. L.: Nitrogen Iso-topic Composition of Coal-Fired Power Plant NOx : In-fluence of Emission Controls and Implications for GlobalEmission Inventories, Environ. Sci. Technol., 46, 3528–3535,https://doi.org/10.1021/es203355v, 2012.
Fibiger, D. L. and Hastings, M. G.: First Measurementsof the Nitrogen Isotopic Composition of NOx fromBiomass Burning, Environ. Sci. Technol., 50, 11569–11574,https://doi.org/10.1021/acs.est.6b03510, 2016.
Fountoukis, C. and Nenes, A.: ISORROPIA II: a computa-tionally efficient thermodynamic equilibrium model for K+–Ca2+–Mg2+–NH+4 –Na+–SO2−
4 –NO−3 –Cl−–H2O aerosols, At-mos. Chem. Phys., 7, 4639–4659, https://doi.org/10.5194/acp-7-4639-2007, 2007.
Freyer, H. D.: Seasonal variation of 15N / 14N ratiosin atmospheric nitrate species, Tellus B, 43, 30–44,https://doi.org/10.1034/j.1600-0889.1991.00003.x, 1991.
Freyer, H. D., Kley, D., Volz-Thomas, A., and Kobel, K.: On theinteraction of isotopic exchange processes with photochemicalreactions in atmospheric oxides of nitrogen, J. Geophys. Res.,98, 14791, https://doi.org/10.1029/93JD00874, 1993.
Goldberg, D. L., Saide, P. E., Lamsal, L. N., de Foy, B., Lu, Z., Woo,J.-H., Kim, Y., Kim, J., Gao, M., Carmichael, G., and Streets, D.
G.: A top-down assessment using OMI NO2 suggests an under-estimate in the NOx emissions inventory in Seoul, South Ko-rea, during KORUS-AQ, Atmos. Chem. Phys., 19, 1801–1818,https://doi.org/10.5194/acp-19-1801-2019, 2019.
Guha, T., Lin, C. T., Bhattacharya, S. K., Mahajan, A. S., Ou-Yang, C.-F., Lan, Y.-P., Hsu, S. C., and Liang, M.-C.: Isotopicratios of nitrate in aerosol samples from Mt. Lulin, a high-altitude station in Central Taiwan, Atmos. Environ., 154, 53–69,https://doi.org/10.1016/J.ATMOSENV.2017.01.036, 2017.
Hallquist, M., Stewart, D. J., Stephenson, S. K., and Anthony Cox,R.: Hydrolysis of N2O5 on sub-micron sulfate aerosols, Phys.Chem. Chem. Phys., 5, 3453, https://doi.org/10.1039/b301827j,2003.
He, P., Xie, Z., Chi, X., Yu, X., Fan, S., Kang, H., Liu, C., andZhan, H.: Atmospheric 117O(NO−3 ) reveals nocturnal chem-istry dominates nitrate production in Beijing haze, Atmos. Chem.Phys., 18, 14465–14476, https://doi.org/10.5194/acp-18-14465-2018, 2018.
He, P., Xie, Z., Yu, X., Wang, L., Kang, H., and Yue, F.:The observation of isotopic compositions of atmosphericnitrate in Shanghai China and its implication for reac-tive nitrogen chemistry, Sci. Total Environ., 714, 136727,https://doi.org/10.1016/J.SCITOTENV.2020.136727, 2020.
Heaton, T. H. E.: 15N/14N ratios of NOx from vehicle en-gines and coal-fired power stations, Tellus B, 42, 304–307,https://doi.org/10.1034/j.1600-0889.1990.00007.x-i1, 1990.
Ishino, S., Hattori, S., Savarino, J., Jourdain, B., Preunkert, S.,Legrand, M., Caillon, N., Barbero, A., Kuribayashi, K., andYoshida, N.: Seasonal variations of triple oxygen isotopic com-positions of atmospheric sulfate, nitrate, and ozone at Dumontd’Urville, coastal Antarctica, Atmos. Chem. Phys., 17, 3713–3727, https://doi.org/10.5194/acp-17-3713-2017, 2017.
Kaiser, J., Hastings, M. G., Houlton, B. Z., Rockmann, T., andSigman, D. M.: Triple oxygen isotope analysis of nitrate usingthe denitrifier method and thermal decomposition of N2O, Anal.Chem., 79, 599–607, https://doi.org/10.1021/ac061022s, 2007.
Kamezaki, K., Hattori, S., Iwamoto, Y., Ishino, S., Furu-tani, H., Miki, Y., Uematsu, M., Miura, K., and Yoshida,N.: Tracing the sources and formation pathways of at-mospheric particulate nitrate over the Pacific Ocean us-ing stable isotopes, Atmos. Environ., 209, 152–166,https://doi.org/10.1016/J.ATMOSENV.2019.04.026, 2019.
Kang, H., Zhu, B., Gao, J., He, Y., Wang, H., Su, J., Pan, C., Zhu, T.,and Yu, B.: Potential impacts of cold frontal passage on air qual-ity over the Yangtze River Delta, China, Atmos. Chem. Phys., 19,3673–3685, https://doi.org/10.5194/acp-19-3673-2019, 2019.
Kim, H., Zhang, Q., and Sun, Y.: Measurement report: Characteriza-tion of severe spring haze episodes and influences of long-rangetransport in the Seoul metropolitan area in March 2019, Atmos.Chem. Phys., 20, 11527–11550, https://doi.org/10.5194/acp-20-11527-2020, 2020.
Kim, H. C., Kim, S., Lee, S.-H., Kim, B.-U., and Lee, P.:Fine-Scale Columnar and Surface NOx Concentrations overSouth Korea: Comparison of Surface Monitors, TROPOMI,CMAQ and CAPSS Inventory, Atmosphere-Basel, 11, 101,https://doi.org/10.3390/atmos11010101, 2020.
Kim, S.-W., Yoon, S.-C., Kim, J., and Kim, S.-Y.: Seasonal andmonthly variations of columnar aerosol optical properties overeast Asia determined from multi-year MODIS, LIDAR, and
Atmos. Chem. Phys., 22, 5099–5115, 2022 https://doi.org/10.5194/acp-22-5099-2022

S. Lim et al.: Oxidation pathways and emission sources of atmospheric particulate nitrate in Seoul 5113
AERONET Sun/sky radiometer measurements, Atmos. Environ.,41, 1634–1651, https://doi.org/10.1016/j.atmosenv.2006.10.044,2007.
Lee, H.-J., Jo, H.-Y., Kim, S.-W., Park, M.-S., and Kim, C.-H.:Impacts of atmospheric vertical structures on transboundaryaerosol transport from China to South Korea, Sci. Rep., 9, 13040,https://doi.org/10.1038/s41598-019-49691-z, 2019.
Lelieveld, J., Evans, J. S., Fnais, M., Giannadaki, D., and Pozzer,A.: The contribution of outdoor air pollution sources to pre-mature mortality on a global scale, Nature, 525, 367–371,https://doi.org/10.1038/nature15371, 2015.
Li, D. and Wang, X.: Nitrogen isotopic signature of soil-releasednitric oxide (NO) after fertilizer application, Atmos. Environ.,42, 4747–4754, https://doi.org/10.1016/j.atmosenv.2008.01.042,2008.
Li, H., Zhang, Q., Zheng, B., Chen, C., Wu, N., Guo, H., Zhang,Y., Zheng, Y., Li, X., and He, K.: Nitrate-driven urban hazepollution during summertime over the North China Plain, At-mos. Chem. Phys., 18, 5293–5306, https://doi.org/10.5194/acp-18-5293-2018, 2018.
Li, J., Zhang, X., Orlando, J., Tyndall, G., and Michalski, G.: Quan-tifying the nitrogen isotope effects during photochemical equi-librium between NO and NO2: implications for 115N in tropo-spheric reactive nitrogen, Atmos. Chem. Phys., 20, 9805–9819,https://doi.org/10.5194/acp-20-9805-2020, 2020.
Li, J., Davy, P., Harvey, M., Katzman, T., Mitchell, T.,and Michalski, G.: Nitrogen isotopes in nitrate aerosolscollected in the remote marine boundary layer: Implica-tions for nitrogen isotopic fractionations among atmosphericreactive nitrogen species, Atmos. Environ., 245, 118028,https://doi.org/10.1016/j.atmosenv.2020.118028, 2021.
Li, Z., Walters, W. W., Hastings, M. G., Zhang, Y., Song,L., Liu, D., Zhang, W., Pan, Y., Fu, P., and Fang, Y.:Nitrate Isotopic Composition in Precipitation at a ChineseMegacity: Seasonal Variations, Atmospheric Processes, andImplications for Sources, Earth Sp. Sci., 6, 2200–2213,https://doi.org/10.1029/2019EA000759, 2019.
Lim, S., Lee, M., Czimczik, C. I., Joo, T., Holden, S., Mouteva,G., Santos, G. M., Xu, X., Walker, J., Kim, S., Kim, H.S., Kim, S., and Lee, S.: Source signatures from com-bined isotopic analyses of PM2.5 carbonaceous and nitrogenaerosols at the peri-urban Taehwa Research Forest, South Ko-rea in summer and fall, Sci. Total Environ., 655, 1505–1514,https://doi.org/10.1016/j.scitotenv.2018.11.157, 2019.
Lim, S., Yang, X., Lee, M., Li, G., Gao, Y., Shang, X.,Zhang, K., Czimczik, C. I., Xu, X., Bae, M.-S., Moon, K.-J., and Jeon, K.: Fossil-driven secondary inorganic PM2.5 en-hancement in the North China Plain: Evidence from car-bon and nitrogen isotopes, Environ. Pollut., 266, 115163,https://doi.org/10.1016/J.ENVPOL.2020.115163, 2020.
Liu, Z., Gao, W., Yu, Y., Hu, B., Xin, J., Sun, Y., Wang, L., Wang,G., Bi, X., Zhang, G., Xu, H., Cong, Z., He, J., Xu, J., and Wang,Y.: Characteristics of PM2.5 mass concentrations and chemicalspecies in urban and background areas of China: emerging resultsfrom the CARE-China network, Atmos. Chem. Phys., 18, 8849–8871, https://doi.org/10.5194/acp-18-8849-2018, 2018.
McIlvin, M. R. and Casciotti, K. L.: Technical updates to the bacte-rial method for nitrate isotopic analyses, Anal. Chem., 83, 1850–1856, https://doi.org/10.1021/AC1028984, 2011.
Michalski, G. and Bhattacharya, S. K.: The role ofsymmetry in the mass independent isotope effect inozone, P. Natl. Acad. Sci. USA, 106, 5493–5496,https://doi.org/10.1073/PNAS.0812755106, 2009.
Michalski, G., Scott, Z., Kabiling, M., and Thiemens,M. H.: First measurements and modeling of 117Oin atmospheric nitrate, Geophys. Res. Lett., 30, 1870,https://doi.org/10.1029/2003GL017015, 2003.
Michalski, G., Meixner, T., Fenn, M., Hernandez, L., Sirul-nik, A., Edith Allen, A., and Thiemens, M.: Tracing Atmo-spheric Nitrate Deposition in a Complex Semiarid Ecosys-tem Using 117O, Environ. Sci. Technol., 38, 2175–2181,https://doi.org/10.1021/ES034980+, 2004.
Morin, S., Savarino, J., Frey, M. M., Domine, F., Jacobi, H.-W.,Kaleschke, L., and Martins, J. M. F.: Comprehensive isotopiccomposition of atmospheric nitrate in the Atlantic Ocean bound-ary layer from 65◦ S to 79◦ N, J. Geophys. Res., 114, D05303,https://doi.org/10.1029/2008JD010696, 2009.
Morin, S., Sander, R., and Savarino, J.: Simulation of the diur-nal variations of the oxygen isotope anomaly (117O) of reac-tive atmospheric species, Atmos. Chem. Phys., 11, 3653–3671,https://doi.org/10.5194/acp-11-3653-2011, 2011.
Nelson, D. M., Tsunogai, U., Ding, D., Ohyama, T., Komatsu, D.D., Nakagawa, F., Noguchi, I., and Yamaguchi, T.: Triple oxygenisotopes indicate urbanization affects sources of nitrate in wetand dry atmospheric deposition, Atmos. Chem. Phys., 18, 6381–6392, https://doi.org/10.5194/acp-18-6381-2018, 2018.
Park, Y., Park, K., Kim, H., Yu, S., Noh, S., Kim, M., Kim, J.,Ahn, J., Lee, M., Seok, K., and Kim, Y.: Characterizing isotopiccompositions of TC−C, NO−3 −N, and NH+4 −N in PM2.5 inSouth Korea: Impact of China’s winter heating, Environ. Pollut.,233, 735–744, https://doi.org/10.1016/J.ENVPOL.2017.10.072,2018.
Parnell, A. C., Inger, R., Bearhop, S., and Jackson, A.L.: Source Partitioning Using Stable Isotopes: Cop-ing with Too Much Variation, PLoS One, 5, e9672,https://doi.org/10.1371/journal.pone.0009672, 2010.
Parnell, A. C., Phillips, D. L., Bearhop, S., Semmens, B. X., Ward,E. J., Moore, J. W., Jackson, A. L., Grey, J., Kelly, D. J., and In-ger, R.: Bayesian stable isotope mixing models, Environmetrics,24, 387–399, https://doi.org/10.1002/env.2221, 2013.
Quan, J., Dou, Y., Zhao, X., Liu, Q., Sun, Z., Pan, Y.,Jia, X., Cheng, Z., Ma, P., Su, J., Xin, J., and Liu, Y.:Regional atmospheric pollutant transport mechanisms overthe North China Plain driven by topography and plane-tary boundary layer processes, Atmos. Environ., 221, 117098,https://doi.org/10.1016/J.ATMOSENV.2019.117098, 2020.
Rose, L. A., Yu, Z., Bain, D. J., and Elliott, E. M.:High resolution, extreme isotopic variability of pre-cipitation nitrate, Atmos. Environ., 207, 63–74,https://doi.org/10.1016/J.ATMOSENV.2019.03.012, 2019.
Saunders, S. M., Jenkin, M. E., Derwent, R. G., and Pilling, M.J.: Protocol for the development of the Master Chemical Mech-anism, MCM v3 (Part A): tropospheric degradation of non-aromatic volatile organic compounds, Atmos. Chem. Phys., 3,161–180, https://doi.org/10.5194/acp-3-161-2003, 2003.
Savarino, J., Kaiser, J., Morin, S., Sigman, D. M., and Thiemens,M. H.: Nitrogen and oxygen isotopic constraints on the origin of
https://doi.org/10.5194/acp-22-5099-2022 Atmos. Chem. Phys., 22, 5099–5115, 2022

5114 S. Lim et al.: Oxidation pathways and emission sources of atmospheric particulate nitrate in Seoul
atmospheric nitrate in coastal Antarctica, Atmos. Chem. Phys.,7, 1925–1945, https://doi.org/10.5194/acp-7-1925-2007, 2007.
Savarino, J., Morin, S., Erbland, J., Grannec, F., Patey, M.D., Vicars, W., Alexander, B., and Achterberg, E. P.: Iso-topic composition of atmospheric nitrate in a tropical ma-rine boundary layer., P. Natl. Acad. Sci. USA, 110, 17668–73,https://doi.org/10.1073/pnas.1216639110, 2013.
Shao, P., Tian, H., Sun, Y., Liu, H., Wu, B., Liu, S., Liu, X., Wu,Y., Liang, W., Wang, Y., Gao, J., Xue, Y., Bai, X., Liu, W., Lin,S., and Hu, G.: Characterizing remarkable changes of severehaze events and chemical compositions in multi-size airborneparticles (PM1, PM2.5 and PM10) from January 2013 to 2016–2017 winter in Beijing, China, Atmos. Environ., 189, 133–144,https://doi.org/10.1016/J.ATMOSENV.2018.06.038, 2018.
Sharma, H. D., Jervis, R. E., and Wong, K. Y.: Isotopic exchangereactions in nitrogen oxides, J. Phys. Chem., 74, 923–933,https://doi.org/10.1021/j100699a044, 1970.
Shi, C., Nduka, I. C., Yang, Y., Huang, Y., Yao, R., Zhang,H., He, B., Xie, C., Wang, Z., and Yim, S. H. L.: Char-acteristics and meteorological mechanisms of transbound-ary air pollution in a persistent heavy PM2.5 pollutionepisode in Central-East China, Atmos. Environ., 223, 117239,https://doi.org/10.1016/J.ATMOSENV.2019.117239, 2020.
Song, W., Wang, Y.-L., Yang, W., Sun, X.-C., Tong, Y.-D., Wang,X.-M., Liu, C.-Q., Bai, Z.-P., and Liu, X.-Y.: Isotopic eval-uation on relative contributions of major NOx sources to ni-trate of PM2.5 in Beijing, Environ. Pollut., 248, 183–190,https://doi.org/10.1016/J.ENVPOL.2019.01.081, 2019.
Song, W., Liu, X.-Y., Wang, Y.-L., Tong, Y.-D., Bai, Z.-P.,and Liu, C.-Q.: Nitrogen isotope differences between atmo-spheric nitrate and corresponding nitrogen oxides: A new con-straint using oxygen isotopes, Sci. Total Environ., 701, 134515,https://doi.org/10.1016/J.SCITOTENV.2019.134515, 2020.
Stein, A. F., Draxler, R. R., Rolph, G. D., Stunder, B. J. B., Co-hen, M. D., and Ngan, F.: NOAA’s HYSPLIT AtmosphericTransport and Dispersion Modeling System, B. Am. Meteo-rol. Soc., 96, 2059–2077, https://doi.org/10.1175/BAMS-D-14-00110.1, 2015.
Thiemens, M. H.: Mass-Independent Isotope Effects in PlanetaryAtmospheres and the Early Solar System, Science, 283, 341–345, https://doi.org/10.1126/science.283.5400.341, 1999.
Thiemens, M. H.: HISTORY AND APPLICA-TIONS OF MASS-INDEPENDENT ISOTOPE EF-FECTS, Annu. Rev. Earth Planet. Sci., 34, 217–262,https://doi.org/10.1146/annurev.earth.34.031405.125026, 2006.
Tong, D., Zhang, Q., Liu, F., Geng, G., Zheng, Y., Xue, T., Hong, C.,Wu, R., Qin, Y., Zhao, H., Yan, L., and He, K.: Current Emissionsand Future Mitigation Pathways of Coal-Fired Power Plants inChina from 2010 to 2030, Environ. Sci. Technol., 52, 12905–12914, https://doi.org/10.1021/acs.est.8b02919, 2018.
van der Werf, G. R., Randerson, J. T., Giglio, L., Collatz, G.J., Mu, M., Kasibhatla, P. S., Morton, D. C., DeFries, R. S.,Jin, Y., and van Leeuwen, T. T.: Global fire emissions and thecontribution of deforestation, savanna, forest, agricultural, andpeat fires (1997–2009), Atmos. Chem. Phys., 10, 11707–11735,https://doi.org/10.5194/acp-10-11707-2010, 2010.
Vicars, W. C. and Savarino, J.: Quantitative constraints on the17O-excess (117O) signature of surface ozone: Ambient mea-surements from 50◦ N to 50◦ S using the nitrite-coated fil-
ter technique, Geochim. Cosmochim. Acta, 135, 270–287,https://doi.org/10.1016/J.GCA.2014.03.023, 2014.
Vicars, W. C., Bhattacharya, S. K., Erbland, J., and Savarino, J.:Measurement of the 17O-excess (117O) of tropospheric ozoneusing a nitrite-coated filter, Rapid Commun. Mass Spectrom., 26,1219–1231, https://doi.org/10.1002/rcm.6218, 2012.
Wahner, A., Mentel, T. F., Sohn, M., and Stier, J.:Heterogeneous reaction of N2O5 on sodium nitrateaerosol, J. Geophys. Res. Atmos., 103, 31103–31112,https://doi.org/10.1029/1998JD100022, 1998.
Walters, W. W. and Michalski, G.: Theoretical calculation of nitro-gen isotope equilibrium exchange fractionation factors for vari-ous NOy molecules, Geochim. Cosmochim. Acta, 164, 284–297,https://doi.org/10.1016/J.GCA.2015.05.029, 2015.
Walters, W. W. and Michalski, G.: Theoretical calculation of oxy-gen equilibrium isotope fractionation factors involving variousNO molecules, OH, and H2O and its implications for isotopevariations in atmospheric nitrate, Geochim. Cosmochim. Acta,191, 89–101, https://doi.org/10.1016/j.gca.2016.06.039, 2016.
Walters, W. W., Goodwin, S. R., and Michalski, G.: Ni-trogen Stable Isotope Composition (δ15N) of Vehicle-Emitted NOx , Environ. Sci. Technol., 49, 2278–2285,https://doi.org/10.1021/es505580v, 2015.
Walters, W. W., Simonini, D. S., and Michalski, G.: Nitro-gen isotope exchange between NO and NO2 and its im-plications for δ15N variations in tropospheric NOx andatmospheric nitrate, Geophys. Res. Lett., 43, 440–448,https://doi.org/10.1002/2015GL066438, 2016.
Walters, W. W., Fang, H., and Michalski, G.: Summer-time diurnal variations in the isotopic compositionof atmospheric nitrogen dioxide at a small midwest-ern United States city, Atmos. Environ., 179, 1–11,https://doi.org/10.1016/J.ATMOSENV.2018.01.047, 2018.
Wang, Y., Wang, Y., Wang, L., Petäjä, T., Zha, Q., Gong,C., Li, S., Pan, Y., Hu, B., Xin, J., and Kulmala, M.: In-creased inorganic aerosol fraction contributes to air pollu-tion and haze in China, Atmos. Chem. Phys., 19, 5881–5888,https://doi.org/10.5194/acp-19-5881-2019, 2019a.
Wang, Y., Song, W., Yang, W., Sun, X., Tong, Y., Wang, X., Liu,C., Bai, Z., and Liu, X.: Influences of Atmospheric Pollution onthe Contributions of Major Oxidation Pathways to PM 2.5 NitrateFormation in Beijing, J. Geophys. Res. Atmos., 124, 4174–4185,https://doi.org/10.1029/2019JD030284, 2019b.
Xie, Y., Dai, H., Zhang, Y., Wu, Y., Hanaoka, T., and Masui,T.: Comparison of health and economic impacts of PM2.5and ozone pollution in China, Environ. Int., 130, 104881,https://doi.org/10.1016/J.ENVINT.2019.05.075, 2019.
Xu, W., Sun, Y., Wang, Q., Zhao, J., Wang, J., Ge, X., Xie, C.,Zhou, W., Du, W., Li, J., Fu, P., Wang, Z., Worsnop, D. R.,and Coe, H.: Changes in Aerosol Chemistry From 2014 to 2016in Winter in Beijing: Insights From High-Resolution AerosolMass Spectrometry, J. Geophys. Res. Atmos., 124, 1132–1147,https://doi.org/10.1029/2018JD029245, 2019.
Yu, Z. and Elliott, E. M.: Novel method for nitrogen isotopic analy-sis of soil-emitted nitric oxide, Environ. Sci. Technol., 51, 6268–6278, https://doi.org/10.1021/acs.est.7b00592, 2017.
Zhao, H., Zhang, X., Zhang, S., Chen, W., Tong, D., Xiu, A.,Zhao, H., Zhang, X., Zhang, S., Chen, W., Tong, D. Q.,and Xiu, A.: Effects of Agricultural Biomass Burning on Re-
Atmos. Chem. Phys., 22, 5099–5115, 2022 https://doi.org/10.5194/acp-22-5099-2022

S. Lim et al.: Oxidation pathways and emission sources of atmospheric particulate nitrate in Seoul 5115
gional Haze in China: A Review, Atmosphere-Basel, 8, 88,https://doi.org/10.3390/atmos8050088, 2017.
Zheng, H., Kong, S., Wu, F., Cheng, Y., Niu, Z., Zheng, S.,Yang, G., Yao, L., Yan, Q., Wu, J., Zheng, M., Chen, N., Xu,K., Yan, Y., Liu, D., Zhao, D., Zhao, T., Bai, Y., Li, S., andQi, S.: Intra-regional transport of black carbon between thesouth edge of the North China Plain and central China dur-ing winter haze episodes, Atmos. Chem. Phys., 19, 4499–4516,https://doi.org/10.5194/acp-19-4499-2019, 2019.
Zong, Z., Wang, X., Tian, C., Chen, Y., Fang, Y., Zhang, F., Li, C.,Sun, J., Li, J., and Zhang, G.: First assessment of NOx sources ata regional background site in north China using isotopic analysislinked with modeling, Environ. Sci. Technol., 51, 5923–5931,https://doi.org/10.1021/acs.est.6b06316, 2017.
Zong, Z., Tan, Y., Wang, X., Tian, C., Li, J., Fang, Y., Chen, Y.,Cui, S., and Zhang, G.: Dual-modelling-based source apportion-ment of NOx in five Chinese megacities: Providing the iso-topic footprint from 2013 to 2014, Environ. Int., 137, 105592,https://doi.org/10.1016/J.ENVINT.2020.105592, 2020.
https://doi.org/10.5194/acp-22-5099-2022 Atmos. Chem. Phys., 22, 5099–5115, 2022