Optimisation of Modelling Methods for Traffic Pollution in Streets
114
1 Optimisation of Modelling Methods for Traffic Pollution in Streets Ruwim Berkowicz 1 Rex Britter 2 Silvana Di Sabatino 3 1. National Environment Research Institute, Department of Atmospheric Environment, Frederiksborgvej 399, DK-4000 Roskilde, Denmark, [email protected] 2. Department of Engineering, University of Cambridge, Trumpington St., Cambridge, CB2 1PZ, UK, [email protected] 3. Dipartimento di Scienza dei Materiali, Universita’ degli Studi de Lecce, Via per Arnesano, 73100, Lecce, Italy, [email protected]
-
Upload
independent -
Category
Documents
-
view
1 -
download
0
Transcript of Optimisation of Modelling Methods for Traffic Pollution in Streets

1
Optimisation of Modelling Methods for Traffic Pollution
in Streets
Ruwim Berkowicz1
Rex Britter2
Silvana Di Sabatino3
1. National Environment Research Institute, Department of Atmospheric Environment,
Frederiksborgvej 399, DK-4000 Roskilde, Denmark, [email protected] 2. Department of Engineering, University of Cambridge, Trumpington St., Cambridge,
CB2 1PZ, UK, [email protected] 3. Dipartimento di Scienza dei Materiali, Universita’ degli Studi de Lecce, Via per
Arnesano, 73100, Lecce, Italy, [email protected]

2
Preface
The EU TRAPOS project ran from November 1997 until April 2001. Upon completion of what was thought to be a successful project the participants were of the view that a book could be put together on the topics of the project that would be useful to a wider community. This was nearly completed in late 2001 but with various distractions and the participants moving to different tasks the book did not see the light of day. However much of the work had been done and several of us recently thought that we could make what we have done available on a CD. The material that follows was up to date as of late 2001 and we trust that some of you will find it useful. Please remember that some of the email addresses and website links may not be current. Ruwim Berkowicz Rex Britter Silvana Di Sabatino November 2004

3
Foreword
By the end of 1997 the European Commission had approved the establishment of a new Research Network operating within the framework of the European Commission Training and Mobility of Researchers Programme (TMR). The Network's title was - "Optimisation of Modelling Methods for Traffic Pollution in Streets", with the short acronym - TRAPOS. The Network project was originally scheduled to last for 3 years but after the first two years of work it was decided to seek the permission of the Commission for a 6-month prolongation. This request was granted and the Network was scheduled to finish at the end of April 2001.
The TMR Networks have two main objectives:
1. To promote training-through-research, especially of young researchers, within the
framework of high quality trans-national collaborative research projects and, 2. To contribute to scientific achievements within a specified research area through co-
operative work. The TRAPOS Network was established and conducted with the aim of contributing efficiently to both of these objectives. The participating teams were:
National Environmental Research Institute (NERI), Denmark University of Surrey (U.Surrey), United Kingdom University of Karlsruhe (U.Karlsruhe), Germany Swiss Federal Institute of Technology (ETHZ), Switzerland Ecole Centrale de Nantes (ECN), France Ingenieurbüro Dr.-Ing. Achim Lohmeyer (IBAL), Germany Aristotle University of Thessaloniki (LHTEE/AUT), Greece Cambridge Environmental Research Consultants Ltd (CERC), United Kingdom Netherlands Organisation for Applied Scientific Research (TNO), The Netherlands University of Hamburg (MIHU), Germany
The National Environmental Research Institute (NERI) was designated to act as co-ordinator of the Network.
The networks established within the framework of the TMR Programme are obligated to employ a number of young researchers to participate in the activities of the network. The rules of employment of the young researchers were:
− The visiting researchers must be aged 35 years or less at the time of their appointment. − Visiting researchers must be holders of a doctoral degree or of a degree that qualifies them
to embark on a doctoral degree. − Visiting researchers must be nationals of a Community Member State or a State
associated with the Programme (Iceland, Israel, Liechtenstein and Norway). The economical support provided by the European Commission is awarded to a network in order to allow its participants to co-ordinate their research around a common project and to reinforce their research teams through the temporary appointment of young researchers from a country other than that

4
of the team concerned. The TRAPOS Network was awarded a support of up to 1,500,000 EURO, which was mainly allocated to provide job opportunities and training of at least 22 person-years of young visiting researchers. At the end of the contract period 25 young researchers were, or have been, employed within the Network. This corresponds to 301 person-months of young visiting researchers.
The scientific objective of TRAPOS was the improvement of modelling tools used for prediction of traffic pollution in urban streets, and with the main focus on dispersion modelling.
Traffic pollution modelling is a very broad discipline. To narrow the scope of the work within the Network, some main research areas were identified, and these were as follows:
− the traffic created turbulence and its influence on dispersion of pollutants in the street, − the influence of thermal effects on flow modification within street canyons with special
regard to low wind speed conditions, − the sensitivity of the flow and turbulence characteristics to the architecture of the street
and its surroundings, − the fast chemical processes with special regard to NO-NO2 conversion, − dispersion and transformation processes of Respirable Suspended Particulate matter
(RSP). The Network's teams represented universities, public research organisations and commercial consulting companies. Their field of research covers different aspects of air pollution modelling, such as: laboratory wind tunnel modelling, field measurements, computational fluid dynamics and regulatory applications of models and the work within the TRAPOS Network was closely connected and related to other projects and research activities conducted by the participating teams. The interdisciplinary character of the co-operation between teams representing different fields of experience and working methods ensured efficient utilisation of the results and scientific achievements. Making use of the existing facilities and expertise of the participating teams, the activities contributing to the research objectives were based on
− field measurements and analyses of data,
− laboratory (wind tunnel) measurements,
− model evaluation and inter-comparison. The models in use within TRAPOS covered both advanced Computational Fluid Dynamics (CFD) models and simpler, parameterised models. Synergy in the work with different types of models ensured scientific quality and the practical applicability of the results.
Field measurements and wind-tunnel data were used for evaluation and improvement of mathematical models. Wind-tunnel models were also tested against data from field measurements. Results from more advanced numerical CFD models were used to improve parameterisation of simpler semi-empirical models. Design of new field experiments and also wind-tunnel measurements was guided by results from mathematical modelling.
The young visiting researchers employed within the TRAPOS were fully integrated within the Network teams and were actively participating in their work. The Network held frequent working meetings and seminars where the results of the joint work were presented and discussed.
In order to consolidate the joint work a number of Working Groups was created focusing on the scientific subjects and activities of the Network. These Working Groups, which were led by the young researchers, got the main responsibility for organisation of the work within TRAPOS. Specially dedicated web-sites, with presentation of the results and conclusions, have been established by several of these groups (http://www.dmu.dk/AtmosphericEnvironment/trapos/wg.htm). The achievements and conclusions provided by the Working Groups constitute the main contents of the present publication.

5
Chapter 1 deals with the processes influencing dispersion in a street environment. Theoretical and experimental studies of these processes was the main subject of TRAPOS. Beside more traditional aspects, such as the influence of the street architecture on the dispersion conditions, this chapter covers also some special phenomena, which have not been studied in such details previously. These are, the traffic produced turbulence and the thermal effects.
Presentation and discussion of the different tools used within traffic pollution modelling is given in Chapter 2. This chapter covers both the use of laboratory wind tunnels and the aspects of CFD-modelling. The last subject is comprehensively substantiated by the extensive CFD model evaluation study conducted within TRAPOS. The data used for this evaluation study originated mainly from systematic wind tunnel experiments but field data were also used.
Application and evaluation of different modelling methods for a practical traffic pollution study is presented in Chapter 3. This study, the so-called "Podbielski exercise", was initiated and conducted by German institutions but with a very active participation of TRAPOS.
A summary and overview of the TRAPOS Network and its achievements is given in Chapter 4.
The scientific achievements of the TRAPOS project were frequently presented at several major Air Pollution conferences and published in the open literature. In March 2001 the Third International Conference on Urban Air Quality was held in Loutraki, Greece. This Conference coincided with finalising of TRAPOS and provided a great opportunity to present the results of the network to a broad scientific community. The Extended Abstracts of presentations given by TRAPOS participants at this Conference are attached to this publication (Chapter 5).
The reference list of all papers published during TRAPOS is given in Chapter 6.
The Appendixes provide organisational details of the Participants and the list of the Young Visiting Researchers employed by the network.
All TRAPOS Participants have contributed to this publication. Dr. Rex Britter, Cambridge Environmental Research Consultants Ltd and Cambridge University, has collected and edited the contributions.
Ruwim Berkowicz (Network co-ordinator) National Environmental Research Institute Roskilde, Denmark Roskilde, July 2001

6
Contents Preface........................................................................................................................................ 2 Foreword .................................................................................................................................... 3 Chapter 1 Processes Influencing Dispersion In Street Canyons ................................................ 7
1.1 Street architecture and air quality................................................................................. 8 1.2 The Modelling of Traffic Produced Turbulence ........................................................ 25 1.3 The influence of thermal effects on flow and dispersion in street canyons ............... 35 1.4 The modelling of tunnel entrances and exits .............................................................. 45 1.5 The Influence of Fast Chemistry on the Composition of NOx in the
Emission Input to Atmospheric Dispersion Models................................................... 51 1.6 Particulate emission and dispersion in street canyon ................................................. 60 1.7 Determination of the 99.8-Percentile of NO2 Concentrations for EIA Studies.......... 67
Chapter 2 Tools for the Study of Pollutant Dispersion in Street Canyons............................... 73
2.1 The use of wind tunnels in modelling air quality in street canyons. .......................... 74 2.2 The use of computational fluid dynamics in modelling air quality in
street canyons ............................................................................................................. 86 Chapter 3 Model Evaluation - "Podbielsi Exercise" ................................................................ 94
3.1 Comparison of concentration predictions, done by different modellers for the same street canyon (Podbi-Exercise)................................................................................... 95
Chapter 4 Concluding Remarks ............................................................................................. 101
4.1 Concluding Remarks ................................................................................................ 103 Chapter 5 Abstracts Prepared for the Third International Conference on Urban Air Quality, Loutraki, Greece, March 2001 ................................................. 104 Chapter 6 Reference list of papers published during TRAPOS............................................. 108 Appendices ............................................................................................................................. 111

7
Chapter 1
Processes Influencing Dispersion In Street Canyons

8
1.1 Street architecture and air quality
Eric Savory1, Mathias W. Rotach2, Christian Chauvet3, Emmanuel Guilloteau4, Petra Kastner-Klein2, Anke Kovar-Panskus1, Petroula Louka5, Peter Sahm6, Silvia Trini Castelli7
1University of Surrey, UK
2Institute for Climate Research ETHZ Switzerland 3University of Hamburg, Germany
4Institute for Hydrodynamics, University of Karlsruhe, Germany 5Ecole Centrale de Nantes, France
6LHTEE, University of Thessaloniki, Greece 7TNO Apeldoorn, The Netherlands
This chapter is concerned with the examination of the influence of street architecture, that is the size, shape and distribution of buildings, on the wind flow and pollutant dispersion within street canyons. A number of studies have been carried out within TRAPOS to examine this influence, using wind tunnel and numerical modelling approaches, as well as full-scale experiments. The idealised cases of very simple 2D and 3D canyons have been studied, together with modifications to the building roof shapes and the effect of the flow over a series of street rows. This has allowed a better understanding of the more complex real urban geometries that were also studied in TRAPOS. In addition to the building infrastructure, numerical investigations have been carried out into the effect of highway noise barriers on the dispersion of traffic produced pollution. Overall, the work in this area within TRAPOS has shown that reproducing small details of the street architecture may be very important in terms of identifying local pollutant concentration through scientific numerical modelling, whilst operational models for determining more generalised pollution conditions will need to continue to rely on using first order parameters such as canyon aspect ratios, wind directions and relative building heights. 1.1.1 Introduction
The wind flow and turbulence characteristics are of key importance in estimating the pollution level within streets. Indeed, the mean flow governs the pollutant transport mechanism whilst the turbulence strongly influences the pollutant mixing and dispersion mechanisms. When studying pollutant dispersion within streets it is, therefore, essential to assess the influence of the street geometry on these mechanisms. This can be done either by investigating the variability of the flow and turbulence structure in the immediate vicinity of the street canyon with varying street geometry or, alternatively, by directly assessing the influence on dispersion characteristics due to changing canyon properties. Both approaches have been followed within TRAPOS. For the first approach full-scale observations and wind tunnel (WT) experiments may be appropriate. For the second, either WT observations as well as numerical modelling may be used.1
Figure 1 shows a prototype street canyon as it can most simply be described by its aspect ratio W/H (street width to building height) and its orientation in relation to the wind direction and the position of the sun. Thus, the schematic street consists of two parallel ”building blocks” whose length is much larger than their height and width. In the following a brief summary is given on how this simple geometry is typically used to investigate street pollution problems and how it is extended to more realistic configurations. Work that was performed within TRAPOS will briefly be summarised in the next subsections.
a) The simple 2D canyon. This configuration defines the traditional approach to studying
street canyon pollution or turbulence in WTs or numerical models (e.g., Kastner-Klein, 1999). The influence of approaching flow direction (e.g., Kastner-Klein and Plate 1999)
1 Clearly, also full-scale observations may be helpful in this respect, but usually a systematic variation of conditions is beyond the possibilities of the experimenter.

9
or aspect ratio on concentration patterns can be studied. While being simple it has the disadvantage that in practice the buildings immediately upwind seriously distort the flow. Hence, unlike Figure 1, the typical urban street canyon does not have an undisturbed upwind fetch but, rather, a complicated urban surface.
b) The cavity. As a variant of a) a street canyon can be simulated as a cavity. In this configuration there is no 'first-building effect', but the upwind 'urban' surface may not have the flow characteristics of a rough, irregular building pattern. Within TRAPOS, this approach was used to study the influence of aspect ratio on street level pollution using WT (Kovar-Panskus et al 2001) and numerical modelling (Sahm et al 2001).
c) Rows of street canyons. To address the problems with the simple canyon, attempts have been made to investigate, at which row the flow starts to become self-similar and thereby, where street canyon pollution resembles the typical urban situation (see e.g. Meroney et al. 1996). Brown et al. (2000) argue that this is the case after about the 6th row. Further upwind, the flow, turbulence and dispersion conditions are to a large extent determined by the flow separation at the upwind edge of the first building. Within TRAPOS this problem has been studied by Kastner-Klein and Plate (1999) in a series of WT experiments.
d) Non-uniform geometry. Both, the buildings immediately surrounding the street canyon of interest or upwind ‘urban surface’ do not usually have a simple rectangular geometry. Rafailidis (1997) has reported on the substantial influence of roof shape on turbulence characteristics and pollutant concentrations within and above a street canyon. Within TRAPOS different roof types were combined (upwind and downwind building) and their effect on street canyon pollution was studied (Kastner-Klein and Plate, 1999). Also, the effect of upwind obstacles with a different height than that of the canyon itself has been studied using a numerical model (Assimakopoulos et al. 2000).
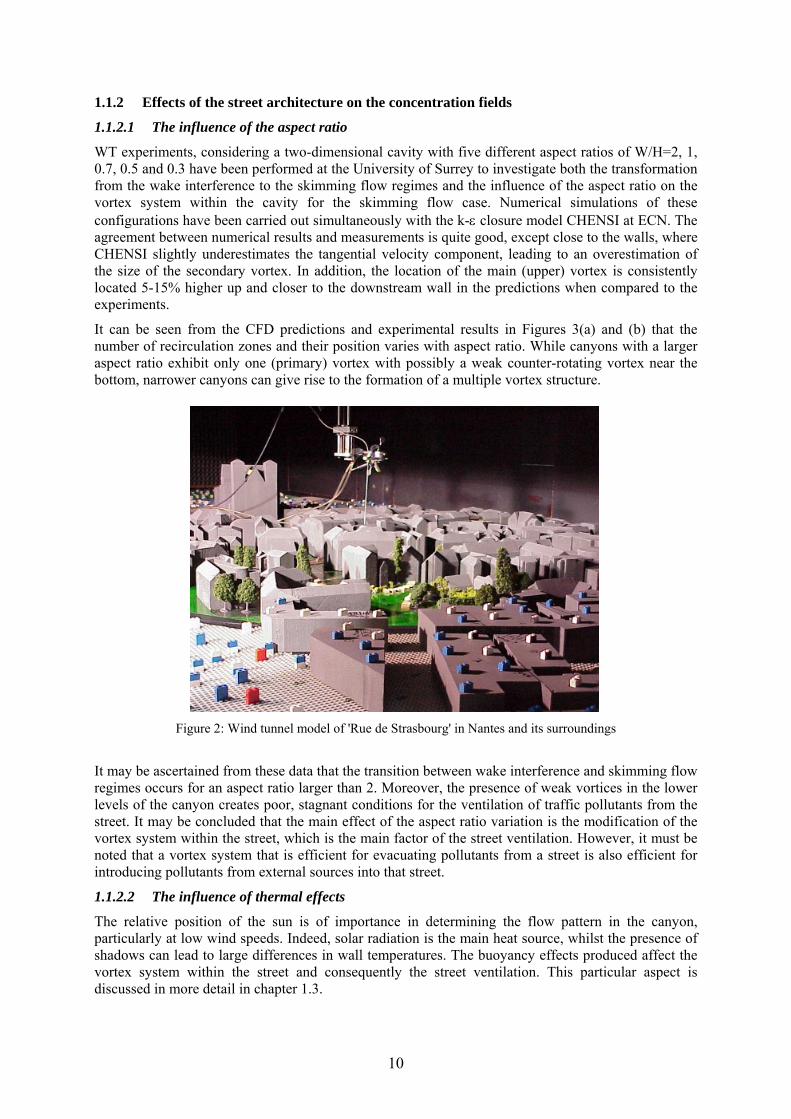
e) Real urban surfaces. The most realistic modelling approach for urban street canyons is certainly to mimic the street geometry in as much detail as possible. This is true for WT as well as numerical experiments. Within TRAPOS several WT models of real streets and their surrounding were realised (Figure 2 as an example). They were all chosen in connection with well-investigated sites with respect to air pollution and/or meteorological observations. In addition, all of the cases were simulated by numerical means. Some efforts were made (Chauvet et al. 1999 and 2000) in order to increase the comparability of numerical and WT modelling approaches.
xy
z Vα
L
W
H
Figure 1: Schematic representation of simple street canyon geometry
10
1.1.2 Effects of the street architecture on the concentration fields
1.1.2.1 The influence of the aspect ratio
WT experiments, considering a two-dimensional cavity with five different aspect ratios of W/H=2, 1, 0.7, 0.5 and 0.3 have been performed at the University of Surrey to investigate both the transformation from the wake interference to the skimming flow regimes and the influence of the aspect ratio on the vortex system within the cavity for the skimming flow case. Numerical simulations of these configurations have been carried out simultaneously with the k-ε closure model CHENSI at ECN. The agreement between numerical results and measurements is quite good, except close to the walls, where CHENSI slightly underestimates the tangential velocity component, leading to an overestimation of the size of the secondary vortex. In addition, the location of the main (upper) vortex is consistently located 5-15% higher up and closer to the downstream wall in the predictions when compared to the experiments.
It can be seen from the CFD predictions and experimental results in Figures 3(a) and (b) that the number of recirculation zones and their position varies with aspect ratio. While canyons with a larger aspect ratio exhibit only one (primary) vortex with possibly a weak counter-rotating vortex near the bottom, narrower canyons can give rise to the formation of a multiple vortex structure.
Figure 2: Wind tunnel model of 'Rue de Strasbourg' in Nantes and its surroundings
It may be ascertained from these data that the transition between wake interference and skimming flow regimes occurs for an aspect ratio larger than 2. Moreover, the presence of weak vortices in the lower levels of the canyon creates poor, stagnant conditions for the ventilation of traffic pollutants from the street. It may be concluded that the main effect of the aspect ratio variation is the modification of the vortex system within the street, which is the main factor of the street ventilation. However, it must be noted that a vortex system that is efficient for evacuating pollutants from a street is also efficient for introducing pollutants from external sources into that street.
1.1.2.2 The influence of thermal effects
The relative position of the sun is of importance in determining the flow pattern in the canyon, particularly at low wind speeds. Indeed, solar radiation is the main heat source, whilst the presence of shadows can lead to large differences in wall temperatures. The buoyancy effects produced affect the vortex system within the street and consequently the street ventilation. This particular aspect is discussed in more detail in chapter 1.3.

11
1.1.2.3 The influence of the wind direction
The influence of wind direction on the concentration patterns in isolated, idealised, street canyons has been studied in the WT at the University of Karlsruhe, Germany (Kastner-Klein and Plate, 1999). A sketch of the experimental set up and the results for two different configurations are presented in Figure 4. A tracer gas has been released along the street from a ground level line source with a constant emission rate and concentrations were measured at three different locations at the leeward canyon wall. Two sampling points have been located close to the lateral buildings edges, the third one in the building centre (Figure 4). Non-dimensional concentration values measured near the ground (z/H=0.083) are plotted in the diagrams. The ratio of building length to building height L/H has been varied and the left plot corresponds to the case of a longer canyon (L/H=10), whilst the right plot is for a shorter canyon (L/H=5).
For wind directions deviating by only 15° from the perpendicular direction, the pollutant concentrations are larger close to the downstream edge than in the centre of the street, especially in the case of the longer canyon (L/H=10). These results indicate that the flow along the street axis becomes a dominant pollutant transport mechanism for wind directions other than perpendicular. Similar observations have been made on the basis of the full-scale measurements carried out by ECN in Rue de Strasbourg (Nantes, France) (Vachon et al. 1999). In particular it has been deduced that pollutants could be transported from one street to the next depending on wind direction. This pollutant transport depending on wind direction has been also observed during different WT studies using scale models of realistic street canyons as performed at University of Hamburg (Chauvet et al., 1999 and 2000), i.e. Jagtvej (Copenhagen, Denmark), Podbielskistrasse and Göttingerstrasse (Hanover, Germany). 1.1.2.4 The influence of the building edges
The results presented in Figure 4 show that significant concentration variations can be observed along the street for a wind direction that is perpendicular to the street axis and with a constant emission rate. The concentration at the middle of the street can be much larger than that close to the lateral building edges. It can be concluded that the vortices developing at the lateral building edges have a strong influence on the flow and dispersion characteristics within street canyons. Flow data discussed in chapter 2.1 indicate that this influence extends up to about three times the building height from the lateral edge towards the canyon centre and that it causes a pronounced flow component along the street axis. However, these findings need to be confirmed by other experimental data sets or numerical simulations in order to guarantee that the presence of the WT sidewalls does not strongly influence, or initiate, the effects observed.
1.1.2.5 The influence of the surrounding buildings
1.1.2.5.a Upstream building effect
The WT experiments at the University of Karlsruhe, Germany, have been extended by a study regarding the influence of additional upwind buildings on the concentration pattern inside the street canyon (Kastner-Klein and Plate, 1999). The results for configurations with one or two additional upwind buildings are presented in chapter 2.1. They demonstrate that the street ventilation is reduced in the presence of upstream buildings. This result might be caused by the upward displacement of the flow and the perturbed exchange between the canyon interior and the outer flow.
1.1.2.5.b Effect of surrounding buildings of different height
The influence of a taller (+H/2) or smaller (-H/2) building among identical buildings has been investigated at the Aristotle University of Thessaloniki with numerical simulations carried out with the code MIMO (Assimakopoulos et al. 2000). Geometry and inflow data from experiments performed by Rafailidis (1997) at the University of Hamburg (six identical schematic 2-D buildings creating five square cavities with a tracer gas source located in the middle of the base of the central cavity) have been used for this study. Figure 5 presents streamlines and pollutant fields for the reference case (identical buildings) and the four combinations. In the case of a step-up notch with a smaller or taller building, a single vortex is established with a high-pressure area developed at the top corner of the

12
roof level of the windward building. Maximum pollutant concentrations are observed on the leeward wall but the street ventilation is enhanced compared to the reference case. Furthermore, the pollutants tend to move upstream and the street ventilation is a little less efficient compared to the reference case.
In the case of a step-down notch with a smaller or taller building, a double vortex system appears with a primary vortex covering the upper part of the cavity and covering (to some extent) the roof of the windward building. A secondary counter-rotating vortex is established at the corner of the windward building. This complicated vortex system leads to maximum concentrations on the windward wall and to a trapping of pollutants.
Except for a step-up notch with a smaller building, introducing a building of different height in a homogeneous arrangement of buildings modifies the vortex system and inhibits the street ventilation compared to the homogeneous arrangement. The step-up notch case with a smaller building enhances the street ventilation but can induce pollutant transport towards the upstream street.

13
W/H=2
W/H=1
W/H=0.7
W/H=0.5
W/H=0.3
Figure 3a: Variation with aspect ratio (W/H) of flow pattern in a 2-D canyon (CHENSI predictions)

14
W/H = 2
W/H = 1 W/H = 0.7
W/H = 0.5 W/H = 0.3
Figure 3b: Variation with aspect ratio (W/H) of the flow pattern in a 2-D canyon (WT experiments – 2d cavity) 1.1.2.6 The influence of the roof shape
An experimental study complementary to the previous one has been undertaken in the WT at the University of Karlsruhe to investigate the influence of roof shape (Kastner-Klein and Plate, 1999). Different combinations of roof shape of both leeward and windward buildings of an isolated, idealised 2-D street canyon have been studied (Figure 6, Table 1).

15
Table 1: The different roof shape combinations studied.
Case Leeward roof Windward roof Reference (-) (-)
1 (b) (-) 2 (a) (-) 3 (-) (b) 4 (-) (a) 5 (c) (-) 6 (-) (c) 7 (d) (-) 8 (-) (d)
11 (b) (a) 12 (a) (a) 13 (d) (d) 14 (a) (b) 15 (b) (b)
It may be seen that the presence of a modified roof shape on the windward building has a negligible influence on the pollutant distribution within the street (Figure 7) compared to the reference case (no roof). On the other hand, having a modified roof on the leeward building significantly alters the vortex system within the street and leads to larger pollutant concentrations on the windward wall and smaller concentrations on the leeward wall, at least for the first third of the building height above the ground. As a consequence of this vortex system modification, pollutants are trapped within the street.
Examination of the effects associated with modified roof shapes on both the leeward and windward buildings shows results that are very dependent on the combination of shapes. Some combinations lead to large pollutant concentrations near the windward wall and pollutant trapping, whilst others lead to behaviour similar to the reference case, but with a ventilation that is much less efficient (Figure 8).
It may be concluded, that the roof geometry has a strong influence on the ventilation of the canyon. In particular, for configurations with a step-down between the roof edge of the upwind building and the windward edge of the downwind building, significantly higher concentration values have been observed at the building walls. In these cases the maximum concentration is also shifted from the leeward canyon wall to the windward canyon wall, which indicates the disappearance of the recirculation inside the canyon.
1.1.2.7 The influence of street elements
Most studies of pollutant dispersion within the urban near-surface layer include the use of numerical simulations. For these simulations, the real geometry has to be simplified because the computer power does not allow for grid resolutions fine enough to resolve the flow at every scale. Consequently, buildings are usually modelled as an assembly of parallelepipeds, thus having flat roofs, a step-like structure in the case of oblique streets and ”smooth” building surfaces.
Different WT studies on typical realistic street canyon models, such as Jagtvej in Copenhagen (Denmark), Podbielskistrasse and Göttingerstrasse in Hanover (Germany), have been performed at the University of Hamburg, to assess the influence of these geometrical simplifications on pollutant dispersion (Chauvet et al. 1999 and 2000). The basic geometry is the one that is used in numerical models and different aspects have been modified separately: smoothing the step-like streets, taking real roof geometry into account, introducing cars within the street, introducing balconies on the walls and taking gateways into account. The results are presented and discussed in detail in chapter 2.1. When comparing results, such as the non-dimensional concentration at a particular point, an inherent ”offset” between the simplistic and detailed models can be noted, as well as some damping of the

16
pollutant peaks. Generally, all geometrical changes induce alterations of the turbulence and friction sources, which modify the flow and turbulence fields and, consequently, the pollutant dispersion.
Figure 4: Evolution of the non-dimensional concentration with the wind direction for two different building
lengths at z=0.0833H.

17
Figure 5: Flow and pollutant fields when considering taller or shorter buildings. Numerical modelling results using MIMO.

18
Roof shapes
(a) (b)
(c) (d) Figure 6: Configuration of the roof shape combination study
x
x
x
x
x
x
x
x
x
x
x
x
x
x
0 20 40 60 80 1000
0.2
0.4
0.6
0.8
1z/H
cU0LsH/Q
Windward wall
x
x
x
x
x
x
x
x
x
x
x
x
x
x
0 20 40 60 80 1000
0.2
0.4
0.6
0.8
1
Case 1Case 2Case 3Case 4Case 5Case 6Case 7Case 8Reference
x
x
z/H
cU0LsH/Q
Leeward wall
Figure 7: Non-dimensional concentration profiles on leeward and windward walls for different roof shapes
(Table 1) when considering either the leeward or windward roof.
0 20 40 60 80 100 1200
0.2
0.4
0.6
0.8
1
Case 11Case 12Case 13Case 14Case 15Reference
z/H
cU0LsH/Q
Leeward wall
0 20 40 60 80 100 1200
0.2
0.4
0.6
0.8
1z/H
cU0LsH/Q
Windward wall
Figure 8: Non-dimensional concentration profiles on leeward and windward walls for different roof shape
when considering both leeward and windward roofs

19
1.1.3 The influence of highway architecture
A sensitivity study has been performed at TNO to assess the interaction of the wind with moving vehicles in a highway configuration, together with a feasibility test to evaluate the capability and applicability of CFD models in typical real applications. The final goal was to estimate the pollutant impact on the surrounding area of highway constructions, including the presence of noise barriers, tunnels and lowered or elevated highways.
In these simulations the atmospheric conditions have been restricted to neutral stability and different inflow wind profiles, along-road and crossroad, have been considered. To describe the variations in the flow and turbulence induced by the vehicles and the related consequences on the pollutant dispersion some schematic cases have been simulated with the computational fluid dynamics model CFX-TASCflow. Applying sources of an inert tracer at the exhaust duct of the vehicles, the concentration field of the tracer has been estimated by means of an Eulerian turbulent mixing. A sensitivity analysis has been performed for both traffic and road structure of increasing complexity, from the case of the interaction of the flow with a vehicle as a fixed obstacle up to several moving vehicles, a two-lane highway and a highway with noise barriers. Full details are given in Trini Castelli et al. (2001) but some of the findings are briefly outlined here.
Comparing the interaction of the flow with a fixed and a moving vehicle showed that the vehicle motion, described by its speed, is the dictating variable in determining the structure of the velocity and turbulence, canalising the pollutant cloud in its wake. The motion of the vehicle affects the concentration by spreading and diluting the plume in the wake so that the peak values close to the emission are strongly reduced. This result was verified for the relatively sparse and fast traffic configuration of a highway, where the vehicle speed is much higher than the wind speed. Besides the contribution of the vehicle and wind speeds, the wind direction is the key parameter determining the pollutant impact from the traffic emissions on the surrounding area. Wider spread and higher concentration values were found in the vicinity of a highway in the case of crossroad inflow direction. When considering several vehicles, different kinds of interactions occurred depending on the direction of the incoming flow. For the along-road wind, the overlapping of the various vehicle wakes resulted in an enveloping wake, while for the crossroad wind, in this traffic configuration, the different wakes weakly interfered. In the simulations of multiple lanes, both for along-road and crossroad winds, the flow and turbulence patterns of the furthest downwind lane were influenced by the presence of the upwind row of vehicles, giving a modified structure with respect to the single-lane case
It was found that the presence of a noise barrier at the side of the highway acts as a pollutant block. As expected, the height of the fence plays an important role in the dispersion of the pollutant. Higher barriers are much more effective in diffusing the plume towards higher vertical levels, allowing the pollutant to be more diluted and dispersed further from the ground level. This produces a decrease in the concentration over the area surrounding the highway. An example of the interaction of the flow with an 8m high noise barrier for a single-lane highway combined with a crossroad wind (α=90°) is shown in Figure 9.

20
Figure 9: Noise barrier 8 m, α=90°, z0=1 m. Upper panel: Crossroad vertical velocity field, middle panel:
Crossroad vertical turbulent kinetic energy, lower panel: crossroad vertical section of along-road integrated concentration (Range: 0 ÷ 0.01). The scales of values for the speed (ms-1) and the turbulent kinetic energy (m2s-2) are in absolute values, whilst the concentrations are dimensionless values referred to the initial source concentration

21
1.1.4 Effects of the street architecture on the flow and turbulence structure
When using simple parametric dispersion models for street level pollution such as the OSPM model (Berkowicz, 2000), input concerning the meteorological situation is required. Typically, this is the wind direction with respect to the canyon axis (see section 1.1.2c), the ‘roof level’ wind speed and, possibly, an information concerning the turbulence state (e.g., velocity variances) within the canyon. All these variables are dependent on the street architecture in a similar way as described in the previous subsection for the concentration fields. Relatively little information on these variables and their dependence on the street architecture was available from full-scale observations before the TRAPOS project had started. Yamartino and Wiegand (1986) proposed a simple correlation between street level velocity variances and the above roof wind speed. Rotach (1995) presented profiles of flow and turbulence statistics from a street canyon in Zurich, Switzerland. Louka et al. (2000) and Louka (1999) investigated the turbulence structure between two isolated farmhouses, i.e. a situation that is similar to that depicted in Figure 1.
An overview over full-scale studies concerning the turbulence structure in the urban roughness sublayer (including the 'canopy' or street canyons) can be found in Roth (2000). WT studies in which the flow and turbulence structure (rather than the concentration distribution) was investigated, were largely restricted to the idealised case of Figure 1 (e.g., Kastner-Klein, 1999) or rows of idealised canyons (e.g., Rafailidis 1997, Brown et al. 2000).
During TRAPOS Kastner-Klein et al. (2001) compared full-scale and WT results and found good general agreement between profiles of turbulence statistics from full-scale observations and an idealised WT study. However, the interpretation of the full-scale data requires careful consideration of the spatial variability of these parameters. Furthermore, a detailed study with the real-array WT model of Rue de Strasbourg in Nantes (Figure 2) addressed the questions regarding the spatial inhomogeneity of wind and turbulence profiles in and above a street canyon, as well as the parameterisation of these variables for use in operational dispersion models (Kastner-Klein et al. 2000a). Velocity statistics in an idealised single canyon, rows of canyons and real-array arrangement have been compared by Kastner-Klein et al. (2000b) and are presented in Figure 10. In particular it is shown that the isolated single canyon (Figure 1) exhibits a large peak in turbulence kinetic energy (TKE) around roof level due to flow separation at the upwind building. This is very similar to what is observed in the first of a row of canyons. On the other hand the 6th canyon in the row shows a much-reduced peak in TKE, this in turn being similar to the range of what is observed at different locations of the real-array model (Figure 2).
-0.5 -0.25 0 0.25 0.5 0.75 1 1.25 1.5u /u(H)upw
0
0.5
1
1.5
2
2.5
3
3.5
z/H
0 0.1 0.2 0.3
TKE /(0.5*u(H)2upw)
0
0.5
1
1.5
2
2.5
3
3.5
z/H
Figure 10: Averaged profiles of the u-velocity component (left plot) and turbulence kinetic energy profiles
(right plot). Black lines: Idealised canyon UKA-WT, solid for flat roofs and dashed for slanted upwind roof. Grey lines: Idealised canyon –EPA-WT, solid for first canyon and dashed for sixth canyon. Circles: Rue de Strasbourg-UKA-WT (thick line - mean; thin lines - lowest/highest values).

22
Kastner-Klein and Rotach (2001) propose a parameterisation for the momentum stress profile throughout the street canyon and the roughness sublayer based on data from the real-array WT study. This parameterisation is based on and similar to a recent analysis of full-scale data (Rotach, 2001) and allows estimation of the traditional roughness parameters (roughness length and displacement height) in urban areas. Thus observations of wind speed and turbulence in the vicinity of the street canyon of interest can be interpreted in order to obtain, for example, the 'roof level wind' as required for street level dispersion modelling.
1.1.5 Conclusions
All of these TRAPOS studies, conducted either in a WT, in situ or with numerical simulations, have confirmed and quantified more precisely our general understanding of the influence of the street architecture and its surroundings on the traffic pollutant dispersion:
- In the case of the wind direction perpendicular to the street axis, the aspect ratio value defines the vortex system within the street and, consequently, the manner in which the street is ventilated.
- A small deviation of the wind from the perpendicular direction makes the flow along the street axis the dominant pollutant-transport mechanism; pollutants are then transported from street to street.
It may be added, as a caveat, that the wind direction is much less well defined in real urban areas than in wind tunnels or numerical models, i.e., the wind direction is never exactly perpendicular to a given street over a period of, say, an hour. Rather an average wind direction is observed, with the instantaneous direction deviating from this by typically +/- 30°. Consequently, small deviations from an approaching flow that is perpendicular to the canyon axis are fairly typical and, hence, street to street transport of pollutants must be taken into account.
The influences of the difference between building heights and the roof shape were found not to be negligible since they modify the vortex system within the street as much as the aspect ratio value does. . These effects are not only due to the canyon of interest, but also to the influence of upwind building structures. Thus the 'upwind urban surface' determines to a certain extent the flow and turbulence structure and, hence, the pollutant concentration distribution in a given street canyon. Similarly, small details such as noise barriers along the side of roads seem to have a noticeable influence on the flow and pollutant dispersion within the road, with the height of the barrier being an important parameter.
Another result emerging from TRAPOS is the quite sensitive influence of the street ”details”. Unlike the aspect ratio value, the wind direction and even the relative building heights, that may be described as ”first order” parameters for practical or operational models, the street ”details” can be considered as a ”second order” parameter. However, the question of how to parameterise these details within practical or operational models remains a subject for further work.
Overall, TRAPOS has substantially advanced our understanding of the influence of street architecture on pollutant dispersion within urban street canyons. While idealised and isolated street canyon geometries have been standard representations for many years a number of studies within TRAPOS have highlighted and quantified the influence of irregularities and even small details. Real-array wind tunnel or numerical studies, in which the details of the street canyon as well as its surroundings are modelled, seem to be necessary in order to obtain realistic results. TRAPOS has played a pioneering role in advancing such real-array studies and elucidating their importance and value.
References Assimakopoulos V., ApSimon H., Sahm P. and Moussiopoulos N., 2000: Effects of street
canyon geometry on the dispersion characteristics in urban areas, Proceedings of the 16th IMACS World Congress, Lausanne, Switzerland, 21-25 August 2000, (in press).
Berkowicz, R., 2000: OSPM - A parameterised street pollution model, Journal of Environmental Monitoring and Assessment, 65, 323-331.

23
Brown, M.J., Lawson, R.E., Descroix, D.S., Lee, R.L., 2000: Mean flow and turbulence measurements around a 2-D array of buildings in a wind tunnel, 11th Conf. on Appl. of Air Poll. Met., Long Beach, CA, Jan. 2000.
Chauvet C., Leitl B., Kovar-Panskus A., Schatzmann M. Experimental investigation on differences in results from microscale dispersion modelling due to geometrical simplification, Euromech conference Sept 1999 Prague Czech Republic.
Chauvet C., Leitl B., Schatzmann M. Wind-tunnel modelling of microscale dispersion in a street canyon, 16th IMACS world congress 2000 August 21-25, 2000 Lausanne, Switzerland
Kastner-Klein, P., Fedorovich, E., Plate, E.J., 1997: Gaseous pollutant dispersion around urban-canopy elements: wind tunnel case studies, Int. J. Environment and Pollution, 8, 727-737.
Kastner-Klein, P., 1999: Experimentelle Untersuchung der strömungsmechanischen Trans-portvorgänge in Straßenschluchten, Doctoral Thesis, Dissertationsreihe am Institut für Hydromechanik der Universität Karlsruhe, ISSN 1439 - 4111, Heft 1999/2 (in German).
Kastner-Klein, P., Plate, E.J., 1999: Wind-tunnel study of concentration fields in street canyons, Atmospheric Environment, 33, 3973-3979.
Kastner-Klein, P., Rotach, M.W. and Fedorovich, E., 2000a: Experimental study on mean flow and turbulence characteristics in an urban roughness sublayer, Preprints of the 14th Symp. on Bound. Layers and Turbulence, Aspen, CO, August 2000, 306-309.
Kastner-Klein, P., Rotach, M.W., Brown, M., and Lawson, R., 2000b: Spatial variability of mean flow and turbulence fields in street canyons, Proceeding of the Third Symposium in Urban Environment. 14-18 August 2000, Davis, California, 13-14.
Kastner-Klein, P., Fedorovich, E., Rotach, M.W., 2001: A wind tunnel study of organised and turbulent air motions in urban street canyons, In print, J. Wind Engineering Industrial Aerodynamics.
Kastner-Klein, P. and Rotach, M.W., 2001: Parameterization of wind and turbulent shear stress profiles in the urban roughness sublayer, Proceedings of the Third International Conference on Urban Air Quality, 19-23 March 2001, Loutraki, Greece.
Ketzel, M., Berkowicz, R., Flassak, T., Lohmeyer, A., Kastner-Klein, P., 2001: Adaptation of results from CFD-models and wind tunnels for practical traffic pollution modelling. Accepted extended abstract for the 7th International Conference on Harmonisation within Atmospheric Dispersion Modelling for Regulatory Purposes, Belgirate, Italy, May 28-31, 2001
Kovar-Panskus, A., Louka, P., Sini, J-F., Savory, E., Abdelqari, A., Mestayer, P. G. and Toy, N.: 2001, Influence of geometry on the flow and turbulence characteristics within urban street canyons – comparison of wind tunnel experiments and numerical simulations, submitted to Int. J of Water, Air and Soil Pollution
Leitl B., Chauvet C., Schatzmann M., 2001: Effects of geometrical simplification and idealisation on the accuracy of microscale dispersion modelling, Proceedings of the Third International Conference on Urban Air Quality, 19-23 March 2001, Loutraki, Greece.
Louka, P., 1999: Measurements of airflow in an urban environment. Ph.D. Thesis, University of Reading, UK.
Louka P., Belcher S.E. and Harrison, R.G., 2000: Coupling between air flow in streets and the well-developed boundary layer aloft, Atmos. Env. 34, 2613-2621.
Meroney, R., Pavageau, M., Rafailidis, S., Schatzmann, M., 1996: Study of line source characteristics for 2-D physical modelling of pollutant dispersion in street canyons, Journal of Wind Engineering and Industrial Aerodynamics, 62, 37-65.
Pavageau, M., Rafailidis, S., Schatzmann, M., 1997: A comprehensive experimental databank for the verification of urban car emission dispersion models, Int. J. Environment and

24
Pollution, 8, 727-737. Rafailidis, S.: 1997, Influence of building areal density and roof shape on the wind
characteristics above a town, Boundary-Layer Meteorol. 85, 255-271. Rotach, M.W., 2001: Simulation of urban-scale dispersion using a Lagrangian stochastic
dispersion model, Boundary-Layer Met., 99, 379-410. Rotach, M.W., 1999: On the influence of the urban roughness sublayer on turbulence and
dispersion, Atmos. Env., 33, 4001-4008. Rotach, M.W., 1995: Profiles of turbulence statistics in and above an urban street canyon,
Atmos. Env. 29, 1473-1486. Roth, M., 2000: Review of atmospheric turbulence over cities, Q.J.R. Meteorol. Soc., 126,
941-990. Sahm, P. Louka, P., Ketzel, M., Guilloteau, E. and Sini, J-F.: 2001, ‘Intercomparison of
numerical urban dispersion models – Part 1: Street canyon and single building configurations’, submitted to Int J of Water, Air and Soil Pollution.
Schatzmann, M., Rafailidis, S., Pavageau, M., 1997: Some remarks on the validation of small-scale dispersion models with field and laboratory data. Journal of Wind Engineering and Industrial Aerodynamics 67, No 8, 885-893
Trini Castelli S., van der Welle R. and Wesseling J., 2001: A sensitivity study in modelling the pollutant impact of a highway on the surrounding, TNO-MEP Report R 2001/081, 56 pp.
Vachon, G.; Rosant, J.-M., Mestayer, P. G. and Sini, J.-F., 1999: Measurements of dynamic and thermal field in a street canyon, URBCAP Nantes'99, Preprints on 6th International Conference on Harmonisation within Atmospheric Dispersion Modelling for Regulatory Purposes, 11-14 October 1999, Rouen, France, 239-240.
Yamartino, R.J. and Wiegand, G., 1986: Development and evaluation of simple models for the flow, turbulence and pollutant concentration fields within urban street canyons, Atmos. Env., 20, 2137-2156

25
1.2 The Modelling of Traffic Produced Turbulence
Petra Kastner-Klein1, Silvana Di Sabatino2, Matthias Ketzel3, Anke Kovar-Panskus4, Petroula Louka5, Silvia Trini Castelli6, Ruwim Berkowicz3, Rex Britter2, Evgeni Fedorovich7, Jean-Francois Sini5
1 Institute for Climate Research, ETH Zurich, Switzerland
2 CERC, Cambridge, UK 3 NERI, Roskilde, Denmark 4 University of Surrey, UK
5 Ecole Centrale de Nantes, Nantes, France 6 TNO, Apeldoorn, Netherlands
7 Institute of Hydromechanics, University of Karlsruhe, Germany The chapter summarises the results of the TRAPOS working group “Traffic Produced Turbulence” (TPT). The main goals of these working group have been i) to summarise the TPT results that had already been achieved by the different teams, ii) to exchange the views and knowledge regarding TPT effects iii) to find a consensus concerning the relevance of traffic produced turbulence for dispersion modelling, iv) to improve TPT scaling concepts v) to verify TPT parameterisations for numerical dispersion models and vi) to present concepts for an incorporation of TPT effects in regulatory dispersion models. The working group organised several meetings during which active and fruitful discussions developed. The results presented in the following chapter and the number of publications related to TPT would not have been possible without the enthusiasm and intense collaboration of the working group participants.
1.2.1 Introduction
The previous chapter presented an overview of typical airflow and dispersion patterns in urban street canyon configurations. Obviously urban building structures strongly influence both mean and turbulent transport of pollutants. A vortex recirculation has been identified as characteristic flow pattern for rather narrow and long street canyons at wind directions perpendicular to the street axis. Accordingly, the street ventilation is controlled by the interaction between the rotating vortex and the flow above roof level. However, such types of flow patterns are only observed for roof-level wind velocities above a threshold value of the order of 2-3 m/s. For low wind speed conditions, which are typically associated with the worst air pollution episodes in cities, additional dispersion mechanisms must be taken into account. It is well known that under such conditions urban dispersion models perform rather poorly and pollutant concentrations are generally overestimated. One of possible reasons for this is not taking into account turbulent motions that are mechanically generated by traffic. Such motions become an important factor for the dilution of pollutants in streets under low wind speed conditions. Thus, any improvement in the estimation of the traffic-produced turbulence (TPT) and implementation into practical models could have a significant impact on concentration predictions for the worst air pollution episodes.
In the literature, only a few applications of relatively simple TPT parameterisations have been reported. For instance in the widely used Operational Street Pollution Model (OSPM, Berkowicz, 2000), traffic in a street canyon is treated as the superposition of individual vehicles. The TPT parameterisation is based on the assumption that the motion of vehicles produces an overall variance of the velocity fluctuations proportional to the square of the vehicle velocity (Hertel and Berkowicz 1989). The coefficient of proportionality is linked to the drag coefficient of the vehicles and its value is empirically determined by fitting velocity variances and concentration data obtained in field experiments. Parameterisations for dispersion models based on computational fluid dynamics (CFD) have been proposed by Sini et al. (1996) and Stern et al. (1998). However, the adequacy of these parameterisations regarding dispersion in urban areas and their accuracy have been subject to controversial discussions.
Consequently, the influence of TPT on dispersion of vehicle emissions in urban building structures has been chosen as one of principal research areas of the TRAPOS network. Several network teams have been involved and different methods of investigation have been used. An active cooperation developed

26
between the participating groups that resulted in a significant contribution towards a better understanding of TPT mechanisms, improvement of TPT parameterisations, and their incorporation in urban dispersion models.
In the following a summary of these results will be presented. It will be structured according to the key aspects of the undertaken research effort: development of a theoretical framework, implementation of TPT parameterisations in dispersion models, wind tunnel studies and field measurements. More detailed information is available in the given references.
1.2.2 Theoretical Framework
A substantial effort of the TRAPOS TPT working group has been laid on the clarification of the link between traffic motions and pollutant transport in street canyons, in particular at low wind speed conditions. The primary aim has been to establish a theoretical framework as background of TPT parameterisations. The verification of presently applied TPT formulations and identification of their range of applicability have been topics of particular interest. In this respect, the working approach has been different from that of Eskridge and Hunt (1979a, b), who established a theoretical framework for the traffic turbulence in single vehicle wakes that is not directly applicable to describe the impact of TPT on dispersion in street canyons.
Based on principal physical mechanisms of vehicle motions in street canyons, a conceptual framework has been developed to parameterise TPT under various traffic conditions (Di Sabatino et al. 2001). As a measure of TPT, the standard deviation of the velocity fluctuations has been introduced. For an implementation in operational dispersion models, a spatially averaged value mtσ of the standard deviation has been chosen as representative TPT scale. Accordingly, appropriate choices for the averaging volume have been discussed. The TPT analysis has been based on the consideration of the production-dissipation balance for the turbulent kinetic energy (TKE) generated by a single vehicle or by a row of vehicles in a street canyon. The proposed parameterisation for mtσ reads:
t
Dmt V
vlhCNc
32
13 ⋅⋅⋅
⋅⋅= εσ (1.2.1)
where N Number of vehicles producing turbulence (dimensionless). DC Average drag coefficient of the vehicles. v Vehicle speed. h Geometrical length scale of the vehicles (e.g. A with A = frontal
area of the vehicle; 2h must be the area used in defining the drag coefficients)
tV Volume over which the averaging is made (e.g. traffic layer in the lower part of the canyon or whole canyon volume)
εl Length scale used to model the dissipation of turbulent kinetic energy; i.e. the dissipation length scale.
c1 Dimensionless proportionality constant For further analysis three different traffic configurations, light traffic, intermediate traffic and congested traffic, have been considered and the length scale εl and averaging volume tV have been specified for each configuration respectively.
1.2.2.1 Light traffic - no interaction among vehicle wakes
The case of light traffic corresponds to low traffic densities when no interaction between flow disturbances by each vehicle is anticipated. In this case, the turbulence in the wake of a single vehicle is considered ( 1=N ) and both parameters, size of the wake ( 3hVt ∝ ) and dissipation length scale

27
( hl ∝ε ), can be related to the geometrical length scale of the vehicle. Thus the velocity variance 2wtσ
in a single wake can be expressed as:
23/22
2 vCc Dwt ⋅⋅=σ (1.2.2)
For the implementation in dispersion models a velocity variance 2ctσ averaged within a portion of the
street canyon of length L, width W, and height H is of interest. It can be defined by volume averaging as
cctwwt VVN ⋅=⋅⋅ 22 σσ , (1.2.3)
where 3hVw ∝ corresponds again to the volume of the wake. The quantity cV describes the averaging volume inside the canyon. It is defined as cc SLV ⋅= , where HWSc ⋅≤ is the cross-section area in the canyon in which TPT is active. In particular, hWSc ⋅= refers to the case when the TPT is averaged over the traffic layer, and HWSc ⋅= correspond to the case when TPT is present in the whole volume of the canyon. As final expression,
cDvct S
hvCnc3
23/23
2 ⋅⋅⋅⋅=σ (1.2.4)
has been derived, where LNnv /= corresponds to the number of vehicles per unit length.
Thus, the above theoretical considerations predict 22 vnvct ⋅⋅∝σ that is conceptually in agreement with the TPT parameterisation used in the OSPM model (Hertel and Berkowicz, 1989). This allows concluding that the OSPM TPT parameterisation corresponds to the situation of light traffic when the vehicle wakes are not interacting.
1.2.2.2 Intermediate traffic – interaction among the vehicle wakes
With intermediate traffic densities, interaction between the vehicle wakes can be expected. Accordingly the derivation of turbulence in a single wake and its subsequent averaging can be omitted and one should consider immediately the variance of turbulent velocity fluctuations produced by a row of vehicles. Using Eq. (1.2.1) and taking into account the relations cct SLVV ⋅== , LNnv /= and
hl ∝ε , the average turbulent kinetic energy can be expressed as
3/2
223/2
42 )(
cDvct S
hvCnc ⋅⋅⋅⋅=σ . (1.2.5)
For intermediate traffic densities, as long as the vehicles are not densely packed, the drag coefficient
DC remains almost constant or changes very slightly. Thus, for a given street canyon geometry, the ratio 22 vctσ changes with traffic density proportionally to 3/2
vn , that is slower than in the previous case where a linear dependence of 22 vctσ on vn has been pointed out. Kastner-Klein et al. (2001b) have shown, that such proportionality can be also derived from the so-called PMC similarity criterion for the interaction of wind and traffic motions in street canyons, which has been proposed by Plate (1982) and verified by Kastner-Klein et al. (2000a, 2000b).
1.2.2.3 Congested traffic – strong interaction among vehicle wakes
Very large traffic densities characterise the case of congested traffic. In this case, the vehicles are so densely packed that the effective length scale for dissipation is the distance between vehicles and no

28
longer the length scale of the wake, and therefore: vv nLl /1=∝ε . Accordingly, Eq. (1.2.1), using again cct SLVV ⋅== , leads to the following formulation for the velocity variance in the canyon region affected by TPT
3/2
3/423/2
52
cDct S
hvCc ⋅⋅⋅=σ . (1.2.6)
This expression predicts that the velocity variance becomes independent of the number of vehicles if traffic densities are very high. It must be also noted that as the spacing between the vehicles decreases, CD will reduce due to vehicle sheltering and 22 vctσ will consequently decrease.
1.2.3 Integration of TPT parameterisations in dispersion models
1.2.3.1 Operational models
Presently, dispersion modelling of street-canyon pollution is often based on the assumption of inverse proportionality between the street level concentration c and a wind speed u measured above roof level. It is argued that in many instances hydrostatic stability effects and traffic-induced turbulence are of minor importance and street canyon ventilation is controlled by mechanical (wind-induced) turbulent air motions (see e.g. Schatzmann et al. 2001). For high Reynolds numbers, which are typical for urban canopy conditions even with relatively low wind velocities, the ventilation parameters and therefore also the street canyon concentrations will scale with a reference wind velocity taken above roof level. Employing the specific emission per length, E, and a reference length scale L, a dimensionless concentration *c is calculated as
ELuccst ⋅⋅=* . (1.2.7) Ketzel et al. (2000) discussed the deficiencies of this approach in particular for low-wind speed conditions and concluded that improved methods accounting for TPT effects are necessary in order to achieve better agreement between model predictions and measured concentration values in urban street canyons. Kastner-Klein et al. (2001b) have shown that a summation of velocity variances induced by wind and traffic motions provide a more appropriate velocity scale su than solely the above-roof wind velocity. It has been assumed in the op. cit. that the turbulent motions related to wind and traffic are mixed inside the canyon and that the corresponding velocity variances can be taken proportional to the squares of wind velocity u and traffic velocity v respectively. This provides the following expression for the velocity scale of the resulting turbulent motions
2/1222/122 )()( vbuau ctus ⋅+⋅=+= σσ , (1.2.8)
where a and b are dimensionless empirical constants, and the scaling for the concentration has the form:
EvbuaLcELucc s22*
mod ⋅+⋅⋅⋅=⋅⋅= . (1.2.9)
The constant a depends on the street geometry and is related to the high-wind velocity value *stc
(Eq. 1.2.7) calculated for a particular street. The constant b associated with the traffic-related velocity variances 22 vbct ⋅=σ accounts for the dependence of 2
ctσ on traffic parameters and can be derived from the formulas presented in the previous section. Ketzel et al. (2001) followed a similar concept and introduced the resulting velocity scale through the composition of velocity variances due to the external flow and due to traffic motions. However, an additional empirical weighting factor of the TPT

29
contribution, which depends on the wind direction relative to the street axis, has been introduced. It will be further discussed to what extend the proposed parameterisations have been verified against experimental results from wind tunnel studies and full-scale measurements. Before that a short summary of TRAPOS activities concerning the implementation of TPT parameterisations in computational fluid dynamics (CFD) codes will be given.
1.2.3.2 Computational fluid dynamics codes
Sini et al. (1996) presented a numerical model that explicitly computes the flow field in a street canyon and accounts for the vehicle-induced turbulence through additional production terms in balance equations for the TKE (k) and its dissipation rate ε. The TKE production by vehicles is taken proportional to the traffic density (expressed in the model as amount of vehicles per unit time) and second power of traffic velocity relative to the mean flow. An analogous parameterisation is employed for the generation term in the ε balance equation. A comparison between model calculations and wind tunnel results for concentration profiles in an idealised street canyon has been performed (Kastner-Klein et. al., 2000b). The value of the proportionality coefficient has been obtained from the best match with the wind tunnel data for one model situation. This value was kept constant throughout the entire set of model runs with different traffic velocities and densities. The results from the combined wind tunnel and numerical model study generally confirmed the validity of the PMC similarity criterion defined by the traffic-to-wind turbulence production ratio that has been proposed by Plate (1982) for the regime of turbulent diffusion in an urban street canyon with moving vehicles.
Recently, Trini Castelli (2001) performed a study with a special focus on the implementation of general TPT parameterisations in computational fluid dynamics (CFD) codes. A combination of the wake theory with the similarity theory for the atmospheric boundary layer has been proposed as a possible solution for including TPT in CFD models. The integration of the system of modified conservation equations for the mean flow and turbulence variables is discussed for the case when the
ε−k and Reynolds stress closures are used in CFD codes. The main idea is to locally correct all the possible quantities affected by the traffic contribution: mean velocity, turbulent kinetic energy and its dissipation rate, eddy diffusivities. The corrections to the system of equations are derived by the wake theory, where formulations defining the wake velocity fluctuations, the mean square velocity fluctuations and the eddy diffusivities are proposed. Following Eskridge et al. (1979a, b), it is assumed that the reference atmosphere is describable by the similarity theory on which perturbations due to the moving vehicles can be added. In the region affected by traffic wakes the modified formulations for the variables are used to solve the relative conservation equation. The principle is that together with the atmospheric turbulence, additionally the wake turbulence must be advected, diffused and dissipated.
The approximations adopted and the limitations affecting the wake theory are discussed and need to be taken into account in possible applications. The vehicle is considered as a point source of momentum loss and non-linear interactions between the vortices and the drag-induced wake are neglected. This implies that the wake effect is treated only as a velocity deficit, describing both its advection and diffusion, but no induced vorticity is taken into account and described. The proposed self-preserving solution is appropriate for wakes when they are sufficiently far from the obstacle. The assumption of weak wind and the hypothesis of no-overlapping wakes are discussed. The variability of the empirical constants defining the ε−k closure in the wake of obstacles is analysed.
The assessment of the practical application of the proposed method is developed considering the complexity of the wake theory analytical formulations, which then need to be integrated on a grid domain. Restrictions to the implementation of the wake theory in CFD models follow from the model structure itself, where the equations are integrated with a discretisation depending on the grid resolution and on the integration time step, which will determine the higher resolution of the effect. A schematic and simplified case is considered, a single roadway with a steady one-way traffic flow where the velocity and the displacement of the vehicles are fixed a priori. In a ‘point by point’ approach it is proposed to treat the wake effect as an intermittent phenomenon occurring at the single grid point in the length scale of the wake, produced with a frequency given by the number of passing vehicles per time unit and lasting for the wake time scale. In alternative, an ‘overall effect’ approach is

30
considered, adopting a volume-averaged contribution calculated by the superposition of the non-interacting wakes at the single time step. Properly processing the input information and optimising the model to automatically adjust to varying conditions can perform the extension of the method to more general cases, characterised by a net of roads and time varying traffic conditions. The ‘overall approach’ should be less computing-time consuming compared to the ‘point by point’ approach, but it is less refined and does not exploit the peculiar capabilities of the CFD models supplied by the grid-point integration of the equations.
1.2.4 Wind tunnel studies
The effect of traffic on mean flow, turbulence and concentration patterns in street canyons has been subject of the wind tunnel studies by Kastner-Klein (1999). Different traffic configurations have been simulated by small metal plates moving on two belts along the street in the wind-tunnel model of an idealized street canyon. The wind flow was directed perpendicular to the street. In order to guarantee Reynolds number similarity the wind velocity has been varied in the range from 5m/s up to 12 m/s. Thus, the results resemble the interaction of traffic and wind-induced flow components in the street canyon. The results have been extensively discussed and documented in various publications (see e.g. Kastner-Klein at al. 2000a, 2000b, 2001a) and will be only shortly summarised.
While the longitudinal mean-flow component (across-the-canyon) has been only slightly affected by traffic, either one-way or two-ways, the lateral (along-the-canyon) component of the mean flow shows strong dependence on the traffic arrangement in the canyon. For both traffic arrangements the turbulence intensity inside the canyon, in particular in the lower part and close to the leeward canyon wall, is much higher than in the case of no traffic, but the increase is more pronounced with two-way traffic than with one-way traffic. Traffic influences have been also clearly identified at the concentration distribution along the leeward canyon wall. For the cases without traffic and two-way traffic the concentration pattern has been approximately symmetric with respect to the central transverse plane of the canyon. The increased turbulence intensity in the case of two-way traffic complies with lower concentration values compared to the no-traffic results. In the case of one-way traffic, the concentration distribution was strongly skewed emphasising the significant mean flow component along the canyon.
For two-ways traffic situations it can be concluded that mean flow components are not affected by traffic motions, meanwhile all components of turbulent kinetic energy are amplified in the region of the traffic layer (e.g. the lateral component values were more than double than for the case without traffic). In this region, parcels of air pushed against each other by vehicles moving in opposite directions are mutually destroyed, resulting in the enhancement of turbulence intensities without noticeably contribution to the mean transport along the canyon. The shift towards the leeward canyon wall can be related to the near-floor advection associated with the wind-induced in-canyon vortex. Consequently the dispersion of street-level emissions is stronger than in the no-traffic case and maximum concentration values at the leeward canyon wall have been consistently reduced with the increase of turbulent kinetic energy.
The wind tunnel dispersion study has been of particular importance for testing TPT parameterisations and scaling concepts described above (Kastner-Klein et al. 2001b, Ketzel et al. 2001). The concentration measurements have been performed for variable wind velocities, vehicle speeds and traffic densities and for a wind direction perpendicular to the street. The TPT influence on street level concentrations has been analysed following the concept described in section 1.2.3.1. The parameters a and b have been evaluated for three traffic densities. As expected, the parameter a has been approximately constant since the building configuration has not been changed. The observed variation of the parameter b with traffic density matches with 3/2nb ∝ and accordingly agrees with the parameterisation (Eq. 1.2.5) presented in section 1.2.2.2 for intermediate traffic densities and the PMC similarity concept discussed in Kastner-Klein et al. (2000b). The concentration data are almost perfectly correlated with a velocity scale su calculated according to Eq. (1.2.8) with
3/2544.1 nEb ⋅−= and 408.2 −= Ea (average observed value).

31
Furthermore a straightforward transformation of these findings for comparison with full-scale situations has been undertaken. The parameter a has been determined from the best fit to the full-scale data for wind speeds higher than 5m/s, whereas the values for the parameter b have been directly taken from the wind tunnel experiments. Compared to the standard normalisation (Eq. 1.2.7), a combination of this simple transformation of the wind tunnel results with the modified scaling method (Eq. 1.2.9) leads to a significant improvement of the concentration predictions for two German streets at wind directions approximately perpendicular to the street axis and lower wind speeds. Ketzel et al. (2001) extended this type of analysis and considered additional full-scale data sets and different wind directions. They found a significant improvement of concentration predictions with the numerical, operational model MISKAM if traffic produced velocity variances are taken into account in defining the scaling velocity of concentration values (Eq. 1.2.8) compared to the standard method (Eq. 1.2.7) and the so-called VDI method (VDI 1998). The agreement with full-scale data could be further improved by incorporation of an empirical weighting factor for the TPT contribution that depends on the wind direction. The strongest influence has been assigned to leeward receptor locations, whereas the influence has been the weakest for windward receptor locations under perpendicular approach flow. The new method has been also successfully applied for scaling of wind tunnel data, which have been obtained during experiments without explicit simulation of TPT effects.
Some insights on the purely traffic-produced flow-field components are available from a wind tunnel data set corresponding to conditions without external flow. At the University of Karlsruhe, Laser-Doppler measurements of mean and turbulent velocities of the along-the-canyon and transverse component have been taken in the central plane of an idealised street canyon with two-way traffic. The simulation of traffic motions has been similar to the studies of Kastner-Klein (1999). The results are presented in (Di Sabatino et al. 2001) and have been employed to verify TPT parameterisations discussed in section 1.2.2. Increased turbulence levels have been observed in approximately the lower quarter of the canyon.
Kovar-Panskus et al. (1999) and Kovar-Panskus (2001) performed an additional basic wind-tunnel study at the University of Hamburg with the focus on the optimisation of the wind-tunnel modelling technique for TPT effects. The mean flow field and turbulence intensity around cars have been investigated. One of the findings of this study has been that the effect of passenger cars within a street canyon is relatively small. This is in good agreement with Frantz (2000) who analysed turbulence signals associated with traffic movement in a real street canyon and concluded that the signals related to passenger cars can be hardly distinguished from the atmospheric background signals. The proposed modelling strategy, which has not been based on the PMC similarity criterion defined by the traffic-to-wind turbulence production ratio (Plate, 1982), can be also applied for zero-wind-conditions. The study has also shown that the shape of the vortex generators, which are used for the simulation of cars, is essential for the correct modelling of the turbulence intensities and mean flow field around cars. Only vortex generators with size and shape similar to the ones of the full-scale prototypes guarantee a) that the correct size of vortices is induced, b) that the mean flow field around cars corresponds to the one observed in nature, and c) that an unrealistic piston-effect is avoided.
In a further study at the University of Hamburg, Henne (2001) and Henne et al. (2001) considered four different vehicle shapes and suggested based on turbulence measurements close to the vehicles that a bended shape with a nose in its lower part leads to a more realistic representation of traffic flow disturbances than flat rectangular plates. The measurements have been done without external flow. Increased levels of turbulence have been observed in a zone with a vertical extension of approximately 2.5 to 3-times the vehicle height. However, the TKE maximum is reached at the vehicle top and a relatively sharp decrease of TKE occurs in the zone above the vehicle tops. For further conclusions and quantification of the effects additional experiments are necessary. In particular a dispersion study with the modified vehicle shape should be performed that can be compared with the results of Kastner-Klein (1999) and that allows verification of the discussed TPT parameterisations and scaling concepts.
Recently a model study of pressure fluctuations that are induced by road vehicles in ambient air has been performed at the University of Karlsruhe (Macciacchera, 2001). It has been aimed at the optimisation of vehicle shapes for wind tunnel modelling of TPT effects. Results for the case of flat plates are available and will be compared with other geometries.

32
1.2.5 Full-scale measurements
Field data of traffic influences of mean and turbulent flow components are not readily available since it is difficult, in a field experiment, to separate TPT from other forms of turbulence such as wind-generated, or thermally generated turbulence. However, the recent Nantes99 experiment, (Vachon et al. 1999, Vachon et al. 2001) had among its aims the determination of turbulent kinetic energy production due to vehicles motion. Although the data analysis is still under process, important insights have been delivered on TPT components in an urban street canyon.
In the lower part of the street canyon increased levels of turbulent kinetic energy have been found, which could be attributed to turbulence created by vehicle motions. A correlation between turbulence levels and the number of vehicles has been observed. In particular, the measurements suggested that turbulent kinetic energy increases with the number of vehicles up to a threshold value and then decreases when vehicles form a “block” shape that limits the additional production of turbulence. Close to the traffic region turbulence enhancement has been found on the leeward and windward side of the street canyon. However, on the leeward side the influence has been more pronounced and the vertical extent of the region with increased turbulence levels has been much larger than on the windward side. This indicates the advection of turbulence created in the traffic layer towards the leeward wall due the wind-induced street-canyon vortex, which has been also observed in the wind tunnel results by Kastner-Klein et al. (2001a).
The analysis of concentration data taken in urban street canyons regarding the influence of TPT has been already discussed in the previous sections. All analysed data sets clearly indicate that the traditional scaling of concentrations with an above-roof wind speed (Eq. 1.2.7) fails for situations with lower wind velocities. Its application results in significant over-predictions of street canyon pollution levels for above-roof wind speeds smaller than 4-5 m/s. Schatzmann et al. (2001) e.g. analysed NOx concentrations in a street canyon (Podbielskistrasse) in the city of Hanover, Germany. They determined dimensionless concentrations in the traditional way and observed that the *
stc -values vary with wind speed even under relatively strong wind conditions, i.e. for wind velocities taken in 100 m height up to 8 m/s. However, the velocity dependence of *
stc has been less pronounced for m/s4~)m100( >u , so that they associated the range of applicability of the traditional velocity scaling
approach (Eq. 1.2.7) with reference velocities above this value.
1.2.6 Summary and Conclusions
The studies performed within the TRAPOS TPT working group have shown that TPT is an important aspect for dispersion of traffic emissions. Neglecting TPT parameterisations in dispersion models causes significant over-predictions of pollutant concentrations in urban street canyons that range up to a factor of 4 to 5. Empirical formulas like the so-called VDI method lead to improvements, but operationally significant differences between model calculations and measured concentration values still occur for above-roof wind speeds smaller than approximately 4-5 m/s.
Due to the active co-operation between the participating teams a consistent understanding concerning TPT parameterisations and their applications has been achieved. Regarding the implementation of TPT parameterisations in operational models a significant step-forward has been made. The physical background of parameterisations for different traffic densities has been verified and a concept to combine turbulent components due to wind- and traffic-induced motions has been established. Parameterisations for CFD models have been developed and tested against field and laboratory data. The various experimental studies resulted in a database for further verification exercises of TPT parameterisations.
Based on the findings of the TRAPOS TPT working group the following recommendations are made for practical applications of dispersion models: The TPT parameterisation implemented in the OSPM model works satisfactorily and dispersion models similar to OSPM should include the OSPM TPT concept. The traditional velocity scaling of concentrations and the empirical VDI method have deficiencies and must be reconsidered. The approach presented in Kastner-Klein et al. (2001b) and Ketzel et al. (2001) that is based on a velocity scale which is defined as composition of velocity
33
variances due to the external flow and due to traffic motions is an improvement and can be recommended. In CFD models TPT parameterisations must be implemented and the developed concepts are an improvement compared to model calculations without TPT parameterisations. However, for recommendations of particular modifications in the system of equations further verification studies are necessary. Full-scale experiments as that of Nantes99 may give some insights regarding the factors influencing TPT and further wind-tunnel datasets may be useful to proceed with the verification of TPT parameterisations.
References
Berkowicz, R., 2000: OSPM - A parameterised street pollution model. Journal of
Environmental Monitoring and Assessment 65, 323-331. Di Sabatino, S., Kastner-Klein, P., Berkowicz, R., Britter, R., Fedorovich, E. (2001): The
modeling of turbulence from traffic in urban dispersion models – Part I: Theoretical considerations. Prepared for submission to Atmospheric Environment.
Eskridge R.E. and Hunt J.C.R., 1979a: Highway modeling. Part I: Prediction of Velocity and Turbulence Fields in the Wake of Vehicles, Journal of Applied Meteorology, 18, pp. 387-400
Eskridge R.E., Hunt J.C.R., Clark T.L., Demerjian K.L., 1979b: Highway modeling. Part II:: Advection and Diffusion of SF6 Tracer Gas, Journal of Applied Meteorology, 18, pp. 401-412
Frantz, H., 2000: Erzeugung eines Naturdatensatzes zur Validierung hindernisauflösender Modelle für städtische Anwendungen, Diplomarbeit, Meteorologisches Institut, Universität Hamburg, 91 pp.
Henne, S., Leitl, B., Schatzmann, M, 2001: Windtunnel studies on traffic produced turbulence and its influence on pollutant dispersion in an urban street canyon. Proceedings of the Third International Conference on Urban Air Quality, 19-23 March 2001, Loutraki, Greece.
Henne, S., 2001: Untersuchung zum Einfluß fahrzeugerzeugter Turbulenz auf das Ausbreitungsverhalten von Luftschadstoffen in Straßenschluchten, Diplomarbeit, Meteorologisches Institut, Universtität Hamburg, 68 pp.
Hertel, O. and Berkowicz R. 1989: Operational Street Pollution Model (OSPM). Evaluation of model on data from St. Olavs Street in Oslo. DMU Luft A-135, 77p.
Kastner-Klein, P., 1999: Experimentelle Untersuchung der strömungsmechanischen Trans-portvorgänge in Straßenschluchten. Doctor Thesis, Dissertationsreihe am Institut für Hydromechanik der Universität Karlsruhe, ISSN 1439 - 4111, Heft 1999/2 (in German).
Kastner-Klein, P., R. Berkowicz, E.J. Plate, 2000a: Modelling of vehicle induced turbulence in air pollution studies for streets. Int J. Environment and Pollution, 14, 496-507.
Kastner-Klein, P., Fedorovich, E., Sini, J.-F., Mestayer, P. G., 2000b: Experimental and numerical verification of similarity concept for diffusion of car exhaust gases in urban street canyons. Journal of Environmental Monitoring and Assessment 65, 353-361.
Kastner-Klein, P., Fedorovich, E., Rotach, M.W., 2001a: A wind tunnel study of organised and turbulent air motions in urban street canyons. In print, J. Wind Engineering Industrial Aerodynamics.
Kastner-Klein, P., Berkowicz, R. and Fedorovich, E. 2001b: Evaluation of scaling concepts for traffic-produced turbulence based on laboratory and full-scale concentration measurements in street canyons. Proceedings of the Third International Conference on Urban Air Quality, 19-23 March 2001, Loutraki, Greece.
Ketzel, M., Berkowicz, R., Müller, W.J., Lohmeyer, A., 2000: Dependence of street canyon concentrations on above roof wind speed – implications for numerical modeling. International Journal of Environment and Pollution (in print).

34
Ketzel, M., Berkowicz, R., Flassak, T., Lohmeyer, A., Kastner-Klein, P., 2001: Adaptation of results from CFD-models and wind tunnels for practical traffic pollution modelling. Proceedings of the 7th International Conference on Harmonisation within Atmospheric Dispersion Modelling for Regulatory Purposes, Belgirate, Italy, May 28-31, 2001.
Kovar, A. B. Leitl, J. Liedtke, M. Schatzmann, 1999: Physical Modelling of Vehicle Emissions in Respect of Car-Induced-Turbulence, Proceedings of EUROTRAC Symposium 1998, Editors: P.M. Borrell and P. Borrell, WITpress, Southampton, 1999
Kovar-Panskus, 2001: Die physikalische Modellierung der Kraftfahrzeug-induzierten Turbulenz im kleinskaligen Windkanalmodell, Dissertation, Meteorologisches Institut, Universität Hamburg, 113 pp., in Vorbereitung zur Veröffentlichung
Macciacchera, I., Ruck, B., 2001: Pressure fluctuations induced by road vehicles in ambient air - A model study. To appear in Proc. Intern. Workshop on Physical Modelling of Flow and Dispersion Phenomena, September 3-5, 2001, Hamburg University, Germany.
Plate, E.J., 1982: Windkanalmodellierung von Ausbreitungsvorgängen in Stadtgebieten. Kolloquiumsbericht Abgasbelastungen durch den Straßenverkehr, Verlag TÜV Rheinland.
Schatzmann, M, Frantz, H., Grawe, D., Leitl, B., Mueller, W.J., 2001: Do field data represent the truth? Proceedings of the Third International Conference on Urban Air Quality, 19-23 March 2001, Loutraki, Greece.
Sini, J.-F., Anquetin, S., and Mestayer P. G.: 1996, Pollutant dispersion and thermal effects in urban street canyons, Atmos. Environ., 30, 2659-2677.
Stern, R., and Yamartino R. J.: 1998, Development and initial application of the micro-calgrid photochemical model for high-resolution studies of urban environments, Preprints 23rd NATO/CCMS ITM on Air Pollution Modelling and its Applications, 28 September - 2 October 1998, Varna, Bulgaria.
Trini Castelli S., 2001: A Proposal For The Parameterisation Of The Traffic Produced Turbulence In Fluid-Dynamics Models. TNO-MEP Report, in press
Vachon, G., Rosant, J-M., Mestayer, P. and Sini, J-F. 1999: Measurements of dynamic and thermal field in a street canyon, URBCAP Nantes 99. Proceedings of the 6th International Conference on Harmonisation within Atmospheric Dispersion Modelling, October 11-14, Rouen, France.
Vachon, G., Louka, P., Rosant, J-M., Mestayer, P. and Sini, J-F. 2001: Measurements of traffic-induced turbulence within a street canyon during the Nantes’99 experiment. Submitted to: Journal of Water, Air and soil Pollution.
VDI (1998): Ausbreitungsrechnung fuer KFZ-Emissionen. Draft of German Guidline VDI 3782, Blatt 8, Beuth Verlag, Berlin (withdrawn in 2000).

35
1.3 The influence of thermal effects on flow and dispersion in street canyons
J.-F. Sini1, A. Abdelqari1, R. Britter2, S. Di Sabatino2, A. Kovar-Panskus3, P. Louka1, P.G. Mestayer1,
L. Moulinneuf3, A. Robins3, J.-M. Rosant1, E. Savory3, G. Vachon1
1 Ecole Centrale de Nantes, France.
2 CERC, Cambridge, UK 3 University of Surrey, UK
The thermal effects due to the variable heating of the building walls by solar radiation and the heating produced by the vehicles on the airflow within a street canyon were studied by this group. The thermal effects (TEF) group, as all TRAPOS working groups, had the following responsibilities: Formulation of the importance of the subject for the street level pollution, Presentation of the TRAPOS contribution to the advancement of the subject, Transformation of the results into recommendations for practical models. Working group activities: The main tasks of this working group were the following: 1) Analysis of the temperature and wind measurements of the Nantes ‘99 experimental
campaign at the Ecole Centrale de Nantes, 2) Wind-tunnel experiments at the University of Surrey with the collaboration of
Ecole Centrale de Nantes examining the effect of different windward-facing wall heating,
3) Modelling of the thermal effects due to different windward-facing wall heating at the Ecole Centrale de Nantes using the CFD code CHENSI,
4) Modelling of the thermal effects induced by vehicles at CERC. 1.3.1 The Nantes ’99 experiment
The Nantes ’99 experimental campaign aimed at providing an insight into the thermal effects on wind and CO concentration fields within a street canyon. The detailed database that was developed is a useful tool for the evaluation of numerical models that deal with this topic. Previous numerical investigations (Sini et al., 1996) suggested that the largest impact of the thermal effects on the airflow occurs when the windward-facing side is heated. In this case the buoyancy forces generated at that wall by the heating directly oppose the downward inertial forces that are associated with the dominant canyon vortex. Hence, the present work was particularly focussed on this situation.
1.3.1.1 The Nantes ’99 experimental site
The field experimental campaign was conducted during June and the beginning of July 1999 in a street canyon in the city of Nantes, France. Rue de Strasbourg (Figure 1) is a three-lane one-way street situated in the centre of Nantes and is one of the most traffic congested streets of the city. The orientation of the street axis is approximately North to South. It is an asymmetric street canyon with its west side slightly lower (hw=19.4m) than its east side (he=22.8m). The aspect ratio of the width of the street, W=14.85m, over the mean height of the buildings, H=21m, is W/H=0.7 implying that a main vortex develops within the street when the ambient wind is perpendicular to its axis (Oke, 1987). A detailed description of the experimental site and the available measurements can be found in Vachon et al., 2000.

36
*7
3.00 m1.90 m
WESTEAST
4 m
8 m
11.6 m
14.5 m
1.5 m
u, v, w, CO
u, v, w, CO
CO, T
u, v, w, CO, Tu, v, w, CO, T
7 m
W/H=0.7
*7
*7*7
Sonic anemometer
CO sensor inlet
3D propeller anemometer
Thermocouples
Comb of x thermocouples
Traffic counter
Hot wire anemometer
Radiometres
*x
14.85 m
z
21 m
Figure 1: Schematic representation of the measurement site and instruments involved. 1.3.1.2 The Main results
The analysis of the air and wall temperatures showed the presence of a steep temperature gradient within the first few cm from the walls. A temperature drop of as large as 18°C was observed at 1.5m from the building wall heated directly by the sun. This led to a strong convection very close to the wall receiving direct solar radiation, affecting the transport of pollutants from the canyon to the layer aloft.
Figure 2 illustrates the diurnal variations of the wall temperature in June. The North-to-South orientation of the street axis results in the solar heating of its west side in the morning and progressively its east side in the afternoon. As shown by Fig. 2, the maximum wall temperature approaches 35°C in the morning and exceeds 45°C in the afternoon.
Figure 3 demonstrates the typical variation of the temperature difference (ΔT) between the air at the different distances x from the walls (Tx) and the adjacent building surface (Ts) on 22nd of June at 10:00 (local time) The most important feature of this graph is the development of a steep horizontal temperature gradient very close to the wall. Already at 2cm from the wall the gradient is extremely high (10.7°C/2cm ≈ 535°C/m) and it is still steep within the first 20cm from the wall (2.7°C/20cm ≈ 13.5°C/m) implying the existence of a thin thermal layer due to the direct solar heating of the wall. At distances farther than 20cm from the wall the gradient for ΔT is reduced to approximately 1.5°C/130cm (≈1.2°C/m). Therefore, in the present case, the thermal boundary layer depth is approximately 1.3% of the street width.

37
22/06/99
10
15
20
25
30
35
40
45
50
0:00 2:00 4:00 6:00 8:00 10:00 12:00 14:00 16:00 18:00 20:00 22:00 0:00Local Time
z/H=0.08, leeward
z/H=0.28, leeward
z/H=0.44, leeward
z/H=0.56, leeward
z/H=0.08, windward
z/H=0.29, windward
z/H=0.46,windward
z/H=0.63, windward
T (°C)
Leeward
Windward
Figure2: Typical diurnal temperature variations on the leeward and windward walls. As the horizontal gradients were observed to be steep within 20cm of the wall, it is suggested that the thermal effects on the street canyon dynamics and, consequently, on the dispersion of vehicular pollutants, have a small spatial extent and could be significant locally, in the close vicinity of the walls.
A flow visualisation study was carried out using helium-filled balloons about 50 cm in diameter. For wind directions perpendicular to the street axis it was found that balloons released at 2m-level tended to remain within 5m from the ground, moving up-and-down here-and-there as cars passed. However, those balloons that approached very close to the heated wall, so that they were almost touching the surface, always rose steadily upwards along that wall and into the upper levels of the canyon (Vachon, 2001).
The quantitative examination of the flow field using the available measurements was made with a two-dimensional projection of the velocity vectors (Figure 4). A main re-circulation was suggested by the measurements, which was present during the whole day for wind perpendicular to the street. However, the wind-speed measurements were taken farther from the walls than the temperature measurements and so the available flow measurements cannot be used to draw definitive conclusions on the thermal effects on the air motion closer than 1.5m from the walls.

38
22/06/99 - 11:00
-16
-14
-12
-10
-8
-6
-4
-2
0
2
0 0,1 0,2 0,3 0,4 0,5 0,6 0,7 0,8 0,9 1
Wall distance (m)
z/H=0.15, leeward
z/H=0.55, leeward
z/H=0.25, windward
z/H=0.57, windward
ΔT(°C)=T(x)-Twall
Leeward
Windward
Figure 3: Horizontal temperature gradient close to the walls. A re-circulation accompanied by a secondary vortex close to the bottom corner of the windward side of the canyon was obtained for the isothermal case using a 2-D application of the CFD code CHENSI. Including the variable heating of the west wall, flow and temperature fields were then simulated using the available wall temperature measurements. The simulation showed that the heated windward-facing wall creates a distinctive effect on the main flow, which is now characterised by two main counter-rotating vortices and a secondary smaller eddy at the leeward side at the bottom of the street. The re-circulation found in the isothermal case has been suppressed at the top of the canyon, while a strong updraft close to the heated wall leads to a transfer of air from the canyon floor to the roof-level.
The numerical simulation of this thermal case showed that the CFD code CHENSI overestimates the influence of the heated windward-facing side. The possible reason for this overestimation is the implementation of a temperature wall function based on temperature gradients normal to the wall, in conjunction with the size of the grid cells close to the walls. Due to grid resolution restrictions the wall condition is used outside the thin thermal boundary layer observed. Therefore, it can be concluded that the “standard” wall function cannot be used in the framework of an obstacle-resolving urban atmosphere model because the thermal boundary layers that develop on the vertical surfaces are too thin to be resolved.
A more appropriate condition for modelling such flows would be the reformulation of the temperature wall conditions in terms of thermal fluxes based on the thermal balance of the walls. For this reason another experiment (Nantes 2000) has been undertaken to investigate the flow and thermal field close to the near wall region. The analysis of these data is expected to give some further insight into the thermal effects on the airflow close to the walls.

39
Figure 4: Measured (left) and simulated (right) flow in the street (22/6/99 – 11:00).
In addition, it is expected that the spanwise re-circulations associated with the essential three-dimensionality of the configuration will also affect the general flow within the street. Therefore, a three-dimensional simulation has commenced that will calculate the airflow within Rue de Strasbourg and in its neighbourhood taking into account the complex geometry of the buildings and the effects of the side streets. 1.3.2 The wind-tunnel experiment
In addition to the full-scale experiment, a wind tunnel experiment was conducted in the EnFlo atmospheric tunnel, Surrey, during the summer 2000, with the collaboration of EnFlo, University of Surrey and ECN. The flow in a canyon is normally dominated by large-scale vortical motion, such that the wind moves downwards at the downstream wall. The effect of wall heating on the flow and pollution dispersion characteristics within the canyon is likely to be greatest when the windward-facing wall is heated, as was discussed in section 1.3.1. It is anticipated, from previous numerical predictions, Mestayer et al. (1995), that, under certain conditions, the buoyancy forces will be large enough to disrupt the canyon vortex to form a different regime with consequent effects on the local flow and pollutant dispersion characteristics. Such changes will also influence the dispersion of pollutants within the street. In the experiments the windward-facing wall of a canyon has been uniformly heated to simulate the effect of solar radiation.
1.3.2.1 The physical model
The experiment was aimed at assessing the effect of the heated windward-facing wall on the structure of the airflow within a cavity for low Froude number values. This had not previously been assessed through wind tunnel simulations under carefully controlled conditions, because it is a challenging problem to match the necessary similarity laws for velocity and temperature via an appropriate Froude
number. Here, the Froude number has been defined as refrefw
2ref
T/)TT(gHU
Fr−
= , where Tw denotes the
heated wall temperature, Tref the ambient, freestream reference temperature and g the acceleration due

40
to gravity. The airflow was investigated for four different Froude number values, namely, Fr=2.03 (Uref=1.0m/s, Twall=80°C), Fr=1.17 (Uref=1.0m/s, Twall=120°C), Fr=0.73 (Uref=0.8m/s, Twall=120°C) and Fr=0.27 (Uref=0.5m/s, Twall=120°C). For reference purposes, the isothermal case, without any wall heating, has also been studied.
W=285 mm
Heated wall [T ]w•
•
•
•
• ••Thermocouple•
H=285 mm
Incoming flowz
x
Figure 5: Diagrammatic layout of wind tunnel and canyon model
A nominally two-dimensional (2-D), 285mm square section (W/H=1) cavity of 3m length was installed with its principal axis perpendicular to the oncoming flow, Figure 5. The approach flow boundary layer conditions have been well-defined, with the wind normal to the main canyon axis, and measurements have been taken of canyon wall and air temperatures and five vertical profiles of mean velocity and turbulence measurements were taken at the same streamwise locations, on the geometrical centre-plane, for all the different Froude number cases. 1.3.2.2 The main results
The projected mean velocity vectors on the centre-plane of the canyon, together with streampaths computed from these velocity distributions, are shown in Figure 6, for the neutral and the lowest Fr value, only. In general, the flow within the heated-wall cavity was quite weak in all cases. The influence of the temperature due to the wall heating seems, in general, to be very small at the intermediate Fr values. The overall feature of a single main vortex in the cavity persists down to Fr=1.17, although the centre of the vortex tends to move slightly downwards and upstream with decreasing Fr value. It appears that the strongest effects on the airflow are detected for Fr=0.73 and Fr=0.27. For these two cases, the centre of the re-circulation was displaced towards the downstream side of the cavity. Moreover, the flow is inverted close to the canyon floor compared to the regular re-circulation of the isothermal cavity. This transition from a flow regime with single dominant vortex to one with a weaker secondary vortex close to the ground, that appears to take place at a Fr of the order of 1, is qualitatively similar to Sini et al’s (1996) 2-D numerical predictions, using the code CHENSI. However, in their study this transition took place at a Fr value at least an order of magnitude higher. Further work is required, including direct comparisons of experiments and 3-D predictions of exactly the same test case, in order to explain these differences.

41
Figure 6: Projected mean velocity vectors, mean temperature contours and streampaths on canyon centre-plane. Left: Neutral case, Uref=1m/s, Right: Fr=0.27, Uref=0.5m/s, Tw=120°C In all the cases there is no evidence of an updraft close to the heated wall, even for the very lowest Fr regime. Yet, since the profile nearest to the heated surface was taken at a distance of 0.09W (25mm) from the wall it is possible that such an updraft occurs within only a very thin layer close to the wall as suggested by the flowlines in the right hand side panel of Fig. 6.
The vertical location of the maximum temperature in the profile measured closest to the wall (not shown) changes significantly with Fr. The value of the maximum temperature in each of these near-wall profiles increases with a decrease in Fr down to Fr=0.73 and then decreases again at the lowest Fr examined. This clearly shows that the increase in height of the hottest region close to the heated wall is directly related to the weakening of the downwash associated with the dominant vortex. In addition, as the wall heating influence increases (decreasing Fr) and the main vortex weakens, together with the evolution of a region of stagnant flow, the temperatures in the most upstream part of the canyon tend to decrease.
So far there is little evidence that the buoyancy forces induce a widespread upward motion near the heated wall. Hence, it is not possible to state at present that the effect of wall heating will be significant in terms of the canyon flow field and the associated motion and dispersion of pollutants. We still need to define Fr values at which; (a) thermal effects become significant, (b) thermal effects completely change the canyon flow regime.
Although no temperature and velocity measurements are available very close to the heated wall (due to instrument limitations) it is suggested by the present measurements that the air is convected along the heated wall and probably escapes from the cavity at the upper downstream corner. As a post-TRAPOS continuation of the ECN-Surrey co-operation, a further experiment is planned at EnFlo during Autumn 2001, associated with 3-D CFD simulations at ECN.
1.3.3 Results of Numerical simulations
Numerical simulations of the Rue de Strasbourg were performed in 2-D based on the experimental results (see §1.3.1). The output showed that the street airflow is significantly modified by the heated windward-facing wall. As such an effect was not evidenced by the measurements it is concluded that the wall temperature boundary condition should be modified in CHENSI. In addition, as the wind tunnel experiment also indicated (see §1.3.2), the thermal effects should always be treated using 3-D simulations.

42
1.3.4 Modelling of the thermal effects induced by vehicles
At the street scale, effects due to the heat released from vehicles could be important especially in association with conditions of low traffic speed and low ambient temperature. Most pollutant dispersion models consider the traffic-induced turbulence to be purely mechanically generated; to neglect the heat effect due to the traffic could lead to overestimation of model predictions of pollutant concentration. In the case of urban street canyons, heat-traffic induced turbulence can be estimated assuming that heat released by vehicles at the bottom of a street canyon leads to a turbulent free convection process. A simple model to estimate this heat-traffic induced turbulence based on free convection is described in Lambley (1997). We investigated this model further. This model allows the estimation of a convective scaling velocity due to the heat from vehicles by knowing the average fuel consumption of a single vehicle, traffic flow parameters i.e. number of vehicles and their speeds and the street canyon geometry. The important result that emerged from this simple calculation was that given an urban street canyon and a constant traffic flow, traffic heat-induced turbulence is comparable with traffic mechanically-induced turbulence (TPT). According to this simple model when the vehicle’s speed is low (say 20 km/hour) the heat-induced turbulence can be larger that TPT, however further verifications of this effect is probably still required.
In the context of pollutant concentration modelling for urban areas, it is important to take into account the global effect of local heat sources. At present, urban dispersion models address the heat effects through empirical methods. For instance, most models used operationally acknowledge that city heating and roughness will influence the Monin-Obukhov length and the internal boundary layer height (IBL). Both atmospheric stability and boundary layer height affect pollutant concentration predictions.
The operational dispersion model ADMS-Urban (CERC, 1999) accounts for the urban heating by limiting the minimum Monin-Obukhov length according to the city size and type of urban area. The minimum Monin-Obukhov value gives an adjustment to the boundary layer height. The US dispersion model Aermod (Cimorelli et al. 1998) incorporates heat effects by estimating urban heat fluxes from temperature differences between rural and urban areas as a function of the city population. A new boundary layer height is then estimated from urban heat fluxes. Some authors (Hanna, 2001) suggest that the minimum Monin-Obukhov length to account for city heating must be set as proportional to the average height of the buildings. These are examples of empirical methods used in urban dispersion models to tackle the problem of urban heat effects. They are often based on experience and intuition and their use is case dependant.
A more general way of accounting for city heat effects is through an estimation of the modification of the incoming airflow due to both surface roughness and surface temperature changes. The most important and apparently least studied case corresponds to the study of a stable boundary layer formed initially over rural areas approaching an urban surface. Stable boundary layers are very sensitive to surface inhomogeneities as in this case any disturbance at the surface is transmitted very quickly to the top of the boundary layer affecting its structure. The aim of the work performed at CERC was to furnish a methodology to deal with the atmospheric stability modification due to the change of roughness and temperature. A simple mixing-height model (Di Sabatino, 1998) developed for changes of both roughness and temperature in coastal areas was used as a tool to estimate the boundary layer height over the city starting from an unperturbed boundary layer and to analyse its consequence on concentration model predictions. This model does not have a diffusion component so in order to study the effect of the stability change over the city on concentration it was used together with the dispersion model ADMS-Urban (version 1.52). As stated above, the ADMS-Urban model accounts for the heat of the city by limiting the Monin-Obukhov length; this prevents the atmospheric thermal stratification over the city from being too stable. This option was not used. Heat fluxes were estimated for the city of London for three days of low wind conditions through the mixing-height model. The calculated heat fluxes values were lower than those reported in literature (Harrison et al. 1984) for the city of London but they produced an improvement of ADMS-Urban concentration predictions. These results are preliminary and further investigations are still required. Besides the specific conclusions the aim of the work was to investigate the possibility of using a model of such type to account for the urban boundary layer and this was achieved.

43
1.3.5 Practical recommendations
Taking the above results together, the recommendations given for practical models are: • The full-scale and wind tunnel measurements suggest that the overall effect of the heated walls on the street canyon flow dynamics is smaller than in 2-D numerical simulations
• Thermal effects may generate a thin thermal convective flow close to the heated wall. As the flow in the wall boundaries carries air from the street level upwards, while normally cleaner air is transported from above, thermal effects may still be important for the air quality at pedestrian level and for the pollution transfers indoor.
• The heated walls affect the three components of the wind close to the wall and, therefore, this topic must be dealt with 3-D numerical calculations.
• The heat flux close to the heated wall is an important issue of these studies. In numerical calculations the use of heat flux boundary conditions is certainly more appropriate than the use of temperature boundary conditions. The results of the Nantes’99 campaign together with the new experiment Nantes 2000 documenting temperature and wind speed close to the wall are expected to give further input to the refinement of the treatment of wall heating effects and to the formulation of the heat flux boundary condition in CFD codes.
• Traffic heat-induced turbulence can be comparable in magnitude to that due to traffic mechanically-induced turbulence (TPT), especially for low vehicle speeds, and so needs to be considered for inclusion in models. Relevant references CERC 1999: ADMS-Urban, USER Guide, November 1999. Available from Cambridge
Environmental Research Consultants, 3 Kings Parade, Cambridge, CB2 1SJ, UK. Cimorelli, A., Perry, S., Venkatram, A., Weil, J., Pain, R., Wilson, R., Lee, R. and Petrs, W.,
1998: AERMOD – Description of Model Formulation (Version 98314 (AERMOD and AERMET) and 98022 (AERMAP). USEPA, RTP, NC 27711, 113 pages.
Di Sabatino S., Tampieri, F. and Trombetti, F. 1998: The growth of the internal boundary layer in different stability conditions. XXIII General Assembly of the European Geophysical Society. April 20-24 1998, Nice, France, Annales Geophysicae C616.
Hanna S., 2001: Personal communication ([email protected]). Harrison, R., McGoldrick, B. and Williams, C. 1984: Artificial heat release from Greater
London 1971-1976. Atmos. Environ. 18, n. 11, 2291-2304 Kovar-Panskus, A., Moulinneuf, L., Savory, E., Abdelqari, A., Sini, J-F, Rosant J-M., Robins,
A. and Toy, N. (2001). A wind tunnel investigation of the influence of solar-induced wall-heating on the flow regime within a simulated urban street canyon. Submitted to the J. Water, Air and Soil Pollut.
Lambley, J. 1997: Urban Pollution Dispersion. 4th Year Project. Dept of Engineering. Univ. of Cambridge.
Louka, P., Belcher, S.E., and Harrison, R.G. (2000). Coupling between airflow in streets and the well-developed boundary layer aloft. Atmos. Env. 34, 2613--2621.
Louka, P., Vachon, G., Sini, J-F., Mestayer, P., Rosant, J-M.: 2001, ‘Thermal effects on the airflow in a street canyon – Nantes ’99, Experimental results and numerical simulation’, submitted to J Water, Air and Soil Pollution: Focus.
Mestayer, P.G., Sini, J-F., Jobert, M.: 1995, ‘Simulation of the wall temperature influence on flows and dispersion within street canyons’, in Air Pollution 95, Porto Carras, Greece, September, Volume 1: Turbulence and Diffusion, pp. 109--106.

44
Sini, J-F., Anquetin, S. and Mestayer, P.: 1996, ‘Pollutant dispersion and thermal effects in urban street canyons’, Atmospheric Environment 30, 2659--2677.
Vachon, G., PhD thesis, Ecole Centrale de Nantes, 2001. Vachon, G., Rosant, J-M., Mestayer, P.G. and Sini J-F.: 1999, ‘Measurements of dynamic and
thermal field in a street canyon. URBCAP Nantes99’, in 6th International Conference on Harmonisation within Atmospheric Dispersion Modelling for Regulatory Purposes, Rouen, France, October 1999, 12 pp.
Vachon, G., Rosant J-M., Mestayer P.G., Louka P., Sini J-F., Delaunay D., Antoine M-J., Ducroz F., Garreau J., Griffiths R., Jones C., Lorin Y., Molle F., Peneau J-P., Tetard Y., and Violleau M. (2000). Experimental investigation of pollutant dispersion within a street in low wind conditions, the experiment Nantes ’99. 9th Int. Symp. on Transport and Air Pollution, Avignon, France 5-8 June 2000.
Vachon, G., Louka, P., Rosant, J-M., Mestayer, P.G., and Sini, J-F. (2001). Measurements of Traffic-Induced Turbulence within a Street Canyon during the Nantes '99 Experiment. Submitted to the J. Water, Air and Soil Pollut.

45
1.4 The modelling of tunnel entrances and exits
Silvia Trini Castelli1, Silvana Di Sabatino2, Giulia Clai3, Ingo Düring3, Rex Britter2, David Carruthers2, Achim Lohmeyer3, Peter Zandveld1
1 TNO-MEP, Apeldoorn, The Netherlands
2 CERC, Cambridge, United Kingdom 3 IBAL, Dresden , Germany
The aim of this study focused on the exchange between the three consultants in the TRAPOS network about the way each of them handles the dispersion of the emissions of tunnel mouths in the frame of an Environmental Impact Assessment (EIA). The final goals was also to identify the key parameters for the description of the tunnel emission sources in a net of roads for the application of operational models. 1.4.1 Introduction
In this work a detailed description of the models used in TRAPOS framework – TNO TRAFFIC, MLuS, PROKAS, ADMS-Urban and an analytical method - is performed, so to compare the different modelling methodologies adopted to evaluate pollutant concentrations when tunnels are present in an urban site. As a reference case, the Stuttgart data set is considered since it supplies an interesting opportunity for the application of the models. There are 2 tunnels very close together, the tunnel Schwanenplatz in the direction east to west and the tunnel “Berg” in the direction from north to south.
The data set (from Lohmeyer et al. 1999) supplies:
- a series of half-hour measured concentrations recorded at the receptors during the week-days; nights and week-ends are not included. The data refer to the year April 1994-March 1995 and the measuring points lie at and nearby the tunnel entrances;
- the emission factors estimated for the year 1995;
- the annual mean wind speed referred to the years 1979 - 1982 time series, recorded at 10 m height;
- the average traffic profile, as function of working days-holidays, light and heavy traffic;
- information about the receptor points and the relative collected measurements;
- the wind statistic in the German ‘TA Luft Format’ related to the stability classes;
- information about the emitting streets described as a net of line sources.
In the following sections only the modelling aspects related to the description of the tunnel presence in the different models are highlighted. For the detailed presentation of the models and the description of the available data set we refer to the relative TRAPOS Report, where also the data files are included.
The insight in the relation between differences in the methodologies allows deducing some general remarks about the methods to describe the concentration contribution of the tunnels to the concentration field when modelling pollutant dispersion in a city.
1.4.2 TNO-TRAFFIC model, Department of Environmental Quality, MEP-TNO, Apeldoorn (The Netherlands)
TRAFFIC is aimed at calculating the annual average concentration and percentiles as a function of wind direction at receptors near roads. Traffic pollution dispersion is reproduced by a Gaussian plume-type model. The model is designed to work on a spatial scale of the order of 1 km, that is a “near-road” condition. The traffic contribution is described by line sources, corresponding to road segments, split into a series of small sections regarded as point sources. The direct contribution of the single point source to the concentration at a given receptor is calculated solving the Gaussian plume equation This last needs to be adapted depending on wind direction and speed in accordance with the effects of possible local buildings. The compounds are transported as inert species. A first order chemical

46
reaction is post-processed for calculating NO2 at the receptor. The dispersion induced by the traffic itself is taken into account considering an initial vertical dispersion, assumed 1.5 m in urban streets and 2.5 m in highways. Submodels are connected for calculations with site-specific climatological data, NO – NO2 conversion and the higher percentiles. A semi-empirical relation is used to determine NO2 concentrations from the calculated local traffic contribution of NOx and the estimated background ozone concentrations. In computing 98 percentile it is assumed that the frequency distribution of concentrations within a certain wind direction sector is log-normal, with an empirically determined standard deviation. This allows calculation of the 98-percentile of the entire concentration distribution.
In the Application to the Stuttgart tunnel exercise, the model was set and run with the following configuration. 1) Identification of the sources: the streets are split and described by linear segments characterised by constant emission values. The provided data set has been used to build the roads’ net in the domain surrounding the tunnels. The emission from the part of the road inside the tunnel is split in two contributions and assigned to two “virtual” street segments placed on the real road exiting from the tunnel up to an established distance. Usually the virtual road is represented by a segment of 50 – 100 m, but it is a variable parameter defined depending on the case study. In this application we have defined a virtual road of 50 m and then of 25 m. 2) Wind speed and direction data: the wind directions are classified in 12 sectors of 30 degrees. The wind speed values are classified in the following three classes: 0 ÷ 2.5 m/s, 2.5 ÷ 7.5 m/s, ≥ 7.5 m/s. Wind rose data from the German TA-Luft classification have been adjusted on TNO TRAFFIC format in the best approximation possible both for direction and speed. 3) Stability classes: the original stability classes have been aggregated in the TNO TRAFFIC format. No differentiation of stability classes is considered. 4) Identification of the receptors: the correspondent data file has been used to input the coordinates of the receptors to TNO TRAFFIC model. 5) Concentration calculation: TNO TRAFFIC requires a wind direction and frequency dependent background concentration for NO2, NOx, O3 and for CO, in the calculation of the percentile. Since wind-rose detailed measured data were missing, the correspondent Dutch data have been scaled on the available background concentrations. This adjustment leads to an approximate comparison between the observed and predicted concentration values, to be accounted for when discussing the results. The model outputs are concentrations and percentiles of the different chemical compounds at the selected receptors.
A comparison between the measured and calculated values for the annual mean and the 98 percentile using the TNO TRAFFIC model has been performed. The predicted data correspond to three runs: to single out the importance of the tunnel contribution to the concentration, in a first test TNO TRAFFIC model was run only accounting for the external road net and no virtual road representing the tunnel was considered. In the next two runs, a virtual street segment, respectively of 50 m and 25 m length, was introduced for describing the emission of the road inside the tunnel.
The NOx concentrations show a reliable agreement between observed and predicted values, while the values of CO appear much smaller than the measured values. This discrepancy suggests that for CO values some uncertainty could be related to the background and the corresponding local measurements or the emission factors of the vehicles. Considering that CO background is a very sensitive quantity, maybe the value of for the annual mean could be not fully representative of the urban area considered and the background should be estimated in a more sophisticated way for each receptor point separately. Satisfactory results are obtained for the annual mean of NO2 while less fair results are obtained for the 98% of NO2. In both the cases, the agreement between predicted and observed values is satisfactory at the stations that are farther with respect to the tunnel entrances. Peak values are not well caught and a smoothing of the predictions towards a sort of average value appears. Analogous

47
results are found for the NOx annual mean, affected by the distances between the receptor and respectively the tunnel entrance and the street. The presence of the virtual street segment to describe the tunnel contribution leads to a slight improvement in those cases where the observed value is already satisfactorily predicted. In this case, the difference in the predictions due to the length of the street segment, 50 m or 25 m, at the most of the receptors is negligible.
1.4.3 MLuS and PROKAS models , IBAL - Ingenieurbüro Dr.-Ing. Achim Lohmeyer (Germany)
IBAL applies 2 models, MLuS and PROKAS, depending on the boundary conditions and on the quality, necessary for the study.
1.4.3.1 MLuS-2000
The model is applicable for first quick estimates of the air quality near streets in the open country or if there are only a few buildings. MLuS-2000 is a regression model based on long-time measurements near streets.
The basic input parameters are: daily mean number of vehicles, percentage of trucks, statement whether number of vehicles and truck content is a typical working day number or an annual mean, kind of street, number of lanes of street, inclination of street, annual mean of the wind speed in 10 m above the ground, year for which the concentration has to be determined, distance of the receptor point from the outer edge of the street and background concentration. In case there is a nearby intersection, the traffic data of the intersecting road are necessary. The model estimates the concentrations (annual mean values and 98-percentils) of CO, Hydrocarbons, NO2, Pb, SO2 and particles. The development of a version including 99.8 percentiles and PM10 concentrations is presently done for the tasks of EU Council Directive 1999/30/EC and (2000/69/EG).
The model has a special module to take care for the additional concentrations resulting from tunnels. In the case of the presence of a tunnel, the following additional input data are needed: width and height of the mouth, length, speed limit, one way/2 way traffic and in case of an exhaust shaft the flow rate, sucked out of the tunnel and emitted vertically by that shaft. The model first calculates the emission of the vehicles inside the tunnel, the speed of the jet of air induced by the piston effect of the vehicles and released horizontally by the tunnel. It then calculates the concentrations in the vicinity of the mouth of the tunnel by a simple regression method and adds these concentrations to the concentrations, resulting from the street without the tunnel.
As the data for the Stuttgart tunnels were used for the development of the tunnel modul of MLuS, the present exercise can not be used for validation purposes.
For further information about MLuS see Lohmeyer et al. (1999) or http://www.sfi-software.de/, for a case study, done with the base module of MLuS see http://www.lohmeyer.de/air-eia/casestudies/mlus/mlusberi.htm. MLuS is commercially available for a small fee, it is published by Forschungsgesellschaft für Straßen und Verkehrswesen, Köln, its use is recommended by the German Ministry of Traffic.
In case MLuS is not applicable or the air quality demands a more detailed attention the IBAL uses PROKAS_V.
1.4.3.2 PROKAS_V
PROKAS_V is a Gaussian Plume Model for the determination of the air quality parameters, to be compared to the air quality limit values, fixed in the EU Council Directives 1999/30/EC and (2000/69/EC). It is based on the German guideline VDI 3782/1 “Gaussian Dispersion Model for Air Quality Management“. Modelling of up to 5000 line sources of a network of streets is possible. The influences of traffic induced turbulence, course of streets on dams and noise protection devices for each street are included.
Input requirements are files containing the coordinates of the streets, the annual mean of the emissions of benzene, soot, NOx, PM10 and CO on these streets, and for each street an additional parameter to the dispersion parameter counting for near field disturbances of the flow (traffic induced

48
turbulence etc.), the dispersion parameters for smooth and rough terrain, the coordinates of receptor points and the background concentrations at these points, the distribution of the emissions on the on the single hours of the week, the meteorological statistics.
The results are the concentrations (annual mean values, 98- and 99.8-percentils) of the air pollutants under consideration (incl. NOx and NO2) at the receptor points.
The network of roads has to be provided by straight line sources with equal emissions. Area sources are reproduced by sets of line sources. The emission of each line source is distributed on an equivalent number of point sources depending on the distance between line source and receptor. Disturbances of the flow in the near field of the source (traffic induced turbulence, course of the street on a dam, noise protection devices etc) are taken into account by an addition to the dispersion parameters. The statistics are done considering 36 wind directions, 12 wind speeds, 6 atmospheric stratifications and the variation of the emissions in the course of the week. The contribution of the tunnel is realised by addition of the emissions of the tunnel to the road in front of the tunnel for a length of 50 m (short tunnels with low exit velocity) up to 150 m (large tunnels, much traffic, noise barriers, street below surrounding surface. The NO-NO2 conversion is handled as described in Romberg et al. (1996). The 98 percentile is calculated from the calculated concentration statistics as the emission statistics are respected. It is not a constant factor of the annual mean. The 99.8-percentile is determined from the 98 percentile as described in Gamez et al. (2001) or in the present book.
If an addition of the background concentration by surrounding streets and the concentration in built-up streets is necessary, the time correlated addition of the single values is carried out in order to assure a correct determination of the 98-percentile.
The results of PROKAS compare well with the results of the field measurements for the vicinity of the tunnels in Stuttgart. For details see the TRAPOS report of Trini Castelli et al. (2001). For further information about PROKAS see http://www.sfi-software.de/, for a case study, done with PROKAS see http://www.stadtklima.de/stuttgart/websk21/Heft2/index_h2.htm. PROKAS is commercially available.
1.4.4 ADMS-Urban model and an Analytical model, Cambridge Environmental Research Consultants Ltd - CERC (United Kingdom)
Within the framework of this working group it is proposed to explore the potential of a method based on a combination of both numerical and analytical modelling. The proposal is to use some analytical models to estimate the concentrations near the tunnel exits and compare them with ADMS-Urban model predictions. There follows descriptions of the dispersion model ADMS-Urban, of the scenarios used to model the tunnel and the analytical model.
1.4.4.1 Numerical modelling: ADMS-Urban model description
ADMS-Urban, is a model of pollutant dispersion in the atmosphere released from industrial, domestic and road traffic sources in urban areas. ADMS-Urban treats the various sources using point, line, area, volume and grid source models. The model applies up-to-date boundary layer physics using parameterisations of the vertical boundary layer structure based on the concept of Monin-Obukhov length and boundary layer height. In the up-to-date approach, the boundary layer structure is defined in terms of measurable physical parameters which allow for a realistic representation of the changing characteristics of dispersion with height. A Gaussian-type model is nested within a trajectory model so that significant areas can be considered. A meteorological pre-processor calculates the boundary layer parameters from a variety of meteorological input data. Other main features are described in the TRAPOS Report. The input parameters are easily introduced in the model through its interface. They are meteorological data, aerodynamic roughness length, co-ordinates of the sources, and specification of the source characteristics. For roads, the model require the width of the road, elevation of the road about ground and street canyon height. The emissions can be entered as an input or calculated through the hourly traffic count.
Different kind of outputs can be chosen by the user according to the problem under study. ADMS-Urban allows for the output of averaged concentration of NOx, NO2, CO, S02 and PM10 in selected receptors or/and in a specific grid. An intelligent grid can be selected in case of modelling of roads. This option allows for a better resolution with extra calculations at the edge of the roads.

49
The average can be specified as short-term calculations for which the concentration values are supplied per each met data or/and long-term calculations.
In this exercise, since the operational dispersion model ADMS-Urban does not contain any specific features to model flow and dispersion inside or/and near the exits of a tunnel, the modelling is done using some approximations and simplifications. The simplified scenarios are built in three stages. The first scenario consists in replacing the tunnel with a point source for each entrance and tunnel exit. The strength of each source is assumed to be equal to the total emission rate per km in the tunnel multiplied per length of the tunnel divided by the number of exits. The result from this simplified scenario will be used for comparison with predictions from a simple analytical model.
In a second stage, the tunnel is simulated by mean of virtual line sources of a pre-determined length positioned at the exits of the tunnel. Different length will be used and discussed. Finally, the use of area and volume sources is used as a replacement for the point sources. Different size of the area and volume sources as a function of the exit area will be investigated with the aim of giving some guidelines for the choice of the appropriate size.
1.4.4.2 The Analytical Model
An alternative way of studying the effect of tunnel on the concentration field is through analytical modelling. Let us consider the simplest case of a hypothetical tunnel of length L along the y direction so that the mean wind )(xU is perpendicular to it. Concentration of pollutants emitted by the traffic in the tunnel at a given receptor R in the vicinity of the tunnel exits can be modelled by finding a solution which is given by the linear superposition of an infinite line source, a line source of finite
length equal to the tunnel length L and the two point sources whose strength is equal to 2Lml ×& ,
where lm& is the source emission rate (mass unit/ time) per unit length. In particular we subtract to the infinite line solution the finite length solution and we add the two point sources where we have placed all the emissions in the tunnel. The solution can be expressed in a non-dimensional form. It can be interpreted in terms of the tunnel half length L /2. This solution has the advantage of giving an immediate response on where the effects of the tunnel are important. Results can be shown in a tabular form. This allows us to apply the template to long-term statistics (for example 1 year meteorological data) without re-running a dispersion code to have a first estimate of the effect of the tunnel. However, the analytical model was developed for a wind direction perpendicular to the tunnel. The model we have built has the disadvantage of becoming very complex when the wind is not perpendicular to the tunnel. To solve this problem the model can be refined by replacing the finite length solution with a finite number of point sources depending on the length of the tunnel L. The procedure to obtain the solution is the same as the one outlined above and has the advantage of not having any restrictions on the wind direction.
References den Boeft, Eerens, den Tonkelaar and Zandveld, 1996, The Science of the Total Environment,
vol. 180/190, 321-326 CERC 2000, ADMS-Urban, User Guide. Available from Cambridge Environmental Research
Consultants. CERC 2000, ADMS3 Technical Specification, (www.cerc.co.uk). Csanady, G.T. 1972: Crosswind shear effects on atmospheric diffusion. Atmospheric
Environment, 6, 221-232. Eerens, Sliggers and van den Hout, 1993, Atmospheric Environment, 27B, 389-399 Gámez, A.J., I. Düring, R. Bösinger, P. Rabl and A. Lohmeyer (2001): Determination of the
99.8-Percentile of NO2 Concentrations and PM10 Emissions for EIA Studies. 3rd Intl. Conf. On Urban Air Quality (Measurement, Modelling, Management), 19 – 23 March 2001 in Loutraki, Greece.

50
Lohmeyer, A., Düring, I., Bächlin, W. (1999): Validierung und Weiterentwicklung des BASt-Modells für die Autoabgasausbreitung an Tunnelportalen. Forschungsvorhaben FE 02.176/1997/LRB. Auftraggeber: BASt, Bergisch Gladbach, Januar 1999.
Romberg, E., Bösinger, R., Lohmeyer, A., Ruhnke, R., Röth, E. (1996): NO-NO2-Umwand-lungsmodell für die Anwendung bei Immissionsprognosen für Kfz-Abgase. Hrsg.: Gefahrstoffe-Reinhaltung der Luft, Band 56, Heft 6, S. 215-218.
den Tonkelaar, Baars and van den Hout, 1987, The Science of the Total Environment, vol. 59, 233-242
Trini Castelli S., Di Sabatino S., Clai G., Britter R., Carruthers D., Lohmeyer A., Zandveld P., 2001: Dispersion near tunnel exits: the Stuttgart Tunnel Exits exercise. TRAPOS Report.
Acknowledgements The authors thank for the provision of the Stuttgart data to Prof. Dr. J. Baumüller, Office of Environmental Protection, Dept. for Urban Climate, City of Stuttgart, Germany
51
1.5 The Influence of Fast Chemistry on the Composition of NOx in the Emission Input to Atmospheric Dispersion Models
Peter Sahm1, Nicolas Moussiopoulos1, Giorgos Theodoridis1, Vassiliki Assimakopoulos1, Ruwim Berkowicz2
1LHTEE, University of Thessaloniki, Greece
2National Environmental Research Institute, Roskilde, Denmark Emission input data needed for atmospheric dispersion simulations are usually provided by suitable emission models. These data are considered at a composition depending merely on the source type regardless of the dispersion model scale. However, chemical reactions with small time scales of the order of a few minutes can have a decisive effect on the composition of the emitted pollutants before scales are reached which are comparable to the resolution of mesoscale models. Microscale models, taking into account such chemical processes as NO-NO2-O3 fast cycles, can provide mesoscale models with more accurate emission data, but need appropriate boundary conditions from larger scale models. The modelling of chemical reactions with small time scales and subsequent the airflow and pollutant pattern within a street canyon were studied by this group. The fast chemistry (FC) group, as all TRAPOS working groups, had the following responsibilities: Formulation of the importance of the subject for the street level pollution, Presentation of the TRAPOS contribution to the advancement of the subject, Transformation of the results into recommendations for practical models. Working group activities I) Development and implementation of a module for the modelling of chemical reactions with small time scales in the CFD codes CFX-TASCflow and MIMO and the parameterised street pollution model OSPM. II) Modelling fast chemistry and analysis of the influence on the pollutant levels in a street canyon. 1.5.1 Description of models
CFX-TASCflow may be used for modelling fluid flow, heat and mass transfer and fast chemistry in complex geometries. The code uses arbitrary curvilinear, body-fitted, multi-block, structured, non-staggered grids, a strong conservative form of the governing differential equations, a first-order accurate backward fully implicit scheme in time, a 2nd-order bounded scheme for the spatial discretisation of advection terms, a coupled solution procedure for momentum and continuity equations, an algebraic multi-grid method for the solution of the sets of the algebraic difference equations and the standard k-ε turbulence model with wall functions.
MIMO is a prognostic microscale model which allows describing the air motion near complex building structures (Ehrhard et al., 2000). Within MIMO, the Reynolds averaged conservation equations for mass, momentum and energy are solved together with additional transport equations for scalar quantities such as potential temperature, turbulent kinetic energy and specific humidity. A staggered grid arrangement is used and co-ordinate transformation is applied to allow non-equidistant mesh size in all three dimensions in order to achieve a high resolution near the ground and near obstacles. Conservation properties are fully preserved within the discrete model equations. The discrete pressure equations are solved with a fast elliptic solver in conjunction with a generalised conjugate gradient method. The Reynolds stresses and turbulent fluxes of scalar quantities can be calculated by several linear and non-linear turbulence models.
A module for the coupled treatment of fast chemical reactions within street canyons has been developed, based on the NO-NO2-O3 cycle:

52
NO +O NO + Ok
3 2⎯→⎯
NO hv NO Oj2 + + ⎯→⎯ •
O O O2 3 + • ⎯→⎯ where k(ppb-1s-1) and j(s-1) are the reaction rate constant for the oxidation of NO and the photolysis frequency of NO2, respectively. A source term linearisation was performed in order to calculate the increase or decrease of each chemical’s concentration, where:
[ ] [ ][ ] [ ]{ }[ ] [ ][ ] [ ]{ }[ ] [ ][ ] [ ]{ }dtjOk
dtjOkdtjOk
233
232
23
NONOOdNONONOdNONONOd
+−=−=+−=
These equations are then embodied to the transport equations, as source terms due to chemistry, using a simple integration rule. An implicit treatment in CFX-TASCflow and a semi-implicit treatment of source terms due to chemical reactions in MIMO is accomplished by incorporating negative source terms to the active part of the coefficients of the discretised equations. Velocity, turbulence and pollutant concentration fields are first computed as quasi-steady, treating pollutants as chemically inert. Velocity and turbulence fields are subsequently frozen and unsteady computations follow for the evolution of the concentration fields of NO, NO2 and O3. Background values for O3, NO and NO2 are provided at the inflow boundary, while NO and NO2 sources at street level are used in order to simulate heavy NOx traffic emissions.
Another approach especially suited for modelling of NO2 with simple parameterised street pollution models is to solve the set of linearised equations describing formation of NO2 in the street air analytically. This allows for calculation of NO2 concentrations based on computed concentrations of NOx. Assuming that an equilibrium is achieved between processes involving oxidation of NO by ozone, photodissociation, direct emissions of NO2 and exchange of the street air with the background air, the concentrations of NO2 in the street canyon air are given by:
( )( )( )[ ] = 0.5 B - - 4 [ ] [ ] + [ ] D/
NO B NO NO NOx o n21 2
22 2⋅ ⋅
where: [NO2]n = [NO2]v + [NO2]b [NO2]o = [NO2]n + [O3]b B = [NOx] + [NO2]o + R + D The terms with index b are the background air concentrations, while the index v denotes concentrations due to the direct emissions. The equilibrium is assumed to be achieved within the time corresponding to the residence time, τ, of pollutants in the street. The photochemical equilibrium coefficient is given by R = J/k (ppb), while D = (kτ)-1 is the exchange rate coefficient (ppb).
The above analytical expression is implemented in the parameterised street pollution model OSPM (Hertel and Berkowicz, 1989; Berkowicz, 2000) and has successfully been used for estimation of NO2 concentrations in Danish streets (Palmgren et al., 1996).

53
1.5.2 Case specification and application of CFX-TASCflow
The geometry of the domain studied and the boundary conditions are illustrated in Figure 1. Two street canyon configurations were used, a rectangular one with H/W=1 and a deep one with H/W=2 (H=28m). At the inflow boundary, a horizontal velocity profile U=Uref(z/δ)α was applied (α=0.33, Uref=5ms-1, δ=140m) with a turbulence intensity of Tu=10%, a dissipation length scale of L=25m, zero background concentration for NO, NO2 and a concentration of 70ppb for O3. A uniform emission rate of 1,250μgm-1s-1 for NOx with NO2/NOx=10% was assumed at street level. Nighttime and daytime conditions were analysed, though the results of the latter are not presented here.
2H 2H
WH
5H
Free boundary
Figure 1: Sketch of the computational domain.
Figure 2: Velocity fields for two street canyon configurations as predicted with CFX-TASCflow.

54
Figure 3: Pollutant concentrations as predicted with CFX-TASCflow. (a) NOx, (b) NO2, (c) O3 and (d) NO2/NOx (%).
5
10
15
20
25
30
0 35 70O3 [ppb]
NO
2/NO
x [%
]
average ratio withphotolysisaverage ratio
Figure 4: Predicted NO2/NOx ratio for various background ozone levels.
1.5.3 Case specification and application of MIMO
The case considered for the application of MIMO has been studied experimentally by Rafailidis and Schatzmann (1995) and Rafailidis (1997). In this experiment, wind-tunnel models, corresponding to multiple street-canyon configurations with a variety of canyon aspect (street width W to building height H) ratios and roof shapes, were placed in a simulated deep urban boundary layer. Twenty street canyons were placed upstream and seven downstream of the canyon containing a line source, to ensure

55
that fully grown neutrally stratified boundary layers were established in the region of interest. Systematic measurements of the boundary layer profiles symmetrically upstream and downstream of the test section have shown that all parameters measured were repeatable between the various upstream and downstream positions. From the available experimental cases, a two-dimensional multiple street canyon configuration with H/W=1 and flat roofs was studied, the computational domain consisting of five street canyons. At the main inflow boundary, the profiles of the horizontal velocity U, the turbulence kinetic energy k and the rate of dissipation ε are specified, such as to match the corresponding experimental conditions, while zero values are assigned to the vertical wind velocity V.
The NOx emission rate was assumed to be 1,250μgm-1s-1 and O3 concentrations ranged from 30 ppb to 70 ppb. The ratio of NO2/NOx was set to 5% following the suggestions of other researchers (Palmgren et al., 1996). In figures 6,7 and 8 the effect of the chemical reactions taking place immediately after emission is clearly seen for the leeward wall, the centre of the cavity and the windward wall respectively (Assimakopoulos, 2001).
W H
H
S Figure 5: Experimental set-up of the two-dimensional urban configuration (top). From Rafailidis and
Schatzmann (1995). The NO2/NOx ratio rises in an almost uniform manner as the background O3 concentration rises. As is illustrated from the reactions given above, the oxidation of NO with O3 acts as a source of NO2 and as there is no destruction of NO2 since no photolysis occurs there is a 6% increase of its concentration as the background concentration of O3 increases. Moving towards the centre of the cavity the NO2/NOx ratio presents an even larger increase of the order of 30% for a background concentration of O3 of 70ppb. This dramatic increase may be explained by the lower wind velocity observed at the middle of the canyon, which enhances good mixing of pollutants since diffusion occurs thus, fresh air mass reaches the area and more NO2 is produced. At the windward wall the NO2/NOx ratio rises even higher, but not dramatically higher than at the centre of the cavity. This may be explained by the fact that recirculated chemicals which did not have time to react at the leeward wall due to the high wind velocity react at this location. Furthermore, fresh O3 enters the street canyon from above the cavity.
Similar calculations performed with the CFD code CFX-TASCflow revealed the same behaviour.
56
0
2
4
6
8
10
12
0 20 40 60 80
O3 (ppb)
NO
2/NO
x (%
)
Figure 6: Average NO2/NOx ratio versus background O3 concentration as computed by MIMO for the leeward
wall.
0
5
10
15
20
25
30
35
0 10 20 30 40 50 60 70 80
O3 (ppb)
NO
2/NO
x (%
)
Figure 7: Average NO2/NOx ratio versus backgroundO3 concentration as computed by MIMO for the centre of
the canyon.
0
5
10
15
20
25
30
35
40
0 10 20 30 40 50 60 70 80
O3 (ppb)
NO
2/NO
x (%
)
Figure 8: Average NO2/NOx ratio versus background O3 concentration as computed by MIMO for the leeward
wall.

57
1.5.4 Case specification and application of OSPM
An application of the above described method for modelling of NO2 concentrations in the street Jagtvej, Copenhagen, Denmark, with the OSPM model is illustrated in Figure 9. In Figure 9.a the measured and modelled hourly concentrations are compared for the whole dataset. In Figures 9.b and 9.c the relationships between NOx and NO2 concentrations are shown separately for the leeward and windward sides of the street. Because the windward NOx concentrations are as a rule much smaller than the leeward concentrations, the oxidation of NO by ozone is more efficient on the windward side than on the leeward side. In both cases, the levels of NO2 concentrations in the street are limited by the availability of the background ozone concentrations. a
0 20 40 60 80NO2 - measured (ppb)
0
20
40
60
80
NO
2 - m
odel
led
(ppb
)
Y = 1.03 * X - 1.77R2 = 0.87
b
0 200 400 600NOx - measured (ppb)
0
20
40
60
80
NO
2 - m
easu
red
(ppb
)
0 200 400 600NOx - modelled (ppb)
0
20
40
60
80
NO
2 - m
odel
led
(ppb
)
c
0 200 400 600NOx - measured (ppb)
0
20
40
60
80
NO
2 - m
easu
red
(ppb
)0 200 400 600
NOx - modelled (ppb)
0
20
40
60
80
NO
2 - m
odel
led
(ppb
)
Figure 9. a) Comparison of the measured and modelled NO2 concentrations for the whole dataset. b) The NOx - NO2 relationships for the leeward side of the street. c) The NOx - NO2 relationships for the windward side of the street. The straight lines shown in b) and c) correspond to the limits of complete oxidation (1:1) and to direct emissions only (0.05:1). 1.5.5 Results
The main findings from the numerical investigation of the flow field and the dispersion and chemical transformation of pollutants in typical street canyon configurations are as follows:
• The flow fields resulting from the simulations correspond to the patterns observed in street canyons (Figure 2).
• In particular, and in good agreement with observations, a dual vortex system is predicted for the deep street canyon configuration (case with H/W=2, Figure 2 right panel).
• Steady state is reached at a time scale of the order of two to three minutes. • High NOx concentration levels are predicted on the leeward side of the street canyon,
while O3 is depleted within the street canyon (Figures 3 (a) and (c)). • The oxidation of NO to NO2 leads to a significant increase of the NO2 concentration
(Figures 3 (b) and (d)). • The NO2/NOx ratio was found to vary linearly with the background O3 levels (Figures 4
and 6-8). In particular the increase of NO2 is highly dependent on the location in the street canyon, thus at the leeward wall a smaller increase is observed compared to the much higher increase at the windward wall. Nevertheless, the area of maximum NO2 is still the leeward wall, according to results indicating this area as the location of maximum pollutant concentration for this type of street canyon configuration.
1.5.6 Practical recommendations
Taking together the above results, the recommendations given for practical models are:

58
• The NO-NO2-O3 cycle has a significant impact to the composition of the pollutants exiting the street canyon.
• The simple NO-NO2-O3 chemical model is sufficient for predictions of NO2 on the street scale. The urban background ozone concentrations are crucial for the NO2 levels in urban streets.
• Urban ozone levels and pollutants levels downwind a city are not only affected by effects on the regional and urban scales: They also depend on small scale phenomena. Air pollutant dispersion and transformation in the urban scale should be described with an appropriate multiscale model cascade.
References Assimakopoulos, V. (2001), ‘Numerical modelling of dispersion of atmospheric pollution in
and above urban canopies’, PhD thesis in preparation. Berkowicz, R., 2000: OSPM - A parameterised street pollution model. Journal of
Environmental Monitoring and Assessment 65, 323-331. Ehrhard J., Khatib I.A., Winkler C., Kunz R. Moussiopoulos N. and Ernst G.: 2000, The
microscale model MIMO: development and assessment, J. of Wind Engineering and Industrial Aerodynamics, 85, pp. 163-176.
Hertel, O. and Berkowicz, R. (1989) Modelling NO2 concentrations in a street canyon, DMU Luft A-131, 31p.
Grønas, S. and K.H. Mitbø (1986), Four dimensional data assimilation at the Norwegian Me-teorological Institute, Norwegian Meteorological Institute Technical Report No. 66.
Grønas, S. and O. Hellevik (1982), A limited area prediction model at the Norwegian Meteorological Institute, Norwegian Meteorological Institute Technical Report No. 61.
Kunz R. and N. Moussiopoulos (1995), Simulation of the wind field in Athens using refined boundary conditions, Atmospheric Environment 29, 3575-3591.
Lalas D.P, D.N. Asimakopoulos, D.G. Deligiorgi and C.G. Helmis (1983), Sea breeze circulation and photochemical pollution in Athens, Greece, Atmospheric Environment 17, 1621-1632.
Moussiopoulos N. and S. Papagrigoriou eds. (1997), Athens 2004 Air Quality, Proc. Int. Scientific Workshop "Athens 2004 Air Quality Study", Zappion, 18/19 Feb. 1997.
Moussiopoulos, N., (1995), The EUMAC Zooming Model, A tool for local-to-regional air quality studies, Meteorology and Atmospheric Physics 57, 115-133.
Moussiopoulos, N., Theodoridis, G. and Assimakopoulos, V. (1998), ‘The influence of fast chemistry on the composition of NOx in the emission input to atmospheric dispersion models’, Proceedings from the EUROTRAC-2 Symposium 1998.
Palmgren, F., Berkowicz, R., Hertel, O. and Vignati, E. (1996) ‘Effects of reduction of NOx on NO2 levels in urban streets’, Sci. Total Environ. 189/190, 409-415.
Rafailidis S. and Schatzmann M. (1995), Concentration measurements with different roof patterns in street canyons with aspect ratios B/H=1/2 and B/H=1, Report, Meteorology Institute, University of Hamburg.
Rafailidis S. (1997), Influence of building areal density and roof shape on the wind characteristics above a town, Boundary-Layer Meteorology 85, 255-271.
Sahm P., Kirchner F. and Moussiopoulos N. (1997), Development and Validation of the Mul-tilayer Model MUSE - The Impact of the Chemical Reaction Mechanism on Air Quality Predictions, Proc. Int. 22nd NATO/CCMS "Technical Meeting on Air Pollution Modelling and its Application", Clermont-Ferrand, France, June 2-6, 1997.
Simpson, D., (1993), Photochemical model calculations over Europe for two extended summer periods: 1985 and 1989, Atmospheric Environment 27A, 921-943.

59
Simpson, D., (1995), Biogenic emissions in Europe 2: Implications for ozone control strategies, Journal of Geophysical Research 100 D11, 22891-22906.
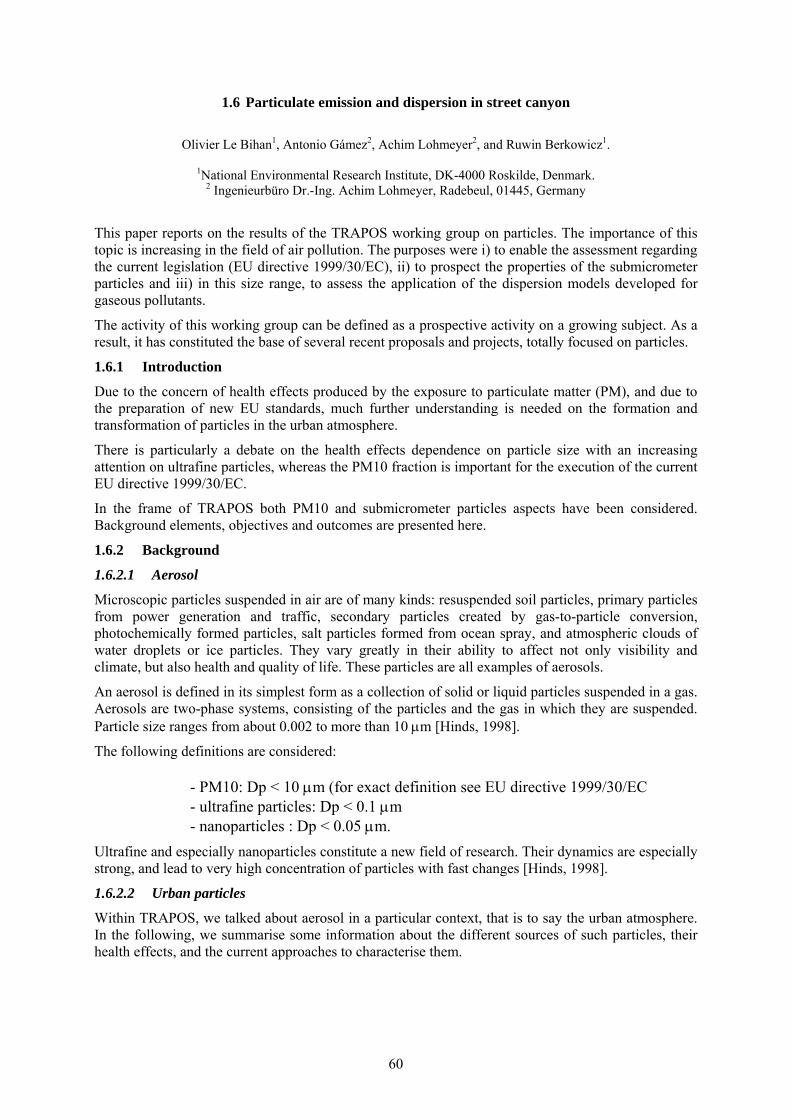
60
1.6 Particulate emission and dispersion in street canyon
Olivier Le Bihan1, Antonio Gámez2, Achim Lohmeyer2, and Ruwin Berkowicz1.
1National Environmental Research Institute, DK-4000 Roskilde, Denmark. 2 Ingenieurbüro Dr.-Ing. Achim Lohmeyer, Radebeul, 01445, Germany
This paper reports on the results of the TRAPOS working group on particles. The importance of this topic is increasing in the field of air pollution. The purposes were i) to enable the assessment regarding the current legislation (EU directive 1999/30/EC), ii) to prospect the properties of the submicrometer particles and iii) in this size range, to assess the application of the dispersion models developed for gaseous pollutants.
The activity of this working group can be defined as a prospective activity on a growing subject. As a result, it has constituted the base of several recent proposals and projects, totally focused on particles.
1.6.1 Introduction
Due to the concern of health effects produced by the exposure to particulate matter (PM), and due to the preparation of new EU standards, much further understanding is needed on the formation and transformation of particles in the urban atmosphere.
There is particularly a debate on the health effects dependence on particle size with an increasing attention on ultrafine particles, whereas the PM10 fraction is important for the execution of the current EU directive 1999/30/EC.
In the frame of TRAPOS both PM10 and submicrometer particles aspects have been considered. Background elements, objectives and outcomes are presented here.
1.6.2 Background
1.6.2.1 Aerosol
Microscopic particles suspended in air are of many kinds: resuspended soil particles, primary particles from power generation and traffic, secondary particles created by gas-to-particle conversion, photochemically formed particles, salt particles formed from ocean spray, and atmospheric clouds of water droplets or ice particles. They vary greatly in their ability to affect not only visibility and climate, but also health and quality of life. These particles are all examples of aerosols.
An aerosol is defined in its simplest form as a collection of solid or liquid particles suspended in a gas. Aerosols are two-phase systems, consisting of the particles and the gas in which they are suspended. Particle size ranges from about 0.002 to more than 10 μm [Hinds, 1998].
The following definitions are considered:
- PM10: Dp < 10 μm (for exact definition see EU directive 1999/30/EC - ultrafine particles: Dp < 0.1 μm - nanoparticles : Dp < 0.05 μm.
Ultrafine and especially nanoparticles constitute a new field of research. Their dynamics are especially strong, and lead to very high concentration of particles with fast changes [Hinds, 1998].
1.6.2.2 Urban particles
Within TRAPOS, we talked about aerosol in a particular context, that is to say the urban atmosphere. In the following, we summarise some information about the different sources of such particles, their health effects, and the current approaches to characterise them.

61
1.6.2.3 Sources
Particles from traffic are supposed to originate mainly from tail pipes, brakes, tyres, road abrasion and resuspension.
In the frame of TRAPOS, NERI2 has been using a station situated in a street canyon in Copenhagen, Jagtvej; at this place, it is believed that the total number concentration is mainly influenced by tail-pipe exhaust. A diesel car would produce really more particles than petrol. Note that the University of Minnesota [University of Minnesota, 2000] realised a large work on diesel motors as source of particles.
The additional PM10 mass concentration in a street canyon seems to be mainly influenced by the abrasion processes and resuspension, see for example Hüglin et al, 2000.
1.6.2.4 Public health effects [Kittelson, 2000]
The current particulate emission standards for engines and the EU Directives are mass based. Recently, however, interest in other measures, i.e., size, number, or surface area, has increased. This is the result of increased awareness of the influence of particle size on the environmental impact of particulate matter.
Such standards (e.g. PM 2.5) are based on studies that show an association between adverse health effects and the concentration of fine particles (100 nm<Dp<1000 nm) in the atmosphere [Künzli, 2000; Pope, 1995; Dockery, 1993]. Ultrafine and nanoparticles may have even stronger environmental impacts than fine particles. Animal studies have shown that particles that produce little respiratory system response in the μm diameter range produce much stronger response in the nm diameter range [Seaton, et al., 1995]. Concerns about the environmental impacts of tiny particles have been brought into sharper focus in a study that suggested that modern low emission engines might actually emit higher concentration of ultrafine and nanoparticles than older designs [Bagley, et al., 1996].
Because the toxicity of inhaled particles depends on their physical as well as on their chemical properties, an understanding of the properties of aerosol is required to evaluate airborne particulate hazards.
1.6.2.5 Measurement techniques of the submicrometer particles: state of the art
A strong research thrust was initiated a couple of years ago on the study of particles emitted from vehicles, both by universities and research institutes worldwide. The experimental approach is in majority in the form of laboratory set-up. A summary of the state of the art [Mc Aughey 2000] shows that, despite large human, technical and financial resources, the progress is very slow in this field:
The laboratory facilities have to face with experimental artefacts;
The processes are very complex and relatively small changes in the sampling and dilution process can induce changes of the order of magnitude of the ultrafine particles [Kittelson 2000]; one explanation is that most of the ultrafine particles may be formed during the dilution process.
Very recently, a preliminary work performed in Denmark has shown the high potential of a field approach by carrying some measurements in normal conditions, in a street [Wåhlin et al. 2000].
The more common technique to measure the size distribution of the submicrometer particles is constituted by a DMA (Differential Mobility Analyser) and a CPC (Condensation Particle Counter). For further information, consider Wåhlin et al. 2000.
1.6.3 Contribution in the frame of TRAPOS
1.6.3.1 Determination of PM10 Emission
1.6.3.1.a Formulation of the importance of the subject for street level pollution
2 National Environmental Research Institute, Roskilde, Denmark

62
The EU directive 99/30/EC sets limits of the PM10 concentration in air. The “stage I” objective for PM10 of the 24-hour limit value is 50 µg/m3, not to be exceeded more than 35 times a calendar year (approximately the 90th percentile), with an annual limit value of 40 µg/m3, both to be achieved by 1 January 2005. But there is no general consensus about how to predict the values where no field measurements can be done, for example, for an Environmental Impact Assessment for a road that is in planning process, as it is not known how to determine the PM10 emissions caused by abrasion and resuspension.
1.6.3.1.b Presentation of the TRAPOS contribution to the advancement of the subject • We checked the most extended model, the EPA3 model, and observed it is not suitable for
predicting PM10 emission with the confidence needed to achieve the EU directive. (Gámez et al, 2001a).
• We noticed that new parameters are needed, and that the silt load is not relevant for predicting emissions. (Gámez et al 2001b).
• We showed that it seems possible to determine the PM10 emission of a road from field measurements not only by backward dispersion modelling. An adequate and may be easier method is using NOx as a tracer. This method needs the following measurements:
- The background and roadside concentrations of PM10 - The background and roadside concentrations of NOx and - The traffic volume and the driving pattern (to determine the NOx emission factors) on the road.
In this case the comparatively well-known NOx emission of the road is determined from the traffic volume and the driving pattern and, for the period of time under consideration (from the whole monitoring period down to single hours) one simply states:
)(NOion concentrat)(PMion concentrat
)Oemission(N )Memission(Px
10x10 ×=
Where concentration means additional road concentration, i.e. roadside minus background concentration. As the driving patterns of a road can only be determined with certain subjectivity, sometimes two reasonable driving patterns were used to estimate the NOx emission. To use NOx as a tracer, the meteorological conditions and the building configurations at the side of the road are not needed and that is a big advantage. For most German monitoring stations the NOx concentrations are available. Thus from the operational point of view, the use of NOx as a tracer is less time consuming than the backward dispersion calculations for example with MISKAM, as the flow field modelling in the built up areas on the basis of a digital building model did not need to be done. (Gámez et al 2001b).
• We found out, that there is a large uncertainty concerning the influence of rain on the PM10 emission. The EPA considers that emission is zero during rainy days (Kuykendal, 2000, private communication); Rauterberg-Wulff (2000) deducts, from a three-months monitoring phase at Frankfurter Allee in Berlin, that the emission is reduced to one half during rainy days; Düring et al. (2001) find, for a four-week monitoring phase in Schildhornstraße in Berlin, no reduction of PM10 emission on days with rain. It is concluded that further measurements are needed as a basis for an understanding of the physical processes while rain appears.
1.6.3.1.c Transformation of the results into recommendations for practical models
For EIA4 studies for street canyons and the near field of roads concerning the determination of the additional street concentration, it is recommended to apply the known microscale dispersion models
3Environmental Protection Agency, USA.

63
(OSPM, WinMISKAM, PROKAS and to take as emission the total sum of all the emission sources: exhaust pipe, vehicle component wear and road abrasion.
To determine the PM10 emission, for lack of better formulas, presently only the EPA formula is available.
To use it, the silt load of the road needs to be known. The following Table 1.6.1 gives some values, found in Germany (Gámez et al, 2001b). Table 1.6.1: Silt load (PM75), found on three street canyons with heavy traffic in Germany. Due to the limited number of measurements, they may be not representative for the whole year. For more parameters, as composition of the silt load, average daily traffic (ADT) etc see the reports.
Silt load [g/m²] Name of road at curb on traffic
lane weighted
mean material
road surface state road
surface Frankfurter Allee, Berlin (Rauterberg-Wulff, 2000) 0,42+0,17 * 0,16+0,09 0,2+0,07 asphalt medium
Lützner Straße, Leipzig (Düring et al., 2001) 1,8+1 # 0,2+0,1 0,38+0,21 asphalt old, patched,
cracked Schildhornstraße, Berlin (Düring et al., 2001) 2+1,3 # 0,09+0,05 0,16+0,09 asphalt good *On outer lane, used as parking lane during night # at 0 - 25 cm distance from kerbstone
Some emission factors, found in Germany, are shown in the Table 1.6.2. The PM10 emission has to be assumed to be much higher than usual, if the road is old, patched and cracked as in Lützner Straße. Table 1.6.2: Results for PM10 emission factors in (g/VKT) for roads in street canyons with heavy traffic in Germany. Due to the limited number of measurements, they may be not representative for the whole year. For more parameters as driving patterns, average daily traffic (ADT), truck content etc (see the reports).
Backward Disp. Modelling
NOx as tracer
EPA formula Name of road
total non exhaust total* non exhaust total* Frankfurter Allee (Rauterberg-Wulff, 2000)
ca. ½ of values of EPA formula
- 0,06 to 0,14# 0,02 to 0,10# 0,15 to 0,24
9 roads in Brandenburg (3 for NOx) (LUA, 2000)&
0,14 to 0,23 0,11 to 0,17 0,12 to 0,16 0,08 to 0,11 silt load unknown
Lützner Straße (Düring et al., 2001)
0,49§ to 1,1§ 0,45§ to 1§ NOx-conc. unknown
NOx-conc. unknown
0,29 to 0,60
Schildhornstraße (Düring et al., 2001)
0,089 to 0,094 0,044 to 0,059
0,079 to 0,095
0,034 to 0,060
0,17 to 0,23
§Not representative because of short monitoring period #deducted from values in the report &reduced quality because of weak information about background concentration
All these recommendations went into the report of Düring et al (2001) where they were detailed and where recommendations for motorways and tunnels were added.
1.6.4 Submicrometer particles
1.6.4.1 Experimental characterisation: Approach
A strong research thrust was initiated a couple of years ago on the study of particles emitted from vehicles, both by universities and research institutes worlwide. The experimental approach is in majority in the form of laboratory set-up. A summary of the state of the art [Mc Aughey 2000] shows that the progress is very slow in this field: the laboratory facilities have to face with experimental artefacts, especially during the artificial dilution applied between the exhaust pipe and the measuring systems; relatively small changes in the sampling and dilution process can induce changes of the order
4Environmental Impact Assessments.

64
of magnitude of the ultrafine particles [Kittelson 2000]; one explanation is that most of the ultrafine particles may be formed during the dilution process.
Very recently, NERI has performed a preliminary work, carrying some measurements in normal conditions, in a canyon street [Wåhlin et al. 2001a, b].
It has shown that traffic is the major source of ultrafine particles, and that it is possible by a statistical method to discriminate between petrol and diesel particles. Their size range is mainly lower than 100 nm.
This demonstrates the high potential of the field experiment approach.
1.6.4.2 Development of the measurement capacity
To enforce this field experiment approach, and in the frame of TRAPOS, we have developed our instrumental capacity.
Three DMA have been mounted to be able to measure simultaneously several points, especially at the street level, and at the urban background level.
In addition to CO [Wåhlin et al. 2001a, b], we have been looking for some tracers to improve the sources apportionment. Two methods have been identified, assessed and acquired, namely:
A particulate carbon analyser; An impactor, to sample particulate matter and so to be able to do some chemical analysis
in function of size. These methods are currently running in the frame of a new campaign.
1.6.4.3 Application of the dispersion model OSPM
In a street canyon, dilution is the mean process for particles after emission [Vignati et al., 1999]. The dispersion conditions of submicrometer particles are expected to be like for gases; therefore the absolute source contribution to particle pollution in a street canyon can be calculated using dispersion models developed for gaseous pollutants.
TRAPOS offered the opportunity to realise an assessment of the application of a gas dilution model on particles, using the data basis constituted previously by NERI (cf. 3.2.1.a).
Firstly we compared the dispersion properties of particles with those of NOx. They seem to be comparable for particles and NOx, especially for particle diameter below 100 nm. Over 100 nm, some additional sources to NOx–related traffic emission have to be taken into account, including long-range transport.
Secondly, we considered the analysis of these measurements by application of the Operational Street Pollution Model (OSPM) [Berkowicz, 1996].
Thus the total emission from traffic, including daily variation and size distribution, has been calculated. Results are in accordance with the previous analysis based on statistical modelling [Wåhlin et al. 2001a, b].
We intend to use this method for detailed evaluation of particle emissions from traffic. This will benefit from the development of instrumentation capacity, namely the simultaneous characterisation of the background concentration of particle and of some new tracers.
References Bagley S.T., Baumgard K.J., Gratz L.G., Johnson J.H. and Leddy D.G., 1996
“Characterization of fuel and aftertreatment device effects on diesel emissions” Health Effects Institute 8HEI), Research Report No. 76
Berkowicz R., Palmgren F., Hertel O., Vignati E., 1996. Using measurements of air pollution in streets for evaluation of urban air quality-meteorological analysis and model calculations. Sci Total Environ 1996; 189/190:259-265.

65
Dockery D.W., Pope III, K.J., Spengler J.D. et al., 1993 “An association between air pollution and mortality in six US cities” New Eng. J. Med. Vol. 329, No. 24, p. 1753-1759.
Düring, I and A. Lohmeyer (2001): Validierung von PM10-Immissionsberechnungen im Nahbereich von Strassen und Quantifizierung der Feinstaubbildung von Strassen. Bericht für Senatsverwaltung für Stadtentwicklung, Brückenstraße 6, 10173 Berlin und Sächsisches Landesamt für Umwelt und Geologie, Zur Wetterwarte 11, 01109 Dresden. Download: www.Lohmeyer.de, click there “Literatur”.
Gámez, A.J., Düring, I., Bösinger, R., Rabl, P. and Lohmeyer, A. (2001a): Determination of the 99.8-Percentile of NO2 Concentrations and PM10 Emissions for EIA Studies. Paper, presented at 3rd Intl. Conf. On Urban Air Quality, 19 – 23 March 2001 in Loutraki, Greece.
Gámez, A.J., Berkowicz, R., Ketzel, M., Lohmeyer, A. and Reichenbächer, W. (2001b): Determination of the „non exhaust pipe“ PM10 emissions of roads for practical traffic air pollution modelling. Paper, to be presented at the 7th Intl. Conference on Harmonisation within Atmospheric Dispersion Modelling for Regulatory Purposes, Belgirate, May 28-31, 2001.
Hinds W.C., « Aerosol Technology, Properties, behavior, and measurement of airbone particles » Wiley-Interscience publication, 1998.
Hüglin, C., Gehrig, R., Hofer, P., Monn, C., Baltensperger, U. (2000): Partikelemissionen (PM10 und PM2.5) des Straßenverkehrs. Chemische Zusammensetzung des Feinstaubes und Quellenzuordnung mit einem Rezeptormodell. Bericht des NFP41” Verkehr und Umwelt”, Bericht C4. EMPA, Abt. Luftfremdstoffe / Umwelttechnik, CH-8600 Dübendorf.
University of Minnesota, Centre for Diesel Research, last update July 2000: http://www.me.umn.edu/centers/cdr/index.html.
Kittelson D.B. and Watts W., 2000. Nanoparticle emissions from engines. Third Joint ESF-NSF Symposium on « Nanoparticles: Applications in Material Science and Environmental Science and Engineering », Dublin, September 6.
Künzli et al., 2000. Public-health impact of outdoor and traffic-related air pollution: a European assessment. The lancet, Vol. 356, September 2.
Le Bihan O., Wåhlin P., Palmgren F. and Berkowicz R., « Application of dispersion modelling for analysis of particle pollution sources in a street canyon » ‘Third International Conference on Urban Air Quality, 19 - 23 March 2001, Loutraki, Greece’.
Mc Aughey J., « Vehicle Particulate Emissions » Report produced for European Commission – Directorate General III, Preliminary document, February 2000.
Pope III, C.A., Thun M.J., Namboodiri M.M., Dockery D.W., Evans J.S., Speizer F.E., and Heath C.W., 1995 “Particulate air pollution as a predictor of mortality in a prospective study of US adults” Am. J. Respir. Crit. Care Med., Vol. 151 pp.669-674.
Rauterberg-Wulff, A. (2000): Untersuchung über die Bedeutung der Staubaufwirbelung für die PM10-Immission an einer Hauptverkehrsstraße. Techn. Univ. Berlin, Fachgebiet Luftreinhaltung.
Seaton A., MacNee W., Donaldson K., Godden D., 1995 “Particulate air pollution and acute health effects” The lancet, Vol. 345, excerpt form section on –How particles may cause harm, p.177.
Vignati E., Berkowicz R., Palmgren F., Lyck E., and Hummelshøj P., « Transformation of size distribution of emitted particles in streets », The Science of the Total Environment 235 (1999) 37-49.
Wåhlin, P., Palmgren, F. and Van Dingenen, R.: 2001a, ‘Experimental studies of ultrafine particles in streets and the relationship to traffic’, Atmospheric Environment. In press.

66
Wåhlin, P., Palmgren, F. and Van Dingenen, R.: 2001b, ‘Source Apportionment and Size Characterisation of Aerosol Particles Measured in a Copenhagen Street Canyon’, ‘Third International Conference on Urban Air Quality, 19 - 23 March 2001, Loutraki, Greece’.

67
1.7 Determination of the 99.8-Percentile of NO2 Concentrations for EIA Studies
Clai1, G., R. Berkowicz2, R. Bösinger3, I. Düring1, M. Ketzel2, P. Rabl4 and A. Lohmeyer1
1Ingenieurbüro Dr.-Ing. Achim Lohmeyer, Radebeul, 01445, Germany 2National Environmental Research Institute, DK-4000 Roskilde, Denmark
3Ingenieurbüro Dr.-Ing. Achim Lohmeyer, Karlsruhe, 76229, Germany 4Bayerisches Landesamt für Umweltschutz, Augsburg, 86179, Germany
Keywords
Directive 1999/30/EC, Directive 96/62/EU, NO2, modelling, air pollution, limit value, wind tunnel, percentiles, automobile exhausts, traffic pollution, urban air quality. 1.7.1 Introduction
The EU Council Directive 1999/30/EC of 22 April 1999 includes NO2 as air pollutant and sets limit values for the protection of human health. This limit value for NO2 is 200 µg/m3 not to be exceeded more than 18 hours in a calendar year (that is approximately the 99.8-percentile) and an annual limit value of 40 µg/m3, both values to be achieved by the year 2010. Thus, for an Environmental Impact Assessment (EIA) these statistical parameters of the concentrations of NO2 have to be predicted.
The first part of the paper deals with the question what is the expected accuracy of determination of these 99.8-percentiles when using available mathematical pollution dispersion models for calculation of air quality near urban streets. In the second part an idea is presented to determine the high percentiles based on a statistical method.
1.7.2 Is a reliable mathematical modelling of high percentiles possible?
The first problem is that measurements of single concentration values, corresponding to averaging times of ½ hour or 1 hour, seem to contain a significant amount of variability. It is obviously difficult to predict the concentrations for a certain hour of the year in sufficient quality. The problem is shown by Figs. 1.7.1 and 1.7.2, displaying the results of field and of wind tunnel measurements of concentrations in street canyons.
Fig 1.7.1 shows the additional NOx street concentration, divided by the emission source strength (circles) as a function of the wind speed. The data result from measurements in the street canyon at the monitoring station Goettinger Strasse, Hannover, Germany. For a description of that site see NLOE (1993). Only observations corresponding to wind directions within the sector (270°±5°) and with traffic flow of more than 1000 vehicles per hour are selected. As already shown earlier for example by Leisen (1982), the concentration in a street canyon is not significantly influenced by the atmospheric stability (temperature gradient) of the flow above the roof. The selected data should thus be essentially dependent on wind speed only. This is actually what is shown by the model results using the Danish street pollution model OSPM (Berkowicz et al., 1997). As can be seen, the measured data exhibit a large scatter; there is a factor of up to five between the lowest and the highest value for the same value of the wind speed. Especially for low wind speeds some variability should nevertheless be expected due to variations in atmospheric stability and e.g. one-sided heating of the street canyon by the sun. Significant parts of the variability can be attributed to inaccuracies in emission modelling but also, errors in measurements of concentration and meteorology can be important. But still: the variability we see in Fig.1.7.1 is serious and seems to indicate that single measurements, averaged over ½ hour or 1 hour in the field, are not reproducible as was already mentioned by Schatzmann et al. (1997). Only the mean of a certain number of measurements for each situation seems to yield reliable results. This kind of variability, resulting in problems when determining single high concentrations, can also be seen in other field measurements, e.g. Ketzel et al. (1999).
The evidence of a large variability also comes from measurements in the wind tunnel. Here experiments are performed under strictly controlled conditions, i.e. both the emission conditions and
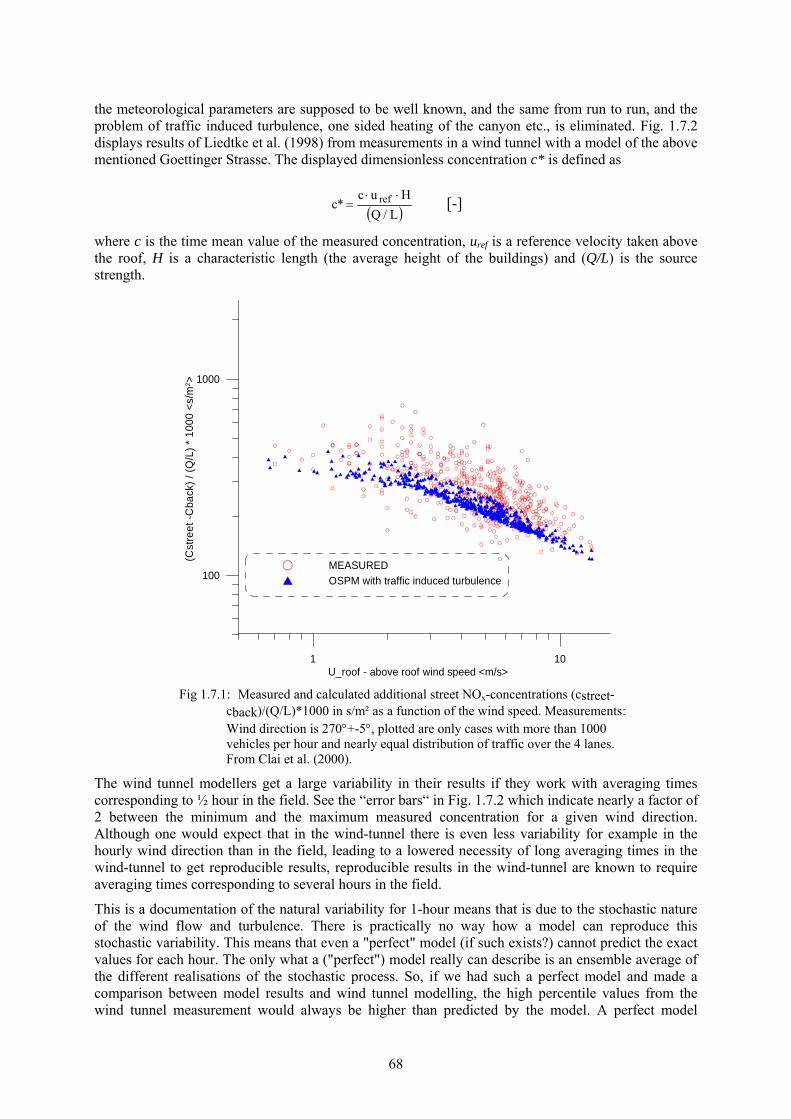
68
the meteorological parameters are supposed to be well known, and the same from run to run, and the problem of traffic induced turbulence, one sided heating of the canyon etc., is eliminated. Fig. 1.7.2 displays results of Liedtke et al. (1998) from measurements in a wind tunnel with a model of the above mentioned Goettinger Strasse. The displayed dimensionless concentration c* is defined as
( )L/QHuc
*c ref ⋅⋅= [-]
where c is the time mean value of the measured concentration, uref is a reference velocity taken above the roof, H is a characteristic length (the average height of the buildings) and (Q/L) is the source strength.
1 10U_roof - above roof wind speed <m/s>
100
1000
(Cst
reet
-Cba
ck) /
(Q/L
) * 1
000
<s/m
2 >
MEASUREDOSPM with traffic induced turbulence
Fig 1.7.1: Measured and calculated additional street NOx-concentrations (cstreet-
cback)/(Q/L)*1000 in s/m² as a function of the wind speed. Measurements: Wind direction is 270°+-5°, plotted are only cases with more than 1000 vehicles per hour and nearly equal distribution of traffic over the 4 lanes. From Clai et al. (2000).
The wind tunnel modellers get a large variability in their results if they work with averaging times corresponding to ½ hour in the field. See the “error bars“ in Fig. 1.7.2 which indicate nearly a factor of 2 between the minimum and the maximum measured concentration for a given wind direction. Although one would expect that in the wind-tunnel there is even less variability for example in the hourly wind direction than in the field, leading to a lowered necessity of long averaging times in the wind-tunnel to get reproducible results, reproducible results in the wind-tunnel are known to require averaging times corresponding to several hours in the field.
This is a documentation of the natural variability for 1-hour means that is due to the stochastic nature of the wind flow and turbulence. There is practically no way how a model can reproduce this stochastic variability. This means that even a "perfect" model (if such exists?) cannot predict the exact values for each hour. The only what a ("perfect") model really can describe is an ensemble average of the different realisations of the stochastic process. So, if we had such a perfect model and made a comparison between model results and wind tunnel modelling, the high percentile values from the wind tunnel measurement would always be higher than predicted by the model. A perfect model

69
would follow the black line of Fig. 1.7.2, while the high percentiles would be determined by the highest values from the red error bars. In the field, the variability of the concentrations is expected to be even higher.
0 4 0 8 0 1 2 0 1 6 0 2 0 0 2 4 0 2 8 0 3 2 0 3 6 0w in d d ire c tio n [° ]
0
1 0
2 0
3 0
4 0
5 0
6 0
7 0
8 0
9 0
1 0 0
c*[-]
w in d tu n n e l d a ta
Fig 1.7.2: Variability of short-term averages of measured concentrations. From Liedtke et al. (1998).
Measurements in the wind tunnel with averaging times, corresponding to 0.5 hour means in the field.
Apart from the natural variability caused by the turbulence we also have the effect of an unpredictable variability in emissions and we have additional uncertainty in the background contribution and different measuring errors. This will make the agreement between model results (we are still talking about a "perfect" model) and the measurements much worse than in the case of wind tunnel data.
An additional indication of problems comes from comparisons between measurements and calculations as in Fig. 1.7.1 for Goettinger Strasse and e.g. Berkowicz et al. (1997) for such comparisons for Jagtvej. The hours during which the highest concentrations are measured are not the same hours, during which the highest concentrations are calculated. That can also be seen for comparisons with other models as for example MISKAM (Lohmeyer et al., 1999). That means it is not possible to compare the results of measurements and calculations for single hours. One might consider that to be a weak argument and for operational purposes it might be enough to get the correct 99.8-percentile, but it shows, that there are important physical processes, which are obviously not represented in the models and which become more and more important, as the percentile to be considered increases.
For operational purposes it is an additional problem that for good model results good input data are needed, that means detailed time correlated emission-, background concentration-, ozone- and wind- time series, which are usually not readily available. For the determination of a 98-percentile, a regular 1 hour per week traffic jam might not be significant, but for a 99.8-percentile it might be. The NOx background or regional concentration might be known as annual mean or as 98-percentile, but not time correlated during certain hours of the year. Without these data one can only hope to get some rough estimates of average air pollution levels while a more detailed information on high percentiles is not possible. If we don't have good input data, then we don't need good models.
Until now only problems concerning the NOx-concentrations were addressed, whereas the EU directive 1999/30/EC limits the NO2 concentration. Thus one more important point is the NO-NO2-conversion. Tab. 1.7.1 displays as an example the 20 highest concentrations measured in Goettinger Strasse in 1994. As can be seen, the highest NO2 concentrations do not appear at the same time as the highest NOx concentrations. That means for the NO-NO2-conversion the essential input data, for

70
example the time correlated ozone concentrations, are necessary, which usually are not available for operational purposes.
Even field measurements show being very coincidental if they are evaluated for a single calendar year only. In December 1996 and January 1997, caused by extreme meteorological conditions, nearly all monitoring stations in the Southern German states of Hessen and Bavaria showed very high concentrations, leading to unexpected high 99.8-percentiles for the year 1997. See Fig. 1.7.3 with the results of the measurements in Viernheim as an example. These results can not be predicted by regular operational dispersion modelling used for EIA studies. Tab. 1.7.1: Highest ½ hour concentrations of NOx and NO2 and time of occurrence at street canyon monitoring
station Hannover, Goettinger Strasse in 1994. Number Day Month Hour NOx
[μg/m3] NO2
[μg/m3] Day Month Hour NO2
[μg/m3]. NOx
[μg/m3] 1 28 4 6 2344 94 29 6 14 219 431 2 3 2 7 2050 105 29 6 15 200 363 3 12 10 8 1697 102 5 8 12 199 471 4 3 2 6 1605 87 5 8 12 197 544 5 6 10 7 1590 80 5 8 14 196 416 6 6 10 6 1523 69 5 8 13 192 454 7 12 10 9 1454 92 22 7 19 191 504 8 3 2 7 1428 52 5 8 15 190 322 9 9 2 7 1423 114 23 2 8 189 1092 10 3 2 6 1395 74 29 6 13 187 416 11 12 10 8 1391 76 23 7 20 184 1087 12 3 2 8 1380 102 23 2 7 184 558 13 3 2 9 1375 78 23 7 21 183 1159 14 25 8 6 1332 91 23 2 8 183 566 15 2 3 6 1328 95 5 8 14 181 584 16 30 3 6 1311 125 22 7 19 181 371 17 30 3 6 1309 107 29 6 14 180 371 18 12 10 7 1305 88 22 7 20 178 443 19 22 4 6 1303 91 23 2 9 175 1063 20 12 10 7 1300 79 23 7 21 173 509
Thus we tempt to conclude, that the models may reproduce annual means in an acceptable range, and they also may reproduce the 98-percentiles, but there are hints that there are problems to determine 99.8-percentiles with mathematical modelling, especially in the case of insufficient quality of input data. For that reason a procedure for the determination of the 99.8-percentile was investigated by using statistical methods. The following second part of the paper deals with such a statistical method.
1.7.3 A statistical method
Field measurements also show there is a fair correlation between the annual mean or preferably the 98-percentile and the 99.8-percentile of NO2 if such exceptional years as 1997 (see Fig. 1.7.3) are excluded. Fig. 1.7.4 shows this for the case of the 98-percentile on the basis of more than 700 one-year-time-series and Fig. 1.7.5 for the annual mean. Therefore, to determine the 99.8–percentile, it is proposed to calculate the 98-percentile or the annual mean value in the conventional way and then deduct the 99.8-percentile by figures like Fig. 1.7.4 and 1.7.5. In case the 98-percentile is calculated by dispersion modelling, Fig. 1.7.4 indicates that the probability of exceedance of a 99.8-percentile of 200 µg/m³ is small, if the 98-percentile is between 115 µg/m³ and 170 µg/m³. In case the annual mean is calculated by dispersion modelling, Fig. 1.7.5 indicates that the probability of exceedance of a 99.8-percentile of 200 µg/m³ is small, if the annual mean is smaller than 40 µg/m³. In case an operational concentration prediction model is used where the 98-percentile is only calculated by just multiplying the annual mean by a constant factor, then the derivation of the 99.8-percentile should be done on the basis of the annual mean (Fig. 1.7.5) and not by using the 98-percentile.
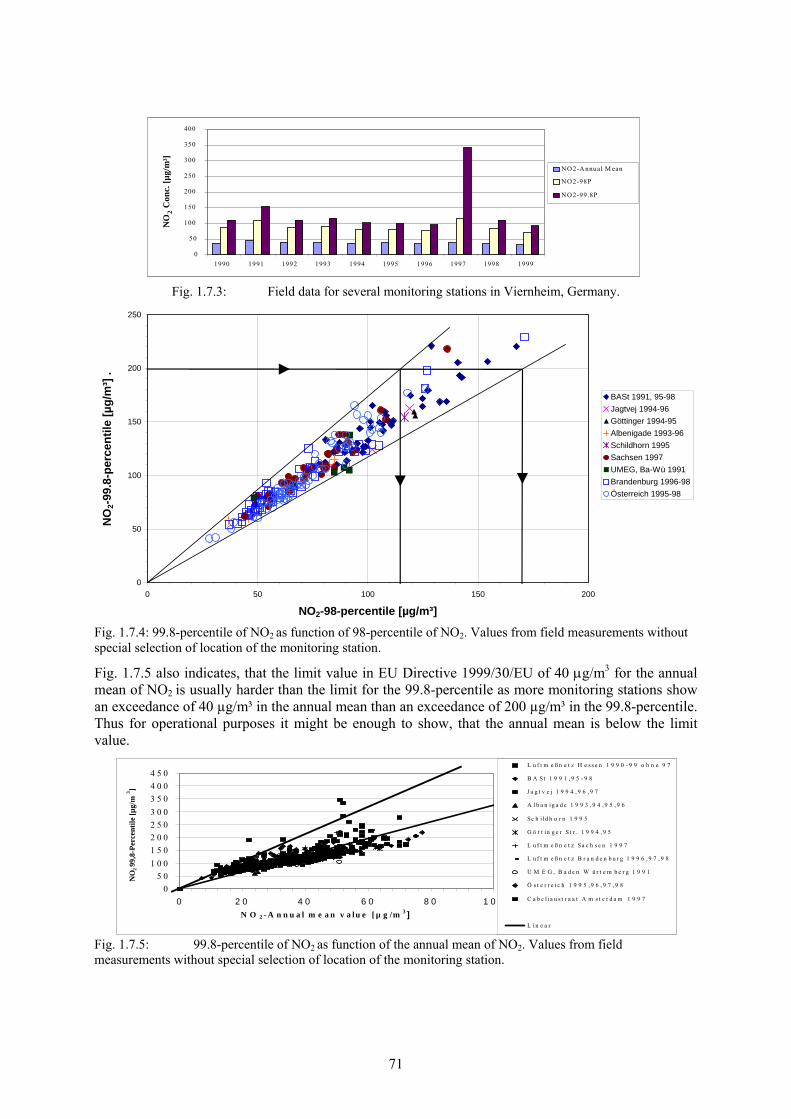
71
0 50
100 150 200 250 300 350 400
1990 1991 1992 1993 1994 1995 1996 1997 1998 1999
NO
2 Con
c. [µ
g/m
³] NO 2-A nnual M ean NO 2-98P NO 2-99.8P
Fig. 1.7.3: Field data for several monitoring stations in Viernheim, Germany.
0
50
100
150
200
250
0 50 100 150 200
NO2-98-percentile [µg/m³]
NO
2-99
.8-p
erce
ntile
[µg/
m³]
.
BASt 1991, 95-98Jagtvej 1994-96Göttinger 1994-95Albenigade 1993-96Schildhorn 1995Sachsen 1997UMEG, Ba-Wü 1991Brandenburg 1996-98Österreich 1995-98
Fig. 1.7.4: 99.8-percentile of NO2 as function of 98-percentile of NO2. Values from field measurements without special selection of location of the monitoring station.
Fig. 1.7.5 also indicates, that the limit value in EU Directive 1999/30/EU of 40 μg/m3 for the annual mean of NO2 is usually harder than the limit for the 99.8-percentile as more monitoring stations show an exceedance of 40 µg/m³ in the annual mean than an exceedance of 200 µg/m³ in the 99.8-percentile. Thus for operational purposes it might be enough to show, that the annual mean is below the limit value.
05 0
1 0 01 5 02 0 02 5 03 0 03 5 04 0 04 5 0
0 2 0 4 0 6 0 8 0 1 0 0N O 2 - A n n u a l m e a n v a lu e [ µ g /m 3 ]
NO
2 99
,8-P
erce
ntile
[µg/
m3 ]
L u f t m e ß n e t z H e s s e n 1 9 9 0 - 9 9 o h n e 9 7
B A St 1 9 9 1 , 9 5 - 9 8
J a g t v e j 1 9 9 4 , 9 6 , 9 7
A l b a n i g a d e 1 9 9 3 , 9 4 , 9 5 , 9 6
Sc h i l d h o r n 1 9 9 5
G ö t t in g e r S t r . 1 9 9 4 , 9 5
L u f t m e ß n e t z Sa c h s e n 1 9 9 7
L u f t m e ß n e t z B r a n d e n b u r g 1 9 9 6 , 9 7 , 9 8
U M E G , B a d e n W ü r t e m b e r g 1 9 9 1
Ö s t e r r e i c h 1 9 9 5 , 9 6 , 9 7 , 9 8
C a b e l i a u s t r a a t A m s t e r d a m 1 9 9 7
L i n e a r Fig. 1.7.5: 99.8-percentile of NO2 as function of the annual mean of NO2. Values from field measurements without special selection of location of the monitoring station.

72
1.7.4 Conclusions
The procedure, presented in Chapter 3, seems to be sufficient for operational purposes in the cases, that were examined up till now. For an example see Oettl et al. (2001). Bibliography Berkowicz, R., Hertel, O., Larsen, S.E., Sørensen, N.N. and Nielsen, M. (1997): Modelling
traffic pollution in streets. National Environmental Research Institute, Roskilde, Denmark.
Clai, G., R. Berkowicz, I. Duering, M. Ketzel, A. Lohmeyer, N. Moussiopoulos and S. Papalexiou (2001): Proposal for the calculation of the high percentiles of concentrations, necessary for the execution of directive 1999/30/EU. Accepted for publication in a special issue of the IJEP journal.
EU Council Directive 1999/30/EC (22 April 1999): Official Journal of the EU. L 163/41-60. Ketzel, M., R. Berkowicz, W. J. Müller and A. Lohmeyer (1999): Dependence of street
canyon concentrations on above roof wind speed - implications for numerical modelling. Proceedings of the 6th Intl. Conference on Harmonisation within Atmospheric Dispersion Modelling for Regulatory Purposes, Rouen, France.
Leisen, P., Jost, P., Sonnborn, and K.S. (1982): Modellierung der Schadstoffausbreitung in Straßenschluchten. - Vergleich von Außenmessungen mit rechnerischer und Windkanal-Simulation. In: Abgasbelastungen durch den Kfz-Verkehr im Nahbereich verkehrsreicher Straßen. Kolloquiumsbericht. Köln, Verlag TÜV Rheinland, S. 207-234.
Liedtke, J., Leitl, B., Schatzmann, M. (1998): Dispersion in a street canyon. Comparison of wind tunnel experiments with field measurements. A contribution to subproject SATURN. Meteorological Institute, University of Hamburg, Bundesstr. 55, D-20146 Hamburg. Proceedings, EUROTRAC-Symposium, Garmisch, 1998.
Lohmeyer, A. Duering, I, Baechlin, W. and Schaedler, G. (1999): Assessment of air quality under EU directives: Possibility of models in draft of German guideline VDI 3782-8. In VDI Bericht 1443, VDI Verlag.
NLOE (1993): Lufthygienisches Ueberwachungssystem Niedersachsen - Luftschadstoffbelastungen in Straßenschluchten. Edited by Niedersaechsisches Landesamt für Oekologie, D-30449 Hannover, ISSN 0945-4187.
Oettl, D., R.A. Almbauer and P.J.Sturm (2001): On the determination of the 99.8-percentile of NO2 concentrations required by the directive 99/30/EC: A case study. Proceedings of the 7th Intl. Conference on Harmonisation within Atmospheric Dispersion Modelling for Regulatory Purposes, May 28-31, 2001 Belgirate, Italy. Paper 6.01.
Schatzmann, M., Pavageau, M., Liedtke, J. (1997): Autoabgasausbreitung in Straßenschluchten. - Vergleich von Windkanal- und Naturmessungen an einem konkreten Fallbeispiel. S. 257-266 in Proceedings des 13. Statuskolloquium des PEF, 11/12.3.1997, Forschungszentrum Karlsruhe.
Acknowledgements The authors wish to express their appreciation for support from Mrs. Stec-Lazaj, State Env. Prot. Agency of Hessen for the evaluation of the monitoring data.

73
Chapter 2
Tools for the Study of Pollutant Dispersion in Street Canyons

74
2.1 The use of wind tunnels in modelling air quality in street canyons.
C. Chauvet1, P. Kastner-Klein2, A. Kovar-Panskus3, E. Savory2, M. Schatzmann1
1Meteorological Institute, University of Hamburg, Germany 2Institute for Climate Research, ETH Zurich, Switzerland
3Dept. of Civil Engineering, University of Surrey, UK The main goal of the Wind Tunnel Group was to centralise and summarise all the wind tunnel measurements carried out in the TRAPOS network. Wind tunnel data were the tools for model evaluation and model calibration in order to allow a better pollutant dispersion prediction. Wind tunnel data were also used to understand and to quantify new effects like Traffic Produced Turbulence or wall heating. 2.1.1 Introduction
Modelling of microscale atmospheric transport and dispersion in an urban area is a difficult task, since complex flow phenomena in the near field of buildings must be resolved. In recent years significant progress in computational fluid dynamics (CFD) and widely available computer power stimulated the development of numerous dispersion models that have delivered promising results for urban areas. However, before application these models must be tested and verified against data sets. Previous studies (see e.g. Kastner-Klein et al. 1997, Pavageau et al. 1997, Schatzmann et al. 1997) have shown that wind-tunnel data sets of flow and dispersion in the near field of buildings are well suited for verification of numerical model results. Accordingly, a major effort of the TRAPOS network focused on an extension of a wind-tunnel database for evaluation purposes of numerical models. In designing the wind-tunnel studies great importance has been also attached to the investigation of physical mechanisms that are only poorly understood so far. Thus, flow variations associated with heating of the building walls due to solar radiation and the role of turbulence generated by vehicle motions with respect to the dispersion of traffic emissions have been investigated.
Regarding the performance of numerical models, influences connected to a limited spatial resolution are among the main open questions. Although increasing computer power allows already quite high resolutions, it is still common for numerical dispersion studies to cover only a limited domain (up to a few hundred meters) and to resolve a very simplified building geometry. For example, it is typical to use a box-type representation of buildings and, as a result, all buildings may have flat roofs instead of the original variation in roof configurations. In addition, building dimensions are adapted to a more or less dense numerical grid, causing significant differences between the full scale building dimensions and the numerical representation. In order to investigate and to quantify effects correlated to model simplifications, flow field and pollutant dispersion measurements have been carried out for building configurations of variable complexity. Configurations starting from 2D cavities that resemble the simplest street canyon case, up to detailed, complex models of the urban landscape in a part of a city, have been investigated.
The present chapter presents a short overview of the wind-tunnel studies performed within the TRAPOS network and summarises the important findings. The results are shown starting with the simplest cases moving to the most complex, realistic city simulation. The text focuses on the new knowledge achieved regarding flow and dispersion in street canyons rather than presenting details of the created database. However, detailed information of the experimental set-up and format of the data sets is available for each experiment and references are given at the end of the paper.
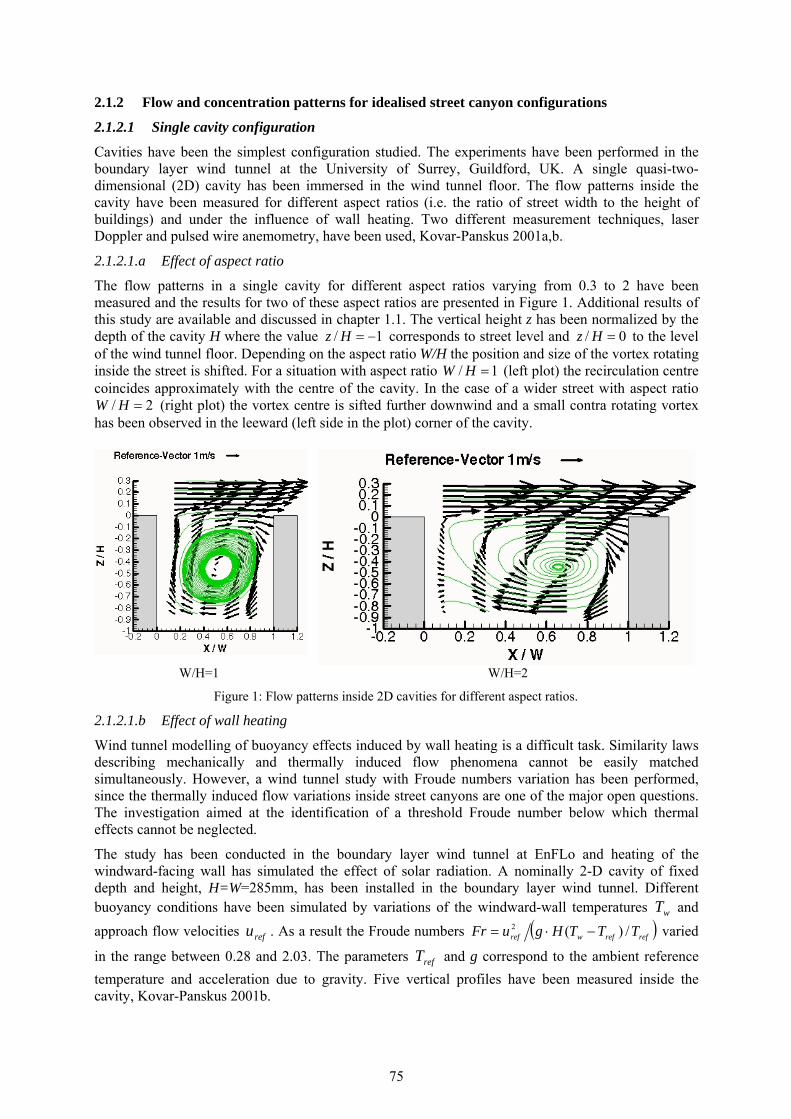
75
2.1.2 Flow and concentration patterns for idealised street canyon configurations
2.1.2.1 Single cavity configuration
Cavities have been the simplest configuration studied. The experiments have been performed in the boundary layer wind tunnel at the University of Surrey, Guildford, UK. A single quasi-two-dimensional (2D) cavity has been immersed in the wind tunnel floor. The flow patterns inside the cavity have been measured for different aspect ratios (i.e. the ratio of street width to the height of buildings) and under the influence of wall heating. Two different measurement techniques, laser Doppler and pulsed wire anemometry, have been used, Kovar-Panskus 2001a,b.
2.1.2.1.a Effect of aspect ratio
The flow patterns in a single cavity for different aspect ratios varying from 0.3 to 2 have been measured and the results for two of these aspect ratios are presented in Figure 1. Additional results of this study are available and discussed in chapter 1.1. The vertical height z has been normalized by the depth of the cavity H where the value 1/ −=Hz corresponds to street level and 0/ =Hz to the level of the wind tunnel floor. Depending on the aspect ratio W/H the position and size of the vortex rotating inside the street is shifted. For a situation with aspect ratio 1/ =HW (left plot) the recirculation centre coincides approximately with the centre of the cavity. In the case of a wider street with aspect ratio
2/ =HW (right plot) the vortex centre is sifted further downwind and a small contra rotating vortex has been observed in the leeward (left side in the plot) corner of the cavity.
W/H=1 W/H=2
Figure 1: Flow patterns inside 2D cavities for different aspect ratios. 2.1.2.1.b Effect of wall heating
Wind tunnel modelling of buoyancy effects induced by wall heating is a difficult task. Similarity laws describing mechanically and thermally induced flow phenomena cannot be easily matched simultaneously. However, a wind tunnel study with Froude numbers variation has been performed, since the thermally induced flow variations inside street canyons are one of the major open questions. The investigation aimed at the identification of a threshold Froude number below which thermal effects cannot be neglected.
The study has been conducted in the boundary layer wind tunnel at EnFLo and heating of the windward-facing wall has simulated the effect of solar radiation. A nominally 2-D cavity of fixed depth and height, H=W=285mm, has been installed in the boundary layer wind tunnel. Different buoyancy conditions have been simulated by variations of the windward-wall temperatures wT and approach flow velocities refu . As a result the Froude numbers ( )refrefwref TTTHguFr /)(2 −⋅= varied
in the range between 0.28 and 2.03. The parameters refT and g correspond to the ambient reference temperature and acceleration due to gravity. Five vertical profiles have been measured inside the cavity, Kovar-Panskus 2001b.

76
-0.2 0 0.2 0.4 0.6 0.8 1 1.2X / W
-1-0.9-0.8-0.7-0.6-0.5-0.4-0.3-0.2-0.1
00.10.20.3
Z/H
Reference vector (vel./Uref=1)
-0.2 0 0.2 0.4 0.6 0.8 1 1.2
X / W
-1-0.9-0.8-0.7-0.6-0.5-0.4-0.3-0.2-0.1
00.10.20.3
Z/H
T [C]80706055504540353020
Reference vector (Vel/Uref=1)
-0.2 0 0.2 0.4 0.6 0.8 1 1.2X / W
-1-0.9-0.8-0.7-0.6-0.5-0.4-0.3-0.2-0.1
00.10.20.3
Z/H
T [C]80706055504540353020
Reference vector (Vel/Uref=1)
neutral case Fr=2.03 Fr=1.17 Figure 2: Influence of wall heating on the flow pattern inside a 2D cavity with aspect ratio 1/ =HW .
Figure 2 shows a comparison of flow patterns observed for two situations with wall heating with the flow pattern observed in the neutral case (no simulation of thermal effects). The influence of the wall heating seems to be small at higher Froude numbers. The feature of a single main vortex remains for cases down to Fr=1.17, below that a weak secondary vortex was induced. From all the cases examined a threshold value can be determined at a Fr number of approximately 1. At the first measurement point of 0.09W (25mm) from the heated wall no updraft was visible and so if there is a heat-induced movement of air, it could not be resolved by the profiles taken. The thermal boundary layer was derived from the measurements to be about 0.2W. The results indicate that further experimental investigations are necessary in which the 3D effects of the flow are considered, together with additional numerical simulations.
2.1.2.2 Isolated 2D street canyon configuration
In this case a street canyon configuration consisting of two bar types buildings has been installed in the atmospheric boundary layer wind tunnel at the University of Karlsruhe, Germany. The buildings were surrounded by small, uniformly distributed roughness elements. The aspect ratio was 1/ =HW and flow field measurements have been performed with a laser Doppler anemometry system. For the dispersion studies a tracer gas was released from two ground-level line sources and concentration samples have been taken at the building walls and analysed with a leak detector (MELTRON). Detailed information about the experimental set-up, measurement technique and wind tunnel boundary layer flow is given in Kastner-Klein (1999) and Kastner-Klein et al. (1999).
2.1.2.2.a Effect of roof shape
The influence of roof shapes on flow and dispersion properties inside the street canyon has been one of the parameter variations studied. In the reference case both buildings had flat roofs. The flow field has been also measured for two additional situations with slanted roofs, added on the upwind building and on both buildings. Figure 3 shows the flow patterns for the three different configurations. The plotted vectors indicate only the direction of the flow, whilst the colours indicate the magnitude of the velocity. Obviously the flow pattern is strongly affected by the slanted roof structures. In both cases with slanted roofs the recirculation vortex, present in the flat-roof case, disappears. The flow separates at the roof edge and the recirculation zone does not penetrate inside the street canyon where a kind of stagnation zone can be observed. Consequently, the exchange between the street canyon interior and the urban boundary layer flow is also significantly affected.
Results from dispersion studies that are presented in chapter 1.1 resemble generally the same tendencies. The roof geometry has a strong influence on the ventilation of the canyon. In particular configurations with a step-down between the roof edge of the upwind building and the windward edge of the downwind building show significantly higher concentration values at the building walls. In these cases the maximum concentration was also shifted from the leeward canyon wall to the windward canyon wall, which indicates the vanishing of the recirculation inside the canyon.

77
Figure 3: Influence of roof shapes on the flow pattern in an isolated 2D street canyon configuration. 2.1.2.2.b Influence of additional upwind buildings
In order to examine more realistic urban situations, adding additional upstream buildings has extended the isolated street-canyon study. Figure 4 shows the results of the concentration measurements at the leeward and windward canyon wall. The concentration results are presented in a dimensionless form according to
s
ref
LQHUc
c⋅⋅
=* , (1)
with c: Measured tracer gas concentration Uref: Reference wind speed taken at a reference height zref H: Building height Ls: Effective line source length, Q: Tracer gas emission rate at the line source For the reference wind velocity the value u0 measured at the top of the wind tunnel boundary layer ( Hz 4≈ ) has been used. The reference case (only two buildings) is compared to situations with one or two additional upstream buildings. The presence of additional buildings coincides with an increase of pollutant concentration at both building walls. Simultaneously, roof-level concentrations (z/H>1) become negligibly small. The effect is more pronounced for the situation with two additional buildings than when considering only one additional building. It can be concluded that the street ventilation is reduced in the presence of upstream buildings. This reduction might be explained by the upward displacement of the flow and the perturbed exchange between the canyon interior and the outer flow. A further discussion of the influence of upstream buildings on the flow characteristics inside and above street canyons is included in chapter 1.1.
0 25 50 75 100 1250
0.2
0.4
0.6
0.8
1
1.2
1.4
Reference - LW wallReference - WW wall1 building - LW wall1 building - WW wall2 buildings - LW wall2 buildings - WW wall
Additional upstream buildingsz/H
cU0LsH/Q Figure 4: Influence of additional upwind buildings on vertical concentration profiles along the leeward (LW) and windward (WW) walls of a 2D street canyon.

78
2.1.2.3 Isolated 3D street canyon configuration
Following the described isolated 2D street canyon study simple three-dimensional street canyon configurations have been investigated at the University of Karlsruhe. The experimental set up has been similar to the one of the 2D studies, but the buildings have been shortened so that they did not cover the whole width of the wind tunnel. Consequently, horizontal flow processes affected the flow pattern inside the street canyon. Situations with two different span wise aspect ratios (longer canyon with
10/ =HL and shorter canyon with 5/ =HL ) have been studied, whereas the aspect ratio was kept at 1/ =HW . The flow patterns shown in Figure 5 demonstrate that changes due to the finite building
length can be observed at the lateral edges of the street canyon as well as above the building roof levels. Additionally, the influences of roof geometry and wind direction in the case of such simple, idealized 3D configurations have been investigated and are discussed in chapter 1.1 (see Kastner-Klein, 1999 and Kastner-Klein et al. 1999 for more details). Both parameters affected the flow and dispersion characteristics inside street canyons significantly and it can be concluded that a simple 2d approach for concentration estimates will not deliver satisfactory results for practical applications in complex urban configurations.
-1 0 1X/H
0
0.5
1
1.5
2
Z/H
ustd/u00.30.280.260.240.220.20.180.160.140.120.10.080.060.040.020
WIND---------->
-1 0 1
X/H0
0.5
1
1.5
2
Z/H
ustd/u00.30.280.260.240.220.20.180.160.140.120.10.080.060.040.020
WIND---------->
-1 0 1X/H
-3.5
-3
-2.5
-2
-1.5
-1
-0.5
0
Y/H
U/u010.950.90.850.80.750.70.650.60.550.50.450.40.350.30.250.20.150.10.050
WIND<-------
-1 0 1X/H
-6
-5
-4
-3
-2
-1
0
Y/H
U/u010.950.90.850.80.750.70.650.60.550.50.450.40.350.30.250.20.150.10.050
WIND<-------
a) 5/ =HL b) 10/ =HL
Figure 5: Influence of span wise aspect ratio L/H on the flow field inside an isolated 3D street canyon configuration. 2.1.3 Influence of traffic motions
The influences of traffic produced turbulence (TPT) on flow field and dispersion characteristics, has been another important aspect of the street canyon studies at the University of Karlsruhe. A summary of the results is included in chapter 1.2 and detailed information of the experimental set-up and the findings made is given in Kastner-Klein (1999) and Kastner-Klein et al. (2000a,b and 2001a). The data

79
have been compared with field data and numerical modelling results and have been employed for verification purposes of TPT parameterisations in dispersion models (Kastner-Klein et al., 2001b, Ketzel et al. 2001). It has been shown that TPT significantly affects dispersion in street canyons. In order to avoid concentration over-predictions for wind speeds lower than 4-5m/s simulations of traffic influences have to be incorporated in numerical as well as physical models. Thus, a further study at the University of Hamburg (Henne et al. 2001) focused on the improvement of TPT modelling techniques in wind tunnels.
2.1.4 Flow and concentration patterns for street canyon configurations with complex, realistic geometry
Finally, flow field and dispersion measurements have been performed with wind tunnel models of realistic urban canopies. Detailed models of the building configuration in the following four urban areas have been constructed and investigated:
• Goettingerstrasse, Hanover (Germany) • Jagtvej, Copenhagen (Denmark) • Podbielskistrasse, Hanover (Germany) • Rue de Strasbourg, Nantes (France)
The first three studies, with the models of Goettingerstrasse, Jagtvej and Podbielskistrasse, have been carried out in the boundary layer wind tunnel at the University of Hamburg, Germany (Chauvet et al. 1999, Chauvet et al. 2000). They focused on an investigation of variations in flow field and dispersion characteristics coinciding with the simplification of the building geometry according to typical resolutions of numerical models. The last study aimed at the investigation of the flow and turbulence characteristics in the urban roughness sublayer (RSL) and has been conducted at the boundary layer wind tunnel at the University of Karlsruhe, Germany (Kastner-Klein et al., 2000c). The results of these experiments have been used to verify and improve parameterisation methods of mean flow and turbulence characteristics inside the RSL. The experimental set-up and the data analysis are presented in a later chapter of the book and will not be discussed in details here (Kastner-Klein et al., 2001c). 2.1.4.1 Simplification effects
Most of the available numerical dispersion models use a box-type representation of buildings and resolve rather limited areas of an urban landscape. As a result, all buildings may have flat roofs instead of the variation in roof configurations in the original. In addition, building dimensions are adapted to a more or less dense numerical grid, causing significant differences between the full scale building dimensions and the numerical representation. Moreover, an essential number of buildings might not be well aligned with the regular structured grid that is commonly used in practical dispersion models. Subsequently, for oblique street canyons the surrounding buildings are represented by step-like structures that might clearly affect the flow. It is obvious that the uncertainty caused by geometrical simplification of the physical reality may play an important role in assessing the quality of results from numerical modelling. The study presented here gives an introduction as to how physical modelling might be used to quantify the effects of geometrical simplification. In order to investigate this effect two types of models have been built for each city area, one directly adapted from the numerical grid and the second one detailed and as close as possible to reality. Figure 6 shows an example of a simplified model and detailed model for the Goettingerstrasse configuration.
The dispersion of a tracer gas released from ground-level line sources has been studied for the three cases Goettingerstrasse, Jagtvej and Podbielskistrasse. Gas samples have been taken for different wind directions inside the street canyons at locations corresponding to full-scale monitoring stations. Results for the three different street canyon configurations are presented in Figure 7 in the form of dimensionless concentrations according to Eq. (1). The reference wind velocity corresponds to the value 100m above ground in nature. The comparison of the results for the detailed physical model with results from simplified models with different levels of abstraction show the inherent “offset” due to the

80
geometry simplifications. In addition, simplified model realisations can results in hiding of pollutant peaks.
Figure 6: Wind tunnel model for pollutant dispersion investigation
a) Goettingerstrasse b) Jagtvej
c) Podbielskistrasse (1) d) Podbielskistrasse (2)
Figure 7: Comparison of dimensionless concentrations as a function of wind direction for detailed and simplified model realizations of three different street canyon configurations.
In order to determine the reasons for the “offset“ between the detailed and simplified model results, systematic modifications of the simplified model have been investigated. The effects of step structure in the surrounding oblique street, roughness on the wall and on the ground and slanted roof have been quantified in the models for the Jagtvej and Podbielskistrasse configurations. Figure 8 shows, for one particular point, the effect of those modifications on the pollutant dispersion. The modification of one parameter did not affect dramatically the pollutant dispersion within the street canyon. The general

81
offset observed between the pollutant curve for detailed and simplified model could not be explained by the effect of one parameter but by a combination of all of them.
Another aspect studied has been the flow pattern modification due to a simplification of complex architectural details in the near vicinity of the sampling location and the absence of surrounding buildings. For the Goettingerstrasse configuration LDA measurements have been taken for three different model realisations. For this configuration the building architecture close to the sample location is rather complex and it is expected that the gateway shown in Figure 9 (right plot) has an influence on the flow and dispersion characteristics. However, in a numerical study performed for this street, the gateway has not been resolved and instead of the opening a solid wall has been modelled (see left plot in Figure 9). Accordingly, the first wind-tunnel model realisation has been directly adapted from the geometry used in the numerical study with a closed gateway. In order to investigate the effect of this simplification the real shape of the gateway has been reproduced in a second model realisation. Finally, a third case has been considered in which additional surrounding buildings were added to the second case.
a) Jagtvej b) Podbielskistrasse
Figure 8: Influence of small-scale geometry simplifications on dimensionless concentrations as a function of wind direction for two different street canyon configurations
a) original model realisation
b) gateway shape in the nature Figure 9: Simplified realisation (left plot) of a complex gateway (right plot) in a numerical study for the Goettingerstrasse configuration.
The results presented in Figure 10 clearly show that model simplifications fundamentally change the flow behaviour within street canyons. Resolving geometrical details and surrounding buildings in the wind tunnel model modifies not only the flow inside the street canyon but also in the adjacent streets. The flow in the streets perpendicular to the canyon can even change direction, which results in a completely different ventilation pattern and, thereby, large differences in local pollutant concentrations
Gateway position

82
within the canyon. Although the measurements presented here were performed at twice the height of the gateway, the effects are still very obvious.

83
a) Model realisation 1 b) Model realisation 2 c) Model realisation 3
Figure 10: Flow patterns in Goettingerstrasse for three different model realisations and a specific wind direction.

84
Summary and Conclusions The wind tunnel studies performed by the different TRAPOS teams resulted in a significant extension of a database for verification purposes of numerical models. The advantages of the wind-tunnel datasets compared to full-scale datasets result from their higher spatial and temporal resolution, the possibility of studying the influences of particular parameter variations and from the fact that wind tunnel measurements are conducted under controlled and reproducible conditions. A substantial effort has been undertaken to document the experiments performed and the datasets gained so that they may be used for various future applications. During TRAPOS they have already been actively employed in comparison studies with numerical models. The results of these research efforts are documented in the next chapter.
Compared to previous studies various improved measurement techniques, such as multi-component LDA systems, have been available. They have been particularly important for studying the complex flow field characteristics in the region between buildings. The new insights obtained allowed improved parameterisation of mean flow and turbulence characteristics in the urban roughness sublayer.
The wind-tunnel studies of traffic produced turbulence and thermally induced flow variations focused on effects that are presently usually not taken into account in physical and numerical modelling of dispersion in street canyons. Both studies have been of great importance in achieving a more complete picture of urban flow and dispersion phenomena. Traffic motions were found to be particularly important for concentration predictions at lower wind speeds. The wind tunnel data allowed verification and improvement of TPT parameterisations that are incorporated in dispersion models.
The studies with complex urban building configurations have generally shown that variations of small-scale features of the building geometry have a strong influence on the flow and concentration pattern in street canyons. The concentration distribution at a particular sampling location is significantly altered, if geometry simplifications and limited spatial resolutions are applied which are usually still the case in numerical dispersion modelling. Thus, the advantage of sophisticated, numerical models seems questionable if their application implies making large simplifications of the urban landscape being considered.
In the future, attention should be paid to non-stationary urban flow phenomena and also the studies of thermal effects should be extended. The layout of wind-tunnel sources in order to simulate vehicle emissions should be further considered. The observed influence of traffic motions is a new challenge and might require a revision of the traditional line-source concept.
References Chauvet C., Leitl B., Kovar-Panskus A., Schatzmann M. Experimental investigation on
differences in results from microscale dispersion modelling due to geometrical simplification. Euromech conference Sept 1999 Prague Czech Republic.
Chauvet C., Leitl B., Schatzmann M. Wind-tunnel modelling of microscale dispersion in a street canyon. 16th Imacs world congress 2000 August 21-25, 2000 Lausanne, Switzerlland
Kastner-Klein, P., Fedorovich, E., Plate, E.J., 1997: Gaseous pollutant dispersion around urban-canopy elements: wind tunnel case studies. Int. J. Environment and Pollution, 8. 727-737.
Kastner-Klein, P., 1999: Experimentelle Untersuchung der strömungsmechanischen Transportvorgänge in Straßenschluchten. Doctor Thesis, Dissertationsreihe am Institut für Hydromechanik der Universität Karlsruhe, ISSN 1439 - 4111, Heft 1999/2 (in German).
Kastner-Klein, P., Plate, E.J., 1999: Wind-tunnel study of concentration fields in street canyons, Journal of Atmospheric Environment, 33, 3973-3979.

85
Kastner-Klein, P., R. Berkowicz, E. J. Plate, 2000a: Modelling of vehicle induced turbulence in air pollution studies for streets. Int J. Environment and Pollution, 14, 496-507.
Kastner-Klein, P., Fedorovich, E., Sini, J.-F., Mestayer, P. G., 2000b: Experimental and numerical verification of similarity concept for diffusion of car exhaust gases in urban street canyons. Journal of Environmental Monitoring and Assessment 65, 353-361.
Kastner-Klein, P., Rotach, M. and Fedorovich, E., 2000c: Experimental study on mean flow and turbulence characteristics in an urban roughness sublayer. Preprints of the 14th Symp. on Bound. Layers and Turbulence, Aspen, CO, August 2000.
Kastner-Klein, P., Fedorovich, E., Rotach, M.W., 2001a: A wind tunnel study of organised and turbulent air motions in urban street canyons. In print, J. Wind Engineering Industrial Aerodynamics.
Kastner-Klein, P., Berkowicz, R. and Fedorovich, E. 2001b: Evaluation of scaling concepts for traffic-produced turbulence based on laboratory and full-scale concentration measurements in street canyons. Proceedings of the Third International Conference on Urban Air Quality, 19-23 March 2001, Loutraki, Greece.
Kastner-Klein, P., Rotach, M., 2001c: Parameterization of wind and turbulent shear stress profiles in the urban roughness sublayer. Proceedings of the Third International Conference on Urban Air Quality, 19-23 March 2001, Loutraki, Greece.
Ketzel, M., Berkowicz, R., Flassak, T., Lohmeyer, A., Kastner-Klein, P., 2001: Adaptation of results from CFD-models and wind tunnels for practical traffic pollution modelling. Accepted extended abstract for the 7th International Conference on Harmonisation within Atmospheric Dispersion Modelling for Regulatory Purposes, Belgirate, Italy, May 28-31, 2001.
Kovar-Panskus, A., Louka, P., Sini, J-F., Savory, E., Abdelqari, A., Mestayer, P. G. and Toy, N.: 2001a, ‘Influence of geometry on the flow and turbulence characteristics within urban street canyons – comparison of wind tunnel experiments and numerical simulations’, submitted to Int J of Water, Air and Soil Pollution: Focus.
Kovar-Panskus, A., Moulinneuf, L., Savory, E., Abdelquari, A., Sini, J-F., Rosant, J-M., Robins, A. and Toy, N.: 2001b, ‘A wind tunnel investigation of the influence of solar-induced wall-heating on the flow regime within a simulated urban street canyon’, submitted to J of Water, Air and Soil Pollution: Focus.
Leitl B., Chauvet C., Schatzmann M. (2001) Effects of geometrical simplification and idealisation on the accuracy of microscale dispersion modelling. Proceedings of the Third International Conference on Urban Air Quality, 19-23 March 2001, Loutraki, Greece.
Pavageau, M., Rafailidis, S., Schatzmann, M., 1997: A comprehensive experimental databank for the verification of urban car emission dispersion models. Int. J. Environment and Pollution, 8. 727-737.
Schatzmann, M., Rafailidis, S., Pavageau, M., 1997: Some remarks on the validation of small-scale dispersion models with field and laboratory data. Journ. Wind Eng. and Ind. Aerodyn., 67&68, 885 – 893.

86
2.2 The use of computational fluid dynamics in modelling air quality in street canyons
M. Ketzel1, P. Louka2, P. Sahm3, E. Guilloteau4, J.-F. Sini2
1 National Environmental Research Institute, Roskilde, Denmark 2 Ecole Centrale de Nantes, Nantes, France
3 LHTEE, University of Thessaloniki, Greece 4 Institute of Hydromechanics, University of Karlsruhe, Germany
2.2.1 Introduction
2.2.1.1 Motivation
Within the last years microscale Computational Fluid Dynamics (CFD) models have become an efficient and common simulation tool for assessment and prediction of air quality in urban areas. The validation of the CFD models is often a critical point, since high quality validation data sets are rare and the validation is a time-consuming process. Within the different groups of the TRAPOS network, several CFD codes are frequently used for the flow and dispersion calculation inside street canyons. For this reason, the TRAPOS network could give a perfect opportunity to launch an inter-comparison exercise for the different CFD codes and validate the codes with available data sets. A TRAPOS working group on CFD modelling was formed to deal with this task. This chapter summarises the work that was done during the operation of the network. Main parts of this work are available from the home page of the CFD working group (URL 1) or are published in conference contributions or international journals (see publication list). The extended abstracts of two publications (paper 2 and 3) are included in this volume.
2.2.1.2 Goals
The aims of the model inter-comparison exercise were defined as follows:
1. to assess and allocate the source of differences that appear when different CFD codes using the same turbulence model are applied to well defined test cases,
2. to improve the knowledge base for model development and application, 3. to demonstrate the level of agreement that can be expected from CFD modelling in urban
environment, 4. to give guidance for the procedure of the case set-up e.g. grid and inflow definitions,
boundary conditions etc. and 5. to prove the CFD codes to be a powerful reliable tool for application in practical situations
and for improvement of practical street pollution models. 2.2.1.3 Models and groups in the exercise
The numerical models used within the TRAPOS network comprise six advanced CFD models, namely, CFX-TASCflow, CHENSI, CHENSI-2, MIMO, MISKAM and PHOENICS, for the numerical simulation of the three-dimensional flow field and the dispersion of pollutants in the microscale.
Table 2.2.1: Numerical microscale models (including version number reference) applied by different TRAPOS groups.
Numerical model Reference TRAPOS Group CHENSI, version 3.2.1 Sini et al., 1996 ECN CHENSI-2, version 1.0 Guilloteau, 1999 U.Karlsruhe. / ECN MIMO Ehrhard et al., 2000 LHTEE MISKAM, version 4.1 Eichhorn, 1989 NERI PHOENICS, version 3.3 Cham, 2001 IBAL CFX-TASCflow Raw et al., 1989 LHTEE

87
A detailed description of the codes can be found in the model inventory (see link from URL 1) or in a table which compares the numerical schemes and boundary conditions in detail and is available on the home page of the working group. All codes employ the widely used 'standard k-ε-model' for the turbulence closure but different implementation of the boundary conditions and different numerical schemes are used. PHOENICS was so far only applied to the Göttinger Strasse test case (Figure 2.2.4).
2.2.1.4 Test cases
Several test cases have been defined, ranging from simple 2D cases like a flat plate approached by a homogeneous wind field and the single cavity case over a simple 3D case, to real case exercises. For all cases (except the flat plate) very comprehensive wind tunnel measurements were available. Additionally an extensive field data set exists for the real case. The description of each test case defines exactly the domain and grid sizes as well as the inflow conditions specified by the available experimental data sets. This ensures that all codes run with identical input parameters. The test case descriptions are available from the working group home page. Table 2.2.2: Test cases and available experimental data sets.
Test case 2D / 3D Validation data sets Flat plate 2D - Single cavity 2D wind tunnel: U.Surrey Multiple street canyon 2D wind tunnel: MIHU Surface mounted cube 3D wind tunnel: MIHU/CEDVAL Göttinger Strasse – real case 3D wind tunnel: MIHU, field data: NLÖ Hannover
The flat plate case was designed to compare the implementation of the boundary conditions for solid surfaces in the different codes and is helpful for the interpretation of the differences appearing close to the solid walls in the results of the different codes. A detailed discussion of this case is omitted in this chapter which focuses on the more practical cases. The multiple street canyon case is similar to the single cavity case and for this reason is also omitted in the discussion. In the following sections results of the single cavity, the surface mounted cube and the Göttinger Strasse cases are presented.
2.2.2 Results
2.2.2.1 Single cavity
The single cavity case was defined as the simplest two-dimensional case to investigate the performance of the codes in reproducing the flow field between buildings. Figure 2.2.1-a shows the general flow pattern observed within the cavity and reproduced by the models. The flow within the cavity is dominated by a main re-circulation, while a secondary vortex rotating in the opposite direction is present at the leeward side of the cavity close to the ground. The re-circulation predicted by the models is characterised by mean velocities ranging between −2m/s and 2m/s and the secondary vortex by lower velocities varying between –0.15m/s and 0.15m/s.
Figure 2.2.1-b shows the vertical profile of the u-component at X/W=0.1, 0.5, and 0.9. The numerical results and the measurements for the mean wind field at the different positions within the cavity are overall in a fairly good agreement. Nevertheless, a focussed examination of the profiles close to the solid boundaries (building walls and ground) shows that the models differ in their predictions. The detailed examination of the source code showed that the origin of this difference is mainly the different implementation of the wall function. It is generally observed that two groups of models CHENSI and CFX-TASCflow, on the one hand, and CHENSI-2 and MIMO, on the other hand, following the same wall-function implementation predict very similar velocity values close to the walls and ground. Due to the implementation of the advection scheme and boundary conditions on solid surfaces, MISKAM is probably less accurate in estimating small-scale flow patterns and is therefore mainly dedicated in simulating real-site flows.
The main feature of the intercomparison is that all models predict similar velocity values at locations of weak local flow, e.g. at X/W=0.1, and the comparison with the data is good. On the contrary, at X/W=0.5 and 0.9 where the flow is stronger the discrepancies among the model results are larger. CHENSI and CFX-TASCflow underestimate the velocity close to solid boundaries, while CHENSI-2 and MIMO show better agreement with the data at all examined positions. Therefore, it is suggested
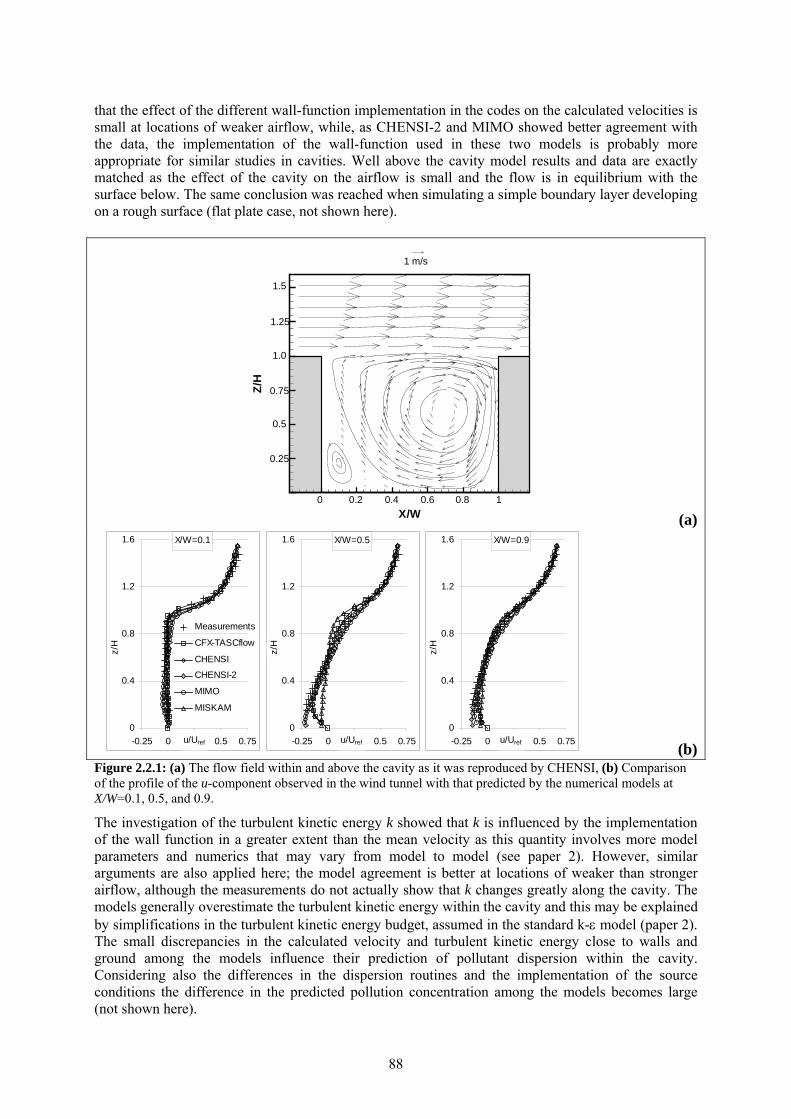
88
that the effect of the different wall-function implementation in the codes on the calculated velocities is small at locations of weaker airflow, while, as CHENSI-2 and MIMO showed better agreement with the data, the implementation of the wall-function used in these two models is probably more appropriate for similar studies in cavities. Well above the cavity model results and data are exactly matched as the effect of the cavity on the airflow is small and the flow is in equilibrium with the surface below. The same conclusion was reached when simulating a simple boundary layer developing on a rough surface (flat plate case, not shown here).
X/W
Z/H
1.5
1.25
1.0
0.75
0.5
0.25
0 0.2 0.4 0.6 0.8 1
1 m/s
(a) X/W=0.1
0
0.4
0.8
1.2
1.6
-0.25 0 0.25 0.5 0.75u/Uref
z/H
Measurements
CFX-TASCflow
CHENSI
CHENSI-2
MIMO
MISKAM
X/W=0.5
0
0.4
0.8
1.2
1.6
-0.25 0 0.25 0.5 0.75u/Uref
z/H
X/W=0.9
0
0.4
0.8
1.2
1.6
-0.25 0 0.25 0.5 0.75u/Uref
z/H
(b) Figure 2.2.1: (a) The flow field within and above the cavity as it was reproduced by CHENSI, (b) Comparison of the profile of the u-component observed in the wind tunnel with that predicted by the numerical models at X/W=0.1, 0.5, and 0.9.
The investigation of the turbulent kinetic energy k showed that k is influenced by the implementation of the wall function in a greater extent than the mean velocity as this quantity involves more model parameters and numerics that may vary from model to model (see paper 2). However, similar arguments are also applied here; the model agreement is better at locations of weaker than stronger airflow, although the measurements do not actually show that k changes greatly along the cavity. The models generally overestimate the turbulent kinetic energy within the cavity and this may be explained by simplifications in the turbulent kinetic energy budget, assumed in the standard k-ε model (paper 2). The small discrepancies in the calculated velocity and turbulent kinetic energy close to walls and ground among the models influence their prediction of pollutant dispersion within the cavity. Considering also the differences in the dispersion routines and the implementation of the source conditions the difference in the predicted pollution concentration among the models becomes large (not shown here).
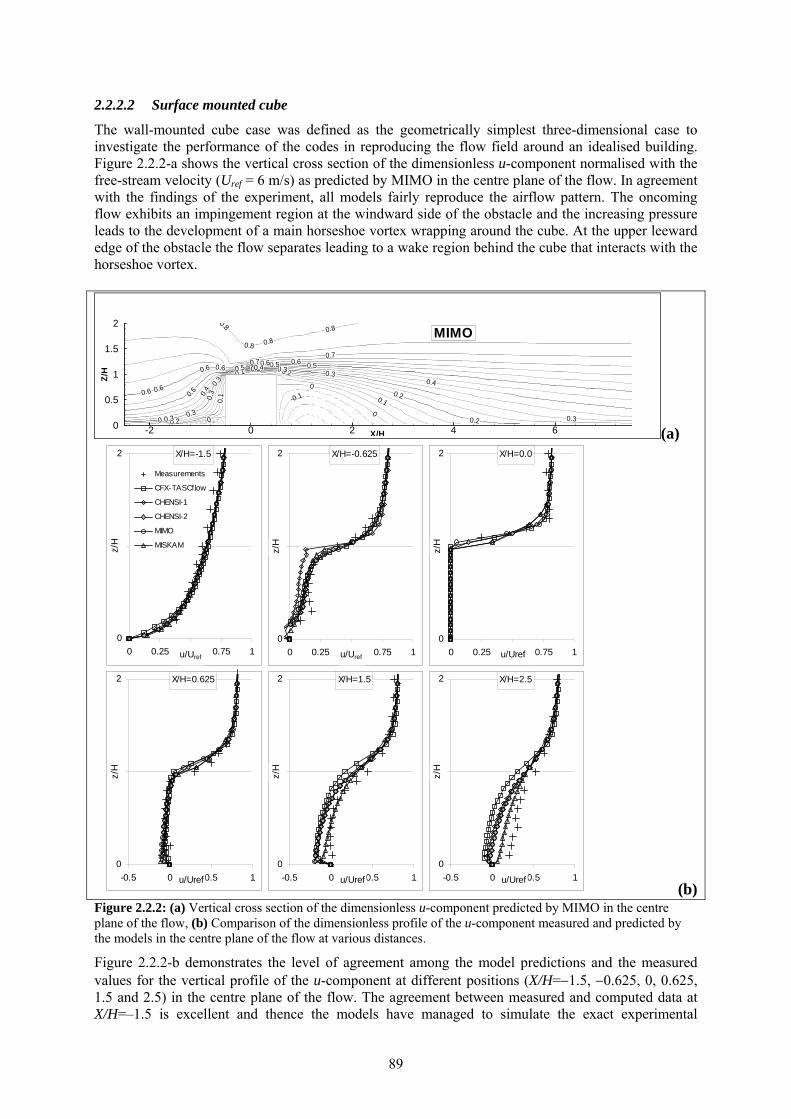
89
2.2.2.2 Surface mounted cube
The wall-mounted cube case was defined as the geometrically simplest three-dimensional case to investigate the performance of the codes in reproducing the flow field around an idealised building. Figure 2.2.2-a shows the vertical cross section of the dimensionless u-component normalised with the free-stream velocity (Uref = 6 m/s) as predicted by MIMO in the centre plane of the flow. In agreement with the findings of the experiment, all models fairly reproduce the airflow pattern. The oncoming flow exhibits an impingement region at the windward side of the obstacle and the increasing pressure leads to the development of a main horseshoe vortex wrapping around the cube. At the upper leeward edge of the obstacle the flow separates leading to a wake region behind the cube that interacts with the horseshoe vortex.
-2 0 2 4 6X/H0
0.5
1
1.5
2
Z/H
-0.1
0
0
0
0.1
0.1
0.1
0.2
0.2
0.2
0.20.30.30.3
0.3
0.3
0.3 0.3 0.3
0.3
0.4
0.4
0.4
0.5
0.5 0.5 0.5
0.6 0.6
0.6 0.60.6 0.60.7
0.7
0.8
0.8 0.8
0.8 MIMO
(a) X/H=-0.625
0
1
2
0 0.25 0.5 0.75 1u/Uref
z/H
X/H=0.0
0
1
2
0 0.25 0.5 0.75 1u/Uref
z/H
X/H=0.625
0
1
2
-0.5 0 0.5 1u/Uref
z/H
X/H=-1.5
0
1
2
0 0.25 0.5 0.75 1u/Uref
z/H
Measurements
CFX-TASCflow
CHENSI-1
CHENSI-2
MIMO
MISKAM
X/H=1.5
0
1
2
-0.5 0 0.5 1u/Uref
z/H
X/H=2.5
0
1
2
-0.5 0 0.5 1u/Uref
z/H
(b) Figure 2.2.2: (a) Vertical cross section of the dimensionless u-component predicted by MIMO in the centre plane of the flow, (b) Comparison of the dimensionless profile of the u-component measured and predicted by the models in the centre plane of the flow at various distances.
Figure 2.2.2-b demonstrates the level of agreement among the model predictions and the measured values for the vertical profile of the u-component at different positions (X/H=−1.5, −0.625, 0, 0.625, 1.5 and 2.5) in the centre plane of the flow. The agreement between measured and computed data at X/H=–1.5 is excellent and thence the models have managed to simulate the exact experimental

90
conditions prevailing upwind of the obstacle. The comparison between the numerical results and the measurements at the other X/H positions shows a good agreement for locations above the cube (e.g. at dimensionless heights Z/H>1). In agreement with observations, all models predict large gradients of the u-component within the near wake area (X/H=0.625). The re-circulation predicted by the models is characterised by mean velocities ranging between –1 m/s and –1.5 m/s. Close to the observed reattachment point in the centre plane (X/H=1.5) all models compute a negative velocity close to the surface indicating that this position is predicted to be still far inside the re-circulation area, thus the models overestimate the reattachment length. This overprediction of the re-circulation in the wake is a feature that standard k-ε models present and, from the air quality point of view, could lead to overestimation of the transport of pollutants at distances farther downstream than in reality.
All models perform similar upstream the obstacle except from CHENSI, which has been generally found to underestimate the velocity at strong local flow regions (Kovar-Panskus et al., 2001). The main reason for this underestimation is the method of implementing the wall functions in this model. Largest differences among the model predictions can be found in the re-circulation zone. Compared to the other models, MISKAM seems not to capture in full the re-circulation, while CFX-TASCflow results show the most extended re-circulation zone. Throughout the whole test case, CHENSI-2 and MIMO predictions lead to similar results as it was also found in the single cavity case.
2.2.2.3 Real street canyon
Figure 2.2.3 shows the airflow in the horizontal plane at z=10m as predicted by the five models within Göttinger Strasse for wind direction 260° from the North, which corresponds to approaching wind nearly perpendicular to the street. Although the aspect ratio of the street, W/H=1.25, would imply that a mean re-circulation should develop within the street for perpendicular wind (Oke, 1987), neither any of the models nor the wind tunnel results showed such a simple flow pattern. Both predicted and measured flows show complicated features mainly characterised by vortices developed at the corners of the buildings as well as air entrainment from the side streets, while the main flow pattern shows a strong flow parallel to the street in its northern part. These features are predicted by all models and generally agree with the wind tunnel observations.
Focusing on the flow pattern in the vicinity of the location of the concentration measurements, the models show some differences mainly in the location of the centre of the vortex produced in this area as well as in the intensity of the flow. These, generally small, differences have a large impact on the calculated concentrations. Figure 2.2.4 shows the normalised concentration ( ) ( )LQHVCC refref=* , where C is the actual concentration, Vref is a scaling velocity (10m/s taken at a reference height of 100m), Href is a scaling height (20m, the average height of the buildings), Q is the source strength and L its length, versus the wind direction. Agreement is found for the general shape of the graph for all codes. However, for specific wind directions the calculated concentration may vary up to a factor 10. The experimental results (wind tunnel and field data) are well in the range of values predicted by the different numerical codes. For wind direction 280°, the predicted C* is in a range of values between 18 and 110, i.e. there is a difference of a factor of 6, even though the general characteristics of the simulated flow were similar. This example illustrates the large difficulty in predicting the pollutant concentration at a location that lies in a region with complex flow patterns and strong gradients. Thus any small difference in the predicted direction of the flow impinging at the measuring location may lead to a large discrepancy among the values predicted by similar codes.
These results suggest that the accuracy of CFD modelling for only one location affected by local gradients should be treated with special care. It is also recommended to experimentalists to avoid monitoring the air quality of streets close to irregularities in the building configuration (intersections, gateways, towers, corners etc.). In addition, as the grid resolution has been always an important issue in CFD modelling, it is expected that it may also explain the discrepancies between model results and data obtained in complex configurations.

91
Wind tunnel
Uref(100m)
200 250
100
120
140
160
180
200
220
240
260
CHENSI-2
Uref(100m)=10 m/s
200 250
100
120
140
160
180
200
220
240
260
TASCflow 200 250
100
120
140
160
180
200
220
240
260
Miskam 4.1200 250
100
120
140
160
180
200
220
240
260
CHENSI
200 250
100
120
140
160
180
200
220
240
260
MIMO
Figure 2.2.3: Flow field in horizontal plane calculated by the CFD models and measured in the wind tunnel (wind direction 260° from the North).
0
20
40
60
80
100
120
0 30 60 90 120 150 180 210 240 270 300 330 360
WIND DIRECTION
C*
U_r
ef=
U(1
00m
), H
=20m
CHENSIMIMOMISKAM 4.1TASCflowPHOENICSField datawind tunnel (detailed model)wind tunnel (numeric structure)
Figure 2.2.4: Normalised concentrations versus the wind direction calculated by 5 CFD codes and measured in the full-scale experimental site and in the wind tunnel.
MonitoringMonitoring site

92
2.2.3 Conclusions
2.2.3.1 TRAPOS contributions to the subject
Improvement and optimisation of the methods used in practical application of traffic pollution models for air quality impact studies is one of the final goals of the TRAPOS network. This CFD intercomparison exercise provided the necessary input for achieving this goal. Several reference cases for CFD-validation were described and are available on the web for users outside TRAPOS. The model validation work within TRAPOS contributed to the refinement of the CFD codes as well as in the way of their application, e.g. the exercise gave input for a new improved MISKAM version.
The results of the model intercomparison indicate that CFD models used by TRAPOS groups properly describe the global flow pattern in the urban atmosphere with simple and complex building arrangements. However, a detailed examination of the model predictions close to the solid boundaries suggested that the implementation of the wall-function influences the calculated velocity values especially at locations where the local flow is strong as was found for the simpler geometrical configurations investigated (single cavity and cube). The effect of the wall-function implementation was also obvious in the more complex case of Göttinger Strasse partly leading to differences in the location of the centre of vortex structures and the intensity of the flow. Consequently the calculated concentration of vehicular exhausts at a location close to building irregularities showed large differences that may reach a factor of 10. In addition, the grid resolution may have its own impact in the discrepancies between model results and data obtained in complex configurations.
It was shown, that the deviations between model results increase with the complexity of the case (referring to the order in Table 2.2.2) and in dependence of the regarded component (u<w<TKE<ε<C)
2.2.3.2 Recommendations for practical models
It is suggested that CFD codes should not be used for a very local purpose (single observation point). The accuracy of the CFD modelling results in complex building configurations for only one location affected by local gradients should be treated with special care. For practical purpose, it is possible that an estimation of averages in time (over different inflow situations) or averages in space (to avoid local gradients) is more appropriate.
For the grid set-up of a building configuration our exercise leads to the following recommendations: 1) For each case a sensitivity study should be done to show the grid independence of the results. 2) The main street should be resolved with at least 10 grid cells, side streets with more than 3 cells. 3) The cube should be resolved with at least 16 cells per dimension. 4) The first grid cell above the ground (or next to a wall) should have a height (or width) of at least 20 times the roughness length z0.
In addition, CFD modelling may be used for recommendations for detecting suitable monitoring sites in order to obtain a representative picture of the air quality in a street canyon. The strong local gradients observed close to irregularities in the building configuration (intersections, gateways, towers, corners etc.) should be avoided, while a variety of measuring positions should be considered.
2.2.3.3 Final Statements
CFD codes are useful tools for microscale air pollution modelling:
(1) to explain characteristics of flow and concentration fields in street canons,
(2) to interpret measurements from wind tunnel and field studies and
(3) to improve parameterised models (e.g. OSPM). Acknowledgements The authors acknowledge the provision of input data by Drs Savory and Kovar-Panskus of the University of Surrey and Chauvet, Liedke and Schatzmann of the University of Hamburg and Dr. Müller of the State Environmental Agency of Lower Saxony (NLÖ Hannover). Computer support was given to the French team by the Scientific Council of Institut de Développement et de Recherche pour l’Informatique Scientifique -IDRIS- (CNRS), Orsay, France.

93
References Cham (2001): PHOENICS. Cham, Bakery House, 40 High Street, Wimbledon Village,
London SW 19 5AU, UK. Ehrhard J., Khatib I.A., Winkler C., Kunz R. Moussiopoulos N. and Ernst G.: 2000, The
microscale model MIMO: development and assessment, J. of Wind Engineering and Industrial Aerodynamics, 85, pp. 163-176.
Eichhorn, J. (1996): Validation of a Microscale Pollution Dispersal Model. In: Air Pollution Modelling and Its Application IX, Plenum Press, New York & London, pp. 539-548.
Guilloteau E.: 1999, Modélisation des sols urbains pour les simulations de l'atmosphère aux échelles sub-meso, PhD thesis, University of Nantes - Ecole Centrale de Nantes, France.
Kovar-Panskus, A., Louka, P., Mestayer, P.G., Savory, E., Sini, J.-F. and Toy, N.: 2001, Influence of geometry on the flow and turbulence characteristics within urban street canyons – Intercomparison of wind tunnel experiments and numerical simulations, Proceedings of the 3rd International Conference on Urban Air Quality, 19-23 March, 2001, Loutraki, Greece.
Oke., T.R. (1987), Boundary Layer Climates – 2nd edition, Methuen, UK. Raw, M.J., Galpin, P.F. and Hutchinson, B.R.: 1989, A collocated finite-volume method for
solving the Navier-Stokes equations for incompressible and compressible flows in Turbomachinery: Results and applications, Canadian Aeronautics and Space Journal 35, pp. 189-196.
Sini, J.-F., Anquetin S. and Mestayer P.G.: 1996, Pollutant dispersion and thermal effects in urban street canyons, Atmos. Environ. 30, pp. 2659-267.7
URL1: CFD working group; http://www.dmu.dk/AtmosphericEnvironment/Trapos/cfd-wg.htm

94
Chapter 3
Model Evaluation - "Podbielsi Exercise"

95
3.1 Comparison of concentration predictions, done by different modellers for the same street canyon (Podbi-Exercise)
W. Bächlin1, W.J. Müller2, Berkowicz3, R., M. Ketzel3, A. Gamez4, G. Clai4 and A. Lohmeyer4
1 Lohmeyer Consulting Engineers (LOH), An der Rossweid 3, D-76229 Karlsruhe, Germany
2 Lower Saxony State Agency for Ecology (NLOE), Goettinger Strasse 14, D-30449 Hannover, Germany 2National Environmental Research Institute, DK-4000 Roskilde, Denmark
4 Lohmeyer Consulting Engineers (LOH), Mohrenstrasse 14, D-01445 Radebeul, Germany
Keywords: traffic, air pollution, emission modelling, dispersion modelling, ring test, quality assurance, harmonisation, Environmental Impact Assessment, operational models, Podbi-Exercise.
3.1.1 Introduction
For many Environmental Impact Analyses street level pollution modelling has to be done. The models have to be quality assured, this includes the demand, that the result of a calculation must not depend on the model used. But even if several persons use the same model, they will not get the same result as shown, for example, in the EMU project (Robins et al., 2000). The present contribution describes the “Podbi Exercise”, where different persons of several institutions used different models (the operational models they normally use in their institutions) to predict the concentrations in the street canyon Podbielskistrasse (Podbi) in Hannover. The aim was, to get hints of the magnitude of the variation in the results and in the procedures, and also clues on how to improve the situation, because the same air pollution limit values are established all over the European Union but the procedures to predict these air pollutions are different and there is only weak information about the variations in the results.
3.1.2 Procedure
The comparison was done for an existing street canyon with heavy traffic, where no concentration measurements existed but where measurements were intended to be executed. Input data like traffic parameters, meteorology and background concentrations were known in a quality, as usual for practical projects to be done within a limited time but it was scheduled to do additional measurements. The exercise was done in 2 phases. Phase 1: The participants did the calculations with the input data, available at the beginning of the project. They did not know each other and did not know the results of each other. After evaluation of the results, all participants met in a workshop and compared their procedures and results. They got informations about the results of higher quality additional meteorological and traffic parameter measurements and the first preliminary results of the concentration measurements in the field, all done by the Lower Saxony State Agency for Ecology (NLOE). Phase 2: The participants repeated the calculations, using the updated informations and the increase of knowledge gained during the workshop. These results were evaluated and then discussed during a second workshop.
The invitation to take part in the exercise was published in several German journals, announced in the internet and during several conferences. At first it was thought to do the exercise in the German speaking modeller community with all data and communications in German, but on the basis of TRAPOS as a platform, a couple of months later an additional comparison on an English language basis was done at an European scale. All together 24 modellers of different European countries, working for different companies universities, and agencies took part, they are listed in alphabetical order in Table 3.1.1.
The following pages only deal with that first (mean “German speaking group”), which is finished now. 11 institutions took part (6 of them being members of the TRAPOS network), they used 14 different dispersion models. Three participants used wind tunnel measurements and 11 used numerical models. Seven different numerical models were used.

96
Tab. 3.1.1: List of all participants of the Podbielski Street Exercise, arranged in alphabetical order. Participant Established in ANECO Inst. für Umweltschutz GmbH & Co Mönchengladbach, Germany Aristotle University of Thessaloniki, LHTEE/AUT Thessaloniki, Greece Brno University of Technology, Mechanical Engineering Brno, Czech Republic Cambridge Environmental Research Consultants Ltd (CERC) Cambridge, UK Datculescu Octavian, Romanian Auto Register, Research Department, Air Pollution Compartment Bucharest, Romania Environmental Research Laboratory, NRCPS "Demokritos" Athens, Greece Hesek, Ferdinand ?, Slovak Republic IBS Ingenieurbüro für Umweltschutz und Strömungstechnik Prof. Dr.-Ing. habil. R. Schenk GmbH Halle, Germany Ingenieurbüro Dr.-Ing. Achim Lohmeyer Karlsruhe/Dresden, Germany Ingenieurbüro Dr.-Ing. W. Theurer Speyer, Germany IVU Umwelt GmbH Sexau, Germany Landesumweltamt NRW Essen, Germany M.A.S. GbR Groß-Zimmern, Germany National Environmental Research Institute (NERI) Roskilde, Denmark Reynolds, Anthony, Trinity College Dublin, Ireland Russian State Hydrometeorological University, Meteorology, Climatology and Atmosphere Protection Department S. Petersburg, Russia Technische Universität Dresden, Institut für Luft- und Raumfahrttechnik Dresden, Germany University Hamburg, Meteorological Institute Hamburg, Germany Vito, Centre for Remote Sensing and Atmospheric Processes Mol, Belgium Zentralanstalt für Meteorologie und Geodynamik ZAMG Wien, Austria
At the beginning of the study, the input parameters, necessary for the exercise, were available in the internet (http://www.lohmeyer.de/modellvergleicheng/) together with forms for a structured submitting of the results for a summarising evaluation by Lohmeyer Consulting Engineers (LOH), the co-ordinator. The participants of the exercise were asked to calculate the annual means of benzene, soot and NO2 as well as the 98-percentile of NO2. But they were not only asked for the final results (the concentrations) but also for the results of the single phases to come to these final results as for example applied emission factors, details of model set up and procedure, calculated dilution factors etc., see below. Additional data, available in the course of the exercise and a section for the latest news was available in the internet. It took nearly 2 years from the provision of the data for phase 1 in the internet (Jan. 1999) to the presentation of the final report of the exercise in Nov. 2000. For the full report of the German speaking group, participating institutions and models used, but without correlation between institution, model and result, see Baechlin et al. (2000), downloadable from the publications section in http://bwplus.fzk.de. The full report of the “European Group” will probably be available starting in August 2001 (Bächlin et al., 2001).
3.1.3 Results
The participants had no serious variations in their input concerning meteorological data and background concentration, as these data were given as an input.
Determination of the emission of the streets was already more difficult. To do that, one needs the traffic volume. As input data for phase 1 the results of traffic counts were given, done in the period 1987 - 1995 between 6.30 o’clock AM and 6.30 o’clock PM. For the average daily traffic volume in 1999, some of the participants just used the number as it was given, others increased the number to account for the fact, that the counting was only done for a limited number of hours during the day, some participants even increased the number to account for the fact, that the counting was done some years ago and the concentration prediction had to be done for 1999. Thus the traffic volume, used by the participants, ranged from ca 16 000 to nearly 25 000 vehicles/day, that is a difference of ca 50%. Another number needed is the emission factor of the vehicles, that is the air pollutant emission per VKT (vehicle and kilometre travelled). As an example see in Fig. 3.1.1 the numbers used by the participants for the benzene emission factors for passenger cars, they range from less than 0.02 g/VKT up to more than 0.06 g/VKT, a difference of more than a factor of 3.

97
Another difference concerning the emissions occurred for example in their representation in the models. Some of the numerical models contain 3 dimensional digital models of the built up area under consideration where the emissions of the Podbielskistrasse and of 2 adjacent streets (Ferd.-Wallbrecht-Strasse and Boedeckerstrasse) had to be represented.
0.00
0.01
0.02
0.03
0.04
0.05
0.06
0.07
1a 1b 2a 2b 3a*
3b*
4a 4b 5a 5b 6a 6b 7a 7b 8a 8b 9a*
9b*
10a*
10b* 11a
11b
13a*
13b* 14a
14b
15a*
Participant (no modification for phase 2)
Emis
sion
Fac
tor [
g/(V
KT)
]
0
50
100
150
200
250
300
350
1 2 3 4 5 6 7 8 9 10 11 13 14 15
Participant
Leng
th [m
]
Podbielskistraße Ferd.-Wallbrecht-Straße Bödeckerstraße Fig. 3.1.1 Benzene emission factors used by the participants, a = phase 1, b = phase 2.
Fig. 3.1.2 Source lengths, represented in the digital building models.
Fig. 3.1.2 shows that this was done in different ways: to determine the additional concentration by the street, where
ctotal = cadditional by street + cbackground
some participants represented Podbielskistrasse in their models with lengths of less than 150 m, another participant with a length of nearly 300 m, that is more than a factor of 2 difference. The other streets were also represented with different lengths, some models only consider Podbielskistrasse itself.
Large variations showed up in the dilution, calculated by the participants between the emission on the road and the monitoring station on the pedestrian walkway. It was asked to hand in the dimensionless concentration c* at the position of the monitoring station as a function of the wind direction. The parameter c* is defined as c*=c⋅u100⋅H/q with c= concentration, u100= windspeed 100 m above ground, H= building height = 25m as a convention for this exercise and q= emission density. Fig. 3.1.3 shows the results. Large variations can be noticed between the participants, for the wind directions where the highest concentrations occur, there a factor of 4 between the lowest and highest values can be noticed. As described above, all the single phases and procedures of the participants were investigated before the evaluation of the calculated total concentrations was made, which was compared among the participants and also to the results of the field measurements. An example for the results is given with Fig. 3.1.4 for the annual mean of benzene and Fig. 3.1.5 for the annual mean of NO2. For benzene, after phase 1, the difference in the predictions of the additional concentration is up to a factor of 3, which is unexpectedly low, compared to the differences, seen in the single phases towards the final result of the calculation. After phase 2 the difference reduces to a maximum of a factor of 1.5 with values for the total concentration between 4 and 6 μg/m3 which is well inside the confidence interval of the field measurements. For NO2, after phase 1, the difference in the predictions for the total concentration is up to a factor of 2.5 but mainly by the results of 2 of the participants, after phase 2 the difference reduces to a maximum of a factor of 1.5, and it would be far less than that without one of the participants who predicted the highest value. This participant is outside the confidence interval of the field measurements but the other participants are well inside.

98
0
20
40
60
80
100
120
140
160
180
200
0 50 100 150 200 250 300 350 400
Wind direction
c* [c
*u*H
/q]
1 2 4 5 6 7 8 9 10 13 14 Fig. 3.1.3: Variations of the c* values (dilution parameters) applied by the participants.
Con
cent
ratio
ns [µ
g/m
3]
0
1
2
3
4
5
6
7
8
9
1 12 23 4 46 68 89 1 1 1 11 3 1 4 1 41 5P a r t ic ip a n t
E s tim a ted ran ge o f un ce rta in ty o f fie ld m ea su re m en ts
P h a s e 1 P h a s e 2
Field measurements
Fig. 3.1.4: Comparison of the calculated annual mean of the total concentration for benzene to each other and to the results of the field measurements. Lower part of columns are the background concentrations taken into account

99
P a r t ic ip a n t12 24 46 67 78 89 1 1 1 11 3 1 4 1 4
0
1 0
2 0
3 0
4 0
5 0
6 0
7 0
8 0
9 0C
once
ntra
tions
[µg/
m3]
E s tim a ted ran ge o f un ce rta in ty o f fie ld m e asu re m en ts
1
Fig. 3.1.5: Comparison of the calculated annual mean of the total concentration for NO2 to each other and to the results of the field measurements. Lower part of columns are the background concentrations taken into account. Participant 11 delivered no values for background concentration. 3.1.4 Conclusions
Concentrating on the points in the street canyon, which are the hardest to handle but which are the points to consider for the execution of the EU Air Quality Directives, the exercise showed:
− there is no standard procedure how to do this kind of street level pollution modelling,
− the use of different tools for the different steps yields different results,
− it is important who does the modelling and how, even for a given model,
− for the emission modelling (NOx, benzene and soot) the results differ by a factor of 3,
− for the dispersion modelling the results (c* values) differ for the wind directions with the highest concentrations by a factor of 4,
− the results for the total concentrations yield variations by a factor up to 2 or 3. These final differences of the prediction of the total concentrations at the points under consideration are less than expected on the basis of the variations in the emission- and dispersion modelling,
− the quality of the calculated concentrations depends on the quality of the input data.
Based on these findings we recommend:
− Not only the final results of the determination of the concentrations are important, but also the results of the emission- and dispersion modelling should be consistent for the different participants. The participants should continue their collaboration to find out the reason for the variances in the emission- and dispersion modelling and they should work on a reduction of these variances. May be more guidance has to be given to do that sort of prediction and standardisation might also be needed.
− The results of concentration modelling should not be given as a fixed number but with a range of uncertainty. Guidance has to be developed and introduced how to quantify that uncertainty.
− Modellers (incl. scientists) should take part in ring tests such as Podbi - Exercise.

100
− Authorities might support that last point by introducing into calls for tenders as condition, that they will accept only offers of institutions which took part in such ring tests. Additionally they may request the proof of the existence of a kind of internal “Standard Operation Procedure”, as it has to exist for example in certified institutions, operating monitoring stations.
Acknowledgements The authors wish to express their appreciation for support from TRAPOS, but also from NLOE, the Lower Saxony State Agency for Ecology and BWPLUS, the research program “Lebensgrundlage Umwelt und ihre Sicherung” of the State of Baden-Wuerttemberg, and they thank to the participants of the exercise, who all took part without external founding. References Bächlin, W., W.J. Müller und A. Lohmeyer (2000): Vergleich von Modellanwendungen zur
Berechnung von Immissionswerten innerhalb eines beidseitig bebauten Strassenquerschnitts. Report BWE 99002, BWPLUS 297007. BWPLUS, Forschungszentrum Karlsruhe, D 76021 Karlsruhe. Available at http://bwplus.fzk.de.
Robins, A.G., Hall, R.,Cowan, I.R., Bartzis, J.G. and Albergel, A. (2000): Evaluating modelling uncertainty in CFD predictions of building affected dispersion. Int. J. Environment and Pollution, Vol. 14, Nos. 1-6, 52-64.
Bächlin, W., W.J. Mueller und A. Lohmeyer (2001): Comparison of the procedures of different modellers for air pollutant concentrations prediction in a street canyon- The Podbi-Exercise. See www.Lohmeyer.de, click “Literatur” there.

101
Chapter 4
Concluding Remarks


103
4.1 Concluding Remarks
Participation in the Network has significantly contributed to strengthening the collaboration among the Participants. Although all of the teams in the network represented the most experienced European groups in their field of research, none of the teams covered all of the necessary different aspects of air pollution modelling by themselves. Experimental data from laboratory and field measurements were used by groups working mainly with the theoretical aspects while the experience in advanced computational methods helped the experimentalists in designing the experiments and interpretation of the results. Of particular importance was the exchange of experience and working contacts between the groups operating mainly in the field of research (universities) and the teams having their experience in regulatory applications of air pollution models (consulting companies, governmental agencies).
Beside the regular meetings, the contact between the Participants and exchange of information was continuously maintained by electronic post. Several short visits of scientific staff members to another Participant were organised either for exchange of information, to conduct an experiment or for preparation of a publication.
The members of the TRAPOS team have participated in the majority of the international conferences devoted to problems of air pollution or fluid dynamics. Several of the TRAPOS meetings and workshops were organised joint with these events.
The young visiting researchers employed within the TRAPOS were fully integrated within the Network teams and were actively participating in their work. The Network held frequent working meetings and seminars where the results of the joint work were presented and discussed. Establishment of the Working Groups has significantly contributed to consolidation of the joint work within the Network. Specially dedicated web-sites, with presentation of the results and conclusions, have been established by several of these groups (http://www.dmu.dk/AtmosphericEnvironment/trapos/wg.htm).
The goals of training of young visiting researchers were achieved mainly trough participation of these researchers in the work of the hosting teams and within the Working Groups. The young researchers were encouraged to participate in international meetings and workshops where they have presented results of their work within TRAPOS. The co-operation established between the TRAPOS teams, and especially between the group of the visiting young scientist, will certainly contribute to strengthening of the European research activities on the subject of traffic pollution and related aspects. The young scientists active within the Network represent the majority of the European Community Member States and there is no doubt that this co-operation will continue after the end of the Network project. Several of the visiting researchers continue now their professional career within a team of the TRAPOS group and they also have actively participated in preparation of new network proposals.
The work within the TRAPOS Network was focused on few selected subjects. A large number of laboratory wind-tunnel experiments was conducted, which provided data used for verification of numerical models. Several computational codes were compared with wind tunnel and field experiments. An extensive model intercomparison exercise has contributed to illustrate these models performance and to point out the needs for improvement. Some special phenomena affecting pollution dispersion in streets, such as, traffic produced turbulence and wall heating, have been investigated in details and their implementation for practical modelling elaborated. Laboratory and field data collected for these studies will constitute basis also for the future work on this subject.
The co-operation established between the TRAPOS teams, and especially between the group of the visiting young scientist, will certainly contribute to strengthening of the European research activities on the subject of traffic pollution and related aspects.

104
Chapter 5
Abstracts Prepared for the Third International Conference on Urban Air
Quality, Loutraki, Greece, March 2001

105
The abstracts submitted by members of TRAPOS to the Urban Air Quality conference in Loutraki, Greece, March 2001 are listed below. The extended abstracts are available at http://www2.dmu.dk/AtmosphericEnvironment /trapos/abstracts/loutraki.htm or in a pdf file below.
R. Berkowicz: The European Research Network TRAPOS - Results and achievements (http://www.dmu.dk/AtmosphericEnvironment/trapos/abstracts/Berkowicz_1.pdf)
Berkowicz_1.p
A. J. Gámez, I. Düring, R. Bösinger, P. Rabl, A. Lohmeyer: Determination of the 99.8-Percentile of NO2 Concentrations and PM10 Emissions for EIA Studies (http://www.dmu.dk/AtmosphericEnvironment/trapos/abstracts/Gamez.pdf) Gamez.pdf
A. Kovar-Panskus, P. Louka, J-F. Sini, E. Savory, M. Czech, A. Abdelqari, P.G. Mestayer, N. Toy: Influence of Geometry on the Flow and Turbulence Characteristics Within Urban Street Canyons - Intercomparison of Wind Tunnel Experiments and Numerical Simulations (http://www.dmu.dk/AtmosphericEnvironment/trapos/abstracts/Kovar_1.pdf)
Kovar_1.pdf
A. Kovar-Panskus, L. Moulinneuf, E. Savory, A. Abdelqari, J-F. Sini, J-M. Rosant,, A. Robins, N. Toy: The Influence of Solar-Induced Wall Heating on the Flow Regime within Urban Street Canyons (http://www.dmu.dk/AtmosphericEnvironment/trapos/abstracts/Kovar_2.pdf)
Kovar_2.pdf
M. Schatzmann, H. Frantz, B. Leitl, W.J. Müller: DO FIELD DATA REPRESENT THE TRUTH ? (http://www.dmu.dk/AtmosphericEnvironment/trapos/abstracts/Schatzmann.pdf)
Schatzmann.pd

106
P. Sahm, P. Louka, M. Ketzel, E. Guilloteau, J-F. Sini: Intercomparison of Numerical Urban Dispersion Models - Part I: Street Canyon and Single Building Configurations (http://www.dmu.dk/AtmosphericEnvironment/trapos/abstracts/Sahm.pdf)
Sahm.pdf
M. Ketzel, P. Louka, P. Sahm, J.-F. Sini, N. Moussiopoulos: Intercomparison of Numerical Urban Dispersion Models - Part II: Street Canyon in Hannover, Germany (http://www.dmu.dk/AtmosphericEnvironment/trapos/abstracts/Ketzel.pdf)
Ketzel.pdf
G. Vachon, P. Louka, J-M. Rosant, P.G. Mestayer, J-F. Sini: Measurements of Traffic-Induced Turbulence within a Street Canyon during the Nantes '99 Experiment (http://www.dmu.dk/AtmosphericEnvironment/trapos/abstracts/Vachon.pdf)
Vachon.pdf
P. Louka, G. Vachon, J-F. Sini, P.G. Mestayer, J-M. Rosant: Thermal Effects on the Airflow in a Street Canyon - Nantes '99 Experimental Results and Model Simulation (http://www.dmu.dk/AtmosphericEnvironment/trapos/abstracts/Louka.pdf)
Louka.pdf
P. Kastner-Klein, M. W. Rotach: Parameterization of Wind and Turbulent Shear Stress Profiles in the Urban Roughness Sublayer (http://www.dmu.dk/AtmosphericEnvironment/trapos/abstracts/Kastner_1.pdf) Kastner_1.pdf
P. Kastner-Klein , R. Berkowicz, E. Fedorovich: Evaluation of Scaling Concepts for Traffic-Produced Turbulence Based on Laboratory and Full-Scale Concentration Measurements in Street Canyons (http://www.dmu.dk/AtmosphericEnvironment/trapos/abstracts/Kastner_2.pdf)
Kastner_2.pdf

107
R. Berkowicz, M. Ketzel, G. Vachon, P. Louka, J-M. Rosant, P.G. Mestayer, J-F. Sini: Examination of Traffic Pollution Distribution in a Street Canyon Using the Nantes'99 Experimental Data and Comparison with Model Results Berkowicz_1.pdf(http://www.dmu.dk/AtmosphericEnvironment/trapos/abstracts/Berkowicz_2.pdf)
Berkowicz_2.p
O. Le Bihan, M. Ketzel, P. Wåhlin, F. Palmgren, R. Berkowicz: Application of Dispersion Modelling for Analysis of Particle Pollution Sources in a Street Canyon (http://www.dmu.dk/AtmosphericEnvironment/trapos/abstracts/LeBihan.pdf)
LeBihan.pdf
P. Wåhlin, F. Palmgren, R. van Dingenen: Source Apportionment and Size Characterisation of Aerosol Particles Measured in a Copenhagen Street Canyon (http://www.dmu.dk/AtmosphericEnvironment/trapos/abstracts/Waahlin.pdf) Waahlin.pdf
R. Britter, F. Caton, K. Cooke, S. Di Sabatino, P. Simmonds, G. Nickless: Results from three field tracers experiments at the neighbourhood scale in the city of Birmingham UK (http://www.dmu.dk/AtmosphericEnvironment/trapos/abstracts/CERC_1.htm)
CERC_1.pdf
C. Ratti, S. Di Sabatino, F. Caton, R. Britter, M. Brown, S. Burian: Analysis of 3-D urban databases with respect to pollution dispersion for a number of European and American cities (http://www.dmu.dk/AtmosphericEnvironment/trapos/abstracts/CERC_2.htm)
CERC_2.pdf
C. Chauvet, B. Leitl, M. Schatzmann: High Resolution Flow Measurements in an Idealised Urban Street Canyon (http://www.dmu.dk/AtmosphericEnvironment/trapos/abstracts/Chauvet.pdf) Chauvet.pdf
B. Leitl, C. Chauvet, M. Schatzmann: Effects of Geometrical Simplification and Idealization on the Accuracy of Microscale Dispersion Modelling (http://www.dmu.dk/AtmosphericEnvironment/trapos/abstracts/Leitl.pdf) Leitl.pdf
S. Henne, B. Leitl, M. Schatzmann: Windtunnel Studies on Traffic Produced Turbulence and its Influence on Pollution Dispersion in an Urban Street Canyon (http://www.dmu.dk/AtmosphericEnvironment/trapos/abstracts/Henne.pdf) Henne.pdf

108
Chapter 6
Reference list of papers published during TRAPOS

109
Abdelqari, A, Savory, E., Mestayer, P.G. and Sini, J-F. 1998: Experimental investigation of the interaction between a backward-facing step flow and large turbulent structures, submitted to Flow, Turbulence & Combustion.
Berkowicz, R., Ketzel, M., Vachon, G., Louka, P., Rosant, J-M., Mestayer, P.G. and Sini, J-F. (2001): Examination of Traffic Pollution Distribution in a Street Canyon Using the Nantes'99 Experimental Data and Comparison with Model Results, submitted to International Journal on Water, Air and Soil Pollution
Britter, R.E., Caton, F., Cooke, K.E, Di Sabatino, S., Simmonds, P.G. and Nickless, G. (2001): Results from three field tracers experiments at the neighbourhood scale in the city of Birmingham, UK. Submitted to Int J of Water, Air and Soil Pollution.
Clai, G., Berkowicz, R., Düring, I., Ketzel, M., Lohmeyer, A., Moussiopoulos, N. and Papalexiou, S. (2000) Proposal for the calculation of the high percentiles of NO2 concentrations, necessary for the execution of EU Directive 1999/30/EC". Accepted for publication in IJEP Journal, to appear in 2001.
Czech, M., Savory, E., Toy, N. and Mavrides, T. (2001) “Flow regimes associated with yawed rectangular cavities”, Aeronautical Journal, 105, 125-134.
Di Sabatino, S., Kastner-Klein, P., Berkowicz, R., Britter, R., Fedorovich, E. (2001): The modeling of turbulence from traffic in urban dispersion models – Part I: Theoretical considerations. Prepared for submission to Atmospheric Environment
Guilloteau, E., and Mestayer, P.G. (2000) Numerical simulations of the urban roughness sub-layer: a first attempt. Environmental Monitoring and Assessment, 65, 211-219.
Kastner-Klein, P., and Fedorovich, E. (2000) Diffusion from a line source deployed in a homogeneous roughness layer: interpretation of wind tunnel measurements by means of simple mathematical models. Accepted pending revisions in Atmospheric Environment.
Kastner-Klein, P., Berkowicz, R. and Plate, E.J. (2000) Modelling of vehicle induced turbulence in air pollution studies for streets. Accepted in Int. J. of Environmental Technology and Management.
Kastner-Klein, P., Fedorovich, E., Sini, J-F. and Mestayer, P.G. (2000) Experimental and numerical verification of similarity concept for dispersion of car exhaust gases in urban street canyons. Environmental Monitoring and Assessment, 65, 353-361.
Ketzel, M., Berkowicz, R. and Lohmeyer, A. (2000): Comparison of Numerical Street Dispersion Models with Results from Wind Tunnel and Field Measurements. Environmental Monitoring and Assessment, Volume 65, Issue 1/2, pp. 363-370.
Ketzel, M., Louka, P., Sahm, P.,. Sini, J-F. and Moussiopoulos, N. (2001): Intercomparison of numerical urban dispersion models - Part II: street canyon in Hannover, Germany. Proc 3rd Int Conf on Urban Air Quality, Loutraki, Greece, March 2001, Submitted for publication in International Journal on Water, Air and Soil Pollution.
Kovar-Panskus, A., Louka, P., Sini, J-F., Savory, E., Abdelqari, A., Mestayer, P.G, and Toy, N, (2001) “Influence of geometry on the flow and turbulence characteristics within urban street canyons – comparison of wind tunnel experiments and numerical simulations”, Submitted for publication in International Journal on Water, Air and Soil Pollution.
Kovar-Panskus, A., Moulinneuf, L., Savory, E., Abdelquari, A., Sini, J-F., Rosant, J-M., Robins, A., and Toy, N. (2001) “A wind tunnel investigation of the influence of solar-induced wall-heating on the flow regime within a simulated urban street canyon”, Submitted for publication in International Journal on Water, Air and Soil Pollution.
Lataste, J. (Vyhnalikova), Huilier, D, Burnage, H. and Bednar, J. 1999, ‘On a shear lift force acting on heavy particles in a turbulent boundary layer', submitted to Atmospheric Environment.

110
Lataste, J. (Vyhnalikova), Huilier, D., Burnage, H. and Bednar, J. 1999, ‘Behaviour of heavy particles in a boundary layer: Simulation of the take-off phenomena', Boundary-Layer Meteorology, accepted.
Lataste, J. and Rotach, M.W.: 1999, ‘On modelling atmospheric aerosol dispersion using Lagrangian stochastic models’, Submitted to the Journal of Environmental Monitoring and Assessment.
Le Bihan, O., Ketzel, M., Wåhlin, P., Palmgren, F. and Berkowicz, R. (2001): Application of Dispersion Modelling for Analysis of Particle Pollution Sources in a Street Canyon, Submitted for publication in International Journal on Water, Air and Soil Pollution.
Lohmeyer, A., Baechlin, W. and Ketzel, M. (2000): The Draft of the New German Guideline VDI 3782/8 to Model Automobile Exhaust Dispersion. Environmental Monitoring and Assessment, Volume 65, Issue 1/2, pp. 381-387.
Louka, P., Belcher, S.E., Harrison, R.G. (2000) Coupling between airflow in streets and the well-developed boundary layer aloft. Atmos. Env. 34, 2613-2621.
Ratti, C., Di Sabatino, S., Caton, F., Britter, R.E., Brown, M. and Burian, S. (2001): Analysis of 3-D urban databases with respect to pollution dispersion for a number of European and American cities. Submitted to Int J. of Water, Air and Soil Pollution.
Sahm, P., Louka, P., Ketzel, M., Guilloteau, E. and Sini, J-F.: 2001, ‘Intercomparison of numerical urban dispersion models – Part 1: Street canyon and single building configurations’, Submitted for publication in International Journal on Water, Air and Soil Pollution.
Savory, E. and Abdelqari, A. (2000) The effect of large-scale turbulent structures on a simple two-dimensional canyon type flow, Environmental Monitoring and Assessment, 65, 397-405.
Savory, E. and Abdelqari, A. 1999: The effect of large-scale turbulent structures on a simple 2-D canyon-type flow. Environmental Monitoring and Assessment, Volume 65, Issue 1/2, pp. 397-405.
Vachon, G., Louka, P., Rosant, J-M., Mestayer, P. and Sini, J-F. 2001: Measurements of traffic-induced turbulence within a street canyon during the Nantes’99 experiment, Submitted to the Journal of Water, Air and soil Pollution.
Vachon, G., Rosant, J-M, Mestayer, P.G. Louka, P., Sini, J-F., Delaunay, D., Antoine, M-J., Ducroz, F., Garreau, J., Griffiths, R., Jones, C., Lorin, Y., Molle, F., Péneau, J-P., Tétard, Y. and Violleau, M. (2000) Experimental investigation of pollutant dispersion within a street in low wind conditions, Submitted to the International Journal of Vehicle Design.
Vyhnalikova, J., Huilier, D. and Burnage, H. 1998, Etude numérique de la dispersion des particules lourdes dans une couche limite turbulente, Comptes Rendus de l'Académie des Sciences, 326, Série II b, 103-110.

111
Appendix I
Participants
112
PARTICIPANT SCIENTIST IN CHARGE
National Environmental Research Institute (NERI)
Berkowicz, Ruwim, Department of Atmospheric Environment, Roskilde, DK Tel.: +45 46301150 Fax.: +45 46301214 e-mail: [email protected]
University of Surrey (U.Surrey)
Savory, Eric, Fluid Mechanics Research Group, Guildford, GB Tel.: +44 1483300800x2221 Fax.: +44 1483450984 e-mail: [email protected]
University of Karlsruhe (U.Karlsruhe)
Jirha, Gerhard H, Institut für Hydromechanik, Karlsruhe, DE Tel.: +49 7216082200 Fax.: +49 721/661686 e-mail: [email protected]
Swiss Federal Institute of Technology (ETHZ)
Rotach, Mathias, Institute for Atmospheric and Climate Science ETH, Zürich, CH Tel.: +41 16355222 Fax.: +41 13625197 e-mail: [email protected]
Ecole Centrale de Nantes (ECN)
Mestayer, Patrice, Fluid Mechanics Laboratory, Nantes, FR Tel.: +33 240371678 Fax.: +33 240747406 e-mail: [email protected]
Ingenieurbüro Dr.-Ing. Achim Lohmeyer (IBAL)
Lohmeyer, Achim, Radebeul, DE Tel.: +49 351839140 Fax.: +49 3518391459 e-mail: [email protected]
Aristotle University Thessaloniki (LHTEE/AUT)
Moussiopoulos, Nicolas, Dept. of Mechanical Engineering, Thessaloniki, GR Tel.: +30 31996011 Fax.: +30 31996012 e-mail: [email protected]
Cambridge Environmental Research Consultants Ltd. (CERC)
Carruthers, David, Cambridge, GB Tel.: +44 1223357773 Fax.: +44 1223357492 e-mail: [email protected]
TNO Institute of Environmental Sciences (TNO)
Builtjes, P.J.H., Department of Environmental Quality, Apeldoorn, NL Tel.: +31 555493038 Fax.: 31 555419837 e-mail: [email protected]
University of Hamburg (MIHU)
Schatzmann, Michael, Meteorological Institute, Hamburg, DE Tel.: +49 4041235090 Fax.: +49 4041173350 e-mail: [email protected]

113
Appendix I
Young Visiting Researchers appointed by TRAPOS

114
Appendix II
Young visiting researchers that have been appointed by TRAPOS.
Name Nationality Appointed by Start date Duration in months
Silvana Di Sabatino IT CERC February 1999 27 Petroula Louka GR ECN January1999 22 Petra Kastner-Klein DE ETHZ May 1999 20 Jana Lataste CZ ETHZ September
1998 6
Giulia Clai IT IBAL June 1999 12 Frank Peacock GB IBAL July 2000 1.5 Antonio Gamez ES IBAL October 2000 7 Peter Sahm DE LHTEE February 1998 33 Emmanuel Le Huu Nho FR MIHU February 1999 10 Christian Chauvet FR MIHU, LHTEE March 1999 23 Sandrine Aubrun FR MIHU November 2000 6 Matthias Ketzel DE NERI September
1998 24
Olivier Le Bihan FR NERI April 2000 13 Jose Ribeiro PT U.Karlsruhe February 1999 11 Emmanuel Guilloteau FR U.Karlsruhe October 1999 10 Alexis Madrange FR U.Karlsruhe July 1999 3 Macciacchera Illic Umberto
IT U.Karlsruhe December 2000 5
Thierry Renouf FR U.Surrey June 1999 2 Anke Kovar-Panskus DE U.Surrey August 1999 21 Michael Czech DE U.Surrey March 1998 12 Ludovic Moulinneuf FR U.Surrey June 2000 2.5 Silvia Trini Castelli IT TNO February 2000 9 Alessandro Dosio IT TNO June 2000 10 Olaf Weinhold DE TNO September
2000 7
Elena Hartog IT TNO January 2001 4