“Streets of Fire” revisited: contact burns
14
RESEARCH ARTICLE Open Access “Streets of Fire” revisited: contact burns Areta Kowal-Vern 1,2* , Marc R. Matthews 1 , Karen N. Richey 1 , Kathy Ruiz 1 , Michael Peck 1 , Arpana Jain 1 and Kevin N. Foster 1 Abstract Background: Pavement-street contact burns are rare. This study compared recent contact burns to those published in “Pavement temperature and burns: Streets of Fire” in 1995. The hypothesis was that there were a significantly increased number of pavement-street burns, as a result of increased ambient temperatures, and that motor vehicle crash (MVC) contact burns were less severe than pavements-street burns. Methods: This was a retrospective burn center registry study of naturally heated surface contact burns during May to September from 2016 to 2018. Statistical analyses were performed with one-way analysis of variance (ANOVA) and Maximum Likelihood chi-squared for age, percent of total burn surface area (% TBSA), treatment, hospitalization, comorbidities, hospital charges, mortality, ambient, and surface temperatures (pavement, asphalt, rocks). Results: In the 1995 study, median ambient temperatures were 106 (range 100–113) °F compared to the 108 (range 86–119) °F highest noon temperature in the current study. No ambient temperature differences were recorded on days with pavement burn admissions compared to days without these admissions. There were 225 pavement, 27 MVC, 15 road rash, and 103 other contact burns. The major injuries in the pavement group were due to being “down” (unknown reason), falls, and barefoot. Compared to the others, the pavement group was older, 56+ years, p < 0.001, and had smaller burns but similar length of stay. Fifty percent of the 225 pavement group patients with full-thickness burns required skin grafts. There were 13 (6%) fatalities in the pavement group vs 1 (4%) in the MVC group, p = 0.01. Fatalities were secondary to sepsis, shock, cardiac, respiratory, or kidney complications. Compared to survivors, the non-survivors had a significantly higher % TBSA (10% vs 4%), p= 0.01, and lower Glasgow Coma Scores (10 vs 15), p = 0.002. Conclusion: There was a median 2 °F increase in ambient temperature since 1995. The increase in pavement burn admissions was multi-factorial: higher temperatures, population, and the number of older patients, with increased metropolis expansion, outreach, and urban heat indices. Pavement group was similar to the MVC group except for significantly older age and increased mortality. Morbidity associated with age contributed to increased mortality. Keywords: Pavement, Concrete, Asphalt, Contact burns, Road rash, Streets, Highways, Sand, Rocks Background There are few literature articles describing burns sus- tained from body contact with naturally heated surfaces such as pavements, sidewalks, streets, and highways. Temperatures severe enough to contribute to burns from the environment have been reported, especially in heavily populated desert areas. The first accounts of pavement-street contact burns were the Arizona Burn Center case series of three motor vehicle crashes (MVCs) by Berens in 1970 [1], and the temperature and patient description in 1995 by Harrington et al. [2]. Add- itional contact pavement burn reports from this center were on pediatric feet in 2006 [3], and seizures in 2007 [4]. The aim of this study was to investigate the demo- graphic characteristics of the recent significant increase in the number of pavement-street burns from 2016 to 2018 compared to those previously published in 1995 [2], which had reported 23 cases in a 6-year-period (1986-1992), and other studies in the literature. The © The Author(s). 2019 Open Access This article is distributed under the terms of the Creative Commons Attribution 4.0 International License (http://creativecommons.org/licenses/by/4.0/), which permits unrestricted use, distribution, and reproduction in any medium, provided you give appropriate credit to the original author(s) and the source, provide a link to the Creative Commons license, and indicate if changes were made. The Creative Commons Public Domain Dedication waiver (http://creativecommons.org/publicdomain/zero/1.0/) applies to the data made available in this article, unless otherwise stated. * Correspondence: [email protected]; [email protected] 1 Arizona Burn Center, Maricopa Medical Center, Department of Surgery, Maricopa Integrated Health System, 2601 E. Roosevelt Street, Phoenix, Arizona 85008, USA 2 Research Department, Maricopa Integrated Health System, Phoenix, Arizona 85008, USA Kowal-Vern et al. Burns & Trauma (2019) 7:32 https://doi.org/10.1186/s41038-019-0169-9
-
Upload
khangminh22 -
Category
Documents
-
view
3 -
download
0
Transcript of “Streets of Fire” revisited: contact burns
RESEARCH ARTICLE Open Access
“Streets of Fire” revisited: contact burnsAreta Kowal-Vern1,2* , Marc R. Matthews1, Karen N. Richey1, Kathy Ruiz1, Michael Peck1, Arpana Jain1 andKevin N. Foster1
Abstract
Background: Pavement-street contact burns are rare. This study compared recent contact burns to those publishedin “Pavement temperature and burns: Streets of Fire” in 1995. The hypothesis was that there were a significantlyincreased number of pavement-street burns, as a result of increased ambient temperatures, and that motor vehiclecrash (MVC) contact burns were less severe than pavements-street burns.
Methods: This was a retrospective burn center registry study of naturally heated surface contact burns during Mayto September from 2016 to 2018. Statistical analyses were performed with one-way analysis of variance (ANOVA)and Maximum Likelihood chi-squared for age, percent of total burn surface area (% TBSA), treatment,hospitalization, comorbidities, hospital charges, mortality, ambient, and surface temperatures (pavement, asphalt,rocks).
Results: In the 1995 study, median ambient temperatures were 106 (range 100–113) °F compared to the 108(range 86–119) °F highest noon temperature in the current study. No ambient temperature differences wererecorded on days with pavement burn admissions compared to days without these admissions. There were 225pavement, 27 MVC, 15 road rash, and 103 other contact burns. The major injuries in the pavement group were dueto being “down” (unknown reason), falls, and barefoot. Compared to the others, the pavement group was older,56+ years, p < 0.001, and had smaller burns but similar length of stay. Fifty percent of the 225 pavement grouppatients with full-thickness burns required skin grafts. There were 13 (6%) fatalities in the pavement group vs 1 (4%)in the MVC group, p = 0.01. Fatalities were secondary to sepsis, shock, cardiac, respiratory, or kidney complications.Compared to survivors, the non-survivors had a significantly higher % TBSA (10% vs 4%), p = 0.01, and lowerGlasgow Coma Scores (10 vs 15), p = 0.002.
Conclusion: There was a median 2 °F increase in ambient temperature since 1995. The increase in pavement burnadmissions was multi-factorial: higher temperatures, population, and the number of older patients, with increasedmetropolis expansion, outreach, and urban heat indices. Pavement group was similar to the MVC group except forsignificantly older age and increased mortality. Morbidity associated with age contributed to increased mortality.
Keywords: Pavement, Concrete, Asphalt, Contact burns, Road rash, Streets, Highways, Sand, Rocks
BackgroundThere are few literature articles describing burns sus-tained from body contact with naturally heated surfacessuch as pavements, sidewalks, streets, and highways.Temperatures severe enough to contribute to burnsfrom the environment have been reported, especially inheavily populated desert areas. The first accounts of
pavement-street contact burns were the Arizona BurnCenter case series of three motor vehicle crashes(MVCs) by Berens in 1970 [1], and the temperature andpatient description in 1995 by Harrington et al. [2]. Add-itional contact pavement burn reports from this centerwere on pediatric feet in 2006 [3], and seizures in 2007[4]. The aim of this study was to investigate the demo-graphic characteristics of the recent significant increasein the number of pavement-street burns from 2016 to2018 compared to those previously published in 1995[2], which had reported 23 cases in a 6-year-period(1986-1992), and other studies in the literature. The
© The Author(s). 2019 Open Access This article is distributed under the terms of the Creative Commons Attribution 4.0International License (http://creativecommons.org/licenses/by/4.0/), which permits unrestricted use, distribution, andreproduction in any medium, provided you give appropriate credit to the original author(s) and the source, provide a link tothe Creative Commons license, and indicate if changes were made. The Creative Commons Public Domain Dedication waiver(http://creativecommons.org/publicdomain/zero/1.0/) applies to the data made available in this article, unless otherwise stated.
* Correspondence: [email protected]; [email protected] Burn Center, Maricopa Medical Center, Department of Surgery,Maricopa Integrated Health System, 2601 E. Roosevelt Street, Phoenix,Arizona 85008, USA2Research Department, Maricopa Integrated Health System, Phoenix, Arizona85008, USA
Kowal-Vern et al. Burns & Trauma (2019) 7:32 https://doi.org/10.1186/s41038-019-0169-9

hypothesis was that the increased number of pavement-street burns was due to higher ambient and naturallyheated surface temperatures. In addition, we proposedthat contact burns sustained in MVCs/road rash weresignificantly less severe than those which resulted frombody contact with hot pavements-streets.
MethodsSample populationThis was a three-year retrospective burn center in-houseregistry study at the Arizona Burn Center. The studypopulation consisted of patients who had contact burnsas an initial admission mainly in the summer with latespring and early autumn months (May-September) of athree year (2016 to 2018) period. These burns weresorted into: pavement/street/highway/asphalt/bench:pavement group (n=225); status post MVC: MVCgroup (n=27); road rash: road rash group (n=15), andscald/hot object, etc.: other contact group (n=103).The database consisted of de-identified patients. Thisstudy was approved by the Maricopa IntegratedHealth System Institutional Review Board in Phoenix,Arizona.
Previous temperature dataIn 1947, studies by Moritz and Henriques [5–7] notedthat second degree burns resulted when the contactsurface temperature was 44oC (111oF) for 6 hours, 50oC(122oF) for 15 minutes, 60oC (140oF) for 5 seconds, and65oC (149oF) for 2 seconds. In comparison, the Ameri-can Burn Association [8] stated that hot tap water andscalds can cause third degree burns in 5 seconds at 60oC(140oF), and 1 second at 68oC (155oF). In Adelaide,Australia, Clifton et al. [9] documented similar naturalsurface temperatures for shaded and unshaded slate,metal, cement, sand, brick and bitumen. Rumney et al.[10] and Way [11] measured asphalt temperatures in dif-ferent state locations in the 1970’s and 1980’s and foundthat the peak daily temperatures occurred around 3 pm.The hottest temperatures were in June and July with amean daily asphalt temperature of 68oC (154.4oF) and amaximum daily asphalt temperature peak of 71.1oC(160oF) [10, 11]. In relation to climate change, it hasbeen recorded that the state has warmed about 2oF inthe last century [12]. Comparing the average annualnumber of days with maximum temperatures of 110oFor higher from 1981-2010 to 1896-2010, it was 19 daysvs 11 days [13].Harrington et al. [2] recorded their own temperatures
on concrete, asphalt, steel, lawn, dirt and sand. Theynoted that ambient temperatures of 35oC to 37.8oC(95oF to 100oF) were necessary to produce a surfacetemperature of 44oC (111oF) to cause a cutaneous burninjury. In their study, asphalt and sand peaked at
approximately 68oC (154oF), and dirt, cement and steelpeaked at 58-60oC (136-140oF). Shade decreased thesurface temperature on asphalt and cement peaks to43oC (109oF) and 39oC (102oF) respectively [2]. De-pending on the time, length of ground contact, and sea-son, motorcyclists may have some protection fromclothing (depending on what they are wearing).
Months of May to September from 2016 to 2018 datacollectionDaily ambient temperatures were obtained for themonths of April through October for three years:2016 to 2018 from the timeanddate.com website [14]with daily high and low temperatures at 6 am, 12noon, and 6 pm. Data was also obtained to determinethe highest ambient temperatures on the days whenpatients with pavement-street contact burns were ad-mitted to the hospital compared to days when therewere no admissions.The authors utilized an IRT207 Heat Seeker™ Infrared
Thermometer (2015 General Tools and Instruments,Secaucus, NJ; Montreal, Canada H9R 1E1) to measurethe sidewalk, asphalt, and rock temperatures for a three-week-period (August 8 to August 31, 2018). This IRTwas an 8:1 non-contact temperature measuring instru-ment using infrared technology and laser sighting. Fea-tures included a 4 digit backlit liquid crystal display(LCD), scan/hold function and auto power off (7 secs), aLaser Class 2 with an Output/Wavelength of <1mW@655nm, and repeatability of ± 1oC (± 1.8oF). Thethermometer temperature readings were recorded inCentigrade and Fahrenheit with the thermometer heldone inch off the surface according to manufacturer in-structions. The emissivity of the instrument did not needto be set by the user.
Statistical analysisStatistical analysis was performed utilizing Statistica® (Stat-Soft, Tulsa, OK) descriptive statistics, one way- analysis ofvariance (ANOVA), with unequal N Tukey post-hoc com-parisons, Maximum Likelihood Chi-squared tests. Com-parisons were made between pavement, MVC, road rash,and other contact groups. The following demographicdependent parameters in the four independent groupswere studied by one-way ANOVA statistics: age, percentof total body surface (%TBSA), procedures, length ofstay (LOS) days, hospital charges, intensive care unit(ICU), injury severity score (ISS), Glasgow coma scale(GCS), body mass index (BMI), ventilator (vent) days,operating room (OR) visits, with ambient and naturalsurface temperatures by month and year. MaximumLikelihood chi-squared and Tukey was utilized forfour study groups and pavement group subsets for:ethnicity, injury location, treatment, surgery, mortality,
Kowal-Vern et al. Burns & Trauma (2019) 7:32 Page 2 of 14

co-morbidities, payers, transport, graft use, ethanol/drug use, and cellulitis. In all cases, a p value < 0.05was considered significant.
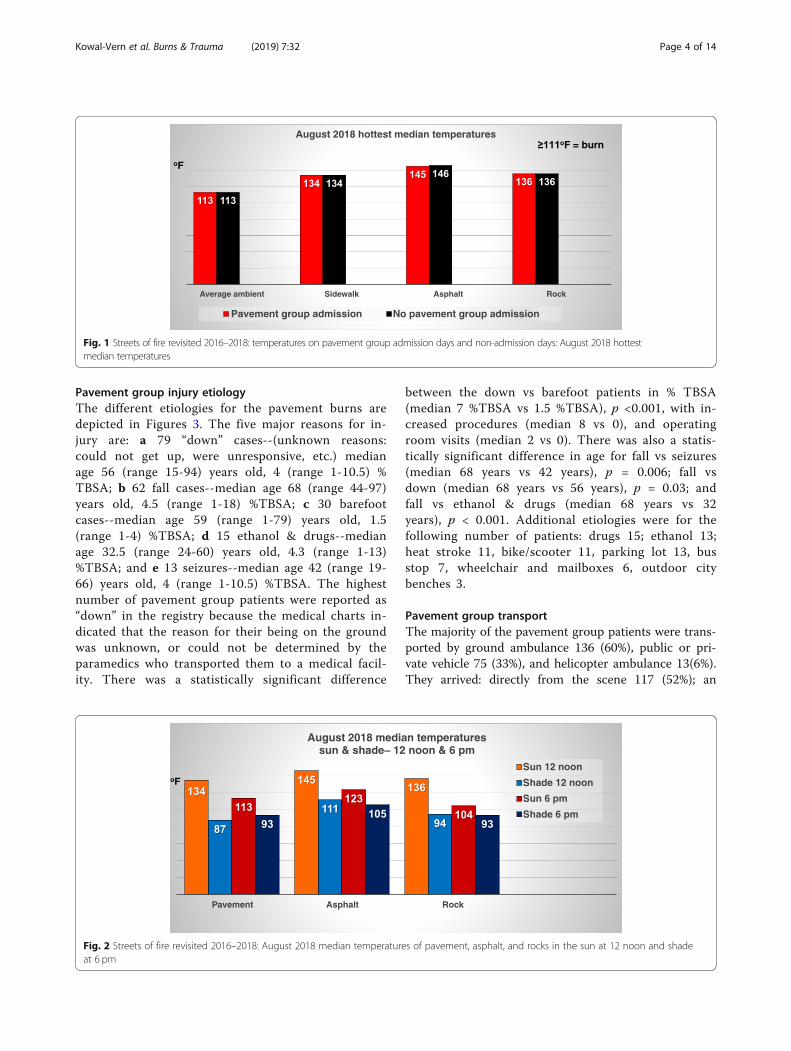
ResultsAmbient and naturally heated surface temperaturesThe median ambient temperatures in the 1995 [2],2006 [3], and present study periods were similar(Table 1). Figure 1 indicates that ambient tempera-tures were not higher on the days when the contactpavement group patients were injured and admittedto the burn center compared to days when there wereno pavement group injury admissions. There was nostatistical significance in the ambient temperature dif-ference between the four groups or the three years inthe current study.The pavement, asphalt, and rock surface tempera-
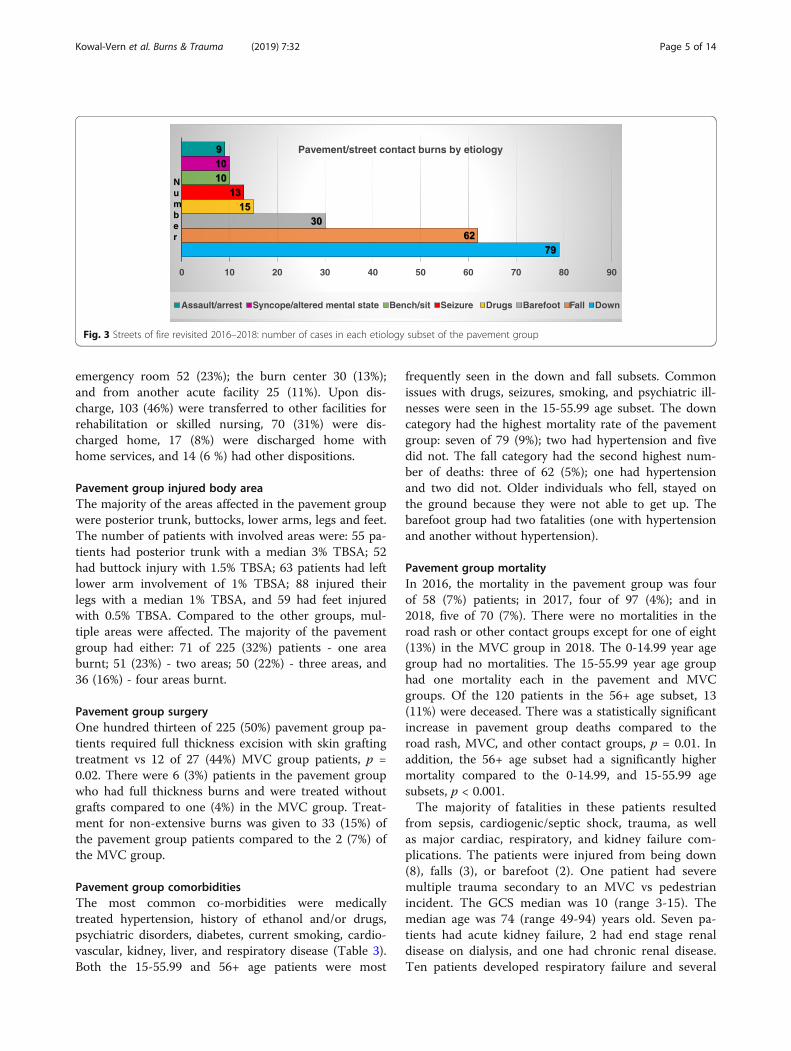
tures were comparable to those recorded in the 1995article, indicating that surface temperatures in therange of 95-100oF were sufficient to cause a cutaneousburn [2]. There were similar surface temperature re-sults in August 2018 as seen in 1995, in reference toshade even during high noon temperatures, providingrelief from the heat, except for the asphalt surfaces(Figure 2). Although the surface temperatures de-creased by 6 pm, they were still hot enough to causecutaneous contact burns.
2016–2018 populationThe majority of the patients in this study were thosewho were burnt by naturally heated surfaces such aspavement, streets, sidewalks, cement, highways, androcks (Figure 3). The highest number of admissions (97)was in 2017. The demographic characteristics of the fourstudy groups are shown in Table 2. Patients in the pave-ment group were significantly older than the patients inthe MVC, road rash or other contact groups, p = 0.002.Compared to the other contact group, the pavementgroup had a significantly higher % TBSA (4% vs 1.5%),p = 0.004; longer LOS (12 days vs 4 days), p < 0.001;more procedures (5 vs 2), p < 0.001, and hospitalcharges (US$172,024 vs US$51,802), p = 0.005, with asignificantly lower ISS score compared to the road rashgroup (1 vs 4), p <0.001. In the pavement group, 151(67%) were Caucasian, 38 (17%) Hispanic, 23 (10%)African American, and 11 (5%) Native American; therewas also one Hawaiian and one Asian.
Pavement group social characteristicsIn the pavement group, 127 (56%) were single; 59 (26%)married; 13 (6%) divorced and 16 (7%) widowed. Of the56+ years old patients in the pavement group, 61 (52%)lived alone and 43 (36%) lived with a spouse, partner orsignificant other compared to the age group 15-55.99years, where 66 (67%) lived alone and 23 (22%) livedwith a spouse, partner or significant other.
Table 1 Median ambient and natural surface temperatures in degrees Fahrenheit and Centigrade: comparison of the literature withthe present studyAmbient temperature comparison Median (°F) Range (°F)
1995 “Streets of Fire” [2] 106 100–113
1996 Mecca burnt feet on sand [15]2000a Friday mass in Saudi Arabia [16]
AV noon: 113 122–140
2006b “Pediatric foot burns” [3] – 86–106
Present study high noon (2016–2018) 106 84–119
Present study low noon (2016–2018) 100 73–115
High noon ambient median temperatures on the day of admission from May to September during 2016–2018
Pavement group 108 86–119
Road rash group 100 100–110
MVC group 104 88–111
Other contact group 106 90–117
August 2018 (12 pm and 6 pm) (median) temperatures of pavement/asphalt/rock
Pavement 12 pm, °F (°C) 129 (53.3) 98.0–140.0 (36.7–61.7)
6 pm, °F (°C) 111 (43.1) 96.6–117.5 (35.9–47.3)
Asphalt 12 pm, °F (°C) 138.5 (59.5) 116.9–152 (41.8–68.7)
6 pm, °F (°C) 124.5 (52.0) 111.3–132 (44.1–56.0)
Rock 12 pm, °F (°C) 124.1 (52.7) 98.6–138.7 (37.0–59.2)
6 pm, °F (°C) 102.0 (37.6) 91.9–110.3 (32.7–43.6)
AV average, MVC motor vehicle crashaFriday Muslim mass held at noon; slippers outside the mosque get misplacedbInjuries occurred between 12 noon and 4 pm
Kowal-Vern et al. Burns & Trauma (2019) 7:32 Page 3 of 14
Pavement group injury etiologyThe different etiologies for the pavement burns aredepicted in Figures 3. The five major reasons for in-jury are: a 79 “down” cases--(unknown reasons:could not get up, were unresponsive, etc.) medianage 56 (range 15-94) years old, 4 (range 1-10.5) %TBSA; b 62 fall cases--median age 68 (range 44-97)years old, 4.5 (range 1-18) %TBSA; c 30 barefootcases--median age 59 (range 1-79) years old, 1.5(range 1-4) %TBSA; d 15 ethanol & drugs--medianage 32.5 (range 24-60) years old, 4.3 (range 1-13)%TBSA; and e 13 seizures--median age 42 (range 19-66) years old, 4 (range 1-10.5) %TBSA. The highestnumber of pavement group patients were reported as“down” in the registry because the medical charts in-dicated that the reason for their being on the groundwas unknown, or could not be determined by theparamedics who transported them to a medical facil-ity. There was a statistically significant difference
between the down vs barefoot patients in % TBSA(median 7 %TBSA vs 1.5 %TBSA), p <0.001, with in-creased procedures (median 8 vs 0), and operatingroom visits (median 2 vs 0). There was also a statis-tically significant difference in age for fall vs seizures(median 68 years vs 42 years), p = 0.006; fall vsdown (median 68 years vs 56 years), p = 0.03; andfall vs ethanol & drugs (median 68 years vs 32years), p < 0.001. Additional etiologies were for thefollowing number of patients: drugs 15; ethanol 13;heat stroke 11, bike/scooter 11, parking lot 13, busstop 7, wheelchair and mailboxes 6, outdoor citybenches 3.
Pavement group transportThe majority of the pavement group patients were trans-ported by ground ambulance 136 (60%), public or pri-vate vehicle 75 (33%), and helicopter ambulance 13(6%).They arrived: directly from the scene 117 (52%); an
Fig. 1 Streets of fire revisited 2016–2018: temperatures on pavement group admission days and non-admission days: August 2018 hottestmedian temperatures
Fig. 2 Streets of fire revisited 2016–2018: August 2018 median temperatures of pavement, asphalt, and rocks in the sun at 12 noon and shadeat 6 pm
Kowal-Vern et al. Burns & Trauma (2019) 7:32 Page 4 of 14
emergency room 52 (23%); the burn center 30 (13%);and from another acute facility 25 (11%). Upon dis-charge, 103 (46%) were transferred to other facilities forrehabilitation or skilled nursing, 70 (31%) were dis-charged home, 17 (8%) were discharged home withhome services, and 14 (6 %) had other dispositions.
Pavement group injured body areaThe majority of the areas affected in the pavement groupwere posterior trunk, buttocks, lower arms, legs and feet.The number of patients with involved areas were: 55 pa-tients had posterior trunk with a median 3% TBSA; 52had buttock injury with 1.5% TBSA; 63 patients had leftlower arm involvement of 1% TBSA; 88 injured theirlegs with a median 1% TBSA, and 59 had feet injuredwith 0.5% TBSA. Compared to the other groups, mul-tiple areas were affected. The majority of the pavementgroup had either: 71 of 225 (32%) patients - one areaburnt; 51 (23%) - two areas; 50 (22%) - three areas, and36 (16%) - four areas burnt.
Pavement group surgeryOne hundred thirteen of 225 (50%) pavement group pa-tients required full thickness excision with skin graftingtreatment vs 12 of 27 (44%) MVC group patients, p =0.02. There were 6 (3%) patients in the pavement groupwho had full thickness burns and were treated withoutgrafts compared to one (4%) in the MVC group. Treat-ment for non-extensive burns was given to 33 (15%) ofthe pavement group patients compared to the 2 (7%) ofthe MVC group.
Pavement group comorbiditiesThe most common co-morbidities were medicallytreated hypertension, history of ethanol and/or drugs,psychiatric disorders, diabetes, current smoking, cardio-vascular, kidney, liver, and respiratory disease (Table 3).Both the 15-55.99 and 56+ age patients were most
frequently seen in the down and fall subsets. Commonissues with drugs, seizures, smoking, and psychiatric ill-nesses were seen in the 15-55.99 age subset. The downcategory had the highest mortality rate of the pavementgroup: seven of 79 (9%); two had hypertension and fivedid not. The fall category had the second highest num-ber of deaths: three of 62 (5%); one had hypertensionand two did not. Older individuals who fell, stayed onthe ground because they were not able to get up. Thebarefoot group had two fatalities (one with hypertensionand another without hypertension).
Pavement group mortalityIn 2016, the mortality in the pavement group was fourof 58 (7%) patients; in 2017, four of 97 (4%); and in2018, five of 70 (7%). There were no mortalities in theroad rash or other contact groups except for one of eight(13%) in the MVC group in 2018. The 0-14.99 year agegroup had no mortalities. The 15-55.99 year age grouphad one mortality each in the pavement and MVCgroups. Of the 120 patients in the 56+ age subset, 13(11%) were deceased. There was a statistically significantincrease in pavement group deaths compared to theroad rash, MVC, and other contact groups, p = 0.01. Inaddition, the 56+ age subset had a significantly highermortality compared to the 0-14.99, and 15-55.99 agesubsets, p < 0.001.The majority of fatalities in these patients resulted
from sepsis, cardiogenic/septic shock, trauma, as wellas major cardiac, respiratory, and kidney failure com-plications. The patients were injured from being down(8), falls (3), or barefoot (2). One patient had severemultiple trauma secondary to an MVC vs pedestrianincident. The GCS median was 10 (range 3-15). Themedian age was 74 (range 49-94) years old. Seven pa-tients had acute kidney failure, 2 had end stage renaldisease on dialysis, and one had chronic renal disease.Ten patients developed respiratory failure and several
Fig. 3 Streets of fire revisited 2016–2018: number of cases in each etiology subset of the pavement group
Kowal-Vern et al. Burns & Trauma (2019) 7:32 Page 5 of 14
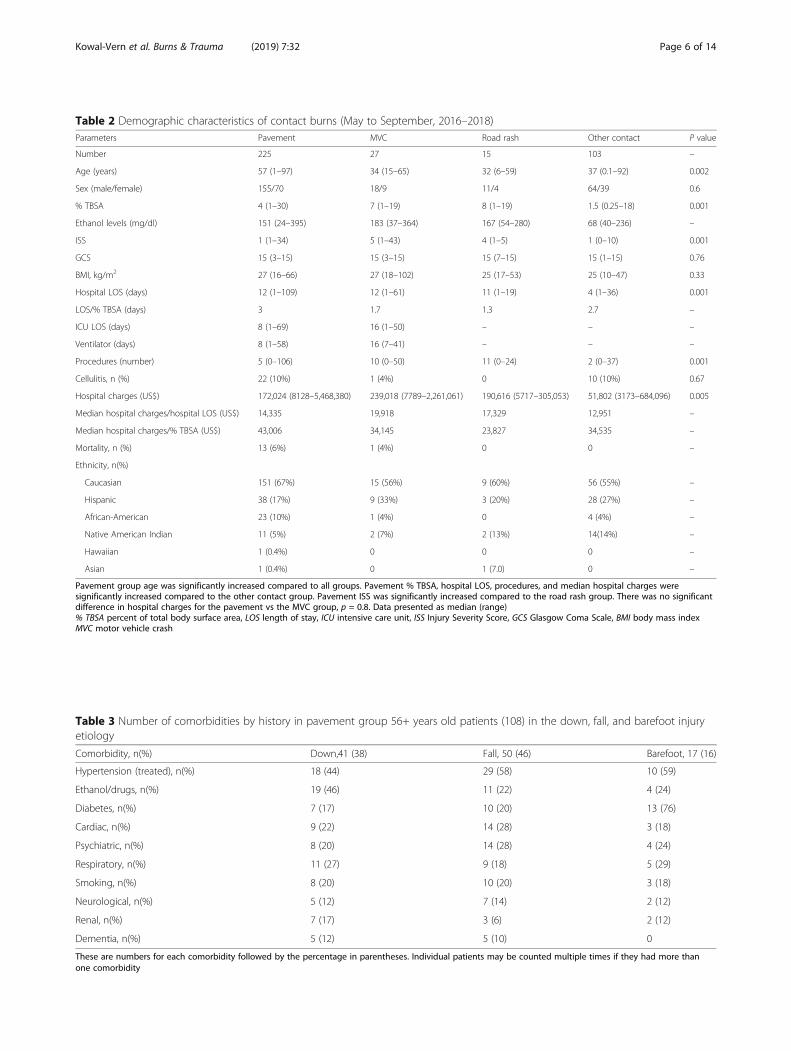
Table 3 Number of comorbidities by history in pavement group 56+ years old patients (108) in the down, fall, and barefoot injuryetiology
Comorbidity, n(%) Down,41 (38) Fall, 50 (46) Barefoot, 17 (16)
Hypertension (treated), n(%) 18 (44) 29 (58) 10 (59)
Ethanol/drugs, n(%) 19 (46) 11 (22) 4 (24)
Diabetes, n(%) 7 (17) 10 (20) 13 (76)
Cardiac, n(%) 9 (22) 14 (28) 3 (18)
Psychiatric, n(%) 8 (20) 14 (28) 4 (24)
Respiratory, n(%) 11 (27) 9 (18) 5 (29)
Smoking, n(%) 8 (20) 10 (20) 3 (18)
Neurological, n(%) 5 (12) 7 (14) 2 (12)
Renal, n(%) 7 (17) 3 (6) 2 (12)
Dementia, n(%) 5 (12) 5 (10) 0
These are numbers for each comorbidity followed by the percentage in parentheses. Individual patients may be counted multiple times if they had more thanone comorbidity
Table 2 Demographic characteristics of contact burns (May to September, 2016–2018)Parameters Pavement MVC Road rash Other contact P value
Number 225 27 15 103 –
Age (years) 57 (1–97) 34 (15–65) 32 (6–59) 37 (0.1–92) 0.002
Sex (male/female) 155/70 18/9 11/4 64/39 0.6
% TBSA 4 (1–30) 7 (1–19) 8 (1–19) 1.5 (0.25–18) 0.001
Ethanol levels (mg/dl) 151 (24–395) 183 (37–364) 167 (54–280) 68 (40–236) –
ISS 1 (1–34) 5 (1–43) 4 (1–5) 1 (0–10) 0.001
GCS 15 (3–15) 15 (3–15) 15 (7–15) 15 (1–15) 0.76
BMI, kg/m2 27 (16–66) 27 (18–102) 25 (17–53) 25 (10–47) 0.33
Hospital LOS (days) 12 (1–109) 12 (1–61) 11 (1–19) 4 (1–36) 0.001
LOS/% TBSA (days) 3 1.7 1.3 2.7 –
ICU LOS (days) 8 (1–69) 16 (1–50) – – –
Ventilator (days) 8 (1–58) 16 (7–41) – – –
Procedures (number) 5 (0–106) 10 (0–50) 11 (0–24) 2 (0–37) 0.001
Cellulitis, n (%) 22 (10%) 1 (4%) 0 10 (10%) 0.67
Hospital charges (US$) 172,024 (8128–5,468,380) 239,018 (7789–2,261,061) 190,616 (5717–305,053) 51,802 (3173–684,096) 0.005
Median hospital charges/hospital LOS (US$) 14,335 19,918 17,329 12,951 –
Median hospital charges/% TBSA (US$) 43,006 34,145 23,827 34,535 –
Mortality, n (%) 13 (6%) 1 (4%) 0 0 –
Ethnicity, n(%)
Caucasian 151 (67%) 15 (56%) 9 (60%) 56 (55%) –
Hispanic 38 (17%) 9 (33%) 3 (20%) 28 (27%) –
African-American 23 (10%) 1 (4%) 0 4 (4%) –
Native American Indian 11 (5%) 2 (7%) 2 (13%) 14(14%) –
Hawaiian 1 (0.4%) 0 0 0 –
Asian 1 (0.4%) 0 1 (7.0) 0 –
Pavement group age was significantly increased compared to all groups. Pavement % TBSA, hospital LOS, procedures, and median hospital charges weresignificantly increased compared to the other contact group. Pavement ISS was significantly increased compared to the road rash group. There was no significantdifference in hospital charges for the pavement vs the MVC group, p = 0.8. Data presented as median (range)% TBSA percent of total body surface area, LOS length of stay, ICU intensive care unit, ISS Injury Severity Score, GCS Glasgow Coma Scale, BMI body mass indexMVC motor vehicle crash
Kowal-Vern et al. Burns & Trauma (2019) 7:32 Page 6 of 14
had either an aspiration or bacterial pneumonia orboth. Nine patients developed either septic, hypovol-emic, or cardiogenic shock. Six patients had medicallytreated hypertension and two had diabetes. The ma-jority of the deaths were complications from co-mor-bidities patients arrived with, such as rhabdomyolysis,ischemic heart disease and congestive heart failure;five were withdrawn from treatment and received pal-liative care. While the burn injury precipitated thesystemic inflammatory response, most fatalities couldbe attributed to the myriad of serious co-morbidities,which resulted in organ failure and complications.Within the pavement group, 203 of 225 (90%) survivors
had an ISS < 6 vs 9 with an ISS ≥ 6, p = 0.02. Ten of 13(77%) non-survivors had an ISS of < 6 and three (23%)had an ISS of ≥ 6, p = 0.02. The demographic characteris-tics of the survivors and non-survivors in the pavementgroup are shown in Table 4. There was no statistically sig-nificant difference in age subsets, p = 0.2. There was a sig-nificantly increased %TBSA in the non-survivors vs thesurvivors, (10 %TBSA vs 4 %TBSA), p = 0.01, and a de-creased GCS in the non-survivors vs the survivors (10 vs15), p = 0.002.
Hospital charge payersTo determine which payers provided funding forhospitalization, we looked at the different subsets by age.Within the pavement group, there were few childrenaged 0-14.99. The major payers for the pavement groupwere medicare, medicaid, and private/commercial insur-ance. In the 15-55.99 subset, insurance payments were:medicaid for 65 of 102 (63.7%); medicare 14 (13.7%);commercial 14 (13.7%); self-pay 7 (6.9%); other 2 (2%).For the 56+ age group, insurance payments were: Medi-care for 87 of 120 (73%); Medicaid 25 (21%); commercial4 (3%); other 3 (3%). Table 2 shows the hospital chargesby group and Table 5 shows the charges by age subsets.
Literature review comparison with the current studyA search through PubMed, Medline, Google Scholar, theInternet, and pertinent articles as references in appropri-ate studies was undertaken. Published English literatureon pavement, highway, street, cement, gravel, sand, andnaturally heated surfaces was compared with the currentstudy data. Ten articles found on this topic were com-pared based on the number of cases, author, year, coun-try, population, and burn size. Table 6 shows the
Table 4 Pavement group survivor vs non-survivor comparisonParameters Pavement/asphalt/rock P value
Status Alive Deada –
Number (%) 212 (94) 13 (6) –
Age (years) 56 (1–97) 71 (35–94) 0.2
Sex (male/female) 148/64 6/7 –
% TBSA 4 (1–27) 10 (2–30) 0.01
Ethanol levels (mg/dl) 151 (24–395) 115 (24–205) 0.4
ISS 1 (1–34) 4 (1–16) 0.79
GCS 15 (3–15) 10 (3–15) 0.002
Body mass index (kg/m2) 27 (16–66) 31 (17–45) 0.99
Down time (min) 25 (1–150) – –
Hospital LOS (days) 12 (1–109) 17 (1–37) 0.99
ICU LOS (days) 5 (1–69) 8 (1–24) 0.7
Ventilator (days) 9 (1–58) 6 (1–24) 0.4
Procedure number 5 (0–106) 8 (0–38) 0.99
Hospital charges (US$) 152,598 (8128–5,468,380) 681,537 (49,242–1,490,924) 0.99
Median hospital charges/LOS (US$) 12,717 40,090 –
Ethnicity, n(%)
Caucasian 139 (93) 10 (7) –
Hispanic 36 (100) 0 –
African American 23 (100) 0 –
Native American Indian 9 (82) 2 (18) –
Hawaiian 1 (100) 0 –
Asian 1 (100) 0 –
Data presented as median (range)% TBSA percent of total body surface area, LOS length of stay, ICU intensive care unit, ISS Injury Severity Score, GCS Glasgow Coma Scale, down time time spent onthe ground before rescue, MVC motor vehicle crasha1 of 27 (4%) MVC cases was a non-survivor and is not included here
Kowal-Vern et al. Burns & Trauma (2019) 7:32 Page 7 of 14

demographic characteristics of patients in the litera-ture. Religious cultural practices may contribute tofoot contact burns as seen in Table 1 [15, 6]. Alcohol-ism were noted in four patients in the Harrington [2]:three assaults/arrests, and one heat stroke case. The"Streets of Fire" article about Phoenix in 1995 [2] andthe Al-Qattan article on Saudi Arabia in 2000 [16]had more than 10 cases each and were statisticallycompared separately from the “other”, <10 casesreports [1, 15, 17, 18] group. The majority of caseswere diabetic and/or barefoot pedestrians, althoughthere were a few case reports of seizures, andsyncope.
Four additional news media articles on the WorldWide Web depicted an adult and three children withbare feet who developed plantar foot burns: a) CitrusHeights, CA, 28 years old with approximately a 20%TBSA pavement burn sustained during a police arrest[19]; b) Huntington Beach, CA, 16 month old playing onthe pavement outside the home [20]; c) Ipswich Park,Australia, 18 month old burned by a metal groundplate covering a service pit in a park [21]; d) Perth,Australia, 14 month old playing on the pavement out-side the home [22].There were very few children in the present pave-
ment group and in the literature reports, especially
Table 5 Demographic characteristics by age group
Age group
0–14.99 15–55.99 56–100
Pavement/asphalt/rock
Number (%) 3 (1 ) 102 (45) 120 (54)
Age (years) 7 (1–9.5) 44 (15–55) 70 (56–97)
Sex (male/female) 2/1 76/26 77/43
% TBSA 1.5 (1–5) 4 (1–27) 4 (1–30)
Hospital LOS (days) 2 (1-12) 12 (1-109) 13 (1-62)
Hospital charges (US$) 44,600 (14,535–131,623) 14,192 (9195–5,468,380) 177,991 (8128–2,150,431)
Hospital charges/hospital LOS (US$) 22,300 1183 13,692
Hospital charges/% TBSA (US$) 29,733 3548 44,498
Mortality, n(%) 0 1 (1) 12 (10)
Road rash
Number (%) 2 (13) 11 (73) 2 (13)
Age (years) 6 (6–7) 32 (21–47) 58 (56–59)
Sex (male/female) 1/1 8/3 2/0
% TBSA 6 (6–7) 10 (1–19) 4 (2–6)
LOS (days) 7 (2–11) 10 (1–19) 15 (12–17)
Hospital charges (US$) 105,355 (15,022–195,689) 190,616 (5717–305,053) 193,352 (192,277–194,426)
Hospital charges/LOS (US$) 15,051 19,062 12,890
Hospital charges/%TBSA (US$) 17,559 19,062 48,338
Mortality, n(%) 0 0 0
MVC
Number (%) 1 (4) 21 (78) 5 (19)
Age (years) 14.6 27 (18–52) 58 (56–65)
Sex (male/female) 1/0 12/9 5/0
% TBSA 1 8 (1–19) 6 (1–9)
Hospital LOS (days) 3 12 (1–61) 12 (5–24)
Hospital charges (US$) 34,289 210,428 (7789–2,261,061) 244,684 (51,392–1,165,514)
Hospital charges/hospital LOS (US$) 11,430 17,536 20,390
Hospital charges/% TBSA (US$) 34,289 26,304 40,781
Mortality, n(%) 0 1 (4) 0
Data presented as median (range)% TBSA percent of total body surface area, LOS length of stay, ICU intensive care unit, ISS injury severity score, GCS Glasgow Coma Scale, MVC motor vehicle crash
Kowal-Vern et al. Burns & Trauma (2019) 7:32 Page 8 of 14

Table 6 Literature reports on pavement-street contact injuryAuthor Date Journal Cases Age
(years)Sex Population % TBSA
Berens [1], Phoenix, AZ, USA 1970 Journal of the American MedicalAssociation
3 22 F MVC vs pedestrian 10
67 M Fell out, moving car
82 F MVC: thrown out 12
Vardy et al. [18], Beer Sheva, Israel 1989 Burns 1 79 F Heatstroke 20
Harrington et al. [2], Phoenix, AZ,USA
1995 Annals of Emergency Medicine 23 3 M MVC vs pedestrian 12
3 M Child abuse 3
34 M Assault 4
33 M Police restraint 10
48 M Police restraint 11
0.75 M Age extreme 1
1.08 M Age extreme 2
22 M Seizure 7
34 M Seizure 10
35 M Seizure 3
63 M Seizure 2
46 M Weakness 8
31 M Syncope 9
29 M Drugs 10
46 F MVC vs pedestrian 5
40 F Assault 2
57 F Heatstroke 4
82 F Heatstroke 7
69 F Fall, pavement 13
30 F Lumbosacral radiculitis 1
48 F Diabetic neuropathy 2
64 F Diabetic neuropathy 2
78 F Diabetic neuropathy 3
Fried et al. [15], Saudi Arabia 1996 Burns 1 58 M Barefoot 1
Al-Qattan [16], Saudi Arabia 2000 Burns 12 1 M NA
2 M
52 M
41 M
50 M Diabetes, PVD
55 M Diabetes
46 M Diabetes
48 M Ddiabetes
52 M Ddiabetes
53 M Diabetes
61 M Diabetes
41 M Diabetes
Sinha et al. [3], Phoenix, AZ, USA 2006 Journal of Trauma 34 NA NA Pediatric feet ≤ 1
Rimmer et al. [4]Phoenix, AZ, USA
2007 Journal Burn Care & Research 10 NA NA Seizures
Silver et al. [17], Las Vegas, NV,USA
2014 Journal of Wound Care 7 71 M Syncope 8
37 M Fall, bike 10
77 F Fall 7
57 M Passed out 10
Kowal-Vern et al. Burns & Trauma (2019) 7:32 Page 9 of 14

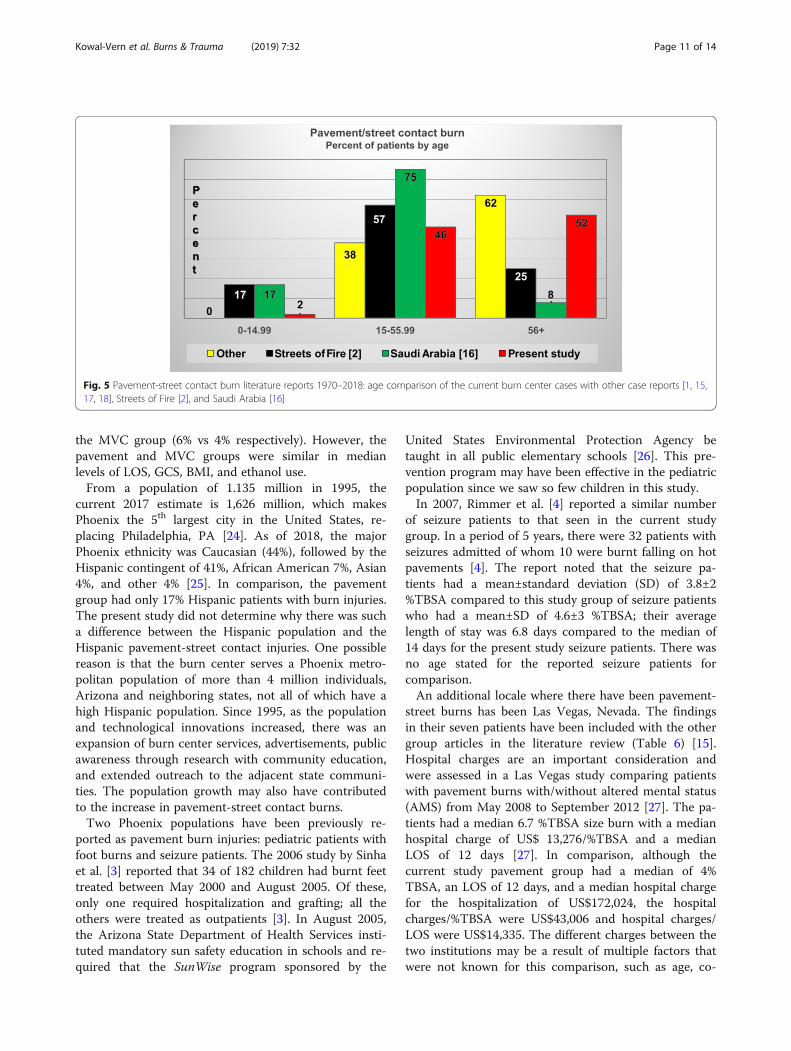
since 2006. Compared with previous published series,the present study had a similar number of assault/ar-rest, syncope, seizure and heat stroke cases. However,the number of diabetic and barefoot/pedestrian casesat the burn center were significantly increased com-pared to the literature (Figure 4). Al-Qattan (SaudiArabia) [16] reported the highest percentage of injur-ies in the 15-55.99 years old age subset. The presentstudy and the “other” , single case reports, [1, 15, 17,18] had the highest percent of 56+ years old patientscompared to the “Streets of Fire” [2] and Saudi Ara-bia [16] cases (Figure 5).
DiscussionThe results of the present study compared to the 1995Harrington et al. “Streets of Fire” [2] report indicate thatthe increase in pavement-street contact burns from 2016to 2018 was multi-factorial: higher temperatures, popu-lation, number of seniors, with increased metropolis ex-pansion, outreach, and urban heat indices for Phoenix.The median 2oF increase in ambient temperature be-tween the “Streets of Fire” [2] article and the current
study may be reflective of the climate change records,which indicate that the state has warmed up by 2oF inthe last century [12]. In the 1995 study [2], medianambient temperatures were 106oF (range 100-113oF)compared to 108oF (range 86-119oF) highest noontemperature in the current study. In Phoenix, the max-imum daily ambient temperature on the day of injuryadmissions was not increased compared to days whenthere were no pavement-street burn admissions. Thiscenter experienced more of these admissions in the tar-get months of summer, with late spring and early au-tumn (May to September) during almost constant dailyhigh temperatures above 95-100oF compared with Janu-ary to April and October to December during the threeyear period. The present study does not reflect the mostrecent pavement burn report of exponential increase inburn pavement admissions with increasing temperaturesseen in Las Vegas, Nevada [23]. Contact burns sustainedin motor vehicle crashes were significantly less severethan those from body contact with hot pavements-streets as evidenced in the statistically significant in-creased mortality in the pavement group compared to
Table 6 Literature reports on pavement-street contact injury (Continued)Author Date Journal Cases Age
(years)Sex Population % TBSA
29 F MVC vs pedestrian 20
57 M Homeless 7
50 M Homeless 10
Silver [27], Las Vegas, NV, USA 2015 Journal Burn Care & Research 72 NA NA Diabetes, altered mental status,toddlers
Average6.7
Vega [23], Las Vegas, NV, USA 2019 Journal Burn Care & Research 173 NA NA Pavement burns Average7.7
Present study, Phoenix, AZ, USA 2019 225 Mean 56 155 male/70female
Down, fall, barefoot, etc. Mean 6
AZ Arizona, NV Nevada, USA United States of America, MVC motor vehicle crash, PVD peripheral vascular disease, %TBSA percent of total body surface area, Ffemale, M male, NA not available
Fig. 4 Literature reports 1970–2018: comparison of the current burn center cases with other case reports [1, 15, 17, 18], Streets of Fire [2], andSaudi Arabia [16] by pavement-street burn etiology
Kowal-Vern et al. Burns & Trauma (2019) 7:32 Page 10 of 14
the MVC group (6% vs 4% respectively). However, thepavement and MVC groups were similar in medianlevels of LOS, GCS, BMI, and ethanol use.From a population of 1.135 million in 1995, the
current 2017 estimate is 1,626 million, which makesPhoenix the 5th largest city in the United States, re-placing Philadelphia, PA [24]. As of 2018, the majorPhoenix ethnicity was Caucasian (44%), followed by theHispanic contingent of 41%, African American 7%, Asian4%, and other 4% [25]. In comparison, the pavementgroup had only 17% Hispanic patients with burn injuries.The present study did not determine why there was sucha difference between the Hispanic population and theHispanic pavement-street contact injuries. One possiblereason is that the burn center serves a Phoenix metro-politan population of more than 4 million individuals,Arizona and neighboring states, not all of which have ahigh Hispanic population. Since 1995, as the populationand technological innovations increased, there was anexpansion of burn center services, advertisements, publicawareness through research with community education,and extended outreach to the adjacent state communi-ties. The population growth may also have contributedto the increase in pavement-street contact burns.Two Phoenix populations have been previously re-
ported as pavement burn injuries: pediatric patients withfoot burns and seizure patients. The 2006 study by Sinhaet al. [3] reported that 34 of 182 children had burnt feettreated between May 2000 and August 2005. Of these,only one required hospitalization and grafting; all theothers were treated as outpatients [3]. In August 2005,the Arizona State Department of Health Services insti-tuted mandatory sun safety education in schools and re-quired that the SunWise program sponsored by the
United States Environmental Protection Agency betaught in all public elementary schools [26]. This pre-vention program may have been effective in the pediatricpopulation since we saw so few children in this study.In 2007, Rimmer et al. [4] reported a similar number
of seizure patients to that seen in the current studygroup. In a period of 5 years, there were 32 patients withseizures admitted of whom 10 were burnt falling on hotpavements [4]. The report noted that the seizure pa-tients had a mean±standard deviation (SD) of 3.8±2%TBSA compared to this study group of seizure patientswho had a mean±SD of 4.6±3 %TBSA; their averagelength of stay was 6.8 days compared to the median of14 days for the present study seizure patients. There wasno age stated for the reported seizure patients forcomparison.An additional locale where there have been pavement-
street burns has been Las Vegas, Nevada. The findingsin their seven patients have been included with the othergroup articles in the literature review (Table 6) [15].Hospital charges are an important consideration andwere assessed in a Las Vegas study comparing patientswith pavement burns with/without altered mental status(AMS) from May 2008 to September 2012 [27]. The pa-tients had a median 6.7 %TBSA size burn with a medianhospital charge of US$ 13,276/%TBSA and a medianLOS of 12 days [27]. In comparison, although thecurrent study pavement group had a median of 4%TBSA, an LOS of 12 days, and a median hospital chargefor the hospitalization of US$172,024, the hospitalcharges/%TBSA were US$43,006 and hospital charges/LOS were US$14,335. The different charges between thetwo institutions may be a result of multiple factors thatwere not known for this comparison, such as age, co-
Fig. 5 Pavement-street contact burn literature reports 1970–2018: age comparison of the current burn center cases with other case reports [1, 15,17, 18], Streets of Fire [2], and Saudi Arabia [16]
Kowal-Vern et al. Burns & Trauma (2019) 7:32 Page 11 of 14

morbidities, complications, the frequency of third degreeburns, etc. Recently, Vega et al [23] reported on 173pavement-related burn injuries (2013-2017). More than88 % of these injuries occurred when the ambienttemperature was ≥ 95oF [23]. They also noted that asthe ambient temperature increased, pavement burn in-jury admission increased exponentially [23].Currently, there is much interest in assessing why
some cities are hotter than others. One assessmentmethod is the use of the urban heat island (UHI) indexfor determining how hot a city might be to live in. Deb-bage and Shepherd [28] from the University of Georgiainvestigated the 50 most densely populated cities in theUnited States and determined that the UHI intensity inPhoenix was 0.52℃ to 0.91 oC compared to Las Vegas,which had a lower UHI intensity of -1.37℃ to - 0.44oC.One of the reasons that Las Vegas has a lower UHI in-tensity is that the city consists of approximately 7.5%barren land compared to Phoenix, which is more denselypopulated with buildings and thoroughfares and has lessthan 1% empty land [28]. In addition, Las Vegas ispositioned at a higher above sea elevation (2,011 feet)[29] compared to Phoenix at (1, 200 feet.) [30]. Thehigher the elevation, the cooler the ambient temperaturegradient.Climatologists and city engineers found that adjacent
densely populated and sprawling city development bothcontribute to the UHI intensity, and that non-contigu-ous urban development separated by green spaces maylower the UHI intensity [28]. Another study recom-mended that city planners include more vegetation ad-joining new construction and development to decreasethe UHI intensity [31]. Since the “Streets of Fire” in1995 [2], Phoenix has expanded in size with an increasedpopulation density, and increased concrete, asphalt andother surfaces absorbing and retaining radiant energyduring the day, before the cooling off in the evening,when the surface heat is dissipated into the atmosphere.Another variable which contributes to population dens-ity and expansion of resource needs is the humanelement.There were 225 pavement group cases, the majority of
which were due to being “down” (time spent on theground before getting rescued), falls (not being able toget up), and bare feet. Compared to the other groups,the pavement group was: older, 120 (53%) patients were56+ years old, p <0.0002, and had smaller %TBSA butsimilar lengths of stay. There were 13 (6.0%) fatalities inthe pavement group vs one (4.0%) in the MVC group.Co-morbidities were a major contribution to the mortal-ities in the pavement group elder population. They werethe largest component of the down and fall subset. Inthis contingent, it was frequently unknown how long thepatients were exposed to the hot pavement, how many
were dehydrated, or suffered heat stroke, seizures, orsyncope at the time of their injury. Of the fatalities, themajor co-morbidities in the present study were acuterenal and pulmonary failure and heart disease. The com-bination of hypertension treated with diuretics duringthe hot summer months may have contributed to therenal disease and mortality. A recent article indicated anegative impact of high ambient temperatures on kidneyfunction in patient >75 years old medicated on commonhypertensive drugs [32].Nationally, there were approximately 35 million indi-
viduals 65+ years old in the United States in 2000, andthat number increased to 46.2 million in 2014 becauseof the “baby boomer” generation [33]. It is projected toincrease to 98.2 million in 2060 [33]. In 2015, MaricopaCounty had an estimated four million residents, ofwhom nearly 25% were 55+ years old [33].The biggestcontingent was that of the 60+ years old seniors at 767,477 individuals [33]. In this study, the patients most atrisk for falls and pavement burns were patients 56+years old.It has to be noted that these aged individuals will con-
tinue to settle and populate this area because of the cli-mate, thereby escalating the prospect of continuedincreases in pavement-street contact burns. Utilizing thewisdom from the past, a SunWise program for seniorsthrough the State Department of Human Services can bedeveloped and promoted on TV, libraries, shoppingmalls, and senior centers for public health education toreduce the “down, fall, and barefoot “ pavement-streetcontact burn injuries.
LimitationsThis was a small three-year study of the burn centerregistry information which is provided to the NationalBurn Repository of the American Burn Association. As aretrospective review, bias may have been introduced dueto the medical information obtained from hospital re-cords and coder interpretation of the medical charts.The temperature readings of the heated surface areaswere only three weeks in August; the hottest surfacetemperatures in June and July were not available forcomparison. There were also few MVC and road rashcases for comparison
ConclusionPavement burns have increased since the 1995 publica-tion of the “Streets of Fire”. The majority were due to“down time spent on the ground before getting rescued,”falls, and barefoot excursions. The ambient and surfacetemperatures have not increased significantly since 1995,but reflected the median 2oF increase in ambienttemperature that has contributed to state warming inthis century. The majority of patients in these groups
Kowal-Vern et al. Burns & Trauma (2019) 7:32 Page 12 of 14

have been older adults, 56+ years old. With a higherdeath rate among the patients, pavement burns were sig-nificantly more severe than MVC contact burns. Becauseof baby boomers, it is projected that the senior popula-tion will be increasing in the future. Cities with high po-tential for pavement-street contact burns in the summerneed to be prepared for the attendant health servicesand education this population will require. In addition,future city and desert area expansion may benefit fromproliferation of green spaces throughout the city andoutlying areas to decrease the UHI effect. Future com-parison studies of ambient and surface temperatures inselect city developments with/without green spaces maybe warranted.
AbbreviationsAA: African American; ANOVA: Analysis of variance; BMI: Body mass index;F: Female; GCS: Glasgow Coma Scale; ICU: Intensive care unit;IRB: Institutional Review Board; ISS: Injury Severity Score; LCD: Liquid crystaldisplay; LOS: Length of stay; M: Male; MVC: Motor vehicle crash;OR: Operating room; %TBSA: Percent of Total body surface area; UHI: UrbanHeat Island Index; Vent: Ventilator
AcknowledgementsNone
Authors’ contributionsAKV and KF contributed to the research, intellectual analysis, writing, andediting to this manuscript. MM, MP, AJ, KR, and KR participated in thepreparation, research, and editing of this manuscript. All authors read andapproved the final manuscript.
FundingNone
Availability of data and materialsData and materials are available from the corresponding author.
Ethics approval and consent to participateIRB approved by the Maricopa Integrated Health System in Phoenix, Arizona
Consent for publicationObtained from the burn center
Competing interestsMarc R. Matthews, M.D., is a surgical consultant and is on the SpeakersBureau of Steadmed/Urgo (Ft. Worth, Texas) and KCI, a company of Acelity,San Antonio, Texas. Kevin N. Foster—grant/research support: Atox-Bio,BARDA, Polynova, Mallinckrodt, MediWound, MiMex, Avita, and Stratech; con-sultant: Baxter, Skingenix, and Integra.
Received: 1 April 2019 Accepted: 13 August 2019
References1. Berens J. Thermal contact burns from streets and highways. JAMA. 1970;214:
2025–2026.2. Harrington WZ, Strohschein BL, Reedy D, Harrington JE, Schiller WR.
Pavement temperature and burns: Streets of Fire. Ann Emerg Med. 1995;28:563–568.
3. Sinha M, Salness R, Foster K, Fenn R, Hannasch C. Accidental foot burns inchildren from contact with naturally heated surfaces during the summermonths: experience from a regional burn center. J Trauma Injury InfectionCrit Care. 2006;61:975–978.
4. Rimmer RB, Bay CR, Foster K, Jones MA, Wadsworth M, Lessard C, et al.Thermal injury in patients with seizure disorders: an opportunity forprevention. J Burn Care Res. 2007;28:318–23.
5. Henriques FC, Moritz AR. Studies of thermal injury. I. The conductionof heat to and through skin and the temperatures attained therein:a theoretical and experimental investigation. Am J Pathol. 1947;23:530–549.
6. Moritz AR, Henriques FC. Studies of thermal injury. II. The relativeimportance of time and surface temperature in the causation ofcutaneous burns. Am J Pathol. 1947;23:695–720.
7. Moritz AR. Studies of thermal injury. III. The pathology and pathogenesis ofcutaneous burns: an experimental study. Am J Pathol. 1947;23:915–941.
8. Burn Foundation: http://www.burnfoundation.org and water temperatures.Accessed 26 Aug 2019.
9. Clifton T, Khoo T-W, Andrawas A, Thomson S, Greenwood JE. Variation ofsurface temperatures of different ground materials on hot days: burn risk forthe neuropathic feet. Burns. 2016;42:453–456.
10. Rumney TN, Jimenez RA. Pavement temperatures in the SouthwestHighway. Research Record. 1969;361:1–13.
11. Way GB. Environmental factor determination from in-place temperature andmoisture measurements under Phoenix pavements. Arizona Department ofTransportation, 1980; Report #FHWA/AZ-80/157.
12. EPA What climate change means for Arizona. August 2016; EPA 430-F-16-005. https://19january2017snapshot.epa.gov/sites/production/.../2016.../climate-change-az.... Accessed 19 Jan 2019.
13. Facts about 100 degree temperatures for Phoenix. http://southwestweather.com/wx/wx100degreeday.php. Accessed 19 Jan 2019.
14. https://www.timeanddate.com/weather/usa/Phoenix/historic?month=6&year=2016 (year = 2017 and year = 2018) Accessed 1 April- September30 2016 to 2018.
15. Fried M, Kahanovitz S. Dagan (Reiss) R. Full thickness foot burn of a pilgrimto Mecca. Burns. 1996;22:644–5.
16. Al-Qattan MM. The “Friday Mass” burns of the feet in Saudi Arabia. Burns.2000;26:102–110.
17. Silver AG, Zamboni WA, Baynosa RC. Operative management of acutepavement burns: a case series. J Wound Care. 2014;23:563–570.
18. Vardy DA, Khoury M, Ben-Meir P, Ben-Yakar, Shoenfeld Y. Full thicknessburns caused by contact with the pavement in a heat-stroke victim. Burns.1989;15:115–116.
19. Hubert C. He suffered severe burns at the hands of police. Now he wantsmore than $26 million. (Citrus Heights, CA) Sacramento Bee, February 07,2018 04:00 AM. https://www.sacbee.com/news/local/article198742299.html.Accessed 2 May 2019.
20. Ludwig A. Hot Pavement Burns Feet; 2nd Degree Burns In Seconds,Southland Mom Says. PATCH; Jun 23, 2016 | Updated Aug 28, 2017. https://patch.com/california/newportbeach/huntington-beach-oc-mom-warns-dangers-2nd-degree-burns-hot-pavement. Accessed 2 May 2019.
21. Riga R. Toddler suffers second degree burns from metal plate in IpswichPark, ABC NEWS. November 8, 2018. https://www.abc.net.au/news/2018-11-08/toddler-burns-feet-standing-on-metal-plate-ipswich-park/10477340.Accessed 2 May 2019.
22. Scanlan R. A Perth mum has warned about the dangers of hot pavementafter her 14-month-old suffered severe burns to both his feet. news.com.au . January 17, 2019. https://www.news.com.au/lifestyle/parenting/kids/toddler-suffers-awful-burns-to-feet-after-walking-on-hot-path/news-story/4e9ff68714a44cbdd72cd5683e1dccd3. Accessed 2 May 2019.
23. Vega J, Chestovich P, Saquib S, Fraser D. 5-year review of pavement burnsfrom a desert burn center. J Burn Care Res. 2019;40:422–6.
24. Phoenix, Arizona Population History 1950 - 2017. https://www.biggestuscities.com/city/phoenix-arizona. Accessed 26 Aug 2019.
25. Race and Ethnicity in Phoenix, Arizona. Updated on September 4,2018, v1.1.d365c65b1203feeabd268194a484a408c4d69da0. https://statisticalatlas.com/place/Arizona/Phoenix/Race-and-EthnicityAccessed 13 Sept 2019.
26. SunWise Program. http://www.azdhs.gov/phs/sunwise. Accessed 9 January 2019.27. Silver AG, Dunford GM, Zamboni WA, Baynosa RC. Acute pavement burns: a
unique subset of burn injuries: a five-year review of resource use and costimpact. J Burn Care Res. 2015;36:e7-e11.
28. Debbage N, Shepherd JM. The urban heat island effect and city contiguity.Computers Environ Urban Systems. 2015;54:181–94.
29. Geographic coordinates of Las Vegas, NV, USA. https://dateandtime.info/citycoordinates.php?id=5506956. Accessed 12 Sept 2019.
30. Geographic coordinates of Phoenix, AZ, USA. http://dateandtime.info/citycoordinates.php?id=5308655. Accessed 6 May 2019.
Kowal-Vern et al. Burns & Trauma (2019) 7:32 Page 13 of 14

31. Wang C, Myint SW, Wang Z, Song J. Spatial-temporal modeling of theurban heat island in the Phoenix metropolitan area: land use changeimplications. Remote Sens. 2016;8:185(1-17).
32. Sagy I, Vodonos A, Novack V, Rogachev B, Haviv YS, Barski L. The combinedeffect of high ambient temperature and antihypertensive treatment on renalfunction in hospitalized elderly patients. PLoS ONE. 2016;11(12):e0168504.
33. Wolfersteig W, Funke MDL, Yoder G, Kasunic ML. Older adult needs in MaricopaCounty. ASU- Southwest Interdisciplinary Research Center. 2017;1-57.
Kowal-Vern et al. Burns & Trauma (2019) 7:32 Page 14 of 14