Operations & Production Management Subject: Rockford Motor Systems Systems Operations & Production...
48
Warsaw University of Technology Operations & Production Management Subject: Rockford Motor Systems Maksymilian Kędzierski Jakub Borowski Warsaw, 2013
Transcript of Operations & Production Management Subject: Rockford Motor Systems Systems Operations & Production...
Warsaw University of Technology
Operations & Production Management Subject: Rockford Motor Systems
Maksymilian Kędzierski Jakub Borowski
Warsaw, 2013

PAGE 2
Warsaw University of Technology / Faculty of Production Engineering / Institute for Organization of Production Systems Operations & Production Management / Rockford Motor Systems
Table of Content
1. Introduction............................................................ 3
2. Mission of the company ......................................... 4
3. Vision of the company ............................................ 5
4. SWOT Analysis ........................................................ 6
5. Balanced Scorecard ................................................ 7
6. Strategy Map .......................................................... 8
7. Ishikawa – Cause and Effect diagram ...................... 9
8. Strategic Vision ..................................................... 12
9. ISO/IEC 27001:2005 .............................................. 13
10. Kaizen ................................................................... 17
11. Theory of Constraints (ToC) and SMED ................. 22
12. Total Productive Maintenance (TPM) ................... 29
13. Just-in-time (JiT) ................................................... 39
14. Intelligent Organization ........................................ 45
15. Overall schedule ................................................... 48

PAGE 3
Warsaw University of Technology / Faculty of Production Engineering / Institute for Organization of Production Systems Operations & Production Management / Rockford Motor Systems
1. Introduction
Rockford Motor Systems, established in 1970, is an enterprise operating in the automobile industry. It produces a range of car parts – initially only driving axles for Rambler, to expand the activity to camshafts and low-power electric motors of various applications. The significant sign of the success of the company is the Original Equipment Manufacturer status obtained in 1990. In the beginnings, the company employed 80 people and currently the number has grown to 275 employees.
The company consists of two departments – Mechanical Processing and Assembly. The first one deals with the whole process of production of camshafts and driving axles and some elements supplying the Assembly Department. It is done with the use of conventional machining equipment.
The Assembly Department workers manually conduct the process of assembly of the rest of the enterprise manufactures. Company also cooperates with customers from both Americas and Europe. The reason for the analysis that would be conducted is a plan to enter the Asian market in the near future. It would mean the predicted rise in the total demand of about 100%. To make it more smooth and predictable the company would need rather radical changes in the way it functions and this in turn has to be based on a reasonable plan. The aim is to make the Assembly Department independent of the external suppliers, so that all the required components would be supplied by the Mechanical Processing Department.
The enterprise wants to increase its production capacity not only by building new facilities or purchasing machinery, but as a vital point also by reorganising the processes and implementing the modern solutions for organising the production. It would require the thorough analysis of the current situation in a wide spectre of aspects.

PAGE 4
Warsaw University of Technology / Faculty of Production Engineering / Institute for Organization of Production Systems Operations & Production Management / Rockford Motor Systems
2. Mission of the company
The mission of the company is a statement of the purpose of the activity that has a clear vision of the current and future business operations related to a product, service or market, as well as a system of values and principles and characteristics that distinguish it from competitors. This declaration sets out the direction in decision-making at all levels of the organizational structure that makes the entire organisation more flexible.
Rockford Motor Systems mission is built on several pillars. These are:
Only highest quality of the products, Customer satisfaction as the highest value, Respect for the environment, Employees’ satisfaction, Development of the neighbouring community.
These assumptions are the determinants of the company’s development and serve as the guidelines for all the employees.

PAGE 5
Warsaw University of Technology / Faculty of Production Engineering / Institute for Organization of Production Systems Operations & Production Management / Rockford Motor Systems
3. Vision of the company
The vision is the desired future state of the organization. It is a picture of the future of the company and its target market position. It consists of goals and aspirations related to the business, a representation of the future resulting from the analysis of the current situation and the imagination and ambition of managers. The vision of Rockford is clearly stated in the provided documents. It is:
"To become the leader in motor products trade, to deliver products
of the highest quality and the best services to its customers" As it can be seen, there are the main points of the mission included in the vision
statement – highest quality of products and service. They are then the means for achieving a goal – becoming a leader in motor products trade.
In 10 years RMC want to be competitive in Asian markets as well as in Europe, North and Latin America. We will produce motor parts for new clients which will lead, to increased demand which was also predicted by forecasts. Currently company is not producing any of motors for Honda but in the future we are going to produce 250 pieces per month.
According to external consultations which predicted increasing demand, RMS are making preparations to product all of components needed for production.

PAGE 6
Warsaw University of Technology / Faculty of Production Engineering / Institute for Organization of Production Systems Operations & Production Management / Rockford Motor Systems
4. SWOT Analysis
Strengths
High brand recognition Good financial condition Large variety of products OEM status Long-term cooperation with contractors Skilled and experienced employees
Weaknesses
No information system (database) No internal communication system
(mostly verbally) Frequent delays on the assembly line Poor inventory control Trainings not corresponding to needs Shortage in time for trainings New products, technology not well-
known Bad production organisation No communication procedures Information lost between departments High share of indirect costs High share of maintenance cost
Opportunities
Possibility of entering new markets Fast development of companies
(contractors) in emerging markets Lower production costs in Asia Demand increase in the home market
forecasted training improvement commonly used automation inventory
control systems Development of new technologies Government investments in transport
infrastructure near plant
Threats
Dependence on parts' suppliers Environmental limitations Demand lower than forecasted High distance from the customers Lower cost competitors Currency rates fluctuations
PAGE 7
Warsaw University of Technology / Faculty of Production Engineering / Institute for Organization of Production Systems Operations & Production Management / Rockford Motor Systems
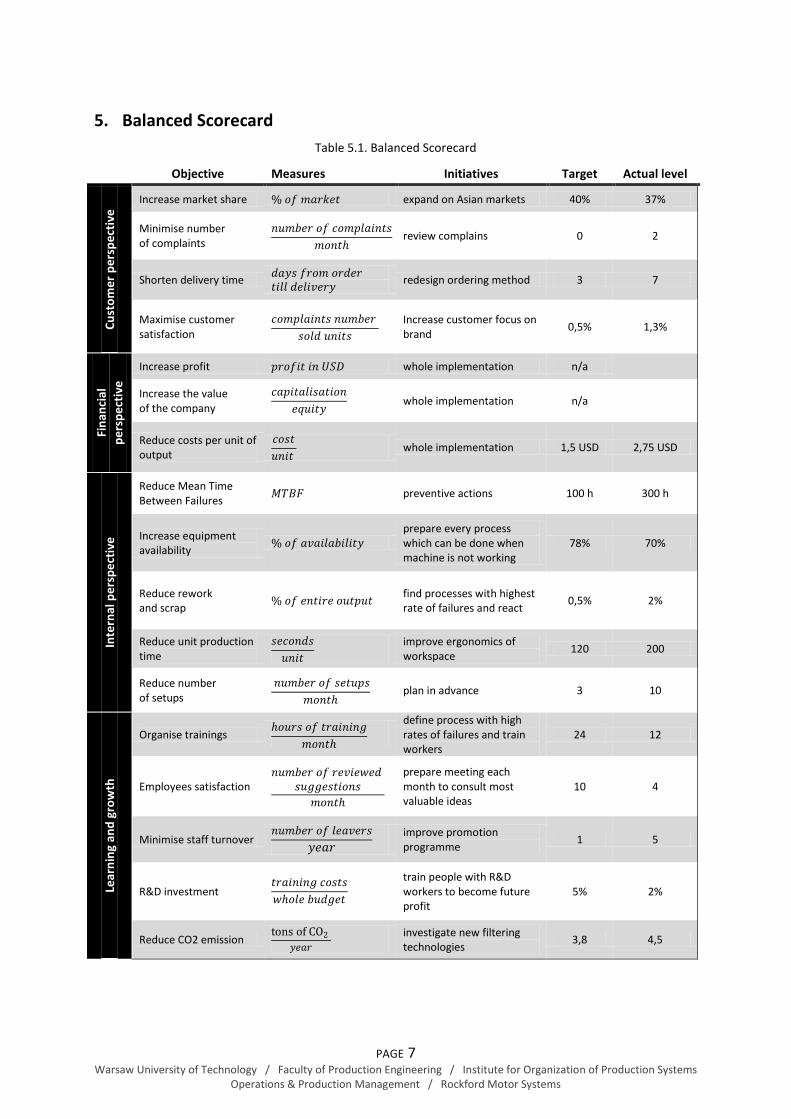
5. Balanced Scorecard
Table 5.1. Balanced Scorecard
Objective Measures Initiatives Target Actual level
Cu
sto
me
r p
ersp
ect
ive
Increase market share expand on Asian markets 40% 37%
Minimise number of complaints
review complains 0 2
Shorten delivery time
redesign ordering method 3 7
Maximise customer satisfaction
Increase customer focus on brand
0,5% 1,3%
Fin
anci
al
pe
rsp
ect
ive
Increase profit whole implementation n/a
Increase the value of the company
whole implementation n/a
Reduce costs per unit of output
whole implementation 1,5 USD 2,75 USD
Inte
rnal
pe
rsp
ect
ive
Reduce Mean Time Between Failures
preventive actions 100 h 300 h
Increase equipment availability
prepare every process which can be done when machine is not working
78% 70%
Reduce rework and scrap
find processes with highest rate of failures and react
0,5% 2%
Reduce unit production time
improve ergonomics of workspace
120 200
Reduce number of setups
plan in advance 3 10
Lear
nin
g an
d g
row
th
Organise trainings
define process with high rates of failures and train workers
24 12
Employees satisfaction
prepare meeting each month to consult most valuable ideas
10 4
Minimise staff turnover
improve promotion programme
1 5
R&D investment
train people with R&D workers to become future profit
5% 2%
Reduce CO2 emission
investigate new filtering technologies
3,8 4,5
PAGE 8
Warsaw University of Technology / Faculty of Production Engineering / Institute for Organization of Production Systems Operations & Production Management / Rockford Motor Systems
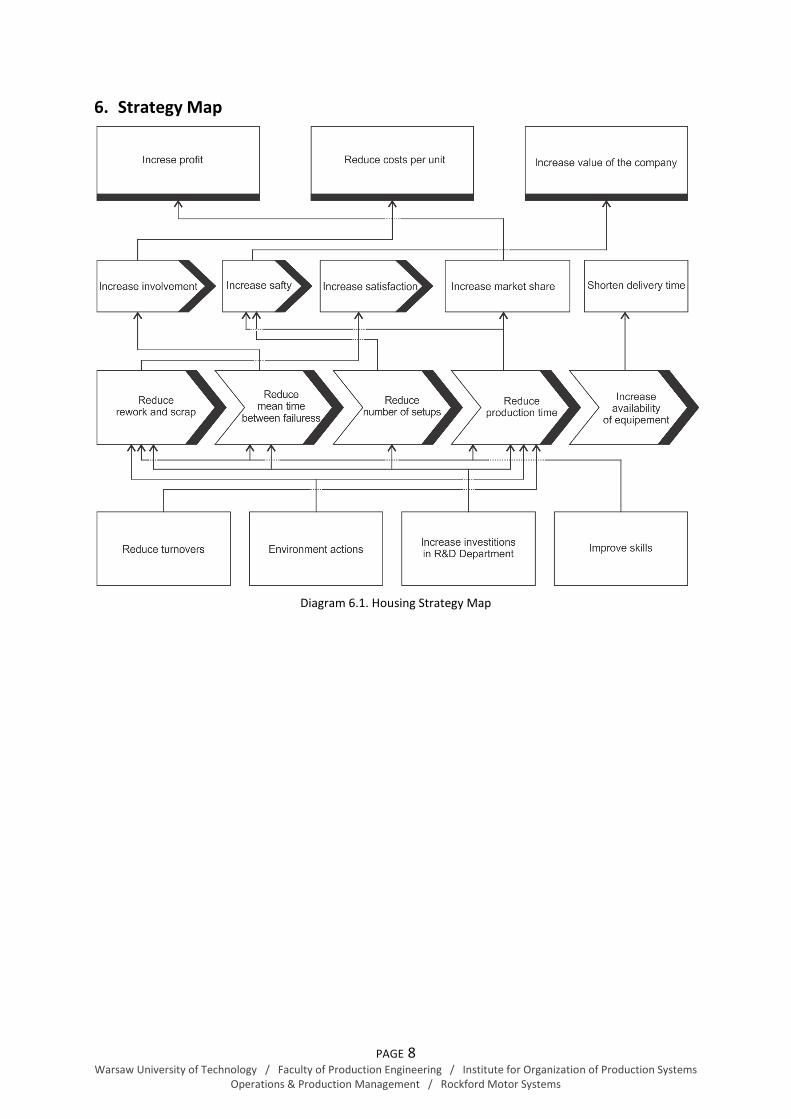
6. Strategy Map
Diagram 6.1. Housing Strategy Map
PAGE 9
Warsaw University of Technology / Faculty of Production Engineering / Institute for Organization of Production Systems Operations & Production Management / Rockford Motor Systems
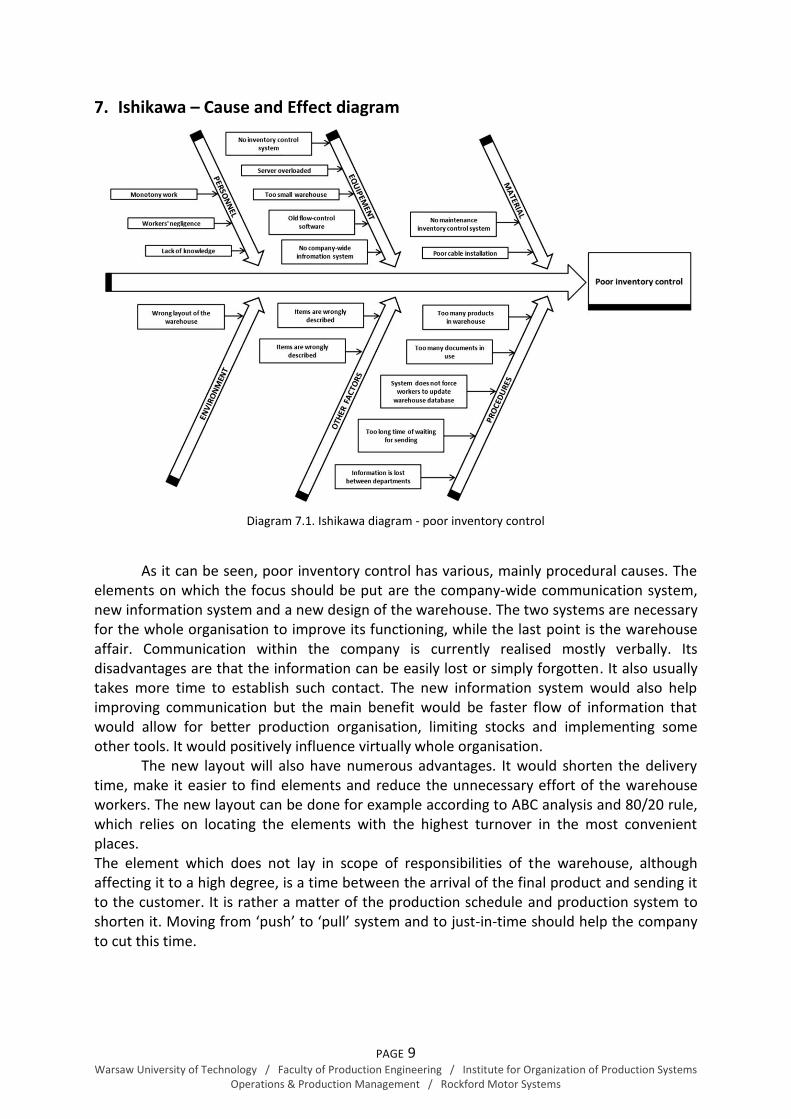
7. Ishikawa – Cause and Effect diagram
Diagram 7.1. Ishikawa diagram - poor inventory control
As it can be seen, poor inventory control has various, mainly procedural causes. The elements on which the focus should be put are the company-wide communication system, new information system and a new design of the warehouse. The two systems are necessary for the whole organisation to improve its functioning, while the last point is the warehouse affair. Communication within the company is currently realised mostly verbally. Its disadvantages are that the information can be easily lost or simply forgotten. It also usually takes more time to establish such contact. The new information system would also help improving communication but the main benefit would be faster flow of information that would allow for better production organisation, limiting stocks and implementing some other tools. It would positively influence virtually whole organisation.
The new layout will also have numerous advantages. It would shorten the delivery time, make it easier to find elements and reduce the unnecessary effort of the warehouse workers. The new layout can be done for example according to ABC analysis and 80/20 rule, which relies on locating the elements with the highest turnover in the most convenient places. The element which does not lay in scope of responsibilities of the warehouse, although affecting it to a high degree, is a time between the arrival of the final product and sending it to the customer. It is rather a matter of the production schedule and production system to shorten it. Moving from ‘push’ to ‘pull’ system and to just-in-time should help the company to cut this time.

PAGE 10
Warsaw University of Technology / Faculty of Production Engineering / Institute for Organization of Production Systems Operations & Production Management / Rockford Motor Systems
Diagram 7.2. Ishikawa diagram - technology of new products not well-known
The company is not much familiar with the technology of the new products. That is because they have not dealt with it before and so the staff does not have experience and deep knowledge about it. What is more, no trainings or consultations have been organised so far to discuss the new products and various aspects of their production. It can allow the company to avoid unexpected problems. However, at the beginning of new production, some time has to be found to organise the trainings or meetings. That is a problem now because of the current overloaded schedule. Taking into account high prices of the new materials it is desirable to negotiate them with the vendors and establish some system of reworking scrap, if possible. The problem of financial nature also exists – the research infrastructure is old and should be replaced in order to make more up to date. It requires high investment, although the benefits are also significant.
A conclusion here is that the company has to liquidate the most important causes from the described. The tools which can be helpful are Theory of Constraints, Kaizen and Total Quality Management. They do not provide the solutions ready to apply in order to eliminate these causes, but rather tools that would indirectly lead to that.
PAGE 11
Warsaw University of Technology / Faculty of Production Engineering / Institute for Organization of Production Systems Operations & Production Management / Rockford Motor Systems
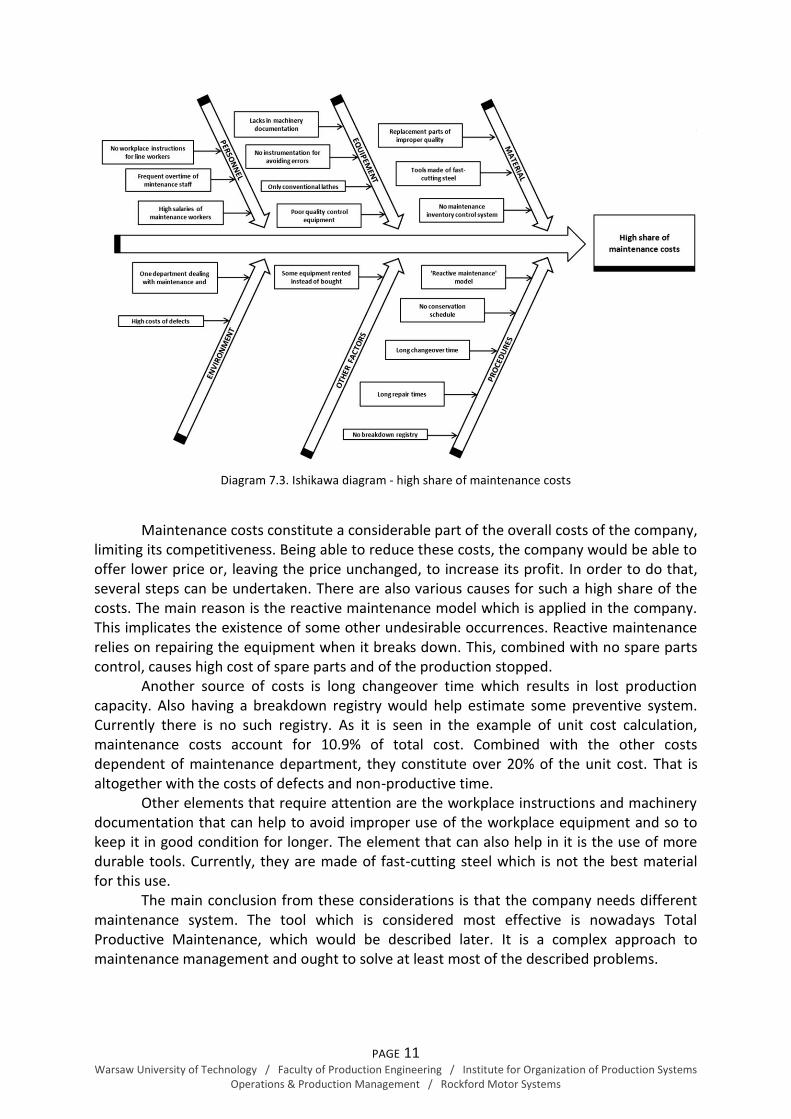
Diagram 7.3. Ishikawa diagram - high share of maintenance costs
Maintenance costs constitute a considerable part of the overall costs of the company, limiting its competitiveness. Being able to reduce these costs, the company would be able to offer lower price or, leaving the price unchanged, to increase its profit. In order to do that, several steps can be undertaken. There are also various causes for such a high share of the costs. The main reason is the reactive maintenance model which is applied in the company. This implicates the existence of some other undesirable occurrences. Reactive maintenance relies on repairing the equipment when it breaks down. This, combined with no spare parts control, causes high cost of spare parts and of the production stopped.
Another source of costs is long changeover time which results in lost production capacity. Also having a breakdown registry would help estimate some preventive system. Currently there is no such registry. As it is seen in the example of unit cost calculation, maintenance costs account for 10.9% of total cost. Combined with the other costs dependent of maintenance department, they constitute over 20% of the unit cost. That is altogether with the costs of defects and non-productive time.
Other elements that require attention are the workplace instructions and machinery documentation that can help to avoid improper use of the workplace equipment and so to keep it in good condition for longer. The element that can also help in it is the use of more durable tools. Currently, they are made of fast-cutting steel which is not the best material for this use.
The main conclusion from these considerations is that the company needs different maintenance system. The tool which is considered most effective is nowadays Total Productive Maintenance, which would be described later. It is a complex approach to maintenance management and ought to solve at least most of the described problems.

PAGE 12
Warsaw University of Technology / Faculty of Production Engineering / Institute for Organization of Production Systems Operations & Production Management / Rockford Motor Systems
8. Strategic Vision
In order to achieve the assumed goals, some strategy has to be chosen. The implementation would be based on cone concept that involves production management tools and techniques.
Diagram 8.1. Model of continuous improvement
Out of the elements forming the cone, one of each level and from the core are to be chosen and implemented. The components which were chosen by the group are:
TQM – Total Quality Management 1. ISO 27001:2005 2. Kaizen 3. TOC – Theory of Constraints 4. TPM – Total Productive Maintenance 5. JIT – Just-in-Time 6. CIM – Continuous Improvement Management 7. Intelligent organisation 8. The order of implementing is as listed.
The specific goals, already presented in the balanced scorecard, which were decided to focus on, are:
Increase market share Reduce costs per unit of output Increase equipment availability Organise trainings
Some other elements, resulting from the Ishikawa diagrams analysis are: 1. Improving inventory control. 2. Acquiring the knowledge about new products technology and organise trainings
about it for employees. 3. Reduce maintenance and maintenance-related costs.
PAGE 13
Warsaw University of Technology / Faculty of Production Engineering / Institute for Organization of Production Systems Operations & Production Management / Rockford Motor Systems
9. ISO/IEC 27001:2005
ISO (International Standardization Organization) and IEC (International Electronic Commission) are making together specialized normalization system. ISO 27001:2005 was prepared to present a model and settlements for implementations, exploitations, reviewing, maintaining and constant improvement of Information Security Management Systems (ISMS). Implementing this standard has to be a strategic choice. Projecting and implementing should consider such aspects as: security requirements, realized processes, size and structure of the company.
Introduction
In order to achieve smooth and secure information flow between specific operations, company decided to implement and maintain a ISO 27001 which will increase productivity and reduce scrap. It will also help in reducing unit cost, which is crucial because of huge competition on Asian market. Other benefit from implementation should be increased workers satisfaction. The new organization of Information Management is supposed to take some responsibilities from them and make them focus on manufacturing and maintain high quality.
ISO 27001 uses process approach to implement, explore, monitor, maintain and improve. This standard is based on Plan-Do-Check-Act model. It is fitted to ISO 9001:2000 and ISO 14001:2004 to support integrated implementation. One well-designed management system can fulfil all of standards requirements. It can be implemented in any kind of organization. It defines management implementation requirements
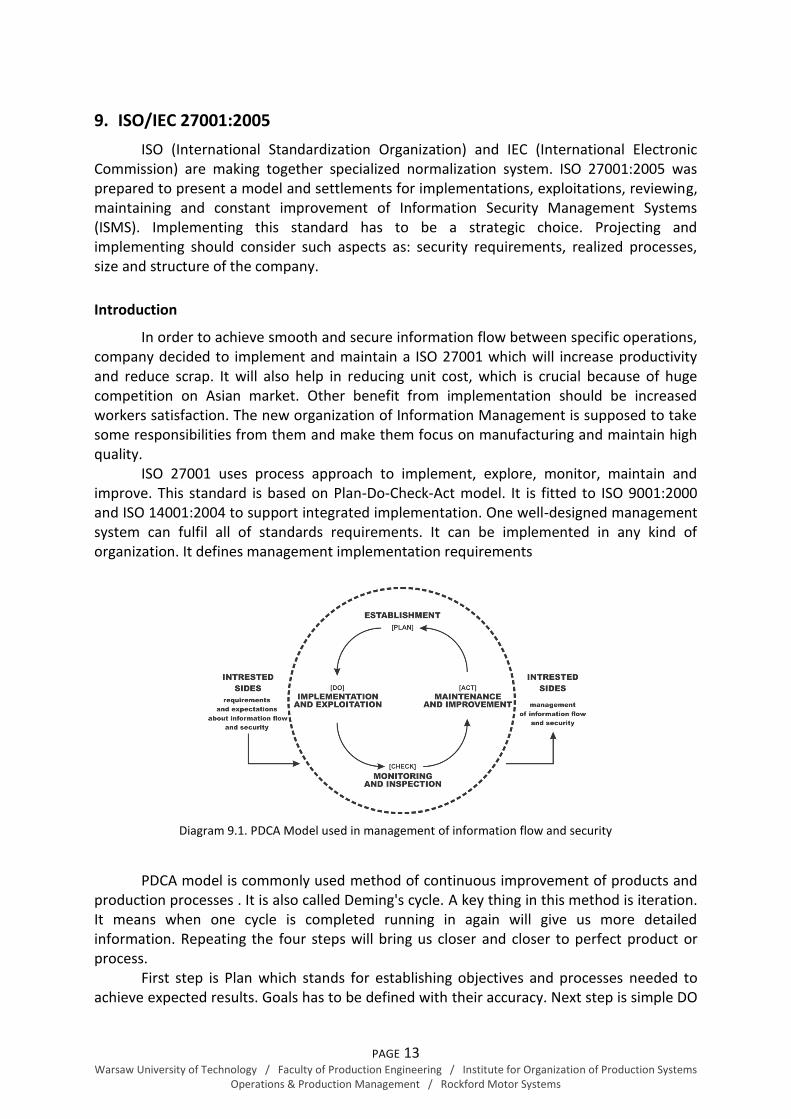
Diagram 9.1. PDCA Model used in management of information flow and security
PDCA model is commonly used method of continuous improvement of products and production processes . It is also called Deming's cycle. A key thing in this method is iteration. It means when one cycle is completed running in again will give us more detailed information. Repeating the four steps will bring us closer and closer to perfect product or process.
First step is Plan which stands for establishing objectives and processes needed to achieve expected results. Goals has to be defined with their accuracy. Next step is simple DO
PAGE 14
Warsaw University of Technology / Faculty of Production Engineering / Institute for Organization of Production Systems Operations & Production Management / Rockford Motor Systems
which delivers clear statement. Implement designed plan and execute essential processes and produce product with according to new plan. Then there is need to CHECK if improvement plan made any change to final product. For this job some measurements have to be defined. Then our goals defined in first step have to be compared with collected data. Best way to see deviations in time is to make control charts. There are several formula to make those charts, depending on process type. Last step is to ACT or better said adjust between current state and planned one. For instance it can be any point on control chart which shows significant difference from mean. For those points there is a need for corrective action. Analyzing data should also lead to finding root causes of problems. When the root causes are known there is time for eliminating them by determining where to address changes that will improve process or product. Sometimes results show no space for improvement, in this case next iteration of cycle has to more detailed or attention needs to be placed in a different process.
Establishment
Information Security Management System has to be implemented in several ways. First one is to implement information flow system between taking order and parts
process department. Between them, new order is checked for manufacture process correctness.
Second is when processed parts are semi-finished products. Then there is need for information flow between semi-finished product warehouse and order taking bureau and most important assembly process line.
Third implementation takes place between finished product warehouse and order taking bureau.
Fourth is connected with 3rd party suppliers which provide some parts for assembly line. They have to adapt to new requirements as well.
Implementation
Company will achieve goals by: Implementation, development and continuous improvement of quality of Information
security management system based on ISO 27001:2005 Improvement of collaboration with suppliers on own terms Provide new orders standard for clients Workers training to meet new software knowledge requirements Information flow to ensure that warehouse is not overfilled and line availability Reducing Lead Time and downtime for better Asian market entrance Identification, planning and management of connection between processes to achieve
continuous improvement Implementing automated inventory control

PAGE 15
Warsaw University of Technology / Faculty of Production Engineering / Institute for Organization of Production Systems Operations & Production Management / Rockford Motor Systems
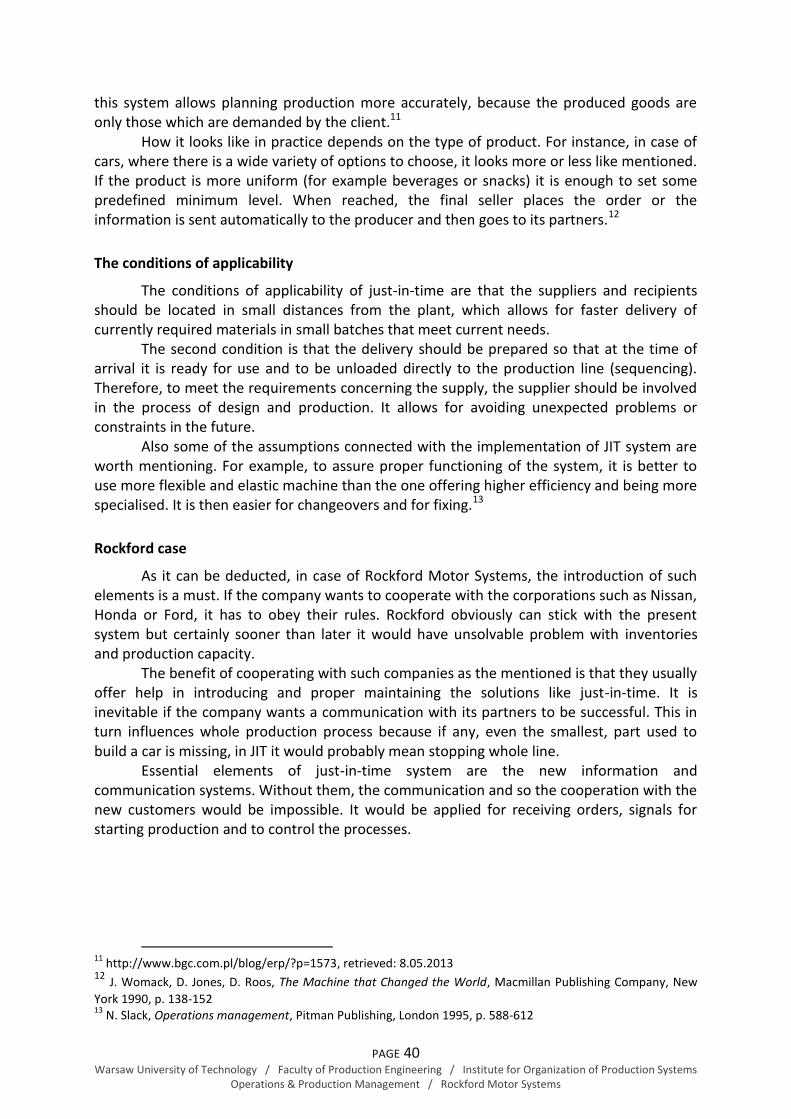
Schedule and costs
Activity Time
[days]
Number of
workers
Man hours
Rate per hour [€]
Date begin Date end
1 Choosing proxy for ISO 27001
0,5 1 2 15 1 January 2013 2 January 2013
2 Designing schedule 2 2 24 15 2 January 2013 4 January 2013
3 Meeting with CEO and choosing crucial point of implementation
1 1 6 15 4 January 2013 5 January 2013
4 Design process map 2 2 24 15 5 January 2013 7 January 2013
5 Preparing and spreading information flow policy
12 2 144 15 7 January 2013 19 January 2013
6 Following and reviewing current information flow
10 2 120 15 19 January 2013 29 January 2013
7 Conducting training 20 4 480 15 29 January 2013 18 February
2013
8 Introducing descriptions of procedures
10 6 360 15 18 February
2013 28 February
2013
9 Implementation procedures
10 6 360 15 28 February
2013 10 March 2013
10 Creating documentation of implemented stages
4 4 96 15 10 March 2013 14 March 2013
11 Reducing lead time 7 2 84 15 14 March 2013 21 March 2013
Diagram 9.1 Gantt diagram
PAGE 16
Warsaw University of Technology / Faculty of Production Engineering / Institute for Organization of Production Systems Operations & Production Management / Rockford Motor Systems
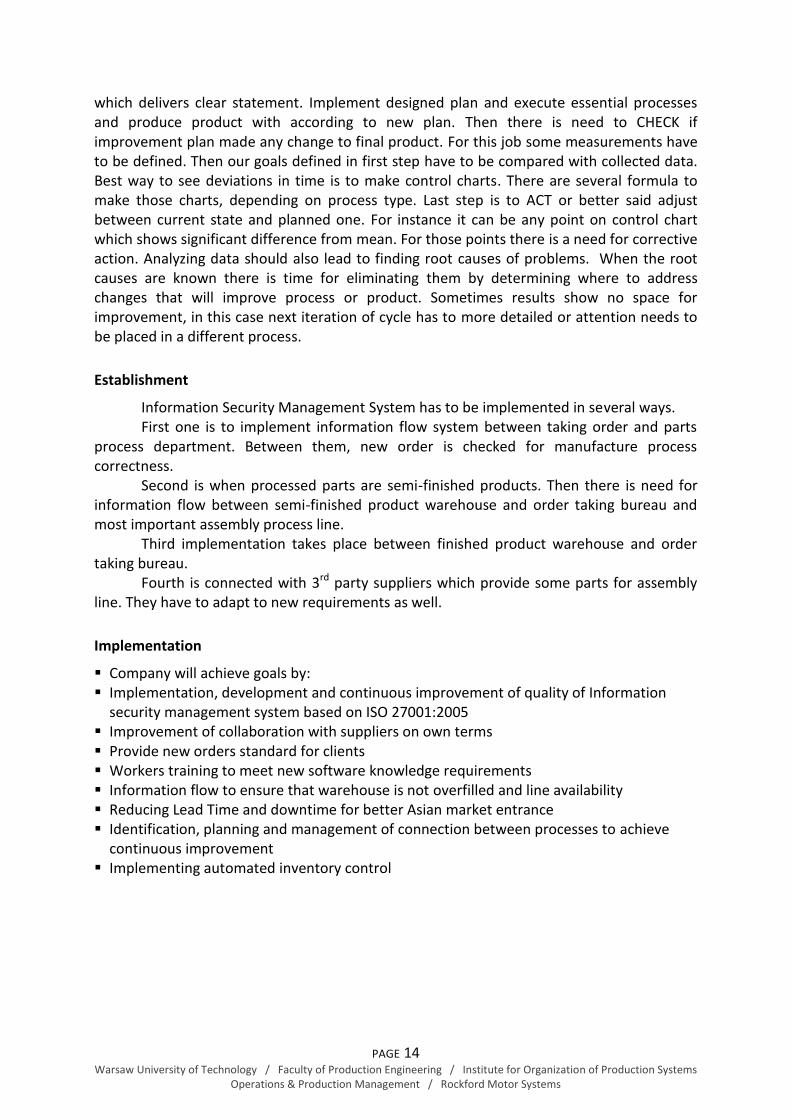
Total cost of investment can be estimated on workers cost and new equipment cost. Total workers cost is 98 500 € during almost 3 moths of implementations. Necessary equipment for this activity such as: displays, power supplies, data loggers, calibrators, transmitters, temperature and humidity control, are about 80 000 € for whole process.
1. Proxy for Information Security Management System is chosen from board of
managers. This step is simple and easy and takes little time that’s why costs for this operation were abandoned.
2. Manager responsible for project is drawing schedule. Its creation is key to specify time needed to fully implement new standard. Schedule also tells us how many people is taking part in each stage and who is responsible.
3. Presenting schedule and elements important from implementation points of view. Determination of employees responsible for implementing various stages.
4. Process map is designed to identify each step and process needed to manufacture as well as interactions between them. It represents data in graphical way.
5. Preparing and spreading information flow policy/ Information flow policy will be a public document for each worker to introduce. Those procedures have to be documented, maintained and available for anyone.
6. Following and reviewing current information flow By following information flow we get complete data about bottlenecks, information losses and mi
7. Conducting training is very important stage. Workers need to know about all changes that will be made as well as future possibilities. It is needed to have at least one perfectly informed worker per shift in case of any questions and problems.
8. Purpose of introducing descriptions of procedures is to determine and standardize reactions for specific actions.
9. Approved by management and CEO procedures are transferred to employees responsible for specific stages
10. Creating documentation of implemented stages. When all procedures are already implemented there is a need to write down every step which was taken. This document will consist of recommendations, precautions, and all general information about information flow
11. Reduce in Lead Time investigate if lead time shorten and if how big was the gain
PAGE 17
Warsaw University of Technology / Faculty of Production Engineering / Institute for Organization of Production Systems Operations & Production Management / Rockford Motor Systems
10. Kaizen
In simple words, Kaizen directs the company towards products of better quality and more efficient production process. Kaizen bases mainly on constant improvements and alterations to a better state.
Kaizen aims for eliminating any waste present in the company. There are 7 main types of waste mentioned in most of the Toyota Production System handbooks:
Over-production Inventories Transport Motion Waiting Over-Processing Defects
Kaizen’s rotating process flow consists of 4 following actions: Plan, Do, Check, Act, so called Deming cycle described before. It helps the company standardise the solutions which were created thanks to the continuous improvement practices.
In fact, continuous improvement is a basic element of most of the modern methods in production management. Some elements of this philosophy have already been introduced at the previous stage – ISO implementation. However, it applied mostly to the information system and at the current point it would be introduced for the entire factory.
It has 10 main rules:
1. Problems generate opportunities to develop and innovate. 2. Use 5-Why method – Keep asking why until you get the deepest root of the
problem. 3. Money is not only answer. You can improve many things by wise actions, your
intuition and efforts to make things better. 4. Take ideas from all surrounding you people. Each idea can be really valuable. 5. Do not make excuses, look for solutions. Spend your time thinking how you can
do it rather than why you can’t. 6. Look for the easiest solution, do not look for the ideal ones, you will never find.
Simple ideas that have been implemented successfully are a very good ground for further improvements.
7. Set the final goal towards which you head, but focus on what must be done immediately.
8. Don’t worry about things that happened or could have happened. Focus on future.
9. Once the enhancement is done and checked, don’t look back. Keep moving forward with continuous uphill movement and come back only to control the results of changes.
10. Do not rest when you have reached your goal. Kaizen is a continuous process and there is no limit to it.
PAGE 18
Warsaw University of Technology / Faculty of Production Engineering / Institute for Organization of Production Systems Operations & Production Management / Rockford Motor Systems
Some of the problems are already listed in the given scenario. As a result, there are even more opportunities to develop than the number of problems, because each problem is usually quite complex. In order to deal with these problems it is necessary to implement some tools, for instance Employee Suggestion System and 5-Why.
The first element serves as a way of improving communication within an organisation. It enables employees to do it efficiently and usually to address the proper person. It eliminates the problem of disturbances. The Suggestion System can be realised by providing Suggestion Cards and boxes, so every worker is able to give his remark. If the suggestion is implemented and gives a result, the person is awarded with some bonus. Depending on the character of the improvement, it can be calculated as a part of the potential saving or additional revenue for the company or be fixed at some levels.
Another element that can be a part of Suggestion System is organisation of meetings, sometimes called Quality Circles. These are meetings of a number of workers organised to discuss quality issues and to give suggestions that can improve the performance of an organisation. After some time, Quality Circles can be empowered to take some decisions on their own. Such delegation of authority increases employee morale and makes them feel responsible for the company. An obvious benefit from such meetings is an improvement of the company as whole.
The described elements were concerning mainly line workers and low management. However, there are also Kaizen tools for higher management. The basic one that should be present in Rockford is 5-Why.
The solution of a problem and effective corrective actions require the identification of the cause of the problem. If a person does not identify and remove (also only remove already formed inconsistency), he can be sure that the re-emergence of the problem is only a matter of time. It is therefore important to identify the actual cause of the problem and removal it to prevent recurrence of the problem. One of the many ways to determine the cause of the problem is the method of 5-Why.
The principle of application of 5-Why method is asking the question ‘Why?’ five times to create the cause and effect sequence. It starts from the effect, observation and Often the answer for the last question identifies the problem. This method often takes advantage of the group work, which is characteristic of the previously discussed solutions. An example of the use of 5-Why is:
Question 1: Why employee fell over? Answer: The floor was wet
Question 2: Why the floor was wet? Answer: Because water leaked from a leaky valve
Question 3: Why is the valve leaking? Answer: Because the seal was worn out
Question 4: Why seal was worn out? Answer: Because it was replaced 3 years ago
Question 5: Why hasn’t it been replaced for 3 years? Answer: There is no prevention plan in the factory
This simple example illustrates the simplicity and effectiveness of the method. By asking only 5 questions the fundamental cause was identified which is not as simple as a bad seal. The real cause is that the prevention plan omits valve check and this can generate

PAGE 19
Warsaw University of Technology / Faculty of Production Engineering / Institute for Organization of Production Systems Operations & Production Management / Rockford Motor Systems
future problems. By creating a prevention plan not only would the seal be monitored and replaced, but also the rest of the equipment would be taken care of.
5S is a method of creating a clean and organized workplace that exposes waste and makes anomalies visible. 5S stand for 5 Japanese words connected with this ideology, but method origins may not be Japanese at all. 5 rules of this method are:
sort (jap. seiri) straighten (jap. seiton) sweep or shine (jap. seisou) standardize (jap. seiketsu) self-discipline (jap. shitsuke)
The most important improvement of implementing of 5S is in safety area. That means this method always focuses on creating and maintaining workplace as safe as possible. Another visible improvement is in workers' productivity which is result of decluttered clean workplace. The best reason for implementing 5S is its high impact on many production aspects with relatively low costs. 5S is key building part to lean tools and concepts production such as Total Productive Maintenance or Single Minute Exchange of Die.
Schedule and costs
Activity
Time [days]
Number of
workers
Man hours
Rate per
hour [€] Date begin Date end
1 Select target process 2 2 24 15 1 January 2013 2 January 2013
2 Create Team 2 2 24 15 2 January 2013 4 January 2013
3 Set project goals and plans
4 2 48 15 4 January 2013 8 January 2013
4 Observe the process 14 2 168 15 8 January 2013 22 January
2013
5 Analyze the process 6 3 108 15 22 January 2013 28 January
2013
6 Create improvement plan
6 3 108 15 28 January 2013 3 February
2013
7 Implementation 14 3 252 15 3 February 2013 17 February
2013
8 Presentation 4 2 48 15 17 February
2013 21 February
2013
9 Standardize and monitor
14 2 168 15 21 February
2013 7 March 2013

PAGE 20
Warsaw University of Technology / Faculty of Production Engineering / Institute for Organization of Production Systems Operations & Production Management / Rockford Motor Systems
Diagram 10.1 Gantt diagram
Total investment cost consists mostly of workers cost which in this case is 14 220 €. Other costs like plates for instructions and procedures depend on scale of improvement, but comparing to other costs they are low.
Benefits and risks
There are numerous benefits from the introduction. In fact, they are unlimited because of the continuous and universal character of Kaizen. It can be applied for the solution of any problem.
First benefits should be limiting the influence of some factors listed at the beginning – production delays, wrong organisation of trainings and generally bad production organisation. For these it would be a direct aim while to virtually all other factors it would have indirect contribution. Examples of such are poor inventory control or high share of maintenance costs. It may seem that there is no connection between Kaizen and these problems but by listening to employees’ suggestions, applying 5S and 5-Why method for more particular problems, it is possible to get rid of the problems.
Such tools as Quality Circles and Suggestion System apart from the potential for improvements have also a motivational role. They make workers responsible for what they do and make it possible to change their situation for better.
The general benefit from the implementation is waste elimination. Other, more specific benefits result from this one. It is not exactly thanks to the presence of the Kaizen system, but rather the effects of its application so the effect is not visible at the moment of introducing but later – because of suggestions and consultations. Obviously, Kaizen enables company to increase quality of products and minimise costs. Properly applied, it results in higher productivity and reducing the amount of unnecessary work.
The obstacles in the implementation process include: concern about additional costs that may appear, possible resistance of some managers to lose control over the processes,

PAGE 21
Warsaw University of Technology / Faculty of Production Engineering / Institute for Organization of Production Systems Operations & Production Management / Rockford Motor Systems
Lack of belief in the possibility of implementing a proposed solution, short-term thinking, problems seen as negatives, not opportunities to improve.

PAGE 22
Warsaw University of Technology / Faculty of Production Engineering / Institute for Organization of Production Systems Operations & Production Management / Rockford Motor Systems
11. Theory of Constraints (ToC) and SMED
The origins of the Theory of Constraints are linked with the figure of Eliyahu Goldratt – doctor of physics and manager. He used his scientific knowledge and practical experience to formulate the theory. Production Management was the first area of interest of Goldratt while formulating it. This was not without reason - many plants despite having continuous, uninterrupted production achieved results far below their potential. What is more, stocks and work-in-progress often reached unreasonably high levels, and the delay in the supply of products was a normal thing. Goldratt noticed that all these phenomena have a common cause – constraint within the system. He called it the Capacity Constraint Resource (CCR). In the system there is always a CCR, but their number is normally small. Quite surprising is the fact that the theory of constraints considers CCR useful, if managers use them correctly. That is because in the real world the production capacity at every stage of production is limited, so the only way to get rid of the CCR is to balance the plant. However, Goldratt pointed out that such a situation would not only be ineffective but also unpredictable. In the sustainable plant production capacities are balanced in such a way that no resource is wasted, although even then there are some statistical fluctuations.1
Analysing this case, the conclusion arises – the delays or productivity decreases would accumulate and procrastinate all the process but the additional, extra capacity would be wasted. Despite having the machines with the above-average capacity the production capabilities would be limited by the weakest link. However, the fact of becoming aware of the CCR does not solve the problems, that is why TOC has developed its own method designed for production management.2
It is called Drum - Buffer – Rope (DBR) method, because it takes its name from its three constituent elements:
1. Drum
The first thing is to find the DBR assumed limitations. In this method there must be internal constraints. They would be the drum. This means that the production planning process begins with a precise timetable for the work restrictions. In this way we can easily assess the size of the entire production system and the time for the individual elements.
2. Buffer
Theory of Constraints emphasizes how important it is to ensure bottlenecks the conditions to achieve the maximum possible performance. For this reason, buffer is so important in this method. There is a certain specified amount of material to be stored before the bottleneck. Thanks to the buffer, the statistical fluctuations and failures of the non-constrained resources does not affect the volume of bottleneck production, and hence the efficiency of the entire system.
It is worth noting that the buffer size is negatively correlated with spare capacity of the resources prior to the bottleneck. The reason for that is the fact that with the increase in global production (eg. through better use of constraints) the excess capacity is reduced in the stages prior to the CCR, which in turn reduces their ability to refill the buffer.
1 http://www.ciras.iastate.edu/library/toc/, retrieved: 06.06.2013
2 E. Goldratt, What is this Thing Called Theory of Constraints, North River Press, New York 1999, p. 4-6

PAGE 23
Warsaw University of Technology / Faculty of Production Engineering / Institute for Organization of Production Systems Operations & Production Management / Rockford Motor Systems
3. Rope
The concept of a rope involves delivering into the system only as much material as it is necessary to ensure continuous operation of the bottleneck. This means that the downtime can occur, which are in turn believed to be necessary. Goldratt has stressed that the full use of the resource, only to avoid downtime is very harmful for the company. In this way it is possible to reduce the value of work in progress and shorten the production cycle. However, this approach stays in contrary to the Mayority of production incentive systems and the opinion, the employee must work every minute, for which he is paid.3
Goldratt, in the book ‘Theory of Constraints’, establishes an approach to deal with the constraint. It consists of the following steps, which are called ‘The Five Focusing Steps’:
Diagram 11.1. Five Focusing Steps
These steps require: 1. Identify - Identifying the constraint. 2. Exploit - Making quick improvements to the throughput of the constraint using
existing resources (make the most of what you have). 3. Subordinate - Reviewing the rest of the process to ensure that it is aligned with
and supports the needs of the constraint. 4. Elevate - If the constraint still exists, considering what further actions can be
taken to eliminate it from being the limitation. Usually, actions are continued at this step until the constraint has been removed (moved somewhere else). Sometimes, capital investment is required at this point.
5. Repeat - The Five Focusing Steps are a continuous improvement cycle. Therefore, when a constraint is removed, the next constraint should immediately be found. This step is a reminder to never become fully satisfied – after improving the current constraint, immediately move on to the next one. It is similar in principle to the PDCA cycle which is a part of quality management programs introduced before.
The constraint which is considered the most necessary to deal with is a changeover
time of the machines. Currently, it varies from 4 to 8 hours, as for the Mechanical Department. Apart from the approach that results from Theory of Constraints, what would
3 http://www.goldratt.co.uk/resources/drum_buffer_rope/, retrieved: 06.06.2013

PAGE 24
Warsaw University of Technology / Faculty of Production Engineering / Institute for Organization of Production Systems Operations & Production Management / Rockford Motor Systems
be now implemented is Single Minute Exchange of Die tool (SMED). Simply speaking, it is a method used for shortening changeover time by performing all the tasks, for which it is not necessary to stop the machine, without stopping it. The analysis would now be done for one of the lathes from Mechanical Department. The table below presents time structure of the changeover process for a lathe. As it can be easily seen, the reduction is significant but the table requires also an explanation. It is in fact a simplification to be able to compare certain times – before, less processes were performed parallel. What is more, the changeover before reorganising consisted of more operations, which were removed because it was decided that they are not necessary. Examples are: producing more trial parts or intermediary position changes during the changeover. In this way, the time was reduced by approximately 78% - from over 247 to 53 minutes, which gave a result similar to the leading manufacturers. However, surely there is still some space for improvements, because for example the changeover time for considerably large presses in leading companies is as low as about 3 to 5 minutes.
Activity Before After
Clock into setup: 0:00:00 0:00:00
Collets and pushers finished 40:48:00 8:30:00
Left side positions 1-5: 1st worker
•Strip all the tools: 59:24:00 12:22:00
•Put the stock stop head on: 67:53:00 13:48:00
•Put 1st, 2nd and 3rd drills in: 82:48:00 17:15:00
•Set 2nd and 4th forms: 90:00:00 18:45:00
•Put cutoff bushing in 3rd: 101:24:00 21:07:00
•Set 4th position step reamer: 128:24:00 26:45:00
•Set 5th position recess: 134:16:00 27:58:00
Right side positions 6-8: 2nd worker
•Change a position cutoff bushing: 49:04:00 10:13:00
•Set 7th position recess holder: 53:16:00 12:00:00
•Change spindle gears: 72:00:00 15:00:00
•Set 5th and 6th recess bushings: 91:07:00 18:45:00
•Get gages and place on bench: 102:14:00 21:18:00
•Clean and put away gears, tooling: 134:16:00 27:58:00
•Jog machine ahead and change pickoff: 135:27:00 32:15:00
Run machine and finish right side: 1st and 2nd worker
•Feed bar out: 169:44:00 34:30:00
•Index machine to 7th: 175:48:00 36:37:00
•Change 7th cutoff bushing: 182:24:00 38:00:00
•Set 7th position reamer: 189:36:00 39:30:00
All tools in machine are set:
•First piece off: 199:48:00 41:37:00
•Put feed-out cam on: 200:38:00 44:00:00
•Adjust 4th position step reamer: 240:00:00 50:00:00
•First good piece off machine: 246:19:00 52:30:00
Clock out of setup: 247:05:00 53:00:00
Table 11.1. Time structure of changeover process source: http://www.productionmachining.com/articles/changing-your-approach-to-change-over
PAGE 25
Warsaw University of Technology / Faculty of Production Engineering / Institute for Organization of Production Systems Operations & Production Management / Rockford Motor Systems
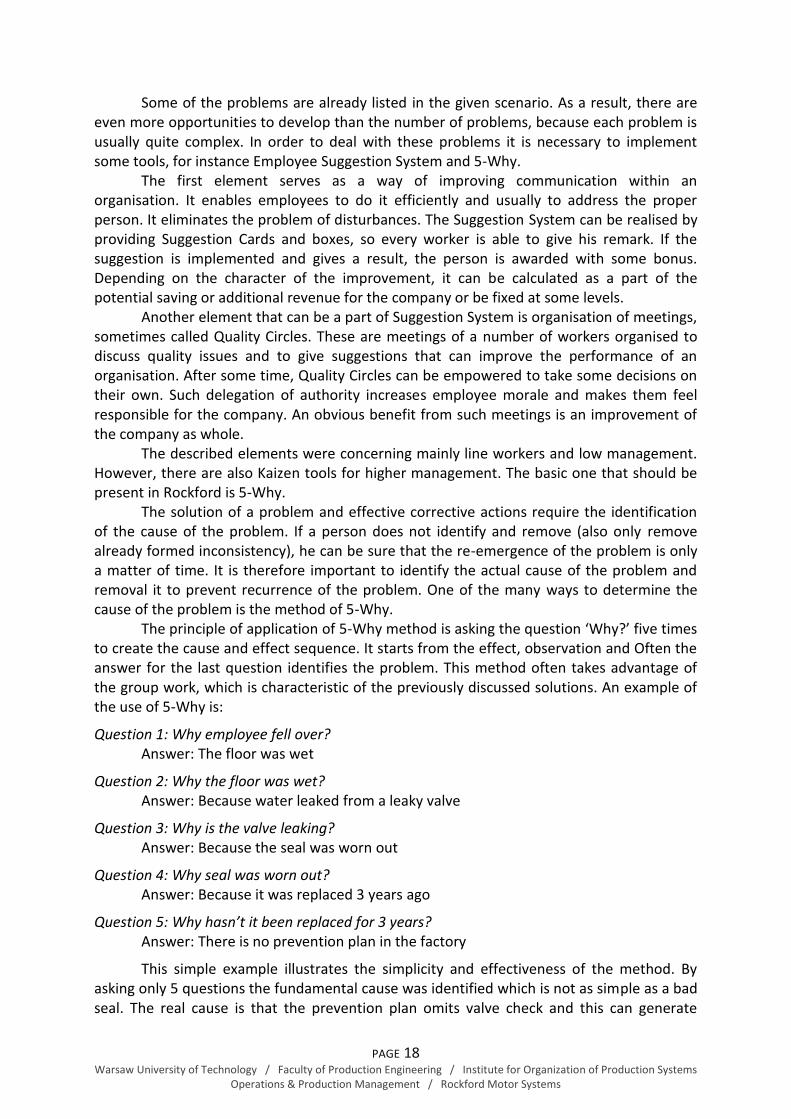
The actions were taken in accordance not only with SMED methodology, but rather with ‘The Five Focusing Steps’ proposed by Goldratt. The actions under each step are:
1. Identify. The constraints were identified and the most critical was chosen – long changeover and setup times.
2. Exploit. The times were measured as shown in the table above, so the duration of each operation was known. Then the results could be consulted with the operators, mechanics and engineers and the whole process could be reorganised. The unnecessary points were removed and, when possible, they were simplified or made simultaneously.
3. Subordinate. Reviewing the rest of the process was also an important point here. Often when one machine is changed over, some other pieces of equipment require it as well, as it is usually connected with the change of product manufactured. It is then vital to ensure that by reducing the changeover time for one machine, it would cause the reduction of lead time. It could happen that the machine would wait for other machines to be set up. Actually, the time reduction should be conducted for all the machines which is surely very time-consuming, yet worth the effort. This would significantly shorten whole lead time and so increase efficiency and productivity.
4. Elevate. The organisation dealt with one constraint of this type, while the changeover time is still long or very long for all the rest. As stated above, the procedure should be repeated for all the machines. It would probably be similar for all the lathes and also some elements can be utilised in case of other machines. The activities that can be performed in order to limit the influence of the constraint are mostly trainings and practicing the new changeover procedure.
5. Repeat. Obviously, the improvement is never perfect. Having the new, better procedures the company should constantly seek for further improvements. The results ought to be regularly measured, recorded and evaluated.
PAGE 26
Warsaw University of Technology / Faculty of Production Engineering / Institute for Organization of Production Systems Operations & Production Management / Rockford Motor Systems
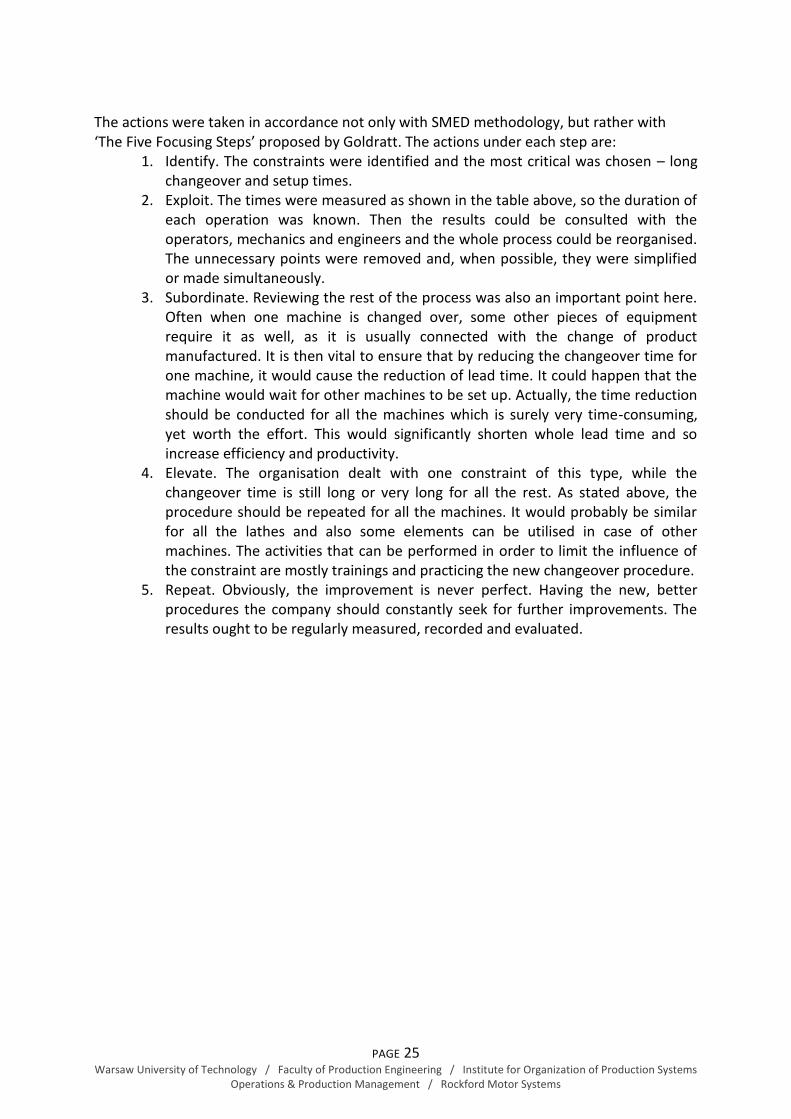
Schedule and costs
Activity
Time [days]
Number of
workers
Man hours
Rate per hour
Date begin Date end
1 Identify the main weaknesses
2 1 12 15 1 January 2013 2 January 2013
2 Find out the root causes of weaknesses
2 2 24 15 2 January 2013 4 January 2013
3 Look for solutions to increase the performance of constraints
4 2 48 15 4 January 2013 8 January 2013
4 Determine parameters for synchronization
2 3 36 15 8 January 2013 10 January 2013
5 Determine the demand ordering management
2 1 12 15 10 January 2013 12 January 2013
6 Synchronize the production
5 2 60 15 12 January 2013 17 January 2013
7 Follow-up buffer stocks 6 2 72 15 17 January 2013 23 January 2013
8 Start continuous improvement workshops
4 2 48 15 23 January 2013 27 January 2013
9 Adjust lots size if necessary 3 1 18 15 27 January 2013 30 January 2013
10 Analyze the work load profiles by resource
3 2 36 15 30 January 2013 2 February 2013
11 Evaluate inventory carrying costs and extra-capacity resources
3 1 18 15 2 February 2013 5 February 2013
12 Forecast the long term demand
2 2 24 15 5 February 2013 7 February 2013
13 Find out the constraints that require investments
2 1 12 15 7 February 2013 9 February 2013

PAGE 27
Warsaw University of Technology / Faculty of Production Engineering / Institute for Organization of Production Systems Operations & Production Management / Rockford Motor Systems
Diagram 11.1. Gantt diagram
Cost of first constraint removal plan is always most expensive. For this, company need a budget of 6 300 €. Comparing to other improvement plans this cost is relatively small. This is because of only few workers needed for this process. Plan can be multiplied to identify and remove constraints faster.
Benefits and risks The benefits of ToC include:
focus on quick, bottom line results
Focus on the most critical elements
Can be applied to all that is done - manufacturing, engineering, projects, business
systems, government systems
It is based on logic
Increased profit
Improved capacity
Reduced lead times
Often reduced inventory
Great solution for kick starting improvement process as it provides immediate and very tangible benefits.
The obstacles for the implementation are:
Some people think it adds inventory that they see as waste
Many people see it in conflict with lean – some TOC practitioners said they were in
conflict only a few years ago
Can be difficult to apply if the demand is hard to foresee
Can be difficult to apply in a jobbing environment

PAGE 28
Warsaw University of Technology / Faculty of Production Engineering / Institute for Organization of Production Systems Operations & Production Management / Rockford Motor Systems
Conclusions
Theory of Constraints is a powerful tool to deal with the limitations within the company. It is very universal and can help eliminate both measurable and immeasurable constraints. In the analysed case the constraint was easy to measure – the time of changeover was far too long. By taking advantage of another method – SMED – it was possible to shorten the time dramatically so the constraint was removed. One machine, however, is not enough and according to the theoretical basis of ToC, it is not a solution. The limitation here was changeover time, treated very generally, so for virtually all the machines. Only when all of them have similar values of such time, the method can be considered successfully introduced. One machine or one type of a machine is a good start – the procedure is created which can be repeated for all the machines and some more specific elements can be also applied for the rest of equipment.
PAGE 29
Warsaw University of Technology / Faculty of Production Engineering / Institute for Organization of Production Systems Operations & Production Management / Rockford Motor Systems
12. Total Productive Maintenance (TPM)
One of the tools which are used for ensuring reliable functioning of the equipment is
Total Productive Maintenance. It is an essential element of the modern production systems, which are usually based on the production flow. In such conditions, virtually every breakdown means losses for the company
According to J. Mikler, maintenance is a daily, systematic work done on the realisation of the planned one-time or periodic tasks in order to prevent degradation in the quality of the equipment and the occurrence of accidents or, if they occur, in restoring their functionality. The duties of the Maintenance Department include organizing, planning, supervision, coordination and control of supporting functions necessary to ensure the full capacity of the production. It is important to note that these tasks should be realised with the effective use of time, equipment and materials.4
To be more specific one can say that the tasks performed by Maintenance Department include:
repairing machinery and equipment, planning and realising preventive activities, planning and realising parts and components replacements when necessary, monitoring working conditions of the equipment, cleaning and lubricating the equipment, adjusting and calibrating the machines, detecting and disposing fault machinery.
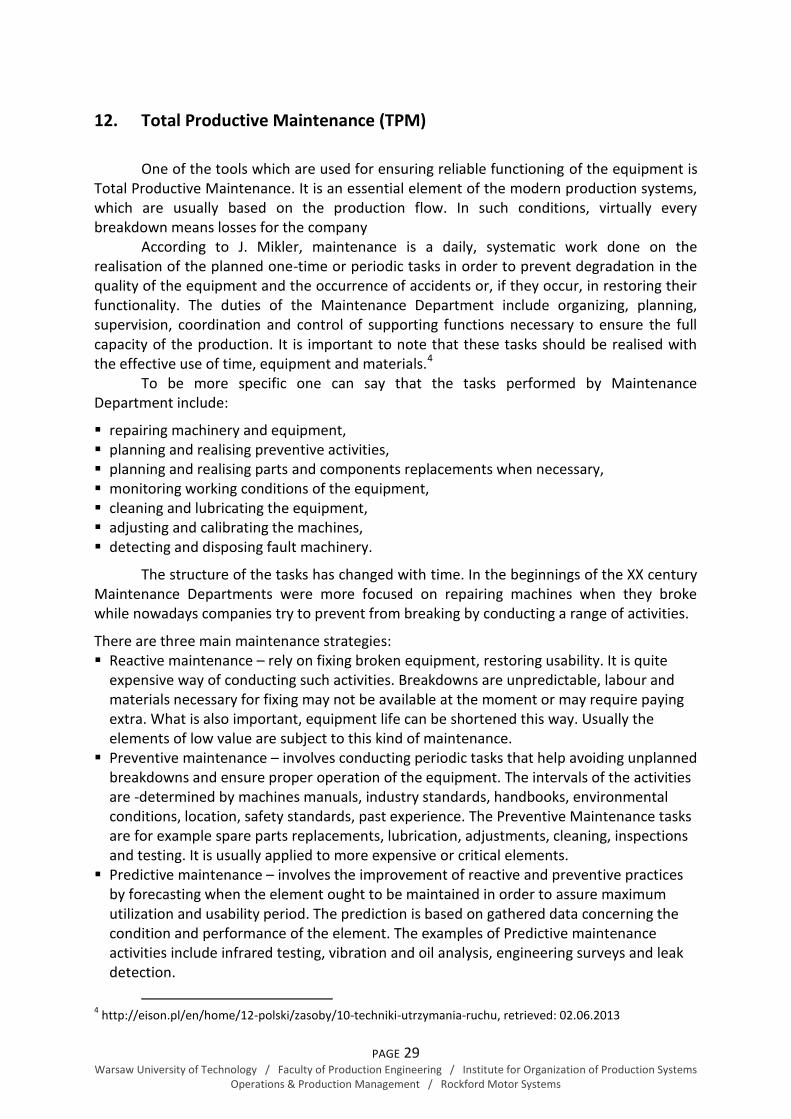
The structure of the tasks has changed with time. In the beginnings of the XX century Maintenance Departments were more focused on repairing machines when they broke while nowadays companies try to prevent from breaking by conducting a range of activities.
There are three main maintenance strategies: Reactive maintenance – rely on fixing broken equipment, restoring usability. It is quite
expensive way of conducting such activities. Breakdowns are unpredictable, labour and materials necessary for fixing may not be available at the moment or may require paying extra. What is also important, equipment life can be shortened this way. Usually the elements of low value are subject to this kind of maintenance.
Preventive maintenance – involves conducting periodic tasks that help avoiding unplanned breakdowns and ensure proper operation of the equipment. The intervals of the activities are -determined by machines manuals, industry standards, handbooks, environmental conditions, location, safety standards, past experience. The Preventive Maintenance tasks are for example spare parts replacements, lubrication, adjustments, cleaning, inspections and testing. It is usually applied to more expensive or critical elements.
Predictive maintenance – involves the improvement of reactive and preventive practices by forecasting when the element ought to be maintained in order to assure maximum utilization and usability period. The prediction is based on gathered data concerning the condition and performance of the element. The examples of Predictive maintenance activities include infrared testing, vibration and oil analysis, engineering surveys and leak detection.
4 http://eison.pl/en/home/12-polski/zasoby/10-techniki-utrzymania-ruchu, retrieved: 02.06.2013

PAGE 30
Warsaw University of Technology / Faculty of Production Engineering / Institute for Organization of Production Systems Operations & Production Management / Rockford Motor Systems
Companies achieving 80% or higher overall equipment efficiency spend just approximately 10% of all maintenance time on repairs. They plan and realise preventive and predictive activities, if possible in the technological breaks time, that allow them to achieve such a high efficiency. It would be very difficult without a computer system which coordinates and manages the activities.
Total Productive Maintenance
TPM is a part of Lean Manufacturing system and sometimes is also referred as a part of Total Quality Management. What makes TPM and TQM similar is the convergence of rules, for example both concepts contain the employee empowerment, individual improvement and quality maintenance postulates. All eight pillars (main ideas) of TPM are presented on the picture below.
The main ideas are to engage all employees in the process of ensuring the technical efficiency of machinery, equipment and tools to enable them to maximise productivity. TPM bases on the delegation of responsibilities for the maintenance of technical equipment to the direct users. These obligations are primarily cleaning, lubrication and daily control as well as observation of the unit during operation. The aim is to prevent faults and failures instead of removing their effects, so move from reactive to preventive and proactive maintenance strategy.
Figure 12.1. TPM Pillars
The ideas of each pillar are then explained below. 1. Autonomous maintenance. It is realised by training of production staff in order to
strengthen mutual cooperation with maintenance personnel. It relies on introducing procedures and auxiliary equipment (e.g. information system) to help the employee identify abnormalities that could lead to loss of control over the process. Normally, the implementation is divided into seven steps:
Cleaning and inspection, Prevention against the causes and effects of pollution, The introduction of standards of cleaning and lubrication Conducting a detailed inspection of equipment, Introduction of standards of autonomous maintenance, Quality assurance process, Continuous improvement - independent supervision.

PAGE 31
Warsaw University of Technology / Faculty of Production Engineering / Institute for Organization of Production Systems Operations & Production Management / Rockford Motor Systems
2. Individual improvement. Costs are reduced through the introduction of a number of low-cost improvements yielding increased efficiency. The improvements are proposed by workers as they know the specific stage of the process well, working on it every day.
3. Planned maintenance. That is an introduction of preventive and predictive maintenance system for the machinery. Maintenance Department is then responsible for the achievement of the longest possible life cycle of machines by:
Properly performed work, Appropriate setting, Cleaning, Lubrication Re-sealing, Repairing small defects, Good quality spare parts.
4. Quality maintenance. It relies on identifying and controlling parameters of machines and devices that affect the quality of the product. The aim is to determine the parameters which produce satisfactory quality of products keeping the price at a reasonable level.
5. Education and training. This pillar can be divided into two areas – training concerning team work and practical skills connected with machinery maintenance.
6. Safety, health and environment. Ensuring safety and preventing negative effects on the environment is a priority for all the actions undertaken within the TPM.
7. Office TPM. The main tasks of maintenance office staff are collecting, processing and distribution of information. That is the element which differs modern systems from the old ones. The most important aim of all the system is cost reduction. To achieve it, they have to be collected and processed in order to identify cost centres and reduce them.
8. Development management. Involves methods that a company uses in order to help its employees in developing skills. That includes trainings, rotations, coaching, promotions and mentoring.
The desired result of introducing TPM in the enterprise is to increase productivity by
reducing the maintenance costs of manufacturing equipment, as well as reducing losses due to under-efficient equipment (caused by defects, production of deficiencies, the prolongation of production cycles and an increase in inventories due to breakdowns and repairs). It is in line with the aims assumed by analysing the case of Rockford. By including production workers in the maintenance processes an increase in their skills and in overall safety is obtained. These aims are shortly formulated as ‘zero breakdowns, zero defects and zero work accidents’.5
No doubt, all of these points are important, although in case of Rockford Motor Company, Autonomous Maintenance and Planned Maintenance seem the most necessary to implement.
5 J. Lewandowski, Decision making processes in reliability and operation of continuous running technical
objects, MARKUS, Łódź 2008, p. 134-138
PAGE 32
Warsaw University of Technology / Faculty of Production Engineering / Institute for Organization of Production Systems Operations & Production Management / Rockford Motor Systems
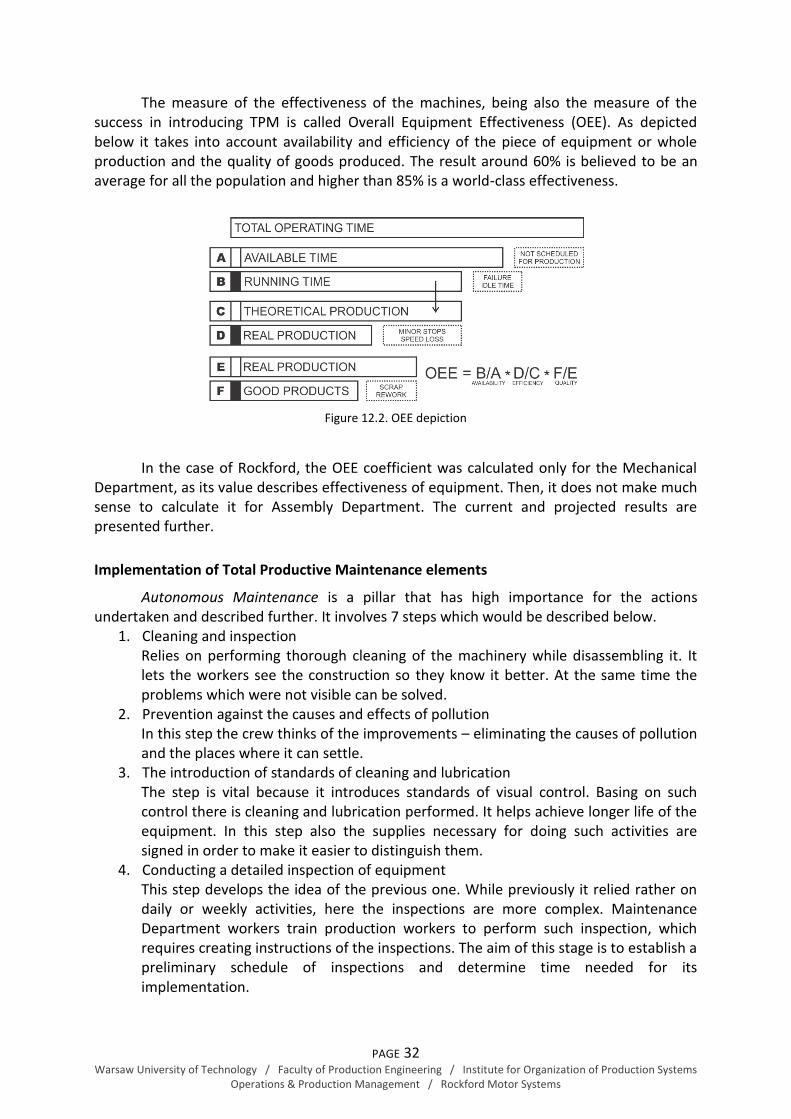
The measure of the effectiveness of the machines, being also the measure of the success in introducing TPM is called Overall Equipment Effectiveness (OEE). As depicted below it takes into account availability and efficiency of the piece of equipment or whole production and the quality of goods produced. The result around 60% is believed to be an average for all the population and higher than 85% is a world-class effectiveness.
Figure 12.2. OEE depiction
In the case of Rockford, the OEE coefficient was calculated only for the Mechanical Department, as its value describes effectiveness of equipment. Then, it does not make much sense to calculate it for Assembly Department. The current and projected results are presented further.
Implementation of Total Productive Maintenance elements
Autonomous Maintenance is a pillar that has high importance for the actions undertaken and described further. It involves 7 steps which would be described below.
1. Cleaning and inspection Relies on performing thorough cleaning of the machinery while disassembling it. It lets the workers see the construction so they know it better. At the same time the problems which were not visible can be solved.
2. Prevention against the causes and effects of pollution In this step the crew thinks of the improvements – eliminating the causes of pollution and the places where it can settle.
3. The introduction of standards of cleaning and lubrication The step is vital because it introduces standards of visual control. Basing on such control there is cleaning and lubrication performed. It helps achieve longer life of the equipment. In this step also the supplies necessary for doing such activities are signed in order to make it easier to distinguish them.
4. Conducting a detailed inspection of equipment This step develops the idea of the previous one. While previously it relied rather on daily or weekly activities, here the inspections are more complex. Maintenance Department workers train production workers to perform such inspection, which requires creating instructions of the inspections. The aim of this stage is to establish a preliminary schedule of inspections and determine time needed for its implementation.
PAGE 33
Warsaw University of Technology / Faculty of Production Engineering / Institute for Organization of Production Systems Operations & Production Management / Rockford Motor Systems
5. Introduction of standards of autonomous maintenance This step combines the cleaning and lubrication standards developed in the third point and the standards for inspection of machines from the phase 4 into a comprehensive standard for equipment inspection. Operators acquire knowledge about machines’ regulation, set up and changeover.
6. Quality assurance process Involves establishing standards that help in maintaining high quality, for example systems counteracting making mistakes.
7. Continuous improvement - independent supervision Is a development of all the previous steps. Requires employees’ involvement in order to continuously make the process better.6 7
The ways in which aims of Planned Maintenance are achieved were already listed. To achieve these goals, however, there is also some predefined procedure invented. It involves:
1. Creating cooperation between production and maintenance departments Under this step, the employees from Maintenance Department train the production workers on how to diagnose the problems typical for the equipment they use. It allows for eliminating the causes of such problems. Another important point is that the equipment should be continuously improved as the result of cooperation of both mentioned departments. Practically, this stage of the process involves the transfer of knowledge to operators in order to identify weaknesses of machines, prevent problems by performing inspections, and the use of technology to detect future problems.
2. Analysis of the current situation This step basically involves analysis of the current maintenance situation – intervals between breakdowns, their times and costs. An important part of the analysis is also the preparation of the classification of machinery. They should be classified in order of importance, priority – based on the impact they have on quality, continuity of the process, safety and costs of repairing them.
3. Removing the sources of failures At this stage the most significant actions should be taken. It is about moving from reactive maintenance to preventive maintenance. When the machine breaks down it is still repaired but the thing that differs the procedures is that here from each failure some conclusion has to be drawn. It is done in order to prevent a similar problem occurrence in the future.
4. Creating the database The database is used to collect the complex data on maintenance. Nowadays, the ready systems – Computerised Maintenance Management Systems (CMMS) – can be purchased which cover all range of data necessary for the Maintenance Department. The company can, on the other hand, create its own simple system to track just the data that it decides that are important.
5. Controlling results An important activity in every management system. Performing no control, the performance of the implemented changes cannot be reliably assessed.8 9
6 ‘Autonomous Maintenance Training Pack’, Beyond Lean, http://www.beyondlean.com/support-
files/autonomous-maintenance.pdf, retrieved: 02.06.2013 7 J. M. Brzeski, M. I. Figas, ‘Autonomous Maintenance’, Vision Lean, 2006
PAGE 34
Warsaw University of Technology / Faculty of Production Engineering / Institute for Organization of Production Systems Operations & Production Management / Rockford Motor Systems
Planned actions
The way of thinking justified above resulted in the following order of actions to be undertaken:
1. Preparation of control, cleaning and lubrication instructions based on the documentation provided by producers and adjusted to the factory’s conditions; preparation of the checklists of the elements subject to the periodic inspections.
2. Consulting the instructions with the operators that use the equipment, revising the instructions.
3. Training about the control, cleaning and lubrication standards provided by the instructions and on removing sources of failures.
4. Preparation of a prevention plan containing the detailed periodic inspections of equipment on the base of the possessed and obtained documentation and inquiries to producers. Creation of the maintenance inventory control system based on kanban concept and breakdowns registry.
5. Preparation of the computer system supporting maintenance as a part of the new information system.
6. Trainings on the use of the new system. 7. Controlling the functioning of the improvements and making changes if necessary.
8 J. M. Brzeski, M. I. Figas, ‘Planned Maintenance’, Vision Lean, 2007
9 J. Venkatesh, An Introduction to Total Productive Maintenance, http://www.plant-
maintenance.com/articles/tpm_intro.shtml, retrieved: 28.05.2013

PAGE 35
Warsaw University of Technology / Faculty of Production Engineering / Institute for Organization of Production Systems Operations & Production Management / Rockford Motor Systems
Schedule and costs
Activity
Time [days]
Number of
workers
Man hours
Rate per hour [€]
Date begin Date end
1 Announcement of TPM 2 1 12 15 1 January 2013 2 January 2013
2 Launch a formal education program
9 2 108 15 2 January 2013 11 January 2013
3 Create an organizational support structure
9 2 108 15 11 January 2013 20 January 2013
4 Establish basic TPM policies, working systems and quantifiable goals
16 3 288 15 20 January 2013 5 February 2013
5 Outline a detailed Master Deployment Plan
16 2 192 15 5 February 2013 21 February
2013
6 TPM kick-off 45 3 810 15 21 February
2013 23 March 2013
7 Improve effectiveness of each piece of equipment
45 3 810 15 23 March 2013 22 April 2013
8 Develop an autonomous maintenance program for operators
45 5 1350 15 22 April 2013 22 May 2013
9 Develop a planned or preventive maintenance program
45 6 1620 15 22 May 2013 21 June 2013
10 Conduct training to improve operation and maintenance skills
60 26 9360 15 21 June 2013 20 August 2013
11 Develop an early equipment management program
16 4 384 15 20 August 2013 5 September
2013

PAGE 36
Warsaw University of Technology / Faculty of Production Engineering / Institute for Organization of Production Systems Operations & Production Management / Rockford Motor Systems
Diagram 12.1. Gantt diagram
Total workers cost during 8 months of implementation is 225 630 €. For maintenance purposes there is a need for spare parts warehouse equipped with consumables like: oils, greases, self-service sets. Cost of this part of infestation is 100 000 €.
Conclusions
The above plan ought to solve most of the problems indicated on the Ishikawa diagram (Diagram 7.1). By implementing the prevention plan the reliability and availability of the equipment would grow. Together with the inventory control system, it would decrease the overall costs so each product unit costs would also be lower. The breakdown registry would allow for adjusting the maintenance system to the real conditions – instead of theoretical intervals and ranges of the inspections, some of them would be performed less frequently. It will minimise costs while not sacrificing reliability of the machinery. The database can also be used to control maintenance costs.
The already discussed new communication system would enhance both vertical and horizontal information flow. Thanks to this fact, not only managers would benefit but also line workers would be capable of having contact with their superiors. This contact can be used to signal problems with the workplace or to propose improvements.
Another significant point is employee empowerment. By delegating some responsibility and some tasks to line workers, basic maintenance activities are performed more frequently than the inspections so the inspections can be performed less often. It is possible thanks to new workplace instructions and trainings. The instructions cover both introductory health and safety guidelines and a list of periodic – every day, week or month – activities to perform. The activities are checking, cleaning and lubricating the pieces of equipment. Trainings would be aimed at showing the workers how to control the machinery and perform such basic activities.

PAGE 37
Warsaw University of Technology / Faculty of Production Engineering / Institute for Organization of Production Systems Operations & Production Management / Rockford Motor Systems
Table 12.1. Table 12.1. OEE Calculation
Actual value Expected value
Hours available 4800 4800
Failure/Idle time 560 230
Availability 88.33% 95.21%
Theoretical production 15300 21150
Real production 12200 19449
Performance 79.74% 91.96%
Good products 8020 19060
Quality 94.25% 98.00%
OEE 66.39% 85.80%
Chart 12.1 OEE and its components
The table and chart above present the values of OEE and its components currently and the projected outcome of the introduced changes. As it can be seen, there is a significant growth expected in all of the components and so the OEE as such. Practically, it means that the equipment is more reliable, there are more slowdowns and less scrap.
Apart from the changes included in TPM, there are also some other improvement concerning maintenance costs reduction. This is for example division of the Maintenance Department – currently it deals with both motion maintenance and supplying the production. That is also changing type of tools from the elements made of fast-cutting steel into more durable material. The Production and Assembly Departments are not equipped with any instrumentation for avoiding errors, which is desirable to be implemented.
The measurable effect of the success of the newly implemented solutions would be longer MTBF – Mean Time Between Failures, indicating less frequent breakdowns and higher equipment availability which is connected with MTBF. It is a direct measure of the time available for production which in turn impacts the output and so financial results.
88% 80%
94%
66%
95% 92% 98% 86%
0%
10%
20%
30%
40%
50%
60%
70%
80%
90%
100%
Availability Performance Quality OEE
Actual value Expected value

PAGE 38
Warsaw University of Technology / Faculty of Production Engineering / Institute for Organization of Production Systems Operations & Production Management / Rockford Motor Systems
Potential obstacles: Lack of knowledge of the equipment, Lack of workers’ commitment, Lack of management engagement, Improper scope of trainings, Unrealistic plans concerning time or scope of implementing, Inconsistent and unclear expectations.

PAGE 39
Warsaw University of Technology / Faculty of Production Engineering / Institute for Organization of Production Systems Operations & Production Management / Rockford Motor Systems
13. Just-in-time (JiT)
Is an inventory management strategy used to improve return on investment by reducing inventory levels throughout the process of production and storage and the associated costs. In fact JIT, as it is a part of Toyota Production System and Lean Manufacturing aims to reduce also the other types of waste – transport, workers motion, waiting, overproduction, over processing and defects. However, inventories are the most important type and it causes other types to arise.
The main idea of JIT is to minimize the main type of waste and other assumptions result from this one. All raw materials and components are delivered only at the time they are needed, to the right place and in the exact quantity. The signal for the start of production is the emergence of demand for the product. This avoids the long-term storage of raw materials, semi-finished and finished products. This results in a reduction of operating costs of the company, which does not need to maintain a large warehouse space.
The use of JIT implies the application of process flow. It relies on designing the production process in such a way that on each position there is only one product which is processed at a time. It is the contrary of batch production in which there is a series (batch) of products, for example 10 pieces, processed at a time. It means that maybe one piece is processed as well but the other 9 pieces are waiting to be processed on this position. They belong to ‘work-in-progress’ category, waiting for their turn and occupying place, so according to lean philosophy they constitute waste. The process flow system has numerous advantages. The most important are:
Reducing the time of order realisation, Increasing flexibility of production control, Reducing the number of operators, Reducing transport (distance) and number of transport staff, Reducing the risk of destruction or damage of the product, Quick and easy identification of mistakes.
All of these advantages result in reduced production cycle time, reduced amount of work-in-progress and costs connected with defects. However, achieving one-piece-flow is not easy and requires huge effort, made on detailed planning, implementation and control of the system.10
Another element characteristic for JIT systems is a presence of ‘pull’ approach. Its main idea is that the client of each process is the next process, so the customer is not at the end of the production, but at the beginning.
Traditional production cycle starts with the suppliers and ends with the final customer. In the pull system the order comes from the client. The information about the demand comes to the producer and from the producer to its subcontractors and suppliers. At the moment they get the information about the demand, the manufacturing process starts.
The "pull" system is the opposite of traditional ‘push’ method, in which the goods are produced, sent to the selling place and wait for the customer to buy them. The advantages of ‘pull’ system are similar to those characteristic for one-piece-flow. Also
10 Toyota Production System Basic Handbook, Art of Lean, Inc., www.artoflean.com, retrieved 28.05.2013, p.
19-28
PAGE 40
Warsaw University of Technology / Faculty of Production Engineering / Institute for Organization of Production Systems Operations & Production Management / Rockford Motor Systems
this system allows planning production more accurately, because the produced goods are only those which are demanded by the client.11
How it looks like in practice depends on the type of product. For instance, in case of cars, where there is a wide variety of options to choose, it looks more or less like mentioned. If the product is more uniform (for example beverages or snacks) it is enough to set some predefined minimum level. When reached, the final seller places the order or the information is sent automatically to the producer and then goes to its partners.12
The conditions of applicability
The conditions of applicability of just-in-time are that the suppliers and recipients should be located in small distances from the plant, which allows for faster delivery of currently required materials in small batches that meet current needs.
The second condition is that the delivery should be prepared so that at the time of arrival it is ready for use and to be unloaded directly to the production line (sequencing). Therefore, to meet the requirements concerning the supply, the supplier should be involved in the process of design and production. It allows for avoiding unexpected problems or constraints in the future.
Also some of the assumptions connected with the implementation of JIT system are worth mentioning. For example, to assure proper functioning of the system, it is better to use more flexible and elastic machine than the one offering higher efficiency and being more specialised. It is then easier for changeovers and for fixing.13
Rockford case
As it can be deducted, in case of Rockford Motor Systems, the introduction of such elements is a must. If the company wants to cooperate with the corporations such as Nissan, Honda or Ford, it has to obey their rules. Rockford obviously can stick with the present system but certainly sooner than later it would have unsolvable problem with inventories and production capacity.
The benefit of cooperating with such companies as the mentioned is that they usually offer help in introducing and proper maintaining the solutions like just-in-time. It is inevitable if the company wants a communication with its partners to be successful. This in turn influences whole production process because if any, even the smallest, part used to build a car is missing, in JIT it would probably mean stopping whole line.
Essential elements of just-in-time system are the new information and communication systems. Without them, the communication and so the cooperation with the new customers would be impossible. It would be applied for receiving orders, signals for starting production and to control the processes.
11
http://www.bgc.com.pl/blog/erp/?p=1573, retrieved: 8.05.2013 12 J. Womack, D. Jones, D. Roos, The Machine that Changed the World, Macmillan Publishing Company, New
York 1990, p. 138-152 13
N. Slack, Operations management, Pitman Publishing, London 1995, p. 588-612

PAGE 41
Warsaw University of Technology / Faculty of Production Engineering / Institute for Organization of Production Systems Operations & Production Management / Rockford Motor Systems
Implementation of JIT requires introducing a number of changes inside and outside the organization. In a production system the company aims to:
design products which are easy to manufacture and convenient for logistics, providing high quality of products, ensuring a certain level of production, ensuring short time of machines set up, ensuring the ability to eliminate emerging interference, striving for standardization of the production, ensuring the flexibility of the production system, concentration of production on a narrow range of products.
Obviously not all of the assumptions would be possible to implement in Rockford. For example, the range of products is not too narrow. The company can either try to standardise the products or outsource them. Another problem is ensuring flexibility of production which depends on machines and on the design of the production process and production flow. Some of the points would be already achieved thanks to the implementation of ISO, TQM and Kaizen, which lay the basis for JIT. More specifically, the implementation can be divided into seven steps:
Making quality improvements Implementing layout changes Reorganizing workplace Reducing setup times Reducing lot sizes & lead times Switching to pull production Develop relationship with suppliers
As the quality improvements were already done, the first step would now be providing new layout. This should take into account all the previously discussed factors and the character of production. Then the workplaces can be reorganized in accordance with the layout. Reducing setup times is then the task for the maintenance and production departments. Next steps would be tasks also for other departments – they involve cooperation with the recipients and these are probably the most difficult parts. The company is dependent on the outside organizations in introducing these points.
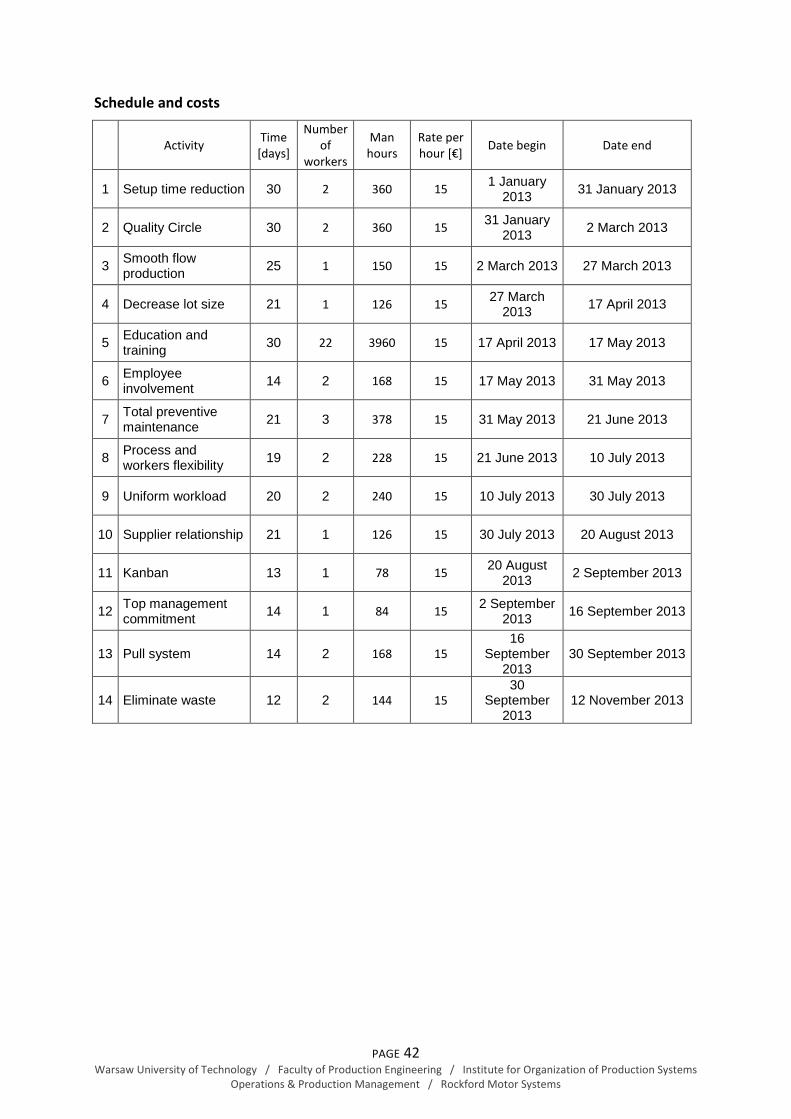
PAGE 42
Warsaw University of Technology / Faculty of Production Engineering / Institute for Organization of Production Systems Operations & Production Management / Rockford Motor Systems
Schedule and costs
Activity
Time [days]
Number of
workers
Man hours
Rate per hour [€]
Date begin Date end
1 Setup time reduction 30 2 360 15 1 January
2013 31 January 2013
2 Quality Circle 30 2 360 15 31 January
2013 2 March 2013
3 Smooth flow production
25 1 150 15 2 March 2013 27 March 2013
4 Decrease lot size 21 1 126 15 27 March
2013 17 April 2013
5 Education and training
30 22 3960 15 17 April 2013 17 May 2013
6 Employee involvement
14 2 168 15 17 May 2013 31 May 2013
7 Total preventive maintenance
21 3 378 15 31 May 2013 21 June 2013
8 Process and workers flexibility
19 2 228 15 21 June 2013 10 July 2013
9 Uniform workload 20 2 240 15 10 July 2013 30 July 2013
10 Supplier relationship 21 1 126 15 30 July 2013 20 August 2013
11 Kanban 13 1 78 15 20 August
2013 2 September 2013
12 Top management commitment
14 1 84 15 2 September
2013 16 September 2013
13 Pull system 14 2 168 15 16
September 2013
30 September 2013
14 Eliminate waste 12 2 144 15 30
September 2013
12 November 2013
PAGE 43
Warsaw University of Technology / Faculty of Production Engineering / Institute for Organization of Production Systems Operations & Production Management / Rockford Motor Systems
Diagram 13.1. Gantt diagram
Total cost of investment can be estimated on cost of workers involved in implementation process. During 10 months of implementation company need to provide 98 550 €. To complete this process, company needs to invest in new software which will control information flow. Software has to be compatible with all elements installed during ISO standardization process. Estimated cost of program itself and adaptation to current situation is 50 000 €.
Results of implementation
The implementation of JIT is a difficult and long-term process (3 to 5 years). However, the benefits, if introduced successfully are worth the effort. These are amongst others14 15: Higher productivity, Lower inventories, The production process becomes more flexible and factories are smaller and more
efficient, Fewer improper and unnecessary movements of personnel, Reduced time when the product waits for transport or processing, Reduced need for space for production and warehousing, Releasing part of working capital previously allocated to finance inventories.
The concept of JIT enables managers for reducing the unit cost and improving customer service level. The main difference between the concept of a JIT more traditional approaches, like economic order quantity, lies in the fact that the JIT seeks to shorten and stabilize the cycles of the contract and to minimise or eliminate stocks. As a result, Rockford saves by reducing expenditures for inventory in the initial part of the logistics system and focuses on improving the responsiveness and flexibility of their system. Ideally, the use of
14
J. K. Liker, ‘The Toyota Way’, op. cit., p. 169-179 15
http://www.toyota-global.com/company/vision_philosophy/toyota_production_system/, retrieved: 02.06.2013
PAGE 44
Warsaw University of Technology / Faculty of Production Engineering / Institute for Organization of Production Systems Operations & Production Management / Rockford Motor Systems
just-in-time allows for the synchronization of the system in such a way that its operation is no longer dependent on the stocks accumulated at various strategic points in the logistics system. When implementing the JIT system what is important is the efficiency and reliability of manufacturing processes. Since such systems require the provision of parts and components at the right time and place, they are largely dependent on the accuracy of forecasts of demand for finished goods. Moreover, punctual operation of the system requires effective and reliable communication and information systems, as well as high-quality transport service.
Summing up, the improvements implemented under this point and before should enable the company to benefit from all the discussed elements. They ought to make the company far more competitive and to satisfy the demand, even as high as projected.
The potential risks of the implementation are: Interruptions in supply flow If the part of the supplies is not in good condition, the production would have to wait for
fresh supplies, as there is no backup inventory. A fault in inventory forecasting methods can cause huge financial losses. The advantage of stocking inventory when prices go down is also lost, as JIT means
getting supplies for the present market value. Trade discounts on big orders are lost.

PAGE 45
Warsaw University of Technology / Faculty of Production Engineering / Institute for Organization of Production Systems Operations & Production Management / Rockford Motor Systems
14. Intelligent Organization
In intelligent company knowledge and use of it is crucial. When managing knowledge, organization is trying to best use it internally and externally to customers and stakeholders. Because the environment is growing in complexity, continuing to be on market requires company to learn enough about the current and likely future conditions of the environment, and to apply this knowledge to change their own behaviour and positioning in time.
There are two distinct meanings to the concept of intelligence: the possession of knowledge and the creation of knowledge. The possession of knowledge provides a pool of knowledge that can be called upon to solve problems and give understanding. The creation of knowledge takes place when new information are generated to solve new problems for which adequate solutions cannot be found in the knowledge base. The context of intelligent behaviour is problem solving, and problem solving implies the pursuance of goals and objectives. The requirement for new information is linked to the appearance of new problems, situations, and experiences. We see therefore that intelligent behaviour is both goal-directed and adaptive, and it will be the capacity of organizations to possess, create, and apply knowledge that will make the crucial difference.
The main idea is to create process of valuing the organization assets in order to fully
exploit this knowledge. It deals with creating, securing, capturing, coordinating, retrieving, and distributing of knowledge. Best way is to create sharing environment. All management has to be aware of this process. When it comes to competition company realized that their main advantage is brainpower and intellectual capital. It happens often that company is hungry of knowledge with a lot of hard to analyze data. First necessary step is to create knowledge infrastructure which can consist of: web-based and intranet connection technologies. It can be achieved by employees active contribution and use of knowledge in repositories, all of this has to be done of daily basics. Second step is value the knowledge in order to show some relationships. Unless this steps are developed company management can be sceptical about intellectual capital in company. After this company has to change approach to information. Each information is valuable knowledge only with some analyzing process applied. Appling process to data is strictly connected to IT department but in this case managing knowledge draws from many other disciplines.
Diagram 14.1. Organizational Intelligence and its five components as defined by Jay Liebowitz.
PAGE 46
Warsaw University of Technology / Faculty of Production Engineering / Institute for Organization of Production Systems Operations & Production Management / Rockford Motor Systems
Efficiency, quality, flexibility and availability are the foundations for success for users of machine tools, irrespective of where they locate their production operations. Tiny cost advantages are often crucial in determining whether an order will be placed or not – and these are achieved by means of intelligent production technology.
Improving machine concepts, control technology, software, tools and processes are always the core concerns. Continuous innovation in every area develops the functionality of intelligent production systems.
Today’s customer requirements, such as changing batch volumes, innumerable product variants and sustainable production demands are additional innovation drivers. Solving these complex tasks also increases demands on communication. Making vast and complex sets of data simultaneously available to all business areas, from development and construction to production planning and order management, requires the unhampered flow of data. Efficient modern companies therefore employ integrated overall communication systems using appropriate planning, control and testing software. Modern production systems also need to be continuously improved, as part of the company’s entire IT universe.
Intelligence in Production ensures that machines communicate autonomously with their supervisory management and control systems.
Standing out in the market with advanced technology is not enough for manufacturing technology providers. They must also contend with extremely varied customer needs. Requirements for machine operators are generally becoming more extensive and more complex. Quality assurance, documentation, machine monitoring and maintenance and ensuring energy efficient operations are just a few of the issues in play.
Intelligence in Production helps machine operators to reliably fulfil every task. The tools used include multi-media elements in the control system, web-based diagnostic systems, remote servicing, innovative hotline concepts, and more. Tailored training also supports the necessary skills for customers over the long term.
Adapting these intelligent assistance functions to machine operators in each market, alone or in conjunction with local vendors, is also itself a valuable and unique selling point for a vendor.
PAGE 47
Warsaw University of Technology / Faculty of Production Engineering / Institute for Organization of Production Systems Operations & Production Management / Rockford Motor Systems
Implementation
Intelligent manufacture consists of reporting and analysis tools, interfaces and dashboards designed to deliver contextual, localized, role-based information to help improve system or process.
Reporting & Analytics
To improve manufacturing performance there is need for reliable data collection, but also accurate and streamlined reporting.
Data is puttend into context and allows to more easily monitor the key factors that impact performance, efficiency and quality. Displaying metrics in graphical representations and easy to read reports provides powerful insight into performance history and can then be used throughout the plant to support continuous improvement.
Dashboards & KPIs
Dashboards can be a key driver of performance improvement initiatives by providing a simple and graphical way to make key performance indicators (KPI) visible throughout the enterprise. That's why there is need for software tools that not only gather data, but format it into easy toread, fully customizable dashboards. Presented in visual charts and graphs, from them we can start putting data into context. Which leads to making better and faster decisions by providing localized information.
With current possibilities plant-floor is huge information warehouse, organizing it and making it usable is a key. For example. When operator performs some simple repair action it takes him time. He knows what happens from his experience and he resume production almost immediately. For maintenance services this information is gone, they don't know about the break so they don't look for it. It seems that this tiny little break want cause any harm but at the end it does.
With every implemented system working every failure has to be reported and that information is spread across company for further analysis. Maintenance can plan action for this inconvenience, which leads to shorten production time.
Energy and Raw materials Intelligence
To accurately account for the cost of producing each individual product, company has to change approach to energy and raw materials calculation, from firm to flexible and intelligent. Using implemented software company will gain information about usage of raw material and energy combined with context. Combining information will enable us to remote monitoring, capture, historize, report and analyse the of flow data, correlate it with disparate data sources within the plant, and enable monitoring and optimizing energy usage. Emissions-monitoring capabilities allow you to leverage rebates, energy incentives, off-peak purchasing plans, and other cost savings measures.
Manufacturing Performance & OEE
Performance metrics like equipment and material use and overall equipment effectiveness (OEE) provides critical insight into how well production operates. manufacturing performance and OEE solutions can measure or compare the performance of plants, lines, machines or even individual production teams.

PAGE 48
Warsaw University of Technology / Faculty of Production Engineering / Institute for Organization of Production Systems Operations & Production Management / Rockford Motor Systems
15. Overall schedule
Diagram 15.1. Overall Gantt diagram
In order to save up man power the implementation of continuous improvement process was divided into two stages. First stage consists of three systems which can be implemented simultaneously. It takes about 3 months to fulfil every criterion. Second stage is implementing TPM and JIT which was predicted to take up to 11 months.
However, the important rule of planning here was that the implementation should be started as soon as possible. Some of the activities belonging to Kaizen and ToC cannot be realised without completing certain elements of ISO system so they were placed just after them. The ISO system had to be designed, planned and accepted so that the other elements could be set off.
31-Dec 4-Feb 11-Mar 15-Apr 20-May 24-Jun 29-Jul 2-Sep 7-Oct 11-Nov 16-Dec 20-Jan