strategic operations management
427
Transcript of strategic operations management


Strategic OperationsManagement

This page intentionally left blank
StrategicOperations
Management
Second edition
Steve Brown, Richard Lamming,
John Bessant and Peter Jones
Amsterdam • Boston • Heidelberg • London • New York • Oxford
Paris • San Diego • San Francisco • Singapore • Sydney • Tokyo

Elsevier Butterworth-HeinemannLinacre House, Jordan Hill, Oxford OX2 8DP30 Corporate Drive, Burlington, MA 01803
First published 2000Second edition 2005
Copyright © 2000, 2005, Steve Brown, Richard Lamming, John Bessant and Peter Jones. All rights reserved.
The right of Steve Brown, Richard Lamming, John Bessant and Peter Jones to be identified as the authors of this work has been asserted in accordance with the Copyright, Designs and Patents Act 1988.
No part of this publication may be reproduced in any material form (including photocopying or storing in any medium by electronic means and whether nor nottransiently or incidentally to some other use of this publication) without the writtenpermission of the copyright holder except in accordance with the provisions of the Copyright, Designs and Patents Act 1988 or under the terms of a licence issuedby the Copyright Licensing Agency Ltd, 90 Tottenham Court Road, London, England W1T 4LP. Application for the copyright holder’s written permission toreproduce any part of this publication should be addressed to the publisher.
Permissions may be sought directly from Elsevier’s Science & Technology RightsDepartment in Oxford, UK: phone: (�44) 1865 843830, fax: (�44) 1865 853333, e-mail: [email protected]. You may also complete your request on-line via the Elsevier homepage (http://www. elsevier.com), by selecting ‘CustomerSupport’ and then ‘Obtaining Permissions’.
British Library Cataloguing in Publication DataA catalogue record for this book is available from the British Library
Library of Congress Cataloguing in Publication DataA catalogue record for this book is available from the Library of Congress
ISBN 0 7506 6319 7
Typeset by Charon Tec Pvt Ltd. Chennai, Indiawww.charontec.comPrinted and bound in Great Britain
For information on all Butterworth-Heinemann publications visit our website at www.bh.com

Contents
Chapter 1 Introduction to operations management 1
Chapter 2 Strategic operations management 45
Chapter 3 Managing the transformation process 93
Chapter 4 Innovation – managing the renewal of the business 140
Chapter 5 Managing inventory, MRP and JIT 185
Chapter 6 Supply management 219
Chapter 7 Capacity and scheduling management 257
Chapter 8 Quality and BPR 286
Chapter 9 Human resources and strategic operations 329management
Chapter 10 The future for operations management 371
Index 409

This page intentionally left blank

C H A P T E R
Introduction tooperations management
1
Introduction
The strategic importance of operations
If you were to speak to a senior-level manager within an organization,
the likelihood is that, within a short period of time, you would be a hav-
ing a conversation that included a number of management terms – core
competences, key performance indicators and critical success factors, among
others. Ask the same manager about how operations and operations
management line up within these terms and the likelihood is that he or
she might be mystified or perplexed by the question. We’ll explore the
key reasons for this in Chapter 2, but we begin our text by stating:
Operations and operations management are of strategic importance to
an organization.
This is because all of the aspirations that modern day organizations
have to excel in any of the following – mass customization, lean produc-
tion, agile manufacturing, customer-centric provision and so on – depend on
the ability of the organization to actually do these things and such cap-
abilities reside within operations. For example, when, in the late 1990s,
Toyota announced their strategic intention to expand capacity and pro-
duce even more automobiles – in what was already an over-saturated
industry – they did so knowing that they had exceptional operations
capabilities that would outperform other competitors. By the beginning
of 2004, Toyota had indeed fulfilled their promise and had become the
number two car producer in the USA. Similarly, Dell Computers have
in-house capabilities that others have found difficult to emulate

2 Strategic operations management
(Brown, 2000). This has led to the demise of some firms as well as
mergers of others within the PC industry (in particular, Hewlett
Packard and Compaq) who simply could not compete against Dell’s
ability to customize personal computers.
However, in contrast to Toyota and Dell, the problem with some
organizations is that they simply do not have senior-level personnel
in place who fully understand the potential that operations can have
and, as a consequence, capabilities are often either not developed or,
worse still, given up by firms by divesting plants and services within the
organzation.
The central aim of this book is to deal with issues of operations man-
agement within a strategic context. So, in the next chapter we will look
at how operations strategies can be devised and implemented. In the
subsequent chapters we look at key strategic issues of the transformation
process, innovation, inventory, supply, capacity, human resources, and
development and growth.
The purpose of this chapter is to introduce the basic framework,
scope and management of activities involved in operations manage-
ment, to understand some of the complexities in operations and
appreciate the strategic importance of operations management.
In this chapter, we will discuss some of the previous misconceptions
that need to be corrected if an organization is to be able to compete
by using its operations’ capabilities, and we look at the importance of
linking both manufacturing and services together in order to provide
the total provision or offer of goods and services to the end customer.
In the next chapter, we develop some of these basics into the strategic
role and importance of operations management. One of the problems
that organizations often have is in not seeing the strategic importance of
their operations management capabilities and so, in the next chapter,
we develop some of these basics into the strategic role and importance
of operations management.
Let’s start with a brief, real-life case, which is provided to indicate the
enormous responsibilities facing the operations manager.
Case: Sunnyside Up
‘If you were going to design a new fast-food concept for the UK, where would you start?’ This is the questionChris Cowls, a former Franchise Director of Burger King, and his colleagues asked themselves. It is a toughmarket to get into and depends on operating very efficiently on tight margins in order to make any profit.Whatis more it is dominated by major international brands, such as McDonald’s and KFC, that have high publicrecognition and a national network of outlets, usually in prime high street locations. So any new concept wouldhave to overcome the barriers to entry, provide competitive advantage and appeal strongly to customers.Cowls’ team believes that ‘Sunnyside Up’ did just that.

The fast-food market in the UK has an annual turnover of £7.2 bn, serving 1.5 bn meals a year. This repre-sents over a quarter of all the meals eaten away from home and the sector is continuing to grow at 5 per centper annum.There are nearly 20 000 outlets employing nearly 200 000 staff. Many of these are owner-operatedsmall businesses, including sandwich bars and ethnic take-away restaurants. But the sector is dominated bymajor international brands offering products based around burgers, pizza or chicken. Between them,McDonald’s, Burger King and Wimpy have nearly 1000 outlets; Pizza Hut, Perfect Pizza and Pizzaland 650restaurants; and KFC and Southern Fried Chicken 450 units. Many of these brands are managed in the UK ascorporate franchises – for instance, Whitbread have the Pizza Hut franchise.
Success in the fast-food business depends on a number of key factors. High volume business is essential, sooutlets need to be located where pedestrian and/or motor traffic is high.The majority of brands are on thehigh street in prime retail areas. To increase sales opportunities in these high-rent locations, take-out as wellas eat-in sales are essential. The meal product therefore needs to be designed to enable this, hence the suc-cess of the hamburger. To sustain high volume, meal prices have to be competitive, which requires low levelsof waste and tight control over production. Fast-food operators achieve this by keeping to a minimum theproduct range, i.e. menu items, so that stock control is simplified. Each commodity may be used in a variety ofways. For instance, the bun can be used for the hamburger, the cheeseburger, the jumbo burger and so on. Insome operations, food items are cooked to order, also avoiding waste, but in burger restaurants at peak times,burgers are pre-cooked and ready-wrapped for immediate sale (hence ‘fast’ food). To avoid waste here,operators depend on accurate forecasting of demand to ensure they produce the right quantity of each item.They also forecast demand to ensure they staff their operations as efficiently as possible, by rostering staff towork flexible shift patterns.
Chris Cowls knew all this, having worked for a major burger chain and roadside dining chain.The questionwas how could he and his colleagues capture a share of this growing and lucrative market?
They began with the product. Every major product segment had at least two major brands competing forbusiness. What was needed was a menu concept for which there was high demand but no major competition.They selected ‘all-day breakfast in a bun’ as their core product – hence the brand name ‘Sunnyside Up’.
Most of the big burger chains were offering fast-food breakfasts, i.e. in a bun, but all of them stopped serving it by 11.00 a.m. in order to switch production to their own core product. But experience showed,especially from roadside sales, that breakfast was popular all day, not just the morning. Market research alsoshowed that breakfast was an expanding segment of the market. The menu would therefore be based aroundcombinations of egg, bacon and sausage served in a bun, along with pancakes served either savoury or sweet.This led to another feature, namely serving freshly ground coffee. Most fast-food chains did not serve this kindof coffee, although new speciality chains such as Costa Coffee were doing so.
The next issue was location. All the best locations were occupied by existing fast-food outlets. Sunnyside Upneeded different locational criteria to the typical restaurant. Cowls and the team decided that the conceptshould be aimed at ‘host environments’. Rather than locate on the high street, their outlets would be locatedinside existing service businesses, such as supermarkets, offices, retail areas, sports arenas, and so on.
This had a number of advantages. First, such locations had the high level of passing traffic this operationrequired. Second, franchise contracts could be signed with major companies, thereby facilitating access to thefinance needed to build each outlet. Third, the concept could be rolled out very quickly, thereby achieving theeconomies of scale needed to sustain marketing, IT and systems expenditures.
But location in a host environment creates one major problem – outlet size. While the supermarkets or cin-emas want a fast-food service, they did not want to allocate too much space to it. So Sunnyside Up is designedto have a micro-footprint.That is, it maximizes sales in the smallest space available.The total space required is32 m2. This is the smallest footprint of any UK fast-food concept. To achieve this, the team researched the latest fast-food equipment to find deep-fat fryers, griddles, hot cupboards and coffee machines that were small, easy-to-use and efficient. This equipment also had to fit together to create the system the team haddesigned. The micro-footprint also means that Sunnyside Up can easily go into a ‘food court’ – branded counters serving food with shared seating.
One consequence of the small scale was that staffing levels are low. One person can operate the food pro-duction area and one or two the service counter.The use of disposables means that wash-up is almost non-existent. Equipment maintenance and cleaning is carried out by these staff during slack periods. There is limited
Introduction to operations management 3

This case is important because it brings together a number of key issues
that need to be in place if we are to understand the profound importance
of, and the contribution made by, operations management. The ability to
enter and compete in both new and existing markets is very dependent
on operations capabilities. Of course, other areas are also vitally import-
ant – marketing, finance and other major functions – and we are not
seeking to play operations against these other areas. However, we argue
that operations management is about uniting these other areas and func-
tions into a central core of capabilities for the organization. This is true in
both manufacturing and service settings. For example, we noted Toyota’s
success earlier and it is well documented how other Japanese organiza-
tions have been both aggressive and remarkably successful in their pur-
suit of targeted markets. We should be careful not to dismiss Japanese
capabilities in operations simply because of the downturn in the Japanese
economy at the end of the 1990s. This downturn had more to do with a
range of financial factors rather than diminishing capabilities in oper-
ations. We should bear in mind that, in the new millennium, it is still
Honda and, particularly, Toyota whose operations capabilities remain the
criteria by which the rest of the car industry is judged.
The key means of doing so was described by Hayes and Pisano (1994,
pp. 80–81):
Japanese companies began in the late 1970s to assault world markets in
a number of industries with increasing ferocity.Their secret weapon
turned out to be sheer manufacturing virtuosity. Most were producing
products similar to those offered by Western companies and marketing
them in similar ways.What made these products attractive was not only
their cost but also their low incidence of defects, their reliability, and
their durability.
That is not to say that Japanese and other world-class organizations
are internally myopic and operations-driven and ignore customer
4 Strategic operations management
provision for eat-in customers, on stools at eating shelves. Most customers are expected to take-away (whichmakes sense in filling stations, sports arenas and cinemas).
While sales volumes in such small operations will not match those achieved by fast-food restaurants on thehigh street, Cowls and his team have rewritten the ‘rules of the game’.Their concept can be built into a hostenvironment for less than £50 000 and their operating costs are also low.The average projected sales volumeof £3000–5000 per week is more than enough to give a good return on capital invested. Indeed, one majorfood-service contractor has become a corporate franchisee, in order to include Sunnyside Up in its portfolioof brands.This has led to 14 restaurants being opened across the UK in offices, factories and colleges, often aspart of a food court.
requirements. We are certainly not advocating that a firm’s strategy
should be limited by its current operations capabilities. What we are
saying is that world-class firms are able to outperform other organiza-
tions and satisfy customer requirements by virtue of their remarkable
operations capabilities, which are aligned to market requirements. So
it is with Sunnyside Up. In this case there was a need to align concerns
of operations with the provision of customer service. Specifically, in
our case, the major issues raised for the company intent on entering
the very competitive fast-food market include a number of important
areas that fall under the responsibility of operations managers:
■ Management of value.
■ Capacity management.
■ Location decisions.
■ Process management.
■ Managing technology.
■ Human resources management.
■ Integration and affiliation.
We shall deal with each of these in turn.
Management of value
Traditionally, operations management has been very concerned with
managing costs, but this important element of responsibility has
changed recently to the management of value. Back in 1980, Harvard
Professor Michael Porter suggested that organizations needed, ideally,
to compete either on low cost or to provide differentiated products in
order to be profitable and to avoid being ‘stuck in the middle’. However,
this is now seen as overly simplistic, because an organization competing
in today’s volatile market requirements may have to offer both low cost
and differentiated features, together with ongoing innovation and rapid
response and delivery times simultaneously, merely to be able to com-
pete at all in markets!
The implications for the operations manager are clear. In value-
conscious markets, where margins are usually very slim – for example,
in fast-food and other high-volume sectors – costs and prices must be
carefully controlled. The ability to do so does not necessarily mean an
automatic reduction in workforce numbers and other drastic measures.
Instead, accumulated know-how, experience, appropriate use of tech-
nology and better process quality through continuous improvement or
kaizen will enable the organization to reduce costs (kaizen is discussed
in Chapter 8). Such capabilities need to be developed and guarded
Introduction to operations management 5

over time (Barney, 1991; Teece et al., 1997). Alternatively, where the
organization is offering differentiated products, then, according to
Porter (1980), it may charge premium prices. This, though, does not
mean that costs are ignored. In premium-price market segments, the
task for the operations manager is, amongst other things, to enable
large margins to be obtained between premium price and actual costs.
Such margins can be achieved by eliminating waste in all forms – the
essence of lean thinking (Womack and Jones, 2003).
Capacity management
Capacity was another major factor in our case. High volume was an
issue here, and managing capacity is common to both manufacturing
and service elements in ensuring the total provision to end customers.
The operations manager needs to know about both the overall, company-
wide capacity as well as department-specific capacity inputs and out-
puts. This will enable the operations manager to schedule without
creating overload or ‘bottlenecks’ in certain areas (capacity is dis-
cussed in Chapter 7).
Location decisions
Location was an important consideration in our case and is linked to
strategic capacity decisions – as well as supply management, which is
explored in Chapter 6. Organizations will face important choices con-
cerning location, and this applies where there is a wish to expand in
outlets both within the country of origin and also where expansion via
international/global efforts are concerned. The Japanese car trans-
plants, especially in the UK and North America, are an important
example of such capacity expansion via strategic location decisions. As
we saw in our case study, a number of American service giants – including
McDonald’s – have been very aggressive in their growth strategies.
These strategies have been realized by determining strategic locations
for the business.
Process management
Managing processes that result in products or services is a major con-
cern of operations managers. The operations manager has to under-
stand the nature, specification and assembly/delivery of the product
6 Strategic operations management

or service. Over-design can cause major problems of organizations
intending to innovate new products and services, and will take up
unnecessary time and capacity. As we shall see in Chapter 4, there has
been an increased awareness of organizations to include operations
managers in the early stages of new product development in both manu-
facturing and service sectors. For the operations manager, the range of
products or services on offer has to be managed in order to satisfy the
mix of volume and variety for customers. This is achieved by having
appropriate process technology in place, which can deal with customer
requirements of volume and variety.
Managing technology
Included in the task facing the Sunnyside Up team was searching for
and purchasing appropriate equipment. Investing in the appropriate
equipment or technology, maintaining it and reinvesting are crucial
decisions for operations managers. The temptation for some managers
is not to invest, believing that such a risk is not necessary since the cur-
rent machinery ‘can cope’ and ‘has done well for us in the past’. In
fact, this may be the correct decision if the useful life of the technology
is shorter than the period over which the organization would need to
recoup the investment – a situation that would hardly have seemed
likely a decade ago. With product lives shortening in many product
markets, the period between purchasing equipment and that equip-
ment being made obsolete by newer technology is never certain.
However, the approach of not investing could hardly be called strategic
and may actually be shortsighted – often quickly depriving the organ-
ization of being able to compete in the long term against other organ-
izations that have made more appropriate decisions. It is a question of
maintaining secure access to the necessary technology. Being left with
out-of-date technology, which has yet to be paid for, however, is a major
liability for an organization and may even cause insolvency.
Human resources management
The management of human resources was a relatively small factor in
our case study, but is often a major concern for operations managers.
As the need for adherence to narrowly defined functional arrange-
ments declines, managing human resources is no longer the preroga-
tive of one department (personnel, human resources, management
Introduction to operations management 7

development and so on) but is, rather, an integral feature of any
would-be world-class operations company.
Developing human resources is clearly evident in the following
(Business Week, 5 May 2003):
Survival isn’t just a matter of smart machines.Workers have to get
smarter as well, and show a willingness to learn new technologies, says
John A. McFarland, CEO of Baldor Electric Co., the largest maker of
industrial electric motors in the US. A versatile corps of workers has
helped Baldor ride out the manufacturing recession without a layoff.
It is important to note how Baldor’s approach to managing human
resources has had strategic benefits, allowing them to compete suc-
cessfully in spite of the recession in which the industry found itself.
Human resources impact a number of areas of interest to the operations
manager, including ideas for innovation (Chapter 4), quality improve-
ments (Chapter 8) and process developments (Chapter 3) – all of
which are dependent upon human resource know-how and inventive-
ness. Indeed, management of the supply chain (Chapter 6) is also very
dependent upon the ability to form strategic partnerships throughout
the supply chain, and this comes from human resource capability and
not from technology or equipment.
Integration and affiliation
This brings us to the questions of the extent to which an organization
owns and controls all the resources needed to make the product or
deliver the service. In the Sunnyside Up case, affiliation through corpor-
ate franchise agreements with large-scale operators was a key element of
their operational strategy. Affiliations such as franchising, sub-franchising
and contracting are common in service organizations and are becom-
ing more common in manufacturing. Firms in both sectors have tended
to extend control over resources through forward, backward or hori-
zontal integration (merger and acquisition). For example, for many
years, firms in the brewing industry have forward integrated into distri-
bution and retailing through licensed premises or pubs.
It becomes clear from discussion of the above case, therefore, that
operations management is very wide in scope of responsibilities and
will draw upon a range of functions within the organization and not be
limited to a specific department. Understanding operations manage-
ment really is vital if the organization is to compete effectively.
8 Strategic operations management

Definitions of operations management
Part of the problem for would-be operations managers is that definitions
of operations management are, themselves, sometimes confusing; we
need to clarify its role. In their text, Muhlemann et al. (1992, p. 8) indi-
cate the reason for the problem:
Of all managerial tasks the production/operations management function
is the hardest to define since it incorporates so many diverse tasks that
are interdependent.To divide it up, therefore, is to destroy it.
As we saw in the Sunnyside Up case, there were indeed a number of
interdependent activities and concerns for the operations manager;
these had to be dealt with simultaneously in order for market entry to
take place. However, the above quote from Muhlemann et al. speaks of
operations management as a ‘function’ and it is here that one of the
issues arises. We argue that operations is not so much a function as a
company-wide and inter-firm activity embracing a number of different
areas and utilizing them in order to satisfy customers.
Another issue that needs to be addressed is distinguishing between
manufacturing/production and operations. We concur with Samson’s
(1991, p. 2) view when he states:
… manufacturing management and strategy (are) subsets of Operations
Management and strategy ….
This is important because, often, the terms operations and manufactur-
ing strategy are used interchangeably in the literature, and we must be
careful to distinguish between the two. In the next chapter we examine
the importance of developing a specific operations strategy as part of
the wider business strategy for the organization. At this point, though,
we need to be clear that operations strategy is concerned with all activ-
ities from basic inputs into completed goods and services for the end
customer. As Hill (2000, p. 5) explains:
The operations task … concerns the transformation process that
involves taking inputs and converting them into outputs together with
the various support functions closely associated with this basic task.
Such transformation processes can be applied to three main categories –
materials, customers and information. Material processing operations are
Introduction to operations management 9

typically associated with manufacturing, customer processing operations
with some sectors of the service industry, and information processing
operations with other service sectors. In practice, most businesses rely on
a combination of materials, customer and information processing. In a
factory, processing materials is obvious and easily observed. These trans-
formations (i.e. of parts into finished products) are not so obvious in
many service operations. For example, banks, hospitals, social services
and universities transform inputs into outputs, and thus all carry out
operations management. There may well be differing views as to what the
outputs are – and there may be several that are provided at the same time.
For example, a university has a number of inputs (including staff expert-
ise and experience, funding from the government, funding from stu-
dents themselves or their sponsors, allocation of time) and these are then
transformed by a number of operations (time spent in the classroom,
scheduling students for particular courses, etc.) in order to provide out-
puts. The immediate output would be ‘successful students’ – those who
have gained their intended qualifications. However, there would be a
number of, perhaps harder to identify, beneficiaries or recipients of these
outputs – including potential employers and society in general.
Hill’s (2000) definition of the task of operations management, which
we cited above, is useful because it indicates the important link that
operational activities have with a wider organization base. As we indi-
cated earlier, it is important to view operations as a core activity rather
than the prerogative of one department only. It also demonstrates that
operations management can be applied to a very wide range of human
economic activity. There are significant sectors of an economy, both in
terms of numbers employed and their contribution to gross national
product, which engage in transformational processes that are more or
less completely ignored in many operations management texts. These
include tourism (tour operating, visitor attractions and so on), the con-
struction industry, medicine, the arts (theatres, cinemas, galleries), util-
ities (gas, water, electricity, sewerage) and the armed services. We shall
therefore strive in this text to include as many sectors of the economy as
possible to illustrate operations management principles and practice.
Developing a definition of operations management
We offer the following as the basic definition of operations management:
Operations management is concerned with those activities that enable
an organization (and not just one part of it) to transform a range of
10 Strategic operations management

basic inputs (materials, energy, customers’ requirements, information,
skills, finance, etc.) into outputs for the end customer.
This is important because we must always bear in mind that operations
do not take place in one confined area of the organization. Rather, vari-
ous forms of operations will take place simultaneously across the
organization. For example, in a manufacturing plant we might assume
that operations take place merely at the point of production, but this
limits what is actually taking place. In reality, a range of operations will
be undertaken in addition to the manufacture of the product, such as
inventory handling, logistics, information processing and office admin-
istration. Similarly, in services, the obvious point where we may think
operations takes place is in the direct contact between the service
provider and the recipient of the service. This contact is sometimes
called the ‘moment of truth’. However, behind the scenes (in services,
this is often called ‘back-office’ operations) there will be a number of
operations that would have needed to be in place. In services, the dif-
ference between the point of contact and all of the support activities has
been likened to an ‘iceberg’ (Normann, 2000), as shown in Figure 1.1.
The organization uses different kind of inputs (the transformational
inputs, such as plant, buildings, machinery and equipment) as well as
less tangible but important inputs (such as learning, tacit knowledge
and experience) and transforms these into outputs. A basic, organiza-
tion-specific model of operations is shown in Figure 1.2.
This basic model, which appears in many management texts, can be
expanded to identify main activities within operations, as shown in
Figure 1.3.
Although models like these are often used, we argue that operations
management in the modern era is more complex than this. The major
Introduction to operations management 11
Service operationsactivities can be
likened to someonewatching an iceberg
Image ‘The Moment of Truth’
Actual service
(unseen, but vitallyimportant,back-office operations) Figure 1.1
The iceberg principle
in service operations.

issue is that operations management is not only an organizational-wide
issue, but also includes activities across organizations. Obviously, an
important part of the transformation process will include purchasing
goods and services from other organizations. In the modern era of oper-
ations management, organizations no longer see themselves as a stand-
alone element in the above diagrams – the ‘processes’ – but will instead
see themselves as part of a wider, extended enterprise, as shown in Figure
1.4. Here, there is a network of collaborative partners, all of whom link
together to form an extended enterprise within an industry. So the oper-
ations management model for current and future operations is no longer
limited to an organization-specific arena. This means that the organiza-
tion has to be willing to look outside of itself and to form strategic rela-
tionships with what were formerly viewed as competitive organizations.
12 Strategic operations management
Processes
OUTPUTSINPUTS
FeedbackFigure 1.2
The basic
operations system.
• Capital• Technology• Energy• Know-how• Experience
Transformation ofinputs, adding valuethroughout the entireprocess from basicinputs to finishedgoods and services
INPUT OUTPUTTRANSFORMATION
The final, completedproduct/service offeringfor the customer.
Tangible and intangibleelements, combiningphysical and psychological effects, and benefits for thecustomer are in placefor the final transaction.Services and productionoperations havebecome linked
Feedback
Transformation inputs
Figure 1.3
Factors within the
input/output model
of operations.

The application of this model is further developed in both Chapters 4
on innovation – where collaboration has become increasingly import-
ant – and Chapter 6 on supply management, where the organization
has to deal with collaborative (and not so collaborative) relationships
with other organizations. In the past, organizations tended to favour
owning all activities within the supply chain from basic materials and
inputs through to end customer. In the relatively ‘cash-rich’ days of the
1970s, for example, there was a great deal of vertical integration taking
place within large US and European corporations, whereby large manu-
facturing organizations sought to gain control and drive down costs by
owning the supply chain. In service organizations too, there was a ten-
dency to own the supply chain. This was evident in the UK, for example,
when banks decided to buy forward into estate agencies in the housing
market. As we shall see in Chapter 5, the problem with this is that organ-
izations in both manufacturing and service operations will often be
pulled in too many different and conflicting directions. The chief diffi-
culty for organizations that are intent on pursuing a vertical integration
strategy is that the organization moves into areas in which it may have
little or no expertise. Once we realize that operations is no longer an
organization-specific affair, but is instead part of an extended supply
chain involving collaboration with both vertical and horizontal partner-
ships, the strategic importance of operations begins to come into focus.
Introduction to operations management 13
Input
organization
Core
organization
Input
organization
Input
organization
Non-
collaborative
(but necessary)
partner
Collaborative
partner
Goods
transfer
End
customer
Service delivery
INPUT OUTPUT
Operations Strategy
Manufacturing service
(Process strategy) (Delivery strategy)
Input
organization
Input
organization
Figure 1.4
The operations
infrastructure from
basic inputs to end
customer.

Operations management and added value
Porter’s (1985) value chain model is a useful means of tracking the
flow of movement from inputs to outputs, as shown in Figure 1.5.
In explaining the value chain model, Porter (1985, p. 38) states that:
Value is the amount buyers are willing to pay for what an organization
provides them … creating value for buyers that exceeds the cost of
doing so is the goal of any generic strategy. Value, instead of cost, must
be used in analysing competitive position ….
As we shall see in the next chapter, part of the strategic task for the
organization is to analyse those activities that it does best and to focus
on these. This means that senior-level managers, dealing with strategic
issues, need first to understand and then to focus on the organization’s
core strengths and to use these capabilities to provide added value for
14 Strategic operations management
Value is added through the value chain
Firm infrastructure
Human resource management
Technology development
Procurement
Inboundlogistics
Outboundlogistics
Operations Marketingand sales
Service
Note how operations is located specifically in one area only.
The idea is that value and not just cost is added at each stage. However, as the above model stands,there are no links between the value-adding stages. Also, as we shall see in Chapter 6, supply through the
value chain is not as linear and sequential as this model indicates. Perhaps a more appropriate way is to seevalue being added by a series of linkages:
Inputs Linking with other firms to
End customer
The firm can then add real value by focusing on what it does best and then forming alliances with other firms
Operations
Operations and
supply Operations and
supply
Operations and
supply
Operations and
supply
Operations and
supply
Figure 1.5
Porter’s value chain (adapted from Brown, 1996).

the organization’s customers. In doing so, the organization must then
become dependent upon strategic partnerships with other organiza-
tions in order to provide value in those areas and activities that it has
now subcontracted.
The extent to which the organization will decide to be involved in all
areas of this transformation process is a critical issue for organizations.
As we shall see in the next chapter, operations management is very
much linked to key strategic business decisions, such as:
■ What business is the firm really in?
■ What does the firm do best?
■ Should it outsource some of its activities, and if so why, where
and how?
■ How can opportunities become quickly exploited and how
can the firm’s capabilities help to ward off external threats
from new and existing players?
We need to view operations management as part of a fluid, interactive,
mutually beneficial series of relationships between raw materials and
end customer.
Many organizations encapsulate what business they are in through a
mission statement. This usually states where a firm expects to be at
some time in the future. However, from an operations perspective, it
may be more useful to adopt what has been called the ‘service concept’
statement. This articulates both customers’ perceptions of what the
firm has to offer and the firm’s own view of its business proposition. It
therefore incorporates more than a typical mission statement, provid-
ing all stakeholders in the business – notably customers, shareholders
and employees – with a mental map of what the firm offers, stated in
terms of benefits and outcomes. Although called a ‘service concept’, it
can apply equally to manufacturing. For instance, Daewoo adopted an
integrated approach to making and selling cars in the UK, through its
own chain of salesrooms, with a salesforce paid salaries rather than on
commission. Likewise, IBM no longer thinks of itself as a computer
manufacturer but as a firm providing ‘business solutions’.
At the heart of every service concept is value, which we have dis-
cussed already. In addition to value, Johnston and Clark (2001) argue
that the service concept must also include and explain:
■ the operation – how the product will behave or the service will
be delivered;
■ the experience – the processes with which the customer will
engage;
■ the outcome – the result for the customer.
Introduction to operations management 15

So, for example, Sunnyside Up’s service concept could be ‘to provide
customers with a hot, easy-to-eat meal product quickly and cheaply
over the counter, throughout the day and in locations where normally
such products and services were not provided’.
Part of the problem facing the operations manager, therefore, has
been determining where operations management really lines up in the
wider aspects of the organization in which they are operating. This is
where strategy comes into play. Strategy is about ‘how’ the organiza-
tion will conduct business.
Thus, not only is the organization concerned with transferring goods
and services to end customers, it has to do so in a value-adding way. Value
added, in most simplistic terms, means that the income or benefit derived
from performing a particular operation is greater than the cost of doing
so. All organizations, whether they are in private or public sector, or in
manufacturing or services, have operations within them. Increasingly,
value-adding operations are important to both private and public sectors.
In private sectors, many industries and markets are so competitive that
the organization cannot afford to be involved in non-value-adding activ-
ities. This is not simply down to costs, but is also concerned with problems
which non-value-adding activities might incur, such as slow delivery
speed, poor delivery reliability and (lack of) flexibility.
The scope of responsibility for operations managers
As we have noted, operations take place throughout the entire supply
network in order to transform and complete the provision of goods
and services to end customers. This means that operations managers
have responsibilities both within their own organizations and in the
relationship with suppliers and distributors within the supply chain.
The extent to which operations managers become involved in activities
in the entire supply chain depends on a number of factors, including:
■ The nature of the industry. In some industries (for example,
automobiles and market sectors within high-tech), two-way
collaboration involving operations managers between two or
more organizations is now commonplace. This is seen as a
means to develop best practice and is often a central feature
of innovation.
■ The reputation of the organization. For example, because of its
immense expertise, Toyota has often been involved in work-
ing with suppliers in developing skills and know-how within
16 Strategic operations management

the supplier’s plant. This enables know-how and expertise to
become shared.
■ The size of the organization. As we shall see in Chapter 5, in spite
of the trend toward collaboration, some organizations will
exercise their ‘muscle’ and influence on the supplying or dis-
tribution organization. The sheer size enables them to do so –
this was a tactic used by General Motors in the early 1990s
and, as we shall discover, this approach does not necessarily
achieve long-term rewards for the larger organization.
The range of responsibilities that operations managers have within the
plant or service itself is both profoundly important and wide in scope;
this range was illustrated by the Sunnyside Up case. These responsibil-
ities include the management of:
■ Human resources. Our case had a small employment base but
their input was critical.
■ Assets. These include fixed assets – machinery, equipment and
plant, and current assets. An important concern for oper-
ations managers is inventory.
■ Costs. We noted earlier how managing costs is a central area of
responsibility for operations managers and played an import-
ant part in Sunnyside Up’s desire to enter the fast-food market.
Human resource management in operations has come to the fore in
recent years due to the flattening of the organizational hierarchy in
many organizations. Where the hierarchy is very ‘flat’, employees take
responsibility in major areas and ‘operators’ become ‘managers’. As we
shall see in Chapter 7, such responsibility may give rise to better per-
formance in quality and encourages ideas for innovation in all its
forms. In recent years, front-line operators have been increasingly
involved in such areas as recruitment and training.
Managing assets is an integral part of the operations manager’s role.
Hill (2000) observes that up to 70 per cent of assets may fall under the
responsibility of operations management. The greatest single cost in
the transformation process within a manufacturing environment is
usually in materials management. However, as we shall see in Chapters
5 and 6, this still remains a problem for many organizations for two
reasons. First, materials management becomes relegated to a tactical-
clerical buying function, and is not seen in the strategic framework
that it needs. Second, the organization will need to form excellent
relationships with suppliers and such relationships are still difficult for
organizations that are unable to form these strategic links.
Introduction to operations management 17

The critical link with marketing
In the next chapter we discuss how operations management needs to
be linked with customer requirements, and how the aims of operations
management include supporting the business in the market-place and
enabling the organization to compete successfully against other players.
The task facing operations is perfectly summarized by Ridderstrale and
Nordstrom (2000, p. 157):
Let us tell you what all customers want. Any customer, in any industry,
in any market wants stuff that is both cheaper and better, and they
want it yesterday.
This is wonderful for us as customers but the downside is that it pre-
sents a massive challenge to operations managers. In order for opera-
tions managers to achieve these customer requirements, operations
needs to be closely allied to marketing and must have a good know-
ledge of customer requirements. By doing so, operations can help to
shape future sales in existing markets as well as helping to determine
the viability of entering new markets. One of the most critical areas of
responsibility, therefore, is in working closely with marketing. Capacity,
quality, delivery capabilities and costs are all within the realm of
operations management. Discussing these traits becomes part of the
overall information for marketing, as shown in Figure 1.6.
In service industries, the link between operations and marketing has
always been close. This is because service firms have always recognized
that having the customer in the business itself provided them with
ideal opportunities for sales and marketing efforts, such as upselling
and promotions. Heskett (1986) developed a model showing the
interaction between marketing, the service concept and operations
strategy. These are linked by market positioning and value/cost lever-
age, as illustrated in Figure 1.7.
The manufacturing/service divide
As we shall see in the next section, we are not advocating that man-
aging service and manufacturing operations are identical. Clearly,
there are differences. But both manufacturing and services are vital
and, in contrast to the old-fashioned view of manufacturing versus ser-
vices, it is clear that both depend on each other in modern economies.
18 Strategic operations management

If we look at the Fortune 500 (US firms) and the Fortune Global 500, it is
important to bear in mind that the massive retail outlets (a service set-
ting) are very dependent upon manufactured goods. We shall provide
telling examples of the dependency in Chapter 5. But manufactured
goods in turn depend on excellent service in retail outlets. This may
seem obvious, but often people will classify retail as a service industry,
as if, somehow, it is an entity that is entirely independent from manu-
facturing. The 35 largest global companies listed in the Fortune 500 in
terms of revenues are listed in Table 1.1.
However, although we are not suggesting that manufacturing is ‘bet-
ter’ than services, we must say that service exports have not managed to
plug the gap between manufactured imports and exports in many
countries, and this is especially evident in the UK and US. Table 1.2
shows how the gap between imports and exports has influenced the
recent trade deficit.
In the UK, a report in The Guardian (16 February 2004, p. 23) on the
UK economy provided some useful insights:
… 1997 was the last year in which Britain had a trade surplus. It was
only £1 bn but it was the culmination of a steady improvement. … In
1998, that small surplus was turned into a deficit of £8.5 bn, followed
by £15.9 bn in 1999, £19.6 bn in 2000, £27.6 bn in 2001 and £31.4 bn in
2002. … There are two ways of coping with a situation where supply is
Introduction to operations management 19
Constant dialogue needs to take place betweenoperations and marketing. Cohesion needs to bein place in terms of:
Forecasts – volume versus capacity constraints;delivery promises versus schedulingcommitments.
Design specifications, product assemblyconfigurations, and supplier involvement andcapabilities are all important issues.
Coreoperations
Supply link Supply link Supply link Supply link
Operations Marketing
Figure 1.6
The critical link
between marketing
and operations.

20 Strategic operations management
Target Market Segments
What are the common characteristics of important market segments?What dimensions (demographic, psychographic) can be used to segment the market?
How important are various segments and what needs do they have?How well are these needs being served? In what manner? By whom?
Positioning
How does the service concept propose to meet the customer needs?How do competitors meet these needs? How is differentiation achieved?
What efforts are required to bring customer expectations and service capabilities into alignment?
Service Concept
What are the important elements of the service stated in terms of results for the customer?How are these elements supposed to be perceived by the target market segment, employees, others?
What efforts does this suggest in terms of designing, delivering and marketing the service?
Value/Cost Leverage
To what extent are differences in perceived value and cost maximized bystandardization or customization of certain elements of the service?
To what extent are these differences achievable by managing supply and demand? To what extent do these efforts create barriers to entry by potential competitors?
Operating Strategy
What are the important strategic elements – operations, marketing, financing,human resources, organization, control?
On which will the most effort and the most investment be made?How will quality and cost be managed?
What results will be expected versus the competition in terms of quality, cost, productivity,employee morale and loyalty?
Basic element Integrative elementKey:
Figure 1.7
Heskett’s service operations model (adapted from Heskett, 1986, p. 30).

Introduction to operations management 21
Table 1.1The Global 500 in 2003
Global Global Company Country Sector Turnover
rank rank ($ million)2003 2002
1 2 Microsoft USA Software and computer 28 365.0services
2 1 General Electric USA Diversified industrials 130 685.0
3 3 Exxon Mobil USA Oil and gas 204 506.0
4 4 Wal-Mart Stores USA General retailers 244 524.0
5 6 Pfizer USA Pharmaceuticals and 32 373.0biotechnology
6 5 Citigroup USA Banks
7 9 Johnson & Johnson USA Pharmaceuticals and 36 298.0biotechnology
8 10 Royal Dutch/Shell Netherlands/ Oil and gas 179 431.0PLCINV UK
9 8 BP UK Oil and gas 178 721.0
10 12 IBM, International USA Software and computer 81 186.0Business Machines services
11 11 American International USA InsuranceGroup
12 15 Merck USA Pharmaceuticals and 51 790.3biotechnology
13 17 Vodafone UK Telecommunication 35 818.7services
14 21 Procter & Gamble USA Personal care and 40 238.0household products
15 7 Intel USA Information technology 26 764.0hardware
16 13 GlaxoSmithKline UK Pharmaceuticals and 33 258.3biotechnology
17 22 Novartis Switzerland Pharmaceuticals and 23 606.5biotechnology
18 29 Bank of America USA Banks
19 14 NTT DoCoMo Japan Telecommunication 43 055.0services
20 16 Coca-Cola USA Beverages 19 564.0
21 26 Berkshire Hathaway USA Insurance
22 19 Verizon USA Telecommunication 67 625.0Communications services
23 27 I-ISI3C Holdings UK Banks

inadequate to meet demand: put up prices or import more. … At this
point, some of you will be thinking that this only relates to goods. Isn’t
the service sector the saviour of the balance of payments? Aren’t we
rather good at what the experts call ‘invisible exports’, even though
nobody knows for sure what they are? To which the answer is yes, but
only up to a point. Services have performed well in recent years, helping
to offset the growing deficit in goods. Note, however, that the record
£15.2 bn surplus in 2002 was only a third as big as the £46.4 bn deficit
in goods. … In the longer term, however, the question is whether
services and investment can continue to mask the deterioration in
trade in goods.There has to be doubt as to whether they can.
Thus, the perceived wisdom that a loss in manufacturing output is
compensated by services is not valid. Both sectors depend upon each
other, of course, and they are not mutually exclusive, but weaknesses
in the manufacturing base can have profound repercussions for the
economic wealth of nations.
Although the US managed to improve its manufacturing base dra-
matically during the 1990s and now has many plants that can be
termed world-class, the damage to the economy is ongoing because the
22 Strategic operations management
24 20 Cisco Systems US Information technology 18 915.0hardware
25 25 Total Fina Elf France Oil and gas 110 261.6
26 28 Toyota Motor Japan Automobiles and parts 125 765.3
27 34 Nestlé Switzerland Food producers and 64 937.4processors
28 39 Wells Fargo USA Banks
29 54 Amgen USA Pharmaceuticals and 5523.0biotechnology
30 48 Dell Computer USA Information technology 35 404.0hardware
31 30 Nokia Finland Information technology 32 276.3hardware
32 32 ChevronTexaco USA Oil and gas 98 691.0
33 43 Royal Bank of Scotland UK Banks
34 33 PepsiCo USA Beverages 25 112.0
35 18 SBC Communications USA Telecommunication 43 138.0services
Source: Fortune, 21 July 2003.
Table 1.1 (contd)

US still imports more manufactured products than it exports, as we
see in Table 1.2. The difference is not met by the export of services.
Warnings about the problems of neglecting manufacturing oper-
ations had been offered by a number of academics over a number of
years, and Garvin (1992, p. xiv) describes how:
All too often, top managers regard manufacturing as a necessary evil.
In their eyes, it adds little to a company’s competitive advantage.
Manufacturing, after all, merely ‘makes stuff ’; its primary role is the
transformation of parts and materials into finished products.To do
so it follows the dictates of other departments.
Garvin (1992, p. xiv) argued that the definition of manufacturing has
to be seen in a wider context and he quotes the Manufacturing Studies
Board publication, Toward a New Era in US Manufacturing, in which it is
stated:
Part of the problem of US manufacturing is that a common definition of
it has been too narrow. Manufacturing is not limited to the material
transformation performed in the factory. It is a system encompassing
design, engineering, purchasing, quality control, marketing, and customer
service as well.
Harvard Professor, Wickham Skinner, whose contribution to our
understanding of the role of operations within a strategic context has
Introduction to operations management 23
Table 1.2US international trade 1998–2002
Year BALANCE
($ million)
Exports Imports Total
1998 682 138 911 896 �229 758
1999 695 797 1 024 618 �328 821
2000 781 918 1 218 022 �436 104
2001 729 100 1 140 999 �411 899
2002 693 103 1 161 366 �468 263
Source: U.S. Commerce department.

been seminal, perfectly captured the problem for US and many
European nations when he stated (Skinner, 1985, p. 55):
Manufacturing is generally perceived in the wrong way at the top,
managed in the wrong way at plant level, and taught in the wrong way
in the business schools.
The dire consequence of this has been manifested in the massive
decline of the manufacturing bases in many countries, notably in the
USA. This trade deficit – typically brought about by inadequate per-
formance in a range of operations – has had some profound conse-
quences, as Industry Week (30 May 2003) noted:
‘We are losing jobs to low-wage nations like China, and when
Congress finally wakes up, our manufacturing base will be eroded,’
warns Zawacki, who also is chairman of the Precision Metal Association,
a trade group of about 1300 North American companies. Even as
what he terms the ‘Big Guys’ take off for China and other
low-wage countries,‘small and medium manufacturers, mostly
suppliers, are trying to hang on without any support,’ he claims.
‘I am scared for my kids and future generations.’ As a result of
outsourcing production both in the US and overseas, IBM Corp. is ‘just a
shadow of [its] former self in terms of manufacturing operations,’
asserts Edward W. Davis, a Professor at the University of Virginia’s
Darden Graduate School of Business Administration in Charlottesville.
And a rule-of-thumb calculation suggests that the movement of
manufacturing operations to China in 2002 cost the US about
234 000 jobs.
The problem was made even clearer in the following (Industry Week, 30
May 2003):
US manufacturing executives, in addition to their understandable
concerns about a US economic recovery from recession that has been
agonizingly slow, are worried, among other things, about innovation,
outsourcing, protecting proprietary technologies, and perceived
imbalances between the US dollar and other currencies. …
Manufacturing is at a crossroads. … We face fundamental changes,
which if left unaddressed, could result in huge economic losses and
the erosion of our industrial leadership.
24 Strategic operations management

In addition, Business Week (5 May 2003) provided further insights into
job losses due to the decline in manufacturing:
Since the manufacturing sector tipped into recession in mid-2000, it has
shed 2.1 million jobs, leaving fewer industrial workers in the US than at
any time since the early 1960s.
We are not suggesting that there is an easy solution to these problems.
What we shall see in Chapter 2, though, is that often decisions to out-
source, downsize and abandon manufacturing activities within the
firm are made by those who may know very little about operations. The
strategic implication is clear: getting rid of manufacturing is relatively
easy to do; getting it back is almost an impossibility for firms.
Looking back …
Before we discuss the major points of strategy in the next chapter, it is
important to note that the reason why strategy is vital is that the nature
of most operations has undergone major changes over time, as shown
in Figure 1.8.
We will discuss each of the key periods in operations and then in
Chapter 2 we will develop this further by explaining how these changes
had profound importance to the way that strategy is both formulated
and implemented within firms.
The craft era
The first major era is now referred to as ‘craft’ manufacturing and ser-
vice ‘shop’ delivery. This system was European in origin and linked to
the way in which skills were developed: the apprentice–journeyman–
master progression, which led to the creation of guilds of skilled people
who sought to control the supply of their speciality, and the consolida-
tion of skill within a subsector of society (as, for example, skills were
passed on from father to son). This was noted for low-volume, high-
variety products, where workers tended to be highly skilled and quality
was built into the very process of operations. It was also appropriate
for largely national markets, supplied internally with minimal imports
and exports. Some craft manufacturing still remains today, in
markets where exotic products and services can control demands
through some unique feature or high level of desirability. For instance,
some house building, furniture making, clock and watch making are
Introduction to operations management 25

still carried out by skilled craftsmen/women working on a single or few
items of output at a time. While the processes and techniques used by
these craftsmen/women are highly inefficient, the unique quality of
their products commands a premium price, as illustrated by the second-
hand value of products such as a Daniels pocket watch or a Morgan car.
In the case of Morgan, however, it is a mistake to conclude that the pas-
senger car industry might still be able to employ craft production.
Morgan is unashamedly part of a sector that is closer to specialist toys
than that concerned with personal transportation. It is also the end of
a very thin tail, other parts of which (AC, Aston Martin, Rolls Royce,
etc.) have already been absorbed by volume producers, keen to oper-
ate in exotic niches for purposes that are closer to corporate advertis-
ing than to income generation. In the clothing industry, one significant
sector of the industry – haute couture – is based on the craft production
approach. In services, the craft era has also continued – perhaps even
more so than in manufacturing. The slower pace of change within services
derives from the extent to which customer processing operations can
26 Strategic operations management
Craft
Low volume, high variety;
firms are capable of
flexibility, high levels of
skills and quality is an
integral part of the
operations process.
A shift to high-volume, standard
products; the manufacturing task is
to produce low-cost goods with little or
no variety; work is largely de-skilled,
repetitive and narrow in scope with
little flexibility required from workers;
automation is dedicated to a small
product range and is incapable of
producing a wide variety of products.
The era is noted for the worker versus
manager divide. Production/operations
is viewed as a low esteemed function
within the firm.
Mass production
Time
The era of mass customization, where
firms have to be agile, flexible and
lean producers and manufacturing has to
be seen as strategic. The era of global
competition in many markets; and these
markets demand high variety and high
volume at the same time; this calls for a
highly motivated and flexible workforce
and management is largely self-managed
in production teams, responsible for
quality and other competitive requirements.
Production/operations is seen as a core
competence and has to be capable of
producing a wide range and different
volumes of output as required by
customers.
The current/future era
Figure 1.8
The transition from craft to strategic operations.

adopt new technologies and new systems. Only services that require
little skill at the operating level (such as FMCG or petrol retailing) or
processing large amounts of information (such as financial services)
are significantly different now from what they were like even 30 years
ago. Many services such as hotels, schools, hospitals, hairdressers, vehi-
cle repair and transportation have changed very little, despite new
technologies.
The mass production era
The second major era is known as mass production, although once
again its principles were by no means restricted to manufacturing. This
system grew in North America to accommodate three principal require-
ments of the developing giant: the need to export, the need to provide
employment for a massive, largely unskilled workforce, and the need to
establish itself as a world player, which meant infiltrating other regions
with ideas clearly associated with the USA. In short, the Americans
could not play by the European rules, so they reinvented the game:
innovating by destroying the competitive position of craft production.
The system was massively successful and changed the working and buy-
ing practices of the world in the first three decades of the twentieth cen-
tury. In order to sell the standardized products made by standardized
operations practices, mass production had to standardize the market
requirements too. Fortunately, the market was immature and would do
what it was told to do. Thus, mass production reversed the paradigm of
craft production: volume was high with little variety. The marketing
ploy (and the resultant manufacturing strategy) was exemplified by
Henry Ford’s famous declaration, from now on, ‘a customer can have a
car painted any colour he likes, as long as it is black!’ In mass produc-
tion, workers were typically unskilled. This was the era owing much to
the contribution of F.W. Taylor’s Scientific Management, whereby workers
had very narrowly defined jobs, involving repetitive tasks, and quality
was left to ‘quality experts’ at the final stage of the overall process rather
than being an integral part of operations at each step (Taylor, 1912).
Taylor enabled firms, for the first time, to control costs, times and
resources, rather than rely on skilled craftsmen and women to decide
what was appropriate. Coupled with the developments made in mech-
anization and employee co-ordination during the European industrial
revolutions, Taylor’s ideas provided an entirely different way of operating.
In 1926, Encyclopaedia Britannica asked Henry Ford to christen his
system and he called it mass production. He meant ‘mass’ in the sense
Introduction to operations management 27

of large volume production. Perhaps he did not see the other meaning
of mass as ‘heavy and cumbersome’, which is what the system turned
out to be (in terms of management systems and superstructure), once
the market no longer bought what it was told.
These principles originating in the 1920s were slow to be adopted in
services, but by the 1970s, Ted Levitt, from Harvard Business School, was
able to identify the ‘production-lining’ (Levitt, 1972) of service and the
‘industrialization’ (Levitt, 1976) of service. He cited fast food, the auto-
matic teller machine (ATM) outside banks and supermarket retailing
as examples of this. Schmenner (1986) coined the phrase ‘mass ser-
vice’ to exemplify this type of service operation. More recently, the
aspects of working life that are typical in this mass production context
have been extended to life in general by Ritzer (1993), who refers to it
as the McDonaldization of society. The shift from ‘craft’ marketing to
marketing in the mass production age is clearly demarcated by the
publication of Levitt’s (1960) article in the Harvard Business Review
entitled ‘Marketing myopia’. In mass production, customers bought
what was supplied; producers concentrated on keeping costs, and
hence prices, down, and focused on selling to customers through
aggressive advertising and sales forces. As organizations were product-
led, operations management was relatively straightforward. Mass pro-
ducing goods at the lowest cost meant minimizing component and
product variety, large production runs and scientific management.
The success of Ford made this view highly persuasive. In 1909, the
Model T automobiles were sold for $950, but by 1916, following the
introduction of the assembly line, it had fallen to $345, and three-quarters
of the cars on American roads were built by Ford (Bryson, 1994).
However, as Levitt (1960) pointed out, Ford was eventually out-
stripped by General Motors, who were not product-led but market-led.
They gave customers what they wanted – choice, model updates, a
range of colours (not just black!).
The symbol of this age is the brand. Originally (in the craft era) the
brand was a mark on the product, often a signature – for example, on
a painting – or symbol, signifying its ownership or origin. But in mass
production the brand took on far more significance. It became the
means by which one product (or service) could differentiate itself
from a competitor’s product (or service). Procter & Gamble set up
brand managers in 1931 to sell their different soap products. Later the
brand also became a guarantee of product/service quality. Kemmons
Wilson’s motivation in 1952 to open the first Holiday Inn hotel was his
own disappointment with the variable standards and sleaziness of the
motels he stayed in whilst on a family holiday. The success of delivering
28 Strategic operations management

a consistently standard level of service resulted in Wilson opening one
hotel every two and half days in the mid-1950s.
But by the 1990s, brands had come under threat. Markets are highly
fragmented, the proliferation of niches makes target marketing more dif-
ficult, product and service life cycles are shortening, and product/service
innovation is quicker than ever before; increasing customer sophistica-
tion has reduced the power of advertising. As a result, a more holistic view
of operations management is required, as Crainer (1998) suggests:
Companies must add value throughout every single process they are
involved in and then translate this into better value for customers.
This is because the modern era has brought profound changes in oper-
ations management and operations has to be at the heart of successful
strategic thinking.
The modern era
The third era (the current and, for the foreseeable future at least, the
likely scenario) is more difficult to name and has been called various
things. The terms used to describe the current era include:
■ Mass customization (Pine et al., 1993) – reflecting the need for
volume combined with recognition of customers’ (or con-
sumers’) wishes.
■ Flexible specialization (Piore and Sabel, 1984) – related to the
manufacturing strategy of firms (especially small firms) to
focus on parts of the value-adding process and collaborate
within networks to produce whole products.
■ Lean production (Womack et al., 1990) – developed from the
massively successful Toyota Production System, focusing on
the removal of all forms of waste from a system (some of them
difficult to see).
■ Agile (Kidd, 1994) – emphasizing the need for an organization
to be able to switch frequently from one market-driven object-
ive to another.
■ Strategic (Hill, 2000; Brown, 1996) – in which the need for the
operations to be framed in a strategy is brought to the fore.
Whatever it is called, the paradigm for the current era addresses the
need to combine high volume and variety together with high levels of
quality as the norm, and rapid, ongoing innovation in many markets.
Introduction to operations management 29

It is, as mass production was a hundred years ago, an innovation that
makes the system it replaces largely redundant.
As each era appeared, however, it did not entirely replace the former
era. As we have seen, a few pockets of craft manufacture still exist. Mass
production is still apparent in chemical plants and refineries and other
high-volume/low-variety environments. However, many are changing
fundamentally as existing economies of scale are questioned: thus,
steel manufacture faces variety requirements and has to develop ‘mini-
mills’ to lower economic batch sizes; the same is true for brewers and
pharmaceutical companies.
Forces that drive change in operations management
We know that operations management has gone through three periods
of change from craft, through mass production, to the present era. We
know that different sectors of many economies have gone through
these periods at different rates. In some, the transition has been incre-
mental, in others spasmodic, usually in response to some new inven-
tion. We also know that in some industries there has been an almost
complete transition from the old approach to the newest, whereas in
others there remains a high proportion of craft manufacture or old
style service delivery. Why is this so? If we can understand these forces
then we may be able to predict what changes are likely to occur in the
future.
We would argue that the three key forces to date have been eco-
nomic, social and technological, or to put it more simply wealth, fash-
ion and invention. Wealth influences economic activity and hence
operations management in two main ways. The aspiration to become
wealthy provides a highly proactive workforce, while the attainment of
wealth creates a growing market for all kinds of goods and services.
When a significant proportion of a population is relatively poor, goods
and services have to be provided at the lowest possible cost and con-
sumers are prepared to accept standardization. The wealthy can afford
customized products and indeed demonstrate their wealth by doing
so. Furthermore, social and economic status is not demonstrated
simply by ownership but by style, fashion or ‘quality’. For what the
American economist, Thorstein Veblen, called ‘conspicuous consump-
tion’ it is not just enough to have a television, but to have a digital televi-
sion; not enough to have a mobile phone but the latest hi-tech version
with a personalized key pad; not enough to own a car but important to
30 Strategic operations management

have a ‘special edition’. Fundamentally, goods and services can be cat-
egorized as necessities or luxuries. Necessities are those goods and
services that are perceived by people to be essential. These are normally
food, drink, health products/services, housing and so on. Making a
product or delivering a service that is perceived as essential clearly has
advantages, as even during periods of shortage or economic downturn
consumers will continue to purchase these items. What is deemed
essential by the population of one country or by one group of people,
however, may not be desired by another population or group. But not
only does ‘fashion’ vary between groups, it also varies over time within
groups. Luxury products and services that were once fashionable
become unfashionable. Up until the 1960s, nearly everyone wore a hat
(as evidenced by any black and white movie made and set in the 1940s
or 1950s). This is no longer the case. It is claimed that the hat-making
industry was sent into decline by President Kennedy – the first US pres-
ident to walk to his inauguration in Washington in January without a
hat, hence making hat wearing unfashionable. Many industries oper-
ate in a context of uncertainty derived from the impact of changes in
fashion – toys, clothing, shoe manufacture, entertainment, the media,
fabric manufacturers and so on.
Wealth and fashion are the powers that drive the forces of demand for
goods and services, while invention enables or constrains supply. If costs
are to be driven down then new ways of doing things are required. The
mass assembly solution to lower costs created by Ford does not work for
all industries. It may be highly effective in those industries that rely on the
assembly of parts to produce finished goods, but there are many sectors,
even in materials processing, that do not function in this way. It also does
not work well in customer processing operations (although in Russia,
some eye operations are carried out on patients who are placed on a con-
veyor belt that moves them from one specialist surgeon to another!). As
well as process redesign, invention can also create new machinery or
equipment for use within the transformation process. The single most
important recent invention in this respect is undoubtedly the micro-
processor (1975), which has been integrated into machinery and control
systems throughout the manufacturing and service sector, in order to
increase speeds and accuracy, reduce labour input and so on. Finally,
invention also creates new types of product and services that have not
existed before. This means that being the best at producing any product
or delivering any service is not sufficient, if the market for that output is
replaced by demand for something different. This questions the wisdom
of such phrases as ‘best practice’ and ‘world-class’: expertise may only be
Introduction to operations management 31

temporary. There are many companies that were the world-class or best
practitioners who no longer exist because people stopped wanting their
products or services and the associated skills became redundant.
The era of volatile markets and industries
This analysis of the forces that drive change helps to explain the current
situation. The current era has been called one of ‘chaos’ (Peters, 1987;
Stacey, 1993). Creating and sustaining competitive advantage in either
manufacturing or service firms is both complex and difficult, and a num-
ber of giant organizations have been humbled in recent times, appar-
ently unable to do just that. Examples of giants in manufacturing and
service sectors suffering declines by the mid-1990s include Boeing,
Caterpillar, Dayton-Hudson, Du Pont, Texas Instruments, Westinghouse
and Xerox. In the early 1990s, huge financial losses were incurred by
giants such as Citicorp, America’s biggest international bank (a loss of
$457 million in 1991); General Motors suffered losses of $23.5 billion in
1992 and IBM had losses of $8.1 billion in 1993, having enjoyed profits
of $6 billion in 1986. By the end of the 1990s, IBM was again reaping
profits of around $8 billion per annum.
Such erratic performances have led to a number of observers doubt-
ing the validity and worth of being in the Fortune 500. This was exem-
plified by the management guru, Peter Drucker, declaring ‘The
Fortune 500 is over.’ Volatility seems common to many firms who have
appeared in the Fortune 500 and, during the 1980s, nearly 50 per cent
(230 firms) disappeared from the Fortune 500. Such volatility has
impacted on senior personnel within firms (who are the supposed
chief strategists), and boardroom casualties in the 1990s included
Robert Stempel at General Motors, Michael Spindler at Apple,
Eckhard Pfeiffer at Compaq and John Akers at IBM.
The reasons for such ‘turbulence’ are complex, but fundamentally go
back to the three forces identified above – wealth, fashion and invention.
Whereas, in the past, wealth was confined to a relatively small proportion
of countries, it is now more widespread. This means that wealth creation,
in the form of significant economic activity, and market demand are
global. Such globalization creates complexity. Second, fashion becomes
global through the worldwide media of the cinema and television. When
movie or sports stars are seen to frequent certain types of establishment,
wear identified types of clothing or use certain types of product, con-
sumers are influenced in their views and values. Paid product placement
in films is now a significant proportion of profit for some types of movie
32 Strategic operations management

and most sports stars earn more from their affiliation with goods manu-
facturers than they do from their salaries or winnings. Third, the pace of
invention is increasing, as we shall see in Chapter 4.
Manufacturing versus services in operations management?
In Chapter 2 we shall discuss the vital importance of an operations
strategy. We argue that operations strategy includes both manufactur-
ing and services activities, and that these need to be integrated into a
combined, holistic manner. However, we have identified that these sec-
tors may well process different things, which we have categorized as
materials, customers and information. This may have implications for
the specific implementation of strategy, but not for operations man-
agement principles or issues per se. Comparing manufacturing and
service industries can be useful, but in an operations management con-
text we suggest that some of the divisions between them are overstated.
For example, in its review of 75 years of management thinking, the
Harvard Business Review, in 1997, traced the operations management
thread from ‘production’ in 1922, with such functions as ‘inventory
control’ mechanization, etc. to ‘growing attention of service manage-
ment’ in the mid-1970s, ‘lean manufacturing’ in the late 1980s and
‘supply chain management’ in the mid-1990s. By the end of their story,
the generic term for the area of business upon which we are focusing
is ‘adding value’ (Harvard Business Review supplement, September–
October 1997).
Similarly, Gilmore and Pine (1997) traced the developments of oper-
ations over time and concluded that the consumer will increasingly
think in terms of ‘experiences’ rather than a manufacturing or service
offering, as shown in Figure 1.9.
Similarly, the renowned management academic, C.K. Prahalad,
stated in 2002 (Financial Times, 2002):
People talk about the convergence of technologies. I think the most
fundamental convergence is between the role of producer and the role
of consumer. … The consumer goes from being a very passive person
to being a very active co-creator of products, services and value. …
Companies spent the 20th century managing efficiencies.They must
spend the 21st century managing experiences.
We believe that this is an important contribution, but we add that instead
of seeing manufacturing versus services we need to see manufacturing
Introduction to operations management 33

alongside services in terms of understanding the range of interlinking
activities from basic inputs to end customer delivery. We illustrate this in
Figure 1.10.
We argue that the distinction between manufacturing and services is
not quite as profound as often stated, for a number of reasons.
First, manufacturing and service operations often link together in
providing a total customer offering within the supply chain. For example,
the automobile industry is often seen as a purely manufacturing con-
cern and much research has been undertaken on Japanese versus
Western approaches to manufacturing (for example, see Womack
et al., 1990; Lamming, 1993). For the automotive customer, however,
the service end of the overall supply chain may be, at key points of the
transaction, equally important in the decision to purchase. Activities
such as arranging finance, offering warranties and guarantees,
together with general after-sales service, are often critical. In many
cases, it does appear that the automobile manufacturers have made
34 Strategic operations management
I N P U T S
Manufacturingoperations
Serviceoperations
C U S T O M E R
The combined manufacturing and
service operations provide an overall offer
to the customer
Figure 1.10
The manufacturing/
service interface
in the offer to the
customer.
According to Gilmore and Pine (1997), the neweconomy will be an ‘experience’ economy wherecompanies package ‘experiences’ rather than‘goods’ or ‘services’
• Examples: Niketown, Borders (bookstore),Warner movie ‘villages’
• Theme parks, theme restaurants, theme housingestates
Commodities Goods Services Experiences
Figure 1.9
Changes from
‘commodities’ to
‘experiences’.
great strides in assembling cars, but have yet to master leanness in their
distribution chains; indeed, this is now the subject of important
research and development, as the vehicle assemblers pursue the holy
grail of the ‘three-day car’ (i.e. a situation in which the customer
can specify any car they want and have it within 3 days). In the com-
puter industry, the customer is paying not only for the ‘tangibles’
(hardware and software), after-sales service is an important part of the
overall offering and the assurance of help-lines for troubleshooting
problems is a key feature in the complete transaction. In that sense,
therefore, we should not see operations in terms of manufacturing ver-
sus services but, rather, as a combination of joint efforts throughout
the entire supply chain as a means to providing customer satisfaction.
Consequently, the issue of quality will depend not only on the per-
formance of a car, but also on the service quality provided at the point
of sale to the customer.
Second, some of the distinctions are not quite as pronounced as may
first appear. For example, the following are typical statements concern-
ing service industries and their contrast to manufacturing operations:
■ The product is intangible.
■ Services cannot be kept in stock.
■ Services vary and cannot be mass-produced.
■ There is high customer contact.
■ Customers participate in the service.
■ Facilities are located near to customers.
■ Services are labour intensive.
■ Quality is difficult to measure.
■ Quality depends largely on the server.
We shall now take each of these in turn and explore them.
The product is intangible
Is this necessarily the case? Increasingly, service organizations speak in
terms of ‘products’ for their customers. This is very clear across a range
of financial services where the term, product, is used and where the
‘intangible’ becomes ‘tangible’. For example, customers choosing a
mortgage can think in terms of a range of products: fixed versus vari-
able rates; the duration of the loan; comparisons between various inter-
est rates tied to a particular offer. Vacations or holiday packages are
within the realms of services, yet holiday organizations speak in terms of
‘packages’. Similarly, time-share organizations will make the intangible
more identifiably tangible. They will speak in terms of purchasing and
Introduction to operations management 35

accumulating a number of points to obtain a particular holiday or time
away. Airline organizations that offer ‘air miles’ for their customers offer
the same approach. In education, universities are able to offer a range of
‘products’, or different modes of attendance for a particular degree. An
MBA, for example, may be offered by distance learning, or by a 1-year
intensive programme, or a 2- to 3-year part-time mode, or in a sporadi-
cally attended, weekly intensive, modular design. Being able to offer a
range of products means that, although a professional service is being
provided, the potential students on the course can choose a particular
offer over another because certain, identifiable, tangibles have been put
in place – duration of course, modes of attendance, etc.
Services cannot be kept in stock
In ‘tangible’ services (such as restaurants, fast-food chains and car
repair outlets) the supporting element of the service – supplies – is
clear and will be kept in stock. In service retail outlets, the goods have
to be available for the customer. In professional services – a solicitor, a
doctor or a consultant, for example – it becomes clear that delivery of
the services depends on the intellectual capital, experience and ‘know-
how’. That being the case, we can speak in terms of a body of know-
ledge or know-how being accumulated over time and ‘stored’ in
readiness. This may be by a particular individual specializing in one
area or by a group of professionals who can offer a variety of profes-
sional services. Likewise, there are some products that cannot be kept
in stock for long – most obviously perishable food products. But other
markets which are subject to rapid, short-term changes in demand,
such as the pop music industry, also make it inadvisable to hold stock
for too long. Whilst the physical shelf-life of a CD may be many years,
the sellable shelf-life will only be as long as the music is popular.
Services vary and cannot be mass-produced
Again, such an assertion depends on where and how we view the service.
As a generic term, fast-food restaurants would come under a ‘service’ as
opposed to ‘manufacturing’. Clearly, where there is a considerably high
tangible feature or input as part of the service provision, we can say
that the product can be produced in volume and is not a truly unique
event at the point of service delivery. All fast food is mass-produced to
some degree. In Russia, eye surgery on cataracts has been ‘production-
lined’. In the field of education, the provision of distance learning has
36 Strategic operations management

highly standardized the student experience. The issue of volume and
variety is an important one for manufacturing and services, and this is
discussed in Chapter 3.
There is high customer contact
Technology has made a great deal of difference in tempering this state-
ment. Clearly, in many financial transactions there may be little or no
customer/client contact. Also, if you take a long-distance flight you will
discover that even in a ‘customer care’ service, the actual amount of
contact between customer and provider may be minimal. One of the
authors estimated that, in an 8-hour flight from the USA to the UK,
no more than 2 minutes was spent in contact with staff. That is not a
criticism of the service – in fact, when a passenger wants to use the
flight to sleep, the very last thing that he or she wants is to be disturbed
by a service offering that the passenger does not want!
In manufacturing environments, while it may be true to say that
within the manufacturing end of the supply chain it is unlikely that the
customer comes into contact with the manufacturing plant itself, this
is not always the case. In a job shop environment, for example (see
Chapter 3), there may be joint design and strong customer links with
the supplier. Conversely, in services, there will not always be high cus-
tomer contact. Financial services are a point in case. Often customers
do not engage in contact with other persons during the provision of
the service. Indeed, there may be occasions when the customer does
not need or require such contact – obtaining funds from a cash
machine involves little contact and it is wholly appropriate for this to
be so. Even in professional services, there may not be a great deal of
customer involvement (although the client will be billed for hours
spent by the professional).
Customers participate in the service
As we have noticed, this is not necessarily the case, or if there is ‘partici-
pation’ it may be to a very small degree. This is noticeable where
automation helps to speed up the process and, by implication, to reduce
the amount of time required by the customer in the service transaction.
Facilities are located near to customers
This used to be a critical distinction between manufacturing and ser-
vices. In the past we could have said, with high levels of confidence, that
Introduction to operations management 37

manufacturing plants are located close to suppliers for ease of trans-
portation; in contrast, services are located near to customers. We saw
this as part of the decision-making process for Sunnyside Up. This dis-
tinction between manufacturing and services is still valid in some cases.
Large retail organizations will, typically, be located close to a large town
or be close enough to a city to attract customers. Here, a key factor is
capacity for customers, especially in determining the size and ease for
customers in car-parking facilities. However, the increase in technology
in many service operations has often reduced the need for facilities to
be physically close because much of the transaction can be automated
via computer, telephone, fax or other types of technology, as is the case
with insurance, hotel reservations or banking services. The Internet will
play a central role in such decoupling, as the success of Amazon.com
demonstrates in book retailing.
Services are labour intensive
We need to focus on specific service sectors in order to evaluate the
application of the statement. Sure, in high-volume manufacturing it is
true to say that direct labour costs are relatively small – typically less
than 10 per cent in industries such as automobiles and markets within
‘high tech’. In manufacturing, the largest cost will tend to centre on
materials or inventory management. In services, though, if there is a large
tangible element to the overall provision of the service (for example, fast
foods), then labour will similarly form a small part of the overall costs.
Increasingly, technology in services has helped to reduce the extent of
labour involvement in the transaction process and therefore labour
costs are reduced to suit.
Quality is difficult to measure and depends
on the server
One of the myths surrounding service provision is that quality is impos-
sible to measure. For sure, measuring quality within manufacturing
plants might be seen as easier in that the product can be measured
in terms of weight, height, overall dimensions and so on. But such
measurement is only part of the overall evaluation of quality (we dis-
cuss this further in Chapter 8) and it is sufficient to say here that there
has been a major shift in recent years concerning quality, particularly in
professional services. In services, time is an important dimension in
measuring quality – speed and reliability of response are measurable
and quantifiable. Such measures are used in the fire service – the
38 Strategic operations management

frequency of timely responses within specified standards to fire alarms,
for example. The same type of measure is used in responses from
ambulance crews to emergencies. In health care, measurements such
as patient waiting lists for operations, or the time spent waiting in
Accident and Emergency units, or patient throughput times and other
time-related measures are used as part of the quality assurance pro-
cedures. However, speed of response times may not be sufficient, as
we can see in the following example (Arussi, 2002):
A large US auto insurance company had a long-standing rule that when
a customer called to cancel a policy, it would honor the request
immediately in order to heighten efficiency. Recently, though, the
company launched a pilot program to gather information from
departing customers. Skillful, gentle questioning let the company not
only identify the reasons for cancellation, which is very valuable
marketing information, but also retain 17% of those customers who had
called to cancel. Of course, the average discussion time increased, but
the agents generated a significant amount of additional revenue.The
company has since abandoned its speed-at-any-cost policy.
In professional services, quality has become an important issue. For
example, the Law Society in the UK takes a much more involved role
than it used to regarding the provision of the service quality by solici-
tors. This is due, in part at least, to the fact that clients are far more
likely to take action against their solicitors than used to be the case, and
their ability to do so is due to a far greater understanding and awareness
of critical issues surrounding service quality in professional services.
In consumer services, within retail outlets or various types of fran-
chises, firms will utilize ‘mystery shoppers’ to gain feedback and thus
measure the performance of the server. Sometimes such feedback
can be quite negative, as exemplified in the following (Fortune, 30
September 2002):
A McDonald’s memo accusing franchisees of service shortcomings has
McDonaldland grimacing. In the three-page document obtained by
Fortune, which was recently sent to McDonald’s franchisees in the
Raleigh region, vice president Marty Ranft cites ‘alarming research’
showing how bad service has gotten.‘Mystery shoppers’ hired by the
company to make unannounced visits found that restaurants were
meeting speed-of-service standards only 46% of the time, with three
of every ten customers waiting more than 4 minutes for their meals – an
eternity in the fast-food business. It also cited complaints of ‘rude
service, slow service, unprofessional employees, and inaccurate service’.
Introduction to operations management 39
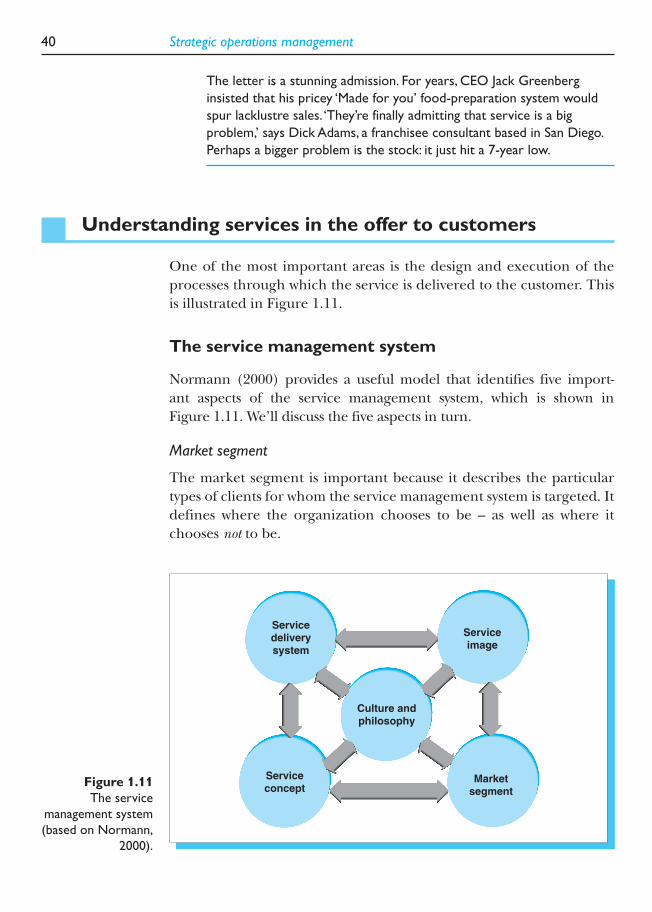
The letter is a stunning admission. For years, CEO Jack Greenberg
insisted that his pricey ‘Made for you’ food-preparation system would
spur lacklustre sales.‘They’re finally admitting that service is a big
problem,’ says Dick Adams, a franchisee consultant based in San Diego.
Perhaps a bigger problem is the stock: it just hit a 7-year low.
Understanding services in the offer to customers
One of the most important areas is the design and execution of the
processes through which the service is delivered to the customer. This
is illustrated in Figure 1.11.
The service management system
Normann (2000) provides a useful model that identifies five import-
ant aspects of the service management system, which is shown in
Figure 1.11. We’ll discuss the five aspects in turn.
Market segment
The market segment is important because it describes the particular
types of clients for whom the service management system is targeted. It
defines where the organization chooses to be – as well as where it
chooses not to be.
40 Strategic operations management
Servicedeliverysystem
Serviceimage
Serviceconcept
Marketsegment
Culture andphilosophy
Figure 1.11
The service
management system
(based on Normann,
2000).

Culture and philosophy
Normann suggests that the core of the service management system is
the company’s culture and philosophy. This describes the overall values
and principles guiding the organization, including values about human
dignity and worth. This is of paramount importance for some compa-
nies (The Body Shop being a prime example) and forms part of their
mission statements.
Service image
The image is vitally important because, within services, customers typ-
ically participate in the production of a service as well as its consump-
tion. As a result, the physical environment in which the service is
produced has important effects:
■ the external environment, including location, premises, ease of
access, ambience;
■ the internal environment, including atmosphere and structure,
within which the service personnel operate.
Thus, the service image becomes part of the information system for
influencing clients and customers alike.
The service concept
The service concept is the specification that describes the benefits offered
by the service. This becomes a key element in the customer’s perception
of the ‘moment of truth’, when the service provider and customer actu-
ally meet. The service concept can include a complex set of values –
physical, psychological and emotional – and these affect both what the
company does and how it is perceived by its customers and clients. The
service concept also describes the way in which the organization would
like its employees and stakeholders to perceive its service offering.
The service concept includes the service package within the offer, and
includes both the physical and tangible elements of the service offering
and its intellectual/intangible elements. The total service package – the
bundle of goods and services (Heskett et al., 1990) – includes:
■ physical items – the physical good that is changing hands, if any
(often called facilitating goods in services);
■ sensual benefits – aspects that can be experienced through the
sensory system (explicit intangibles);
■ psychological benefits – emotional or other aspects (implicit
intangibles).
Introduction to operations management 41

The service delivery system
The service delivery system is the way in which the service concept and
service package are actually delivered to the consumer. This process
may include customer participation in the manner in which the offer
is designed and delivered to customers, including personnel, clients,
technology and physical support. The service delivery system is dic-
tated by and defined by the service concept.
Manufacturing and services – the key point
Many articles and texts make sweeping distinctions between manufac-
turing and services. We argue that this is not always helpful when trying
to manage operations. What provides better insight is in viewing manu-
facturing and service operations as collaborative activities in providing
goods and services to customers. A more relevant distinction is to dif-
ferentiate between those operations that process materials and those
that process customers. It needs to be remembered that materials do
not think or act for themselves, whereas customers can and do. Service
companies that forget this and start to treat their customers as if they
were materials will not survive in the long term, even if they provide
excellent value.
42 Strategic operations management
Summary
■ The range of responsibilities that operations managers have within the plant or service itself is both profound, important and wide in scope.
■ Operations management is concerned with those activities that enable an organization (and not one part ofit only) to transform a range of basic inputs into outputs for the end customer.
■ Operations management is very wide in scope of responsibilities and will draw upon a range of functionswithin the organization, not be limited to a specific department.
■ Operations management is concerned with uniting these other areas and functions into a central core ofcapabilities for the organization.
■ Operations management is no longer limited to a narrow focus on organization-specific activity. In the modern era of operations management, organizations no longer see themselves as a stand-alone elementin the overall ‘process’ but will, instead, see themselves as part of a wider, extended enterprise.
■ Not only is the organization concerned with transferring goods and services to end customers, it has to doso in a value-added way. Value added, in most simplistic terms, means that the income or benefit derivedfrom performing a particular operation is greater than the cost of doing so. All organizations, whether theyare in the private or public sector,or in manufacturing or services, have operations within them. Increasingly,value-added operations are important to both private and public sectors.
■ The link between operations and marketing is a critical one. Constant dialogue needs to take place in orderto satisfy customer requirements. Expertise in one may be negated by failure in the other.

Key questions
1 What are the major areas of responsibility for operations managers?
2 Why is it important to go beyond the organization-specific, input/
processes/output model in modern-day operations management?
References and further reading
Arussy, L. (2002) Don’t take calls, make contact. Harvard Business
Review, 80(1), 16–18.
Barney, J.B. (1991) Firm resources and sustained competitive advan-
tage. Journal of Management, 17, 99–120.
Brown, S. (1996) Strategic Manufacturing for Competitive Advantage.
Hemel Hempstead: Prentice Hall.
Brown, S. (2000) Manufacturing the Future – Strategic Resonance for
Enlightened Manufacturing. London: Financial Times Books.
Bryson, W. (1994) Made in America. London: Minerva.
Business Week, The flexible factory, 5 May 2003.
Crainer, S. (1998) Thinkers that Changed the Management World. London:
Pitman.
Financial Times (2002) 13 December, p. 14.
Fortune, Fast food, slow service, 30 September 2002.
Fortune, The Global 500, 21 July 2003.
Garvin, D. (1992) Operations Strategy, Text and Cases. Englewood Cliffs,
NJ: Prentice Hall.
Gilmore, J.H. and Pine, J. (1997) Beyond goods and services. Strategy
and Leadership, May/June, 25(3), 10–18.
The Guardian, 16 February 2004, p. 23.
Hayes, R. and Pisano, G. (1994) Beyond world-class: the new manufac-
turing strategy. Harvard Business Review, January–February, 77–86.
Heskett, J.L. (1986) Managing in the Service Economy. Cambridge, MA:
Harvard Business School Press.
Heskett, J., Sasser, E. and Hart, C.W. (1990) Service Breakthroughs.
New York: Free Press.
Introduction to operations management 43
■ Instead of seeing manufacturing versus services, we need to see manufacturing alongside services in termsof understanding the range of interlinking activities from basic inputs to end customer delivery.
■ The distinction between manufacturing and services is not quite as profound as often stated for a numberof reasons; the key issue is more likely to be differences between materials, customer or information processing operations.

Hill, T. (2000) Production/Operations Management. Hemel Hempstead:
Prentice Hall.
Industry Week, Manufacturing’s global future, 30 May 2003.
Johnston, R. and Clark, G. (2001) Service Operations Management.
Hemel Hempstead: Prentice Hall.
Kidd, P. (1994) Agile Manufacturing – Forging New Frontiers. Reading,
MA: Addison Wesley.
Lamming, R. (1993) Beyond Partnership. Hemel Hempstead: Prentice Hall.
Levitt, T. (1960) Marketing myopia. Harvard Business Review, July–August,
35–56.
Levitt, T. (1972) The production-line approach to service. Harvard
Business Review, 50(5), 20–31.
Levitt, T. (1976) The industrialisation of service. Harvard Business
Review, 54(5), 32–43.
Muhlemann, A., Oakland, J. and Lockyer, K. (1992) Production and
Operations Management. London: Pitman.
Normann, R. (2000) Service Management, 3rd Edition. New York: Wiley.
Peters, T. (1987) Thriving on Chaos. London: Pan Books/Macmillan.
Pine, B., Bart, V. and Boynton, A. (1993) Making mass customization
work. Harvard Business Review, September–October, 108–119.
Piore, M. and Sabel, C. (1984) The Second Industrial Divide: Possibilities
for Prosperity. New York: Basic Books.
Porter, M. (1980) Competitive Strategy. New York: Free Press.
Porter, M. (1985) Competitive Advantage. New York: Free Press.
Ridderstrale and Nordstrom (2000) Funky Business. London: FT Books.
Ritzer, G. (1993) The McDonaldization of Society. California: Pine Forge.
Samson, D. (1991) Manufacturing and Operations Strategy. Sydney:
Prentice Hall.
Schmenner, R.W. (1986) How can services business survive and pros-
per? Sloan Management Review, 27(3), 21–32.
Skinner, W. (1985) Manufacturing, the Formidable Competitive Weapon.
New York: Wiley.
Stacey, R. (1993) Strategic Management and Organizational Dynamics.
London: Pitman.
Taylor, F. (1912) Scientific Management. Hanover, NH: Dartmouth College.
Teece, D., Pisano, G. and Shuen, A. (1997) Dynamic capabilities and
strategic management. Strategic Management Journal, 18(7), 509–533.
Womack, J. and Jones, D. (2003) Lean Thinking, 2nd Edition. New York:
Simon & Schuster.
Womack, J., Jones, D. and Roos, D. (1990) The Machine that Changed the
World. New York: Rawson Associates.
44 Strategic operations management
C H A P T E R
Strategic operationsmanagement
2
Introduction
In this chapter we will expand upon a number of key issues faced by
operations managers in both manufacturing and service environments
that we discussed in Chapter 1. We will develop the theme of how opera-
tions management must be seen in terms of strategic importance and
how strategies have to be in place if the organization wants to be able
to compete in the modern business world.
In Chapter 1 we looked at the major responsibilities that face opera-
tions managers. As we saw, these responsibilities are wide in scope and
extremely important by themselves. It is important to bear in mind that
operations managers have responsibilities that go beyond management
of assets, costs and human resources in the transformation process (as
important as these managerial responsibilities are!). In the current busi-
ness environment, operations must be managed in a way that will enable
the firm to compete against extensive and increasing competition from
around the world. This means that managing operations takes on wholly
different requirements to how it was performed in the past. In short,
operations management becomes strategic operations management.
The modern business world requires rapid and continuous innov-
ation, and there is global competition in many industries and markets.
This chapter addresses key areas, including:
■ Understanding the nature of strategy.
■ The vital role of operations strategy.
46 Strategic operations management
■ Manufacturing and operations strategy.
■ Why many firms struggle with forming operations strategies.
■ Service operations strategies.
■ Strategic resonance.
■ The need for flexibility and agility.
■ The nature and importance of strategy in dealing with com-
petitive conditions.
■ Competitive analysis and profiling.
■ Operations management as part of developing core
competences.
The purpose of this chapter is for the reader to:
■ understand why there is a need for all organizations to
develop operations strategies;
■ gain insights into how operations strategy has developed
over time;
■ provide indications of the process and content of strategy;
■ appreciate why some organizations struggle with devising and
implementing operations strategies.
Understanding strategy
We do not pretend that strategy is easy or straightforward. Strategy
is clearly a complex issue (Whittington, 2001; Mintzberg et al., 2000),
but we can say that a number of recurring factors are integral to the
strategy process. For us, strategy is:
■ concerned with meeting existing market needs as well as
exploiting opportunities for potential market segments (Kim
and Mauborgne, 2002; Nunes and Cespedes, 2003);
■ about making the best use of resources, and to leverage these
resources either alone or with partners (Wernerfelt, 1984;
Barney, 1991; Dierickx and Cool, 1989; Lamming, 1993;
Hines, 1994; Stump et al., 2002; Ireland et al., 2002);
■ the ultimate responsibility of senior-level managers within the
firm – of course, we recognize the vital of importance of a
range of stakeholders in the process, both within the firm and
with external linkages to the enterprise (Frambach et al., 2003;
Hax and Majluf, 1991; Dougherty and Corse, 1995);
Strategic operations management 47
■ about devising and implementing processes that will enable
the enterprise to compete and, ideally, to create competitive
advantage (Whittington, 2001; Hamilton et al., 1998);
■ concerned with developing capabilities within the firm’s oper-
ations that are superior to other competitors and that other
competitors either cannot copy or will find it extremely diffi-
cult to copy (Teece et al., 1997; Eisenhardt and Martin, 2000).
These indications of what strategy is about are important because they
are all linked to operations management in various ways. That is not
necessarily a problem in itself: the problem is that firms often do not
organize themselves in a way that will allow them to make the best pos-
sible use of their operational capabilities. This is true of both manu-
facturing and service organizations. If anything, the situation has been
even worse in service organizations, which have lagged considerably
behind the revolution in manufacturing practices that has taken place
over the last 30 years. While there is now a well-established service
management academic discipline in some business schools and an
emerging research agenda, this is a very recent phenomenon. Service
operations thinking may be said to have originated with the publica-
tion of Sasser et al.’s book on the subject in 1976.
To begin with, the very idea that operations should be seen as a ‘stra-
tegic’ factor is still a problem for some firms, whose overall strategy may
be governed by a few people at the top of the hierarchy of the firm who
might know very little about production and operations management. As
a result of this, the rationale behind, and the measurement of the success
of, business decisions may be driven almost entirely by short-term finan-
cial criteria. As we noted in Chapter 1, such an approach may often rob
the firm of vital investment to support and sustain key operations areas,
such as technology, plant modernization and ongoing training. In 1997,
Lord Simon, UK Minister for Competitiveness, in HM Treasury (himself
an ex-industrialist) blamed the parlous state of the British manufactur-
ing sector on three factors: uncertainty in currency exchange rates, poor
labour productivity and prolonged lack of investment over two decades.
The use of management accounting tools and ‘justification by num-
bers’, although important, is not enough. For example, there simply is
no formula to determine financial ratios or outcomes if the firm doesn’t
invest in these key areas. Ultimately, if the firm fails to invest – and, as
we shall see in Chapter 3, the opposite extreme of ‘throwing money at
the problem’ is not the answer either – then the net result is that the
firm will fail to compete and will face decline.

The distortion brought about by lack of investment was perfectly cap-
tured by an American academic lamenting the situation in his country
(Professor Edward W. Davis, quoted in Industry Week, June 2003):
‘This focus on quarterly profits among the large, publicly held
companies is deathly. If there is any hope on the horizon for this
country it is in the privately held, medium-size companies,’ he says.
‘I see them with a willingness to take greater risks in investments that
benefit the competitiveness of the company and don’t just make the
ROI look better in the short run. I see them with a better balance of
outsourcing.’
‘If I could change one thing about this country that I think would help
improve manufacturing in the long run, it would be to pass a law to
forbid the reporting of company profits on a quarterly basis. I think that
the short-term focus on profits has done more to hurt manufacturing
than probably any other thing.’
Businesses face increasing levels of competition, which is becoming
more global in nature in many industries. Coping with this competi-
tion demands that strategies are in place, because being prepared and
poised to act rarely, if ever, comes about by accident or ‘just happens’
by chance.
The strategy mission
As we noted in Chapter 1, firms will often articulate a mission, linked
to its strategy. This core mission does not have to be particularly
lengthy, or wonderfully articulated when stated, but it does have to be
meaningful. Examples include Komatsu’s vision of ‘Maru-C’ – to encircle
Caterpillar, Komatsu’s major rival – and Coca-Cola’s intention of being
able to position a coke within ‘arm’s reach’ of every consumer in the
world are entirely appropriate for their firms. The mission is depend-
ent upon what the firm does via its operations capabilities. On occa-
sions, the core mission’s intention may be a little more dramatic, as in
Honda’s case (Whittington, 2001, p. 69):
… when Honda was overtaken by Yamaha as Japan’s number one
motorbike manufacturer, the company responded by declaring
‘Yamaha so tsubu su!’ (We will crush, squash and slaughter Yamaha!).
48 Strategic operations management

The ability to launch such a plethora of innovations in a short time
came about by mobilizing a set of capabilities that had been developed
over time by Honda. These operations capabilities were then able to
be utilized in the market in order to ward off competitive advances.
However, it is futile to assert a strategy if operations capabilities are
not in place. One telling example of this problem was with Compaq.
Compaq’s problems began in 1994, when its former CEO, Eckhard
Pfeiffer, announced that Compaq would make all its PCs on a ‘build-to-
order’ basis by 1996. At the time of the ‘build-to-order’ statement from
Pfeiffer, Compaq built less than 5 per cent of its machines to order. By
the beginning of the new millennium, Compaq was way behind Dell
in build-to-order capabilities and Dell had surpassed Compaq in desk-
top PC sales to US businesses for the first time. Perhaps more than any
other single factor, it was the absence of customer-focused operations
strategies that cost Pfeiffer his job.
The success of operations strategy has nothing to do with how long
the planning process has taken, nor has it to do with how nicely or how
wonderfully articulately the strategy is presented to the firm’s employees –
if indeed strategy is articulated to employees! Rather, the success of oper-
ations strategy will be determined by the extent to which it will focus
operations’ efforts into an integrated set of capabilities. These capabil-
ities should, in turn, enable the firm to compete in the increasingly com-
petitive environment common to many industries. It is not argued that
manufacturing/operations managers should necessarily take the lead in
business strategy, but that they should be an integral part of the strategic
planning process. Without operations managers’ capabilities, the best
marketing and corporate plans have little chance of being achieved. The
importance of being able to accomplish the strategic vision once it has
been formed was highlighted by Fortune (8 March 2004):
Not only do the majority of the world’s most admired companies
have a winning strategy – they’re also able to carry it out. That’s the
conclusion of a follow-up study conducted by the Hay Group in the
last quarter of 2003. The study found that a key difference between the
most admired companies and others surveyed lies in execution.‘It’s not
a secret what needs to be done,’ says A.G. Lafley, CEO of Procter &
Gamble, which ranked No. 1 in the household and personal products
industry and had the highest overall score of any of the 346
companies on this year’s list. ‘The challenge is to put the strategy,
systems, and capabilities in place, and then drive deployment and
execution.’
Strategic operations management 49

What strategy is about
If the mission of the company is about stating what the firm is about,
then strategy is about how the firm will achieve the mission. In Honda’s
case the mission (the ‘what’ element) was ‘to crush, squash and slaugh-
ter Yamaha!’, but the strategy (or the ‘how’ element) was by launching
the dramatic rate and range of products in 18 months.
In essence, then, we can illustrate basic strategy in Figure 2.1.
However, in order to have a sense of what the organization can and
cannot do, the senior-level strategists need to have a good understand-
ing of operations capabilities. Of course, in a business world that is
increasingly about forming networks it is important that strategists do
not limit themselves to operations that reside within the firm only. But
any firm wishing to be involved in supply chains/networks has to
‘bring something to the party’ in terms of a range of capabilities that
other firms within the same network either do not possess or do not
intend to acquire.
It is important that we do not think of operations as a limiting
factor in strategic formulation. Indeed, many companies have senior-
level strategists who do understand the capabilities within the firm and
can think in terms of how these capabilities can be targeted to where the
firm currently may not have a presence. For example, Sony is famous
for exploiting its capabilities in miniaturization in a number of different
markets. This ‘reverse marketing’ approach – using operations capabil-
ities to target future markets – is part of the resource-based view of strat-
egy, which we will discuss later. It is illustrated in Figure 2.2.
In order to understand strategy it is, perhaps, sensible to think of it
in terms of both the process and content involved in the process.
Figure 2.3 indicates the basic difference.
50 Strategic operations management
Figure 2.1
The basic strategy
model.
Where thecompany iscurrently – interms of markets,products and othercorporate goals
Where thecompany wants tobe – in terms ofmarkets, productsand other corporategoals
The change process
MISSIONFUTURE
STATE STRATEGY

In reality, the process (the ‘who’) defines to a large extent the con-
tent (or the ‘what’) of strategy. For example, if the strategy is made by
senior-level managers the scope of the content, typically, will be wider
and more ‘business focused’ than if the process were left to function-
ally focused managers. However, as we shall see, in order for strategy
to be meaningful, the link between business and operations strategy
is vital.
Strategic operations management 51
Operationscapabilities
Current markets in whichthe firm competes
Potential markets that canbe targeted due tooperations capabilities towin orders
Figure 2.2
Using operations
capabilities in
strategy formulation.
StrategyFormulation
The Processof Strategy –‘WHO isinvolved?’
The Contentof Strategy –‘WHAT it contains’Figure 2.3
Understanding the
process and content
of strategy.

The vital role of strategy
Although there may not be absolute agreement on the definition of
strategy, there are at least four characteristics that tend to distinguish
strategic from tactical decisions.
1. The role of senior management
We can say that strategy formulation tends to be the prerogative of
senior managers within the firm and the final decisions regarding
the direction of the firm will rest with these senior-level managers.
However, other levels of the firm may also be involved in the develop-
ment of strategic plans and these other levels will certainly be involved
in their implementation (for a good discussion on strategic formulation,
see Johnson and Scholes, 2003).
2. Creating competitive advantage
Strategic decisions are intended to create competitive advantage for
the firm or, at the very least, to allow the firm to continue to compete
in its chosen markets. The term ‘strategy’, as used in the ‘business strat-
egy’ sense, originated in military terminology. This analogy is not liked
by some writers (for example, see Kay, 1993) because strategy is not
always about obliterating the competition. However, it should fall
under the realm of strategists within the firm to determine and exploit
opportunities and, at the same time, to be aware of, and diffuse, poten-
tial threats from other players. So a feature of strategy is the need for
awareness and vision outside of the firm, as Hamel and Prahalad
(1994, p. 78) explain:
To get to the future first, top management must either see
opportunities not seen by other top teams or must be able to exploit
opportunities, by virtue of pre-emptive and consistent capability-building,
that other companies can’t.
For some firms this will mean attacking and exploiting opportunities,
where a major player has not paid attention or has believed a particu-
lar market segment to be insignificant. For example, in the early 1990s,
IBM lost over one-third of its PC market share to Compaq and Apple.
These two players (amongst others) attacked in key segments such as
52 Strategic operations management

home use, education and small business users, all of which had been
neglected by IBM in the pursuit of mainframe developments. Similarly,
GM has lost vast amounts of market share (it went from a high in the
domestic market of 61 per cent in 1979 down to 29 per cent by 2004)
to the likes of Honda, Mazda, Toyota, Chrysler and Ford, who either
attacked or, indeed,created market segments neglected by GM. These neg-
lected or ignored segments included four-wheel drives, sub-compacts,
turbos and minivans. On the other hand, ACCOR Hotels has come to
dominate the hotel market in France by deliberately developing a strat-
egy based on having a hotel brand for all market segments – Formula 1
and Urbis at the lower end of the market, Orbis and Novotel for the
middle market, and Sofitel at the top end.
However, as we noted above, strategy does not necessarily concern
itself with the destruction of other players but, if we expand the mili-
tary application of strategy further, a firm may often develop alliances
with other competitors rather than seek their destruction. These
alliances may play a major factor in the success of the firm in specific
areas, as we shall see in Chapter 4 on innovation and Chapter 6 on
strategic partnerships in the supply chain. A key requirement for entry
to these alliances, though, is in the operations capability that each firm
can bring to a particular alliance.
3. The profound consequences of strategic decisions
A strategic decision can profoundly alter, and have major conse-
quences for, the firm. Examples of such decisions might include: mas-
sive financial investment (for example, GM’s $80 billion investment in
technology in the 1980s); radical reconfigurations of entire business
structures (as happened with many US ‘giants’, including IBM, in the
1990s); and radical downsizing within the enterprise (again exempli-
fied in many US giants in the 1990s through to the present day). An
operations strategy concerned with supply may lead to a reshaping of
the organization, including outsourcing and insourcing operations,
and configuring an internal supply chain, thus profoundly altering its
nature.
4. Long-term horizons
Strategic decisions can have long-term implications for the firm and
hence the factor of time is an important one for strategists (Das, 1991;
Itami and Numagami, 1992). It is important to note that strategic
Strategic operations management 53

planning is not simply crystal-ball gazing into the far future; for strat-
egy to be effective, it also needs to have a sense of timing and urgency
in its implementation.
There are a number of areas of operations that are simultaneously
tactical and strategic in scope, and these are listed in Figure 2.4. The
problem with many firms is that the perceived tactical concerns are
seen to rest with production/operations staff, whereas the strategic
concerns do not.
What is operations strategy?
There is no one best way to formulate strategy and the debate on
whether strategy should be internal, resource-based or fully externally
market-driven may be seen as of intellectual interest only. In practice,
many organizations will combine both internal and external consider-
ations in the same way that they tend to innovate as a result of both
54 Strategic operations management
TACTICAL OperationsActivity
STRATEGIC
Day-to-dayscheduling; loading;task allocations
CAPACITY/ SCHEDULING
Future capacity –expansion ofexisting sites;location of newsites
Process quality,SPC charts,monitoring
QUALITYMANAGEMENT
TQM – impactingon costs, deliveryreliability
Change-over times,tooling,maintenance
PROCESSTECHNOLOGY
Investing to meetcustomerspecifications;process choice decisions
Buying materials INVENTORYMANAGEMENT
Strategicpurchasing;buy/makedecisions
Examples of the firm’s operations intactical and strategic areas
Figure 2.4
Tactical and strategic
concerns in
manufacturing
operations.
Strategic operations management 55
‘push technology’ (from internal developments) and ‘pull demand’
(from market requirements). These capabilities are not limited to
operations only but they must include operations capabilities, includ-
ing quality, innovation, flexibility of volume and variety requirements,
delivery speed and reliability. While excellent marketing skills need to
be in place within an organization, they are of little use if there are not
world-class operations management capabilities (internal and external)
also in place to support the marketing intentions of the organization.
Every firm must be aware of external issues, including macro-economic
factors, social and technological changes. The PEST model (Political,
Economic, Social and Technical elements) is a convenient – but hardly
exhaustive – approach to scanning external issues. However, the firm
must also pay great attention to internal capabilities and to link these
with opportunities and threats that may influence the firm. Brown et al.
(2001) offer a simple model of managing the process (Figure 2.5).
In some firms, operations personnel will be involved from stage 2
onwards. However, some firms involve operations from stage 4 and, for
others, stage 6 (design operations systems) is where production/oper-
ations come into the process – a role which is to react to plans and
strategies already in place. However, by that stage, the original corporate
aim could be ‘out of line’ with production/operations capability.
In the same way that there is no fixed way in the process of strategy,
it is also best to see the content of strategy as a dynamic rather than fixed
entity. However, we suggest that the content should include at least the
following:
■ process choice – the selection of the right approach to pro-
ducing goods or delivering service;
■ innovation – the adaptation or renewal of the organization’s
processes or outputs to ensure they adapt to changes in the
external environment;
■ supply chain management – the external management of rela-
tionships with suppliers to ensure the effective and efficient
supply of inputs;
■ control of resources – the internal management of inventories;
■ production control – the effective and efficient management
of processes;
■ work organization – the management and organization of the
workforce within the organization;
■ customer satisfaction – the management of quality.
If any of these imperatives are mismanaged the future of the organiza-
tion is placed in jeopardy. It is for this reason that each of these has a

chapter devoted to it and the key approaches to managing the impera-
tive are identified. Specifically, an operations strategy must include
at least the following:
■ amounts of capacity required by the organization to achieve
its aims;
■ the range and locations of facilities;
■ technology investment to support process and product
developments;
■ formation of strategic buyer–supplier relationships as part of
the organization’s ‘extended enterprise’;
■ the rate of new product or service introduction;
■ organizational structure – to reflect what the firm ‘does best’,
often entailing outsourcing of other activities.
56 Strategic operations management
Examining changes in the environment (e.g. PEST), theindustry (e.g. Porter’s five forces model) and searchingfor links with other firms, including suppliers. A constantscan on competitive movements and reactions to a firm'sstrategy is vitally important here.
External
audit
Assessing the organization’s internal strengths andweaknesses, and comparing them with externalopportunities and threats (a SWOT analysis).
Internal
audit
Aligning capabilities with opportunities so that theorganization does not compete in markets where it lackscapabilities, but looking beyond current limitations foropportunities.
Deciding in which markets the organization will andwon't compete (strategic focus). Putting operationscapabilities (technology, inventory, capacity, skills andproduct/process quality) in place.
Allocating resources and setting objectives so that thestrategy can be monitored, and successes and failuresfed back on an ongoing bases. Creating a sense ofurgency. Feedback on the progress of implementation isvital here.
Implementing
strategy
Generating
strategic
options
Selecting
strategic
options
Figure 2.5
A simplified process of strategy (from Brown et al., 2001).

Understanding manufacturing and operations strategy
Manufacturing strategy was the forerunner of the wider aspects of
operations strategy. Manufacturing strategy was established as a core
topic in operations management by the major contributions from US
academics, including Skinner (1969, 1978, 1985), along with Hayes
and Wheelwright (1984), as well as from the UK, particularly Terry
Hill (1995). Skinner (1969) had pointed out that not only was the manu-
facturing function being neglected as a strategic element of the planning
process, but also the linkage between manufacturing and strategic plan-
ning was elusive and ill-defined.
Over 35 years on since Skinner’s seminal contribution, it has been
estimated that over 250 conceptual and empirical papers on manu-
facturing strategy have been published in over 30 major journals
(Dangayach and Deshmukh, 2001). The discussion on the role and
purpose of manufacturing strategy has been broad and includes many
frameworks for identifying key manufacturing decisions. Although
there are no absolute agreements about the role of manufacturing
strategy – and it has even been questioned by one of the field’s leading
scholars, Kim Clark, if manufacturing strategy is passé (Clark, 1996) –
most writers agree that its potential role can be both central and piv-
otal. For manufacturing strategy to be useful, it needs to have consis-
tency among decisions that affect business-level strategy, competitive
priorities and manufacturing infrastructure (e.g. Skinner, 1969; Hayes
and Wheelwright, 1984; Hill, 2000). Much of the degree to which man-
ufacturing strategy will be effective relies on the internal consistency of
manufacturing strategy, manufacturing capabilities, marketing – man-
ufacturing congruence, and their effects on manufacturing perform-
ance (Bozarth and Edwards, 1997).
There is some confusion in terms of both where and when opera-
tions strategy might appear within the overall strategic planning
process of the firm. For example, it has been questioned whether
operations strategy has been replaced by specific approaches such as
just-in-time ( JIT; which we discuss in Chapter 5) and total quality
management (TQM; see Chapter 8). Mills et al. (1995, p. 17) summarize
the perceived confusion concerning operations strategy as applied to
manufacturing when they ask:
What is a manufacturing strategy nowadays – is it world-class, lean
production, JIT, cells or TQM? Is it none of them, some of them or all
of them?
Strategic operations management 57

However, Hayes and Pisano (1994, p. 77) assert that manufacturing
strategy is wider than this:
Simply improving manufacturing – by, for example, adopting JIT,TQM or
some other three-letter acronym – is not a strategy for using
manufacturing to achieve competitive advantage.
The same could equally be true of services. However, there has been
very little research into service strategy, so for a moment let us focus on
manufacturing strategy. This perceived confusion with manufacturing
strategy is discussed by Kim and Arnold (1996), who similarly conclude
that managers often find it hard to distinguish between approaches such
as JIT and other issues that might be included in manufacturing strategy.
Some clarity of the process and content of strategy is provided by Hayes
and Wheelwright (1984), who speak of four stages where manufacturing
strategy (as part of operations strategy) can appear in, and contribute to,
the firm’s planning process. This is illustrated in Figure 2.6. Although
the model relates, essentially, to the formulation of manufacturing strat-
egy, we suggest that the same model could be used for services and, in
any event, should be seen within the wider view of operations strategy.
Hayes and Wheelwright’s (1984, p. 30) contribution is also important
because it helps to explain what a manufacturing strategy should contain:
… manufacturing strategy consists of a sequence of decisions that, over
time, enables a business unit to achieve a desired manufacturing
structure, infrastructure and set of specific capabilities.
58 Strategic operations management
Stage 2: Externally neutral – the role here is for manufacturing to lookexternally and to ensure that it is able to achieve parity with competitors.
Stage 1: which they call internally neutral – the role here is to ensure that manufacturing will not disrupt the intention of the firm and manufacturing’s role is purely reactive to an already devised strategy.
Stage 4: Externally supportive – here manufacturing is central in determining the nature of business strategy and the involvement is much more proactive.
Stage 3: Internally supportive – here manufacturing exists to support business strategy. Manufacturing capabilities are audited and the impact of a proposed business strategy upon manufacturing is considered.
Figure 2.6
Hayes and
Wheelwright’s four
stages of strategy.

The scope of structural/infrastructure areas that can form part of
manufacturing strategy is wide-ranging and can include quality capabil-
ities (including quality requirements that a plant might demand from
its supplier base), manufacturing processes, investment requirements,
skills audits, capacity requirements, inventory management through-
out the supply chain and new product innovation. Manufacturing
strategy is concerned with combining responsibility for resource man-
agement (internal factors) as well as achieving business (external)
requirements (Swamidass and Newell, 1987):
Manufacturing strategy is viewed as the effective use of manufacturing
strengths as a competitive weapon for the achievement of business and
corporate goals.
Although applied to manufacturing, the above analysis is equally
relevant to services. Hence we can refer to an ‘operations strategy’
applicable to any business organization.
Why operations strategy is important
One of the key tasks for operations managers in developing strategy is
that these managers are aware of competitive factors and as a result are
able to put in place capabilities to deal with such competitive require-
ments. The link between these requirements and operations capab-
ilities is shown in Table 2.1.
All capabilities depend, to a very large extent, on managing produc-
tion/operations in a strategic manner. Forming an operations strategy
that links into, and forms part of, the overall business strategy can also
be a vital factor in uniting the organization. In spite of all of the chaos
and turbulence in markets, a clear strategy can play an important part
in the firm’s success, as Hayes and Pisano (1994, p. 77) state:
In today’s turbulent competitive environment, a company more than
ever needs a strategy that specifies the kind of competitive advantage
that it is seeking in the market-place and articulates how that advantage
is to be achieved.
The need for business and manufacturing strategies to be linked is
as crucial today as in Skinner’s day. Strategy matters because without
Strategic operations management 59

it firms’ short-term decisions will conflict with their long-term goals
(St John and Young, 1992). A firm must be poised and ready to meet
future market opportunities, as illustrated in Table 2.1 (Brown, 1996).
If not, strategic successes are as likely to be due to chance as to plan,
and thus cannot be reliably sustained or repeated. Manufacturing plays
an important role in the overall performance of the business unit, as
measured by market share, growth and profits (e.g. Ramanujam and
Venkatraman, 1987). Manufacturing capabilities – if properly utilized –
can provide a ‘competitive weapon’ in the firm’s strategic planning
(Skinner, 1969). Manufacturing strategy contributes substantially to
business strategy as well as operations management (Meredith and
Vineyard, 1993), because the process, content and implementation of
manufacturing strategy are the means by which manufacturing resources
are deployed to complement the business strategy. Thus, manufactur-
ing strategy influences areas as diverse as:
■ selecting new process technologies (Honeycutt et al., 1993;
Beach et al., 2000);
■ developing new products (Spring and Dalrymple, 2000); and
■ managing human resources (Youndt et al., 1996).
Manufacturing strategy should be aligned to the business unit’s com-
petitive environment through business-level strategy (Ward and Duray,
1995), which requires linking business and manufacturing strategies.
60 Strategic operations management
Table 2.1The link between operations and competitive factors
Competitive factors Operations task
Offer consistently low defect rates Process quality
Offer dependable delivery Delivery reliability
Provide high-performance products or amenities Product quality
Offer fast deliveries Delivery speed
Customize products and services to customer needs Flexibility
Profit in price competitive markets Low-cost production
Introduce new products quickly Rapid innovation
Offer a broad product line Flexibility
Make rapid volume changes Flexibility
Make rapid product mix changes Customization, flexibility
Make product easily available Delivery speed/reliability (distribution)
Make rapid changes in design Flexibility
Adapted from Brown (1996).

Thus, the firm’s external competitive environment affects the struc-
ture and infrastructure of operations and performance (Pagell and
Krause, 1999). Manufacturing strategy should therefore be involved in
strategy formulation and implementation at the business unit level.
A report published by the American Production and Inventory
Control Society (APICS) (Industry Week, 7 December 1998, p. 35) cor-
roborates this need to link the two levels of strategy:
The first and largest implication delivered by the IW census is that there
is a fundamental disagreement between the strategic level and execution
of the business.This issue may have far-reaching effects for a company. …
Another large issue, that of management capability, also should be
evaluated in the strategic deployment process. Senior managers should be
assessing whether plant managers have the ability to absorb the strategic
direction of the business and turn the vision into operating reality. …
Manufacturing executives need to look at themselves in the deployment
process as well. They must question whether their expectations have
been communicated effectively to plant managers. Conversely, they also
need to evaluate whether the degree of support they provide in terms of
involvement could alter their perception of operational execution.
Manufacturing strategy must match manufacturing capabilities with
market requirements in three key areas (Brown and Blackmon, 2004):
1 Manufacturing strategy must support the goals of the strategic
business unit (SBU) through being aligned with business-level
competitive strategy (e.g. Skinner, 1969; Hayes and Wheelwright,
1984).
2 Manufacturing strategy must align with other functional-level
strategies, particularly the marketing and human resources
strategies of the SBU (e.g. Berry et al., 1995; Deane et al., 1991;
Menda and Dilts, 1997).
3 Manufacturing strategy must lead to internal consistency
within the manufacturing function (e.g. Hill, 1980, 1995).
Why many firms struggle with forming operations strategies
Companies are full of highly intelligent people, but often they struggle
with the notion of operations strategy. We suggest the key for this
is linked to the changes to operations management over time that we
Strategic operations management 61

discussed in Chapter 1. Here we provide some insights into how the
changes have had important impact on the formulation of operations
strategy.
Looking back …
The transition from craft, through mass production, to the current
era, provides insight into the changing role of operations personnel
within firms and at least three major factors emerge. First, we can say
that operations personnel were often absent from the most senior
levels of the firm as enterprises became larger and more functionally
organized (Lazonick, 1990; Lazonick and West, 1995; Chandler, 1992).
While there has been increasing importance placed on operations per-
sonnel in terms of their contribution to the firm’s capabilities (see, for
example, Womack et al., 1990; Kenney and Florida, 1993), this has not
necessarily included involvement in terms of their seniority within the
hierarchy of the firm, which is a telling indication of the operations
management role in many Western plants.
Second, the role of operations managers often became that of a
technical specialism rather than an involvement in the business of the
firm. Often, manufacturing’s contribution, in terms of its capability, is
ignored until after strategic plans have been already formulated by an elite
planning group, whose understanding of the specifics of manufactur-
ing or service delivery may be very limited (Hayes and Wheelwright,
1984). The relegation of manufacturing to a mere function, unrelated
to the strategy process, is discussed by Lazonick (1990, 1991) and Prais
(1981) in comparisons made between the UK and USA on the one
hand and Japan and Germany on the other.
Third, strategy formulation and planning became the prerogative of
senior managers and operations personnel were, typically, excluded
from the process, because of their position within the firm, so that
operations strategies, where they did exist, were merely the means by
which an already existing business strategy became translated into
plant operations. The need for a better, more integrated approach,
involving all levels of the firm, was made by The Economist (24 June
1995):
The trouble with many multinationals is that they are legacies of a very
different era. Many grew up in the heyday of command-and-control
management, when strategy was made by a tiny elite at the top, work
was broken down into its simplest component parts and workers
62 Strategic operations management
were monitored by layer upon layer of managers. But today fashion is
so fickle and markets so quicksilver that decisions are best taken by
front-line workers rather than by lethargic middle managers.
The present-day problem
Many strategic decisions in firms are made by those who might know
very little about manufacturing and service delivery, and whose
approach to strategy is often dictated by purely financial and short-
term applications. Thus, even a decision which might have long-term
implications – investment in process technology or a cut in the training
budget, for example – is sometimes made as a quick-fix, cost-cutting
device rather than as a means to enhance capability in a number of
competitive areas, other than low-cost production. In consequence,
firms will often place too much of an emphasis on the wrong things.
For example, ‘productivity’ and ‘return on equity, or capital, employed
(ROCE)’ ratios – often touted by corporate officials within the firm –
can be easily distorted to appear better than they really are, and it is
vital to ‘get behind the numbers’ and calculations to know what the fig-
ures actually mean. For example, the productivity ratio is derived by
dividing the firm’s outputs/inputs. In Britain, whole areas of the manu-
facturing base declined between 1980 and 2000 but, during this
period, Britain’s productivity ratio was second only to Japan’s – but for
entirely different reasons. In Britain, inputs went down (sometimes in
terms of whole industries) and the cost of this approach is best sum-
marized by Hamel and Prahalad (1994, p. 9):
Between 1969 and 1991, Britain’s manufacturing output … went up by
a scant 10% in real terms.Yet over this same period, the number of
people employed in British manufacturing … declined by 37%. …
During the early and mid 1980s … UK manufacturing productivity
increased faster than any other major industrialized country except
Japan … British companies were, in fact, surrendering global market
share.
And the same sort of ‘improvement’ through productivity was also
apparent in the USA, where, as Dertouzos et al. (1989, p. 31) wrote:
There is a dark side to these developments, however. A significant
fraction of the productivity gains in manufacturing were achieved by
shutting down inefficient plants and by permanently laying off workers
Strategic operations management 63

at others. Employment in US manufacturing industry declined by
10 per cent between 1979 and 1986, and that loss of jobs accounted for
about 36 per cent of the recorded improvements in labor productivity.
Similarly, the return on capital employed ratio (ROCE) by itself says
very little. Of course, it is important to know how the firm’s money is
being used and to assess if it could be better used elsewhere (which is
one of the reasons behind the ROCE ratio), but if a firm wants to
appear to have sound ROCE it can achieve this quite easily – simply by
not investing in the plant over a period of time. Of course, the plant
will then be unable to compete against the world’s best but, in terms of
ROCE, the firm will look good. There have to be better ways of deter-
mining success for the firm, and one of the best ways for doing so lies
in the role and contribution of operations strategy.
How operations strategy can contribute to the firm’s overall strategy
Operations strategy can be vitally important to achieving business goals
and gaining competitive advantage in at least two ways. First, it can be cen-
tral to the implementation of an already devised business strategy, which, as
we have already noted, operations personnel may or may not have helped
to formulate. In this approach, operations’ role is important in providing
‘strategic fit’ in focusing efforts and resources so that operations strategy
is consistent with, and helps to support, the already devised business
strategy (Hayes and Wheelwright, 1984; Miller and Roth, 1994).
Second, operations strategy can be used in a more proactive
approach. Here, operational capabilities would be viewed as part of the
core capabilities/competencies (Hamel and Prahalad, 1994), which can
be exploited and used to create new opportunities and to target new
areas. In this approach, operations’ contribution would be central to the
planning stages of business strategy and is not restricted to the imple-
mentation of an already devised strategy. This resource, competence-
based approach to strategy has become an important feature in the
literature on strategy (e.g. Hamel and Prahalad, 1989, 1990; Stalk et al.,
1992; Collis and Montgomery, 1995). This approach equates with stage
4 of Hayes and Wheelwright’s (1984) model discussed earlier, whereby
operations’ role is central in creating strategies to gain competitive
advantage. This approach places profound importance on the link
between operational and business strategies in terms of consistency,
64 Strategic operations management
and ongoing pursuit of the firm’s objectives as indicated by Corsten
and Will (1994, p. 111):
Production is the key area for forming competitive advantage for a
company. Therefore the aim of strategic production management is to
provide competitive advantage by creating an optimal co-ordination
between competitive strategy and production strategy.
More recently, the potential that such operations strategies can offer
to mainstream strategy, particularly resource-based approaches, has
emerged as an important contribution. For example, Corbett and Van
Wassenhove (1994) and Gagnon (1999) view operations strategy as hav-
ing a key role in the competence-based approaches to strategy and one
that can nullify any notions of competitive trade-offs in strategy formula-
tion. This is endorsed by Beach et al. (2000) and D’Souza and Williams
(2000) in their respective discussions on the role of strategy in enhanc-
ing capabilities in flexibility. Similar claims for the importance of opera-
tions strategy have been made in relation to mass customization (Spring
and Dalrymple, 2000). A key element of accruing capabilities in flexibil-
ity comes from the utilization of process technology where, again, the
role of operations strategy can be pivotal (Kathuria and Partovi, 2000).
An important contribution on operations strategy came from Hill
(1995, 2000). In this he talks about the need to have a fluid process
that links corporate, marketing and operations strategies into a unified
process, as illustrated in Figure 2.7.
As can be seen, the links between corporate, marketing and oper-
ations strategies are made very clear, and the need for dialogue between
them is vital. There is no doubt that this model provides excellent
insight into the process of strategy. However, as important as this
model is, its focus is based on strategy within the firm. It is also import-
ant that the firm looks outside itself and sees how it lines up within
what are, increasingly, complex networks. We will develop the process
when we look at strategic resonance later in the chapter. For now, a
note on order-winning and order-qualifying criteria is pertinent here.
Order-winning and order-qualifying criteria
A powerful means of linking operations capability with market require-
ments is presented by Hill (1995, 2000), where he discusses the need to
understand order-winning and order-qualifying criteria. Order win-
ners are those factors that win orders in the market-place over other
Strategic operations management 65

competitors; order-qualifying criteria are those factors that the firm needs
to be able to achieve in order to compete at all in the market-place.
Without these capabilities the firm will lose orders – in fact, order qual-
ifiers may become order losers for the firm. Order-qualifying criteria
must not therefore be viewed as less important than order-winning cri-
teria because failure to achieve these will cause the firm to decline. In
the PC industry, an order qualifier must include up-to-date technology –
without this the firm cannot hope to compete and will decline. Who
in 2004 would boast of making Pentium 1 PCs at very low prices, for
example? However, a range of order-winning criteria come into play:
low cost is an obvious one, but delivery requirements are important too;
in addition, the ability to configure to customer requirements (due to
mass customization) is also important. Likewise, when John Martin
transformed Taco Bell into a fast-food giant, he discovered that offer-
ing Mexican food was only an order-qualifying factor. Customers’
order-winning criteria were found to be what was termed FACT (Fast,
Accurate, Clean, Timely).
This approach – distinguishing between order-qualifying and order-
winning criteria – provides a useful insight, but it is important to note
the following caveats. First, order-qualifying and order-winning criteria
66 Strategic operations management
Product/
service
Markets and segments
Range
Mix
Volumes
Standardization
versus customization
Level of innovation
Leader versus follower
alternatives
Choice of various
processes
Trade-offs
embodied in the
process choice
Process positioning
Capacity:
– size
– timing
– location
Role of inventory in
the process
configuration
Function support
Operations
planning and
control systems
Quality assurance
and control
Systems
engineering
Clerical procedures
Payment systems
Work structuring
Organizational
structure
Price
Quality conformance
Delivery:
– speed
– reliability
Demand increases
Colour range
Product/service
range
Design leadership
Technical support
Brand awareness
New products and
services – time to
market
1
Corporateobjectives
2
Marketingstrategy
3
How do youqualify and win
orders in themarket-place?
Operations strategy
4
Processchoice
5
Infra-structure
Growth
survival
Profit
Return on
investment
Other
financial
measures
Figure 2.7
The Hill framework (from Hill, 2000).

may change over time; once a firm has undertaken an audit of these
criteria it must be prepared to adapt as the criteria themselves change.
In other words, the assessment of order-winning/qualifying criteria
has to be an ongoing, dynamic process.
Second, the link between order-winning/qualifying criteria and
process choice that Terry Hill makes has been questioned (and we
highlight the problem with this in Chapter 3). The concern is that
the firm may make similar products under one choice of process, but
these might be targeted at more than one market segment and there
may be conflicting and differing requirements in these segments for
the same product made under the one type of process.
Third, consumers will not necessarily distinguish between order-
qualifying and order-winning criteria and may, instead, look at the
overall value or package being offered. For example, in buying a per-
sonal computer, the customer may have rough guides or indications of
price and basic specifications, but will adjust both of these as the over-
all package offering becomes clearer.
Fourth, the organization must be prepared and able to improve all
areas of operations management simultaneously. Again, this is very
noticeable in the PC market, where up-to-date technology, rapid
innovation of new products, high quality levels and low cost have to
be achieved simultaneously.
Service operations – the service profit chain
One reason why strategic operations may be so important derives from
a long-term research programme into successful businesses by a group
of Harvard academics. In 1997, Heskett, Sasser and Schlesinger pub-
lished their book on the ‘service profit chain’, which ‘simply stated …
maintains that there are direct and strong relationships between
profit, growth, customer loyalty, customer satisfaction, the value of
goods and services delivered to customers, and employee capability,
satisfaction loyalty and productivity’. Their model is illustrated in
Figure 2.8. Although their work has focused on service firms, they
themselves state they believe this may apply to goods as well as services.
Fundamental to the service profit chain is the idea that in order to
achieve profits and growth for the firm, an operations strategy must be
in place. In their terms, this strategy identifies where the most effort
will be placed, how quality and cost will be controlled, and how per-
formance will be measured against the competition. Derived from this
is developed a so-called ‘service delivery system’, which is the specific
Strategic operations management 67

combination of facilities, layout, equipment, procedures, technology
and employees needed to achieve this strategy. Heskett et al. argue that
the highly successful firms they have studied, such as Southwest
Airlines and Wal-Mart, have achieved their success through the devel-
opment and implementation of an operations strategy.
A key element of their research findings is evidence to suggest three
strong links in successful firms. First, there is a link between employee
satisfaction and capability. Put simply, happy employees are more pro-
ductive and consistently deliver better quality. For instance, in Taco
Bell, the Mexican-style restaurant chain, it was found that the outlets
with the highest rates of staff retention (a major indicator of employee
satisfaction) consistently outperformed those with high staff turnover.
These differences were great – on average, high staff retention outlets
had double the sales and 55 per cent higher profits than the worst
ones. Similar links have also been reported in the financial services sec-
tor (Zornitsky, 1995). Not only did employee satisfaction lead to better
firm performance, related to this is a clear link between employee and
customer satisfaction. Heskett et al. have found this in Chick-Fil-A,
Bank of Ireland, MCI, Swedbank and AT&T Travel. Indeed, this view
has been adopted as a fundamental business philosophy in some firms.
For instance, J.W. Marriott Sr is often quoted as saying ‘It takes happy
employees to make happy customers’. The third strong link is perhaps
not surprising – it is between customer satisfaction and growth/profits.
Heskett et al. report that Banc One found that, in all its operating divi-
sions, there was a direct relationship between profitability and loyal
customers, whilst Waste Management reported 65 per cent more prof-
itability in divisions with the highest levels of customer satisfaction.
The service profit chain concept therefore makes a strong argument
in support of strategic operations management. It also suggests that
how a firm measures its strategic performance may need to be con-
sidered. Heskett et al. are enthusiastic advocates of the balanced
scorecard approach.
68 Strategic operations management
Employees:
– quality
– productivity
– capability
– satisfaction
– loyalty
Service
value
Customers:
– satisfaction
– loyalty
Company:
– revenue growth
– profits
Figure 2.8
The service profit
chain (adapted from
Heskett et al., 1997).

Strategic resonance
Although much of the literature in both operations management and
mainstream strategy has been useful, there are specific problems, which
include the following:
■ operations literature (and sometimes practice) sees the need
to ‘make the case’ for strategy, but there is not a great deal of
crossover to strategy mainstream;
■ mainstream strategy will use terms like core competences, key
success factors and so on without necessarily linking these
with operations management;
■ there is often a conflict between resource-based and market-led
views of strategy.
As important as operations capabilities are, it is important that we do
not excel in the wrong things! Verdin and Williamson (1994, p. 10)
warn about this when they state:
Basing strategy on existing resources, looking inwards, risks building a
company that achieves excellence in providing products and services
that nobody wants … market-based strategy, with stretching visions and
missions, can reinforce and complement competence or capability-
based competition. And that successful strategy comes from matching
competencies to the market.
A solution to the conundrum comes with the notion of strategic reson-
ance. Brown (2000, p. 6) has previously defined strategic resonance as:
… an ongoing, dynamic, strategic process whereby customer
requirements and organizational capabilities are in harmony and resonate.
Strategic resonance is more than strategic fit – a term which has often
been used (rightly in the past) to describe the ‘fit’ between the firm’s
capabilities and the market that it serves. Strategic resonance goes beyond
that. Strategic fit may be likened to a jigsaw where all parts fit together.
This is a useful view but it can have … a very static feel to it. In strategic
fit it is as if once the ‘bits’ are in place, the strategic planning is done.
By contrast, strategic resonance is a dynamic, organic process, which is
about ensuring continuous linkages and harmonization between:
■ the market and the firm’s operations capabilities;
Strategic operations management 69

■ the firm’s strategy and its operations capabilities;
■ all functions and all levels within the firm.
Firms need to find and exploit their strategic resonance: between
markets and the firm; within the firm itself; and between senior-level
strategists and plant-level operations capabilities.
The concept of strategic resonance is illustrated in Figure 2.9.
In essence, strategic resonance is concerned with managing two sets
of capabilities that need to be in place simultaneously. These are:
1 within the firm’s functions, so that there is cohesion and stra-
tegic alignment within them;
2 between the firm’s capabilities and the market segments in
which the firm wishes to compete.
Strategic resonance is also about ensuring that the firm will develop
and protect those capabilities that can be used to exploit market
opportunities. As we have indicated, such capabilities do not come
about by chance.
A model of how strategic resonance ties in with resource-based and
market-led views of strategy is illustrated in Figure 2.10.
The appreciation of the strategic resonance concept, and the recog-
nition of it as a real issue that should concern firms, is important because
the current competitive environment is increasingly characterized by
rapid technological changes in new and existing products, brought
about, in part at least, by enhanced levels of competition.
Strategic resonance could be seen perhaps as an element within the
broader concept defined by Teece et al. (1997) of dynamic capability.
70 Strategic operations management
The essence of strategic resonance is
that ongoing linkages are made between:
• Strategic decisions and operations
capabilities
• The firm’s strategy and market
requirements
This ensures that there is no conflict
between market-driven and resource-
based strategies. Instead, they operate
simultaneously and resonate. This
prevents the firm being excellent in the
wrong things; it also prevents the firm
chasing after business and markets in
which it cannot hope to compete. The
strategy process is ongoing and changing,
adapting to ensure that customer
requirements and organizational-wide
capabilities continue to resonate.
Marketrequirements
Strategicdecisionmaking
Plant capabilitiesFigure 2.9
Strategic resonance
(adapted from
Brown, 2000, p. 6).

However, the contribution of strategic resonance lies in understanding
the current problems within the domain of strategic-level processes
that need to be rectified so that capabilities can be developed over time
and employed as needed in order to create, or respond to, market
opportunities.
Strategic resonance addresses both the process and content of strat-
egy in three ways:
1 It is a dynamic process whereby senior-level strategists com-
municate with operations personnel so that there is awareness
about the capabilities (and incapabilities!) that reside within
the firm’s operations.
Strategic operations management 71
– –
–
– Senior executives ANDmanufacturingexecutives involved
– Resource-driven ANDmarket-led
CompetitiveEnvironment– Stable– Predictable
Competitivestrategy Market andcompetitiveanalysis
ManufacturingStrategy
– Based onmarket reqts.
Performance
Market-led approach
Strategic resonanceapproach
CompetitiveEnvironment
– Dynamic– Unpredictable
CompetitiveStrategy– Resources/
capabilities
ManufacturingStrategy
– Based on corecompetences
Performance
Resource-driven approach
– Senior executivesdevise strategy basedon market andcompetitive analysis
– Senior executivesdevise strategy basedon core competencesand competitiveadvantage
Dynamic flexibility
Strategic resonance
Strategic fit
Strategic flexibility
–
PerformanceCompetitiveStrategy
CompetitiveEnvironment
DynamicUnpredictable
ManufacturingStrategy
Mfg.capabilities
Figure 2.10
Strategic resonance versus resource-based and market-led strategies
(adapted from Brown and Blackmon, 2004).

2 It is a dynamic process that ensures resonance between the
firm and its existing customers.
3 It is a dynamic process that utilizes capabilities to search for
new market segments.
Creating and sustaining strategic resonance
Michael Dell is an example of a Chief Executive Officer who has a pro-
found knowledge of operations and may also be seen, simultaneously,
as a Chief Operating Officer. There aren’t too many cases where the
CEO really does understand operations (Brown, 2000). Dell under-
stands market requirements and how to utilize operations capabilities
to meet these needs. Speed of response is now a critically important
feature of the PC industry. Dell is more focused than any of its com-
petitors on speedily manufacturing and delivering inexpensive, top-
quality PCs. An example of Dell’s remarkable operations capabilities
was at the end of 1997 when Dell shipped 2000 PCs and 4000 servers
loaded with proprietary and multimedia software to 2000 Wal-Mart
stores in 6 weeks – just in time for the Christmas season (Industry Week,
16 November 1998). Clearly, Dell does not see any conflict between
market demands and operations capabilities and, indeed, Dell measures
success not only in financial terms but also in strategic operations per-
formance (Fortune, 11 May 1998):
He now wants to measure parts inventory in hours instead of days.
‘7 days doesn’t sound like much inventory, but 168 hours does. … In a
business where inventory depreciates by 1 per cent per week,
inventory is risk. A few years ago no one in this business realized what
an incredible opportunity managing inventory was.’
On the global front, however, other results of Dell’s policy – in its
after-sales customer service – reveal that even best practitioners can
misjudge the challenges and underestimate the complexities. In 2003,
in a case that became a public embarrassment for the company, a blind
customer obtained damages from Dell after the customer had called a
helpline to ask for a service call to be made to fix a Dell computer. The
company had placed its help desks in India, benefiting from the low
costs (see Chapter 6 for further insights into this). The accompanying
strategy to this globalization has been to create customer-replaceable
units (CRUs) for components such as modems, which require the cus-
tomer to dismantle parts of the computer, instructed over the phone
72 Strategic operations management

by the help-desk person. This customer could not make the customer
service engineer understand that they were blind, with the result that
the useless instructions were simply repeated, as if by an automaton,
until the customer hung up.
Becoming strategic, focused and holistic
As well as creating and sustaining strategic resonance, a firm has to
ensure that it is strategic, focused and holistic in approach. Each of
these three factors needs further explanation.
1. Strategic: first, strategy decisions really do need
to be strategic
In recent times many firms seem to see cost-cutting and strategy as syn-
onymous. For sure, downsizing and cost-cutting may well be necessary,
particularly where management ranks are bloated and where strategy
implementation becomes painfully protracted and damaging for the
firm and its customers. But cost-cutting by itself will not be a sustainable
strategy, and the full scope and possibilities of strategy must go beyond
this. As we have indicated earlier in the chapter, there are at least four
characteristics that tend to distinguish strategic from tactical decisions:
■ The strategy must include, but not be limited to, senior-level
management and it is these senior-level personnel who will,
ultimately, have the ‘final say’ on the nature of the strategic
direction for the organization.
■ Strategy should create competitive advantage, or at the very
least, enable the organization to survive within its chosen
markets.
■ Strategic decisions can have profound consequences in terms
of resources and directions or options that the organization
may have.
■ Strategy has long-term horizons and cannot be limited to
mere short-term financial results.
However, as we have commented on – there is often an inherent ten-
sion in the strategy process – those who make strategic (long-term)
decisions are assessed by short-term criteria. In addition, the average
life of a CEO in Europe and the USA is short, typically less than 3 years –
hardly strategic!
Strategic operations management 73

2. Focused: the need to focus, Focus, FOCUS!!
Focus is essentially about deciding which businesses and markets the firm
wants to be in and then ensuring that strategic resonance occurs between
this intention and operations capabilities. In a sense, all firms have to
focus to some degree because they do not have limitless resources and
cannot therefore provide a limitless range or any volume of products or
services in every market around the world. However, focus is much more
specific than this and can have profound importance for the firm. In
essence, focus is concerned with what the organization will not do as
much as it is deciding what it will and this intention can become part of
its core mission. For example, in 1991, Hewlett Packard intended to enter
the PC market with great intensity and it succeeded in doing so, reaching
a position in the top four PC manufacturers in the USA by 1997. Focus
played a key part in Hewlett Packard’s phenomenal rise in the PC market.
Hewlett Packard decided that it would move away from being a manu-
facturer to being an assembler of products. This shift in focus places even
greater emphasis on the need for excellent supplier relations through-
out the supply chain, especially with those suppliers on whom Hewlett
Packard greatly depends. However, since 2001 HP has decided not to
assemble but to focus instead on service elements of the total provision
to customers. This means that a range of capabilities have been lost –
HP’s assembly plants were well known for their expertise in assembly.
The organization can focus in a number of ways, including:
■ Focusing on particular customer groups/market segments
which it serves.
■ Deliberately avoiding other market segments.
■ Ensuring that strategic resonance occurs between customer
requirements and plant capabilities and resources. Focusing
the plant into a number of specified areas by customer, product
or process is important to ensure that strategic resonance takes
place between customer requirement and plant capabilities.
■ Divesting non-core areas of the business, which in turn will
impact on operations management. One of the easiest – and
most dangerous – means of becoming unfocused is in acquir-
ing other businesses.
■ Concentrating on specific activities within the supply chain
and forming strategic buyer–supplier relationships with other
players in the supply network.
Focus also ties in with agility – by virtue of being freed up from areas
in which it does not excel or have capability, the organization may
74 Strategic operations management
concentrate on its core competencies and become agile by knitting
these together with other operations required to satisfy simultaneous
requirements of flexibility, delivery and cost. Very often, focus means
concentrating on specific aspects of the supply chain to see where the
organization really adds value and to subcontract whole areas in the
supply process.
3. Holistic: the firm must become holistic in its
vision and understanding of strategy
In a business sense, holistic means ‘seeing the whole’ in terms of where
the business is positioned. Holistic includes – but is not limited to –
integration of functions within the firm. Undoubtedly, the need to
integrate various functions so that the firm moves in a unified fashion
is vital if strategic plans are to be achieved. However, being holistic is
wider than ensuring integration. Being holistic means that a firm is
able to grasp the complete picture in its strategic vision. This includes
understanding:
■ the composition and changes within entire markets;
■ complete configurations of supply networks and how the firm
will feature in the configuration;
■ the fit that a particular alliance will have with the firm;
■ the impact of growth or divestment, including downsizing of
staff.
Being holistic in approach means that strategic resonance is more
likely to be achieved simply because a firm will not make a decision
in isolation that might cause strategic dissonance to occur but will,
instead, go in a particular strategic direction only once it has under-
taken an holistic audit of strategy.
Strategic, focused and holistic in practice
Being strategic, focused and holistic is a powerful approach. It enables
the firm to position itself in a truly strategic position rather than
embarking on a knee-jerk, cost-cutting frenzy. In addition, it will
ensure that the firm will not suffer from internal myopia, being pulled
into different directions by the power of its internal functions. It will
also prevent the firm from being pulled into different directions
because, instead, it will be focused on businesses and markets and not
Strategic operations management 75

functions and marketing! Being strategic, focused and holistic in
approach will enable the firm to understand the likely repercussion
that a particular strategic plan will have on the firm’s numerous stake-
holders in the business. Although the three factors – strategic, focused
and holistic – are separate to some degree, the degree to which a strat-
egy will succeed will depend to a large extent on how these factors
themselves resonate. Consequently, the three entities should overlap
to a large degree, as shown in Figure 2.11.
The problem for many firms is that strategic dissonance takes place
between the firm and its customers. At the core of this is imbalance
due to decisions being taken which are neither really strategic, nor
focused, nor holistic. Compaq’s involvement in NT workstations, the
high-powered computers, is a case in point. In 1998, Compaq’s market
share declined from 22 to 14 per cent and part of the problem was that
the supposed benefit from the purchase of Digital simply did not materi-
alize (Business Week, 3 May 1999):
Compaq thought Digital would help, but they found Digital didn’t have
a lot of expertise there, either. It used to, but lost it through years of
downsizing.
Compaq’s acquisition of Digital caused it to be become unfocused to
some degree. Indeed, Compaq’s overall acquisition strategy caused a
76 Strategic operations management
Strategic
Holistic
Strategic
Focused
Holistic
Focused
Strategic decisions arenow taken within aframework that understandsthe impact that may be hadon competitors, customers,the supply network andother stakeholders
The market
Figure 2.11
The strategic,
focused and holistic
approach.

number of problems and was one of a number of reasons why its
merger with Hewlett Packard took place in 2002.
Competitive profiling in operations strategy
Part of the external audit that an organization undertakes is in bench-
marking against ‘best practice’ of competitors in the same industry or
by looking outside the industry to see if learning can be gained from
other industries. For example, large computer firms will not always
benchmark against each other in areas of services. Instead, they will
often look to ‘best service’ companies as good criteria for service per-
formance. For example, the NHS in the UK has used benchmarking
with transport companies, including airlines. Of course, on the surface
they are in entirely different businesses, but they do share a key process
in common: moving people within the service.
However, it is important not only to benchmark against other organiza-
tions, but also to question if a particular capability that the organization
might have provides any competitive advantage or value. In other words,
the organization needs to avoid being good at the wrong things. For
example, an organization may become obsessed with its own technology –
the problem of technophilia (Bessant, 1993) – and forget that other key
factors such as delivery speed and cost are paramount for its customers.
The benchmarking process is illustrated in Figure 2.12.
Strategic operations management 77
D
E
G
R
E
E
Of
A
D
V
A
N
T
A
G
E
Majoradvantage
Neutral
Majordisadvantage
Poor Same as competitor Superior
Capability comparison against competitors
Figure 2.12
Using benchmarking
of operations
capabilities to
determine
competitive
advantage.

When undertaking benchmarking as part of the company’s
strategic formulation, there are two key questions that need to be
addressed:
1 Are the organization’s capabilities superior to competitors?
2 Do the weaker areas cause major disadvantages?
This analysis is important because, without it, any firm can excel in
the wrong things! An alternative approach from the service literature
(Johnston and Clark, 2001) is to profile process based around the
extent to which they are ‘commodity’ or ‘capability’ driven. ‘Commodity
processes’ are essentially those that lead to high volume but limited
variety outputs, whereas ‘capability processes’ lead to relatively low vol-
ume but a high variety of outputs. These two types of process have
characteristics against which a specific process may be profiled, as in
Figure 2.13.
78 Strategic operations management
Capability Commodityprocesses processes
High process variety Low process variety
Low volume of customertransactions
High volume of customertransactions
Focus on flexibility Focus on standardization
Transactions are lengthyand unpredictable
Transactions are shortand predictable
Process flows are fluid Process flows are rigid
Process capability is mainlybased on individuals’ skillsand knowledge
Process capability is basedon process design andresource deployment
Flexible systems of controlset of tasks
Systems dedicated to narrow
Customer is integral todelivery of service
Customer is mainly anorder giver
Budget hotel
Resort hotelFigure 2.13
Profiling within
service operations.
Operations as a ‘core competence’ and ‘distinctive capability’
Some organizations view the abilities of their operations as a ‘core
competence’ (Hamel and Prahalad, 1990, 1994) and a ‘distinctive
capability’ (Kay, 1993). These two terms are quite similar because both
emphasize the need to focus on, and build upon, those capabilities
that the organization has which might provide competitive advantage.
The firms need to have a bundle of skills in place that will enable them
to create leverage or, at least, to be able to compete at all, against com-
petitors. Such skills can have an important input in planning strategy.
The role of internal resource-based strategies was developed in the
1990s (Hayes and Pisano, 1994; Hamel and Prahalad, 1994; Stalk et al.,
1992) and there has been considerable debate on the possible conflict
between internal, resource-based strategies versus external, market-
driven strategies.
Hamel and Prahalad (1994) define core competence as:
… a bundle of skills and technologies rather than a single discrete skill
or technology. As an example, Motorola’s competence in fast cycle time
production … rests on a broad range of underlying skills [p. 202] …
and a core competence is also a tapestry, woven from the threads of
distinct skills and technologies. [p. 214]
Hamel and Prahalad’s key points about the nature of core com-
petencies are vital for any discussion on operations strategy. First,
core competencies can provide a competitive advantage based around
operations capability (Hamel and Prahalad, 1990, p. 80):
… a core competence should be difficult for competitors to imitate.
And it will be difficult if it is a complex harmonization of individual
technologies and production skills.
Second, the cultivation of these skills is a major challenge for, and
increasingly a requirement of, CEOs, who will (Hamel and Prahalad,
1990, p. 91):
… be judged on their ability to identify, cultivate, and exploit core
competencies.
Strategic operations management 79

If such CEOs know and appreciate little of operations capabilities,
then clearly there will be problems.
Third, core competencies have to be part of the organizational
learning of the firm and, again, this impacts on operations (Hamel and
Prahalad, 1990, p. 90):
Core competencies are the collective learning in the organization,
especially how to co-ordinate diverse production skills and integrate
multiple streams of technologies.
Fourth, core competencies in operations capability enable the firm
to be agile, able to exploit these capabilities in a number of different
industry applications.
Exploiting internal capabilities does not mean that strategy is there-
fore fixed and rigid. Indeed, Hayes and Pisano (1994) talk of the need
for strategic flexibility. Similarly, Corsten and Will (1994) warn against
inflexibility brought about by a fixed adherence to a particular strategy
and Beach et al. (1995) suggest that the ability of organizations to adapt
to their changing environment is a corporate requirement. Such ideas
are echoed by Gerwin (1993) and Gupta (1993).
The current era and its impact on the need for flexibility and agility
The need for some agility in operations was first highlighted by
Skinner (cited in Wallace, 1989):
On Monday, they want low cost. On Tuesday, they want high quality.
On Wednesday, they want no backorders. On Thursday, they want low
inventories. On Friday, they want maximum overhead absorption, so we
have to work the weekend.
We mentioned earlier how the current era in manufacturing and
service demands that both high volume and high variety must be
achieved. The problem for the modern operations manager, therefore,
is that the requirements of cost, quality, no backorders or service queues,
low inventories and so on, provided in the above quote by Skinner, are
all needed simultaneously. This is good for customers who may demand
such requirements but it poses major potential headaches for operations
80 Strategic operations management

managers, who are charged with the responsibility of having to deliver
all of these requirements simultaneously. This is a very different scen-
ario from that of mass production or mass service to which we alluded
earlier. Skinner’s (1969, 1978) initial solution was to speak in terms of
‘focused’ factories – and he spoke of the need to have a trade-off
between cost, quality, delivery and flexibility. This may have ‘solved’
the problem of the former, mass production era (1970s) and Skinner’s
suggestion was certainly a means of dealing with the perceived con-
fusion in running a plant but, as Schonberger stated in 2001 (p. 21) –
by which time the current era of mass customization was in place – the
trade-off solution was not a solution after all:
World class strategies require chucking the (trade-off) notion. The right
strategy has no optimum, only continual improvement in all things.
The 1980s saw the apotheosis of strategic thinking, with the publication
of Michael Porter’s Competitive Strategy in 1980 and Competitive Advantage
in 1985. In the former, Porter identified five competitive forces (sup-
pliers, customers, substitutes, new entrants and rivalry), whilst in the
latter he identified three generic strategies that could be applied to all
industries (lowest cost production, differentiated production and
focused production). The implications of this type of strategic thinking
for operations management was to reinforce the scientific approach of
shopfloor Taylorism and continue the emphasis on planning. Inherent
in this thinking, especially Porter’s generic strategies, is also the concept
that cost and quality are a trade-off. In the current competitive arena,
cost, speed, quality and other features are not trade-offs, but are,
instead, combined in unique ways to meet strategic goals. Firms that are
frequently cited as reinventing the rules of the game in their sectors
are CNN, Federal Express, Body Shop, First Direct and Ikea.
We will discuss agility and mass customization in Chapter 3, but we
mention them here because having an operations strategy is an import-
ant feature of agility. This is because such capabilities do not ‘happen
by chance’ but have to be intentional and planned.
Agile or lean
We will discuss agility and leanness in other chapters, but a note is pertin-
ent here. Modern managers are perhaps ill served by terminology, often
shortened to just initials, and there is often contempt for those who seek
Strategic operations management 81

to capture the essence of an idea in a ‘buzzword’. The adjectives ‘agile’
and ‘lean’ were perhaps used by their progenitors to avoid this problem.
However, some observers have felt that the two are in conflict, and thus
devalued. Since we are using these and other terms in this book, it is per-
haps necessary to discuss them briefly here. Simply put, leanness is taken
as the state of an operation (in the extended sense: internal and external)
when unnecessary resources have been eliminated, so that it may func-
tion as close to perfection as possible. Waste is identified in materials,
time, labour, rework, poor design and so forth (some observers use the
Japanese term ‘muda’ for this, identifying seven different types). Agility,
meanwhile, is seen as the nature of an operations system that enables it to
change quickly, refocusing on new challenges. Clearly, to be agile a sys-
tem needs to be lean – but not denuded of resources that enable the
change to take place. The approach to operations strategy that results in
leanness and agility is thus seen as common, for our purposes.
As we have mentioned before, the problems and requirements
facing the firm include:
■ rapid change and volatility in many markets;
■ emergence of globalization in many firms;
■ increased national as well as international competition;
■ agility and flexibility.
Having operations strategies in place becomes an important feature in
dealing with these requirements. The ability to deal with these require-
ments has to be planned and executed because these capabilities will
not ‘just happen’. The firm has to be equipped and strategies have to
be in place to ensure that the firm can compete against other players.
This is where strategy comes into play, and in the following sections we
look at the nature and importance of strategy; how strategy is formu-
lated; competitive profiling; and the debate on whether strategy is
developed by exploiting the firm’s capabilities or if it is down to react-
ing to requirements.
The need for agility and flexibility comes as a result of the operations
capabilities of one or more players competing within particular indus-
tries. For example, in the computer industry, firms dealt in different
ways with the shift to mass customization and agility in their operations.
The strategic challenge
The challenge for manufacturers, who predominantly process mater-
ials, is how to provide variety while producing high-volume outputs
at low cost, whereas, for service firms, especially those processing
82 Strategic operations management

customers, the challenge is how to provide individual customer service
while lowering unit costs, possibly through higher volume output.
For some firms, solving the problem of having differing competitive
requirements was thought to be achievable by blanket investment –
‘throwing money at technology’. In services, this has largely been
through information technology and simple automation such as
barcode readers in supermarkets and ATMs. In manufacturing, the
technological ‘solutions’ have been more sophisticated, including
manufacturing resources planning (MRP2), flexible manufacturing
systems (FMS), computer-aided design and computer-aided engineer-
ing (CAD/CAM), computer-integrated manufacturing systems (CIM)
and the all-encompassing ‘enterprise resource planning’ (ERP), of
which perhaps the best known is the German software house SAP.
Interestingly, ERP producers sell on the basis of capturing the entire
operating systems within their software, unashamedly asking the cus-
tomer to become completely dependent upon them. SAP have said
publicly that their strategy is to become a ‘healthy virus’ within their
customers’ systems. There have also been attempts to redesign the
system. Service firms have increasingly separated out the back-of-house
or back-office operations from the front-of-house or front-office activi-
ties. This has been termed ‘decoupling’ (Lovelock, 1985). A second
major system redesign has been to increase customer participation in
their own service experience, which is a way of describing ‘self-service’.
System redesign in manufacturing has seen the introduction of cell
and group technology configurations. All of these approaches are
important and are discussed in Chapter 3. However, such approaches
are not sufficient by themselves and, at best, form only part of wider
strategic considerations. Operations strategy can be a driving force
behind such continual improvements in all areas indicated by
Schonberger, whereby the notion of trade-offs between various com-
petitive requirements becomes redundant. Instead, accumulated oper-
ational capabilities, activated simultaneously, can equip and enable the
firm to satisfy a wide variety of requirements.
The ability to be agile can be a powerful competitive weapon for the
firm and, as Roth (1996, p. 30) states:
The ability to rapidly alter the production of diverse products can
provide manufacturers with a distinct competitive advantage.
Companies adopting flexible manufacturing technology rather than
conventional manufacturing technology can react more quickly to
market changes, provide certain economies, enhance customer
satisfaction and increase profitability. Research shows the adoption and
Strategic operations management 83

use of technological bases determines an organization’s future level of
competitiveness. Corporate strategy based on flexible manufacturing
technology enables firms to be better positioned in the battles that lie
ahead in the global arena.
In services, technology (especially computer technology) has radi-
cally altered many of the transformation processes associated with
service provision. This applies especially to back-of-house activities – for
example, cheque processing in banks, reservations in hotels and inven-
tory management in retail stores.
The other ‘revolution’ in services might be seen as the opposite of
‘high technology’ – the significant growth of self-service. Many people
have seen, and continue to see, this as a lowering of quality standards
as a means of reducing costs. Significant savings in labour cost may
be achieved if the customer does things previously done by a service
worker. In effect, this is perceived as a trade-off, similar to that
described by Skinner. But increasingly it is being understood that qual-
ity is enhanced if customers participate in their own service. For
instance, diners who serve themselves from a restaurant salad bar enjoy
a product individually customized to their personal tastes, appetite and
value perception. From its humble origins in self-service cafeterias, this
concept has developed to the notion of ‘value constellations’ as sug-
gested by Normann and Ramirez (1993), in which the customer’s role
is explicitly adding value to an already high-quality product – for
example, in self-assembly furniture as sold by Ikea.
Modern service firms, like their manufacturing counterparts, are
now extending mass service into mass customization by adding value
into low-cost services. In many respects this means allowing consumers
to select from a range of service alternatives, each at a different price.
It is now common in the USA for petrol filling stations to have two rows
of pumps, one self-service and the other attended. Petrol is typically a
few cents per gallon more expensive if it is served by the attendant.
Supermarket consumers of the future will be faced with a range of
alternatives, including compiling your own shopping list or letting the
supermarket do it for you; emailing your list to the supermarket, drop-
ping it off at the supermarket, or carrying it around the supermarket
with you; filling your own trolley or paying someone to do it for you;
putting your items through the check-out or billing yourself on a hand-
held machine on the trolley.
The ability of some service firms to customize is based on the impact
that computerizing their systems has had. Service firms know a great
deal about the purchase behaviour of their customers. ‘Data-mining’,
84 Strategic operations management

or the analysis of this customer information, enables service providers
such as banks, retailers, hoteliers and restaurateurs to predict very
accurately the needs of the customer, sometimes even before the cus-
tomer is aware of these needs for themselves.
Strategic operations management 85
Industry Week’s 2003 Best Plants winners: living the good life
Looking for the secrets to manufacturing longevity? Industry Week’s 2003 Best Plants winners
offer their prescription for success.
If you want to live to see your 100th birthday, or 90th at least, you have to stack the odds in your favour.Everyone knows that what we eat, whether we exercise or not, how much alcohol we drink and how safelywe drive all play a role in how ripe an age we reach and how much we enjoy it when we get there.
The same assumption applies to managing a manufacturing operation.What it takes to run a world-classfacility is no mystery. Industry Week’s 2003 Best Plants winners and other pioneers have made incredible changesin the way they run their operations, aligning their production processes with customer needs and harnessingpeople’s desire to make things better. As they’ll be the first to say, all it takes is some skill and the resolve to do what most plant managers already know what needs to be done.
A standard longevity test – such as the one published online by the Alliance for Aging Research – asks aboutvarious risk factors and behaviour and then spits out an estimated life expectancy. Just as in business, where atechnological innovation or foreign competitor can suddenly change the rules of the game, some of these fac-tors are beyond our control.Women live longer than men, and family history is a key determinant of health.Such facts of life aren’t worth worrying about.The behavioural factors we can influence are another story.
Like life-insurance agents consulting their actuarial tables, the judges for Industry Week’s 2003 Best Plants
competition weighed the management practices reported by the applicants, compared the raw performancemetrics and improvement records and came up with their own life-expectancy ratings.This year’s 10 winners:
■ Exercise more.Where continuous improvement is ingrained in the work culture, there’s no such thing as rest-ing on laurels.Through lean initiatives at Boston Scientific Corp’s Maple Grove operation, managers expectwork teams to reduce total floorspace by 40 per cent, cut cycle times by 25 per cent and improve productiv-ity by at least 20 per cent.Then, the following year, to do it again.The end result: the business stays limber andresponsive to rapid market changes. Such hard work shows up in a number of areas, including customer leadtimes, which most of the 2003 Best Plants cut by 37 per cent or more over the past 3 years.
■ Monitor their health and watch what they eat. Most of us check our blood pressure and monitor our cho-lesterol levels to find out if we need to cut back on the high-fat foods and eat more fruits and vegetables(whether we act on our doctors’ advice or not). Similarly, the Best Plants winners are obsessed by metrics.They track how they’re doing on a weekly, monthly and annual basis to see where they need to improvetheir operations. Not only that, they do what they can to find out how they stack up against other manu-facturers. Most of the winners conducted six or more major benchmarking studies last year.
■ Are not overweight. Excess inventory hides problems, is a chore to manage and costs money. Although DanaCorp.’s facility in Owensboro, KY, which supplies truck frames to Toyota, was born lean not too many yearsago, it’s reduced total inventories by an additional 56 per cent over the past 3 years.Total inventory levels atthe top 10 plants follow a similar downward trajectory, dropping an average of 50 per cent over the samespan.
■ Come from healthy stock. Any change initiative that isn’t supported by upper management is doomed.Whether prodded or coddled by the corporate office, many of this year’s Best Plants winners have earnedrecognition from headquarters as benchmark facilities within their organizations. Many of these companieshave even devised their own formulas for becoming world-class. Under Kautex-Textron’s operating system,followed by two of this year’s winners, an eighth form of waste has been added to the standard list of seven:‘wasted talent’.

86 Strategic operations management
■ Look forward to tomorrow. As people get older, staying engaged is one of the keys to living a long, happy life. In manufacturing this pursuit of lifelong learning manifests itself in non-stop training both in the class-room and on the shopfloor. At the Collins & Aikman plant in Guelph, Ontario, job instructions are communicated on personal computers at workstations that not only explain, but show how tasks should beperformed. Most of Industry Week’s 2003 Best Plants dedicated 2.8 per cent of their labour costs and over 70 hours of training per employee last year.
■ Obey the rules of the road and buckle up. In business it’s impossible to predict everything that the marketwill throw your way. It’s best to be prepared. Operations with low levels of inventory and rapid cycle timesinherently respond better to fluctuations in demand. On the journey to world-class, it’s also a good idea totake care of your passengers. With the ultimate objective that all leave the factory at the end of their shiftin the same condition in which they arrived, the winning plants achieved Occupational Safety and HealthAdministration incident rates about half of their industry averages.
■ Drink in moderation.The Best Plants winners know how to celebrate. Walking through these facilities, you’llfind people who smile and project an air of competent comradery. At every opportunity they recognizeindividual and team achievements. Autoliv’s facility in Columbia City, IN, is home to local superhero KaptainKaizen, who congratulates team members on a job well done. Around the corner in Avilla, IN, increasing participation in Kautex-Textron’s annual plant picnic itself has become an indicator of how much happierpeople are to work there.
One of the key factors of life expectancy calculators that doesn’t necessarily hold true for manufacturing plantsis age. With today’s pace of innovation, younger plants can be outmoded almost as quickly as older ones.Survival depends on market success that in turn drives ongoing investments in new capital equipment andtechnology. Over half of this year’s winners began life in the 1990s, but the Lockheed Martin facility in Syracusehas had several lives going back to the late 1940s, when it was part of General Electric Co.’s Electronics Park.
Yet in the final analysis, manufacturing success is about more than mere survival. It’s about living the goodlife: serving customers well, making a healthy profit and having fun along the way.
Source: Living the good life. Industry Week, October 2003, Issue 10, p. 27.
Key question: What role do you think strategy had in subsequent performance of these plants?
Summary
■ In addition to the huge managerial responsibility of managing key assets, costs and human resources, thecontribution of production and operations management is vital because it can provide a number of com-petitive opportunities for the firm.
■ Strategies must be in place if the organization is to compete in a business world which is now chaotic,requiring rapid and continuous innovation, and open to global competition in many industries and markets.
■ In Japanese and other world-class companies, the contribution of operations management to business planning is central. This involvement helps to guide the firm by matching the firm’s core capabilities withmarket requirements.
■ There have been major transitions from craft to mass through to the current era of mass customization,agility, leanness and strategic manufacturing. Each of these has represented a major, worldwide innovation,with implications for strategy formulation and profoundly changing the way people work. In each case, thenew paradigm has made the previous one largely, but not totally, redundant.
■ Operations strategy is vital as part of the wider, business strategy, in integrating and combining major competitive requirements, including cost, delivery speed, delivery reliability, flexibility and customer-specificconfigurations.
■ Having an operations strategy is important because the ability to be agile, lean and flexible does not come about by chance; such states are achieved by enabling the organization to be poised to achieve suchrequirements. Operations strategy becomes the means by which capabilities become realized.

Strategic operations management 87
Key questions
1 What are the links between operations strategy and business
strategy?
2 What are the problems that might be faced in formulating an
operations strategy?
3 Why have operations and business strategies become separated in
some firms?
4 Why is operations strategy vitally important in modern-day oper-
ations management?
References and further reading
Barney, J.B. (1991) Firm resources and sustained competitive advan-
tage. Journal of Management, 17, 99–120.
Beach, R., Muhlemann, A., Paterson, A., Price, D. and Sharp, J. (1995) A
process for developing manufacturing management information
systems to support strategic change. In: Advances in Manufacturing
Technology, Vol. IX, pp. 646–650. London: Taylor & Francis.
Beach, R., Muhlemann, A.P., Price, D.H.R., Paterson, A. and
Sharp, J.A. (2000) Manufacturing operations and strategic flexi-
bility: survey and cases. International Journal of Operations and
Production Management, 20(1), 13–27.
Berry, W.L., Hill, T.J. and Klompmaker, J.E. (1995) Customer-driven
manufacturing. International Journal of Operations and Production
Management, 15(3), 4–16.
Bessant, J. (1993) The lessons of failure: learning to manage new manu-
facturing technology. International Journal of Technology Management,
Special Issue on Manufacturing Technology, 8(2–4), 197–215.
Bozarth, C. and Edwards, S. (1997) The impact of market require-
ments focus and manufacturing characteristics focus on plant.
Journal of Operations Management, 15(3), 162–180.
Brown, S. (1996) Strategic Manufacturing for Competitive Advantage. Hemel
Hempstead: Prentice Hall.
Brown, S. (2000) Manufacturing the Future – Strategic Resonance
for Resonant Manufacturing. London: Financial Times/Pearson
Books.
Brown, S. and Blackmon, K. (2004) Aligning manufacturing strategy
and business-level competitive strategy in new competitive envir-
onments: the case for strategic resonance. Journal of Management
Studies (in press).

Brown, S., Blackmon, K., Cousins, P. and Maylor, H. (2001) Operations
Management – Policy, Practice and Performance Management.
Butterworth-Heinemann.
Business Week, 7 August 1995, p. 64.
Business Week, 3 May 1999.
Chandler, A. (1992) Corporate strategy, structure and control methods
in the United States during the 20th century. Industrial and
Corporate Change, 1(2), 263–284.
Clark, K. (1996) Competing through manufacturing and the new manu-
facturing paradigm: is manufacturing strategy passé? Production
and Operations Management, 5(1), 42–58.
Collis, D. and Montgomery, C. (1995) Competing on resources: strat-
egy in the 1990s. Harvard Business Review, 73(4), 118–128.
Corbett, C. and Van Wassenhove, L. (1994) Trade-offs? What trade-
offs? Competence and competitiveness in manufacturing strategy.
California Management Review, 35(4), 107–120.
Corsten, H. and Will, T. (1994) Simultaneously supporting generic
competitive strategies by production management. Technovation,
14(2), 111–120.
Dangayach, G.S. and Deshmukh, S.G. (2001) Manufacturing strategy:
literature review and some issues. International Journal of
Operations and Production Management, 21(7), 884–932.
Das, T.K. (1991) Time: the hidden dimension in strategic planning.
Long Range Planning, 24(3), 49–57.
Deane, R.H., McDougall, P.P. and Gargeya, V.B. (1991) Manufacturing
and marketing interdependence in the new venture firm: an
empirical study. Journal of Operations Management, 10(3), 329–343.
Dertouzos, M., Lester, R. and Solow, R. (1989) Made in America.
Cambridge, MA: MIT Press.
Dierickx, I. and Cool, K. (1989) Asset stock accumulation and sustain-
ability of competitive advantage. Management Science, 35, 1504–1511.
Dougherty, D. and Corse, S.M. (1995) When it comes to product inno-
vation, what is so bad about bureaucracy? Journal of High Technology
Management Research, 6, 55–76.
D’Souza, D.E. and Williams, F.P. (2000) Toward a taxonomy of manu-
facturing flexibility dimensions. Journal of Operations Management,
18, 577–593.
The Economist, Survey of multinationals: who wants to be a giant?, 24
June 1995.
The Economist, 22 June 1996, p. S3:3.
Eisenhardt, K.M. and Martin, J.A. (2000) Dynamic capabilities: what
are they? Strategic Management Journal, 21(10/11), 1105–1122.
88 Strategic operations management

Fortune, 11 May 1998, 137(9), p. 59.
Fortune, The secrets of execution, 8 March 2004.
Frambach, R.T., Prabhu, J. and Verhallen, T.M.M. (2003) The influ-
ence of business strategy on new product activity: the role of
market orientation. International Journal of Research in Marketing,
20(4), 377–397.
Gagnon, S. (1999) Resource based competition and the new operation
strategy. International Journal of Operations and Production Management,
19(2), 125–138.
Gerwin, D. (1993) Manufacturing flexibility: a strategic perspective.
Management Science, 39(4), 395–408.
Gupta, D. (1993) On measurement and valuation of manufacturing
flexibility. International Journal of Production Research, 31(12),
2947–2958.
Hamel, G. and Prahalad, C. (1989) Strategic intent. Harvard Business
Review, 67(3), 63–76.
Hamel, G. and Prahalad, C. (1990) Strategy as stretch and leverage.
Harvard Business Review, 71(2), 75–84.
Hamel, G. and Prahalad, C. (1994) Competing for the Future. Cambridge,
MA: Harvard Business School Press.
Hamilton, R.D. III, Eskin, E. and Michaels, M.P. (1998) Assessing com-
petitors: the gap between strategic intent and core capability.
Long Range Planning, 31(3), 406–417.
Hax, A. and Majluf, N. (1991) The Strategy Concept and Process.
Englewood Cliffs, NJ: Prentice Hall.
Hayes, R. and Pisano, G. (1994) Beyond world-class: the new manufac-
turing strategy. Harvard Business Review, January–February, 77–86.
Hayes, R. and Wheelwright, S. (1984) Restoring Our Competitive Edge.
New York: Wiley.
Heskett, J., Sasser, E. and Schlesinger, L.(1997) Service Profit Chain. New
York: Free Press.
Hill, T. (1980) Manufacturing implications in determining corporate
policy. International Journal of Operations and Production Management,
1(1), 3–11.
Hill, T. (1995) Manufacturing Strategy, 1st Edition. Basingstoke: Macmillan.
Hill, T. (2000) Manufacturing Strategy, 2nd Edition. Basingstoke:
Macmillan.
Hines, P. (1994) Creating World Class Suppliers: Unlocking Mutual Competitive
Advantage. London: Pitman.
Honeycutt, E.D., Siguaw, J.A. and Harper, S.C. (1993) The impact of flex-
ible manufacturing on competitive strategy. Industrial Management,
35(6), 2–15.
Strategic operations management 89
Industry Week, 16 November 1998.
Industry Week, 7 December 1998.
Industry Week, Waking up to a new world, June 2003, 252(6).
Ireland, R., Hitt, M.A. and Vaidyanath, D. (2002) Alliance management
as a source of competitive advantage. Journal of Management, 28(3),
413–446.
Itami, H. and Numagami, T. (1992) Dynamic interaction between strat-
egy and technology. Strategic Management Journal, 13, 119–135.
Johnson, G. and Scholes, K. (2003) Exploring Corporate Strategy. Hemel
Hempstead: Prentice Hall.
Johnston, R. and Clark, G. (2001) Service Operations Management. London:
Financial Times.
Kathuria, R. and Partovi, F.Y. (2000) Aligning workforce, management
practices with competitive priorities and process technology: a
conceptual examination. Journal of High Technology Management
Research, 11(2), 215–234.
Kay, J. (1993) Foundations of Corporate Success. Oxford: Oxford University
Press.
Kenney, M. and Florida, R. (1993) Beyond Mass Production. New York:
Oxford University Press.
Kim, J. and Arnold, P. (1996) Operationalizing manufacturing
strategy – an exploratory study of constructs and linkages. Inter-
national Journal of Operations and Production Management, 16(12),
45–73.
Kim, W.C. and Mauborgne, R. (2002) Charting your company’s future.
Harvard Business Review, 80(6), 76–83.
Lamming, R. (1993) Beyond Partnership. Hemel Hempstead: Prentice Hall.
Lazonick, W. (1990) Competitive Advantage on the Shopfloor. Cambridge,
MA: Harvard University Press.
Lazonick, W. (1991) Business Organization and the Myth of the Market
Economy. Cambridge, MA: Harvard University Press.
Lazonick, W. and West, J. (1995) Organizational integration and
competitive advantage: explaining strategy and performance
in American industry. Industrial and Corporate Change, 4(1),
229–269.
Lovelock, C. (1985) Developing and managing the customer-service
function in the service sector. In: Czepiel, J.A., Solomon, M.R.
and Surprenant, C.F. (eds), The Service Encounter. Lexington, MA:
Lexington Books.
Menda, R. and Dilts, D. (1997) The manufacturing strategy formula-
tion process: linking multifunctional viewpoints. Journal of
Operations Management, 15, 223–241.
90 Strategic operations management

Meredith, J. and Vineyard, M. (1993) A longitudinal study of the role
of manufacturing technology in business strategy. International
Journal of Operations and Production Management, 13(12), 4–25.
Miller, J. and Roth, A. (1994) Taxonomy of manufacturing strategies.
Management Science, 40(3), 285–304.
Mills, J.F., Neely, A., Platts, K. and Gregory, M. (1995) A framework for
the design of manufacturing strategy processes: toward a contin-
gency approach. International Journal of Operations and Production
Management, 15(4), 17–49.
Mintzberg, H., Ahlstrand, B. and Lamprel, J. (2000) Strategy Safari: A
Guided Tour Through the Wilds of Strategic Management. London:
Financial Times Books.
Normann, R. and Ramirez, R. (1993) From value chain to value con-
stellation: designing interactive strategy. Harvard Business Review,
71(4), 65–78.
Nunes, P.F. and Cespedes, F.V. (2003) The customer has escaped.
Harvard Business Review, 81(11), 96–105.
Pagell, M. and Krause, D.R. (1999) A multiple-method study of envir-
onmental uncertainty and manufacturing flexibility. Journal of
Operations Management, 17, 307–325.
Porter, M. (1980) Competitive Strategy. New York: Free Press.
Porter, M. (1985) Competitive Advantage. New York: Free Press.
Prais, S. (1981) Productivity and Industrial Structure: A Statistical Study of
Manufacturing in Britain, Germany and the U.S. Cambridge, UK:
Cambridge University Press.
Ramanujam, V. and Venkatraman, N. (1987) Planning system charac-
teristics and planning effectiveness. Strategic Management Journal,
8(5), 453–468.
Roth, A.V. (1996) Achieving strategic agility through economics of
knowledge. Strategy and Leadership, 24(2), 30–37.
St John, C.H. and Young, S.T. (1992) An exploratory study of patterns
of priorities and trade-offs among operations managers.
Production and Operations Management, 1(2), 133–150.
Sasser, W.E., Olsen, R.P. and Wyckoff, D.D. (1976) The Management of
Service Operations. Boston, MA: Allyn & Bacon.
Schmenner, R.W. (1986) How can services business survive and prosper?
Sloan Management Review, 27(3), 21–32.
Schonberger, R. (2001) Building a Chain of Customers. London:
Hutchinson Business Books.
Skinner, W. (1969) Manufacturing – the missing link in corporate strat-
egy. Harvard Business Review, May–June, 136–145.
Skinner, W. (1978) Manufacturing in the Corporate Strategy. New York: Wiley.
Strategic operations management 91

Skinner, W. (1985) Manufacturing, the Formidable Competitive Weapon.
New York: Wiley.
Spring, M. and Dalrymple, J.F. (2000) Product customisation and manu-
facturing strategy. International Journal of Operations and Production
Management, 20(4), 23–36.
Stacey, R. (1993) Strategic Management and Organizational Dynamics.
London: Pitman.
Stalk, G., Evans, P. and Shulman, L. (1992) Competing on capabilities:
the new rules of corporate strategy. Harvard Business Review,
70(2), 57–69.
Standard and Poor’s Industry Survey, 3 June 1999.
Stump, R., Athaide, G. and Ashwin, W.J. (2002) Managing seller–
buyer new product development relationships for customized
products: a contingency model based on transaction cost analysis
and empirical test. Journal of Product Innovation Management,
19(6), 439–454.
Swamidass, P. and Newell, W. (1987) Manufacturing strategy, environ-
mental uncertainty, and performance: a path analytical model.
Management Science, 33(3), 509–534.
Teece, D., Pisano, G. and Shuen, A. (1997) Dynamic capabilities and
strategic management. Strategic Management Journal, 18(7), 509–533.
Verdin, P. and Williamson, P. (1994) Successful strategy: stargazing or self-
examination? European Management Journal, 12(1), March, 10–19.
Wallace, T. (1989) The Manufacturing Strategy Report, No. 4, June.
Cincinnati, OH: T.F. Wallace Inc.
Ward, P.T. and Duray, R. (1995) Business environment, operations strat-
egy, and performance. Journal of Operations Management, 13, 99–115.
Wernerfelt, B. (1984) A resource-based view of the firm. Strategic
Management Journal, 5(4), 171–180.
Whittington, R. (2001) What Is Strategy – And Does It Matter? London:
Routledge.
Womack, J., Jones, D. and Roos, D. (1990) The Machine that Changed the
World. New York: Rawson Associates.
Youndt, M.A., Snell, S.A., Dean, J.W. Jr and Lepak, D.P. (1996) Human
resource management, manufacturing strategy, and firm per-
formance. Academy of Management Journal, 39(4), 836–865.
Zornitsky, J.J. (1995) ‘Making Effective Human resource Management
a Hard Business Issue’ Compensation & Benefits Management,
Winter, 16–24.
92 Strategic operations management

C H A P T E R
Managing thetransformation process
3
Introduction
The physical layout and the transformation process that an organiza-
tion employs are critical factors for strategic operations management.
This is because both the layout and, more specifically, the process
transformation process (or process choice as it is sometimes called) pro-
vide massive clues about what the organization can do, as well as what
it cannot do. This is important because sometimes an organization will
be attracted to a market opportunity and the attempt will prove futile
because the appropriate process choice is not in place. For example, a
famous operations management case on this issue is the attempt by
Babcock & Wilcox to enter the nuclear energy industry (Hill, 2000).
This was a disaster because the required change of transformation –
from line to job processes – was not undertaken by Babcock & Wilcox.
The purpose of this chapter is for the reader to:
■ understand the strategic significance of process choice;
■ realize that ‘throwing money’ at technology is not the answer,
although appropriate investment in technology is a necessary
requirement;
■ appreciate how process choice will help guide the organization,
including how to avoid being pulled into market segments in
which it cannot compete.
As we saw in Chapter 1, there have been three major eras in manufac-
turing: craft, mass production and the current era. This current era
94 Strategic operations management
has been called a number of things, including flexible specialization, mass
customization, agile manufacturing and lean production. These terms
attempt to describe the simultaneous requirements of volume and var-
iety that have placed enormous responsibility upon operations man-
agement. This is because the current era, with rapid change, fickle and
dynamic global markets, constant innovation and immense demands
of flexibility, requires processes that enable the firm to meet customer
demands accurately (i.e. without relying on compromise). The key
issue in addressing this situation is that, within the current turbulence
in sales and supply markets, it is inappropriate to use methods and
processes that were previously adopted under mass production (which
enjoyed a totally different, acquiescent market). This is particularly rele-
vant in the use of technology in process choice. The nature of the new
market requirements demands operations management capabilities
that deliver flexibility; this comes from an array of operating possibili-
ties under the heading of ‘flexible’ manufacturing. This is discussed in
this chapter.
Process technology is a key part of innovation, which we will discuss
in Chapter 4. However, innovation is not restricted to the launch of
new products (as vitally important as this is) – it includes acquiring and
managing new process technology. Investment in process or product
technology per se is not enough, however. An important part of the
innovation process is in ensuring that there is sufficient and suitable
human capacity – know-how and learning – in place to accompany and
complement the investment in new process technology: this is the inter-
face between technology management and operations management.
Process and product technology are often twin themes in the innova-
tion process; this is because process technology must be in place to
support new product innovations. Without this capability, new product
developments will fail. New technology may also have important influ-
ence on the wider issue of the firm’s overall capacity. Capacity should
not be seen just in terms of volume, but also in the variety of products
that the firm can provide. This capability – to produce a variety of
products – is an important feature of the overall output of the firm.
Managing technology is a complex task because technology is uncer-
tain and dynamic, and must be integrated with other areas, such as human
skills and capabilities, cultural aspects (working practices), and finan-
cial protocols. Process choice – which is the means by which techno-
logy transforms inputs into products within the plant – is always a major
strategic decision. This is because no amount of reactive, tactical meas-
ures can be expected to compensate retrospectively for inappropriate
investment in processes that do not match the market requirements in

which the firm or plant is competing. Decisions have to be based on
current and future market demands and counter technical or engin-
eering indulgence or idiosyncrasy within an influential group within
the firm. One of the major considerations in selecting process technology
is in the amount and nature of investment necessary – the financial factor,
which we shall now discuss.
The financial factor in process technology
The state of markets for most products and services means that invest-
ment in technology is seldom a question of choice of whether or not to
invest; the only choice is often the type and extent of process technology
investment. Many industrial sectors have seen the demise of firms that
suffered from lack of investment over time – firms which became casu-
alties of aggressive competitors that were prepared to invest in process
technology. In some cases, this lack of investment has accounted for
the demise of whole industrial sectors – including the British car manu-
facturers of the 1970s and elements of shipbuilding throughout
Europe and in the USA. These industries represent a range of trans-
formational types that fall under the title of process choice: the lack of
investment has been apparent in high-volume, high-tech sectors, as
well as in sectors producing low-volume products.
There are two, equally dangerous, positions that can be taken when
it comes to investment in process technology. Both may seem unrealis-
tic to the newcomer to operations management, but evidence of both
is depressingly common. The first is not to invest at all; the second is to
‘throw money’ at technology in the hope that, somehow, this very act
will ensure success for the firm. If a firm does not invest, it may be
expected to grow increasingly incapable of competing against other
players in its market. The temptation not to invest – management indol-
ence – is one of the easiest financial traps to fall into. In the short term,
the plant may survive as if no mistake has been made. More alarmingly,
the firm’s return on net assets – RONA, one of the most misleading of
all accounting ratios if used in isolation – will appear to improve! In the
longer term, the plant will undoubtedly become uncompetitive and,
typically, face closure. In global manufacturing, where politics are
never far beneath the surface, this strategy may be used – with stealth –
to justify withdrawal from a foreign plant when conditions in the home
country favour retrenchment.
Justifying investment will always be a difficult matter, relying as much
on management intuition as scientific analysis: there are no calculations
Managing the transformation process 95

that can state with certainty that a specific investment will yield a speci-
fied return. In other words, we cannot say that ‘x amounts’ of investment
equals ‘y values of return’ within a specific period of time. But we must
always bear in mind that the greatest cost will arise from not investing.
This may mean that justifying an investment is seen as a ‘leap of faith’
to some degree – beyond the scope of straightforward accountancy
techniques. Large sums may be involved and there is often a significant
period between the time of investment and the benefits that might be
attained. These benefits, such as improved speed and accuracy of deliv-
ery, greater flexibility and enhanced quality, might not have an impact
on the ‘bottom line’ for some time after the operational capabilities
have been developed. Financial ratios do not always provide solutions
in these cases. Various attempts have been made to justify accounting
criteria, including the payback period (Monohan and Smunt, 1984;
Willis and Sullivan, 1984), break-even analysis (Starr and Biloski, 1984)
and net present value (Hutchison and Holland, 1982; Kulatilaka,
1984). However, the problem with these accounting measures is that
there is a static and fixed ‘feel’ to them. For example, ‘payback’ criteria
ignore any returns that might be forthcoming beyond the payback
period. In addition, net present value (NPV) – a ratio that is often used
to evaluate investment – assumes that factors such as market share,
price, labour costs and the firm’s competitive position in the market
will remain constant over time. In practice, all of these factors may be
expected to change. To allow for this scientifically, investment analysts
would need to use parametric estimating – a complex technique only
used at present for the largest, most long-term investments (such as
governments’ investments in major weapons systems, ship and so on).
More importantly, these operational factors may be expected to degen-
erate if the company retains outdated production methods, preventing
it from competing on key competitive bases such as cost, delivery speed
and reliability, and new product innovation.
In the past, the justification for investment was that it should result in
a reduction in the numbers of people employed, thus reducing labour
costs. This apparently ignores the point that labour costs are typically a
small proportion of product cost. There are two traditional reasons for
this – the first so surprising that it is difficult to believe. Since overhead
costs were traditionally recouped on the basis of a labour hour charge
(e.g. overheads might be costed to a product at, say, 300 per cent of
labour costs), it was hoped that a reduction in labour would result in a
reduction in overhead costs. This absurdity was actually present in
industry in the 1980s, revealing, perhaps, the degree to which a formu-
laic approach to management can result in myopia.
96 Strategic operations management

Just as important – especially in the justification for the vast amounts
of expenditure that took place in a number of US plants on robots in
the 1980s and 1990s – was the argument that technological hardware
does not incur the imponderable costs associated with human employ-
ees; machines do not go on strike, have unions or pay deals, nor bring
any of the other annoyances that can cause managers and directors of
plants major headaches when managing human resources. Justification
for investment clearly has to go beyond simply replacing labour costs
to the principle of competitive advantage in other areas, such as prod-
uct quality, delivery speed and delivery reliability. In addition, a major
issue that has emerged is that human capability is a very necessary com-
plementary asset to the technological hardware in flexible manufac-
turing systems: it appears the most complex computer control will
usually benefit from a ‘human break’ in its control loops at some stage.
The question of how much to invest in technology is made more dif-
ficult in many Western manufacturing firms, because there is no tech-
nological or manufacturing presence among senior managers involved
in business strategy decisions, whose input might help in guiding the
extent and appropriateness of technological investment decisions
(Brown, 1996, 1998a,b). The consequence of this in some cases is that
there have been massive amounts of investment in technology that
have resulted in no benefit for the firm.
For example, one of General Motors’ most automated plants is in
Hamtramck, Michigan, but in spite of the level of automation in place,
this plant was known for having lower productivity and poorer quality
performance than GM’s more labour-intensive plant at Fremont,
California – the NUMMI project (New United Motor Manufacturing
Industry) – a joint venture between GM and Toyota in an old GM plant
planned for closure.
Keller (1993, p. 169) provides insight into the inappropriate invest-
ment at General Motors:
While Smith provided the money for automation and supported it
completely, he clearly didn’t understand it. … With its 260 gleaming new
robots for welding, assembling, and painting cars; its 50 automated
guided vehicles to deliver parts to the assembly line; and a complement
of cameras and computers to monitor, inspect, and control the process,
the plant put stars in Smith’s eyes. He believed it held the promise of a
new era of efficiency and quality and would eventually become a model
for all assembly plants. What it became was a nightmare of inefficiency,
producing poor-quality vehicles despite the heroic efforts of workers to
correct mistakes before they were shipped to dealers.
Managing the transformation process 97

The NUMMI plant, meanwhile, benefited from GM’s link-up with
Toyota in the 1980s, in which the US giant learnt lean production from
its Japanese competitor, while Toyota, in return, built a bridgehead in
North America.
Between 1980 and 1995, GM is reputed to have spent $80 billion on
manufacturing automation (at a time when the giant corporation’s
annual turnover was around $100 billion). This massive investment did
not bring significant benefits to General Motors, however. In 1979, GM
enjoyed a domestic market share of around 61 per cent; by the end of
the 1990s this had fallen to around 30 per cent and had diminished
further to around 28 per cent in 2004.
What had happened was that GM’s rivals – particularly the Japanese –
invested in the right technology for the right reasons. The new Japanese car
transplants in the USA employed lean, flexible manufacturing tech-
niques – a mix of human and technological capacity, which was to take
the North American vehicle producers almost a decade to understand.
One of the reasons behind GM’s investment disaster was that the deci-
sion to invest included wanting to reduce the workforce significantly.
It did just that – in a 6-year period – from 876 000 in 1986 to around
750 000 in 1992 (Brown, 1996). With the benefit of hindsight, we can see
that GM’s problem during this period was the lack of importance given
to process technology as a complementary feature to skills and inventive-
ness of humans, rather than a wholesale replacement for them. GM
learned this lesson from Toyota in the NUMMI joint venture project
and later implemented it at the Saturn plant in Springhill, Tennessee.
Clearly, technology can replace human labour: this has been a con-
cern since the early nineteenth century, when the British ‘Luddites’
destroyed the looms and ‘spinning Jennies’ that threatened their liveli-
hood in the industrial revolution. Computers have also been seen as a
threat. For example, in the late 1940s, Norbert Weiner, a pioneer of
computing, forecast that this new technology would destroy enough
jobs to make the depression of the 1930s appear tame by comparison.
The case is not clear, however, as shown by this comment in The
Economist (11 February 1995):
Are such fears justified? In one way, yes. Millions of jobs have indeed
been destroyed by technology. A decade ago, the words you are now
reading would have reached you from two sets of hands: those of a
journalist and those of a typesetter. Thanks to computers, the
typesetter no longer has a job. … Although the typesetter no longer
has that job, he may well have a different one. John Kennedy put it well
in the 1960s:‘If men have the talent to invent new machines that put
98 Strategic operations management

men out of work, they have the talent to put those men back to work.’
That is as true now as it was then, and earlier.
Investment in technology can provide benefits for the firm and its
workforce, principally by ensuring continued operation for a plant.
The firm can gain from consistent process quality and quicker change-
overs (set-up), which will result in greater flexibility. Robots can free
humans from tiresome, repetitive and monotonous tasks, allowing
them to do more creative activities.
With specific regard to manufacturing technology, The Economist
Manufacturing Technology Survey (1994, pp. 8–9) noted that:
… robots have not displaced men and women … despite the fact that
their advent gave rise to yet another wave of speculation about the
workerless factory. They have a role in manufacturing and have been
used well in Japan. … The Japanese have understood that, if work is
designed properly for robots, they will do it well – but they are not able
to replace people at jobs that have evolved to need a human’s innate
ability to fit the world and ideas and intentions to that of deeds and
objects.
It is clear, then, that the justification for technological investment must
go beyond cost reductions from reduced numbers in the workforce.
Instead, it must follow on from an awareness of, and the desire to sat-
isfy, market requirements.
Investment decisions are critical and must be made with the aim of
equipping the firm or the plant to be more competitive in the market.
Furthermore, wrong process choice decisions may severely reduce the
company’s capability to satisfy customer demands in particular markets.
Process choice and technology are both vital because key competitive
factors for customers, including cost, delivery speed and flexibility, can
be enhanced by their combination. If appropriate investment is made
in technology and process choice, the resultant capacity and capability
should become a central part of the firm’s competitive weaponry.
Layout
As we noted earlier, we know there have been three eras of manufac-
turing: craft, mass production and the current era. All three have
direct relevance to the nature of the transformation process and
Managing the transformation process 99

process choice. They are also relevant to types of facilities layout to be
understood: we start with this factor before linking layout to process
choice. There are four basic layout types to be found in manufacturing
and service settings:
1 Fixed position.
2 Process layout.
3 A hybrid of process and product layouts, based around cells.
4 Product layout.
Fixed layout
A fixed layout is used where a product may be heavy, bulky or fragile
and in this approach operators come to the product itself. The prod-
uct is completed ‘on site’ and is not moved during completion. The
product is centred around a particular, focused area. Examples of this
are shown in Figure 3.1.
Process layout
In a process layout, a plant or service location has specific activities or
machinery grouped together. In manufacturing this allows a range or
variety of products to be made. The machines are not laid out in a particu-
lar, sequential process. Therefore, the product does not move in a speci-
fied sequence but would go to a machine centre as and when required
for the particular product. The great advantage of process-oriented
100 Strategic operations management
Product
Operators perform processeson the ‘fixed’ product. Theremay be more than oneoperation performed on theproduct at the same time. Eachoperation adds to the productuntil it is completed.
Examples:In manufacturing, fixed layouts are used in shipbuilding, fabrication ofaeroplanes and various forms of construction. In services, a dentist will bean example where the person remains ‘fixed’ or in place for the duration of the‘operation’.Figure 3.1
Fixed position
layouts.

layouts is the flexibility in both equipment and labour assignments that
they bring. The breakdown of a particular machine will not halt an
entire process and work can therefore be transferred to other machines
in the department. This type of layout is ideal for manufacturing parts
in small batches – or job lots – and for producing a wide range of parts
in different sizes and forms. Examples are shown in Figure 3.2.
The hybrid process/product cell
With the above approach, the machines or points of activity (operating
theatres, sections in the department store) are not dedicated to a
particular product family (customer) but are available for a range of
products. Another approach, shown in Figure 3.3, is to group machines
or activities together around a focused, product family cell.
Managing the transformation process 101
machine/activitygroup 1
machine/activitygroup 2
Movement
of product or person
machine/activitygroup 3
machine/activitygroup ‘n’
Examples:In manufacturing, this layout is commonly used in job-shop environments wherecraft-type manufacture continues to this day. Examples would include: low-volumefurniture; haute couture clothing; jewellery. In services, examples would includetypes of catering which are laid out enabling a person to move to an area asrequired; hospitals are also laid out like this – unless they are dedicated to oneprocess only (such as an eye operation). Patients move around departments andwards as necessary. Hairdressing is another service example where areas such aswashing, drying, and cutting are put in place to complete a range of different styles.A department store (retailing) is also arranged on this basis.
Unconstrained movement takes place asproducts are modified or people move aroundaccording to process requirements. There isno specified standard ‘flow’ – each productwill have its particular process requirementsand will move to each machine group as andwhen required. In service a person (customer)will move to a particular area as needed.
Figure 3.2
Process layout in a functional approach.

In manufacturing, machines or activities are grouped together in a
way to best support the manufacture of a particular family of products
or to provide a cluster of similar services. The variety of products or
services around a particular group or ‘cell’ may be quite large, but the
essential nature of the product will remain similar and will therefore
warrant a cell of its own, distinct from other product family cells.
Product layout
In a product layout, machines are dedicated to a particular product –
or a very similar small range of products – and each stage of manufac-
ture is distinct from the next, as shown in Figure 3.4.
102 Strategic operations management
Ο Ο Ο Ο
group 1 group 2 group 3 group 4
Ο Ο Ο
Examples:This clustering/cell approach is common inhigh-tech manufacturing environments. This enableshigh volume and some variety to be achievedsimultaneously. The same type of approach has beenadopted in high-volume, batch-type services such ascall centres in finance-related sectors, where calls arerouted through to specific, focused areas.Figure 3.3
Process layout in a
product family cell.
Examples:In manufacturing this is common in car manufacture and other high-volumeapplications. In services it has been used to some degree in high-volume‘standard’ provisions, especially were there is a tangible element in theoverall offering: e.g. fast-food delivery in-house.
Assembly/packing
The sequence of operations is designed in a linear, logical succession, whereone activity in the line is dependent upon the preceding activity having takenplace.
Ο Ο Ο
Figure 3.4
Product layout.

Each of the stations shown is laid out in an operational sequence
specific to the manufacture of a particular product or the provision of
a repetitious service offering.
Process choice
As we shall see, process choice will provide essential, major clues about
how a firm competes and what it can – and cannot – do. There are five
basic types of process choice:
1 Project.
2 Job.
3 Batch.
4 Line.
5 Continuous process.
The basic distinction between the five types of process choice is illus-
trated in Figure 3.5 and each type is discussed subsequently.
As we shall see, the choice of the transformation process choice actually
dictates, to a large extent, what the company ‘sells’ in terms of its capabil-
ities and how it can compete. There may be more than one process type
being used within the same company, but there will usually be a dominant
‘core’ process that is best suited to support the company in the market.
We need to be clear about the nature of each transformation process.
Project processes
In project manufacturing environments, the nature of the products is
often large-scale and complex. The designs of the products under-
taken in project manufacturing are, essentially, unique by virtue of
their not being repeated in exactly the same way. The distinguishing
Managing the transformation process 103
Project Job Batch Line Continuous process
Increase in Volume – typically competing on cost via scale economies
Increase in Variety – typically competing on capabilities of scope
Figure 3.5
The key distinction of volume and variety outputs from process choice.

104 Strategic operations management
feature between project and job manufacture is that, during the
process of completion, the product in project manufacture tends to be
‘fixed’. Scheduling of projects tends to be undertaken in a ‘phased
completion’ programme, where each phase of completion will be dis-
tinct and separate from other subsequent, or parallel, stages. At the
simplest level of management, tools such as Gantt charts will be used.
Alternatively, more complicated programmes such as project network
planning will be employed.
Examples
In manufacture this includes civil engineering of various types, aero-
space and some major high-tech projects – flight simulator manufac-
ture would tend to fall into this category, for example. Projects tend to
be ‘one-offs’, where repetition in terms of the product being exactly
the same is unlikely. Construction in all forms – bridge manufacture,
tunnel construction and shipbuilding – is a common application of
project process choice.
In manufacturing environments, this ties the process choice (pro-
ject) with the fixed type of layout. In services, all types of consulting
would fall into this category. The relationship, expectations and out-
comes with each client should be seen as ‘unique’; each session with a
client should be seen as unique. This means that the project process
links to Schmenner’s ‘professional services’ category within the matrix
(see Figure 3.6).
Job processes
In manufacturing, job processes are used for ‘one-off’ or very small
order requirements, similar to project manufacture. However, the dif-
ference is that the product can often be moved during manufacture.
Perceived uniqueness is often a key factor for job manufacture. The
volume is very small and, as with project manufacture, the products
tend to be a ‘one-off’ in terms of design; it is very unlikely that they will
be repeated in the short term and therefore investment in dedicated
technology for a particular product is unlikely. Investment in automa-
tion is for general purpose process technology rather than product-
specific investment. Many different products are run throughout the
plant, and materials handling has to be modified and adjusted to suit
many different products and types. Detailed planning will evolve
around sequencing requirements for each product, capacities for each

Managing the transformation process 105
work centre and order priorities; because of this, scheduling is rela-
tively complicated, in comparison to repetitive ‘line’ manufacture.
Examples
In manufacture, job processes are linked to traditional craft manufac-
ture. Making special haute couture clothing is a clear example. Job
processes are common in the following:
1 Making prototypes of new products – even if the end volume
is likely to be high for the product, it makes sense to produce
a ‘one-off’ or very low volume, which lends itself to job
manufacture.
2 Making unique products such as machines, tools and fixtures
to make other products. The process choice (job) is linked to
the process layout.
In services, a job process is linked to the ‘service shop’ in Schmenner’s
matrix. Car repairs and many hospital service activities are job processes.
Batch processes
As volume begins to increase, either in terms of individual products
(i.e. total volume) or in the manufacture of similar ‘types’ or ‘families’
LOW HIGHCustomer interaction and customization
LOW
Labourintensity
HIGH
Service factory
Examples:AirlinesHotelsTruckingFast foodAmusement parks
Mass service
Examples:RetailingWholesalingSchoolsDry cleanersFilm developers
Service shop
Examples:HospitalsAuto repairUpscale restaurantsCopy shopDentists
Professional services
Examples:DoctorsLawyersCounsellors/psychiatristsInvestment bankersRealtors
Figure 3.6
Schmenner’s service
matrix (source:
Schmenner, 1986).

of products (i.e. greater number of products in any one group or family),
the process will develop into batch manufacture. The difficulty in
batch manufacturing is that competitive focus can often become
blurred – management attention becomes fixed upon optimizing the
batch conditions to the detriment of customer service. The batch
process is therefore often difficult to manage; the key is to map the
range of products in terms of either ‘job’ or ‘line’ characteristics.
Batch production may be arranged either in terms of the similarity of
finished products or by common process groupings. As a starting point,
each product has to be determined by its volume; focused ‘cells’ of
manufacture will then be arranged so that low and high volumes can
be separated. Automation, especially for lower volumes of batch manu-
facturing, tends to be general purpose rather than dedicated to a par-
ticular product whose volume does not demand product-specific
investment in automation. Scheduling is often complicated and has to
be completely reviewed on a regular basis – this applies to new prod-
ucts, to ‘one-offs’ and to higher volume, standard products: all of these
types will need to be scheduled.
In batch production, operators have to be able to perform a number
of functions. This is clearly also true for ‘job’-type processes, but in
batch this flexibility is crucial, as it allows operators to move to various
workstations, as and when required. Where automation is being used,
set-up times need to be short, the ideal set-up time being that necessary
to accommodate run lengths of just one unit, switching over to other
models and volumes as required.
Batch is the most common form of process in engineering and the
most difficult to manage. Only by determining the volumes of each
product and dividing these into low- and high-volume sections can a
company hope to be focused and, in turn, customer driven.
Examples
Typical examples of this in manufacture will be in plastic moulding
production – these would be distinguished by determining those prod-
ucts that need much labour input (hand laminating in glass-reinforced
plastic, for example) and high-volume ‘standard’ products, where con-
siderable automation would be appropriate. Other examples include
bread making – where batches of similar types are produced. In gen-
eral, batch processes link to process layout, although high-volume
batch will tend to have a type of line (product) layout, depending
upon how often the product is reproduced.
106 Strategic operations management

In services, ‘batching a process’ has become common in routing pro-
cedures for call centres. The response message to many telephone call
centres is: ‘press “1” for this service’, ‘press “2” for that service’ and so on.
If the service centre adds the message: ‘press “0” for all other enquiries’,
this puts the service provision back into a job-type service. This will equate
either with a mass service or a service shop in Schmenner’s matrix,
depending on the extent of customization involved with the customer.
Line processes
A line process becomes more appropriate as the volume of a particular
product increases, leading to greater standardization than in low batch
volumes. Each stage of manufacture will be distinct from the next; value
and cost are added at each stage of manufacture until the product is
completed. The line is dedicated to a particular product (with possible
variations of models) and introducing new products that are signifi-
cantly different from the former product is difficult or even impossible
to realize on an existing line manufacturing process. Individual oper-
ation process times should be short – in order to satisfy delivery expec-
tations. Competitive advantages may be gained from simplification in
production planning and control, and the tasks themselves should also
be simplified for each workstation (both these features were funda-
mental to the development of the just-in-time processes in Japan in the
1950s). In line production, there should only be very small amounts of
work in process: where it does exist, it represents a poorly balanced line
loading and is seen as a signal for necessary improvement. Work in
process is counted as an asset by traditional accounting systems, but is
actually a liability to the company as it represents unsellable materials:
unmanaged, this can ruin cash-flow and stifle quick response to market
requirements. Workstations should be located as closely as possible to
each other to minimize materials handling between them. Materials
flow and control is critical and stock-outs have to be avoided.
Since much of the discussion on automation – which appears later in
the chapter – is based on developments around line processes, it is neces-
sary for us to discuss some of the disadvantages of line processes here.
The disadvantages of line manufacture include the following:
■ There can often be a lack of process flexibility and introducing
new products on existing technology can be difficult. This is
alleviated to some degree by similar sub-components which
become included in the design for new products and which
then allow the new product to be made on existing lines.
Managing the transformation process 107

108 Strategic operations management
■ As standardization and volumes both increase, relative to batch
and job manufacturing processes, investment in technology
also increases. Special product-specific technology is used and
this often involves vast amounts of firm-specific investments
(for example, GM’s $80 billion investment in automation
in the 1980s). Each workstation is dependent upon the next –
consequently, the speed of the line is determined by the lowest
capacity of a particular work centre; moreover, in ‘standard’
lines, if one set of machines is not operating, the whole line
can come to a stop, thus preventing any production.
Examples
High-volume, ‘standard’ products – such as particular models of cars,
TVs, hi-fi, VCRs and computers – lend themselves to line processes,
often arranged in a U-shape. The process choice (line) ties it to the
product type of layout. In services, a sequential, line-type process can
be put in place where there is high standardization of the service offer-
ing. This equates to Schmenner’s service factory quadrant. Where
there is a high tangible element within the offering – e.g. fast foods –
the back-room facilities will resemble a factory and the mode of deliv-
ery will go through specific stages. In less tangible elements, the ser-
vice may resemble a line process in that there may be, for example,
set procedures to adopt for a particular type of service process. For
example, in dealing with high-volume, ‘standard’ applications – for a
mortgage – there will often be set sequences of events.
Continuous processes
This is used when a process can (or must) run all day for each day of
the year, on a continuous basis. The volume of the product is typically
very high and the process is dedicated to making only one product.
Huge investment in dedicated plant is often required. Much automa-
tion tends to be evident and labour input is one of ‘policing’ rather
than being highly skilled as an integral input to the overall process.
Examples
In manufacturing, a chemical refining plant, a blast furnace or steel
works, and very-high-volume food processing are all examples where a

continuous process would be in place. In services, strictly speaking,
there is no real equivalent. For example, even though technology
might be in place to allow financial transactions to take place on a
24-hour basis, the amounts being transferred from one account to
another would vary: it is not a case of one transaction being conducted
many thousands of times.
Matrices used in services
One of the major challenges in managing service operations is to
understand the nature of the service provision. This challenge is
helped by using a ‘mapping process’ focusing on a range of factors:
■ Is the labour intensity high or low?
■ Is the degree of contact with the customer high or low?
■ Is the interaction high or low?
■ Is the degree of customization choice fixed or adaptation?
■ Is the nature of the act tangible or intangible?
■ Is the recipient of the act people or things?
In each factor the key issue is the degree of interaction between the
service provider and the customer.
These questions help us to define the very nature of the service pro-
vision and prevent us from thinking that all services are similar. A num-
ber of matrices provide additional insights into how to map the nature
of the service.
In the service literature, a useful taxonomy has been proposed by
Schmenner (1986), who identified that services could be categorized,
using their degree of labour intensity and level of customization, into
four types called service shop, service factory, mass service and profes-
sional service. This is shown in Figure 3.6.
The Schmenner matrix links the extent of customization with the
level of labour input in the transformation process. As Schmenner
observes, however, a service, although essentially rooted within a par-
ticular quadrant, may wander into other quadrants, consciously or other-
wise. For example, a therapist may ‘batch’ the same types of questions
when dealing with a number of patients. The reason for doing so may
well be good intentioned: namely to ‘speed up’ the healing process.
However, in doing so the therapist is moving from the professional
service quadrant into other areas and may even mimic elements of the
service factory.
Managing the transformation process 109
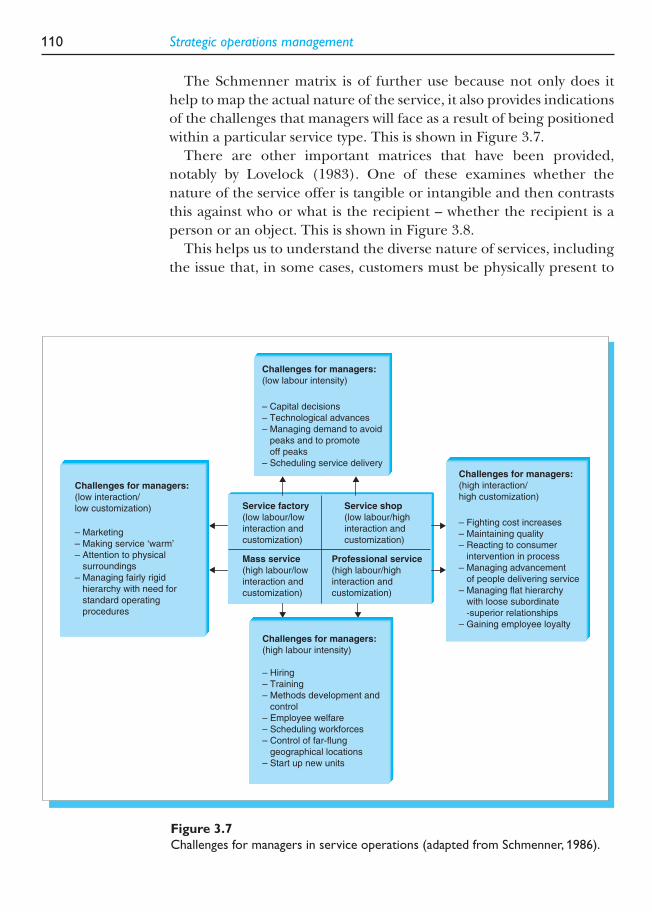
The Schmenner matrix is of further use because not only does it
help to map the actual nature of the service, it also provides indications
of the challenges that managers will face as a result of being positioned
within a particular service type. This is shown in Figure 3.7.
There are other important matrices that have been provided,
notably by Lovelock (1983). One of these examines whether the
nature of the service offer is tangible or intangible and then contrasts
this against who or what is the recipient – whether the recipient is a
person or an object. This is shown in Figure 3.8.
This helps us to understand the diverse nature of services, including
the issue that, in some cases, customers must be physically present to
110 Strategic operations management
Challenges for managers:
(low interaction/
low customization)
– Marketing
– Making service ‘warm’
– Attention to physical
surroundings
– Managing fairly rigid
hierarchy with need for
standard operating
procedures
Challenges for managers:
(high interaction/
high customization)
– Fighting cost increases
– Maintaining quality
– Reacting to consumer
intervention in process
– Managing advancement
of people delivering service
– Managing flat hierarchy
with loose subordinate
-superior relationships
– Gaining employee loyalty
Service factory
(low labour/low
interaction and
customization)
Mass service
(high labour/low
interaction and
customization)
Service shop
(low labour/high
interaction and
customization)
Professional service
(high labour/high
interaction and
customization)
Challenges for managers:
(low labour intensity)
– Capital decisions
– Technological advances
– Managing demand to avoid
peaks and to promote
off peaks
– Scheduling service delivery
Challenges for managers:
(high labour intensity)
– Hiring
– Training
– Methods development and
control
– Employee welfare
– Scheduling workforces
– Control of far-flung
geographical locations
– Start up new units
Figure 3.7
Challenges for managers in service operations (adapted from Schmenner, 1986).

receive services (where they are directed at their bodies or minds), but
need not be present to receive other services (directed at goods or intan-
gible assets). This will have a major impact on service design, especially
the design of service facilities.
Further insight is offered by Lovelock when he states how important
it is to see the dimensions of ‘who does what’ against the number of
sites involved in the service transfer. This is shown in Figure 3.9.
Managing the transformation process 111
WHO OR WHAT IS THE DIRECT RECIPIENT OF THE SERVICE?
PEOPLE THINGSNATURE
OF
SERVICE
TANGIBLE
Services directed at people’sbodies
Health careBeauty salonsExercise clinicsRestaurantsHaircuts
Services directed at goods
Freight transportIndustrial repair andmaintenanceLaundryLandscaping
Services directed at people’sminds
EducationBroadcastingInformation servicesTheatreMuseums
Services directed at intangibleassets
BankingLegal servicesAccountingSecuritiesInsurance
INTANGIBLE
Figure 3.8
Further mapping in
service operations –
the degree of
tangibility and
the nature of the
recipient in the
service (from
Lovelock, 1983).
Single site Multiple site
Bus service
Fast-food chain
Mail delivery
AA/RAC service
Broadcasting
Telephone company
Customer goesto the serviceorganization
Serviceorganizationcomes tothe customer
Customer andorganization interactat arm’s length
Theatre
Hairdressing
Lawn care service
Pest control
Taxi
Credit cardcompany
Figure 3.9
Understanding ‘who
does what’ and the
role of sites in
services.

Summarizing the links between process choice and layout
As we have noted, there are clear links between the basic choice of
process and type of layout. We can summarize this in Figure 3.10.
It is important to note that operations and industries are not forever
tied to one type of process or one type of layout. In the early 1970s, Ted
Levitt (1972) discussed the notion of production-lining service or service
‘industrialization’. He illustrated this concept by discussing the concept
of fast food. The innovation that lay behind the success and tremendous
growth of this industry was the way in which the production and service
of a hot meal was conceived and designed. Before fast food, meals were
produced to order, once the customer had made their choice from the
menu. This meant the restaurant could offer variety, as production only
started once the order had been placed. Variety required a process layout
and restaurants were (and still are) job shops. In the case of fast food,
the meal is produced before the customer enters the restaurant. It is
cooked and wrapped ready for sale on a shelf – all the server has to do is
assemble the order when the customer comes to the counter. This makes
the service time considerably faster than in a conventional restaurant.
Since the hot meal (in McDonald’s case, the hamburger) has a short
shelf-life of approximately 7 minutes, in order to avoid waste the
112 Strategic operations management
Process choice Type of layout
Project Fixed
Job Process
Batch Process/Product (see note 1 below)
Line Product
ContinuousProduct (see note 2 below)Process
Notes:1. The link between batch and the type of layout would depend upon volume and variety – in low-volume/high-variety batch, process layouts would be used; in high-volume/low-variety batch, product layouts would be appropriate.2. Continuous process differs from line due to the fact that a line process can be stopped at a particular stage and the product will be at that stage of production; in continuous process, stopping the process is an exception and is very costly (e.g. shutting down a blast furnace).
Figure 3.10
The link between process choice and layout.

restaurant needs a high volume of customers in order to ensure the stock
is sold quickly. To achieve high volume the product needs to be relatively
low priced and easy to eat anywhere. But also, to avoid the production of
unsold stock, the menu needs to reduced down to as few items as pos-
sible. Hence a fast-food menu typically has a very small number of raw
material items that can be processed in a variety of ways to produce a
range of products – regular hamburger, cheeseburger, bacon and cheese-
burger, etc. By increasing volume and decreasing variety, the fast-food
‘restaurant’ was no longer a job shop, but a line operation based on a
product layout. Hence Levitt’s notion of production-lining service.
However, in some industries, layout is not a matter of choice. This
often applies in those operations in which the customer interacts with
the service provider. The classic example of this is a hotel. Hotel rooms
are cleaned in batches, each worker being allocated ten to fifteen
rooms to service. Ideally, they should be organized on a process or
product basis; in reality, they have a fixed position. The same is true of
theme parks. The layout is fixed, although customers using the rides
are processed in batches.
It is also the case that some operations do not involve one process
type, nor have one layout. This is most obviously the case in those ser-
vice operations which have a back and front office, such as a bank, or a
front-of-house and back-of-house, such as a restaurant. In these opera-
tions it may be that customers are processed in one, typically as a job
shop, whilst the materials and information processing that occurs to
support the front office may be batch or even line production.
In such operations, in the past, it was typically the case that the back-
of-house operation and front-of-house operation were the same process
type. However, many operations have now ‘decoupled’ the two parts of
the operation so that a choice can be made over the best process to use.
For instance, banks continue to process customers in their branches
based on job shop principles and process layout. However, in their back
office, the administration has been production-lined by setting up one
large data processing facility to support a very large number of branches.
Once it is possible to decouple one part of the operation from
another, it then becomes possible to consider outsourcing a part of the
operation. For instance, large hotels engage in two types of food and
beverage operation. They have restaurants, which are job shops, and
banqueting, which is batch production. In some hotels, in recognition
of this, there are two kitchens, one for the restaurant and one for the
banqueting suites, although this results in inefficiencies due to dupli-
cation of equipment and staff. Where there is only one production
kitchen, equipment and work activities designed to cope with one
Managing the transformation process 113

operation often find it difficult to cope with the other – typically, ban-
quet service interrupts and slows down restaurant service. Partly for
this reason, many hotels now outsource the production of banquet
meals to specialist cook-chill suppliers. They also outsource because
the supplier can supply the meals at a lower unit cost than they them-
selves are able to do. This is because the supplier has a process and lay-
out that enables lower cost production and economies of scale.
The strategic importance of process choice
As we noted earlier, the type of process choice determines to a large
extent what the firm can and cannot do. This provides major clues to
the actual nature of the business that the firm is in. This is shown in
Figure 3.11.
One of the dangers for firms in both manufacturing and service set-
tings is that there may be a mismatch between the type of process being
used and the expectations of the customer. In services, for example, we
have noted how the nature of professional services (around a job-type
setting) would mean that one would expect high customization as well
as high labour input. However, the danger is that, for example, lawyers,
114 Strategic operations management
Batch Line
Continuous
process
The firms sells a wide variety ofproducts or designs and there is theperception of customization forcustomers. Order sizes are small or‘one-off’. New products are requiredon an ongoing basis and the firm sellsits capability to potential customers interms of design and innovation.
The firms sells a narrow range ofstandard products, but in high volume.New product introductions will takelonger than in job or projectenvironments because the technologyand plant are dedicated around specificproducts.
Batch can be difficult because of its ‘middle’ groundand is managed initially by mapping productsaccording to their job (low volume) or line (high-volume) characteristics. The plant is then furtherfocused into production cells.
Project Job
Figure 3.11
The link between process choice and marketing strategy (adapted from Brown,
1996).

doctors and other professionals might begin to batch the service
process so that the customization becomes compromised in the name
of gaining economies of scale or effort. This would have dangerous
consequences – a clinical psychologist, for example, might batch cer-
tain questions together in order to speed up the therapy process, but
in doing so may miss the deeper issues that would be expected in a
one-to-one consultant/patient relationship.
Clearly, managing the process transformation is an enormously
important challenge for operations managers in both service and manu-
facturing settings. Success does not come about purely by having the
right technology. Other skills and tacit knowledge also come into play.
We illustrate this with the case of Taco Bell.
Managing the transformation process 115
Case: Taco Bell
In 1999, three out of every four Mexican fast-food meals purchased in the United States were made from onecompany – Taco Bell. However, this market dominance may never have come about unless the company hadnot transformed its operations throughout the 1980s.
In the early 1980s,Taco Bell was typical of its kind. It was essentially a job shop operation. Nearly all foodproduction was carried out on site: foodstuffs were prepared from their raw state; food items such as groundbeef for tacos were cooked for a period of several hours in vats; guacamole and other sauces were made-up;and beans were washed, cleaned and cooked. Once these items were ready for sale, they were then assembledin response to a customer order. This meant that wait time at the cash register was 105 seconds on average,and even slower during peak periods.
This type of operation led to a number of management challenges. Staff had to be scheduled and organized inshifts so that they mainly prepared food items and cleaned the unit during slack periods, whilst they assembledorders and served customers during busy times. It was estimated that the restaurant manager spent an houreach day working on this crew schedule in order to match labour supply as closely as possible to potentialdemand, and thereby meet the company’s labour cost targets. Food cost control was also a priority, whichmeant that a great deal of time and effort went into ensuring no menu item was prepared in too small or toolarge a quantity. But the complexity of this operation lead to quite wide variations in food quality, both withinsingle units and between units in the chain.This was not helped by inconsistency in the quality of raw materials,which were mainly sourced locally.
The emphasis on in-house food production meant that that the ratio of kitchen to dining space was 70:30.Moreover, the main assembly line where food items were made to order ran parallel to the service counter,so that employees on the line were facing away from the customers. At that time,Taco Bell did not have a drive-through window, even though 50 per cent of competitors’ sales were from this source.
Beginning in 1983, the CEO of Taco Bell, John Martin, made a number of major changes to the physical lay-out. The food assembly line was reconfigured to have two shorter lines at right angles to the service counter.This improved product flow and improved customers’ perception of the operation. The introduction of elec-tronic point-of-sale not only improved order taking and cash handling, but also provided improved data onwhich food forecasting could be made. Other changes included adding new menu items, increasing the averagesize of new units from 1600 up to 2000 square feet, adding drive-through windows, and upgrading the decorand uniforms of staff.
However, external pressures meant that Martin also had to adopt a new operations process. By the mid-1980s, the US fast-food market had matured and competition was fierce. Previously performance was judgedon growth, which could be achieved by opening new units. In the mature market-place, market share becamemuch more significant. Labour shortages also meant an increase in labour costs, up by 18 per cent for theindustry, but by 50 per cent for Taco Bell due to its relatively larger, skilled workforce. Whereas chains with

Process choice and competitive factors
As we saw in Chapter 2, Hill (2000) makes the very useful distinction
between ‘order-qualifying’ and ‘order-winning’ criteria for a firm. Briefly
put, order-qualifying criteria are those factors that a company needs in
order to compete at all and order-winning criteria are those factors
that a company needs to achieve in order to win in the market-place.
Hill suggests that order-qualifying/winning criteria can be mapped
onto process choice, as shown in Figure 3.12.
This framework can be a powerful tool for the company in ‘mapping’
how the process choice ties it to competitive factors. It is critically
important to rank, or weight, the importance of these criteria in any
specific case. It is important that firms do not see order qualifiers as
inferior, because, as Hill argues, these can lose orders. A firm cannot
simply ‘skip over’ order-qualifying criteria. For example, a PC pro-
ducer, recognizing that price is an order-winner, cannot skip over
order-qualifying criteria of up-to-date technology, delivery and so on
in order to reduce prices still further.
116 Strategic operations management
burger or chicken concepts could offset this increase by taking advantage of falling food costs,Taco Bell’s foodcost remained at around 30 per cent of sales. So by 1989,Taco Bell was a relatively small player in the marketbeing squeezed by rising costs.
In a series of initiatives, the operation was transformed. K-minus was a project that turned the kitchen intojust a heating and assembly unit. Nearly all food preparation (chopping, slicing and mixing of vegetables andmeat) and cooking was eliminated. Beef, chicken and beans arrived in pre-cooked bags, lettuce was pre-shredded, hard tortillas pre-fried and guacamole delivered in cartridges. This changed the ratio of back-of-houseto front-of-house to 30:70, reduced staffing levels in each unit and increased the operational capacity of eachunit.The SOS (speed of service) initiative was designed to respond to market research that showed customerswanted their food fast. Recipes were adapted and a heated staging area developed so that 60 per cent of themenu items, representing over 80 per cent of sales by volume, were pre-wrapped ready for sale.This reducedcustomer waiting time to 30 seconds, and increased peak hour capacity by over 50 per cent. Finally, TACO(Total Automation of Company Operations) was an IT project designed to computerize in-store operationsand network each unit to headquarters.TACO provided each manager with daily reports on 46 key perform-ance measures, assisted with production and labour scheduling, and aided inventory control.This reduced thetime restaurant managers spent on paperwork by up to 16 hours a week.
These process changes and the investment in technology were also accompanied by changes in humanresource management.The restaurant manager’s job was now very different from what it had been due to K-minus, SOS and TACO. Taco Bell recognized that managers should now focus much more on front-of-houseand on the customer. The management structure within each unit was therefore changed along with jobdescriptions and remuneration packages. Much more pay was performance related, so that top managers couldearn $80 000 a year, a huge increase on previous salary scales. Selection criteria for new restaurant managerswere also adapted to reflect the new style operation.
Between 1988 and 1994, Taco Bell doubled its sales and tripled its profits. Despite this, competitionremained tough. With the right processes in place, Martin could now look to other ways in which to improveoperational performance. So, in the mid-1990s, the focus switched from technology to human resources, withthe growth of team-managed units and the development of the learning organization within Taco.

Concerns with the mapping process
Although the mapping process can be useful, there are some problems
with it. An excellent critique on this is given by Spring and Boaden
(1997). In addition, we would add that it is important not to be too
rigid with the use of this framework, for the following reasons:
■ A firm may produce the same type of product for two markets
under one process choice. The particular needs of each mar-
ket may differ even though the process choice is the same. For
example, one of the authors acted as a management consult-
ant for a firm producing flight simulator units. The two mar-
kets are commercial and military, and the requirements for
the two are entirely different in terms of cost, delivery reli-
ability and added features, even though each simulator prod-
uct would be made under a project process choice. However,
under the process choice mapping model we would expect
the competitive requirements to be the same because they
share the same process choice. But this is not the case.
■ In many environments, order-qualifying and order-winning
criteria are often very linked, to the point where they become
almost indistinguishable. For example, in the UK’s public sec-
tor, price has become less of an order qualifier by itself and has
been subsumed into a wider set of criteria concerned with per-
ceived overall value, where low cost alone does not secure entry
into the market. Hence hospitals will not award contracts on
Managing the transformation process 117
Project Job Batch Line Continuousprocess
Order-winningcriteria
Deliveryqualitydesigncapability
Price PriceDeliveryqualitydesigncapability
Qualifyingcriteria
Price Price Deliveryqualitydesigncapability
Deliveryqualitydesigncapability
Note: There are many more order-winning and qualifying criteria than listed – theabove list is indicative only. Also, it is important to weight the criteria for specificapplications or industries.
⇔
⇔
Figure 3.12
Linking process
choice and order-
qualifying/order-
winning criteria.

price alone – perceived value and reputation of the supplier
are key requirements. Similarly, the ‘lowest cost contract award’
in public sector activities such as road-building and main-
tenance no longer view cost as a stand-alone factor. Rather,
price is viewed as part of overall perceived value and is one of
many important factors on the competitive menu.
■ Hill rightly warns that what were once order-winning criteria
may, over time, become order-qualifying. This may be espe-
cially so where competitors copy the technology or the firm
loses control of the differentiating feature. This is where
using weightings or scoring the criteria over time is very
important.
■ One of the key questions in this model is: ‘How do products
win orders in the market?’ Therein lies another problem –
products do not win orders, firms do, and they do so in a num-
ber of ways, including intangible but powerful factors such as
reputation, perceived overall value for money and other sub-
jective, but important, elements to the buying decision.
■ The majority of manufacturing in the West is made under
batch production and the model does not seem to accommo-
date this ‘middle’ path too well.
The model is still important and can clarify what are often difficult
strategic decisions, but perhaps a better approach would be to add pre-
qualifying criteria, as shown in Figure 3.13.
118 Strategic operations management
Project Job Line Continuousprocess
Order-winningcriteria
Deliveryqualitydesigncapability
Price Price
Qualifyingcriteria
Price
Deliveryqualitydesigncapability
Price Deliveryqualitydesigncapability
Deliveryqualitydesigncapability
Pre-qualifyingcriteria
Experience, reputation and otherintangible factors are key here.The importance and strength of thebuyer–supplier relationship over timemay also be a deciding factor.
Batch
⇔
⇔
Figure 3.13
The importance of
pre-qualifying
criteria.
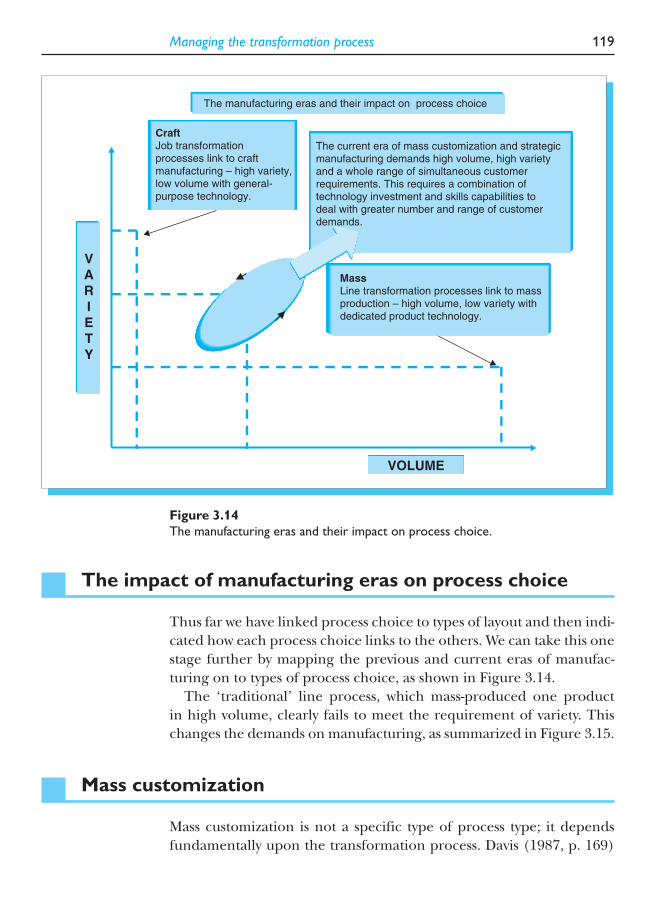
The impact of manufacturing eras on process choice
Thus far we have linked process choice to types of layout and then indi-
cated how each process choice links to the others. We can take this one
stage further by mapping the previous and current eras of manufac-
turing on to types of process choice, as shown in Figure 3.14.
The ‘traditional’ line process, which mass-produced one product
in high volume, clearly fails to meet the requirement of variety. This
changes the demands on manufacturing, as summarized in Figure 3.15.
Mass customization
Mass customization is not a specific type of process type; it depends
fundamentally upon the transformation process. Davis (1987, p. 169)
Managing the transformation process 119
CraftJob transformationprocesses link to craftmanufacturing – high variety,low volume with general-purpose technology.
MassLine transformation processes link to massproduction – high volume, low variety withdedicated product technology.
The current era of mass customization and strategicmanufacturing demands high volume, high varietyand a whole range of simultaneous customerrequirements. This requires a combination oftechnology investment and skills capabilities todeal with greater number and range of customerdemands.
The manufacturing eras and their impact on process choice
VOLUME
V
A
R
I
E
T
Y
Figure 3.14
The manufacturing eras and their impact on process choice.

coined the term mass customization and stated:
… mass customization of markets means that the same large number
of customers can be reached as in mass markets of the industrial
economy, and simultaneously they can be treated individually as in
customized markets of pre-industrial economies.
In essence, this present era of mass customization combines the best of
the craft era, where products were individualized but at high cost, with
the best of mass production, where products were affordable but highly
standardized (Fralix, 2001).
Mass customization firms comprise a diverse range of products and
services, and cannot be identified as a homogeneous group. Lampel
and Mintzberg (1996) illustrate the range of offers from ‘pure stand-
ardization’ to ‘pure customization’ as in Figure 3.16.
Customer involvement in the production process is argued to be
one of the defining characteristic of mass customization. Mass cus-
tomization overcomes what has typically been seen as a trade-off
between volume and variety. It achieves this in a number of ways, such
as flexible manufacturing and agile production, which we discuss
below. MacCarthey et al. (2003) suggest that there are actually five
basic ways in which mass customization can be achieved, derived
120 Strategic operations management
Period
production
Production
task
Volume
level
Finished
product
made
Range
1950–1970s(Line processes)
Narrow
Wide To meet specific customerincluding cost, delivery,range and flexibility
Very high
As required –volumeand variety
To stock(just in case)
For customerrequirementsonly (just in time)
To achieve supposedeconomies of scaleby large productionruns of limited ranges
1980s on(Hybrid systems –FMS)
Figure 3.15
The changing task of manufacturing management.
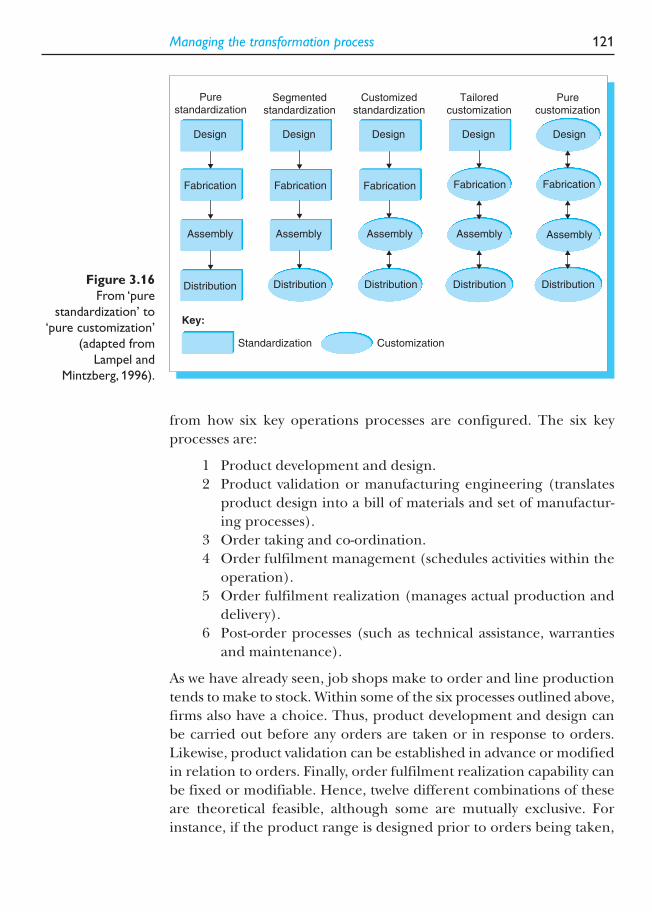
from how six key operations processes are configured. The six key
processes are:
1 Product development and design.
2 Product validation or manufacturing engineering (translates
product design into a bill of materials and set of manufactur-
ing processes).
3 Order taking and co-ordination.
4 Order fulfilment management (schedules activities within the
operation).
5 Order fulfilment realization (manages actual production and
delivery).
6 Post-order processes (such as technical assistance, warranties
and maintenance).
As we have already seen, job shops make to order and line production
tends to make to stock. Within some of the six processes outlined above,
firms also have a choice. Thus, product development and design can
be carried out before any orders are taken or in response to orders.
Likewise, product validation can be established in advance or modified
in relation to orders. Finally, order fulfilment realization capability can
be fixed or modifiable. Hence, twelve different combinations of these
are theoretical feasible, although some are mutually exclusive. For
instance, if the product range is designed prior to orders being taken,
Managing the transformation process 121
Key:
Fabrication
Design
Fabrication
Assembly
Design
Fabrication
Design
Distribution
Assembly
Distribution
Fabrication
Assembly
Distribution
Design
Fabrication
Assembly
Distribution
Design
Assembly
Distribution
Standardization Customization
Purestandardization
Segmentedstandardization
Customizedstandardization
Tailoredcustomization
Purecustomization
Figure 3.16
From ‘pure
standardization’ to
‘pure customization’
(adapted from
Lampel and
Mintzberg, 1996).

it is not necessary to have modifiable product validation nor to have
flexible order fulfilment realization.
Pine (1992) argues that mass production created economies of
scale, whilst mass customization is based on economies of scope. So far,
the approaches discussed above, such as JIT, achieve the efficiencies of
mass production (volume) whilst accommodating a wide product range.
But Pine (1992) goes on to suggest that ‘the best method for achieving
mass customization is by creating modular components that can be
configured into a wide variety of end products and services’. Such stand-
ardization of parts not only reduces production costs and increases
customizable output, it also reduces new product development time
and accommodates short life cycles. Take-home pizza delivery has used
this approach for years. The typical menu offers a range of standard
pizzas using specific ingredients, but these can be customized by the
consumer, who can request any one or more of these ingredients to be
added to any one of the standard pizzas. So, from a range of, say, ten
pizzas and less than a hundred ingredients, literally thousands of dif-
ferent pizzas can be produced. Other examples of this approach
include house paint mixed to customer specification at point-of-sale,
Black & Decker power tools, Wendy’s hamburger chain, Lutron
Electronics lighting equipment and Komatsu heavy equipment.
Pine (1992), building on work by Abernathy and Utterbuck (1978)
and Ulrich and Tung (1991), outlines six kinds of modularity. They
are not mutually exclusive and may be combined together within one
operation. The six forms are:
1 Component-sharing modularity. This refers to the same compon-
ent being used in multiple products, thereby reducing inven-
tory costs and simplifying production. Forte Posthouse Hotels
have recently redesigned the menus in their different restaur-
ant concepts, so that the product range continues to offer a
wide range of dishes, but the number of ingredients needed to
make these has been reduced from over 4000 to around 1000.
2 Component-swapping modularity. In this instance, as opposed to
different products sharing the same components (as above),
the same products have different components in order to dif-
ferentiate or customize them from each other. The classic
example of this is Swatch, who produces a range of standard
watches, but with a wide range of colours and faces.
3 Cut-to-fit modularity. This modularity is based around the ability
to adapt or vary a component to individual needs and wants,
within preset or practical limits. Pine (1992) exemplifies this
122 Strategic operations management

through Custom Cut Technologies, who make clothing to fit;
National Bicycle Industrial Co., who can produce over 11 million
variations on 18 models; Peerless Saw, who use lasers to vary
the dimensions of any saw.
4 Mix modularity. This modularity is based on the concept of a
recipe, so that components, when mixed together, become
something different. This can be applied to paints, fertilizer,
restaurant menu items, breakfast cereals and any other process
in which ingredients are mixed.
5 Bus modularity. This is based around the concept of a standard
structure to which different components can be added. The
obvious example of this is the lighting track, to which different
light fittings can be attached. The term ‘bus’ derives from the
electronics industry, which uses this as the base from which
computers and other electronic devices are built up. This type
of modularity allows ‘variations in the type, number and loca-
tion of modules that can plug into the product’.
6 Sectional modularity. This type of modularity is based on differ-
ent types of components fitting together in any number of pos-
sible ways through the use of standard interfaces. Lego building
blocks are the classic example of this. Whilst this achieves the
greatest degree of variety and customization, it is the most dif-
ficult to achieve. Few products are as simple as Lego blocks (or
as precisely dimensioned – total interchangeability requires very
high precision manufacturing of the basic ‘building blocks’),
but examples include: Bally Engineered Structures (who use a
standard panel to produce many different forms of refrigeration
unit); Agfa Corporation’s system for handling all forms and sizes
of information; and American Express (who capture each trans-
action so that they may offer personalized products and services
to match the buying needs and buying power of their customers).
Gilmore and Pine (1997) mention ‘four faces of customization’: col-
laborative (designers working closely with customers); adaptive (where
standard products are changed by customers during use); cosmetic
(where packaging of standard products is unique for each customer);
and transparent (where products are modified to specific individual
needs). By contrast, Lampel and Mintzberg (1996) discuss a con-
tinuum of various mass customization strategies, including different
configurations of processes (from standard to customized), product
(from commodities to unique) and the nature of the customer trans-
action process (from generic to personalized).
Managing the transformation process 123

Da Silveira et al. (2001) provide a useful summary of perceived
requirements for mass customization. These are:
1 Customer demand for variety and customization must exist.
2 Market conditions must be appropriate.
3 The value chain should be ready.
4 Technology must be available.
5 Products should be customizable.
6 Knowledge must be shared.
Undoubtedly, mass customization presents firms with a number of
challenges. Zipkin (2001) categorizes three types of challenge:
1 Elicitation. The requirement of an elaborate system for eliciting
customers needs and wants. Zipkin argues that capturing cus-
tomer input into the production process can prove difficult.
2 Process flexibility. The requirement of highly flexible production
technology. Zipkin argues that developing such technologies
can be expensive and time-consuming.
3 Logistics. The requirement of a strong direct-to-customer logistics
system. Zipkin argues that processing and tracking individual
customer orders through the supply chain presents a variety of
challenges.
124 Strategic operations management
Case: Mass customization
At a factory in Wichita, Kansas, run by the Cessna aircraft company, a gleaming new Citation Excel executivejet rolls off the production line roughly every 3 days. While they may look almost identical, virtually every aircraft, which sell for an average of about $10 million and are assembled from about 30 000 parts, is different,depending on the requirements of the customer.
The production line at Cessna – which is part of the Textron industrial conglomerate – is a good exampleof the trend in much of industry towards mass customization.This term was introduced in the early 1990s todescribe how manufacturers can satisfy customer demand for product variants by introducing them into traditional factories. But they don’t sacrifice manufacturing efficiencies, the absence of which can push up costsand make the company uncompetitive.
According to a seminal paper (Pine et al., 1993) in the Harvard Business Review, mass customization requiresa dynamic and flexible organization.The authors say ‘the combination of how and when they (different pro-duction units) make a product or provide a service is constantly changing in response to what each customerwants and needs’. Since this paper was written, more manufacturers have realized they need to introduce vari-ation into production as a way of keeping customers happy – but without returning to employing craftsmen tofashion items in single batches and at astronomic cost.
Cessna has introduced principles of lean manufacturing to speed up production and worker efficiency,while at the same time allowing for a large degree of product variation. Last year Cessna made 81 Excel aircraft, one of the company’s best-selling models. This is a five-fold improvement on 1998, since when thenumber of direct assembly workers has risen two-and-a-half times. In other words, worker productivity overthis period has doubled.

Flexible manufacturing
Flexible manufacturing is an element of mass customization and the
move towards flexible manufacturing was one of the major competitive
advantages of Japanese car manufacturing, subsequently appearing in
Western manufacturing. Segments of the car market are fragmenting
as customer demands and expectations force firms to provide a wide
variety of models. So whereas, at one time, a large producer could have
Managing the transformation process 125
Behind the improvement has been a number of changes to the processes on the assembly line involvingextra worker training and a reclassification of the 1000 or so individual assembly jobs that it takes to fit theparts together on an individual aircraft. The result is that production variation is catered for by substituting dif-ferent parts and sub-assembly routines within a mass-production environment. According to Garry Hay,Cessna’s Chief Executive, the company’s ability to provide a high level of customization without overly pushingup costs is a key factor behind the company’s good profits record and its likely increase in sales from $2.8 bnlast year to $3.1 bn this year. This is in spite of a cooling of the world economic climate.
Also keen on mass customization is FAG Kugelfischer, a German manufacturer with sales last year of Euros2.2 bn and which is Europe’s second biggest maker of rolling bearings (devices essential to virtually all kinds ofrotary motion) after SKF of Sweden. Uwe Loos, FAG’s Chief Executive, suggests that how well the companycan move in the direction of customized bearings that suit individual tastes will be a key determinant of futureearnings growth.
Mr Loos says: ‘In the bearings industry globally, 70 per cent of the sales come from standard bearings andjust 30 per cent from special or customized bearings. At FAG, the ratio is closer to the other way round – 30per cent standard and 70 per cent specials – and I want to move the ratio even further, to about 20:80, in thenext few years.’
A reason for this goal is that, frequently, the profit margins on special, custom-made bearings are higher than for conventional standard bearings – a factor of their higher price. While the bearings churned out intheir hundreds of thousands for car wheels might sell for tens of dollars, a high-tech bearing for a jet enginemight cost $15 000.
The interest in mass customization can be seen in FAG’s main German ball-bearings plant in Schweinfurt,near Wurzburg. Here, 270 people work using a high level of automated plant to turn out some 13 000 bearingsa day, weighing twenty-five tonnes.While the casual observer might imagine the bearings were nearly all thesame, in fact each day’s output can be divided into 50 to 60 types.
The main components for each bearing – the inner and outer rings, balls and cage to hold the balls in place –are shipped in the correct quantities and dimensions to separate units or cells charged with manufacturingindividual product types. As much of the detailed assembly (such as inserting balls inside a pair of inner andouter rings) is left to machinery, it is important to make the machines easy to re-programme to increase theirflexibility. That, in turn, allows smaller production runs and a greater degree of product variance withoutunacceptable increases in costs.
Jens Krohn, FAG manager in charge of the ball-bearings plant, says: ‘Increasingly we are trying to reduce the set-up times for the assembly machines, so we can change production more easily in tune with thedemands of the market.The goal is to reduce set-up times by 10 per cent a year. In some cases, we can altermachinery (to make different kinds of products) in about 15 minutes when a few years ago it might have taken2 to 3 hours.’
This kind of change allows it to be more cost-effective to make products in relatively small batches, while itused to be uneconomic to do so.
Source: Mass customization: make every one different. Financial Times, 21 May 2002.

produced 1 million of one model over its product lifetime, by the year
2000 it was rare to exceed 250 000 of a particular model. In consequence,
processes that are structured around old-fashioned ideas of economies
of scale and inflexible line processes must change to more ‘customer-
driven’ processes, including flexible manufacturing systems. We should
not be overly critical of past approaches around line processes; they were
state of the art 100 years ago and simply no longer serve the current
market requirements. Line processes (mass production) were entirely
appropriate for past market requirements. As Industry Week points out:
In the early days of the automotive industry, Henry Ford reportedly was
able to produce a Model T Ford in less than 56 hours – from the
conversion of iron ore into steel and through final assembly operations.
But things have changed dramatically since then (Industry Week, 8 June
1998):
But when a manufacturing organization bases its competitive strategy
on offering customers greater product variety, that elevates the level of
product and process complexity considerably. … Supporting an endless
flow of new products can trigger a chain of effects inside the
organization that can burden it to the breaking point.
This is not to say that flexible production leads to a proliferation of
complexity in terms of products: the trick is to offer the market ‘appar-
ent variety’ while reducing it in real terms at the point of operation.
This is evident in a reduction in the amount of genuine variation of
products offered by manufacturing plants.
This does not mean that there is a return to mass manufacturing
with its narrow, dedicated lines. Instead, production has focused on
developments around the batch area – creating solutions in which
flexible manufacturing systems (FMS) and group technology are
employed. FMS and group technology are different approaches, or
‘step changes’ – not just modifications of ‘traditional’ batch manufac-
ture. They are major changes whereby both variety and volume may be
achieved. The mass production system has had to change to suit a
volatile, changing environment with new competitors coming from all
over the globe. Where mass production’s process ‘strategy’ emphas-
ized efficiency in production, modern world-class manufacturing firms
emphasize product quality, differentiation and any other factor per-
ceived to be important for customers.
126 Strategic operations management

Flexible manufacturing and its impact on competitive strategy
Flexible manufacturing can be applied to high- or low-volume batch
processes. It is normally applied by installing flexible manufacturing
systems (FMS) – groups of machines and other equipment that would
usually include the following:
■ A number of workstations, such as computer numerically con-
trolled machines, each performing a wide range of operations.
■ A transport system that will move material from one machine
to another; loading and unloading stations where completed
or partially completed components will be housed and worked
upon.
■ A comprehensive computer control system that will co-ordinate
all the activities.
The advantages that FMS can provide go beyond the flexibility of the
hardware. The real advantage comes with the plant-specific know-how
and enhanced skills that accompany FMS. Consequently, investment in
technologies such as computer-integrated manufacture (CIM) and
advanced manufacturing technology (AMT) is seen as strategically
important because it can provide competitive options for the firm (Lei
et al., 1996):
In most cases, AMT investments are irreversible because they are
highly specialized, durable, and dependent on the firm’s specific
operating routines, information flows and knowledge surrounding
both product design and process technology. However, the strategic
options allowed by AMT help the firm recoup its investment. … The
fragmentation of markets, the development of new market segments
or niches, as well as faster design … all contribute to the need for
strategic flexibility. Thus, flexible manufacturing technologies provide
a strategic real option … in which high levels of economies of scope
and a ‘design for response’ capability position the firm to enter a
broader range of different markets at its own discretion.
This learning effect is shown in Motorola’s AMT investments in the
flexible manufacture of components for cellular telephones, which are
now being used for other electronic component applications. This is
typical of the sort of strategic opportunities that technology investment
can present to the firm. As a result, AMT investments can enable the
Managing the transformation process 127

firm to provide a range of products or components based on group
technology or shared design characteristics. This in turn provides
strategic options based on economies of scope, rather than economies
of scale.
Moreover, investment in FMS and other advanced manufacturing tech-
nologies provides strategic scope for the firm (Honeycutt et al., 1993):
Flexible manufacturers are in a rather interesting position in the
market-place. When non-flexible manufacturing firms are asked, ‘What
business are you in?’, they list the products they produce. When flexible
manufacturers are asked the same question, they respond, ‘Whatever
business you want us to be in!’ In a rapidly changing market-place, the
ability to almost instantly change what the firm can offer its customers
can be a formidable competitive weapon.
This has to be treated with some caution: it is clearly not realistic for
a firm to claim that it is any business that any customer wants. Toyota
might be able to produce many variations around a single platform but
the auto giant could not respond to a customer who asked for, say, an
aeroplane or a ship, because Toyota’s technology remains focused on
car production. So the term ‘flexible’ has to be seen within product-
specific boundaries. (At a corporate group level, however, some tech-
nology transfer may enable sister divisions to excel at different
products or services. The Toyota group, for example, has a division
that makes pre-fabricated houses; Saab makes aircraft as well as cars,
and almost every large firm provides some sort of financial services.)
FMS allows the firm to compete on economies of scope rather than
economies of scale. Because technologies are more flexible, allowing
numerous product variations to be made, the overall volume achieved
can be almost as great as manufacturing large volumes of standardized
products. This means that the basis of competition moves from a
strategy of low-priced, commodity products to an emphasis on low-cost
special options and customized products.
This profoundly changes the rules of the game. As we saw in Chapter
2, Porter (1980) had stated in Competitive Strategy that in order to be
profitable, firms were faced with two options: either low cost or differen-
tiation. This reflected industrial economic theory at the time, but now
firms have to compete on both fronts – amongst a range of other cus-
tomer requirements. Due to the nature of competition, what were
once differentiated features, able to provide sustained competitive
advantage (for some time at least), have become the ‘level playing
field’ (basic expectation) in many markets. This is because technology
128 Strategic operations management

is often easy to copy. The computer industry exemplifies this. For years,
Apple was able to charge premium prices for its ‘differentiated’ prod-
ucts. Once others emulated the technology, however, price became
critical and the differentiating software became available on all PCs. So
neither low cost nor differentiation is sufficient by itself. Instead, a
range of new competitive requirements including speed, flexibility and
customization, have emerged as the key competitive drivers. Flexibility
has become a central capability of world-class manufacturers.
Flexibility has spilled over to customer response times. In the past, in
addition to the old ‘any colour so long as it’s black’ mentality in manu-
facturer’s (mass production marketing to an immature market), there
was also the mentality of ‘you’ll have the product when we’re ready’
(mass production lack of customer orientation). In modern markets,
this has had to change, because if the firm does not respond quickly, it
must be assumed that another will. Computer-integrated manufacture
(CIM), originally a matter of information and control systems linking
items of production technology, has grown to embrace electronic
data interchange and other information technology tools, including
intranets, resulting in the ability to provide greater speed of customer
response. Fortune magazine (30 March 1998) described how Ford has
made great use of intranet:
Ford Motor’s intranet is an example of a bigtime manufacturer getting
the technology right. The intranet connects about 120 000 of Ford’s
computers around the world to Web sites containing proprietary
company information such as market research, rankings of suppliers’
parts and analyses of competitors’ components.The network has
enabled Ford to bring new models into full production in 24 months
compared with 36 months before.The intranet is expected to save the
company billions of dollars during the next few years. Ford plans to use
its intranet to move closer to manufacturing on demand, a process that
involves co-ordination of delivery and assembly of thousands of
components.The company plans to manufacture most of its vehicles on
a demand basis by 1999, requiring linking of its 15 000 dealers around
the world via its intranet.
Fortune also mentioned how Ford has had to speed up its customer
response and provide greater choice for customers simultaneously:
… this is all part of a sweeping manufacturing re-engineering process
that Ford has undergone in the past couple of years.The results are
clear: in 1996 … it took more than 50 days to get the Mustang of your
Managing the transformation process 129

choice delivered from the plant to the dealer; today you’ll get that
Mustang in 15 days. Ford’s goal is to manufacture the majority of its
vehicles on a demand basis by the end of 1999, with delivery in less than
2 weeks after the order. This would save billions of dollars in current
inventory and fixed costs.
The actual arrangement of production cells provides insight into how
manufacturing becomes flexible. Flexible manufacturing systems are
typically arranged in small, U-shaped cells, as illustrated in Figure 3.17.
The reasons for this shape include:
■ reduction of space;
■ shorter workflow paths;
■ increased teamwork and better communication and motivation
brought about by seeing a completed product in the cell.
Workers are arranged into teams to operate the cells. A single cell
can manufacture, inspect and package finished products or components.
Every cell is responsible for the quality of its products and each worker
130 Strategic operations management
1. In-line (typically in a ‘U’-shape): where work is transferred from one station to the next in a defined sequence
2. Loop: where parts move around the loop but can be offloaded at any point:
‘Offload’points
3. A ladder: where the loop approach is modified to have ‘cells within cells’, where components can move into a particular cell from the overall flow of the overall ‘loop’
Each ‘mini-cell’ has its own process – components/materials move into each cellas required
Figure 3.17
Layout of a typical
U-line or cell
(adapted from
Brown, 1996).

will normally be able to perform a range of tasks. Once again, process
choice is the key insight in cell arrangements; under line processes,
introducing variety or changing the product meant stopping the entire
assembly line. Such breakdowns and shortages are very costly overheads
for mass-producers, intent on low-cost production. To compensate for
this, they have to carry large stocks of parts and spares, ‘just-in-case’.
We shall discuss the critical importance of just-in-time – which is linked
to cell manufacturing – in Chapter 5, but we can say here that stocks of
partly finished products also tend to be high under traditional line
processes. Components that have undergone part of the production
process often sit idle, waiting for the next stage. This is a major source
of waste. Large amounts of inventories, some sitting in large ware-
houses, are a feature of mass production. By contrast, flexible manu-
facturing, via U-shape cells, and low inventory levels go hand in hand.
Agile production
Like mass customization, agile production is not a particular process
choice but it is wholly dependent upon the transformation process for
agility to become a reality within the offer to customers. It is clear that
we are in an era that has evolved from mass production offering ‘any
colour of car as long as it is black’ to that of customer-centric offerings,
as indicated by Ridderstrale and Nordstrom (2000): ‘Let us tell you
what all customers want. Any customer, in any industry, in any market
wants stuff that is both cheaper and better, and they want it yesterday.’
This comes under the umbrella of mass customization and agile pro-
duction. There is some confusion about both of these terms, as Brown
and Bessant (2003, p. 708) explain:
… there seems to be no firm agreement as to the definitions for, and
major differences between, the paradigms of mass customization and
agile manufacturing. For example, Feitzinger and Lee (1997) in their
discussion on mass customization also include ‘Agile Supply Networks’
as a necessary factor. In addition, Da Silveira et al. (2001) mention agile
manufacturing as a feature within their summary on the literature on
mass customization. We suggest that although it might be important to
understand both, we add that agile manufacturing and mass customization
are not mutually exclusive paradigms. Instead, we argue that mass
customization is best viewed as a powerful example of a firm’s ability
to be agile.
Managing the transformation process 131

Bessant et al. (2001, p. 31) offer the following definition of agility:
Agility in manufacturing involves being able to respond quickly and
effectively to the current configuration of market demand, and also to
be proactive in developing and retaining markets in the face of extensive
competitive forces.
Gunasekaran and Yusuf (2002, p. 1357) add:
Agile manufacturing can be said to be a relatively new, post-mass-
production concept for the creation and distribution of goods and
services. It is the ability to thrive in a competitive environment of
continuous and unanticipated change and to respond quickly to rapidly
changing markets driven by customer-based valuing of products and
services. … It includes rapid product realization, highly flexible
manufacturing, and distributed enterprise integration. … Technology
alone does not make an agile enterprise. Companies should find the
right combination of strategies, culture, business practices, and
technology that are necessary to make it agile, taking into account the
market characteristics.
Bessant et al. (2001) offer an emerging model of agile manufacturing
capabilities, consisting of four key interlinked parameters. The four
major dimensions of the reference model are:
1 Agile strategy – involving the processes for understanding the
firm’s situation within its sector, committing to agile strategy,
aligning it to a fast-moving market, and communicating and
deploying it effectively.
2 Agile processes – the provision of the actual facilities and processes
to allow agile functioning of the organization.
3 Agile linkages – intensively working with and learning from
others outside the company, especially customers and suppliers.
4 Agile people – developing a flexible and multi-skilled workforce,
creating a culture that allows initiative, creativity and support-
iveness to thrive throughout the organization.
Figure 3.18 shows the reference model for agile manufacturing practices.
Further insights are provided by understanding the configurations
and dimensions of agility and some of the theoretical underpinnings.
Figure 3.19 shows the dimensions of agility.
132 Strategic operations management

Of course, there is considerable overlap between mass customiza-
tion and agile practices, and one will feed the other. It is best, there-
fore, not to see these paradigms as conflicting and competing
approaches to ‘best practice’, but rather as complementary sets of skills
and abilities that need to be in place for today’s highly competitive
and demanding conditions.
Putting it all together
There are no hidden secrets to running successful transformation
processes in either manufacturing or service settings. There are, of
course, many companies that will fall into the trap of purchasing
‘instant solutions’ via the latest technological offerings. However, these
can, at best, mask what are fundamental mistakes in understanding the
basics of the transformation processes within organizations. The fol-
lowing, although focused on manufacturing plants, has much that can
be applied to service settings as well.
Managing the transformation process 133
Agile
strategy
Agile
processes
Agile
linkages
Agile
people
II I
IIIIV
Ia
Wide-deep
Scanning
Strategic
Commitment
Full
Deployment
Agile
Metrics
Ib
Ic
Flexible
FacilitiesFast New
Product
Acquisition
Rapid
Problem
Solving
Rich
Information
Systems
IIa
IIb
IIc
IId
IIIa
IIIb
IIIc
IIId
Extensive
Bench-
marking
Full
Customer
Insight
Aligned
SuppliersPerforming
Partnerships
IVaIVb
IVc
IVd
Adaptable
Structure
Multi-
skilled
People
Able
Decision-
making
Continuous
Learning
Id
Figure 3.18
A reference model
for agile
manufacturing
practices (from
Bessant et al., 2001).

134 Strategic operations management
AgilityProactive and reactive
flexibility
What? When? How ? Where? Who?
• Variety
• Customization
• Volume
• Timing
• Speed
• Seasonality
• Full service
• ‘Badging’
• Value
chain
positioning
• Local/
global reach
• In-customer
site
• Integrated provision
• Networks and
value chains
• Clusters
Different configurations based around questions of:
Relevant theoretical approaches include
Various tools and techniques can be drawn upon to help achieve these configurations –
e.g. flexible technologies, ICT tools, cellular layouts, networks, etc.
Mass
customization
Project-based
manufacturing
Flexible
specialization
Time-based
competition
Time
compression
Just-in-time
Global value
chains
Flexible
specialization
Knowledge-
based
competition
Location and
logistics
Virtual
organizations
and networks
Boundary-less
firms
Clusters and
networking
Flexible
specialization
Boundary-less firms
Markets and
hierarchies
Figure 3.19
The dimensions of agility (adapted from Brown and Bessant, 2003).
Case: How Nissan laps Detroit – its manufacturing flexibility makes fora huge advantage over the Big Three
Jonathan Gates slaps a wide slab of tan-coloured, hard foam rubber on his workbench. He fastens a numberedtag in one corner and some black foam insulation at the edges. As soon as he puts a number on the piece offoam, which will become the top of a dashboard for a Nissan Quest minivan, the vehicle has an identity. All ofthe parts for a big chunk of the minivan’s interior, decked out with the customer’s choice of colours, fabricsand options, will come together in the next 42 minutes.
Gates and his co-workers fill a crucial role at Nissan Motor Co.’s new Canton (MO) assembly plant: almosteverything a driver touches inside a new Quest, Titan pickup or Armada sport-utility vehicle is put together ina single module, starting at Gates’s workbench. ‘This is the most important job,’ he says. And yet, amazingly,Gates doesn’t even work for Nissan. He works for Lextron/Visteon Automotive Systems, a parts supplier thatalso builds the centre console between the front seats and a sub-assembly of the car’s front end. The finishedmodules pass over a wall to be bolted into a car or truck body rolling down the assembly line. Lextron/Visteondoes the work faster than Nissan could and pays $3 an hour less than the carmaker pays assembly workers.Nissan is using a similar strategy for its vehicle frames, seats, electrical systems and completed doors.
It’s a level of efficiency that Detroit auto makers are only beginning to attempt. Along with other features inNissan’s 8-month-old, $1.4 billion factory, the wholesale integration of outside suppliers is another reason why

Managing the transformation process 135
General Motors, Ford and Chrysler are still playing catch-up with Japanese car manufacturers. The Big Three havemade great strides in productivity in recent years: General Motors Corp.’s best plants now actually beat Toyota’sfactories. But overall, every time Detroit gets close, the competition seems to get a little better.‘The Japanese arecontinually improving,’ says Michael Robinet,Vice-President of CSM Worldwide, an industry consultant.
Nissan has been the best example of that in North America for years. The Canton plant was designed with thesame flexibility, shopfloor smarts and management-dominated work rules that made Nissan’s 20-year-old plant inSmyrna,TN,the most productive factory in North America year after year,according to Harbour & Associates.TheSmyrna plant builds a car in just under 16 labour hours – six fewer than the average Honda or Toyota plant,eight fewer than GM and ten fewer than Ford. Its profit per vehicle of $2069 is the best in North America.
The Canton plant, which opened in May, will almost certainly top that. Nissan’s secret? Sure, its plants usecheaper, non-union labour. Besides lower wages, the Smyrna workers get about $3 an hour less in benefits thanBig Three assemblers represented by the United Auto Workers.But there’s more to it.Outsourcing offers hugesavings, whereas the Big Three must negotiate the outsourcing of sub-assembly work with the union. AndNissan’s plants are far more flexible in adjusting to market twists and turns. Canton can send a minivan, pickuptruck and sport-utility vehicle down the same assembly line, one after the other, without interruption.
Manoeuvring room
The payoff: Nissan plans to build an impressive five different models in the Canton plant. And, like Toyota andHonda, Nissan will have more financial room to manoeuvre as it pushes aggressively into segments like pick-ups and SUVs. That is already putting pressure on Detroit’s few remaining areas of dominance. When itlaunched the new Titan pickup this November, Nissan set the price at $22 000, undercutting the Ford F-150 by at least $2000 while still maintaining a healthy profit margin.
At first glance, a Nissan factory does not look much different than one you would see in Detroit or St Louis.But talk to the workers and it soon becomes clear how relentlessly the company squeezes mere seconds out of the assembly process. ‘There’s no silver bullet,’ says Emil E. Hassan, Nissan’s Senior Vice-President ofManufacturing.‘It’s really just following up every day with improvements.’
On the Smyrna passenger-car line, for instance, a worker stands on a moving platform, called a lineside limo, thatinches along the body of an Xterra SUV.The limo carries all the tools and parts he needs.The assembler grabs aseat belt from a bin next to him,bolts it in, then moves along and installs the rear struts – all without having to makewhat used to be a twenty-foot walk back and forth, three times per car. Nissan started installing lineside limos13 years ago at the suggestion of a line worker; GM and other auto makers also use these limos, but not asextensively. ‘We don’t have to do a lot of walking,’ says Smyrna Vice-President of Manufacturing Gregory Daniels.
Still, there are some big differences between domestic and foreign plants in the USA. The United AutoWorkers is slowly allowing more outsourcing. But the UAW wants to outsource work only to union-friendlysuppliers. And even then it has to be negotiated. Nissan, meanwhile, has free rein to outsource jobs.Two ofSmyrna’s vehicles – the Maxima and Altima sedans – were engineered to be built using modules built by sup-pliers. Every vehicle built in Canton was designed that way. All together, buying modules saves 15–30 per centon the total cost of that section of the car, according to the Center for Automotive Research (CAR) in AnnArbor, MI. And the Big Three? GM is the most ‘modular’ of the domestic manufacturers, but only a few of itsplants have been designed to build cars using many big modules.
Making headway
One of the biggest advantages the Japanese have is that they can keep their plants busy pretty much no matter howthe market shifts. In Nissan’s case, if demand for the Titan surges it could cut production of, say, slower-movingAltima sedans.That means its workers are rarely idle and the company doesn’t need rebates to keep its plants busy.This flexibility means that Nissan,Toyota and Honda all run their plants at 100 per cent capacity or higher, onceovertime is figured in. GM,Ford and Chrysler,on the other hand,use about 85 per cent.‘The key to making moneyin this business is running plants at 100 per cent capacity,’ says Sean McAlinden, Chief Economist with CAR.
Toyota is probably the most flexible auto maker in North America, according to Prudential Securities Inc.,with five of its seven North American assembly lines building more than one vehicle. When Canton startsbuilding the Altima, three of Nissan’s four lines will be fully flexible.What that means on the factory floor isthat Canton’s body shop can weld any of four vehicles – two SUVs, a pickup and a minivan – on the same line.Robotic arms can be quickly programmed to weld in the spots needed for different vehicles.

136 Strategic operations management
Detroit is slowly making headway. Prudential says half of GM’s 35 North American assembly lines can makemultiple vehicles. GM’s 2-year-old Cadillac plant in Lansing, MI, will make three luxury vehicles – the CTS andSTS sedans and SRX SUV. It has also been designed to get some large, preassembled modules from suppliers.GM is using the Cadillac plant as a model for upgrading other plants. ‘We’re getting much more flexible,’ saysGary L. Cowger, President of GM North America.
But it’s much easier to design a new factory to be flexible from the ground up than to refurbish those built30 or more years ago. And with so much excess capacity, the Big Three have no room to build new plants.Even if they could match the Japanese in productivity, they would have to account for the costs of laid-off workers, whose contracts entitle them to 75 per cent of their pay.
By contrast, Nissan runs a tight ship and works its employees harder. During the UAW’s failed attempt toorganize Smyrna in 2001, workers told the union that line speeds were too fast and people were gettinginjured, says Bob King, the UAW’s Vice-president of Organizing.The union says that, in 2001, Nissan reported31 injuries per 1000 workers – twice the average at Big Three plants – according to logs reported to theOccupational Safety and Health Administration.
Squeaks and rattles
Nissan does not dispute the OSHA figures, but it denies its assembly lines are any less safe than Detroit’s.Although the company won’t release current numbers, executives do say that they have taken steps to reduceinjuries. For instance, the company has workers do four different jobs during a typical 8-hour shift, to try to cutdown on repetitive-motion injuries. Nissan claims that injury rates have fallen 60 per cent in the past 2 years.
As for the finished product, the real test is still to come for Nissan.The company has yet to prove that thepopularity of its Altima and G35 Infiniti sedans can carry over to minivans, big pickups and big SUVs. The com-pany’s quality rating is below average, and critics say the Quest has squeaks and rattles that need to be workedout at the factory. Trucks are Detroit’s last bastion of dominance, and it will fight to maintain an edge. But atleast in terms of efficiency, each new Nissan is rolling off the line with a huge headstart.
A second wave of efficiency
Here’s how Nissan pushes its productivity edge at auto factories in Canton, MI and Smyrna,TN:
■ Body shop.Nissan can weld bodies for different cars and trucks using the same machines.Computer-controlledrobots quickly change weld points to adjust.
■ Paint shop. Nissan’s plants have highly automated processes to paint all kinds of vehicles one after the other,with no downtime for reconfiguration.
■ Outsourcing. Nissan uses lower wage suppliers to build the frame, dashboard and seats. They are shippedright to the assembly line.
■ A moving stage. Assembly workers can stand on a ‘lineside limousine’,which moves them, their tools and partsalong with the car. That eliminates having to walk back and forth to the parts bins and tool racks.
■ Elbow grease. Nissan works its staff hard. Critics say injury rates are high, though Nissan counters that it hasbeen making ergonomic improvements.
Playing catch-up on the factory floor
General Motors has made great strides in efficiency, but Nissan still operates the most efficient auto plant inNorth America:
Best plants Hours per vehicle* Product
Nissan: Smyrna,TN 15.7 Altima, MaximaGM: Oshawa, Ont. 1 16.4 Chevrolet Monte Carlo, ImpalaGM: Oshawa, Ont. 2 17.1 Buick Century, Regal
Worst plants Hours per vehicle* Product
Ford: Wixom, MI 44.2 Lincoln Town Car, LS, Ford ThunderbirdChrysler: St Louis North 33.8 Dodge Ram pickupGM/Suzuki: Ingersoll, Ont. 29.9 Suzuki Vitara, Chevrolet Tracker*Average labour hours spent on vehicles made in 2002.
Source: Business Week, 22 December 2003, pp. 58–61.

Managing the transformation process 137
Summary
■ Layout and process choice are of major strategic importance to manufacturing and services operations. Theoptions to choose from are also essentially similar – it’s not an infinite variety but a small number ofoptions, and switching between one and the other is by no means cost free – so there is an importantstrategic objective to align the transformation process with market requirements and to understand theimplications of changing.
■ The five basic types of process choice are project, job, batch, line and continuous process.■ The basic types of layout are fixed, process, hybrid (cell) and product.■ There are links between the layout (the physicality of operations) and process choice (the transformation).■ A process choice will indicate what a firm can and cannot do. Process choice may significantly influence what
the company sells and what it is able to offer.■ Increasingly, because of the need to satisfy volume and variety requirements, production technology is
centred on the middle of the continuum between volume and variety.■ Process technology is not a quick-fix solution and investment must be made alongside skills and capabilities.
Any investment has to be made to support the company in its chosen market and should not be at thewhim of a particular technical specialist, but should be a holistic decision for the company.
■ Vast amounts of investment have been made in some plants with little competitive advantage being gainedas a result. However, when appropriate investment is made it should allow the firm to operate at world-class levels, provided that it is used to meet the needs of the markets in which the firm is competing.
■ Process technology is a requirement in order to meet the demands of the needs of markets. In order tomeet these needs, technology can be used for rapid changeover and set-up times, volume and variety mixes,delivery speed and reliability requirements, and for ensuring process quality. However, technology must notbe seen as a replacement for human resource capability.
■ Investment in technology is a strategic decision. Investment must be made to enable the firm to support themarkets in which the firm is competing.
Key questions
1 Describe how types of layout are often linked to process choice.
2 What clues does process choice provide concerning how a company
competes?
3 Why is investment in process technology often a difficult
decision to make?
References and further reading
Abernathy, W.J. and Utterbuck, J.M. (1978) Patterns of industrial
automation. Technology Review.
Bessant, J., Brown, S., Francis, D. and Meredith, S. (2001) Developing
manufacturing agility in SMEs. International Journal of Technology
Management, 28–52.
Brown, S. (1996) Strategic Manufacturing for Competitive Advantage.
Hemel Hempstead: Prentice Hall.

Brown, S. (1998a) Manufacturing strategy, manufacturing seniority
and plant performance in quality. International Journal of
Operations and Production Management, 18(6).
Brown, S. (1998b) New evidence on quality in manufacturing plants – a
challenge to lean production. Production and Inventory Management
Journal, 39(1), 14–22.
Brown, S. and Bessant, J. (2003) The strategy–capabilities link in mass
customization. International Journal of Operations and Production
Management, 23(7), 707–730.
Business Week, 22 December 2003.
Da Silveira, G., Borenstein, D. and Fogliatto, F.S. (2001) Mass cus-
tomization: literature review and research directions. International
Journal of Production Economics, 72, 1–13.
Davis, S. (1987) Future Perfect. Reading, MA: Addison Wesley.
The Economist Manufacturing Technology Survey, 5 March 1994.
The Economist, The celling out of America, 17 December 1994.
The Economist, Technology and unemployment: a world without jobs?,
11 February 1995.
Financial Times, 21 May 2002.
Forbes, Custom-made (PCs made to order), 6 November 1995.
Fortune, 16 November 1992.
Fortune, Ford’s intranet success, 30 March 1998.
Fralix, M. (2001) From mass production to mass customization.
Journal of Textile and Apparel, Technology and Management, 1(2), 1–7.
Gilmore, J.H. and Pine, J. (1997) Beyond goods and services. Strategy
and Leadership, 25(3), 10–18.
Gunasekaran, A. and Yusuf, Y. (2002) Agile manufacturing: a taxonomy
of strategic and technological imperatives. International Journal of
Production Research, 40(6), 1357–1385.
Hill, T. (1995) Manufacturing Strategy, 1st Edition. Basingstoke:
Macmillan.
Hill, T. (2000) Manufacturing Strategy, 2nd Edition. Basingstoke:
Macmillan.
Honeycutt, E.D., Siguaw, J.A. and Harper, S.C. (1993) The impact of
flexible manufacturing on competitive strategy. Industrial Manage-
ment, 35(6), 2–15.
Hutchison, G. and Holland, J. (1982) The economic value of flexible
automation. Journal of Manufacturing Systems, 1(2), 215–227.
Industry Week, The search for simplicity, 8 June 1998.
Keller, M. (1993) Collision. New York: Currency Doubleday.
Kulatilaka, N. (1984) Valuing the flexibility of flexible manufacturing sys-
tems. IEEE Transactions on Engineering Management, 35(4), 250–257.
138 Strategic operations management

Lampel, J. and Mintzberg, H. (1996) Customizing customization. Sloan
Management Review, 38, 21–30.
Lei, D., Hitt, M.A. and Goldhar, J.D. (1996) Advanced manufacturing
technology: organizational design and strategic flexibility.
Organization Studies, 17(3), 501–524.
Levitt, T. (1972) The production-line approach to service. Harvard
Business Review, 50(5), 20–31.
Lovelock, C.H. (1983) Classifying services to gain strategic marketing
insights. Journal of Marketing, 47(3), 9–21.
MacCarthey, B., Brabazon, P.G. and Bramham, J. (2003) Fundamental
modes of operation for mass customization. International Journal
of Production Economics, 85, 289–304.
Monohan, G. and Smunt, T. (1984) The flexible manufacturing system
investment decision. Proceedings of ORSA/TIMS Conference, November.
Porter, M. (1980) Competitive Strategy. New York: Free Press.
Pine, B.J. (1992) Mass Customization: The New Frontier in Business
Competition. Cambridge, MA: Harvard Business School Press.
Pine, B.J., Victor, B. and Boynton, A. (1993) Making mass customiza-
tion work. Harvard Business Review, September–October.
Ridderstrale and Nordstrom (2000) Funky Business. London: FT Books.
Schmenner, R.W. (1986) How can services business survive and pros-
per? Sloan Management Review, 27(3), 21–32.
Spring, M. and Boaden, R. (1997) One more time: how do you win
orders?: a critical reappraisal of the Hill manufacturing strategy
framework. International Journal of Operations and Production
Management, 17(8).
Starr, M. and Biloski, A. (1984) The decision to adopt new technology.
Omega, 12(4), 353–361.
Ulrich, K.T. and Tung, K. (1991) Fundamentals of product modu-
larity. Working Paper No. 3335-91-MSA, Sloan School of
Management, MIT.
Willis, R. and Sullivan, K. (1984) CIMS in perspective. Industrial
Engineering, February, 28–36.
Zipkin, P. (2001) The limits of mass customization. Sloan Management
Review, 42(3), 81–87.
Managing the transformation process 139

C H A P T E R
Innovation – managingthe renewal of the
business
4
Introduction – the innovation imperative
It’s a disturbing thought – but the majority of companies have a life span
significantly less than that of a human being. Even the largest firms can
show worrying signs of vulnerability – for example, of the top names in
the Fortune 500 list for 1985, less than half were still there by 1995. For the
smaller firm, the mortality statistics are even more worrying. For instance,
in 2003 over 200 restaurants were declared bankrupt in London alone.
Sometimes it’s individual firms which face the problem – sometimes
it is whole sectors. We only have to consider the sad fate in the United
Kingdom of industries like motorcycles, machine tools, coal mining
and toys, to realize how shaky the foundations of most of our industrial
base really are. What goes up can come down just as fast.
It is not all doom and gloom though – there are also plenty of stories
of new firms and new industries emerging to replace those which die.
And in many cases the individual enterprise can renew itself, adapting
to its environment and moving into new things. Consider a firm like
Nokia – once a humble boot and shoe maker and now the number one
player in the global business of mobile telephones. Arie de Geus (for
many years the planning director for Shell and responsible for helping
that company navigate the turbulent waters of the oil business) cites

Innovation – managing the renewal of the business 141
the example of the Stora company in Sweden, which was founded in
the twelfth century as a timber cutting and processing operation but
which is still thriving today – albeit in the very different areas of food
processing and electronics (de Geus, 1996).
The purpose of this chapter is for the reader to:
■ understand the strategic importance of innovation;
■ realize that operations management can play a central and
pivotal role in the innovation process;
■ appreciate how operations ‘lines up’ within the innovation
process.
Business success through rewriting the rules of the game
There are plenty of examples of firms that have made an impact in established sectors through doing some-thing differently – either in what they offer or how they produce that offering. For example:
■ Amazon.com revolutionized the world of publishing and bookselling by the early adoption of the Internet asa mechanism for advertising, ordering and distributing books. So successful has the project been that nowalmost all the major booksellers have added Internet operations to their existing physical bookshops.
■ The Body Shop broke new ground in the well-established cosmetics and toiletries field of retailing by a strat-egy based on environmentally friendly products and a strong commitment to international development aid.Again, their success caused other players in the field to alter their own behaviour and to produce productsand redesign packaging and retailing operations to match.
■ Dell Computers have redefined the computer as a consumer product, taking advantage of several techno-logical and social changes. They offer not only a rapid delivery and low price, but also customization – eachmachine is built to an individual customer specification. Achieving this is done through a mixture of carefulmodular design and the management of an extended web of outsourced capabilities – in manufacturing,distribution, service, etc. The result is a highly successful mass customizing company that operates from a tiny core – a true virtual business.
■ Easyjet have innovated in services with their low-cost scheduled flights (in fact, their in-flight literatureincludes a detailed description of airline economics and how they have changed the rules of the game!).
Underpinning all of this is a simple point. Firms need to innovate – to
change what they offer and how they produce that offering – to survive.
History is very clear on this point; survival is not compulsory, but those
enterprises that do survive and grow do so because they are capable of
regular and focused change. It is worth noting that Microsoft – cur-
rently one of the biggest and most successful companies in the world –
takes the view that it is always only 2 years away from extinction!
On the plus side, innovation can be about more than simple survival –
it is also strongly associated with growth. New business is created by new
ideas, by the process of creating competitive advantage in what a firm
can offer. Economists have argued for decades over the exact nature of
the relationship, but they are generally agreed that innovation accounts
for a sizeable proportion of economic growth in a country or at the

142 Strategic operations management
Looking back …
Perhaps the most telling difference between past approaches to innova-
tion and the present day is provided by the eminent management
writer, Peter Drucker (Business 2.0, 22 August 2000), who describes how:
My ancestors were printers in Amsterdam from 1510 or so until 1750 …
and during that entire time they didn’t have to learn anything new.
Drucker is not being critical of his ancestors, nor is he accusing them
of not being innovative, nor is he stating that such an approach was
‘wrong’. Indeed, it might well be argued that in previous times such an
approach would have been entirely appropriate. The issue is: in today’s
competitive arena it is not appropriate.
Innovation has been with us since the earliest days, when our ancestors
began experimenting with different ways of hunting, of fighting, of cook-
ing and generally trying to survive in the hostile prehistoric environment.
New tools, new materials, new methods – all of these things on which our
civilization was founded did not happen by accident but by a gradual
process of learning and capturing of knowledge. History is punctuated by
periods in which new ideas drove society forwards – for example, the
Renaissance or the Industrial Revolution – and it is clear that techno-
logical change continues to be a powerful force in all aspects of our lives.
Whilst innovation has been the mainspring of development in society,
our understanding of it has, until recently, been somewhat poorly
developed. Much thinking assumed relatively simplistic and linear
models of the process – for example, that all it takes is a good idea for suc-
cessful innovation. Emerson’s famous quote about the world beating a
path to the door of the inventor of the better mousetrap has never really
been a good description of what actually happens in innovation – but that
has not stopped many people trying and failing to introduce new ideas.
level of the firm. Marx called technological change ‘the locomotive of
growth’, whilst Joseph Schumpeter developed a whole school of eco-
nomic thought based on this principle (Schumpeter, 1950). More
recently, studies by the OECD have highlighted the strong correlation
between innovation and economic growth.
This chapter explores the challenge of innovation, arguing that it is
not a luxury or optional extra but a core part of what the organization
does. Managing this central process of renewal is one of the most
important challenges facing the strategic operations manager.

Innovation – managing the renewal of the business 143
Innovation today
Our view of innovation today no longer sees it as an occasional event
but a core part of what organizations do to survive. Nor is it the
province of a few gifted specialists – it is too important to be left to
them. Rather it is at the heart of what organizations do to renew them-
selves in terms of what they offer and how they create and deliver that
offering. For this reason, it is of central concern to strategic operations
managers whose role is co-ordinating the development and deploy-
ment of capabilities that make innovation happen.
It will be worth spending a little time looking in more detail at what
innovation involves, and from that identifying the key levers with
which we can try and manage the process.
What is innovation?
Innovation can take many forms. It could be in the equipment used to
produce the product or service, or it could be in the way in which the
process is organized and structured. It could be in the repositioning of
an existing idea – for example, an established product in a new market.
(Think about the cellular phone, originally sold as a business tool but
with suitable packaging and advertising now sold to concerned parents
as a safety aid to give to their children when out alone at night.) The
case of McDonald’s expanding internationally into such diverse markets
as France, China and the Middle East demonstrates the extent to which
global brands need not adapt to reflect local needs. Likewise, Harley-
Davidson motorcycles have had great success in selling their products to
the 50+ age group. And occasionally it can involve a complete reframing
of the way in which we see the world – a ‘paradigm shift’. The transition
to steam power and mechanization underpinning the first Industrial
Revolution, the emergence of mass transportation with the railways and
the motor car and, more recently, the radical changes in computing and
communications are all examples of this kind of innovation.
Transforming industries through innovation
Two examples of recent innovations that are likely to transform industries or whole segments of society willbe considered. The first is in the field of music,where the complex web of products and services involved fromcreating and performing and the accompanying recording and distribution now represents one of the world’sbiggest industries. Much of this has grown up around the physical capture and distribution of music on a

144 Strategic operations management
Changes do not always have to be great leaps forward or involve rad-
ical new ideas. Most of the time change is more gradual, moving incre-
mentally forward with a sequence of little, cumulative improvements.
For example, although the invention of the electric light-bulb was a
dramatic breakthrough, little improvements in the design of the bulb
and in the process for manufacturing it led to a fall in price of over 80
per cent between 1880 and 1896. In recent times, the dramatic growth
and success of the Japanese car manufacturing industry is primarily the
result of a 40-year programme of systematic and continuous improve-
ment of product and process design.
Innovation depends on attitudes to change, as shown in Figure 4.1.
Whatever form it takes, innovation is at least a survival imperative and
it can also offer real opportunities for growth. But the choice of whether
or not to innovate remains at the level of the individual enterprise.
For some firms the challenge is obvious – take, for example, the print-
ing industry. Here the entire rules of the game are being rewritten –
by technological and market changes that have turned the industry
variety of media – from graphite cylinders, through to vinyl discs, magnetic tape and, most recently, variousforms of laser-written discs. Around this set of technologies an industry grew up to control the productionand distribution of music – and collect revenues from its sale.But now,with the advent of the Internet and withtechnologies like MP3 that enable anyone to create and distribute music – and indeed to copy and pirate it! –the foundations of this industry are beginning to shake. It is not clear who will be the eventual ‘winners’ in thisprocess – needless to say the major music industry players are taking the whole challenge very seriously andresponding with a mixture of technological and legal changes. But what is clear is that the music business willnever be the same again – it is being transformed through innovation.
A second example concerns an everyday object – the light-bulb. Ever since Edison and Swann took the ideas ofnineteenth-century physicists and managed to produce a working and reliable light-bulb, we have relied on somevariant of their basic device.Whilst bulbs may come in different shapes,sizes,colours and have different energy effi-ciencies, they are still fundamentally based on glowing filaments in a glass container.But all that is about to change.
Light-emitting diodes (LEDs) are familiar to everyone in the form of little red or green lights that tell uswhether our various electrical devices are working.This technology has been around since the 1960s, and iswidely used and understood. But most scientists have accepted that it has its limits, one of them being thatLEDs can only be made in certain colours – red, orange, yellow and light green.White light – the kind we usein light-bulbs – is made up of many colours and the missing one as far as LEDs was concerned was always blue.
A small chemicals firm in Japan, and a dedicated scientist by the name of Shuji Nakamura, have changed thatperception.Twenty years of work and considerable investment by the company in what seemed at the time tobe high-risk research is about to transform the electric light industry – because Nichia have developed blueLED technology. More importantly, they have solved the manufacturing problems associated with producingsuch LEDs successfully, and have moved on to produce prototype light sources. In 1995, they made the firstprototype for what will replace Edison’s design – a blue diode with a phosphor coating on top of the semi-conductors, which converts the frequency of light emitted into white light.
Devices of this kind will use around 85 per cent less power and last sixteen times longer; the market for them is estimated at around £8 bn per year! Nichia invested around £2 m in their original research projecton the technology, and the work has led to around 300 patents, which provide them with a significant degreeof protection from which to exploit this potential. Once again this demonstrates the potential transformation ofan industry through technological innovation.

Innovation – managing the renewal of the business 145
upside down. Firms that don’t recognize the need for change simply
disappear – whilst those that recognize that ‘we must change’ can use
this to build new and growing businesses. The kind of transformation
described in the box cannot be ignored; firms making light-bulbs need
to adapt rapidly to enter the new technology or they will not survive. It
is instructive to look, for example, at the names of the firms that were
active players in the early days of electronics, when valves were the
dominant products. If you compare this list from around 1948 to the
list some 6 years later – after the advent of solid-state electronics –
there are quite a few omissions. New firms moved into the new tech-
nology and exploited the opportunities emerging; older firms often
failed to see the change coming or to respond quickly enough (Braun
and Macdonald, 1980).
But not all firms recognize the need to change; for some there
appears to be security in size or in previous technological success. Take
the case of IBM – a giant firm which can justly claim to have laid the
foundations of the IT industry and one which came to dominate the
architecture of hardware and software and the ways in which computers
were marketed. The trouble is that such core strength can sometimes
become an obstacle to seeing the need for change – as proved to be the
case when, in the early 1990s, the company moved slowly to counter
the threat of networking technologies – and nearly lost the business in the
process. (In 1993, IBM lost nearly $8 bn and global lay-offs of employees
ran close to 100 000. Its subsequent return to good health under a new
Chief Executive, ex-consultant Lou Gerstner, is reflected in his public
New response needed
Old response OK
Turbulent environmentStable environment
Rewriting the rules of thegame
We have to change
Falling asleep We’ve seen it all before
Figure 4.1
Contrasting
attitudes to
innovation.

146 Strategic operations management
message to his employees in 1993: ‘Basically, you need to change the
way you think and act, every hour of every day for the rest of your IBM
career. If you are comfortable with tradition and procedure, you will
likely find all this difficult, if not impossible, to accomplish.’)
Changing core strengths is often a problem for large companies –
the case of General Motors is another example, where the challenge
of ‘lean production’ was ignored for many years – but it can be life
threatening for smaller, less well-resourced firms. Building on ‘core com-
petence’ is important, but it is also important to remember how easily
this can turn into ‘core rigidity’, as Dorothy Leonard-Barton (1995)
calls it.
Sometimes the pace of change appears slow and the old responses
seem to work well. It appears, to those within the industry, that they
understand the rules of the game and that they have a good grasp of
the relevant technological developments likely to change things. But
what can sometimes happen here is that change comes along from
outside the industry – and by the time the main players inside have
reacted it is often too late. For example, in the late nineteenth century
there was a thriving industry in New England based upon the har-
vesting and distribution of ice. In its heyday it was possible for ice
harvesters to ship hundreds of tons of ice around the world on
voyages that lasted as long as 6 months – and still have over half
the cargo available for sale. By the late 1870s, the 14 major firms
in the Boston area of the USA were cutting around 700 000 tons per
year and employing several thousand people. The industry made use
of a variety of novel techniques for cutting, insulating and transporting
ice around the world. But the industry was completely overthrown
by the new developments that followed from Linde’s invention of
refrigeration and the growth of the modern cold storage industry. The
problem – as Professor Utterback of MIT points out in his book study-
ing a number of industries – is that the existing players often fail to
respond fast enough to the new signals coming from outside their
industry. Yet three-quarters of the industry-changing innovations that
he examined originated from outside the industry itself! (Utterback,
1994).
Other examples of this kind of change include:
■ The shift from valve to solid-state electronics (where few of the
original producers and especially the industry leader, RCA,
were able to make the transition).
■ The emergence of digital watches (which nearly destroyed the
traditional Swiss watch industry).

Innovation – managing the renewal of the business 147
■ The emergence of low-cost airlines has led to several major
airlines declaring, or being close to declaring, bankruptcy.
Whilst traditional airlines, so-called ‘flag carriers’ such as
British Airways and KLM, have experienced falls in passenger
demand, budget operators such as Ryanair and Easyjet have
experienced significant growth.
■ In the UK, McDonald’s entered the market in 1974, but
most restaurant operators with hamburger-based products
did not adopt their process technology (which puts the fast in
fast food) until the mid-1980s, by which time McDonald’s was
already close to achieving dominance in the market-place.
■ Currently, Kodak is facing a major challenge as the traditional
fields in which it has been strong give way to completely
new technologies – and unless the company can succeed in
re-inventing itself as a digital image operation rather than a
mechanical and physical chemistry firm, its survival may be in
doubt.
Of course, for others these conditions provide an opportunity
for moving ahead of the game and writing a new set of rules. The case
of banking is an example; for many years the banking industry in the
UK was a relatively stable environment. Small changes took place but
each of the major players kept up and maintained their market shares.
But in the 1980s, following developments that had radically shaken
up the insurance industry, one or two banks began to rewrite the rules
of the game by introducing telephone banking services backed up
by sophisticated information technology systems. The results, as far
as the customers were concerned, were massive improvements in
perceived levels of service; no longer did they have to wait until the
banks were open but instead they had 24-hour access every day of the
year. The range of services that could be offered was increased so that
the telephone became a ‘one-stop shop’ for a range of banking and
other financial services. And, as far as the banks were concerned, the
reduction in their cost base was enormous, switching from an expensive
physical infrastructure with branches on the streets of most towns and
many staff to run these, to a streamlined and professional call centre in
one city handling all the business in the UK. So innovation is not a lux-
ury or an optional extra – it is essential to the firm’s survival. But simply
changing things for their own sake is not necessarily the answer. The
problem with innovation is that it is uncertain – by its nature, it involves
risks and there are no guarantees of success. This makes its management
a primary strategic task for the enterprise.

148 Strategic operations management
Innovation as a process
If someone asked you ‘when did you last use your Spengler?’, they might
well be greeted by a quizzical look. But if they asked you when you last
used your ‘Hoover’ – the answer would be fairly easy. Yet it was not
Mr Hoover who invented the vacuum cleaner in the late nineteenth cen-
tury but one J. Murray Spengler. Hoover’s genius lay in taking that idea
and making it into a commercial reality. In similar vein, the father of
the modern sewing machine was not Mr Singer, whose name jumps to
mind and is emblazoned on millions of machines all round the world.
It was Elias Howe who invented the machine in 1846 and Singer who
brought it to technical and commercial fruition. (Of course, not all
great entrepreneurs put their own name to someone else’s invention.
For instance, it was Ray Kroc that made the restaurant concept invented
by the McDonald brothers what it is today.)
Perhaps the godfather of them all in terms of turning ideas into reality
was Thomas Edison, who during his life registered over 1000 patents.
Products for which his organization was responsible include the light-bulb,
35-mm cinema film and even the electric chair. Many of the inventions
for which he is famous were not in fact invented by him – the electric
light-bulb, for example – but were developed and polished technically
and their markets opened up by Edison and his team. More than anyone
else, Edison understood that invention is not enough – simply having a
good idea is not going to lead to its widespread adoption and use. Much
has to be done – the 99 per cent perspiration in his famous dictum – to
make ideas into successful reality. His skill in doing this created a busi-
ness empire worth, in 1920, around $21.6 billion. He put to good use
an understanding of the interactive nature of innovation, realizing that
both technology push (which he systematized in one of the world’s first
organized R&D laboratories) and demand pull need to be mobilized.
Take the light-bulb, for example. To bring that to fruition required
enormous technical development on both the product and the process
to produce it at the right cost and quality, and it required the creation
and development of a market into which it could be sold. But Edison
also recognized that, although the electric light-bulb was a good idea,
it had little practical relevance in a world where there was no power
point to plug it into. Consequently, his team set about building up an
entire electricity generation and distribution infrastructure, including
designing lamp stands, switches and wiring. In 1882, he switched on
the power from the first electric power generation plant in Manhattan
and was able to light up 800 bulbs in the area. In the years that fol-
lowed he built over 300 plants all over the world.

Innovation – managing the renewal of the business 149
In other words, invention is just the first step along an extended
process of translating ideas into reality and it is of central concern in
operations management. Innovation can thus be represented as a
process – a sequence of activities which lead to an outcome. In the
organization it is a core process concerned with renewal – translating
ideas and resources into new products and processes that will under-
pin the future of the business, as shown in Figure 4.2.
It is a process triggered by many things, but these stimuli can be
resolved into two components – pull and push. The ‘push’ comes from
the gradual accumulation of ideas through technological research
and development; these create a range of opportunities that might be
exploited in new or improved products or processes. The ‘pull’ comes
from the influence of different kinds of demand (market, social,
regulatory, etc.) that bring new responses – essentially the ‘necessity is
the mother of invention’ model. Arguments have raged between those
who see one or the other as the prime driver of change; experience
tells us that, whilst the balance may vary widely under different cir-
cumstances, both are involved in triggering innovation. One of the
most helpful analogies is that of the blades of a pair of scissors – both
need to work together to ensure that cutting takes place. The challenge
for the firm is to pick up these signals and respond to them to create
relevant new responses and exploit relevant new opportunities.
It sits in parallel with the other core process of meeting the customers’ needs today and whenwell managed, it involves considerable inter-relationship between today’s and tomorrow’s process.
Ideas
Resources
The innovation process
New products/services
New processes
The innovation (�renewal)process
The order fulfilment process
Needs
Figure 4.2
The process of innovation.

150 Strategic operations management
Case example: the pre-filled drinking glass
In 1973, an inventor patented the concept of a pre-filled glass and in 1990 approached a West London firm spe-cializing in flight catering for airlines to help with its commercial development.The standard inflight approachto drinks service is to serve the passenger a glass and a separate miniature bottle of spirits.The patented prod-uct was a tumbler pre-filled with a measure of spirits.This tumbler is made from a high-quality plastic that feelsand looks like glass. Around the inside, a few millimetres from the base, is a rim to which is attached a foil disc,thereby sealing the alcohol inside the tumbler. A strip up and over the side of the glass allows the seal to beremoved when served to the customer. For promotional and identification purposes, the seal has the nameand logo of the spirit in the tumbler printed on it.
The design not only enables the spirit to be packaged but also the tumblers to be stacked one inside theother. This provides two key advantages over miniatures – it is both space-saving and lighter than the conven-tional approach. Space and weight are key operational issues for airlines in order to maximize passenger capacity and minimize fuel consumption.The stackable, pre-filled glass takes up the same amount of space as a conventional glass, but without the need to stock, handle and dispose of miniature bottles of spirit.
This new product concept was easy to describe, but technically difficult to achieve. The major problem wassealing the foil disc to the inside rim. Both the sealant and the foil had to be strong enough to be rigorouslyhandled whilst being transported to the point of sale and distributed to customers. A great deal of investiga-tion and experimentation went in to alternative types of seal, which is now subject to patent protection.
But even when this problem was overcome, the development faced further problems in turning the proto-type product into one that could be mass-produced.To make the pre-filled glass commercially, the process hadto be automated along production-line principles.This meant tumblers had to be moved along a line for fillingwith spirit before being sealed. But the seal was ineffective if the rim was contaminated by alcohol. The needto ensure a dry rim radically affected the speed of the line and the method of dispensing the alcohol, and con-sequently the unit cost of production.Then, in 1995, it was found that the shelf-life of spirits stored in this waywas only 6 months, considerably shorter than bottled storage.This lead to a further redesign of the adhesionof the foil seal, in order to make it more airtight.
Even after these technical problems were overcome, the pre-filled drinking glass did not go in to commer-cial production. Airlines and other potential users of the product, such as railway caterers and vending machineoperators, saw the advantages of the product, but also some difficulties with its use. For instance, there wereservice problems on aircraft if passengers wanted ice and lemon with their drink; some passengers ask forminiature spirits on board for consumption after the flight is over; and distillers like their miniatures on aircraft as they see it as a major form of product placement.Trials on the ground by one caterer were highlysatisfactory, but bar staff were highly resistant to the product, claiming the seals were too easily broken andthat customers did not like the pre-filled glass. Such resistance might have been due to the fact that stock security was greatly improved by using this instead of miniatures!
Hence caterers were reluctant to commit themselves to this revolutionary product, with its many desirablefeatures. But large-scale commitment was necessary if the product was to be produced commercially. Fourassembly lines producing 8 million pre-filled tumblers a year would only be twice as expensive to set up as oneline predicting only 2 million units. Such economies of scale could not be ignored.Twenty-five years after itsinvention, and with more than 5 years of product testing and development, along with considerable investment,the tumbler was still not in production.
Innovation and operations management
As we saw above, innovation is a risky and uncertain process, but it can
be managed. At its heart it is about disposing resources and controlling
activities – in other words, it’s about operations management. It may

Innovation – managing the renewal of the business 151
seem somewhat strange since ‘mainstream’ operations management
is often preoccupied with capacity, with production flow and control,
and other themes – but managing innovation is fundamentally about
the same set of challenges – of co-ordination and disposition.
Indeed, we could argue that one reason why innovation is often
poorly managed in organizations is precisely because of a lack of an
integrated operations management perspective. There is a tendency to
see it in limited terms and to manage that bit of it well – but at the
expense of the bigger picture. For example, if innovation is viewed
simply as invention, then firms will tend to organize and manage it as if
R&D (the part of the firm associated with generating ideas) is all that
matters. But unless we connect these ideas to other parts of the firm –
the marketing, the production, the quality, etc. – then the chances are
that we will end up with a better mousetrap that nobody wants and that
we can’t make in volume.
Similarly, if we only see it as a demand-led process where signals
from the market pull through innovations, then we risk the danger of
only offering me-too products and of failing to lead. One of the most
famous examples here would be the Sony Walkman – a product for
which no market existed and about which the marketing department
were deeply sceptical during the early days of development! (Nayak
and Ketteringham, 1986).
Table 4.1 indicates some of the problems of managing with only a
partial view of what innovation process involves.
So what is needed in successful innovation management is a stra-
tegic, integrative and systemic approach. Before we look at how this
might be achieved, it will be worth reminding ourselves about what has
to be managed. In process terms, we need to look at the structure of
the process itself, the inputs/outputs that are involved and the factors
that can influence in positive or negative fashion the workings of the
process. Figure 4.3 provides a simple process model of these factors.
A key issue for us is that, although a number of important contribu-
tions to the literature see innovation as a strategic issue (e.g. Hamel,
2001; Christensen, 1997; Henderson and Clark, 1990; Nelson and
Winter, 1982; Tushman and Anderson, 1987; Utterback, 1994), we
suggest that the specific role of operations is underplayed in much of
the literature. Of course, it is axiomatic that operations personnel will
be involved in innovation simply due to the fact that they will be
charged with producing or assembling the new product. But the asser-
tion that operations personnel should be involved in innovation, par-
ticularly with new product development, is not enough because
the specific role and contribution from operations personnel in

152 Strategic operations management
Table 4.1Problems of partial views of innovation
If innovation is only seen as The result can be
Being good at invention – and Technology which fails to meet therefore having strong R&D capability user needs and may not be accepted
The province of specialists in white Lack of involvement of others, and a coats in the R&D laboratory lack of key knowledge and experience
input from other perspectives
Meeting customer needs – and Lack of technical progression, leadingtherefore emphasizing good market to inability to gain competitive edgeresearch and hearing ‘the voice of the customer’
Technology advances Producing products which the market does not want or designing processes which do not meet the needs of the user and which are opposed
The province only of large firms Weak small firms with too high a (with the resources to carry through dependence on large customerstechnological and market research)
Only about ‘breakthrough’ changes Neglect of the potential of incremental innovation. Also an inability to secure and reinforce the gains from radical change because the incremental performance ratchet is not working well
Only associated with key individuals Failure to utilize the creativity of the remainder of employees, and to secure their inputs and perspectives to improve innovation
Only internally generated The ‘not invented here’ effect, where good ideas from outside are resisted or rejected
Only externally generated Innovation becomes simply a matter of filling a shopping list of needs from outside and there is little internal learning or development of technological competence
innovation is still far from clear in spite of the plethora of articles
related to the subject.
One of the key areas of dialogue in the innovation process is between
operations and marketing personnel, and the areas of interface
between the two is shown in Figure 4.4.

Innovation – managing the renewal of the business 153
Types of innovation
Innovations come in various configurations – some radical and highly
visible (like the examples of new light sources or of robots in industrial
processes), but others less visible or dramatic. The challenge for
The innovation process
Enabling routines
Constraining routines
ResourcesInnovations
Figure 4.3
Enabling and
constraining factors
in innovation.
Operations’ Role Stages ofDevelopment
Market assessmentVolume requirements
Ensuring that capacity, process technologyand skills can be mobilized and costs can be met
InitialScreening
Developing marketingstrategy and product
concept
Integrated design – with other functionsinternally and with suppliers’ involvement
InitialDesign
Refining market strategyin terms of buyers, pricingand promotion decisions
Design development Prototype testing
Enhanced CAD usageDevelopment
Executing marketingstrategy
Full-scale production capabilityContinuing product and process improvements
ProductLaunch
Marketing’s Role
Figure 4.4
The interface between marketing and operations in the innovation process
(adapted from Brown, 2000).

154 Strategic operations management
effective management of innovation begins with an understanding of
the whole range of innovation types and the need to manage them in
different ways.
The first helpful distinction is to recognize that innovation can take
place in terms of what a firm offers or how it creates that offering –
traditionally, these are termed ‘process’ and ‘product’ innovation,
although they can be applied just as much to a service context as to
physical products. Hence we shall refer to these as process and output
innovation. And they are not mutually exclusive. For example, the
budget hotel was a new way of processing the hotel guest stay, but the
basic output – a good night’s sleep – remains unchanged. On the other
hand, the same process capability in food manufacture can be used to
make a wide range of different product outputs. Finally, the develop-
ment of an express parcel delivery service by Federal Express not only
changed the process, it considerably altered the output and customers’
service expectations.
But innovation does not take place in a vacuum; it involves taking an
idea (invention) and developing it to the point where it is adopted and
used by others. This could be a new product in the market-place or a
new way of working being adopted and used by the workforce inside an
office. So we also need to consider innovation in terms of the context
into which it is applied; an old idea in a new context is still an innovation.
Figure 4.5 shows these types of innovation.
The second major distinction concerns the degree of novelty involved
in an innovation. At one end of the spectrum we have tiny, incremen-
tal changes which take place every day and which represent minor
improvements – ‘doing what we’ve always done a little bit better’. But at
New context
Existing context
Product Process
Chocolates as high energyresource for fitnessmarket – gyms, etc.
Continuous casting(a steelmaking approach) –
applied to chocolatemanufacture
New design of achocolate bar forschool children
Robots substitutingfor manual labour inpacking chocolate
assortments
Figure 4.5
Types of innovation.

the other end of the spectrum we have innovations which are major
changes, often representing significant shifts in what we offer or how
we create that. At the limit there is ‘discontinuous’ change, where innov-
ation involves a jump to something completely different and rewrites
the rules of the game.
We can see this pattern better if we consider some specific examples.
In the field of glass-making, for example, the traditional method of mak-
ing window glass was to grind and polish sheets of glass produced in
moulds. This was a labour-intensive process whose performance was
gradually increased through a long series of incremental innovations,
punctuated by more radical changes as, for example, the process was
mechanized and then new generations of machine came along. But in
the 1960s a radical jump took place with the development of the ‘float
glass’ process by Pilkingtons. Here the whole concept of flat glass-making
moved from grinding and polishing to a new approach in which molten
glass was continuously extruded from a furnace and floated on a bath of
molten tin so as to give a very flat, high-quality surface without the need
for polishing. This process became the dominant model for the indus-
try and almost all window glass in the world is now made by licensees of
the Pilkington process (Nayak and Ketteringham, 1986).
Another example in process innovation is that of the automobile.
When Henry Ford and his team of engineers began looking at the motor
car in the late nineteenth century the process was essentially one of craft
manufacture. Skilled men working in small groups would more or less
hand build a car, fashioning components one by one on general-purpose
machines, where the key to what was produced lay in the operator’s
head and hands. The cars took weeks to build and each was slightly dif-
ferent – very much as a hand-made suit is built up and shaped to an
individual client. Not surprisingly, this process was expensive and slow.
It was not without change; there was a continuous stream of minor
incremental improvements in the ways in which craft production oper-
ated – for example, in the materials used or the machinery involved.
But the shift that Ford and his team introduced was fundamental – a
radical jump from craft production to an early version of what we now
term ‘mass production’. The combination of new organizational prac-
tices (based on Taylor’s ‘scientific management’ ideas) and standard-
ization of product and process elements meant that huge increases in
productivity were possible – for example, an 800 per cent jump in prod-
uctivity in engine building between 1912 (craft) and 1913 (early mass
production) (Womack et al., 1990).
We can see other examples in the field of products – for example,
the telephone. This moved through a phase of radical innovation
Innovation – managing the renewal of the business 155

156 Strategic operations management
when it was first invented and then stabilized into a pattern of incre-
mental improvements – both in terms of the external styling and shape
and the internal electromechanical functioning. Throughout its life
there have been long periods of such incremental development, punc-
tuated by surges of radical change – for example, the move to elec-
tronic mechanisms and, in recent years, the advent of mobile phones.
In recent years, major impacts have been felt across information-
intensive sectors like banking and insurance as a result of the impact of
information and communications technology development. Until the
bursting of the ‘dotcom bubble’ there were dire predictions about the
fate of many other industries with an information handling component
– for example, travel, media, retailing, etc. – but the impact on these has
varied widely (Evans and Wurster, 2000). Customer processing opera-
tions, on the other hand, have experienced much less innovative turbu-
lence. A range of sectors continue to use processes and offer outputs
that are little changed – hotels, cinemas, hairdressers, schools and so on.
The line between incremental and radical innovation is hard to fix –
not least because novelty is in the eye of the beholder. For some firms
an innovation may be a simple and logical next step in an incremental
process of improvement. But for others it may represent a major shift.
It may also be that innovation is confined to the level of the firm, but
there are occasions where it influences and shapes a whole sector – as
in the case of the glass industry. (Other examples of such radical change
include the shift in steel-making technology enabled by the Bessemer
process, or in chemicals by the continuous Solvay process replacing the
batchwise Leblanc for the manufacture of soda ash and other key alkali
products.) And periodically something comes along which has an
System
Component
Incremental Radical
New propulsion system– fuel cell instead of
internal combustion engine
Improved energyefficient engine
Improved spark plugmade of better ceramic
Electronic ignitionsystem
Figure 4.6
Incremental and
radical innovations.

Innovation – managing the renewal of the business 157
impact across sectors and affects whole societies – for example, the
advent of steam power in the first Industrial Revolution or the current
‘revolution’ that the convergence of computing, communications and
electronics has brought about.
Why is it important to think about the different types of innovation?
Put simply, they need different ways of managing. An incremental change
in process in a familiar context is not a high risk and can probably be
managed in day-to-day fashion – for example, as part of a shopfloor
daily ‘review and improve’ activity. Equally, a radical new product being
launched in a new market will require care and attention to manage
the risks and resource flows – and will probably form the basis of a special
project teams’ work. At the limit, radical change in product, process
and context may offer the chance to change the rules of the business
game – but it will need very careful and focused management. For suc-
cessful strategic operations management of the innovation process we
need a portfolio approach.
The innovation process
Innovation, as we said earlier, is not just about invention but about a
sequence of activities involved in turning ideas and possibilities into
reality. We can map this process in terms of a number of discrete
phases or stages (Tidd et al., 2001). (This is, of course, an oversimplifi-
cation, but helps focus our attention on the different management
issues and needs at each stage of the ‘journey’ through the process.)
It involves:
■ scanning the environment (internal and external) for and
processing relevant signals about threats and opportunities
for change;
■ deciding (on the basis of a strategic view of how the enterprise
can best develop) which of these signals to respond to;
■ obtaining the resources to enable the response (through cre-
ating something new through R&D, acquiring something
from elsewhere via technology transfer, etc.);
■ implementing the project (developing the technology and
the internal or external market) to respond effectively.
We should also add the point that enterprises can learn from pro-
gressing through this cycle so that they can build their knowledge base
and can improve the ways in which the process is managed, as illus-
trated in Figure 4.7.

158 Strategic operations management
Whatever their size or sector, all firms are trying to find ways of man-
aging this process of renewal. There is no right answer, but each firm
needs to aim for the most appropriate solution for its particular cir-
cumstances. For example, those firms concerned with large, science-
based activities – like pharmaceuticals or electronics – will tend to
develop solutions to the problem of managing innovation, which
include formal R&D inside and outside the firm, patent protection and
searching, internationalization, etc. By contrast, a small engineering
subcontractor might develop very different solutions that aim at creating
a capacity to respond very quickly. Firms in the retail sector may not
invest much in formal R&D, but they are likely to stress scanning the
environment to pick up new consumer trends, and to place heavy
emphasis on marketing. Heavy engineering firms involved in products
like power plant are likely to be design intensive, and critically depend-
ent on project management and systems integration aspects of the
implementation phase. Consumer goods producers may be more con-
cerned with rapid product development and launch, often with vari-
ants and repositioning of basic product concepts.
Although each firm is, in this way, unique in coming up with its own
solution to the problem of configuring and managing the innovation
process, the underlying pattern of phases in innovation remains con-
stant. For example, developing a new consumer product or service
proposition will involve picking up signals about potential needs and
new technological possibilities, developing a strategic concept, coming
up with options and then working those up into new products that can
be launched into the market-place.
By the same token, deciding to install a new piece of process tech-
nology also follows this pattern. Signals about needs – in this case internal
ones, such as problems with the current equipment – and new techno-
logical means are processed and provide an input to developing a
strategic concept. This then requires identifying an existing option or
inventing a new one, which must then be developed to such a point
Scan Strategy Resource Implement
Learn
Figure 4.7
Learning from
innovation.

that it can be implemented (i.e. launched) by users within the enter-
prise – effectively a group of internal customers. The principles of
needing to understand their needs and to prepare the market-place
for effective launch will apply just as much as in the case of product
innovation.
It is worth looking at the question of services a little more closely.
Traditionally, it is argued that they are different – because they are
intangible and because production and consumption often take place
simultaneously. But if we look more closely at what is going on, the
same underlying process can be seen. For example, when an insurance
or financial services company launches a new product the innovation
process will follow a path of signal processing, strategic concept, prod-
uct and market development, and launch. What is developed may be
less tangible than a new television set, but the underlying structure to
the process is the same. Similarly, restaurant chains develop new con-
cepts and adapt an existing site into a prototype on a trial basis before
deciding whether to develop the new brand.
Another apparent exception to the rule is the case of what can be
termed ‘complex product systems’. These are typically the kinds of
product that bring together many different elements into an integrated
whole, often involving different firms, long time scales and high levels
of technological risk. Although such projects may appear very different
to the core innovation process associated with, for example, producing
a new soap powder for the mass market, the underlying process is still
one of careful understanding of user needs and meeting those. There
are differences in intensity of key stages – for example, involvement of
users throughout the development process, with the close integration
of different perspectives being of particular importance – but the over-
all map of the process is the same.
A number of factors may affect the specific process adopted by an
organization. Based on case study research in the tourism and hospi-
tality industries, it is suggested (Jones, 1996; Jones et al., 1998) that
these factors derive from features of the product/service, the organ-
ization and the environment. Product factors include the degree of
originality, the extent of patent protection, the level of capital invest-
ment, the range of professional expertise required and the potential
life cycle of the product. Organizational factors include the size of the
organization, organizational culture, in-house capability and organiza-
tional design. Finally, environmental factors relate to the maturity of
the market-place, nature of the supply chain, structure of the industry,
and the roles of trade associations and related trade shows in fostering
innovation.
Innovation – managing the renewal of the business 159

160 Strategic operations management
A formal, systematic approach to innovation is likely to be adopted
when:
■ a new product, with a major process impact, is being developed;
■ a number of interrelated innovations are being developed
simultaneously;
■ the product’s life cycle is long – it can be protected by patent
or licence;
■ the innovations are original or new to the world;
■ competitors are unlikely to enter the market with a similar
product.
If innovation is a process then we should be able to model it – and
this is very much the case. One of the most-cited models for product
Table 4.2Key activities in innovation management
Stage in the process Critical activities
Scanning Scanning the environment for signals about triggers for innovation – market research,competitor analysis, technology scanning, etc.Forecasting – scanning ahead in time for technological and market developments
Strategy Strategic analysis of what could be done in response to the trigger signalsStrategic choice – what will we do, given our previous experience and knowledge, our business strategy and the likely costs and benefits of particular choices?Strategic planning – how are we going to turn the idea into the reality of an innovation?
Resourcing Where and how will we obtain the key knowledge resources to make the innovation happen?
Implementation How will we manage the project?How will we manage the technological and market development leading up to launch?How will we balance the risks and costs, and decide whether to continue or stop the project?
Learning Having launched the innovation, how can we learn from the process?Technological knowledgeManagerial knowledgeContinuous improvement – how can we make it better?

Innovation – managing the renewal of the business 161
Case: Developing a short break tour to Poland
Travel companies and tour operators routinely engage in new product development and ‘Magic Tours’ is noexception. It specializes in short break holidays to major cities, and from 1992 to 1996 it won the UK traveltrade’s top awards for this.The company’s mission statement makes no reference to innovation, focusing onquality and service. But each year, during the firm’s annual strategic planning round, new holiday ideas and destinations are mooted and investigated.
The tour package to Warsaw and Krakow was generated at a senior management meeting in the Spring of1995. It built on an existing programme of short breaks to Prague and Budapest. Over the next 3 months,the idea was screened in a number of ways. The contracts manager visited Poland on familiarization trips;airlines were contacted; and volume forecasts developed in consultation with the Polish Tourist Board.
Informal approval was given in July to further develop the product over the next 6 months.Visits were madeto the destination by the marketing, contracts and transportation managers.The tour price was established bythe marketing team, along with a sales forecast. Copy was prepared for inclusion in the 1996 corporatebrochure. Reservations staff were briefed on the new product but no formal training took place.
The destination was formally launched in October 1995, as part of the firm’s 1996 product range. To support the launch, the firm’s PR manager successfully placed articles in the trade press. Since then, little orno formal evaluation of the product has been carried out.
innovation is due to Booz, Allen & Hamilton, whilst Robert Cooper’s
work suggests a slightly extended view with ‘gates’ between stages
which permit management of the risks in the process (Booz, Allen &
Hamilton, 1982; Cooper, 1988a,b). There is even a British Standard
(BS 7000) that sets out a design-centred model of the process. A num-
ber of authors have also developed models for new service develop-
ment (Easingwood, 1986; Cowell, 1988). These models are reviewed
and integrated by Scheuing and Johnson (1989) into a 15-stage process,
which emphasizes the involvement of the marketing and human
resource functions as well as operations.
The danger in models of the process is that we risk confusing them
with what really happens. In practice, most innovation is messier,
involving false starts, recycling between stages, dead ends, jumps out of
sequence, etc. But thinking about it in process terms can help us iden-
tify particular stages and activities on which we can focus particular
kinds of management effort. Table 4.2 highlights some of the key
activities associated with each stage.
This can be further demonstrated in the following mini-case.
Managing innovation
Table 4.2 sets out the key challenges at different stages in the process
but says nothing about how these things might be achieved. This is the
core problem in managing innovation – every firm has to do these
things but each finds its own particular solutions to the problem. Firms

develop their own particular ways of doing things – sometimes called
‘firm-specific routines’ – and some work better than others. It is quite
possible to find two firms trying to innovate the same thing, but one
succeeds whilst the other fails – indeed, this is a common approach to
studying success and failure in managing innovation.
Any organization can get lucky once, but the real skill in innovation
management is being able to repeat the trick. And whilst there are no
guarantees, there is plenty of evidence to suggest that firms can and do
learn to manage the process for success – by consciously building and
developing their firm-specific routines. Take the case of 3M, a com-
pany whose commitment to innovation is such that it bases its brand-
ing in advertisements on themes like ‘Innovation – working for you’.
3M see strategic advantage in their being able to come up with a regu-
lar stream of product innovation, so much so that they have a policy
that 50 per cent of sales should come from products invented during
the past 3 years. In practice, this means that they are betting on their
ability to bring new ideas to market not once or twice but consistently
and across a range that now numbers around 60 000 products world-
wide. Underpinning this is a particular set of firm-specific routines that
3M have learned, adapted and developed over time – and that seem to
work more often than they fail. There are some problems and the occa-
sional disaster, but the company’s track record on innovations (from
sandpaper, through Scotch tape, overhead projection film, magnetic
tape and discs to the ‘post-it’ notes) strongly supports their particular
ways of doing things.
One important feature about firm-specific behaviour of this kind is
that it can’t be copied easily – it has to be learned the hard way, through
experience, trial and error. Many firms have tried, for example, to
emulate 3M’s famous 15 per cent rule – a policy that encourages experi-
mentation and curiosity by allowing staff to ‘play around’ with ideas
and hunches for up to 15 per cent of their working time. This helps
create ‘space’ in which innovative ideas can flourish within 3M – but it
doesn’t necessarily transplant to other companies. Instead, they need
to develop their own particular way of making some ‘space’ (Augsdorfer,
1996).
The particular bundle of structures, policies, procedures and other
‘ways of working’ – essentially the organization’s behavioural routines –
which define the ‘way we manage innovation’ in a particular firm can
be called its ‘innovation capability’. For example, at Hewlett Packard
researchers are encouraged to spend up to 10 per cent of time on their
own pet projects, and have 24-hour access to laboratories and equip-
ment. The company tries to keep divisions small to focus team efforts.
162 Strategic operations management
Innovation – managing the renewal of the business 163
In the pharmaceutical company Merck, researchers are given time and
resources to pursue high-risk, high-pay-off products, whilst in Johnson
& Johnson the principle of ‘freedom to fail’ is a core corporate value.
General Electric lays particular stress on jointly developing products
with customers – for example, this approach helped develop the first
thermoplastic body panels for cars through joint work with BMW
(Mitchell, 1991).
So what are the key routines? What do strategic operations managers
need to consider in tackling the problem of managing innovation? In
essence, the task is one of developing capability so that the organization
has appropriate and effective structures and procedures for making the
process work. Table 4.3 lists some of the main capabilities required.
For each of these areas there is now a wealth of experience about
how other organizations have tackled the problem – some more success-
fully than others. There are also many tools and techniques that can be
used to help with the process. For example, the problem of scanning
the environment for signals about relevant triggers can be dealt with
using an extensive armoury of tools, ranging from various kinds of
market and competitor analysis (e.g. benchmarking, market surveys),
through forecasting tools (technological, market, social, etc.) to com-
plex procedures for ‘hearing the voice of the customer’ and translat-
ing this into action plans throughout the organization.
Similarly, the question of strategy formulation is one of analysis (what
could we do?), fit (given our positioning and our resource/experience
base, what should we do?), choice (what are we going to do and what
are the opportunity costs of particular commitment decisions?) and
planning (how are we going to do it?). Again, there are many tools and
techniques available to help with each of these issues, and the same is
true of the remaining stages in the innovation process.
We can break this capability analysis down further, into four key
areas, as shown in Table 4.4. From this we can begin to focus on some
key tools, techniques, structures and other enabling routines that can
be deployed to help manage the process. (We do not have the space to
discuss them in depth in this chapter, but references to further infor-
mation are given.) It is also possible to use this research-derived model
to develop frameworks against which innovation management can be
audited and through which learning can be facilitated by looking at
examples of firms who manage particular aspects well. Examples of
such audit frameworks include process models, innovation climate
audits, innovation performance measures and innovation network
maps (Ekvall, 1990; Chiesa et al., 1996; Francis, 2001; Tidd et al., 2001;
Design Council, 2002).
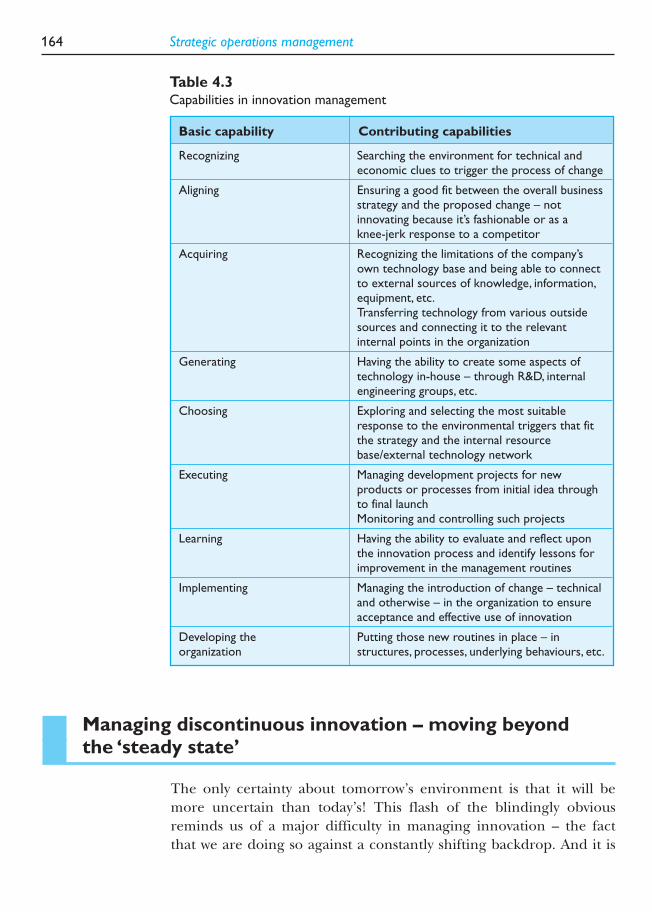
164 Strategic operations management
Managing discontinuous innovation – moving beyondthe ‘steady state’
The only certainty about tomorrow’s environment is that it will be
more uncertain than today’s! This flash of the blindingly obvious
reminds us of a major difficulty in managing innovation – the fact
that we are doing so against a constantly shifting backdrop. And it is
Table 4.3Capabilities in innovation management
Basic capability Contributing capabilities
Recognizing Searching the environment for technical and economic clues to trigger the process of change
Aligning Ensuring a good fit between the overall business strategy and the proposed change – not innovating because it’s fashionable or as a knee-jerk response to a competitor
Acquiring Recognizing the limitations of the company’s own technology base and being able to connect to external sources of knowledge, information,equipment, etc.Transferring technology from various outside sources and connecting it to the relevant internal points in the organization
Generating Having the ability to create some aspects of technology in-house – through R&D, internal engineering groups, etc.
Choosing Exploring and selecting the most suitable response to the environmental triggers that fit the strategy and the internal resource base/external technology network
Executing Managing development projects for new products or processes from initial idea through to final launchMonitoring and controlling such projects
Learning Having the ability to evaluate and reflect upon the innovation process and identify lessons for improvement in the management routines
Implementing Managing the introduction of change – technicaland otherwise – in the organization to ensure acceptance and effective use of innovation
Developing the Putting those new routines in place – in organization structures, processes, underlying behaviours, etc.

Innovation – managing the renewal of the business 165
clear that some trends in the current environment are converging to
create conditions that many see as rewriting the rules of the compet-
itive game.
Certainly there are big changes taking place in the environment in
which we have to try and manage innovation, and in this unit we will
look at some of the major forces underpinning such change. Whilst
there is no room for complacency, we should also not be in a hurry to
Table 4.4Four key areas in innovation
Capability area Key capabilities Enabling routines
Strategic focus and direction Inspiring ‘visionary leadership’ Top teamworking (Francis and Young,Targeting key strategic areas 1988)Making strategy Benchmarking, competitor analysis,Communicating and customer focus (Camp, 1989; Voss,deploying strategy 1992)
Strategy process (Porter, 1985,1990; Francis, 1994)Policy deployment (Bessant and Francis, 1999)
Implementation Managing projects Appropriate project structures (line,Managing risk matrix, project, heavyweight project)Developing technology (Wheelwright and Clark, 1992)and market in parallel Project team building (Thamhain and Cross-functional working Wilemon, 1987; Kharbanda and
Stallworthy, 1990)Stage gate process (Cooper, 1988a,b)Early involvement (Souder and Sherman, 1994)Cross-functional working‘Simultaneous’ engineering
Innovative people and Structuring Appropriate design (Mintzberg, 1979)organization Teamworking Team building (Bixby, 1987; Holti
Managing knowledge et al., 1995)Participating in continuous Knowledge management tools (Nonaka,improvement 1991; Pisano, 1994; Quintas et al., 1997)Empowering Training and development
Continuous improvement tools and techniques (Lillrank and Kano, 1990;Robinson, 1991; Bessant, 1999)
Effective linkages Active networking Customer involvement tools and Involving customers and procedures, QFD (Akao, 1990; Shillito,suppliers 1994)
Supplier development (Lamming, 1993)Technology transfer (UNIDO, 1995;Rush and Bessant, 1998)

throw away the basic principles on which innovation management is
based; they will certainly need adapting and configuring to dramat-
ically new circumstances, but underneath the innovation management
puzzle is what it always was – a challenge to accumulate and deploy
knowledge resources in strategically effective fashion.
Innovation involves some change in either the thing that is offered
(product innovation) or the ways in which that offering is created and
delivered (process innovation). Change in these takes place mostly in
a continuing, incremental way, but sometimes in a radical and discon-
tinuous jump. Occasionally, the two take place simultaneously – and
under these conditions particularly we are likely to see the rules of the
game shifting.
Consider the current emergence of the Internet and related infor-
mation and communication technologies (ICTs) as examples of the
powerful forces shaping the competitive environment and arguably
rewriting the rules of the game. Let’s look, for example, at their impact
in the world of publishing.
On the one hand, we have an industry that was, until recently, based
on very physical technologies and a complex network of specialist sup-
pliers who contributed their particular parts of the complex puzzle of
publishing. For example, copy – words or pictures – would be gener-
ated by a specialist journalist or photographer. He or she would then
pass this on to various editors, who would check, make choices about
design and layout, etc. Next would come typesetting, where the phys-
ical materials for printing would be made – hot metal would be cast into
letters and grouped into blocks to form words and sentences within
special frames. Pictures and other items would be transferred on to
printing plates. The type frames or printing plates would then be fixed
to presses, these would be inked and some test runs made. Finally, the
printed version would appear – and pass on to someone else to distrib-
ute and publish it.
Such a method might still be recognizable by Messrs Caxton and
Gutenberg – the pioneers of the printing industry. But it is a fair bet
that they would not have a clue about the way in which publishing
operates today – with its emphasis on information technology. Now the
process has changed such that a single person could undertake the
whole set of operations – create text on a word processor, design and
lay it out on a page formatting program, integrate images with text
and, when satisfied, print to either physical media or, increasingly, pub-
lish it worldwide in electronic form.
There are plenty of examples of firms that have exploited the oppor-
tunities that this kind of change creates (Evans and Wurster, 2000;
166 Strategic operations management

Pottruck and Pearce, 2000). The challenge of disruption has prompted
many others to rethink the business models that operate – and to try
and rewrite the rules of the game. The author Stephen King, for
example, has made a number of attempts to move beyond the tradi-
tional relationships between writers and publishers, and particularly to
publish directly via the Internet. In his latest venture, he has taken this
a step further; his new book is being written chapter by chapter and
will only appear if enough people ask for it. He has moved from the trad-
itional model of writing in the hope of readers, to the point where he
is effectively writing on demand – much like a factory nowadays often
operates on a make-to-order basis only.
There are winners in this game but also losers. People still think of
the Encyclopaedia Britannica as a household name and the repository of
useful reference knowledge that can be trusted. It is a well-established
product – in fact, the original idea came from three Scottish printers
back in 1768! The brand is fine – but the business has gone through
dramatic shifts and is still under threat. From a peak of sales in 1990 of
around $650 m its sales have collapsed – for example, by up to 80
per cent in the USA. The problem is not the product but the way in
which it is presented – all the hard copy encyclopaedias have suffered
a similar fate at the hands of the CD-ROM-based versions like Encarta
(which is often bundled in as part of a PC purchase).
We could go on looking at the publishing industry but the point is
clear – when technology shifts dramatically it opens up major oppor-
tunities but also poses major threats to players in the industry and to
those who might want to enter from outside. Under these conditions
simply being an established player – even with a centuries-old brand
name and an excellent product – is not enough. Indeed, as firms like
Amazon.com (an online bookstore) have shown, it is at times like
these that coming from outside and starting fresh may offer significant
advantages.
What is going on here is clearly not conforming to a stable, big-is-
beautiful model, nor is it about historically important emphasis on
core competence. The foundations of a business like publishing
become shaken and many of the famous names disappear, whilst other
unknown upstarts become major industry players – in some cases
overnight! (To put that in perspective, Amazon.com was at one time
worth more than established businesses like British Airways!)
Turbulence like this throws a challenge to established models of man-
aging – not only is it a question of urgently needing to change, but the
very models of change management on which many traditional players
rely may not be sufficient or appropriate.
Innovation – managing the renewal of the business 167

168 Strategic operations management
Perhaps the hardest challenge is that ‘more of the same’ may not be
enough under these conditions. Even firms that have a good track
record in innovation and who seek regularly to improve their products
and processes are vulnerable. Doing what you do better may not always
work – sometimes you have to look to do different things. This is not to
say that we have to rewrite the entire rule book – if we do that we risk
throwing the baby out with the bathwater. Closer examination of the
above successful cases – and many others that have been researched –
shows that those firms that do well look to merge new ideas and models
about how to do business with established good practices. For example,
Amazon have succeeded not only by exploiting the new opportunities
created by the Internet, but also by employing well-established prin-
ciples like listening to their customers, ensuring a total quality approach
in their dealings with them, encouraging widespread incremental
innovation to continuously improve their service offering, etc.
Innovation theory is helpful here, at least insofar as showing that
change of this kind is not uncommon. Indeed, it is a consequence of
Schumpeter’s concept of ‘creative destruction’. (Joseph Schumpeter
was a famous economist who, more than anyone else, worked on the
economics of innovation and established much of the theory that
underpins its management.) Entrepreneurs in his model are con-
stantly seeking for ways to achieve an edge that no one else has in the
competitive market-place. This could come from a new product or
process, or at least a better one than the rest can offer. The result is that
for a short time, if successful, he or she will be able to reap a handsome
rent – what Schumpeter calls monopoly profits. Of course, sooner or
later many imitators come in, copying or finding better alternatives,
often ingeniously getting round patent and other protection – but the
overall effect is to create a swarm of innovations and to drive the economy
forward (Freeman, 1982; Coombs et al., 1985).
Implicit in this model is the idea that if the entrepreneur is lucky, he
or she may come up with a ‘killer application’ – a product or process
innovation that not only offers something dramatically new, but that
simultaneously makes the old ones obsolete. Under these conditions
the rules of the game are rewritten – and there is a shakeout of the old
and new winners and losers.
Experience and theory tells us that (a) this kind of discontinuous
change happens regularly, often at the level of a sector or branch, less
so at the level of the whole economy, and that (b) when it does the old
incumbent players are often not very successful at making the transi-
tion. New entrants tend to thrive partly because they are small and fast
moving (and have little to lose), and partly because they do not come

Innovation – managing the renewal of the business 169
encumbered with the baggage of their past experience. They only have
to learn new tricks, whereas old players have to unlearn old ones as well
(Utterback, 1994; Christensen, 1997).
But it isn’t just a form of corporate Darwinism in which the thrusting
young players overturn the old order; history suggests that a significant
number of older players do survive and prosper through discontinuity.
And we shouldn’t forget that we hear about the few small new firms
that enter successful, but conveniently ignore the large number of fail-
ures amongst this size range. (Think about the current crop of
Internet fatalities – boo.com, clickmango.com, etc. Small businesses
are easy to start but also very vulnerable to even minor infections.)
We have learned that under discontinuous conditions there are
strategies and responses that can help. Although the technological and
market shifts are dramatic, the basic innovation management issues
remain. In particular, impacts vary, from niches where the rules change
through to sectors through to – very occasionally – the whole economy.
It is important to be clear about what’s going on and its implications –
and this means that firms will need sensitive antennae and a strong
future orientation. If anything, effective management of the scanning
phase becomes even more critical.
We have seen that even large and long-established firms are not
immune from the forces of disruptive change. It’s worth reflecting on
the fact that most firms don’t live all that long – for example, of the
firms comprising the Dow Jones index of the largest businesses in the
USA in 1900, only one firm (out of 250) made it through to the year
2000! But equally there are survivors and firms that have managed to
stay around and to thrive and prosper. When we look more closely at
these, we can see two important themes for our interest in managing
innovation (de Geus, 1996).
First, these firms do not survive because of their scale or their phys-
ical assets. The thing that enables them to survive is a deep knowledge
base – a core competence that defines what they’re distinctively good
at and that others find hard to match. This could take many forms. It
might be a specific technology – for example, the Pilkington Company
in the UK has the patents on the process by which most of the world’s
flat glass is made – so it has some measure of defence against shocks by
virtue of this knowledge base. In most cases, the core competence of a
firm is much more than just a set of patents or a specific knowledge set –
for example, Sony’s skills lie in being able to link electronics, mini-
aturization, design and good customer understanding to make them the
respected player they are in consumer electronics. Canon does the same
in imaging because of competence built up from mixing electronics and

170 Strategic operations management
optics. 3M have deep skills in coating technology down to sub-molecular
level – but they are also extremely capable in the field of regular prod-
uct innovation, so their competence lies in being able to build a busi-
ness out of technological knowledge (Hamel and Prahalad, 1994).
The second point is even more important, though. What separates
the survivors from the rest is not just that they have core competence,
but that they actively manage this side of their business. And a key fea-
ture in such management is knowing when you have to build it (for
example, by making strategic investments in R&D or in acquiring
knowledge which you need to add) – but also when you have to let it
go. Letting go of knowledge you no longer need is simple in concept
but very hard to achieve in practice.
We can see this in the case of a firm like Nokia – a large company that
began as a forestry business in the nineteenth century. It diversified and
acquired many different areas of knowledge – some would say too many,
since its product range at one time ran from pulp and paper right
through to Wellington boots! But in the late twentieth century it focused
on electronics and particularly on mobile communications – and let the
other competencies go. By the year 2000 it was entirely a mobile tele-
communications business.
Table 4.5 gives some other examples of firms that have survived but
that have done so by being prepared to take on new knowledge and to
let go other sets of knowledge when needed.
An important piece of work was done on this theme of competence
by two US writers, Tushman and Anderson (1987). Their paper looked
at the historical evidence from a wide range of industries that had
faced discontinuous change and they identified that there were two
ways in which a new technology could affect an industry. On the one
hand, it could be what they called ‘competence enhancing’ – that is, it
actually extended the range of things a firm could do and built on what
they already knew. Examples might be the jet engine, which didn’t
knock aircraft makers out of the sky but rather enhanced their ability
to deploy what they knew about aerodynamics, control systems, etc.
On the other hand, there are technologies that they term ‘compet-
ence destroying’ – which have the capacity to make redundant all the
knowledge that a firm has accumulated over many years and on which
it has built its business. A good example here would be those printing
and publishing firms we looked at earlier, where much of what they knew
about how to make physical printing plates and typesetting operations
becomes irrelevant in an era of digital imaging and communication.
Kodak faces a significant challenge of this kind. Founded around
100 years ago, the basis of the business was the production and

processing of film and the sales and service associated with mass-mar-
ket photography. Whilst the latter set of competencies are still highly
relevant (even though camera technology has shifted), the move away
from wet physical chemistry in the dark (coating emulsions onto film
and paper) to digital imaging represents a profound change for the firm.
It needs – across a global operation and a workforce of thousands – to
let go of old competencies that are unlikely to be needed in the future
whilst at the same time rapidly acquiring and absorbing cutting-edge
new technologies in electronics and communication.
What does this mean for our question of how to manage discontinu-
ous innovation? The challenge posed by this model is one of making
sure firms understand the nature of the changes coming at them. If
they are competence enhancing, the innovation management ques-
tions are around how best to build on this new opportunity, how to
acquire complementary and new competence, and to merge these with
what already exists. But if the technology is competence destroying,
the challenge is how to let go of redundant competencies and move
quickly into the new era.
History tells us that such strategic riding of the waves of change is
possible – but not for everyone. Typically, when discontinuous change
171 Strategic operations management
Table 4.5Examples of radical transitions in business
Company Origins Current basis of business How they moved
Preussag Prussian state-owned Largest integrated tourism Had transport interests to move mining and smelting operator in Europe – coal, iron ore, etc. Moved into company owns Thomas Cook, shipping and other transport.
Hapag-Lloyd, Thomson From there, into airline business Holidays, etc. and exploiting growth of leisure
and service industry
ICI-Zeneca 19th century UK Major international Demerger of heavy chemicals chemical industry – pharmaceutical firm and commodity businesses andalkalis (Astra-Zeneca) concentration on high-value
‘precision’ chemistry business
Mannesman 19th century inventors Major European player in From steel pipes to steel of the seamless steel mobile telephones – sold production and downstream tube – basis of all pipes to Vodafone in 1998 applications. Let go of steel and
concentrated on increasingly sophisticated downstream machinery and from there movedinto control technology. Fromthere into data communications and from there into mobile phones

172 Strategic operations management
Competence enhancing Competence destroying
Pro
du
ct
Pro
cess
Technological discontinuities
LSI to VLSIMechanical to
electric typewriters
Catalytic crackingto reforming
Branch to directline banking
Float glassNatural to
synthetic gemsXerography
AutomobilesTransistors
Electric light-bulbDigital imaging
Figure 4.8
Dimensions of
technological
discontinuity.
happens, most of the incumbent firms don’t make a very good show of
moving forward. This is partly because they are so committed – not just
in terms of fixed assets but also in terms of their underlying psychology –
to the old model. Letting go is not easy – shrugging off the knowledge
base that might have been the original source of strength for the com-
pany is not something that comes easily. For the same reason, new
entrants usually do well under conditions of discontinuity – because
they are carrying less baggage and have nothing to let go of.
Figure 4.8 summarizes the key dimensions associated with this view
of change.
The idea of looking at technologies in terms of whether they are likely
to enhance or destroy our existing competencies has a lot of power. But
we need to be careful – as two US writers, Henderson and Clark (1990),
point out. Change, whilst dramatic, may not affect the entire business.
Their concept of component and architectural innovation is relevant
here – firms need to develop the ability to see which parts of their activ-
ity are affected by technological change and to react accordingly.
They suggest that we need to recognize that in most industries the
core product or service is not a single thing, but actually made up of
different components configured into a system or architecture. For
example, a motor car is not a single thing but a complex assembly
of chassis, wheels, engine, body and control systems. A bank is not
simply a building where money is kept, but a complex arrangement of

Innovation – managing the renewal of the business 173
components concerned with customer service, information processing,
inter-bank transactions, etc.
Viewed in this way, we can see that even major technological changes
do not necessarily destroy the whole business – they may only affect
one part of it. Our example of Kodak earlier is correct in that the film
manufacture and processing side of the business is facing competence-
destroying change in the shift from wet chemistry to digital imaging.
But this does not necessarily threaten other aspects of the business –
for example, the camera and photographic equipment side. In fact,
the impact of technology here is probably competence enhancing –
digital technology opens up the chance to configure lenses and other
elements in new and more powerful ways.
So, in managing discontinuous changes we need to learn not only to
assess whether or not they are competence enhancing or destroying,
but also which parts of our business are affected in which ways. In some
cases, change at the component level opens up new opportunities – for
example, new materials or propulsion systems like fuel cells – may
open up new options for vehicle assemblers, but will not necessarily
challenge their core operations. However, the shift to MP3 as an
alternative way of creating and distributing music via the Internet
poses challenges to the whole system of music production and pub-
lishing, and may require a much more significant response.
Figure 4.9 highlights the key dimensions here and gives some examples.
Overturned
Un
ch
an
ged
Core concepts
Reinforced
Lin
ks c
han
ged
Architecturalinnovation
Incrementalinnovation
Modularinnovation
Paradigm changinginnovation
Figure 4.9
Architectural and
component
innovation.

174 Strategic operations management
An example of where change that is discontinuous and competence
destroying for some businesses whilst opening up opportunities for
others can be seen is the case of Internet retailing. Although much of
the discussion of the Internet and innovation focuses on new services
and processes enabled by the network, we should not forget the new
opportunities opened up around the edge of this phenomenon. Much
potential exists for innovation in the products and technologies sus-
taining the network itself – for example, the fibre optics, switches,
routers, etc. that make the Internet physically possible. One of the
problems posed by the Internet revolution, especially in the area of
online retailing, is the so-called ‘last mile’ question. Even for conven-
tional mail- or telephone-order shopping, one problem is the fact
that you need to be at home or arrange for someone to sign for/
receive/store your package of books, computer parts, CDs or whatever.
And very often the suppliers won’t commit themselves to a definite
time for the delivery but only to, at best, a time window.
Don’t forget the demand side!
The danger in spending all our time looking at technological discon-
tinuities is that we forget the key point about innovation – that it always
arises out of a combination of needs and means. Sometimes the main
impetus comes from the opportunities created by a new technological
discovery, but sometimes it will be the emergence of strong signals
about demand. Under these circumstances, necessity becomes the
mother of invention. Part of the problem with much of the Internet
hype at present is the absence of clear demand for all the wonder-
ful new products and services that can be configured to exploit the
great technological opportunities made available by information
technology.
When we look at the problem of discontinuity – and particularly
about where and how we look for signals – we need to be aware that
these could come from the market-place as much as from the techno-
logy development labs. This point comes through very clearly in influ-
ential work by Christensen (1997). He made a detailed study of the
hard disk drive industry and how it has evolved and changed over the
past 30 years. His argument is that this represents a good test case from
which we can learn some valuable lessons about how innovation works
and particularly how disruptive technologies operate.
Although perhaps not on a par with the complete redefinition of an
industry that the Internet represents to many service businesses, the

Innovation – managing the renewal of the business 175
pattern of change in disk drives has been dramatic. It is possible to
identify several generations – but more importantly the transition
between them has not been smooth. The size and shape of the drives
and the underlying technologies have all jumped – and significantly
the firms associated with leading the change at each wave were differ-
ent. So too was the industry structure – firms that were leaders in one
generation did not always do well in making the transition.
This partly confirms the theme we have already explored – that old-
established players find it harder to move than newcomers do. But
Christensen adds another important dimension. He suggests that the
good business practice of staying close to your customers may not
always be the best strategy in times of rapid technological development.
If you work closely with a major customer you will soon become part of
a closed system in which innovation happens but at a pace and in a
direction that is defined by the users in terms of their prior experience
and the technology suppliers in terms of the problems they already
know how to solve.
Christensen’s point is that the significant jumps in disk drive techno-
logy arose not from listening to these markets, but rather from picking up
on weak signals from customers and potential customers right at the
fringe. These players weren’t large and were often not particularly well
known in their sector. They were essentially working at the fringe and had
requirements that were not of interest to the mainstream players – for
example, for smaller size, higher capacity or access speed. But it was their
ideas that actually set the pace of change to the next generation, with the
result that what began as fringe concepts became mainstream designs.
He introduces two useful concepts to our discussion – those of ‘sus-
taining’ and ‘disrupting’ technologies. Sustaining technologies enable
continuous progress within an existing set of market relationships and
it is here that staying close to the customer works well as a recipe for
continuing successful innovation. But ‘disrupting’ technologies do just
that – they threaten to change the rules of the game and to open up
opportunities for new markets to emerge.
Once again, in innovation management this places the emphasis on
building effective scanning mechanisms, and for ensuring that the sig-
nals generated get heard within the organization and not filtered out
because they conflict with the established view – the ‘not invented here’
problem. This is by no means an unfamiliar problem – imagine a well-
established company in the photocopier business being faced with two
proposals on a Monday morning. One is from a salesman who is working
closely with a big corporate client and has brought back some ideas
from a meeting with that client that could lead to modifications and

176 Strategic operations management
improvements to the existing range of copiers. His views are likely to be
taken seriously, the procedures for transmitting them to the design and
development team are in place, and the whole proposed innovation
has an aura of managed risk about it. It will probably succeed – at least
as far as getting a product on the market that the client likes.
But consider another salesman who spent Friday night in a bar with
a couple of computer whiz-kids with some crazy ideas about the hand-
held device of the future. Their view is that incorporating scanning
and printing technology into the package would give it a sharp edge in
the emerging market for portable and personal computing/commun-
ications. The challenge would be to make a copier much smaller and
that would demand very different power and other arrangements.
Presenting these ideas on a Monday morning would probably incur
disapproval and they could well be dismissed as the dreams of a couple
of cranks. The salesman would not be encouraged to do this – either
by his unreceptive colleagues or by the reward system, which may well
be based on sales targets that are easier to achieve by working with
established customers on incremental innovation.
In fact, this demonstrates well Christensen’s principle. In the first
case, the salesman’s proposals are for innovation – but in a controlled
sense, working to clearly specified user needs and within a sustaining
Disrupting
Dis
rup
tin
g
TechnologySustaining
Mark
et
su
sta
inin
g
Incremental technicaland market
development –consolidate
Open up newmarkets via newdeployment of
existing technology
Radical technology �new markets �
major shifts
Radical technology butclose to existing
markets – they may notsee the need to change
Figure 4.10
Christensen’s model
of market and
technological
disruption.

Innovation – managing the renewal of the business 177
technology envelope. But in the second, we are in the realms of high
risk and uncertainty, and with a requirement for a technology that – if
it is eventually feasible – might well disrupt the industry.
Sticking close to the customer remains a good prescription, but
innovation managers need to complement it with additional structures
or mechanisms that also allow the possibility of disruptive techno-
logy. Firms have to find a way of resolving what Christensen calls ‘the
innovator’s dilemma’ – otherwise, they risk being caught out when
disruption occurs. Figure 4.10 summarizes the key points of this
approach.
Looking forward …
We have seen in this chapter the growing recognition of innovation as
a core business process, something essential to the renewal and indeed
the survival of the enterprise. Our thinking has moved it from the
periphery of the organization to the centre of the stage, and the cre-
ation and management of suitable routines and structures to enable
innovation is a key role for strategic operations. But we need in the
future to look more closely at the key components of innovation – and
to manage these for competitive advantage.
Knowledge management
Three themes are worth mentioning here. First, we need to recognize
that innovation is always a race in which front runners are constantly
being chased and caught. Finding something that confers sustainable
and protectable competitive advantage is a key challenge – and we
have come to realize that in a global economy this is not an easy task.
In particular, advantages of location, of access to cheap labour or raw
materials is not often sustainable – because globalization means that
others can move somewhere with similar or better factor endowments.
Even technology is not a good solution – having a machine with power-
ful and clever capabilities is not really an edge, since anyone else with
deep enough pockets can also buy such a machine or, if the underlying
technology is protected, they can reverse engineer or even steal the
ideas!
For these reasons we are beginning to think of competitive advan-
tage as lying fundamentally in knowledge – in what we know about and

178 Strategic operations management
can deploy in new products or processes. This places emphasis on the
aspects of innovation to do with acquiring, capturing and managing
the knowledge bases of the firm as the key task (Teece, 1998).
Thinking in this way brings a new perspective to the task of managing
innovation – we need to recognize that innovation is essentially a
knowledge creating and deploying process (Leonard-Barton, 1992).
Developing the capacity to learn becomes central to strategic oper-
ations management.
Involvement
The second challenge for the future lies in the area of involvement. In
the past, and still to a large extent in today’s innovation operations,
there is an emphasis on specialists – those who, by virtue of possessing
particular skills or experiences, are ‘licensed’ to participate in the
innovation process. It is true that such people have been central to the
creation of all the radical innovations we have been speaking about
in this chapter – but they represent a small part of the total work-
force in most organizations. Yet innovation is primarily the application
of a fundamental human skill – that of creative problem-solving.
This is something with which everyone in the organization could
potentially make a contribution – and the relatively few studies that
have been done on high levels of involvement in innovation support
this view. In recent years, we have seen some dramatic examples – for
instance, the transformation of Japanese manufacturing from its
weak base in the 1950s to world-class by the 1980s – and we now under-
stand that much of this can be related to high involvement of
people in the innovation process. Where a firm like Toyota receives
over two million ideas per year and does so over a 30-year period it
becomes clear that it has learned to harness considerable innovative
resources.
The challenge for strategic operations management is making high
involvement a reality. It sounds simple. As one manager put it, ‘now
I see the potential – with every pair of hands you get a free brain!’ The
difficulty is finding ways to mobilize such involvement and to sustain it
in the long term.
Sustainability
The final area in which there are significant future challenges for the
strategic operations manager in managing the innovation process lies

Innovation – managing the renewal of the business 179
in the concept of sustainability. One of the implicit problems in innova-
tion is that it assumes anything is possible, that there is always some-
thing new in product or process. The trouble with this view is that it
ignores the fact that we live on a planet with finite resources, many of
which are not renewable. Increasingly, there is public concern about
changes that appear to have negative effects on the world we live in or
on quality of life – not just for ourselves but throughout the value chain
from raw material to finished product. People like new designs in fur-
niture, for example – but are no longer so interested when they find
that such innovative products are made by destroying a non-renewable
teak forest in Indonesia.
Thinking about more sustainable products and forms of consump-
tion is becoming increasingly important and affecting many aspects of
operations management. The challenge in the context of innovation is
to harness the creativity within the organization to find product and
process ideas that contribute to sustainability whilst also preserving
and developing business opportunities.
Case: Bags of ideas – the case of James Dyson
In October 2000, the air inside Court 58 of the Royal Courts of Justice rang with terms like ‘bagless dust col-lection’, ‘cyclone technology’, ‘triple vortex’ and ‘dual cyclone’ as one of the most bitter of patent battles inrecent years was brought to a conclusion. On one side was Hoover, a multinational firm with the eponymousvacuum suction sweeper at the heart of a consumer appliance empire. On the other a lone inventor – JamesDyson – who had pioneered a new approach to the humble task of house cleaning and then seen his effortsthreatened by an apparent imitation by Hoover. Eventually the court ruled in Dyson’s favour.
This represented the culmination of a long and difficult journey that Dyson travelled in bringing his ideas toa wary market-place. It began in 1979, when Dyson was using, ironically, a Hoover Junior vacuum cleaner todust the house. He was struck by the inefficiency of a system that effectively reduced its capability to suck themore it was used, since the bag became clogged with dust.He tried various improvements, such as a finer meshfilter bag, but the results were not promising.The breakthrough came with the idea of using industrial cyclonetechnology applied in a new way – to the problem of domestic cleaners.
Dyson was already an inventor with some track record;one of his products was a wheelbarrow that used a ballinstead of a front wheel. In order to spray the black dust paint in a powder-coating plant they had installed acyclone – a well-established engineering solution to the problem of dust extraction. Essentially a mini-tornadois created within a shell and the air in the vortex moves so fast that particles of dust are forced to the edge,wherethey can be collected whilst clean air moves to the centre. Dyson began to ask why the principle could not beapplied in vacuum cleaners – and soon found out why. His early experiments – with the Hoover – were not entirelysuccessful, but eventually he applied for a patent in 1980 for a Vacuum Cleaning Appliance using cyclone technology.
It took another 4 years and 5127 prototypes, and even then he could not patent the application of a singlecyclone, since that would only represent an improvement on an existing and proven technology. He had todevelop a dual cyclone system, which used the first to separate out large items of domestic refuse – cigaretteends, dog hairs, cornflakes, etc. – and the second to pick up the finer dust particles. But having proved the tech-nology, he found a distinct cold shoulder on the part of the existing vacuum cleaner industry represented by
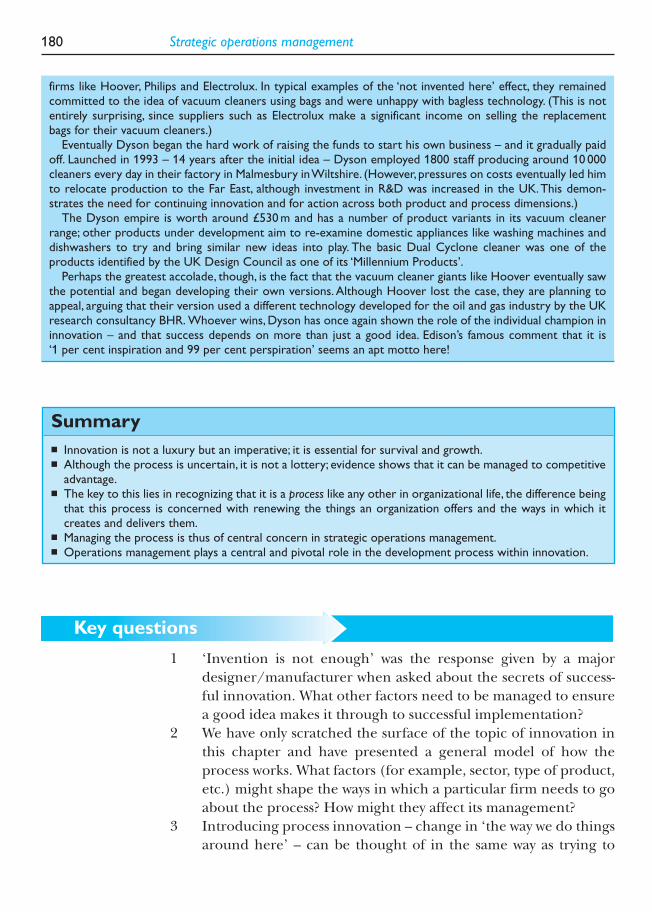
180 Strategic operations management
Summary
■ Innovation is not a luxury but an imperative; it is essential for survival and growth.■ Although the process is uncertain, it is not a lottery; evidence shows that it can be managed to competitive
advantage.■ The key to this lies in recognizing that it is a process like any other in organizational life, the difference being
that this process is concerned with renewing the things an organization offers and the ways in which it creates and delivers them.
■ Managing the process is thus of central concern in strategic operations management.■ Operations management plays a central and pivotal role in the development process within innovation.
Key questions
1 ‘Invention is not enough’ was the response given by a major
designer/manufacturer when asked about the secrets of success-
ful innovation. What other factors need to be managed to ensure
a good idea makes it through to successful implementation?
2 We have only scratched the surface of the topic of innovation in
this chapter and have presented a general model of how the
process works. What factors (for example, sector, type of product,
etc.) might shape the ways in which a particular firm needs to go
about the process? How might they affect its management?
3 Introducing process innovation – change in ‘the way we do things
around here’ – can be thought of in the same way as trying to
firms like Hoover, Philips and Electrolux. In typical examples of the ‘not invented here’ effect, they remainedcommitted to the idea of vacuum cleaners using bags and were unhappy with bagless technology. (This is notentirely surprising, since suppliers such as Electrolux make a significant income on selling the replacement bags for their vacuum cleaners.)
Eventually Dyson began the hard work of raising the funds to start his own business – and it gradually paidoff. Launched in 1993 – 14 years after the initial idea – Dyson employed 1800 staff producing around 10 000cleaners every day in their factory in Malmesbury in Wiltshire. (However, pressures on costs eventually led himto relocate production to the Far East, although investment in R&D was increased in the UK.This demon-strates the need for continuing innovation and for action across both product and process dimensions.)
The Dyson empire is worth around £530 m and has a number of product variants in its vacuum cleanerrange; other products under development aim to re-examine domestic appliances like washing machines anddishwashers to try and bring similar new ideas into play. The basic Dual Cyclone cleaner was one of the products identified by the UK Design Council as one of its ‘Millennium Products’.
Perhaps the greatest accolade, though, is the fact that the vacuum cleaner giants like Hoover eventually sawthe potential and began developing their own versions. Although Hoover lost the case, they are planning toappeal, arguing that their version used a different technology developed for the oil and gas industry by the UKresearch consultancy BHR. Whoever wins, Dyson has once again shown the role of the individual champion ininnovation – and that success depends on more than just a good idea. Edison’s famous comment that it is ‘1 per cent inspiration and 99 per cent perspiration’ seems an apt motto here!

Innovation – managing the renewal of the business 181
launch a new product in the commercial market-place. What simi-
larities and differences might there be between the two, and what
messages emerge for successful management of both?
4 ‘Innovation is a survival imperative, not a luxury!’ Thinking of an
organization with which you are familiar, think about whether this
statement applies – and if it does, what kinds of innovation can
you trace in its history? What triggered them, and what difference
did they make?
5 In this chapter we have positioned innovation as a core process in
the business, concerned with renewing what the organization
offers and the ways in which it does so. This process operates in
parallel with those concerned with the present-day operations –
managing supply through to satisfying customers. Inevitably, there
will be points of conflict between managing today and building for
the future. Where do you think these ‘flashpoints’ might emerge –
and how would you deal with them as an operations manager?
References and further reading
Akao, Y. (ed.) (1990) Quality Function Deployment – Integrating Customer
Requirements into Product Design. Cambridge, MA: Productivity Press.
Augsdorfer, P. (1996) Forbidden Fruit. Aldershot: Avebury.
Bessant, J. (1999) Developing continuous improvement capability.
International Journal of Innovation Management, 4(2), 409–430.
Bessant, J. and Francis, D. (1999) Policy deployment and beyond.
International Journal of Operations and Production Management.
Bixby, K. (1987) Superteams. London: Fontana.
Booz, Allen & Hamilton (1982) New Product Management for the 1980s.
Booz, Allen & Hamilton Consultants.
Braun, E. and Macdonald, S. (1980) Revolution in Miniature. Cambridge:
Cambridge University Press.
Brown, S. (2000) Manufacturing the Future – Strategic Resonance for
Enlightened Manufacturing. London: Financial Times/Pearson Books.
Business 2.0, 22 August 2000.
Camp, R. (1989) Benchmarking – The Search for Industry Best Practices that
Lead to Superior Performance. Milwaukee, WI: Quality Press.
Chiesa, V., Coughlan, P. and Voss, C. (1996) Development of a tech-
nical innovation audit. Journal of Product Innovation Management,
13(2), 105–136.
Christensen, C. (1997) The Innovator’s Dilemma. Cambridge, MA:
Harvard Business Press.

182 Strategic operations management
Coombs, R., Saviotti, P. and Walsh, V. (1985) Economics and
Technological Change. London: Macmillan.
Cooper, R. (1988a) The new product process: a decision guide for
management. Journal of Marketing Management, 3(3), 238–255.
Cooper, R. (1988b) Winning at New Products. London: Kogan Page.
Cowell, D. (1988) New service development. Journal of Marketing
Management, 3(3), 296–312.
de Geus, A. (1996) The Living Company. Cambridge, MA: Harvard
Business School Press.
Design Council (2002) Living innovation. Design Council/Department of
Trade and Industry website: www.livinginnovation.org.uk, London.
Easingwood, C.J. (1986) New product development for service com-
panies. Journal of Product Innovation Management, 4, 264–275.
Ekvall, G. (1990) The organizational culture of idea management. In:
Henry, J. and Walker, D. (eds), Managing Innovation, pp. 73-80.
London: Sage.
Evans, P. and Wurster, T. (2000) Blown to Bits: How the New Economics of
Information Transforms Strategy. Cambridge, MA: Harvard Business
School Press.
Francis, D. (1994) Step by Step Competitive Strategy. London: Routledge.
Francis, D. (2001) Developing Innovative Capability. Brighton: University
of Brighton.
Francis, D. and Young, D. (1988) Top Team Building. Aldershot: Gower.
Freeman, C. (1982) The Economics of Industrial Innovation. London:
Frances Pinter.
Hamel, G. (2001) Leading the Revolution. New York: New American
Library.
Hamel, G. and Prahalad, C.K. (1994) Competing for the Future. Boston,
MA: Harvard Business School Press.
Henderson, R. and Clark, K. (1990) Architectural innovation: the
reconfiguration of existing product technologies and the failure
of established firms. Administrative Science Quarterly, 35, 9–30.
Holti, R., Neumann, J. and Standing, H. (1995) Change Everything at
Once: The Tavistock Institute’s Guide to Developing Teamwork in
Manufacturing. London: Management Books 2000.
Jones, P. (1996) Managing hospitality innovation. Cornell HRA Quarterly,
37(5), 86–95.
Jones, P., Hudson, S. and Costis, P. (1998) New product development
in the U.K. tour operating industry. Progress in Hospitality and
Tourism Research, 3(4), 283–294.
Kharbanda, O. and Stallworthy, M. (1990) Project Teams. Manchester:
NCC-Blackwell.
Innovation – managing the renewal of the business 183
Lamming, R. (1993) Beyond Partnership: Strategies for Innovation and
Lean Supply. Hemel Hempstead: Prentice Hall.
Leonard-Barton, D. (1992) The organisation as learning laboratory.
Sloan Management Review, 34(1), 23–38.
Leonard-Barton, D. (1995) Wellsprings of Knowledge: Building and
Sustaining the Sources of Innovation. Cambridge, MA: Harvard
Business School Press.
Lillrank, P. and Kano, N. (1990) Continuous Improvement; Quality Control
Circles in Japanese Industry. Ann Arbor: University of Michigan
Press.
Mintzberg, H. (1979) The Structuring of Organisations. Englewood Cliffs,
NJ: Prentice Hall.
Mitchell, R. (1991) How 3M keeps the new products coming. In: Henry, J.
and Walker, D. (eds), Managing Innovation. London: Sage.
Nayak, P. and Ketteringham, J. (1986) Breakthroughs: How Leadership
and Drive Create Commercial Innovations that Sweep the World.
London: Mercury.
Nelson, R.R. and Winter, S.G. (1982) An Evolutionary Theory of Economic
Change. Cambridge, MA: Belknap Press.
Nonaka, I. (1991) The knowledge creating company. Harvard Business
Review, November–December, 96–104.
Pisano, G. (1994) Knowledge, integration and the locus of learning: an
empirical analysis of process development. Strategic Management
Journal, 15, 85.
Porter, M. (1985) Competitive Advantage: Creating and Sustaining Superior
Performance. New York: Free Press.
Porter, M. (1990) The Competitive Advantage of Nations. New York: Free
Press.
Pottruck, D. and Pearce, T. (2000) Clicks and Mortar. San Francisco:
Jossey Bass.
Quintas, P., Lefrere, P. et al. (1997) Knowledge management: a stra-
tegic agenda. Long Range Planning, 13(3), 387.
Robinson, A. (1991) Continuous Improvement in Operations. Cambridge,
MA: Productivity Press.
Rush, H. and Bessant, J. (1998) Innovation agents and technology
transfer. In: Miles, I. (ed.), Innovation and the Service-based Economy.
London: Frances Pinter.
Scheuing, E.E. and Johnson, E.M. (1989) A proposed model for
new service development. Journal of Services Marketing, 3(2),
25–34.
Schumpeter, J. (1950) Capitalism, Socialism and Democracy. New York:
Harper & Row.

Shillito, M. (1994) Advanced QFD: Linking Technology to Market and
Company Needs. New York: John Wiley.
Souder, W. and Sherman, J. (1994) Managing New Technology
Development. New York:, McGraw-Hill.
Teece, D. (1998) Capturing value from knowledge assets: the new
economy, markets for know-how, and intangible assets. California
Management Review, 40(3): 55–79.
Thamhain, H. and Wilemon, D. (1987) Building high performance
engineering project teams. IEEE Transactions on Engineering
Management, EM-34(3), 130–137.
Tidd, J., Bessant, J. and Pavitt, K. (2001) Managing Innovation, 2nd
Edition. Chichester: John Wiley.
Tushman, M. and Anderson, P. (1987) Technological discontinuities
and organizational environments. Administrative Science Quarterly,
31(3), 439–465.
UNIDO (1995) Technology Transfer Management. United Nations
Industrial Development Organization.
Utterback, J. (1994) Mastering the Dynamics of Innovation. Cambridge,
MA: Harvard Business School Press.
Voss, C. (1992) Manufacturing Strategy. London: Chapman & Hall.
Wheelwright, S. and Clark, K. (1992) Revolutionising Product Development.
New York: Free Press.
Womack, J., Jones, D. and Roos, D. (1990) The Machine that Changed the
World. New York: Rawson Associates.
184 Strategic operations management

C H A P T E R
Managing inventory,MRP and JIT
5
Introduction
We have stated throughout the text that it is important to think of
manufacturing and services as a total offering to customers simply
because wonderful services without excellent products will count for
nothing; conversely, excellent products without good service is also
not acceptable for customers. When problems occur in the interface
between the two, the ‘moment of truth’ that we discussed in Chapter 1
becomes a major disappointment, as shown in the following mini-case.
Case: ToysRUs.com
‘eToys SUCKS!!!’ one customer shouts on a thread dubbed ‘Online Shopping Hell’. Another rants, ‘I doubt I will ever shop again online for Christmas. It is not worth the wait, lies, ill-informed customer service reps,and the hassle and stress.’
No brand did more to infuriate shoppers than toysrus.com. It kicked off the season with a big ad campaignthat lured thousands to the site – traffic jumped more than 300 per cent. But midway through the holidays, thecompany announced it could not guarantee delivery by Christmas day. When Shaun Lawson learned his orderswouldn’t arrive on time, he e-mailed the company to cancel. He received a form e-mail from toysrus.comtelling him orders could only be cancelled within 30 minutes of the time they were placed. After several moreattempts and a slew of form e-mail responses, an apoplectic Lawson fired off an e-mail he was sure the com-pany couldn’t ignore: ‘Your form letter is grossly insulting. Cancel the ****ing order (yes, that means do notship) and never bother me again.’ He posted his rant on a website so ‘others have an opportunity to learn frommy mistake’. Toys ‘R’ Us’s response came a few days later: ‘Dear Shaun Lawson: Thank you for contacting toysrus.com. Our records indicate that your order was shipped … and is en route to you!’
Source: The nightmare before Christmas, Fortune, 24 January 2000, 141(2).

186 Strategic operations management
Managing inventory successfully is not about technical solutions;
rather a key factor to bear in mind with inventory management is that
much of it is service related – it has to do with managing relationships
throughout the supply network (which we explore further in Chapter
6) and this is fully linked to service operations.
The purpose of this chapter is for the reader to:
■ understand the strategic significance of managing inventory;
■ gain insights into why tactical ‘solutions’ do not work;
■ appreciate how MRP (materials requirement planning), MRPII
(manufacturing resource planning) and JIT (just-in-time) can
be successful only if they are expertly managed within networks,
which we will discuss in depth in Chapter 6.
The problem – the tactical ‘solution’ to managing inventory
Many Western firms have tended to view inventory management as a ‘tac-
tical’ activity – this same ‘tactical’ attitude has also applied to operations
management in general. Consequently, purchasing and supply manage-
ment has been performed, in the main, at lower levels of the organization
and has been relegated to a reactive function – again, much like opera-
tions itself. In the West this has meant that purchasing has been seen as a
‘buying function’ responding to production requirements – after they
have been, in turn, determined by marketing. This mentality has
changed to some degree, as Industry Week pointed out:
Heading for box?
There was a time when top-ranking executives in manufacturing tended to distance themselves from suchoperational details as supply chain management or information sharing with upstream and downstream partners in the ‘value chain’ – that continuum of activities that ultimately delivers something of value to an endcustomer. In the past, company presidents and CEOs were more inclined to fret about internal politics and bottom-line earnings than plunge into the various intercompany relationships that can either elevate orundermine the ultimate success of a business. But, like last month’s stock price, that’s history.
Today, in many firms, executives at the highest corporate levels are driving the development of value-chainstrategies to enhance interactions with business partners. They’ve seen, for example, what innovative businessmodels have done for leading companies like Dell Computer Corp. and Cisco Systems Inc., shrinking inventory costs and accelerating the cash-to-cash cycle.
In adopting elements of the so-called virtual corporation – often through outsourcing – they are trying toleverage the efficiencies of their value-chain partners. And they are beginning to understand that all of thisrequires a higher level of collaboration and information sharing if they expect to improve not only the performance of their own companies, but also the overall performance of the value chains in which they

The degree to which a strategic view is really embraced by firms is
still unclear, although there is some evidence that there is a shift in
emphasis in how inventory is managed. This will be developed further
in the next chapter, but we will explore the strategic issues surround-
ing inventory in this chapter as well.
Looking back …
The perceived management wisdom between the 1950s and 1980s was
that a firm should try to vertically integrate as much as possible. So,
looking at Figure 5.1, the former desired aspiration was that, wherever
Managing inventory, MRP and JIT 187
participate.To varying degrees that’s true, whether their companies are ‘chain starters’ that supply raw materialsand components, mid-chain suppliers, finished-product manufacturers, distributors or direct marketers.
Executives in each of those segments – including 1309 who lead finished-product firms – were among themore than 2000 respondents to an Industry Week survey designed to assess the impact of effective value-chainstrategies and identify major obstacles to optimizing the performance of a value chain.
Among the major findings of the extensive research project, conducted in association with Ernst & Young,the New York-based management consulting firm, were these:
■ Nearly one-third of the survey participants (31.2 per cent) said that, in their companies, the CEO or president is ‘most responsible’ for value-chain-improvement initiatives. Another 33.6 per cent indicated that responsibility rested at the vice-president level.
■ More than half of the executives said that their firms have adopted – or are in the process of developing –formal value-chain strategies. Of the 36.7 per cent who now have formal strategies in place, a heavy majoritybelieve their efforts have been at least ‘somewhat effective’ – although only 26.1 per cent think the strategieshave been ‘highly effective’.
■ Only 13.3 per cent of the respondents rate the overall performance of the primary value chain that theyparticipate in as ‘very good’ or ‘excellent’ – indicating that there is considerable room for improvement.
■ Companies that have adopted formal strategies – and especially those with highly effective strategies – tendto be more successful in growing top-line revenues.
■ Intercompany pressures on pricing issues are the most common stumbling block to value-chain optimiz-ation. Fully 44.2 per cent of the executives cited pricing issues as a ‘major’ barrier, while 39.7 per centblamed poor communication.
A strategic imperative
Considering the level of executive involvement, value-chain management has clearly become ‘a strategic imperative’ in most companies, observes Robert Neubert, Ernst & Young’s national director of automotive and industrial products services. ‘It is not something that is being left to the purchasing department. It hasreached the highest levels in the corporation,’ he says.‘People see it as a key element of strategy.’
In smaller companies – those with revenues of less than $100 million – the president or CEO is most likelyto bear the primary responsibility for value-chain improvement, the IW survey found, while large companiesmore frequently assign vice-presidents the leading role.
Source: Industry Week, Now it’s a job for the CEO, 20 March 2000, p. 22.

possible, a firm would own all of the ‘supply chain’, or network. We use
the term ‘chain’ here because it is commonly used but, as we shall see
in Chapter 6, firms typically operate within networks, which are often
complex, rather than within linear, ‘chains’.
The reasons for the strategy of vertical integration were complex,
but included the following factors:
■ the need for control (including costs, assurance of delivery
and perceptions of quality) within the supply chain;
■ the possibility of diversification of business activities within
the firm’s business portfolio;
■ there was a commonly held belief that the ‘bigger we are, the
better we are’ and that owning activities – including entire
firms – within the supply chain could then be shown on the
balance sheet as an asset.
188 Strategic operations management
THE
Receiving
SUPPLY Retrieval
Conversion processCHAIN
Packaging
Transport
Warehouse/Retailing
Customer
Materialprocess
The key strategic questions
The questions for the firm are:1. What business are we in?2. Is it manufacturing or
assembly?3. Is it both?4. Is it neither?5. To what extent does the firm
want to own assets throughoutthe supply chain?
6. With which suppliers (andnumbers of suppliers) does thefirm want to have strategiclong-term relationships?
7. What is the extent of thesuppliers’ involvement: is itjust delivery of materials, ordoes it involve other businessareas, such as joint design ofnew products?
Purchasing
Storage
Figure 5.1
Questions within
the ‘supply chain’
(from Brown, 2000).
The rationale behind this strategy was captured by Wise and
Baumgartner (1999, p. 133):
Ever since the birth of the modern industrial corporation in the 1920s,
manufacturing strategy has been built on three foundations: the vertical
integration of supply and production activities to control the cost and
maintain the predictability of raw materials and other inputs; disciplined
research to create superior products; and a dominant market position
to provide economies of scale.With these in place, manufacturers could
be assured of a durable cost advantage, steady revenue growth, and
substantial scale barriers to competition.The usual reward was
double-digit margins and returns on capital.
What became clear over time, however, was that this strategy had major
flaws. This was brought to light in the 1980s, when Western firms began
to understand how Japanese companies managed buyer–supplier
relationships. We shall discuss this in greater detail in the following
chapter, but as Brown (1996, p. 224) commented:
Nowhere has the contrast between Western and Japanese
manufacturing been more evident than in materials – or inventory –
management. This area has also been one of the great areas of
organizational learning by the West in terms of how it has tried to
emulate some of the Japanese practices which have underpinned Japan’s
success in key industries.
The major shift in thinking since the 1980s has been to move away
from the idea of inventory as an asset (which can be shown on a bal-
ance sheet as part of the firm’s ‘worth’) to the idea, instead, that inven-
tory can become a huge liability for the firm, the bad management of
which (especially in production/operations areas) will weaken com-
petitive capability in terms of delays, increased costs, reduced output
and poor responsiveness to market requirements. As we shall see in
Chapter 6, the sheer cost of bought-in materials from suppliers reveals
how important inventory is to the buying company.
Inventory as an indication of world class
Inventory is not about ‘buying things’; rather, its management goes
right to the core of world-class practice in both manufacturing and
services, and it is used as a key parameter in assessing capabilities, as
can be seen in Figure 5.2.
Managing inventory, MRP and JIT 189

The scorecard in Figure 5.2 is typical of the measures that are used
and the parameters have been central to lean production since the
publication of The Machine that Changed the World (Womack et al., 1990).
However, as we shall see, although inventory management has strategic
consequences, it has sometimes been managed in a tactical fashion.
One of these has been in the EOQ formula.
The poor solution – the economic order quantity (EOQ) ‘fix’
As can be seen from the Toys’R’Us case earlier, having stock-outs or
zero-inventory for customers is not acceptable. However, there is a tension
190 Strategic operations management
Value chain Raw material WIP turns Finished goods Total inventoryturns turns turns
Median Upper Median Upper Median Upper Median Upperquart. quart. quart. quart.
Aerospace 6.8 13.0 10.0 20.0 8.5 15.0 6.0 10.0Automotive 16.2 30.0 20.0 40.0 19.0 30.0 12.0 22.0Chemicals 12.0 24.0 20.0 55.0 12.0 30.0 8.0 20.0Construction 8.5 15.5 20.0 51.2 11.0 27.5 6.4 12.0Consumer packaged 15.0 45.0 24.0 81.5 13.0 38.0 10.0 23.0goods/non-durables
Consumer product 10.0 20.0 20.0 38.4 12.5 24.0 8.0 17.3durables
High tech 8.0 22.0 12.0 30.0 10.0 24.0 7.0 10.0Industrial equipment 8.0 13.0 12.0 20.0 10.0 12.0 6.0 10.0and machinery
Pharma, biotech, 8.7 15.0 11.0 18.5 8.0 13.0 5.0 10.0medical devices
Printing and publishing 12.0 20.0 25.5 90.5 15.0 88.0 10.0 16.0Other 12.0 26.3 15.5 49.5 12.0 40.8 6.8 12.0All 11.6 22.0 16.0 38.2 12.0 25.0 8.0 13.0
Note: Upper quart. equals upper quartile.Raw material turns is cost of goods (COGS) sold divided by average raw materials.Work-in-process (WIP) turns is COGS divided by average WIP value.Finished goods turns is COGS divided by average value of finished goods.Total inventory turns is COGS divided by average value of total inventory.
Raw material turns – a median of 11.6 for all plants, with 16.2 being the high for automotive – indicatehow well manufacturers are working with suppliers to deliver needed material when it is needed. Finishedgoods turns – 12.0 or once per month for all plants, with 19.0 being the high, again in automotive – offersa sign of how customer responsive manufacturers are, and how quickly they’re moving what they makeout the door.
Figure 5.2
US manufacturing scorecard. (source: IW/MPI Census of Manufacturers shows
challenges, reality and, yes, even optimism. Industry Week, 1 January 2004).

here because holding too much inventory can also cause major
problems for firms.
All operations have to hold levels of inventories. The typical reasons
for this are (Waters, 2003, p. 7):
■ to act as a buffer between different operations;
■ to allow for mismatches between supply and demand rates;
■ to allow for demands that are larger than expected;
■ to allow for deliveries that are delayed or too small;
■ to avoid delays in passing products to customers;
■ to take advantage of price discounts;
■ to buy items when the price is low and expected to rise;
■ to make full loads and reduce transport costs;
■ to provide cover for emergencies.
Many of the above reasons are, however, no more than excuses, either
for bad in-house performance or for poor buyer-supplier relationships.
Similarly, work-in-process and finished goods inventories tend to act as
covers or ‘buffers’ for possible failures. If finished goods inventories are
held in order to ‘supply the good product quickly to the consumer’,
then action should be taken to ensure that speed is improved within the
in-house process, rather than keeping large quantities of finished
goods, ‘just in case’, due to the current process being incapable of rapid
response. In addition, keeping finished goods in inventory in high-tech
markets is dangerous, due to rapid product/component obsolescence.
Admittedly, there are industries that are seasonal or extremely erratic
and where the threat of obsolescence is low, in which case holding raw
materials and finished stock makes some sense – this approach makes
little sense in many industries, however. One of the problems in the car
industry is in levels of finished goods, as can be seen in Figure 5.3. As we
shall see in our discussion on just-in-time, there are major challenges
that need to be addressed in managing inventory.
There are problems with holding inventories:
■ storage costs;
■ interest is tied up – therefore, a loss on capital;
■ obsolete stock;
■ less money is available for the business;
■ prices fall on held items;
■ deterioration, theft, damage.
Conversely, there are problems with inventory ‘stock-outs’:
■ failure to satisfy customer demands;
■ costly emergency procedures to rectify situations;
■ higher replenishment costs for stock replacement.
Managing inventory, MRP and JIT 191

There are also the costs associated with inventory management, with
the option of ordering large quantities infrequently, thereby keeping
order costs down and increasing bulk discounts, or ordering small
quantities frequently, to keep storage costs down and improve cash
flow. The ‘solution’ to this was seen to be in the economic order quan-
tity (EOQ), which de facto is the order size that minimizes both total
stock holding and ordering costs.
However, it should be noted that the EOQ is based on weak assump-
tions, including the idea that demand is constant, there is little uncer-
tainty, only order and storage costs are relevant, and orders are placed
for only single items. Furthermore, the EOQ only identifies how much
to order, not when to place the order. Two approaches to this may
be adopted: the continuous review system or periodic review system.
Under the continuous review system, the order is placed when the
stock held is at a pre-designated re-order point. The re-order point is
determined by calculating the average use of stock over time com-
pared with the expected lead time between the order being placed and
materials being delivered.
There are major problems with the EOQ formula. It is based on the
following assumptions (Brown, 1996):
1 All costs are known and do not vary – demand for an item is
also similarly known and will not vary.
192 Strategic operations management
Figure 5.3
A telling example of
finished goods
inventory in the car
industry (courtesy
of Dr Howard and
Professor Graves,
University of Bath,
2004).

2 As a result of point 1, both the unit cost of an item and the
reorder costs are fixed and do not change according to quantity.
3 There is only one delivery for each order – this is fine on an
as-required basis for JIT, but under the EOQ approach this
‘one delivery’ means that the buyer will incur stockholding costs
until the materials are actually required and then decline over
a period of time. The delivery will not necessarily act as a driv-
ing force to speed up its use and, even if it did, it might merely
encourage forcing a material onto a work area before it is
required. This will create a bottleneck and act to increase work
in process.
The EOQ formula glosses over important issues, including:
■ The ordering cost. In the EOQ formula, this is seen to be
constant, regardless of the distance in placing the order, the
mode of communication (phone, fax, EDI) and the time spent
in placing the order, and the salary cost of the particular per-
son(s) who placed the order.
■ The cost of stockholding. Trying to determine this value is – for
all practical purposes – impossible. Waters (2003) suggests
that: ‘The usual period for calculating stock costs is a year, so
a holding cost might be expressed as, say, £10 a unit a year.’
Another approach is to charge a percentage (25 per cent, for example)
against the actual cost of a bought item. A £100 item, therefore, will
have a storage charge of £25. The problem with this is that holding an
item for any period – particularly if the item is a high-tech component –
will run the risk of obsolescence, which makes the unit itself redun-
dant. Moreover, trying to work out a ‘standard time’ that an item might
be expected to be in stock is at best pseudo-scientific and at worst
becomes a means of providing an overhead cost on a unit component
in order to fund another major overhead cost – warehousing. The
EOQ approach is alien to just-in-time management that, as we shall
see, seeks to ‘pull’ the exact number of materials or components to a
particular work station only when it is required and not before. The
EOQ formula encourages buffer stock and endorses a ‘just-in-case’
mentality rather than a just-in-time approach.
Usually, a buffer stock is added to cope with uncertainties, such as
higher than average usage or delayed stock delivery. Under the peri-
odic review system, there is no fixed order size, as orders are placed
routinely at fixed time intervals, with order size being determined by
comparing planned stock levels and actual stock levels. For instance,
Managing inventory, MRP and JIT 193

most pubs and bars have an identified ‘par stock’ level and re-order
this once or twice a week. In practice, there are many combinations of
these two basic approaches to inventory management, including base
stock, optional replenishment and visual systems.
It should be clear, then, that the EOQ ‘solution’ is not really a solu-
tion at all. What this approach shows is that academics and practitioners
alike are, perhaps, fond of seeking answers to what are often complex,
dynamic variables. The impact of managing inventory is summarized
by Lee and Schniederjans (1994, p. 323):
Implementing a new inventory system takes more than a commitment
from the inventory manager. It takes a commitment from the entire
organization, from purchasing to shipping and from top management
to the workers at the shop floor level of the organization.
A good starting point for an inventory manager intent on managing
inventory in a strategic manner is to assess the range of inventories in
an ‘ABC’ analysis.
ABC analysis
An ABC analysis is a surprisingly accurate, although simplistic,
approach to managing inventory. It is based on the reality that com-
ponents within the firm’s total inventory range have various values or
costs. ABC analysis can be undertaken in two ways. First, it can be done
by focusing on a particular product and analysing its costs. Second, it
can be undertaken by looking across the complete range of products
within the firm (this is done where there is a large range of products)
and analysing costs of components across the range.
In ABC analysis, the basic rule is: if we were to dismantle a finished
product into a ‘bill of materials’ (which we shall discuss later) and lay
out all of the components and then group them in terms of cost, we
would find that around 20 per cent of the number of components
account for 80 per cent of the costs of the product. This ‘rule of
thumb’ is not fixed, of course; it might well be that 17 per cent of the
components account for 76 per cent of costs, for example. ABC ana-
lysis is important because it helps to focus on the key issues in
inventory management. The Class A components are those that need
to be managed within strategic buyer–supplier relationships that we
will discuss in this chapter and then develop further in Chapter 6.
194 Strategic operations management
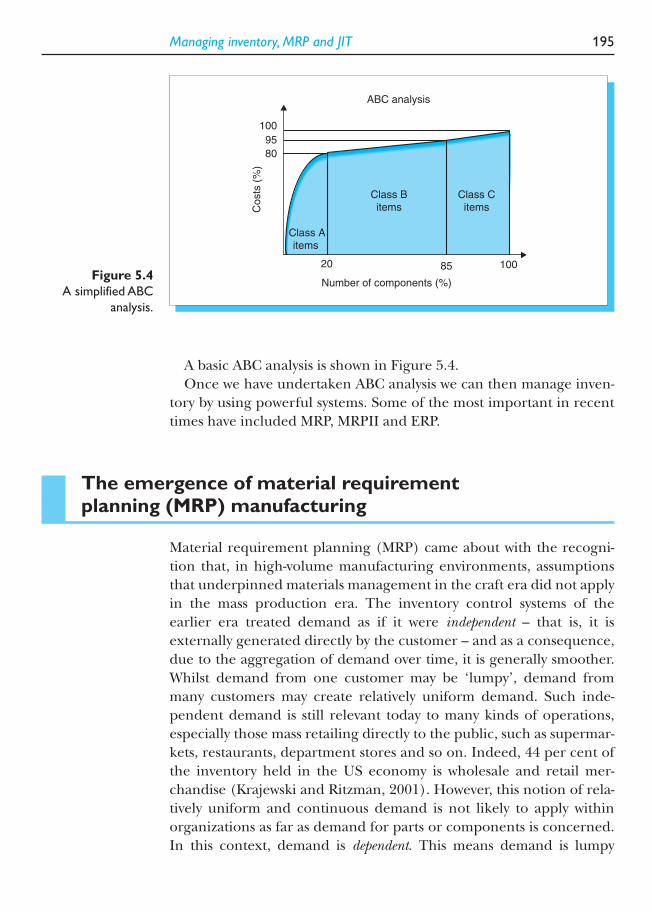
A basic ABC analysis is shown in Figure 5.4.
Once we have undertaken ABC analysis we can then manage inven-
tory by using powerful systems. Some of the most important in recent
times have included MRP, MRPII and ERP.
The emergence of material requirement planning (MRP) manufacturing
Material requirement planning (MRP) came about with the recogni-
tion that, in high-volume manufacturing environments, assumptions
that underpinned materials management in the craft era did not apply
in the mass production era. The inventory control systems of the
earlier era treated demand as if it were independent – that is, it is
externally generated directly by the customer – and as a consequence,
due to the aggregation of demand over time, it is generally smoother.
Whilst demand from one customer may be ‘lumpy’, demand from
many customers may create relatively uniform demand. Such inde-
pendent demand is still relevant today to many kinds of operations,
especially those mass retailing directly to the public, such as supermar-
kets, restaurants, department stores and so on. Indeed, 44 per cent of
the inventory held in the US economy is wholesale and retail mer-
chandise (Krajewski and Ritzman, 2001). However, this notion of rela-
tively uniform and continuous demand is not likely to apply within
organizations as far as demand for parts or components is concerned.
In this context, demand is dependent. This means demand is lumpy
Managing inventory, MRP and JIT 195
ABC analysis
Costs
(%
)
Number of components (%)
Class Aitems
80
20
Class Bitems
95
100
Class Citems
85 100Figure 5.4
A simplified ABC
analysis.

because demand for components varies over time according to what
output is being produced; such demand does not aggregate to smooth
demand, but is determined by schedule of activity planned. Finally,
independent demand-based reordering systems look at historic usage
and ignore future plans.
MRP was developed and refined by Joseph Orlicky at IBM and by
Oliver Wight, a consultant, in the 1960s and 1970s (Orlicky, 1975). It
replaced re-order point systems by deriving dependent demand for
parts and raw materials from production schedules and determining
order points based on delivery lead times and production needs. A
materials requirements plan is derived from the master production
schedule (MPS), inventory records and the product structure. The
product structure refers to a diagram, engineering drawing or list of
materials and their quantities, usually called a bill of materials (BOM),
needed to produce one item of output. The structure is often shown as
a hierarchy of levels or ‘parts explosion’ (see Figure 5.6). For instance,
the end product (level 0) may be made up of assemblies (level 1), each
of which is made up of sub-assemblies (level 2), each of which may be
made up of component parts (level 3).
MRP systems are often in the form of commercial software. Such
commercialization has led to different terminology for similar aspects
of the system, although there are some common terms in use. Generally,
all MRP systems would involve the management of the following:
■ gross requirements, i.e. the total quantity of material needed
to produce planned output in a given period;
■ available inventory, i.e. actual stock available for use in any
given time period;
■ allocated inventory, i.e. stock not available as part of the plan
since it has been allocated to another use, such as spares;
■ safety stock, i.e. stock not available for the plan as it exists to
cope with uncertainty;
■ net requirements, i.e. the quantity of material needed to meet
scheduled demand;
■ scheduled receipts, i.e. inventory already ordered and
expected to be received from suppliers, which can be
assumed to be in stock for planning period;
■ planned ordered receipts, i.e. quantity of material planned to
be received to meet net requirements or greater than net
requirements if required by order size limitations;
■ planned ordered releases, i.e. the quantity of output planned
for a given time period to satisfy planned ordered receipts.
196 Strategic operations management

In essence, MRP is very simple. It seeks answers to the following
questions:
1 How many products are to be made?
2 When do these products need to be made?
3 What is the finished product composition in terms of materials
and components?
4 What are the numbers and types of components and materials
currently in stock?
A figure is determined (by subtracting the answer to question 4 from
the answer to question 3) to then ask:
5 How many items have to be ordered from suppliers?
6 What is the lead time for suppliers and, consequently, when do
orders have to be placed?
Once these questions have been answered, the ‘number crunching’
begins on a component basis. The basic calculations are shown in
Figure 5.5.
Another feature of the MRP system is the ‘parts explosion’, whereby
a finished product is ‘exploded’ into ‘levels’ of components so that it
becomes clear which components are dependent upon others. For
example, in Figure 5.6 it is clear that some parts of the tricycle are level
1 only, whereas others are level 2. This is important in tracing com-
ponents in terms of where they ‘line up’ across the range of the firm’s
products.
Using these data, these computerized systems typically produce a
material requirement plan, priority reports, performance reports and
Managing inventory, MRP and JIT 197
Time period (weekly)
1
100
100
150 150 50 50
50
Gross requirements
Scheduled receipts
Stock on hand(inventory balance)
Planned order release
Lead time = 1 week
2 3 4 5
50
100
150
50
Figure 5.5
The basic MRP
calculation (adapted
from Brown, 1996).

action notices, which draw management attention to exceptions. In
fact, one of the requirements of successful MRP is that it should be an
integrated, cross-functional process. Oliver Wight listed 25 key points
– which he called the ABCD checklist – against which firms could rate
their level of adoption of MRP. It was clear from this that this was
meant to encourage close liaison between operations, marketing and
financial functions. The ABCD checklist is shown in Table 5.1.
198 Strategic operations management
Tricycle
Handle Rear AxleFront
Assembly
Two Wheels
SeatAssembly
AxleSupports
Wheel Front AxleSteeringColumn
Front Axle Front Axle
0
1
2Figure 5.6
A simple parts
explosion.
Table 5.1ABCD checklist
1 Company has a formal monthly sales and operations planning process chaired by the Managing Director.
2 Company has a business planning process that is fully integrated with its operating system.
3 All functions within the company use a common set of numbers to drive the business.
4 There is a single database that drives all material and capacity planning.
5 System supports daily planning buckets and may be run daily (i.e. MPS, MRP and CRP).
6 Company has the appropriate levels of data accuracy to support business excellence:(a) Stock records 98–100 per cent;(b) Bills of material 98–100 per cent;(c) Routings 98–100 per cent.
7 The master production schedule is realistic in that there are no plans to produce items that have datesin the past and there are no overloads against critical resources.
8 Valid material plans exist for all components and ingredients of master schedule items.
9 Valid capacity plans exist for all work centres.
10 Company is committed to schedule achievement. It achieves:(a) On time in full delivery to customers 98–100 per cent;(b) Factory schedules on time 98–100 per cent;(c) Vendor schedules on time 98–100 per cent.
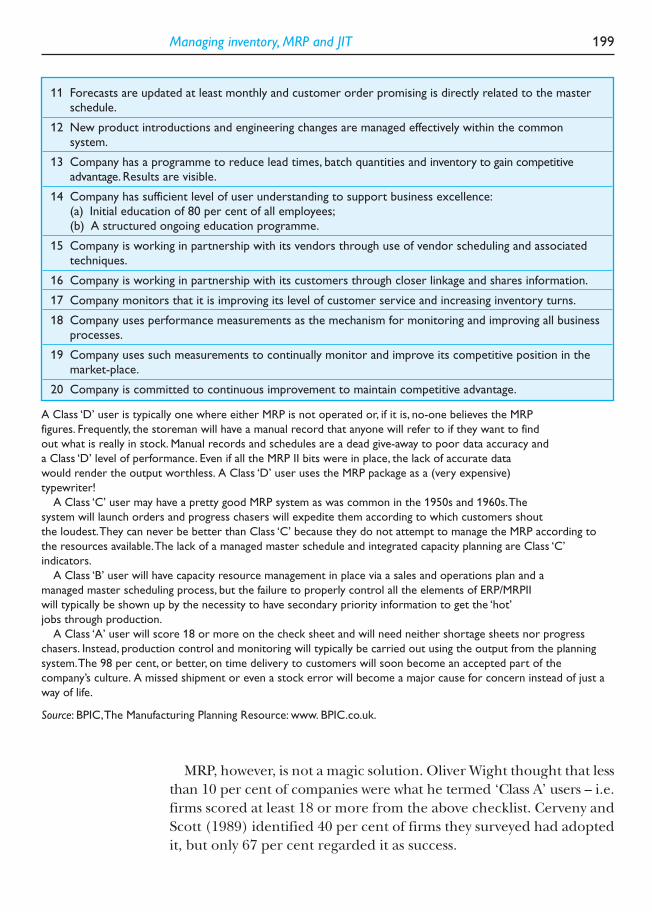
Managing inventory, MRP and JIT 199
A Class ‘D’ user is typically one where either MRP is not operated or, if it is, no-one believes the MRP
figures. Frequently, the storeman will have a manual record that anyone will refer to if they want to find
out what is really in stock. Manual records and schedules are a dead give-away to poor data accuracy and
a Class ‘D’ level of performance. Even if all the MRP II bits were in place, the lack of accurate data
would render the output worthless. A Class ‘D’ user uses the MRP package as a (very expensive)
typewriter!
A Class ‘C’ user may have a pretty good MRP system as was common in the 1950s and 1960s.The
system will launch orders and progress chasers will expedite them according to which customers shout
the loudest.They can never be better than Class ‘C’ because they do not attempt to manage the MRP according to
the resources available.The lack of a managed master schedule and integrated capacity planning are Class ‘C’
indicators.
A Class ‘B’ user will have capacity resource management in place via a sales and operations plan and a
managed master scheduling process, but the failure to properly control all the elements of ERP/MRPII
will typically be shown up by the necessity to have secondary priority information to get the ‘hot’
jobs through production.
A Class ‘A’ user will score 18 or more on the check sheet and will need neither shortage sheets nor progress
chasers. Instead, production control and monitoring will typically be carried out using the output from the planning
system.The 98 per cent, or better, on time delivery to customers will soon become an accepted part of the
company’s culture. A missed shipment or even a stock error will become a major cause for concern instead of just a
way of life.
Source: BPIC,The Manufacturing Planning Resource: www. BPIC.co.uk.
MRP, however, is not a magic solution. Oliver Wight thought that less
than 10 per cent of companies were what he termed ‘Class A’ users – i.e.
firms scored at least 18 or more from the above checklist. Cerveny and
Scott (1989) identified 40 per cent of firms they surveyed had adopted
it, but only 67 per cent regarded it as success.
11 Forecasts are updated at least monthly and customer order promising is directly related to the masterschedule.
12 New product introductions and engineering changes are managed effectively within the common system.
13 Company has a programme to reduce lead times, batch quantities and inventory to gain competitiveadvantage. Results are visible.
14 Company has sufficient level of user understanding to support business excellence:(a) Initial education of 80 per cent of all employees;(b) A structured ongoing education programme.
15 Company is working in partnership with its vendors through use of vendor scheduling and associatedtechniques.
16 Company is working in partnership with its customers through closer linkage and shares information.
17 Company monitors that it is improving its level of customer service and increasing inventory turns.
18 Company uses performance measurements as the mechanism for monitoring and improving all business processes.
19 Company uses such measurements to continually monitor and improve its competitive position in themarket-place.
20 Company is committed to continuous improvement to maintain competitive advantage.

MRP operates best under four conditions:
1 High-volume line processes.
2 Product structure is complex and there are many levels of bills
of materials.
3 Production is carried out in relatively large batch sizes.
4 There is limited volatility. Bottlenecks, rush jobs, high scrap
rates and unreliable suppliers create volatile conditions
unsuited for the MRP system.
MRP also requires high data integrity – that is, the accuracy of the data
must be high and consistent. Since inventory level data is traditionally
poor and quoted lead times from suppliers even worse, the general fail-
ure of MRP should not surprise us. The precision was also inherently
poor: a lead time for delivery of a component, for example, might
typically be quoted – and entered into the database – as, say, 14 weeks.
There are several problems with this: the suggestion that anyone can
predict what materials will be needed in 14 weeks’ time, and the exces-
sively loose unit of a week for a delivery promise.
From MRP to MRPII
MRP evolved into MRPII which, in essence, included MRP and added
other management ingredients such as tooling, routing procedures,
capacity availability and man-hours requirement. MRP is therefore a
subset of MRPII, as shown in Figure 5.7.
Often, plant managers will refer to MRP when, in fact, the system they
have is MRPII – the terms have become almost interchangeable. When
executed properly, MRPII can make a powerful contribution to mater-
ials planning and capacity management. However, both MRP and MRPII
have been severely criticized, as Luscombe (1994, p. 123) observes:
One article referred to ‘disillusionment with existing MRPII-based
production planning tools’, another stated that MRPII implementation
methodologies ‘belong to a different era’ whilst a third offered reasons
why ‘so many large-scale MRPII systems failed’.
But, as Luscombe (1994, p. 123) also suggests:
Those who abandon MRPII in search of some form of instant-response,
shopfloor-driven system are likely to be disappointed, as they ignore
200 Strategic operations management

the realities of manufacturing as reflected in both MRPII and leading
Japanese production systems.
The real problem is that often managers expect an instant solution to
poor management of inventory. They suspect that software alone, via
MRP/MRPII, will solve these problems. The lack of strategic import-
ance given to materials management by senior managers becomes a
key reason for failure. But when there is a strategic and holistic
approach to managing inventory, the ‘closed loop’ system becomes a
reality, as shown in Figure 5.8.
In addition, MRP should facilitate better relationships with suppliers
because, in theory, all lead times are known and therefore unreason-
able delivery requirements are not made on suppliers. Admittedly,
shorter lead times are preferable, especially when MRP is used along-
side JIT, but that has more to do with an ongoing pursuit of improve-
ment in delivery performance via relationships with suppliers than as
a reflection on MRPII itself.
Resolving problems of MRP
There is nothing to stop MRP being used as the planning system, and
then for the tools and techniques of JIT to be used to actually ‘pull’ the
Managing inventory, MRP and JIT 201
MRP and MRPII
Routing
Capacityrequirements
Tooling
Man-hours
MRP
MRPII
Figure 5.7
MRP as a subset of
MRPII.

materials only when needed. At any rate, there must be some sort of
master plan for a given time period in order for the firm to know what
is to be made in a particular time. MRP can therefore be used as an
exhaustive management tool whereby numbers of products and, con-
sequently, sub-components can be determined and tracked through-
out the process. MRP should not be used to ‘push’ components or
materials onto a workstation before they are required. Advocates of JIT
(and critics of MRP) have stated that MRP is inclined to do this
(Plenert and Best, 1986) – but, again, this has more to do with man-
agement’s failure in terms of using MRP rather than the system itself.
MRP can provide a discipline so that key areas such as master produc-
tion schedules, bill of materials, lead times with suppliers and other
data integrity are reliable, accurate, relevant and known to all parties,
which is essential to any well-run management information system.
202 Strategic operations management
FEEDBACK
PLANNING
Business Planning
Sales Planning
Production Planning
Check Rough-cut Capacity
Planning – OK?
Master Production Schedule
(MPS)
Materials Requirement Planning
(MRP)
Capacity Requirement Planning
Check Planning – OK?
EXECUTION
Purchasing Shopfloor
Control
Purchasing
YES
IF NO
NOT
OK
Figure 5.8
MRPII: the closed
loop system.

MRP encourages an holistic approach within the firm itself. As
Waters (2003, p. 279) states:
The introduction of MRP needs considerable changes to an
organization and these require commitment from all areas.
The MRP system can also serve to highlight business performance
problems with delivery speed and reliability. As Schmenner (1990,
p. 487) suggests:
Not only can an MRP system detail what should be ordered and when,
but also it can indicate how and when late items will affect other
aspects of production. It can signal … how tardiness will alter the
existing production schedule.
Since delivery speed and reliability are crucial in many markets, it is
clear that MRP can play an important role in achieving these market
requirements. MRP also becomes a powerful ally to just-in-time man-
agement. As Karmarker (1989, p. 125) states:
MRPII … initiates production of various components, releases orders,
and offsets inventory reductions. MRPII grasps the final product by its
parts, orders their delivery to operators, keeps track of inventory
positions in all stages of production and determines what is needed to
add to existing inventories.What more could JIT ask?
The answer to this question is twofold:
1 Much better internal quality control systems to enable JIT to
become a reality.
2 A strategic vision with suppliers – a vision of shared destiny
between them rather than the buyer versus supplier relation-
ship that pervades in much of Western manufacturing.
The linkages within MRP are shown in Figure 5.9.
MRP became an important step in the evolution toward the strategic
management of inventory, as shown in Figure 5.10.
Enterprise resource planning (ERP)
Enterprise resource planning (ERP) systems go beyond MRP and MRPII
to integrate internal and external business processes. SAP AG, a German
software company, sells the most popular ERP system, R/3. Although
Managing inventory, MRP and JIT 203

ERP systems have become popular, implementing ERP is time-consuming
and costly. Like all software ‘solutions’, ERP has its advocates and critics
alike. The basic flow of the system is shown in Figure 5.11.
ERP has gained in popularity over MRP to some extent, although
MRP and MRPII remain in use. The basic problem with MRP is that it
204 Strategic operations management
Inputs Outputs
Customerorders
Bills ofmaterial
Productstructure
Purchaseorders
Demandmanagement
system
Masterproductionschedule
Material plans
Forecastdemand
Inventoryrecords
Leadtimes
Work orders
MRPsystem
Figure 5.9
Linkages within the MRP system.
1920s 1950s 1970s 1990s
Economic Order Quantity –
MRP/MRPII
Just-In-TimeJIT is fully dependent on an integrated and
strategic approach linking customer requirements with supplier capabilities and
excellence in internal operations.
In order for these to be successful, an integrated approach both within thecompany and with suppliers is vital.
EOQ is essentially tactical, a quick-fixformula. It is not strategic in scope.
Figure 5.10
The development of the strategic importance of inventory management.

can be a ‘push’ system of inventory management. This means that
there can be a danger of ordering materials and then ‘pushing’ them
through the system before an operator is ready. The danger of a ‘push’
system is shown in Figure 5.12.
Managing inventory, MRP and JIT 205
Customer
Retailer
Physicaldistribution
Productionprocess
Purchasing
Humanresources
ERP
Figure 5.11
How enterprise
resource planning
(ERP) systems link
the supply chain
(from Brown et al.,
2001).
The Destructive Cycles of Make-to-forecast
In the first cycle, the company must rely on larger economies ofscale to compensate for the use of push-based selling. In the second,the company loses sight of real customer requirements because it isselling too many products from stock.
Push-based selling
using discounts and
incentives
Reduced margins
and pressure on
residual values
More volume to
achieve economies
of scale
Long lead times
for custom-built
vehicles
Build-to-order
discouraged
Demand
information
distorted
MAKE PRODUCTSTO FORECAST
Figure 5.12
Push versus pull
strategies (source:
Holweg and Pil,
2001).
An alternative approach based on a ‘pull’ approach was developed
by some Japanese companies in the 1950s – most famously by Toyota.
It is called ‘just-in-time’ (JIT).
Just-in-time management
JIT is more holistic than earlier systems of inventory management and
MRP. It is not solely concerned with capacity, materials and inventory,
but also includes aspects of quality management, such as continuous
improvement and total quality control. TQM is a vital prerequisite in
order for JIT to be successful in manufacturing plants. Just-in-time
management is therefore not simply an inventory reduction exercise.
In fact, just simply reducing stocks will, in the first instance, create major
problems. Shingo in Zipkin (1991, p. 44) states:
Stock reduction should not become an end in itself, however, since
cutting stock blindly may cause delivery delays. … Rather the conditions
that produce or necessitate stock must be corrected so that stock can
be reduced in a rational fashion.
Just-in-time is a complete shift away from traditional Western manufac-
turing. Hutchins (1999, p. 11) narrates how:
JIT is part of a fundamentally different approach to management which
when fully developed will help to create a totally new industrial culture.
Harrison (1992, p. 24) shows how this fundamental change works in
Japan:
In Japan, JIT has developed into a total management system from
marketing through to delivery. It has diffused through suppliers and
distributors. It has provided Japanese companies with a formidable
competitive advantage over their Western rivals.
JIT includes elements of production scheduling and inventory man-
agement. This approach identified for the first time that trade-offs
were not an essential aspect of operations. JIT is linked to capacity
management. For example, Toyota creates a fixed monthly production
schedule each month. The production level will change each month,
but what Toyota is doing by adhering to the monthly production sched-
ule is to manage the uncertainty of capacity by making the production
‘fixed’ for a given month. This schedule is then communicated to
206 Strategic operations management

Toyota’s suppliers. This then means that capacity has become synchro-
nized between Toyota and its suppliers so that deliveries can be
planned with a great amount of certainty to manufacturing operations.
JIT enables improvements to be made to costs, delivery times and
quality. It is for this reason that we shall consider it in more detail in
discussion of the mass customization era. Perhaps the most fascinating
aspect of JIT, in retrospect, is that it was developed entirely without
computers (although latterly much computerization has been incorp-
orated into it). At a time when managers in the West were fixated with
the computer programs in MRP, missing the absurdity of relying
on data such as ‘14 weeks lead time’, the Japanese were dealing with
immediate requirements – making a virtue out of living from hand to
mouth and employing common sense, not rocket science.
Just-in-time production (JIT) was conceived by Taiichi Ohno, the
former head of production at Toyota, in the 1980s. World-class JIT
streamlines production, exposes problems and bottlenecks, and
attacks waste. Suzaki (1987) quotes Jujio Cho of Toyota, who identifies
seven types of waste; these are shown in Table 5.2.
Managing inventory, MRP and JIT 207
1. Overproduction 5. Stock on hand■ More than customer needs ■ Buffer against variability■ Out of sequence ■ Store excess parts■ The wrong part ■ WIP deadens responsiveness■ Early or late ■ Money tied up
2. Waiting 6. Motion■ By people ■ Process choice■ By products ■ Efficiency of task■ By machines (bottlenecks) ■ Maintain operator flow■ By customer ■ Maintain work flow
■ Improve the method first, then
inject capital
3. Transportation 7. Defective goods■ Not value added ■ Cost of scrap■ Effort and cost ■ Creates inventory (just in case!!)■ Inventory ■ Cost of rectification■ No control, no ownership ■ Causes poor delivery performance
4. The process itself■ Basic raw material■ Basic process■ Value eng, value analysis■ Make/buy■ Why do it at all?■ Process choice
Table 5.2Seven categories of waste

True JIT operation does not employ safety stocks, therefore, as they
are wasteful. At the heart of the system is the kanban, the Japanese word
for card; in practice, these take many forms – cards, magnetic strips,
plastic containers and so on. They are the means for communicating
to, from and within work centres. Information about the part is written
on the kanban, including reference number, storage area and associ-
ated work centres. These days, much of this information is now in bar-
code form. In a JIT system, parts can only be used, moved or produced
if accompanied by a kanban. Movement of parts is further simplified by
bins or containers of fixed size, designed to hold a specific and rela-
tively small number of units of the same part. Different parts are never
put into the same containers. In a typical production situation, an
operator at a workstation has one or more kanban. When one is empty,
this is authorization to obtain a full kanban from either the storage area
or the next workstation up the line. The arrival of an empty kanban at
a workstation is authorization for that operator to produce sufficient
parts to refill it. Thus, production activity is generated by demand from
the next operator down the line (‘downstream’), which is why it is a
‘pull’ system. MRP and JIT systems are not mutually exclusive. Many
operations operate a hybrid of these two in an attempt to take advan-
tage of the best elements of both. MRP/MRPII will be used to plan
materials; JIT will then ‘pull’ materials as required.
Another element of the Japanese approach to manufacturing has
been to dampen the impact of variations in the production schedule,
by producing relatively small quantities of the same mix of products.
Operations schedules are planned on a daily basis to achieve monthly
planned output. The adoption of uniform plant loading may have the
impact of increasing the frequency of machine set-ups, however, as
the plant switches from producing one output to another. Hence the
Japanese, notably Shigeo Shingo in Toyota, spent many years seeking
to achieve a ‘single digit’ set-up – the ability to change a machine tool
from one set-up to another in less than 10 minutes. By the late 1970s,
a Toyota team of press operators was able to change over an 800-ton
press, from one part to another, in less than 10 minutes, compared
with 6 hours for the same activity (i.e. the same two parts) in a US car
plant. They achieved this simply by differentiating between external
set-up, which can be carried out whilst the machine is running, and
internal set-up, which requires the machine to be stopped. External
set-up may include transfers of dies or moulds from a storage area to the
machine and preheating the machine or its component up to operating
temperature. Set-up time may also be reduced by standardizing the
208 Strategic operations management

set-up function of the machine, conveyors and cranes to move dies,
eliminating unnecessary adjustments, synchronizing operator tasks
and automating some of the procedures, such as feed and position
work, if possible. Furthermore, in Japanese factories, change-over
teams would go into the factory at weekends, when production was
shut down, to practise set-ups. This same approach can be observed
during Formula 1 races, when the pit team changes tyres. They can
change all four wheels and put large volumes of fuel into the tank in
under 10 seconds, whereas the average motorist can take up to half an
hour to change one wheel!
The challenges of JIT
Just-in-time is a very simple idea which has been extraordinarily diffi-
cult for many companies to implement. Zipkin’s (1991, p. 40) state-
ment is pertinent here:
… a storm of confusion swirls around JIT. Ask any two managers who
have worked with it just what JIT is and does, and you are likely to hear
wildly different answers. Some managers credit JIT with giving new life
to their companies; others denounce it as a sham ….
The essence of JIT is that the exact number of components will
arrive at a workstation exactly at the time required and, in JIT, the supply
of materials will exactly match the demand of materials both in terms of
quantity and time.
Although the just-in-time management approaches emanated from
Japan, it is clear that the techniques have been transferred – with vary-
ing degrees of success – to the West. For many companies just-in-time
will present a massive challenge to the way in which the firm will oper-
ate its business. These factors will include both internal and external
factors: the internal factors will include an obsession with quality – ‘get-
ting it right first time’ – because JIT cannot tolerate re-work and scrap,
since only the exact amount of materials will be ‘pulled’ to satisfy the
component requirements for a particular workstation. The internal
challenges of JIT are shown in Table 5.3.
One of the main factors in just-in-time is in the elimination of waste,
resulting in measurable benefits, not always centred on costs: areas
such as flexibility, rapid response to customer requirements, innova-
tion, and delivery speed and reliability.
Managing inventory, MRP and JIT 209

The Japanese have insisted that, in their plants, there should not be
idle time, waiting or buffers. The Japanese terms for these are:
Muda waste
Mura inconsistency by machines or workers
Muri excessive demands upon workers or machines
When there is little ‘buffer’ inventory, these three factors become
prominent. Conversely, these three factors are disguised by holding
amounts of inventory. Holding inventory – at any stage – can serve to
‘cover’ poor operational performance and reducing inventory will, in
the first instance, cause these problems to surface, which will then
focus the firm in having to make improvements in production/opera-
tion areas, as shown in Figure 5.13.
Interestingly, when these problems appear, the strategic importance
is revealed. Instead of a ‘quick fix’, tactical approach – buying more
210 Strategic operations management
Traditional manufacturing JIT/enlightened approaches
Quality ‘Acceptable’ levels of rejects ‘Right first time, every time’,and rework – an inevitability constant, ongoing pursuit of that failures will occur. process improvement.A specialist function Everybody responsible for
ensuring quality
Inventory An asset, part of the balance A liability, masking the sheet and therefore part of operational performance by the value of the firm; buffers hiding a number of problemsnecessary to keep production running
Batch sizes An economic order can be Batch sizes must be as small as determined to show the possible, aiming toward a batch balance between set-up time size of 1and production runs
Materials Determined by the economic Supply exactly meets demand,ordering order quantity no more no less, in terms of
quantity; delivery is exactly when required, not before and not after
Bottlenecks Inevitable; shows that machine No queues – production is at utilization is high the rate which prevents delays
and queues
Workforce A cost which can be reduced A valuable asset, able to problem by introducing more solve, and should be supportedautomation by managers
Table 5.3The effect of JIT on operations (adapted from Brown, 1996)

Managing inventory, MRP and JIT 211
INVENTORY
LEVEL
Off-standards
Untrainedoperators
Scrap
WIPqueues
Rework
Machinedowntime
Deliveryproblems
Poor floorlayout
Unstabledemand
Absenteeism
Figure 5.13
The challenge of JIT
on operations.
stock to cover problems – the firm must take strategic measures: con-
tinuous and ongoing improvements in-house to reduce stock levels,
coupled with strategic alliances with suppliers to enhance delivery,
innovations and reduce total costs.
We hinted at the differences between push and pull earlier in the
chapter. The challenges and benefits of this transition to JIT are shown
in Figure 5.14.
As well as the internal requirements for JIT, there are also external
factors: a major failure of some Western companies in terms of imple-
menting just-in-time is their inability to forge long-term, strategic part-
nerships with their suppliers. We shall discuss this in depth in the next
chapter, but a note is pertinent here in our discussion on just-in-time.
You will recall how, earlier in the chapter, we stated that the former
perceived wisdom within management was for the firm to own as much
of the supply chain as possible for the reasons that we listed. Over time
this perception changed, although this did not mean that there were
mutually beneficial strategic relationships in place between buyers and
suppliers within the supply network. Indeed, Porter (1980, p. 125) had
pitched the buyer–supplier relationship in, largely, adversarial terms –
the buyer, for example, should pursue the ‘threat of backward integra-
tion’ and ‘use of tapered integration’ according to Porter. This has
changed over time, although there are many firms who remain routed
in this approach. However, buyer–supplier relationships had changed
over time, as Turnbull et al. (1993, p. 51) commented:
In Japan, the actual contract between motor manufacturer and supplier
is based on co-operation, a full exchange of information, a commitment

to improve quality, and a recognition … that prices can (and will) be
reduced each year … bargaining is not simply focused on price per se
but on how to reach the target price while maintaining a reasonable
level of profit for the supplier.
That is not to say that the partnership is based on complacency and
ease as a result of the partnership deal having been made. Rather,
demands are made on the supplier, but these are made achievable as a
result of the Japanese buyer helping the supplier to improve its business
212 Strategic operations management
Goals
Benefits
Weakness
Produce standard
products from
long-term-demand
forecasts
Use MTF, but
increase stock
visibility
(through the
internet,
for example)
to enhance
customer choice
Provide custom
orders when
specifications of
product in system
can be easily
amended
Rely on forecasting
for high-volume,
stable products, and
build low-volume
product to orderManage stock
reactively to allow
for efficient
production
Efficient production
High levels of
finished stock in
market
High stock levels
remain
Customer orders
built only when
they fit
Stock is still in
market
System is sensitive
to short-term
demand
fluctuations, so
will not work
without proactive
demand
management
Still requires
discounting to cope
with forecast error
Danger of reverting
to pure MTF when
demand shiftsActive revenue
management
required to
maximize profit
Unsold orders are
built anyway
High temptation
to revert to MTF if
demand drops
Discounting still
required
Custom orders
still compete
with forecast
for capacity
Extra cost to
transfer product
to location close
to customer
MTF requires
alternative product
specifications and
discounting to sell
ageing stock
Customer orders
compete with
forecast for capacity
MTF loses sight of real
customer demand
Local optimization
of factory operations
Build products only
after the customer
orders them
Make customer
needs visible to
all parts of the
value chain
Higher chance of
finding right
product in stock
Higher degree
of custom-built
vehicles in
production
Stable base
production
No stock apart
from showroom
and demonstrators
No discounting
Relatively short
order-to-delivery
times on average
Less inventory
Less discounting
Inexpensive to
implement
PUSH PULL
Make-to-forecast
(MTF)
Locate-to-order
(LTO) Amend-to-order
Hybrid
Build-to-order
True
Build-to-order (BTO)
Push vs. Pull Strategies
Figure 5.14
Key factors in push versus pull strategies (source: Holweg and Pil, 2001).

in terms of lower cost and faster delivery. The partnership approach is
summarized by Schonberger and Knod (2001, p. 291):
In the partnership approach, the idea is not to change suppliers. The
rule is: stay with one, in order that it may stay on the learning curve, get
to know the customer’s real requirements, and perhaps participate with
the customer on product and process improvements.
The benefits of buyer–supplier collaboration are stated by Carlisle and
Parker (1991, p. 5):
Co-operation between industrial users and sellers is a far more
powerful strategy for making them both more profitable in the long
term than any adversarial approach yet devised.
In order for buyer–supplier relationships to be strong there has to be
considerable trust shown between both parties. Sako (1992) suggests
that three types of trust need to be in place:
1 Contractual trust – which is the adherence to formal, legal
promises.
2 Competence trust – that either side is capable of providing what
has been promised.
3 Goodwill trust – which borders on ‘ethics’, trusting that appro-
priate behaviour will ensue.
As we shall see in the next chapter, the ability to form such part-
nerships, essential to successful JIT, is a major challenge and calls
for the very best of management expertise. It is clear that, sometimes,
this expertise is not in place. Business Week (8 August 1994, p. 26)
noted how:
GM’s relations with its suppliers remain the worst in Detroit. … An
electronics supplier tells of a $30 part he developed jointly with GM.
He says that after he slashed the price to $15, the GM purchasing agent
demanded more cuts, citing a $9 bid from a Chinese company that
had never made the part in question. … One parts maker that does
$600 million in business with car makers says it is focusing its efforts
on selling to GM’s rivals.
Managing inventory, MRP and JIT 213

Fortune (15 May 2000) too, added how buyer–supplier relationships
within the car industry have not improved across many companies:
The relationship between an auto-parts company and its customer, the
automaker, is like the relationship between a masochist and a sadist.
Really. The parts maker slashes margins to the bone to get a contract in
which the difference between a winning bid and a losing one may be
one-thousandth of a cent.Then the real pain begins.The manufacturer
demands that the parts maker meet rigorous schedules, adjust to wide
fluctuations in production, and cut prices by several per cent every year
that a contract runs. If a part turns out to be defective, the parts maker
may have to share in the manufacturer’s added warranty costs – or
perhaps pay damages from a class-action lawsuit.
The Financial Times (29 January 2003, p. 19) commented how buyer–
supplier relationships were far from perfect in retail services:
From September 2001, the report says, they operated a programme
called – almost comically – Project Slow It Down. Payments to suppliers
were systematically delayed or reduced, suppliers were denied access to
computer records of accounts payable and were deceived about why
they were not being paid.
Even though JIT was pioneered within the car industry, there are still
problems in place. One of this relates to the time taken for a car to be
transferred from customer order to delivery to the customer. The
problem is captured in Figure 5.15.
214 Strategic operations management
The 3DayCar programme shows it takes on average 40 days to fulfil anorder in the UK, but only 1.5 are actually spent building the vehicle
Order scheduling13.5 days
Order bank10 days Order entry
4 days
Vehicle distribution4 days
Loading in factory1 day
Manufacturing1.5 days
Production sequence6 days
The problem
Figure 5.15
Ongoing problems
with JIT (courtesy of
Dr Howard and
Professor Graves,
University of Bath,
2004).

Another challenge with JIT is that even when there are mutually bene-
ficial relationships in place, with both parties striving to continuously
improve their operations in order to outperform other such relation-
ships within the same industry, unforeseen problems may occur. These
can have a devastating effect upon JIT, which although vastly superior
to the just-in-time scenario under traditional mass production, is a very
fragile, almost delicate phenomenon.
Clearly, the management of inventory has developed over time,
from a largely tactical activity to a senior-level strategic position within
firms. Changes from EOQ to MRP and JIT have shown profound
developments over time. JIT is more than inventory management
because it represents a fundamental change in how firms produce
goods by utilizing a ‘pull’ system that we discussed earlier.
A key issue in inventory is in managing buyer–supplier relationships
within networks and we discuss this in depth in the next chapter.
Managing inventory, MRP and JIT 215
Case: The virtues of vertical integration
Crown Equipment Corp. seems on first impression to be a company that time forgot.Tucked away in the smallOhio town of New Bremen (population: 2909), which prides itself on its nineteenth-century streetscape, thecompany has leveraged vertically integrated manufacturing facilities to produce products for the maturematerial-handling industry.Yet with its passionate attention to the products it makes and uncommon attentionto the needs of the people who use them, the company represents at least one aspect of US manufacturing’sfuture: the ability to design, manufacture, distribute and service innovative, high-tech products in mature segments for which buyers are willing to pay a little bit more.
Crown’s FC4000 series sit-down counterbalanced electric lift truck, a recent Industrial Design ExcellenceAward (IDEA) winner, was developed along with a three-wheel model. Having in-house manufacturing, designand engineering helped the company leverage its product development investment over the two products.
Consider Crown’s achievements: the privately-held company entered the material-handling industry late, inthe early 1950s.The last North American entrant to the lift-track manufacturing market, the company thrivedamid a consolidating industry, rising to become the fifth largest lift-truck company in the world and capturingthe top spot in the electric lift-track segment. It’s now a $1 billion company.
Its financial success is complemented by its innovation and design accomplishments, represented by a substantial list of design awards – including an international award that ranks Crown ahead of such design stalwarts as Audi, Jaguar and Porsche.
Company executives insist that no grand strategy or implementation of the latest management trend drivestheir success. They contend that what might be considered their ‘management strategies’ are simply workprocesses that work for them, given the company’s mission.Take the vertically integrated manufacturing ‘strat-egy’, for example. The fact that Crown plants produce 85 per cent of the parts in its products came about notbecause of ‘some big strategic thing that we want to be vertically integrated and by golly that’s what we’regoing to do,’ says Senior Vice-president Don Luebrecht. He notes that executives rarely even employ the term‘vertical integration’. Rather, the company’s bias toward in-house manufacturing evolves from a ‘product-focused, product passionate’ mindset, says Mike Gallagher,Vice-president, Crown Design Center.Vertical inte-gration gives the company ‘the ability to cook more of ourselves and this passion into the product’, enablingthem to build a product that is more central to the Crown brand.
Both men are quick to point out that they and other executives at the company are not adamantly opposedto outsourcing manufacturing and other functions. ‘We do tend to review these things, and revisit them tomake sure we’re still competitive,’ says Luebrecht.

216 Strategic operations management
Most often though, says Gallagher, ‘It would be harder to achieve the brand promise with everyone else’ssupplied content.’ Both executives stress that the company’s focus on meeting the forklift operator’s needs andtheir emphasis on ergonomics and safety has set Crown apart from its competitors. But it’s also created thetype of manufacturing challenges that few or no outside vendors address. He explains that the company’sbreakthrough product,Crown’s first counterbalance truck introduced in the 1970s, is a good example. In devel-oping the lift, the first in the industry to combine a multi-function control handle with a side-stance operatorposition, Crown could have found suppliers to contribute components to the control device, but no supplierhad the technology to build it. Says Luebrecht, ‘That first multi-function handle was an incredible mechanicaland electronic combination of things. That combination of things just wasn’t around in those days.’
Ultimately, says Luebrecht, the company’s intense customer and product focus inspires designers, engineersand production employees at the company to be ‘more willing to be challenged and find new ways of solvingproblems – to sweat the details of each component – than somebody else who is one or two times removedfrom that feeling. I think at times we’ve found ways of doing things that weren’t impossible in other ways, but[most companies] wouldn’t have had the patience or taken the time to get there.’
Tight integration between the design and production also accelerates product innovation, say companyexecutives.They note that once they’ve solved technological or ergonomic challenges for one product, theycan quickly adapt the innovation to other products. When the company started development of its three-wheel sit-down counterbalance lift track, the design team all had in mind the future development of a four-wheel model. This allowed them to consider design challenges associated with both applications and essentiallyaddress them for both models at the same time.
One question that remains to be answered is whether low-cost, overseas manufacturers will redefine com-petition in the electric lift-truck industry and render the vertical manufacturing approach obsolete, as it has inso many other industries.The executives readily admit they are very aware of the possibility, noting that theydo not only compete on price: ‘We’re at the higher end of the price continuum,’ notes Joe Ritter, Director ofMarketing.They also allow that they’ve been somewhat insulated from low-cost competition from overseas:‘The electric lift-truck industry has not been impacted over the years nearly the way the internal combustionindustry has with offshore products,’ says Ritter. He notes that while low-cost, overseas manufacturers tend tobe good at mass manufacturing, ‘electric lift trucks tend to be more specialized. Our products are not cookiecutter and that’s a different challenge for manufacturers, and those challenges have not created opportunitiesfor those other countries in the electric lift-truck industry.’
No one can say for sure, but many speculate that US manufacturers will survive by producing highly specialized products that do not compete on price, but rather better meet customer needs and provide better customer service.Who knows? Maybe this smallish company, steeped in history and practising whatmany think is an outmoded vertical manufacturing strategy, just might represent US manufacturing’s future.
Source: Panchak, P. (2003) The virtues of vertical integration. Industry Week, September, pp 50–52.
Key question: What role does strategy have in the above case?
Summary
■ For many years, inventory management was one of the major contrasts between the Japanese and Westernapproaches to manufacturing, although there is evidence that many Western firms are improving in the areaof inventory management.
■ Inventories can, if badly managed, serve as a means of covering problems both in terms of in-house opera-tions and poor supplier performance.
■ ‘Quick-fix’ purchasing formulas (such as EOQ) do not provide any strategic advantage for the firm.■ The firm must concentrate on improving operations performance in order to avoid a ‘just-in-case’
approach. In this way, inventory costs will decrease and, just as important, the firm’s capabilities in terms ofdelivery reliability, rapid response and flexibility will be greatly enhanced.
Managing inventory, MRP and JIT 217
■ Material requirement planning (MRP), manufacturing resource planning (MRPII) and enterprise resourceplanning (ERP) can be powerful means of controlling inventory. However, MRP should not be used to ‘push’ materials through the production system; rather, MRP is a management planning system whereby all components can be planned in advance for a particular time period.
■ Just-in-time is part of world-class, strategic manufacturing. However, JIT is not simply about inventory reduction; it is a complete shift from traditional ‘push’ approaches based around production of large batches(made to stock). Instead, a ‘pull’ system based upon ‘make to order’ for customers becomes the focus ofproduction.
■ A vital feature of just-in-time is the buyer–supplier relationship. The ‘traditional’ buyer versus supplierapproach makes little sense; instead, the manufacturing firm must concentrate on focusing on key suppliers and forming strategic partnerships with them.
Key questions
1 Why has inventory management emerged as strategic factor?
2 What is the main difference between push and pull systems?
3 What internal and external capabilities need to be in place for
successful JIT?
References and further reading
Brown, S. (1996) Strategic Manufacturing for Competitive Advantage.
Hemel Hempstead: Prentice Hall.
Brown, S. (2000) Manufacturing the Future – Strategic Resonance for
Enlightened Manufacturing. London: Financial Times/Pearson Books.
Brown, S., Cousins, P., Blackmon, K and Maylor, H. (2001) Operations
Management – Policy, Practice and Performance Management.
Butterworth-Heinemann.
Business Week, 8 August 1994.
Carlisle, J. and Parker, L. (1991) Beyond Negotiation. Chichester: Wiley.
Cerveny, R.P. and Scott, L.W. (1989) A survey of MRP implementation.
Production and Inventory Management, 30(3), 177–181.
Financial Times, 29 January 2003.
Fortune, 24 January 2000.
Fortune, 15 May 2000.
Goldratt, E.M. and Cox, J. (1986) The Goal. Great Barrington, MA:
North River Press.
Harrison, A. (1992) Just-in-Time Manufacturing in Perspective. Hemel
Hempstead: Prentice Hall.
Holweg and Pil (2001) Successful build-to-order strategies start with the
customer. Sloan Management Journal, Fall, 74–83.

Hutchins, D. (1999) Just in Time, 2nd Edition. London: Gower Books.
Industry Week, 20 March 2000.
Industry Week, IW/MPI Census of Manufacturers shows challenges,
reality and, yes, even optimism, 1 January 2004.
Lee, S. and Schniederjans, M. (1994) Operations Management. Boston,
MA: Houghton Mifflin.
Karmarker, U. (1989) Getting control of just in time. Harvard Business
Review, September–October, 122–131.
Krajewski, L. and Ritzman, L. (2001) Operations Management: Strategy
and Analysis. Englewood Cliffs, NJ: Prentice Hall.
Luscombe, R. (1994) Getting better all the time. In: Proceedings of
BPICS Conference, Birmingham.
Orlicky, J. (1975) Material Requirements Planning. New York: McGraw-Hill.
Plenert, G. and Best, T.D. (1986) MRP, JIT and OPT. What’s best?
Production and Inventory Management, 27(3), 22–30.
Porter, M. (1980) Competitive Strategy. New York: Free Press.
Sako, M. (1992) Prices Quality and Trust: Inter-firm Relations in Britain
and Japan. Cambridge: Cambridge University Press.
Schmenner, R. (1990) Production/Operations Management. Macmillan.
Schonberger, R. and Knod, E. (2001) Operations Management: Improving
Customer Service. New York: Irwin.
Suzaki, K. (1987) The New Manufacturing Challenge: Technqiues for
Continuous Improvement. New York: Free Press.
Turnbull, P., Delbridge, R., Oliver, N. and Wilkinson, B. (1993)
Winners and losers – the ‘tiering’ of component suppliers in the
UK automotive industry. Journal of General Management, 19,
Autumn, 48–63.
Waters, D. (2003) Operations Management: Producing Goods and Sevices.
Harlow: Addison Wesley.
Wise, R. and Baumgartner, P. (1999) Go downstream: the new profit
imperative in manufacturing. Harvard Business Review, 77(5),
133–142.
Womack, J., Jones, D. and Roos, D. (1990) The Machine that Changed the
World. New York: Rawson Associates.
Zipkin, P. (1991) Does manufacturing need a JIT revolution? Harvard
Business Review, January–February.
218 Strategic operations management

C H A P T E R
Supply management
6
Definition and development
In the first edition of this book we started this chapter by remarking: ‘It
is perhaps necessary to explain at the outset why we have dedicated a
whole chapter to the subject of supply management, and what we mean
by the term.’ Since the mid-1990s, the importance of understanding the
supply chain has become accepted in every part of business and the sub-
ject is now amongst the most popular in research in the area.
The purpose of this chapter is for the reader to:
■ understand how supply management has changed over time;
■ gain insights into the strategic importance of supply within
operations;
■ appreciate the importance of lean supply.
In the last quarter of the twentieth century, the perception of what takes
place in the transactions between organizations and their suppliers – of
materials, component parts, services, information and utilities –
changed profoundly. When, in 1997, the Harvard Business Review pub-
lished its 75-year review of management thinking, the central theme of
‘production’ (as it was called in 1922) had become ‘adding value’ in
modern times, and featured prominently in the mid-1990s was ‘supply
chain management’. The expression ‘supply chain management’ is
now over 20 years old and probably reaching the limit of usefulness
as a metaphor: it is now recognized that strategists in supply must
embrace the concepts of supply networks (another metaphor). It is still
appropriate, however, to begin by exploring supply chain management
and explaining the reason we prefer to focus on supply management.
In particular, we should focus on the implications for operations
strategists.

220 Strategic operations management
In this chapter, we shall first explore the nature of supply chains and
supply bases. This will be followed by a discussion on the essential fac-
tors in developing a comprehensive supply strategy. These are: a policy
on supply positioning, with a strategy to implement it; an internal strat-
egy on the location of the purchasing and supply process within the
organization; and a set of techniques for managing relationships
between organizations – the essence of supply.
Strategic supply and focused operations
Supply management has a significant role to play in focusing oper-
ations. All organizations have to focus to some degree as they do not
have limitless resources and cannot, therefore, provide a limitless range
or volume of products or services around the world. However, focus is
much more specific than this and can have profound importance for
the firm. The organization can focus in a number of ways, including:
■ Choosing the customer groups and market segments which it
serves.
■ Adopting a particular type of manufacturing process – as we
saw in Chapter 3, the choice of process determines to a large
degree what the firm can and cannot do.
■ Focusing the plant into a number of different, but specific,
allocated areas – these cells of production or service units can
be focused by customer, process, product or service.
■ Outsourcing non-core areas of the business, which in turn will
impact on operations management.
■ Concentrating on a specific activity within the supply chain
and forming strategic buyer–supplier relationships with other
players in the supply chain. For many years, this has been a
key strategic factor in the success of firms in the aerospace
industry, where as much as 85 per cent of the value of an air-
craft is derived from the supply base.
The last two points clearly relate directly to management of supply.
Focus is concerned with what the organization chooses not to do
itself – and must therefore obtain from its supply network. This choice
forms part of its strategic intent. For example, focus within the supply
network played a key part when, in 1991, Hewlett Packard decided to
enter the PC market. HP did this with great intensity and was one of
the top four PC producers by 1997. Later, HP decided to move away
from being a manufacturer to being an assembler of products. This shift
in focus placed even greater emphasis on the need for excellent

supplier relations throughout the supply chain, especially with those
suppliers on whom HP greatly depends. It also freed the firm from
unnecessary investment in manufacturing plant to focus on investment
in assembly technology. Subsequently, even the assembly of finished
units was considered non-core and was widely outsourced to suppliers.
Today, the impacts of strategies such as this, which have been followed
by all the well-known computer companies, have led to a major refram-
ing of the industry, so that now the majority of laptop computers are
manufactured by a handful of companies, operating globally, the
equipment being badged for marketing by the big brands.
Focusing operations means concentrating on specific aspects of the
entire process of production or provision of a service to see where the
organization can really add value and make money for itself; other
areas may be outsourced, responsibility for them (including conduct-
ing parts of a service, manufacturing parts of a product or system, and
the management of further input resources, such as supplies of raw
materials) being given to suppliers. Of course, such suppliers become
much more significant players in the process and may be expected to
employ more sophisticated management skills, rather than simply
doing what they are told.
Focus may even mean that the firm becomes a virtual organization,
employing far fewer people then before but achieving similar business
goals. For example, TopsyTail, a small Texan company, sold $100 mil-
lion worth of its hairstyling equipment during the mid-1990s, although
it had virtually no permanent employees of its own. Subcontractors
handled almost all of the organization’s activities – design, manu-
facturing, marketing. The Italian motorcycle manufacturer, Aprilia,
sources all parts for its bikes and scooters from suppliers in the region
around its home in Mestre, near Venice, simply assembling to order
and managing its supplies accordingly. Its own organization is small,
representing the hub of a network that forms a virtual organization.
Supply and outsourcing
Whereas focus includes divesting business assets that were once part of
the firm’s attempts to diversify, outsourcing is more often associated
with the configuration in which the firm finds itself within the supply
chain. The perceived wisdom was formerly that a firm should own all
activities within the supply chain. For example, at one time, Ford made
almost everything that went into its cars, including the steel and glass.
In 1980, it made about 87 per cent of a car itself. Now it makes less than
40 per cent. Similarly, in the past, IBM produced the silicon as well as
Supply management 221

the software and hard drives for its computers. This approach – one of
vast amounts of vertical integration – has been replaced by outsourcing
strategies. As a result, by the end of the century a new group of ‘con-
tract manufacturers’ had emerged in the PC industry – companies
such as SCI Systems, Celestica, Solectron, Merix, Flextronics, Smartflex
and Sanmina – who now manufacture products for major PC players
including IBM and Hewlett Packard, as we saw above. Some of these
firms have become very large (typically over $10bn in sales turnover)
and together represent a new business sector.
In the USA, such outsourcing has seen a remarkable growth of small
manufacturing enterprises so that, by the mid-1990s, companies with
fewer than 100 employees comprised some 85 per cent of the USA’s
370 000 manufacturing firms (The Economist, 27 January 1996). Service
industry soon followed manufacturing, with the development of call
centres (for sales enquiries and customer service) sited offshore. These
are typically moving from the USA or the UK to countries such as India
or Malaysia, where international English is spoken. In 2002, a report
on ‘offshoring’ by the Forrester research group in the USA estimated
that 3.3 million white-collar American jobs (500 000 of them in IT)
would shift offshore to countries such as India by 2015. Stephen
Roach, the Chief Economist at Morgan Stanley, described the oppor-
tunity represented by outsourcing as a ‘new and powerful global
labour arbitrage’ that has led to an accelerating transfer of high-wage
jobs to India and elsewhere. While the dominant trend has been
USA/UK to India, there are also cases of Japan ‘offshoring’ to North-
East China (where Japanese is spoken), Russia to Eastern Europe and
Switzerland to the Czech Republic. In addition to the low costs of
labour in such countries, the logic of offshoring is boosted by the drop
in the cost of international phone calls. However, such activities have
not always been successful, as the following case demonstrates.
222 Strategic operations management
Case: Hang-ups in India call centre backlash!
India isn’t the answer say some firms
Last year, after reading about Indian call centres in a magazine,Web.com CEO Will Pemble decided to ‘offshore’his Internet hosting company’s customer service.This November, plagued by cultural misunderstandings andlost customers, Pemble brought all of Web.com’s calls back from India to Brookfield, CT.
In the end, Pemble concluded, it was costing his company more to send work to India than to do it in oneof the highest-cost states of the Union. Dell made a similar – if much more widely publicized – decision inNovember, routing calls from some high-end business customers back to Texas from its Indian call centre inBangalore. None of this means that the great migration of service jobs to India and other low-cost overseas

Not surprisingly, outsourcing strategies have sometimes seen major
negative reactions from what were once seen as ‘core’ employees. For
example, in 1996, there was a major strike at General Motors (Leslie,
1996):
… when GM workers went on strike, the term ‘outsourcing’ became a
dirty word. Widely used when describing GM’s tactic of contracting out
for the manufacture of certain automobile components that it had been
manufacturing in-house,‘outsourcing’ in this context meant knocking
yet another raft of auto workers off GM’s assembly lines.
and (Financial Times, 26 June 1996):
The United Auto Workers Union used the 17-day strike to complain
that jobs were being threatened and technological leadership put at risk
by the increased shift towards outside suppliers.
In the UK, throughout the 1990s, the compulsory tendering of service
contracts by local government led to services such as street cleaning,
Supply management 223
locations (see ‘Where Your Job Is Going’ on fortune.com) is about to come to a halt. It is an indication, though,that there are limits to offshoring.The most obvious have to do with politics and public opinion: corporationsare having to tread more gingerly on the outsourcing front for fear of backlash from elected officials and customers. If the US economy keeps strengthening, that backlash should fizzle. But CEOs are being forced to realize that, while their shareholders may think it’s swell that customer calls can be routed seamlessly topeople in India making $2000 a year, many customers are less pleased.
In Web.com’s case it wasn’t so much anti-foreigner sentiment among customers as frustration with tech-support people who were simply too far from headquarters to reach the people who could solve problemsquickly. ‘If it’s a binary decision process – yes or no – then you should consider outsourcing,’ says Pemble.‘But if there’s a maybe in there anywhere, then you can be sure that all your customer-support difficulties willgravitate to that like iron filings to a magnet.’
As a result, many larger companies – like Dell – are developing a hierarchy of which calls get shunted over-seas and which don’t. ‘Not everything is moving offshore,’ says Amit Shankardass, Solution-Planning Officer atClientLogic, a Nashville-based call centre outsourcing company. ‘Airline companies would not move manage-ment of high-yield customers offshore.’ Instead, they practise, to follow industry jargon, ‘onshoring’ or ‘nearshoring’ – which means sending calls to Canada.
Meanwhile, back in India, the vaunted limitless supply of well-educated young English speakers willing toanswer phones is looking slightly more limited. Much of the IT work outsourced to India in recent years benefits from the 101⁄2-hour time difference with the Eastern USA – Indian programmers can work while theirAmerican counterparts sleep. But call centres and back-office operations that offer real-time service need peakstaffing in the middle of the Indian night, and many providers are already struggling with high turnover (upwardsof 20 per cent a year) among their urban, just-out-of-college workforce. As a result, Indian operators arebeginning to eye older workers living in the provinces. Translation: get ready for an even wider cultural and language gulf between workers and Western customers.
Source: Fortune, 22 December 2003, 148(13), p. 16.
maintenance, security and even such practices as planning permission,
being outsourced to private sector organizations – many from outside
the UK. At the national level, outsourcing information systems in cen-
tral government departments have recently been conducted but with-
out any clear (or ‘joined-up’) policy. This resulted in contracts for over
three-quarters of the central administration’s information systems
being placed with one, North American, company – but this only
became apparent later, causing much dismay.
A similar reaction has been seen in the USA, in some cases eliciting a
strong response. For example, in November 2002, the state government
in Indiana withdrew from a $15 million contract with the American sub-
sidiary of a leading Indian IT outsourcing firm. Governor Joe Kernan
said that the contract did not fit with Indiana’s ‘vision’ of providing bet-
ter opportunities to local companies and workers.
So although the decision to outsource has become a popular one, it
can cause unrest and strategic problems if it is poorly managed. But
simply divesting part of what was previously an owned asset is only part
of the puzzle. For such outsourcing to be successful, strategic buyer–
supplier relationships need to be in place, as we shall see.
The nature of supply
Looking back …
The practice of buying and selling is one of the oldest ‘professions’ in
the world. In the remains of cities within Mesopotamia (modern-day
Iraq) there are records of transactions that took place 6000 years ago –
bearing chilling resemblance to today’s purchase orders and materials
schedules. What has changed recently is the scope of concern that the
purchaser and seller must have in order to ensure their organization
survives. The copper traders in Ur may have paid the merchants from
Dilmun (Bahrain) for minerals from Makan (Oman), and considered
they were doing business over great distances. Today, the same distance
takes a couple of hours by air and traders in the modern equivalent of
each of these countries are dealing by Internet and mobile, wireless
telephony with collaborators, customers and competitors in every part
of the globe. Thus, managing the provision of the resources necessary
to conduct the operations of the organization – latterly called purchas-
ing, procurement, buying and materials management – is now a matter
of competing for scarce commodities that may differentiate the product
or service in the eyes of the consumer. It is a short, simple step to con-
nect such activity with the operations strategy for an organization.
224 Strategic operations management

The current position
The term ‘supply chain’ is now about 25 years old, having being coined
in the early 1980s by consultants (Houlihan, 1992) in various parts of
North America and Europe to crystallize the concept of managing an
organization in the light of the activities, resources and strategies of
other organizations on which it relies. Individual supply relationships
between pairs of organizations – sometimes called ‘dyads’ – were
addressed by economists such as Williamson (1975), Williamson and
Masten (1999), and Granovetter (1985) in the development of ‘trans-
action costs economics’, but the idea of going beyond the immediate
relationship to manage remote links (i.e. between one’s suppliers and
their suppliers) came later. The term ‘chain’ may have originated in
the concept of the ‘food chain’ (humans may like these because they
are at the ‘top’ of one) or simply the attractive causal image of a chain
of events. A contemporary of the supply chain was the value chain
(Porter, 1980), which we have discussed in Chapter 1.
The chain, however, is clearly an imperfect metaphor: even a cursory
attempt at mapping the process of supply (for anything other than the
simplest logistical transportation activities) reveals that there is little
about it that is linear. This is illustrated in Figure 6.1.
Supply is actually carried out in a network – or, perhaps, a mess! One
example of this complexity is given by the case of Octel Network
Services, Electronic Data Systems (EDS), Xerox and Motorola. EDS is
a major client of Octel Network Services, a firm in Dallas that operates
more than 1 million electronic voice ‘mailboxes’. EDS, in turn, has a
$3.2 billion contract to run Xerox’s computer and telecoms networks,
Supply management 225
?
A B C
E1
E2
g
H
??
X
A CD
E
?No!
The way wedescribe it:
The way itreally is:
A
Figure 6.1
The supply chain
metaphor may be
inappropriate.

a deal that involves some 1700 of Xerox’s employees transferring to
EDS. Xerox itself provides invoicing and billing services for Motorola,
which in turn designs and makes parts of Octel’s voice-messaging sys-
tems, and thus the circle is completed. Such supply configurations do
not fit into neat, simplistic models of the supply chain.
There are different types of supply networks and attempts have been
made to classify them (see Lamming et al., 2000). Management prac-
tice has sometimes struggled to deal with this problem, developing
models for controlling supply chains based upon the assumption that
one organization can intervene in the business relationships of another.
We shall examine this later. The process of forming a strategy for the
operational concerns of the organization outside its boundaries of
ownership and physical presence cannot rely upon a concept of
remote control, however: some better theory is required for managers
to employ.
Research over 20 years by a group of academics from around the
world, known as the Industrial Marketing and Purchasing group, has
concluded that it is not possible to manage in supply networks –
instead, it is suggested, organizations may only seek to manage within it
(Ford, 1997). So far, research in the area does not refute this conclu-
sion and, in discussing supply strategy within operations strategy, we
shall retain this assumption: forming supply strategy, as an accompani-
ment to operations strategy, begins with managing the relationships
between the organization and other organizations with which it deals
directly; as a result of this management, influence may be exerted on
the activities of organizations elsewhere in the network that are
involved in delivering the goods and services that form the focus of the
supply strategy. Some of the strong keiretsu networks formed in Japan
during the twentieth century do appear to be controlled by their prin-
cipal firms, but research in 1999 showed that this was changing pro-
foundly as Japan weathered 10 years of recession and the impacts of
global operations (see Lamming, 2000).
This makes sense for the strategist – form a plan for one’s own activ-
ities and then try to influence others (either directly or indirectly) so
that it may be complemented and therefore successful.
So, it isn’t a chain, and you can’t manage it, but ‘supply chain man-
agement’ is the term that has become common parlance around
the world – for managers, academics and politicians. We shall use
it here, but focus particularly on supplier relationship management –
the management of supply relationships between two organizations
(including the activities that one might term ‘purchasing’) and the
network perspective.
226 Strategic operations management

Managing supply – the objective
For many organizations, the major proportion of value offered to the
customer is actually derived not from doing things, but from adding
value to things that have been bought. This is sometimes referred to as
the ‘purchasing ratio’. In our fast-food example in Chapter 1, the cost of
the components of the meals sold by Sunnyside Up was around 30 per
cent of the meal itself. The component parts of an aeroplane often add
up to over 80 per cent of the total sale price: the aircraft assembler is
adding less than a fifth of the value, for all its labour, design, sales effort
and administration, etc. Many manufacturers of consumer durable
products have a purchasing ratio of over 70 per cent. If the unit cost
may be thought of as a pie chart, a typical manufactured product might
appear as shown in Figure 6.2.
Clearly, efforts to reduce the size of the pie – and thus the cost of the
item – should concentrate on all three aspects. A 10 per cent reduction
in labour costs would result in a 1.5 per cent reduction in overall cost; 10
per cent off overhead costs would lead to 3.5 per cent reduction. A simi-
lar reduction in material costs would reduce the overall pie by 5 per cent.
This simple point leads to the conclusion that control of material costs
may actually be more important than savings on labour or overheads. As
purchasing people like to point out, such savings go directly to the bot-
tom line for the company and improve profits in a way that increased
sales could rarely achieve.
In practice, however, materials costs result from a series (or chain) of
events – the supply chain. Reducing them is thus not simply a matter
of attacking the immediate target – the price paid for the goods or
services – but a more complex task of analysing the build-up of value,
Supply management 227
Material50%
Labour10%
Overheads40%
Figure 6.2
A traditional
representation of
product unit cost.

cost and time that has resulted in the material cost as it is experienced
by the organization.
As we have seen earlier, the materials are actually part of a service
provided by the supplier: materials surrounded by delivery, presenta-
tion, treatment, aftercare and so on. It follows that one is not simply
buying a product but paying for a service; this must be borne in mind
when considering the value being purchased.
Figure 6.3 provides a view of the way in which firms in the supply
chain may be viewed in the context of progressive value addition.
(Note that the customer is a part of this process and can be required to
add value for which they pay – for example, the total value of ‘flat-pack’
furniture includes the value which the owner adds by constructing it.
Normann and Ramirez (1993) suggested this might be termed the
‘value constellation’ principle, although this has not subsequently
become popular.)
The simplicity of Figure 6.3 should not hide the complexity of the
supply process, as discussed earlier, but it does show how an increase in
value added at any stage of the process might lead to an increase in
eventual value for the end customer, while a reduction in time taken to
process the product, and thus cost, may be lessened at any point. Since
either of these should increase the likelihood of the product succeed-
ing in the market-place, either should be to the benefit of all parties
in the supply chain. Each organization in the chain is naturally con-
cerned with the financial gain it makes from adding value in the
228 Strategic operations management
Value
Time/cost
Raw materialproducer
Componentsmanufacturer
Productmanufacturer
Distributor
Serviceprovider
Customer
Figure 6.3
Build-up of value
and cost in the
supply process.

process – in effect, the value it receives itself. Each organization must
thus have a supply strategy in order to operate within the chain, and in
order for the chain itself to operate competitively.
The players in the chain thus have two concerns: for the overall com-
petitiveness of the chain and for their own prosperity within it. Since
they derive their income from the value they add, each firm may be
expected with the others to add more of the total value. It follows that
the customers and suppliers at each stage in the chain are actually
competing for the value: they are competitors as well as collaborators.
Where the boxes in Figure 6.3 overlap there lies an arena for this com-
petition – the value should be great, the time/cost small. This leads to
a set of dynamic partnerships in the chain, which, if it works efficiently
in market terms, should lead to individual and mutual prosperity.
So much for the concept: how does it work in practice? Each organ-
ization is driven by its owners – shareholders in the case of a limited
company, public offices in the case of, say, a government department.
In either case, the responsibility of the directors and managers in the
organization is to their stakeholders: their shareholders, employees,
customers and members of the community affected by the activities of
the organization. The dominant force here has traditionally been the
first one: the owners. Recently, the stakeholder concept has been
extended to include suppliers to the organization; the actions of the
organization may have an adverse effect upon the suppliers in the
short term and on the supply chain (and thus the organization itself)
in the long term. This domination has led managers to be concerned
principally (often exclusively) with their own organization – especially
in the case of a limited company, where shareholders are most directly
aware of the results of any strategy.
Structuring the supply base
Observers of Japanese industrial structure coined the term ‘first tier’ to
describe the powerful, large suppliers that supported the household-
name manufacturers of cars, consumer durables and capital equip-
ment that were such a part of Japan’s revival in the post-war period.
The structure of supply ‘base’ – a sort of pyramid of firms upon which
the final product assembler sat – was a feature of the historical
Japanese social structure and key to the formation of the giant groups
(known as zaibatsu in the first half of the twentieth century and keiretsu
in the second half). As Nishiguchi (1986) pointed out, these supply
structures should not be seen as separate ‘mountains’ but as a sort of
Supply management 229

Alpine structure – a great base of manufacturing companies, from
which peaks (the well-known product assemblers) emerge (the point
being that components from any of the firms in the substructure might
end up in a product of any of the ‘peak’ organizations).
In Japan, the tiers are clearly marked (and documented). Elsewhere,
they do not exist, simply because the historical development of firms
has been more autonomous. The image of tiers is so strong, however,
that there is a tendency to call suppliers ‘first tier’ and ‘second tier’
without a logical basis. A tier, after all, is a very specific feature of a
structure: it has a hierarchical position (in this case, the first being
above the second, since the referencing is done from the top – the cus-
tomer – but it could easily be the reverse, in a different situation) and
lateral links to other items in the same tier (like seats in a stadium or
theatre – arranged in integrated rows).
The danger of referring to organizations in the supply chain, base or
network as ‘first tier’ (or second tier, and so on) is that the expect-
ations thus created bear no actual resemblance to the activity that will
be addressed by the organization in question, since the lateral links,
which may be essential for the expected activity, do not exist. Thus, a
vehicle assembler may require a major supplier to buy components
from other suppliers, and construct and deliver complete ‘systems’
(e.g. an entire engine cooling system, consisting of the radiator, hoses,
brackets, sensors, etc., ready to fit into the car). The system supplier
might be called ‘first tier’ but have little link-up with other suppliers,
with whom their supply of systems must be interfaced. It is now com-
mon to hear supply strategists speak of ‘tier-half’, referring to suppliers
to whom so much responsibility (e.g. for design and production) has
been given that they must be seen as not entirely separate from the cus-
tomer. This rather odd terminology fits well with the concept that a
relationship as close as this is actually an overlap between the two
organizations, rather than a bridged gap.
During the 1980s, supply strategists began to realize that they had, in
general, too many suppliers. It was not unusual for an organization (of
any size) to have more suppliers than employees. A practice emerged
for reducing the number of suppliers with whom the organization
dealt on a regular basis, in order to focus the cost of dealing with them
on a smaller number, who would therefore benefit from the customer’s
attention. This was usually termed ‘supply base rationalization’. In fact,
it seldom appears rational in practice – a common problem being that
illustrated in Figure 6.4. In the second diagram (post-rationalization),
there are in fact just as many suppliers involved in the supply base,
despite the number of direct suppliers being reduced by two-thirds.
230 Strategic operations management

Moreover, the ex-first-tier suppliers, now called second tier by the
‘Producer’, are likely to be demoralized, and possibly dissatisfied with
supplying to the remaining first-tier supplier. In many cases, the
Producer will stipulate that the first-tier supplier must purchase from
specific ex-first-tier suppliers, for political reasons, leaving the remain-
ing first-tier organization in a commercial trap. The supply strategist
must avoid this situation and devise a more rational approach if this
practice is to produce genuine benefits.
The Japanese tiered system was formed and maintained by a tech-
nique known in the West as ‘supplier associations’ (in Japanese:
kyoryokukai); this is discussed later in this chapter.
Setting up a supply strategy
In forming a supply strategy, there are four requirements, the first two
of which may be considered together:
■ a general policy on how the organization is to engage with its
external activities, accompanied by a suitable strategy for
implementing it;
■ an internal strategy for the role that the purchasing process
(and thus the functions associated with it) should play;
■ a set of specific approaches to managing supply relationships.
Supply policy and strategy
A policy is concerned with clarifying an organization’s position on
a specific matter – an articulation of the way it feels about something.
Supply management 231
The producer The producer
Tier structure before‘rationalization’ of supply base
Tier structure after‘rationalization’ of supply base
T1 T1 T1
T2 T2 T2T2 T2T2
T1
T2 T2
T2
T3T3T3T3
T2Figure 6.4
Tiers in supply bases
and the flaw in some
approaches to
supply base
rationalization.

In this case, the matter is supply. Directors of the organization may
decide that the nature of their business means that they must be very
competitive in the supply chain (i.e. in terms of controlling the value-
adding process) rather than collaborative. This would be the case
where the resources needed for the business (including skills, materials,
information, locations, equipment and finance) were scarce and the
number of suppliers or subcontractors with whom one might work
was high. In this case, simply getting hold of – or controlling – what
Cox (1997) called the ‘critical assets’ in the supply chain might be
enough to ensure success for the organization, and simultaneously
causing one or two other firms in the chain to suffer fatal difficulty,
causing them to exit, might not matter. In other circumstances, the
resources needed might be plentiful and the number of firms with
whom one might work small. In this case, the policy might be more col-
laborative, since success might only come from differentiating the
product or service through imaginative and creative development, in
which the organization and its suppliers would need to work together.
As industries tend to become more concentrated (i.e. mergers and
acquisitions are frequent) to support the costs of global operation, so
aligning oneself with the right supplier becomes an increasingly
important factor. In the aerospace industry, for example, there are
three manufacturers of engines for large passenger jets: Rolls Royce,
General Electric and Pratt & Whitney. For aircraft manufacturers, the
supply of engines is a vital area, but it is not a simple case of, say, Boeing
acquiring General Electric’s engine business, since the latter requires
non-Boeing business to support its research and development and pro-
duction activities. Such a strategy should not be seen as a soft position
for the supplier, however: in the large engines business of the aircraft
industry, a supplier must commit to achieving 7 per cent per annum
‘cost-out’ just to remain in the supply base (even as a half-tier sup-
plier). If this is not accepted, the customer will bring in another com-
pany that can do so.
The supply policy might also include meddling with the resources
issue – to create scarcity and thus influence the degree of competitive-
ness or collaboration in the chain. This is a central theme of Cox’s
(1997) approach, one that he suggests is universally applicable. It nat-
urally includes acquisition, so that one might become the owner of
assets required by a competitor, and thus hold the whip hand. Other
commentators argue that there are cases in which the immediately
apparent benefits of controlling all the assets may lead to longer-term
dysfunction in the supply markets as players upon whom the organiza-
tion must rely (for activities that may not be appropriate for it to
232 Strategic operations management

conduct itself) are starved and exit the field. This might mean that the
meddling organization is left to buy the products and services from a
reduced number of suppliers (who will feel little sympathy with it) or
make the items for itself. The investments necessary for the latter may
not be possible, or sensible, for the organization and it is thus left with
an inappropriate portfolio of activities to manage. In practice, the
reverse of this strategy is increasingly in evidence, as witnessed by the
growth in contract electronics manufacturers in the early 1990s,
fuelled by computer and other electronic product manufacturers sell-
ing their production facilities and setting up supply contracts with
their former in-house divisions – so-called ‘outsourcing’.
All this assumes that the organization is in a competitive situation
and has the ability to acquire and shed activities and businesses strategic-
ally. If this is not the case, the strategic potential for supply may be
limited.
Other factors come into the policy-making process, such as ethical
and environmental issues, social considerations and the nature of the
organization, including the constraints on its freedom of action (now
discussed under the general title of ‘corporate social responsibility’).
This will entail a series of trade-offs, such as the commercial benefits of
sourcing in low-labour-cost countries, versus the issue of child labour,
which may form a part of the low-cost labour.
Once policy is set, an overall strategy for supply requirements may
be formed. This will include matters such as ‘make or buy’ (or ‘do or
buy’), location and alliances. In the first of these, the organization must
decide whether or not it wishes to carry out a process itself, or have it
done by an outside party. This may be a simple matter of subcontracting
(having something done for you that you could do yourself but choose
not to) or outsourcing (setting up an external resource that does some-
thing for you in which you choose not to become expert). This is clearly
fundamental to the organization’s success and is not usually left to
traditional supply managers – e.g. purchasing directors.
The mass production approach to this was neatly summed up by
Henry Ford, who said: ‘If you need a machine and you do not buy it, you
will eventually find that you have paid for it but do not have it.’ With the
long product lives and controlled sales markets of mass production, the
logic of this statement is powerful. As the useful lives of product and
process technologies shorten, however, with the opening of markets
and the need to recognize the ‘voice of the customer’, so the wisdom of
buying ‘the machine’ may be less clear. Put briefly, it may be a choice
between, on the one hand, operating without a critical resource by buy-
ing in the service (thereby risking paying too much for the service and
Supply management 233
losing competitiveness, or even having to do without it) and, on the
other, being caught with a sunk cost investment in a technology that is
no longer commercially valuable (and thus paying off the investment
long after it has ceased to provide the necessary revenue). The former
problem (which would be avoided by acquiring the resource ‘in-
house’) may lead to a cost penalty and loss of sales, while the latter
(which could be avoided by outsourcing) might lead to a cash flow cri-
sis and insolvency. In fact, either could prove fatal. Once again, the
answer might be to meddle in the supply market, suppressing tech-
nologies that appear (e.g. by buying them) in order to increase the
period of ‘economic rent’ – and thus recouping the investment. The
extreme form of this would be monopoly – at least temporarily – in
which case, the organization’s concerns would be reduced. However,
the rate of technological change in many sectors makes monopoly a dif-
ficult concept: examples such as Microsoft Corp. are rare exceptions.
Policy may lead to the strategies of outsourcing, as we saw earlier.
The policy evident in Nintendo and Sega, for example, is that the nat-
ural dynamism of their products should not be reduced by heavy
corporate inertia. The strategy associated with this is to outsource
everything and concentrate on the competence of marketing. They are
thus never left with production competences that are out of date
(including the mercurial resource of software writing) and can switch
to a new idea with only minimal costs.
Sourcing strategy
Much has been written about ways of deciding where to procure prod-
ucts and services. The most well-respected modern approach was pub-
lished in the Harvard Business Review as long ago as 1983, by Peter
Kraljic, a senior member of the consultants, McKinsey. Kraljic’s sour-
cing ‘tool’ is shown in Figure 6.5.
Kraljic’s argument is that, for any item, the risk of being caught with-
out it (and thus, for example, stopping the production line or failing
to fill an order) may be high or low. Kraljic calls this risk of expos-
ure. The cost to the organization (of the procured item) may also be
dichotomized into high and low. Cost may include many factors in add-
ition to purchase price – for example, the cost of acquiring, storing,
insuring and maintaining the item. Combining these two factors enables
the supply strategist to decide on what approach should be taken to
managing the item; those in the top right-hand box may be treated as
strategically important and thus managed through close collaboration
234 Strategic operations management

with the supplier, while those in the bottom left may be dealt with via,
say, automated buying and stock control. Taking its origins clearly from
such ideas as the famous Pareto ‘80–20’ effect (which observes, in this
context, that 80 per cent of expenditure on goods and services supplied
to the organization will probably be accounted for by 20 per cent of
the suppliers from whom these things are bought), Kraljic’s tool has
encouraged supply managers in many sectors to consider more than
the immediate aspects of their sourcing decisions. Its simplicity has
appealed to supply strategists over two decades and many modern
strategies consist of little more than this diagram – almost always with
different wording, as the analysis has been customized to a specific organ-
ization’s situation. Anyone wishing to be taken seriously as a profes-
sional purchaser must be able to recognize and use this tool – as a basic
skill. As with all ‘two-by-two’ analysis methods, the tool is open to criticism
for oversimplification – there are other variables involved in sourcing.
There has also been recent discussion over the appropriateness of the
boxes – an item that is low in cost and has little risk of exposure
attached to it may still be a vital part, without which the organization
cannot function – the traditional ‘halfpenny’s worth of tar which (by its
absence) spoiled the ship’.
Internal strategy for the role of the purchasing process
Having built a strategy for supply itself and a way of understanding the
management of sourcing decisions, the supply strategist must decide
how purchasing is conducted within the organization. This has two
parts: location and process.
Supply management 235
HighLowLow
Ris
k o
f e
xp
osu
reCost significance
Strategic
Tactical
Bottlenecks
Supply Continuity
Routine
Efficiency
Strategic
Tactical
Critical
Co-operation
Leverage
Best Deal
Figure 6.5
Kraljic’s sourcing
tool (adapted from
Kraljic, 1983).

Location – where purchasing actually takes place – depends upon the
way in which the organization is structured. In a general sense, the organ-
ization may be set up to run with functional departments, each of which
contains career specialists who are both the operational competence of
the organization and also its ‘eyes and ears’ in that specialism (i.e. they
ensure that the organization’s competence in their area is up to date).
These vertical, functional pillars within the organization (sometimes
called ‘silos’, after the agricultural storage device in which materials such
as animal foodstuffs are delivered into the top of an upright cylinder, and
drawn off as needed from the bottom) form its structure. Across them
(i.e. from one functional area to another) flow the processes of the
organization – product development and order fulfilment being the two
basic activities. In recent years, many firms have removed their functional
silos and organized themselves along process lines, supporting the
processes with the necessary functional expertise at the appropriate
points. The operational manifestation of this is cross-functional teams, in
which experts with a variety of functional and commercial skill are put
together (often ‘co-located’ in one office) to take responsibility for a
specific process – such as bringing a new product to market on time.
Thus, purchasing, as the traditional home of responsibility for sup-
ply management, may be located as a separate functional department,
with processes passing into and out of it (in which case the manage-
ment role is to ensure that the interfaces with other departments do
not delay communications or add cost to the process) or as part of a
cross-functional team within a process-oriented organization, where
there are no clear ‘departments’. There are, of course, many hybrid
arrangements. Either way, the organization will need a strategy for the
way in which the purchasing process takes place, which will influence
the way in which it is organized.
The best-known and practiced strategy for this was developed by
Reck and Long in 1988. Like the Kraljic model, this useful approach
has survived from the 1980s, developed many times in practice but still
respected. It is a four-stage, hierarchical process with which managers
may compare themselves as they develop purchasing’s role and posi-
tion in the supply management of the organization. At all times, of
course, this needs to be conducted in the light of the policy and strat-
egy discussed above. Reck and Long’s model is shown in Figure 6.6.
The Reck and Long model enables the supply strategist to define the
role of the purchasing process and the function (i.e. the department).
It may be used first to identify the present situation and then to define
the appropriate position. Moving from one to the other then becomes
a project of change.
236 Strategic operations management

Other writers have constructed similar, multi-level models for explain-
ing the ways in which purchasing may be positioned to ensure the best
use is made of the expertise and the best ‘fit’ with corporate purposes
is maintained. Naturally, supply strategy must be made to fit with
higher level direction in the company, and thus the Reck and Long
model is used in the context of corporate strategy.
Two developments have fundamentally affected the way in which
purchasing is positioned as part of the supply process: information
technology (IT) and global expansions of business organizations. The
two are, of course, related. IT has made possible practices such as elec-
tronic purchasing (i.e. paperless and instant), sharing scheduling
information with suppliers via access to the organization’s intranet
(leading in some cases to the removal of the need to schedule deliver-
ies, simply asking the supplier to monitor stock levels of their products
within the organization’s stores and replenish them as necessary), and
information through intranet and Internet technologies. In some
cases, this has been combined with Kraljic’s model to encourage
people within the organization to purchase their own requirements,
using electronic catalogues that maintain a corporate knowledge of
‘best buys’. This is used to cover everything from travel to electronic
components, and takes the purchasing activity away from the specialist
and into the hands of the first-line manager. The purchase may be made
with a corporate credit card, so that the budget holder can monitor
expenditure against the plan and be accountable for it. This ‘atom-
ization’ of purchasing responsibility has the benefit of leaving the
Supply management 237
Independent
Passive
Supportive
Integrative
Stage
Purchasing strategy is fully integrated with theorganization’s competitive strategy and constitutespart of an integrated effort among functional peersto formulate and implement a strategic plan
Supports the organization’s competitive strategyby adopting purchasing techniques that strengthenits competitive position
Adopts latest purchasing techniques and practices,but strategic direction is independent from theorganization’s competitive strategy
No strategic direction: primarily reacts to requestsfrom other functions
Definition
Figure 6.6
Reck and Long’s
model for
developing the role
of purchasing
(adapted from Reck
and Long, 1988).

specialists to concentrate on strategic matters (including setting up the
framework agreements for the supply of the items covered) and rela-
tionship management on strategic items. The potential problem is that
control of expenditure will be lost; despite the rigour of budget man-
agement, individuals given autonomy for purchasing their require-
ments may not adhere to corporate guidelines in practice. If the
individual is a line manager who needs replenishment of production
components, there may only be one or two specified sources that can
be used (controlled by the information system). If the item required is
a laptop computer, however, there may be dozens – the proliferation of
suppliers of such items, accessed through catalogues, is precisely the
type of uncontrolled activity that results in administrative congestion
within an organization.
This may be controlled, however, as in the case of the British–
American global medical and foods manufacturer, GlaxoSmithKline.
In the late 1990s, GSK (in its former name of SmithKline Beecham –
SB) put in place a worldwide IT system that allowed any budget holder
in the corporation, anywhere in the world, to find the best buy for any
item, and to understand the corporate policy associated with the pur-
chase they are about to make. Thus, a manager wishing to buy a laptop
computer in Australia will know what it should cost to SB (global price
from the laptop manufacturer) and also what specification of machine
will be appropriate to ensure that it could be repaired in London or
Chicago, when the user is attending an SB meeting there. The techni-
calities are endless; the principle is clear. Giving responsibility for
sourcing to non-specialists throughout the organization requires discip-
line and support, but can lead to a reduction in formal (centralized)
purchasing departments, thus actually saving the organization money.
GSK were also one of the first companies to become expert in the
use of online auctions, in which suppliers bid for business in a live,
onscreen event, run by the customer or their agent. Online auctions
(once called ‘reverse’ auctions, because the prices are driven down-
wards in the bidding) are now commonplace, either within Internet
exchanges or simply as tools within the sourcing process. The initial
concerns for suppliers’ interests have largely abated and such methods
are seen simply as the way in which sourcing will be done in future (as
often seen, electronic communication replaces paper). In practice,
however, the online auction only replaces part of the sourcing process –
it is still important in many cases for purchasers and prospective
suppliers to discuss details of the contract personally. This may be a
complication where the customer has chosen to run the online auction
worldwide.
238 Strategic operations management

Globalization of operations and markets leads to further challenges
for positioning supply management. The customer for a manufactured
product expects it to operate efficiently in any country, and to be com-
patible with other items that may have been made in a different part of
the world. The same expectations of consistency exist for international
hotel chains, courier services and airlines. In global manufacturing,
the production system costs (which include supply of materials and com-
ponents) for an item made in, say, Latin America, need to be as close
as possible to those in, say, Korea, in order for location decisions to
made on the simplest basis possible – the logic of position (wage level,
subsidies, logistics, etc.). To address this need, global operators have
developed global purchasing and supply – dealing with other global
players on a worldwide level. One way of managing this is to assign
responsibility for technical expertise in a particular product or com-
modity area to a specific geographical office, e.g. the global head of
purchasing for a computer manufacturer might say ‘Our purchasing
expertise in DRAMs (dynamic random access memory chips) is located
in Singapore: anyone who needs to purchase DRAMs has only to speak
to Singapore in order to get the best deal from our global supply part-
ners.’ (Of course, ‘speaking’ is done via intranet.) In this case, Singapore
might be called the ‘lead buyer’ for DRAMs.
An alternative way of addressing this supply management need is to
set up what IBM calls ‘Commodity Councils’ – working groups with
members drawn from all operating divisions around the world that are
in constant touch with each other, meeting in person occasionally, as
well as via intranet and telephone or video conferences. The group
becomes the organization’s knowledge base and develops expertise
and ‘good deals’ in purchasing and supply. The advantage over the
‘lead buyer’ approach is that the expertise is spread around the div-
isions and may grow from a multiplicity of inputs and perspectives,
rather than the narrowly focused efforts of one group.
The following case shows how supply policy and strategy for acquir-
ing pharmaceuticals has been developed recently, in the highly com-
plex environment of the UK National Health Service.
Supply management 239
Case: The supply of pharmaceuticals in NHS hospitals – settingup a strategy
The English National Health Service spends over £11 billion per year on goods and services purchased from com-mercial companies. Of this, hospitals’ spend on pharmaceuticals is worth over £1.6 billion p.a. Traditionally, hos-pital pharmaceutical departments have been accountable for their own purchasing and contracting. This had thekey benefit of allowing them to accommodate the needs of their individual trusts, but had the disadvantages of
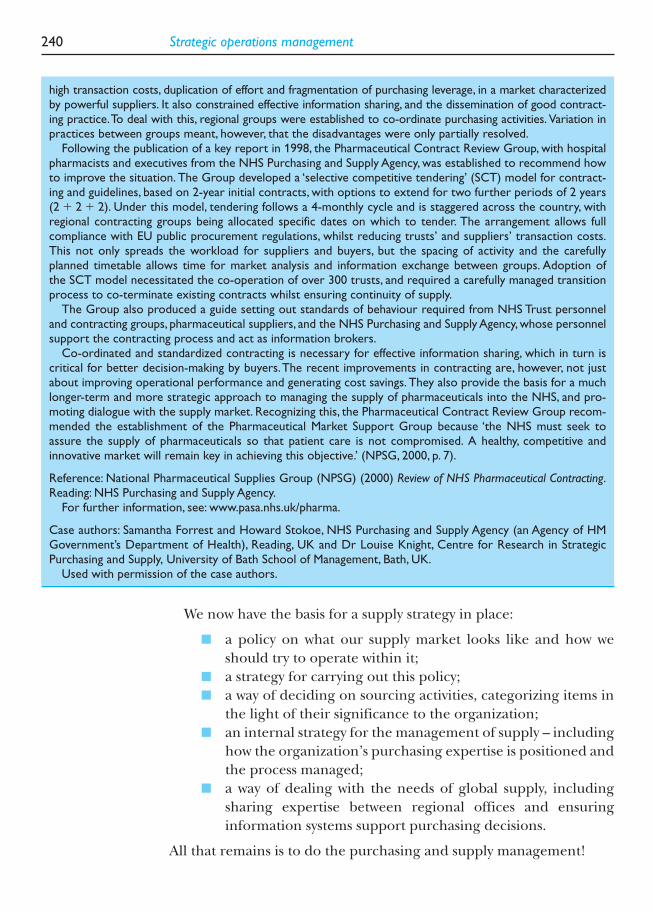
We now have the basis for a supply strategy in place:
■ a policy on what our supply market looks like and how we
should try to operate within it;
■ a strategy for carrying out this policy;
■ a way of deciding on sourcing activities, categorizing items in
the light of their significance to the organization;
■ an internal strategy for the management of supply – including
how the organization’s purchasing expertise is positioned and
the process managed;
■ a way of dealing with the needs of global supply, including
sharing expertise between regional offices and ensuring
information systems support purchasing decisions.
All that remains is to do the purchasing and supply management!
240 Strategic operations management
high transaction costs, duplication of effort and fragmentation of purchasing leverage, in a market characterizedby powerful suppliers. It also constrained effective information sharing, and the dissemination of good contract-ing practice.To deal with this, regional groups were established to co-ordinate purchasing activities. Variation inpractices between groups meant, however, that the disadvantages were only partially resolved.
Following the publication of a key report in 1998, the Pharmaceutical Contract Review Group, with hospitalpharmacists and executives from the NHS Purchasing and Supply Agency, was established to recommend howto improve the situation. The Group developed a ‘selective competitive tendering’ (SCT) model for contract-ing and guidelines, based on 2-year initial contracts, with options to extend for two further periods of 2 years(2 � 2 � 2). Under this model, tendering follows a 4-monthly cycle and is staggered across the country, withregional contracting groups being allocated specific dates on which to tender. The arrangement allows fullcompliance with EU public procurement regulations, whilst reducing trusts’ and suppliers’ transaction costs.This not only spreads the workload for suppliers and buyers, but the spacing of activity and the carefullyplanned timetable allows time for market analysis and information exchange between groups. Adoption of the SCT model necessitated the co-operation of over 300 trusts, and required a carefully managed transitionprocess to co-terminate existing contracts whilst ensuring continuity of supply.
The Group also produced a guide setting out standards of behaviour required from NHS Trust personneland contracting groups, pharmaceutical suppliers, and the NHS Purchasing and Supply Agency, whose personnelsupport the contracting process and act as information brokers.
Co-ordinated and standardized contracting is necessary for effective information sharing, which in turn iscritical for better decision-making by buyers.The recent improvements in contracting are, however, not justabout improving operational performance and generating cost savings. They also provide the basis for a muchlonger-term and more strategic approach to managing the supply of pharmaceuticals into the NHS, and pro-moting dialogue with the supply market. Recognizing this, the Pharmaceutical Contract Review Group recom-mended the establishment of the Pharmaceutical Market Support Group because ‘the NHS must seek toassure the supply of pharmaceuticals so that patient care is not compromised. A healthy, competitive and innovative market will remain key in achieving this objective.’ (NPSG, 2000, p. 7).
Reference: National Pharmaceutical Supplies Group (NPSG) (2000) Review of NHS Pharmaceutical Contracting.Reading: NHS Purchasing and Supply Agency.
For further information, see: www.pasa.nhs.uk/pharma.
Case authors: Samantha Forrest and Howard Stokoe, NHS Purchasing and Supply Agency (an Agency of HMGovernment’s Department of Health), Reading, UK and Dr Louise Knight, Centre for Research in StrategicPurchasing and Supply, University of Bath School of Management, Bath, UK.
Used with permission of the case authors.

The process of purchasing and supply
The purchasing and supply process is one of responding to demand
for products and services from within the organization by providing
the necessary resources to specification. This involves competences,
action and knowledge. Identification of the services and products that
the organization requires, and their sources, may stem from any of
three directions.
The first is the user of the product or service. Clearly, a designer of a
product will be concerned for the parts that fit within it and will keep
a close eye on the possible sources of supply. Similarly, budget holders
who want items of capital equipment will have clear ideas of the mod-
els they would like to get. The manager of a hotel within a global group
will know which laundry service works best for him or her; the catering
manager at a company restaurant will be aware of the best place to buy
fresh vegetables. The risk here is that the budget holder may not be in
touch with the commercial consequences of specifying a particular
supplier for the parts; the same may apply to the purchase of capital
equipment (it is less likely that the problem would arise for the hotel-
ier or catering manager, who may be expected to be very much in
touch with the immediate commercial consequences of their sourcing
decisions). However, the user is the traditional origin of the require-
ment for purchased resource and will often go beyond identifying the
generic resource, suggesting or even specifying the supplier of the
item with whom purchasing should place the contract for supply.
The commercial problems of this should be obvious: the sup-
pliers know that the buyer must get the item from them and will nego-
tiate accordingly. It is not surprising, therefore, that it is the dream of
every sales representative in the manufacturing industry to have their
component specified by the designer of a product before purchasing
becomes involved. The potential problem may be addressed strategi-
cally by deciding that purchasing should be involved early, perhaps
advising the designer on potential suppliers that might be considered.
The strategic supply manager must thus develop and maintain a know-
ledge of the supply market as good as that concerning the sales market
which would be expected of a marketing manager. If this is done, the
supply manager becomes a genuine source of ideas in the decisions
about what resources to use in the organization’s business.
The third origin of ideas for such resources comes from outside the
organization – the supply base. Suppliers of services and products to an
organization are often able to use their expertise, developed from
working with a variety of customers, to the benefit of the organization.
Supply management 241

Managing this resource must be done with care, since the organization
must retain its own strategic choice, rather than become dependent
upon suppliers for its resource management. Others within the organ-
ization may suspect the supply manager’s introduction of a supplier’s
idea into, say, a design discussion (especially if it conflicts with the
preference of the designer, even without technical problems) and
tension in the internal relationships between functional specialists
is apparent in practice in almost any case of integrating external
and internal resource management. Nevertheless, if the full strategic
advantages of a properly managed supply process are to be realized,
the ideas and expertise of the supply base must be tapped. As Gene
Richter, Head of Global Procurement at IBM, told every one of his
2400 staff (by e-mail) in December 1997:
Our suppliers are often more aware than we of technology
developments, what our competitors are doing, and where the
industry is going. We must learn to listen to them and act on what
they tell us.
At the time, this was seen as a new responsibility for supply managers.
Most of their training has been to do with telling the supplier what to do
and managing the problems that result from this rather arrogant pos-
ture. Suppliers, after all, work with lots of customers and know their
own business (service or product) well: if the customer tries to manage
them, they are likely to defend themselves against the cost and strategic
implications of the customer’s demands, setting up a traditional rela-
tionship battlefield. In mass production this was the general modus
operandi: a battle of wits in which the supplier (who may be assumed to
be in league with other suppliers, through trade associations and other
mechanisms) would build-in costs to the transaction to pay for the diffi-
culties the customer caused through arrogance. In post-mass produc-
tion days, where customers demand what they want, rather than accept
what providers offer, the costs of this battlefield may be punitive for the
supply chain. The listening to suppliers that Richter evangelized has
become a common aim for purchasers. The head of Ford followed
IBM’s lead 5 years later, with COO Sir Nick Scheele encouraging all
personnel (in an e-mail) to work towards closer relationships with sup-
pliers. So, the company that invented the old way, 100 years before, now
sought a new way. Some better ways of working were required, starting
with recognizing and managing supply relationships.
242 Strategic operations management

Supplier relationship management
In the next part of this chapter we shall look at the ways in which supply
managers try to deal with their relationships with other organizations
(suppliers of materials, components and services to the organization)
and explore some ways in which these may need to be developed in
order to ensure the supply chain is effective. This is known as supplier
relationship management, or SRM, and has a direct resemblance to
CRM, or customer relationship management, which is a core feature of
marketing. In doing so, we shall touch upon the principles of lean sup-
ply – the supply management activity necessary to provide a lean supply
chain within a lean production system. We shall not concern ourselves
with semantic differences between ‘lean’, ‘agile’ and ‘mass customiza-
tion’ for these purposes: the focus is on developing strategies to ensure
that supply functions perfectly. The three aspects of SRM that we shall
use in exploring the move from mass production thinking to lean sup-
ply are: how performance in the supply chain is assessed; how develop-
ment is approached and conducted; how information and knowledge
are shared within the supply chain. Sometimes this relationship places
enormous stress on suppliers, as the following case demonstrates.
Supply management 243
Case: Wal-Mart keeps the change
Suppliers pay for new technology, but Bentonville really benefits
Imagine strolling into Wal-Mart to buy the new DVD of The Matrix. As you take it off the shelf, a radio signalalerts an employee to restock, telling him where in the backroom to find The Matrix and giving a warning pingif he mistakenly slides it onto the Legally Blonde shelf. Meanwhile, forget going through the checkout line: anelectronic reader scans the items in your cart and automatically charges your debit card.
Sound far-fetched? The future is closer than you think. Wal-Mart, the company that almost singlehandedly madethe bar code ubiquitous by demanding 20 years ago that suppliers use it, is promoting a new tracking and identifi-cation system. Called radio frequency identification (RFID), the geeky-sounding technology – already used byExxon Mobil Speedpass and E-ZPass – will revolutionize both the way stores sell and the way consumers buy.
On 4 November,Wal-Mart’s top 100 suppliers are convening near Bentonville,AR, for what amounts to aUnited Nations of retail. Everyone from Procter & Gamble, which sells 17 per cent of its goods to Wal-Mart,to Unilever, which sells 6 per cent, will attend the 2-day meeting.They’ll discuss plans for attaching RFID tagsby January 2005 to every box and pallet shipped to Wal-Mart (smaller suppliers have until 2006). Wal-MartCIO Linda Dillman is expected to explain what needs to be tagged (high-volume products may be targetedfirst),where it will be rolled out (chances are it will happen by region) and how RFID will tie into existing deliv-ery systems. Flout Wal-Mart’s orders, and ‘you potentially get thrown off the shelf of the largest retailer in theworld,’ says Banc of America household-products analyst William Steele.
Dozens of RFID component manufacturers – from tiny startups to tech titans like IBM, Intel, Microsoft andPhilips Semiconductor – will also be at the Bentonville meeting, vying for a piece of the action.
Because of cost and privacy concerns, Wal-Mart plans to start using RFID just in its backrooms and distri-bution centres, not on individual products or at checkout. But wider use of the technology is inevitable.The Defense Department already uses it internally to track some 400 000 items – from air-cargo containers

SRM and performance assessment
Measurement of performance is an important part of strategy. This
requires prior identification of the criteria for success, disciplined moni-
toring of performance against the criteria and their component parts,
and careful interpretation of results. In the field of supply manage-
ment, this process has become established over three decades and is
typified by schemes that are generally known as ‘supplier (or vendor)
assessment’. The principle of supplier assessment is that the customer
sets up an articulation of its expectations and requirements, monitors
the supplier’s performance against them and then converts the results
into an assessment of the supplier’s performance, complemented in
some cases by suggested paths towards improvements.
Supplier assessment began in the 1960s, tracing its origins to the qual-
ity management movement that grew from the work of Walter Shewart
in North America in the 1930s. The development of quality manage-
ment in Japan following the Second World War was supported by the
American consultants such as Deming and Juran, itself leading to a
renaissance of concern for quality in the West. Part of this concern
focused upon the quality of incoming goods and materials. In the defence
(aerospace) and automotive industries, schemes began to appear for,
typically, ‘supplier quality assurance’. These schemes generally employed
some statistical analysis of data concerning performance criteria set by the
customer – ‘hoops’ through which the supplier must ‘jump’.
The focus on product quality was gradually replaced (on both sides
of the Atlantic and in the other areas of the industrialized world that
took their steer from the USA and Europe) by a focus on service and
244 Strategic operations management
to Hummers – and last month the DoD issued a Wal-Mart-like edict to suppliers to be RFID-ready by 2005.Metro, Germany’s leading retailer, opened an RFID-rich Future Store in April.
Retail analysts at Sanford C. Bernstein estimate that Wal-Mart could save $8.35 billion annually by using RFID –mostly in labour costs from not having to manually scan the bar codes of incoming goods.While other analystsbelieve the $8 billion figure is optimistic, there’s no doubt RFID can help solve retail’s two biggest problems:out-of-stock items and shrinkage – products lost to theft or supply-chain snafus. Theft costs Wal-Mart alonean estimated $2 billion a year; a legitimate business of that size would rank No. 694 on the Fortune 1000.
Though few suppliers will say so publicly, many are less than thrilled with the RFID mandate – they see costs,not benefits. Only about two dozen companies have conducted meaningful pilots, and most analysts say RFID isstill too expensive and full of bugs for widespread use. AMR Research estimates that a typical consumer-productscompany will spend $13–23 million just to meet Wal-Mart’s 2005 demands. True, Larry Kellam, Director ofSupply-network Innovation at P&G,notes that reducing out-of-stock products by 10–20 per cent could boost itsannual sales by anywhere from $400 million to $1.2 billion. But benefits of that magnitude will come when com-panies start analysing their data to reduce inventories and respond better to fluctuations in consumer demand.
For now, it seems, RFID is just the latest cost of living in a Wal-Mart world.
Source: Fortune, 10 November 2003, 148(10).

on appropriate management approaches in the supplier organiza-
tions. Thus, schemes emerged with complex algorithms for calculating
the supplier’s performance, often accompanied by annual reward cere-
monies and all the trappings of celebration that are associated with
project management.
In the 1980s, some companies began to institute schemes that involved
two-way assessment: the customer would tell the supplier how well or
poorly they were performing and seek the supplier’s view of them as a
customer in return. Suppliers would naturally tend to be complimen-
tary, fearing retribution from the customer for a criticism, and the
resultant good feedback from suppliers would encourage organizations
to refer to themselves, rather naively, as ‘preferred customers’.
Supplier assessment, however, has a basic flaw: responsibility for the
performance of the supply activity cannot simply be laid at the door of
the supplier. The manner in which the customer (and not just its pur-
chasing department) conducts itself in the transaction is also heavily
influential on the smooth running, or otherwise, of supply and the
related costs. Thus, vendor assessment, born of a time when the cracks
in the mass production paradigm were beginning to show, results not in
the improvements in supply that are expected (and may indeed be shown
and measured by proud customers), but in a systemic corruption of the
process, as suppliers learn how to deal with dozens of different customers’
assessment schemes, managing by guile to avert the commercial disas-
ter that full compliance with all of them would almost certainly entail.
The principle of supplier assessment is logical but limited. There are
many different types of scheme in operation and it is clear that, in some
cases, the suppliers are actually helped by them. However, the area of
assessment is thus one in which supply strategists should be employing
their imagination and creativity. If it is not worthwhile to measure the
individual performance of the supplier (which results, almost always, in
a game of blame and defence) nor even that of the two separate parties
(customer and supplier – again, this becomes a game of blame and
counter blame, if, indeed, it ever moves beyond the blame and pleas-
antry model), then some other focus must be found for the perform-
ance measurement that is a critical part of strategic management.
One approach to this has been to use a facilitator between the two
parties who provides the rationale in assessment. The Relationship Posi-
tioning Tool, developed by academic consultants at Glasgow Business
School in the 1980s, does just this (Macbeth and Ferguson, 1994). Using
a common framework for assessment, the performance of each organ-
ization is mapped independently (by the consultant/facilitator) and then
a comparison and discussion takes place to identify ways forward.
Supply management 245

A further development of this is to manage the unique relationship
that is shared by the two parties as an entity itself; that is, the overlap of
operational value adding between one stage in the chain and the next
(as shown in Figure 6.3) is seen as a jointly owned activity with ‘fuzzy’
responsibility instead of a clean division, at least for operational pur-
poses. The legal difficulties with this may be small or great, depend-
ing upon the situation. In the early 1990s the expression ‘partnership’
became popular within this context, with organizations professing
mutual interest embodied in the relationship of partners. This served
well in terms of awareness of shared responsibility but raised potential
problems, especially when things went wrong. In the UK, under the
1891 Partnership Act, any two parties acting as if they are one entity
become jointly responsible for one another’s liabilities (as partner-
ships in, say, the legal profession do). Two companies acting this way
may therefore incur unwanted liabilities – even if they do not actually
call their relationship a partnership, or even claim that it is not (the
interpretation is left to the courts). It may be that the only way around
this is actually to form a third party – a joint venture company. When
the stakes are high, this is precisely what some firms have done.
Assuming that the customer and supplier do not need to go to quite
these lengths, it is reasonable to view the joint operation of organiz-
ing supply as a shared responsibility, and measuring its performance
becomes a mutual interest. Since the activity of either party to the rela-
tionship (customer or supplier) might affect the performance, there is
clearly no point in one of them simply blaming the other (other than
as a tactical ploy in the ‘competition’ part of the relationship). Instead,
the two can jointly assess the relationship and take appropriate action
to reduce the difficulties it is experiencing, thereby improving the effi-
ciency and cost-effectiveness of the value-adding process. This technique
was pioneered by researchers at the University of Bath, in the form of the
relationship assessment process (RAP), and subsequently, in the UK
aerospace industry, as the relationship assessment process. The RAP is
shown in Figure 6.7. In the early years of the new century, the field of
management consultancy in purchasing and supply abounds with rela-
tionship assessment models: a good example of practice (via consul-
tancy!) following academic research by about ten years.
SRM and development
The development of supplier assessment over three decades reveals a
worrying assumption on the part of supply strategists that Gordon
246 Strategic operations management

Selfridge’s famous aphorism ‘The customer is always right’ is a truism
rather than the retailing sales tactic that it really is. The extension of this
suggestion to commercial and industrial supply has left a legacy of tech-
niques in which the customer assumes the role of infallible despot, while
the suppliers become wily and resourceful, living on their wits and tricks.
As supplier assessment needs revision for post-mass production sup-
ply strategy, so its close cousin, supplier development, is also ripe for
new perspectives. The idea that the customer could blame the supplier
for all the shortcomings in the supply process led not only to the assess-
ment mentality, but also to a view that customers might tell suppliers
how to run their businesses – under the banner of development.
Growing in popularity on the back of supplier assessment in the 1980s,
this approach meant that by the mid-1990s many customers were seek-
ing to ‘develop’ their suppliers in industries far from the origins of the
approach (once again, aerospace and automotive). While some logic
may be seen in, say, a global automotive company telling a small com-
ponents manufacturer how do adopt statistical process control, the
rationale for an airline telling its bakery supplier how to make its bread
rolls is difficult to see. The latter example is real, however, and illus-
trates how far a fashionable idea can drift from its relevant basis.
Supplier development is actually a ‘developing countries’ strategy –
used when an organization from a developed country wants to set up
supply lines in a new, foreign venture. This also applies in the case of
redeveloping economies and was evident in the strategies of the Japanese
Supply management 247
Power
issues
Closeness
Dependency
issues
Problem
solving
Benefits
Depth
The Relationship
Supplier dimension
Enablers
Influencers
Contact
frequency
and type
Sale
size and
type
Resources
committed
Customer dimension
Enablers
InfluencersCRiSPS 1996; A T Kearney 1997
Competitive
pressures
Competitive
priorities
Internal
relationships
Purchasing
abilities
Marketing
abilities
Internal
relationships
Competitive
priorities
Competitive
pressuresResources
committed
Order
size and
type
Contact
frequency
and type
Figure 6.7
The relationship
assessment process
(adapted from
Lamming et al.,
1996).
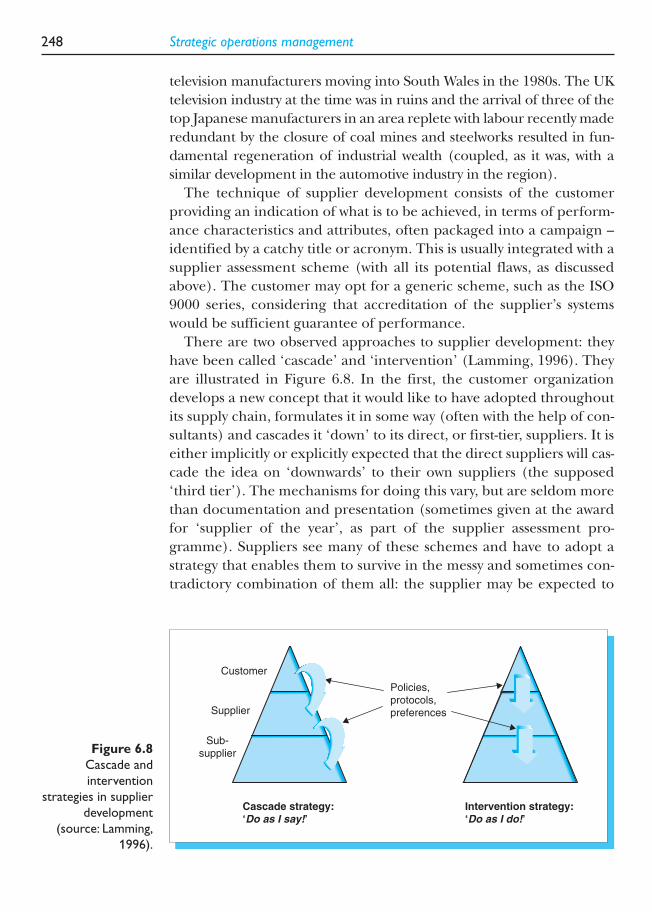
television manufacturers moving into South Wales in the 1980s. The UK
television industry at the time was in ruins and the arrival of three of the
top Japanese manufacturers in an area replete with labour recently made
redundant by the closure of coal mines and steelworks resulted in fun-
damental regeneration of industrial wealth (coupled, as it was, with a
similar development in the automotive industry in the region).
The technique of supplier development consists of the customer
providing an indication of what is to be achieved, in terms of perform-
ance characteristics and attributes, often packaged into a campaign –
identified by a catchy title or acronym. This is usually integrated with a
supplier assessment scheme (with all its potential flaws, as discussed
above). The customer may opt for a generic scheme, such as the ISO
9000 series, considering that accreditation of the supplier’s systems
would be sufficient guarantee of performance.
There are two observed approaches to supplier development: they
have been called ‘cascade’ and ‘intervention’ (Lamming, 1996). They
are illustrated in Figure 6.8. In the first, the customer organization
develops a new concept that it would like to have adopted throughout
its supply chain, formulates it in some way (often with the help of con-
sultants) and cascades it ‘down’ to its direct, or first-tier, suppliers. It is
either implicitly or explicitly expected that the direct suppliers will cas-
cade the idea on ‘downwards’ to their own suppliers (the supposed
‘third tier’). The mechanisms for doing this vary, but are seldom more
than documentation and presentation (sometimes given at the award
for ‘supplier of the year’, as part of the supplier assessment pro-
gramme). Suppliers see many of these schemes and have to adopt a
strategy that enables them to survive in the messy and sometimes con-
tradictory combination of them all: the supplier may be expected to
248 Strategic operations management
Customer
Supplier
Sub-supplier
Policies,protocols,preferences
Cascade strategy:‘Do as I say!’
Intervention strategy:‘Do as I do!’
Figure 6.8
Cascade and
intervention
strategies in supplier
development
(source: Lamming,
1996).

develop expertise in dealing with such complexity, appearing to com-
ply with all but in fact approximating each to a common model.
The second strategy has the same basis as the first – the good idea
(perhaps termed ‘best practice’) stems from the customer and is
passed on down to the suppliers. However, in this case, the customer
‘intervenes’ into the business of the supplier, actually working at the
operating level to help the supplier to develop specific skills. In this
case, the customer is clearly making a real investment in the process,
and this is likely to be more respected by the supplier as a valuable con-
tribution (rather than simply issuing edicts ex cathedra). From the cus-
tomer’s point of view, it may actually be possible to make ideas ‘stick’,
by working alongside the supplier’s personnel in implementation.
The problem with intervention strategies is that the supplier may
simply become dependent upon the customer for new ideas – a
‘sheep’. The strategy should be used with care, therefore, and for a
limited period only. This path was followed by the Japanese vehicle
assemblers on coming to the UK and the USA: the intervention was for
a limited period, following which the supplier was expected to develop
their own competences, although the customer still brought new chal-
lenges and initiatives, to ensure the suppliers (of components, mater-
ials and services) were aware of the pressures in the end markets,
which had to be transmitted all the way back along the supply chain.
In the course of time, one might expect the advanced supply strategist to
construct a way of capturing the learning available from the interaction
with suppliers so that the customer also sought to develop, not just the
supplier. This might be a two-way, ‘vertical’ activity or perhaps, recogniz-
ing the complexity of the actual situation, a case of network develop-
ment, where any player might learn from, and help to develop, any
other. This situation, which is illustrated in Figure 6.9, is rarely found as
yet, although one good example is the Supply Network Innovation
Programme at British Nuclear Fuels plc in the UK in the following case.
Supply management 249
Case: The Supply Network Innovation Programme at British Nuclear Fuels plc – an example of radical thinking in supply management
British Nuclear Fuels plc (BNFL) is an international business employing 23 000 people in 16 countries.Theiractivities span the entire nuclear energy cycle, from reactor design and fuel manufacture, generating electricityin nuclear power stations to spent fuel recycling and decommissioning, and cleaning up redundant nuclear facilities. The company has a large supply base, providing materials and services, many of a very specialized high-technology nature.
In 1998, BNFL decided to develop a ‘supplier of the year award’ scheme, to reward outstanding suppliers for their achievements over the past year, on an annual basis.This was seen as a normal approach to supply

Whichever ways the development of skills, knowledge, learning and
techniques is fitted into a supply strategy, it is important not to lose
sight of the degree to which the customer, as well as the supplier,
should seek to improve in all aspects; not to do so represents a waste of
resources – something that lean supply cannot tolerate. It is a question
of retaining strategic autonomy in both the supplier and the customer,
250 Strategic operations management
management, underway in many industries, but before they embarked upon it BNFL purchasing strategists didsome deep thinking. They brainstormed,workshopped, consulted widely and talked to their suppliers.They real-ized that to go this route would simply be following an old-fashioned idea – treating the performance as theresponsibility of the supplier alone, whereas, in fact, it reflected on the customer as well. Rather than develop-ment being something that should be done to suppliers, they realized that they should develop too, as part of theprocess. Leaving the outdated, mass production idea behind, BNFL began to work on a radical, lean idea; the supply network, they argued, could develop in many ways, using good relationships between BNFL and suppliers(singly and in groups) as the means for delivering mutual benefits and removing noise from the supply network.They designed and implemented a new scheme – the Supply Network Innovation Programme (SNIP).Withinthis programme, project teams would form, consisting of people from BNFL and a supplier (in practice, thissometimes became two or three suppliers at once – a mini-network). Each team would be set up on the basisof an identified development project that would provide benefits and learning for BNFL and the supplier. Whereinvestment was required (people’s time, etc.), a cost-benefit analysis would be drawn up to show the businesslogic for both parties – and identify the criteria for success (in fact, this became the norm).The projects wouldbe intended to run for about 9 months, at which point their success would be assessed. (In practice, many proj-ects have continued well beyond this period, delivering joint benefits for several years.) The most impressiveprojects would then be presented to an annual celebration event, attended by a broad range of suppliers andfunded by BNFL, at which those involved in the projects (the BNFL people as well as those from the supplier)would be given physical records of the celebration – such as small, specially commissioned sculptures – notawards but symbols of the team’s success. The intrinsic reward to suppliers and BNFL of being celebrated fortheir achievements, in front of 200 representatives of many industry organizations, was significant.
The scheme was a resounding success, resulting in major financial benefits for BNFL and its suppliers. Manyof the projects (some 30 celebrated between 1999 and 2003) provided significant cost savings for BNFL andincreased business or improved terms for the supplier. It is an example of lean supply at work: mutual benefitsthrough network development, getting away from ‘the customer’s always right’ and cutting the noise or waste inthe system that results from the mass production attitudes to performance measurement.
Networkdevelopment
Vertical, two-waydevelopment
Customer
Supplier
Sub-supplier
Figure 6.9
Two-way vertical
development
(customer and
supplier) and
network
development
(source: Lamming,
1996).

recognizing the fundamental competition that exists between the sup-
ply chain ‘partners’, and managing the limitations to both so that each
exploits the business opportunity to the level necessary to ensure their
continued, combined activity.
One way of approaching this problem is through mimicking the
Japanese technique of bringing suppliers together into a supplier
association (the Japanese word is kyoryokukai). In this approach, the
customer sets up a series of meetings between suppliers that it wants to
form into a development group – the objective being to improve the
overall situation in supply for the customer’s products (with conse-
quent benefits for all in the supply chain). These meetings may take
place on neutral territory, and it may be necessary for the customer to
be absent, at least after an initial ‘bonding’ has taken place. Supplier
associations are a central feature of the Japanese system and have been
adopted in the West successfully in several industries, the first European
example being set up by Canon in France (for more information on
this, see Hines, 1994).
SRM and information sharing: open-book negotiation
Recently, the practice of requiring a supplier to reveal all sorts of sen-
sitive information to the customer, in the interests of joint competitive
position, has become popular. The principle is that, if the supplier
shows the customer how the costs are structured for a particular prod-
uct or service (including, sometimes, their profit margins), the cus-
tomer will be able to help the supplier to reduce costs, and thus prices.
Sometimes this is dressed up as part of a joint effort, i.e. amid claims
that the customer’s own product or service might become more com-
petitive in the market-place, thus ensuring the supplier’s business too.
The principle of open-book negotiation is sound, but in practice it
appears to be flawed – something the supply strategist must clearly
understand. The supplier must manage resources to meet corporate
objectives – generally a matter of shareholder value and return on cap-
ital employed. To do so, it has to manage risk and reward. Business is
all about taking risks (i.e. making investments) and then ensuring that
the reward is sufficient to justify having done so. When two parties
compete, one will try to ensure that the other does not receive
adequate reward for the risk and suffers accordingly. If they are col-
laborating, however, it is in the interests of both that they each receive
appropriate reward – although for truly strategic operations to be
conducted, each party must be free to decide its own rate or return.
Supply management 251

In the supply chain, the organizations are both competing and col-
laborating. Thus, they must ensure that each makes appropriate
reward, but there will be constant tension over who actually takes what
risk and how the rewards (which are clearly jointly generated – each
party is dependent upon the other) are shared.
A supply strategy that requires one side of a supply relationship to
take a risk while the other does not, with the second seeking to articu-
late in heroic terms what the reward should (or might) be for the for-
mer, appears unlikely to succeed. When a customer stipulates to a
supplier, therefore, that private information must be revealed (i.e. the
supplier must take a very great risk) and also what the reward should
be (i.e. the supplier is not allowed the strategic determination of the
vital risk–reward business balance), it is probable that the supplier will
take the only sensible business action, and cheat. Information will be
distorted and misrepresented, incomplete and arcane. The customer,
believing that they have extracted valuable information, will act
accordingly and may only find after some time that they are not deriv-
ing the value from the transaction that they expected. (The failure of
some European automotive manufacturers to make profits after a
decade of such – publicly declared – initiatives may be related to this.)
The only solution to this is to manage the risk in some way, so that it
makes economic sense for the supplier to share information. If the cus-
tomer takes a risk, as well as requiring the supplier to do so, there may
be a chance of genuine information and knowledge emerging. Thus,
for a worthwhile supply strategy, exchange of sensitive information
must be two-way – the customer must share information as well as
demand it. Such ‘transparency’ may result in focused activity towards
real improvements, but it will often require a great deal of confidence
on the part of the supplier, that the customer has really taken a risk.
Research on this has developed the management technique of ‘value
transparency’ – now in use in manufacturing firms in the UK and USA
and under consideration in the healthcare industry. For an explan-
ation, see Lamming et al. (2001). It is not currently a common-place
practice, however, and is actually considered impossible in some
instances. It is, perhaps, an area in which the supply strategist must
explore and innovate.
SRM: policy and strategy
Equipped with a policy, general strategy, structure plan, internal strat-
egy for the purchasing and supply process, and set of techniques for
252 Strategic operations management

managing relationships, the supply strategist can make a significant
contribution to operations strategy – in both financial and technical
terms. The structure of the organization may change fundamentally as
a result, perhaps leading to more dissipated, decentralized activity, in
which case the activity of supply management becomes even more
important.
This may challenge or even threaten some traditional approaches to
strategy and organizational analysis. When it is stripped of its mass
production baggage, however, supply management consists of a cold
logic and pragmatism that cannot be ignored for long.
Supply management 253
Case: Facing the complex problems of managing supply
In order to illustrate the differences between lean supply and intervention strategy in supply chain manage-ment, we may consider the case of a Spanish manufacturer, identified here as ‘Nunca’.This company is locatedin north-east Spain and manufactures a high-technology, high-complexity consumer product to which itsclients add finishing touches (only a few features, in some cases) before selling the product as their own, to bemarketed through distributors to end customers.
Nunca’s unit cost for the product includes approximately 70 per cent bought-in components and materials.In addition to these, Nunca often receives materials ‘free-issue’ from its clients.
The Nunca name is well known – especially for design. Many of the items of equipment that they make fortheir client are actually Nunca designs, and the consumers who buy them appreciate this. The famous Nuncainsignia is displayed on the product in addition to that of the client.
Nunca’s clients are all skilled in manufacturing processes similar to those conducted by Nunca but are accus-tomed to work in high volumes.Nunca,on the other hand, has chosen to specialize in making high-profile nicheproducts (or equipment that constitutes a large part of the finished product) for its clients to market.The components that are issued free of charge to Nunca are generally those the client purchases for use on a high-volume product, which are also fitted to the low-volume niche model made by Nunca.
In 1996, a very large French client (‘Choux’) that had been dealing with Nunca for many years began to treatthe Spanish firm as ‘a partner’. Although the equipment that Nunca made constituted almost the total value ofChoux’s product, in some cases (i.e. the ‘package’ that Choux sells to consumers is basically the Nunca prod-uct with the Choux badge added), the relationship had been one of master–servant, with Nunca allowed tomake only minor decisions in sourcing components. This was a very limited expectation for Choux to exhibitin respect of a ‘first-tier’ supplier.
As part of its supplier development programme, Choux started to intervene in Nunca’s supply operation.Nunca had its own supplier accreditation (vendor assessment) scheme,but Choux insisted on visiting the second-tier suppliers itself. Nunca understood lean production and supply but Choux did not take them seriously whenNunca’s management team explained its plans for implementing the latter. It was true, however, that Nunca hadsometimes experienced problems in maintaining the required levels of manufacturer quality or timeliness.
This was an intervention strategy that may only be considered as part of a collaborative approach if it is con-ducted in a co-operative manner. In this case, however, the visits to second-tier suppliers were characterizedby Choux’s representatives insisting on activities being done in the way they stipulated, often embarrassingNunca in front of its suppliers.
Nunca could not refuse Choux’s proposals, even though it could often see a better way to solve a particularproblem. It also needed to develop its relationships with suppliers but found Choux’s intervention disruptivein this respect.
Finally, Choux exhibited nationalist tendencies, often refusing to condone Nunca’s choice of supplier (notjust the Spanish ones), requiring instead that a French firm was awarded the business – especially one from

254 Strategic operations management
which Choux already bought. If Nunca persisted and did manage to gain agreement for one of its partner sup-pliers to supply a component in preference to Choux’s choice, it knew that the French were ‘just waiting forsomething to go wrong – to say “I told you so”.’
Choux was using a vantage point intervention strategy in this case. As a result, it was unable to develop leansupply, since the potential contribution of Nunca was not valued. It could not afford to lose Nunca in the shortterm, however. Nunca’s strategy was to develop lean production in its own operation and to demonstrate tothe client – and others – that it was capable of running its own lean supply base, perhaps with co-operative,rather than dictatorial, intervention from the client.
In the end, it took several visits by the most senior managers in Nunca (including the Chairman and CEO)to Paris to convince Choux that their supply management was counter-productive. As a result, Choux alteredthe words of its contracts to allow more scope for Nunca to contribute to technology and logistical matters.By that time, however, Nunca had begun to court a new set of clients (non-European) who valued the com-pany’s contribution more highly.
Summary
■ The strategic management of supply is a critical part of managing the operations of an organization, and mayrepresent the most critical part.
■ The supply process is not a chain – it is a network, possibly even a mess. It is not possible to manage it in astraightforward manner; it may only be possible to manage within it, pursuing strategies for one’s own activities that influence rather than control the activities of others.
■ The term ‘supply chain management’ is in common parlance and may be used as an approximation to theactual situation, as a point of departure. In fact, supplier relationship management offers a more realistic focusfor managing the process of supply.
■ The organizations within a supply chain are both competitors and collaborators. Their operations are inter-dependent but they must also compete for the available value-adding business from which profit may be made.
■ The structuring of supply ‘bases’ may include assumptions and expectations that are not backed up in prac-tice. Simply calling a supplier ‘first tier’ may not bring the benefits expected of a structure supply base,such as that observed in post-war Japan.
■ In order to develop a supply strategy, it is necessary to have a policy on how the organization should behavein the supply chain, a strategy to implement that policy, an internal strategy for the positioning of the purchasing and supply process, and a set of techniques for managing relationships within the supply chain.
■ Some currently available and practised techniques for supplier relationship management are based uponmass production thinking and may not be appropriate for the post-mass production era.Techniques thatform parts of lean supply – the removal of noise or waste from the supply relationship and process – canprovide alternatives to such outdated approaches, especially those based on the mass production idea thatthe customer is always right.
Key questions
1 What are the challenges facing operations managers in obtaining
competitive advantage from proficiency in supply management?
Use examples from a heavy manufacturing industry (e.g. steel-
making), a light manufacturing industry (e.g. televisions), a ser-
vice sector organization using materials (e.g. catering) and a
service organization with almost no materials (e.g. finance).
2 Give examples of ways in which organizations might achieve
differentiation in their own sale market by managing supply
in new ways.
3 Trace the influence of Henry Ford to today’s supply relationships:
what techniques may be attributed to his ideas and in what ways
are they now being questioned?
4 In what ways are customers and suppliers competitors and collab-
orators? How would this apply if one of them has a monopoly?
References and further reading
Cox, A.W. (1997) Relational competence and strategic procurement
management: towards an entrepreneurial and contractual theory
of the firm. European Journal of Purchasing and Supply Management,
2(1), 57–70.
The Economist, 27 January 1996.
Financial Times, 26 June 1996.
Ford, I.D. (ed.) (1997) Understanding Business Markets, 2nd Edition.
London: Dryden Press.
Granovetter, M. (1985) Economic action and social structure: the
problem of embeddedness. American Journal of Sociology, 78,
481–510.
Hines, P. (1994) Creating World Class Suppliers: Unlocking Mutual
Competitive Advantage. London: Pitman.
Houlihan, J.B. (1992) International supply chain management. In:
Christopher, M. (ed.), European Logistics: The Strategic Issues.
London: Chapman & Hall.
Kraljic, P. (1983) Purchasing must become supply management.
Harvard Business Review, 61(5), 109–117.
Lamming, R.C. (1996) Squaring lean supply with supply chain man-
agement. International Journal of Operations and Production Manage-
ment, 16(2), 183–196.
Lamming, R.C. (2000) Japanese supply chain relationships in reces-
sion. Long Range Planning, 33(6), 757–778.
Lamming, R.C., Cousins, P.D. and Notman, D.M. (1996) Beyond ven-
dor assessment: the relationship assessment process. European
Journal of Purchasing and Supply Management, 2(4), 173–181.
Lamming, R.C., Johnsen, T., Harland, C.M. and Zheng, J. (2000) An
initial classification for supply networks. International Journal of
Operations and Production Management, 20(5/6), 675–691.
Supply management 255

Lamming, R.C., Caldwell, N.D., Harrison, D.A. and Phillips, W.E.
(2001) Transparency in supply relationships: concept and prac-
tice. Journal of Supply Chain Management, 37(4), Fall.
Leslie, W. (1996) High order strategy for manufacturing. Journal of
Business Strategy, 17(4), 21–36.
Macbeth, D.K. and Ferguson, N. (1994) Partnership Sourcing: An
Integrated Supply Chain Approach. London: Pitman.
Nishiguchi, T. (1986) Competing systems of automotive components
supply: an examination of the Japanese ‘clustered control’ model
and the ‘Alps structure’. In: First Policy Forum, International Motor
Vehicle Program. Cambridge, MA: MIT Press.
Normann, R. and Ramirez, R. (1993) From value chain to value con-
stellation: designing interactive strategy. Harvard Business Review,
July–August, 65–77.
Porter, M.E. (1980) Competitive Strategy: Techniques for Analysing Industries
and Competitors. New York: Free Press.
Reck, R.F. and Long, B.G. (1988) Purchasing: a competitive weapon.
International Journal of Purchasing and Materials Management,
Fall, 2–8.
Williamson, O.E. (1975) Markets and Hierarchies. New York: Free Press.
Williamson, O.E. and Masten, S.E. (eds) (1999) The Economics of
Transaction Costs. Cheltenham: Elgar.
256 Strategic operations management

C H A P T E R
Capacity and schedulingmanagement
7
Introduction
Managing capacity is a central feature of strategic operations manage-
ment. In some ways managing and understanding capacity is twinned
with process choice that we discussed in Chapter 3, because under-
standing both areas can then enable the firm to make informed deci-
sions about what it can and cannot do in the market.
The purpose of this chapter is for the reader to:
■ understand the strategic importance of capacity;
■ be able to utilize specific approaches to managing scheduling.
Adding capacity allows firms to position plants and service outlets in
key areas around the world. In some cases location may be influenced
by industry trends (e.g. in order to develop a fluid labour pool in a
certain geographical area). For example, in the mid-1990s, before its
merger with Hewlett Packard, Compaq invested $90 million in order
to double its capacity at its Singapore manufacturing plant. In addi-
tion, the firm injected a further $11 million into its manufacturing
plant in Scotland to enhance the manufacturing capabilities there.
These additions to capacity formed part of Compaq’s pronounced
plan to become the world’s leading PC manufacturer. The extent
to which this will be realized after its merger with Hewlett Packard
remains uncertain in the mid-2000s. The strategic importance of
capacity for the computer industry was evident at the same time that
Compaq expanded its capacity, when Dell Computers doubled the size

258 Strategic operations management
of its manufacturing plant in Ireland as part of its long-term strategic
positioning in Europe.
Japanese firms have clearly understood the strategic importance of
capacity in their transplants operations. For example, the expansion by
Nissan when it enlarged its Tennessee plant by 1.7 million square feet
in order to allow a further 200 000 vehicles to be manufactured there
in the mid-1990s was typical of many such aggressive expansions (Brown,
2000). This, and the other massive investments in North American capa-
city by Japanese firms, employed the technology advantage of lean pro-
duction to exploit a window of opportunity – indolence in American
management.
More recently, Intel showed the importance of capacity (Fortune, 11
November 2002):
Intel is gambling that by pushing the state of the art in chipmaking faster
than rivals are able to, it will reach a point where it can use sheer
manufacturing prowess and capacity to undercut any competitor in
price, performance, and variety. That means not just fending off
would-be arch-rival Advanced Micro Devices and continuing to
dominate the business of making chips for PCs, but also challenging
Texas Instruments, IBM, Motorola, and a spate of smaller competitors in
chips found in everything from cellphones to cars.‘Capacity is strategy,’
says Andy Grove, Intel’s Chairman and former CEO. ‘Henry Ford used it
to revolutionize the automobile industry; the Japanese used it to push
us out of the memory-chip business 25 years ago; we used it a decade
ago to ignite the explosion of the PC industry. Now we’re using it again
so we can broaden our business beyond the PC.’
Capacity expansion can often be targeted within specific countries, as
illustrated in the example of Pepsi-Cola (Business Week, 6 September
2003):
What the Chinese want now are more bottles of Mountain Dew. At
least that is the hope of PepsiCo, which says it plans to spend $150
million to expand bottling capacity by a third.That will mean 100 million
more cases of Pepsi, 7 Up, and the caffeine-charged Mountain Dew.
While the company’s annual sales in China have grown at around 10 per
cent in recent years, it still has only about half the penetration of rival
Coca-Cola. PepsiCo executives say they are determined to increase
their beverage presence in China, despite the threat of severe acute
respiratory syndrome (SARS).

Capacity has to be seen within the specifics of industry characteristics.
For example, in the year 2004 the car industry had about 40 car pro-
ducers. The likelihood is that there will be ten or even as few as six car
producers by 2010. The reason for this is overcapacity within the indus-
try. However, this means that the current car producers are seeking
to expand capacity still further, as can be seen in the following (The
Economist, 2 January 2003):
Almost nobody, not even the giant western carmakers that have been
dreaming about China for two decades, was prepared for today’s boom.
Ford, a latecomer which opened its first car factory in China in January,
says that it expects China to become a larger market than Germany
and perhaps even Japan in the next 3 to 5 years. For Volkswagen, whose
joint ventures still dominate even though their market share has fallen
from 55% to 41% in the past 2 years, China is already the biggest
market outside Germany, its home. And in China, where fewer than 2%
of urban residents have cars, this take-off phase could last a while – in
Germany and America, by comparison, about half the population now
owns a car. Shanghai Automotive Industrial Corp (SAIC), the largest
domestic car company, has joint ventures with both Volkswagen and GM,
as well as with other domestic firms. … The capacity that investors are
now building will outstrip demand by 20% at least.
These examples clearly show the strategic intents of those companies
who utilize capacity to achieve aims of growth and expansion into exist-
ing or entirely new areas.
Capacity defined and measured
Capacity can be considered as:
The potential output of a system that may be produced in a specified
time, determined by the size, scale and configuration of the system’s
transformation inputs.
At all stages of any process, limitations are placed on capacity. A
machine has a maximum output per hour, a truck has a maximum load,
a production line has a limit to its speed of operation, an aeroplane
has a certain number of seats for passengers, a computer processes a
specified number of bytes per second, and so on.
Capacity and scheduling management 259

Capacity is therefore normally measured by considering how much
can be processed in any given time period. This is commonly the case
in materials processing operations, many information processing oper-
ations and some customer processing operations (CPOs). For example, a
car plant is designed to produce a certain number of cars per shift; the
work pattern of an insurance company worker is designed to process a
certain number of claims per hour, and fast-food stores expect to be
able to serve a certain number of customers in a defined time period
(typically at a rate of one every 90 seconds).
Waters (2001) suggests that there is a difference between ‘designed
capacity’, defined as ‘the maximum output of a process under ideal
conditions’, and ‘effective capacity’, defined as ‘maximum output that
can be realistically expected under normal conditions’. He explains
that, usually, effective capacity is less than designed capacity, due to
set-up times, breakdowns, stoppages, maintenance, and so on. Whilst
this is true in many cases, especially in materials processing operations,
there are instances in which effective capacity may be greater than
designed capacity. For example, there are many mass transit systems
around the world, such as the London Underground and metropol-
itan railways in the Far East, where more passengers routinely travel
than the system was designed for. Likewise, under normal conditions it
might be thought a hotel could sell its rooms only once in a 24-hour
period but some hotels, those at airports for instance, routinely sell
their rooms more than once per day. Overbooking can be an issue,
as in the case of one of the authors’ experience with two airlines. The
following are extracts from two letters from one of the authors.
260 Strategic operations management
Case: Overbooking and poor capacity management in the airline industry – the case of the angry passenger
Case 1
XXX Airlines,Customer Care Department,16 June 2003.
Dear Sir/Madam,It is with much regret that I am writing to you to convey our disappointment with the lack of customer careand poor quality of service that we encountered in our last flight from Gatwick to Newark.The facts are asfollows:
1 We booked a flight with XXX from Gatwick to Newark on the morning of 29 March.This booking was for two adults (my wife and I) and our baby daughter, and we had specified that we needed a bassinet forour baby.

Capacity and scheduling management 261
2 When we checked in, we were told that that the bassinet would not be offered because we had ‘requested’but not ‘booked’ it – I am at a loss as to what this really means and the distinction between the two termsis meaningless.
3 What became annoying was the dismissive attitude, with comments from your staff that included ‘you’re notthe only family with children’ (we didn’t assume that we were!) and ‘all seat allocations are made on a firstcome, first served basis’. If this is the case then the question is: what is the point of requesting a bassinet(which in turn demands allocations to specific seating areas on the plane that can house this unit) if this isoverridden with a first come, first served basis, regardless of need?
4 More annoying was that we were informed that seats had already been allocated to families with childrenwho had booked in earlier. However, as we later discovered on the plane, when we walked round the bodyof the plane, this was clearly a lie.
5 When asked why our request had not been honoured, I also had to endure standard nonsense statementsabout how all airlines overbook. I am a Professor of Business Management with a very good knowledge ofthe airline industry, and I really do not need to be lectured on the industry.
6 Finally, at the departure gate we were told that we were ‘lucky’ because the airline had managed to persuade a couple of other passengers to change seats.
To summarize, the issues are as follows:
■ We had ordered a bassinet, which was evident from the onscreen data, but were then told we had not.■ We were, frankly, misled and lied to about seat allocations having been given to other families in the two
rows of seats where bassinets can be located.This was clearly not the case.
I have travelled with XXX on many occasions. However, the nature of the response to this letter will deter-mine the extent to which I, my family and colleagues will continue to book with you.
We look forward to hearing from you.
Yours sincerely,
To the airline’s credit, there was a response dated 1 July, which included the following:
‘Because we value you as a customer, I will forward a tangible token of goodwill under separate cover.’
However, by November, no such ‘tangible token’ had been offered. Consequently, another letter was sent:
XXXX Airlines,Customer Care Department,5 November 2003
DearYou may recall that I wrote to you on 16 June and that you responded to my concerns about poor service quality that my family and I were exposed to on the Gatwick/Newark flight in your letter, dated 1 July 2003.
I appreciate that fact that you responded and in your letter you stated:
‘Because we value you as a customer, I will forward a tangible token of goodwill under separate cover.’
As of today, nothing has been forthcoming.This is highly disappointing given the tone and content of your letter.
I trust you will respond by return and I look forward to hearing from you.
Yours sincerely,

262 Strategic operations management
A week later, a $50 gift voucher to be redeemed within the airline’s shop was sent.
Case 2
XXXX Airways,Customer Relations DepartmentPO Box
12 March 2004
Dear Sir/Madam,I am writing to you to convey my huge disappointment in the poor service quality offered by XXXX on ourrecent flights to Athens.The facts are as follows:
Flying to Athens, 4 March
1 We booked a flight with XXXX from Heathrow to Athens, for 4 March, returning on 8 March. This bookingwas for two adults (my wife and I) and our baby daughter, and we had specified that we needed a bassinetfor our baby.The reservation for the bassinet was confirmed.
2 When we checked in, we were told, initially, that we would not be able to sit together and the plan was that I would be in row 20 and my wife and child would be in row 27.
3 We were then told that XXXX would be able to accommodate us in row 27, where the bassinet would be.4 When we boarded the plane we found, to our annoyance, that our seat allocations in row 27 were
not where the bassinet would be! It took about 15 minutes of fuss, arguments and conflict in order to move seats.
5 To (your) credit we were, finally, moved to the Business Class area and the bassinet was brought on board.6 The net result to our flight was that we had to endure considerable and unnecessary stress in order to have
what had been agreed. It gets worse …
Flying to Heathrow, 8 March
1 Again, we confirmed that we needed a bassinet for our return flight on 8 March.2 When we boarded the plane we found that, again, there was a problem.This time there was no bassinet on
the plane and we were told, wrongly I believe, that the 757 could not accommodate a bassinet (even thoughour seats were in front of what was, clearly, a bassinet holder).
3 Your flight attendant (name provided) showed a great deal of empathy and tried to diffuse the problem.4 However, again after a great deal of fuss, we were moved to Business Class but this time there was no
bassinet and my wife was left carrying our child for the full 4-hour flight!
Clearly, the above is unacceptable. We were promised that a bassinet would be available for both flights; weendured a great deal of fuss and stress, which was avoidable, and we were left with a poor sense of servicequality from XXXX. The fact that we were moved to Business Class did not solve the problem. Indeed, on thereturn flight we would have preferred to have been in Economy Class with a bassinet, as clearly agreed,booked, confirmed and paid for!
I have travelled with XXXX on many occasions. However, the nature of the response to this letter will deter-mine the extent to which I, my family and colleagues will continue to book with you.
We look forward to hearing from you.
Yours sincerely,
On 17 March, the following standard reply was provided. It had no address on it and no details of
the person who sent the letter:
17 March 2004
DearThank you for completing our comment card on your flight from Athens.

Waters (2001) suggests that ‘actual output will normally be lower than
effective capacity’. This will certainly be the case if capacity is not
managed well. As we shall see, managing capacity is a challenging task,
because matching output with effective capacity is very difficult. How-
ever, by distinguishing between designed capacity and effective capacity,
we can establish the difference between ‘utilization’ and ‘efficiency’.
Utilization is the ratio of actual output to designed capacity, whilst effi-
ciency is the ratio of output to effective capacity. In some operations,
management focuses very much on utilization. For example, key per-
formance measures in many capacity-constrained services, such as
hotels, airlines and theatres, are utilization measures, namely room
occupancy, passenger load and seat occupancy. In other operations,
especially those adopting high-volume production processes, the focus is
often upon efficiency measures.
The importance of capacity management
Strategic capacity management – i.e. knowing the maximum as well as the
attainable input and output capabilities within a period of time – enables
the firm to make vital strategic decisions. One of these is to reject poten-
tial opportunities. Hill (2000) describes how many firms suffer from the
‘can’t say no syndrome’. By that he means that, sometimes, firms embark
on growth and expansion and take on business for which they have
neither the capability nor the capacity to satisfy customers.
So, capacity management becomes an important means by which
important, valid, business decisions can be made. Capacity also becomes
a means by which both entrance and exit barriers to industries are put
in place. Setting up new plants is a matter of managing strategic capacity.
Capacity and scheduling management 263
I understand your disappointment, and I am sorry we could not arrange for you to have the bassinet seat foryour child, which you had asked for. We try and make your time in the air as relaxed and comfortable as pos-sible, but I’m afraid we cannot positively guarantee a particular seat to anyone. I do hope you will choose to flywith us again soon.
Yours sincerelyCustomer Relations
Key questions: Why do airlines typically overbook and what does this say about how they manage capacityin relation to customer expectations? Given the nature of the replies from both of these airlines, which wouldyou choose to fly with and why?

That is, these decisions are made at senior levels of the firm; the amount
of investment can be large; they are intended to provide competitive
advantage – possibly by destabilizing the industry – or, at least, to allow
the firm to remain in a position to compete.
In this book, we argue that the aim of operations management is
to deliver an offer (a product or service) to consumers at the time they
need it, to an appropriate quality standard, and at a price they are pre-
pared to pay. The role of capacity planning and scheduling manage-
ment in making this aim possible is to ensure the products and services
are available when needed by the consumer. This is achieved by man-
aging processes as efficiently as possible.
The management of capacity focuses on two aspects of the operation:
1 Transformation inputs and their organization into processes.
Transformation inputs are those resources used to process the
final output. They comprise both hard systems such as plant,
machinery and technology, and the so-called soft systems, which
are essentially work processes and the workforce. Capacity
planning is largely focused on the effective and efficient util-
ization of these transformation inputs. In operations manage-
ment terms, at the operations level, this is typically and variously
referred to as capacity planning, aggregate planning or master
scheduling. For separate processes within an operation, capacity
management includes activities such as production control,
loading or activity scheduling.
2 Ensuring the transformation inputs are utilized efficiently
depends on the flow of inputs through the system. This
requires the adoption of an appropriate strategy for inventory
management. As we saw in Chapter 5, such strategies include
inventory management, material requirement planning/
manufacturing resource planning (MRP/MRPII) and just-in-
time (JIT) production.
Inputs and outputs of capacity
We need to make a distinction between outputs and inputs of capacity.
They are linked, of course, but we need to focus on each because
inputs can act as constraints on outputs. One of the key constraints that
needs to be managed in capacity is bottleneck problems.
Schmenner and Swink’s ‘law of bottlenecks’ states that productivity
is improved if the rate of flow is consistent throughout the whole
264 Strategic operations management

process. Applying this to engineering and manufacturing in job shops
has led to the emergence of a number of rules:
■ throughput is governed by the capacity of the bottleneck;
■ balance material flow rather keep all resources fully occupied;
■ inventory will accumulate at the bottleneck;
■ any decrease in the output of a bottleneck will be a decrease
in the output of the whole system;
■ any increase in the output of a non-bottleneck will not increase
the output of the system as a whole.
Managing bottlenecks is an important feature of scheduling. One solu-
tion to this comes from Goldratt and Cox (1986), who speak of optimized
production technology (OPT). OPT is, essentially, based around soft-
ware, aimed at locating and dealing with possible bottlenecks in the
system. There are ten principles to OPT:
1 Balance flow, not capacity.
2 The level of utilization of a non-bottleneck is determined by
some other constraint in the system, not by its own capacity.
3 Utilization and activation of a resource are not the same thing.
4 An hour lost at a bottleneck is an hour lost for ever out of the
entire system.
5 An hour saved at a non-bottleneck is a mirage.
6 Bottlenecks govern throughput as well as inventory in the
system.
7 The transfer batch may not, and at times should not, equal
the process batch.
8 The process batch should be variable, not fixed.
9 Lead times are the result of the schedule and cannot be pre-
determined.
10 Schedules should be established by looking at all constraints
simultaneously.
The capacity challenge
From an internal, resource management point of view, the first chal-
lenge of capacity planning is to maximize utilization, and if this is con-
strained by process capability, to maximize efficiency. However, there is
not much point in producing output if it cannot be sold. The second
major challenge of capacity management is therefore fundamentally
about matching the productive output of the operation with market
Capacity and scheduling management 265
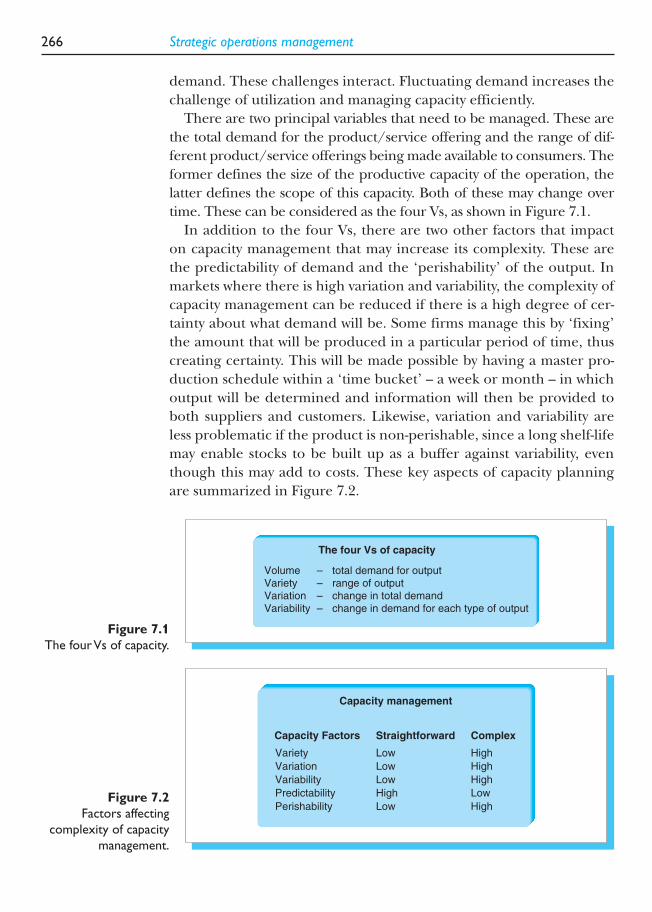
demand. These challenges interact. Fluctuating demand increases the
challenge of utilization and managing capacity efficiently.
There are two principal variables that need to be managed. These are
the total demand for the product/service offering and the range of dif-
ferent product/service offerings being made available to consumers. The
former defines the size of the productive capacity of the operation, the
latter defines the scope of this capacity. Both of these may change over
time. These can be considered as the four Vs, as shown in Figure 7.1.
In addition to the four Vs, there are two other factors that impact
on capacity management that may increase its complexity. These are
the predictability of demand and the ‘perishability’ of the output. In
markets where there is high variation and variability, the complexity of
capacity management can be reduced if there is a high degree of cer-
tainty about what demand will be. Some firms manage this by ‘fixing’
the amount that will be produced in a particular period of time, thus
creating certainty. This will be made possible by having a master pro-
duction schedule within a ‘time bucket’ – a week or month – in which
output will be determined and information will then be provided to
both suppliers and customers. Likewise, variation and variability are
less problematic if the product is non-perishable, since a long shelf-life
may enable stocks to be built up as a buffer against variability, even
though this may add to costs. These key aspects of capacity planning
are summarized in Figure 7.2.
266 Strategic operations management
The four Vs of capacity
Volume – total demand for outputVariety – range of outputVariation – change in total demandVariability – change in demand for each type of output
Figure 7.1
The four Vs of capacity.
Capacity management
StraightforwardCapacity Factors
Variety Low High
Variation Low High
Variability Low
High
High
Predictability
Perishability Low
Low
High
Complex
Figure 7.2
Factors affecting
complexity of capacity
management.

Back in 1967, Thompson wrote: ‘the ideal operation is one in which
a single kind of product is produced at a continuous rate and as if inputs
flowed continuously at a steady rate and with specified quality’ or, in
other words, a continuous flow process. In this ‘ideal’ operation, capacity
management is simple – volume is stable; there is no variety (and
hence no variability or variation).
Continuous flow processes tend to produce outputs, like petroleum,
that are commodities with relatively long shelf-lives for which demand
is reasonably predictable over the medium term. A key point to note is
that variation, variability and predictability are inherent features of
market forces, whilst perishability is an inherent feature of the output.
Firms may try to smooth demand and make their markets more pre-
dictable by, for example, introducing a reservation system, but they can
only do so if consumers are prepared to accept such influence. Likewise,
firms often seek to make their product less perishable to facilitate
smoothing production capacity, but their ability to do so is constrained
by the physical properties of the output. Variety, on the other hand, is
a strategic choice that firms make in relation to the scale and scope of
their operations. In the very early days of manufacturing, it was recog-
nized that variety added costs, which is one reason Henry Ford only
wanted to make black cars. This is the law of variability, which states
‘the greater the random variability, either demanded of the process or
inherent in the process itself or the items processed, the less productive
the process is’ (Schmenner and Swink, 1998).
So far this discussion of capacity has focused on aggregate demand.
We know, however, that many operations are made up of complex
processes that can be divided into subsystems. The four Vs, predictabil-
ity and perishability also affect the utilization and efficient perform-
ance of each subsystem. Hence capacity and scheduling management
becomes more complex the greater the number of different subsys-
tems and the greater the flexibility of their use.
Capacity in services
It is in the nature of some services, specifically customer processing
operations, that scale economies are limited, because in some cases the
firm’s physical assets have to be located where the customer is. Thus,
whilst manufacturers may be highly selective as to the countries in which
they locate their plants, from which to ship their products elsewhere,
service firms often need a physical presence wherever they identify
Capacity and scheduling management 267
sufficient demand for their services. For example, of more than 2 million
hotel rooms operated by the world’s major hotel chains, 89 per cent are
in just 1200 locations, typically capital cities, gateway cities (with an
international or national airport) and major industrial centres.
Multi-unit operations
A key strategic issue for firms in managing capacity is the extent to
which they own and operate their own assets. This is a particularly
important issue for firms that need to utilize a large number of assets,
specifically buildings. Such firms tend to be in the consumer service,
companies that operate ‘chains’ of hotels, restaurants and retail out-
lets. In this instance, the property itself and its location are essential
elements of the operations strategy. For instance, in the hotel industry,
Conrad Hilton is famous for identifying the three keys to success in the
business – ‘location, location, location’.
Such chains have specific characteristics and face particular oper-
ational challenges. First, production is geographically dispersed across
many units because these are sited close to their market. Second, most
of these units are small. By definition they cannot be centralized into
one large unit in order to achieve economies of scale. Third, pro-
duction is local. Whilst some back-of-house activity or operation may
be centralized, all front-of-house delivery is carried out at the point of
contact with the consumer. Fourth, each outlet will be operated within
the brand standards established by the chain. Just as manufacturers
use brands to assure consumers of the quality of the product wherever
it may be bought and consumed, service chains also use branding
to assure consumers of the conformity of service in whatever outlet
they visit.
Localized, small-scale operations of multiple units present both a chal-
lenge and an opportunity ( Jones, 1999). The three major challenges
are growing quickly, finding the right sites and ensuring each outlet
satisfies its local market whilst conforming to brand standards. Amongst
consumer service firms, rapid growth is desirable for two main reasons.
First, new service concepts are easily copied by competitors. Unlike
new products, which may be patent protected, it is very difficult to
define a service concept and to legally protect this from commercial
exploitation by others. In most cases, all consumer service firms can do
is copyright the brand name they adopt, and some firms, such as
McDonald’s, are highly proactive in protecting their brand. Second,
sites are difficult to find and rapid growth is desirable to get these
before the competition does.
268 Strategic operations management
But rapid growth is difficult because the firm may lack the capital
and cash flow needed to fund this. Property construction or acquisi-
tion is highly capital intensive. A relatively simple new-build 100-room
hotel may cost 6 million Euros and a roadside restaurant with 80 covers
in the region of 900 000 Euros ( Jones, 1999). Many firms therefore
have adopted franchising as a means by which they can grow rapidly.
However, there is evidence to suggest that the higher the investment cost,
the higher the risk (Brickley and Dark, 1987). As a result of this, single
franchisees (so-called ‘mom and pop’ operators) may be replaced by
corporate franchisees. For instance, the British company Whitbread
is a corporate franchisee of US-based Marriott Hotels, owning and
operating a number of hotels under the Marriott flag throughout
the UK.
Franchising has three main advantages. First, the franchisee typically
‘owns’ and develops the unit. Hence they provide the funding to
enable rapid expansion. Second, the franchisee is typically local to the
community, region or even country that the franchisor is expanding
into. This local knowledge greatly assists with regards the findings of a
suitable site for the outlet. Third, this same local knowledge should also
ensure that operations are managed effectively – both in terms of serving
local customers as well as operating within the local labour market.
Operations management in multi-unit firms
The third issue faced by multi-unit chains is to ensure each unit is oper-
ated effectively and efficiently. In chains which own and operate outlets
directly, the operations function has total control over performance in
each of the units, usually through the ‘area manager’ role. How this is
specifically achieved depends on a number of dimensions:
■ job scope – this is the range of tasks and responsibilities at
area management level;
■ organizational congruence – this is the extent to which all
managerial levels within the firm share a common vision and
work together towards a common purpose;
■ geographic density – this is the number of units in an area
relative to the size of the area;
■ unit conformity – this is the extent to which units within an
area are identical or not.
When Sasser et al. (1978) first proposed the concept of the service firm
life cycle, they drew heavily on the growth of fast-food and restaurant
Capacity and scheduling management 269

chains in the USA. Such chains demonstrated characteristics of high
market penetration, strongly branded identical units, tightly and nar-
rowly defined job descriptions for area managers, tightly specified stand-
ards of performance, effective organization-wide systems and strong
organizational culture. The archetype of this kind of multi-site business
is McDonald’s. At that time, it can be inferred that area manager effec-
tiveness required relatively narrow, tightly defined job scope; a high
degree of organizational congruence; high geographic density; and
high unit conformity.
But there is growing evidence from the USA that chains are
abandoning these established traditions of multi-site management. For
instance, at a conference in 1993, the CEO of PepsiCo outlined how he
was refashioning the management of Pizza Hut, KFC and Taco Bell by
increasing dramatically (from twelve to twenty-four) the span of control
of area managers, empowering managers and employees, flattening
the hierarchy, and investing in information technology.
It does not appear that the orientation towards a strategic role for
the area manager versus an operational role is sector specific. In one
UK study (Goss-Turner and Jones, 2000), the job scope of area managers
appeared to vary greatly – from those who clearly had a narrowly
defined operational role as a line manager, with tasks focused around
unit inspection and control, to those with a broad range of respons-
ibilities for developing the business. Indications were that there are two
alternative business strategies adopted by firms. The first focuses on
achieving high levels of profit through tight control of operating units.
The second is more concerned with sales growth and market share
through a strategic service vision related to customer service, hence a
differentiation strategy. It would appear that multi-unit managers from
firms in the first category have a narrower job scope. Again, this is not
necessarily sector specific. Although the hotel area managers in this
study tended to have a narrower job scope than restaurants or pubs,
this appears to be a reflection of their strategy, rather than related to
the relative complexity of the business at unit level.
An alternative explanation may not be the strategy adopted by the
firm but the attitude of the firm to operating in a mature market-place.
Certainly hotels and pubs are mature UK businesses, with some kinds
of restaurant less so. Baden-Fuller and Stopford (1994) suggest two
alternative mindsets towards this context. ‘Mature businesses’ perceive
the industry as stable, believe profitability derives from giving stake-
holders less value, regard themselves victims of external economic
forces, strive for market share, and seek economies of scale. ‘Dynamic
businesses’, however, seek new ways of operating, give better service to
270 Strategic operations management

customers, believe profit derives from their own ability to control events,
see market share as the reward for creating value not the means of achiev-
ing it, and use innovation to compete. There is some evidence that
firms like Taco Bell in the USA have adopted this dynamic perspective.
Such a shift may have implications for organizational congruence. New
ways of thinking and operating take a while to develop within firms.
This concept of congruence is largely concerned with organizational
systems or culture. In the UK study (Goss-Turner and Jones, 2000),
formal systems were most evident in those firms operating UK corpor-
ate franchises of international brands originating in the USA. On the
other hand, one firm stood out as a firm in which cultural norms rather
than formal systems were dominant. It appears that rather than having
both strong systems and culture, as is the case with the US archetypes,
most firms were strong in one but weaker in the other. The relative lack
of strong cultures may relate to the British approach to business, a lack
of clear identity in businesses that were franchises of concepts (in
restaurants), a very strong tradition of management (in pubs) and few
firms operating single concepts. The relative lack of strong systems,
especially integrated IT support, may be due to the age of the infra-
structure and lack of new build units in the UK compared with the
USA. Most firms in the study were investing in IT to address this issue.
Business units may vary in a number of different ways: sales volume,
sales revenue, operating capacity, number of employees and so on.
There tends to be a close fit between these factors, i.e. the larger the
physical capacity of the unit, the larger its sales revenue. In firms which
have units that vary in size, there is a tendency to adapt the size of
an area to reflect this. However, there is no evidence of any formal
method, such as a formula or statistical analysis, used to determine the
size of areas. According to Goss-Turner and Jones (2000), firms with
the highest level of unit conformity are those that have grown through
new-build or green field site development. But most UK chain hospi-
tality businesses, unlike the USA, have a relatively old property port-
folio, especially in the pub and hotel sectors, which significantly reduces
unit conformity.
Reflecting the diverse range of operations within firms, many UK
hospitality chains have developed brands, notably in the hotel and pub
sectors. Hence there is potential trade-off in these large firms between
geographic density and unit conformity. Areas may be organized with
high density but low conformity, or low density and high conformity.
Based on their work (Goss-Turner and Jones, 2000), firms have a
strategic choice as to how they should organize the operation function
in multi-unit chains. There are four types of area manager.
Capacity and scheduling management 271

The archetype
Area management in the archetypal multi-site service firm conforms to
the McDonald’s model – strongly branded identical units, tightly and
narrowly defined tasks for area managers, tightly specified standards of
performance for units, and an emphasis on operational control over
units. The job scope of this type of multi-unit manager is relatively
narrow and there is a high degree of organizational congruence, with
a focus on operational performance. Firms would like to have high
geographic density, as they believe their area managers should be in
the units as much as possible.
The entrepreneur
Entrepreneurial area managers are responsible for a single concept,
also tightly branded, but are expected to develop the potential of each
unit as a business. It is possible in this context for control to be exerted
over and by the area manager entirely through cultural norms. Organ-
izational congruence also tends to be culturally driven. Such managers
therefore have wide job scope, applying a range of skills to operating
units to reflect local and regional influences.
Multi-brand manager
The area manager in the multi-brand context has more than one con-
cept to manage but does so by applying almost identical ‘rules of the
game’ to them all – namely, tight cost controls, standards conformance
and revenue growth. Job scope remains quite narrow, but because the
manager is responsible for more than one brand or type of operation,
there is more flexibility. In this context, achieving high levels of organ-
izational congruence may be difficult. Typically, geographic density is
high as the rationale for defining an area is based on this.
The business manager
The ‘business manager’ is responsible for more than one brand and
applies creative solutions to each of their units within the context of
over-arching policy guidelines and marketing strategies. Such man-
agers, like their firms, need to be dynamic. They coach and influence
their unit managers, rather than control them. Geographic density is
272 Strategic operations management

not too great an issue for them as they do not believe they have to
spend a lot of time in each unit.
Goss-Turner and Jones (2000) suggest that individual managers
could not easily move from one firm to another with different charac-
teristics. For instance, area managers used to operating with high geo-
graphic density might dislike managing a large area with long drive
times; those used to tight control over a single brand may be challenged
by more strategic responsibility for a number of brands; and those used
to a clearly defined job may find a lack of definition and emphasis on
cultural norms disquieting. This appears to be confirmed by industry
practice, which is for most firms to appoint area managers from within.
Franchisor–franchisee relationships
In firms that have adopted franchising as their approach to growth, the
firm still requires units to be operated effectively and efficiently. They
want units to be profitable as franchise fees are often based on a pro-
portion of profits, whilst they also want to ensure brand standards are
maintained. Rather than have area managers, such firms have franchise
managers. Whilst the role these managers play is essentially the same,
the means by which they do it is quite different. Franchise managers
have to operate in the context of the legal franchise agreement agreed
between the firm and its franchisees.
Franchise contracts have many similarities whatever market they may
be applied to and whatever country they operate in. The franchisee
agrees to operate the business according to policies and procedures
laid down by the franchise ‘system’. Such a system typically stipulates
the products to be sold, inventory items, opening hours, plant main-
tenance, staffing levels, insurance cover, accounting procedures and
auditing processes. In return, the franchisor provides national brand
marketing, along with a range of managerial assistance, such as help
with site selection and development, training, standard operating man-
uals and financing. The franchise fees for the right to operate the system
and have access to assistance are usually in the form of royalties, such as
a percentage of sales. In addition, franchisees are usually required to
purchase their raw materials from the franchisor or designated suppliers.
The contract will also have clauses in relation to the termination of the
agreement by either party. The franchisor typically may terminate
the contract if the franchisee operates the unit outside the parameters of
the stipulated ‘system’ and terms of the contract, and there will be con-
straints on the franchisee in terms of opening a competing business.
Capacity and scheduling management 273
In the popular press, the relationship between franchisor and fran-
chisee is often portrayed as coercive – big business controlling and
coercing the little guy. For instance, in his book Fast Food Nation, Eric
Schlosser (2001, p. 99) talks about conflicts between franchisor and
franchisee as ‘commonplace’, franchisees being ‘afraid to criticize their
chains’ for fear of reprisals or termination of contract, and firms
anxious to expand ‘encroaching’ on the territories of their franchisees.
This relationship tends to be further supported by the approach adopted
by multi-unit firms to monitor and regulate quality in their operations
(owner or franchised). The typical approach is to have a mystery
shopper scheme, whereby each unit is visited on a random basis by an
incognito quality inspector posing as a typical consumer.
In reality, the relationship between the two parties is much more
complex than this and firms have a strategic choice with regard to how
they work with their franchisees. Hunt and Nevin (1974) argued that
the franchise relationship is a specific type of distribution channel
and that, as such, power in the relationship may be exercised by the
franchisor in five ways – by coercive sources (typically enshrined in the
contract), and four non-coercive sources, namely reward, expertise,
legitimacy and identification (or referent power). Reward-based power
derives from one party being able to reward the other to their mutual
benefit. A relationship based on expertise derives from one party shar-
ing its expertise with the other. Legitimate power is based on the one
party accepting the right of the other party to exert power over it,
whilst identification means ‘a feeling of oneness’ or desire for it between
the two parties. Hunt and Nevin (1974) showed that those franchisors
that used non-coercive approaches had franchisees that were more
satisfied than those who were contracted to ‘coercive’ franchisors.
It is suggested that the non-coercive style and resultant higher levels of
franchisee satisfaction lead to considerable benefits. First, franchisees
will have higher morale. Second, co-operation between the two parties
will be better. Together, this should lead to both better business perform-
ance as well as compliance with system requirements. Furthermore,
the non-coercive approach will reduce the likelihood of legal action
by either party to terminate the contract, file suits or take out class
actions.
Capacity and scheduling in mass services
During the mass production era, service operations began to be
addressed, initially from the viewpoint that they were becoming more
274 Strategic operations management

like manufacturing. This view was seminally articulated by Ted Levitt, of
Harvard Business School, who wrote two key articles in 1972 and 1976 –
‘The production-line approach to service’ and ‘The industrialization
of service’. The success of hamburger fast-food chains, notably
McDonald’s, in the late 1950s partly derived from appearing to offer a
reasonably wide range of products at different prices, made from a
small stock of ‘components’ and using a small number of processes. So
from the same food items (meat pattie, bun, salad items and sauce),
based on identical processes (grilling, toasting, assembly and wrapping),
the basic hamburger could be turned into a cheeseburger by adding a
slice of cheese, a Big Mac by including two patties instead of one, and
so on. Meanwhile, in manufacturing, many operations required variety
reduction programmes in order to remove redundant processes and
duplicated components.
In contrast to Levitt’s perspective, Sasser et al. (1978) suggested some
different and new ideas about services. These new ideas originated
from their analysis of services as being intangible, heterogeneous, per-
ishable and ‘simultaneous’. Services are ‘perishable’ in the sense that
those not consumed today cannot be stored until tomorrow. As Sasser
et al. put it: ‘a hotel room unused today cannot be sold twice tomor-
row’. This perishability derives from the fact that production and con-
sumption of many services are simultaneous; ‘production’ only occurs
when a consumer arrives to use the service facilities. Such facilities may
also have a fixed capacity that derives from the physical infrastructure
that delivers the service offer. For instance, aircraft or cinemas have a
defined number of seats, hotels a certain number of bedrooms, and
schools an optimum class size. Due to the perishability of the service
offer and fixed capacity, there is greater emphasis in services capacity
management on managing demand. Hence, from the 1980s onwards,
there has been a growing synergy between the operations and market-
ing functions of organizations, especially those delivering services.
These developments lead to a paradox. On the one hand, a growing
number of authors and researchers were actively developing theories
and models based on the idea that services and manufacture were
different. On the other hand, a growing number of practitioners
and operations managers were using similar ideas and methods irre-
spective of whether they were engaged in goods production or service
delivery. The reason for this confusion is clear. Often, the examples of
industrialized services cited in the literature were not pure customer
processing operations (CPOs), but had strong elements of materials
processing as with fast food, or information processing as with auto-
matic teller machines. Hence it is not surprising that they could be
Capacity and scheduling management 275

managed like batch production operations. Those that were more
CPOs continued to be operated as job shops like they had always done,
albeit with better utilization than before due to better forecasting and
priority management. The adoption of yield management in hotels
is a good example of this. In discussing ‘priority management’,
Westbrook (1994) identifies that it is a key element of batch produc-
tion operations, so that organizations ‘pursue certain kinds of order to
fill capacity … and choose which customer orders are to have priority’.
A hotel is a particular kind of batch production operation in that it
produces every 24 hours a number of rooms available for sale. Its out-
put is therefore highly perishable. Yield management is an approach to
priority management that comprises a range of systems and procedures
designed to maximize sales of a product or service under more or less
fixed supply conditions, where the revenue producing ability dimin-
ishes with time. The following case illustrates this.
276 Strategic operations management
Case: Hotel yield management
The Portsmouth Hotel is part of an international chain. It has 160 rooms and is located on the South Coast ofEngland. The General Manager’s performance and that of his hotel are evaluated by the company on the basisof profitability, sales revenue, customer satisfaction and employee satisfaction. Thus, yield management is thekey tool for delivering revenue and contributing to profitability. The General Manager emphasizes the role that strategic decisions have in the yield management system. On an annual basis, a business plan is drawn upthat sets sales targets for seven market segments (‘premium’, corporate, conference, leisure, promotions,tours/groups and ‘special company’). These targets derive from an analysis of the hotel’s previous perform-ance, analysis of achieved rate per segment, a competitor analysis and an environmental analysis. This leads tothe setting of rates for these segments, designed with the overall aim of increasing the overall average rate performance. In 1996, a key decision was made to lower the rack rate significantly, adjust sales mix and reducethe number of special companies (those with specially negotiated, discounted rates) from 200 down to just 20.This has led to an increase of £4.00 in the average room rate achieved, even though the rack rate is £10.00lower.The aim is to establish what the manager calls a ‘fair price’ (or price–value relationship), thereby attract-ing the right volume of business and negating the need to negotiate price.
The business plan is reviewed on a quarterly basis by the full management team. Rooms performance is specifically reviewed by a group comprising the General Manager, Sales Manager, Reservations Manager,Front-Office Manager and Financial Controller. This group also convenes weekly for a Sales Strategy Meeting.The routine agenda for this weekly event is based around a review of the previous week’s performance (roomssold, occupancy rate, actual revenue, average rate achieved, lost potential sales from declines/denials); com-petitor review (five hotels regarded as direct competition are telephoned twice per day to establish roomavailability and rack rate offered); 35-day occupancy forecast by market segment; monthly financial forecast;3-month forecast of occupancy. The meeting analyses the reasons for any deviation from plan and proposesaction to ensure future plans are achieved. Special events, such as, in the case of this hotel, the WhitbreadRound the World Race, are also considered and responses to these considered.
These annual, quarterly and weekly planning meetings enable the Reservations Manager, who is largelyresponsible for managing the yield management system, to take appropriate action on a daily basis. Over 80 per cent of the hotel’s reservations are taken in the reservations office in the hotel, comprising the managerand two full-time reservationists. Each day, the yield management system presents a report showing the current level of bookings for the next 7-day period by each ‘rate category’. These categories are related to, but

Strategies for managing capacity
Over time it became clear that there were two basic strategies that
operations could adopt when managing capacity. Starr (1978) pro-
posed an ‘aggregate planning model’ that led to two strategies: either
Capacity and scheduling management 277
not identical to, the seven market segments. A is the rack rate and B–H are different levels of discount on thisrate. It is possible for a ‘special company’ to pay a significantly discounted rack rate, but still be categorized asA, due to the volume of business they provide the hotel.The system also provides a breakdown of what wouldbe ‘acceptable’ lengths of stay that could be accepted by each of seven rate categories, A–H. In response to anenquiry, the reservationist establishes the rate category and desired length of stay. If the hotel is near capacity,lower rate categories, such as D–H, are likely to be blocked out, so the reservationist will identify this rate isunavailable and offer occupancy at whichever category rate is the minimum available. The reservationist mayalso turn away business at these lower rates if the requested length of stay spans a period during which higherrates are forecast to be achievable. The system can be overridden by anyone taking a booking. A detailedrecord is kept of these denials (due to the hotel being fully booked or length of stay mismatch) and decline(due to the customer not accepting the rate offered). These are regarded as ‘lost sales opportunities’ and areanalysed at the weekly meeting against the actual occupancy achieved. Such sales may be acceptably ‘lost’ if thehotel was fully booked or the enquiry was made some time in advance. Recent denials and recent declines (inthe previous week) are reviewed if the hotel did not achieve full occupancy. The daily demand forecast can beadjusted by the Reservations Manager in the light of adjustments to the overbooking policy and policy deci-sions made at the weekly review meetings. The system also has a subsystem that enables decisions to be madeabout conference or group bookings. Based on demand forecasts, the subsystem predicts the sales mix andidentifies the potential level of displacement of rack rate. On this basis it advises what rate to propose for theconference.
The core team engaged in yield management is the Reservations Manager and two reservationists. In termsof strategic decision-making, the Reservations Manager has strong support and encouragement from theGeneral Manager, as well as effective co-operation with other members of the hotel’s management team.Operationally, the Reservations Manager liaises with the Front-Office Manager and her team, especially withregards to the 10–15 per cent of reservations taken through the front office. There is a clear distinctionbetween the level of knowledge and skill displayed by the reservationists compared with the receptionists.TheReservations Manager undertook a 2-week induction course based on simulation exercises before taking uphis post, but believes that it took him a further 6 months to really understand the system. He has personallysupervised the training of the reservationists, who also have taken months to become fully competent.Thereceptionists, on the other hand, have had a minimum level of training. A high proportion of their ‘reservations’are actually ‘walk-ins’ on nights when rooms are available. Given the emphasis on keeping ‘lost sales’ to a min-imum, the Reservations Manager always follows up a reservation taken by a receptionist that has overridden thesystem (usually by accepting a lower rate category).
The yield management team is not directly incentivized. The hotel’s management team have a bonus basedon their performance, whilst employees are able to collect points towards household goods and other con-sumables based on their individual performance. However, this company’s emphasis on employee satisfactionand the prevalent corporate culture creates an environment in which good performance is recognized andpraised by the General Manager down. The technology that supports yield management is based around a cen-tral reservations system that enables bookings to be made in the central sales office or in each individual prop-erty. This system advises reservationists on room availability and rate (as described above), and records all therelevant data for a booking to be made. A number of subsystems use this data to facilitate yield management.These comprise a demand forecasting system, a decline/denial model, guest history database, group demandforecasting system and a travel agency commission system. The chain also has a hotel information system thatsupports accounts, guest check-in and check-out, audit and payroll.

‘vary W [the workforce] so that P [production] matches the demand as
closely as possible’ or ‘do not vary the workforce, thereby keeping P
constant over time’. This is illustrated in Figure 7.3. Sasser et al. (1978)
identify that these same strategies may be applied to service operations.
Under a chase demand strategy, the emphasis is placed on matching
output to demand and hence there is a need to forecast demand. In the
level capacity strategy, the emphasis is on maximizing utilization.
Managers are faced with decisions about matching demand with
supply in capacity and these are for both short-term and longer, more
strategic, decisions on capacity. The three types of capacity are:
■ lead – adding capacity in advance of demand growth;
■ lag – adding capacity after demand growth;
■ average – trying to maintain average capacity.
These are illustrated in Figure 7.4.
The first of these, ‘lead’ capacity, can be a sign of aggressive growth
from an organization whereby it will ‘stake out a position’ geographically
278 Strategic operations management
S
D D
S
Fixed capacity Chase demandFigure 7.3
Fixed capacity and
chase demand.
Capacity
Demand Capacity
Demand Demand
Lead Lag Average
Capacity
Figure 7.4
Three strategies in
managing capacity.

and actively create demand. Japanese transplants have been hugely
successful at doing this; some types of pharmaceutical and biotechno-
logy capacity management is handled in this way. ‘Lead’ capacity can
be viewed as a ‘risk-seeking’ strategy.
The second, ‘lag’ capacity, is a more reactive, risk-averse approach
whereby an organization responds to specific demands. It is, none the
less, a powerful approach. For example, the tragedy of the Aids epi-
demic has caused some pharmaceutical companies to increase capac-
ity in response to this tragic phenomenon.
The third type, averaging capacity, is typically used within service
organizations to smooth out the relationship between demand and
supply. As we have mentioned earlier, some services cannot store cap-
acity and so the key task is to match demand with supply so that capacity
requirements are met on both sides.
Further strategies that are used across organizations to manage fluc-
tuations in demand and supply are:
■ Providing the same level of supply, no matter what demand
level. This strategy may be called demand smoothing in service
operations, or level production in manufacturing operations.
■ Exactly matching the level of supply to the level of demand.
This strategy is usually called chase demand.
■ Adjusting demand to better match supply. This strategy is
called demand management.
Level capacity strategies. One strategy that organizations use to match
demand and supply is to produce and store outputs in advance of
demand. These strategies rely on building inventory. Other types of
operations – such as service operations – have only limited recourse to
Capacity and scheduling management 279
DemandUnits o
f outp
ut
Capacity
Figure 7.5
A level capacity
strategy.

inventory-building strategies. In many service organizations, mismatches
between supply and demand will result in queues.
Chase strategies. Organizations that use chase strategies adjust their
activity levels to reflect the fluctuations in demand.
Demand management strategies. Organizations that use demand man-
agement try to change demand to smooth high and low periods.
According to Shore (1973), the ‘essence of aggregate planning is to
devise a strategy by which fluctuations in demand can be economically
absorbed’. In this sense, this approach to capacity management is
largely concerned with managing volume and reducing or controlling
the impact of variation through improved predictability. The focus is
therefore on forecasting.
The two stages of aggregate planning are first to add together all
productive output to arrive at a total level of production (the equivalent
of what we have called ‘volume’) and second to predict or forecast the
280 Strategic operations management
Demand
Units o
f outp
ut
Capacity
TimeFigure 7.6
A chase capacity
strategy.
Demand
Units o
f outp
ut
Adjusteddemand
Figure 7.7
A comparison of the
three types of capacity
management policies.
fluctuations in this output (what we have called ‘variation’). De facto,
therefore, this approach eliminates, or rather ignores, variety and
variability.
Once a strategy or aggregate plan has been drawn up, it has to be put
into practice. In manufacturing, especially where high-volume batch
or line processes are in place, this is usually through a master production
schedule. Such a schedule includes information about promised deliv-
ery dates, resources and materials needed, assembly capacity, set-up
costs, and inventory. The particular approach will depend on the
competitive priorities of the organization. Those with a make-to-stock
strategy schedule production of output or end items, those with a
make-to-order strategy schedule inputs or purchase items, and those
with an assemble-to-order strategy schedule assemblies to capitalize on
making common components for various output items.
Although volume, variety, variation and variability are derived from
finished output, they feed back through each stage in the production
process. Likewise, prediction about finished output leads to prediction
about each stage of the process, whilst there may be perishability of
components at each stage of the process. The ‘make or buy?’ approach
to capacity management reduces variety with regard to inputs and in-
process activity by shifting production to suppliers. Often, the final
stage of the process is the assembly of components. Hence the ‘make
or buy?’ decision identifies the extent to which a process should also
include the ‘manufacture’ of these components. By outsourcing the
production of some or all of component production, the variety of sub-
processes within the operation is reduced, and just as capacity may be
more easily managed if the variety of output is reduced, so it is if the
variety of process is reduced.
The profound implication of outsourcing for capacity planning is
the shift from a process that is controlled within the operation to one
that requires co-ordination with suppliers. The growth of so-called
‘supply chain management’ during the 1980s (although, as we saw in
Chapter 6, it is perhaps better to think in terms of networks rather than
chains) indicates the extent to which this was increasingly identified as
a key aspect of operations management. Operations have always been
faced with the challenge of deciding whether or not to use raw materials
or processed materials supplied by intermediaries. Even the archetypal
job shopper, the blacksmith, did not smelt his own ore to produce iron.
The key difference in managing capacity that was adopted was the idea
of a strategic approach to outsourcing, from which supply chain man-
agement emerged. Decisions about whether to make or buy therefore
shifted from consideration about individual items on a piecemeal basis
Capacity and scheduling management 281

to decisions about whole groups of components and whole sets of
processes. We saw in Chapter 3 how Taco Bell had reconfigured its
processes. Taco Bell also made changes to how they managed scheduling,
as the study illustrates.
The capacity/scheduling interface
We have deliberately spent much of this chapter discussing types of
capacity. Capacity has clear strategic consequences, but it is also linked
to day-to-day scheduling. In essence, the link between capacity and
scheduling is one of timing, as can be seen in Figure 7.8.
Scheduling methods
Given that operations scheduling is so important for utilization and
efficiency, order sequencing, or as Westbrook (1994) terms it ‘priority
management’, is essential. From the craft era onwards, order sequen-
cing has been determined using a range of criteria. Informal scheduling
methods include the following:
■ Giving priority to the best customer. For instance, hotel clients
(often large companies) that provide a high number of bed
nights are not only given a discounted room rate, but also ‘last
room’ availability.
■ Prioritizing emergency cases. This applies particularly in
medical circumstances, such as accident and emergency
departments, which often have a ‘triage’ system.
■ Giving in to pressure from the most demanding customer.
282 Strategic operations management
Time
Company strategy
Sales forecast
Production master schedule
Loading
Daily production planning
Figure 7.8
Links between
long-term capacity and
daily scheduling.

Other ‘good ideas’ of scheduling based on systematic order sequen-
cing can include the following:
■ First come, first served. This is the fairest system, and is often
applied where people are processed through the operation.
■ Earliest due date.
■ Shortest or longest total processing time. This is based on the
idea of getting jobs that take the least, or most, time out of
the way.
■ Least slack time. This sequencing is based on matching process
time to the due date so that the finished output can be shipped
to the customer as quickly as possible.
■ Least change-over cost. Jobs are selected on the basis that they
require little or no machine set-up or change-over.
■ Shortest first/last operation first – the ‘shortest first operation
first’ approach enables jobs to become active and aims to make
good utilization of plant. The problem is that it can create
work in process and bottlenecks at later stages. Loading jobs
according to their shortest last operation attempts to ensure
that jobs are not held up at the point where most cost has been
accrued – i.e. at the last stage. Once again, though, this can
cause bottlenecks at earlier stages of the overall process.
■ Critical ratio. This is determined by dividing the time to due
date by the process time. Less than 1 means that the job will fin-
ish after the promised delivery date. In this situation, steps can
be taken to reduce process time through employee overtime
and so on. Orders are sequenced by the lowest critical ratio.
Capacity and scheduling management 283
Case: Financial services
The provision of financial services such as banking, mortgages and insurance has been transformed in recentyears by the increase in power of desktop computing and the development of the information superhighway.Many ‘virtual’ firms have entered the market, without the physical retail infrastructure of their predecessors.These firms have radically transformed this sector.
They have been able to handle significantly higher volumes of business through access to sophisticated databases. Customers making a telephone enquiry need only cite their post code (or zip code) for detailed information about the enquirer to be revealed to the tele-sales operator.This also reduces the transactiontime through accelerated data entry.
But the same databases may also hold considerably more information. Insurance companies are now able to‘customize’ individual home insurance policies based on post code data that identifies the level of crime andhence risk for any given area, along with the detailed information provided by the customer as to the contentof their properties. Again, standardized data entry enables swift data entry, along with highly individual policyproduction.
Claim processing has also been very much more flexible and responsive to customer needs, whilst at thesame time reducing costs. Claims settlements have traditionally comprised two stages: an assessment of the

Key questions
1 How well do firms really understand the four Vs of their business
and the concepts of perishability and predictability?
2 How should firms go about making the choice between improv-
ing their existing approach to capacity and scheduling management
or radically changing their process to reconfigure the notion of
capacity?
References and further reading
Baden-Fuller, C. and Stopford, J. (1994) Rejuvenating the Mature
Business. London: Routledge.
Brickley, J.A. and Dark, F.H. (1987) ‘The Choice of Organisational
Form: The Caso of Franchising’. Journal of Financial Economics, 18,
401–421.
284 Strategic operations management
damage sustained, usually determined in the field by a loss adjuster, and processing of the associated paper-work and issuance of the cheque, usually centrally processed in batches back-of-house.Today, it is possible forloss adjusters to be equipped with technology that enables them to respond to claims immediately, travel to the claimant, assess the claim, process the documentation and issue the cheque, all within 3 hours of theaccident occurring.This combination of mobile computing and telephony also enables the adjuster to liaisewith other service providers that the claimant may need, such as in the case of a car accident, a towing vehicle,medical treatment, overnight accommodation or whatever. This form of provision adds considerable value,customizes the experience and is relatively cheap to provide with the right kind of technological support.
The same information that enables insurance policies or mortgages to be customized also enables thesefirms to engage in more effective marketing of other products or services, to the point where the concept of one-to-one marketing has emerged. Information about the age, sex, residence and most especially spendinghabits of the customer identify key lifestyle changes that may trigger new sales opportunities for financial services firms. For instance, the regular purchase of airline flights might signal the opportunity to sell travelinsurance or travellers’ cheques.
Summary
■ Capacity management is based on understanding the specific characteristics of volume, variety, variation,variability, predictability and perishability.
■ There are two main strategies available for managing capacity – level capacity or chase demand.■ Early operations management approaches to capacity were based on order sequencing, scheduling
activities and process control, whilst materials management was based around economic order quantities,standardized components and inventory control.
■ It is erroneous to assume that because some approaches to capacity planning were developed early in thetwentieth century, they are no longer relevant to today. There are many operations, businesses and evensectors that continue to need and indeed use these methods.
■ Such operations are often small scale and owner operated in sectors with some technology that hasremained largely unchanged.

Brown, S. (1996) Strategic Manufacturing for Competitive Advantage.
Hemel Hempstead: Prentice Hall.
Brown, S. (2000) Manufacturing the Future – Strategic Resonance for
Resonant Manufacturing. London: Financial Times/Pearson Books.
Business Week, 6 September 2003.
The Economist, 2 January 2003.
Fortune, Intel’s $10 billion gamble, 11 November 2002.
Goldratt, E.M. and Cox, J. (1986) The Goal. Great Barrington, MA:
North River Press.
Goss-Turner, S. and Jones, P. (2000) Multi-unit management in service
operations: alternative approaches in the UK hospitality industry.
Tourism and Hospitality Research: The Surrey Quarterly Review, 2(1),
51–66.
Hill, T. (2000) Manufacturing Strategy. Basingstoke: Macmillan.
Hunt, S.B. and Nevin, J.R. (1974) Power in a channel of distribution:
sources and consequences. Journal of Marketing Research, 11, May,
186–193.
Jones, P. (1999) Multi-unit management in the hospitality industry:
a late twentieth century phenomenon. International Journal of
Contemporary Hospitality Management, 12(3), 155–164.
Levitt, T. (1972) The production-line approach to service. Harvard
Business Review, 50(5), 20–31.
Levitt, T. (1976) The industrialisation of service. Harvard Business
Review, 54(5), 32–43.
Sasser, W.E., Olsen, M. and Wyckoff, D.D. (1978) The Management of
Service Operations. Boston, MA: Allyn & Bacon.
Schlosser, E. (2001) Fast Food Nation. London: Penguin Press.
Schmenner, R. (1990) Production/Operations Management. Macmillan.
Schmenner, R.W. and Swink, M. (1998) On theory in operations
management. Journal of Operations Management, 17, 97–113.
Schonberger, R. (1986) World Class Manufacturing. New York: Free Press.
Shore, B. (1973) Operations Management. New York: McGraw-Hill.
Starr, M.K. (1978) Operations Management. Englewood Cliffs, NJ:
Prentice Hall.
Suzaki, K. (1987) The New Manufacturing Challenge: Techniques for Con-
tinuous Improvement. New York: Free Press.
Thompson, J.D. (1967) Organisations in Action. New York: McGraw-Hill.
Waters, D. (2001) Operations Management: Producing Goods and Services.
Harlow: Addison Wesley.
Westbrook, R. (1994) Priority management: new theory for operations
management. International Journal of Operations and Production
Management, 14(6), 4–24.
Capacity and scheduling management 285

C H A P T E R
Quality and BPR
8
Introduction
This chapter looks at the key issues in quality. We discuss its strategic
importance, track its evolution through the various stages of manufac-
turing, and provide details of important research in an important
aspect of quality – continuous improvement.
The purpose of this chapter is for the reader to:
■ understand the strategic importance of quality;
■ realize that it remains a central feature of strategic operations
in manufacturing and service settings in private and public
sectors.
Quality is not an option in most walks of life. For example, it would be
unthinkable for airline pilots or hospital midwives to aim for anything
less than perfection in what they do, and nonsense to think of only try-
ing for an ‘acceptable’ level of failure – one plane crash in 100 or one
baby dropped per 500 deliveries! In similar fashion, no artist who is
serious about his or her work would think of producing something that
did not reflect their best endeavours and provide an object or artefact
of lasting value.
One of the annoying factors about quality is that seemingly unimport-
ant details can have an astonishing impact on how quality is perceived.
For example, when Concorde crashed it was as a result of a lack of atten-
tion to a piece of debris on the runway. The consequences to this were
both profound and fatal. Concorde had not suddenly become a poor-
quality product, but the issue of safety (the most important element of
travel in our evaluation of service quality) now became paramount.
On the positive side, it is Disney’s obsession with keeping the theme
park clean that has been seen as a key issue in our view of quality.

Quality and BPR 287
Of course, we don’t go to a theme park just because we want to see how
clean it is; none the less, this detail has become a source of advantage
for Disney – ‘other theme park operators can copy Disney’s technology
with its theme rides but nobody can figure out how to keep the damn
park clean!’ (Peters, 1990).
Yet until recently these ideas of quality were not common in the world
of business. Indeed, much of the early theory of manufacturing oper-
ations contains terms and concepts such as ‘acceptable quality level’
and an underlying philosophy that assumes mistakes will happen and
that things will go wrong. For much of the twentieth century, the ques-
tion of quality was recognized as an issue, but the assumption was also
made that with complex products and manufacturing processes there
would inevitably be defects and problems that could not be predicted
or prevented. There is some truth in this at the most basic statistical
level; in any population of events there will be an element of random
variation, but this level is very small – and even then action can be taken
to ensure this does not adversely affect the perception of overall quality.
As a result, whole departments of specialists were developed to man-
age the effects of having problems with quality as an endemic part of
business life. This included inspectors whose job it was to catch defect-
ive products before they left the factory; customer support staff, pro-
cessing complaints and warranty claims; and an army of people
running around the factory trying to repair or replace the faulty items.
Needless to say, all of this quality ‘management’ results in extra costs,
and they may be considerable. It is not just the cost of the direct
employees involved that we have to consider, it is also the disruption,
the wasted effort producing something of poor quality in the first
place, the risk to reputation and goodwill, the wasted time and effort in
attracting customers who then become dissatisfied and tell their friends,
and so on. One of the noted quality writers of recent years is Philip
Crosby, who began working on quality issues within the giant ITT
Corporation. He tried to put some numbers to the real costs of quality,
and realized to his – and the company’s – horror that these could
account for as much as 40 per cent of sales revenue! (Crosby, 1979).
For example, back in 1984, when IBM first began looking at this prob-
lem, they estimated that $2bn of its $5bn profits was due to improved
quality – not having to fix errors. But quality is not just about prevention
of problems, as a recent J.D. Power Survey (2003) announced:
Quality as defined by few defects is becoming the price of entry for
automotive marketers rather than a competitive advantage.

288 Strategic operations management
It would not be an exaggeration to say that there has been a revolution
in thinking and practice around the theme of quality. Firms recognize
its potential as a source of competitive advantage; as one commentator
in the aerospace industry pointed out, ‘achieving six sigma (a measure
of very-high-quality performance) is worth several points on Wall St –
that’s why we are going for it!’ The following captures the mood with
quality in the new millennium (Financial Times, 15 July 2002):
When (the new CEO) took the top job at 3 M in early 2001, one of his
first moves was to launch a Six Sigma quality initiative across the
group … 3M has selected 500 up-and-coming managers to work on
quality improvement projects full time for 2 years. It is providing a
week of Six Sigma training for each of its 28,000 salaried employees. …
‘This is about addressing the DNA of the company. It is a 10- to 15-year
commitment’ [said the CEO].
Some spectacular results have been gained from adhering to high
levels of quality (Financial Times, 15 July 2002):
In 1996 … Welch declared Six Sigma quality to be his next group-wide
initiative for GE. By the end of the decade he was declaring it a
spectacular success: his 1999 letter to shareholders attributed ‘Dollars
2bn in benefits’ to the Six Sigma programme. … GE is also going out of
its way to introduce its business partners to Six Sigma. Last year, the
giant aero-engines and appliances group carried out 10,000 joint quality
improvement projects with customers. Among those involved was
Xerox, the company once heralded as America’s quality champion.
Quality has moved from being something about which firms have much
choice – it is now a competitive imperative. In general, customers make
their purchase decisions based on price and a set of non-price factors,
such as design, variety, speed of response and customization. Quality sits
amongst these non-price factors and we can chart its evolution over the
past 30 years from being a non-essential, to being a desirable feature, to
being a necessary qualification to enter some markets.
But what of services, where much of what is involved is intangible? In
many cases, quality is even more important. First, because service con-
tains many tangible components and no one values poorly cooked or
served food or bedrooms that are not cleaned properly. But percep-
tions of service go beyond this to the overall experience – and the likeli-
hood of returning. For example, it has been estimated that the potential

Quality and BPR 289
value of securing a customer for life (through good service) for a pur-
chase as trivial as a home delivery pizza is of the order of $12 000!
(Bentley, 1999).
For the operations manager, quality is of critical importance. Quality –
as we shall see – is not the province of a specialist but the responsibility
of everyone. It pervades all aspects of an organization’s operations, and
the development and maintenance of quality consciousness has become
one of the key roles that strategic operations managers have to play.
What is quality?
Before we explore how operations managers can influence the quality
performance, it will be useful to reflect for a moment on what we mean
by the word ‘quality’. The dictionary says it is ‘… the degree of excellence
which a thing possesses …’, while John Ruskin, the nineteenth-century
painter and art critic, makes a valuable additional point: ‘… quality is
never an accident, it is always a result of intelligent effort’. Pirsig (1974) sug-
gests that quality is not a physical attribute, nor a mental concept, but
something embodying both: ‘… even though quality cannot be defined, you
know what it is’. Garvin (1992, p. 126) states:
Quality is an unusually slippery concept, easy to visualize and yet
exasperatingly difficult to define.
Juran (1974) spoke of quality as ‘fitness for use’. But the question is:
for whose use? From this point of view, a better definition – certainly in
terms of how markets perceive quality – is offered by Feigenbaum
(1983, p. 7), who asserted that quality is:
… the total composite product and service characteristics … through
which the product or service in use will meet the expectations of the
customer.
Feigenbaum (1983, p. 11) adds further insight to our understanding of
the definition of quality when he ties it to quality control:
… control must start with identification of customer quality
requirements and end only when the product has been placed in the
hands of a customer who remains satisfied.

290 Strategic operations management
This user-oriented approach is helpful in focusing attention on the
customer rather than the producer, but it can be argued that it needs
some modification. In particular, as Garvin (1988) points out, it does
not deal with two key problems:
■ how to aggregate what may be widely varying individual per-
ceptions of quality to provide something meaningful at the
level of the market;
■ how to identify the key product attributes that connote quality.
An alternative set of definitions emerge from considering the producer’s
side: these are concerned with establishing standards and measuring
against them ( Juran and Gryna, 1980). The quality of design represents
the intentional quality that designers wish to see produced in order to
meet their interpretations of the customer’s needs. It is a multi-attribute
definition, but has the advantages of permitting measurement against
each of these attributes to assess whether or not the intentional quality
level has been achieved.
Associated with this is the quality of conformance, which represents the
degree to which the product when made conforms to the original design
specifications. The extent to which this can be achieved will depend in
turn on the various elements of manufacturing – people, processes,
equipment, incoming raw materials quality, etc. This equates to Crosby’s
idea of quality as ‘conformance to requirements’ (Crosby, 1979). The
quality process can be seen in Figure 8.1. Essentially, the market needs
are translated into product strategy, which in turn feeds through to the
R&D – and other key functions involved in design – in order to provide
a suitable product and associated specification. It is against this that
quality can be measured in terms of conformance to that specification.
Market needs anddemands
Product orservice policy
Product orservice design
Product/servicespecification
Process capability
Process qualityassurance and
control
Conformance withspecification
Product orservice quality
Figure 8.1
Quality in the design
process.

Quality and BPR 291
On the process side, quality will be affected by two things: the overall
capability of the process (to hold tolerances, etc.) and the way in which
quality is controlled within the process. The degree to which conform-
ance to specification can be achieved will depend on these two
factors.
Quality is complex but is dependent upon four, interlinking
components – the hard side, the soft side, process quality and product
quality – and these need to be linked and dynamically interfacing, as
shown in Figure 8.2.
Strategic quality
There are two key reasons why quality has become strategic. The first is
due to the number – and capabilities – of new entrants into many markets
and industries. The second major factor is that, as a result of this fierce
competition, customers now have far greater amounts of choice. For
example, the major reason why quality became such a major issue for
the ‘Big Three’ US car manufacturers in the 1980s was that it became
abundantly clear that the Japanese plants’ capabilities were vastly super-
ior to their American competitors (Womack et al., 1990). As Tom
Peters (1995) succinctly stated, reflecting on the situation of the US
auto industry at the beginning of the 1980s: ‘Our cars were trash!’
Product qualityProviding designs and
specifications tocustomer requirements
Process quality –The ability to provide'right first time', cost-effective, speedy and
reliable deliveryrequirements
Soft factors – gainingcommitment to TQM;
understanding customerrequirements, cultural
change, training,enthusiasm
Hard factors – SPCcharts, Ishikawadiagrams, flow
diagrams, other datafor measuringConstant
interactionbetween hard,soft, product,
process factors
The Total Quality Offering to Customers
Figure 8.2
Understanding the
total quality offering
(source: Brown,
2000, p. 119).

292 Strategic operations management
Business Week (8 August 1994, p. 54) commented on the strategic
importance of quality:
Detroit, for instance, finally caught the quality wave in the 1980s and it’s
hard not to shudder at the thought of how the Big Three would be
faring today if they were still turning out Chevy Citations instead of
Saturns. And much of the rest of US industry would be locked out of
the game in today’s global economy without the quality strides of the
past few years.
The number – and capabilities – of new entrants into markets has
raised competition between new and existing players, all of whom have
to compete to ‘world-class’ standards. This intense competition has
helped to redefine the term world class, when applied to quality. Kanter
(1996) rightly argues that the term world class has less to do with being
better than competitors – the term merely denotes the ability to com-
pete at all in global competition. It may well be necessary to speak of
‘world-class’ quality capability as an order qualifier (Hill, 1995), in
order to compete in markets. This has had enormous benefits for cus-
tomers but has placed even higher standards on manufacturing cap-
abilities. Production/operations have to be able to respond to changes
with great speed to meet the mix, range and volume of customer
requirements. The challenge for firms, though, is that although they
may know that these capabilities need to be in place, they fail to under-
stand how to put them in place. This chapter provides some of the keys
to achieving this.
Looking back …
We have seen in previous chapters how the transition from craft to
mass production through to the modern era has had profound influ-
ence on operations management. This is clearly evident in quality. In
the earliest days of manufacturing, quality was essentially built into
the work of the craftsman. For example, the notion of ‘taking pride in
work’ was a central pillar of the medieval guild system, whereby con-
cern for quality was trained into the hearts and minds of apprentices
onwards. The Industrial Revolution destroyed much of this one-to-one
identification with the product and led to a loss of the craft ethic to be
gradually replaced by the factory system. Although quality was important,
especially in the pioneering applications of new technologies evident
Quality and BPR 293
in the bridges, machinery and other products of that period, it was
often in competition with the demands of high productivity for satisfy-
ing massively expanding demand.
In the latter part of the nineteenth century, the focus of attention in
manufacturing shifted to the USA, where the ideas of Taylor and Ford
were of particular importance. In Taylor’s model of the effective factory,
quality was one of eight key functions identified as of critical importance
for shop foremen to manage (Taylor, 1911), while Radford’s influential
book, The Control of Quality in Manufacturing, placed further emphasis on
the task of inspection as a separate function (Radford, 1922).
In services at this time, quality remained strongly associated with the
traditional values: a high-quality solicitor or bank would be one that
exhibited a haughtiness and aplomb, rather than measurably excellent
service. A ‘quality’ school would be one to which well-known people
sent their sons or daughters, rather than one in which the excellence
of education could be assessed. This reflected the immaturity of markets
(e.g. their inability to demand or complain), as well as some deeply
entrenched vested interests (e.g. the superiority of some public schools).
Lastly, the concept of ‘professions’ and the reflection in deference
meant that service providers could get away with poor quality, simply
telling the customer that failure was attributable to factors that could
not be explained to the layman.
Taylor’s model became the blueprint not only for the mass produc-
tion factories of the 1920s and 1930s, but also for many other types of
business. Typically, emphasis was placed on inspection as the main con-
trol mechanism for quality, supporting a process of gradual refinement
in product and process design that aimed to eliminate variation and
error. The essential character remained one in which the majority of
people were not involved; the task of managing quality fell to a hand-
ful of specialists.
In 1931, in perhaps the most significant development, Walter
Shewhart wrote a book based on his experience in the Bell Telephone
Laboratories entitled The Economic Control of Manufactured Products.
This study of methods for monitoring and measuring quality marked
the emergence of the concept of statistical quality control as a sophisti-
cated replacement for the simple inspection procedures of the 1920s
(Shewhart, 1931). The development reinforced the idea of quality
needing specialists (able to understand and use statistical methods) to
manage it, further separating it from the labourer, the machinist and
even the foreman.
Of particular interest was the work of a group of quality experts,
including William Edwards Deming (1986) and Joseph Juran (who

worked for a while with Bell Labs in the quality assurance department
set up by Shewhart), who were involved in wartime training and who
helped establish the American Society for Quality Control. Within this
forum, many of the key ideas underpinning quality management today
were first articulated, but their impact was limited and little under-
standing of quality control principles extended beyond the immediate
vicinity of the shopfloor.
In 1951, Juran published his Quality Control Handbook, in which he
highlighted not only the principles of quality control, but also the
potential economic benefits of a more thorough approach to preventing
defects and managing quality on a company-wide basis ( Juran, 1951).
He suggested that failure costs were often avoidable, and the economic
pay-off from preventive measures to reduce or eliminate failures could
be between $500 and $1000 per operator – what he referred to as the
‘gold in the mine’. A few years later, Armand Feigenbaum extended
these ideas into the concept of ‘total quality control’, in which he drew
attention to the fact that quality was not determined simply in manu-
facturing, but began in the design of the product and extended
throughout the entire factory (Feigenbaum, 1956). As he put it:
… the first principle to recognize is that quality is everybody’s job.
Strangely, these ideas were not taken up with any enthusiasm in the
West – but they did find a ready audience in post-war Japan, which was
facing the twin problems of catching up with Western practice and
rebuilding its shattered industrial base. Much of the reason for the rela-
tive lack of interest amongst Western firms can be traced back to eco-
nomic factors. For most firms, the 1950s were a boom period – the era
of ‘you’ve never had it so good’. One consequence of this relatively
easy market environment was that the stringencies of the war years
were relaxed and there was a general slowdown in effort in both prod-
uctivity growth and quality improvement practices.
In the 1960s, the concept of ‘quality assurance’ began to be pro-
moted by the defence industry in response to pressure from the NATO
defence ministries for some guarantees of quality and reliability. This
grew out of work on ‘reliability engineering’ in the USA, which led to
a number of military specifications establishing the requirements for
reliability programmes in manufacturing organizations. (Some indica-
tion of the size of the problem can be gauged from the fact that, in 1950,
only 30 per cent of the US Navy’s electronics devices were working
properly at any given time.) Such approaches were based on extensive
294 Strategic operations management

application of statistical techniques to problems like that of predicting
the reliability and performance of equipment over time. This link with
the defence sector (and latterly, by association, with the aerospace
industry) led to the formalizing of quality standards for products,
including components and materials, supplied by subcontractors for
military customers. In the USA and the UK, the so-called ‘military speci-
fications’ and ‘defence standards’ gave rise to the practice of formal
assessment of suppliers, for purposes of accreditation as acceptable
sources.
Quality assurance (QA) is the name given to the set of systems
(embodying rules and procedures) that are used by a firm to assure the
manufacture of quality products. Although clearly a sound idea in
principle, by 1969 it had become enshrined in an increasingly bureau-
cratic set of rules and procedures that suppliers needed to go through
to obtain certification by defence agencies. Consequently, in the firms
themselves, QA became an increasingly dogmatic, bureaucratic and
specialized function – a book of rules rather than a live principle.
The combination of QA and the supplier assessment initiatives
described above gave rise to the concept of supplier quality assurance
(SQA). In order to ensure compliance with increasingly rigorous stand-
ards, certification and checking of suppliers began to take place,
where the onus was placed upon suppliers to provide evidence of their
ability to maintain quality in products and processes. Such vendor
appraisal was often tied to the award of important contracts, and pos-
session of certification could also be used as a marketing tool to secure
new business because it provided an indication of the status of a quality
supplier.
In keeping with the general tenor of quality management to date,
however, SQA maintained the idea that quality was something ‘outside’
the process – as if it were the result of inspection (this time, with the
customer wearing the ‘white coat’).
By the mid to late 1970s, there were many of these SQA schemes in
operation, all complex and often different for each major customer. As
a result, suppliers faced a major task in trying to ensure compliance
and certification. Such congestion led to the need for some form of
central register of approved schemes and some common agreement
on the rules of good QA practice. There are now a number of national
and international standards which relate to the whole area of quality
assurance and require the establishment and codification of complete
quality assurance systems, and achievement of certification (e.g. ISO
9000) has become a prerequisite for participation in many global mar-
kets. A summary of developments in quality is illustrated in Figure 8.3.
Quality and BPR 295

296 Strategic operations management
The Eastern promise – a new approach to quality
There is no doubt that such procedural approaches made a contribu-
tion to improving quality levels in the West. However, they still repre-
sented a traditional view which saw quality as the province of specialists
and primarily controlled through inspection at all stages. Something
very different had been happening in the Far East. During the 1960s,
and particularly the 1970s, it became clear that Japanese firms had not
only managed to shake off their image of offering poor quality prod-
ucts, but had actually managed to obtain significant competitive advan-
tage through their improved performance in this field. In fact, their
improved performance was the result of a long learning process, which
began in the aftermath of World War II.
In 1948, the Japanese Union of Scientists and Engineers (itself only
formed 2 years earlier) formed a quality control research group, and
Emphasis Major themesCraft production
Dates Key figures
Prior to1900s1900s1900s1920s
InspectionStandardized parts and gaugingControl charts and acceptancesampling
Walter ShewhartHarold DodgeHarry Romig
Statisticalprocesscontrol
Theory of SPC 1931
US experts visit Japan 1940s W. Edwards DemingJoseph JuranArnold Feigenbaum
Qualityassurance
Cost of qualityTotal quality controlQuality control circles in Japan
1950s
1950s
Reliability engineeringZero defectsRobust design
1960s
Total qualitymanagement 1960s Genichi Taguchi
Quality function deploymentDesign for manufacture/assemblyTQM in West
1970s1980s1980s–present
Walter Shewhart
Joseph JuranArnold FeigenbaumKaoru IshikawaTaiichi Ohno
Inspection
Figure 8.3
Major developments in quality (based on Nicholas, 1998, p. 20).

invited Deming to give a series of seminars. These were extremely
influential, especially in introducing some of the statistical approaches,
but also in encouraging a systematic approach to problem solving. So
successful was his visit that the Deming Prize for quality was initiated in
1951 in his honour. Pride in quality became a key norm in the post-war
development of Japanese industry and state support was also present in
the form of the Industrial Standardization Law in 1949, which came
out of Ministry for International Trade and Industry (MITI) attempts
to improve the range of products being made and sold.
The early 1950s saw the growing trend towards SQC being applied
across the organization, backed up by formal procedures and stand-
ardization. It is important to note that this trend was led by engineers and
middle managers, and was not necessarily seen as a key strategic develop-
ment by senior management at the time. The concept of company-wide
quality control really emerged during the late 1950s as new mechanisms
were developed and as the tools of statistical quality control were applied
systematically across the piece. Once again, ideas that had originally
developed in the West were influential here. Joseph Juran visited in 1954
and laid considerable emphasis on the responsibility that management
had for quality planning and other organizational issues concerned with
quality, while Armand Feigenbaum came 2 years later with his message
about company-wide quality control, taking his cue from Juran.
One lesson emerging from this experience was the need to involve
those in the production process much more, to teach them why as well
as what they had to do to guarantee quality. A key feature of this is
the idea that operators are much more than simply interchangeable
resources as they are represented in the Taylor/Ford model. As Kaoru
Ishikawa, son of one of the founders of the Japanese quality move-
ment, said (Ishikawa, 1985):
… if Japanese workers … were obliged to work under the Taylor
system, without encouragement of voluntary will and creative initiative,
they would lose much of their interest in work itself … and do their
work in a perfunctory manner.
In many ways this is an obvious point – after all, the likely conse-
quences of treating people as ‘cogs in a machine’ include:
■ uninterested operators;
■ increased defects in products;
■ drop in labour efficiency;
■ no quality consciousness (why bother?);
Quality and BPR 297

298 Strategic operations management
■ increased absenteeism;
■ increased labour turnover.
Re-learning the quality lesson in the West
Growing awareness (and in many cases impact on market shares) of
the Japanese total quality model led to a renewed focus of interest and
effort in the quality area and the beginnings of adoption of Japanese
practices in the West. For example, Garvin (1988) reports that the Martin
Corporation managed to supply a defect-free Pershing missile 1 month
ahead of schedule in 1961, a remarkable achievement at a time when
extensive inspection and testing was the norm and defects were accepted
as almost inevitable by final customers. Of particular significance was
the fact that this had been achieved by focusing all employees on the
common goal of ‘zero defects’. As the company management reflected
(Halpin, in Garvin, 1988):
… the reason behind the lack of perfection was simply that perfection
had not been expected.
This led them, and others, to experiment with ways of building worker
involvement in programmes that were designed to promote higher
quality consciousness and the desire to do things ‘right first time’. The
first Western quality circle was established in Lockheed in 1975 and
others quickly followed. Firms quickly began to realize that there was
no instant plug-in means of providing better quality – and many early
QCs failed after early success. Gradually firms recognized the need for
more of a company-wide approach, which included operator involve-
ment and a total system approach to quality management.
New tools helped this process, particularly the idea of statistical
process control (SPC), which had been developed in the 1940s but
which became easier to implement in total systems that stressed oper-
ator involvement. SPC, which was applied extensively in the early 1980s,
not only improved the control of quality but, importantly, changed the
location of responsibility. It brought control of the quality back to the
point of manufacture, rather than placing it at the end of the process.
Such approaches call for operator involvement, for top management
commitment, for quality to be seen as a concept being applied to much
more than just the product, and for the extension of problem-solving
techniques beyond the quality area – in short, to company-wide quality
control or total quality management.

Quality and BPR 299
Quality today
The picture today is very different to the mass production approach to
quality. Quality has been re-integrated into the mainstream of oper-
ations thinking, and concern for the development and maintenance of
high standards runs throughout business. It is seen as a national impera-
tive, something which affects international competitiveness and is too
important to be left to chance. (An indication of this can be seen in the
number of government-backed programmes that have promoted the
adoption of quality standards, such as the ISO 9000 series, which pro-
vide a measure of the overall quality of processes.)
Importantly, we have also moved on from the view that quality is the
province (and problem) of a small group of specialists. These days, qual-
ity is everyone’s problem – and everyone can make a contribution to its
development and maintenance. As we shall see, the notion of employee
involvement in problem finding and solving is beginning to be recog-
nized as a significant – and low-cost – source of competitive advantage.
It will be useful to look at some of the key components of today’s
quality practice – at what is involved in building and maintaining qual-
ity in creating and delivering products and services of consistently high
quality. Much is made of the term ‘total quality management’, but there
is a risk that the term itself becomes meaningless. In essence, little has
changed from the principles discovered (or perhaps rediscovered) in
post-war Japan and later in the West; quality still comes from an
approach that emphasizes everyone’s involvement, from a view that
integrates quality thinking and action into all operations, and from the
pursuit of excellence. The target should always be an uncompromising
‘zero defects’; though every step towards this will be useful, it is also
important to reflect that ‘best is the enemy of better’.
In putting this philosophy into action, three areas are of interest –
the process whereby quality is built into what we do, the tools and tech-
niques which enable that to happen, and the involvement and commit-
ment of everyone towards continuous improvement.
ISO 9000
ISO 9000 is an internationally recognized standard of quality that
many firms strive for in order to demonstrate that quality standards
and processes are in place. ISO 9000 and TQM are not one and the
same thing. More pointedly, we should bear in mind that many firms
that have ISO 9000 go out of business and so it is not a guarantee of
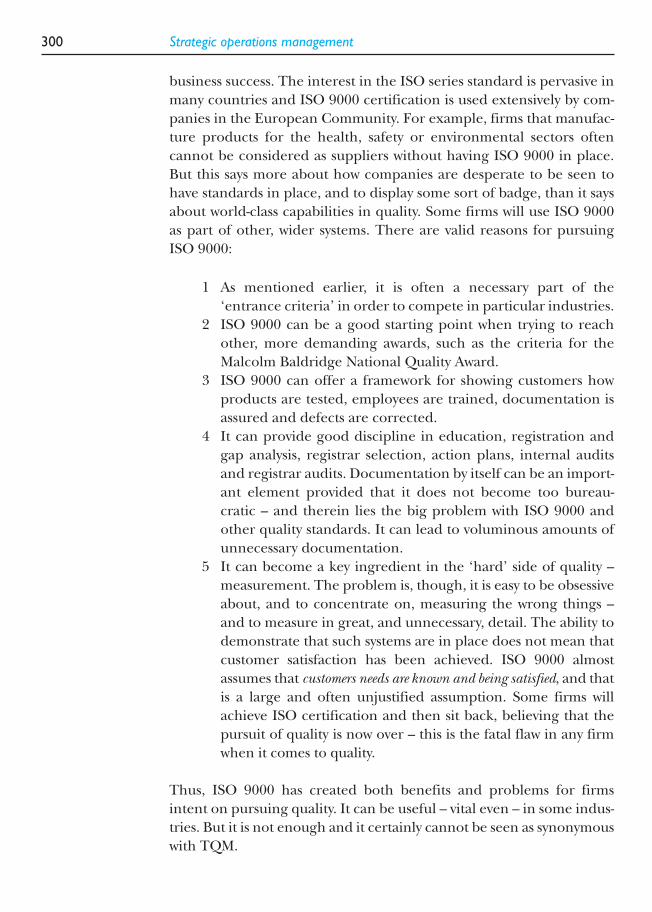
300 Strategic operations management
business success. The interest in the ISO series standard is pervasive in
many countries and ISO 9000 certification is used extensively by com-
panies in the European Community. For example, firms that manufac-
ture products for the health, safety or environmental sectors often
cannot be considered as suppliers without having ISO 9000 in place.
But this says more about how companies are desperate to be seen to
have standards in place, and to display some sort of badge, than it says
about world-class capabilities in quality. Some firms will use ISO 9000
as part of other, wider systems. There are valid reasons for pursuing
ISO 9000:
1 As mentioned earlier, it is often a necessary part of the
‘entrance criteria’ in order to compete in particular industries.
2 ISO 9000 can be a good starting point when trying to reach
other, more demanding awards, such as the criteria for the
Malcolm Baldridge National Quality Award.
3 ISO 9000 can offer a framework for showing customers how
products are tested, employees are trained, documentation is
assured and defects are corrected.
4 It can provide good discipline in education, registration and
gap analysis, registrar selection, action plans, internal audits
and registrar audits. Documentation by itself can be an import-
ant element provided that it does not become too bureau-
cratic – and therein lies the big problem with ISO 9000 and
other quality standards. It can lead to voluminous amounts of
unnecessary documentation.
5 It can become a key ingredient in the ‘hard’ side of quality –
measurement. The problem is, though, it is easy to be obsessive
about, and to concentrate on, measuring the wrong things –
and to measure in great, and unnecessary, detail. The ability to
demonstrate that such systems are in place does not mean that
customer satisfaction has been achieved. ISO 9000 almost
assumes that customers needs are known and being satisfied, and that
is a large and often unjustified assumption. Some firms will
achieve ISO certification and then sit back, believing that the
pursuit of quality is now over – this is the fatal flaw in any firm
when it comes to quality.
Thus, ISO 9000 has created both benefits and problems for firms
intent on pursuing quality. It can be useful – vital even – in some indus-
tries. But it is not enough and it certainly cannot be seen as synonymous
with TQM.

The quality process
At its heart, quality is the result of a sequence of activities embodied in
a process within the business. The advantage of looking at it in this way
is that it becomes possible to map the process and monitor and meas-
ure the outputs – and to use this information to identify where and
how the process itself can be improved. This kind of thinking is central
to the original statistical approaches developed in the early part of the
century, but it can be applied on a broader scale to explore all the
areas where quality is introduced, and to the influences on the process.
At the simplest level, we can consider a machine making a part; we
know the desired output specification and can use this to compare
what actually comes out of the process with what is supposed to. If
there is a difference, we know there is a problem affecting quality – and
we can then apply tools and techniques to finding and rectifying the
problem and eventually preventing its recurrence. This approach can
be used on a single machine, on a series of machines, on the intangible
processes that schedule those machines, on the various linked activities
upstream and downstream of the machines, and so on. We can even
look at the quality management process itself and how that might be
improved.
Taking a process approach is a powerful start to improving quality
and has the advantage of being generic – as long as we can define the
process and specify inputs, outputs and relevant measures, we can apply
this approach. The argument then runs that if we can guarantee the
process is OK then it follows that the quality coming out of that process
will be OK. This kind of thinking underpins the many national and
international standards around total quality management – such as ISO
9000. In this, firms are required to define and document each process
they employ and to show how quality assurance and improvement are
built into it. If they do so, then they have the framework for ensuring
high and improving quality. (Of course, it is possible to write elegant
descriptions of processes and suitable procedures for monitoring and
measurement that have nothing to do with the way things work in prac-
tice – but in principle such process-based standards are a powerful tool.)
Benchmarking in quality
An extension of the process idea is the use of benchmarking to com-
pare performance on quality indicators – for example, defective parts
per million – and the practices which different firms use to achieve
Quality and BPR 301

302 Strategic operations management
such performance. This approach – which was originally developed in
the Xerox Corporation – provides a powerful learning and develop-
ment aid to quality improvement. Regular benchmarking can provide
both the stimulus for improvement (because of the performance gap
that has to be closed) and new ideas about things to try in terms of
organizational tools, mechanisms and practices.
Further development of these ideas of assessment and improvement
comes in the form of integrated frameworks, which provide definitions
of ‘ideal’ quality organizations against which firms can benchmark
themselves. Such models are sometimes associated with a prize – for
example, the Deming prize in Japan – but their real value lies in offer-
ing a well-publicized target for which firms can aim in their quality
improvement activities. In the USA, the Malcolm Baldridge Award pro-
vides such a framework, whilst in Europe the model originally
developed by the European Foundation for Quality Management
(EFQM) is finding increasing application. Importantly, these models
not only look at processes within the firm, but increasingly at its inter-
actions with the wider community; equally they are not simply con-
cerned with aspects of product quality but also consider issues such as
the quality of working life within the firm.
Figure 8.4 reproduces the model used in the EFQM approach, and
shows the concern for both performance (essentially the ‘results’
measures) and practices which create that performance (the ‘enablers’
measures). Such models are used by firms for self-assessment or
for feedback and guidance offered by a team of trained external and
independent assessors.
It is important to remember that benchmarking is limited to the
immediate and tactical level of management. When used at the stra-
tegic level, benchmarking may prevent the organization from ‘thinking
Leadership(100)
Peoplemanagement (90)
Policy and strategy(80)
Resources (90)
Processes(140)
Impact on society(60)
Customersatisfaction
Peoplesatisfaction (90)
Businessresults(150)
ENABLERS RESULTS
Figure 8.4
The EFQM model.

Quality and BPR 303
big’ or ‘outside the box’. To be best at meeting current expectations
may mean one does not see the potential for competing by exceeding
or changing expectations – thereby making competitors’ competences
redundant (see Chapter 4). This is what severely hampered the North
American motor industry until its shock in the 1980s. Complacent
benchmarking between the ‘Big Three’ led to their mutual loss of
international competitiveness – a process that Abernathy and Utterback
(1978) famously called a ‘roadblock to innovation’.
Operationally, this might be captured in the rather effete term ‘cus-
tomer delight’. A train passenger is unlikely to be delighted by the
train departing and arriving on time (the sort of thing that is bench-
marked) because this is what is expected. The passenger might be
delighted, however, to find a complimentary newspaper or cup of coffee
is included in the service.
Customer satisfaction versus customer loyalty (SERVQUAL)
Clearly, a key element of ensuring quality is to measure customers’
responses to the product or service they have received. Understanding
this provides strategic feedback as to the likely future success of the
firm. At first, it might seem simple to establish if customers are pleased
or dissatisfied with their purchase – just ask them. With regards to
products that have tangible characteristics, it is possible to ask customers
about these and their degree of satisfaction with them. In services, it has
been less straightforward. However, Parasuraman et al. (1985) have
developed the SERVQUAL model based on measuring the difference
between customer’s expectation of a service and their perceptions of
the actual experience. This has led them to identify five key character-
istics which they claim apply across all services: tangibles, reliability,
responsiveness, assurance and empathy. Despite its general applicabil-
ity, this approach is modified to reflect the specific characteristics of
different service industries and can only be used with other forms of
quality measurement techniques. The SERVQUAL model is shown in
Figure 8.5.
Parasuraman et al. (1985) identified five gaps that can lead to service
quality failures:
1 Not understanding the needs of the customers.
2 Being unable to translate the needs of the customer into a
service design that can address them.

304 Strategic operations management
3 Being unable to translate the design into service expectations
or standards that can be implemented.
4 Being unable to deliver the services in line with specifications.
5 Creating expectations that cannot be met (gap between cus-
tomers’ expectations and actual delivery).
The task that the organization has, therefore, is in ensuring that these
gaps are closed in order for the ‘promise’ of the offer to be on a par
with the actual delivery. The various gaps are common, and an amusing
example is given in the following anecdotal perception of management
consultants.
Word of mouthcommunications
Personal needs Pastexperience
Expected service
Perceivedservice
Servicedelivery
Service qualityspecifications
Externalcommunications
to customers Gap 4
Gap 5
Gap 3
Managementperceptions of
customerexpectations
Gap 2
Gap 1
Figure 8.5
The SERVQUAL
model (source:
Parasuraman et al.,
1985).
SERVQUAL – an example
A reader sends the following story. A shepherd is tending his flock when a Jeep screeches to a halt beside him.The driver hops out and says: ‘If I tell you how many sheep you’ve got, will you give me one?’ The shepherdlooks him up and down.‘OK,’ he shrugs. The stranger takes out his laptop, plugs it into his mobile phone and,after a little work involving NASA websites and satellite readings, says: ‘The answer is 931.’ The shepherd nods. ‘Choose your sheep,’ he says.The stranger bundles the animal into his Jeep. ‘Now,’ says the shepherd.‘If I tell you what job you do, can I have it back?’ Sure, the stranger replies. ‘You’re a management consultant,’the shepherd says. ‘How did you know?’ the astonished stranger asks. ‘Easy,’ the shepherd says. ‘First, youcharged me a fortune. Second, you told me something I already knew. And third, you know nothing about mybusiness. Now please give me back my dog.’
Source: Financial Times, A flair for stating the obvious, 29 January 2003.
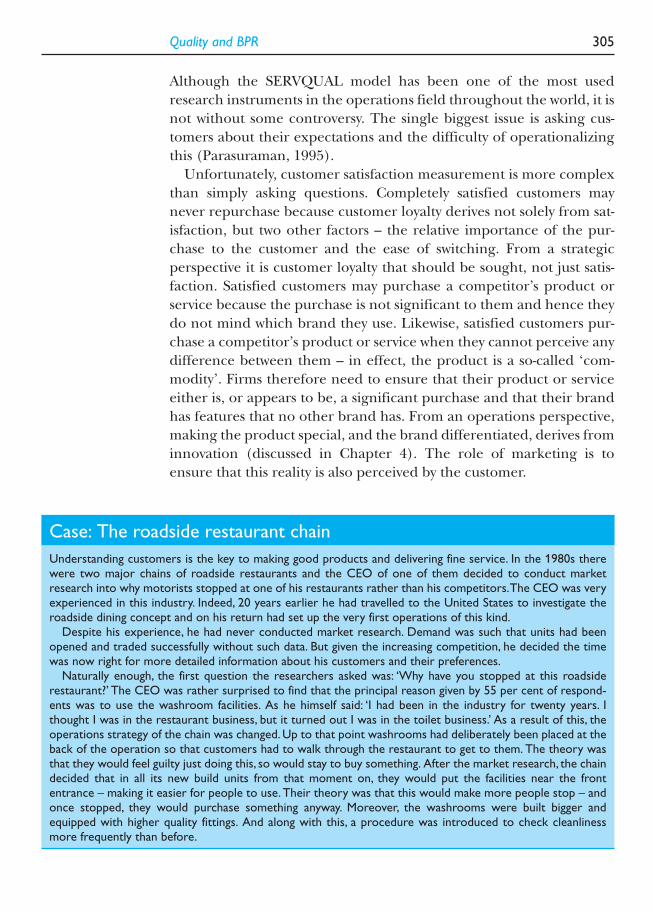
Quality and BPR 305
Although the SERVQUAL model has been one of the most used
research instruments in the operations field throughout the world, it is
not without some controversy. The single biggest issue is asking cus-
tomers about their expectations and the difficulty of operationalizing
this (Parasuraman, 1995).
Unfortunately, customer satisfaction measurement is more complex
than simply asking questions. Completely satisfied customers may
never repurchase because customer loyalty derives not solely from sat-
isfaction, but two other factors – the relative importance of the pur-
chase to the customer and the ease of switching. From a strategic
perspective it is customer loyalty that should be sought, not just satis-
faction. Satisfied customers may purchase a competitor’s product or
service because the purchase is not significant to them and hence they
do not mind which brand they use. Likewise, satisfied customers pur-
chase a competitor’s product or service when they cannot perceive any
difference between them – in effect, the product is a so-called ‘com-
modity’. Firms therefore need to ensure that their product or service
either is, or appears to be, a significant purchase and that their brand
has features that no other brand has. From an operations perspective,
making the product special, and the brand differentiated, derives from
innovation (discussed in Chapter 4). The role of marketing is to
ensure that this reality is also perceived by the customer.
Case: The roadside restaurant chain
Understanding customers is the key to making good products and delivering fine service. In the 1980s therewere two major chains of roadside restaurants and the CEO of one of them decided to conduct marketresearch into why motorists stopped at one of his restaurants rather than his competitors.The CEO was veryexperienced in this industry. Indeed, 20 years earlier he had travelled to the United States to investigate theroadside dining concept and on his return had set up the very first operations of this kind.
Despite his experience, he had never conducted market research. Demand was such that units had beenopened and traded successfully without such data. But given the increasing competition, he decided the timewas now right for more detailed information about his customers and their preferences.
Naturally enough, the first question the researchers asked was: ‘Why have you stopped at this roadsiderestaurant?’ The CEO was rather surprised to find that the principal reason given by 55 per cent of respond-ents was to use the washroom facilities. As he himself said: ‘I had been in the industry for twenty years. Ithought I was in the restaurant business, but it turned out I was in the toilet business.’ As a result of this, theoperations strategy of the chain was changed. Up to that point washrooms had deliberately been placed at theback of the operation so that customers had to walk through the restaurant to get to them. The theory wasthat they would feel guilty just doing this, so would stay to buy something. After the market research, the chaindecided that in all its new build units from that moment on, they would put the facilities near the frontentrance – making it easier for people to use. Their theory was that this would make more people stop – andonce stopped, they would purchase something anyway. Moreover, the washrooms were built bigger andequipped with higher quality fittings. And along with this, a procedure was introduced to check cleanlinessmore frequently than before.

Quality management – tools and techniques
Although we are dealing with strategic issues in quality, it is important
to be aware that quality tools and techniques can play an important
part in strategic quality. There are numerous texts that deal with the
tools of quality (see, for example, Oakland, 1994). There are ‘seven
basic tools’ of quality management:
1 Pareto analysis – this recognizes that it is often the case that
80 per cent of failures are due to 20 per cent of problems,
and therefore tries to find those 20 per cent and solve them
first.
2 Histograms – used to represent this information in visual form.
3 Cause and effect diagrams (fishbone charts or Ishikawa dia-
grams) – used to identify the effect and work backwards, through
symptoms to the root cause of the problem.
4 Stratification – identifying different levels of problems and
symptoms using statistical techniques applied to each layer.
5 Check sheets – structured lists or frameworks of likely causes
which can be worked through systematically. When new issues
are found, they are added to the list.
6 Scatter diagrams – used to plot variables against each
other and help identify where there is a correlation or other
pattern.
7 Control charts – use SPC information to start the analytical
process off, asking why these errors occur at this time.
Once a basic understanding of the problem and its contributing prob-
lems has been built up, other techniques for problem solving can be
introduced. Since the search is on for as many different ways as pos-
sible of dealing with the problem, techniques that support creative
problem solving are especially helpful here. Brainstorming and other
related techniques are often used. There are also many new and power-
ful tools associated with more advanced forms of approach linked to
the wider questions of quality management – sometimes referred to as
the ‘seven advanced tools’ of quality management. These include affin-
ity diagrams, relations diagrams, matrix diagrams, tree diagrams, arrow
diagrams, matrix data analysis and process decision progress charts. All
of these take a system-wide perspective and provide ways of relating dif-
ferent elements in the quality process. A full description of these tools
can be found in Shiba et al. (1993).
306 Strategic operations management

Quality and BPR 307
Beyond tools to ‘total’ quality management
So far we have looked at the process aspects of quality and some of the
tools that can enable its effective management. We now need to add
the third essential ingredient – the active involvement of people in the
process of quality control and improvement.
It is widely recognized that at the core of Japanese quality success has
been the idea of company-wide quality control (CWQC) – a theme origin-
ally articulated by Feigenbaum (1956). The basis of this concept is
to be able to design, produce and sell goods and services that satisfy
the customer’s requirements – and this takes us back to our initial defin-
itions of quality. But CWQC recognizes that there are many dimensions
to this, such as:
■ customer service;
■ quality of management;
Six Sigma
One of the recent ‘management revolutions’ being widely applied is ‘Six Sigma’. Although apparently a new concept this is, in fact, an approach built on well-founded total quality principles, applied within a disciplinedcompany-wide framework. Pioneered by GE in the USA, Six Sigma takes its name from a statistical term that measures how far a given process deviates from perfection.The central idea behind Six Sigma is that if you can measure how many ‘defects’ you have in a process, you can systematically figure out how to eliminatethem and get as close to ‘zero defects’ as possible.To achieve Six Sigma quality, a process must produce nomore than 3.4 defects per million opportunities. An ‘opportunity’ is defined as a chance for non-conformance,or not meeting the required specifications.
GE began moving towards a focus on quality in the late 1980s. A major employee involvement programmecalled ‘Work-Out’ established an approach that ‘opened our culture to ideas from everyone, everywhere,decimated the bureaucracy and made boundary-less behaviour a reflexive, natural part of our culture,thereby creating the learning environment that led to Six Sigma. Now, Six Sigma, in turn, is embedding qualitythinking – process thinking – across every level and in every operation of our Company around the globe’ (GE website, http://www.ge.com/sixsigma/).
At its core, Six Sigma revolves around a few key concepts:
■ Critical to quality – attributes most important to the customer.■ Defect – failing to deliver what the customer wants.■ Process capability – what your process can deliver.■ Variation – what the customer sees and feels.■ Stable operations – ensuring consistent, predictable processes to improve what the customer sees and feels.■ Design for Six Sigma – designing to meet customer needs and process capability.
Perhaps one of the key contributions to its success has been the highly disciplined approach taken to implementa-tion and ongoing measurement. Taking a framework from the martial arts, Six Sigma involves a rigorous trainingand development process in which capability is measured in terms of grades, from beginner through to black belt.
A number of discussion forums have been set up where detailed information on tools, techniques and case experiences can be found – see, for example, www.isixsigma.com or the American Society for Quality(www.sixsigmaforum.com/).

308 Strategic operations management
■ quality of company;
■ quality of labour;
■ quality of materials, techniques, equipment, etc.
Thus, quality becomes total quality, pervading everything both within
the organization (all departments and functions) as well as the firm’s
supply network. The development from inspection under the mass
production era, which we saw earlier, to TQM, reveals the increasing
strategic importance of quality. The scope of each stage of develop-
ment in quality is shown in Table 8.1.
TQM embraces the following points:
1 Top management commitment. In terms of ‘setting an example’
in their commitment to quality, particularly in terms of their
willingness to invest in training and other important features
of TQM.
2 Continuous improvement. Deming, Juran, Crosby and other quality
‘gurus’ may have slight differences in their actual approaches
to quality. What becomes a common denominator, though,
both for the ‘quality gurus’ and for firms involved in quality, is
that quality is a ‘moving target’ and therefore a firm must have
a strategic commitment to always improve performance (we
discuss this in more depth within this chapter).
3 All aspects of the business. The quality drive relates to all personnel
within the firm and also outside – all aspects of the supply chain.
Table 8.1Stages of development in quality and related activities
Stage of development Activities
Inspection Salvaging, sorting, grading and corrective actions
Quality control Quality manuals, product testing, basic qualityplanning, including statistics
Quality assurance Third-party approvals, advanced planning, systems audits, SPC
Company-wide QC Quality measured in all areas of the firm and employee involvement in continuous improvement
TQM Company-wide QC principles applied across the whole system and in proactive fashion, emphasizing elements like continuous improvement; involvement of suppliers and customers; employee involvement and teamwork
Developed from Brown (1996).

4 Long-term commitment. TQM is not ‘quick fix’ but, ideally, an
everlasting approach to managing quality. As each stage
developed – from inspection to TQM – the preceding stage
was included as part of the next stage. TQM therefore includes
company-wide quality control rather than ignoring it.
A key factor in translating senior commitment to quality into ‘front-
line’ operations comes from group-based activities, which provide a
focus for much of the powerful continuous improvement effort charac-
teristic of TQM. Originally termed quality circles, they represent a key
link between the mechanics of quality tools and techniques and the
behavioural components that make a living, developing quality system.
Quality circles
The origins of this approach lay in Japanese work in a number of dif-
ferent contexts; despite this variety there is considerable convergence
around what makes for an effective quality circle (QC) and the core
elements are simple. It involves a small group (five to ten people) who
gather regularly in the firm’s time to examine problems and discuss
solutions to quality problems. They are usually drawn from the same area
of the factory and participate voluntarily in the circle. The circle is usually
chaired by a foreman or deputy and uses SQC methods and problem-
solving aids as the basis of their problem-solving activity. An important
feature, often neglected in considering QCs, is that there is an element
of personal development involved, through formal training but also
through having the opportunity to exercise individual creativity in con-
tributing to improvements in the area in which participants work.
The basic activity cycle of a QC goes from selection of a problem
through analysis, solution generation, presentations to management
and implementation by management. Once the problem is analysed
and the root problem identified, ways of dealing with it can be identi-
fied. The valuable techniques here include brainstorming (in its many
variants) and goal orientation. However, it is important that the struc-
ture and operation of the group support suggestions from anyone
(irrespective of levels in the organization, functional or craft skills
background, etc.) and allow for high levels of creativity – even if some
of the ideas appear wild and impractical at the time. The principles of
brainstorming, especially regarding expert facilitation and enforce-
ment of a ‘no criticism’ rule during idea generation sessions, are
important.
Quality and BPR 309

310 Strategic operations management
The circle does not have to confine itself to current problems –
it can also involve itself in forecasting. Here, the possible future
problems resulting from each stage can be anticipated and explored,
perhaps employing failure mode effects analysis (see above). Finally,
the group presents the solution to management, who are expected to
implement it. A key success factor in QCs’ survival and effectiveness is
the willingness of management to be seen to be committed to the prin-
ciples of TQM and to act on suggestions for improvement.
Small group activity of this kind is a powerful way of moving quality
forward, but it is not the only vehicle for involvement. Many variants
have emerged, ranging from large group/task force approaches to
individual problem-solving approaches, and there is a need to match
the selection of methods to the particular culture and operations of
the firm. Another important aspect is the extent to which such groups
are ‘in line’ as opposed to ‘off line’ (as the early QCs were); evidence
suggests that strategic quality improvement only takes place when it
becomes part of the day-to-day operations of the business.
Continuous improvement (CI)
The underlying principle of continuous improvement is philosophically
clear – and well expressed in the Japanese phrase ‘best is the enemy of
better’. Rather than assuming a single big hit change will deal with the
elimination of waste and the causes of defects, CI posits a long-term sys-
tematic attack on the problem. A metaphor for this is the gradual wear-
ing down of stone through the continuous dripping of water on to it
from above – it doesn’t happen overnight but the cumulative effect is as
effective as a powerful drill. In the context of quality management, CI has
come to mean not only this process of continuous attack on problems,
but also the involvement of as many people as possible in the process. It
could, perhaps, be more accurately called ‘high involvement innovation’,
since it is about getting the majority of people in an organization to con-
tribute, at least at the level of regular incremental innovation.
There is, of course, no reason why people cannot participate in this
process. After all, they are all equipped with sophisticated problem-
finding and -solving capabilities – a point well expressed by one man-
ager, who commented ‘the beauty of it is that with every pair of hands
you get a free brain!’ Nor is there now a difficulty of lack of evidence –
organized systems for engaging such commitment are commonplace
now and have in fact been around in documented form since the
nineteenth century (Bessant, 2003).
Quality and BPR 311
But making CI happen is easier said than done. Early attempts to
emulate Japanese success in the West often led to disillusionment –
firms set up problem-solving teams and invested heavily in training
all their staff in the relevant tools and techniques, only to find their
programmes had run out of steam some 6 months later. These days, it
has become clear that introducing and embedding the new behaviour
patterns that make up CI is something that takes time and effort – and
there is no magic bullet that will achieve this overnight.
The CI journey
In today’s turbulent business environments, everyone is looking for
continuous improvements in the products and services that they offer
and the ways in which they produce them. Whether these come through
the occasional ‘big bang’ breakthrough innovation or through the
more typical incremental improvements and adjustments, constant
change is essential, not just to remain competitive but often for the sur-
vival of the business itself.
Work in the CIRCA programme1 in the UK has been concerned with
trying to understand the geography of this journey, and with trying to
make up some basic maps that organizations can use to position them-
selves and guide their next steps. It has also been concerned with col-
lecting and identifying useful resources that can be used to overcome
the different kinds of obstacles that get in the way of moving down the
CI road.
A roadmap for the journey
As far as the roadmap is concerned, the research has developed a model
composed of five levels or stages of evolution of CI. Each of these takes
time to move through, and there is no guarantee that organizations will
progress to the next level. Moving on means having to find ways of over-
coming the particular obstacles associated with different stages.
The first stage – level 1 – is what we might call ‘unconscious CI’.
There is little, if any, CI activity going on, and when it does happen it is
1CIRCA � Continuous Improvement Research for Competitive Advantage, a 5-yearindustry-based research programme based at the University of Brighton, and sup-ported by the Department of Trade and Industry and the Engineering and PhysicalSciences Research Council. Over 100 organizations have been involved in experience-sharing research aimed at improving understanding and practice of CI.

essentially random in nature and occasional in frequency. People do
help to solve problems from time to time – for example, they will pull
together to iron out problems with a new system or working proced-
ure, or getting the bugs out of a new product. But there is no formal
attempt to mobilize or build on this activity, and many organizations
may actively restrict the opportunities for it to take place. The normal
state is one in which CI is not looked for, not recognized, not sup-
ported – and often, not even noticed. Not surprisingly, there is little
impact associated with this kind of change.
Level 2, on the other hand, represents an organization’s first serious
attempts to mobilize CI. It involves setting up a formal process for finding
and solving problems in a structured and systematic way – and training
and encouraging people to use it. Supporting this will be some form of
reward/recognition arrangement to motivate and encourage con-
tinued participation. Ideas will be managed through some form of system
for processing and progressing as many as possible and handling those
that cannot be implemented. Underpinning the whole set-up will
be an infrastructure of appropriate mechanisms (teams, task forces or
whatever), facilitators and some form of steering group to enable CI to
take place and to monitor and adjust its operation over time. None of
this can happen without top management support and commitment of
resources to back that up.
Level 2 is all about establishing the habit of CI within at least part of
the organization. It certainly contributes improvements but these may
lack focus and are often concentrated at a local level, having minimal
impact on more strategic concerns of the organization. The danger in
such CI is that, once having established the habit of CI, it may lack any
clear target and begin to fall away. In order to maintain progress there
is a need to move to the next level of CI – concerned with strategic
focus and systematic improvement.
Level 3 involves coupling the CI habit to the strategic goals of the
organization such that all the various local level improvement activities
of teams and individuals can be aligned. In order to do this, two key
behaviours need to be added to the basic suite – those of strategy deploy-
ment and of monitoring and measuring. Strategy (or policy) deploy-
ment involves communicating the overall strategy of the organization
and breaking it down into manageable objectives towards which CI
activities in different areas can be targeted. Linked to this is the need
to learn to monitor and measure the performance of a process and use
this to drive the continuous improvement cycle.
Level 3 activity represents the point at which CI makes a significant
impact on the bottom line – for example, in reducing throughput
312 Strategic operations management

Quality and BPR 313
times, scrap rates, excess inventory, etc. It is particularly effective in
conjunction with efforts to achieve external measurable standards (such
as ISO 9000), where the disciplines of monitoring and measurement
provide drivers for eliminating variation and tracking down root cause
problems. The majority of ‘success stories’ in CI can be found at this
level – but it is not the end of the journey.
One of the limits of level 3 CI is that the direction of activity is still
largely set by management and within prescribed limits. Activities may
take place at different levels, from individuals through small groups to
cross-functional teams, but they are still largely responsive and steered
externally. The move to level 4 introduces a new element – that of
‘empowerment’ of individuals and groups to experiment and innovate
on their own initiative.
Clearly, this is not a step to be taken lightly, and there are many situ-
ations where it would be inappropriate – for example, where established
procedures are safety critical. But the principle of ‘internally directed’
CI as opposed to externally steered activity is important, since it allows
for the open-ended learning behaviour that we normally associate with
professional research scientists and engineers. It requires a high degree
of understanding of, and commitment to, the overall strategic objectives,
together with training to a high level to enable effective experimenta-
tion. It is at this point that the kinds of ‘fast learning’ organizations
described in some ‘state-of-the-art’ innovative company case studies
can be found – places where everyone is a researcher and where know-
ledge is widely shared and used.
Level 5 is a notional end-point for the journey – a condition where
everyone is fully involved in experimenting and improving things, in
sharing knowledge and in creating the complete learning organiza-
tion. No such organization exists in our experience, but it represents
the ideal towards which CI development can be directed. Table 8.2
illustrates the key elements in each stage.
Learning continuous improvement
Moving along this journey is not a matter of time serving or even of
resources – though without resources it is unlikely that things will get
any further than a car without petrol can be expected to. But the
essence of progress along the CI road is learning – acquiring, practising
and repeating behaviours until they become ingrained as ‘the way we
do things round here’ – the culture of the organization.
The basic behaviour patterns or routines that have to be learned are
outlined in Table 8.3.

314 Strategic operations management
Learning these behaviours begins with moving to a new level and
then involves extensive broadening out and modifying within the level.
There are plenty of problems to solve and bugs to iron out – but even-
tually there comes a point where a move to the next level is required.
At this point, the organization needs to take a step back and reconfig-
ure its approach to CI – and doing this involves learning of a differ-
ent kind.
In both cases, learning is not only about practising behaviours – it is
also about finding ways of overcoming blockages at particular points.
But learning isn’t easy – and many organizations don’t learn at all.
Others get blocked at particular points and never move on from there –
which goes a long way to explaining why so many CI programmes,
despite early enthusiasm and commitment, eventually peter out.
Table 8.2Stages in the evolution of continuous improvement capability
Stage of development Typical characteristics
(1) ‘Natural’/background CI Problem solving randomNo formal efforts or structureOccasional bursts punctuated by inactivity and non-participationDominant mode of problem solving is by specialistsShort-term benefitsNo strategic impact
(2) Structured CI Formal attempts to create and sustain CIUse of a formal problem-solving processUse of participationTraining in basic CI toolsStructured idea management systemRecognition systemOften parallel system to operations
(3) Goal-oriented CI All of the above, plus formal deployment of strategic goalsMonitoring and measurement of CI against these goalsIn-line system
(4) Proactive/empowered CI All of the above, plus responsibility for mechanisms,timing, etc., devolved to problem-solving unitInternally directed rather than externally directed CIHigh levels of experimentation
(5) Full CI capability – the CI as the dominant way of lifelearning organization Automatic capture and sharing of learning
Everyone actively involved in innovation processIncremental and radical innovation

Quality and BPR 315
Table 8.3Behavioural patterns in continuous improvement
Ability Constituent behaviours
‘Getting the CI habit’ – developing the ■ People make use of some formal problem-finding ability to generate sustained involvement and -solving cyclein CI ■ People use appropriate simple tools and
techniques to support CI■ People begin to use simple measurement to shape
the improvement process■ People (as individuals and/or groups) initiate and
carry through CI activities – they participate in theprocess
■ Ideas are responded to in a clearly defined and timely fashion – either implemented or otherwise dealtwith
■ Managers support the CI process through allocation of time, money, space and other resources
■ Managers recognize in formal (but not necessarily financial) ways the contribution of employees to CI
■ Managers lead by example, becoming actively involved in design and implementation of CI
■ Managers support experiment by not punishing mistakes but by encouraging learning from them
‘Focusing CI’ – generating and sustaining ■ Individuals and groups use the organization’s the ability to link CI activities to the strategic goals and objectives to focus and prioritize strategic goals of the company improvements
■ Everyone understands (i.e. is able to explain) what the company’s or department’s strategy, goals and objectives are
■ Individuals and groups (e.g. departments, CI teams)assess their proposed changes (before embarking oninitial investigation and before implementing a solution)against departmental or company objectives to ensurethey are consistent with them
■ Individuals and groups monitor/measure the results oftheir improvement activity and the impact it has onstrategic or departmental objectives
■ CI activities are an integral part of the individual orgroup’s work, not a parallel activity
‘Spreading the word’ – generating the ■ People co-operate across internal divisions (e.g.ability to move CI activity across cross-functional groups) in CI as well as working in organizational boundaries their own areas
■ People understand and share an holistic view (processunderstanding and ownership)
■ People are oriented towards internal and externalcustomers in their CI activity
■ Specific CI projects with outside agencies –customers, suppliers, etc. – are taking place
■ Relevant CI activities involve representatives fromdifferent organizational levels
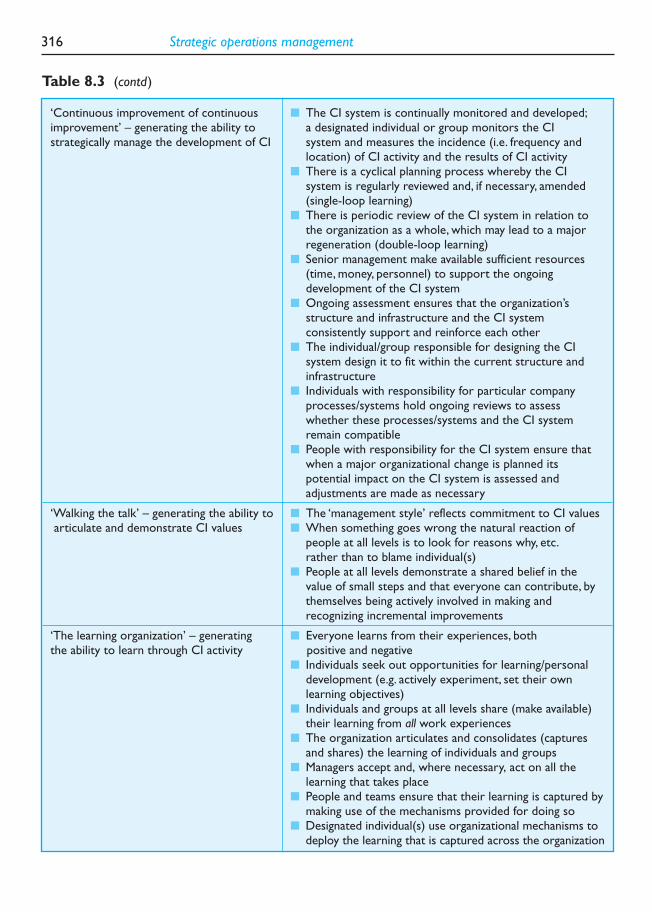
316 Strategic operations management
‘Continuous improvement of continuous ■ The CI system is continually monitored and developed;improvement’ – generating the ability to a designated individual or group monitors the CI strategically manage the development of CI system and measures the incidence (i.e. frequency and
location) of CI activity and the results of CI activity■ There is a cyclical planning process whereby the CI
system is regularly reviewed and, if necessary, amended(single-loop learning)
■ There is periodic review of the CI system in relation tothe organization as a whole, which may lead to a majorregeneration (double-loop learning)
■ Senior management make available sufficient resources(time, money, personnel) to support the ongoingdevelopment of the CI system
■ Ongoing assessment ensures that the organization’sstructure and infrastructure and the CI systemconsistently support and reinforce each other
■ The individual/group responsible for designing the CIsystem design it to fit within the current structure andinfrastructure
■ Individuals with responsibility for particular companyprocesses/systems hold ongoing reviews to assesswhether these processes/systems and the CI systemremain compatible
■ People with responsibility for the CI system ensure thatwhen a major organizational change is planned itspotential impact on the CI system is assessed andadjustments are made as necessary
‘Walking the talk’ – generating the ability to ■ The ‘management style’ reflects commitment to CI valuesarticulate and demonstrate CI values ■ When something goes wrong the natural reaction of
people at all levels is to look for reasons why, etc.rather than to blame individual(s)
■ People at all levels demonstrate a shared belief in thevalue of small steps and that everyone can contribute, bythemselves being actively involved in making andrecognizing incremental improvements
‘The learning organization’ – generating ■ Everyone learns from their experiences, both the ability to learn through CI activity positive and negative
■ Individuals seek out opportunities for learning/personaldevelopment (e.g. actively experiment, set their ownlearning objectives)
■ Individuals and groups at all levels share (make available)their learning from all work experiences
■ The organization articulates and consolidates (capturesand shares) the learning of individuals and groups
■ Managers accept and, where necessary, act on all thelearning that takes place
■ People and teams ensure that their learning is captured bymaking use of the mechanisms provided for doing so
■ Designated individual(s) use organizational mechanisms todeploy the learning that is captured across the organization
Table 8.3 (contd)

Quality and BPR 317
Roadblocks and obstacles – and ways round them
Our research suggests that there are several helpful enabling resources
for overcoming blocks to learning at different stages in the CI journey.
Some examples are given in Table 8.4.
In the driving seat – managing the journey to CI
Creating a continuous improvement culture is not something that can
be done overnight. Nor is it something that can be created by order.
‘Culture’ is essentially something that people ‘buy into’ and create for
themselves as the accepted set of behaviour patterns which define ‘the
way we do things around here’. It takes time to establish, and it needs
reinforcing with artefacts – structures, procedures, symbols, etc. – which
help give it form. Doing this is particularly hard with CI because it
involves not just learning and reinforcing new behaviours, but also a fair
measure of ‘unlearning’ of old ones.
Table 8.4Enablers for continuous improvement
Behaviour/routines Blockage Enablers
Getting the CI habit No formal process for finding PDCA or similar structured model plus and solving problems training on real problemsIdeas are not responded to Simple idea management system, based
on rapid responseLack of skills in problem solving Training in simple CI tools –
brainstorming, fishbone techniques, etc.Lack of motivation Recognition systemNo structure for CI Simple vehicles, based on groupsLack of group process skills Facilitator training
Focusing CI No strategic impact of CI Focus problem solving on strategic targets/policy deployment
No measurement of benefits Process monitoring and measurement
Spreading the word Lack of co-operation across Cross-functional CI teamsdivisionsLack of process orientation Process modelling tools and training
Walking the talk Conflict between espoused Articulation and reviewand practised values
The learning organization No capture of learning Post-project reviewsStoryboard techniquesEncapsulation in procedures
Continuous improvement of Lack of direction Formal CI steering group and strategic continuous improvement framework
Running out of steam Regular CI review and relaunch

318 Strategic operations management
It is possible to make progress along the CI journey – as an increasing
number of organizations have discovered to their advantage. The main
requirement is to recognize the need to drive the vehicle along the
road – there is no ‘automatic pilot’ but instead a need for consciously
steering the process in strategic fashion.
Such a strategic approach needs a map – and some sense of where
we are and where we are trying to get to next. This chapter has outlined
a simple roadmap which organizations can use to help orientate them-
selves and plan for the next steps along the journey. Such positioning
can be helped by external or self-assessment to provide a more accur-
ate picture of the current position and what needs to be done next;
the CIRCA project has developed one such tool that is currently being
tested in a number of organizations. Other frameworks are also avail-
able – for example, the various quality awards or the software develop-
ment model.
Moving down the road involves identifying obstacles and deploying
suitable enablers to help deal with them. There are no standard solu-
tions to dealing with these – each organization needs to work out its
own particular variant. Evidence from practice suggests that the obs-
tacles encountered at different stages are broadly similar and can be
anticipated. More importantly, there are many robust enabling resources
that can be adapted and developed to help deal with these.
Continuous reconfiguration
Perhaps one final point should be made in considering implementation.
There is extensive evidence that TQM often falters or even disappears
after the initial ‘honeymoon’ period after its implementation. This can
be for many reasons, but it highlights the problem of maintaining
momentum. Work by UK researchers on this question suggested that
there are many different approaches to TQM and at least three com-
mon entry points can be identified. The first is what they term ‘vision-
led TQM’ and is characterized by a vision-led process usually starting at
the top of the organization. This has powerful impact in terms of ener-
gizing the rest of the organization, and is usually accompanied by sig-
nificant input of resources for training and implementation. Its major
weakness is that the vision may not be sufficient to sustain interest and
there may not be sufficient structural underpinning to embed TQM in
the organization’s culture – ‘the way we do things around here’. It also
tends to be highly dependent on a senior manager as champion and
when he or she moves on the initiative may falter.

A second approach is what is termed ‘planned TQ’, in which there is
a formal planned and structured approach to implementation. This kind
of initiative often originates with those responsible for quality stand-
ards, etc., and can be most closely linked to the kind of efforts made
in seeking to obtain ISO 9000 or similar approvals. These approaches
have the strength of structure and measurement, but may lack the
overall motivation to involve and retain people in the quest for quality
improvement.
Third is the approach termed ‘training TQM’, which tends to emerge
from the human resources concerns of the business. Recognition that
people can offer much more than just involvement as pairs of hands
has led to a reappraisal of roles and mechanisms, and a concern with
developing individual skills and competence. This kind of approach
typifies much of the effort made to create ‘learning organizations’ and
is empowering at the individual level. Its main weakness in respect of
TQM is that it creates involvement but may lack the strategic direction
and vision, and the structure and measurement frameworks, necessary
to engage long-term systematic improvement.
Each of these components has much to offer, and most existing TQM
programmes can be grouped under one or other of them. Ideally, long-
term sustainable TQM depends on elements of all three, and the abil-
ity to switch between different modes in a continuous development
cycle. This last approach – which essentially involves continuous moni-
toring and change of the change programme itself – is called ‘trans-
formational TQM’.
From the above, it is clear that, in the main, success in implementing
a quality improvement programme depends upon the extent to which
it is seen as a total activity, running company-wide and involving every-
one in ownership of the quality problem and responsibility for solving
it. Unfortunately, it lends itself to extensive partial innovation of the
substitution variety, using more advanced techniques or tools to sup-
port local functions only, or using them in an isolated way, rather than as
part of a company-wide package of change. In particular, the challenge
to changing the culture of the organization is often shirked – not just
because of the considerable effort that this involves, but also because
of the perceived threats to the status quo.
In the end, the organization and management of quality requires a
new kind of organization, one which communicates and owns the
problem in integrated form. This model is similar to the one we saw
earlier for supporting advanced and integrated IT applications, involv-
ing similar patterns of networking, of decentralization of responsibility
within an integrated framework, where people own the problem and
Quality and BPR 319

320 Strategic operations management
share in solving it. Rather than emphasizing structures, processes and
a culture that is geared to doing the same thing, day after day, the new
organization needs to find ways of becoming a ‘learning organization’
able to adapt and develop in a cycle of continuous improvement.
Problems with TQM and the emergence of business process re-engineering
In spite of the compelling evidence for firms to adopt and remain com-
mitted to quality, it remains clear that it is difficult to sustain. This is
brought out in the following (McAbe and Wilkison, 1998):
The 1990s have not been good to TQM: A survey of 500 executives in
US manufacturing and service firms indicated that ‘only one-third
believe that TQM made them more competitive’ … a survey of 100
British firms that had implemented quality programs found that only
one-fifth believed that their programs had ‘a significant impact’ … an
American Electronics Association survey revealed that use of TQM by
member firms dropped from 86 per cent in 1988 to 73 per cent in
1991 and that 63 per cent of the firms reported that TQM failed
to reduce defects by 10 per cent or more, even though they had
been in operation for almost 21⁄2 years on average. … McKinsey &
Company found that two-thirds of the TQM programs it examined
had simply ground to a halt because they failed to produce expected
results. At the same time, widely acclaimed TQM programs began
to stumble:
Florida Power and Light, winner of Japan’s prestigious Deming Prize
for Quality Management, slashed its quality department staff from 85
employees to three after group chairman James L. Broadbent found
that many employees feared that the ‘quality improvement process
had become a tyrannical bureaucracy’. … And the Wallace Company, a
Malcolm Baldridge National Quality Award winner, filed for Chapter 11
bankruptcy protection.
At the beginning of the 1990s, business process re-engineering (BPR)
emerged as a threat to quality. BPR is not meant to be the same as, or
a replacement for, TQM. Although both TQM and BPR are strategic in
scope, BPR has more fundamental consequences in terms of immediate –
and sometimes radical – outcomes. There is some confusion about
BPR, so let’s revisit the definition of BPR from Hammer and Champy

(1993), who coined the term business process engineering. They defined
business process re-engineering (BPR) as:
… the fundamental rethinking and radical redesign of business
processes to achieve dramatic improvements in critical, contemporary
measures of performance such as cost, quality, service and speed.
[p. 32]
These are important issues and the words are dramatic: fundamental
rethinking ; radical redesign; dramatic improvements. As we saw earlier, many
firms have failed with TQM, and BPR took over from TQM as the most
popular topic in the business press from early 1993 onwards (De Cock
and Hipkin, 1997). Bearing in mind that the first major article on BPR
appeared in 1990, probably no other single managerial innovation
has acquired quite so much attention in such a short period as BPR.
For example, in a 1993 survey of 224 North American senior business
executives, BPR was listed as the most important management issue, and
72 per cent of those surveyed had committed to BPR in their organiza-
tion (Conti and Warner, 1994). A large survey published in 1997 (Gemini
Consulting, 1997) found that 782 companies would remain committed
to, and would continue to invest in, BPR initiatives in spite of the neg-
ative reactions against BPR that had begun to appear in the business
press. In fact, 70 per cent of the companies that had already under-
gone re-engineering fully expected to maintain or add still further to
their present re-engineering budgets. However, only 47 per cent of the
respondents reported revenue growth and only 37 per cent succeeded
in increasing their market share.
BPR attempts to concentrate the firm on what it does best. In that
sense, it has links with the profoundly important notions of focus, core
competencies and resource-based approaches to strategy. However, the
problem can be that, in the name of right-sizing, the brain of the firm –
the essential expertise and know-how upon which core competencies
must depend – can undergo a corporate lobotomy. The Economist picked
out some of the dangers with this when it stated:
In the end, even the re-engineers are re-engineered. At a recent
conference held by Arthur D. Little, a consultancy, representatives
from 20 of America’s most successful companies all agreed that
re-engineering, which has been tried by two-thirds of America’s biggest
companies and most of Europe’s, needs a little re-engineering of its
Quality and BPR 321

own. … As well as destroying morale, this approach leads to ‘corporate
anorexia’, with firms too thin to take advantage of economic upturns.
Can TQM and BPR be combined? Some think so (Lee and Asllani,
1997, p. 5):
In today’s challenging economic climate, many organizations have come
to realize that improved quality is an essential entry ingredient for
successful global competition.Total quality management (TQM) is based
on a broad organizational commitment to make continuous quality
enhancements in products and services for customers over a long term.
Business process re-engineering (BPR) allows for radical changes in
organizational processes intended to make quantum leaps in
performance by taking advantage of the advances in the information and
telecommunication technology. While they seem to be two completely
opposite approaches,TQM and BPR can well be combined into the
‘endless quality improvement’ concept.
However, it is mighty difficult for firms who, having promised
empowerment and involvement from the workforce in TQM, then cut
out large numbers within the firm in the name of re-engineering and
expect wonderful commitment from the workforce.
Looking forward …
From the above discussion it is clear that even the most advanced firms
still have a long way to go on their journey towards TQM. For this
reason, much of the future direction is likely to involve work towards
integrating TQM into the daily life of the firm rather than seeing it as
a special initiative or a fashion. There are also some specific areas in
which we can see new challenges emerging for thinking about quality
and how it can be built into strategic operations work.
One area is clearly in the kind of environment that is non-repetitive
in nature. Much of the theory of quality comes from work with processes
that are by their nature reproduced many times – for example, the oper-
ations in a mass production factory. There is a sizeable and growing
part of economic activity that is not dealing with this kind of work, but
rather with one-off transactions or short-run work. Examples include
most construction work, engineering prototypes, custom design and
delivery of services, etc. Here the challenge is one of capturing learning
322 Strategic operations management

Quality and BPR 323
rapidly and transferring it to new environments through generic pro-
cedures and principles. Many professionals work on this kind of approach,
but there has been little work on routinizing it such that it can under-
pin quality improvement in project-type businesses.
A second area for further development lies in the field of non-
production environments. Most of the attention in TQM has been in the
direct manufacturing area or in services at the point of delivery – e.g. in
customer care programmes. But many indirect activities support these –
for example, R&D, finance, order processing, etc., and the challenge
is to take TQM principles into these environments. This will mean
adapting tools, mechanisms and structures, and looking for ways to motiv-
ate and involve different groups. For example, the R&D challenge is
partly one of engaging the interest and commitment of professionals who
often believe that they already practise TQM and have no need to join in
more formal approaches. The future is also likely to see much more
emphasis on building quality in from the design of products and services.
Finally, a major area for development lies in the concept of inter-
organizational TQM. There is growing recognition of the need to
think not just of operations within a business, but in terms of the over-
all value stream. Improving performance of a system such as this can
employ the principles of TQM, but new tools and techniques need to
be developed to help deal with some of the issues involved in develop-
ing the new relationships needed to underpin such work.
If the original driver for quality in the early 1980s was increased
levels of competition, the key question has to be: is competition greater
now than before? The answer is undoubtedly ‘yes’ and for this reason
alone it is clear that organizations need to be very serious about qual-
ity in the modern business world. Quality is not a fad or a fashion, nor
has it been replaced by BPR or other alternatives. The best organiza-
tions are those that remain committed to quality and strive for continu-
ous improvement in their operations in order to meet or exceed
customer expectations.
Case: Marvellous motors
This Japanese firm is a major conglomerate with key interests in aerospace and motor vehicles. Eighty per centof sales now come from the automotive business and this is the prime source of growth for the company.However, the high value of the yen has hit exports hard, to the point that the company made a loss in 1990.They have responded to this crisis by systematic deployment of continuous targeted improvement, with threecore themes:
1 development of new, attractive products;2 maintaining productivity levels;3 reconstruction of the company from within.

324 Strategic operations management
The long-term programme includes simultaneous attack on quality improvement, cost reduction employeemotivation and increased education and training, and the specific ‘stretch’ targets are:
■ zero defects;■ zero accidents;■ zero breakdown;■ 20 per cent increase in labour productivity.
The pillars on which these are to be achieved are:
■ jishu hozen – voluntary operator inspection and maintenance;■ kaizen teian – individual improvement activities;■ education and training;■ planned maintenance;■ development management;■ quality maintenance activities, including ISO 9000;■ tool/mould/die maintenance management aimed at zero defects and breakdowns.
They began by setting up separate task forces to deal with each area, and developed a formal structure aimedat promoting TQM; in particular, they emphasized ‘total productive maintenance’ (TPM), which targeted qual-ity improvements around machine reliability and availability. The results undoubtedly helped in their recoveryfrom losses by the end of 1995; examples of gains include a reduction in breakdowns per month across theirmajor manufacturing site of 96 per cent (from over 5000 in 1992 to 194 in 1996).
As with other Japanese companies, the 3-year mid-term plan is the key mechanism for focusing and refocusing attention in continuous improvement. In this case, the recent plans have involved three main themesover the past decade:
1 TQM aimed at increasing productivity and quality.2 TPS (Toyota Production System) aimed at waste reduction.3 TPM aimed at obtaining high machine efficiency and availability, and at increasing production rates through
more reliable plants.
Visualization of this is important; the dominant image is one of ‘equipment and operator upgrading’. There arestoryboards and display boards throughout the factory, including a master chart, which is a giant Gantt charttracking progress to date and plans for the future. Each work group meets daily and this take place aroundtheir own storyboard.
The implementation of TPM includes a number of components:
■ daily review and improvement cycle – i.e. high frequency of small innovations;■ small and regular inputs of training – ‘one-point lesson system’;■ motivation events;■ individual kaizen teian (small and simple to implement) activities;■ small group kaizen (successors to quality circles);■ five-S activities to ensure workplace cleanliness and order;■ preventive maintenance analysis;■ design for maintenance;■ ‘zero orientation’ – no tolerance for waste, defects, stoppages, etc., as the target;■ step-by-step approach;■ voluntary participation and high commitment.
The implementation of TPM involves a 5-year programme spanning two mid-term planning periods. Part 1 ranfrom 1992 to 1995 and was designed to introduce the basic TPM mechanisms; activities included awarenessand training and practice to embed the behavioural routines. Part 2 – the current phase – involves aiming forthe Japanese Production Management Association’s Special Award for TPM. Significantly, the company is usingvery clear behaviour modelling approaches – articulating the desired behaviours and systematically reinforcingthem to the point where they become routines.

Quality and BPR 325
Policy deployment is the link between these broad objectives and the specific improvement activities at shopfloor level. For each of the eight pillars of TPM there are specific targets that can be decomposed into improve-ment projects. For example, ‘maintain your machine by yourself ’, ‘increase efficiency of machine to the limit’or ‘reduce start-up times’. These vague signposts are quantified and analysed in terms of how they can beachieved and the problems that would have to be solved to make that happen – using simple tools such as fivewhys and fishbone charts. Diagnosis is top down in terms of setting the actual numerical targets or the extentto which operators can maintain their own machines; a team of specialist engineers carries this out.
As with other plants there is a step-by-step process for increasing capability in TPM, and this is linked totraining inputs. For example:
Step 1 clean up your machineStep 2 learn to detect different sensitive pointsStep 3 develop a procedure for lubrication and cleaning workStep 4 total inspection and check of different key pointsStep 5 autonomous inspectionStep 6 adjustment and orderingStep 7 execution of this in self-management (unsupervised) mode
The company places strong emphasis on mechanisms for embedding these behaviours in the culture so thatthey become the way things are done and taught to others. An important aspect of Part 2 – the current mid-term plan – is to find mechanisms for doing this.These include extensive use of training and development – forexample, each employee receives 10 hours initial training in TPM and then 3 hours/month additional trainingon the job. They are also allocated 30 minutes per day to carry out their individual maintenance and to learnand improve this.
In addition to this operator development and individual improvement there are also CI projects in particularareas on which groups work in team mode – for example, projects on sputterless welding or cleaning enginecoolant,which involve consistent attack on problem areas over a period of weeks or months. Activities of this kindhave led to, for example,major set-up time reductions; the Komatsu 1000-tonne presses take less than 10 minutesto change and are changed four or five times per shift. Projects of this kind tend to take around 3 months.
There are some thirty-odd groups working – ten to fifteen in trim, twelve in body and assembly, and six toeight in the press shop. Group leaders spend half their time with the groups, facilitating, training, etc., and theremainder acting as a floating resource to cover sickness, holidays, etc.
The evolution of kaizen has been through early team activities going back 20 or more years. Individual kaizen
teian ideas did not come through at first, so a campaign was launched with the theme of ‘what makes your jobeasier?’; prior to that the focus was outside the individual operator’s own job area. The evolution of suggestionscan be seen in data collected by the Japanese Human Relations Management Association, which suggest that onthe site there is now 100 per cent participation of the ‘eligible employees’ (around 85 per cent of the total work-force). Of their suggestions, around 88 per cent are implemented, giving a 1995–6 saving of around Y3.2bn.
At present they are receiving around twenty suggestions per employee per month. One of the difficultiesraised by the generation of some 40 000 suggestions per month is how to process them; this is primarily theresponsibility of the group leader. Many of the ideas are minor changes to standard operating procedures andforemen/team leaders are authorized to make these. Ideas are judged against four levels as below:
Level Reward Volume
1 – high level, considerable 150 000Y upwards only 4–5 per yearpotential benefits and judged by senior management team
2 – again reviewed by senior medium – 10 000Y plus 20/yearteam
3 – basic, handled by team leader 300Y4 – minor, recognized to encourage 50Y
continuous improvement activity

326 Strategic operations management
The importance of recognizing and rewarding the low-level simple ideas was expressed by one manager: ‘If we don’t encourage fertile soil at the bottom, we’ll never get the high grade ideas later.’ Motivation is alsosecured by strong top-level commitment. When the TPM programme was launched, the first stage built on five-S principles and involved cleaning up machinery and plant.The plant director held a site briefing explaininghis concern and the ideas behind TPM, and then led the setting up of a ‘section chief ’s model line’, which wasa line cleaned up and improved by all the senior managers as a demonstration. Symbolically, the plant directorwas the first to pick up a broom and begin the process. The line was followed by an ‘assistant chief’s modelline’, again to reinforce the commitment top down.
Summary
■ Quality has moved from being an ‘optional extra’, something you could have if you were prepared to pay forit – to an essential feature of the products and services that we consume. International competitivenessdepends not only on price factors but also on non-price factors, and quality is the first and most essential ofthese. So a crucial challenge for the strategic operations manager is to ensure that the design of such prod-ucts and services – and the management of the operations that go into their creation and delivery – ensuresquality. The framework for doing this involves a combination of strategy, tools, procedures, structures andemployee involvement, and is conveniently grouped under the heading of ‘total quality management’. In thischapter we have tried to trace the development of this approach and describe its key components.
■ In many ways, the biggest challenge in TQM is not in the components but in their implementation. Evidenceshows that although companies recognize the quality imperative, they are not always able to respond – orif they do they have difficulties in sustaining such performance for the long haul. Building total quality oper-ations and sustaining them in the long term so that they become part of the organization’s culture – ‘theway we do things around here’ – is still the biggest challenge, and one to which strategic operations managers can make a major contribution.
Key questions
1 ‘Quality is free!’ proclaimed the title of Philip Crosby’s book in
the 1970s. In what ways can investments in developing quality
management in the business pay for themselves and make a dif-
ference to the overall bottom line of the company?
2 ‘Total’ quality management involves an integrated approach, com-
bining tools, strategy, structure and involvement. What are the key
components in a successful programme and how can strategic
operations managers establish and sustain TQM in organizations?
3 What do you think are the main barriers to effective implementa-
tion of TQM – and how might they be overcome?
4 Why does quality matter to a business?
5 Quality management used to be a specialist function carried out
by a specialist manager. Why has it become a mainstream task and
a key part of the strategic operations manager’s job? How can
strategic operations managers contribute to creating businesses
capable of competing on quality?

Quality and BPR 327
References and further reading
Abernathy, W. and Utterback, J. (1978) Patterns of industrial innov-ation. Technology Review, 80(7), 40–47.
Bentley, J. (1999) Fit for the future. CIPS Annual Conference, Egham,UK. Chartered Institute of Purchasing and Supply.
Bessant, J. (2003) High Involvement Innovation. Chichester: John Wiley.Boer, H., Berger, A., Chapman, R. and Gertsen, F. (1999) CI Changes:
From Suggestion Box to the Learning Organisation. Aldershot: Ashgate.Brown, S. (1996) Strategic Manufacturing for Competitive Advantage.
Hemel Hempstead: Prentice Hall.Brown, S. (2000) Manufacturing the Future – Strategic Resonance for
Resonant Manufacturing. London: Financial Times/Pearson Books.Business Week, 8 August 1994.Conti, R.F. and Warner, M. (1994) Taylorism, teams and technology in
‘reengineering’ work-organization. New Technology, Work, and
Employment, 9.Crosby, P. (1979) Quality is Free. New York: McGraw-Hill.De Cock, C. and Hipkin, I. (1997) TQM and BPR: beyond the beyond
myth. Journal of Management Studies, 34(5).Deming, W.E. (1986) Out of the Crisis. Cambridge, MA: MIT Press.Feigenbaum, A. (1956) Total quality control. Harvard Business Review,
November, 56.Feigenbaum, A. (1983) Total Quality Control, 3rd Edition. New York:
McGraw-Hill.Financial Times, When quality is not quite enough: programmes such as
Six Sigma and TQM are in vain unless top executives addresstheir own shortcomings, 15 July 2002.
Financial Times, A flair for stating the obvious, 29 January 2003.Garvin, D. (1988) Managing Quality. New York: Free Press.Garvin, D. (1992) Operations Strategy, Text and Cases. Englewood Cliffs,
NJ: Prentice Hall.Gemini Consulting (1997) A report in the Journal of Business Strategy,
May–June, 18(3).Hammer, M. and Champy, J. (1993) Reengineering the Corporation. New
York: Harper Business.Hill, T. (1995) Manufacturing Strategy. Macmillan.Imai, K. (1987) Kaizen. New York: Random House.Imai, M. (1997) Gemba Kaizen. New York: McGraw-Hill.Ishikawa, K. (1985) What is Total Quality Control? Englewood Cliffs, NJ:
Prentice Hall.J.D. Power Survey (2003).Juran, J. (1951) Quality Control Handbook. New York: McGraw-Hill.

328 Strategic operations management
Juran, J. (1974) Quality Control Handbook, 3rd Edition. New York:
McGraw-Hill.
Juran, J. (1985) Juran on Leadership for Quality. New York: Free Press.
Juran, J. and Gryna, F. (1980) Quality Planning and Analysis. New York:
McGraw-Hill.
Kanter, R. (1996) World Class. New York: Simon & Schuster.
Lee, S. and Asllani, A. (1997) TQM and BPR: symbiosis and a new
approach for integration. Management Decision, May–June, 35(5–6).
Lillrank, P. and Kano, N. (1990) Continuous Improvement; Quality Control
Circles in Japanese Industry. Ann Arbor: University of Michigan Press.
McAbe, D. and Wilkison, A. (1998) The rise and the fall of TQM: the
vision, meaning and operation of change. Industrial Relations
Journal, March, 29(1).
Nicholas, J. (1998) Competitive Manufacturing Management. Irwin:
McGraw-Hill.
Oakland, J. (1994) Total Quality Management. Oxford: Butterworth-
Heinemann.
Parasuraman, A. (1995) Measuring and Monitoring Service Quality. In
Glynn, W.J. and Barnes, J.G. (eds.) (1995) Understanding Services
Management. Wiley: New York, pp 143–177
Parasuraman, A., Zeithaml, V.A. and Berry, L.L. (1985) A conceptual
model of service quality and its implications for future research.
Journal of Marketing, 49, Fall, 41–50.
Peters, T. (1990) Tom Peters – Business Evangelist. BBC TV.
Peters, T. (1995) Quote taken from Tom Peters in conversation. The
Money Programme, BBC TV, 29 October.
Pirsig, R. (1974) Zen and the Art of Motorcycle Maintenance. New York:
Bantam.
Radford, G. (1922) The Control of Quality in Manufacturing. New York:
Ronald Press.
Schroeder, M. and Robinson, A. (1993) Training, continuous improve-
ment and human relations: the US TWI programs and Japanese
management style. California Management Review, 35(2).
Shewhart, W. (1931) Economic Control of Manufactured Product. New
York: Van Nostrand Rheinhold.
Shiba, S. and Graham, A. et al. (1993) A New American TQM; Four
Practical Revolutions in Management. Portland, OR: Productivity Press.
Taylor, F. (1947) The Principles of Scientific Management. London: Harper &
Row (first published in 1911).
Womack, J., Jones, D. and Roos, D. (1990) The Machine that Changed the
World. New York: Rawson Associates.

C H A P T E R
Human resources andstrategic operations
management
9
Introduction
We saw in Chapter 1 that one of the major responsibilities for operations
managers is in managing people. This is because human resources can
be a source of advantage for firms. The latest process technology can
be bought and accumulated, but human skills are more complex. In
any event, as we saw in Chapter 3 on process technology, an important
ingredient in successfully managing technology is in having appropri-
ate skills levels in place.
The purpose of this chapter is for the reader to:
■ understand the strategic importance of human resource man-
agement in world-class operations;
■ appreciate the problems that firms have in managing human
resource management in fast, volatile markets;
■ understand the changes to human resources over time within
operations management;
■ recognize the need for ongoing development, training and
learning within organizations.

330 Strategic operations management
The vital importance of human resources is indicated in a telling quote
from the Managing Director of British Chrome and Steel who, in 1998,
stated:
There is no other source of competitive advantage! Others can copy
our investment, technology and scale – but NOT the quality of our
people …
Tampoe (1994) argues that ‘the basis of competitive advantage is moving
from capital, natural resources to human capital’ and Grindley (1991)
endorses this sentiment:
The skills base is one of the firm’s main assets. It is hard for competitors
to imitate … this calls for an attitude to encourage learning and to
reward efforts which add to the firm’s knowledge. Skills go out of date
and need constant replenishment. In the long term what is most
important may not be the particular skills, but the ability to keep
learning new ones.
Human resources can be closely linked with the firm’s core com-
petences. Hamel and Prahalad (1994) describe core competences as ‘a
bundle of skills and technologies rather than a single discrete skill or
technology’. Although we cannot limit core competences to human
resources only, it is clear that human resource management must form
at least part of the organization’s core competence because ‘skills’ are
grounded in human capabilities. Human resource management must
be a key core competence for any world-class manufacturing firm. New
ideas for innovation, new products, continuous improvement and so
on, come from harnessing this creativity from humans, not via machines
or ‘technology’.
But managing human resources as part of strategic operations man-
agement is difficult for many firms. Although, as we saw in Chapter 6,
human resources will account for a small proportion of direct costs
(typically less than 10 per cent in high-volume manufacturing), human
resources will often be the first target in cost-cutting initiatives. The
reason for this is that such reductions are easily identifiable and
quantifiable. But such an approach is hardly strategic. There are major
negative repercussions in firms that downsize radically. First, many
firms attempt to be lean but end up becoming anorexic in the process.
Second, the ‘brain of the firm’, which is focused on human resources,
can suffer from what might be called a corporate lobotomy – i.e. the firm

forgets how to do things. Third, getting rid of staff is easy but dealing with
the survivors is immensely difficult. For example, we saw in Chapter 8
how vital continuous improvement initiatives can be. It is remarkably
difficult to motivate people in continuous improvement initiatives when
staff are leaving and surviving personnel are in fear of their jobs.
The fact is that people matter. This apparently obvious statement
underpins one of the key lessons that strategic operations management
has learned in the last part of the twentieth century. From a position in
which people were seen simply as factors of production, as ‘hands’ to
work in factories and offices, we have moved to a recognition of the
enormous potential contribution which human resources can offer.
Whether in systematic and widespread problem solving (such as helped
the Japanese manufacturing miracle), in the flexibility of teamworking
or in the emerging role of ‘knowledge workers’, the distinctive cap-
abilities of human beings are now being recognized. In the ‘resource-
based’ view of strategy, organizations are encouraged to identify and
build upon their core competencies; what is now clear is that a major
(but still often under-utilized) resource is the people involved in the
organization – the ‘human resources’. There is already compelling evi-
dence about the benefits of strategic human resource management,
seeing people as part of the solution rather than as the problem. In work
on US companies, Pfeffer (1998) notes the strong correlation between
proactive people management practices and the performance of firms
in a variety of sectors. Such ‘competitive advantage through people’
is also to be found elsewhere; in the UK, a series of studies on ‘high-
performance workplaces’ and on the contribution of advanced human
resource practices to improved competitiveness provide clear evidence
of the link (Guest et al., 2000; CIPD, 2001; DTI, 2003).
All of this raises a challenge for strategic operations management.
Whilst there is undoubted potential in the staff of any organization,
unlocking it – for example, in systematic high involvement in problem
solving around the quality question – is not easy. Fashions abound – for
teamworking, for empowerment, for knowledge and learning workers –
but implementing these themes requires fundamental changes in the
way people think and behave within the organization. Obtaining com-
mitment and ‘buy-in’ to new ways of working requires a skilful combina-
tion of leadership, communication and motivation, coupled with
appropriate designs for new work organization. Simple recipes are not
enough – for example, ‘empowerment’ sounds good, but allowing
people freedom to decide what they do and how they do it may be
somewhat dangerous when applied in the context of complex systems
or safety-critical operations. ‘Teamworking’ requires more than just
Human resources and strategic operations management 331

throwing a group of individuals together; effective teams are the result
of careful selection, training and experience. ‘Employee involvement’ in
problem solving (sometimes called kaizen or continuous improvement)
requires a supporting and enabling system, and a long-term commitment
to establishing this as the ‘way we do things around here’.
In the past, looking after people-related issues was the province of
specialists – in personnel and industrial relations – working on basic
issues of recruitment, reward, working conditions, etc. But it is becoming
a critical concern for operations management. The emerging model
sees, on the one hand, a much higher profile for the developmental
side of human resource management – for example, the need to train
and equip people to make a contribution to the operational compet-
encies of the organization – and on the other an integration of this
role into that of line or work-group management. Human resources
matter much more than they ever did and they are moving centre
stage. So one of the key skills in strategic operations management is
going to be learning how to motivate and direct such resources.
Why bother with people?
If you had been asked to predict the stocks that would do best in the
USA over the last quarter of the twentieth century, it is unlikely that you
would have chosen a small regional airline, a small publisher, an unknown
retailer, a poultry farmer or a video rental business. Yet each of these
outperformed the rest of the stock market, including some of the most
glamorous and high-technology stocks (Pfeffer, 1994). This is a signifi-
cant achievement in itself, but it takes on even more importance when
set against the performance of the rest of the sectors in which these firms
operate. They are not niche markets but highly competitive and over-
crowded sectors – with the result that many firms within them have
gone bankrupt and all face serious challenges. To perform well under
these conditions takes a particular kind of competitive advantage – one
that is highly firm-specific and difficult to imitate. In resource-based
strategy theory, such firms have a ‘distinctive’ capability or competence
(Kay, 1993).
In these firms, it was not the possession of specific assets or market
share or scale economy or advanced technology that accounted for
success. They achieved (and attribute) their growth through the ways
in which they managed to organize and work with their people to pro-
duce competitive advantage. This is evident in both manufacturing and
service sectors.
332 Strategic operations management

A good example is the case of Southwest Airlines – the role model for
the many low-cost airlines now coming to dominate the air travel market.
This firm did not have specially designed aircraft but used industry-
standard equipment. They did not have access to major international
reservation systems, and for many years they were unable to fly in and out
of their primary regional airport – Dallas-Fort Worth – and for a long time
had to make do with smaller local airports. Their chosen market segment
was not in a small niche but in the mainstream business of trying to sell
a commodity product – low-price, no-frills air travel. Yet Southwest
achieved significantly better productivity than the industry average
(79 employees vs. 131 average per aircraft in 1991), more passengers/
employee (2318 vs. 848) and more seat miles/employee (1 891 082 vs.
1 339 995). One of its most significant achievements was to slash the
turnaround time at airports, getting its planes back in the air faster than
others. In 1992, 80 per cent of its flights were turned around in only 15
minutes against the industry average of 45; even now the best the indus-
try can manage is around 30 minutes. All of this is not at a cost to service
quality; SWA is one of the only airlines to have achieved the industry’s
‘triple’ crown (fewest lost bags, fewest passenger complaints, best on-time
performance in the same month). No other airline has managed the
‘triple’, yet SWA has done it nine times! (Pfeffer and Veiga, 1999).
This is not an isolated example; many other studies point to the same
important message. For example, research on the global automobile
industry in the 1980s showed that there were very significant perform-
ance differences between the best plants in the world (almost entirely
Japanese operated at that time) and the rest. The gaps were not trivial
(Womack et al., 1990):
… our findings were eye-opening. The Japanese plants require one-half
the effort of the American luxury-car plants, half the effort of the best
European plant, a quarter of the effort of the average European plant,
and one-sixth the effort of the worst European luxury-car producer.
At the same time, the Japanese plant greatly exceeds the quality level
of all plants except one in Europe – and this European plant required
four times the effort of the Japanese plant to assemble a comparable
product …
Not surprisingly, this triggered a search for explanations of this huge
difference, and companies began looking to see if scale of operations,
or specialized automation equipment or government subsidy might be
behind it. What they found was that there were few differences in areas
like automation – indeed, in many cases non-Japanese plants had higher
Human resources and strategic operations management 333

levels of automation and use of robots. But there were major differences
in the way work was organized and in the approach taken to human
resources.
A comprehensive study of UK experience (Richardson and Thompson,
1999) carried out for the Chartered Institute of Personnel and
Development collected evidence to support the contention that in the
twenty-first century (CIPD, 2001):
Tayloristic task management gives way to knowledge management; the
latter seeking to be cost-efficient by developing an organization’s
people assets, unlike the former which views labour as a cost to be
minimized.
They observe that although the task of convincing sceptical managers
and shareholders remains difficult (Caulkin, 2001):
… more than 30 studies carried out in the UK and US since the early
1990s leave no room to doubt that there is a correlation between
people management and business performance, that the relationship
is positive, and that it is cumulative: the more and the more effective
the practices, the better the result …
Other relevant work includes:
■ A study carried out by the Institute of Work Psychology at
Sheffield University, which found that in a sample of manu-
facturing businesses, 18 per cent of variations in productivity
and 19 per cent in profitability could be attributed to people
management practices (Patterson et al., 1997). They concluded
that people management was a better predictor of company
performance than strategy, technology or research and
development.
■ Analysis of the national UK Workplace Employee Relations
Survey by Guest et al. (2000) found a link between the use of
more human resource practices and a range of positive out-
comes, including greater employee involvement, satisfaction and
commitment, productivity and better financial performance.
Another study (Stern and Sommerblad, 1999) concluded that:
Practices that encourage workers to think and interact to improve the
production process are strongly linked to increase productivity.
334 Strategic operations management
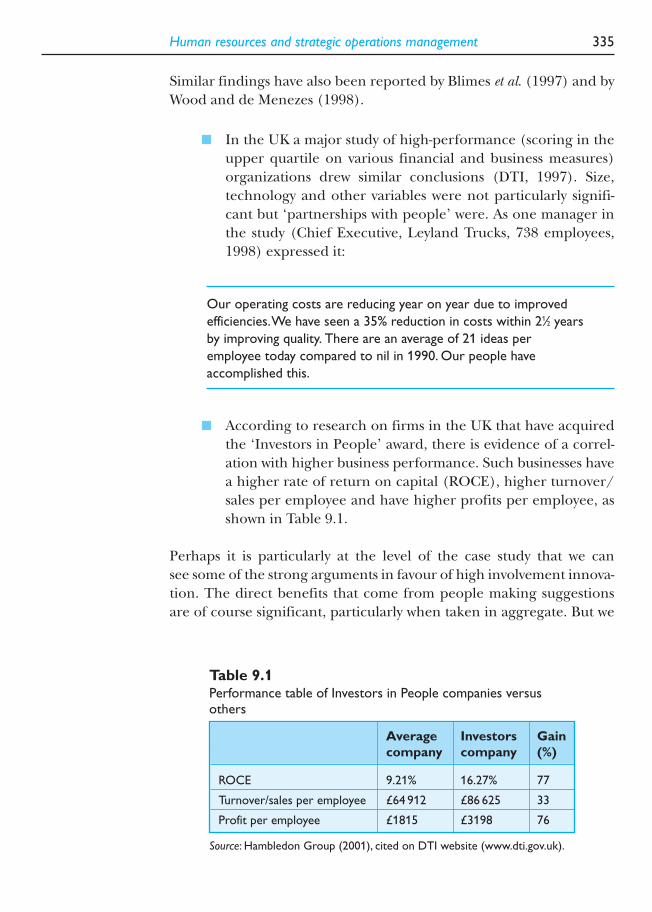
Similar findings have also been reported by Blimes et al. (1997) and by
Wood and de Menezes (1998).
■ In the UK a major study of high-performance (scoring in the
upper quartile on various financial and business measures)
organizations drew similar conclusions (DTI, 1997). Size,
technology and other variables were not particularly signifi-
cant but ‘partnerships with people’ were. As one manager in
the study (Chief Executive, Leyland Trucks, 738 employees,
1998) expressed it:
Our operating costs are reducing year on year due to improved
efficiencies.We have seen a 35% reduction in costs within 21⁄2 years
by improving quality. There are an average of 21 ideas per
employee today compared to nil in 1990. Our people have
accomplished this.
■ According to research on firms in the UK that have acquired
the ‘Investors in People’ award, there is evidence of a correl-
ation with higher business performance. Such businesses have
a higher rate of return on capital (ROCE), higher turnover/
sales per employee and have higher profits per employee, as
shown in Table 9.1.
Perhaps it is particularly at the level of the case study that we can
see some of the strong arguments in favour of high involvement innova-
tion. The direct benefits that come from people making suggestions
are of course significant, particularly when taken in aggregate. But we
Human resources and strategic operations management 335
Table 9.1Performance table of Investors in People companies versusothers
Average Investors Gain
company company (%)
ROCE 9.21% 16.27% 77
Turnover/sales per employee £64 912 £86 625 33
Profit per employee £1815 £3198 76
Source: Hambledon Group (2001), cited on DTI website (www.dti.gov.uk).

need to add to this the longer-term improvements in morale and moti-
vation that can emerge from increasing participation in innovation.
A flavour of the case level experience can be seen in the following
examples.
In a detailed study of seven leading firms in the fast-moving consumer
goods (FMCG) sector, Westbrook and Barwise reported a wide range of
benefits, including:
■ waste reduction of £500 k in year 1, for a one-off expense of
£100 k;
336 Strategic operations management
Human resource management and operations at 3M
3M as an example of an innovative culture based on people:
As our business grows, it becomes increasingly necessary to delegate responsibility and toencourage men and women to exercise their initiative.This requires considerable tolerance. Thosemen and women, to whom we delegate authority and responsibility, if they are good people, aregoing to want to do their jobs in their own way.
Mistakes will be made. But if a person is essentially right, the mistakes he or she makes are not asserious in the long run as the mistakes management will make if it undertakes to tell those inauthority exactly how they must do their jobs.
These comments are from William McKnight, who was CEO of 3M from 1949 but who joined the companyas a book-keeper in 1907. He is widely credited with having articulated some of the key principles on whichthe company culture is based and which has led to such an effective track record in innovation. It is often citedas an example of successful and consistent innovation, drawing on what is clearly a highly innovative culture.3M has around 50 000 products in its range and yet is so confident of its ability to innovate that it sets the stretching target of deriving half of its sales from products it develops and introduces during the last 3years. Not only are they able to keep this ambitious flywheel of innovation turning, but they do so with a mixtureof product improvements and breakthrough radical new product concepts.
Significantly, 3M do not attribute their success to a single organizational ‘lever’. Although they are famous fortheir ‘15 per cent’ rule in which people are encouraged to explore and play with ideas that may not be directlyrelevant to their main job, this space for innovation is only one element of a complex culture. Other com-ponents include policies to allow people to progress their ideas if they feel a personal commitment and areprepared to champion them – this is enabled through a rising series of funding options from simple ‘seed’money through to more extensive resources made available if the Board can be convinced by the ideas and theenthusiasm of the proposer. There is a deliberate attempt to create a sense of company history based on valuingas heroes and heroines those people who challenged the system – and a deliberate policy of encouraging ‘boot-legging’ behaviour – progressing projects which do not necessarily have official sanction but which peoplepursue often in highly innovative and improvisational mode.
The complex set of behaviours that the firm has discovered works and their subsequent embodiment in a set of reinforcing processes, structures and mechanisms make it difficult for others to imitate the 3Mapproach – it is not simply a matter of copying, but rather of learning and configuring to suit particular circumstances.
For a detailed discussion of how 3M has built an innovative culture, see Mitchell (1991), Kanter (1997) andGundling (2000).

■ a recurrent problem costing over 25 k/year of lost time,
rework and scrapped materials eliminated by establishing and
correcting root cause;
■ 70 per cent reduction in scrap year on year;
■ 50 per cent reduction in set-up times, in another case 60–90
per cent;
■ uptime increased on previous year by 50 per cent through CI
project recommendations;
■ £56 k/year overfilling problems eliminated;
■ reduction in raw material and component stocks over 20 per
cent in 18 months;
■ reduced labour cost per unit of output from 53 to 43 pence;
■ raised service levels (order fill) from 73 to 91 per cent;
■ raised factory quality rating from 87.6 to 89.6 per cent.
The US financial services group Capital One saw major growth between
1999 and 2002, equivalent to 430 per cent, and built a large customer
base of around 44 million people. Its growth rate (30 per cent in
turnover 2000–2001) made it one of the most admired and innovative
companies in its sector. But, as Wall (2002) points out:
Innovation at Capital One cannot be traced to a single department or
set of activities. It’s not a unique R&D function, there is no internal
think-tank. Innovation is not localized but systemic. It’s the lifeblood
of this organization and drives its remarkable growth. … It comes
through people who are passionate enough to pursue an idea they
believe in, even if doing so means extending well beyond their primary
responsibilities.
Chevron Texaco is another example of a high growth company which
incorporates – in this case in its formal mission – a commitment to
high involvement innovation. It views its 53 000 employees worldwide
as (Abraham and Pickett, 2002):
… fertile and largely untapped resources for new business ideas. …
Texaco believed that nearly everyone in the company had ideas
about different products the company could offer or ways it could
run its business. It felt it had thousands of oil and gas experts inside
its walls and wanted them to focus on creating and sharing innovative
ideas …
Human resources and strategic operations management 337

In implementing high involvement of employees in innovation in a
large South African mining company, suggestions made by employees
led to (De Jager et al., 2004):
■ improvements in operating income at one dolomite mine of
23 per cent despite deteriorating market conditions;
■ increase in truck fleet availability at a large coal mine of 7 per
cent (since these are 180-ton trucks the improvement in coal
hauled is considerable);
■ increase in truck utilization of 6 per cent on another iron
ore mine.
Kaplinsky (1994a,b) reports on a series of applications of ‘Japanese’
manufacturing techniques (including the extensive use of kaizen in a
variety of developing country factories in Brazil, India, Zimbabwe,
Dominican Republic and Mexico). In each case there is clear evidence of
the potential benefits that emerge where high involvement approaches
are adopted – although the book stresses the difficulties of creating the
conditions under which this can take place.
Gallagher and Austin (1997) report on a series of detailed case studies
of manufacturing and service sector organizations that have made
progress towards implementing some form of high involvement innova-
tion. The cases highlight the point that although the sectors involved
differ widely – insurance, aerospace, electronics, pharmaceuticals, etc. –
the basic challenge of securing high involvement remains broadly similar.
Another source of support for the high involvement approach can
be drawn from the increasing number of studies of employee involve-
ment programmes themselves. Studies of this kind concentrate on
reports describing structures that are put in place to enable employee
involvement and the number of suggestions or ideas that are offered
by members of the workforce. For example, a recent survey by ideasUK
(based on 79 responses from their membership of around 200 firms)
indicated a total of 93 285 ideas received during 2000–2001. Not every
idea is implemented, but from the survey and from previous data it
appears that around 25 per cent are – and the savings that emerged
as a direct consequence were reported as being £88 million for the
period. This pattern has been stable over many years and indicates
the type of direct benefit obtained. In addition, firms in the survey
reported other valuable outcomes from the process of employee
involvement.1
338 Strategic operations management
1Source: Personal communication with ideasUK. For more information, see their website (http://www.ideasuk.com/).

From all of these – and many other examples (Clark, 1993; Huselid,
1995; Blimes et al., 1997) – the evidence is clear. Competitive advantage
is coming not through scale of operations, or special market position
or the deployment of major new technologies, but rather from what these
organizations do with their people. Teamworking, employee involve-
ment, decentralization of many decisions, training, flexibility, all of these
become meshed into a pattern of behaving – ‘the way we do things
around here’ – which we call the company culture. Although ‘soft’ and
intangible, the evidence is clear that possessing such a culture is as
powerful a strategic resource as a major patent or an advantageous
location. But such cultures don’t emerge by accident – they must be
built and maintained.
Looking back …
Attempts to utilize this approach in a formal way, trying to engender
performance improvement through active participation of the work-
force, can be traced back to the eighteenth century, when the eighth
shogun Yoshimune Tokugawa introduced the suggestion box in Japan
(Schroeder and Robinson, 1991). In 1871, Denny’s shipyard in
Dumbarton, Scotland, employed a programme of incentives to encourage
suggestions about productivity-improving techniques; they sought to
draw out ‘any change by which work is rendered either superior in quality or
more economical in cost’. In 1894, the National Cash Register company
made considerable efforts to mobilize the ‘hundred-headed brain’ that
their staff represented, whilst the Lincoln Electric Company started
implementing an ‘incentive management system’ in 1915. NCR’s ideas,
especially around suggestion schemes, found their way back to Japan,
where the textile firm of Kanebuchi Boseki introduced them in 1905.
One of the difficult questions to answer when considering the
evolution of operations management is how the potential contribution
of people has become marginalized. Clearly, this is not the product of a
conspiracy on the part of operations managers, but rather an unfortu-
nate by-product of centuries of trying to make operations more efficient
and effective. To understand what has happened, we need to take a
brief look at the history of operations management.
Managing agricultural production was the dominant challenge for
all countries until comparatively recently. And whilst the forms of man-
agement were often less than enlightened (including a sizeable element
of slavery), there was a clear relationship between what people did and
what they produced. The vast majority of work was as direct labour
Human resources and strategic operations management 339

rather than involved in indirect activity, and the challenges faced were
relatively simple tasks. Where specialized skills were needed – crafts-
men working as wheelwrights, blacksmiths, masons, carpenters, etc. –
there was the Guild system to regulate and professionalize. Here, strong
emphasis was placed on a learning process, from apprenticeship,
through journeyman to master craftsman, and this process established
clear standards of performance and what might be termed ‘professional’
values. Again, there was a close link between what a craftsman produced
and the man himself, and a strong sense of pride in quality.
The Industrial Revolution changed all of this. The gradual drift
towards the cities and the increasing use of machinery led to a rethink
of how operations were managed. Its origins can be traced back to
Adam Smith and his famous observations of the pin-making process,
which marked the emergence of the concept of the division of labour.
By breaking up the task into smaller, specialized tasks performed by a
skilled worker or special machine, productivity could be maximized.
During the next 100 years or so, considerable emphasis was placed on
trying to extend this further, by splitting tasks up and then mech-
anizing the resulting smaller tasks wherever possible, to eliminate
variation and enhance overall managerial control.
The resulting model saw people increasingly involved as only one of
several ‘factors of production’ – and in a rapidly mechanizing world,
often in a marginal ‘machine-minding’ role. At the same time, the
need to co-ordinate different operations in the emerging factories led
to a rise in indirect activity and a separation between doing and think-
ing/deciding. This process accelerated with the increasing demand for
manufactured goods throughout the nineteenth century, and much
work was done to devise ways of producing high volumes in reproducible
quality and at low prices.
This ‘American system’ stressed the notion of the ‘mechanization of
work’. As Jaikumar (1988) puts it:
… whereas the English system saw in work the combination of skill in
machinists and versatility in machines, the American system introduced
to mechanisms the modern scientific principles of reductionism and
reproducibility. It examined the processes involved in the manufacture
of a product, broke them up into sequences of simple operations, and
mechanized the simple operations by constraining the motions of a
cutting tool with jigs and fixtures.Verification of performance through
the use of simple gauges insured reproducibility. Each operation could
now be studied and optimized.
340 Strategic operations management

That the convergent blueprint for this kind of manufacturing has
come to be known as ‘Fordism’ reflects the enormous influence of
Henry Ford in the way in which he (and his gifted team of engineers)
developed and systematized such approaches. His model for the manu-
facture of cars was based on a number of innovations which reduced
the need for skilled labour, mechanized much of the assembly process,
integrated preparation and manufacturing operations for both com-
ponents and finished product, and systematized the entire process. As
Tidd (1989) points out, the basic elements of the Ford system were
largely already in existence; the key was in synthesizing them into a new
system. (Even the idea of flow production lines for motor cars was first
used in the Olds Motor Works in 1902, while Leland’s Cadillac design
of 1906 won an award for the innovation of using interchangeable,
standardized parts.) The challenge of high-volume, low-cost produc-
tion of the Model T led Ford engineers to extend the application of
these ideas to new extremes – involving heavy investment in highly
specialized machine tools and handling systems, and extending the
division and separation of labour to provide workers whose main tasks
were feeding the machines. The dramatic impact of this pattern on
productivity can be seen in the case of the first assembly line, installed
in 1913 for flywheel assembly, where the assembly time fell from
20 man minutes to five. By 1914, three lines were being used in the
chassis department to reduce assembly time from around 12 hours to
less than 2.
This approach extended beyond the actual assembly operations to
embrace raw material supply (such as steelmaking) and transport and
distribution. At its height, a factory operating on this principle was able
to turn out high volumes (8000 cars/day) with short lead times – for
example, as a consequence of the smooth flow that could be achieved
it took only 81 hours to produce a finished car from raw iron ore, and
this included 48 hours for the raw materials to be transported from the
mine to the factory! (Tidd, 1989). In the heyday of the integrated
plants such as at River Rouge, productivity, quality, inventory and other
measures of manufacturing performance were at levels that would still
be the envy even of the best organized Japanese plants today.
Some of the key features of this blueprint for manufacturing, typified
in the car plants of Henry Ford, but applied to many other industries
throughout the 1930s and beyond, are outlined below:
■ Standardization of products and components, of manufactur-
ing process equipment, of tasks in the manufacturing process,
and of control over the process.
Human resources and strategic operations management 341

■ Time and work study, to identify the optimum conditions for
carrying out a particular operation and job analysis, to break up
the task into small, highly controllable and reproducible steps.
■ Specialization of functions and tasks within all areas of oper-
ation. Once job analysis and work-study information was avail-
able, it became possible to decide which activities were central
to a particular task and to train an operator to perform those
smoothly and efficiently. Those activities which detracted from
this smooth performance were separated out and became, in
turn, the task of another worker. So, for example, in a machine
shop the activities of obtaining materials and tools, or main-
tenance of machines, or of progressing the part to the next
stage in manufacture, or quality control and inspection, were
all outside the core task of actually operating the machine to
cut metal. Thus, there was considerable narrowing and rou-
tinization of individual tasks and an extension of the division
of labour. One other consequence was that training for such
narrow tasks became simple and reproducible, and thus new
workers could quickly be brought on stream and slotted into
new areas as and when needed.
■ Uniform output rates and systemization of the entire manu-
facturing process. The best example of this is probably the
assembly line for motor cars, where the speed of the line
determined all activity.
■ Payment and incentive schemes based on results – on output,
productivity, etc.
■ Elimination of worker discretion and passing of control to
specialists.
■ Concentration of control of work into the hands of manage-
ment within a bureaucratic hierarchy with extensive reliance
on rules and procedures – doing things by the book.
Alternative routes
There were, of course, competing models which saw a different role
for people in the operations of industrial and service businesses. Even
in the early days of mass production, other work was going on to try
and understand how people could work more productively in an
industrial rather than a craft environment.
Criticism is often levelled at the scientific management school (rep-
resented by figures like Frederick Taylor and Frank and Lilian Gilbreth)
342 Strategic operations management

for helping to institutionalize standardized working practices mod-
elled around a single ‘best’ way to carry out a task. But this is to mask
the significant role that their systematic approach took to encourage
and implement worker suggestions. It was Frank Gilbreth, for example,
who is credited with having first used the slogan ‘work smarter, not
harder’ – a phrase which has since come to underpin the philosophy
of continuous improvement innovation. As Taylor (1912, cited in Boer
et al., 1999) wrote:
You must have standards. We get some of our greatest improvements
from the workmen in that way. The workmen, instead of holding
back, are eager to make suggestions. When one is adopted it is named
after the man who suggested it, and he is given a premium for having
developed a new standard. So, in that way, we get the finest kind
of team work, we have true co-operation, and our method … leads
on always to something better than has been known before.
In particular, a whole series of experiments at the Hawthorne plant
of the Western Electric Company led to the emergence of what has come
to be termed the ‘human relations’ school of management – an
approach which tries to re-integrate people into work processes rather
than marginalizing them (Lewin, 1947; Morgan, 1986).
Another significant development was the recognition of the value of
teamworking in improving both productivity and flexibility. Work in
the UK, for example, looked at the problems of mechanization and
automation in the coal industry. The aim was to improve productivity
through the use of a new process for cutting coal, but early experience
with the machinery was disappointing. Researchers from the Tavistock
Institute highlighted the fact that the new system and equipment
broke up what had been productive teams under the old system – and
by working on both the social and technical systems simultaneously
they produced a model for effective teamworking with new technology.
Such ‘socio-technical systems design’ provided a strong influence on
the development of capital intensive industries like petrochemicals and
for experiments in the car industry (for example, at Volvo’s Kalmar
plant in the 1960s – Miller and Rice, 1967).
Mass production begins to unwind
It was not until the 1970s that the cracks began to appear in this view –
essentially reflecting the problems of such systems in meeting the
Human resources and strategic operations management 343

changing demands of fragmenting markets and shifting patterns of
demand. In particular, meeting the growing demand for high perform-
ance in non-price factor areas – quality, flexibility, variety, speed – became
increasingly difficult with systems geared around assumptions of stable,
unlimited demand and a market in which price was the key competitive
factor. The position was exacerbated by the growth in global competi-
tion – it became increasingly clear that those enterprises that did not
adapt to offer price and non-price advantages would be overtaken by
those who did. The demise of much UK manufacturing, for example, can
be attributed to a failure to keep up with Japanese competition based
on superior quality and delivery performance.
The inherent inflexibility in the ‘mass production’ approach was
reflected particularly in the ways in which people were involved only
as replaceable cogs in a large machine-like organization. As Piore and
Sabel (1982) stated:
Mass production offered those industries in which it was developed and
applied enormous gains in productivity – gains that increased in step
with the growth of these industries. Progress along these technological
trajectories brought higher profits, higher wages, lower consumer prices
and a whole range of new products. But these gains had a price. Mass
production required large investments in highly specialized equipment
and narrowly trained workers. In the language of manufacturing, these
resources were ‘dedicated’; suited to the manufacture of a particular
product – often, in fact, to make just one model. Mass production was
therefore profitable only with markets that were large enough to
absorb an enormous output of a single, standardized commodity, and
stable enough to keep the resources involved in the production of the
commodity continuously employed.
The influence of ‘lean’ thinking
Early attempts to emulate the Japanese experience often failed. For
example, the widespread adoption of quality circles in the late 1970s
often led to short-term gains and then gradual disillusionment and
abandonment of the schemes later (Dale and Hayward, 1984; Lillrank
and Kano, 1990). In large measure this can be attributed to a mistaken
belief in there being a single transferable solution to the problem of
quality which Western firms had to try and acquire. The reality was,
of course, that the ‘Japanese’ model involved a completely different
philosophy of organizing and managing production.
344 Strategic operations management
This became increasingly clear as Western firms began to explore
other dimensions of Japanese practice – for example, their approach to
production scheduling, to inventory control, to flow, to maintenance
and to flexibility (Suzaki, 1988; Schonberger, 1982). The emergent
model was one in which people were treated as a key part of the solution
to the problems of production – and as a problem-finding and -solving
resource for dealing with new ones. In order to mobilize this potential it
was necessary to invest in training, and the more widely this was done,
the more flexibly people could be used across a manufacturing facility.
Having trained staff with the capability of finding and solving problems,
it made sense to pass the responsibility for much of the operational
decision making to them, so workers became involved in quality, in main-
tenance, in production scheduling and smoothing, etc. And in order to
maximize the flexibility associated with devolution of decision making,
new forms of work organization, especially based around teamworking,
made sense.
It is important to recognize that there is nothing peculiarly Japanese
in any of these concepts – rather, they simply represent a re-integration
of tasks and responsibilities which had been systematically fragmented
and separated off by the traditions of the factory system in the nine-
teenth century and Ford/Taylor-style mass production in the twentieth.
None the less, the gap that had opened up was significant, and was
highlighted in particular by a series of studies of the world automobile
industry in the late 1980s. This work looked systematically at both the
performance of car assembly plants right across the world and also the
practices that led to particular levels of performance. It became clear
that Japanese operated plants were significantly better performers
across a range of dimensions – and that the difference could only be
explained by recognizing that a fundamentally different philosophy of
manufacturing was in operation. Efforts to identify the source of these
significant advantages revealed that the major differences lay not in
higher levels of capital investment or more modern equipment, but in
the ways in which production was organized and managed.
The authors christened this ‘lean production’ – implying an approach
that focused on the elimination of waste of all kinds – physical (as in
poor-quality components or processes), space, movement, etc. And one
of the biggest areas of waste was in the human resource potential, which
was not being used in most Western operations. Schroder and Robinson
present figures for suggestions made by ordinary shopfloor workers in
major Japanese companies, both in terms of the volume and the number
implemented; typically, the number of ideas offered runs into many
millions per year! (Schroeder and Robinson, 1993). If we add to this
Human resources and strategic operations management 345

the information that many firms – such as Toyota – have been doing
since the 1960s, we can see that a great deal of creative problem-solving
capability has been mobilized. Whilst critics often argue that this data
simply reflects tiny changes and improvements, the counter argument
is that even if each suggestion is tiny, millions per year over a sustained
20- or 30-year period add up to significant benefit. To underline the
point further, studies of the auto industry in 1989 suggested that the
average rate for Japanese plants worked out at around one suggestion
per worker per week. The US data indicated a rate of around half a
suggestion, per worker, per year!
Putting people back into operations management
This extended look at history highlights several key points. First, that
things change – no model is appropriate for every circumstance. The
craft system would not have been sufficient to cope with the explosive
demands of expanding markets in the twentieth century – something
like mass production had to emerge. In similar fashion, mass production
is no longer an appropriate model for the twenty-first century (although
we must be careful not to throw the baby out with the bathwater – there
are many features that are still very relevant under certain contingencies).
Second, people are a key part of the puzzle – they are resources
that can be mobilized in different ways. With hindsight it is easy to be
critical of the Ford/Taylor models – but we should also remember that
they represented very effective solutions for their time. To get the kind
of productivity which Ford’s early plants achieved from unskilled and
often illiterate workers, and to do so at consistent levels of quality, sug-
gests that many ideas from that period had relevance. But the weakness
in the model probably lay in its marginalizing of those characteristics
of human beings which make them so useful in uncertain conditions –
creativity, problem solving, flexibility in teamworking, etc. In an environ-
ment characterized by uncertainty we need to find models of organizing
that maximize the opportunities to deploy these characteristics.
Third, we need to recognize that we are not dealing with particular
country solutions. Much is often made of the Japanese miracle – but
although the conditions for the emergence of a new model were present
in post-war Japan, the underlying principles are of much wider relevance.
Just as mass production evolved in the factories of the USA but then dif-
fused widely, so those of lean (and beyond) began life in Japan but have
come to dominate the operations management agenda across the world.
Finally, we need to be aware of sectoral issues. Much of the preced-
ing discussion has been about manufacturing – because this is where
346 Strategic operations management
the changes first took place and where we can see most clearly the rela-
tionship between people and the tasks they do. But the same pattern
has been going on in the service sector – for example, McDonald’s very
sophisticated model for fast-food production and service replicates
across 185 000 outlets, a model with which Henry Ford would feel quite
comfortable. (It is also important to note that whilst Japanese manu-
facturing has been held up as a role model for much of the last quarter
century, the service sector in that country remains far less developed
and has a serious productivity problem.)
Current ‘good practice’ in strategic humanresource management
Pfeffer (1998) and Pfeffer and Veiga (1999) report on a study of high-
performance work practices of 968 US firms representing all major indus-
tries. The study found that a one standard deviation increase in the use of
such practices was associated with a 7.05 per cent decrease in staff turnover
and, on a per-employee basis, a $27 044 increase in sales/employee, an
$18 641 increase in stock market valuation and a $3814 increase in
profits (Huselid, 1995). Similar data comes from a German study, which
found ‘a strong link between investing in employees and stock market
performance’ (Blimes et al., 1997), and from UK studies, which demon-
strate a high degree of correlation between new human resource prac-
tices and performance (DTI, 1994, 2003; Guest et al., 2000; CIPD, 2001).
It is important to note two points in such studies. First, they are not
saying that a single practice will change things overnight. Rather, success
comes through a systematic and integrated approach carried through
over a sustained period of time. Changing the way an organization
behaves is a matter of consistent reinforcement and the establishment
of a different set of values.
The second point is that we can see a high degree of convergence in
different studies around the key dimensions of high-performance human
resource management. For example, Pfeffer (1994) lists seven key
practices of successful organizations, whilst the UK ‘Competitiveness
through partnerships with people’ study highlights five key areas for
change. We can group the key factors into a simple model (Figure 9.1),
which provides an overview of the challenges for strategic operations
management in this field.
Under each of these headings are a number of factors: Table 9.2 lists
the key elements. In the following section we discuss them in a little
more detail.
Human resources and strategic operations management 347

348 Strategic operations management
Enablingstructures
Shared purpose
Sharedinvolvement
Shared learningand development
Commitment topeople asstrategic
resources
Figure 9.1
Human resource
issues in strategic
operations
management.
Table 9.2Key elements in human resource management in strategic operations
Area Key elements
Commitment to people as strategic Employment securityresources Choosing the right people
Valuing and rewarding themWage compressionSymbolic egalitarianism
Shared purpose Strategic leadershipShared planning processesPolicy deploymentInformation sharingEmployee ownership
Enabling structures Appropriate organization designJob and work organization designDevolved decision makingSupportive communications
Shared learning and development Commitment to training and developmentEmbedding a learning cycleMeasurementContinuous improvement culture
Shared involvement TeamworkingCross-boundary workingParticipation and involvement mechanismsStakeholder focus and involvement

Commitment to people as strategic resources
There is no ‘magic ingredient’ in the recipe for developing high-
performance organizations of this kind – but there is a need to work on
some basic principles. At the heart of such organizations lies a belief in
the importance and potential contribution that employees can make.
From this a series of practices follow which reinforce the message and
enable sometimes ‘extraordinary efforts from ordinary people’ (Joynson,
1994). One of the basic human needs is for security, and in an uncer-
tain world providing some measure of employment security is a powerful
way of signalling the value placed on human resources. Of course, this
is not something that can be guaranteed and there is a risk of ‘feather-
bedding’ employees – but providing some form of contract that shares
the risks and the benefits is strongly correlated with success. For example,
one of the most successful US firms is Lincoln Electric, who operate on
this basis (cited in Pfeffer, 1994):
… Our guarantee of employment states that no employee with 3 years
or more of service will be laid off for lack of work … this policy does
not protect any employee who fails to perform his or her job properly,
it does emphasize that management is responsible for maintaining a
level of business that will keep every employee working productively.
The institution of guaranteed employment sprang from our belief that
fear is an ineffective motivator … relief from anxiety frees people to do
their best work …
The converse of this is also true; if people feel their efforts are likely
to have a negative impact on their employment security, they will not
make them. So introducing programmes which engage employees in
improvement activities that raise productivity will only work if there
is some form of reassurance that these employees are not improving
themselves out of a job!
Much depends on ensuring that the right people are involved in the
first place, and there is a clear trend towards more selective and care-
ful recruitment practices within organizations. For example, Southwest
Airlines received nearly 100 000 job applications in 1993; 16 000 were
interviewed and only 2700 people were actually employed (Pfeffer and
Veiga, 1999). Given the flexibility and creativity required and the
increasing emphasis on teamworking in the emerging operations envir-
onment, a broad range of social skills become an important part of the
skills mix that firms are seeking.
Human resources and strategic operations management 349

Reward systems are another area in which significant change is taking
place. The traditional view concentrated on simple reward systems, often
linking wages to output in systems like piece-work. But our understand-
ing of what motivates people, and our need for performance across a
broad range of factors like quality, flexibility and speed, has led to the
emergence of new approaches. New arrangements include payment
for acquiring skills, for effective teamworking and for participation in
problem finding and solving; perhaps more important is the recogni-
tion that non-financial rewards are an important part of the package
(Luthans and Stajkovic, 1999).
There is also some evidence that paying high wages is associated with
improved performance (Pfeffer, 1994, 1998). But of greater signifi-
cance is the reduction of wage and status differentials; eliminating sym-
bols that imply there are more or less valued people in the organization
is a critical step in building a new culture. For example, the presence
of separate and hierarchically arranged facilities like office space, can-
teens, car parking, etc. sends out powerful messages about valuing
some people more than others. By contrast, shared facilities, company
uniforms and other symbols help reduce this sense of status difference.
In the end, the task is one of building a shared set of values which
bind people in the organization together and enable them to participate
in its development. As one manager put it in a UK study (DTI, 1997):
… we never use the word empowerment! You can’t empower people –
you can only create the climate and structure in which they will take
responsibility …
Shared purpose
Successful organizations do not happen by accident – they have a clear
and thought-out sense of direction, and can mobilize support for their
strategic goals. Whilst charismatic leaders can and do make a difference,
it is not sufficient to rely upon this phenomenon. Instead, high-perform-
ance organizations need ways of building a sense of shared purpose.
This can be accomplished in a number of ways, not least through
participation in the planning process itself. A growing number of firms
make use of workshops and other mechanisms to gain input and dis-
cussion of strategic issues, whilst many others take pains to ensure the
ideas are communicated throughout the organization – for example,
via team briefings, newsletters, videos, etc. Others make use of the
appraisal process to provide a mechanism for involvement in strategic
350 Strategic operations management

planning and particularly for aligning the goals of the individual to those
of the organization.
A key issue here is what is sometimes called ‘policy deployment’ –
essentially a process of connecting the high-level strategic goals of the
business with specific tasks and targets with which individuals and groups
can engage. This requires two key enablers – the creation of a clear and
coherent strategy for the business and the deployment of it through a
cascade process that builds understanding and ownership of the goals
and sub-goals.
This is a characteristic feature of many Japanese ‘kaizen’ systems and
may help explain why there is such a strong ‘track record’ of strategic
gains through continuous improvement (CI) (Bessant, 2003). In such
plants overall business strategy is broken down into focused 3-year mid-
term plans (MTPs); typically, the plan is given a slogan or motto to
help identify it. This forms the basis of banners and other illustrations,
but its real effect is to provide a backdrop against which efforts over the
next 3 years can be focused. The MTP is specified not just in vague
terms but with specific and measurable objectives – often described as
pillars. These are, in turn, decomposed into manageable projects that
have clear targets and measurable achievement milestones, and it is to
these that CI is systematically applied (Bessant and Francis, 1999).
Policy deployment of this kind requires suitable tools and techniques,
and examples include hoshin planning, how-why charts, ‘bowling charts’
and briefing groups (Shiba et al., 1993).
One way in which shared purpose can be developed is through
involving employees as key stake- or share-holders. In the five high-
performance firms that Pfeffer mentions, more than 4 per cent of the
stock is owned by employees, whilst in Japan there is a clear link between
ESOPs (employee share ownership programmes) and reduced labour
turnover. By the same token, reward systems that emphasize some elem-
ent of gain sharing – bonus schemes linked to stretching strategic
targets that reflect high levels of active involvement – provide powerful
mechanisms for ensuring commitment to common purpose.
Linked to this is the need for shared understanding about what is
happening and where the organization is going. Information sharing
and effective communication systems that operate in two-way mode are
critical to building shared purpose. As one manager put it (John Mackey,
CEO of Whole Foods Markets, cited in Pfeffer and Veiga, 1999):
… if you’re trying to create a high trust organization … an organization
where people are all-for-one and one-for-all, you can’t have secrets!
Human resources and strategic operations management 351

The case of Springfield ReManufacturing Company in the USA pro-
vides a powerful illustration of this; when faced with a cancelled order
from General Motors, which represented around 40 per cent of their
business, the senior management chose to let everyone know exactly
what was going on. The response to the crisis was a series of employee-
led initiatives which raised productivity and has subsequently allowed
major expansion of the business. Open-book management of this kind
has become central to their development and growth – and has helped
them move from a position in 1986 where the 119 employees faced
being laid off to one where they now employ over 700. Similar stories
of turnaround through high commitment can be found in Sirkin and
Stalk (1990), who looked at a large paper-maker in the US, and Semler
(1993), who explains his approach to revitalizing a number of white
goods plants in Brazil.
Enabling structures – the limits to chaos
Central to this is the idea of structure – and here it is important to be
clear that the prescription is not simply flat and loose. Whilst there are
significant limitations to the kind of hierarchical design that charac-
terized organizations in Henry Ford’s day, simply substituting a new
‘one size fits all’ model may be the wrong thing to do. What we have
learned over decades of research on organizational structures is that
the choice is contingent on factors like size, technology, the environ-
ment the firm works in – and what it is trying to do (strategy). There are
some cases where it makes a great deal of sense to devolve decision mak-
ing to the shopfloor self-managed team looking after a self-contained
cell – for example, in a highly uncertain customer-focused business
where each order is a special project. But that model may not be the
best idea where we are trying to co-ordinate the activities of many dif-
ferent people in the production of a complex product or assembly. For
example, empowering people working on the drug manufacture and
packing lines in a pharmaceutical business to use their own judgement
and come up with their own solutions may not be the safest or most
reliable way to run things.
In general, organizational structures are influenced by the nature
of tasks to be performed within the organization. In essence, the less
programmed and more uncertain the tasks, the greater the need for
flexibility around the structuring of relationships (Preece, 1995). For
example, activities like production, order processing, purchasing, etc.
are characterized by decision making that is subject to little variation.
352 Strategic operations management

(Indeed, in some cases these decisions can be automated through
employing particular decision rules embodied in computer systems,
etc.) But others require judgement and insight and vary considerably
from day to day – and these include those decisions associated with
innovation. Activities of this kind are unlikely to lend themselves to
routine, structured and formalized relationships, but instead require
flexibility and extensive interaction.
Valuable insights into this issue came originally from the work done
in the late 1950s by researchers Burns and Stalker (1961), who outlined
the characteristics of what they termed ‘organic’ and ‘mechanistic’
organizations. Organic forms are suited to conditions of rapid change,
whilst mechanistic forms are appropriate to stable conditions. The rele-
vance of this model can be seen in an increasing number of cases
where organizations have restructured to become less mechanistic. For
example, firms like General Electric in the USA underwent a painful
but ultimately successful transformation, moving away from a rigid and
mechanistic structure to a looser and decentralized form (Moody,
1995), whilst in the 1980s ABB, the Swiss–Swedish engineering group,
developed a particular approach to their global business based on
operating as a federation of small businesses, each of which retains
much of the organic character of small firms (Barnevik, in Champy and
Nohria, 1996). Other examples of radical changes in structure include
the Brazilian white goods firm Semco and the Danish hearing aid com-
pany Oertikon (Kaplinsky et al., 1995; Semler, 1993).
Another important strand in thinking about organization design is
the relationship between different external environments and organ-
izational form. Once again, the evidence suggests that the higher the
uncertainty and complexity in the environment, the greater the need for
flexible structures and processes to deal with it (Smith, 1992). In part,
this explains why some fast-growing sectors – for example, electronics
or biotechnology – are often associated with more organic organiza-
tional forms, whereas mature industries often involve more mechanistic
arrangements.
An important contribution to our understanding of organizational
design came in studies originated by Joan Woodward (1965), associated
with the nature of the industrial processes being carried out. These
studies suggested that organizational structures varied between indus-
tries; those with a relatively high degree of discretion (such as small
batch manufacturing) tended to have more decentralized and organic
forms, whereas in those involving mass production more hierarchical and
heavily structured forms prevailed. Significantly, the process industries,
although also capital intensive, allowed a higher level of discretion.
Human resources and strategic operations management 353

Many other factors have an influence on the structuring of organ-
izations – these include size, age and company strategy (Child, 1980;
Johnson and Scholes, 1999). What became a long-running debate on
what determined organization structure began to resolve itself into a
‘contingency’ model in the 1970s. The basic idea here is that there is
no single ‘best’ structure, but that successful organizations tend to be
those which develop the most suitable ‘fit’ between structure and oper-
ating contingencies (Mintzberg, 1979). So if we were trying to replicate
the operations of a company like McDonald’s, so that it offered the same
products and standards of service in thousands of locations around the
world, it would make sense to structure it in a mechanistic and highly
controlled form. But if we were trying to develop new drugs or respond
to a rapidly changing ‘fashion’ market, we would need a more flexible
and loose structure.
Stretching learning and development
One lesson which emerges consistently when looking at high-
performance organizations is their commitment to training and devel-
opment. If a firm is to make the best use of new equipment or to produce
products and services with novelty in design, quality or performance,
then it needs to recognize that this depends to a large extent on the
knowledge and skills of those involved.
Training and development has two contributions to make. First, of
course, it equips people with the necessary skills and capabilities for
understanding and operating equipment or processes. But it also has
considerable potential as a motivator – people value the experience of
acquiring new skills and abilities, and also feel valued as part of the
organization. For example, a survey of employee involvement in con-
tinuous improvement in the UK found that the opportunity for per-
sonal development was ranked higher than financial motivators as a
reward mechanism (Caffyn et al., 1996). Similarly, if we want people to
take on more responsibility and demonstrate more initiative – so-called
‘empowerment’ exercises – then training and development provide an
important aid to the process. And if we are concerned with harnessing
creativity and encouraging experiment, then we need to recognize that
this depends on people having the necessary skills and confidence to
deploy them (IPD, 1995).
Change management – the planned and effective introduction of new
systems, structures or procedures – is one of the big challenges in con-
temporary organizations, and it is likely to become even more so in an
354 Strategic operations management

environment where organizations need to re-invent themselves on a
continuous basis. When major innovations are introduced, people
often resist the change for a variety of reasons, not all of which are
rational or clearly articulated (Smith and Tranfield, 1990). Research
suggests that a key element of this anxiety is the sense that the innova-
tion will require abilities or skills which the individual does not possess,
or pose challenges which are not fully understood. So training and
development – not only in the narrow sense of ‘know-how’, but also a
component of education around the strategic rationale for the change
(the ‘know-why’) – can provide a powerful lubricant for oiling the
wheels of such innovation programmes (Walton, 1986; Bessant and
Buckingham, 1993).
A final but key point concerns the use of training and development
activities to develop the habit of learning. Any ‘learning organization’
will require the continual discovery and sharing of new knowledge – in
other words, a continuing and shared learning process (Garvin, 1993;
Leonard-Barton, 1992). Putting this in place requires that employees
understand how to learn, and an increasing number of organizations
have recognized that this is not an automatic process. Consequently,
they have designed and implemented training programmes designed
less to equip employees with skills than to engender the habit of learn-
ing. Examples include firms offering access to courses in foreign lan-
guages, hobby-skills and other activities unrelated to work, but with the
twin aims of motivating staff and getting them back into the habit of
learning.
Human resources and strategic operations management 355
Getting the learning habit
Successful firms invest in training of various kinds – to give staff an understanding of the targets towards whichcontinuous improvement (CI) should be focused, to develop the skills of problem solving and learning, and toequip them with the necessary skills and familiarity with key tools and techniques. Some also stress the import-ance of developing the habit of learning by encouraging employees to take on training of any kind – foreignlanguages, construction skills, anything to get them into the swing of acquiring and using new skills.
Examples of particular training inputs amongst some UK organizations include:
■ A major manufacturer of auto components reports saving £850 000 per year from its extensive continuousimprovement (CI) activities. In building its process improvement teams it provided 3 days of training for each team member, to establish the basic process and concepts of CI; its LIFE (little improvements fromeveryone) programme is now carrying out similar training inputs, and so far some 500 staff have beeninvolved.
■ An engine manufacturer has around 60 per cent of its staff actively involved in CI across some 530 projects,has provided a minimum of 3 days training for every one of its employees, which provides the basic platformfor CI understanding and establishes the process in people’s minds. Additional inputs – for example, forthose with the responsibility for facilitating CI – are also made, and there are periodic updates in such

Shared involvement
Although there is scope for individual activity, one of the main advantages
in working in organizations is to benefit from the team effect, whereby
the benefits of working together outweigh those of the same number of
people working alone. But simply throwing a group of people together
does not make a team; the whole can only become greater than the
sum of its parts if careful attention is paid to design and operation, and
to training the skills for effective teamworking.
Teams have become a fashionable concept as organizations recog-
nize the value in the flexibility and problem-solving capability that they
can offer. Research has consistently shown that teams are both more
fluent (the number of ideas they generate) and more flexible (the num-
ber of different ideas they generate) than individuals in problem-solving
tasks, and this attribute makes them a very suitable vehicle for dealing
with the uncertainties of the current environment. At the same time, the
psychological pressure to conform means that teams become a powerful
way of articulating and reinforcing patterns of behaviour – a culture –
within an organization. Building effective routines for organizational
activities can often be best achieved through the development and
support of team norms.
Much research has been carried out to try and understand how teams
work and how they might be developed. Two conclusions emerge
strongly. First, as with the design of organizations, the design and working
of a team depends on what it is trying to do and the context in which it
works. Second, high-performance teams for whatever purpose do not
emerge by accident – they have to be built and sustained (Francis and
356 Strategic operations management
training. Its initial investment in training during the 18-month start-up period was of the order of 16 000 person days.
■ A major UK power generator has an overall training budget of £1 m and each employee receives a minimumof 10 days training; this is equivalent to £1400/employee. In addition, they give every employee £100 worthof training, which can be in anything – from gardening or sewing to work-related topics. The aim is toencourage a learning culture in which more work-specific inputs can take root. Similar programmes are inoperation at Ford (where demand for training far exceeded expectations) and at Baxi,where employees canstudy a wide range of courses at local colleges with the company paying the fees and providing some timerelease.
■ Unipart has become one of the most successful companies in the European automotive components sector.A key element in its continuing drive for reduced costs and improved performance is the mobilization ofhigh levels of creativity across its workforce, and this is in turn enabled by a strong commitment to educa-tion and training. In order to facilitate this, the company set up ‘Unipart U’ (short for university) as a placewhere all employees could access learning opportunities across a wide range of work- and non-work-related activities.

Young, 1988). They result from a combination of selection and invest-
ment in team building, allied to clear guidance on their roles and tasks,
and a concentration on managing group process as well as task aspects
(Thamhain and Wilemon, 1987). For example, work by researchers in
the USA on a variety of engineering companies aimed at identifying
key drivers and barriers to effective performance found that effective
team building is a critical determinant of project success. Bixby (1987)
drew similar conclusions in work with organizations associated with the
Ashridge Management College teamworking programme; this model
for ‘superteams’ includes components of building and managing the
internal team, and also its interfaces with the rest of the organization.
Key elements include:
■ clearly defined tasks and objectives;
■ effective team leadership;
■ good balance of team roles and match to individual behavioural
style;
■ effective conflict resolution mechanisms within the group;
■ continuing liaison with external organization.
Extensive work on ‘group dynamics’ in the 1950s and 1960s found that
there is a pattern to the way in which teams emerge. Teams typically go
through four stages of development, popularly known as ‘forming,
storming, norming and performing’. In practice, they are put together
and then go through phases of resolving internal differences and con-
flicts around leadership, objectives, etc. Emerging from this process is a
commitment to shared values and norms governing the way the team will
work, and it is only after this stage that teams can move on to effective
performance of their task.
Obviously, a key influence on team performance will be the mix of
people involved – in terms of personality type and behavioural style.
There has to be good matching between the role requirements of the
group and the behavioural preferences of the individuals involved.
Again, this has been the subject of extensive work, and one of the most
useful models derives from the research carried out by Meredith Belbin
(1984). In this model of team behaviour, he classifies people into a
number of preferred role types – for example, ‘the plant’ (someone who
is a source of new ideas), ‘the resource investigator’, ‘the shaper’ and the
‘completer/finisher’. Research has shown that the most effective teams
are those with diversity in background, ability and behavioural style.
In one noted experiment, highly talented but similar people in what
he terms ‘Apollo’ teams consistently performed less well than mixed,
average groups (Belbin, 1984).
Human resources and strategic operations management 357

Team building is not the only aspect affecting performance. Other
influential factors include:
■ team size;
■ team structure;
■ team process – the way in which meetings are organized and
decisions taken;
■ team leadership;
■ team environment/organizational context.
Holti et al. (1995) provide a useful summary of the key factors involved
in developing teamworking. Although there is considerable current
emphasis on teamworking, we should remember that teams are not always
the answer. In particular, there are dangers in putting nominal teams
together where unresolved conflicts, personality clashes, lack of effective
group processes and other factors can diminish their effectiveness.
An important point to remember is that different kinds of teams are
required for different situations. Tranfield et al. (1998) found several
different ‘archetypes’ where the team structure and dynamics needed
to be different to cope with different kinds of context, ranging from
repetitive manufacturing operations through to highly uncertain and
unpredictable task environments. Increasingly, their role as enablers of
knowledge generation, sharing and diffusion is also being recognized
(Sapsed et al., 2002).
Teams are increasingly being seen as a mechanism for bridging bound-
aries within the organization – and indeed, in dealing with inter-
organizational issues. Cross-functional teams can bring together the
different knowledge sets needed for tasks like product development or
process improvement – but they also represent a forum where often
deep-rooted differences in perspectives can be resolved. However, as
we indicated above, building such teams is a major strategic task – they
will not happen by accident, and they will require additional efforts
to ensure that the implicit conflicts of values and beliefs are resolved
effectively.
Teams also provide a powerful enabling mechanism for achieving the
kind of decentralized and agile operating structure that many organ-
izations aspire to. As a substitute for hierarchical control, self-managed
teams working within a defined area of autonomy can be very effective.
For example, Honeywell’s defence avionics factory reports a dramatic
improvement in on-time delivery – from below 40 per cent in the 1980s
to 99 per cent in 1996 – due to the implementation of self-managing
teams. In the Netherlands, one of the most successful bus companies is
Vancom Zuid-Limburg, which has improved both price and non-price
358 Strategic operations management

performance and has high customer satisfaction ratings. Again, they
attribute this to the use of self-managing teams and to the reduction in
overhead costs that results. In their system, one manager supervises
over 40 drivers, where the average for the sector is a ratio of 1:8. Drivers
are also encouraged to participate in problem finding and solving
in areas like maintenance, customer service and planning (Van
Beusekom, 1996).
Learning
The last area is in many ways the most significant for the future. One of
the fundamental flaws in the Ford/Taylor model was the assumption
that it represented the ‘one best way’ – that it was possible to design
something which represented the ‘perfect’ manufacturing system. It
was undoubtedly effective in terms of productivity (rises of 300 per cent
in the first year of operation vs. craft production, for example) and in
its impact on costs (when competitors entered, Ford was able to drop
and continue to drop his prices to remain competitive). It was also
attractive as an employment option – despite the hard conditions and
the high labour turnover, people flocked to work in his plants because
of the high wages being paid. The problem for Ford was that the world
doesn’t remain static and if you have invested heavily in ‘one best way’,
then it is a costly business to change.
Arguably, Ford’s plants represented the most efficient response to the
market environment of its time. But that environment changed rapidly
during the 1920s, so that what had begun as a winning formula for
manufacturing began gradually to represent a major obstacle to change.
Production of the Model T began in 1909 and for 15 years or so it
was the market leader. As Abernathy points out, despite falling margins
the company managed to exploit its blueprint for factory technology
and organization to ensure continuing profits. But by the mid-1920s,
growing competition (particularly from General Motors, with its strat-
egy of product differentiation) was shifting away from trying to offer the
customer low-cost personal transportation and towards other design
features – such as the closed body – and Ford was increasingly forced
to add features to the Model T. Eventually, it was clear that a new model
was needed and production of the Model T stopped in 1927.
Changing over to the new Model A was a massive undertaking and
involved crippling investments of time and money – since the blue-
print for the highly integrated and productive Ford factories was only
designed to make one model well. During the year it took to change
Human resources and strategic operations management 359

over, Ford lost $200 m and was forced to lay off thousands of workers –
60 000 in Detroit alone; 15 000 machine tools were scrapped and a fur-
ther 25 000 had to be rebuilt, and even though the Model A eventually
became competitive, Ford lost its market leadership to General Motors.
These days we face a much more uncertain environment, where the
only certainty is change itself. So the response cannot be ‘one best way’
because even if it were possible to find it, tomorrow’s conditions would
put it out of date. Instead, we have to look towards organizations that
are adaptive and experimental – in other words, organizations that learn.
Of course, organizations don’t learn, it is the people within them who
do; what we need to look for are those behaviour patterns that the organ-
ization develops to enable the learning process, and in particular on
the ways in which individual and shared learning can be mobilized. For
example, Garvin (1993) suggests the following mechanisms as important:
■ training and development of staff;
■ development of a formal learning process based on a problem-
solving cycle;
■ monitoring and measurement;
■ documentation;
■ experiment;
■ display;
■ challenge existing practices;
■ use of different perspectives;
■ reflection – learning from the past.
Garvin (1993, p. 80) provides further insight about a would-be learning
organization:
A learning organization is an organization skilled at creating, acquiring,
and transferring knowledge, and at modifying its behavior to reflect new
knowledge and insights.
He continues by saying that learning organizations are adept at five
activities:
1 Problem solving.
2 Experimentation with new approaches.
3 Learning from their own experience and past history.
4 Learning from others.
5 Efficiently (and speedily) transferring this knowledge through-
out the organization.
360 Strategic operations management

Learning gained from both the firm’s own experience and learning
from others demand that organizations make time to reflect on this
learning in order to reinforce and confirm what has been learned.
Learning in all of the ways cited above is a feature of world-class manu-
facturing firms. These firms learn quickly and effectively; these out-
standing firms also learn quickly from mistakes and failures, and then
utilize the intellectual capability from their trained workforces to rect-
ify the situation. Such learning then manifests itself in competitive
areas such as lower cost, enhanced delivery speed and reliability, higher
levels of process quality, and speedier new product development. But
the alarming thing is that, in the quick-fix management culture, not
enough firms take time to learn, as Garvin (1993) observes:
… few companies … have established processes that require their
managers to periodically think about the past and learn … [p. 85]. …
There must be time for reflection and analysis, to think about strategic
plans. … Only if top management explicitly frees up employees’ time for
the purpose does learning occur with any frequency. [p. 91]
Learning is an invaluable ingredient: it includes forgetting bad prac-
tice as well as embracing new ideas. Learning undoubtedly impacts
upon key areas in manufacturing processes. It would seem, therefore,
very sensible for firms to set aside time for learning rather than having
an ongoing pursuit of being busy – often in the wrong things.
Looking forward
If the twentieth century marked the shift from labour intensity to cap-
ital intensity, with people and manual work being gradually substituted
by mechanization and automation, the transition to the twenty-first is
proving to be equally dramatic. Many commentators argue that the
emerging era is one in which the key to competitiveness will be know-
ledge. Simply possessing assets or technology or access to raw materials
or cheap labour is no longer sufficient – in a global business economy,
these advantages can be matched (Teece, 1998).
The key will be knowledge – and particularly the firm-specific know-
ledge that an organization can accumulate and protect. This may be in
the form of codified knowledge – in patents or copyrighted materials –
but much is likely to be in the form of knowledge embedded in the minds
and behaviour patterns of the people working in the organization (Tidd
Human resources and strategic operations management 361

et al., 1997). The potential of such resources is considerable – from the
tacit knowledge possessed by research scientists and engineers through
to the day-to-day, hands-on knowledge about how to get the best out of
processes and machinery that shopfloor employees possess (Nonaka,
1991). Capturing and sharing such knowledge – and creating new
knowledge through experimentation and experience – is perhaps the
key task in developing competitive edge in organizations. As we saw
earlier, the ability to mobilize the problem-finding and -solving capacity
of the workforce has played a major role in creating Japanese capabil-
ity as a manufacturing nation and this model is increasingly recognized
as relevant (Hayes and Wheelwright, 1984; Senge, 1990a,b; Bessant,
1998).
But there is another pattern that is also of critical importance – the
shift from manufacturing into services. Over the past centuries we have
seen an inexorable drift from agricultural employment into manufac-
turing and, during the twentieth century, from manufacturing employ-
ment into services. Although the proportions vary by country and by
level of industrialization, overall there is a clear and continuing trend
towards the growth of the service sector, both in terms of economic
activity and as the primary source of employment.
With the rise in the service economy comes a greater reliance on
human resources to deliver, especially at the critical customer interface.
Even where services can be automated – for example, in banking and
insurance operations – the need for some form of human interaction
is still a key factor in determining competitiveness. Consumer reluc-
tance to work only with automated systems, and the need for a human
problem-solving capability for the non-standard and exceptional issues
that arise, means that there will continue to be a role for people,
even in these service businesses. In many others it is the perceived
quality of service – expressed through interactions with customers as
well as ‘back-office’ efficient processes – which makes the competitive
difference.
So, once again, the key resource that operations managers will need
to work with is the human one – particularly in terms of its flexibility,
problem-solving and creative capabilities. Operations can and will be
significantly improved through the use of technology to automate and
streamline processes for creation and delivery of products and services.
But dealing with the exceptions and managing the customer interfaces
will continue to depend on human resources, and their success will be
linked to the level of training and capability of those people.
If strategic HRM is going to play such a significant role in the future,
how will it be handled and what needs to be done? In parallel with the
362 Strategic operations management

developments outlined in this chapter, we have seen the task of enabling
the involvement of people changing. In the Ford/Taylor model, the
issue was one of hiring, firing and managing contractual and other
employment issues on a formal maintenance basis. The response was
to create a specialist function of personnel management with capabil-
ities in industrial relations, employment law and contracts, payment
systems, etc.
With the growing recognition of the potential contribution of human
resources came a need to think about the development of people
as assets – much as equipment needs retooling. Thus, the role shifted
from employment to development, with an increase in the scope of
training and the use of more creative forms of motivation (including
non-financial methods) and appraisal systems linked to career devel-
opment. Recognition of the need for changing the shape and
operation of the organization to enable people to contribute more
meant that organizational development also came into the picture.
The resulting – present-day – model of HRM is thus much more devel-
opmental in nature, addressing the individual and the organization
in a long-term fashion (Clark, 1993). Even the name of the major
professional body in the UK has changed to reflect this – from the
Institute of Personnel Management to the Institute of Personnel and
Development.
The next step in the process is likely to see an increasing shift of
responsibility for this broad set of HRM activities to operations man-
agers. As we have argued throughout this chapter, strategic development
and deployment of this set of resources may be the most important task
facing operations management in the future, and whilst professional
expertise can provide valuable help in design and implementation of
relevant structures and processes, the responsibility for HRM will be
integrated into the day-to-day and future planning role of strategic
operations management.
What do strategic operations managers need to look for in the
future? Essentially, their role will increasingly be to facilitate and
co-ordinate the activities of a highly involved and committed work-
force – and this will depend on constructing and maintaining the kind
of conditions outlined in this chapter. The challenge is to enable more
self-direction and autonomy within clear and bounded limits – the lab-
oratory for learning rather than the factory or office. Agility comes
through being able to respond and be proactive, but above all from
fast learning. In an environment where we do not know what is com-
ing, only that the challenges themselves will be new and need new
responses, enabling this agility will be key.
Human resources and strategic operations management 363

364 Strategic operations management
Case: Human resources to strategic operations at XYZ Systems
At first sight, XYZ Systems does not appear to be anyone’s idea of a ‘world-class’ manufacturing outfit. Set in a small town in the Midlands with a predominantly agricultural industry, XYZ employs around 30 people,producing gauges and other measuring devices for the forecourts of filling stations. Their products are used to monitor and measure levels and other parameters in the big fuel tanks underneath the stations, and on thetankers that deliver to them. Despite their small size (although they are part of a larger but decentralizedgroup), XYZ have managed to command around 80 per cent of the European market. Their processes are competitive against even large manufacturers, their delivery and service level the envy of the industry. Theyhave a fistful of awards for their quality and yet manage to do this across a wide range of products, some dating back 30 years, which still need service and repair. They use technologies from complex electronics andremote sensing right down to basics – they still make a wooden measuring stick, for example.
Their success can be gauged from profitability figures, but also from the many awards that they receive andcontinue to receive as one of the best factories in the UK.
Yet if you go through the doors of XYZ, you would have to look hard for the physical evidence of how theyachieved this enviable position.This is not a highly automated business – it would not be appropriate. Nor is itlaid out in modern facilities; instead, they have clearly made much of their existing environment and organizedit and themselves to best effect.
Where does the difference lie? Fundamentally, in the approach taken with the workforce.This is an organi-zation where training matters – investment is well above the average and everyone receives x hours per year, notonly in their own particular skills area, but across a wide range of tasks and skills. One consequence of this isthat the workforce is very flexible; having been trained to carry out most of the operations, they can quicklymove to where they are most needed. The payment system encourages such co-operation and teamworking,with its simple structure and emphasis on payment for skill, quality and teamworking. The strategic targets areclear and simple, and are discussed with everyone before being broken down into a series of small, manageableimprovement projects in a process of policy deployment. All around the works there are copies of the ‘bowlingchart’, which sets out simply – like a tenpin bowling scoresheet – the tasks to be worked on as improvementprojects and how they could contribute to the overall strategic aims of the business. And if they achieve orexceed those strategic targets, then everyone gains thorough a profit-sharing and employee ownership scheme.
Being a small firm there is little in the way of hierarchy, but the sense of teamworking is heightened by activeleadership and encouragement to discuss and explore issues together, and it doesn’t hurt that the OperationsDirector practises a form of MBWA – management by walking about!
Perhaps the real secret lies in the way in which people feel enabled to find and solve problems, often experi-menting with different solutions and frequently failing – but at least learning and sharing that information forothers to build on. Walking round the factory it is clear that this place isn’t standing still. Whilst major invest-ment in new machines is not an everyday thing, little improvement projects – kaizens as they call them – areeverywhere. More significant is the fact that the Operations Director is often surprised by what he finds peopledoing – it is clear that he has not got a detailed idea of which projects people are working on and what theyare doing. But if you ask him if this worries him the answer is clear – and challenging. ‘No, it doesn’t bother methat I don’t know in detail what’s going on. They all know the strategy, they all have a clear idea of what we have to do (via the “bowling charts”). They’ve all been trained, they know how to run improvement projects andthey work as a team. And I trust them …’
Summary
■ This chapter has reviewed the ways in which strategic development and deployment of human resourcescan make a significant impact on an organization’s performance. In crude terms, we have moved a long wayfrom the position at the beginning of the twentieth century, where people were seen as part of the problem,something to be eliminated or at worst kept on the sidelines because they were a source of unwanted vari-ation in the operation of carefully designed manufacturing systems. Today’s view is very different, seeing the
Human resources and strategic operations management 365
contribution of people’s flexibility and problem-solving capability as critical resources in dealing with aworld characterized by uncertainty – and in which business systems and organizations have to change on acontinuing basis. And it is likely that the future will bring increasing emphasis on the ability of organizationsto learn, to remember and to deploy their collective knowledge more effectively – again, a process thatdepends critically on the people within them.
■ Putting people at the centre of the stage rather than on the sidelines requires new approaches to theirorganization and management, and the chapter has tried to highlight the key areas in which such manage-ment needs to take place. These are big challenges for the strategic operations manager – not only does heor she have to create and implement new structures and procedures to enable and support more activeparticipation in the development and improvement of the business, they also have to play a key role in theprocess of helping the organization ‘unlearn’ some of the beliefs and accompanying practices that pushedpeople to the side of the stage.
Key questions
1 It is commonplace to hear managers and chairmen of companies
say that ‘people are our biggest asset’ – but often this is nothing
more than words. In what ways can people make a difference to the
way a business operates – and how can this potential be realized?
2 How and why has human resource management moved from a
simple concern with recruitment and reward to a more strategic
role in the business? In what ways is people management becom-
ing a central concern for strategic operations managers – and in
what ways can they enable human resources to make a strategically
important contribution to the business?
3 In the 1980s there was great enthusiasm for the ‘lights out’ factory –
a totally automated operation in which almost no people would
be required. Why do you think this idea has fallen from favour,
and why are advanced organizations in many sectors now seeing
people as a key resource in their businesses?
4 ‘The beauty of it is that with every pair of hands you get a free
brain!’ This quote from a manager highlights the potential of
employee involvement, but the fact remains that most organiza-
tions still do not manage to engage their workforce on a system-
atic and sustained basis. What are the main barriers to doing so –
and how would you, as a strategic operations manager, try and
increase active employee involvement in continuous improvement
of the business?
5 Many pictures of the future stress themes like ‘the learning organ-
ization’ or ‘the knowledge-based business’. Such visions are likely to
depend on human resources, and achieving them poses challenges
for how such resources are recruited, developed and managed.

How can strategic operations managers contribute to the design
and operation of such organizations?
References and further reading
Abraham, D. and Pickett, S. (2002) Refining the innovation process at
Texaco. Perspectives on Business Innovation (online), www.cbi.cgey.
com(8).
Belbin, M. (1984) Management Teams – Why They Succeed or Fail. London:
Heinemann.
Bessant, J. (1997) Report on Kaizen Mission. Brighton: University of
Brighton.
Bessant, J. (1998) Learning and continuous improvement. In: Tidd, J.
(ed.), Measuring Strategic Competencies: Technological, Market and
Organisational Indicators of Innovation. London: Imperial College
Press.
Bessant, J. (2003) High Involvement Innovation. Chichester: John Wiley.
Bessant, J. and Buckingham, J. (1993) Organisational learning for
effective use of CAPM. British Journal of Management, 4(4),
219–234.
Bessant, J. and Francis, D. (1999) Developing strategic continuous
improvement capability. International Journal of Operations and
Production Management, 19(11).
Bixby, K. (1987) Superteams. London: Fontana.
Blimes, L., Wetzker, K. and Xhonneux, P. (1997) Value in Human
Resources. London: Financial Times.
Boer, H., Berger, A., Chapman, R. and Gertsen, F. (1999) CI Changes:
From Suggestion Box to the Learning Organisation. Aldershot: Ashgate.
Burns, T. and Stalker, G. (1961) The Management of Innovation. London:
Tavistock.
Caffyn, S., Bessant, J. and Silano, M. (1996) Continuous improvement
in the UK. Works Management, July.
Caulkin, S. (2001) Performance Through People. London: Chartered
Institute of Personnel and Development.
Champy, J. and Nohria, N. (eds) (1996) Fast Forward. Cambridge, MA:
Harvard Business School Press.
Child, J. (1980) Organisations. London: Harper & Row.
CIPD (2001) Raising UK Productivity: Why People Management Matters.
London: Chartered Institute of Personnel and Development.
Clark, J. (ed.) (1993) Human Resource Management and Technical Change.
London: Sage.
366 Strategic operations management

Dale, B. and Hayward, S. (1984) A Study of Quality Circle Failures.
UMIST.
De Jager, B., Minnie, C., De Jager, C., Welgemoed, M., Bessant, J. and
Francis, D. (2004) Enabling continuous improvement – an
implementation case study. International Journal of Manufacturing
Technology Management.
DTI (1994) Innovation – Your Move. Department of Trade and
Industry.
DTI (1997) Competitiveness Through Partnerships with People. London:
Department of Trade and Industry.
DTI (2003) Competing in the Global Economy: The Innovation Challenge.
London: Department of Trade and Industry.
Francis, D. and Young, D. (1988) Top Team Building. Aldershot: Gower.
Gallagher, M. and Austin, S. (1997) Continuous Improvement Casebook.
London: Kogan Page.
Garvin, D. (1993) Building a learning organisation. Harvard Business
Review, July–August, 78–91.
Grindley, P. (1991) Turning technology into competitive advantage.
Business Strategy Review, Spring, 35–47.
Guest, D., Michie, J., Sheehan, M. and Conway, N. (2000) Employment
Relations, HRM and Business Performance: An Analysis of the 1998
Workplace Employee Relations Survey. London: CIPD.
Gundling, E. (2000) The 3M Way to Innovation: Balancing People and
Profit. New York: Kodansha International.
Hamel, G. and Prahalad, C. (1994) Competing for the Future. Cambridge,
MA: Harvard Business School Press.
Hayes, R. and Wheelwright, S. (1984) Restoring Our Competitive Edge.
New York: Wiley.
Hayes, R., Wheelwright, S. and Clark, K. (1988) Dynamic Manu-
facturing: Creating the Learning Organisation. New York: Free Press.
Holti, R., Neumann, J. and Standing, H. (1995) Change Everything at
Once: The Tavistock Institute’s Guide to Developing Teamwork in
Manufacturing. London: Management Books 2000.
Huselid, M. (1995) The impact of human resource management prac-
tices on turnover, productivity and corporate financial perform-
ance. Academy of Management Journal, 38, 647.
IPD (1995) People Make the Difference. Institute of Personnel and
Development.
Jaikumar, R. (1988) From Filing and Fitting to Flexible Manufacturing.
Cambridge, MA: Harvard Business School Press.
Johnson, G. and Scholes, K. (1999) Exploring Corporate Strategy, 5th
Edition. Hemel Hempstead: Prentice Hall.
Human resources and strategic operations management 367
Joynson, S. (1994) Sid’s Heroes: Uplifting Business Performance and the
Human Spirit. London: BBC Books.
Kanter, R. (ed.) (1997) Innovation: Breakthrough Thinking at 3M,
DuPont, GE, Pfizer and Rubbermaid. New York: Harper Business.
Kaplinsky, R. (1994a) The Challenge of Easternisation. London: Frank Cass.
Kaplinsky, R. (1994b) Easternization: The Spread of Japanese Management
Techniques to Developing Countries. London: Frank Cass.
Kaplinsky, R., den Hertog, F. and Coriat, B. (1995) Europe’s Next Step.
London: Frank Cass.
Kay, J. (1993) Foundations of Corporate Success: How Business Strategies Add
Value. Oxford: Oxford University Press.
Leonard-Barton, D. (1992) The organisation as learning laboratory.
Sloan Management Review, 34(1), 23–38.
Lewin, K. (1947) Frontiers in group dynamics: concept, method and
reality in the social sciences. Human Relations, 1(1), 5–41.
Lewis, K. and Lytton, S. (1994) How to Transform Your Company and
Enjoy it. London: Management Books 2000.
Lillrank, P. and Kano, N. (1990) Continuous Improvement; Quality Control
Circles in Japanese Industry. Ann Arbor: University of Michigan Press.
Luthans, F. and Stajkovic, A. (1999) Reinforce for performance: The
need to go beyond pay and even rewards. Academy of Management
Executive, 13(2), 49–57.
Miller, E. and Rice, A. (1967) Systems of Organisation. London: Tavistock.
Mintzberg, H. (1979) The Structuring of Organisations. Englewood Cliffs,
NJ: Prentice Hall.Mitchell, R. (1991) How 3M keeps the new products coming. In:
Henry, J. and Walker, D. (eds), Managing Innovation. London: Sage.
Moody, F. (1995) I Sing the Body Electronic. London: Hodder &
Stoughton.
Morgan, G. (1986) Images of Organisation. London: Sage.
Nonaka, I. (1991) The knowledge creating company. Harvard Business
Review, November–December, 96–104.
Patterson, M., West, M., Lawthom, R. and Nickell, S. (1997) The Impact of
People Management Practices on Business Performance. London: CIPD.
Pfeffer, J. (1994) Competitive Advantage Through People. Cambridge, MA:
Harvard Business School Press.
Pfeffer, J. (1998) The Human Equation: Building Profits by Putting People
First. Cambridge, MA: Harvard Business School Press.
Pfeffer, J. and Veiga, J. (1999) Putting people first for organizational
success. Academy of Management Executive, 13(2), 37–48.
Piore, M. and Sabel, C. (1982) The Second Industrial Divide. New York:
Basic Books.
368 Strategic operations management

Preece, D. (1995) In: Bessant, J. and Preece, D. (eds), Organisations
and Technical Change, Routledge Series in the Management of
Technology. London: Routledge/International Thompson.
Richardson, R. and Thompson, M. (1999) The Impact of People
Management Practices on Business Performance: A Literature Review.
London: CIPD.
Sapsed, J., Bessant, J., Partington, D., Tranfield, D. and Young, M.
(2002) Teamworking and knowledge management; a review of
converging themes. International Journal of Management Review, 4(1).
Schonberger, R. (1982) Japanese Manufacturing Techniques; Nine Hidden
Lessons in Simplicity. New York: Free Press.
Schroeder, D. and Robinson, A. (1991) America’s most successful
export to Japan – continuous improvement programmes. Sloan
Management Review, 32(3), 67–81.
Schroeder, M. and Robinson, A. (1993) Training, continuous improve-
ment and human relations: the US TWI programs and Japanese
management style. California Management Review, 35(2).
Semler, R. (1993) Maverick. London: Century Books.
Senge, P. (1990a) The Fifth Discipline. New York: Doubleday.
Senge, P. (1990b) The leader’s new work: building learning organisa-
tions. Sloan Management Review, 32(1), 7–23.
Shiba, S., Graham, A. and Walden, D. (1993) A New American TQM; Four
Practical Revolutions in Management. Portland, OR: Productivity Press.
Sirkin, H. and Stalk, G. (1990) Fix the process, not the problem.
Harvard Business Review, July–August, 26–33.
Smith, S. (1992) Factory 2000: organization design for the factory of
the future. International Studies of Management and Organisation,
22(4), 61–68.
Smith, S. and Tranfield, D. (1990) Managing Change. Kempston: IFS
Publications.
Suzaki, K. (1988) The New Manufacturing Challenge. New York: Free Press.
Stern, E. and Sommerblad, E. (1999) Workplace Learning, Culture and
Performance. London: CIPD.
Tampoe, M. (1994) Exploiting the core competences of your organ-
ization. Long Range Planning, 27(4), 66–77.
Taylor, F. (1912) Scientific Management. Hanover, NH: Dartmouth College.
Teece, D. (1998) Capturing value from knowledge assets: the new
economy, markets for know-how, and intangible assets. California
Management Review, 40(3), 55–79.
Thamhain, H. and Wilemon, D. (1987) Building high performing
engineering project teams. IEEE Transactions on Engineering
Management, EM-34(3), 130–137.
Human resources and strategic operations management 369
Tidd, J. (1989) Flexible Automation. London: Frances Pinter.
Tidd, J., Bessant, J. and Pavitt, K. (1997) Managing Innovation:
Integrating Technological, Organizational and Market Change.
Chichester: John Wiley.
Tranfield, D. et al. (1998) Teamworked organisational engineering:
getting the most out of teamworking. Management Decision, 36(6).
Van Beusekom, M. (1996) Participation Pays! Cases of Successful
Companies with Employee Participation. Netherlands Participation
Institute: The Hague.
Wall, J. (2002) Innovation based sustainability at Capital One
Financial. Perspectives on Business Innovation. Internet: www.cbi.
cgey.com(8).
Walton, R.E. (1986) Human Resource Practices for Implementing AMT:
Report of the Committee on Effective Implementation of AMT. Washington,
DC: National Research Council.
Womack, J., Jones, D. and Roos, D. (1990) The Machine that Changed the
World. New York: Rawson Associates.
Wood, S. and de Menezes, L. (1998) High commitment management
in the UK: evidence from the Workplace Industrial Relations
Survey and Employers’ Manpower and Skills Practices Survey.
Human Relations, 51, 485–517.
Woodward, J. (1965) Industrial Organisation: Theory and Practice.
Oxford: Oxford University Press.
370 Strategic operations management

C H A P T E R
The future foroperations management
10
Introduction
In this book, we have developed a strategic understanding of oper-
ations management by considering how manufacturing and service
operations have developed over the last 100 years. During this time
there has been a marked transition, exemplified by the Fortune 500,
which lists the top 500 US-based companies. When it was first com-
piled, all of these firms were manufacturing based. As the US economy
shifted towards a service base, with service firms growing in size and
economic significance, a separate listing called the Service 500 was
developed. Over time, some companies moved from the Fortune 500 to
the Service 500, as their stream of revenue from their services out-
stripped their income from the sale of manufactured goods. By the
1990s, the distinction between manufacturing and service companies
was so slight that the two lists were combined. Moreover, most, if not
all, of these firms are now global in scope, with operations on a world-
wide basis. It is this notion of a modern, global, integrated product/
service firm that has been the focus of previous chapters’ discussions
on contemporary operations management practice.
A key feature in this, of course, will be the extent to which the
Internet empowers companies and consumers. Already it is possible
for Internet users to exchange goods using ‘e-credits’, which perform
the same function as money but have no value except on the Internet.
It has contributed significantly to the notion of Lester Thurow’s vision
of a global village, in which ‘neighbours’ can trade or barter with each

372 Strategic operations management
other, just as they used to before the world became so complex. As
Thurow says: ‘For the first time in human history, anything can be
made anywhere and sold anywhere.’ Davis and Meyer (1999) predicted
the emergence of powerful consumer groups, made up of very large
numbers of like-minded people. They suggested a notional ‘Value 500’
of such groups, which will be the consumer equivalent of, and rival to,
the Fortune 500. This has still to happen, but seems to fit with the ways
in which global markets are developing. The ability of consumer groups
to mobilize their collective will has always been important, with some
groups having notable successes, such as those concerned with US
automobile safety, led by Ralph Nader, the Campaign for Real Ale
(CAMRA) in the UK, and current popular concern in Europe with
respect to genetically modified foods. Such mobilization has previously
been difficult due to the relative isolation of each consumer. The
Internet overcomes this isolation and enables each consumer to, first
of all, identify like-minded souls and then to communicate with them
extremely quickly and on a very large scale.
The immense impact of global terrorism that occurred in the first
4 years of the twenty-first century also holds special challenges for
operations management – especially in the assumptions that may be
made about geographical locations and logistics. The costs of security
(for example, in air freight) are great but they must be borne by pro-
ducers who are also facing intense price-driven competition.
The future challenges for operations management
So, what are the future challenges for operations management? What
lies ahead for managers concerned with the value creation processes
discussed in this book? In this final chapter, we focus on three of the
central challenges: we cannot foretell the future, of course, but we
hope we can set the scene. The three challenges are: managing global
growth, understanding and gaining competitive advantage from
e-commerce, and achieving environmental soundness in operations.
We shall examine each of these in turn.
The challenge of global growth
As newly industrializing countries seek to achieve widespread improve-
ments in quality of life and political stability, so their industries simul-
taneously present new consumer markets and new sources of products

and services to the world. In such countries, labour costs are low, devel-
opment grants are available to tempt inwards investors, and local mar-
kets are homogeneous and tolerant.
These were the conditions within which mass production was born at
the end of the nineteenth century. Now, widespread communications
mean that consumers in newly developing countries are aware of the
array of products and services from which their counterparts in the West
may choose, and want some of the same for themselves. While it may
be true, at the end of the twentieth century, that three-quarters of the
people in the world had never used a telephone, influences such as tele-
vision and American feature films are effective stimulants for demand in
new consumer markets. More significantly, the growth of mobile phone
technology has become common place throughout the world.
Within this context, while many of the challenges relate to inter-
national (or global) marketing, it is clear that operations strategy is
of pivotal importance. The windows of opportunity for commercial
exploitation that appear as developing countries emerge as potential
manufacturing bases may be brief. Developing countries must export
to earn foreign capital, but will inevitably import goods as well. Once
goods produced for Western markets are available in developing coun-
tries, the nascent consumers there will begin to demand Western levels
of quality. This may seem obvious but the implications for operations
management are immense.
Under mass production principles, the typical practice in setting up
a manufacturing plant in a developing country would be a compromise –
based upon low expectations of competence in workforces and local
management. The local government’s motivation for allowing in a for-
eign investor would be jobs (and thus prosperity) and a chance to
export – at least to elsewhere in its region. For the investor, however,
the primary motivation would be sell goods in the host country – and
perhaps in those surrounding it: the expectation would be that prod-
ucts made in the new plant would not be acceptable for import to the
home country of the investor. The opportunity for its firms to hit the
affluent export markets of the West (where the real money lay) would
thus be very limited for the host country. In this practice, products or
component parts that were considered good enough for export would
typically be separated out from a batch – leaving those of inferior qual-
ity to be sold to the local market. Now, as soon as the local market has
experienced (albeit vicariously) export quality, and has the income to
allow it, such consumers may be expected not to accept second best.
The wish of the developing country’s government to achieve export
income is, of course, very much in tune with foreign investors’ wishes
The future for operations management 373

to play global games with their capacity – reducing the need to trans-
port goods around the world. The strategy in some manufacturing
industries is now to produce for local requirements in each region and
then cross-ship products from one region to another to create niche
(smaller quantity) markets. Thus, for example, when Honda began to
produce the Accord in the USA in the mid-1980s, it developed a popu-
lar two-door coupé model for local tastes, and found that it could ship
it to Japan as a niche vehicle there (in left-hand drive – the ‘wrong’ side
for Japan, but very fashionable in Tokyo). In this way, Honda was treat-
ing the USA as a developing country but naturally exploiting the devel-
oped manufacturing ability that existed there (although it had fallen
behind world-class levels by the 1980s). The coupé was also sold in
Europe (and the USA) and, later in the 1990s, Honda used the replace-
ment model to introduce its V6 engine to the Accord range in Europe
(i.e. in small numbers, as a niche product).
While playing a global game with capacity has been a central part of
corporate strategy since the days of Henry Ford, actually exploiting
global positions and developing economies in the present day requires
redefined excellence in operating strategy. In the expansion of mass
production in the early part of the twentieth century, American firms
showed Europeans (and subsequently others) how to apply Taylorism
and Fordism, both for local consumption and for regional exports.
The same happened with the Japanese in the 1970s and 1980s, as lean
production was rolled into North America and Europe.
Some of the rationale for global manufacturing relates more to
financial and marketing matters than operations – and there are cases
where, despite excellence in manufacturing, firms have met failure.
For example, the well-respected firm Hewlett Packard moved produc-
tion of its disk drives from the USA to Malaysia in the early 1990s, in
order to benefit from low taxation in the developing country. In fact,
the market for these products collapsed shortly afterwards and HP
made losses in the Malaysian operation. Had the production facility
been in the USA, HP could have set these losses against its profits
there. Having moved to Malaysia, however, this was not possible. HP
was thus unable to reduce its tax burden in the USA and was faced with
operating losses in Malaysia – the worst of both worlds. The lesson is
that, no matter how good the manufacturing is, globalizing business
may not always be the best path.
This has developed further into the partial or even complete exit
from manufacturing of many product-related firms (including HP).
Instead of producing laptop computers, for example, most of the main
brands have moved to outsourced production – thereby avoiding some
374 Strategic operations management

of the difficulties of global networking, by leaving them to the special-
ist firms that have grown up to address them. This is a trend that may
be expected to continue – at least until international agreements on
such things as environmental impacts (and thus costs) of large-scale
logistics, and perhaps the intolerable risks of terrorism, are established
and addressed.
Globalization and service operations
It can be argued that the internationalization of manufacturing has
been one of the key drivers of service firm internationalization. Airlines,
hotels and banks have expanded into countries in order to serve their
globalizing customers, especially business travellers, who visit and work
outside their home country. Thus, the average split between domestic
and foreign business in the hotel industry is 50:50 worldwide. Some of
the early growth in international hotel development was linked directly
to the airlines’ desire to have suitable accommodation available for
their passengers. For instance, TWA developed the Inter-Continental
chain and Air France the Meridien brand. Increasingly, service firm
international expansion is fuelled by scale economies that can be lever-
aged from strong brands, loyal customers and centralized facilities,
especially reservations and distribution systems.
Inward investment is both capital intensive and risky. The political,
financial, economic and social circumstances in a country may vary
widely. Hence, service firms have developed alternative strategies for cre-
ating brand presence without a high degree of financial investment. The
two most common alternatives are franchising and management con-
tracting. These two alternative business formats both involve collabor-
ation between the international service firm and a local investor. In the
case of a franchise, the franchisee typically builds or leases the local
infrastructure, such as the restaurant, hotel or retail outlet, and agrees to
run the business in conformance with the precise system developed by
the franchisor. McDonald’s, Holiday Inn and the retail division of
Benetton are examples of highly successful global service firms that have
adopted this approach. A management contract, on the other hand,
involves the local developer appointing an international firm, such as
Hyatt Hotels, to manage and operate their business on their behalf.
It is clear that internationalization for service firms is of itself a chal-
lenge. The geographic distance between operating units, the differences
in the environmental context, local market and labour conditions all
create an operations challenge with regards to successful, consistent
The future for operations management 375

performance, especially if the service is strongly branded. However,
the lack of direct control over the business through the adoption of
these alternative business formats creates an additional challenge.
There are three main forms of control: centralizing, which means that
all decisions are taken by senior managers, usually at corporate head-
quarters; bureaucratic, which involves highly detailed policies and pro-
cedures limiting subordinate discretion; and socialization, which is
largely through the adoption and dissemination of a shared organiza-
tional culture, especially amongst operational managers.
In the past, firms tended to attempt to exert a very strong control
over their service offering so that the customer experience was as iden-
tical as possible wherever the customer was in the world. Service firms
that owned and operated their own units were typically centralized,
and those that franchised or contracted their expertise were highly
bureaucratic. Increasingly, however, service firms are tending to adopt
the slogan ‘think global, act local’, recognizing that even their inter-
national travellers welcome some adaptation of the provision to reflect
the destination or region in which the operation is located. As a result,
there has been a reduction in centralization and bureaucracy and an
increase in socialization control over operational units. For instance,
hotel management contractors typically move their managers from
one hotel to another every 2 years, despite hotel owners’ expressed
preference to retain managers for longer. The firm believes that keeping
managers on the move supports and reinforces the firm’s organizational
culture.
There is some evidence emerging to suggest that hybrid firms, those
that own and manage their own operations and franchise them, have so-
called ‘plural processes’ (Bradach, 1998) that help them outperform
firms that rely solely on one business format. Such processes include:
■ modelling – franchise operators model themselves on company-
run units, thereby encouraging the adoption of system-wide
standards;
■ ratcheting – the juxtaposition of company-owned and fran-
chised units encourages benchmarking across the two, thereby
creating a climate of friendly competition, with each trying to
outperform the other;
■ local learning – the franchisee’s closeness to their market
enables the firm to learn quickly about local market conditions;
■ market pressure – corporate staff services developed to support
operations are exposed to market conditions when franchisees
can opt out of utilizing these services;
376 Strategic operations management

■ mutual learning – hybrid firms have a more diverse source
of new ideas and alternative range of screening processes
than those available to firms operating within one business
format.
The role of operations in corporate expansion
The spirit of business in the twenty-first century reveals that there is no
‘one best way’ to follow in managing operations. There is also a range
of approaches available to the operations strategist – those concepts we
have discussed earlier. As corporations expand, they find the manufac-
turing management techniques and the process of knowledge exchange
are such that new plants in developing countries can be expected to
work at world-class levels almost immediately.
In describing how some expanding firms address this phenomenon,
observers in the West have captured the strategic approach under the
rather unfortunate sobriquet of ‘the China box’. The name of China
(i.e. the country) appears because that is where this concept has most
resonance until now, but it could be any developing country. It is import-
ant for this discussion because it illustrates very clearly the changing
nature of the challenges that operations strategy must address. It works
as follows:
Let us say an American firm wishes to set up a manufacturing facility
in a developing Asian country. It already has world-class manufacturing
facilities in California but it needs to exploit the growth of the domes-
tic market in the developing country, simultaneously providing a base
for exporting to other Asian countries (and, possibly, Europe and
North America).
Traditionally, this firm would have shipped old production tooling
(dedicated machinery, fixtures, factory equipment, etc.) and old work-
ing practices to the developing country, seconded managers from its
US plants, recruited a local workforce to assemble kits of components
sent from suppliers in the USA, and expected the local quality to be
poor. This last factor would provide a very useful political argument
(i.e. when dealing with the local government’s industrial policy mak-
ers) for not buying local components – since the quality would be infer-
ior and the products made could not subsequently be exported.
(Ironically, in practice, these arguments often included the claim that
the production costs were too high to warrant selling the components
or products on the export market: an anomaly in light of the primary
reason for manufacturing in the country – inexpensive labour.)
The future for operations management 377

The order of events in the old way of doing things, therefore, was:
negotiate development grants, build factory, recruit staff, import parts,
export the good products, sell others locally. The plant would start to
assemble products to sell locally and the consumers in the developing
country, who were used to this and accepted this poor quality, would
buy them. Politically, this was not good news for anybody: the local pro-
duction would be considered token at best and the workforce treated
poorly. In the 1980s, the term ‘screwdriver plants’ was used to describe
such facilities – the operatives did nothing but screw together imported
parts. Since labour costs were low, the local operation did not add much
value and thus did little for the country’s gross domestic product. In
addition, of course, the local operatives and managers did not learn
very much about international standards of operation – a situation
which would suit the investing firm well but not please the host country.
By the time our American firm starts to plan its new plant, however,
the developing country has begun to seek to increase its added value
and will require the American firm to purchase components locally – to
increase its ‘local content’. No foreign investor is going to do this vol-
untarily, and the government may have to implement an ‘import sub-
stitution’ policy – banning the import of selected items it wants to have
made locally. Even in the absence of such a severe measure, the nature
of local content is political rather than economic: extending the manu-
facturing base to the suppliers means increasing the number of jobs
(a proxy for votes!). Also, the degree of learning and skills development
within the local workforce is much higher if the proportion of manu-
facturing done locally is higher. For these and other reasons, the host
country’s government may be expected to push for a high local content.
Leaving aside the political manoeuvring in negotiations between for-
eign investors and governments, this would mean the investing firm
must consider local supply sources rather than simply importing kits.
Just as service firm infrastructure has always had to conform to
international standards of performance, so manufacturing investment
also has to be world-class. The nature of foreign investment for pro-
duction facilities, an essential part of corporate growth, has changed
from one of assembly to one of more extensive manufacture and sup-
ply management. This can no longer be based on the principle of
transferring old tooling and working practices, however, as the final
products simply won’t work if they are made from poor components.
In our case, the practices in the Asian plant will begin to reflect world
standards. (When the Japanese did this in North America and Europe
with lean production in the 1980s, the term ‘transplant’ was born; the
Japanese, not surprisingly, never liked it!)
378 Strategic operations management

The combination of local tastes and wealth, and the political
unacceptability of maintaining old practices in developing countries, has
led to a situation where the American firm in our case has to be sure that
the plant will be making products to world-class levels from the start –
there is almost no room for ‘ramp-up’ (producing substandard products
for a period during which the workforce gradually learns the operations).
There is another pressure here which impacts further on operations
strategy. The dynamic nature of the consumer market will probably
mean that the life cycle of the product to be manufactured in this plant
will be short. Any dedicated technology linked specifically to that prod-
uct (or version of the product) therefore must be paid for during a
short period. If this has to include a ramp-up period, the time for
which the operation is creating revenue (to pay off the investment and
produce profits) may be very limited. The traditional approach to this
is to use low-technology production in such plants, so that there are no
highly specific assets (specialized tooling) to write off. This, coupled
with low labour costs and low skills (at least, as perceived by those in
the West), has meant operations in developing countries have trad-
itionally remained primitive. A combination of the need to produce
world-class products and the political pressure of developing country
governments has begun to change this situation.
The ‘China box’ idea now arrives. Instead of building a factory to
assemble imported parts, the manufacturer has to set up local supply
lines for components, materials and services. As these are constructed
(they may include setting up local component plants, and getting the
American firm’s existing suppliers to move abroad too), the workforce
for the new operation must be recruited and trained – to work at
world-class levels. When the supply lines are in place and the workforce
trained, the plant can start to operate – and rise to world-class levels in
a space of time that allows it to produce revenue soon enough to pay
for any product-specific investment before the product’s life ends. To
keep this time to a minimum, the technology is not installed until the
last moment (when, in the imagery of the metaphor, it is ‘put in a box
in California and dropped into place in China’ – the lines of supply are
all plugged in and the switch is thrown!).
As firms move internationally, therefore, the strategic checklist
changes. In order to succeed with such investments it is necessary to do
the following:
1 local supply lines must be set up;
2 operative and management competences in developing coun-
tries must be developed to world-class levels;
The future for operations management 379

3 a quick start-up must be planned and managed, to ensure suf-
ficient revenue generation over the life of the product, linked
to specificity of the technology employed.
The challenge for operations strategy, then, is to plan the response to
the new requirements of such expansion: how to find and prepare new
suppliers; how to train an immature workforce; how to achieve quick
start-up and start generating revenue.
There is one more aspect to include before we can start to design
our strategy: the long-term time frame. This is illustrated by a case of
the European power generation company, GEC Alsthom – a firm that
was very active in China in the early 1990s.
As in many new industrializing countries, the lack of electricity distri-
bution infrastructure in China, coupled with hostile terrain and long
distances, means that power generation for local communities may be
expected to rely on local installations, rather than a national grid. (The
same situation in telecommunications means that some countries are
moving straight to wireless, cellular phone systems – or even satellite –
rather than invest in laying cables through mountain ranges, and so
on.) In the early 1990s, therefore, this company sought to sell local
installation power stations to the Chinese government. The traditional
way of doing this – an approach with its roots firmly secured in several
centuries of European empires – would be to retain the ‘know-how’
back home and give the local people just enough knowledge to operate,
thereby maintaining dependency. The Chinese government, however,
understood this well and also recognized the massive opportunity that
the size of their country and population represented for investors from
the West. GEC Alstom, therefore, was set an ultimatum by the Chinese:
installation projects could be undertaken over a 10-year period, start-
ing with total import of technology and modest local purchase. By the
second or third project, however, some proportion of technology
(know-how) should have been transferred to the local managers and
local content should be increased to a certain level. At the end of the
10 years, the Chinese stipulated, all of the know-how should have been
transferred – meaning that Chinese firms would then be able to design
and build their own power stations. This is clearly a political decision –
the period of 10 years is the offer the Chinese made to negotiate the
exchange of knowledge. Our power generation firm thus had to make
the investment pay over the short period, possibly putting in place
longer-term agreements for further business on slightly different bases
(for example, the R&D expertise transferred with the business might be
insufficient to support development of entirely new technologies).
380 Strategic operations management
The situation was made difficult in this case by a surprise on the local
content front: GEC Alstom had planned to satisfy part of the local con-
tent requirements by buying its steel locally. This is an obvious choice,
since steel is heavy, relatively low value and can be easily procured in
most newly industrializing countries. When this was mooted, however,
the firm was told by its clients that they considered local steel to be of
inferior quality (an impression not based upon fact: Chinese steel was
perfectly adequate for the job); so, steel had to be imported and other
local purchases sought to satisfy the local content requirements.
The case of Japan
During the difficult times of the 1990s, Japanese manufacturers needed
to increase their imports from their neighbours in South East Asia, for
political reasons (to establish themselves as the protector of the region –
the phrase they used was the ‘shock absorber’), despite the unemploy-
ment problems that beset them at home. (Japan’s recession began in
1993 and lasted for a decade, resulting in profound changes to the
commercial fabric of the country. By December 2001, the unemploy-
ment rate had reached 5.5 per cent – higher than that in the UK or
USA.) In May 2003, after a brief respite, the economy was said by inter-
national analysts, Merrill Lynch, to be on the brink of returning to
recession.
Investments in overseas manufacturing facilities, set up during the
time of the high yen, were reviewed. As lead times to markets short-
ened, Japanese companies considered bringing business back into
Japan, but still planned to buy from abroad (especially within Asia)
those items for which they could establish stable supply. Meanwhile,
Japanese labour costs were high and it did not make sense to make
items there that could be made abroad with confidence. Thus, less
demanding, less volatile product types were produced in overseas
plants (e.g. PC motherboards in Taiwan, components in ASEAN coun-
tries), with new products being made in Japan. Such components
could not be classed as ‘low technology’, however: NEC and Sharp
both set up plants in China in which large-scale integrated circuits and
flat-screen display panels were produced.
In all cases, the spread of international operations was clearly an
influence on the apparent changes in supply strategy for the Japanese;
their system of inter-firm supply relationships worked well on a
national level but, as observers pointed out in the late 1980s, it could
not be expected to operate in the same manner on an international
The future for operations management 381

scale. As Japan looked to the countries of East Asia both for external
manufacturing facilities, including material and component supply
bases, and for sales markets, it was possible to envisage the Japanese
way of managing supply taking a hold there. The influence of North
American market perspectives was clear, however – just as the influ-
ence could be seen in the opposite direction (evidenced by the divest-
ment of large amounts of vertically integrated divisional business by
American corporations during the 1990s).
Component suppliers in Japanese capital equipment and automo-
tive industries had always faced pressure from their customers (i.e.
assemblers of final products) to purchase components in Japan, due to
scepticism over quality and reliability of imported parts. This was not
the case in the consumer durable industries, where the assumption was
that if a product failed in use, it was simply thrown away and replaced
(a ‘consumer disposable’). The caution in the Japanese capital equip-
ment and automotive industries lessened during the 1990s, however, as
local suppliers who worked with overseas Japanese plants learned how
to produce to Japanese standards of quality, reliability and cost control.
This development, coupled with Japan’s need to be a strong player
in a strong region, maintaining its technological lead, led to more
offshore activity by Japanese companies in Asia (and, indeed, to
non-Japanese Asian firms buying into corporate Japan).
The business that Japan placed in East Asia consisted of stable tech-
nologies and products rather than those that might be termed innovative,
and thus higher margin. The potential existed in Japan for development
of firms to design, engineer and produce the newer technologies,
thereby retaining the leading-edge thinking at home.
Setting up a plant in one country is, of course, only part of the
expansion picture. For multinational or global operation it is necessary
to establish a logic that binds individual plants and offices into a com-
prehensive whole. To explain this, and to summarize this part of the
chapter, we use Shi and Gregory’s framework for considering inter-
national operations strategy, which is shown in Table 10.1. In this, manu-
facturing plants are categorized as product or process specific (or not),
sometimes linked to a specific host country market.
The impact of globalization on operations management
The rise of globalization has clearly necessitated a complete rethink
for some firms in terms of how they can organize and reconfigure
themselves. Firms have to equip themselves in order to compete in
382 Strategic operations management

these global markets and two other factors – focus and agility, which we
will discuss later in the chapter – are often key means of doing so. Many
markets now contain a number of global players. This is true of both
manufacturing and service sectors, and indications of this are provided
in Chapter 2. When Boeing and McDonnell Douglas, the US aircraft
makers, completed their $13.3 billion merger in 1997, Philip Condit,
the former combined group’s CEO, said that one of the main reasons
behind the merger was (Financial Times, 19 September 1997):
We are moving, I think, inexorably towards a global economy.
Globalization impacts on operations management in a number of
ways, including:
■ capacity (locations and levels at each plant);
■ skills requirements and employment levels in production;
■ plant technology and supplier relations – which have to be con-
figured in a plant-specific way in order to deal with the peculiar
requirements of each plant but managed as a global network.
The future for operations management 383
Table 10.1Taxonomy of international operations strategies
Operations location Domestic/multidomestic orientation Global orientation
Domestic Home country operations with domestic Home country operations with customers and suppliers. General purpose global sourcing, marketing and or no focused plant strategy distribution. Product or process
plant strategy
Regional World is divided into regions containing Operations are regionally common requirements, culture and divided but with product or practices. Operations are located in each process plant strategies for each region and tailored to them, with a site. Each site can thus serve the market plant strategy. Very few links rest of the world. Global between regions sourcing
Multinational Multiple locations, dispersed internationally, Corporate value-adding chains taking advantage of low-cost resources. are located to exploit optimal May adopt a general-purpose plant strategy resources and strategic or a strategy focused on product or capability. Global logistics, global process. Sourcing may be local or a sourcing and global brandscombination of local/international
Worldwide Market plant strategies with maximum Product market, product and market coverage worldwide. Separate, process plant strategies autonomous plant strategies employed, providing global
products as well as global brands
Source: adapted from Harland et al. (1999, p. 656). Based originally on Shi and Gregory (1994).

Managing growth into other countries’ territories is a difficult task for
the firm and there is no one, single best, way to do so. The firm can set
up its own subsidiaries, buying existing local companies, or through
alliances. Some companies prefer internally generated expansion,
others seem to profit from acquisitions. For example, the major car
firms have expanded mainly without acquisitions. For the Americans in
the early decades of the twentieth century, this was by building so-called
transplants (Ford set up in Manchester, UK, in 1927) – a strategy fol-
lowed by the Japanese in the 1980s. The New United Motor Manufactur-
ing Industry (NUMMI) venture in Fremont, California, involved Toyota
and GM. Toyota showed GM how to work with lean production – then
unknown, but now recognized as the best practice in that industry –
while GM allowed Toyota to gain a foothold in the USA. The same
strategy has worked elsewhere, usually including some help for an ailing
national champion from the inward investor (e.g. Honda and Rover
in the 1980s).
By contrast, leading pharmaceuticals groups in the 1990s consoli-
dated their positions with mergers such as the Glaxo–Wellcome
merger in the UK, and we saw the same strategy being pursued in the
Boeing–McDonnell Douglas merger in the aircraft industry. Inter-
national service firms have tended to adopt franchising or management
contracting as their strategy. For instance, hotel chain expansion, by
chains such as Hilton, Sheraton and Holiday Inn, has largely been
through agreeing management contracts with hotel owners and devel-
opers in major destinations. The recent expansion of Marriott Hotels
has been a joint venture, on a corporate franchise basis, with Whitbread,
the brewing giant. In the restaurant sector, franchising has been the
preferred strategy. Such strategies allow expansion and multi-unit
growth to occur using the financial resources of the other party, as well
as the specific country expertise of the franchisee.
Similar things are now happening in manufacturing. Some firms set
up plants in strategic geographic areas and employed local staff. For
example, Du Pont moved its electronics-related businesses to Japan,
Siemens shifted its air traffic management to Britain, and Hyundai
located its personal computer business in the United States. Other
firms form alliances whereby functional specific responsibilities are
allocated to the alliance firms and the ‘host’ country will often be
responsible for local distribution. Many high-tech firms are global in
intent and markets consist of firms from around the world.
An interesting approach now called ‘the China box’ in common man-
agement parlance is intended to address two key requirements of global
set-up: the need to reach competitive output rates (in cost, volume and
384 Strategic operations management
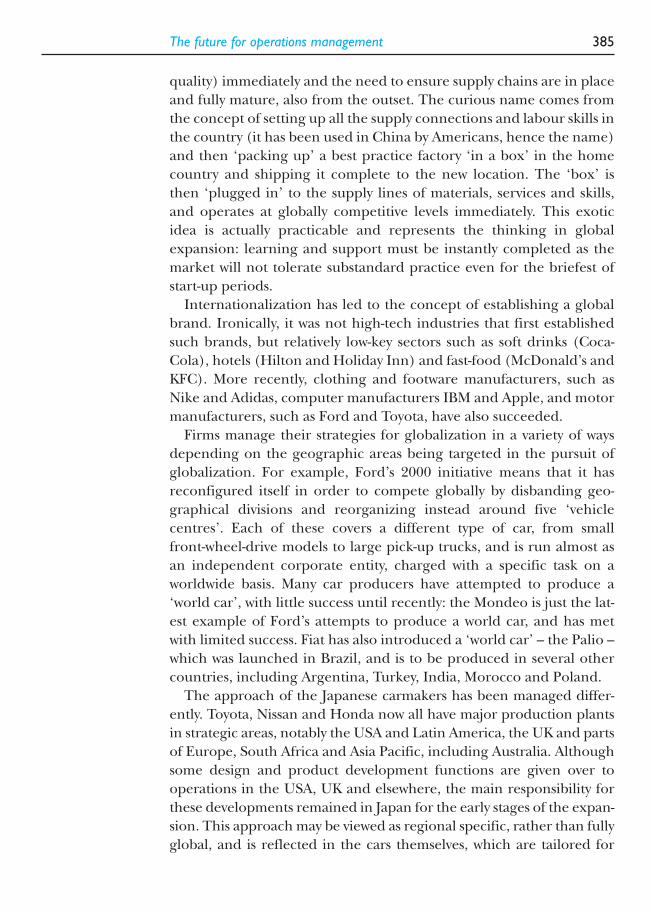
quality) immediately and the need to ensure supply chains are in place
and fully mature, also from the outset. The curious name comes from
the concept of setting up all the supply connections and labour skills in
the country (it has been used in China by Americans, hence the name)
and then ‘packing up’ a best practice factory ‘in a box’ in the home
country and shipping it complete to the new location. The ‘box’ is
then ‘plugged in’ to the supply lines of materials, services and skills,
and operates at globally competitive levels immediately. This exotic
idea is actually practicable and represents the thinking in global
expansion: learning and support must be instantly completed as the
market will not tolerate substandard practice even for the briefest of
start-up periods.
Internationalization has led to the concept of establishing a global
brand. Ironically, it was not high-tech industries that first established
such brands, but relatively low-key sectors such as soft drinks (Coca-
Cola), hotels (Hilton and Holiday Inn) and fast-food (McDonald’s and
KFC). More recently, clothing and footware manufacturers, such as
Nike and Adidas, computer manufacturers IBM and Apple, and motor
manufacturers, such as Ford and Toyota, have also succeeded.
Firms manage their strategies for globalization in a variety of ways
depending on the geographic areas being targeted in the pursuit of
globalization. For example, Ford’s 2000 initiative means that it has
reconfigured itself in order to compete globally by disbanding geo-
graphical divisions and reorganizing instead around five ‘vehicle
centres’. Each of these covers a different type of car, from small
front-wheel-drive models to large pick-up trucks, and is run almost as
an independent corporate entity, charged with a specific task on a
worldwide basis. Many car producers have attempted to produce a
‘world car’, with little success until recently: the Mondeo is just the lat-
est example of Ford’s attempts to produce a world car, and has met
with limited success. Fiat has also introduced a ‘world car’ – the Palio –
which was launched in Brazil, and is to be produced in several other
countries, including Argentina, Turkey, India, Morocco and Poland.
The approach of the Japanese carmakers has been managed differ-
ently. Toyota, Nissan and Honda now all have major production plants
in strategic areas, notably the USA and Latin America, the UK and parts
of Europe, South Africa and Asia Pacific, including Australia. Although
some design and product development functions are given over to
operations in the USA, UK and elsewhere, the main responsibility for
these developments remained in Japan for the early stages of the expan-
sion. This approach may be viewed as regional specific, rather than fully
global, and is reflected in the cars themselves, which are tailored for
The future for operations management 385
each distinct market, as opposed to the ‘world car’ platforms emanating
from Ford. The impact of globalization on operations management was
highlighted by Business Week (22 September 2003):
386 Strategic operations management
Strategic operations and globalization
Trend Micro is among a new breed of high-tech companies that’s defying conventional wisdom about how corporations ought to operate. While most large companies have extensive worldwide operations, these companies go much further – aiming to transcend nationality altogether. C.K. Prahalad, a Professor at theUniversity of Michigan Business School, calls this the fourth stage of globalization. In the first stage, companiesoperate in one country and sell into others. Second-stage multinationals set up foreign subsidiaries to handleone country’s sales. And the third stage involves operating an entire line of business in another country.
What’s different about these outfits – call them transnationals – is that even the executive suite is virtual.They place their top executives and core corporate functions in different countries to gain a competitive edgethrough the availability of talent or capital, low costs or proximity to their most important customers.TrendMicro’s financial headquarters is in Tokyo,where it went public; product development is in PhD-rich Taiwan; andsales is in Silicon Valley – inside the giant American market.When companies fragment this way, they are nolonger limited to the strengths, or hobbled by the weaknesses, of their native lands. ‘This is very new, and it’simportant,’ says Prahalad.‘There’s a fundamental rethinking about what is a multinational company,’ he says. ‘Doesit have a home country? What does headquarters mean? Can you fragment your corporate functions globally?’
There has long been talk of the stateless corporation – Business Week even ran a cover story on it in 1990.Yet the dispersal of key corporate functions takes the idea one step further, and it is made possible by advancesin technology, especially the Internet. Harvard Business School Professor Christopher A. Bartlett saysimproved communication is allowing an evolution toward ‘an integrated global network of operations’.To dealwith the gaps between time zones and cultures, these tech transnationals operate like virtual computer net-works. Thanks to the Internet, they can communicate in real time via e-mail, instant messenger or Web video-conferencing. Over time, these scattered experiments could coalesce into a powerful new model for business.Bartlett and other management experts say the strategy of truly globalizing core corporate functions is applicable for all kinds and sizes of companies.
Tech’s transnationals are popping up all around the world.They range from business-intelligence-softwaremaker Business Objects, with headquarters in France and San Jose, CA, to Wipro, a tech services supplier with headquarters in India and Santa Clara, CA, to computer peripherals maker Logitech International,with headquarters in Switzerland and Fremont, CA. While no one tracks the numbers, Business Week
interviewed executives at a dozen such companies, and new ones keep popping up. For instance, 24/7Customer, a business services provider with headquarters in Los Gatos, CA and Bangalore, India, just raised$22 million from Silicon Valley venture capitalists.
Source: Hamm, S. (2003) Borders are so 20th century. Business Week, 22 September, p. 68.
Investment in global operations
We need to bear in mind that the very presence of globalization may
determine the very definition of what manufacturing operations are
about. As Industry Week ( June 2003) observed:
‘Manufacturing’s definition will evolve with global product innovation,’
contends Edward P. Campbell, President and CEO of Nordson Corp.,
a Westlake, Ohio-based maker of precision dispensing equipment.
‘Manufacturing can no longer be thought of as simply fashioning
products using industrial machines,’ he says.‘It is more accurately a
process of defining products, integrating operations, implementing
strategies and having proprietary rights.’
Many US and European companies have invested in globalization
efforts in their operations (Industry Week, June 2003, p. 22):
The increasing globalization of US manufacturing companies has taken a
huge evolutionary leap in recent years that on the surface appears as a
mass exodus of US-based production. Most notably, China’s rising
economic status has both cast a dark shadow on US industry and
opened a passage to sunny prospects. … Companies from beyond its
borders poured $52 billion into China last year. … Some 400 of the 500
largest US companies are doing business in China these days, estimates
Yang Jiechi, China’s Ambassador to the United States.
However, firms do not always devolve all responsibility to operations
in other countries, but may choose to be selective about what is out-
sourced (Industry Week, June 2003, p. 27):
‘We are very selective as to what we put into the various countries,’
explains Gustafson, President and CEO of Emhart Teknologies, a New
Haven, Conn.-based maker of fasteners and other products used in the
assembly of goods and a unit of Black & Decker Corp. … Manufacturing
decisions are based on capabilities and value added. ‘We look very hard at
developing increasingly higher value-added products, and the higher value-
added products we keep in the areas where we want to protect the
technology. The lower value added we would put into a purely low-cost
environment,’ says Gustafson. For example, for stud-welding systems used
in the automotive industry, products are designed primary in Germany,
Japan and the US.The electronics and sophisticated hardware and
software that go into the systems also come from company facilities in
those countries. But such things as cabinets, frames and wiring harnesses
are done in places like the Czech Republic and Mexico. ‘Then we bring
them all together in the US, Germany or Japan,’ explains Gustafson.
A number of companies have seen alliances as a way to manage the
opportunities of expansion in China and a few of these are listed below
(Business Week, 28 October 2002, p. 80):
■ Alcatel. French telecom giant has taken control of a Shanghai
equipment producer and is expanding research operations,
hoping that Shanghai will account for 15 per cent of R&D.
The future for operations management 387

■ General Electric. Just started work on a large, basic research
centre in Shanghai. The facility will also assist in GE’s pro-
curement of Chinese-made plastics and other materials.
■ Intel. Operates five Chinese labs, some of which have moved
beyond semiconductor research. One is investigating better
human/machine interfaces.
■ Matsushita. Japan’s largest consumer electronics company will
spend $330 million on a Chinese R&D centre, boosting the
number of engineers from 110 to 1500 by 2005.
■ Microsoft. Working with the State Development and Planning
Commission, it will spend $750 million over 3 years on research,
training and outsourcing in China.
■ Siemens. Expanding mobile phone research while helping
Chinese government researchers devise an advanced 3G wire-
less standard for use worldwide.
The UK no longer has its own high-volume car production company
but has become, instead, a host nation for other transplants. Rolls
Royce was sold in 1998 and Rover had been sold to BMW in 1994.
Britain now acts as host to a number of major players. But the strategic
significance of this development for the UK is evident in the following
(Standard and Poor’s Industry Survey, 3 June 1999):
In the case of every plant, from General Motors’ Astra-producing facility
at Ellesmere Port, a few miles from Halewood on Merseyside, through
Nissan’s at Sunderland,Toyota’s in Derbyshire, Honda’s at Swindon, to
the Rover and Land Rover plants of the Midlands, ultimate decision-
making lies not in the UK but in the boardrooms of Detroit, Munich
and Tokyo. As global competition sharpens, whether these plants live,
wither or die will depend almost entirely on performance.
That is a telling, and rather damning, statement for the UK which, at
one time, had an active, British-owned, car industry.
Globalization can have massive implications for operations manage-
ment and, as we have discussed, this can entail substantial investment
in plant. This investment by itself will not ensure success of global aspir-
ations, but it is a necessary feature in many industries. There are many
sectors where firms continue to struggle to globalize their business and
establish their brand. Despite huge investment and an established brand
name, Disneyland Paris has undergone significant difficulties since its
launch in 1992. Major international firms in other sectors, such as
British Airways, Sears the retailers and DuPont, are currently engaged in
388 Strategic operations management

establishing their global presence, not without problems. Underpinning
their success is a range of operations-specific areas, which combine to
form a major part of operations strategy. These areas include capacity,
skill requirements, plant technology, strategic alliances with suppliers
and other, long-term partnerships with key stakeholders in the business.
The contrast between US, European (particularly in the UK) manu-
facturing and other areas of the globe is particularly noticeable in
China. Business Week perfectly captured the challenge from China:
The future for operations management 389
The Chinese challenge
A few years ago, the idea would have been laughable. China was a place to make sneakers, not semiconductors.But to many of Silicon Valley’s movers and shakers, the spectre of Chinese competition is no longer a joke.Recent developments inside China – and a few beyond its borders – have reshaped the lens through which foreign multinationals view the world’s most populous country. Over the next 10 years, China will become ‘a ferociously formidable competitor for companies that run the entire length of the technology food chain,’predicts Michael J. Moritz, a partner at Sequoia Capital in Menlo Park, CA, one of the Valley’s premier venturecapital firms.Consider some of China’s milestones in science and tech:
■ Chinese universities granted 465 000 science and engineering degrees last year – approaching the total forthe US.
■ There are plans to crank out chips from seven new semiconductor plants by 2004, putting China on trackto be the world’s second largest chip producer.
■ A team at the Beijing Genomics Institute was among the first of several scientific teams to decode the ricegenome, landing on the cover of the journal Science.
■ Two homegrown vendors of network switches, Huawei Technologies Co. and ZTE Corp., have opened offices in the US and Europe and snatched contracts from the likes of Cisco Systems and Nortel Networks.
■ China has been launching satellites for years and intends to begin manned space missions next year.
Source: Business Week, 28 October 2002, p. 80.
Developing an operations strategy for growth
A comparison of the traditional and modern aspects of this manage-
ment task may lead us to identify key parts of a strategy for growth. This
is shown in Table 10.2.
The challenge of the Internet
The rate of change in management techniques reflects that in the com-
mercial world itself and it has probably never been greater. Whereas it
is generally agreed that the technological changes in the West were
actually of greater significance in the first part of the twentieth century

than in the second, the arrival of developing nations in the commercial
world – as independent players rather than outposts of empires – is
something new and is likely to be more pronounced in the early
decades of the twenty-first century than ever before.
Perhaps the most potentially significant technology facing
operations managers at this moment in time is that of the worldwide
communications available from the Internet: in practice, this translates
390 Strategic operations management
Table 10.2Comparing traditional and modern approaches to expanding operations
Factor Traditional approach Modern approach
Human resources Recruit locals and train them to Train and educate locals to operate necessary levels to operate equipment and develop ideas in equipment; limited learning or participative manner (quality circles,skill development kaizen, employee involvement, policy
deployment, etc.)
Capacity Transfer old equipment from home Set up world-class facilities to compete and produce for local market; limit with products made anywhere. Plan export to that demanded by local regional and even global (niche) government exports as well as local consumption
Process technology Use old equipment to limit Invest for world-class operation and investment risks and satisfy local export; achieve payback within short market requirements product life
Product technology Retain at home. Overseas plants A compromise: high enough make old products, no longer technology to satisfy local government sellable at home stipulations/market demands, without
releasing advanced R&D
Supply Import kits of parts for assembly; Set up supply lines to deliver in a lean buy locally only those items supply manner all items to support necessary to appease local content world-class operations; retain high-requirements (generally low-value, technology items at home and import heavy, bulky items) to overseas plants
Market impacts Overseas plants do not affect markets Overseas plants have impact on for home plants international markets and require
strategies that develop network potential without harming home employment
Management Second managers from home country Train and educate local managers;gradually withdraw home managers
Environmental impact Convince local people that the impact Design environmentally sound is justified by the benefits of the operations and supply chains to investment minimize impact while maintaining
economic performance and remaining a ‘good corporate citizen’
Information Secrecy Transparency

to e-commerce (or e-business). Originally a military device, the
Internet has grasped the imagination of businesses and consumers on
a massive scale. Davis and Meyer (1999), in their book Blur, identify
that old distinctions between products and services, buying and selling,
providers and consumers are breaking down or becoming ‘blurred’.
They suggest that the nature of exchange on the Internet is very
different:
■ it is not just an economic exchange, but an informational and
emotional exchange;
■ sellers and buyers mutually create and consume;
■ communication between parties is interactive;
■ exchange can be carried out at any time and in any place.
We cannot hope to explain or discuss all these features here, so we
shall focus on some of the likely impacts for operations managers.
Three of these challenges are designing the offer, speed of response
and transparency.
Designing the offer
If the Internet delivers things that cannot be distinguished as either
products or services, we need a term to describe what is delivered.
Davis and Meyer (1999) suggest the term ‘offer’. Offers deliver eco-
nomic utility just as products and services have always done, but they
include two other features, namely information capital and emotional
capital. Moreover, the flow of utility, information and emotion is not
just from the provider to the consumer, but in both directions. Value is
derived in all three areas to the mutual benefit of both parties.
For some time now, firms have been paying their customers as well
as customers paying them. For example, in the food industry suppliers
pay supermarket chains for premium space on their shelves and the
supermarkets ‘pay’ their customers with discounts in proportion to
their spending power. This happens in many other industries. In the
first example the supplier is paying for the marketing of their product,
and in the second the chain is buying the loyalty of its customers.
However, in the world of blur, these exchanges can take on other
dimensions. One supermarket chain in Ireland, Superquinn, asks its
customers to identify faults and assist in their correction. Customers
who see a faulty thermostat on a freezer, mislabelled or mispriced
goods, or any other problem get rewards in the form of goods or cash
if they report them to staff. In this context, customers are being paid to
The future for operations management 391

be quality controllers for the firm. Such involvement clearly exchanges
information, but also creates an emotional bond between the store
and its customers.
Such complexity and mutuality is even more evident with firms that
operate exclusively or partially on the Internet. In the airline industry,
the well-equipped business traveller can not only use their laptop via a
mobile modem to link to a reservation system, they can tap into the sys-
tem itself to identify free capacity and even book a specific seat. Such
connection helps the airline to track carefully the usage patterns of the
consumer and to customize special offers to that user. Moreover, these
offers can be bundled together with other providers such as car hire
and hotel companies to add value for the consumer, as well as log up
even more frequent flyer points. But the airlines can go beyond this
and use these contacts to engage with consumers at an emotional level
by setting up discussion groups, requesting or paying customers to par-
ticipate in focus groups, and respond to customer concerns arising
from air accidents.
Of course, there are now many firms that only exist in cyberspace.
A classic example, cited by Davis and Meyer, is Mainspring Inc. This
firm enables firms to learn about e-commerce and online business
through online conferences. It heavily discounts its membership fees to
those firms that agree to allow Mainspring to collect information about
the firm’s activities on the Internet and to share them with other mem-
bers. Hence a firm becomes part of a mutual learning group, using the
tool they intend to adopt for some of their mainstream business activity.
Speed of response
The ability to conduct business at any time of day or night and in any
part of the world (i.e. from a laptop computer via wireless communi-
cation) is now taken for granted. With the notable exception of aero-
planes, there are almost no locations on earth where one cannot
receive, process and transmit information in the form of text, spread-
sheets, databases, illustrations, video and audio clips, and so forth.
The operations manager can no longer rely upon reasonable expect-
ations for response time: requests for services and information may
arrive at any time and require immediate action. The consumer is thus
being tempted with shorter lead times for manufactured items: in the
fashion industry, this threatens to upset the age-old tradition of sea-
sons. A child can see a television character wearing a totally new idea
in clothing and be wearing it themselves within 2 weeks: the fashion
392 Strategic operations management
retailers have reduced the ‘mind to market’ time (i.e. from designer’s
concept to the garment actually being available in the shops) from
several months to 10 days. Children’s clothing is probably the hottest
topic in this respect, but for the operations manager the threat of such
responsiveness extending to all clothing throws into confusion the sta-
bility of seasonal production (from two a year – spring/summer and
autumn/winter – to, say, six or twelve). In retailing, the arrival of firms
such as Amazon has destroyed traditional assumptions about both high-
street shopping and mail order: from the PC in the bedroom one can
literally ‘shop the world’ and have books, CDs – potentially anything –
delivered to the door within a few days. Elsewhere, grocers now make
arrangements for goods to be ordered via the Internet and delivered to
the home. In the motor industry, the race is on to become the first
company to make the ‘3-day car’ – literally a personally specified car,
available to the customer within 3 days.
The ability to communicate has been seen before as a prime force
on operations: the demise of mass production was brought about when
consumers could no longer be kept in the dark about alternatives to
Henry Ford’s ‘black cars’. The Internet once again shows the power of
the unrestricted consumer (albeit stimulated to extraordinary levels of
avarice and appetite by intensive and extensive marketing) to steer the
development of operations by its demands.
In the travel industry, the traditional agent is threatened by the abil-
ity of the customer to reach the destination of their choice simply
through ‘visiting’ the web page. To find a hotel in Tokyo, for example,
the traveller in Plymouth has only to type in a few words and then view
a dozen possibilities (photographs, videos, etc.). Availability can be
checked and reservation made – in some cases with payment (via credit
card number). The same is true of package holidays, flights and train
journeys, banking and so on. Achieving sufficient speed of response
for these consumer demands, once the possibilities are realized, may
not simply be a matter of working faster: traditional operations may
need to be scaled down or even destroyed and recreated.
Transparency
Traditional business has always assumed that confidential information
can be kept secret. The flip side of the Internet is that this comforting
assumption may no longer be true. The amount of information avail-
able and the technology for espionage combine to make almost any
factor in an organization impossible to conceal.
The future for operations management 393

At the level of operations, this is already becoming the case, with
interesting implications for the future. In the case of supply relation-
ships, as we saw in Chapter 5, requests by customers of their suppliers
for ‘open-book’ negotiations impose a risk on the latter but not on the
former. As a result, the supplier must hedge its bets – in practice, this
means the information transferred is heavily edited. A truly transpar-
ent way of working – in pursuit of solutions to the problems raised by
the pressures discussed above – would require understanding of risk-
taking seldom found traditionally in operations management. In short,
the profound nature of change in responsiveness may mean that there
is no time in the operation to hide information.
In the early part of the twentieth century, when the Japanese wanted
to learn how to run factories, they went to the USA. Mr Toyoda, on
visiting the mighty Ford River Rouge plant in Michigan, is reputed to
have told journalists that he was very impressed but could see one or
two ways in which he thought he could improve on operations. Later,
when Americans and Europeans went in their thousands to Japan to
learn about lean production, similar comments were probably made.
The demonstrator effect is a powerful stimulus for change in oper-
ations, and firms are often prepared to be quite open about their
achievements. This apparent laxity in security is based on the assump-
tion that the competitor is so far behind that, by the time they have
caught up, the firm will have moved even further ahead.
The opposite is, of course, the closed factory, where no one is
allowed in and employees sworn to secrecy. Such a fortress, however, is
not difficult to penetrate with modern espionage. Already, military
operations employ devices such as the spy-bug – a self-contained air-
borne camera about the size of a large bee. The spy-bug (not its real
name) can fly through any open window or door and transmit video
information back to its base station. If it is discovered, it will be
destroyed – but the espionage may well have already taken place!
If nothing can be kept secret, then the operations manager has to
learn to deal with managed risk. This opens up a new set of challenges –
but also opportunities for operations to become a genuine part of the
competitive efforts of the operation.
394 Strategic operations management
Case: Amazon.com
So much has been written about this e-company that is already established as a business cliché. However, theorigins and development of the firm so clearly demonstrate some of the key aspects of e-commerce that notto include them would be wilful. Amazon.com started out as an online bookstore, recognizing that books rep-resented a product that could easily be marketed online. Large volume sales enabled discounting to offset the

What comes after leanness and agility?
The development of the lean concept for operations was driven by the
lack of fit with modern markets present within mass production. When
Henry Ford said ‘If you need a machine and do not buy it, you will
eventually find that you have paid for it and do not own it,’ he was
referring to a socio-economic world that no longer exists. Consumers
are now better informed, educated and resourceful than they were in
the early 1900s, and their demands, coupled with the possibilities for
competition that are provided by global supply chains, have made mass
production ways of working inappropriate. The revelation of lean pro-
duction was that many of the established norms had been eschewed by
some firms and that they were apparently more competitive as a result
(see Womack et al., 1990). In order to be agile enough to respond to
the changing demands of highly intolerant markets, the argument
went, firms had to remove the waste or noise that slowed them down
and added cost – to be lean. Many established features of mass pro-
duction, such as batch scheduling, the separation of quality control
and problem solving from production, expediting and massive inven-
tory holding, were removed in lean systems – features that had been
present in operations from manufacturing to banking sectors.
Lean, then, was a call for radical innovation in operations manage-
ment – in some cases, literally the implementation of what Schumpeter
called ‘creative destruction’.
When the need for reduced costs and radical innovation to find more
competitive ways of working was applied to supply chains and net-
works, it was the relationships between customers and suppliers within
those systems that appeared to be harbours for poor practice and
excess costs. Many practices in mass production supply relationships
were based directly on the top-down control developed by Ford so long
ago, in a different world, where the neoclassical view of relationships as
The future for operations management 395
added distribution costs. But this of itself has not created added value over conventional book stores or bookclubs. Amazon.com’s success is derived from the informational and emotional exchange elements of its offer.
Customers are invited to submit book reviews and are paid up to $1000 in book vouchers if they are usedon the website.Customers who purchase a book can also see what other books have been purchased by read-ers of that book. Customers, if they want to be, are automatically e-mailed with information and news updatesabout their favourite author, subject or book category. In 1997, subscribers were invited to participate in thewriting of a short story, in collaboration with the author John Updike. Each day, for 44 days, thousands of customers submitted a paragraph, from which one was selected. The author of each selected paragraphreceived $1000 and the author of the best $100 000.The participation of amateur authors was huge, but thatby readers of the storyline as it developed even greater.

market failures was still considered appropriate. Thus, lean supply,
another radical and destructive innovation, attacked customs in rela-
tionships such as supplier performance assessment (replaced with rela-
tionship assessment), material control schedules (replaced with
vendor-managed inventory) and open-book negotiation (replaced by
managed transparency).
Since its revelation in the late 1980s, lean production has been widely
adopted across many sectors. Sometimes seen simply as a call to become
more efficient or ‘do better’, in practice it soon becomes clear that lean
ways of working require ‘do different’ approaches – radical innovation.
Lean supply is inevitably more complex than lean production, since it
involves the combination of two company cultures and many personal
relationships between people who do not know one another or work
together naturally. The practices that lean supply seeks to destroy are
sometimes well-established professional specialisms and their adherents
do not take lightly to the idea of such radical innovation. As always, mar-
kets drive innovation, as shown by the case of Cisco in the mid-1990s.
The Cisco.com website was set up with three portals – one each for cus-
tomers, suppliers and staff. A customer with an order for an Internet
router from Cisco was able to alter the delivery date of their order by
directly accessing the production planning system in the Cisco factory
(of which there were eleven, four of them Cisco owned, and none more
than 50 per cent dependent on Cisco). If the customer wished to delay
delivery of their router from, say, a March due date to a September deliv-
ery, they could do so simply by moving its position in the schedule. This
very lean idea destroys all sorts of systems that would be necessary under
mass production (customer service, production scheduling and so on,
all adding cost and delaying the response to the customer).
Lean supply has been slower to become reality but many manifest-
ations now exist. Where might it lead in future?
There is little prospect of the waste being allowed back in – no room
for unnecessary professional managers to add overhead costs and slow
down processes. Nor is there the prospect of a return to massive inven-
tory holding and armies of quality control inspectors.
In the short term, global supply chains have brought into play such
factors as very low wage levels and questionable practices such as the
use of child labour. There is also an ignorance of the true cost – to the
earth – of, say, importing goods to Europe from East Asia. Consumers
are increasingly aware of such issues, however, albeit informed largely
by journalism rather than more rigorous research.
Markets drive down prices but the other tenet of neoclassical eco-
nomics – that transactions are cost free – has long been disproved.
396 Strategic operations management

Thus, as the costs of what are now low-cost economies increase with the
local quality of life and recognition of true cost of international trans-
portation, the relationships between customers and suppliers will be
put under more stress; the wide adoption of lean principles in work-
places may be expected to spread to supply chains, relationships and
networks as the need for quick response, agility and cost reductions
can only be fulfilled through radical innovation and the destruction of
Ford’s eighteenth-century principles.
So, in a way, there is nothing to ‘come after’ leanness and agility –
simply the market-driven need constantly to remove the existing best
practice by radical innovation. As one player develops the perfect way
of working, or product or service offer, so another competitor (prob-
ably in another part of the world) will always be seeking to make that
competitive advantage redundant in market terms – the classic aggres-
sive strategy. The nature of human economic endeavour is such that we
may not expect ever to reach a point at which an operations system
could be said to be totally lean and agile – the innovative process, as
always, is one in which the next best practice may be expected simply
to present a more appropriate, desirable offer to the customer, incur-
ring less loss of potential value in the process.
The challenge of the environment
Without doubt one of the key phrases of the 1990s was sustainable devel-
opment, often abbreviated to the single word sustainability. This is gen-
erally agreed to mean ‘meeting the needs of the present without
compromising the ability of future generations to meet their own
needs’ (WCED, 1987).
In the early 1990s, 75 per cent of North American consumers
claimed that their own purchasing decisions were influenced by their
perception of an organization’s environmental correctness, and 80 per
cent said they would pay more for environmentally ‘friendlier’ goods
(Drumwright, 1994). (This is actually a meaningless expression, but
one that is commonly used when organizations wish to appeal to the
uninitiated consumer or observer. As we shall see below, a much more
precise terminology is necessary, even though the phrase is still in com-
mon use.) In the UK, the results of a 1995 Department of the Envir-
onment survey on public attitudes showed that concern about the
environment had remained during the years of recession and was
growing in line with the economic recovery; it was given as the third
most important issue that the public believed government should be
The future for operations management 397

addressing, second only to unemployment and health, and above
crime, education and the economy in general. The survey also showed
a dramatic shift in public opinion to favour the ‘polluter pays’ prin-
ciple, even if this meant paying higher prices for goods and services (62
per cent); 87 per cent of respondents wanted more information from
companies on the environmental impact of their products, and 88 per
cent wanted better labelling to enable them to make more informed
buying decisions (ENDS 232, 1994). Other studies have produced
results that show that while consumers may state these preferences
in surveys, in practice their buying activities do not reflect this.
However, it appears likely that, faced with a choice between two other-
wise identical products, they would buy the most environmentally
sound of the two.
There is a fundamental problem here for operations managers,
seeking to respond to these market requirements; many of the aspects
of genuine sustainability (i.e. beyond sales talk aimed at immature con-
sumers) are actually matters of public policy, not corporate responsi-
bility. A small company cannot influence public policy very much, and
a large corporation should not: in a democracy, public policy should
only be made by elected representatives and their closely linked public
officers (civil servants). Commercial organizations must comply with
policy and its related legislation, of course, and be ‘good corporate citi-
zens’, but they are answerable to shareholders and many of the aspects
of sustainability, for good or ill, are in conflict with shareholders’ inter-
ests (for example, provision for long-term considerations may reduce
short-term financial returns).
To address this problem and give managers a reasonable (but still not
easy) target on which to focus, the concept of environmental soundness
was developed. This starts with a division of sustainability into three
types of consideration: economic, environmental, and social (especially
social justice). Addressing the first two may result in environmental
soundness. This is shown in Figure 10.1 and is explained below.
There are, of course, many examples of large firms contributing to
social policy – especially where there is a high degree of development
going on in the local economy (such as in the China box example
above). Thus, for example, large firms wishing to exploit local natural
mineral resources will build schools, roads and hospitals for the host
country, as a means of getting to the minerals. The danger here is that
the large firm imposes its culture (often Western) on the host country
and begins to change morals and ways of working. Such cultural imperi-
alism may well be met with sectarian reactions – at the least it will cause
friction in the host country.
398 Strategic operations management

The environmental and economic areas of concern may be seen as
the responsibility of the firm: on the one hand, complying with – or
exceeding – regulatory requirements on biophysical impacts and, on
the other, behaving in an appropriate manner to ensure value is
returned to its shareholders.
Operations managers have two concerns in achieving environmen-
tal soundness (in the eyes of their customers and regulators): ensuring
that the operations in their own organization are appropriate (or, per-
haps, ‘green’) and dealing with the problems (and opportunities) that
may exist in the supply chains which feed it. We shall examine each of
these, starting with the organization itself.
Standards
For the operations manager’s own organization, there is a relatively
straightforward approach – that of complying with regulations and
achieving accreditation to an approved standard. Just as the business
world has adopted, on a global level, the ISO 9000 series of standards
in quality (developed from the British Standard, BS 5750, during
the early 1980s), so environmental considerations have been covered
by ISO 14000 (developed from BS 7750 in the early 1990s). This is a
series of qualifications given by accredited consultancies and other
bodies. ISO 14001, for example, is the first level of accreditation within
the ISO 14000 series, under which the inspectors will assess systems in
The future for operations management 399
ENVIRONMENT ECONOMICS
SOCIAL
Environmental Soundness
Environmentally Sound Development (ESD over
time produces the state of sustainable development)
Conventional developmentSocial environmentalism
Figure 10.1
The broad
constituent
elements of
sustainable
development
(source: Lamming
et al., 1999).

use to monitor such factors as energy use, waste disposal, recycling,
and air and water pollution. Inevitably, perhaps, such standards are
applied not to the outputs of an operation (i.e. how ‘green’ are the
firm’s products or services), but to the management systems and pro-
cedures used to generate them. The criticism of this approach (which
is perhaps the only really practical approach for such standards) is that
an organization may develop excellent systems but still not produce
environmentally sound outputs – good paperwork does not guarantee
good products and services. Nevertheless, the standards are a very posi-
tive development for the environmental agenda and are widely
respected. Indeed, the first thing the visitor to Toyota’s Takaoka plant
in the Aichi prefecture of Japan sees on entering the factory is a display
proudly informing them that the plant (30 years old, but still one of
the most efficient in the world) has full accreditation to ISO 14000.
Ford, meanwhile, claimed in 1999 that it was the first auto maker to
have all its plants – worldwide – accredited to the standard.
‘Environmental’ concern can spill over very quickly into ‘ethical’ con-
cern – especially in the eyes of the popular press and therefore the con-
sumers. This moves the focus away from environmental soundness and
towards sustainability – a goal that the individual firm may not be able to
espouse, as we have seen above. The UN has developed another standard
for this – SA 8000 (modelled after ISO 9000 and 14000, but with per-
formance-based provisions). This was launched in 1997 by the Council
on Economic Priorities as a universal, independently verifiable standard
for social accountability, covering such matters as child labour, forced
labour, health and safety, freedom of association and the right to collec-
tive bargaining, discrimination, disciplinary practices, working hours
and compensation (CEP, 1998; Larson and Cox, 1998; CEPAA, 1997).1
The combination of ethical and environmental concerns is known as
corporate social responsibility (CSR) – and is recognized as a prime
issue for firms – perhaps especially those operating globally. This sub-
ject is already vast, and the reader is recommended to see the Brookings
Institution’s report: Corporate Social Responsibility: Partners for Progress
(2002), HBR on Corporate Responsibility (Harvard Business Review Paper-
backs, 2003) and The Planetary Bargain: Corporate Social Responsibility
Matters, by Michael Hopkins (2003).
400 Strategic operations management
1SA 8000 is based on conventions ratified at the International Labour Organizationand related human rights instruments including the Universal Declaration of HumanRights and the UN Convention on the Rights of the Child (CEP, 1998). It was writtenby an advisory board including representatives of human rights NGOs, business andtrade unions.

However, while there may be defined ‘scientific’ measurements of
performance for ‘environmental’ and ‘economic’ responsibilities (e.g.
particles in the atmosphere, levels of chemicals in discharges, and
return on net assets or simply profitability), for social and ethical activ-
ity no universal value systems can exist. Thus, for example, child labour
may be abhorrent to those in the West who envisage Victorian scenes
with children being forced up chimneys, whereas modern local com-
munities in developing countries may well have struck a balance which
is, at least for the present, a perfectly satisfactory way of using their
skills and time, while ensuring education and welfare are firmly on the
agenda. In October 2000, the BBC’s investigative programme, Panorama,
ran an exposé on the supply chain in the sports clothing industry, in
which viewers were shown products destined for the well-known
brands, Nike and The Gap, being made by children in factories in South
East Asia. The programme was taken seriously and caused an outcry,
with sales suffering for some time for both companies.
Thus, organizations may seek to abide by UN SA 8000 or their own
code of conduct, but investors, consumers and host governments will
make their own judgements. The latter may be swayed, however, by the
arguments of journalists and broadcasters as much as scientists and
strategists. The operations manager therefore has to take into account
popular views of the methods and materials involved in the operation –
and be prepared to defend them (or change) in the face of public
scrutiny.
The environmental manager
In order to gain and maintain accreditation to ISO 14000, the organ-
ization will need an up-to-date knowledge of laws and other formal
requirements that must be obeyed. This will require a specific individual
with responsibility for environmental matters – possibly with formal
qualifications in an environmental field, if the size of the organization
or the nature of the activities warrant it. The regulatory pressures
related to environmental performance are changing very quickly and
may be expected to carry on doing so: the individual must be the ‘gate-
keeper’ for the organization – in the same way that innovation may be
introduced early in the organization by developing technological gate-
keepers (see Chapter 4). The role of the specific individual, however,
should be one of catalyst – the real challenge is to get everyone in the
organization to care about environmental soundness, a challenge very
like that encountered in the 1980s when the concern was total quality.
The future for operations management 401

Inevitably this will cast the environmental manager (or whatever
they are called) in the role of evangelist – and thus, perhaps, some-
thing of an oddball. The caricatures of environmental concerns are
often not serious ones: while rivers running red with pollution from tin
mines in Cornwall make impressive and shocking news, the common
stereotype of the environmental manager is one of ‘muesli and san-
dals’. There are two ways in which the attention of the non-specialist
may be attracted to environmental matters: impacts on competitive-
ness (e.g. from consumers’ preferences for greener products and from
the costs of clean-up) and the threat of legal penalty.
Legal penalties for poor environmental soundness may be expected
to increase in their severity: resource wastage is not a short-term mat-
ter. The international non-governmental organization (NGO – more
commonly called a ‘pressure group’) Friends of the Earth have stated
publicly that the use of natural resources and levels of pollution will
have to be reduced by between 80 and 90 per cent by the year 2050 if
the stability of the environment is to be regained. Criminal damage
such as the river pollution described above is now the subject of mas-
sive fines (although in the Cornwall example above, the mine was
already defunct – which is why it leaked into the river – and great diffi-
culty was encountered in tracing anyone upon whom a fine might be
levied) and activities such as dumping waste in landfill sites – until
recently almost free of charge – are now seriously curtailed in many
countries by taxation.
Recycling
One of the most stringent legal penalties has arisen from the European
Union legislation (2001) that has required product manufacturers to
take responsibility for recycling the products they sell to consumers.
Quite simply, this will eventually mean that, at the end of the product’s
useful life, the consumer can return – free of charge – the fridge, or
television, or lawnmower, or article of clothing, to the place where it
was bought, from whence it will be passed to the manufacturer, who
must recycle it in some way.
This ‘reverse logistics’ operation is, of course – like the practice of
taking empty bottles back to the shop to claim a refund of the deposit –
still common practice in parts of North America and Europe, although
largely phased out in the UK (where, however, millions of consumers
rinse milk bottles every day and pass them back to their dairy via the
doorstep). British drinks producers have claimed that reverse logistics
402 Strategic operations management

would be too expensive for UK consumers, and point to the success of
recycling of paper, glass and aluminium via the informal system of col-
lection points sited in car parks. This has led to the typical bottle for,
say, mineral water, containing 70 per cent recycled glass. In the UK, the
cardboard box industry claims to collect and recycle 75 per cent of all
boxes used; the figure claimed for paper is lower at about 50 per cent.
Such achievements were naturally linked to the issue in 1998 of EC
Directives on packaging waste.
The EU regulators have, not surprisingly, also focused on that arch
enemy of environmental soundness – the motor car. Since 2001, under
EU Directives launched progressively during the 1990s, vehicle pro-
ducers have begun to take responsibility for every car they produce at
the end of its working life. This regulation is intended to encourage
producers to design cars for recycling, in a move nicely summed up by
EU Commissioner for the Environment, Margot Wallström, as chan-
ging the focus from ‘cradle to grave’ to ‘cradle to cradle’.
The industry has not exactly been caught napping. All manufactur-
ers had for some time been working on increasing their recyclability.
During the early 1990s, BMW developed this principle and when the
new Series 3 car was launched it was claimed that 70 per cent of its
materials and components could be recycled. In 1999, Ford of Europe
displayed an experimental car at the Frankfurt motor show that was
claimed to be ‘84.2 per cent recyclable’. In addition to the recycling of
metal and plastics in the bodywork, the car employed old clothing in
its insulation panels – especially denim jeans, which apparently have
particularly good properties for such applications.
The recycling directives go further in the car industry, however, with
the threat of vehicle manufacturers eventually having to take back
every vehicle they have ever made that is still running on European
roads. Provision for such costs could clearly ruin some commercial
organizations.
In the consumer electronics field (next in line for the EU, after the
car industry) manufacturers face similar problems. The response of
one producer, Panasonic, selling some 6000 televisions each year,
reveals an interesting twist to this challenge: if the products remain
their responsibility, perhaps they should also remain their property.
Thus, rather than selling the televisions to consumers, Panasonic is
considering leasing or renting them – thus improving the firm’s ability
to keep records and discharge its responsibilities. A similar approach
has been taken in the UK by the communications giant BT. With one
of the largest fleets of vehicles in the country to manage, BT is recon-
sidering its policy on lubricants and other fluids. In the future, it may
The future for operations management 403

effectively rent the oil from suppliers, returning it to them for cleaning
and reprocessing after a specified period of use in the engines of its
vehicles.
The implications of all this for operations managers are clearly
immense. Having grasped the notions of just-in-time (removing inven-
tory) and leanness in operations (removing all waste from processes),
the challenge now must be to reduce the biophysical impact of all activ-
ities and to consider the future state of products beyond the sale and
use by the consumer, working with materials which may not perform or
behave in the same way as virgin matter. Management systems must be
designed to track a product, sometimes for many years, in order to deal
with it when it returns. This will always be a greater concern for indus-
tries in which product lives are short or shortening, as they will present
the greatest potential environmental problems for society.
The supply chain
The second concern for operations managers is the environmental
soundness of the origins of the goods and services upon which the
organization relies. This is a more complex matter than the first con-
cern, since the supply base is a more complex entity to address and, as
we saw in Chapter 5, it may not be managed in the ‘planning and con-
trol’ way. The international standards described above make some pro-
vision for this and, indeed, many organizations have sought to require
their suppliers of goods and services to be accredited to ISO 14000, in
the same way that they used ISO 9000 a decade earlier. However, as we
saw above, these systems cannot guarantee environmental soundness
in the products and services, only in the systems which their producers
and providers use to manager their processes.
In the light of this realization, some organizations have developed
their own systems for measuring environmental performance of their
supplier – often as an extension of their existing vendor assessment
schemes – and also sought more effective accreditation. Thus, the
British hardware retailer, B&Q, has invested in its total environmental
soundness and can now guarantee, for example, that any wood used in
the products it sells has come from a ‘sustainably managed’ forest. This
is because the worldwide forestry industry has a respected auditing body,
known as the Forestry Stewardship Council (FSC); the FSC mark can
only be applied to wooden products whose source has been inspected
and approved. B&Q has also invested in ensuring the ethical propriety of
its supply chain – targeting the social concerns of its consumers and
404 Strategic operations management

using the public media as its channel for information. (The original
stimulus for B&Q’s efforts in environmental soundness came from a
breakfast conversation between the Chairman and his young children
after they watched a BBC Blue Peter programme in which the desecra-
tion of rain forest was featured. The UK’s use of such timber is minis-
cule, but B&Q realized that its customers would be more swayed by
Blue Peter than by statistics.)
In the USA, the big automobile producers have reacted with a typical
‘top-down’ approach to the environmentally sound supply chain prob-
lem. In September 1999, Ford and General Motors both announced
(on the same day – apparently by coincidence!) that in future they
would require parts manufacturers to become more ‘environmentally
friendly’ (that old phrase again). Both the firms now require suppliers
to comply with ISO 14001. In Ford’s case, suppliers were required to
have at least one plant accredited by December 2001 and all plants by
July 2003. General Motors stipulated that all plants – suppliers and its
own facilities – should be approved by December 2002. Such moves are
intended to convince legislators and consumers that cars are becoming
‘environmentally friendly’. For the operations manager, however, such
rhetoric may not be sufficient to ensure actual environmental sound-
ness – but at least organizations are ‘talking the talk’.
It is possible to portray almost any management problem as a supply
chain issue. For example, the BSE crisis in the 1990s (when British beef
was banned from export because it was considered dangerously
infected, and millions of cows were slaughtered) could be linked to the
foodstuff fed to beef cattle – a supply issue. Such connections are, of
course, tenuous, but the ease with which the blame can be passed from
the organization to its suppliers, illustrates how the environmental
(and ethical) agenda must be dealt with in greater scope than simply
that of the immediate arena (i.e. the firm). Operations managers have
thus to concern themselves with their own responsibilities, and those
of their suppliers of goods and services, if they are to avoid the finger
of public accusation being pointed at them for not being ‘environ-
mentally friendly’ – or perhaps environmentally sound. We will now
illustrate our discussion on the impact of environmental factors on
operations management by looking at a case from Australia.
The future for operations management 405
Case: Kingfisher Bay resort and village, Fraser Island, Australia
This hotel, conference centre and resort complex is 250 km north of Brisbane on Fraser Island – a UNESCOWorld Heritage site. Prior to construction, a number of environmental impact assessments were carried outto understand the property’s overall likely impact, as well as specific impacts on the island’s vegetation, fauna,

Conclusions
The future role of operations managers will take on far greater respon-
sibility than before and we have outlined the key areas in this chapter.
The Economist (20 June 1998) summarized the position very well when
referring to manufacturing operations, but much of this is true within
service settings as well:
Manufacturing used to be pretty simple. The factory manager or the
production director rarely had to think about suppliers or customers.
All he did was to make sure that his machinery was producing widgets
at the maximum hourly rate. Once he had worked out how to stick to
that ‘standard rate’ of production, he could sit back and relax. Customer
needs? Delivery times? Efficient purchasing? That was what the
purchasing department and the sales department were there for. Piles
of inventory lying around, both raw materials and finished goods? Not
his problem. Now it is. The 1980s were the decade of lean production
and right-first-time quality management. In the 1990s the game has
grown even tougher. Customers are more and more demanding. They
increasingly want the basic product to be enhanced by some individual
variation, or some special service. Companies sweat to keep up with
their demands, in terms both of the actual products and of the way they
are delivered.
We have dealt with a number of these issues in previous chapters
of this book. But the point to bear in mind here is this: not only do
406 Strategic operations management
hydrology and archaeology. In order to minimize these impacts and to achieve a high level of environmentalintegration, a wide range of measures were adopted.These included landscaping roads around major trees,growing 150 000 native plants from seeds and cuttings, using landfill from the site itself to avoid mainland soildisease transmission, and limiting buildings to two levels so they are below the tree line. Buildings are con-structed from indigenous species in the Queensland-style architecture with open verandas and curving tinroofs. No air-conditioning is needed as natural convection currents are created by windows and vents on theupper levels, which are kept open in the summer to cool the buildings and closed in the winter to keep itwarm. Waste water is treated biotechnologically on site and released into the fast-flowing Great Sandy Strait.Guest key cards operate power in each room so that energy is turned off when rooms are vacant. All solidwaste is separated, compacted and sent for recycling.
As well as these development and operational policies, Kingfisher Bay also maintains good relations with allthose interested in the Fraser Island environment, such as conservation groups, aboriginals, other residentsand ecologists.The firm has supported a research project on small native marsupials and annually offers fiveresearch grants for eco-tourism projects. It also has in place an Environmental Education Programme forSchools to explain its environmentally friendly approach to children, and a similar programme for its visitors.

operations managers have to take on board these additional, major
competitive requirements, there are also other vitally important social/
environmental pressures that need to be managed, as we have outlined
in this chapter. In the future, the pressure put on production/opera-
tions managers will be greater than ever. A key issue for operations
managers in trying to manage the future is that operations strategy
must be in place to enable the firm to deal with such changes.
Undoubtedly, having strategic operations in place will decide the fate
of firms in both manufacturing and services settings, and combina-
tions of both.
References and further reading
BBC (2000) Gap and Nike: no sweat? Panorama, 15 October.
Bradach, J.L. (1998) Franchise Organisations. Cambridge, MA: Harvard
Business School Press.
Brookings Institution (2002) Corporate Social Responsibility: Partners for
Progress.
Business Week, 28 October 2002.
Business Week, 22 September 2003.
CEP (1998) Research Report: Social Accountability 8000. New York:
Council on Economic Priorities.
Davis, S. and Meyer, C. (1999) Blur: The Speed of Change in the Connected
Economy. New York: Capstone.
Drumwright, M. (1994) Socially responsible organisational buying:
environmental concern as a non-economic buying criterion.
Journal of Marketing, 58.
The Economist, 20 June 1998, 347(8073), p. S8(3).
ENDS 232 (1994) Public concern for the environment rides the
recession.
Financial Times, 19 September 1997.
Fortune, 11 May 1998, 137(9), p. 59.
Harland, C.M., Lamming, R.C. and Cousins, P.D. (1999) Developing
the concept of supply strategy. International Journal of Operations
and Production Management, 19(7).
Harvard Business Review (2003) HBR on Corporate Responsibility. Harvard
Business Review Paperbacks.
Hopkins, M. (2003) The Planetary Bargain: Corporate Social Responsibility
Matters. London: Earth scan.
Industry Week, 16 November 1998.
Industry Week, June 2003, 252(6), pp. 22–27.
The future for operations management 407

Lamming, R.C., Faruk, A.C. and Cousins, P.D. (1999) Environmental
soundness: a pragmatic alternative to expectations of sustainable
development in business strategy. Business Strategy and the
Environment, 8(3), 177–188.
Larson, E.R. and Cox, B. (1998) Social Accountability 8000: measuring
workplace conditions worldwide. Quality Digest, February, 26–29.
Shi, Y. and Gregory, M.J. (1994) International manufacturing strategy:
structuring worldwide manufacturing networks. Working Papers in
Manufacturing, No. 11, Cambridge University.
Standard and Poor’s Industry Survey, 3 June 1999.
WCED (World Commission on Environment and Development) (1987)
Our Common Future. Oxford: Oxford University Press.
Womack, J., Jones, D. and Roos, D. (1990) The Machine that Changed the
World. New York: Rawson Associates.
408 Strategic operations management
Index
ABC analysis, 194–5
ABCD checklist, 198–9
ACCOR Hotels, 53
Added value
in operations management, 14–16, 29
in supply chain, 228–9
Advanced manufacturing technology (AMT), 127–8
Affiliation, 8
Aggregate planning, 277–8, 280–1
Agile manufacturing, 94
practices model, 132–3
Agile production, 120, 131–3
v. mass customization, 131, 133
Agility, 81–2, 83–4
definition, 132
dimensions of, 134
and focus, 74–5
in the future, 363
in the modern era, 29, 80–1
Airlines
low-cost, 147
overbooking, case study, 260–3
Southwest Airlines, 333, 349
Alcatel, 387
Amazon.com, 141, 167–8
case study, 394–5
Amend-to-order, 212
American system of work mechanization, 340–2
Aprilia, 221
Archetypal area managers, 272
Area managers, types, 271–3
Assemble-to-order, 281
Asset management, 17
Auctions, online, 238
Averaging capacity, 278, 279
B&Q, 404–5
Banking industry, 147
see also Financial services, case study
Batch processes, 105–7, 126
Batch sizes, effect of JIT on, 210
Bell Telephone Laboratories, 293
Benchmarking, 77–8
in quality, 301–3
Body Shop,The, 141
Bottlenecks, 264–5
effect of JIT on, 210
BPR, see Business process re-engineering
Brands, 28–9
global, 385
British Nuclear Fuels, supply network innovation
programme, 249–50
British Standards, BS 7000, 161
BS 7000, 161
BT, 403–4
Build-to-order (BTO), hybrid/true, 212
Bus modularity, 123
Business
mature v. dynamic, 270–1
renewal of, 140–2
vulnerability of, 140
Business managers, 272–3
Business process re-engineering (BPR), 320–2
dangers with, 321–2
definition, 321
Buyer–supplier relationships, 211–14, 242, 243–53

CAD/CAM (computer-aided
design/manufacturing), 83
Call centres in India, 222–3
‘Can’t say no syndrome’, 263
Capability
dynamic, 70
employees’, 68
in innovation management, 162–3, 164, 165
operations as distinctive capability, 79–80
Capacity
averaging capacity, 278, 279
bottlenecks, 264–5
effect of JIT on, 210
capacity/scheduling interface, 282
challenges, 265–7
chase demand, 278, 279, 280
definition, 259–60
demand management, 279, 280
demand smoothing, 279
designed capacity, 260, 263
effective capacity, 260, 263
fixed capacity, 278
four Vs of, 266
inputs, 264–5
lag capacity, 278, 279
lead capacity, 278, 278–9
level capacity, 278, 279, 279–80
level production, 279
management of, 6, 257–9
aggregate planning, 277–8, 280–1
‘can’t say no syndrome’, 263
factors affecting complexity of, 266
importance of, 263–4
strategies for, 277–82
summary, 284
in mass services, 274–6
measurement, 260
outputs, 264–5
overbooking, case study, 260–3
in services, 267–74, 274–6
Capital One, 337
Car industry
in China, 259
problems with JIT, 214
recycling, 403
‘three-day car’, 393
in UK, 388
world-wide, 385–6
Cascade strategy, 248–9
Cellular production, 130–1
Cessna, case study, 124–5
Change
attitudes to, 144–7
change management, 354–5
discontinuous, 155
driving forces for, 30–2
see also Innovation
Chase demand, 278, 279, 280
Chevron Texaco, 337
Child labour, 396, 401
China
car industry, 259
challenge from, 389
China box, 377–80, 384–5
CI, see Continuous improvement
CIM (computer-integrated manufacture), 83, 127,
129
CIRCA (Continuous Improvement Research for
Competitive Advantage), 311, 318
Cisco, 396
Closed factory, 394
Commodity Councils, 239
Company-wide quality control (CWQC), 307–8
Compaq, 49, 76–7, 257
Competence, see Core competence
Competence trust, 213
Competition, 292
ability to compete, 4
increasing levels of, 323
Competitive advantage
CIRCA project, 311, 318
creation of, 52–3
human resources and, 330, 332–9
Competitive factors
operations and, 59, 60
process choice and, 116–17
Competitive profiling, 77–8
Competitive strategy
impact of flexible manufacturing, 127
see also Strategy
Competitor alliances, 53
Complex product systems, 159
Component-sharing modularity, 122
Component-swapping modularity, 122
Computer-aided design/manufacturing
(CAD/CAM), 83
Computer-integrated manufacture (CIM), 83, 127,
129
410 Index
Conformance, quality of, 290–1
Conspicuous consumption, 30–1
Continuous improvement (CI), 308, 310–20
behavioural patterns in, 315–16
CI journey, 311–13
enablers for, 317
learning, 313–16, 355–6
management of, 317–18
obstacles to, 317
Continuous improvement innovation, 343
Continuous Improvement Research for
Competitive Advantage (CIRCA),
311, 318
Continuous processes, 108–9, 267
Continuous reconfiguration, 318–20
Contract manufacturers, 222
Contractual trust, 213
Core competence, 146, 169–70
human resources, 330
operations as, 79–80
Core rigidity, 146
Corporate expansion, role of operations, 377–81
Corporate lobotomy, 321, 330–1
Corporate social responsibility (CSR), 400
Costs
inventory management, 192
labour costs, 38, 96, 330–1
management of, 5–6, 17
quality, 287, 294
Craft, transition to strategic operations, 26
Craft era, 25–7
Creative destruction, 168, 395
Critical ratio, 283
Crown Equipment Corp., case study, 215–16
CSR (corporate social responsibility), 400
Current (modern) era, 29–30, 32–3
need for flexibility and agility, 80–1
Customer contact in service operations, 37
Customer processing operations (CPOs), 260,
275–6
Customer relationship management (CRM), 243
Customers
location of facilities, 37–8
satisfaction v. loyalty, 303–5
Customization
four faces of, 123
‘pure standardization’ to ‘pure customization’,
121
see also Mass customization
Cut-to-fit modularity, 122–3
CWQC (company-wide quality control), 307–8
Data-mining, 84–5
Decisions, see Location, decisions; Strategic
decisions
Dell Computers, 72, 141, 257–8
Demand, 174–7, 195–6
dependent, 195–6
Demand management, 279, 280
Demand smoothing, 279
Design
organization design, 353–4
quality of, 290
Designed capacity, 260, 263
Development
human resources, 354–5
network development, 219, 225–6, 249–50
supplier development, 247–9
sustainable, 397, 399
two-way vertical, 249, 250
Disk drives, 174–5, 374
Disrupting technologies, 175–7
Distinctive capability, operations as, 79–80
Division of labour, 340, 341
Drinking glasses, pre-filled, case study, 150
Dynamic capability, 70
Dyson, James, case study, 179–80
Easyjet, 141
Economic order quantity (EOQ), 190–4
Edison,Thomas, 148
Effective capacity, 260, 263
EFQM (European Foundation for Quality
Management) model, 302
Emphasis inspection, 296
Employees
effect of JIT on, 210
employee share ownership programmes
(ESOPs), 351
satisfaction and capability, 68
see also Human resources management
Enterprise resource planning (ERP), 83, 203–6
Entrepreneurial area managers, 272
Environmental issues, 397–405
environmental manager, 401–2
recycling, 402–4
standards, 399–401
supply chain, 404–5
Index 411

Environmental soundness, 398–9
EOQ (economic order quantity), 190–4
ERP (enterprise resource planning), 83, 203–6
Ethical concerns, 400
European Foundation for Quality Management
(EFQM) model, 302
Expansion, corporate, 377–81
FAG Kugelfischer, case study, 125
Fashion, 30–1, 32–3
Feedback, 39
Financial services
case study, 283–4
see also Banking industry
Firm-specific routines, 162–3
Fixed capacity, 278
Fixed layout, 100
Flexibility, 65
in the modern era, 80–1
Flexible manufacturing, 83, 120, 125–6
impact on competitive strategy, 127–31
Flexible manufacturing systems (FMS), 83, 126,
127–8, 130–1
Flexible specialization, 29, 94
Focus, 74–5, 75–7, 220–1
agility and, 74–5
Ford
customer choice, 129–30
environmental issues, 405
globalization, 385
intranets, 129
outsourcing, 221
process innovation, 155
production model change, 359–60
Fordism, 28, 341, 359, 374
Foreign investment, 378
Forestry Stewardship Council (FSC), 404
Fortune 500, 19, 371
Franchising, 375
advantages, 269
corporate franchisees, 269
franchisor–franchisee relationships, 273–4
hotel chains, 384
hybrid firms, 376–7
single franchisees (‘mom-and-pop’ operators), 269
FSC (Forestry Stewardship Council), 404
GEC Alsthom, 380–1
General Electric, 388
General Motors (GM)
automation and, 97–8
environmental issues, 405
market share, 53
market-led, 28
outsourcing, 223
relationships with suppliers, 213
Glass-making, 155
GlaxoSmithKline, 238
Global 500, 19, 21–2
Globalization
challenge of global growth, 372–5
impact on operations management, 382–6,
388
investment in global operations, 375, 386–9
service operations and, 375–7
strategic operations and, 386
GM, see General Motors
Goodwill trust, 213
Growth, operations strategy for, 389, 390
Guild system, 292, 340
Harley-Davidson, 143
Hawthorne experiments, 343
Hewlett Packard, 162–3, 220–1, 374
Holism, 75, 75–7
Honda, 48–9, 374
Hoover, 148
Hotel chains
case study, 276–7
expansion, 384
Human relations school of management, 343
Human resources management, 7–8, 17,
329–70
commitment to people as strategic resources,
349–50
competitive advantage and, 330, 332–9
cost-cutting initiatives, 330–1
current good practice, 347–8
development, 354–5
enabling structures, 351, 352–4
future directions, 361–3
importance of human resources, 330, 331, 332–9
mass production era, 343–4
organizational learning and, 359–61
reward systems, 350, 351
shared involvement, 356–9
shared purpose, 350–2
in strategic operations, 348
412 Index

summary, 364–5
training, 345, 354–6
Hybrid process/product cell, 101–2
IBM, 52–3, 145–6, 221–2
Ice industry, 146
Iceberg principle in Service operations, 11
ICI-Zeneca, 171
Import/export gap, 19, 23
Incremental innovation, 156, 157
Industrial Revolution, 292–3, 340
Information-sharing
employer/employee, 351–2
purchaser/supplier, 251–2
Information technology (IT), 237–8
Innovation, 94, 140–50
attitudes to, 144–7
demand and, 174–7
discontinuous, management of, 164–74
high involvement, 310, 335–6, 337–8
see also Continuous improvement
incremental, 156, 157
influencing factors, 159
involvement, 178
key areas in, 165
knowledge management, 177–8, 334, 361–2
learning from, 158
management of, 151, 161–4
capabilities in, 162–3, 164, 165
key activities in, 160
marketing/operations interface in, 153
models of, 160–1
nature of, 143
operations management and, 150–3
output innovation, 154
partial views of, 152
as a process, 148–9
process innovation, 154, 155, 166
process of, 157–61
product innovation, 154, 155–6, 166
push v. pull strategies, 149
radical, 156, 157, 170, 171
stages in, 157
summary, 180
sustainability, 178–9
transforming industries through, 143–4
types of, 153–7
see also Change; Process technology
Intangibility of service products, 35–6
Integration, 8
Intel, 258, 388
International standards
ISO 9000, 295, 299–300, 319
ISO 14000 series, 399–400
SA 8000 (UN), 400, 401
Internationalization, see Globalization
Internet, 371–2
challenge of, 389–91
design of offers, 391–2
speed of response, 392–3
transparency, 393
Intervention strategy, 248–9
Intranets, 129
Invention, 30, 31, 33, 148–50
see also Innovation
Inventory
effect of JIT on, 210
management of, see Inventory management
obsolescence risk, 191, 193
problems with holding, 191–2, 210
stock-outs, 191–2
Inventory management, 185–7, 189–90
costs, 192
development of strategic importance of, 204
Japanese approach, 189
push v. pull strategies, 205–6, 212
summary, 216–17
Investment
foreign investment, 378
in global operations, 375, 386–9
in process technology, 95–9, 137
Investors in People, 335
Involvement
in innovation, 178, 310, 335–6, 337–8
shared involvement, 356–9
ISO 9000, 295, 299–300, 319
ISO 14000 series, 399–400
IT (information technology), 237–8
Japanese approach, 381–2
international operations, 381–2
inventory management, 189
lean thinking, 344–6
to manufacturing, 208–9
to quality, 244, 294, 296–8
supplier associations, 231, 251
tiered system, 229–31
see also Just-in-time (JIT) operations
Index 413

JIT, see Just-in-time (JIT) operations
Job processes, 104–5
Job shops, 37
Just-in-case, 193, 216
Just-in-time (JIT) operations, 57–8, 206–9
car industry, problems with, 214
challenges of, 209–15
effect on operations, 210
elimination of waste, 209
hybrid with MRP/MRPII, 208
a pull system, 208
total quality management as prerequisite for,
206
Kaizen, 325, 332, 338, 351
Kanban, 208
Keiretsu networks, 226, 229
Kingfisher Bay resort and village, case study, 405–6
Knowledge management, 177–8, 334, 361–2
Kodak, 147, 170–1, 173
Kyoryokukai, 231, 251
Labour
costs, 38, 96, 330–1
division of, 340, 341
Lag capacity, 278, 279
Layout
fixed layout, 100
hybrid process/product cell, 101–2
process choice and, 99–100, 112–14
process layout, 100–1
product layout, 102–3
summary, 137
types of, 99–103
Lead capacity, 278, 278–9
Lean production, 29, 94, 345–6, 395–7
Lean supply, 396
Lean thinking, 344–6
Leanness, 81–2
Learning, 354–6
continuous improvement (CI), 313–16, 355–6
organizational learning, 359–61
Level production, 279
Light-bulbs, 144, 148
Light-emitting diodes (LEDs), 144
Lincoln Electric, 349
Line processes, 107–8
Locate-to-order (LTO), 212
Location
decisions, 6
multi-unit operations, 268
purchasing, 235–40
Lovelock service matrix, 110–11
McDonaldization, 28
McDonald’s, 39–40, 143, 147, 275
Magic Tours, case study, 161
Mainspring Inc., 392
Make-to-forecast (MTF), 212
Make-to-order, 281
Make-to-stock, 281
Management contracting, 375, 384
Mannesman, 171
Manufacturing, definition, 23
Manufacturing eras, 25–30, 93–4, 292
craft era, 25–7
impact on process choice, 119
mass production era, 27–9, 81, 341–2
human resource management, 343–4
quality in, 293
modern (current) era, 29–30, 32–3
transition in, 26, 62
Manufacturing operations, 33–5
changing tasks in, 120
decline in, 24–5
Japanese approach, 208–9
links/contrast with service operations, 34–5, 42
manufacturing/service divide, 18–25
performances, 85–6
strategic challenge, 82–5
technical and strategic concerns in, 54
see also Operations management
Manufacturing resource planning (MRPII), 83,
200–1
closed-loop system, 202
hybrid with JIT, 208
MRP as subset of, 201
Manufacturing strategy, 9, 57–9, 60–1
Market niches, 26, 29
Market volatility, 32–3
Marketing, links with operations, 18, 19, 153
Marketing strategy, process choice, 114
Martin Corporation, 298
Marvellous Motors, case study, 323–6
Mass customization, 29, 84, 94, 119–24
v. agile production, 131, 133
basic ways of achieving, 120–1
case study, 124–5
414 Index

challenges, 124
perceived requirements, 124
Mass production, 155
Mass production era, 27–9, 81, 341–2
human resource management, 343–4
quality in, 293
Mass services, 28
capacity in, 274–6
scheduling in, 274–6
Material requirement planning (MRP), 195–200
ABCD checklist, 198–9
hybrid with JIT, 208
linkages within, 204
as push system, 205
resolving problems of, 201–3
as subset of MRPII, 201
Materials management
enterprise resource planning (ERP), 83, 203–6
just-in-time (JIT) management, 206–9
manufacturing resource planning, see
Manufacturing resource planning
material requirement planning, see Material
requirement planning
Materials ordering, effect of JIT on, 210
Matsushita, 388
Mechanistic organizations, 353
Mergers, 384
Microprocessors, 31
Microsoft, 388
Mission statements, 15, 48–9
Mix modularity, 123
Modern (current) era, 29–30, 32–3
need for flexibility and agility, 80–1
Modularity, 122–3
‘Moment of truth’, 11, 185
Monopoly profits, 168
Motorola, 127
MRP, see Material requirement planning
MRPII, see Manufacturing resource planning
Multi-brand area managers, 272
Multi-unit firms
location, 268–9
monitoring quality, 274
operations management, 269–71
Music industry, 143–4
National Health Service (NHS), pharmaceuticals in,
case study, 239–40
Net present value (NPV), 96
Network development, 249–50
supply networks, 219, 225–6
New United Motor Manufacturing Industry
(NUMMI), 97–8, 384
NHS (National Health Service), pharmaceuticals in,
case study, 239–40
Nichia, 144
Nissan, 258
case study, 134–6
Nokia, 170
NUMMI (New United Motor Manufacturing
Industry), 97–8, 384
Nunca, case study, 253–4
Offers (on Internet), design of, 391–2
Offshoring, 222–3
Online auctions, 238
Onshoring, 223
Open-book negotiation/management, 251–2, 352,
394
Operations
as core competence, 79–80
as distinctive capability, 79–80
links with marketing, 153
models of, 11–12
strategic importance of, 1–2
Operations management
added value and, 14–16, 29
definitions of, 9–13
in the future, 363, 371–408
challenges for, 372
corporate expansion, 377–81
global growth, 372–5
role of, 406–7
see also Environmental issues; Internet
globalization impact, 382–6, 388
service operations, 375–7
history of, 339–47
importance of, 1–2
innovation and, 150–3
innovation management, see Innovation,
management
link with marketing, 18, 19
manufacturing v. services, 33–5
multi-unit firms, 269–71
responsibilities of operations managers, 16–17
in fast-food market, 2–4, 5
role in corporate expansion, 377–81
services, multi-unit operations, 268–9
Index 415

Operations management (contd)
strategy, see Operations strategy
summary, 42–3
transitions, 25–30
craft era, 25–7
forces that drive change, 30–2
impact on process choice, 119
mass production era, see Mass production era
modern (current) era, 29–30, 32–3
Operations strategy, 9, 54–6, 57–9, 83
competitive factors, 59, 60
competitive profiling, 77–8
contribution to firm’s overall strategy, 64–7
for growth, 389, 390
importance of, 59–61
international operations, 383
model of, 13
strategy forming process, 61–4
summary, 86
see also Strategy
Optimized Production Technology (OPT), 265
Order-qualifying criteria, 65–7, 116–17, 117–18
Order-winning criteria, 65–7, 116–17, 117–18
Organic organizations, 353
Organization design, 353–4
Organizational congruence, 271, 272
Organizational learning, 359–61
Organizational structures, 352–4
Organizations
organic, 353
virtual, 186, 221, 283
Output innovation, 154
Outsourcing, 221–4
Overbooking by airlines, case study, 260–3
Panasonic, 403
Pareto 80-20 effect, 235, 306
Partnership Act 1891, 246
Parts explosion, 196, 197–8
People management, see Human resources
management
PepsiCo, 258, 270
PEST (Political, Economic, Social and Technical)
model, 55
Pharmaceutical groups, mergers, 384
Pharmaceuticals in NHS hospitals, case study,
239–40
Pilkington, 155
Plural processes, 376–7
Policies, 231–2
supply policy, 231–5
Policy deployment, 351
Portsmouth Hotel, case study, 276–7
Pre-filled drinking glasses, case study, 150
Preussag, 171
Printing industry, 144–5
Priority management, 282
Process choice (transformation process), 93, 94–5,
103–9
batch processes, 105–7, 126
competitive factors and, 116–17
continuous processes, 108–9
impact of manufacturing eras, 119
job processes, 104–5
layout and, 99–100, 112–14
line processes, 107–8
mapping process, 116, 117–18
marketing strategy and, 114
project processes, 103–4
strategic importance of, 114–15
summary, 137
see also Transformation processes
Process innovation, 154, 155, 166
Process layout, 100–1
Process management, 6–7
Process technology, 94–5, 137
human element, 94
investment in, 95–9, 137
Product innovation, 154, 155–6, 166
Product layout, 102–3
Product technology, 94
Production-lining service (service
‘industrialization’), 28, 112–13
Productivity ratio, 63
Products
of service organizations, 34–5
intangibility of, 35–6
unit cost, 227
Profiling, competitive, 77–8
Project processes, 103–4
Publishing, 166–7, 170
Purchasing
buyer–supplier relationships, 211–14, 242,
243–53
information technology and, 237–8
location, 235–9
process, role of, 235–40
process of, 241–2
416 Index

Purchasing ratio, 227
Push v. pull strategies, 205–6, 212
in innovation, 149
Quality, 286–328
benchmarking in, 301–3
as competitive imperative, 288
components of, 291
of conformance, 290–1
costs, 287, 294
current era, 299–301
customer satisfaction v. loyalty, 303–5
definitions of, 289–91
of design, 290
effect of JIT on, 210
historical trends, 292–6
inspection as control mechanism, 293
Japanese approach, 244, 294, 296–8
major developments in, 296
management of, 244
tools and techniques, 306–7
process approach, 301
in service operations, 288–9, 293
measurement of, 38–40
SERVQUAL model, 303–5
stages of development in, 308
strategic quality, 291–2
summary, 326
total quality control, 294
total quality management, see Total quality
management
Quality assurance (QA), 294–6
supplier quality assurance (SQA), 244, 295
Quality circles (QCs), 298, 309–10, 344
Quality control
company-wide (CWQC), 307–8
statistical quality control, 293
total quality control, 294
Radical innovation, 156, 157, 170, 171
Radio frequency identification (RFID), 243–4
Recycling, 402–4
Relationship assessment process (RAP), 246, 247
Relationship Positioning Tool, 245
Response time, 392–3
Restaurants, roadside restaurant chains, case study,
305
Return on capital employed (ROCE) ratio, 63, 64
Return on net assets (RONA), 95
Reverse logistics, 402–3
Reward systems, 350, 351
Roadside restaurant chains, case study, 305
SA 8000 (UN standard), 400, 401
SAP AG (software house), 83, 203
Scheduling
capacity/scheduling interface, 282
in mass services, 274–6
methods, 282–3
Schmenner service matrix, 104, 105, 109–10
Screwdriver plants, 378
Sectional modularity, 123
Self-service, 83, 84
Service operations, 33–5
back-of-house/front-of-house, 113, 268
capacity in, 267–74, 274–6
concept, 15–16, 41
customer contact, 37
customer participation, 37
delivery system, 42, 67–8
globalization and, 375–7
growth in, 362
iceberg principle, 11
image, 41
labour costs, 38
life cycle of firms, 269–70
link with marketing, 18, 19
links/contrast with manufacturing, 34–5, 42
location of facilities, 37–8
management system, 40–2
manufacturing/service divide, 18–25
market segment, 40
mass services, 28, 274–6
matrices used in, 104, 105, 109–11
model of, 20
multi-unit firms, 268–9, 269–71, 274
production-lining service (service
‘industrialization’), 28, 112–13
products, 34–5
intangibility of, 35–6
profiling within, 78
quality in, 288–9, 293
measurement of, 38–40
scheduling, 274–6
service concept, 15–16, 41
service package, 35, 41–2
service profit chain, 67–8
service variety, 36–7
Index 417

Service operations (contd)
strategic challenge, 82–5
see also Franchising; Operations management
Service profit chain, 67–8
SERVQUAL model, 303–5
Share ownership programmes, employees’
(ESOPs), 351
Shared involvement, 356–9
Siemens, 388
Silos, 236
Single digit set-up, 208–9
Six Sigma, 288, 307
SmithKline Beecham, see GlaxoSmithKline
Sony Walkman, 151
Sourcing strategy, 234–5
Southwest Airlines, 333, 349
Specialization, flexible, 29, 94
Speed of response, 392–3
Springfield ReManufacturing Company, 352
SQA (supplier quality assurance), 244, 295
SRM, see Supplier relationship management
Standardization,‘pure standardization’ to ‘pure
customization’, 121
Standards
BS 7000, 161
environmental, 399–401
ISO 9000, 295, 299–300, 319
ISO 14000 series, 399–400
SA 8000, 400, 401
world-class, 22, 292
Statistical process control (SPC), 296, 298
Statistical quality control, 293
Strategic challenge, 82–5
Strategic decisions, 73
consequences of, 53
long-term implications, 53–4
process choice, 94–5
v. tactical decisions, 54, 73
Strategic dissonance, 76
Strategic operations
globalization and, 386
human resources, case study, 364
transition from craft, 26
Strategic quality, 291–2
Strategic resonance, 69–73
creating and sustaining, 72–3
Strategy, 25, 46–8
for capacity management, 277–82
cascade strategy, 248–9
competitive advantage creation, 52–3
competitor alliances, 53
content of, 51, 55–6
decisions, see Strategic decisions
flexible manufacturing impact on, 127–31
four stages of, 58
framework, 65, 66
for growth, 389, 390
implementation, present-day problem, 63–4
intervention strategy, 248–9
long-term implications, 53–4
manufacturing strategy, 9, 57–9, 60–1
market-led, 69, 70, 71
mission statement, 15, 48–9
model of, 50–1
in the modern era, 29
operations, see Operations strategy
process of, 51, 55, 56
purchasing process, 235–40
resource-based, 50, 69, 70, 71
reverse marketing approach, 50
role of senior management, 52, 62
sourcing strategy, 234–5
supply strategy, 231–4
basis for, 240
formation of, 231
technological aids, 83–4, 127–9
vital role of, 52–4
see also Operations strategy
Structures, organizational, 352–4
Suggestion schemes, 325–6, 335–8, 339, 345–6
Sunnyside Up, case study, 2–4
Superquinn, 391–2
Supplier assessment, 244–6, 248
development of, 246–51
Supplier associations, 231, 251
Supplier–buyer relationships, 211–14, 242, 243–53
Supplier development, 247–9
cascade strategy, 248–9
intervention strategy, 248–9
Supplier quality assurance (SQA), 244, 295
Supplier relationship management (SRM), 243–53
information sharing, 251–2
policy and strategy, 252–3
shared responsibility, legal implications, 246
supplier assessment, 244–6, 248
development of, 246–51
supplier–buyer relationships, 211–14, 242,
243–53
418 Index

Suppliers, tiers, 229–31
Supply
build-up of value and costs, 227–8
management of, see Supply management
nature of, 224–6
networks, 219, 225–6
outsourcing, 221–4
process of, 241–2
Supply base, 241–2
rationalization of, 230–1
structuring of, 229–31
Supply chains, 188, 211, 219–20, 225–6
added value in, 228–9
environmental concerns, 404–5
management of, 281
Supply management, 219–20, 227–35
case study, 253–4
and focus, 220–1
objective, 227–9
open-book negotiation, 251–2, 394
purchasing, 235–40
location, 235–40
sourcing strategy, 234–5
summary, 254
supplier development, 247–9
supply base, 241–2
rationalization of, 230–1
structuring of, 229–31
supply policy, 231–5
supply strategy, 231–4
basis for, 240
formation of, 231
see also Supply
Sustainability, 178–9, 397
Sustainable development, 397, 399
Sustaining technologies, 175–7
Taco Bell, case study, 115–16
Teamworking, 343, 349, 356–9
Technological aids, 83–4, 127–9
Technological discontinuities, 172–4
Technology/ies
convergence of, 33
disrupting, 175–7
human element, 94, 97, 98, 99
management of, 7, 94–5
process technology, 94–5, 95–9, 137
product technology, 94
sustaining, 175–7
Technophilia, 77
Telephones, 155–6
3M, 162, 170, 288
human resource management and operations at,
336
Tiers, 229–31
TopsyTail, 221
Total productive maintenance (TPM), 324–6
Total quality control, 294
Total quality management (TQM), 57–8, 296, 298,
307–9
approaches to, 318–19
continuous reconfiguration, 318–20
future developments, 322–3
planned, 319
prerequisite for JIT, 206
problems with, 320–1
top management commitment, 308
training TQM, 319
transformational, 319
vision-led, 318
Toyota, 29, 128, 178, 208–9
just-in-time, 206–8
ToysRUs.com, case study, 185
TPM (total productive maintenance), 324–6
TQM, see Total quality management
Training, 345, 354–6
Transformation processes, 9–10, 11, 12
see also Process choice
Transparency, 393–5
open-book negotiation, 251–2, 394
value transparency, 252
Transplants, 378, 384
Travel industry, Internet use, 393
Trend Micro, 386
Trust, in buyer–supplier relationships, 213
Two-way vertical development, 249, 250
Unipart, 356
Vacuum cleaners, case study, 179–80
Value
added value, 14–16, 29, 228–9
management of, 5–6
Value chain management, 186–7
Value chain model, 14–15
Value transparency, 252
Variability, law of, 267
Index 419

Vertical integration, 13, 187–9
case study, 215–16
Virtual organizations, 186, 221, 283
Volatility of market, 32–3
Wage and status differentials, 350
Wal-Mart, 243–4
Waste
categories of, 82, 207
elimination of, 6, 209
Wealth, 30–1, 32
Western Electric Company, 343
Workforce
effect of JIT on, 210
see also Employees; Human resources
management
World-class standards, 22, 292
XYZ Systems, case study, 364
Yield management, 276
case study, 276–7
420 Index