Open source tools for geographic analysis in transport planning
26
Open source tools for geographic analysis in transport planning 2020-11-16 Abstract Geographic analysis has long supported transport plans that are appropriate to local contexts. Many incum- bent ‘tools of the trade’ are proprietary and were developed to support growth in motor traffic, limiting their utility for transport planners who have been tasked with 21 st Century objectives such as enabling citizen participation, reducing pollution, and increasing levels of physical activity by getting more people walking and cycling. Geographic techniques — such as route analysis, network editing, localised impact assessment and interactive map visualisation — have great potential to support modern transport planning priorities. The aim of this paper is to explore emerging open source tools for geographic analysis in transport planning, with reference to the literature and a review of open source tools that are already being used. A key finding is that a growing number of options exist, challenging the current landscape of proprietary tools. These can be classified as command-line interface (CLI), graphical user interface (GUI) or web-based user interface (GUI) tools and by the framework in which they were implemented, with numerous tools released as R, Python and JavaScript packages, and QGIS plugins. The review found a diverse and rapidly evolving ‘ecosystem’ tools, with 25 tools that were designed for geographic analysis to support transport planning outlined in terms of their popularity and functionality based on online documentation. They ranged in size from single-purpose tools such as the QGIS plugin AwaP to sophisticated stand-alone multi-modal traffic simulation software such as MATSim, SUMO and Veins. Building on their ability to re-use the most effective components from other open source projects, developers of open source transport planning tools can avoid ‘reinventing the wheel’ and focus on innovation, the ‘gamified’ A/B Street simulation software, based on OpenStreetMap, a case in point. The paper concludes that, although many of the tools reviewed are still evolving and further research is needed to understand their relative strengths and barriers to uptake, open source tools for geo- graphic analysis in transport planning already hold great potential to help generate the strategic visions of change and evidence that is needed by transport planners in the 21 st Century. 1 Introduction: geographic analysis in transport planning Transport planning is an applied discipline involving developing local policies and the design and placement of physical infrastructure including ways — highways, railways, cycleways and footways — for the greatest economic, social and environmental benefit (O’Flaherty and Bell 1997; Parkin 2018). Planning also involves thinking about the future, envisioning scenarios of change and making the case for change (Timms, Tight, and Watling 2014). Successful transport plans are therefore a combination of geographically specific recom- mendations (e.g. “build this way here”) and long-term strategies guided by citywide, regional and national visions (e.g. “imagine the benefits of making the city free from private cars by 2030”). The rewards can be great: transport planners who have designed — and helped to implement — plans appropriate to the needs of an area leave a legacy that will benefit people and the environment for generations to come. 1 Transport planning can be considered as “more of an art than a technique,” although good transport plans also rely on robust analysis and modelling of sometimes large and usually spatial input datasets (Dios Ort’uzar S. and Willumsen 2011). Ways and other pieces of transport infrastructure must go somewhere; 1 Articles about successful transport planners illustrate the point. Ben Hamilton-Baillie (1955 - 2019), for example, was an influential transport planner and street designer whose obituary emphasised the “hundreds of thousands of people who are safer and happier as a result of his achievements” (Tim Stornor, quoted in TransportExtra). 1
-
Upload
khangminh22 -
Category
Documents
-
view
4 -
download
0
Transcript of Open source tools for geographic analysis in transport planning
Open source tools for geographic analysis in transport planning
2020-11-16
Abstract
Geographic analysis has long supported transport plans that are appropriate to local contexts. Many incum-bent ‘tools of the trade’ are proprietary and were developed to support growth in motor traffic, limiting theirutility for transport planners who have been tasked with 21st Century objectives such as enabling citizenparticipation, reducing pollution, and increasing levels of physical activity by getting more people walkingand cycling. Geographic techniques — such as route analysis, network editing, localised impact assessmentand interactive map visualisation — have great potential to support modern transport planning priorities.The aim of this paper is to explore emerging open source tools for geographic analysis in transport planning,with reference to the literature and a review of open source tools that are already being used. A key finding isthat a growing number of options exist, challenging the current landscape of proprietary tools. These can beclassified as command-line interface (CLI), graphical user interface (GUI) or web-based user interface (GUI)tools and by the framework in which they were implemented, with numerous tools released as R, Python andJavaScript packages, and QGIS plugins. The review found a diverse and rapidly evolving ‘ecosystem’ tools,with 25 tools that were designed for geographic analysis to support transport planning outlined in terms oftheir popularity and functionality based on online documentation. They ranged in size from single-purposetools such as the QGIS plugin AwaP to sophisticated stand-alone multi-modal traffic simulation softwaresuch as MATSim, SUMO and Veins. Building on their ability to re-use the most effective components fromother open source projects, developers of open source transport planning tools can avoid ‘reinventing thewheel’ and focus on innovation, the ‘gamified’ A/B Street simulation software, based on OpenStreetMap, acase in point. The paper concludes that, although many of the tools reviewed are still evolving and furtherresearch is needed to understand their relative strengths and barriers to uptake, open source tools for geo-graphic analysis in transport planning already hold great potential to help generate the strategic visions ofchange and evidence that is needed by transport planners in the 21st Century.
1 Introduction: geographic analysis in transport planning
Transport planning is an applied discipline involving developing local policies and the design and placementof physical infrastructure including ways — highways, railways, cycleways and footways — for the greatesteconomic, social and environmental benefit (O’Flaherty and Bell 1997; Parkin 2018). Planning also involvesthinking about the future, envisioning scenarios of change and making the case for change (Timms, Tight,and Watling 2014). Successful transport plans are therefore a combination of geographically specific recom-mendations (e.g. “build this way here”) and long-term strategies guided by citywide, regional and nationalvisions (e.g. “imagine the benefits of making the city free from private cars by 2030”). The rewards can begreat: transport planners who have designed — and helped to implement — plans appropriate to the needsof an area leave a legacy that will benefit people and the environment for generations to come.1
Transport planning can be considered as “more of an art than a technique,” although good transport plansalso rely on robust analysis and modelling of sometimes large and usually spatial input datasets (DiosOrt’uzar S. and Willumsen 2011). Ways and other pieces of transport infrastructure must go somewhere;
1Articles about successful transport planners illustrate the point. Ben Hamilton-Baillie (1955 - 2019), for example, was aninfluential transport planner and street designer whose obituary emphasised the “hundreds of thousands of people who are saferand happier as a result of his achievements” (Tim Stornor, quoted in TransportExtra).
1
transport planning involves consideration of where investment and other interventions are most needed.Tools for geographic analysis have been used in transport planning since at least the 1990s, when localtransport planning bodies in the United States started using geographic information systems (GIS) softwareto support their transport planning activities (Anderson 1991), taking advantage of newly available softwareand hardware such as the Intel 80386 processor (first released in 1985) which could run early proprietaryGISs such as ‘SPANS’ (Ebdon 1992).
Despite the inherently geographic nature of movement, and the growth of GIS in transport planning, theimportance of geographic in transport systems has long been overlooked (Rodrigue, Comtois, and Slack 2013),notwithstanding efforts to formalise the field of ‘GIS-T,’ described in the next section. Geographic methods
— such as origin-destination modelling, route assessment and spatial network analysis — are prominent inthe literature, providing evidence for a range of transport planning interventions (e.g. Jäppinen, Toivonen,and Salonen 2013; Larsen, Patterson, and El-Geneidy 2013; Tribby and a. Zandbergen 2012). But there hasbeen less research into digital geographic tools, as discussed in Section 3, despite the fact that geographicmethods must be accompanied by software and a user interface if they are to be of use in practice.
A range of data driven transport planning approaches has evolved in recent years to take advantage of newdatasets and technologies. Large movement datasets from disruptive ‘ride hailing’ firms have been used tobetter understand parking patterns (Aryandoust, van Vliet, and Patt 2019); ‘deep learning’ has been used toforecast demand for transport services in near real-time (Liao et al. 2018). Such novel geographic approachescan be defined as Geographic Data Science, a still emerging field that calls for the tighter integration betweendata science and geographic research (Singleton and Arribas-Bel 2019). While there is much academic activityin this direction, the extent to which new geographic tools have gained traction in practice, and in transportplanning practice in particular, is debatable. In this context, the goal of this paper is to add to the literatureon geographic tools in transport planning, with a focus on open source options.
At this point some definitions are in order. Although ubiquitous in the literature, terms such as ‘tool,’‘software’ and ‘model’ are often used interchangeably, relying on the (potentially unsafe) implicit assumptionthat everyone shares the same idea of what they mean (see Salter et al. 2009 for an example). For thepurposes of this paper, a tool is a broad term referring to a modular piece of software or online service; amodel, by contrast, is method or process that is expounded in theoretical terms; software is the collection ofcomputer instructions that underlies digital tools, encoded in publicly available and transparent programminglanguages (in open source software) or in a ‘binary’ file that has “limits against usage, distribution, andmodification that are imposed by its publisher” (Dhir and Dhir 2017), the inner workings of which areobfuscated from the user (in proprietary software). An increasingly used but seldom defined term in thiscontext is ecosystem which, following Franco-Bedoya et al. (2017), we define as the wider community ofpeople organizations that support the development of open source software. The paper focuses on tools,as opposed to software or software ecosystems, because tools are tangible and widely understood (unlikesoftware ecosystems) entities that the end user sees (as opposed to software, which is a rather esotericconcept).
The focus on open source tools for geographic analysis in transport planning is timely because this is an areaof rapid growth, as outlined in Section 4. The topic has yet to be explored in the academic literature, to thebest of the author’s knowledge. A deeper reason that transport planning benefits from levels of transparencyand citizen participation that are more easily reached with open source solutions than proprietary solutions(Peters 2020). Transport planning involves decisions about how public funds, spaces and other sharedresources are used. It is, to a greater or lesser extent, part of wider democratic processes that reflectcontemporary political and societal priorities (Legacy 2016). These priorities have shifted substantially overthe past few decades, meaning that transport plans based on out-of-date ideas or faulty model assumptions(such as the assumption that congestion can be tackled by building more roads) can lead to unwanted impacts(such as increased congestion), which can be fatal (Hollander 2016).
The importance of transparency and democratic accountability in transport planning (and hence the impor-tance of open source tools in transport planning) has increased alongside wider campaigns for evidence-baseddecision making and ‘participatory democracy’ (Monbiot 2017; Hackl et al. 2019), and growing evidence thattransport systems cause substantial damage to the environment and human health and wellbeing. Roads
2
are now the “leading cause of death for children and young adults aged 5-29 years” with 1.35 million peoplekilled and tens of millions injured and disabled each year due a range of factors including unsafe speeds,weak road traffic laws, lack of enforcement and poor infrastructure that forces pedestrians and cyclists tomix with motorised modes (World Health Organization 2018). The air pollution impacts could be evengreater, with a growing body of research linking air pollution to Alzheimer’s disease, lung cancer and heartdisease among hundreds of millions of sufferers worldwide (Kampa and Castanas 2008; Kilian and Kitazawa2018). Transport is responsible for a quarter of global greenhouse gas emissions and growing (Harrison andHester 2017), and is one of the hardest sectors to decarbonise (Moriarty and Honnery 2008), meaning thatreducing transport energy use is an urgent priority.
Transport planning is inherently embedded within local geographic contexts because transport systems, andassociated networks of physical infrastructure, are highly localised (Barth’elemy 2011; Levinson 2012) and tosome degree dynamic (Xie and Levinson 2011) phenomena. Transport planning is therefore fundamentallya geographic activity. All accurate geographic coordinates are defined with reference to the Earth’s surface,either via geographic or projected coordinate systems (Sherman 2008). By extension, transport planning isa geographic enterprise.
The influential textbook Modelling Transport outlines the main stages of transport planning as follows (DiosOrt’uzar S. and Willumsen 2011).
1) problem formulation2) data collection3) modelling/analysis4) evaluation5) implementation of solutions
Each of these stages, illustrated in Figure 1, has geographic components. The 3rd stage, can refer to atleast three distinct processes: the ‘four stage’ transport model (left box); scenario modelling (central box)or geographic analysis and modelling (right box, Figure 1). The wider point is that geographic techniquescan supplement and in some cases replace traditional modelling, and the classic four stage transport model.Many of the inputs (datasets with geographic coordinates) and outputs (maps and geographically specificrecommendations) shown in Figure 1 are spatial, suggesting the importance of geographic tools throughoutthe transport planning process.
Formulation of the problem (stage 1 in the transport planning process illustrated in Figure 1) and identifi-cation of the scope of solutions that the transport planning process can propose is inherently geographic. Thefirst step of many projects is defining the ‘region of interest.’ This step has important implications because itcan focus the analysis on areas where solutions are most likely to be implemented and, conversely, highlightthe potential for inter-regional collaboration. Although the region of interest may be pre-determined byadministrative boundaries over which a planning authority presides, geographic analysis this first stage inthe transport planning process can help refine the definition of the ‘region of interest’ to include different‘spheres of influence’ such as the wider catchment area, the administrative region, and the area that is thefocus of the study.
Data collection (stage 2) is an explicitly geographical activity, although in some cases the geographiccomponents of valuable data are not used (origin-destination datasets in which the coordinates of originsand destinations are excluded represent a common example). Geographic analysis tools can support thisstage not only by providing descriptive overviews of the datasets available to planners (and their limitationssuch as parts of a city lacking in data), but by flagging places where additional monitoring is needed (e.gLindsey et al. 2013).
Likewise, modelling (stage 3) is a central component of data-driven transport planning. Whether themodelling involves a four stage model, statistical modelling or geographic analysis, it inevitably containssome geographic analysis. Geographic analysis is implicit in the classic four-stage model: 1) trip generation(the number of trips generated by each zone in a region) is influenced by geographic factors such as numberof buildings in the direct surroundings; 2) the distribution of these trips to destinations depends on explicitlygeographic factors such as absolute and relative distances; 3) mode split is influenced by geographic factors
3
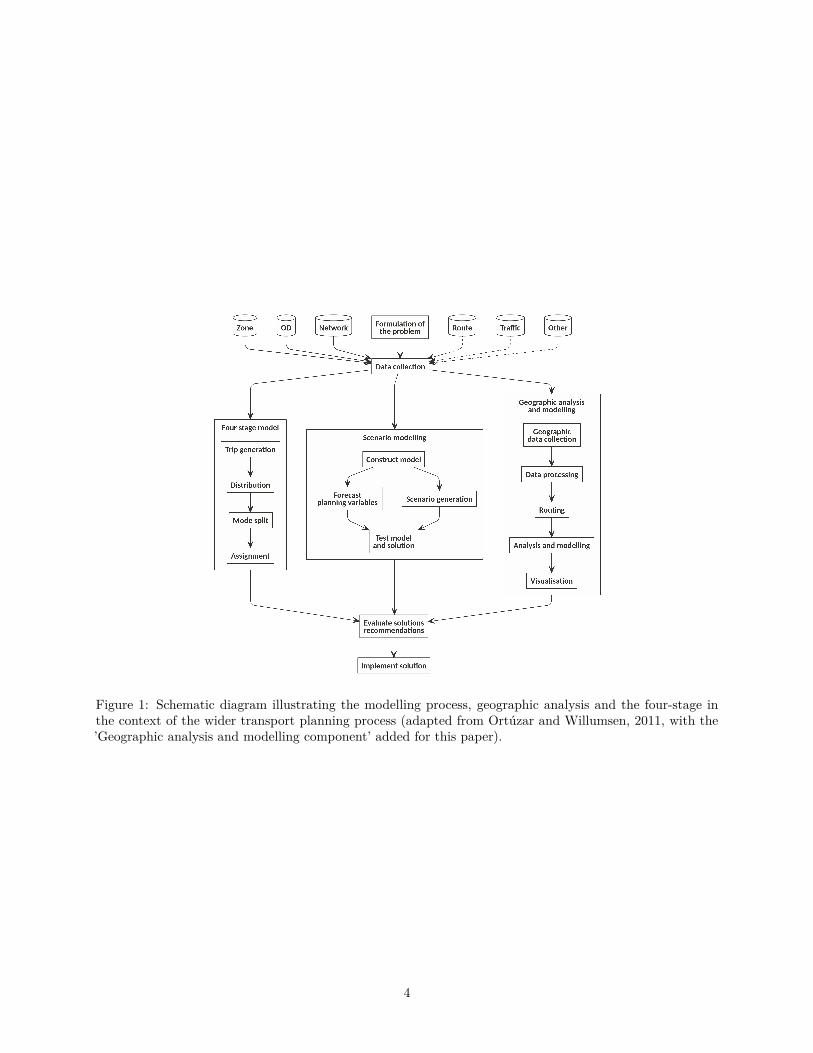
Figure 1: Schematic diagram illustrating the modelling process, geographic analysis and the four-stage inthe context of the wider transport planning process (adapted from Ortúzar and Willumsen, 2011, with the’Geographic analysis and modelling component’ added for this paper).
4
such as the gradient and motor traffic speeds and volumes associated with routes between origins anddestinations; and 4) assignment to the route network clearly depends on a realistic representation of footways,cycleways, highways and other geographic entities such as traffic lights that affect route choice. Likewisestatistical modelling includes consideration of trip distances and destinations, which imply some level ofgeographic analysis. Four-stage and statistical modelling options can be supplemented by geographicanalysis and modelling, something that has been recognised since at least the 1990s (Anderson 1991).Critical to any modelling exercise are scenarios, which can be either ‘global’ (such as a nationwide increasein fueld tax) or ‘local’ (such as the creation of new public transport routes on specific roads) in nature. Thelatter type of scenario require geographical inputs, such as simulating a new cycleway or bus stop. Theseare arguably more tangible and relevant to the city and regional levels at which many transport plans aredeveloped than abstract ‘global’ changes (e.g. Larsen, Patterson, and El-Geneidy 2013).
Geographic considerations are particularly important in stage 4, evaluation of solutions and recom-mendations to policy makers, but are often overlooked. If recommendations resulting from an ‘optimal’model have geographically uneven impacts, it risks exacerbating existing spatial inequalities. Geographicanalysis of the results of the transport planning process, in addition to geographic analysis of input data, cansupport more spatially equitable development which could have a co-benefit of reducing travel demand: wageand other differences between cities are a major driver of (often energy intensive) inter-city travel demand(Schmutz and Sidib’e 2019). And of course the the implementation of effective solutions relies on resultsthat are specific, including being geographically specific and presented in clear and accurate geographicvisualisations (Pensa, Masala, and Lami 2013).
The stages represented in Figure 1 have been criticized for being simplistic, linear and ‘top-down,’ withparticularly strong criticisms focusing on the lack of stages for impact assessment and public participation(Löfgren, Nilsson, and Johansson 2018; Tornberg and Odhage 2018), and more sophisticated representationsof key stages in the planning system have been expounded for some time (Batty 1995). However, there islittle doubt that the ‘formulate → collect → model → evaluate → implement’ approach continues to bepopular and that, within this framework, each stage (particularly ‘modelling’ which includes geographicanalysis and modelling) could benefit from increased access to geographic insights. Due partly to data andcomputing limitations (outlined in the next section) geographic considerations are not always considered,with consequences for the solutions resulting from the transport planning process and the extent to whichthey adapt to local geographic factors. Lack of access to, knowledge of and skills in the use of tools forgeographic analysis represent another reason why geographic factors may be excluded from transport plans(although evidence of the tools that transport planners use and can use is scarce, suggesting areas of futureresearch, as discussed in Section 5). There is evidence that these ‘barriers to entry’ for geographic analysis
— at high resolution based on high quality data and high performance software — are being removed, asoutlined in Section 4. In this context, the aim of this paper is to explore emerging open source tools forgeographic analysis in transport planning, with reference to the literature.
The increased availability of open access geographic data and high performance computing technologies (inaddition to policy drivers increasing demand for geographic analysis) over the last few decades is discussedin the next section. Despite the increasing availability of open source options, proprietary tools still appearto dominate transport planning in practice, as we will see in Section 3. The nature and functionality ofopen source tools for geographic analysis in transport planning is outlined in Section 4. Section 5 concludesby summarising the state and future prospects of open tools in transport planning, highlighting gaps in thecurrent crop of open source options, and flagging ways of getting involved to improve the provision of opensource tools for the benefit of researchers, companies, governments and interested citizens with stakes intransport planning processes.
2 Policy and technological drivers
Two major drivers of change in transport planning tools have historically been technological developmentand shifting political priorities (Boyce and Williams 2015). Environmental, health and equality regulations
— which can be seen as a manifestation of political change — have also influenced transport planning practice
5
and some specific transport planning tools have emerged to tackle particular issues (e.g. Vandenbulcke etal. 2009). Environmental concerns, including fears about the impact of climate change, have risen up policyagendas in recent years, meaning that such environmental policy drivers a likely to become more importantin the coming years. In parallel, the ‘obesity crisis’ and mounting evidence of the health benefits of physicalactivity have provided impetus to plans that prioritise walking and cycling, with environmental co-benefits.There have also been calls for more ‘bottom-up’ and participatory approaches, although transport planningpractice has been slow to change in this direction (Legacy 2016). No less important is the demand forlocalised results; while a national transport model can provide a high level overview of the transport systemfor policy-makers, tools that provide geographically specific results, potentially down to the street level, cansupport transport planners ‘on the ground.’
Environmental and (local participatory) political factors drive demand for transport planning tools thatenable geographic analysis: sustainable modes such as walking and cycling (and to a lesser extent publictransport) require greater consideration in the spatial variation in trip origins and destinations at high levelsof geographic resolution: analysis with limited consideration of geographic factors, such as the spatial distri-bution of locations within walking distance of new infrastructure, is less able to inform investment in activetravel or provide citizens with localised information. A final driver of demand for such tools is technology.Rapidly emerging digital technologies could transform transport planning, with two-way communicationsbetween planning authorities and citizens, and even peer-to-peer communications on transport planning is-sues, now feasible.2 These drivers of change provide the context in which open source tools for transportplanning are being developed.
2.1 Political drivers
The history of transport modelling shows that transport planning software was originally designed in thelate 1950s and onwards to plan for “increased use of cars [for personal travel], and trucks for deliveries andgoods movement” (Boyce and Williams 2015). Policy drivers have changed dramatically since then: climatechange mitigation, air quality improvement and public health are prioritised in the emergent ‘sustainablemobility paradigm’ (Hickman, Ashiru, and Banister 2011; Johansson et al. 2017; Department for Transport2020). Yet many traditional transport planning tools focus on motor traffic, emphasising travel time savingsimpacts over environmental and health savings (Hall, Willumsen, and Van Vliet 1980; Dios Ort’uzar S. andWillumsen 2011), often at low levels of geographic resolution (Hollander 2016). These observations have ledto criticism of transport models which are deemed unable to represent transport network details such aspavement and way widths that are needed effectively design for active transport (Parkin 2018) or capturecommunity input (Beimborn and Kennedy 1996).
Tools for 21st Century transport planning need to tackle very different questions, such as: What are thebarriers preventing people from switching to more sustainable modes of transport, and where are thesebarriers located? How are transport behaviours likely to shift in the future, in response to technologicalchanges including autonomous vehicles and the continued rise of online working? Where will different typesof intervention be most effective? And how can citizens be engaged in transport decisions? Tools that canhelp answer these questions are becoming an increasingly important part of the transport planner’s cabinet(te Brömmelstroet and Bertolini 2008).
As the gap between what the science seems to say is necessary in the near future and the reality of pollutingand unhealthy transport systems grows, so does the need for transparent models that stand up to scrutinyand enable participation and informed debate. This has been well documented in with respect to energymodels by Morrison (2018), who observed that “opaque policy models simply engender distrust.” The samecould be said of transport models, driving demand for tools that are open to public scrutiny and communityinvolvement. In parallel, growing awareness of the need for sustainable transport planning solutions has alsodriven demand for geographically locallised transport planning tools.
2See https://www.cyclescape.org/ for an example of such a peer-to-peer transport planning tool.
6
2.2 Demand for localised results
With the emphasis shifting to reducing travel by building ‘liveable’ communities and enabling mode shift(Sallis et al. 2016), localised and geographically specific considerations may become increasingly prominentin future plans. To illustrate this point, imagine being the mayor of a major city that has declared a ‘climateemergency’ and who has been given the task of leading the transition away from fossil fuels (Hadfield andCook 2019). Policies such as carbon taxes would undoubtedly be needed at the national level but your focuswould naturally be on the bounds of the local authority over which you have some power. Except for specificnational transport policies such as fuel tax, transport policies tend to have geographic outcomes (to buildnew cycle infrastructure, for example, which must go somewhere) and this is especially so for low-carbontransport plans which tend to operate over distances of hundreds of metres rather than dozens of kilometres,due to inherent limits in the speeds of active modes (Iacono, Krizek, and El-Geneidy 2010).
Even high level national plans for a walking and cycling revolution must be implemented locally, downto the level of streets, as illustrated by the still ongoing local implementation of Dutch cycling ambitions(Pucher and Buehler 2008). The political-democratic and local-geographic aspects of transport planning canbe considered in isolation, but an integrated approach is necessary for effective policies (Hull 2008). Thisis well illustrated by prominent Mayoral transport policies in cities such as London,3 Paris4, and Bogotá,5where geographically specific interventions (such as congestion charges in carefully demarcated central zones)combined with citywide vision have enabled modal shift.
With issues such as climate change, air pollution, obesity and social inequalities high on the political agenda,and the benefits for ‘early adopters’ of evidence-based interventions to accelerate the shift away from themotor car in cities such as London, Paris and Bogotá, pressure is growing on local, city and national transportplanning departments to act. But what should they do, and where should they intervene? Geographicaldata and to some extent analysis (e.g. calculating distances) was integral to this ‘computational transportplanning’ activity, but input datasets were limited in size and accuracy. Partly in response to such driversfor geographic analysis in transport planning, there have been various attempts to define a more appliedGIS approach transport research. Miller (1999) advocated a new field, GIS for Transport (GIS-T), positedas an academic field at the interface between transport planning and GIS. Although the label gained limitedtraction in academia or practice, Harvey Miller’s call for a shift to methods and tools has been answeredin the 2000s and 2010s by researchers who have developed ideas and software that transport planners canactually use, including the Australian Research Infrastructure Network (AURIN), which is widely used fortransport planning and public health research in Australia (Pettit et al. 2014) and the Propensity to CycleTool (PCT, publicly available, including source code, at www.pct.bike) (Goodman et al. 2019).
2.3 Technological drivers
Technological change has increased the capabilities of transport planners since the the beginning of the dis-cipline, with transport planning tasks being an early use case of mainframe computers (Boyce and Williams2015). With unprecedented access to increasingly detailed datasets on transport behaviours and infras-tructure, transport planners today require tools that enable them to make sense of this ‘data revolution’(Transport Systems Catapult 2015). The sheer volume and complexity of new datasets require new ap-proaches that can scale and integrate multiple data sources (Lovelace et al. 2016). Advances in software andhardware allow not only for current transport systems to be modelled at high temporal and geographic res-olution, but for future scenarios and ‘model experiments’ to be developed, which can support identificationand implementation of the most effective interventions (Klosterman 1999).
3Transport is a major electoral issue in London and the current Mayor, Sadiq Kahn, has made tackling air pollution a policypriority. See tfl.gov.uk/corporate/about-tfl/the-mayors-transport-strategy.
4The current Mayor of Paris, Anne Hidalgo, sees transport as a priority and has plans to make public transport free. Seeparis.fr.
5Bogotá has an innovative and prominent transport policy, led by the two times mayor Enrique Peñalosa, who has led theroll-out of major bus and cycleway projects in the city. See sitp.gov.co.
7
With the explosion in open source software, which has risen to prominence data science, policy, data andtechnological drivers are pushing for geographic analysis to be better integrated in transport planning tools,alongside wider shifts for towards more data driven, transparent and democratically accountable transportplanning workflows. At present this dream is far from reality, despite the long history of geographic methods,public involvement and technological innovation in transport planning.
3 The current landscape
In broad terms, digital transport planning tools are like any other computer program in that they take inputswhich are processed to generate outputs (Knuth 1997). The broader term ‘transport model’ is sometimesused interchangeably with transport software but in this paper we follow (Hollander 2016) in using ‘model’to refer to the theories and mathematics underlying transport planning software, rather than the softwarethat implements the model.6 In relation to the narrower concept of ‘algorithm,’ transport planning softwarecan be seen as a computing environment or system that provides a user interface to run a range of algorithmsinteractively on a range of input datasets to generate outputs that can feed into the wider transport planningprocess (Boyce and Williams 2015).
Software for transport planning can be grouped by the scale at which it operates, with broad categories beingmicroscopic and macroscopic (macro) models (Kotusevski and Hawick 2009; Hildebrand and Hörtin 2014).Microscopic transport models represent individual vehicles on the road network and are therefore able torepresent localised phenomena such as traffic congestion. Macro models, by contrast, represent aggregatesof vehicular traffic over large spatial scales, in which “the total flow is studied” and behaviour of individualvehicles is omitted (Hildebrand and Hörtin 2014). Of course the distinction is, in reality, an oversimplification:there is a continuum between macro and microscopic transport models; advances in computing increasinglyenable both approaches to be combined, enabling researchers to choose the most appropriate spatial scales fortheir application (Moeckel et al. 2018). The focus of this paper is on macro models which enable modellingof the implications of future changes in transport behaviour and infrastructure on flow at city scales, withresults down the route network level (microscopic models tend to be used to model individual route segmentsand intersections), and their geographic analysis capabilities.
This history is detailed in Chapter 10 of Forecasting Urban Travel (Boyce and Williams 2015) called “Com-puting environment and travel forecasting software,” which provides an insight into how software has beenused in transport planning over the years. Of course, software development has always depended on thephysical hardware on which it runs and the early days of transport planning software were characterised bybespoke programs running on mainframe computers and maintained by domain experts. Transport planningbodies and researchers in the USA led developments in the 1960s and 1970s when computers first startedto be used for transport planning, when the main problem that they addressed was how to deal with theexplosive growth in car ownership and use that was taking place during those decades. More overtly politicalfactors also influenced the direction of transport planning software: “certain private firms complained to USDoT [Department of Transport] that its agencies were developing software in competition with the privatesector,” leading to the abandonment of publicly funded transport planning software development projects,notably UTPS (Boyce and Williams 2015).7 This transfer of transport planning software development to theprivate sector contrasts with the history of GIS. The example of GRASS (Geographic Resources AnalysisSupport System) illustrates this point and helps explain the dominance of proprietary software in transportplanning. Like UTPS, GRASS was a publicly funded software project. Unlike UTPS, it was made freelyavailable to the public and was open sourced (in 1999), meaning that it has been under continuous devel-
6There is of course a close relationship between transport planning software and models because theoretical models can informthe direction of software developments, as was the case with the development of spatial interaction models (Boyce and Williams2015). Conversely, ‘upstream’ developments in computer languages affect the range of models that can be implemented, as canbe seen with the current shift towards cloud-based and more visual and interactive transport models such as the open sourceStreetmix and the Institute of Transport Engineers endorsed StreetPlan tools for visualising 1D street layouts and cloud-basedtransport planning services such as Remix.
7UTPS stands for the UMT (Urban Mass Transportation Administration, an agency of the DoT responsible for transportplanning) Transportation Planning System (UTPS).
8
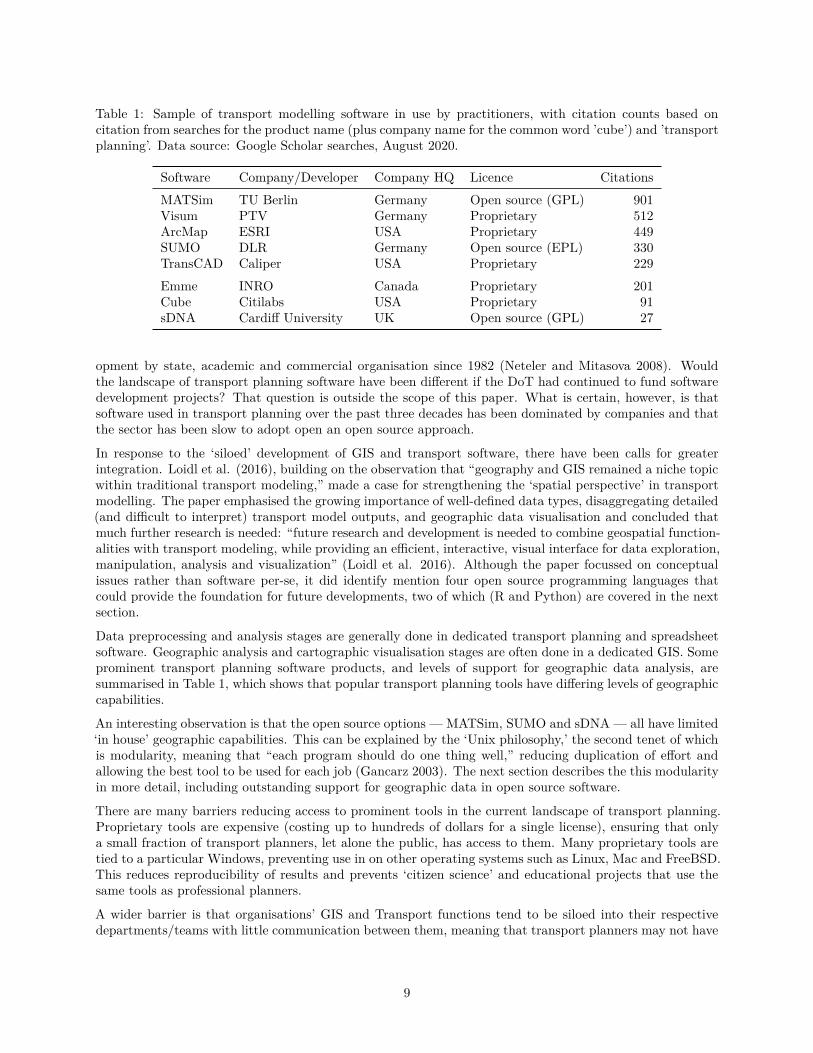
Table 1: Sample of transport modelling software in use by practitioners, with citation counts based oncitation from searches for the product name (plus company name for the common word ’cube’) and ’transportplanning’. Data source: Google Scholar searches, August 2020.
Software Company/Developer Company HQ Licence CitationsMATSim TU Berlin Germany Open source (GPL) 901Visum PTV Germany Proprietary 512ArcMap ESRI USA Proprietary 449SUMO DLR Germany Open source (EPL) 330TransCAD Caliper USA Proprietary 229Emme INRO Canada Proprietary 201Cube Citilabs USA Proprietary 91sDNA Cardiff University UK Open source (GPL) 27
opment by state, academic and commercial organisation since 1982 (Neteler and Mitasova 2008). Wouldthe landscape of transport planning software have been different if the DoT had continued to fund softwaredevelopment projects? That question is outside the scope of this paper. What is certain, however, is thatsoftware used in transport planning over the past three decades has been dominated by companies and thatthe sector has been slow to adopt open an open source approach.
In response to the ‘siloed’ development of GIS and transport software, there have been calls for greaterintegration. Loidl et al. (2016), building on the observation that “geography and GIS remained a niche topicwithin traditional transport modeling,” made a case for strengthening the ‘spatial perspective’ in transportmodelling. The paper emphasised the growing importance of well-defined data types, disaggregating detailed(and difficult to interpret) transport model outputs, and geographic data visualisation and concluded thatmuch further research is needed: “future research and development is needed to combine geospatial function-alities with transport modeling, while providing an efficient, interactive, visual interface for data exploration,manipulation, analysis and visualization” (Loidl et al. 2016). Although the paper focussed on conceptualissues rather than software per-se, it did identify mention four open source programming languages thatcould provide the foundation for future developments, two of which (R and Python) are covered in the nextsection.
Data preprocessing and analysis stages are generally done in dedicated transport planning and spreadsheetsoftware. Geographic analysis and cartographic visualisation stages are often done in a dedicated GIS. Someprominent transport planning software products, and levels of support for geographic data analysis, aresummarised in Table 1, which shows that popular transport planning tools have differing levels of geographiccapabilities.
An interesting observation is that the open source options — MATSim, SUMO and sDNA — all have limited‘in house’ geographic capabilities. This can be explained by the ‘Unix philosophy,’ the second tenet of whichis modularity, meaning that “each program should do one thing well,” reducing duplication of effort andallowing the best tool to be used for each job (Gancarz 2003). The next section describes the this modularityin more detail, including outstanding support for geographic data in open source software.
There are many barriers reducing access to prominent tools in the current landscape of transport planning.Proprietary tools are expensive (costing up to hundreds of dollars for a single license), ensuring that onlya small fraction of transport planners, let alone the public, has access to them. Many proprietary tools aretied to a particular Windows, preventing use in on other operating systems such as Linux, Mac and FreeBSD.This reduces reproducibility of results and prevents ‘citizen science’ and educational projects that use thesame tools as professional planners.
A wider barrier is that organisations’ GIS and Transport functions tend to be siloed into their respectivedepartments/teams with little communication between them, meaning that transport planners may not have
9
access to the latest geographic data or software.8 This relates to tools because if transport planners andGIS analysts are using different programs for their work, transport planners will be less likely to collaboratewith people with geographic analysis skills or identify potential geographic solutions to their domain-specificproblems. The extent to which these barriers can be overcome by open source software ecosystems is exploredin the next section.
4 Open source tools for geographic analysis in transport planning
Technological, environment and societal changes are driving demand for accessible tools for geographicanalysis transport planning. This section reviews prominent open source tools that are already being usedto tackle transport planning challenges. Open source tools for geographic analysis in transport planninghave not emerged in a vacuum. They were developed in the wider landscape of open source software (Dhirand Dhir 2017).
These tools could be classified by the five main stages illustrated in Figure 1 (data collection, processing,routing, modelling and visualisation). Instead, because many tools can be used in multiple stages, can bemore usefully classified from the user’s perspective. Based on open tools identified through web searches,they can be classified into the follow broad, and to some extent overlapping,9 user interface (UI) types (seeTable 2):
• command-line interface (CLI) tools, primarily controlled by typing commands• graphical user interface (GUI) tools, primarily controlled by mouse clicks• web user interface (WUI) tools that users access through a web browser• web application programming interfaces (API) that computers access over the web
In this paper we will focus on projects in the first three categories. Numerous open source ‘routing engine’projects provide a range of high performance routing and other transport data analysis services via a webapplication programming interface (API). While technically these can be used for geographic analysis tasks,they are more commonly used by transport planners as remote services, and are usually the preserve ofsoftware developers, so were excluded from Table 2.
4.1 Defining open source
Before describing open source tools for transport planning, classified by their main user interface, is worthconsidering what ‘open source’ means.
Open source software differs from proprietary software in that users are free to see, download and modifythe source code. Freedom is central to open source software, which is sometimes referred to simply as ‘freesoftware,’ defined by the Free Software Foundation (FSF) as follows:10
software that gives you the user the freedom to share, study and modify it.
This adaptability is conducive to collaboration, the creation of mutually supportive user/developer commu-nities and rapid evolution, making open source software ecosystems fast moving and highly diverse. It isimpossible to discuss all software options that could be used for geographic transport planning: there areliterally thousands of software projects written in dozens of programming languages, many of which are nolonger actively maintained (Coelho et al. 2020). Transport planners should use solutions that are futureproof and actively maintained.
8Thanks to Crispin Cooper, author of sDNA, for raising this barrier.9Some tools can be used through multiple interfaces but most have a dominant interface type.
10See https://www.fsf.org/about/what-is-free-software for a full definition and context.
10
4.2 Methods to identify open source tools
To identify open source tools for transport planning, a search approach was used to incorporate projects thathave been written-up in the academic literature, and projects which exist only as software projects, with aminimum level of popularity. The method was as follows:
1. Undertake searches of Google Scholar, DuckDuckGo and the popular code hosting platform with searchterms set to identify open source projects for transport planning.
2. Combine results from the searches into a single dataset and rank the projects according to evidence ofusage.
3. Verify that the projects are open source and actively maintained by analysis of package documentationand source code.
4. Classify and the projects based on their main user interface, resulting in Table 2 (see open_tools.csvfor a more complete list that includes web APIs). These tools are described in more detail in thefollowing three sections.
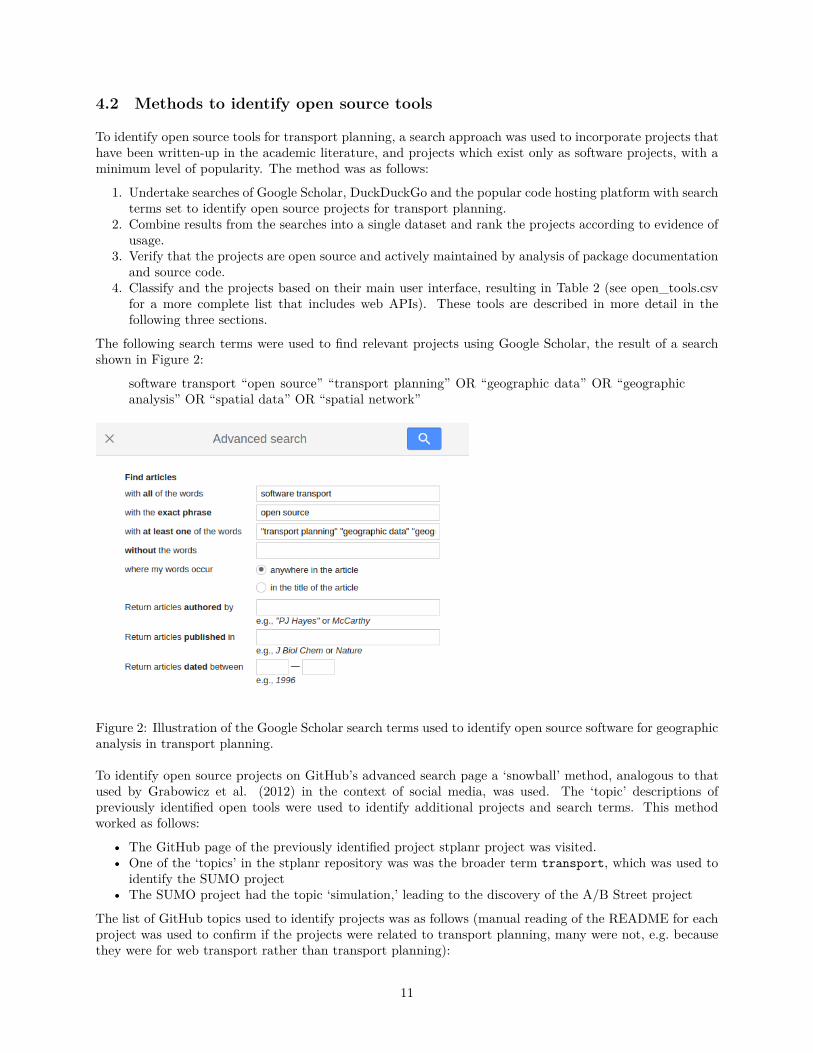
The following search terms were used to find relevant projects using Google Scholar, the result of a searchshown in Figure 2:
software transport “open source” “transport planning” OR “geographic data” OR “geographicanalysis” OR “spatial data” OR “spatial network”
Figure 2: Illustration of the Google Scholar search terms used to identify open source software for geographicanalysis in transport planning.
To identify open source projects on GitHub’s advanced search page a ‘snowball’ method, analogous to thatused by Grabowicz et al. (2012) in the context of social media, was used. The ‘topic’ descriptions ofpreviously identified open tools were used to identify additional projects and search terms. This methodworked as follows:
• The GitHub page of the previously identified project stplanr project was visited.• One of the ‘topics’ in the stplanr repository was was the broader term transport, which was used to
identify the SUMO project• The SUMO project had the topic ‘simulation,’ leading to the discovery of the A/B Street project
The list of GitHub topics used to identify projects was as follows (manual reading of the README for eachproject was used to confirm if the projects were related to transport planning, many were not, e.g. becausethey were for web transport rather than transport planning):
11
transport planning, transport, transportation-planning, traffic-simulation, simulation, trajectory
To overcome the limitation that not all open source software projects are hosted on GitHub or described inacademic papers, snowballing via web pages such as the QGIS plugin homepage, links in project READMEfiles and social media were used to find additional projects. Only projects with the following criteria wereincluded (see open_tools.csv for online version):
1. The tool was designed to support transport planning using geographic data analysis and supports thedesign and placement of physical infrastructure for urban mobility, based on the project’s website orcode repository
2. Evidence that the tool is being used in practice, via citations, ‘stars’ or other type of ‘upvote’3. Evidence that the tool is actively maintained, with activity in the last 12 months4. Availability of source code with a visible open source license
A secondary filter was used to focus attention on tools for analysis: projects whose primary purpose is toprovide an interface to an existing software/services, such as the R package opentripplanner (e.g. Morganet al. 2019; Giraud 2019) and routing engines (Luxen and Vetter 2011; Padgham 2019) are omitted fromTable 2 for brevity (routing engines are mentioned in the final section of the paper). Tools can be classified ina variety of ways from a developer’s perspective including sometimes tribal ‘ecosystems’ such as R packages,Python packages and QGIS plugins. From a transport planner’s perspective, however, the technology ordeveloper community from which tools emerge may be irrelevant: what is important is what the tool can doand its ease-of-use. We therefore describe the tools in order of their primary user interface, in chronologicalorder of the interface’s development (CLIs predate GUIs which predate WUIs), acknowledging the fact thatmost tools with a prominent GUI and WUI can also be used from the command line. While sDNA andAequilibraE can be used from the command-line, their documentation suggests they are more likely to beused from graphical interfaces via QGIS plugins, resulting in the categorisation shown in Table 2.
It should be clear that the ‘Type’ and ‘Language’ values shown in Table 2 are also fuzzy: open source softwareis by nature modular and flexible, meaning that the same piece of code can take multiple different forms andthe same method can be implemented in multiple languages. The AequilibraE QGIS plugin (Camargo 2015),for example, is also a Python package. Conversely, the MovingPandas Python package by Graser (2019) isalso a QGIS plugin. The point is that the most prominent category into which each project seemed to fall,based on documentation, was used. The rest of this section outlines some of the capabilities of each toolpresented in Table 2 based on the author’s reading of easily available documentation: due to time constraintsno systematic installation tests or benchmarks were undertaken, although this could be a direction of futureresearch.
An interesting insight provided by the popularity metrics of ‘Stars’ (meaning the number of people who had‘starred’ the project on GitHub) and Citations (to the main paper outlining the tool, where available) asof September 2020 is that the choice of metric has a large impact on perceived popularity. While MatSIMis perhaps the tool in Table 2 that has most uptake in applied transport planning, it had only a moderatenumber of Stars (285) compared with the number of papers citing the tool’s main reference the tool, whichis in itself a free and open resource (Horni, Nagel, and Axhausen 2016). A/B Street, by contrast, had morethan twenty times the number of Stars on GitHub but no academic paper that could be found in the publicdomain at the time of writing. This highlights the fact that different user communities visit different forumsand, furthermore, many transport practitioners will neither write academic papers not be active GitHubusers, making the uptake of different software projects even harder to monitor, an issue we return to inSection 5.
4.3 Command-line interface (CLI) tools
Tools based on a command line interface (CLI) are designed to be controlled primarily by typing commands.CLIs predate graphical user interfaces (GUIs), which are controlled by ‘pointing and clicking’ (Sherman2008). CLIs can take time to learn, especially for people who have been trained on GUI-based software suchas Microsoft Word. After overcoming often steep ‘learning curves,’ the advantages of CLI-based tools forusers become substantial. The approach can be highly productive, with hundreds of commands only a few
12

Table 2: Open source tools for geographic analysis in transport planning, based on data from Google Scholar,GitHub and web searches and classified in by their primary user interface. CLI, GUI and WUI refer tocommand-line, graphical user and web user interfaces respectively.
Tool Type Licence Language Stars Citations ReferenceCLI
OSMnx Python package MIT Python 2496 302 (Boeing 2017)SUMO Standalone EPL-2.0 C++ 736 219 (Lopez et al. 2018)UrbanSim Python package AGPLv3 Python 310 1444 (Waddell 2002)MovingPandas Python package BSD-3 Python 307 6 (Graser 2019)MATSim Standalone GPLv2 Java 285 564 (Horni et al. 2016)Scikit-mobility Python package BSD-3 Python 251 1 (Pappalardo et al. 2019)stplanr R package MIT R 201 9 (Lovelace et al. 2018)momepy Python package MIT Python 133 3 (Fleischmann 2019)Trip-simulator JavaScript package MIT JavaScript 117 NA NAurbanaccess Python package AGPLv3 Python 105 12 (Blanchard 2017)spaghetti Python package BSD-3 Python 60 0 (Gaboardi et al., 2018)urbanpy Python package MIT Python 16 NA NA
GUIABStreet Standalone Apache-2.0 Rust 4896 NA NAVeins Standalone GPLv2 C++ 155 NA NAAequilibraE QGIS plugin Custom Python 57 3 (Carmargo 2015)QNEAT3 QGIS plugin GPLv3 Python 35 NA NANetworks plugin QGIS plugin GPLv3 Python 9 NA NAsDNA QGIS plugin GPLv3 C++ 9 27 (Cooper 2015)AwaP QGIS plugin GPLv3 Python 3 2 (Majik and Pafka 2019)
WUICitybound Standalone AGPLv3 Rust 6124 NA NAStreetMix Hosted service BSD-3 JavaScript 440 6 (Riggs et al. 2016)flowmap.blue Standalone MIT TypeScript 90 NA NAConveyal Analysis Hosted service MIT Java 19 NA NAPCT Hosted service AGPLv3 R 16 66 (Lovelace et al. 2017)TrajAnalytics Standalone BSD-3 JavaScript NA 0 (Shamal et al. 2019)
13
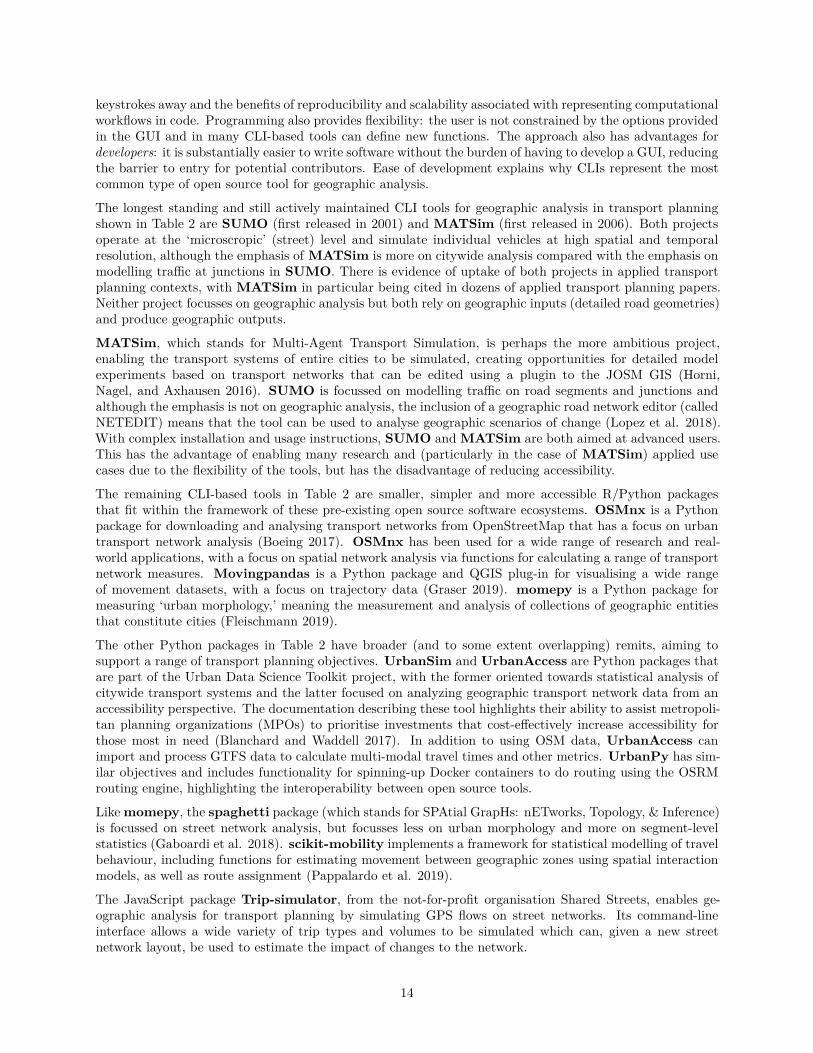
keystrokes away and the benefits of reproducibility and scalability associated with representing computationalworkflows in code. Programming also provides flexibility: the user is not constrained by the options providedin the GUI and in many CLI-based tools can define new functions. The approach also has advantages fordevelopers: it is substantially easier to write software without the burden of having to develop a GUI, reducingthe barrier to entry for potential contributors. Ease of development explains why CLIs represent the mostcommon type of open source tool for geographic analysis.
The longest standing and still actively maintained CLI tools for geographic analysis in transport planningshown in Table 2 are SUMO (first released in 2001) and MATSim (first released in 2006). Both projectsoperate at the ‘microscropic’ (street) level and simulate individual vehicles at high spatial and temporalresolution, although the emphasis of MATSim is more on citywide analysis compared with the emphasis onmodelling traffic at junctions in SUMO. There is evidence of uptake of both projects in applied transportplanning contexts, with MATSim in particular being cited in dozens of applied transport planning papers.Neither project focusses on geographic analysis but both rely on geographic inputs (detailed road geometries)and produce geographic outputs.
MATSim, which stands for Multi-Agent Transport Simulation, is perhaps the more ambitious project,enabling the transport systems of entire cities to be simulated, creating opportunities for detailed modelexperiments based on transport networks that can be edited using a plugin to the JOSM GIS (Horni,Nagel, and Axhausen 2016). SUMO is focussed on modelling traffic on road segments and junctions andalthough the emphasis is not on geographic analysis, the inclusion of a geographic road network editor (calledNETEDIT) means that the tool can be used to analyse geographic scenarios of change (Lopez et al. 2018).With complex installation and usage instructions, SUMO and MATSim are both aimed at advanced users.This has the advantage of enabling many research and (particularly in the case of MATSim) applied usecases due to the flexibility of the tools, but has the disadvantage of reducing accessibility.
The remaining CLI-based tools in Table 2 are smaller, simpler and more accessible R/Python packagesthat fit within the framework of these pre-existing open source software ecosystems. OSMnx is a Pythonpackage for downloading and analysing transport networks from OpenStreetMap that has a focus on urbantransport network analysis (Boeing 2017). OSMnx has been used for a wide range of research and real-world applications, with a focus on spatial network analysis via functions for calculating a range of transportnetwork measures. Movingpandas is a Python package and QGIS plug-in for visualising a wide rangeof movement datasets, with a focus on trajectory data (Graser 2019). momepy is a Python package formeasuring ‘urban morphology,’ meaning the measurement and analysis of collections of geographic entitiesthat constitute cities (Fleischmann 2019).
The other Python packages in Table 2 have broader (and to some extent overlapping) remits, aiming tosupport a range of transport planning objectives. UrbanSim and UrbanAccess are Python packages thatare part of the Urban Data Science Toolkit project, with the former oriented towards statistical analysis ofcitywide transport systems and the latter focused on analyzing geographic transport network data from anaccessibility perspective. The documentation describing these tool highlights their ability to assist metropoli-tan planning organizations (MPOs) to prioritise investments that cost-effectively increase accessibility forthose most in need (Blanchard and Waddell 2017). In addition to using OSM data, UrbanAccess canimport and process GTFS data to calculate multi-modal travel times and other metrics. UrbanPy has sim-ilar objectives and includes functionality for spinning-up Docker containers to do routing using the OSRMrouting engine, highlighting the interoperability between open source tools.
Like momepy, the spaghetti package (which stands for SPAtial GrapHs: nETworks, Topology, & Inference)is focussed on street network analysis, but focusses less on urban morphology and more on segment-levelstatistics (Gaboardi et al. 2018). scikit-mobility implements a framework for statistical modelling of travelbehaviour, including functions for estimating movement between geographic zones using spatial interactionmodels, as well as route assignment (Pappalardo et al. 2019).
The JavaScript package Trip-simulator, from the not-for-profit organisation Shared Streets, enables ge-ographic analysis for transport planning by simulating GPS flows on street networks. Its command-lineinterface allows a wide variety of trip types and volumes to be simulated which can, given a new streetnetwork layout, be used to estimate the impact of changes to the network.
14
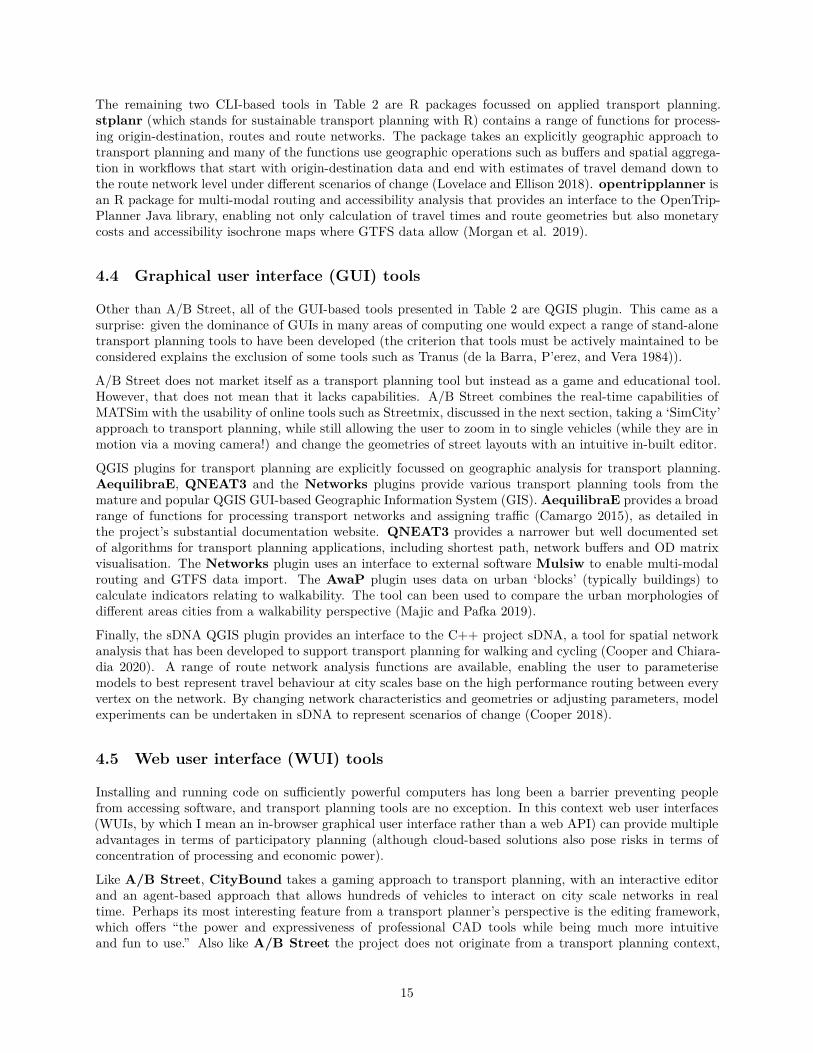
The remaining two CLI-based tools in Table 2 are R packages focussed on applied transport planning.stplanr (which stands for sustainable transport planning with R) contains a range of functions for process-ing origin-destination, routes and route networks. The package takes an explicitly geographic approach totransport planning and many of the functions use geographic operations such as buffers and spatial aggrega-tion in workflows that start with origin-destination data and end with estimates of travel demand down tothe route network level under different scenarios of change (Lovelace and Ellison 2018). opentripplanner isan R package for multi-modal routing and accessibility analysis that provides an interface to the OpenTrip-Planner Java library, enabling not only calculation of travel times and route geometries but also monetarycosts and accessibility isochrone maps where GTFS data allow (Morgan et al. 2019).
4.4 Graphical user interface (GUI) tools
Other than A/B Street, all of the GUI-based tools presented in Table 2 are QGIS plugin. This came as asurprise: given the dominance of GUIs in many areas of computing one would expect a range of stand-alonetransport planning tools to have been developed (the criterion that tools must be actively maintained to beconsidered explains the exclusion of some tools such as Tranus (de la Barra, P’erez, and Vera 1984)).
A/B Street does not market itself as a transport planning tool but instead as a game and educational tool.However, that does not mean that it lacks capabilities. A/B Street combines the real-time capabilities ofMATSim with the usability of online tools such as Streetmix, discussed in the next section, taking a ‘SimCity’approach to transport planning, while still allowing the user to zoom in to single vehicles (while they are inmotion via a moving camera!) and change the geometries of street layouts with an intuitive in-built editor.
QGIS plugins for transport planning are explicitly focussed on geographic analysis for transport planning.AequilibraE, QNEAT3 and the Networks plugins provide various transport planning tools from themature and popular QGIS GUI-based Geographic Information System (GIS). AequilibraE provides a broadrange of functions for processing transport networks and assigning traffic (Camargo 2015), as detailed inthe project’s substantial documentation website. QNEAT3 provides a narrower but well documented setof algorithms for transport planning applications, including shortest path, network buffers and OD matrixvisualisation. The Networks plugin uses an interface to external software Mulsiw to enable multi-modalrouting and GTFS data import. The AwaP plugin uses data on urban ‘blocks’ (typically buildings) tocalculate indicators relating to walkability. The tool can been used to compare the urban morphologies ofdifferent areas cities from a walkability perspective (Majic and Pafka 2019).
Finally, the sDNA QGIS plugin provides an interface to the C++ project sDNA, a tool for spatial networkanalysis that has been developed to support transport planning for walking and cycling (Cooper and Chiara-dia 2020). A range of route network analysis functions are available, enabling the user to parameterisemodels to best represent travel behaviour at city scales base on the high performance routing between everyvertex on the network. By changing network characteristics and geometries or adjusting parameters, modelexperiments can be undertaken in sDNA to represent scenarios of change (Cooper 2018).
4.5 Web user interface (WUI) tools
Installing and running code on sufficiently powerful computers has long been a barrier preventing peoplefrom accessing software, and transport planning tools are no exception. In this context web user interfaces(WUIs, by which I mean an in-browser graphical user interface rather than a web API) can provide multipleadvantages in terms of participatory planning (although cloud-based solutions also pose risks in terms ofconcentration of processing and economic power).
Like A/B Street, CityBound takes a gaming approach to transport planning, with an interactive editorand an agent-based approach that allows hundreds of vehicles to interact on city scale networks in realtime. Perhaps its most interesting feature from a transport planner’s perspective is the editing framework,which offers “the power and expressiveness of professional CAD tools while being much more intuitiveand fun to use.” Also like A/B Street the project does not originate from a transport planning context,
15
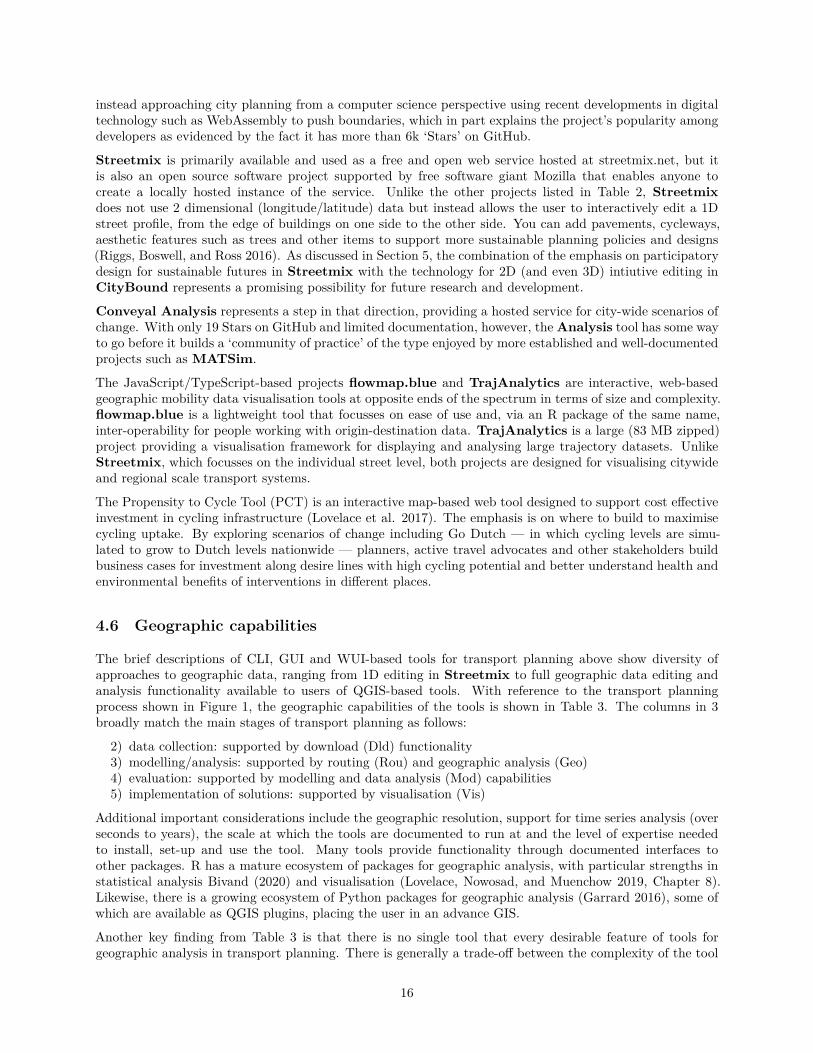
instead approaching city planning from a computer science perspective using recent developments in digitaltechnology such as WebAssembly to push boundaries, which in part explains the project’s popularity amongdevelopers as evidenced by the fact it has more than 6k ‘Stars’ on GitHub.
Streetmix is primarily available and used as a free and open web service hosted at streetmix.net, but itis also an open source software project supported by free software giant Mozilla that enables anyone tocreate a locally hosted instance of the service. Unlike the other projects listed in Table 2, Streetmixdoes not use 2 dimensional (longitude/latitude) data but instead allows the user to interactively edit a 1Dstreet profile, from the edge of buildings on one side to the other side. You can add pavements, cycleways,aesthetic features such as trees and other items to support more sustainable planning policies and designs(Riggs, Boswell, and Ross 2016). As discussed in Section 5, the combination of the emphasis on participatorydesign for sustainable futures in Streetmix with the technology for 2D (and even 3D) intiutive editing inCityBound represents a promising possibility for future research and development.
Conveyal Analysis represents a step in that direction, providing a hosted service for city-wide scenarios ofchange. With only 19 Stars on GitHub and limited documentation, however, the Analysis tool has some wayto go before it builds a ‘community of practice’ of the type enjoyed by more established and well-documentedprojects such as MATSim.
The JavaScript/TypeScript-based projects flowmap.blue and TrajAnalytics are interactive, web-basedgeographic mobility data visualisation tools at opposite ends of the spectrum in terms of size and complexity.flowmap.blue is a lightweight tool that focusses on ease of use and, via an R package of the same name,inter-operability for people working with origin-destination data. TrajAnalytics is a large (83 MB zipped)project providing a visualisation framework for displaying and analysing large trajectory datasets. UnlikeStreetmix, which focusses on the individual street level, both projects are designed for visualising citywideand regional scale transport systems.
The Propensity to Cycle Tool (PCT) is an interactive map-based web tool designed to support cost effectiveinvestment in cycling infrastructure (Lovelace et al. 2017). The emphasis is on where to build to maximisecycling uptake. By exploring scenarios of change including Go Dutch — in which cycling levels are simu-lated to grow to Dutch levels nationwide — planners, active travel advocates and other stakeholders buildbusiness cases for investment along desire lines with high cycling potential and better understand health andenvironmental benefits of interventions in different places.
4.6 Geographic capabilities
The brief descriptions of CLI, GUI and WUI-based tools for transport planning above show diversity ofapproaches to geographic data, ranging from 1D editing in Streetmix to full geographic data editing andanalysis functionality available to users of QGIS-based tools. With reference to the transport planningprocess shown in Figure 1, the geographic capabilities of the tools is shown in Table 3. The columns in 3broadly match the main stages of transport planning as follows:
2) data collection: supported by download (Dld) functionality3) modelling/analysis: supported by routing (Rou) and geographic analysis (Geo)4) evaluation: supported by modelling and data analysis (Mod) capabilities5) implementation of solutions: supported by visualisation (Vis)
Additional important considerations include the geographic resolution, support for time series analysis (overseconds to years), the scale at which the tools are documented to run at and the level of expertise neededto install, set-up and use the tool. Many tools provide functionality through documented interfaces toother packages. R has a mature ecosystem of packages for geographic analysis, with particular strengths instatistical analysis Bivand (2020) and visualisation (Lovelace, Nowosad, and Muenchow 2019, Chapter 8).Likewise, there is a growing ecosystem of Python packages for geographic analysis (Garrard 2016), some ofwhich are available as QGIS plugins, placing the user in an advance GIS.
Another key finding from Table 3 is that there is no single tool that every desirable feature of tools forgeographic analysis in transport planning. There is generally a trade-off between the complexity of the tool
16
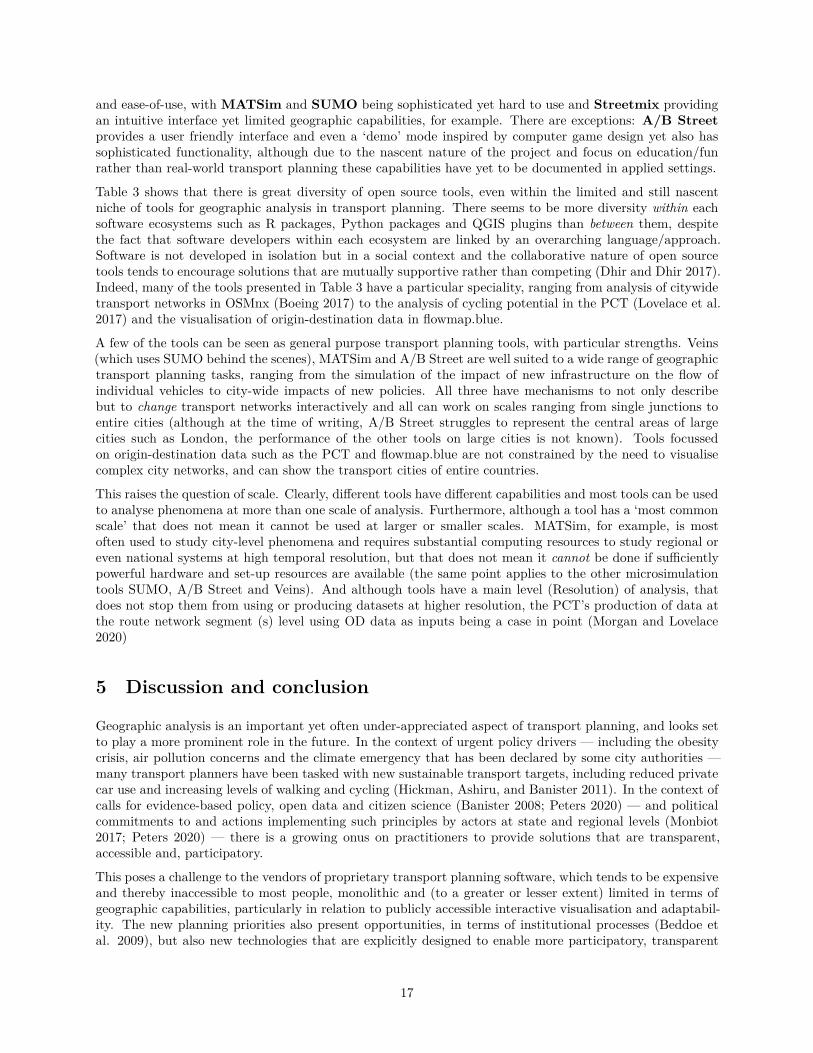
and ease-of-use, with MATSim and SUMO being sophisticated yet hard to use and Streetmix providingan intuitive interface yet limited geographic capabilities, for example. There are exceptions: A/B Streetprovides a user friendly interface and even a ‘demo’ mode inspired by computer game design yet also hassophisticated functionality, although due to the nascent nature of the project and focus on education/funrather than real-world transport planning these capabilities have yet to be documented in applied settings.
Table 3 shows that there is great diversity of open source tools, even within the limited and still nascentniche of tools for geographic analysis in transport planning. There seems to be more diversity within eachsoftware ecosystems such as R packages, Python packages and QGIS plugins than between them, despitethe fact that software developers within each ecosystem are linked by an overarching language/approach.Software is not developed in isolation but in a social context and the collaborative nature of open sourcetools tends to encourage solutions that are mutually supportive rather than competing (Dhir and Dhir 2017).Indeed, many of the tools presented in Table 3 have a particular speciality, ranging from analysis of citywidetransport networks in OSMnx (Boeing 2017) to the analysis of cycling potential in the PCT (Lovelace et al.2017) and the visualisation of origin-destination data in flowmap.blue.
A few of the tools can be seen as general purpose transport planning tools, with particular strengths. Veins(which uses SUMO behind the scenes), MATSim and A/B Street are well suited to a wide range of geographictransport planning tasks, ranging from the simulation of the impact of new infrastructure on the flow ofindividual vehicles to city-wide impacts of new policies. All three have mechanisms to not only describebut to change transport networks interactively and all can work on scales ranging from single junctions toentire cities (although at the time of writing, A/B Street struggles to represent the central areas of largecities such as London, the performance of the other tools on large cities is not known). Tools focussedon origin-destination data such as the PCT and flowmap.blue are not constrained by the need to visualisecomplex city networks, and can show the transport cities of entire countries.
This raises the question of scale. Clearly, different tools have different capabilities and most tools can be usedto analyse phenomena at more than one scale of analysis. Furthermore, although a tool has a ‘most commonscale’ that does not mean it cannot be used at larger or smaller scales. MATSim, for example, is mostoften used to study city-level phenomena and requires substantial computing resources to study regional oreven national systems at high temporal resolution, but that does not mean it cannot be done if sufficientlypowerful hardware and set-up resources are available (the same point applies to the other microsimulationtools SUMO, A/B Street and Veins). And although tools have a main level (Resolution) of analysis, thatdoes not stop them from using or producing datasets at higher resolution, the PCT’s production of data atthe route network segment (s) level using OD data as inputs being a case in point (Morgan and Lovelace2020)
5 Discussion and conclusion
Geographic analysis is an important yet often under-appreciated aspect of transport planning, and looks setto play a more prominent role in the future. In the context of urgent policy drivers — including the obesitycrisis, air pollution concerns and the climate emergency that has been declared by some city authorities —many transport planners have been tasked with new sustainable transport targets, including reduced privatecar use and increasing levels of walking and cycling (Hickman, Ashiru, and Banister 2011). In the context ofcalls for evidence-based policy, open data and citizen science (Banister 2008; Peters 2020) — and politicalcommitments to and actions implementing such principles by actors at state and regional levels (Monbiot2017; Peters 2020) — there is a growing onus on practitioners to provide solutions that are transparent,accessible and, participatory.
This poses a challenge to the vendors of proprietary transport planning software, which tends to be expensiveand thereby inaccessible to most people, monolithic and (to a greater or lesser extent) limited in terms ofgeographic capabilities, particularly in relation to publicly accessible interactive visualisation and adaptabil-ity. The new planning priorities also present opportunities, in terms of institutional processes (Beddoe etal. 2009), but also new technologies that are explicitly designed to enable more participatory, transparent
17
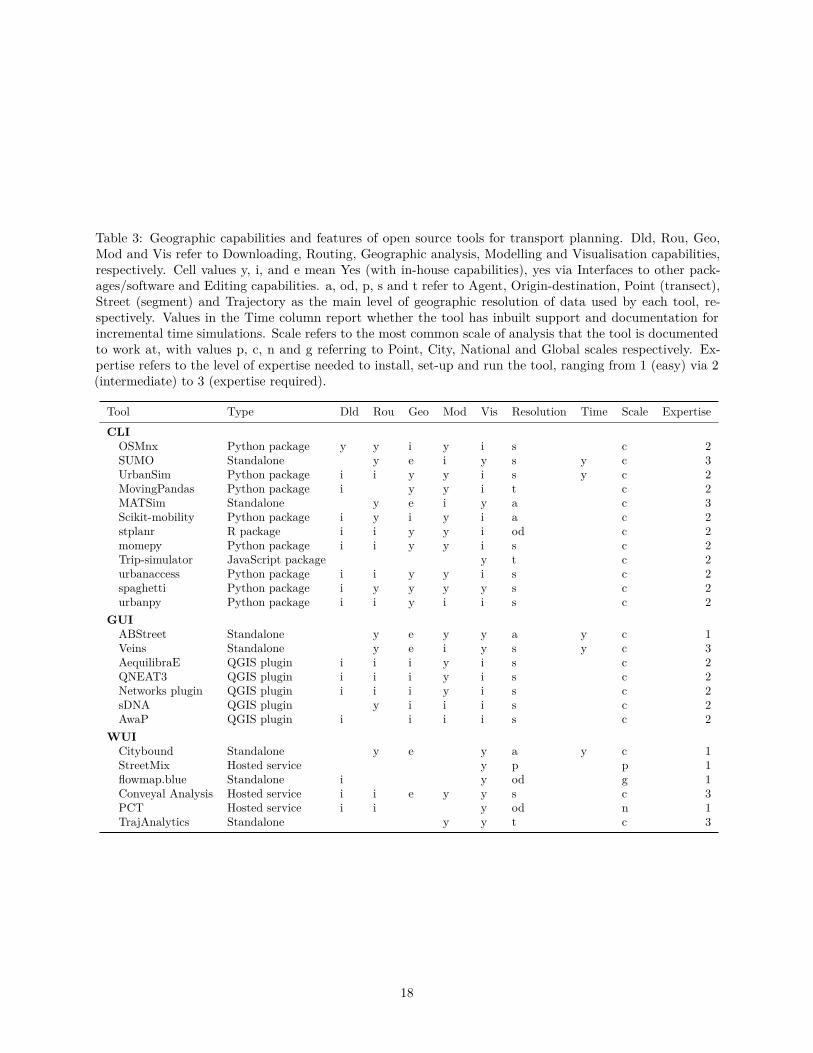
Table 3: Geographic capabilities and features of open source tools for transport planning. Dld, Rou, Geo,Mod and Vis refer to Downloading, Routing, Geographic analysis, Modelling and Visualisation capabilities,respectively. Cell values y, i, and e mean Yes (with in-house capabilities), yes via Interfaces to other pack-ages/software and Editing capabilities. a, od, p, s and t refer to Agent, Origin-destination, Point (transect),Street (segment) and Trajectory as the main level of geographic resolution of data used by each tool, re-spectively. Values in the Time column report whether the tool has inbuilt support and documentation forincremental time simulations. Scale refers to the most common scale of analysis that the tool is documentedto work at, with values p, c, n and g referring to Point, City, National and Global scales respectively. Ex-pertise refers to the level of expertise needed to install, set-up and run the tool, ranging from 1 (easy) via 2(intermediate) to 3 (expertise required).
Tool Type Dld Rou Geo Mod Vis Resolution Time Scale ExpertiseCLI
OSMnx Python package y y i y i s c 2SUMO Standalone y e i y s y c 3UrbanSim Python package i i y y i s y c 2MovingPandas Python package i y y i t c 2MATSim Standalone y e i y a c 3Scikit-mobility Python package i y i y i a c 2stplanr R package i i y y i od c 2momepy Python package i i y y i s c 2Trip-simulator JavaScript package y t c 2urbanaccess Python package i i y y i s c 2spaghetti Python package i y y y y s c 2urbanpy Python package i i y i i s c 2
GUIABStreet Standalone y e y y a y c 1Veins Standalone y e i y s y c 3AequilibraE QGIS plugin i i i y i s c 2QNEAT3 QGIS plugin i i i y i s c 2Networks plugin QGIS plugin i i i y i s c 2sDNA QGIS plugin y i i i s c 2AwaP QGIS plugin i i i i s c 2
WUICitybound Standalone y e y a y c 1StreetMix Hosted service y p p 1flowmap.blue Standalone i y od g 1Conveyal Analysis Hosted service i i e y y s c 3PCT Hosted service i i y od n 1TrajAnalytics Standalone y y t c 3
18
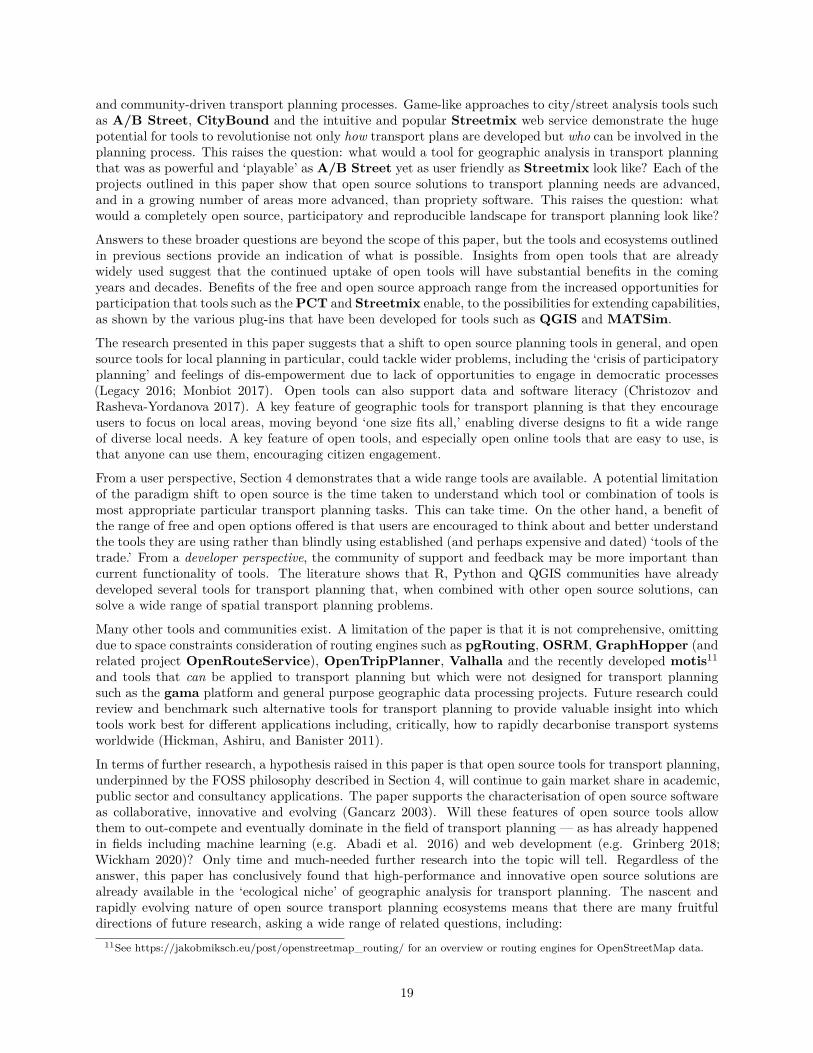
and community-driven transport planning processes. Game-like approaches to city/street analysis tools suchas A/B Street, CityBound and the intuitive and popular Streetmix web service demonstrate the hugepotential for tools to revolutionise not only how transport plans are developed but who can be involved in theplanning process. This raises the question: what would a tool for geographic analysis in transport planningthat was as powerful and ‘playable’ as A/B Street yet as user friendly as Streetmix look like? Each of theprojects outlined in this paper show that open source solutions to transport planning needs are advanced,and in a growing number of areas more advanced, than propriety software. This raises the question: whatwould a completely open source, participatory and reproducible landscape for transport planning look like?
Answers to these broader questions are beyond the scope of this paper, but the tools and ecosystems outlinedin previous sections provide an indication of what is possible. Insights from open tools that are alreadywidely used suggest that the continued uptake of open tools will have substantial benefits in the comingyears and decades. Benefits of the free and open source approach range from the increased opportunities forparticipation that tools such as the PCT and Streetmix enable, to the possibilities for extending capabilities,as shown by the various plug-ins that have been developed for tools such as QGIS and MATSim.
The research presented in this paper suggests that a shift to open source planning tools in general, and opensource tools for local planning in particular, could tackle wider problems, including the ‘crisis of participatoryplanning’ and feelings of dis-empowerment due to lack of opportunities to engage in democratic processes(Legacy 2016; Monbiot 2017). Open tools can also support data and software literacy (Christozov andRasheva-Yordanova 2017). A key feature of geographic tools for transport planning is that they encourageusers to focus on local areas, moving beyond ‘one size fits all,’ enabling diverse designs to fit a wide rangeof diverse local needs. A key feature of open tools, and especially open online tools that are easy to use, isthat anyone can use them, encouraging citizen engagement.
From a user perspective, Section 4 demonstrates that a wide range tools are available. A potential limitationof the paradigm shift to open source is the time taken to understand which tool or combination of tools ismost appropriate particular transport planning tasks. This can take time. On the other hand, a benefit ofthe range of free and open options offered is that users are encouraged to think about and better understandthe tools they are using rather than blindly using established (and perhaps expensive and dated) ‘tools of thetrade.’ From a developer perspective, the community of support and feedback may be more important thancurrent functionality of tools. The literature shows that R, Python and QGIS communities have alreadydeveloped several tools for transport planning that, when combined with other open source solutions, cansolve a wide range of spatial transport planning problems.
Many other tools and communities exist. A limitation of the paper is that it is not comprehensive, omittingdue to space constraints consideration of routing engines such as pgRouting, OSRM, GraphHopper (andrelated project OpenRouteService), OpenTripPlanner, Valhalla and the recently developed motis11
and tools that can be applied to transport planning but which were not designed for transport planningsuch as the gama platform and general purpose geographic data processing projects. Future research couldreview and benchmark such alternative tools for transport planning to provide valuable insight into whichtools work best for different applications including, critically, how to rapidly decarbonise transport systemsworldwide (Hickman, Ashiru, and Banister 2011).
In terms of further research, a hypothesis raised in this paper is that open source tools for transport planning,underpinned by the FOSS philosophy described in Section 4, will continue to gain market share in academic,public sector and consultancy applications. The paper supports the characterisation of open source softwareas collaborative, innovative and evolving (Gancarz 2003). Will these features of open source tools allowthem to out-compete and eventually dominate in the field of transport planning — as has already happenedin fields including machine learning (e.g. Abadi et al. 2016) and web development (e.g. Grinberg 2018;Wickham 2020)? Only time and much-needed further research into the topic will tell. Regardless of theanswer, this paper has conclusively found that high-performance and innovative open source solutions arealready available in the ‘ecological niche’ of geographic analysis for transport planning. The nascent andrapidly evolving nature of open source transport planning ecosystems means that there are many fruitfuldirections of future research, asking a wide range of related questions, including:
11See https://jakobmiksch.eu/post/openstreetmap_routing/ for an overview or routing engines for OpenStreetMap data.
19
• What are the relative merits of different tools and combinations of tools for different transport planningapplications, in terms of criteria such as computer/programmer efficiency and public accessibility?
• What scope is there for greater integration and collaboration between tools, building on themodular and ‘pluginable’ nature of open source software (this questions raises the prospectR/Python/QGIS/other interfaces to established transport tools such as MATSim, SUMO andsDNA)?
• How can the growth of open source solutions for geographic transport data analysis be monitored,e.g. to identify ‘tipping points’ in uptake?
• What are the barriers to uptake and ‘discoverability’ of leading open source tools, including in relationto documentation and case studies?
• In which contexts — e.g. along wealthy/low income, urban/rural, democratic/dictatorship continua— are open source tools for transport planning, and evidence-based decision-making in general, mosteffective and most needed?
This is clearly a multi-disciplinary area of research, and it is not immediately clear which methodologicalapproaches — ranging from action-based research developing “practical solutions to issues of pressing con-cern,” e.g. by creating or contributing to the source code underpinning open source tools (Brydon-Miller,Greenwood, and Maguire 2003), to more conventional literature/software reviews of emerging ecosystems(e.g. Joo et al. 2020).
Technical/computing approaches could usefully tackle more objective questions, such as the relative perfor-mance of different routing engines and transport planning APIs. Indeed, there is a need research evaluatingthe potential of ‘WebAPI’ based tools for transport planning such as OpenTripPlanner, mentioned in theonline version of Table 2 but not discussed in this paper due to space constraints.
Returning to the ‘big picture’ introduced in Section 1, it is clear that there are strong arguments for aparadigm shift in transport planning overall. Academic attention has tended to focus on changes that areneeded in the overall planning process (Banister 2008; Legacy 2016) rather than changes that are neededin the transport planning ‘tools of the trade,’ notwithstanding research advocating for change in transportmodelling from practitioner (e.g. Hollander 2016), academic (e.g. Lovelace, Parkin, and Cohen 2020) andadvocacy (e.g. Beimborn and Kennedy 1996) perspectives.
Building on prior research and a review of existing open source options, this paper highlights the importanceof not only processes and models, but also the tools used for designing geographically specific transportplans. Open source tools generate evidence that is more likely to be rigorous, transparent, reproducible andshared than evidence generated by the established proprietary tools (Peters 2020; Brunsdon and Comber2020). Transport interventions based on such open evidence are more likely to be effective at meeting policyobjectives. Effective interventions are necessary to improve the environmental and health performance oftransport systems worldwide, to reduce lives lost due to climate change and non-communicable disease.This paper therefore concludes that open source tools for geographic analysis in transport planning cansupport emerging environmental, health and social objectives. In other words — alongside wider politicaland institutional shifts to decarbonise the economy (Beddoe et al. 2009; Litman 2007) — open sourcesoftware can, in addition to providing cost-effective solutions to 21st Century transport planning needs, savelives.
References
Abadi, Martín, Ashish Agarwal, Paul Barham, Eugene Brevdo, Zhifeng Chen, Craig Citro, Greg S. Cor-rado, et al. 2016. “TensorFlow: Large-Scale Machine Learning on Heterogeneous Distributed Systems.”arXiv:1603.04467 [cs], March. http://arxiv.org/abs/1603.04467.
Anderson, Larry D. 1991. “Applying Geographic Information Systems to Transportation Planning.” Trans-portation Research Record, no. 1305.
Aryandoust, Arsam, Oscar van Vliet, and Anthony Patt. 2019. “City-Scale Car Traffic and Parking Density
20
Maps from Uber Movement Travel Time Data.” Scientific Data 6 (1): 1–18. https://doi.org/10.1038/s41597-019-0159-6.
Banister, David. 2008. “The Sustainable Mobility Paradigm.” Transport Policy 15 (2): 73–80. https://doi.org/DOI:%2010.1016/j.tranpol.2007.10.005.
Barth’elemy, Marc. 2011. “Spatial Networks.” Physics Reports 499 (1): 1–101.
Batty, Michael. 1995. “Planning Support Systems and the New Logic of Computation.” Regional Develop-ment Dialogue 16 (1): 1–17.
Beddoe, Rachael, Robert Costanza, Joshua Farley, Eric Garza, Jennifer Kent, Ida Kubiszewski, Luz Mar-tinez, et al. 2009. “Overcoming Systemic Roadblocks to Sustainability: The Evolutionary Redesign ofWorldviews, Institutions, and Technologies.” Proceedings of the National Academy of Sciences 106 (8):2483–89. https://doi.org/10.1073/pnas.0812570106.
Beimborn, Edward, and Rob Kennedy. 1996. “Inside the Blackbox: Making Transportation Models Workfor Livable Communities.” Citizens for a Better Environment.
Bivand, Roger S. 2020. “Progress in the R Ecosystem for Representing and Handling Spatial Data.” Journalof Geographical Systems, October. https://doi.org/10.1007/s10109-020-00336-0.
Blanchard, Samuel D., and Paul Waddell. 2017. “Urbanaccess: Generalized Methodology for MeasuringRegional Accessibility with an Integrated Pedestrian and Transit Network.” Transportation ResearchRecord 2653 (1): 35–44.
Boeing, Geoff. 2017. “OSMnx: New Methods for Acquiring, Constructing, Analyzing, and VisualizingComplex Street Networks.” Computers, Environment and Urban Systems 65 (September): 126–39. https://doi.org/10.1016/j.compenvurbsys.2017.05.004.
Boyce, David E., and Huw C. W. L. Williams. 2015. Forecasting Urban Travel: Past, Present and Future.Edward Elgar Publishing.
Brunsdon, Chris, and Alexis Comber. 2020. “Opening Practice: Supporting Reproducibility and CriticalSpatial Data Science.” Journal of Geographical Systems, August. https://doi.org/10.1007/s10109-020-00334-2.
Brydon-Miller, Mary, Davydd Greenwood, and Patricia Maguire. 2003. “Why Action Research?” ActionResearch 1 (1): 9–28. https://doi.org/10.1177/14767503030011002.
Camargo, P. 2015. “AequilibraE: A Free QGIS Add-On for Transportation Modeling.” Foss4g North America.
Christozov, Dimitar, and Katia Rasheva-Yordanova. 2017. “Data Literacy.” International Journal of DigitalLiteracy and Digital Competence 8 (2): 14–38. https://doi.org/10.4018/ijdldc.2017040102.
Coelho, Jailton, Marco Tulio Valente, Luciano Milen, and Luciana L. Silva. 2020. “Is This GitHub ProjectMaintained? Measuring the Level of Maintenance Activity of Open-Source Projects.” Information andSoftware Technology 122 (June): 106274. https://doi.org/10.1016/j.infsof.2020.106274.
Cooper, Crispin H. V. 2018. “Predictive Spatial Network Analysis for High-Resolution Transport Modeling,Applied to Cyclist Flows, Mode Choice, and Targeting Investment.” International Journal of SustainableTransportation 0 (0): 1–11. https://doi.org/10.1080/15568318.2018.1432730.
Cooper, Crispin H. V., and Alain J. F. Chiaradia. 2020. “sDNA: 3-d Spatial Network Analysis for GIS, CAD,Command Line & Python.” SoftwareX 12 (July): 100525. https://doi.org/10.1016/j.softx.2020.100525.
de la Barra, T, B P’erez, and N Vera. 1984. “TRANUS-J: Putting Large Models into Small Computers.”Environment and Planning B: Planning and Design 11 (1): 87–101. https://doi.org/10.1068/b110087.
Department for Transport. 2020. “Decarbonising Transport: Setting the Challenge.” Department forTransport.
21
Dhir, Swati, and Sanjay Dhir. 2017. “Adoption of Open-Source Software Versus Proprietary Software: AnExploratory Study.” Strategic Change 26 (4): 363–71. https://doi.org/10.1002/jsc.2137.
Dios Ort’uzar S., Juan de, and Luis G. Willumsen. 2011. Modelling Transport. Fourth edition. Chichester,West Sussex, United Kingdom: John Wiley & Sons.
Ebdon, David. 1992. “SPANSA Quadtree-Based GIS.” Computers & Geosciences, GIS Design Models, 18(4): 471–75. https://doi.org/10.1016/0098-3004(92)90077-5.
Fleischmann, Martin. 2019. “MOMEPY: Urban Morphology Measuring Toolkit.” Journal of Open SourceSoftware 4 (43): 1807.
Franco-Bedoya, Oscar, David Ameller, Dolors Costal, and Xavier Franch. 2017. “Open Source SoftwareEcosystems: A Systematic Mapping.” Information and Software Technology 91: 160–85.
Gaboardi, James D., Jay Laura, Sergio Rey, Levi John Wolf, David C. Folch, Wei Kang, Philip Stephens,and Charles Schmidt. 2018. “Pysal/Spaghetti.”
Gancarz, Mike. 2003. Linux and the Unix Philosophy. Digital Press.
Garrard, Chris. 2016. Geoprocessing with Python. Shelter Island, NY: Manning Publications.
Giraud, Timoth’ee. 2019. Osrm: Interface Between R and the OpenStreetMap-Based Routing Service OSRM.
Goodman, Anna, Ilan Fridman Rojas, James Woodcock, Rachel Aldred, Nikolai Berkoff, Malcolm Morgan,Ali Abbas, and Robin Lovelace. 2019. “Scenarios of Cycling to School in England, and Associated Healthand Carbon Impacts: Application of the ‘Propensity to Cycle Tool’.” Journal of Transport & Health 12(March): 263–78. https://doi.org/10.1016/j.jth.2019.01.008.
Grabowicz, Przemyslaw A., Jos’e J. Ramasco, Esteban Moro, Josep M. Pujol, and Victor M. Eguiluz. 2012.“Social Features of Online Networks: The Strength of Intermediary Ties in Online Social Media.” PloSOne 7 (1): e29358.
Graser, Anita. 2019. “Movingpandas: Efficient Structures for Movement Data in Python.” GIForum 1:54–68.
Grinberg, Miguel. 2018. Flask Web Development: Developing Web Applications with Python. ” O’ReillyMedia, Inc.”.
Hackl, Roland, Clemens Raffler, Michael Friesenecker, Hans Kramar, Robert Kalasek, Aggelos Soteropoulos,Susanne Wolf-Eberl, Patrick Posch, and Rupert Tomschy. 2019. “Promoting Active Mobility: Evidence-Based Decision-Making Using Statistical Models.” Journal of Transport Geography 80 (October): 102541.https://doi.org/10.1016/j.jtrangeo.2019.102541.
Hadfield, Paris, and Nicole Cook. 2019. “Financing the Low-Carbon City: Can Local Government LeveragePublic Finance to Facilitate Equitable Decarbonisation?” Urban Policy and Research 37 (1): 13–29.https://doi.org/10.1080/08111146.2017.1421532.
Hall, M., L. G. Willumsen, and D Van Vliet. 1980. “SATURNa Simulation-Assignment Model for theEvaluation of Traffic Management Schemes.” Traffic Engineering & Control 21 (4).
Harrison, R. M., and R. E. Hester. 2017. Environmental Impacts of Road Vehicles: Past, Present and Future.Royal Society of Chemistry.
Hickman, Robin, Olu Ashiru, and David Banister. 2011. “Transitions to Low Carbon Transport Futures:Strategic Conversations from London and Delhi.” Journal of Transport Geography, Special section onAlternative Travel futures, 19 (6): 1553–62. https://doi.org/10.1016/j.jtrangeo.2011.03.013.
Hildebrand, Cisilia, and Stina Hörtin. 2014. A Comparative Study Between Emme and Visum with Respectto Public Transport Assignment.
Hollander, Yaron. 2016. Transport Modelling for a Complete Beginner. CTthink!
22
Horni, Andreas, Kai Nagel, and Kay W. Axhausen. 2016. The Multi-Agent Transport Simulation MATSim.Ubiquity Press. https://doi.org/10.5334/baw.
Hull, Angela. 2008. “Policy Integration: What Will It Take to Achieve More Sustainable Transport Solutionsin Cities?” Transport Policy, New Developments in Urban Transportation Planning, 15 (2): 94–103.https://doi.org/10.1016/j.tranpol.2007.10.004.
Iacono, Michael, Kevin J. Krizek, and Ahmed El-Geneidy. 2010. “Measuring Non-Motorized Accessibility:Issues, Alternatives, and Execution.” Journal of Transport Geography 18 (1): 133–40. https://doi.org/10.1016/j.jtrangeo.2009.02.002.
Jäppinen, Sakari, Tuuli Toivonen, and Maria Salonen. 2013. “Modelling the Potential Effect of SharedBicycles on Public Transport Travel Times in Greater Helsinki: An Open Data Approach.” AppliedGeography 43: 13–24.
Johansson, Christer, Boel Lövenheim, Peter Schantz, Lina Wahlgren, Peter Almström, Anders Markstedt,Magnus Strömgren, Bertil Forsberg, and Johan Nilsson Sommar. 2017. “Impacts on Air Pollution andHealth by Changing Commuting from Car to Bicycle.” Science of The Total Environment 584-585 (April):55–63. https://doi.org/10.1016/j.scitotenv.2017.01.145.
Joo, Rocio, Matthew E. Boone, Thomas A. Clay, Samantha C. Patrick, Susana Clusella-Trullas, and MathieuBasille. 2020. “Navigating Through the R Packages for Movement.” Journal of Animal Ecology 89 (1):248–67. https://doi.org/10.1111/1365-2656.13116.
Kampa, Marilena, and Elias Castanas. 2008. “Human Health Effects of Air Pollution.” EnvironmentalPollution, Proceedings of the 4th International Workshop on Biomonitoring of Atmospheric Pollution(With Emphasis on Trace Elements), 151 (2): 362–67. https://doi.org/10.1016/j.envpol.2007.06.012.
Kilian, Jason, and Masashi Kitazawa. 2018. “The Emerging Risk of Exposure to Air Pollution on CognitiveDecline and Alzheimer’s Diseaseevidence from Epidemiological and Animal Studies.” Biomedical Journal.
Klosterman, R. E. 1999. “The What If? Collaborative Planning Support System.” Environment andPlanning B: Planning and Design 26 (3): 393–408. https://doi.org/10.1068/b260393.
Knuth, Donald E. 1997. The Art of Computer Programming: Volume 1: Fundamental Algorithms. Addison-Wesley Professional.
Kotusevski, G., and K. A. Hawick. 2009. “A Review of Traffic Simulation Software.” Research Letters inthe Information and Mathematical Sciences 13: 35–54.
Larsen, Jacob, Zachary Patterson, and Ahmed El-Geneidy. 2013. “Build It. But Where? The Use ofGeographic Information Systems in Identifying Locations for New Cycling Infrastructure.” InternationalJournal of Sustainable Transportation 7 (4): 299–317.
Legacy, Crystal. 2016. “Is There a Crisis of Participatory Planning?” Planning Theory 16 (4): 425–42.https://doi.org/10.1177/1473095216667433.
Levinson, David. 2012. “Network Structure and City Size.” PloS One 7 (1): e29721. https://doi.org/10.1371/journal.pone.0029721.
Liao, Siyu, Liutong Zhou, Xuan Di, Bo Yuan, and Jinjun Xiong. 2018. “Large-Scale Short-Term Urban TaxiDemand Forecasting Using Deep Learning.” In 2018 23rd Asia and South Pacific Design AutomationConference (ASP-DAC), 428–33. IEEE.
Lindsey, Greg, Steve Hankey, Xize Wang, and Junzhou Chen. 2013. “The Minnesota Bicycle and PedestrianCounting Initiative: Methodologies for Non-Motorized Traffic Monitoring.” Minnesota Department ofTransportation.
Litman, Todd. 2007. “Developing Indicators for Comprehensive and Sustainable Transport Planning.”Transportation Research Record: Journal of the Transportation Research Board 2017 (December): 10–15.https://doi.org/10.3141/2017-02.
23
Loidl, Martin, Gudrun Wallentin, Rita Cyganski, Anita Graser, Johannes Scholz, and Eva Haslauer. 2016.“GIS and Transport ModelingStrengthening the Spatial Perspective.” ISPRS International Journal ofGeo-Information 5 (6): 84. https://doi.org/10.3390/ijgi5060084.
Lopez, Pablo Alvarez, Michael Behrisch, Laura Bieker-Walz, Jakob Erdmann, Yun-Pang Flötteröd, RobertHilbrich, Leonhard Lücken, Johannes Rummel, Peter Wagner, and Evamarie WieBner. 2018. “Micro-scopic Traffic Simulation Using Sumo.” In 2018 21st International Conference on Intelligent Transporta-tion Systems (ITSC), 2575–82. IEEE.
Lovelace, Robin, Mark Birkin, Philip Cross, and Martin Clarke. 2016. “From Big Noise to Big Data: Towardthe Verification of Large Data Sets for Understanding Regional Retail Flows.” Geographical Analysis 48(1): 59–81. https://doi.org/10.1111/gean.12081.
Lovelace, Robin, and Richard Ellison. 2018. “Stplanr: A Package for Transport Planning.” The R Journal10 (2): 7–23. https://doi.org/10.32614/RJ-2018-053.
Lovelace, Robin, Anna Goodman, Rachel Aldred, Nikolai Berkoff, Ali Abbas, and James Woodcock. 2017.“The Propensity to Cycle Tool: An Open Source Online System for Sustainable Transport Planning.”Journal of Transport and Land Use 10 (1). https://doi.org/10.5198/jtlu.2016.862.
Lovelace, Robin, Jakub Nowosad, and Jannes Muenchow. 2019. Geocomputation with R. CRC Press.
Lovelace, Robin, John Parkin, and Tom Cohen. 2020. “Open Access Transport Models: A Leverage Pointin Sustainable Transport Planning.” Transport Policy 97 (October): 47–54. https://doi.org/10.1016/j.tranpol.2020.06.015.
Löfgren, Sofia, Kristina L. Nilsson, and Charlotta M. Johansson. 2018. “Considering Landscape in StrategicTransport Planning.” Transportation Research Part D: Transport and Environment 65 (December): 396–408. https://doi.org/10.1016/j.trd.2018.09.001.
Luxen, Dennis, and Christian Vetter. 2011. “Real-Time Routing with OpenStreetMap Data.” In Proceedingsof the 19th ACM SIGSPATIAL International Conference on Advances in Geographic Information Systems,513–16.
Majic, Ivan, and Elek Pafka. 2019. “AwaP-ICAn Open-Source GIS Tool for Measuring Walkable Access.”Urban Science 3 (2): 48.
Miller, Harvey J. 1999. “Potential Contributions of Spatial Analysis to Geographic Information Systems forTransportation (GIS-T).” Geographical Analysis 31 (4): 373–99. https://doi.org/10.1111/j.1538-4632.1999.tb00991.x.
Moeckel, Rolf, Carlos Llorca Garcia, Ana Tsui Moreno Chou, and Matthew Bediako Okrah. 2018. “Trends inIntegrated Land Use/Transport Modeling: An Evaluation of the State of the Art.” Journal of Transportand Land Use 11 (1). https://doi.org/10.5198/jtlu.2018.1205.
Monbiot, George. 2017. Out of the Wreckage: A New Politics for an Age of Crisis. Brooklyn, NY: VersoBooks.
Morgan, Malcolm, and Robin Lovelace. 2020. “Travel Flow Aggregation: Nationally Scalable Methods forInteractive and Online Visualisation of Transport Behaviour at the Road Network Level.” Environment& Planning B: Planning & Design. https://doi.org/10.1177/2399808320942779.
Morgan, Malcolm, Marcus Young, Robin Lovelace, and Layik Hama. 2019. “OpenTripPlanner for R.”Journal of Open Source Software 4 (44): 1926. https://doi.org/10.21105/joss.01926.
Moriarty, Patrick, and Damon Honnery. 2008. “The Prospects for Global Green Car Mobility.” Journal ofCleaner Production 16 (16): 1717–26. https://doi.org/10.1016/j.jclepro.2007.10.025.
Morrison, Robbie. 2018. “Energy System Modeling: Public Transparency, Scientific Reproducibility, andOpen Development.” Energy Strategy Reviews 20: 49–63.
24
Neteler, Markus, and Helena Mitasova. 2008. Open Source GIS: A GRASS GIS Approach. 3. ed. New York,NY: Springer.
O’Flaherty, Coleman, and Michael GH Bell. 1997. Transport Planning and Traffic Engineering. Elsevier.
Padgham, Mark. 2019. “Dodgr: An R Package for Network Flow Aggregation.” Transport Findings,February. https://doi.org/10.32866/6945.
Pappalardo, Luca, Gianni Barlacchi, Filippo Simini, and Roberto Pellungrini. 2019. “Scikit-Mobility: AnOpen-Source Python Library for Human Mobility Analysis and Simulation.” arXiv:1907.07062 [physics],July. http://arxiv.org/abs/1907.07062.
Parkin, John. 2018. Designing for Cycle Traffic: International Principles and Practice. ICE Publishing.
Pensa, Stefano, Elena Masala, and Isabella M. Lami. 2013. “Supporting Planning Processes by the Useof Dynamic Visualisation.” In Planning Support Systems for Sustainable Urban Development, 451–67.Springer.
Peters, Michael A. 2020. “Citizen Science and Ecological Democracy in the Global Science Regime: TheNeed for Openness and Participation.” Educational Philosophy and Theory 52 (3): 221–26. https://doi.org/10.1080/00131857.2019.1584148.
Pettit, C. J., J Barton, X Goldie, R Sinnott, R Stimson, and T Kvan. 2014. “The Australian UrbanIntelligence Network Supporting Smart Cities.” In Smart Cities and Planning Support Systems, editedby S Geertma, J Stillwell, J Ferreira, and J Goodspeed. Springer.
Pucher, John, and Ralph Buehler. 2008. “Making Cycling Irresistible: Lessons from The Netherlands,Denmark and Germany.” Transport Reviews 28: 495–528.
Riggs, William W., Michael R. Boswell, and Ryder Ross. 2016. “Streetplan: Hacking Streetmix forCommunity-Based Outreach on the Future of Streets.” Focus 13 (1): 14.
Rodrigue, Jean-Paul, Claude Comtois, and Brian Slack. 2013. The Geography of Transport Systems. 3edition. London ; New York: Routledge.
Sallis, James F., Fiona Bull, Ricky Burdett, Lawrence D. Frank, Peter Griffiths, Billie Giles-Corti, and MarkStevenson. 2016. “Use of Science to Guide City Planning Policy and Practice: How to Achieve Healthyand Sustainable Future Cities.” The Lancet 388 (10062): 2936–47.
Salter, Jonathan D., Cam Campbell, Murray Journeay, and Stephen R. J. Sheppard. 2009. “The DigitalWorkshop: Exploring the Use of Interactive and Immersive Visualisation Tools in Participatory Planning.”Journal of Environmental Management, Collaborative GIS for spatial decision support and visualization,90 (6): 2090–2101. https://doi.org/10.1016/j.jenvman.2007.08.023.
Schmutz, Benoît, and Modibo Sidib’e. 2019. “Frictional Labour Mobility.” The Review of Economic Studies86 (4): 1779–1826. https://doi.org/10.1093/restud/rdy056.
Sherman, Gary. 2008. Desktop GIS: Mapping the Planet with Open Source Tools. Pragmatic Bookshelf.
Singleton, Alex, and Daniel Arribas-Bel. 2019. “Geographic Data Science.” Geographical Analysis.
te Brömmelstroet, Marco, and Luca Bertolini. 2008. “Developing Land Use and Transport PSS: MeaningfulInformation Through a Dialogue Between Modelers and Planners.” Transport Policy 15 (4): 251–59.https://doi.org/10.1016/j.tranpol.2008.06.001.
Timms, Paul, Miles Tight, and David Watling. 2014. “Imagineering Mobility: Constructing Utopias forFuture Urban Transport.” Environment and Planning A 46 (1): 78–93. https://doi.org/10.1068/a45669.
Tornberg, Patrik, and John Odhage. 2018. “Making Transport Planning More Collaborative? The Case ofStrategic Choice of Measures in Swedish Transport Planning.” Transportation Research Part A: Policyand Practice 118 (December): 416–29. https://doi.org/10.1016/j.tra.2018.09.020.
25
Transport Systems Catapult. 2015. “The Transport Data Revolution.” Government. Transport SystemsCatapult.
Tribby, Calvin P., and Paul a. Zandbergen. 2012. “High-Resolution Spatio-Temporal Modeling of PublicTransit Accessibility.” Applied Geography 34 (May): 345–55. https://doi.org/10.1016/j.apgeog.2011.12.008.
Vandenbulcke, Gr’egory, Isabelle Thomas, Bas de Geus, Bart Degraeuwe, Rudi Torfs, Romain Meeusen, andLuc Int Panis. 2009. “Mapping Bicycle Use and the Risk of Accidents for Commuters Who Cycle toWork in Belgium.” Transport Policy 16 (2): 77–87. https://doi.org/10.1016/j.tranpol.2009.03.004.
Wickham, Hadley. 2020. Mastering Shiny.
World Health Organization. 2018. Global Status Report On Road Safety 2018. S.l.
Xie, Feng, and David Levinson. 2011. Evolving Transportation Networks. Transportation Research, Eco-nomics and Policy. New York: Springer-Verlag.
26