Geographic impressions in Facebook political ads - Applied ...
Upload
khangminh22Category
view
3download
0
Open Source Geographic Information System and Petrel Software Adaptation and Integration
B. Sadoun, O. Al-Bayari and Samih Al Rawashdeh AL-Balqa’ Applied University Department of Surveying and Geomatics Engineering, Al-Salt, Jordan
Key Words: GIS, Open Source, Mapwindow, Maps, Petrel Software, Reservoir Exploitation.
Abstract: We present here the development of an Open Source Geographic Information System (OSGIS) tool using MapWindow GIS and petrel software to prove its efficiency for different applications. Geographic Infor-mation System (GIS) is a computer system capable of capturing, storing, analyzing, and displaying geo-graphically all types of data. MapWindow is free of charge, extensible geographic information system (GIS) that can be used as an open-source alternative to desktop GIS to develop and distribute custom spatial data analysis tools. It is a "Programmable Geographic Information System" that supports manipulation, analysis, and viewing of geospatial data and associated attribute data in several standard GIS data formats. It is a mapping tool, a GIS modeling system, and a GIS application programming interface (API) all in one con-venient redistributable package. It was developed by MapWindow Open Source Team to address the need for a GIS programming tool that could be used in engineering research, without requiring the purchase of a commercial GIS system, or become a GIS expert. In the following, we use Petrel software for subsurface interpretation and modeling to build and update reli-able subsurface models for a study area. It allows the user to interpret seismic data, perform well correla-tion, build reservoir models suitable for simulation, submit and visualize simulation results, calculate vol-umes, produce maps and design development strategies to maximize reservoir exploitation. A new kind of application is tested for the sake of scientific satisfaction. We had used MapWindow in many applications and always proved efficient. We found Open Source MapWindow GIS is as efficient as the commercial GIS for essential applications such as Mapping, Naviga-tion, and Tracking. Moreover, it is a free of charge tool. We have been using it in our applications and re-search such as OSGIS for BAU and in the design of a web site for navigation and tracking to be used by in-terested users on the web.
1 INTRODUCTION
The objective of this work is to develop an Open Source Geographic Information System (OSGIS) tool using MapWindow and Petrel software.
MapWindow is a mapping tool, a GIS modeling system, and a GIS application programming interface (API), which was developed by Dr. Daniel P. Ames and a team of exceptional student programmers at Utah State University (Appleman, 1998). It was developed to address the need for a GIS programming tool that could be used in engineering research and related software projects, without requiring the purchase of a complete GIS system, or become a GIS expert. It is a GIS system that is free of charge to distribute and be used to
develop custom spatial data analysis tools (http://www.mapwindow.org/). Developers can write Plug-ins to add additional functionality (models, special viewers, hot-link, Handlers, data editors… etc.) and pass these to users. It includes standard GIS data visualization features as well as, database functions such as attribute table editing, shape file editing and data converters. Dozens of Standard GIS formats are supported, including Shape files, GeoTIFF, ESRI format, ASCII and binary grids. It includes a complete ActiveX component to instantly add GIS capabilities to the user’s existing software products (Ames, 2007; FOSS4G, 2008). Additional geo-processing components are available for .NET-compatible Languages and environments (Deitel and Deitel, 2013). Components of MapWindow are:
22 Sadoun B., Al-Bayari O. and Al Rawashdeh S..Open Source Geographic Information System and Petrel Software - Adaptation and Integration.DOI: 10.5220/0005162000220027In Proceedings of the 11th International Conference on e-Business (ICE-B-2014), pages 22-27ISBN: 978-989-758-043-7Copyright c 2014 SCITEPRESS (Science and Technology Publications, Lda.)
-Main Application: This is the central interface where, the user may view data elements such as Shape files and Grids and the Core Components -The components which operate underneath. The three main components are:
1. MapWin GIS, which is an ActiveX control which may be placed into any project in any programming language that supports ActiveX. This is the main map component - if the user wants to write a program that displayed shape data, for example, the user could use this control for the display portion of the user’s program.
2. MapWin Interfaces, which is also called the "Plug-in Interface". It is a dll file which will allow the user to write the user’s own plug-ins to the main application. This may be done from any programming Language which supports the creation and use of Microsoft .NET 2.0 Dynamic Link Libraries (dlls).
3. MapWin GeoProc, which is a .NET library of geoprocessing functions, including tools for managing projections, clipping and buffering. This Library is under very active development with new capabilities appearing Often.
Petrel Software (2009.1): Petrel is a subsurface interpretation and modeling that allows building and updating reliable subsurface models. Geophysicists, geologists, and reservoir engineers can move across domains, rather than applications, through the Petrel integrated toolkit. The software objectives are to: (a) import and edit input data, (b) perform seismic visualization and interpretation, (c) perform well correlation, (d) use the pillar gridding process to create 3D grids, (e) generate horizons, (f) perform geometrical modeling, (g) calculate volumes and (h) plot results.
Program Petrel deals with the following aspects:
1. Petrel Geology and Geological Modeling 2. Petrel Geophysical Software 3. Petrel Reservoir Engineering 4. Petrel Drilling
The relation between PETREL and GIS is presented in Importing and Exporting files. Petrel Software is a Schlumberger owned Windows PC software application intended to aggregate oil reservoir data from multiple sources. It permits the user to understand seismic data, achieve well correlation, construct reservoir models suitable for simulation, offer and envisage simulation results,
estimate volumes, generate maps and devise development strategies to enhance reservoir exploitation. Moreover, it addresses the need for a single application able to support the "seismic- to-simulation" workflow, and minimize the need for a multitude of highly specialized tools. By carrying the whole workflow into a single application where risk and ambiguity can be evaluated during the life of the reservoir.
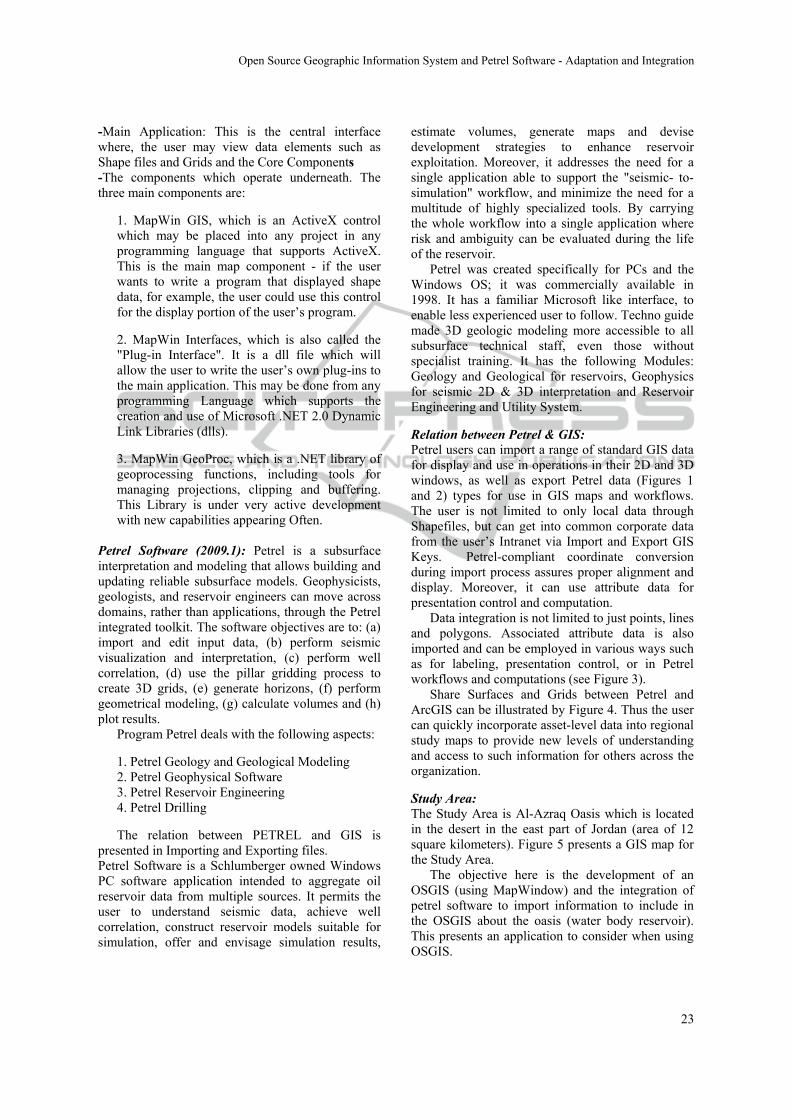
Petrel was created specifically for PCs and the Windows OS; it was commercially available in 1998. It has a familiar Microsoft like interface, to enable less experienced user to follow. Techno guide made 3D geologic modeling more accessible to all subsurface technical staff, even those without specialist training. It has the following Modules: Geology and Geological for reservoirs, Geophysics for seismic 2D & 3D interpretation and Reservoir Engineering and Utility System. Relation between Petrel & GIS: Petrel users can import a range of standard GIS data for display and use in operations in their 2D and 3D windows, as well as export Petrel data (Figures 1 and 2) types for use in GIS maps and workflows. The user is not limited to only local data through Shapefiles, but can get into common corporate data from the user’s Intranet via Import and Export GIS Keys. Petrel-compliant coordinate conversion during import process assures proper alignment and display. Moreover, it can use attribute data for presentation control and computation.
Data integration is not limited to just points, lines and polygons. Associated attribute data is also imported and can be employed in various ways such as for labeling, presentation control, or in Petrel workflows and computations (see Figure 3).
Share Surfaces and Grids between Petrel and ArcGIS can be illustrated by Figure 4. Thus the user can quickly incorporate asset-level data into regional study maps to provide new levels of understanding and access to such information for others across the organization.
Study Area: The Study Area is Al-Azraq Oasis which is located in the desert in the east part of Jordan (area of 12 square kilometers). Figure 5 presents a GIS map for the Study Area.
The objective here is the development of an OSGIS (using MapWindow) and the integration of petrel software to import information to include in the OSGIS about the oasis (water body reservoir). This presents an application to consider when using OSGIS.
Open�Source�Geographic�Information�System�and�Petrel�Software�-�Adaptation�and�Integration
23
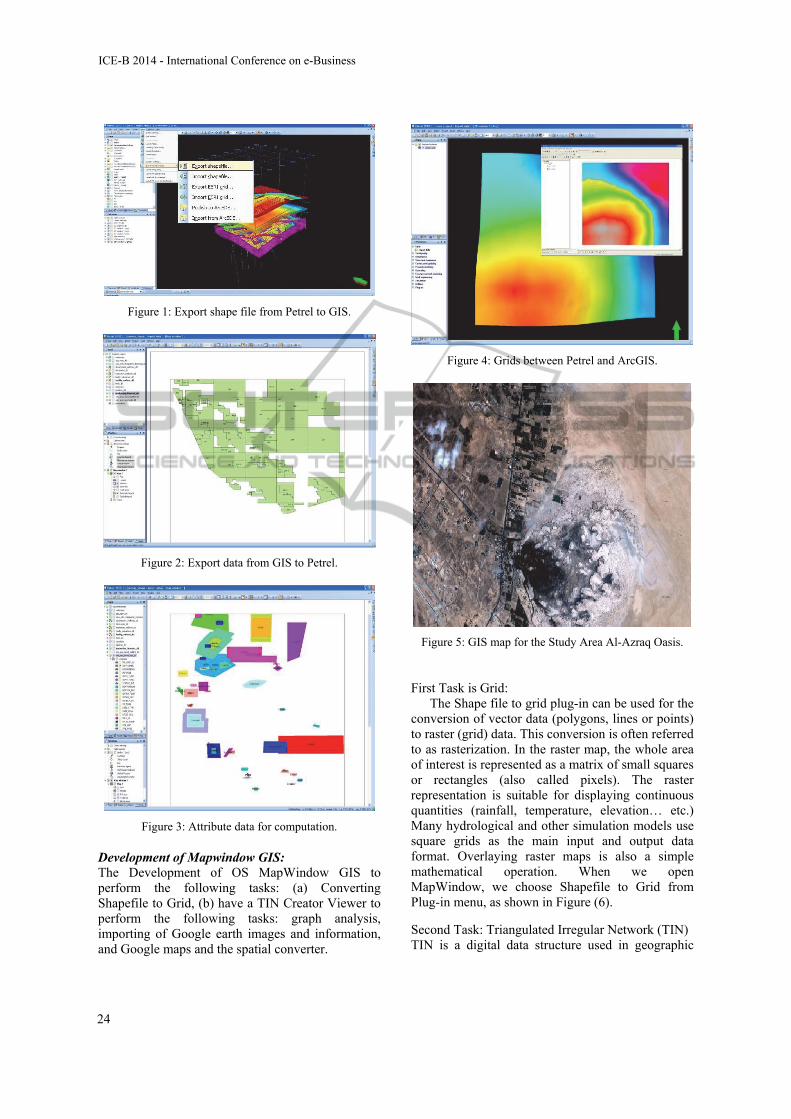
Figure 1: Export shape file from Petrel to GIS.
Figure 2: Export data from GIS to Petrel.
Figure 3: Attribute data for computation.
Development of Mapwindow GIS: The Development of OS MapWindow GIS to perform the following tasks: (a) Converting Shapefile to Grid, (b) have a TIN Creator Viewer to perform the following tasks: graph analysis, importing of Google earth images and information, and Google maps and the spatial converter.
Figure 4: Grids between Petrel and ArcGIS.
Figure 5: GIS map for the Study Area Al-Azraq Oasis.
First Task is Grid:
The Shape file to grid plug-in can be used for the conversion of vector data (polygons, lines or points) to raster (grid) data. This conversion is often referred to as rasterization. In the raster map, the whole area of interest is represented as a matrix of small squares or rectangles (also called pixels). The raster representation is suitable for displaying continuous quantities (rainfall, temperature, elevation… etc.) Many hydrological and other simulation models use square grids as the main input and output data format. Overlaying raster maps is also a simple mathematical operation. When we open MapWindow, we choose Shapefile to Grid from Plug-in menu, as shown in Figure (6).
Second Task: Triangulated Irregular Network (TIN) TIN is a digital data structure used in geographic
ICE-B�2014�-�International�Conference�on�e-Business
24
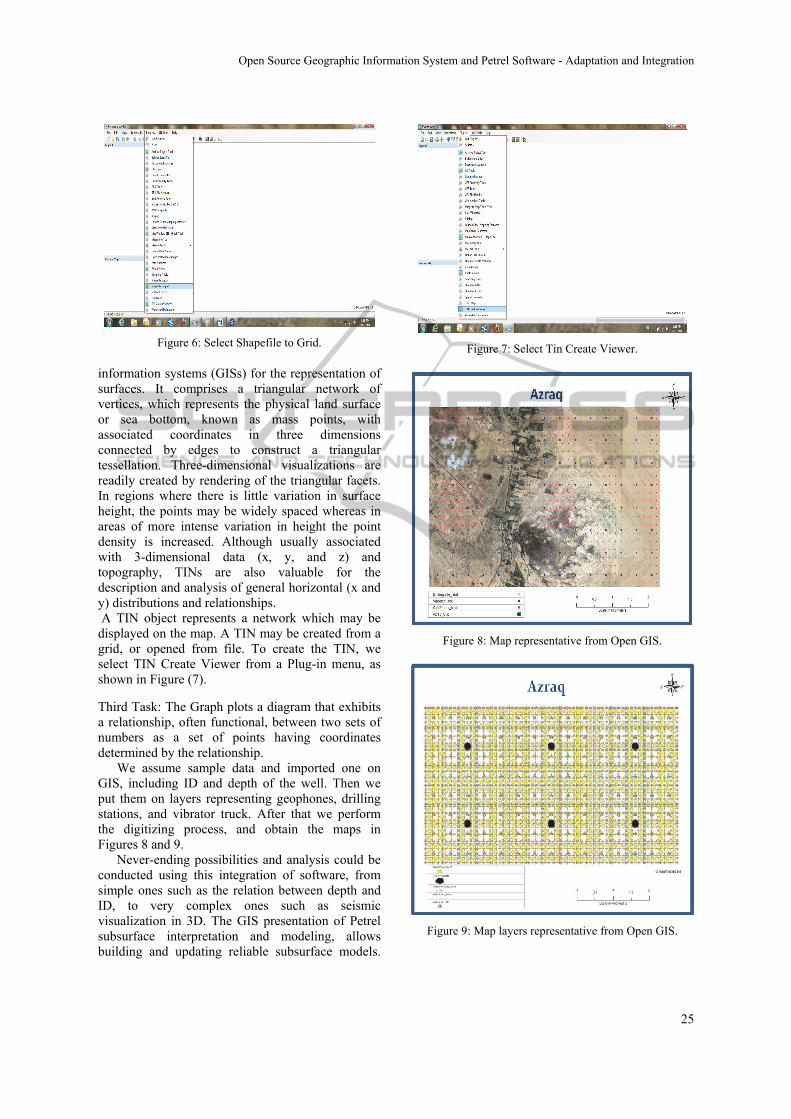
Figure 6: Select Shapefile to Grid.
information systems (GISs) for the representation of surfaces. It comprises a triangular network of vertices, which represents the physical land surface or sea bottom, known as mass points, with associated coordinates in three dimensions connected by edges to construct a triangular tessellation. Three-dimensional visualizations are readily created by rendering of the triangular facets. In regions where there is little variation in surface height, the points may be widely spaced whereas in areas of more intense variation in height the point density is increased. Although usually associated with 3-dimensional data (x, y, and z) and topography, TINs are also valuable for the description and analysis of general horizontal (x and y) distributions and relationships. A TIN object represents a network which may be displayed on the map. A TIN may be created from a grid, or opened from file. To create the TIN, we select TIN Create Viewer from a Plug-in menu, as shown in Figure (7).
Third Task: The Graph plots a diagram that exhibits a relationship, often functional, between two sets of numbers as a set of points having coordinates determined by the relationship.
We assume sample data and imported one on GIS, including ID and depth of the well. Then we put them on layers representing geophones, drilling stations, and vibrator truck. After that we perform the digitizing process, and obtain the maps in Figures 8 and 9.
Never-ending possibilities and analysis could be conducted using this integration of software, from simple ones such as the relation between depth and ID, to very complex ones such as seismic visualization in 3D. The GIS presentation of Petrel subsurface interpretation and modeling, allows building and updating reliable subsurface models.
Figure 7: Select Tin Create Viewer.
Figure 8: Map representative from Open GIS.
Figure 9: Map layers representative from Open GIS.
Open�Source�Geographic�Information�System�and�Petrel�Software�-�Adaptation�and�Integration
25
Geophysicists, geologists, and reservoir engineers can move across domains, rather than applications, through the Petrel integrated toolkit and all the possibilities are imported and managed in the GIS environment. The objectives are to: (a) import and edit input data, (b) perform seismic visualization and interpretation, (c) perform well correlation, (d) use the pillar gridding process to create 3D grids, (e) generate horizons, (f) perform geometrical modeling, (g) calculate volumes and (h) plot results that are all kept in layers in a GIS. Google Earth: is a virtual globe, map and geographical information program that was originally called Earth Viewer 3D (Bolstad, 2007). It displays satellite images of varying resolution of the Earth's surface; allowing users to see things like cities and houses looking vertically down or at an oblique angle. It allows searching for addresses, entering coordinates, or browsing to a location. The Addition of a New Tool to Open GIS: This can move the user to Google earth and acquire the needed data by one click. Select Google earth icon from tool bar then the next windows appears is Google Earth window; see Figure 10.
Figure 10: Google Earth window.
Google Maps: This is a free of charge web mapping service application and technology provided by Google that powers many map-based services (wikipedia.org/wiki/Google_Earth). It provides high-resolution aerial or satellite images for most urban areas. We added another new tool to OSGIS which can move the user to Google maps, as shown in Figure (11). The user needs to select Google maps icon from tool bar, then he can be in Google Map window.
Figure 11: Google maps window.
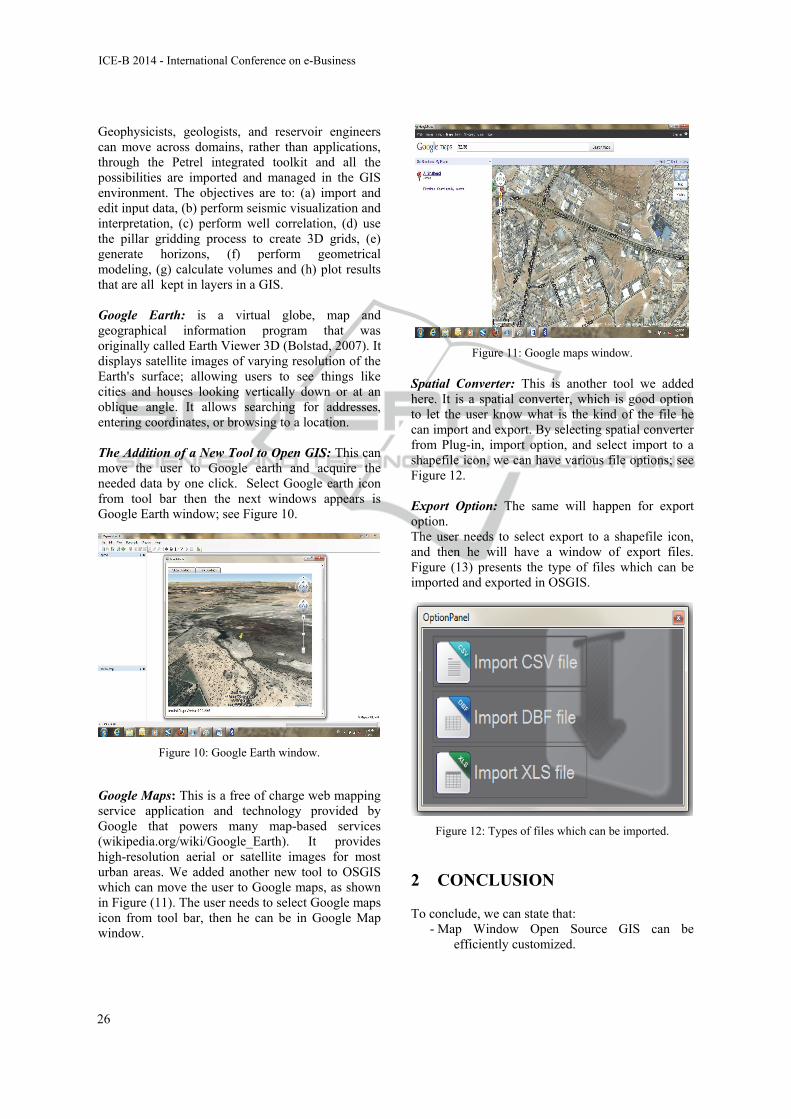
Spatial Converter: This is another tool we added here. It is a spatial converter, which is good option to let the user know what is the kind of the file he can import and export. By selecting spatial converter from Plug-in, import option, and select import to a shapefile icon, we can have various file options; see Figure 12. Export Option: The same will happen for export option. The user needs to select export to a shapefile icon, and then he will have a window of export files. Figure (13) presents the type of files which can be imported and exported in OSGIS.
Figure 12: Types of files which can be imported.
2 CONCLUSION
To conclude, we can state that: - Map Window Open Source GIS can be
efficiently customized.
ICE-B�2014�-�International�Conference�on�e-Business
26
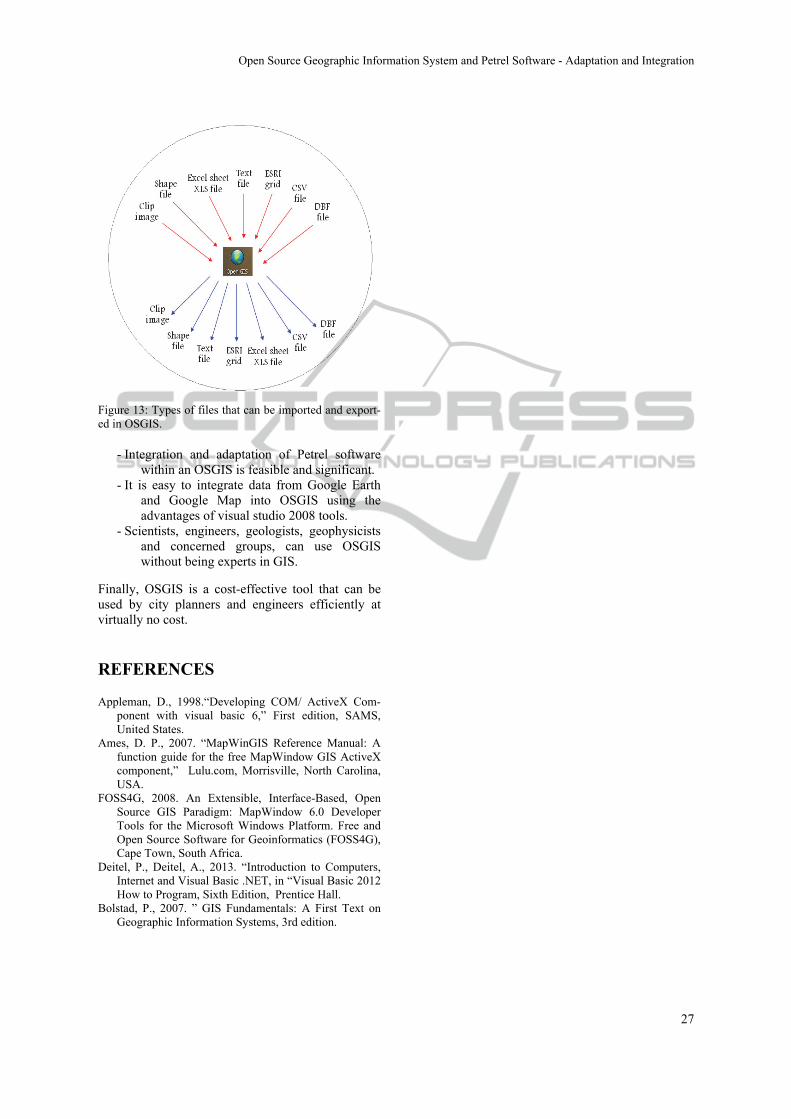
Figure 13: Types of files that can be imported and export-ed in OSGIS.
- Integration and adaptation of Petrel software within an OSGIS is feasible and significant.
- It is easy to integrate data from Google Earth and Google Map into OSGIS using the advantages of visual studio 2008 tools.
- Scientists, engineers, geologists, geophysicists and concerned groups, can use OSGIS without being experts in GIS.
Finally, OSGIS is a cost-effective tool that can be used by city planners and engineers efficiently at virtually no cost.
REFERENCES
Appleman, D., 1998.“Developing COM/ ActiveX Com-ponent with visual basic 6,” First edition, SAMS, United States.
Ames, D. P., 2007. “MapWinGIS Reference Manual: A function guide for the free MapWindow GIS ActiveX component,” Lulu.com, Morrisville, North Carolina, USA.
FOSS4G, 2008. An Extensible, Interface-Based, Open Source GIS Paradigm: MapWindow 6.0 Developer Tools for the Microsoft Windows Platform. Free and Open Source Software for Geoinformatics (FOSS4G), Cape Town, South Africa.
Deitel, P., Deitel, A., 2013. “Introduction to Computers, Internet and Visual Basic .NET, in “Visual Basic 2012 How to Program, Sixth Edition, Prentice Hall.
Bolstad, P., 2007. ” GIS Fundamentals: A First Text on Geographic Information Systems, 3rd edition.
Open�Source�Geographic�Information�System�and�Petrel�Software�-�Adaptation�and�Integration
27
Copyright © 2022 FDOKUMEN