OVERVIEW OF GEOGRAPHIC INFORMATION SYSTEMS (GIS)
61
CHAPTER - IV OVERVIEW OF GEOGRAPHIC INFORMATION SYSTEMS (GIS) 4.1 INTRODUCTION 4.2 WHY GEOGRAPHIC INFORMATION IS IMPORTANT? 4.3 WHAT IS GEOGRAPHIC INFORMATION SYSTEMS (GIS)? 4.4 COMPONENTS OF GIS 4.5 DATA ORGANISATION METHODS 4.6 DATA CAPTURE AND STORAGE 4.7 GRAPHICAL PRESENTATION OF OBJECTS 4.8 DATA TYPES IN GEOGRAPHIC INFORMATION SYSTEMS (MAP DATA REPRESENTATION) 4.9 APPLICATION OF GEOGRAPHIC INFORMATION SYSTEMS 4.10 BENEFITS OF GEOGRAPHICAL INFORMATION SYSTEMS 4.11 FUNCTIONS OF GEOGRAPHIC INFORMATION SYSTEMS 4.12 TRENDS IN BUSINESS GEOGRAPHIC INFORMATION SYSTEMS 4.13 GIS TOOLS 4.14 GIS IN INDIA 4.15 WHY IS GIS DIFFICULT?
-
Upload
khangminh22 -
Category
Documents
-
view
1 -
download
0
Transcript of OVERVIEW OF GEOGRAPHIC INFORMATION SYSTEMS (GIS)

CHAPTER - IV
OVERVIEW OF GEOGRAPHIC INFORMATION SYSTEMS (GIS)4.1 INTRODUCTION
4.2 WHY GEOGRAPHIC INFORMATION IS IMPORTANT?
4.3 WHAT IS GEOGRAPHIC INFORMATION SYSTEMS (GIS)?
4.4 COMPONENTS OF GIS
4.5 DATA ORGANISATION METHODS
4.6 DATA CAPTURE AND STORAGE
4.7 GRAPHICAL PRESENTATION OF OBJECTS
4.8 DATA TYPES IN GEOGRAPHIC INFORMATION SYSTEMS (MAP DATA REPRESENTATION)
4.9 APPLICATION OF GEOGRAPHIC INFORMATION SYSTEMS
4.10 BENEFITS OF GEOGRAPHICAL INFORMATION SYSTEMS
4.11 FUNCTIONS OF GEOGRAPHIC INFORMATION SYSTEMS
4.12 TRENDS IN BUSINESS GEOGRAPHIC INFORMATION SYSTEMS
4.13 GIS TOOLS
4.14 GIS IN INDIA
4.15 WHY IS GIS DIFFICULT?

CHAPTER - IV
OVERVIEW OF GEOGRAPHIC INFORMATIONSYSTEM (GIS)
4.1 INTRODUCTION:
Information about our world has been depicted on maps of various forms for
many centuries. During the golden age of exploration, maps showed critical
paths of navigation to the known world, as well as strategic political boundaries
and information about establishments and natural resources. Most recently,
computer-related advances have led to a revolution in handling of Geographic
Information.
Geographic Information (GI) is the “information, which can be related to a
location (defined in terms of a point, area or volume) on the Earth, particularly
information on natural phenomena, cultural and human resources.” The
positional data can be a specific set of spatial coordinates, or can cover less
precise locations or areas, such as addresses, postal codes or administrative
boundaries, regions or even whole countries. Most GI also includes a time
dimension, since the world is not a static place. GI can be divided into two
major classes: Base data (sometimes called core data or framework data),
which are necessary for most applications, and application-specific data,
sometimes referred to simply as Thematic data.
83

Base data may include:
1. The basic geodetic frameworks for determining geographic location,
2. Elevation data,
3. Thematic data on the location of natural objects, such as rivers,
coasts and lakes, and anthropogenic features such as roads, railways,
towns and cities, and administrative boundaries at national, regional
and local levels, and
4. Linkage data, permitting non-spatial data to be more easily analyzed
spatially (e.g. relating addresses to coordinate systems).
Application specific data covers all other kinds of GI that may be used in one
application but not in all applications. Examples include socio-economic data
from planning studies and censuses and natural resource data such as soil
information or groundwater quality, or special purpose versions of the base
data (e.g. the use of road center lines for auto navigation). Application specific
data are largely thematic and may range from measures of reflected radiation
captured by remote sensing sensors to data on utility networks to information
about land ownership, land use and natural resources, or demography and
health. By means of computerized Geographical Information Systems (GIS)
base data can be exchanged, used, modified and combined with other spatial
and non-spatial data in an unlimited number of ways.
84
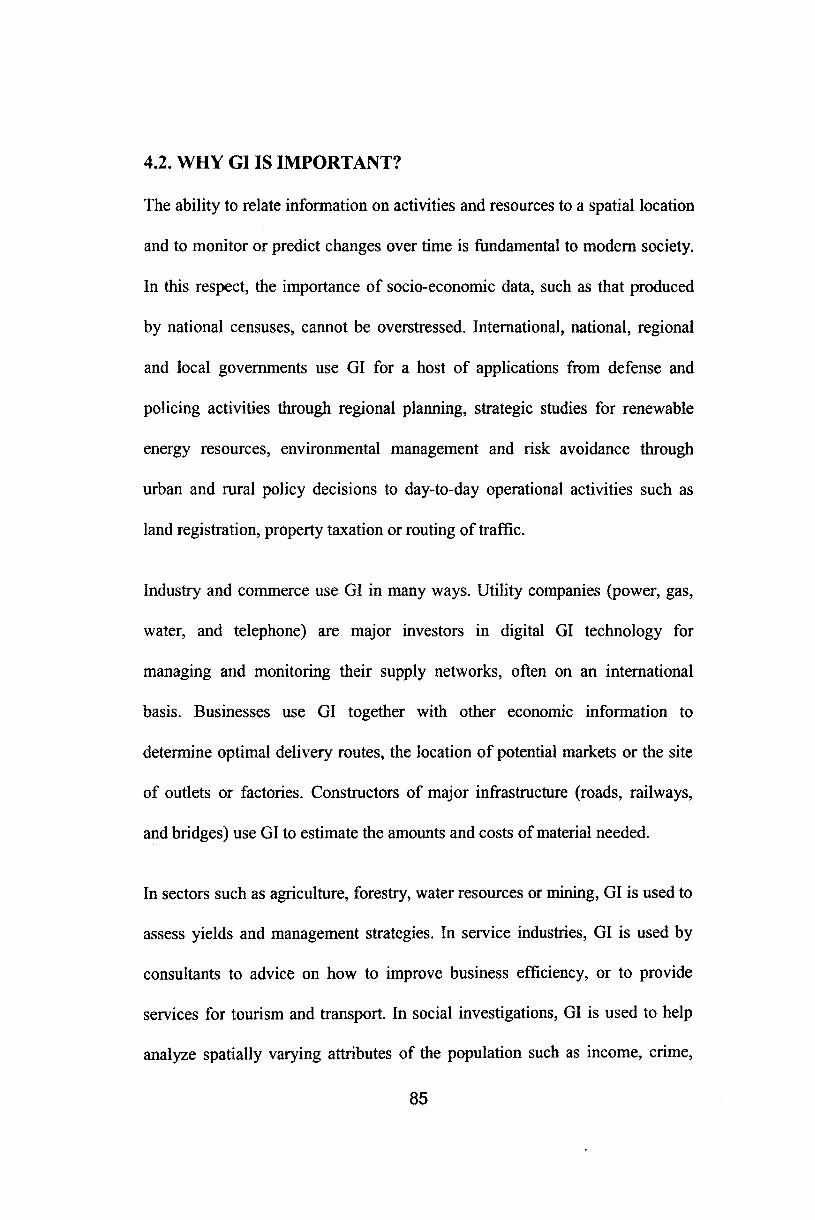
4.2. WHY GI IS IMPORTANT?
The ability to relate information on activities and resources to a spatial location
and to monitor or predict changes over time is fundamental to modem society.
In this respect, the importance of socio-economic data, such as that produced
by national censuses, cannot be overstressed. International, national, regional
and local governments use GI for a host of applications from defense and
policing activities through regional planning, strategic studies for renewable
energy resources, environmental management and risk avoidance through
urban and rural policy decisions to day-to-day operational activities such as
land registration, property taxation or routing of traffic.
Industry and commerce use GI in many ways. Utility companies (power, gas,
water, and telephone) are major investors in digital GI technology for
managing and monitoring their supply networks, often on an international
basis. Businesses use GI together with other economic information to
determine optimal delivery routes, the location of potential markets or the site
of outlets or factories. Constructors of major infrastructure (roads, railways,
and bridges) use GI to estimate the amounts and costs of material needed.
In sectors such as agriculture, forestry, water resources or mining, GI is used to
assess yields and management strategies. In service industries, GI is used by
consultants to advice on how to improve business efficiency, or to provide
services for tourism and transport. In social investigations, GI is used to help
analyze spatially varying attributes of the population such as income, crime,
85

health or the quality of housing. GI is used in a wide range of practical
environmental issues from global warming and sea level rise to erosion,
flooding and soil, air and water pollution. Geographic information increases
knowledge and reduces uncertainty; this helps to improve and expedite
decision-making, prevent mistakes and in the process saves money [1].
Development of GIS Geographic information systems have their roots in
efforts begun in the 1960s to bring computation to the processing of mapped
information. The earliest GIS, the Canada Geographic Information System was
built to automate the processing of the information collected in map form by
the Canada Land Inventory, and was justified on the simple proposition that
computers could perform numeric determinations of area from digital
representations of maps much more accurately and cheaply than humans
working from the maps themselves. In somewhat similar vein, the U.S. Bureau
of the Census constructed a rudimentary geographic information system in the
run-up to the 1970 census on the grounds that computerization could reduce the
rate of errors in tabulating and spatially aggregating census results.
Throughout the 1970s and 1980s the progress of GIS was measured at least in
part through its ability to perform complex spatial analyses. GIS’s were built
and marketed as slave-like processors, computer applications that could
perform operations on geographic data much more cost-effectively than could
humans. By the late 1970’s commercial GIS’s began to appear that were
capable of supporting both the basic types of geographic data model (raster and
86

vector), all the necessary housekeeping functions, and many of the most useful
analytic operations. GIS technology has now been extended for use in
transportation modeling, planning, reporting, and decision -making.
Table-4.1
Evolution of GIS
Stage of Development The Formative Years Maturing Technology G1 Infrastructure
Time Frame 1960-1980 1980-Mid-1990 Mid-1990s-present
Technicalenvironment
Mainframes and minicomputers. Proprietary software. Proprietary data structure. Mainly raster based.
Mainframes and minicomputers.
Geo-relational data structures. Graphical users interface. New data acquisition technologies like GPS, Remote sensing
Workstations and PCs.Network/Intemet.Open system design.
Multimedia. Data Integration. Enterprise computing. Object- relational data model.
Major Users Government, Universities, Military
Government, Universities, Military, Utilities, Business
Government,Universities and schools, Military, Utilities, Business, General Public
MajorApplicationAreas
Land and Resource Management, Census, Surveying andMapping
Land and Resource Management, Census, Surveying andMapping, Facilities Management, Market Analysis
Land and Resource Management, Census, Surveying andMapping, Facilities Management, Market Analysis, Utilities, Geographic Data Browsing
Source: C.P. Lo Albert, K. W. Yeung, Concepts and Techniques of Geographic InformationSystems; Prentice Hall of India
GIS is not only one of the fastest growing areas in applied computing, but is an
integrated technology bringing together information, systems, applications and
people from diverse fields. GIS are important to a wide range of disciplines and
applications including transportation, mining and exploration, environmental
87
and natural resources management, urban and regional planning, land
administration, asset management and utilization, health monitoring and
management, demographic marketing etc. The unique ability of GIS to handle
complex spatial relationships makes it a natural tool to use in the planning and
analysis of transportation systems specifically public transportation system.
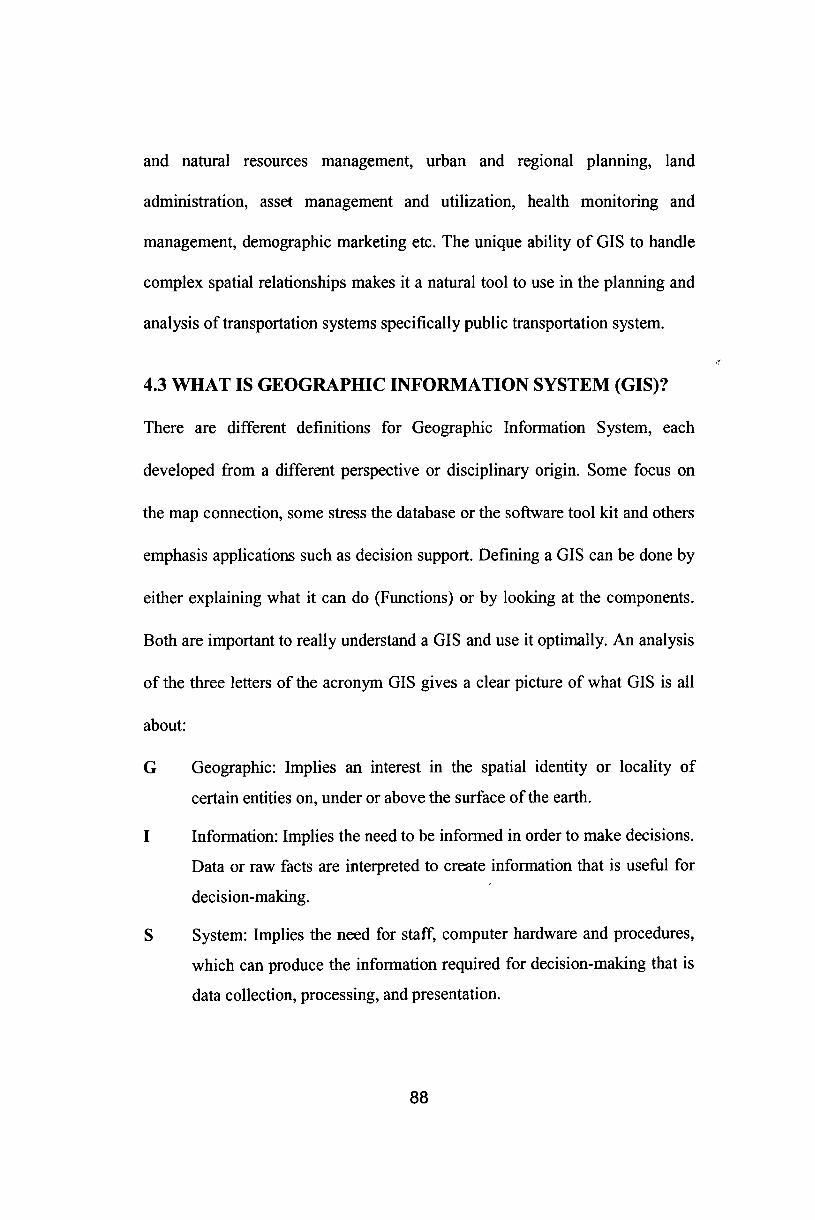
4.3 WHAT IS GEOGRAPHIC INFORMATION SYSTEM (GIS)?
There are different definitions for Geographic Information System, each
developed from a different perspective or disciplinary origin. Some focus on
the map connection, some stress the database or the software tool kit and others
emphasis applications such as decision support. Defining a GIS can be done by
either explaining what it can do (Functions) or by looking at the components.
Both are important to really understand a GIS and use it optimally. An analysis
of the three letters of the acronym GIS gives a clear picture of what GIS is all
about:
G Geographic: Implies an interest in the spatial identity or locality of
certain entities on, under or above the surface of the earth.
I Information: Implies the need to be informed in order to make decisions.
Data or raw facts are interpreted to create information that is useful for
decision-making.
S System: Implies the need for staff, computer hardware and procedures,
which can produce the information required for decision-making that is
data collection, processing, and presentation.
88

4.3.1 A GIS is a computer-assisted system for the collection, storage,
management, analysis and representation of geo-referenced data to support
decision-making. This definition includes what some regard as the fringe
elements of GIS, remote sensing, global positioning systems, computer
cartography, multimedia, etc.
4.3.2 GIS is defined as a computerised system for capture, storage, retrieval,
analysis and display of spatial data describing the land attributes and
environmental features for a given geographic region, by using modem
information technology (Thurgood, 1995). According to this definition, a GIS
includes not only computing capability and data, but also managers and users,
the organisation in which they function and institutional relationships that
govern their management and use of information.
4.3.3 A GIS can be defined as a computing application capable of creating,
storing, manipulating, visualizing, and analyzing geographic information. It
finds its strongest applications in resources management, utilities management,
telecommunications, urban and regional planning, vehicle routing and parcel
delivery, and in all of the sciences that deal with the surface of the Earth.
4.3.4 Geographic Information System is a system of hardware, software, data,
people, organisations and institutional arrangements for collecting, storing,
analyzing and disseminating information about areas of the earth.
89

4.3.5 A Geographical Information System is an information system that is
designed to work with data, references by spatial or geographic coordinates. In
other words, a GIS is both a database system with specific capabilities for
spatially, reference data, as well as a set of operations for working with data. In
a sense, a GIS can be thought of as a high-order map (Star, Estes, “Geographic
Information Systems”, 1990, Page 2-3).
4.3.6 GIS are commonly defined by the processes that are carried out:
“Computer System[s] for capturing, storing, checking, integrating,
manipulating, analyzing and displaying data related to positions on the Earth’s
surface”
4.3.7 GIS is a system of hardware, software, and procedures designed to
support the capture, management, manipulation, analysis, modeling, and
display of spatially referenced data for solving complex planning and
management problems (Rhind 1989).
4.3.8 GIS is defined as a decision support system involving the integration of
spatially referenced data in a problem-solving environment. GIS offers the
unique capacity for spatial analysis and overlay enabling decision-maker to
integrate information through several layers of data and perform multi-criteria
analysis and evaluation (Cowen 1988).
4.3.9 GIS is an electronic information system that analysis, integrates, and
displays information based on geography. GIS systems have powerful visual
90

display capabilities that present the results of analysis on maps on a wide
variety of scales, ranging from very large (accurate to within inches) to very
small (accurate only in broad overview).
4.3.10 GIS is a special case of information systems where the database consists
of observations on spatially distributed features, activities, or events, which are
definable in space as points, lines or areas. A GIS manipulates data about these
points, lines, and areas to retrieve data for adhoc queries and analyses (Dueker
[1979; P. 106]).
4.3.11 GIS is an automated set of functions that provides professionals with
advanced capabilities for the storage, retrieval, manipulation, and display of
geographically located data (Ozemoy, Smith, and Sicherman
[1981; P. 92])
4.3.12 GIS is defined as a powerful set of tools for collecting, storing,
retrieving, at will, transforming and displaying spatial data from the real world
(Burrough [1986; P. 6]).
4.3.13 GIS is defined as a form of MIS [Management Information System] that
allows map display of the general information (Devine and Field [1986; P. 18]).
4.3.14 GIS is a system for capturing, storing, checking, manipulating,
analyzing, and displaying data which are spatially referenced to the Earth
(Department of the Environment [1987, P. 132]).
91
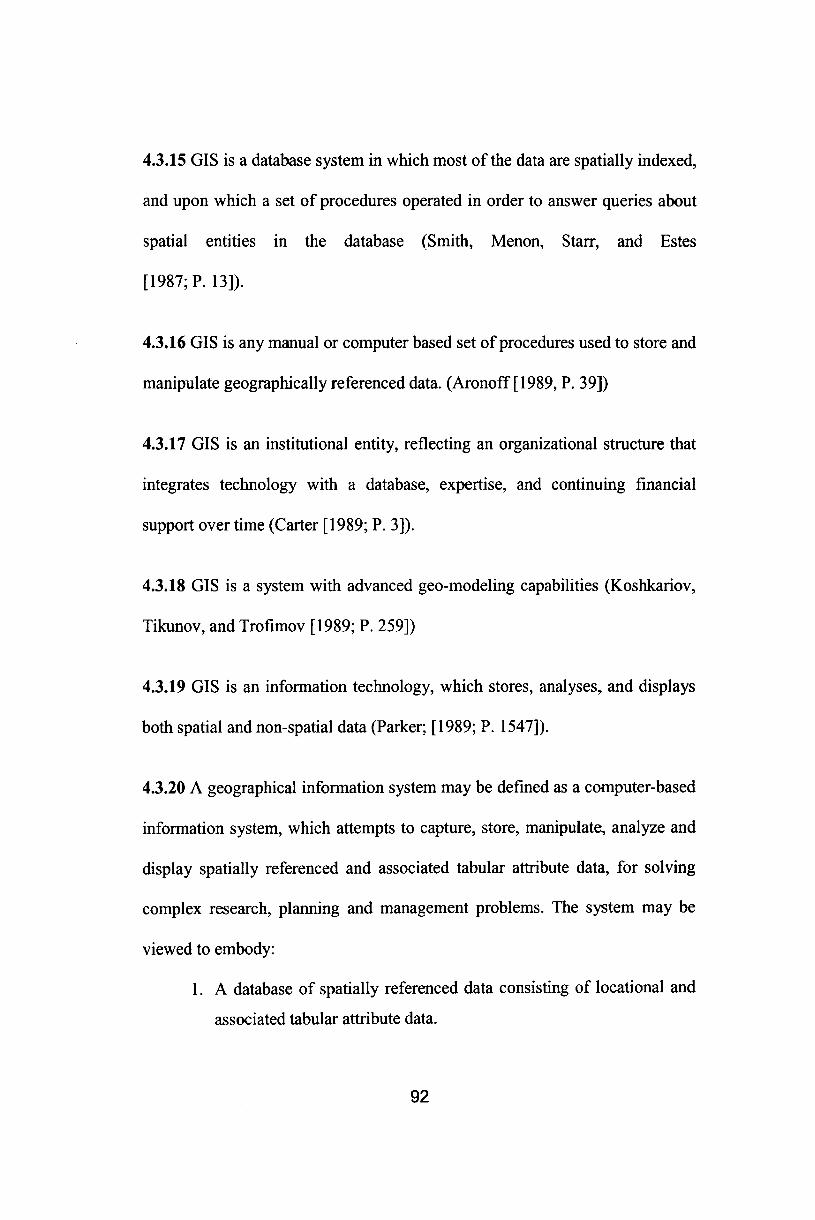
4.3.15 GIS is a database system in which most of the data are spatially indexed,
and upon which a set of procedures operated in order to answer queries about
spatial entities in the database (Smith, Menon, Starr, and Estes
[1987; P. 13]).
4.3.16 GIS is any manual or computer based set of procedures used to store and
manipulate geographically referenced data. (Aronoff [1989, P. 39])
4.3.17 GIS is an institutional entity, reflecting an organizational structure that
integrates technology with a database, expertise, and continuing financial
support over time (Carter [1989; P. 3]).
4.3.18 GIS is a system with advanced geo-modeling capabilities (Koshkariov,
Tikunov, and Trofimov [1989; P. 259])
4.3.19 GIS is an information technology, which stores, analyses, and displays
both spatial and non-spatial data (Parker; [1989; P. 1547]).
4.3.20 A geographical information system may be defined as a computer-based
information system, which attempts to capture, store, manipulate, analyze and
display spatially referenced and associated tabular attribute data, for solving
complex research, planning and management problems. The system may be
viewed to embody:
1. A database of spatially referenced data consisting of locational and
associated tabular attribute data.
92

2. Appropriate software components encompassing procedures for the
interrelated transaction from input via storage and retrieval, and the
adhering manipulation and spatial analysis facilities to output
(including specialized algorithms for spatial analysis and specialized
computer language for making spatial queries), and
3. Appropriate software components including high-resolution graphic
displays, large-capacity electronic storage device which are
organized and interfaced in an efficient and effective manner to
allow rapid data storage, retrieval and management capabilities and
facilitate the analysis.
4.3.21GIS can be defined as a computer -based tool that is used for referencing
information based at location-such information about terrain. Using GIS, any
particular point on a map can serve as a reference to a particular area. As the
potential of this technology is huge, one can find this technology being
deployed in large number of government sectors.
4.3.22 An information system that has been designed specifically to work with
data referenced by spatial and geographic co-ordinates can be appropriately
termed as a Geographic Information System. With this information system one
can capture, store, retrieve, manipulate and display the results of a spatial
analysis of geographically referenced data. GIS thus has the ability to store,
process and effectively present the geographically referenced data, primarily
because of its power to combine the relational databases with geographic
features on the map.
93

4.3.23 The term geographical information system is now used generically for
any computer-based capability for the manipulation of geographical data. A
GIS includes not only hardware and software, but also the special device used
to input maps and to create map products, together with the communication
systems needed to link various elements. The hardware and software functions
of a GIS include:
1. Acquisition and verification
2. Compilation
3. Storage
4. Updating and changing
5. Management and exchange
6. Manipulation
7. Retrieval and presentation
8. Analysis and combination.
All of these actions and operations are applied by a GIS to the geographical
data that forms its database. (Geographic Information Systems An Introduction
by Tor Bemhardsen)
4.3.24 GIS is a system of hardware, software, and procedure designed to
support the capture, management, manipulation, analysis, modeling and display
of spatially -referenced data for solving complex planning and management
problems. - NCGIA Lecture by David Cowen, 1998.
94

4.3.25 GIS is a system for capturing, storing, checking, integrating,
manipulating, analyzing and displaying data, which are spatially referenced to
the earth. - Chorley 1987.
4.3.26 GIS is a automated system for the capture, storage, retrieval, analysis
and display of spatial data - Clarke 1990.
4.3.27 GIS is an integrated package for the input, storage, analysis and output
of spatial information, analysis being the most significant. GIS are
simultaneously the telescope, the microscope, the computer and the Xerox
machine of regional analysis and synthesis of spatial data.
4.3.28 At the simplest level, GIS can be thought of as a high-tech equivalent of
a map. GIS facilitates map creation and data storage in an easily accessible
digital format, which, in turn, enables complex analysis and modeling [2].
4.3.29 In the strictest sense, a GIS is a computer system capable of assembling,
storing, manipulating, and displaying geographically referenced information,
i.e. data identified according to their locations. Practitioners also regard the
total GIS as including operating personnel and the data that go into the system
- United States Geological Survey (USGS).
4.3.30 A geographic information system (GIS) is a computer-based tool for
mapping and analyzing things that exist and events that happen on earth. GIS
technology integrates common database operations such as query and statistical
95

analysis with the unique visualization and geographic analysis benefits offered
by maps - Environmental Systems Research Institute (ESRI).
4.3.31 GIS is an integrated system of computer hardware, software, and trained
personnel linking topographic, demographic, utility, facility, image and other
resource data that is geographically referenced. - NASA
4.3.32 A GIS is a computer system for managing spatial data. The word
geographic implies that location of the data items are known in terms of
geographic co-ordinates (Latitude and Longitude). The word information
implies that the data in a GIS are organized to yield useful knowledge, often as
coloured maps and images, but also as statistical graphics, tables and various
onscreen responses to interactive queries. The word system implies that a GIS
is made up from several interrelated and linked components with different
functions.
Thus GIS has functional capabilities for data capture, input, manipulation,
transformation, visualization, combination, query, analysis, modeling and
output. A GIS consists of a package of computer programmes with a user
interface that provides access to particular function.
96

4.4 COMPONENTS OF A GIS:
A working GIS integrates five components: Hardware, Software, Data, People,
and Methods.
4.4.1 Hardware:
Hardware is the computer on which a GIS operates; GIS software runs on a
wide range of hardware types, from centralized computer server to desktop
computers and in stand-alone or networked configurations.
4.4.2 Software:
GIS software provides the functions and tools needed to store, analyze and
display geographic information. Key software components are
1. Tools for the input and manipulation of geographic information.
2. A database management system (DBMS)
3. Tools that support geographic query, analysis and visualization.
4. A geographical user interface (GUI) for easy access to tools.
4.4.3 Data:
Possibly the most important component of a GIS is the data. Geographic data
and related tabular data can be collected in-house or purchased from a
commercial data provider. A GIS will integrate spatial data with other data
resources and can even use a DBMS, used by most organizations to organize
and maintain their data, to mange spatial data.
97

4.4.4 People:
GIS technology is of limited value without the people who manage the system
and develop plans for applying it to real-world problems. GIS users range from
technical specialists who design and maintain the system to those who use it to
help them perform their everyday work.
4.4.5 Methods:
A successful GIS operates according to a well-designed plan and business
rules, which are the models and operating practices unique to each
organisation.
Geographic Information System- The organized activity by which people,
, 1. Measure aspects of geographic phenomena and processes.
2. Represent these measurements, usually in the form of a computer
database, to emphasize spatial themes, entities and relationships.
3. Operate upon these representations to produce more measurements
and to discover new relationships by integrating disparate sources.
4. Transform these representations to conform to other frameworks of
entities and relationships.
These activities reflect the large context (Institution and Cultures) in which
these people carryout their work. GIS is primarily a computer software package
for organizing data with location dimension. However, its capacity to
assimilate the concepts and algorithms from many discipline such as
cartography, geography, surveying, statistics, operation research techniques
and computational mathematics make it a versatile tool for handling geo-
referenced data.
98

It establishes one-to-one correspondence between the spatial and non-spatial
data and thereby performs an integrated analysis. The spatial data could be in
the form of charts, aerial photos, satellite imageries, plane table surveyed maps
and Global Positioning System (GPS) generated observations i.e. essentially
mapped databases. The non-spatial or the attribute data could be in the form of
words, numbers and symbols obtained from say census, secondary surveys and
other sources.
GIS has the capacity to keep spatial and non-spatial information in different
layers. The information can be processed according to any combination of
layers. This greatly facilitates various spatial operations like overlay, union,
intersection and clippings of maps with corresponding operation performed on
the linked databases. The results of the analysis could be depicted in the form
of maps, statistical table, reports and slide [3].
4.5 DATA ORGANISATION METHODS:
4.5.1 Layer Based Approach:
The traditional method of classifying information in a GIS derived from the
ability to graphically distinguish various layers or levels of data, also affected
by the practical limitations of available computing capacity. Compared to
previous means of producing hard copy maps, though, these restrictions did not
prevent reasonable modeling of data.. Rather, it allowed the storage,
maintenance, and manipulation of many more levels of information than
previously possible through manual drafting or overlay means.
99

GIS stores information about the world as a collection of thematic layers that
can be linked together. Many GIS related issues require information from four
or five or even more layers for analysis [4]. Thus the primary function of a
GIS is to link multiple sets of geo-spatial data and graphically display that
information as maps with potentially many different layers of information.
Assuming that all the information is at the same scale and has been formatted
according to the same standards, users can potentially overlay spatial
information about any number of specific topics to examine how the layers
interrelate. Each layer of a GIS map represents a particular “theme” or feature,
and one layer could be derived from a data source completely different from
the other layers. For example, one theme could represent all the streets in a
specified area. Another theme could correspond to all the buildings in the same
area, and others could show vegetation or water resources. As long as standard
processes and formats have been arranged to facilitate integration, each of these
themes could be based on data originally collected and maintained by a
separate organization.
This simple but extremely powerful and versatile concept has proven
invaluable for solving many real-world problems, analyzing this layered
information as an integrated whole can significantly aid decision makers in
considering complex choices, such as where to locate a new department of
motor vehicles building to best serve the greatest number of citizens, tracking
delivery vehicles, to record details of planning applications, to modeling global
atmospheric circulation.
100
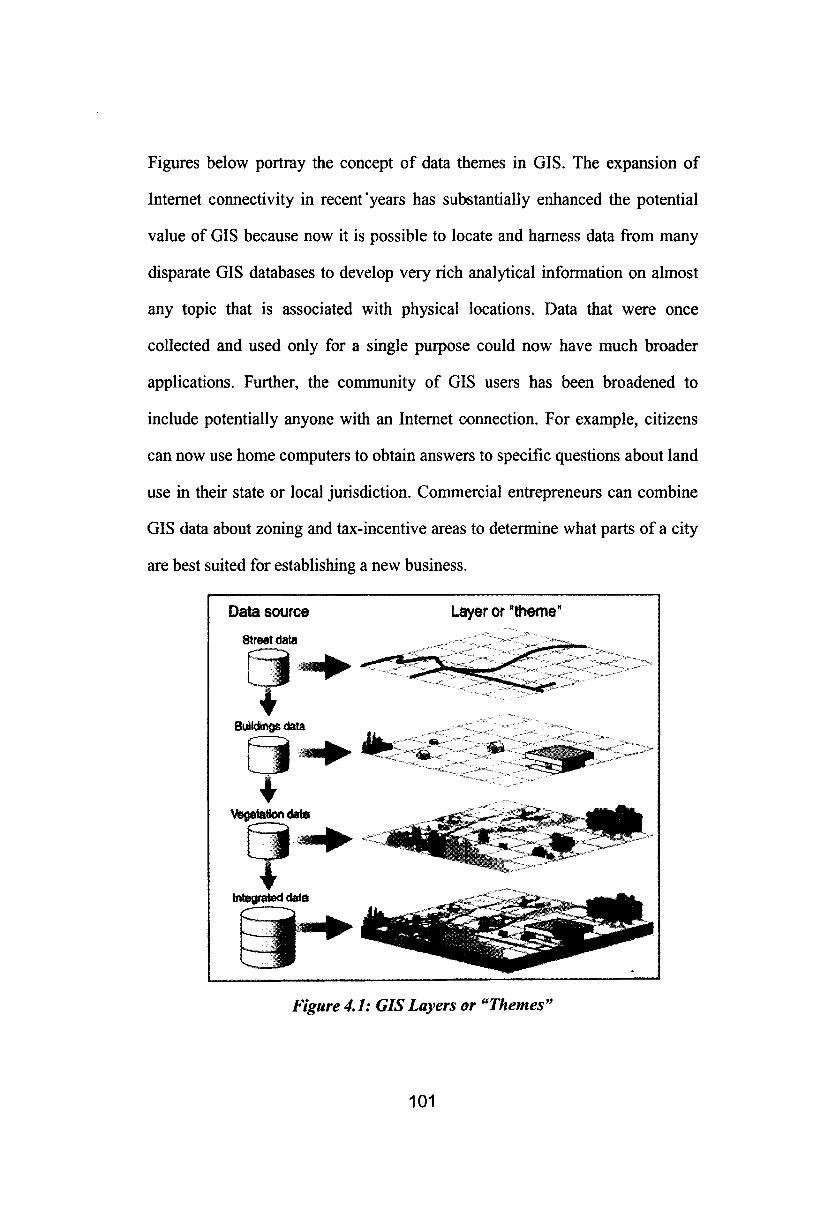
Figures below portray the concept of data themes in GIS. The expansion of
Internet connectivity in recent'years has substantially enhanced the potential
value of GIS because now it is possible to locate and harness data from many
disparate GIS databases to develop very rich analytical information on almost
any topic that is associated with physical locations. Data that were once
collected and used only for a single purpose could now have much broader
applications. Further, the community of GIS users has been broadened to
include potentially anyone with an Internet connection. For example, citizens
can now use home computers to obtain answers to specific questions about land
use in their state or local jurisdiction. Commercial entrepreneurs can combine
GIS data about zoning and tax-incentive areas to determine what parts of a city
are best suited for establishing a new business.
Figure 4.1: GIS Layers or “Themes”
101

Figure 4,2: Layer Based Approach1
In addition to all cartographic information GIS allows for the powerful addition
of tabular information to be attached to the GIS layers. The figure below shows
how each element of a map layer is given a unique id number. These unique id
number ties into a database management system. This allows for the addition of
attributes describing the cartographic date.
102

OVERALL DATA BASE CONCEPT
1Figure 4.3: Map Layer and Tabular Attributes Linked by Geographic Identifier
4.5.2. Object-Oriented Approach:
An alternative method for organizing spatial data is objected-oriented. In an
objected -oriented GIS, the geographic features and all the information related
to a feature are stored as an object. “An object is a structure that represents a
single entity, describing both its information content and its behavior. Every
object belongs to a class, which defines a structure and a set of operations that
are common to a group of objects. Individual objects of a given class are often
103

referred to as instances of the class”. When using an object-oriented model in a
GIS “each object instance contains all of its graphical characteristics, its
geographic location, and all of the associated data.”
By storing information in thematic data layer or objects registered to a common
geographic coordinate system, any combination of these layers or objects may
be overlaid to form a new dataset to be used to answer a question or analyze a
problem. This ability to manipulate the separate data layers and objects provide
a GIS with vast analytical power [5].
4.5.3 Relational Approaches:
As a first step in the evolution from a purely graphical system, it was
recognised that links to additional geographic attributes in a GIS would
radically increase the utility and power of such information system. Although
early GISs provided an ability to graphically model and depict cartographic
information, such systems became extremely cumbersome and limiting when
trying to really apply the power of computers to selective retrieval and analysis
of spatial information. The simplest relational model used in GIS consists of a
graphic-based component that carries with each geographic primitive (Points,
Line or Polygon), a unique identifier or tag, which is the means to associate the
geometry with additional non-graphic information defining the characteristic of
the spatial feature.
104
4.6 DATA CAPTURE AND STORAGE:
A GIS can be used to emphasize the spatial relationships among the objects
being mapped. While a computer-aided mapping system may represent a road
simply as a line, a GIS may also recognize that road as the border between
wetland and a urban development, or as the link between main street and the
super express lane.
If the data to be used are not already in digital form that is in a form a computer
can understand and recognize, various techniques are available to capture the
information. Maps can be digitized, or hand traced with a computer mouse, to
collect the coordinates of the features. Electronic scanning devices will also
convert map lines and points to digits.
Putting the information into the system is the time consuming component of
GIS work. Identities of the object on the map must be specified, as well as their
spatial relationships. Editing of information that is automatically captured can
also be difficult. Electronic scanners record blemishes on a map just as a
faithfully as they record the map features. For example, a fleck of dirt might
connect two lines that should not be connected. Extraneous data must be edited,
or removed from the digital data file.
GIS has the ability to extract information from one layer of topology based on
its relationship to another layer, and to integrate information from different
topological layers based on their relationship to each other. An important
concept, which makes GIS different from other computerized graphical system,
105

is topology. Topology is defined as the spatial relationships between
connecting or adjacent spatial objects (Example: Points, Lines, Polygons).
Topological relationships are built from simple elements into complex
elements such as points (simplest element), line (sets of connected points) and
polygons (closed set of connected lines) [6],
4.7 GRAPHICAL REPRESENTATION OF OBJECTS:
Graphical information on objects may be entered in terms of
1. Points (No dimension)
2. Lines (One dimension)
3. Areas / Polygon (Two dimensions)
4.7.1 Points:
A point is the simplest graphical representation of an object. Points have no
dimensions but may be indicated on maps or displayed on screen using
symbols. The comer of a property boundary is a typical point, as is the
representative coordinate of a building. The scale of viewing determines
whether an object is defined as a point or an area. In a large-scale
representation a building may be shown as an area, whereas it may only be a
point (symbol) if the scale is reduced.
4.7.2 Lines:
Lines connect at least two points and are used to represent objects that may be
defined in one dimension. Property boundaries are typical lines, as are electric
106

power lines, telecommunication lines. Roads and rivers on the other hand, may
be either lines or areas depending on the scale.
4.7.3 Areas/polygons:
Areas are used to represent objects defined in two dimensions. An area may
typically represent a lake, an area of woodland, or a township. Again, physical
size in relation to the scale determines whether an object is represented by an
area or by a point. An area is delineated by at least three connecting lines, each
of which comprises points. In databases, areas are represented by polygons
(i.e., plane figures enclosed by at least three straight lines intersecting at a like
number of points). Therefore, the term polygon is often used instead of area.
Figure 4.4: Objects Identity Code Type
4.7.4 Textual Database:
Besides the spatial information in a map, the GIS can usually store non-spatial
information, which is related to the spatial entities. For instance an urban GIS
database may have a map theme of property boundaries. Attached to each
parcel will be the textual database, which might store the name of the owner,
the address, the assessed value of the property, or the type of services and
utilities available on the/ near the site [7].
107

4.8 DATA TYPES IN GEOGRAPHIC INFORMATION SYSTEMS (MAP DATA REPRESENTATION) [8]:
A Geographic information system stores two types of data that are found on a
map- the geographic definitions of earth surface features and the attributes or
qualities that those features possess. Not all systems use the same logic for
achieving this. Nearly all, however, use one or a combination of both of the
fundamental map representation techniques:
1. Raster Based
2. Vector Based
Even though both techniques do the basic task of storing, retrieving, updating,
manipulating, and displaying data, their basic structures are different, and their
displays are strikingly different.
4.8.1 Vector Systems:
With vector representation, the boundaries or the course of the features are
defined by a series of points that when joined with straight lines, form the
graphic representation of that feature. The points themselves are encoded with
a pair of numbers giving the x and the y coordinates. That is the information
about points, lines and polygons is encoded and stored as a collection of x and
y coordinates. The location of a point feature, such as a bore well/bore hole can
be described by a single x, y coordinate. For example, the location of a point,
which is 300 meters east, and 200 meters north of an origin (0, 0) would be
stored as the x, y co-ordinate pair (300,200). Linear features, such as roads and
108

rivers, can be stored as a collection of point coordinates. Polygonal features
such as sales territories and river catchments can be stored as a closed loop of
coordinates.
The vector model is extremely useful for describing discrete features, but less
useful for describing continuously varying features such as soil type or
accessibility costs for hospitals. Vector GIS’s produce data products more like
the analog maps produced by draftsmen of CAD system. Most of the data
layers are developed digitizing (Determining the latitude and the longitude)
lines from existing maps, changing the digitized lines into polygons, and
storing these polygons along with their attributes. The familiar map graphics
and ability of vector systems to include very small or minor areas are the most
important advantage of vector GIS.
Vector system has the following drawbacks:
1. Slower computer operational speeds during the query process.
2. Generation of silvers during the overlay process.
3. Problems creating vector data from raster data.
4. Inability of vector system software to process more than two data
layers in the same query statement.
5. Vector data usually requires less storage space in the computer, but it
may be difficult in a vector system to perform certain data overlay
functions, vector processing requires more sophisticated
programming and processing time.
6. In a vector system, coordinates may be stored at any desired
scale [8],
109
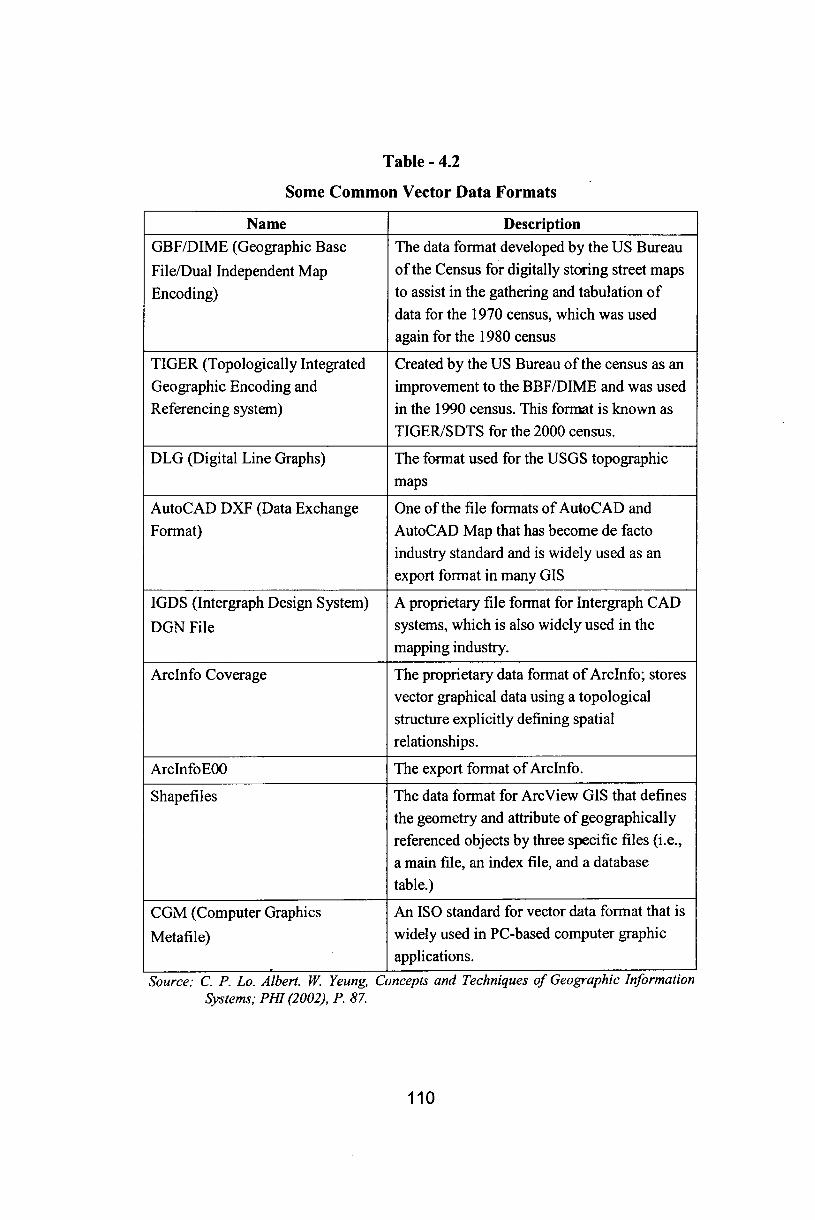
Table - 4.2
Some Common Vector Data Formats
Name DescriptionGBF/DIME (Geographic Base File/Dual Independent Map Encoding)
The data format developed by the US Bureau of the Census for digitally storing street maps to assist in the gathering and tabulation of data for the 1970 census, which was used again for the 1980 census
TIGER (Topologically Integrated Geographic Encoding and Referencing system)
Created by the US Bureau of the census as an improvement to the BBF/DIME and was used in the 1990 census. This format is known asTIGER/SDTS for the 2000 census.
DLG (Digital Line Graphs) The format used for the USGS topographic
mapsAutoCAD DXF (Data Exchange Format)
One of the file formats of AutoCAD and AutoCAD Map that has become de facto industry standard and is widely used as an export format in many GIS
IGDS (Intergraph Design System)DGN File
A proprietary file format for Intergraph CAD systems, which is also widely used in the mapping industry.
Arclnfo Coverage The proprietary data format of Arclnfo; stores vector graphical data using a topological structure explicitly defining spatial relationships.
ArcInfoEOO The export format of Arclnfo.
Shapefiles The data format for ArcView GIS that defines the geometry and attribute of geographically referenced objects by three specific files (i.e., a main file, an index file, and a database table.)
CGM (Computer GraphicsMetafile)
An ISO standard for vector data format that is widely used in PC-based computer graphic applications.
Source: C. P. Lo. Albert. W. Yeung, Concepts and Techniques of Geographic Information Systems; PHI (2002), P. 87.
110

4.8.2 Raster Systems:
With raster systems, the graphic representation of features and the attributes
they possess are merged into unified data file. In fact, we typically do not
define features at all. Rather, the study area is divided into a fine mesh of grid
cells in which we record the condition or attribute of the earth’s surface at that
point. That is Raster data are stored as a matrix of pixels (Contraction of the
term picture element) with each pixel location assigned a row and column
designation.
Each cell is given a numeric value, which may than represent either a feature
identifier, a qualitative attribute code, or a quantitative attribute value. For
example, a cell could have a value “6” to indicate that it belong to District 6
(A feature identifier), or that it is covered by soil type 6 (A qualitative attribute)
or that it is 6 meters above sea level (A quantitative attribute value).
Points are represented as a single pixel, lines as a series of contiguous pixels,
and area as group of pixels.
Raster systems have several drawbacks:
1. The graphic output does not look like maps people are used to
seeing.
2. Minor characteristics of an area may be lost.
3. Linear data, such as roads, are difficult to depict.
4. Boundaries between units are often represented by stair steps.
111

5. With raster storage it is necessary to store the entire matrix of rows
and columns. Storing the entire matrix may include unwanted data.
Raster system has the following advantage:
1. The raster structure, by virtue of its matrix, has a built in ability to perform
neighborhood-type analysis easily, that is, it is easy for the computer to
identify which features are adjacent to other features because of the row and
column structure.
Thus Vector data represents geographic entities by means of an x-y coordinate
system. Raster data uses a matrix of cells, which form a grid, the data grid
themselves can be thought of as images- images of some aspect of the
environment-or as layers-each one of which stores one type of information over
the mapped region- that can be made visible through the use of a raster display.
112

Table - 4.3
Some Commonly Used Raster File Formats
Format Name Description
BMP The format used by bit map graphics in Microsoft windows application.
PCX A proprietary bit map format of Zsoft that is supported by many image scanners.
TIFF (TaggedImage File Format)
A nonproprietary system-independent format designed as a non proprietary format for the storage of scanned images and the exchange of data between graphics packages. TIFF/JPEG, commonly referred to as TIFF 6.0, is an extension of theTIFF format.
GeoTIFF An extension of the TIFF format that contains georeferencing information in its file header. GeoTIFF is developed andmaintained as the result of the concerned effort of GISsoftware developers, commercial data suppliers, and data users to provide a publicly available and platform - interoperable standard for the support of raster geographicdata in TIFF.
GIF (Graphic Interchange Format)
A cross platform format, proprietary to CompuServe that is widely used for the transmission of images on the world wideweb.
JPEG (Joint PhotographicExperts Group)
Another cross-platform format developed primarily for storage of photographic images and is also widely used for graphics on the world wide web
PNG (Portable Network Graphics)
A patent free raster format that is intended to replace the
proprietary GIF format
GRID The proprietary raster format used by ESRI (Environmental Systems Research Institute Inc.) in its software products such
as Arclnfo and ArcView GIS
Source: C.P.Lo. Albert. W. Yeung, Concepts and Techniques of Geographic Information Systems; PHI (2002), P. 87.
113

Figure 4.5: Raster and Vector Representations ofReal World Data flOJ
4.8.3 Raster Versus Vector:
Raster systems are typically data intensive (Although good data compaction
techniques exist) since they must record data at every cell location regardless of
whether that cell holds information that is of interest or not. However, the
advantage is that geographical space is uniformly divided in a simple and
predictable fashion. As a result, raster systems have substantially more
analytical power than their vector counterparts in the analysis of continuous
space and are thus ideally suited to the study of data that are continuously
changing over space such as terrain, vegetation biomass, rainfall and the like.
114

The second advantage of raster is that its structure closely matches the
architecture of digital computer. As a result, raster systems tend to be very
rapid in the evaluation of problems that involve various mathematical
combinations of data in multiple layers. Hence they are excellent for evaluating
environmental models such as soil erosion potential and forest management
suitability. Further satellite imagery employs a raster structure, most raster
systems can easily incorporate these data, and some provide full image
processing capabilities. Raster systems are predominantly analysis oriented.
Vector systems are more database management oriented. Vector systems are
quite efficient in their storage of map data because they only store the
boundaries of features and not what’s inside those boundaries. Because the
graphic representation of features is directly linked to the attribute database,
vector systems usually allow one to roam around the graphic display with a
mouse and inquire about the attributes associated with a displayed feature, such
as the distance between points or along lines, the areas of region defined on the
computer screen.
Vector systems do not have as extensive a range of capabilities for analysis
over continuous space. They do however excel at problems concerning
movements over a network and can undertake the most fundamental of GIS
operations that will be sketched out below. For many, it is the simple database
management functions and excellent mapping capabilities that make vector
systems attractive. Because of the close affinity between the logic of vector
115

representation and traditional map production, a pen plotter can be driven to
produce a map that is indistinguishable from that produced by traditional
means. As a result, vector systems are very popular in municipal applications
where issues of engineering map production and database management
predominates.
4.8.4 Querying the GIS:
GIS stores both spatial and non-spatial data in a database system, which links
the two types of data to provide flexible and powerful ways of querying or
asking about the data. In some cases we query by location For example “what
land use is at this location?” In other cases we query by attribute -“What areas
have high levels of carbon-di-oxide?” Some time we undertake simple queries
such as the above and at other time we ask about complex compounds of
conditions like- “Show all wetlands that are larger than 1 hectare and that are
adjacent to industrial lands” [11].
4.9 APPLICATIONS OF GEOGRAPHIC INFORMATION SYSTEMS:
At a broad range of scales, map have become increasingly important as legal
document that convey land ownership and jurisdictional boundaries, as tools to
support decision making (For example, in urban planning).
GIS provides the ability to completely model utility networks, such as those
supplying water, power and telecommunications to a large number of
consumers. Such a system may operate at a variety of scales, modeling service
116

connections to consumers, service districts as well as detailed facilities
inventories and layouts, such as transformers, valves conduits, and schematic
diagrams.
What’s in a GIS map? Today we look for it to guide our decision-making
through fuller control of our natural resources, a giant step in itself and more
than ambitious enough in many respects. GIS has become a key element at
many levels:
1. In customer support (to respond to service failure),
2. In maintenance and daily operations (To identify work requirements
and assess inventories) and
3. In planning (to respond to projected needs).
GIS provides link between many information systems, including engineering,
planning and customer billing, which can increase overall performance and
operational efficiency. Examples of the types of activities that are being
addressed through this technology are listed below:
1. Municipal Infrastructure: Centre-line drawings for streets, water and
sewer utilities linked to databases for integrated planning,
construction, and maintenance management.
2. Regional Planning: Maps, land records, highways, redevelopment
plans analyzed for regional impact.
3. Tax Management: Property maps, tax records, assessment for tax
collection and planning.
117
4. Emergency Services: Responding to fire, explosions, hazardous
material spills, and other unpredictable events.
5. Environmental Studies: Evaluation of wetlands, erosion patterns and
watersheds using aerial digital orthophotography.
6. Oil Spill Impacts: Remote sensing and surface based evaluation for
tanker spills, war disasters, and real time management of emergency
operations.
7. Wastewater Management: integrated planning system including
sewers, catch basins, ditches, and waterways for planning storm
impacts.
8. Water Quality Management: Modeling soil, land use, and watershed
characteristics to evaluate alternative scenarios.
9. Air Emissions: Modeling and display of dispersal and risk from air
toxics on regions surrounding industrial facilities.
10. Process Hazard Analysis: Linking drawings and databases to
conduct hazardous operations analysis for chemical operations.
11 .Forestry Management: Imaging and digital elevation modeling to
evaluate damage to forests from the effects of fire, logging,
pesticides, and acid rain and to describe trends in forest resources.
12 .Population Planning: Spatial distribution and mapping
overpopulation and slums in underdeveloped countries using satellite
imagery.
13. Habit Characterization: Analysis of population and migration
patterns to support preservation of endangered species.
14. Urban Development Planning: Modeling diffusion of development
processes to predict real estate growth patterns.
118

15. Use of GIS as Automation Tool: GIS may be seen as a means to
automate spatial operations or as a tool for obtaining better
information about business operations. Map automation is most
relevant where traditional paper maps were used; this arises only in
specialist role in most business organisations. One example is the
field of Facilities Management (FM), which makes use of computer
aided design approach to record factory layouts, location of pipe
networks etc. Typically these layouts were superimposed on maps,
therefore GIS can be used better integrate this data and to produce
appropriate integrated maps in a less expensive and timelier way.
Utility companies such as electricity, gas or water companies can
also exploit GIS to support routine maintenance of pipe, cable and
power networks. For these organisations, the ability to locate quickly
a pipe or cable is critical to their ability to continue to provide
service to their customer. GIS based technology can be used to
automate the search procedure for pipe location, thereby making
operations more efficient.
16. GIS as a Database: A GIS interface can be used to query a database;
although this requires a more sophisticated interface with the ability
to formulate a query using interactive commands. Modem desktop
GIS software packages like Maplnfo, ArcGis, Arclnfo, ArcView
have sophisticated database functionality. Database capability allows
queries to be generated in the GIS to show only areas selected by
attribute value, for example sales value. This type of software also
allows simple spatial database queries such as selection of a
particular region and operations such as buffering or overlay.
ll.GIS as an Information Tool: The simplest forms of information-
based application are those where a map is produced with some
graphical information on attribute values superimposed. Presentation
119

mapping has been identified as the dominant requirement of the
business use of GIS based technology. Presentation mapping creates
a one-way report; the user cannot query the map presented, instead
the user assimilates the information provided and indirectly
manipulates the data.
Modem desktop GIS software, such as ArcGIS or Maplnfo, can be regarded as
much more than presentation mapping software. This software can be better
regarded as illustrating the database or spatial analysis view of GIS. However,
in addition this type of software also provides comprehensive presentation
facilities. These facilities include the ability to generate thematic maps using a
variety of shading techniques, bar and pie charts, graduated symbols, and dot
density maps. Modem presentation mapping software allows three-dimensional
representation to be used, with the capability to extrude areas on the map to
represent particular attribute.
4.9.1 Business Application of GIS:
Business organizations operate in an ever changing and challenging
environment, in which competitive forces require that information technology
be exploited to the full. On widely cited model of business, the Value Chain
Model by Porter identifies five primary business activities:
1. Inbound Logistics (Inputs)
2. Operations
3. Outbound Logistics (Outputs)
4. Marketing and sales and
5. Services.
120

Information Technology can contribute to the efficient organization of all the
primary business activities. As business environment becomes increasingly
competitive, the use of IT becomes an important component of business
strategy. Importantly, spatial techniques can have major role in this
contribution. There is increasing concern about the natural environment and
companies are anxious to be seen to respond to these concerns. Issues such as
pollution control often have a spatial dimension and planning for the location
of new facilities requires the use of spatial techniques to address public concern
over issues such as traffic impacts.
4.9.2 Logistics Support:
Business logistics has an inherent spatial dimension, as goods must be moved
from one point to another. Modem businesses have sophisticated supply chain,
with goods being moved around the world on a just-in-time basis. However,
these supply chains are vulnerable to disruption due to political events, bad
weather and natural disasters and unforeseen events: such as quarantine due to
diseases. In these circumstances, it is important to be aware of the spatial
location of parties involved and to be able to plan rapidly alternative routes to
resolve any difficulties.
It is therefore not surprising that routing and location analysis are some of the
most important areas of application of spatial techniques, a good example being
the comprehensive restructuring of a Procter and Gamble’s logistics. Logistics
applications are therefore of considerable importance to business and a field
121

where the contribution of quantitative approaches has long been recognized, in
the fields such as routing and location analysis.
4.9.3 Operational Support:
Organizations with substantial use of spatial data for logistics form one group
of potential users of GIS techniques. Other organizations will focus on the use
of spatial techniques for different operational applications. IT continues to be
of critical importance to the routine operations of many businesses, which rely
on systems, such as airlines booking systems, point of sales system and bank
networks to facilitate their routine operations.
Many operational applications of GIS lie in the government sector, these often
involve private contractors. For example, road networks may be publicly
owned, but may be constructed and maintained by the private sector. The use
of GIS should lead to greater efficiencies in this type of application and
ultimately to new procedures and processes for the allocation of this type of
work.
Organisations using spatial data for operational reasons have the opportunity to
exploit their spatial data resources for strategic management purposes. This
will mean a move towards spatial decision support applications and the
incorporation of spatial data in the Executive information systems (EIS).
The synthesis of EIS and spatial techniques is most promising where there is
already a large volume of operational spatial data in the organization, as well as
a requirement for access to spatial data outside the organization.
122

4.9.4 Marketing:
In disciplines such as marketing, additional possibilities for analysis are
provided by the availability of increasing amount of reasonably priced spatial
data. Demographic data is of particular importance to business and basic census
information is now available for use in GIS throughout the western world. The
relevance of GIS to this type of work is becoming widely recognized. The
availability of user friendly SDSS to manipulate this type off data will lead to
additional decision possibilities being examined, which are difficult to evaluate
without the use of such techniques. This is reflected in increasing interest in
spatial applications for sectors such as retailing, which may not have used this
form of technical analysis in the past. GIS has been seen as being a critical
component of a marketing information system.
4.9.5 Service:
Within Porter’s value chain model, service refers to customer related activities
other than direct sales and product delivery. This would include after sales
service and support. With the routine high standards in modem manufacture
and the outsourcing of logistics, service is often one area where companies can
try to achieve a competitive advantage.
GIS based techniques have an important role to play in customer service. Call
centers will often use a customer’s telephone number to identify where they are
calling from, thereby providing a service appropriate to that customer. Spatial
database can be used to identify the nearest shop or repair centre or an ATM of
123
a particular bank for a customer. Utilities can identify whether a customer is
sufficiently close to a cable network or telephone exchange to avail of an
improved service.
4.9.6 New Areas for SDSS Use in Business:
One area of growing importance of SDSS application is businesses where the
importance of both spatial data and modeling is some what neglected at
present, in sectors where decision-makers are less accustomed to using maps.
Groups such as insurance sector have been accustomed to using statistical and
actuarial models, but have not attempted to use information on the location of
their customers. As insurance risks are often strongly spatially correlated, this
sector needs to make more use of spatial techniques in the future.
Mobile computing and telecommunications is an emerging area of IT
application that is of increasing interest to business. GIS is widely used by
operational activities by mobile service providers for modeling service levels
and locating signal masts. Mobile services can be largely distinguished from
fixed Internet services by the presence of a locational element. Future
developments will enhance the capabilities of mobile devices and we are likely
to see the integration of mobile data devices and spatial technologies such as
Global Positioning Systems (GPS). This will allow the location of the mobile
user to be easily identified and will therefore provide the basis for a service
customized to that location. This allows for the growth in situation-dependent
services directed at a particular customer in a particular location [12].
124

4.10 BENEFITS OF GEOGRAPHICAL INFORMATION SYSTEMS:
GIS can lead to new ways of thinking about and dealing with old problems,
because the data is tied to a common referencing system, it is easy to use the
same data to various applications as well as to associate diverse data sets
previously unavailable for joint analysis. Topology permits new questions to be
asked and encourages a new style of analysis that is in many cases
fundamentally better than those used traditionally.
GIS provides the following benefits:
1. It adds a degree of intelligence and sophistication to a transport
database that has previously been unknown.
2. It is possible to perform, geographic queries in a straightforward,
intuitive fashion.
3. The analyst can ask a series of geo-based questions and obtain the
answers quickly in an easy to understand colour-coded display on the
screen, hard copy or disk file.
4. Integrates different databases into one environment. Each layer in a
GIS database may represent a complete database (One layer may
contain census geographic with associated demographic information.
Additional layers might include the national wetlands, Inventory data
from the fisheries and wildlife departments, land ownership of the
local government so on and so forth). Different individual layer
databases are used for their own purposes and analysis, but value
increases drastically when included as a layer in a GIS: these layers
(databases) may be over laid with one another for spatial analysis.
125

5. Displays and manages spatial data in a spatial context. Often, spatial
data are managed in tabular database that do not allow viewing or
management of the data with spatial tools.
6. Production of specialized maps and graphic products.
7. Redundancy and other problems of multiple map sets are eliminated.
8. Map data is easier to search, analyze and present [13].
4.11 FUNCTIONS OF GEOGRAPHIC INFORMATION SYSTEMS:
The processes of integration and interrogation can be broken down into a
number of general categories. Laurini and Thompson have identified ten major
tasks for spatial information systems:
1. Automated Mapping: Replicating paper maps on computers.
2. Thematic Mapping: For instances using customer information and
demographic data.
3. Map Overlay or Composite Mapping: Producing a map from several
layers of data.
4. Spatial Querying: Obtaining information from a database in response
to identification of particular conditions.
5. Spatial Browsing: Exploring the contents of a database in response to
identification of particular conditions.
6. Spatial Problem Solving: For example deducing inclusions of points
in polygons, or for spatial decision-making incorporating both spatial
and logical deductive reasoning.
7. Analysis of Spatial Data: Tasks which deal with the attributes of
entities, like the average size of sales territories or the degree to
which product sales are related to weather conditions.
126

8. Creating Spatial Statistics: Tasks that require measurements of
spatial properties of phenomena, like the total distance traveled by a
vehicle on a road network.
9. Analysis of Spatial Statistics: Tasks which treat spatial properties as
attributes, for example the correlation between the highway network
connectivity and levels of economic development.
10. Spatial Analysis: Encompassing tasks, including simulation, which
use a variety of tools of spatial statistics and location-based problem
solving.
These tasks define ways in which users make use of spatial data. Tasks are
carried out on spatial and attribute data sets held in a database.
Figure 4.6: Example of Geographical Map Data
127
VIL.NO NAME TALUK DISTRICT AREA PERIMETER RES HOUSE HOUSEHOLDS T_POPLN T_M_POPLH
400,100,132 BAWALGAON Aurad Bidat 15,263,110 18,92024 356 356 2,139 1,051400,100,131 NANDI BUALGAON Aurad Bidar 10,237,210 14220.72 249 249 1,7® 884400,100,127 CHKLIUDOIR Aurad Bidar 15,904,840 16,85964 427 427 2,622 1,343400,100,133 HOKRANA Aurad Bidat 15,116,460 16,59683 472 472 2,897 1,473400,100,130 MUTHKHED Aurad Bidar 4,227,513 8,434.98 101 101 517 264400,100,125 DA9KA(CHAWAR) Aurad Bidat 15,042,400 16,422.93 536 536 3,028 1,578400,100,134 HANGERQA Aurad Bidat 10,477,420 13,716.23 320 320 1,769 916400,100,128 AKANAPUR Aurad Bidar 2,264,024 6,320 29 27 27 190 94400,100,135 SAWARGAON Aurad Bidar 9,802,902 12,846.97 234 234 1,445 740400,100,136 BONTHI Aurad Bidar 20,039,430 23,234.16 387 367 2,479 1,265400,100,138 KHTOA(B) Aurad Bidat 11,886,750 14,894.86 323 326 1,919 1,031400,100,126 GANGANBEH) Aurad Bidar 12,407,850 13,851.62 173 173 1,210 620400,100,149 GANESH4JR (UDGIR) Aurad Bidat 4,808,090 8,778.43 163 163 993 492400,100,137 UNGI Aurad Bidat 8,293,926 14247.49 176 178 993 488
400,100,139 BHANDAR KUMTA Aurad Bidat 13,433,300 16,015.12 366 366 2,401 1,211400,100,147 MURKI Aurad Bidat 20,344,170 20,860.18 542 542 3,555 1,825
400,100,145 cm<eGAON Aurad Bidar 15,757,360 17,147.8 331 331 1,904 984400,100,148 WAGANGERA Aurad Bidat 5,613,051 10,783.95 104 104 704 364
400,100,146 HANDIKHrRA Aurad Bidat 7,699,371 11,487.73 287 287 1,844 924400,100,143 MALEGAON Aurad Bidat 4,865,167 9,768.42 184 184 1,338 871
400,100,004 HULYAL Aurad Bidat 6,703,383 11,341.05 171 175 1,257 633400,100,140 DANGORGAON Aurad Bidar 9,987,154 13,508.13 173 173 1,011 514
400,100,003 EKAMBA Aurad Bidat 19,320,940 18,386.7 496 497 3,100 1,534
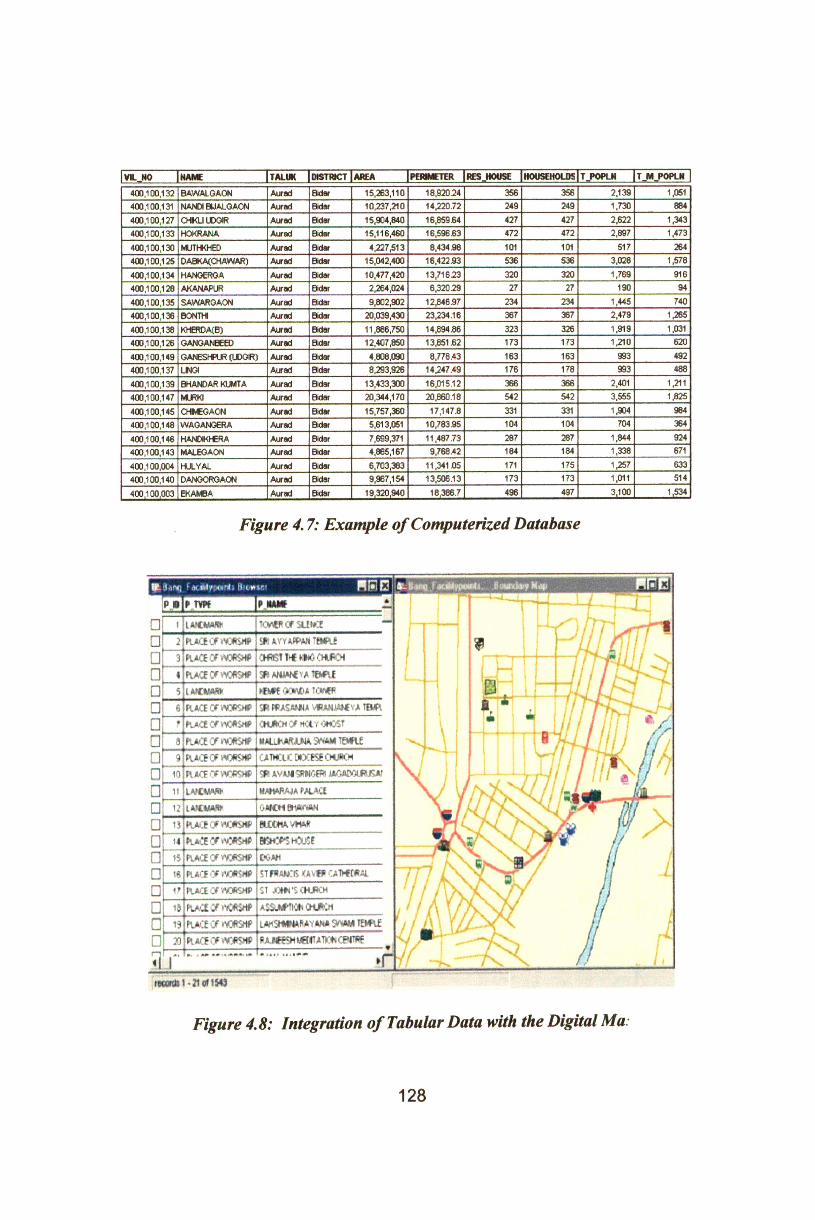
Figure 4.7: Example of Computerized Database
t-j'inq f i*t.*lpix«nl» Binder3P TVPf P NAME
□ Hi lANCWASf tcwer or Since□ 2 H.ACS CP WJRSrtP * AYTAfPM TEWLt□ “~3i PLACE Of iVOf&K1 CMfGTK P#40 CHLfSCM
D » PlACECf ACRSMR SBAPUPPE'iA Wit□ ~S' lArtfcwW PFMRf .>TWPA TOWER□ 6 race y JPIRASANNA VHAMJAMYA W.□ p place cpvnoashp CHURCH OP tt&Y GHOST□ si PLACE V WOWMR M4LLP.AR.IJNA 3*V*M TEMFtE□ PLACECPWRSHP CATHCLC WXESECKJR04□ io: R.4CFGfVV0R9>» y AVAMORNCfSl JAGADQURUSA1□ it LAHMA* MAHARAJA PALACE□ lANEMAW omcm awm□ u PLACE Of MJCCMA VMM□ ' 14 fc.*CE *P>v2*Srtf> KMOPS HOUSEn "~1S place arvmsNP OC-AH□ 18 place y twmmp S1P»4W*IS CAVER CAMtRAl□ ~ PLACE CfWORSHP SI JOMTSCHJRCH□ J» PLACE Of TiCftSHR ASSUMPTION CHURCH□ 19 place on**sr* LAMSNlWAMYANA CVVAM TEPElE□ 30 PLACE PAJffSH WKfATBH CENTRE
l words I - 21 <H 1543
B.WXI f dtiWyswtM) HwlxteyM*!
Figure 4.8: Integration of Tabular Data with the Digital Ma
128

9 ooyr v>o\ roor 4 toinmQ'c tjff»i
»0CR0S*«OAt
KARNATAKA $*AU INCWS1 ^MARKETiNG CORPORAROJ
*. 4KSSIBC CORPORATE 0Pfl.CE
P-P 1,319
P_TVPE BANKS /FINANCIAL NSTITUTIONS
TYPEJCp 112
PJiAkC STATE Of NDIA
GRCJD 42
L.D 383
CSCJD 101,105,101ftfRASANNA Cll ■RAROP CINEW
I1RD POLICE STATIONSASTRI MEMORI
,nH
Figure 4.9: Intelligent Map Developed (GIS Data)
YOUR CHOICE:
TABULAR DATA?
OR MAP?
ID NAME AREA Total PopulaNon
1 Chtkmagalur 7,070,867,000 754,49421 Chitradurga 8,556 236,000 1,347,738
3 Davanagere 5,791,004 200 1,325,182
4 Haven 4,845,495 000 1994,9425 Shimoga 8250,978,000 1,381313
Figure 4.10: Data Visualization f!4]
129

4.12 TRENDS IN BUSINESS GEOGRAPHIC INFORMATION SYSTEMS:
Business use of GIS covers a wide spectrum of GIS applications. The use of
GIS application is still somewhat fragmented and there is a need for future
integration with other forms of information technology. The trend in IT
applications has been for initial operational use in specialized situations,
followed by a more general information providing use, followed in turn by
sophisticated specialist decision-making and executive management
applications. Recent research shows a common trend in public organizations
towards GIS becoming an integral part of the overall corporate information
system.
GIS applications are relevant to a wide range of sectors, from engineering
related applications where technical solutions are readily accepted, to
marketing departments where there is less tradition of using IT. GIS faces
particular problems as most people in business have little training in spatial
techniques and may consequently be slower to make full use of the technology.
Where top managers have little appreciation of the technology, they are
unlikely to be sufficiently enthusiastic in supporting it.
At the government level, current trends have created an environment for
efficient management of the large volumes of complex, multi application
information required in the land records management needs of planning, public
works, tax assessment, mapping, emergency services, utility facilities
130

management and other applications. Through the enhanced power and
flexibility provided by these trends, users will have greater capabilities than
ever for the input, management, analysis of attribute and graphic information
from diverse sources and for providing rapid response to comprehensive
inquires about this information.
4.13 GIS TOOLS:
There are an extraordinary range of software packages that are presented as
tools for developing IS applications. There are about 63 GIS software systems
currently available. Most of these are sold as application software only or as
turnkey systems that include hardware, software and user training. A few are
offered as consulting services. Some of the products such as base networks or
data files, for which the user must develop data input and retrieval routing, are
limited in the form but broad in scope. There are a number of GIS software
packages available today. Some of them are listed below:
1. AGIS 12.GIMMS 23. PMAP
2. ARC/INFO 13.GISIN 24. SICAD
3. ARCVIEW GIS 14. GRAMS 25. SPANS
4. ATLAS GRAPHICS 15. GRASS 26. STRINGS
5. CARIS-GIS 16. IDRISI 27. TIGRIS
6. EPPL7 17. IGDS/DMRS 28.TOPOLOGIC
7. ERPAS 18.IMAGE 29. TRANSCAD
8. FMS/AS 19.MAPINFO 30. UFOSNET
9. GEO-GRAPHICS 20.MIPS 31. USEMAP
10. GEOMEDIA 21.MGE (INTERGRAPH) 32. VANGO
11. GFIS 22. PC ARC/INFO
131

4.14 GIS IN INDIA:
Farmers in Uttar Pradesh’s, Badaun district no longer use farming techniques
that haven’t changed in centuries. Now, before deciding on which crop to grow
on his land, a farmer no longer says a prayer, asking for divine help, but simply
drops in at the nearest Tata Kisan Kendra (TKK) set up by Tata Chemicals. All
he has to do is mention his name and the computer at the centre generates an
image of his field and tells him the type of crop to grow on his field or how
much fertilizer to use. The TKK tracks key parameters relevant to farmers,
such as soil, ground water and weather on a real-time basis with the help of
GIS or Geographic Information Systems.
Welcome to the new age of precision farming where agriculture has become a
refined art thanks to GIS. Today, with the help of GIS, TKK can not only
suggest the type of crop that would best suit a particular plot of land, but also
keep track of other parameters that have a bearing on this decision. What’s
more, a GIS can even help predict pest attacks since it combines remotely
sensed data, ground verification data, meteorological information, and crop
growth and soil moisture models to provide a visual representation of current
conditions. Cases like the TKK project though rare in the country; simply
affirm the potential of a technology such as GIS in a country like India.
4.14.1 Scenario:India has a well-established framework for collecting geographical data. Two
government agencies—The Survey of India (SOI) and the National Remote
132

Sensing Agency (NRSA) through its remote sensing satellites, are the most
important generators of geographical data. The SOI, which was established
way back in 1767, is responsible for all topographical and development surveys
in India. Similarly, Indian remote sensing satellites have been providing data
for monitoring and management of India’s natural resources. Further, there are
a lot of other agencies for different sectors such as meteorological data,
oceanographic data and groundwater data. Though work done by various
agencies is excellent, the same is not completely available to the general public.
This rigidity in approach has been a major obstacle in the growth of the Indian
GIS industry. But despite the obstacles, almost all Indian players are bullish on
the growth potential of the industry, which is growing at an average of 35-40
percent year-on-year.
4.14.2. Indian Market:
In GIS there are different components like data collection, data capture, data
conversion, consulting and system integration. Most Indian firms in GIS are
involved in the data collection, data capture and data conversion scenario. But
some players have moved up the value chain to offer consulting and system
integration. Some of the success stories in the Indian GIS space include
companies such as Rolta, Infotech Enterprises, Genesys, Nucleus NetSoft and
GIS India, ESRI India and Spatial Data.
The Indian market potential in GIS is high. With GIS already having made
inroads into sectors such as defense, natural resources management and
133

environmental management, we see increased application of GIS in areas such
as land and property information management, utilities and facilities
management, agriculture, e-govemance, and more significantly as an important
planning and decision-making tool. According to market reports, in the year
2000 alone, the Indian government invited major tenders worth more than Rs.
200 Crore in this sector. It is also estimated that private players in
infrastructure, telecom and other utilities are spending around Rs 50 Crore
annually on GIS products and services. In short, the growth indicators are
extremely positive feels Ajay Lavakare, CEO of RMSI. Though there have
been no official figures on the GIS market in India, market sources estimate the
entire GIS industry to be close to Rs 80 Crore.
As noted earlier, the Government is the biggest consumer of GIS applications
and uses it actively. India, with its diverse landscape is a perfect fit for a
technology like GIS. The use of geographic data has always been considered to
be a vital asset in decision-making for any nation. For instance, knowledge of
geographic data is absolutely critical while planning a town or building a
highway-any infrastructure, for that matter. Keeping this in mind, a large
number of government departments, both at the centre and the state level, have
established GIS centers.
Dr D K Munshi, of GIS solutions at Rolta India says, the maximum potential
has been in the government departments, which are actively involved in spatial
data generation and planning and implementation of various programmes. For
134

example, various departments responsible for execution and implementation of
development schemes have been using GIS. The departments, which are
involved in implementation of GIS activities are the Department of Space
through NRIS, the department of Science and Technology through NRDMS,
Forest Survey of India, Survey of India and National Hydrographic Survey.”
Simply put, this is a massive market for GIS players to address. There is also
an increased use of GIS by central, state and local governments in the areas of
converting their existing maps to digital formats and in areas such as land
record management.
4.14.3 Issues:
While there have been interesting and innovative cases of the use of GIS, there
are also critical issues that need to be resolved immediately to boost the growth
of the industry. For instance, there are still many government restrictions on the
Survey of India map data for large portions of India.
Lack of reliable and accurate digital data, in addition to policies, are some of
the major obstacles. For example, a private sector player who creates a digital
map has to get it cleared by the Ministry of Defense. There are also no clear
guidelines. Everything is treated on a case-to-case basis and this sometimes
takes more than a year. The end result is that, by this time, there are changes in
the attributes of-the location itself, such as the coming up of new shops, and
data has to be sent all over again to the ministry, Says Rajagopalan of Spatial
Data.
135

Explains Lavakare, India has a well-documented history of maps but the rigid
framework of restriction of map data policy has tied down GIS players within
India. In addition, there is no ‘quality standard’ or certification standard for
GIS data produced, and end users are unable to evaluate the quality of data
supplied by GIS players. The other real obstacles are low awareness of the
benefits of GIS, no clearly outlined government policy in this area, and the lack
of finance to support GIS solutions, especially at the state and local
government level. Consequently, although government bodies in India have
been one of the biggest consumers of GIS, compared to international trends the
usage of GIS-related technology has been comparatively low in India so far. As
a result, most of the larger and more professional GIS service firms in India are
focused on the international market. Hence, success stories of the benefits of
GIS technology and their applications are few and not so well known.
Adds Bharti Sinha, vice president of Marketing and Sales for Asia Pacific at
Infotech Enterprises, “Indian users need to be educated on the power of GIS-
based applications. There is also a need for ridding the industry of short-term,
fly-by-night operators who take customers for a ride and ultimately the quality
of projects gets affected, which in turn affects the whole industry. Additionally,
users need to understand the need for comparing apples with apples and not
apples and oranges, when deciding on a major project. For instance, many
projects still are decided only on the basis of cost, which leads to the lowest
priced vendor being selected, but who may not have the capability to deliver.”
136

Sinha feels that the government needs to lay down strict guidelines for
acceptance on quality and credentials in order to remove the chaff from the
grain.
Manoj Thakur, president and CEO of Nucleus NetSoft, also puts forward a very
valid point on the need for a change in mindset on the part of the government.
Says he, the policy maker’s mindset has to change on availability of data for
public consumption. The Survey of India needs to be left to do what they have
been doing for centuries, in their military role. Public availability of data can
only increase with a civilian copy of SOI. If ISRO and NRSA could work
closely with private service providers in making satellite originated GIS
products publicly available, it could lead to a great win-win situation for not
only Indian users but users worldwide.
In addition to these issues, there is also a need for dissemination of spatial data
through the Internet. A clear-cut policy on map publication and distribution on
the Internet needs to be framed, taking into consideration the security concerns
of the country. The policy should also address the issues of data availability for
the common man, its accessibility, dissemination and standardization. Lavkare
of RMSI feels that the government should institute an annual award to
recognize the best Internet GIS usage by any government agency, similar to the
e-govemance award already in place for government websites providing e-
govemance services.
137

To conclude, there are about 263 companies in India dealing in GIS. While the
Indian market is still at a nascent stage, major growth can be achieved if the
government decides to follow progressive policies similar to other countries.
And when that happens, Indian GIS-based technology providers can surely
look to the sky as their upper limit for growth [15].
14.15 WHY IS GIS DIFFICULT?
The use of computer-based Geographic Information Systems (GIS) technology
in the government, business, and non-profit sectors has expanded tremendously
in the last decade. GIS has become a pivotal component for decision making
and planning in government agencies, in business, and already had significant
impact in applications ranging from facilities management through marketing
analysis to the monitoring of global change and environmental degradation.
The audience of GIS Technology continues to diversify, and it is expected that
GIS will be adopted by millions of new users in the years ahead. While many
of these new users will be seeking simplified tools custom tailored to their
applications, a significant fraction will need the rich repertoire of data
development, data management, and spatial analysis functions provided by a
full-scale GIS software environment [16].
Despite this growth, obstacles to the widespread use of GIS technology remain.
One of the most serious obstacle is the apparent complexity of GIS analysis
techniques and systems. As GIS commonly uses graphical presentation
methods, almost anyone can understand and appreciate its results. However,
highly trained personnel are usually required to produce these results. GIS
138

systems are actually becoming more complex due to the more integration of
remote sensing and other functions [17].
GIS is difficult because:
1. Openness of the GIS Domain: GIS is difficult because institutional
and environmental constraints restrict the analyst's activities or
interface with his/her objectives. In the real world, GIS is not
distinguished from other activities that strictly might be considered
to be unrelated to GIS. In particular, the general hardware and
software environment that supports the GIS becomes part of the
domain. Many of the problems that people cited as "GIS problems"
actually stemm from difficulties with hardware configurations,
operating systems and so on. Similarly, activities related to
assembling or compiling information (e.g. reading reports,
contacting town planning boards, tracing out boundaries on paper
maps, doing ground checks) also appear to be viewed as part of the
GIS domain. Problems of source data accessibility or quality, as well
as organizational barriers related to data ownership, are all identified
as "GIS problems".
2. Management of Details: GIS is difficult it requires recording, recall
and use of many details, which are outside of the GIS database
proper. Practically every user uses some kind of external aids for
maintaining information about his or her GIS work. Many users
keep notebooks or logs of their project work, recording a wide
variety of items such as coordinates, tolerances, lists of data layers or
maps, special cases or problems to be considered etc. They also use
sketches and other graphics to record problems, procedures, or plans.
In addition to these notes on project work, several users keep
notebooks on topics related to the GIS software itself. These
notebooks are used to record problem, workarounds, detailed
139

procedures, shortcuts, and so. In general, users view this information
as (essential) supplements to the GIS product documentation. Users
feel that many of the errors they made were due to the failure to
record, or inability to recall, this type of detailed information. They
had learned, through experience, the importance of maintaining and
managing the specifics items of information that they, personally,
tended to forget.
3. Data versus Operations as the Focus of Work: GIS is difficult
because users focus on data, while GIS software focuses on
operations.
GIS is typically described as a set of operations applied to data:
overlying polygons, buffers, calculating view shed. There have even
been attempts to specify a formal "algebra" of spatial operations.
Most commonly used GIS software is also organized around
operations. Originally, each operation was associated with a
command verb. Although many GIS software packages now use a
graphical, menu-based interface, the action-oriented organization has
not changed significantly. First, the user selects an action from the
menu; secondly, he or she supplies information on the data sets to be
processed, as operation parameters [18].
To conclude GIS is difficult even for experienced users because:
1. It subsumes a wide range of institute and environment issues, outside
the formal definition of the domain;
2. It requires management of large amount detailed information, distinct
from the GIS data;
3. The task structure enforced by current GIS software does not match the
way experts approach GIS problems.
140

REFERENCES
1. Samina T. Panwhar, Robert Pitt and Michael D. Anderson, Development of
a GIS-based Hazardous Material Transportation Management System,
A Demonstration Project.
2. Michael F. Goodchild, National Center for Geographic Information and
Analysis and Department of Geography, University of California, Santa
Barbara, CA 93106-4060, USA.
3. P. Partheeban Evaluation of Transportation Management System
Management Technique using GIS; Regional Engineering College,
Tiruchirappalli.
4. Thurgood, J.D and J.S Bethel; Geographic Information Systems, Civil
Engineering Handbook, CRC Press, Indiana.
5. Geographic Information Systems Challenges to Effective Data Sharing
Statement of Linda D. Koontz Director, Information Management Issues
www.gao.gov/cgi-bin/getrpt? GAO-03-874T. (United States General
Accounting Office)
6. Clodoveu Augusto Davis, Jr. Objected Oriented GIS in Practice in Urban
and Regional Information Systems Association; 1994 Annual Conference
Proceedings.
7. Tor Bemhardsen, Geographic Information Systems, An Introduction,
Second Edition, John Wiley and Sons Inc.
8. J. Ronald Eastman, May 1995, Idrisi for Windows, Student Manual,
Version 1.0.
9. C.P.Lo. Albert. W. Yeung, Concepts and Techniques of Geographic
Information Systems; PHI (2002), Pp. 87.
10. Department of Geosciences, The University of Arizona, Internet page
download, www.Geo.Arizona.edu/geos256/gis/lect4.html
141

11. J. Ronald Eastman, May 1995, Idrisi for Windows, Student Manual,
Version 1.0.
12. Douglas, W.J, Environmental GIS Applications to Industrial Facilities.
13. Allan B. Cox and Fred Gifford, An Overview to Geographic Information
Systems;
14. Omcad System Private Limited, Bangalore, Karnataka, India.
15. Express Computer, India’s No.l IT Business Weekly, “Indian GIS Industry Aims for the Sky”, Issue Date 21st October 2002.
16. Jordon, L.E, J. GIM Interviews the GIS Industry, Geodential Information
Magazine, Vol. 7, No. 10, October 1993, Pp. 35-39.
17. Dobson, J.E. Commentary: A Conceptual Framework for Integrating
Remote Sensing, GIS, and Geography. Photogrammetric Engineering and
Remote Sensing, Vol. 59, No. 10, October 1993, Pp. 1491-1496.
18. Sally E. Goldin and Kurt T. Rudahl Goldin, Rudahl Systems, Inc., Why is
GIS Difficult?
142