
The Design and Implementation of Geographic Information ...
274
-
Upload
khangminh22 -
Category
Documents
-
view
2 -
download
0
Transcript of The Design and Implementation of Geographic Information ...


The Design andImplementation
of Geographic Information Systems


The Design andImplementation
of Geographic Information Systems
John E. Harmon and Steven J. Anderson

This book is printed on acid-free paper.
Copyright © 2003 by John Wiley & Sons, Inc.All rights reserved
Published by John Wiley & Sons, Inc., Hoboken, New JerseyPublished simultaneously in Canada
No part of this publication may be reproduced, stored in a retrieval system, or transmittedin any form or by any means, electronic, mechanical, photocopying, recording, scanning, orotherwise, except as permitted under Section 107 or 108 of the 1976 United StatesCopyright Act, without either the prior written permission of the Publisher, or authoriza-tion through payment of the appropriate per-copy fee to the Copyright Clearance Center,Inc., 222 Rosewood Drive, Danvers, MA 01923, (978) 750-8400, fax (978) 646-8700, or onthe web at www.copyright.com. Requests to the Publisher for permission should beaddressed to the Permissions Department, John Wiley & Sons, Inc., 111 River Street,Hoboken, NJ 07030, (201) 748-6011, fax (201) 748-6008, e-mail: [email protected].
Limit of Liability/Disclaimer of Warranty:While the publisher and author have used theirbest efforts in preparing this book, they make no representations or warranties with respectto the accuracy or completeness of the contents of this book and specifically disclaim anyimplied warranties of merchantability or fitness for a particular purpose. No warranty maybe created or extended by sales representatives or written sales materials. The advice andstrategies contained herein may not be suitable for your situation. You should consult witha professional where appropriate. Neither the publisher nor author shall be liable for anyloss of profit or any other commercial damages, including but not limited to special, inci-dental, consequential, or other damages.
For general information on our other products and services or for technical support, pleasecontact our Customer Care Department within the United States at (800) 762-2974, out-side the United States at (317) 572-3993 or fax (317) 572-4002.
Wiley also publishes its books in a variety of electronic formats. Some content that appearsin print may not be available in electronic books. For more information about Wiley prod-ucts, visit our web site at www.wiley.com.
Library of Congress Cataloging-in-Publicaton Data
Harmon, John E.The design and implementation of geographic information systems /
John E. Harmon, Steven J. Anderson.p.cm.
Includes bibliographical references (p. )ISBN 0-471-20488-9 (cloth : alk. paper)1. Geographic information systems. I.Anderson, Steven J., 1964- ii.
Title.
G70.212.H36 2003910’.285—dc21 2002032425Printed in the United States of America
10 9 8 7 6 5 4 3 2 1
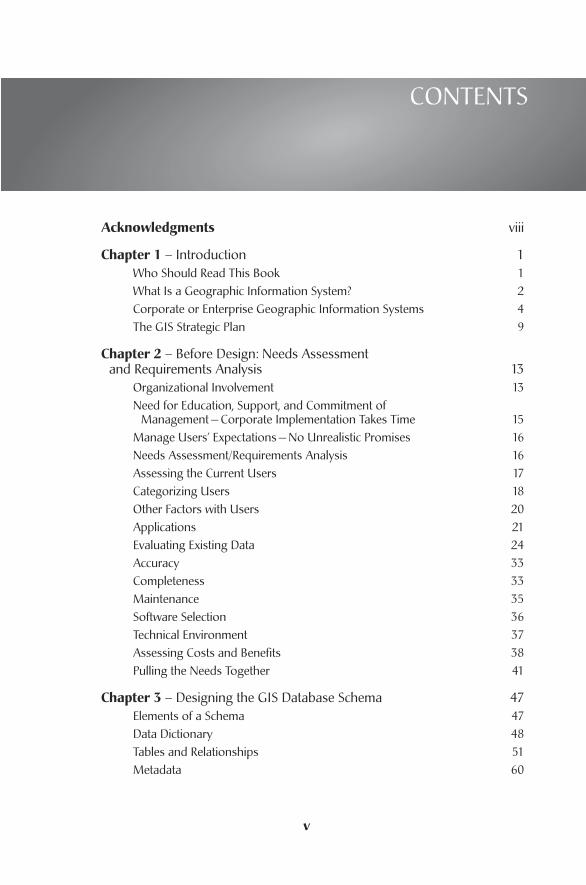
Acknowledgments viii
Chapter 1 – Introduction 1Who Should Read This Book 1What Is a Geographic Information System? 2Corporate or Enterprise Geographic Information Systems 4The GIS Strategic Plan 9
Chapter 2 – Before Design: Needs Assessment and Requirements Analysis 13
Organizational Involvement 13Need for Education, Support, and Commitment of
Management — Corporate Implementation Takes Time 15Manage Users’ Expectations — No Unrealistic Promises 16Needs Assessment/Requirements Analysis 16Assessing the Current Users 17Categorizing Users 18Other Factors with Users 20Applications 21Evaluating Existing Data 24Accuracy 33Completeness 33Maintenance 35Software Selection 36Technical Environment 37Assessing Costs and Benefits 38Pulling the Needs Together 41
Chapter 3 – Designing the GIS Database Schema 47Elements of a Schema 47Data Dictionary 48Tables and Relationships 51Metadata 60
CONTENTS
v
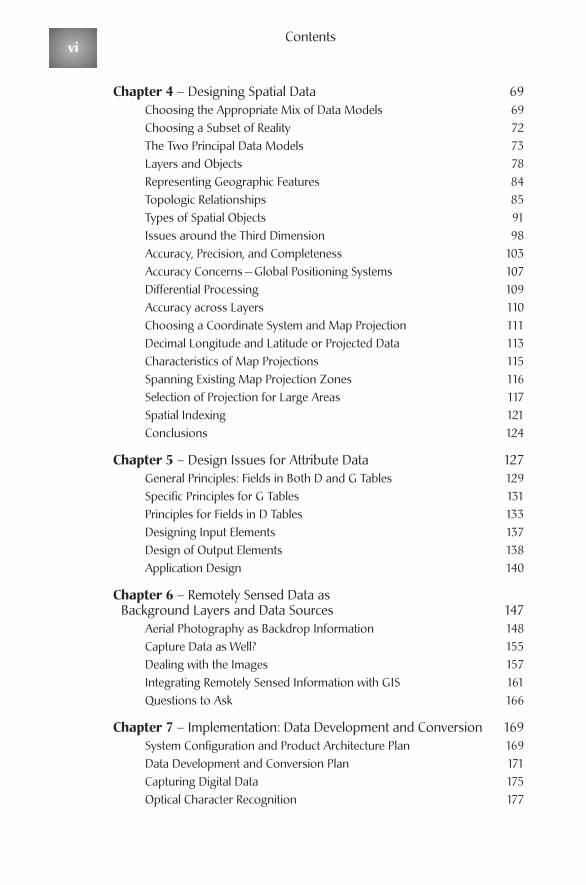
Chapter 4 – Designing Spatial Data 69Choosing the Appropriate Mix of Data Models 69Choosing a Subset of Reality 72The Two Principal Data Models 73Layers and Objects 78Representing Geographic Features 84Topologic Relationships 85Types of Spatial Objects 91Issues around the Third Dimension 98Accuracy, Precision, and Completeness 103Accuracy Concerns — Global Positioning Systems 107Differential Processing 109Accuracy across Layers 110Choosing a Coordinate System and Map Projection 111Decimal Longitude and Latitude or Projected Data 113Characteristics of Map Projections 115Spanning Existing Map Projection Zones 116Selection of Projection for Large Areas 117Spatial Indexing 121Conclusions 124
Chapter 5 – Design Issues for Attribute Data 127General Principles: Fields in Both D and G Tables 129Specific Principles for G Tables 131Principles for Fields in D Tables 133Designing Input Elements 137Design of Output Elements 138Application Design 140
Chapter 6 – Remotely Sensed Data as Background Layers and Data Sources 147
Aerial Photography as Backdrop Information 148Capture Data as Well? 155Dealing with the Images 157Integrating Remotely Sensed Information with GIS 161Questions to Ask 166
Chapter 7 – Implementation: Data Development and Conversion 169System Configuration and Product Architecture Plan 169Data Development and Conversion Plan 171Capturing Digital Data 175Optical Character Recognition 177
Contentsvi
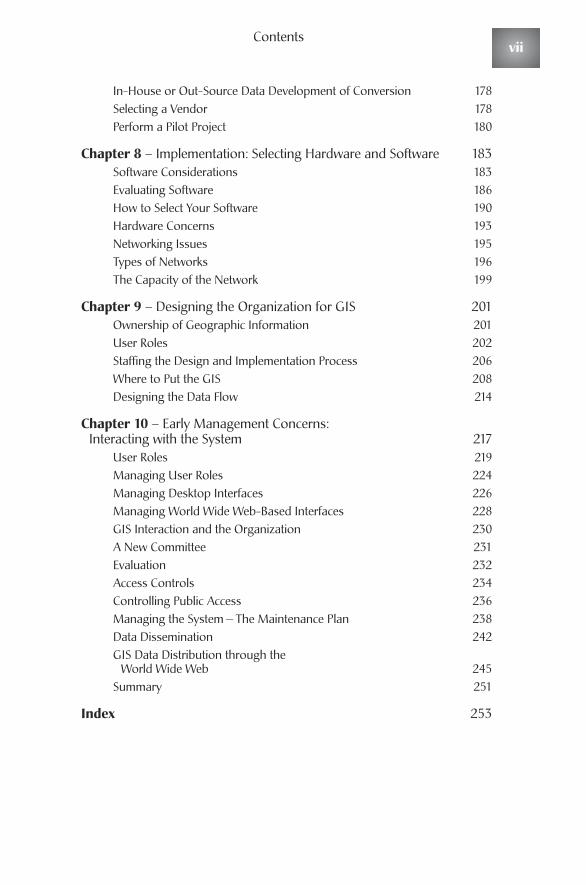
Contents
In-House or Out-Source Data Development of Conversion 178Selecting a Vendor 178Perform a Pilot Project 180
Chapter 8 – Implementation: Selecting Hardware and Software 183Software Considerations 183Evaluating Software 186How to Select Your Software 190Hardware Concerns 193Networking Issues 195Types of Networks 196The Capacity of the Network 199
Chapter 9 – Designing the Organization for GIS 201Ownership of Geographic Information 201User Roles 202Staffing the Design and Implementation Process 206Where to Put the GIS 208Designing the Data Flow 214
Chapter 10 – Early Management Concerns: Interacting with the System 217
User Roles 219Managing User Roles 224Managing Desktop Interfaces 226Managing World Wide Web-Based Interfaces 228GIS Interaction and the Organization 230A New Committee 231Evaluation 232Access Controls 234Controlling Public Access 236Managing the System — The Maintenance Plan 238Data Dissemination 242GIS Data Distribution through the
World Wide Web 245Summary 251
Index 253
vii

ACKNOWLEDGMENTS
viii
GIS is an extremely collaborative activity.Almost at the drop of a hat, GIS profes-sionals will organize a conference, set up a Web-based list server, pull people
together for discounts on training, establish a networking group, and generally dowhat they can to move the community forward.The standards for GIS certification inthe United States, which are being worked out as we complete the manuscript forthis book, explicitly include points for participating in and organizing events thatbenefit the entire community. Collaboration, making your data and documents openand accessible to other users, is what GIS professionals do, and we are proud to be apart of that community. But there is still real value in having a book, somethingbetween covers on the shelves of your office, that you can pull down to help youwork through a problem. It is always interesting to go into the office of a GIS profes-sional and, while making the customary chatter about backgrounds, look around onthe bookshelves. What books did this person deem worthy of holding on to? Arethere books besides software manuals? Which books appear to have been heavilyused, pulled down and opened many times? A bookshelf says a lot about a person. Sowe have taken the opportunity to write a book that we hope will go up on a fewshelves, but we could not have done it without the support of many in the commu-nity. Specifically, they are Gerry Daumiller, Natural Resource Information Center,State of Montana; David Dickman, SBC — Southern New England Telephone; FrankDeSendi, Bureau of Planning and Research, Pennsylvania Department ofTransportation; Kevin Hanron, Charles River Technologies — Crimeinfo; JayHeerman,Address Coordinator, Johnson County, Kansas; Neijel Huff, GIS Intern —Town of West Hartford, Connecticut; David Kingsbury, Intergraph Corporation;Barbara MacFarland, Metropolitan District, Hartford, Connecticut; DonnyMcElveen, Department of Transportation, South Carolina; Jeffrey Osleeb, HunterCollege, CUNY; Martin Roche, Information Technology Director, South CarolinaDepartment of Commerce; Jeffrey Roller, GIS Coordinator,Town of West Hartford,Connecticut.

IntroductionAgeographic information system (GIS) is really nothing special. Like any informa-
tion system, a GIS is an organized accumulation of data and procedures that helppeople make decisions about what to do with things. In a GIS these things have onecharacteristic that makes them at least a little special — their location is an importantpart of what they are.You as a human being are a special thing, but your basic selfdoesn’t change a lot depending on where you are, although some might take issuewith that.You may be one person at work and another at home with your family, butthose are characteristics that differ depending on the role you have adopted, notwhere you are.The role of a parent brings out different characteristics that are notrelated to where you are being a parent but just to the fact that you are acting as aparent. But a parcel of land is completely tied up with where it is; you can’t move itand have it be the same thing.A segment of pavement is where it is, and if you pick itup, move it and disconnect it from other segments of pavement, it becomes some-thing different. People have been constructing GISs to manage and analyze types ofthings for which location matters for almost the last 40 years. In this book we discussand explain the issues of design and implementation of systems that manage this typeof information.
Who Should Read This BookWe have written this book to help practitioners design and implement multiuser,multiunit GISs to assist in their spatial decision-making.These are called corporate orenterprise GISs.We presume that you know what a GIS is, already have some expe-rience with GIS, and have some ideas about what it can do.We also assume you areinterested in improving the design of your existing GIS or building a well-designedsystem that will meet your needs. In our review of the existing material on GIS wefelt that there was a missing piece in an accessible book.There is a lot of informationon design and implementation in hundreds of needs assessments and database docu-mentation files and probably thousands of public and private documents in the handsof organizations and consulting companies that have implemented GISs. But thatinformation is very hard to come by and is usually specifically tailored for the
CHAPTER
1
1
particular application.At the other end of the generality scale, books on relationaldatabase design do not contain information on how to deal with spatial data, the“where” of things, and they usually are aimed at a business market with examplesdrawn from the world of commerce. Knowing how to design an inventory controlor billing information system is a useful exercise, but it doesn’t help a GIS practi-tioner in local government design a database to support planning and zoningactivities. Our goal in this book is to deal explicitly with the issues of spatial datain designing and implementing a GIS and to provide examples useful to the GIScommunity.
People become involved in GIS through all sorts of complex pathways. Somecome to it through a background in civil engineering and computer assisted draft-ing (CAD), whereas others may develop an interest through remote sensing of theenvironment. Many come to GIS from backgrounds that are not technical ormapping related; they just recognize that a GIS might help them do their jobs bet-ter. Others come from backgrounds in planning, geography, public health, survey-ing, property assessing, public safety, indeed from any of the dozens of applicationareas that can benefit from GIS. Because there are so many areas of human activitythat can benefit from GIS, we have taken great care to keep the discussion generalenough to be helpful without focusing on any particular application area. TheHow They Did It sidebars are our attempt to bring in some specific concernsaround data, applications, and software that organizations need to consider. By nomeans do they exhaust the application areas, the data issues, or the softwarerequirements for organization, but they provide some experiential background forthe design and implementation process.
What Is a Geographic Information System?Having said that we assumed you knew what a GIS was before picking up thisbook, we feel an obligation to define it anyway. So, to repeat what has been circu-lating in the information technology (IT) and GIS literature, vendor brochures,countless figures, and PowerPoint slides, a GIS is composed of
◆ People — the users of the system◆ Applications — the processes and programs they use to do their work◆ Data — the information needed to support those applications◆ Software — the core GIS software◆ Hardware — the physical components on which the system runs
Versions of these components of a GIS have been circulating in the literature andvendor brochures for years.They certainly predate GIS specifically and are applic-able to any information system.Although it is common to represent the five ele-ments, or components, in some kind of mandala diagram where everythingappears to be connected to everything else, we do not find that very useful, so wehave added the key relationships. Figure 1.1 should be read as a sentence, and itproceeds from the most important elements to the least important elements.
Introduction2
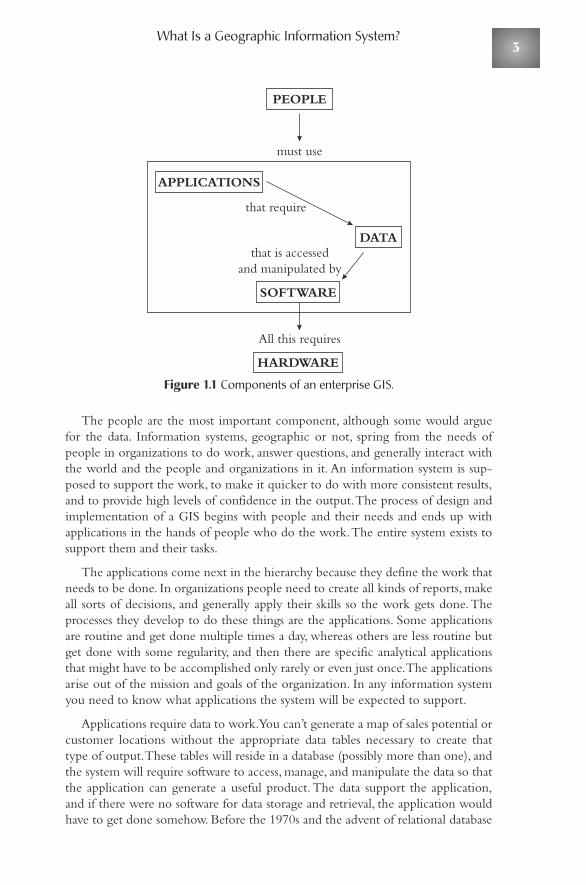
What Is a Geographic Information System?
Figure 1.1 Components of an enterprise GIS.
The people are the most important component, although some would arguefor the data. Information systems, geographic or not, spring from the needs ofpeople in organizations to do work, answer questions, and generally interact withthe world and the people and organizations in it. An information system is sup-posed to support the work, to make it quicker to do with more consistent results,and to provide high levels of confidence in the output.The process of design andimplementation of a GIS begins with people and their needs and ends up withapplications in the hands of people who do the work.The entire system exists tosupport them and their tasks.
The applications come next in the hierarchy because they define the work thatneeds to be done. In organizations people need to create all kinds of reports, makeall sorts of decisions, and generally apply their skills so the work gets done.Theprocesses they develop to do these things are the applications. Some applicationsare routine and get done multiple times a day, whereas others are less routine butget done with some regularity, and then there are specific analytical applicationsthat might have to be accomplished only rarely or even just once.The applicationsarise out of the mission and goals of the organization. In any information systemyou need to know what applications the system will be expected to support.
Applications require data to work.You can’t generate a map of sales potential orcustomer locations without the appropriate data tables necessary to create thattype of output.These tables will reside in a database (possibly more than one), andthe system will require software to access, manage, and manipulate the data so thatthe application can generate a useful product. The data support the application,and if there were no software for data storage and retrieval, the application wouldhave to get done somehow. Before the 1970s and the advent of relational database
PEOPLE
must use
All this requires
APPLICATIONS
DATA
SOFTWARE
HARDWARE
that require
that is accessedand manipulated by
3
management systems (RDBMSs) in business and government, bills got generatedand paid, and locational decisions were made.The process was a little more cum-bersome, but it worked. So an application can work without software so long asthe data are arranged in a useful way.That is why data are more important thansoftware.The triad in the center of Figure 1.1 of applications/data/software repre-sents the core of the information system. Ideally, it should work regardless of whothe people are (if the application is well designed) and be flexible enough to workon whatever innovations in hardware come along, even in the absence of anyhardware.That is why hardware is at the bottom, the least important element ofthe information system.
Corporate or Enterprise GeographicInformation SystemsThe type of GIS we discuss in this book is a corporate, often called enterprise, GIS(Harder 1999;Von Meyer and Oppman 1999). An enterprise GIS is one that isdesigned to meet the needs of multiple users across multiple units in an organiza-tion. Although many organizations have a GIS in one or more units, they havebeen built to support the needs of those units only and may be of little utility toother departments in the organization. It is common to find an organizationwhere a marketing department has one desktop GIS license to support its work,the engineering department has a GIS with CAD at its core, and perhaps otherscattered, lightly or heavily used systems are in different units. There is muchduplication of data and little congruence of the data sets, duplication of applica-tions, variety in standards for the output of the systems, and generally a unit-centric view of GIS and what it can do.
An enterprise GIS is built around an integrated database that supports thefunctions of all units that need spatial processing or even mapping.That database,whether centralized for real-time access by all users or replicated across manycomputers, is the engine of the enterprise GIS. In a well-designed system, users inthe departments where GIS already existed will interact with the GIS in ways thatare not much different from what they had been doing. New users will interactwith the system with custom-designed applications that use the centralized data.The system will no longer be a particular department’s GIS but will be the orga-nization’s GIS.
This kind of corporate, or enterprise, GIS is different from a single-unit or project-oriented GIS in several ways:
◆ Data are standardized and redundancy is reduced. In municipal government,a type of organization that is an excellent candidate for an enterpriseGIS, an assessment of information needs will almost always reveal thatmany different units of the government maintain information onaddresses. But there will be no standardization of address composition;that is, some units may store addresses in a single field of a data table,others break it into street numbers and streets, and a still others might
Introduction4
Corporate or Enterprise Geographic Information Systems
use the address parsing scheme that came with a packaged informationsystem.As a result, there is a lot of duplication and confusion about whatan address is and how to store it.An enterprise GIS for a local govern-ment may have standards and a nonredundant master data table ofaddresses.
◆ Database integrity is maximized. When people start using information andmodifying data in databases, what was once clean and accurate data has away of getting dirty and inaccurate. Names are misspelled, addressesincorrectly recorded, records deleted that should not have been; the listof things that can happen to corrupt data is very long.An enterprise GISwill have safeguards and procedures to minimize that kind of data loss.All organizations run on a supply of accurate and timely information tomake decisions that will move the organization forward, and it should beas good as possible.The progression of data in information systems, GISincluded, has been from databases on mainframe computers maintainedby centralized staff to distributed databases on individual desktop com-puters, and now, full circle, back to central data servers.The data are tooimportant and need careful watching and maintenance.
◆ Units come together through the database. In a complex organization thereare many different departments or units with unique missions and goals.When they come together in the creation of an enterprise GIS, theybecome aware of other units’ needs for information and begin to seetheir own needs in a different light. People in almost all of the organiza-tions that undertake and successfully complete the implementation of anenterprise GIS will speak positively about the benefits to the organiza-tions that go beyond the cost and times savings the GIS might provide.An enterprise GIS database is a gathering point for different units, andhow they come together in its creation and maintenance usually benefitsthe organization in some unexpected ways.
◆ There is a consistent look and feel to output. In the process of design andimplementation of this kind of database it is necessary to set standardsand requirements on what the output from the database will look like.This results in a consistent-appearing output that is usually important totop management.Typically, management does not want any individualunits of the organization looking too much out of step with the others,and an enterprise database with standardized outputs makes uniformitymuch more likely.
◆ Geographic information costs are centralized.A common problem that man-agers encounter when they are building a case for an enterprise GISwithin the organization is that the current costs of obtaining and usinggeographic information are diffused and hidden within the budgets andoperations of many different units.Anyone who tries to conduct a cost-benefit analysis around a GIS discovers this. It is comparatively easy tocalculate the costs of implementation but much more difficult to com-pare those costs to ones presently being incurred. By taking an enter-prise GIS approach, you make the conscious decision that the costs of
5
geographic information should be borne by the entire organization, notthe individual units. Cost centralization with benefit dispersion allowsthe organization to use its resources more effectively
It may sound as though every organization in the world that deals with geo-graphic information would be foolish not to rush right out and develop an enter-prise GIS, but that is not the case. The software vendors and GIS consultantswould probably like all organizations to feel that way, but they won’t. It is largely amatter of size and complexity.Very small water companies that have a small num-ber of wells and provide water service only a few hundred homes will probably getby with a single license of a CAD system and a set of spreadsheets and a desktopdatabase management program.To expect a small company with a staff of five toinvest in multiple software licenses, multiuser database management systems, andall the support those things require is unrealistic. A water utility serving severalhundred thousand accounts across multiple political jurisdictions, though, is aprime candidate for this kind of GIS implementation.
Size and complexity are not necessarily the same thing; some small organiza-tions can be quite complex.This is the case with most municipal governments inwhich there tend to be large numbers of different departments or units, sometimeslightly staffed, that have distinctly different missions. This kind of organization,even though it is not particularly large, may benefit greatly from a well-designedenterprise GIS.
The process of design and implementation of an enterprise GIS is complexand can take up to a year or more depending on the size of the organization andthe amount of geographic data which need to be incorporated. But unlike somecomplex planning processes, this one is relatively straightforward, without manyfeedback loops and decision points.The process consists of a set of one-time stepsthat you need to get through and some continuing steps (see Table 1.1).
One way of thinking of the design and implementation process is to identifythe products that come out of each stage. The needs assessment/requirementsanalysis is discussed in chapter 2, but it should always precede any attempts to pre-pare a strategic plan.The needs assessment will give you an idea of where you are;the strategic plan is an outline to get to where you want to be. Our discussion ofthe second plan, the implementation plan, sometimes comes along with the needsassessment/requirements analysis if the organization is already sure it wants tojump into GIS.We discuss that plan in chapters 7 and 8.The third plan, mainte-nance, is discussed under system management (chapter 10, Managing the Systemthe Maintenance Plan). Those four documents — the three plans and the needsassessment/requirements analysis — are basic for the implementation of a systemthat could take several years and hundreds of thousands of dollars if not more.Additional documents might include cost/benefit analyses, requests for proposals(RFPs) for consulting work, training manuals, data dictionaries, and so on.A com-plex GIS generates a lot of paper and that is a good thing. It means other people,particularly new staff, can quickly come to understand the system, how it wasdeveloped and how it is structured.A GIS where the documentation resides in theheads of one or two key staff people is on very thin ice.
Introduction6

7
Tabl
e 1.
1 St
eps
in th
e D
esig
n an
d Im
plem
enta
tion
Pro
cess
Prim
ary
Out
com
es/
Who
Is In
volv
ed?
Whe
re D
iscu
ssed
St
eps
Cent
ral Q
uest
ions
Prod
ucts
(Sta
ff o
r Co
nsul
tant
s)Se
cond
ary
Goa
lsin
the
Book
?
One
-Tim
e St
eps
Nee
ds a
sses
smen
t/W
hat a
re th
e cu
rren
t and
futu
re
Nee
ds a
sses
smen
t rep
ort.
This
Po
tent
ial u
sers
and
man
- To
bui
ld s
uppo
rt a
t Ch
apte
r 2 –
Nee
dsre
quire
men
ts
need
s fo
r geo
grap
hic
info
rmat
ion?
is
a c
entr
al d
ocum
ent t
o gu
ide
ager
sof u
sing
dep
artm
ents
fr
ont-
line
and
Ass
essm
ent/
anal
ysis
How
do
peop
le c
urre
ntly
use
geo
- th
e im
plem
enta
tion
plan
pha
se.
and
depa
rtm
ents
that
may
m
id-m
anag
emen
t Re
quire
men
ts A
nayl
sis
grap
hic
info
rmat
ion
and
how
wou
ld
late
r bec
ome
user
s.le
vels
.th
ey li
ke to
?
Stra
tegi
c pl
anH
ow w
ill G
IS fu
rthe
r the
mis
sion
of
Stra
tegi
c pl
an, w
ith ro
ugh
time-
Top
and
mid
-lev
el
To b
uild
sup
port
in
Chap
ter 1
– T
he G
IS
the
orga
niza
tion?
How
will
an
ente
r-
tabl
e, a
gree
d up
on b
y al
l sta
ke-
man
agem
ent p
lus
core
to
p m
anag
emen
t.St
rate
gic
Plan
pris
e G
IS fi
t with
in th
e or
gani
zatio
n?ho
lder
s, no
t jus
t top
man
agem
ent.
GIS
com
mitt
ee.
Impl
emen
tatio
n W
hat a
re th
e ph
ased
ste
ps w
e ne
ed
Impl
emen
tatio
n pl
an w
ith
Full
GIS
impl
emen
ta-
Chap
ter 2
– P
ullin
gpl
an
to ta
ke to
impl
emen
t an
ente
rpris
e
deta
iled
timet
able
, inc
ludi
ng a
tio
n co
mm
ittee
with
th
e N
eeds
Tog
ethe
r, G
IS th
at w
ill m
eet o
ur n
eeds
and
de
cisi
on o
n hi
gh-l
evel
des
ign
tech
nica
l sup
port
.Ch
apte
r 7fu
rthe
r our
goa
ls?
ques
tions
.
Des
ign
phas
eW
hat d
ata
tabl
es, f
ield
s, an
d in
itial
D
atab
ase
sche
ma,
dat
a di
ctio
-Te
chni
cal s
taff.
Chap
ters
3, 4
, 5ap
plic
atio
ns a
re re
quire
d to
mee
t na
ry, a
pplic
atio
ns, f
low
cha
rts.
user
nee
ds a
nd h
ow s
houl
d th
ey
be a
rran
ged?
Impl
emen
tatio
n W
hat p
roce
sses
will
we
use
to
GIS
dat
abas
e an
d se
lect
ed
Tech
nica
l sta
ff an
d Ch
apte
rs 6
, 7, 8
phas
epo
pula
te th
e sc
hem
a an
d
appl
icat
ions
.fr
ont-
line
user
s.im
plem
ent t
he in
itial
app
licat
ions
?
Pilo
t pro
ject
Whe
re a
nd w
hen
can
we
test
this
O
utpu
t inf
orm
atio
n fo
r pilo
t Se
lect
ed fr
ont-
line
staf
f To
qui
ckly
sho
w
Chap
ter 7
– P
erfo
rm a
sy
stem
?pr
ojec
t.an
d m
anag
emen
t.ev
eryo
ne, p
artic
ular
ly
Pilo
t Pro
ject
man
agem
ent,
that
it .
will
wor
k
cont
inue
d

8
Tabl
e 1.
1 (c
ontin
ued)
Prim
ary
Out
com
es/
Who
Is In
volv
ed?
Whe
re D
iscu
ssed
St
eps
Cent
ral Q
uest
ions
Prod
ucts
(Sta
ff o
r Co
nsul
tant
s)Se
cond
ary
Goa
lsin
the
Book
?
Cont
inui
ng S
teps
App
licat
ion
How
can
we
add
to th
e ex
istin
g
Upd
ated
pro
cedu
re m
anua
ls.
Tech
nica
l sta
ff w
orki
ng
Conv
inci
ng re
luct
ant
Ch
apte
r 9de
velo
pmen
tse
t of a
pplic
atio
ns a
nd im
prov
e w
ith fr
ont-
line
user
s.us
ers
of th
e sy
stem
’s ex
istin
g on
es?
valu
e.
Mai
nten
ance
and
H
ow w
ill w
e ke
ep th
e da
ta,
Tech
nica
l sta
ff w
ith
Ensu
ring
ongo
ing
Chap
ter 2
– M
aint
enan
ce,
upgr
ade
plan
softw
are
and
hard
war
e cu
rren
t?fr
ont-
line
man
agem
ent.
supp
ort.
Chap
ter 1
0 –
Man
agin
gth
e Sy
stem
– T
he
Mai
nten
ance
Pla
n
Trai
ning
Who
nee
ds w
hat k
ind
of
Tech
nica
l sta
ff an
d sk
illed
Co
nvin
cing
relu
ctan
t Ch
apte
r 2 –
tr
aini
ng in
wha
t app
licat
ions
?us
ers.
user
s of
the
syst
em’s
Trai
ning
valu
e.
Eval
uatio
nA
fter a
reas
onab
le tr
aini
ng a
nd
All
user
s.Co
nvin
cing
top
man
-Ch
apte
r 10
- Ev
alua
tion
wor
king
per
iod,
is it
wor
king
as
agem
ent o
f the
wis
-ad
vert
ised
?do
m o
fthei
r dec
isio
n.
The GIS Strategic Plan
The GIS Strategic PlanStrategic planning is an activity with which most complex, multiunit organiza-tions are familiar. Over time, the organization may have prepared many strategicplans, overall plans around the goals, and specific plans for projects and otherimportant changes the organization has gone through.A strategic plan for GIS istherefore just another working out of a familiar process and should not cause a lotof anxiety, although midlevel management and front-line staff often feel a little putout about participating in yet another planning exercise.A strategic plan for GIS isa document of interest principally to top-level management and outside organiza-tions.Top-level managers needs a document they can refer to when difficult deci-sions need to be made; is this something that fits our strategic plan or not? In someways an important function a strategic plan plays is as a backstop for decisions thatmanagement may have to make.The reason for a positive or negative decision insome area then becomes not “because I said so,” but “because this proposal doesnot mesh well with the strategic plan.”The strategic plan for an enterprise GISshould contain at least the following:
◆ A concrete discussion of how an enterprise GIS fits within the existing missionstatement of the organization. Front-line workers and midlevel manage-ment in any organization cringe when they are asked to contribute todiscussions around the mission statement because they feel, sometimescorrectly, that it bears little relationship to what they do on a daily basis.So the people participating in this GIS strategic planning process need tobe reassured that the purpose is not to rewrite the mission statement butto demonstrate how a GIS would support the existing statement of mis-sion.Top managers in most organizations really believe these are impor-tant documents; to many they represent the condensation to a smallnumber of statements what the organization does and why it does thosethings.
◆ A tentative and light discussion of how GIS is going to fit inside the organiza-tion with a recognition that the design and implementation process may requiremodification of the plan.A GIS strategic planning committee may decidethat creating an entirely separate GIS unit parallel to but separate fromthe existing information technology department is a good idea. In thecourse of design and implementation, however, staff may pick up skills,money may get short, leadership may change, and the recommendationmay change to something else.That could always happen. But allinvolved staff deserve to have an idea of where it is going to fit withinthe organization.
◆ A timetable with checkpoints.A plan without a timetable is a dangerousthing because it gives management no way to monitor progress.Theimplementation process can take more than a year, so there need to becheckpoints along the way to monitor progress.
9

Introduction10
How They Did It — State of South Carolina Strategic Plan forStatewide GIS Technology Coordination
The strategic plan for GIS coordination in the State of South Carolina isa good, if large and complex, example. From the resources available onthe World Wide Web, agendas, minutes, and the documents produced,you can reconstruct at least the official process of this committee. Thecommittee was established by an executive order of the governor. DavidCowan, a university professor, had prepared some principles forstatewide GIS coordination in January 1996, and the committee had itsfirst meeting in July 1997. By January 1998 the committee, which wascomposed of more than 30 people at its height, was beginning theneeds assessment process. A consultant was hired and the second draftof the needs assessment, a 224-page document, was completed by theconsultant in July 2000. The needs assessment looked at state, regional,and local governments; universities; and other stakeholders; in all, morethan a hundred different organizations participated in some way in theneeds assessment. The linkages between the different stakeholders,their missions, and how geographic information was important tomeeting that mission were clearly presented in the needs assessment. Along the way in this process the committee also had to deal with otherissues that just arose, and because they were in place, they becometheir problems. One was the relationship between GIS and thesurveying professions and how that would work out in the SouthCarolina legislature where the committee had to work quickly to ensurethat professionals other than surveyors would be able to work withparcel layers in a GIS. There was also relationship between thecommittee and an existing Statewide Mapping Advisory committee thathad been in place for more than 20 years. The principle focus, however,was on the needs assessment and strategic plan. Throughout the 3-year process the committee went through severaldifferent structures, tried to hire a coordinator, finally found one in amember of the committee, but kept the same consultant during theprocess. Funding was from the good will of 10 state agencies, each ofwhich could find $10,000 for each of 2 years for a $200,000 budget.Virtually all of the money was spent on consulting contracts andexpended over an 18-month period. The committee consulted withsenior GIS staff from all state agencies with GIS capabilities. MartinRoche, who coordinated the committee, estimated it took 10 to15percent of his time over the period, 5 to10 percent of the time of fourother members of a steering committee, and less than 5 percent for theother members of the committee. At around the time of the completionof the draft, the sponsoring governor lost his election, several keysupporters retired, and the new governor appointed a new committee.The committee, though it officially still exists, has been dormant sincethe completion of the plan. This complete draft was completed inJanuary 2001. The strategic plan consists of two separate documents, one of 24 pages(GIS Background and Business Case) and a second of 60 pages

The GIS Strategic Plan
◆ If the implementation is to be phased (i.e., brought into certain units first andlater diffused to the entire organization), those units need to be identified in thestrategic plan. The pilot project will come from one of these early units,and the data layers and applications they need will be the first to bedeveloped, so there needs to be organizationwide understanding of whatthe phasing pattern will be.This may lead to difficult decisions if thereare managers from many units who want to be first, but it can also leadto easy decisions if there are managers from some units who are skepticaland would prefer to come later.
◆ Initial decisions on what existing staff will do in the design and implementationprocess and what functions the organization will hire consultants to do. A feworganizations are able to do the entire process with existing staff, butthese are usually organizations with considerable technical mapping anddatabase experiences (e.g., large utilities). Most will find that a mix of in-house staff work and consultant contracts will provide the best mix ofskills and get the GIS implemented more quickly without taking awaytoo much time from the work that already needed to be done.Thestrategic plan is not the place to detail the RFPs for the consultant por-tions or to choose the consultants, but it is the place for management tocome to agreement over what the mix will be.As part of this, if a GISimplementation committee is going to be a part of the process, thestrategic plan is the place to lay out its makeup and responsibilities.
◆ Some statement of the resources the organization is willing to contribute to theprocess.This should not be a detailed budget at this point but somerecognition of the costs and how the organization plans to pay for them.For large organization such as utilities that cover large territories thetime to implement a GIS may be measured in years and the costs in mil-lions of dollars. Ballpark estimates of the time and financial resourcesneeded should be part of a strategic plan.
That is about it. It sounds simple but can be difficult. Finally, South Carolinanotwithstanding, the plan should not be overly long, and there should be a one-page summary of the entire document as well. Plan for sufficient time to prepare
11
(Strategic Foundation and Work Program). The things that happenedalong the way — loss of key political support, loss of key committeemembers, getting sidetracked on important but ancillary issues — arethings that can happen in any lengthy process and clearly had an effecton South Carolina’s plans. This is probably as complex and lengthy aprocess that one could imagine, but it contains the outline of what anyreasonably complex organization needs to do as it tries to coordinateGIS activities. Currently (May 2002), the plan is “just sitting there due tobudget cuts. It is an ambitious plan and we are hoping forimplementation in the next budget year.” (Martin Roche, personalcommunication)
the strategic plan; it is a critical document for building high-level managementsupport for GIS implementation.
ADDITIONAL READING
Antenucci, J. C., K. Brown, P. L Croswell, M. J. Kevany with H.Archer. 1991,Geographic Information Systems:A Guide to the Technology. Kluwer AcademicPublishers: Dordrecht, Netherlands.
Aronoff, Stanley. 1991. Geographic Information Systems:A Management Perspective.WDL Publications: Ottowa, Canada.
Harder, C. 1999. Enterprise GIS for Energy Companies. Environmental SystemsResearch Institute: Redlands, CA.
Huxhold,W. E., and A.G. Levinsohn. 1995. Managing Geographic InformationSystem Projects. Oxford University Press: New York.
Huxhold,W.E. 1991. An Introduction to Urban Geographic Information Systems.Oxford University Press: New York.
Information Resource Council. 1997–2001.“Geographic Information Systems.”Columbia, SC: Office of Information Resources.state.sc.us/irc/committees/gis/gis.htm.
Korte, G. E. 2001. The GIS Book, 5th ed. Onword Press: New York.
Longley, P.A, M. F. Goodchild, and D.W. Rhind. 2001. Geographic InformationSystems and Science. John Wiley & Sons: New York.
Obermeyer, N. J., and J. K. Pinto. 1994. Managing Geographic Information Systems.The Guilford Press: New York.
Von Meyer, N. R., and R. S. Oppman. 1999. Enterprise GIS. Urban and RegionalInformation Systems Association: Park Ridge, IL.
INTERNET RESOURCES
GIS frequently asked questions:census.gov/geo/www/faq-index.html
Some GIS portal or gateway sites:ciesin.org/gisfaq/gis_gateway.html
directory.google.com/Top/Science/Social_Sciences/Geography/Geographic_Information_Systems/
Introduction12

Before Design: NeedsAssessment andRequirements AnalysisBefore you begin the implementation of a GIS, it is important to establish an
essential groundwork that will make success with the implementation much eas-ier to attain. The following factors need to be planned for in this crucial planningstage:
◆ Making sure that the proper individuals in your organization are involved◆ Educating users ◆ Gaining commitment from management for the implementation◆ Setting realistic expectations of users and management◆ Understanding the needs and requirements of the user base◆ Evaluating existing geographic data that is in use◆ Assessing costs and benefits of the implementation ◆ Developing a strategic plan for implementation
Each of these considerations is discussed in the following sections.
Organizational InvolvementHaving the proper individuals in the organization involved in the process of planningan implementation is a critical first step. One of the most common mistakes in plan-ning the implementation of a GIS is to involve just management-level individuals inthe process. Although managers are very important in the process, it is also equally
CHAPTER
2
13
important to have the staff who work for the managers involved for a number ofreasons. First, staff-level individuals usually have a better understanding of theissues that are dealt with on a daily basis and the accuracies or inaccuracies thatexist in the data they use. Second, staff will likely be more frequent users of thesystem than a manager would be because they typically deal with more of the day-to-day issues that can be solved using GIS than a manager does.Third, because staffwill likely be more frequent users of the system, it is important to start building afeeling of involvement in the decision process early on in the implementation sothat buy-in and acceptance can be achieved as early as possible in the process.Many new technology users often feel that if they are not part of the planningprocess, what is being developed will not work or will not be useful to them. Ifthey are involved in the process, they can provide input to its design, see theirfeedback responded to, and take pride in ownership of the system as it evolves.
An effective way to involve users while still keeping control of the implemen-tation path is to create two groups of users, or committees, that are involved in thedecision process at varying levels. One group would consist of administrators ormanagers (often referred to as an oversight committee) who would be responsiblefor making policy decisions, setting security rights, making budgetary decisions,and rendering the ultimate decisions on the implementation path. The secondgroup would include all of the same people in the first group and more of the endusers of the system.This group would discuss operational issues of the system, dis-cuss problems or issues with the data that are being developed or used, and rec-ommend enhancements that could improve the system’s functionality.
This group will also be very effective at educating other users and increasingthe group’s capabilities as a whole. Often one user will be experiencing a problem,and another user will know how to solve the problem. At each meeting of thisgroup there should also be a designated presenter.A presenter can be a staff mem-ber from within the agency who has just completed a project using the system andcan demonstrate the use of the system. A presenter can also be an invited guestsuch as a consultant, a staff member from a neighboring agency, a GIS coordinatorfrom a utility company that serves the geographic area, or a software vendor.Much can be learned from what others are doing.
One of the other benefits that comes from involving users in this type of acommittee is that it builds support for the system.As users spend more time in theplanning stages of an implementation, they take much more ownership for thesystem. Ownership translates to support for the system. Support at all levels of thesystem is very important to its success. Invite management to these meeting sothey can hear the users talking about what they are going to use the system for orhow they have used it to solve problems. Let top managers hear reports from userswho have seen implementations in other agencies, and they will realize that theircompany is not the only one that is doing something like this.
Another type of presentation can be a recap from a conference. Users who aresent to an off-site user conference or association meeting can be instructed to take
Before Design: Needs Assessment and Requirements Analysis14

Need for Education, Support, and Commitment of Management
notes and then make a presentation to the user group upon their return. Thisallows more users to benefit from the event. It also helps assure that the user whogoes to the conference attends sessions that can be beneficial to the group as well.
In today’s society human nature is to want what others have.There is a tremen-dous amount of competition in the private sector that has been carried over intothe public sector. Competition for economic development purposes is often a dri-ving force behind what makes agencies implement a GIS.With good data aboutitself, an agency can present itself as the place businesses want to come to.Therehave been many stories of where a GIS has been used to promote an agency, andits use has been the deciding factor when a business decides to come to that loca-tion. Learn about these success stories and make sure management is aware ofthem. On the other hand, GIS has also been used quite broadly for predicting theeffects of what would happen if an agency was built out based on its present zon-ing. Build-out analyses have become common ways for communities to look attheir future and make changes to regulations and constraints to assure that thecommunity grows in the ways it wants to. Many agencies do not want to lose theirpresent character, and GIS is an excellent way to visualize and understand whatwill happen if rules and regulations are not changed.
Need for Education, Support, andCommitment of Management — CorporateImplementation Takes TimePlanning a system as complicated as a GIS takes more than just sitting down in aroom and outlining the steps that need to be taken, the data that are needed, andthe software and hardware that need to be purchased.The process of planning asystem starts with the need for a complete education about the capabilities of sys-tems based on present-day and near-term technological advances.There is a needto know what works and what doesn’t, pitfalls that have happened in previousimplementations and how to avoid them, and what can be expected for timeframes and results along the way.This education process can take many years toacquire, but there are a number of ways that this learning curve can be accelerated.
The first way is to visit agencies similar in size, or slightly larger, that havealready implemented a system and see it in action. Ask the users what they like,what they don’t like, what problems they encountered during the implementa-tion, and what they would do differently if they could do it all over again. Don’tjust visit one place; visit a few so that you can get a better understanding of whatthe more common or consistent problems have been.Where the consistent prob-lems don’t exist, find out why.What did that agency do differently that allowed itto circumvent the problems others had? Take notes, especially when you seeunique components that you like or dislike. In addition, encourage other potentialusers, especially those who are skeptical about the implementation, to meet withother agencies that are using the technology in the same roles they perform. Learnfrom other’s mistakes.
15
Another excellent venue for learning about the technology is user conferences.Go to conferences that users who have already implemented a system attend tolearn more about what can be done. Many events have presentations by end usersor consultants who provide solutions in specific areas in which you may be inter-ested.Talk to attendees of previous years’ events to see which conferences are wellattended and get good reviews; attend those events. Most conferences are orga-nized around tracks that are geared to attendees who are just starting a system,have intermediate systems, and have advanced systems. Because you are just start-ing, attend mostly basic presentations, but don’t be afraid to attend an upper-levelsession if the topic seems to fit you very well. Remember, you are planning foryour future, not just what you can do today.
Another excellent source for educating yourself and other users is to inviteconsulting companies to present their approach to planning and implementingsystems. Experienced consultants usually have very good presentations puttogether for these types of educational talks and often have multiple systems thatthey have developed for other agencies available for demonstration purposes.Another option is to visit the consulting companies’ offices to see the differentprojects they are working on during the development process. Ask them toexplain what and how they are doing on the project on which they are working.Again, learn from others to avoid mistakes.
Manage Users’ Expectations —No Unrealistic PromisesAnother important issue to deal with early on in the planning stage of an imple-mentation is to manage the expectations of the users. Implementing a system takestime. Most well-planned, well-executed implementations take 2 to 3 years beforethey reach a mature level.What is important in the design stage is to design intothe plan a series of milestones along the way so that success can be achieved anddemonstrated.As departments are brought on line, it is important to provide smallachievements along the way that will continue to build support. A good rule ofthumb is to have at least one new function added to the system every othermonth. Many implementations fail because users’ expectations are set so high atthe onset of the project that when the goals are not met, they lose interest. Ifmonths and even years can go by without showing any new progress, supportdwindles. Support takes a long time to build but is very easy to lose whenpromises are made that are unrealistic and cannot be met.
Needs Assessment/Requirements AnalysisA GIS is a very complex system that is composed of business processes, data, peo-ple, software, and hardware.The most critical stage of implementing a system is theplanning stage. The first step in this stage is what is commonly referred to as aneeds assessment.As the name infers, a needs assessment is a process in which youdetermine what all of the needs are for the users of the system. This includes
Before Design: Needs Assessment and Requirements Analysis16
Assessing the Current Users
determining the users who will benefit from the technology and which functionsthey perform will benefit the most, the applications of the technology in thesefunctions, the data that will be needed to support these applications, the mostappropriate software to support these applications using this data, and the hard-ware that will be required to support the system.
Performing a needs assessment can be a very time-consuming process and canresult in erroneous results if not done in a systematic way.To understand how toplan for a system one must understand how systems have evolved in recent years.In the past, GISs were often started in a single department or division of anagency, and as these implementations progressed, a member of the user groupacquired general knowledge of the technology, and this person became the cham-pion of the system.The champion developed what was necessary to support theneeds of his or her department, and the resulting systems were often very focusedaround this department’s processes. Many systems failed because the champion ofthe system left the agency or was too busy with other duties to properly maintainthe system, and it languished. In addition, the total needs and benefits of otherdepartments in the agency were often not met because of the system’s departmen-tal focus.
In some cases, after success was had in this department, other departmentswould join in on the implementation, and it’s use would grow department bydepartment. Because this was more of a random than a systematic approach, itwould work, but the implementation was not often the most cost-effectiveapproach, and much time and money was often wasted. The following sectionsdescribe how one can plan to implement a system. There are many ways toapproach this process, and this is just one way that success has been achieved.
Assessing the Current UsersThe single most important component of the system that must be assessed is theusers of the system. Because of the breadth of the processes that can be automatedwith this technology, there are many types of users who may touch or use the sys-tem over time.The most critical component of determining where to start is todetermine which users will get the most value from the system.There are two pri-mary classifications of users who can benefit from GIS technology. The first isusers who are already using some sort of mapping in their day-to-day functions.These users are usually fairly easy to find because they are surrounded by somesort of hard-copy maps already. Assessors have tax maps, engineers have designplans, planners have zoning and land use maps, conservationists have wetlands andsoils maps, and public safety staff have district, beat, or zone maps. Each of theseusers can benefit from the technology by automating these maps and makingthem more consistent and accessible.
The second classification of users can be much harder to identify. These arethose who can use the technology to solve a problem,but the final output may notbe a map.An example of this is routing inspections for an inspector.The technol-ogy can determine how to most efficiently get from one inspection to the next,
17
and then the next, and so on, but the result may be printed directions, not anactual map.
To identify these users you must review their processes and determine whetherthere is a spatial component to what they do and then determine if GIS can beused to automate the process. Another example of such an application is docu-ment retrieval. Many departments have index cards or paper sketches of featuresthat they retrieve based on an account number or some other type of identifier.These documents can be scanned and organized by linking them to a geographicfeature with which they are associated, and GIS technology can then be used toretrieve the scanned version of the document once the associated feature isselected.
An efficient way to determine both of these needs is to first educate the usersabout all of the different basic functions that a GIS can perform. Once they areeducated, the functions they perform and the amount of time they spend per-forming each function can be documented.These functions can then be analyzedand classified into different types of potential applications, whether or not map-ping is used in the function and whether or not there is a spatial component to thedecisions they are making.
Categorizing UsersOnce the departments that will benefit from the technology are established, thenext step in the process is to assess the people who use the system.The most effi-cient way to analyze the potential users and plan for their needs is to classify theminto a series of groupings that are determined by the type of functions they per-form in their regular work duties. Each user category must be well defined so thatthe applications, supporting data, and user interfaces that will be designed willsupport the functions that they perform. Care must be taken to develop groupingsthat will result in applications that provide all the capabilities necessary to supportthese roles without providing overfunctionality that will be confusing and notneeded by other categories of users.The following sections describe typical usercategories and the typical functions they perform. This section on users relatesdirectly to what people are doing overall with geographic information right now.Later, in the early management phases of the GIS, you can assign particular rolesthat relate to how they will use the new database.
Director, Head, or ManagerA director, head, or manager is typically an end-user of the products and informa-tion created by other users of the system. Reporting and visualization of the datain the system is most important to this classification of a user. He or she is inter-ested in knowing how many tasks have been completed, how much money hasbeen taken in, or what the status of an activity is at any point in time. In manycases this person is not an actual user of the system; he or she asks questions of asubordinate, and the answers are provided.
Before Design: Needs Assessment and Requirements Analysis18
Categorizing Users
The most efficient way to determine what functionality is required for this useris to review existing periodic reports such as weekly, monthly, or quarterly reportsthat this individual uses and determine whether the system can reproduce thesame results.
Professional-Level or Technical StaffThose at a professional or technical level typically perform technical reviews ofactivities based on their specialized expertise. A few examples of these types ofusers are engineers, planners, and scientists.These users usually need full access toall of the details of an activity and are typically responsible for performing techni-cal reviews of activities to ascertain whether or not the activity is in conformancewith the appropriate rules or regulations. In larger organizations these users do nottypically input the details of an activity; they use the information provided by asubordinate. They are responsible for assuring that the appropriate reviews havebeen performed and the status of the activity is current.The details of activitiessuch as date information, testing results, and measurements are usually very criticalto this user. In addition they need to be able to query historic data, generate sum-mary reports, and perform comparative analysis for use in defense of decisionsthey make.
The most efficient way to determine what functionality is required for theseusers is to review existing reports and checklists used and generated by them anddetermine whether the system can track the information used and generate areport containing the same information upon completion.
Administrative StaffAdministrative staffers are some of the most important users of a system. Theseusers are the ones that are typically going to spend more time inputting andmanipulating the data in the system and generating the reports needed for the staffthey support.They need full access to perform data entry and data manipulationand to generate reports and maps.
The most efficient way to determine what functionality is required for theseusers is to review existing letters, mailing labels, file folders, maps, and reports gen-erated by them in the current process and determine whether the system can assistthem in the process. In addition it is important to review whether or not theinformation that is input by these users can later help the processes performed byany of the previously discussed users.Automating these processes can actually addtime to the short-term process, but the benefits would then be seen in the overallprocess.
External Professionals (Engineers, Architects,Attorneys, Developers)External professionals are a group of end-users who by nature will become expertend-users of a system like this.They will become experts because of the frequency
19
at which they use the system.They are typically highly educated and knowledge-able of the process, able to interact with local government officials, and want toperform this function as efficiently as possible; therefore, they will to gravitatetoward access to and use of systems like this.
They will want the ability to input data into the system themselves rather thanfill out paper forms.They will require searching capabilities to review past activi-ties and reporting capabilities to print out what they have found and the informa-tion they have put in. They will want electronic submittal of applications andsupporting documents to help reduce costs to themselves and their clients.
The most efficient way to determine what functionality is required for theseusers is to review existing applications they have completed using the presentprocess and determine whether the system reproduces this process.
The use of the Internet or an in-office kiosk terminal can be of significant ben-efit to an agency in this process. It is often overlooked that if a data entry system isput online, the data entry process typically performed by the administrative staff isnow virtually eliminated. Rather than entering the data themselves, now all theadministrative staff needs to do is validate and verify that the data are complete andaccurate. Furthermore, much of this validation and verification can be handled bythe system itself. The use of pick-lists, fast matching, data validation, and othertypes of technology can have significant positive effects on the process of imple-menting a system.
CitizensThe final class of users is the citizens, or the general public.These are users that asindividuals have an extremely low usage rate for a system such as this, but as agroup, as a whole, they are significant consumers of the technology. They oftenhave needs that are very focused and limited and very reproducible. For this user,if access is provided, a simple and logical interface is needed because these usersmay only use the system very infrequently.
Other Factors with UsersA number of other factors should also be taken into consideration when assessingthe needs of the users, including their frequency of use, level of computer profi-ciency, and receptiveness to change.
Frequency of UseThe users of a GIS can be broken down into four major types based of the func-tion they will perform with respect to the system itself. These categories aredescribed in the following list. Each defines the role that a user will play in the sys-tem and the level of expertise that they will need to have with the technology.
Before Design: Needs Assessment and Requirements Analysis20
Applications
◆ Data maintainer. Maintains the data layers and associated attributes in the system. Because these people perform the data maintenance, theytypically have a high level of expertise with the technology.Training forthese users typically includes intensive technical coursework.
◆ Data owner. A user or department that is responsible for a data layer. Inmost cases this user is the same as a data maintainer, but in some cases adata owner may be a different user.An example is when an agency has aGIS coordinator who is responsible for making physical changes to alldata layers, but other departments are actually responsible for what thecontent of the layer is.
◆ Power user. Use GIS on a regular basis to perform day-to-day functions.These people usually have a high level of technical understanding of GISapplications as they pertain to their department or their industry.
◆ Occasional user. Uses the system to perform basic review and query func-tions.This user typically just queries the system for basic information,does not typically perform advanced analysis with the system, and onlyhas a basic understanding of GIS.
Computer ProficiencyNot only is it necessary to identify and classify the users of the system based on thefunctions they perform, it is also important to further classify the users as to theircomputer proficiency. It is very common for agencies to be planning an imple-mentation of a GIS from what is presently a paper-based system. Staff memberswho may be presently performing the functions in the paper-based system mayhave little to no computer experience and may initially resist the change.Anothercommon issue is that the present staff may be using a more text-based type systemand may have little to no Microsoft Windows experience. It is important to iden-tify these issues up front and provide proper basic training if necessary.
ApplicationsThe next important step in the needs assessment process is to determine whichfunctions within the business processes that are going to automated can benefitfrom GIS technology.The definition of an application can take on two primaryforms with respect to GIS technology. In the first, GIS is the core technology usedfor the solution to provide spatial analysis.Typical examples of these types of appli-cations are tools that use GIS to answer the following questions:
◆ What exists at or near a particular location?◆ Where are all of the places where this exists?◆ What geographic areas meet the following criteria?◆ What has changed in this area or region over time?
21
◆ What spatial patterns exist?◆ If we where to do this, what would the result be?
The following are a few examples of specific types of applications or functions thatare solved by answering the above questions.
View, Locate, and Query DataViewing, locating, and querying data are the most generic of GIS applications.Almost everyone who uses GIS is interested in viewing some type of mappinginformation.The users need to perform functions such as finding a certain parcel,finding where all features of a certain type are, drawing features with different col-ors or symbols, or finding records in a database and then seeing where all of thesefeatures are on a map.
Complaint TrackingA complaint-tracking application automates the process of taking a call or com-plaint from a concerned citizen or business owner in an agency, forwarding thecall to the appropriate department or departments, and notifying, inspecting, cit-ing violations, and tracking the actions taken in response to this call. Dependingupon the department, complaints can come in many forms, and they often beginin the wrong department.The application should allow for any department’s staffmember to see any complaint and any actions taken by other departments.Thesecomplaints and actions can then be viewed in a mapped form to look for spatialpatterns.
Mailing List Generation Mailing list generation is more of a tool than an application.This tool should havethe capability of creating a mailing list to be used to either create mailing labels instandard formats or to use in form letters. As an example, all properties within acertain distance of a subject property, a water line, or a roadway can be determinedand their addresses fed into a form letter and used to create mailing labels.A cus-tomized mailing list can be created for the whole agency, for a select geographicarea, or for properties, customers, or potential customers meeting certain criteria.
Address Matching (Pin Mapping)Various databases and paper documents contain information relating to a propertylocation.These database records and/or documents can be linked to a building orparcel by their street or mailing address.The result of this linking can be a point atthe middle of a building or parcel. It may also result in a map with shaded build-ings or parcels by which records match. If an agency lacks an accurate base map,low-cost street centerline files can be purchased that contain associated addressranges on the left and right sides of the roads, and these ranges can be used togeocode the points that you wish to map to perform basic spatial analysis.
Before Design: Needs Assessment and Requirements Analysis22
Applications
Maintenance Tracking and Inventory Maintenance is performed routinely on both the indoor and outdoor componentsof facilities and properties throughout an agency. During this process, many formsare filled out, creating an inventory of many attributes of the features that need tobe tracked by various departments. Even without the forms, maintenance of prop-erties can be tracked in a database linked to the property, provided that property ismapped. On occasion, descriptive information relating to these structures ischanged due to repairs or replacements.This application allows the input of manycharacteristics of these features using on-screen form menus, and then analysis canbe performed on this data to help schedule more effective maintenance programs,systematic repairs, or efficient total replacement.
Incident Mapping and TrackingOften departments deal with situations that don’t necessarily involve permittingor complaints but are related to an emergency or other unforeseen events. GIS canbe used to zoom to where an incident occurs, point to where it happened, createa new point of where it happened, or add a record to the database that stores thebuilding, property, street segment, or other GIS mapping feature.A form will dis-play on the screen, allowing the user to enter information pertaining to the inci-dent, along with the name of the caller, name of person taking the call, and theresolution. Emergency management services departments can then respond to theincident in the most efficient manner using a routing application, and once theyarrive on the scene, they can locate the facilities they need to support the incidentusing the technology. Fire departments in urban areas use this type of applicationfor response and need to know where the closest fire hydrants are when they getthere. In rural areas the fire department may need to know where the closest pondor swimming pool is. GIS is also commonly used by public safety officers to ana-lyze patterns of occurrences over time to help solve repetitive crimes or betterplan and dispatch officers based on the past history of events.
Routing ApplicationsA routing application allows someone to plan the most efficient way to get tomultiple locations in the most efficient manner. The simplest example of this is Web-based direction sites such as Mapquest.com that allow you to determinethe most efficient way to get from one location to another. A more advancedexample would be a routing package that allows a school system to plan the mostefficient route to pick up all of the third and fourth graders and get them to schoolon time.
PermittingPermitting processes and systems are carried out by many agencies, and the func-tions within these process can benefit greatly from enhancement with GIS. Someexamples of how GIS can be used in this application are as follows:
23
◆ Check distance from proposed structure to other features such as prop-erty lines, setbacks, wetlands
◆ Map where all building permits have been issued this month, quarter,or year
◆ Map all places where a specific contractor is doing work in the agency◆ Map where all inspections are for this week by inspector◆ Calculate fastest route to get to each inspection◆ Verify zoning of a parcel◆ Generate mailing labels and abutter’s notification letters for all parcels
within 250 ft of a parcel in less than 1 minute◆ Map all septic failures that have occurred this year◆ Calculate distance to nearest day care center or residential zone from a
specific parcel
The second definition of a GIS application is when GIS acts as the integrationtechnology that helps store and retrieve information based on where it physicallyis located. One of the most difficult problems to solve in an integration project isidentifying what common characteristic can be used to store and retrieve infor-mation in one or more systems. GIS allows the integrator to use the physical loca-tion of the feature as a method of storing and retrieving the appropriate piece ofinformation. A few examples of systems that are in place in many governmentagencies where GIS can be beneficial as an integration technology are as follows:
◆ Computer aided mass appraisal (CAMA)◆ Enterprise resource planning and financial (ERP)◆ Permitting◆ Document management or imaging◆ Computer aided dispatch and records management (CAD/RMS)◆ Computer aided design and drafting (CADD)◆ Complaint tracking◆ Customer relationship management (CRM)
Data are one of, if not the most, important component of a GIS system.Threeprimary types of data comprise a GIS: spatial data or layers, attribute data, and doc-uments or images. Determining which of these items should be included in a sys-tem, how accurate they should be, how complete they need to be, what order theyshould be created in, and how they should be created are all of the questions thatneed to be answered. Let’s try to answer each of these questions one at a time.
Evaluating Existing DataThe first decision that needs to be made is which layers need to be created to sup-port the system.This is most easily accomplished by first inventorying what layers
Before Design: Needs Assessment and Requirements Analysis24
Evaluating Existing Data
are in use in an agency.Table 2.1 is a typical list of layers that are used by a localgovernment agency to perform their duties. Table 2.2 shows the 13 departmentsthat were expected to have some GIS use in this community and the 33 existingpaper and digital databases that contain geographic information. Due to spaceconstraints we can show only a partial set of each in further tables. This entire listcan be given to each department, and each department can then be asked to rankeach of the data layers based on its frequency of use. For example, in a typicalranking system layers that are used multiple times a day could be given a factor of10, layers used multiple times a week could be given a factor of 5, layers used oncea week a factor of 3, layers used once a month a factor of 2, and those used only acouple of times a year, a factor of 1. All of these factors are then summed for alldepartments, and a total usage ranking can be calculated for each layer.The layerscan then be sorted from top to bottom, from high to low rankings, where layershaving the highest total ranking would be used more frequently by all depart-ments, and layers having a lower factor would be used less frequently.The results ofthis analysis can formulate the priority order in which layers should be automatedto provide the highest level of usage to the most users (see Table 2.3). The oneproblem with this type of analysis is that it does not take into account the value orrelative importance that a layer can provide. For example, evacuation zones are alayer that is not used very frequently, and this analysis would confirm this, butwhen this type of a layer is needed, its importance can greatly outweigh its usagerate. Careful consideration has to be given to each and every layer to make surethat these types of factors are taken into account.
Table 2.1 Data Layer List
Features Layer (Point, Line, Polygon) Description
Annotation Miscellaneous text shown on amap
Rights of way (easements) Boundaries of an area owned byone party with limited rights toothers
Parcels Boundaries of a contiguous pieceof land in the possession of anowner
Topography (10-ft contours within Lines representing a prescribed regional watershed) increment of elevation change
Topography (2-ft contours Lines representing a prescribed within town limits) increment of elevation change
Building footprints Perimeter of exterior of a buildingfoundation
Sidewalks Boundaries of sidewalks
Town line Boundary of an area owned by amunicipality
continued
25
Table 2.1 (Continued)
Features Layer (Point, Line, Polygon) Description
Wetlands Boundary of an area designated asa wetland by a regulating agency
Walls Stone walls, barbed wire fences,retaining walls, etc.
Zoning Boundaries of zoning areas
Recreational areas Athletic fields, golf courses, parks
Edge of driveway Edge of paved or unpaved, gravel,or dirt driveways
Land use Boundaries of land use areas
Trees vegetation (> 0.5 Acre) Boundaries of trees and/or vegetation areas
Hydrographic Features Canals, marshes, piers/docks,dams, lakes, reservoirs, rivers,streams, creeks
Edge of pavement Edge of a paved roadway
Utility pole and towers A structure that holds or supportsa utility line
Census boundaries (demographics) Boundaries of census tract orblock groups
Ponds Boundaries of stagnant waterwithout or with a small outlet
Roadway intersections Graphical point depicting whereroad centerlines intersect
Utilities, gas Graphical representation of naturalgas distribution system
Railroad Railroad tracks or yards
Storm drainage system Graphical representation of stormsewer collection system
Swimming pools Graphical representation of publicand private pools
Traffic features Signals, streetlights, signs
Water supply system Graphical representation of waterdistribution system
Drainage features Floodwalls, headwalls
Flood zones Boundaries of the edge of floodwaters in varying flood frequencies
Protected open space (public & private) Boundaries of protected openspace areas
Before Design: Needs Assessment and Requirements Analysis26
Evaluating Existing Data
Table 2.1 (Continued)
Features Layer (Point, Line, Polygon) Description
Sanitary sewer systems Graphical representation of sani-tary sewer collection system
Street centerlines Graphical representation of thecenter of a street
Bridge Graphical representation of thestructure of a bridge
Channel encroachment Boundaries of restricted areasalong navigable waters
Miscellaneous structures Above-ground tanks and othermisc. structures
Groundwater recharge areas Boundaries of a groundwaterrecharge areas
IRA map layer of police zones Graphical representation of policezones
Residential wells A hole or shaft in the ground usedto provide drinking or irrigationwater
Wellhead protection areas Boundaries of protected areasaround surface water wells
Groundwater protection overlay district Boundaries of a groundwater pro-tection overlay district areas
Soils Boundaries of differentiating soiltypes
Surface drainage areas Boundaries of areas that drain tostorm drainage structures
Utilities, cable Graphical representation of cabletelevision distribution system
Utilities, electric Graphical representation of electri-cal power distribution system
Curbing locations/types Graphical representation of curb-ing material types
Groundwater aquifer Boundaries of a ground wateraquifer areas
Paved aprons Driveway area between the frontof sidewalk and edge of pavement
Plowing/sanding routes Lines depicting routes followed byplows and sand trucks
Public transportation (bus routes) Lines depicting regular routes thatbuses travel
continued
27
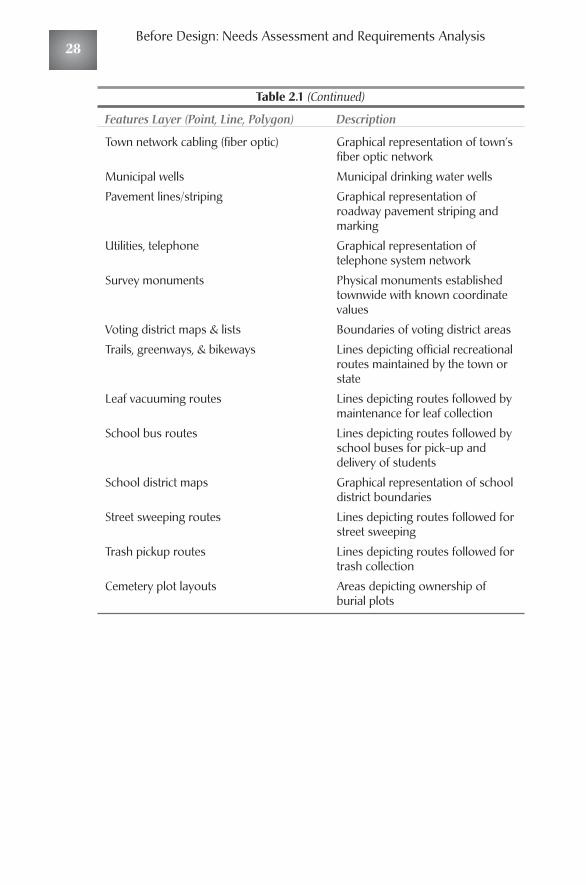
Table 2.1 (Continued)
Features Layer (Point, Line, Polygon) Description
Town network cabling (fiber optic) Graphical representation of town’sfiber optic network
Municipal wells Municipal drinking water wells
Pavement lines/striping Graphical representation of roadway pavement striping andmarking
Utilities, telephone Graphical representation of telephone system network
Survey monuments Physical monuments establishedtownwide with known coordinatevalues
Voting district maps & lists Boundaries of voting district areas
Trails, greenways, & bikeways Lines depicting official recreationalroutes maintained by the town orstate
Leaf vacuuming routes Lines depicting routes followed bymaintenance for leaf collection
School bus routes Lines depicting routes followed byschool buses for pick-up anddelivery of students
School district maps Graphical representation of schooldistrict boundaries
Street sweeping routes Lines depicting routes followed forstreet sweeping
Trash pickup routes Lines depicting routes followed fortrash collection
Cemetery plot layouts Areas depicting ownership of burial plots
Before Design: Needs Assessment and Requirements Analysis28
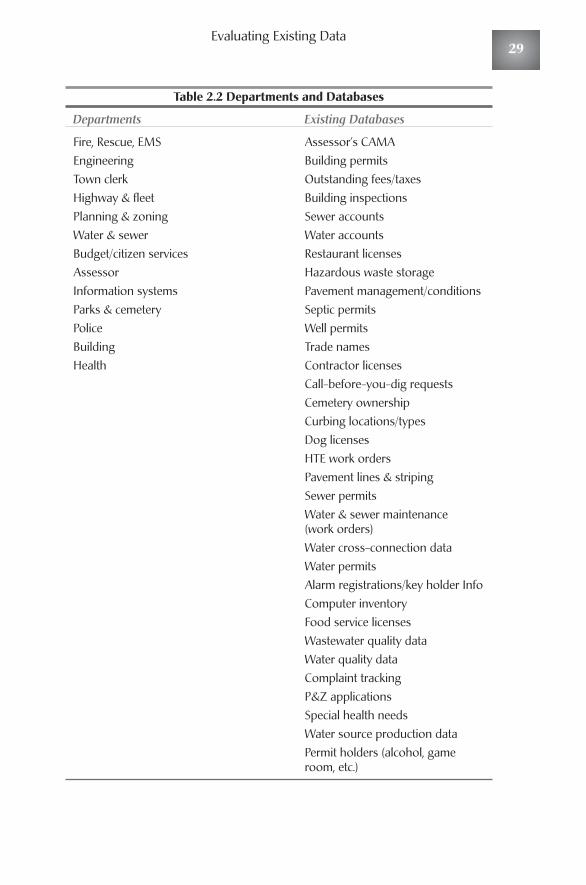
Evaluating Existing Data
Table 2.2 Departments and Databases
Departments Existing Databases
Fire, Rescue, EMS Assessor’s CAMAEngineering Building permitsTown clerk Outstanding fees/taxesHighway & fleet Building inspectionsPlanning & zoning Sewer accountsWater & sewer Water accountsBudget/citizen services Restaurant licensesAssessor Hazardous waste storageInformation systems Pavement management/conditionsParks & cemetery Septic permitsPolice Well permitsBuilding Trade namesHealth Contractor licenses
Call-before-you-dig requestsCemetery ownershipCurbing locations/typesDog licensesHTE work ordersPavement lines & stripingSewer permitsWater & sewer maintenance (work orders)Water cross-connection dataWater permitsAlarm registrations/key holder InfoComputer inventoryFood service licensesWastewater quality data Water quality data Complaint trackingP&Z applicationsSpecial health needsWater source production dataPermit holders (alcohol, gameroom, etc.)
29
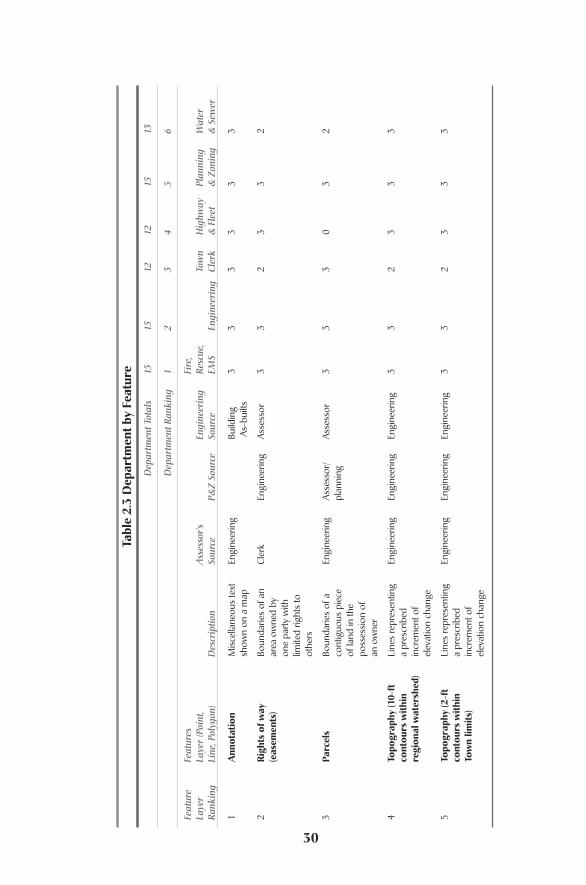
30
Tabl
e 2.
3 D
epar
tmen
t by
Feat
ure
Dep
artm
ent T
otal
s15
1512
1215
13
Dep
artm
ent R
anki
ng1
23
45
6
Feat
ure
Fe
atur
es
Fire
,La
yer
Laye
r (P
oint
,A
sses
sor’s
En
gine
erin
g R
escu
e,To
wn
Hig
hway
Plan
ning
Wat
er
Ran
king
Line
, Pol
ygon
)D
escr
iptio
nSo
urce
P&Z
Sou
rce
Sour
ceEM
SEn
gine
erin
gCl
erk
& F
leet
& Z
onin
g&
Sew
er
1A
nnot
atio
nM
isce
llane
ous
text
En
gine
erin
gBu
ildin
g3
33
33
3sh
own
on a
map
As-
built
s
2R
ight
s of
way
Bo
unda
ries
of a
n Cl
erk
Engi
neer
ing
Ass
esso
r3
32
33
2(e
asem
ents
)ar
ea o
wne
d by
on
e pa
rty
with
lim
ited
right
s to
ot
hers
3Pa
rcel
sBo
unda
ries
of a
En
gine
erin
gA
sses
sor/
Ass
esso
r3
33
03
2co
ntig
uous
pie
ce
plan
ning
of la
nd in
the
poss
essi
on o
fan
ow
ner
4To
pogr
aphy
(10-
ft
Line
s re
pres
entin
g En
gine
erin
gEn
gine
erin
gEn
gine
erin
g3
32
33
3co
ntou
rs w
ithi
n a
pres
crib
ed
regi
onal
wat
ersh
ed)
incr
emen
t of
elev
atio
n ch
ange
5To
pogr
aphy
(2-f
t Li
nes
repr
esen
ting
Engi
neer
ing
Engi
neer
ing
Engi
neer
ing
33
23
33
cont
ours
wit
hin
a pr
escr
ibed
To
wn
limit
s)in
crem
ent o
f el
evat
ion
chan
ge
Evaluating Existing Data31
Another factor that this analysis helps determine is which departments wouldhave higher usage rates of the system. If you now total the rankings given to alllayers by department and sort this ranking from high to low (left to right on thischart), you can determine the more frequent users of the system. Departmentslisted on the upper left portion of this matrix are those that will use the system themost, and those listed to the right will be less-frequent users.
Two other factors that should be inventoried as part of this analysis includewhich department is responsible for the layer and which department maintains thelayer. Often agencies have a central department that performs mapping updates,whereas another department actually is responsible for the content of the map. Forexample, the assessor is usually the department that is responsible for the contentof the tax maps an agency uses, but often another department, such as engineer-ing, may perform the actual updates because engineers are proficient with draftingtechniques or a CAD program.These relationships will be important to the designof the maintenance strategy of a GIS program.
The next factor that is documented is the source that will be used for theautomation. Again, there are often multiple departments within an agency thatmay have different copies of the same type of mapping.The assessor may have taxmaps that show features that are pertinent to the assessing function, and engineer-ing or building may have another set for tracking house address assignments. It isimportant to document all versions of these maps and more importantly to docu-ment the differences between each so that critical features or attributes are notmissed in the system.
The final factors that should be developed as part of this matrix are the meth-ods that should be used to automate the layer and the frequency at which mainte-nance should be performed. The methods used for automation are discussed inchapter 7, Data Development and Conversion Plan, and maintenance frequenciesare discussed later in this chapter.
The matrix in Table 2.4 is a summary of the same type of process used to ana-lyze database systems that is in use in an agency and can be tied into using GIS.The same type of a ranking approach can be used to analyze the frequency ofusage of typical databases in a GIS.Again, databases receiving the highest rankingswill be used the most by the end users of the system, and the departments receiv-ing the highest total rank will be the most frequent users of the system. Only asmall set of the 33 database systems and the 13 departments are shown.
In addition to factors similar to layers such as source and methodology, thereare a number of other critical aspects that need to be determined for a database.Connect to is the description of the spatial feature that the database would beconnected to for retrieval. Many times there are multiple features that these attrib-utes would be connected to for retrieval based on the application in which it willbe used.Archive years is the duration or time period for which historic data needto be tracked. Some attributes are only as important in their present state, whereasfor others, complete, historic data are important.
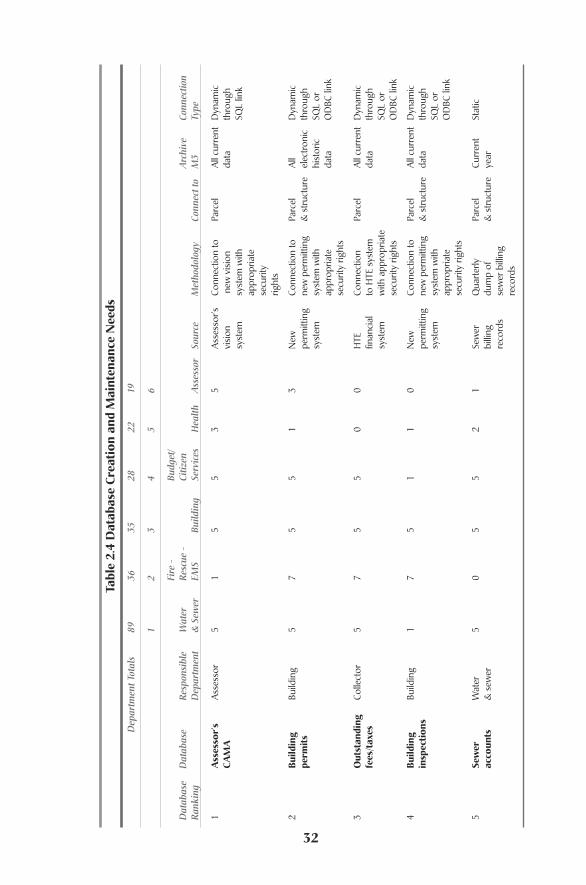
32
Tabl
e 2.
4 D
atab
ase
Crea
tion
and
Mai
nten
ance
Nee
ds
Dep
artm
ent T
otal
s89
3635
2822
19
12
34
56
Fire
-
Budg
et/
Dat
abas
eD
atab
ase
Res
pons
ible
Wat
erR
escu
e -
Citiz
en
Arc
hive
Conn
ectio
nR
anki
ngD
epar
tmen
t&
Sew
erEM
SBu
ildin
gSe
rvic
esH
ealth
Ass
esso
rSo
urce
Met
hodo
logy
Conn
ect t
oM
3Ty
pe
1A
sses
sor’
s A
sses
sor
51
55
35
Ass
esso
r’s
Conn
ectio
n to
Parc
elA
ll cu
rren
t D
ynam
ic
CAM
Avi
sion
ne
w v
isio
n da
tath
roug
h sy
stem
syst
em w
ith
SQL
link
appr
opria
te
secu
rity
right
s
2Bu
ildin
g Bu
ildin
g5
75
51
3N
ew
Conn
ectio
n to
Pa
rcel
A
ll D
ynam
ic
perm
its
perm
ittin
g ne
w p
erm
ittin
g &
str
uctu
reel
ectr
onic
th
roug
h sy
stem
syst
em w
ith
hist
oric
SQ
L or
ap
prop
riate
da
taO
DBC
link
secu
rity
right
s
3O
utst
andi
ng
Colle
ctor
57
55
00
HTE
Co
nnec
tion
Parc
elA
ll cu
rren
t D
ynam
ic
fees
/tax
esfin
anci
al
to H
TE s
yste
m
data
thro
ugh
syst
emw
ith a
ppro
pria
te
SQL
or
secu
rity
right
sO
DBC
link
4Bu
ildin
g Bu
ildin
g1
75
11
0N
ew
Conn
ectio
n to
Pa
rcel
A
ll cu
rren
t D
ynam
ic
insp
ecti
ons
perm
ittin
g ne
w p
erm
ittin
g &
str
uctu
reda
tath
roug
h sy
stem
syst
em w
ith
SQL
or
appr
opria
te
OD
BC li
nkse
curit
y rig
hts
5Se
wer
W
ater
5
05
52
1Se
wer
Q
uart
erly
Pa
rcel
Cu
rren
t St
atic
ac
coun
ts&
sew
erbi
lling
du
mp
of
& s
truc
ture
year
reco
rds
sew
er b
illin
g re
cord
s
Completeness
The final factor that is important to a database is the type of connection thatwill be made to the spatial feature. Historically, the most common connections arestatic dumps of data where a snapshot in time is taken and the data are convertedand linked to the spatial feature. In recent years it has become more common fordatabases to be tied into in a more live manner using either Structured QueryLanguage (SQL) connections or open data base connectivity (ODBC).
Table 2.5 shows the final data analysis for documents or scanned images thatcould be tied into from the system. Just like the last two analyses, documents areinventoried and ranked based on usage, sorted, and comparatively ranked by theirtotal anticipated usage. Departments are again ranked by their overall usage rank-ings and the sources of the images are documented.With documents, a few addi-tional factors should also be determined. The total quantity of documents isimportant for estimating the cost or effort for conversion of the documents intothe system, and go-back-years, similar to archive-years in databases are importantto determine how critical the historic version of this document is.
Three major ways to handle historic data are typically found with documents.The first is that all historic documents, such as land records, are important andshould be included. In this case all of the historic data need to be converted,indexed, and included in the system.The second is that only a certain period oftime is critical for the users of the system, such as 3 to 5 years’ worth of historicdata. Finally, go forward means that historic data are not that important or may betoo cost-prohibitive to convert, and only new documents or recently accesseddocuments, going forward, will be collected an input into the system.
AccuracyThe accuracy required for any GIS layer can also be another complex factor tocalculate because as the accuracy of a data layer is increased, the cost or time ittakes to automate a layer also goes up, usually not in a linear manner.The difficultdecision is to determine what is the appropriate accuracy to develop to. It is veryeasy to say that the accuracy that a data layer should be developed to should equalthe highest level of accuracy that any one department needs. If cost were not anissue, this would be the appropriate approach.The recommended approach is toperform a standard return-on-investment study and determine whether thehigher level of accuracy justifies itself over a 5- to 10-year period. Accuracy is fur-ther discussed in the section in chapter 4 “Accuracy, Precision and Completeness.”
CompletenessCompleteness is the final factor that needs to be considered when performing anassessment on the data to be included in a GIS. Again, striving for 100 percentcomplete data, in an ideal world, is an easy goal to set but a very difficult one toachieve. Again, balance has to be considered to determine where the return oninvestment lies with respect to the usage rate of the data. In addition, it is also
33
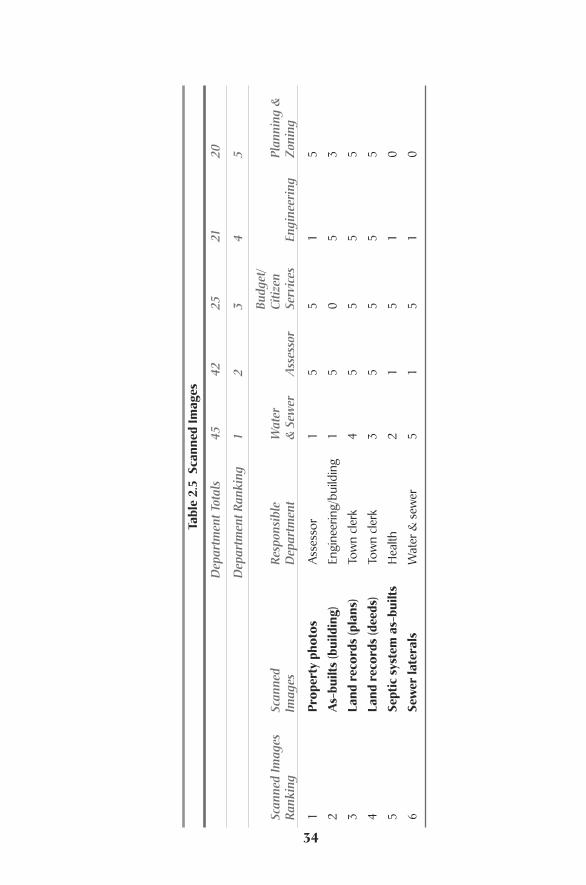
34
Tabl
e 2.
5 S
cann
ed Im
ages
Dep
artm
ent T
otal
s45
4225
2120
Dep
artm
ent R
anki
ng1
23
45
Budg
et/
Scan
ned
Imag
esSc
anne
dR
espo
nsib
leW
ater
Citiz
en
Plan
ning
&
Ran
king
Imag
esD
epar
tmen
t&
Sew
erA
sses
sor
Serv
ices
Engi
neer
ing
Zon
ing
1Pr
oper
ty p
hoto
sA
sses
sor
15
51
5
2A
s-bu
ilts
(bui
ldin
g)En
gine
erin
g/bu
ildin
g1
50
53
3La
nd r
ecor
ds (p
lans
)To
wn
cler
k4
55
55
4La
nd r
ecor
ds (d
eeds
)To
wn
cler
k3
55
55
5Se
ptic
sys
tem
as-
built
sH
ealth
21
51
0
6Se
wer
late
rals
Wat
er &
sew
er5
15
10
Maintenance
important to determine what the potential liability would be if the data were lessthan 100 percent complete.
MaintenanceThe maintenance of the data in a GIS is one of the most important aspects ofensuring continued success of the system, the mapping features being the mostimportant part of the data. It is imperative that these features be updated on a reg-ular basis to maintain the integrity and accuracy of the mapping in any system.Without proper maintenance, other departments that use the mapping in a GISwould soon lose confidence in the information provided by the mapping.The endresult would be a product that no longer performs its function as a foundation fora GIS.The development of a maintenance plan after implementation is discussedlater in the book
Frequency of UpdatesAnother important consideration for maintaining the data in the system is the fre-quency of updates for each of the data elements in the system.The most commondefinitions of the frequencies of typical update cycles and when they are used areas follows:
◆ Semi-monthly. This type of update is planned for data layers that have thehighest level of importance in the system.These data layers change quiteoften, and their changes are considered to be critical to decisions thatwill be made with the system.A typical example of this is a parcel base.Attribute data such as change of ownership, change of definition (subdi-vision, lot splits, or combinations), and/or improvement in accuracy(new surveys being filed) are also critical.These layers are also the onesthat the highest number of departments have use for or depend on.
◆ Monthly. These layers still have a high level of importance, but typicallythey do not change as frequently as the previous layers.Typically the fea-tures on these layers take longer to construct (such as building foot-prints) and require an official approval or as-built to be filed before anupdate can be completed or accepted.
◆ Quarterly. These layers are those that change on a much less-frequentbasis than the previous two types.They typically require a formalapproval and acceptance by a department or commission and acceptancebefore they can be updated.The higher level of frequency does not jus-tify the cost of maintaining multiple layers of each type that areapproved, pending, and in the application process.
◆ Annual. These layers are typically used for planning applications. Streetsweeping, snow plowing, and school bus routes are examples of layersthat require a considerable amount of planning before they are defined,but once they are defined, they do not change very often throughout the year.
35
◆ As outside source updates. These layers are created and maintained by anoutside source. Once they are created, they are not often updated bythese agencies; therefore there is no need to update them unlesschanged. Examples of these are FEMA flood plains, soil type definitions,and public transportation routes.
Software SelectionThere are a number of factors or considerations that one should take into accountwhen selecting a GIS software product.
System ComponentsThe first and foremost factor that should drive the selection of a software productis the business processes that the product performs. Bells and whistles will oftenmake you want a product, but the core functions that you perform are the ones thatshould be looked at first.A good rule of thumb is that if you look to automate theprocesses that you spend 80 percent of your time on, you will only spend 20 per-cent of the money that you would spend to automate the remaining 20 percent.
Ease of UseThe next most important factor is the ease of use of the product.This is twofold.Beginning users should be able to pick up the product and easily work throughfunctions with the use of wizards, but expert users should be able to navigatethrough the product in a more efficient manner.The best products on the markethave both novice and expert modes that allow you to switch over as your profi-ciency with the product increases.
If the product is modular in structure, each module should have the same lookand feel so that once users learn the first module, they can make an easy transitionto another module.The best way to fully understand how easy a product is to useis to talk to both new users and users who have been using it for a long time andconsider themselves experts.
Product SupportAnother important consideration for a product is how the parent company pro-vides technical support. Is it something that is included with the product? Is it freefor a period of time? Good technical support groups are made up of good quali-fied technical support people. Good people cost money, so be leery of free techni-cal support.
Another consideration with support is the different avenues that are providedfor support. Email,Web site, phone, and on-site support are all options. Be awareof the company’s location, what time zone it is in, and what hours, in your timezone, it provides support. If you are trying to get that report out for a meeting thatnight, is support going to be available? How about that morning?
Before Design: Needs Assessment and Requirements Analysis36
Technical Environment
TrainingTraining is another important consideration. Who does the training? Does thecompany have dedicated training staff or do it send out sales people or developers?How much training comes with the software product? The most successful train-ing programs are designed around a two-phased training program.The first phaseis a complete course that introduces the users to all aspects of the product. Aftertaking the course, the users return to work and are given phone support to workthrough any daily issues they come across.After 2 to 3 months the users receive asecond course.This course is usually designed around specific questions developedby the users and supplemented with more advanced topics developed by theinstructor.
Product MaintenanceThe final consideration is product maintenance, which consists of the way thecompany handles bug fixes and new releases of the software product.Ask the com-pany how often it puts out bug fixes, and how many it has put out in the last year.If it is too often, less than once a quarter, and the product is relatively new, therecould be problems with the product. If the fixes seem far apart, only twice a year,and the users say the product is buggy, the company may not have enough devel-opers on staff. It’s a delicate balance.
Technical EnvironmentOperating SystemAnother consideration for any of the product solutions is the operating systemsthat they support.Virtually every software product supports 32-bit environmentssuch as Windows NT, 2000, or XP, but some of the systems do not support older16-bit environments such as Windows 95 or 98.This can be an important consid-eration if you are using older hardware and you don’t have a replacement budget.Web-based solutions are becoming more and more popular these days because themajority of the applications that can developed using Web technology will func-tion independent of the end-users operating system. Using this type of anapproach, 16- or 32-bit systems are no longer a barrier, and applications can bedeveloped and used on many older computers without having to invest significantamounts of money for new infrastructure.
Network EnvironmentA network environment is an essential component for any GIS solution today.Thequestion isn’t whether or not there should be a network; the main considerationin this area should be the speed of the network that the system requires. Systemsbased on MS-Access technology require, at a minimum, 100 baseT networkspeeds, whereas systems that are Web based or use a client server (Oracle or MS-SQL Server) can run very efficiently on 10 baseT networks. For a smaller agency,a MS-Access system can be successfully implemented on the slower network, but
37
for larger municipalities, a MS-Access solution can only be effectively deployed iftechnology like Citrix or Terminal Server is used.
The end of a needs assessment is the time to select software and examine othertechnical requirements; at the beginning you may not know all your needs,and certain software is better at supporting certain needs. Software selection andsome of the other technical issues of implementation are discussed further in alater section
Database ConsiderationsThe final area that should be considered is the back-end database that is used withthe system.The most commonly used back ends are MS-Access, MS-SQL Server,and Oracle. MS-C.V. Access-based systems require the minimum amount ofexpertise at the end-user site, and need for expertise increases as you transcend toSQL-Server and then to Oracle. Care should be taken to appropriately size thesystem based on the number of users, the number of transactions, and the level ofexpertise at the end-user site. Database selection may be constrained by existingdatabases in use by the organization, and you should certainly select your databasesoftware before you begin the design phase for the GIS data because there aredesign considerations specific to different database software systems.
Assessing Costs and BenefitsThe costs and benefits of implementing a GIS system has been one of the mostwidely asked and debated questions when planning the implementation of a sys-tem.This question has been a difficult one to answer because of the relative new-ness of the technology and the lack of concrete facts and statistics on which tobase the analysis. Luckily, in recent years more concrete data have begun to emergethat can be applied to some of the applications of the technology.The followingdiscussion describes the process that one can go through to perform this type ofanalysis and concludes with some facts and figures that have been found that maybe useful to an organization in this process.
Predicting the costs for implementing a system is a relatively straightforwardprocess. Because many systems have been implemented to date, an abundance ofinformation is available about the cost of building system components.There aretwo primary breakdowns to the costs that are associated with implementing a sys-tem: initial and recurring costs. Fundamental initial costs are easily identifiable andare composed of the initial capital outlays that must be made to plan the system,develop the data to support the system, purchase the hardware and software nec-essary to support the system, and provide initial training to the users. There is animportant fact that is often overlooked when identifying these costs, especially inthe data area. Statistics have shown that approximately 80 percent of the cost ofimplementing a system are typically accounted for by the cost to develop the datain the system. Often this data would have been developed whether or not a GISwas implemented. For example, traditionally many government agencies woulddevelop base mapping for capital improvement projects they are performing to use
Before Design: Needs Assessment and Requirements Analysis38

Assessing Costs and Benefits
for engineering design or survey and construction documents.These costs wouldbe incurred regardless of whether the data are developed in a GIS format. For thepurposes of the cost and benefits analysis it is important to identify only the dif-ference in cost that is incurred because the data are developed for use in a GIS, notthe total cost to develop the data. Another example is tax mapping. Parcel basecreation is one of the higher cost in a systems implementation, yet often tax map-ping and tax mapping maintenance is already being performed in the agency.Again, for the purposes of the analysis, only the difference in cost should beaccounted for, not necessarily the total cost.
Recurring costs are those that are incurred repetitively over time such as main-tenance costs, staff salaries, possibly some data costs, and training costs.The samerule applies to these costs. If maintenance of a data layer was already occurring,only part of this cost, the increase due to GIS, should be accounted for in theanalysis.The addition of a new staff person such as a GIS coordinator should beaccounted for in its entirety, but if existing staff who were already performing datamaintenance functions, are retrained to perform these same functions in the GIS,their costs are offset, not additive. Often, once created, efficiency is gained byimplementing the system, and the actual cost to maintain the data in a centralizedlocation can reduce the effort to maintain the data in the future. Therefore, themaintenance of a GIS can actual be a positive return, not a cost.
A very basic, yet fundamental example of this is an owner name change. Astudy was done in a municipal agency recently where the amount of time that wasspent changing records in computer programs, databases, and hard-copy docu-ments every time a new owner moved into town or changed a name wasaccounted for.The municipality had a population of approximately 21,000 people,and it was estimated that 3,000 individual changes to names took place each year.There are 26 departments in this municipality, and prior to implementing system,20 people in these departments made a change in some document, spreadsheet, ordatabase. Each change took approximately 5 minutes to make on average. If youdo the math, one owner change accounted for 100 minutes of staff time, and in alla total 5,000 staff hours, or 2.8 staff years, were spent changing names.The designwas to implement a system where one person now changed the name, and othersused this name for their purpose from a centralized GIS.The one person now onlyspends 250 hours annually making this change, and 4,750 hours of staff time isgained on an annual basis. This community on average has a high rate of namechanges, but experience has shown that virtually every agency has this type ofredundancy in many of its systems including accounting, permitting, and taxation.
This leads into a discussion on the typical benefits that can be gained fromimplementing a system such as a GIS.Two major classifications of benefits can beachieved from implementing a system: quantitative and qualitative. Quantitativebenefits are those like the previous one in which an exact quantity of time, effort,or cost can be derived from the analysis. Some other examples of quantitative ben-efits are as follows.
A medium-size municipality in northeastern Massachusetts implemented aparcel-based GIS as part of the revaluation process. When a link was made
39
between its CAMA system and the tax maps, a number of inaccuracies in the datain their CAMA system were found, including properties that were not beingtaxed, properties with significant errors in the land area they were being taxed on,and physical features such as sheds and pools that were not accounted for becausethe owner had built them without a permit. The GIS was used to analyze andcompare the mapping data to the assessment data and $200,000 a year in addi-tional tax revenue was found due to the application of GIS.
Another medium-size municipality in the greater Boston area has imple-mented a Web-based GIS system to give citizens, attorneys, and real estate profes-sionals access to data such as owner and parcel information, tax assessmentinformation, comparable sales data, and basic mapping. After implementing thesystem, the municipality had a significant decrease in counter traffic, reducing stafftime by 400 to 500 hours per year due to the lack of need of answering questionsand processing walk-up requests.
A relatively small municipality in central Connecticut, population 12,500,recently implemented a GIS system to automate its sewer, water, and parcel infor-mation. One of the applications developed was designed to link the water andsewer account billing system to the parcel base. Once linked a comparison was runbetween accounts that have received sewer and water assessment charges that werewithin the sewer and water district and accounts that were also being billed userfees. A significant number of properties were found that were not ever billedassessment fees, but should have been, as well as a significant number of accountsthat where not being billed annual fees, yet should be.The end result of the pro-ject was that a one-time revenue of $26,000 was realized from assessment fees, andan increase of approximately $6,500 per year was realized from annual service fees.
To perform a cost-benefits analysis, one of the key factors in applying some ofthis data is to make sure that the data are all standardized to a consistent unit oftime. For example, recurring costs and benefits, by definition, repeat themselves ona year-to-year basis. Initial costs are a one-time expense. If the life of a one-timecost covers a 5-year period, this cost must be spread out over the 5-year periodeven if it must be paid for over 2 or 3 years. In addition the costs of some of theinitial expenditures, like data development and hardware and software purchases,often still have a valley at the end of their life period, so standard depreciation cal-culations should be applied to the component because it is an asset of the agency.
To summarize, quantitative benefits are those that are measurable or quantifi-able. Typical quantitative benefits are reductions in staff time to perform a task,decreased operating costs, increased revenue, cost avoidances, and cost reductions.
The second category of benefits that can be seen from implementing a GIS isqualitative. Qualitative benefits allow people to make better decisions, decreaseuncertainty with an issue, or improve the image or services that are provided.These benefits are extremely difficult, if not impossible, to put a value on. No onewould argue that having better information available to make a decision is not abenefit, but the only way to quantify that benefit is to first not have the informa-tion available, make a mistake, and then have to in some way pay for that mistake.Providing better public service is also considered a benefit to some, but not all, so
Before Design: Needs Assessment and Requirements Analysis40

Pulling the Needs Together
putting a measurable value on it is difficult. Other examples of both quantitativeand qualitative benefits include the following:
◆ Effort to produce maps by manual means was greater than total cost ofmaking identical maps using GIS: quantitative benefit
◆ Use of GIS allows garbage and recycling collection efforts to be reducedthrough better scheduling of collection routes: quantitative benefit
◆ Emergency vehicles reduce average arrival time by using GIS: both ◆ Information from GIS was used to avoid lawsuit in land ownership case:
qualitative benefit◆ Board of Education finds a better location for a new school through use
of GIS: qualitative benefit
Pulling the Needs TogetherThe final stage of a needs assessment is to pull all of the components of the systemtogether into a phased approach and develop an implementation plan.The needsassessment portion of the project can be considered the wish list for an imple-mentation, and the implementation plan can be considered the do list.The strate-gic implementation plan includes a number of fundamental components such asthe following:
◆ Data development plan◆ Application development plan◆ Staffing and management plan◆ Training plan◆ Hardware and software acquisition plan◆ Financial projection plan◆ Schedule
As described, the needs assessment constitutes a wish list, meaning that all theidentified needs are addressed, regardless of cost or priority. Implementation plan-ning attaches costs and priorities to the needs. Factors that affect the costs andpriorities need to be analyzed, available budgets and time constraints must be con-sidered, and a realistic strategy must be developed.
The following charts summarize the priorities of applications, data, and depart-ments in the system design. Table 2.6 summarizes which departments will usewhich applications and what type of a solution will need to be developed for eachapplication. Only 5 of the 13 departments are shown.
Table 2.7 summarizes what data layers will be required to support each of theapplications that will be developed. Only 10 of the 60 data layers are shown.Table 2.8 depicts which databases (10 of 30 shown) will be required for each ofthe applications, and Table 2.9 depicts which of the imaging sources will be used
41
by each of the applications. These summary tables combined with the previousmatrices are the complete summary of what applications need to be done first;what spatial data, attribute data, and imaging data are required for each; whatmethods should be used to produce the desired results; and which departmentsshould be included first.These combined with a detailed schedule that includesdependencies between the applications, data sets, training dates, staff additions, andhardware and software acquisitions constitute the complete implementation strat-egy. The only remaining piece is the budget, which is a derivative of the abovedocuments.
Although the final needs assessment will contain quite a bit of text, these tablesare the core of a needs assessment. The example followed was for local govern-ment, but the process fits any multidepartment organization with several applica-tions and databases that require geographic information.
ADDITIONAL READING
In books and journals there is little material on how to conduct needs assessments;there are many statements about how important they are, however. Accordingly,the additional resources we suggest here are Web links and, as with all Web links,we can make no guarantee that they will still be there when you need more infor-mation. But a Web search on a good search engine should regenerate a similar listat any time with not too much effort.
INTERNET RESOURCES
Usually has links to recent needs assessments conducted by different organiza-tions, guidelines for developing RFPs, and so on:tenlinks.com/MapGIS/reference/best_practice/needsassess.htm
More guidelines for developing a needs assessment RFP:archives.nysed.gov/services/local-gov/RFP.htm
The New York State Archives and Records Administration working with theNational Center for Geographic Information produced a series of documentsto help local governments in New York state implement GIS:archives.nysed.gov/pubs/gis/needs.htm
The Nature Conservancy’s needs assessment workbook. This organization has aWeb-based enterprise GIS program as well:gis.tnc.org/knowledge/capacity/needs_wkb.php
We have chosen not to list completed needs assessments of organizations thathave placed them on the Web for fear that they will not stay there long. Nor havewe included the many examples of needs assessments that consulting firms haveplaced on the Web as demonstrations of the projects they do. Before the WorldWide Web people circulated copies of needs assessments through personal net-works, but today there is no shortage of samples you can read for ideas on how toconduct one.
Before Design: Needs Assessment and Requirements Analysis42
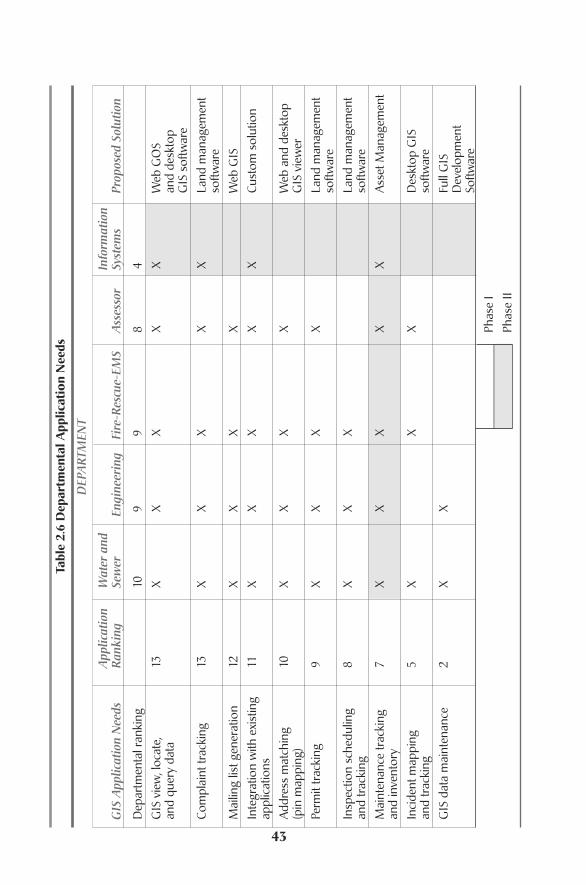
43
Tabl
e 2.
6 D
epar
tmen
tal A
pplic
atio
n N
eeds
DEP
ART
MEN
T
App
licat
ion
Wat
er a
nd
Info
rmat
ion
GIS
App
licat
ion
Nee
dsR
anki
ngSe
wer
Engi
neer
ing
Fire
-Res
cue-
EMS
Ass
esso
rSy
stem
sPr
opos
ed S
olut
ion
Dep
artm
enta
l ran
king
109
98
4G
IS v
iew
, loc
ate,
13
XX
XX
XW
eb G
OS
and
quer
y da
taan
d de
skto
p G
IS s
oftw
are
Com
plai
nt tr
acki
ng13
XX
XX
XLa
nd m
anag
emen
t so
ftwar
eM
ailin
g lis
t gen
erat
ion
12X
XX
XW
eb G
ISIn
tegr
atio
n w
ith e
xist
ing
11X
XX
XX
Cust
om s
olut
ion
appl
icat
ions
Add
ress
mat
chin
g 10
XX
XX
Web
and
des
ktop
(p
in m
appi
ng)
GIS
vie
wer
Perm
it tr
acki
ng9
XX
XX
Land
man
agem
ent
softw
are
Insp
ectio
n sc
hedu
ling
8X
XX
Land
man
agem
ent
and
trac
king
softw
are
Mai
nten
ance
trac
king
7
XX
XX
XA
sset
Man
agem
ent
and
inve
ntor
yIn
cide
nt m
appi
ng
5X
XX
Des
ktop
GIS
an
d tr
acki
ngso
ftwar
eG
IS d
ata
mai
nten
ance
2X
XFu
ll G
IS
Dev
elop
men
t So
ftwar
e__
____
____
____
Phas
e I
____
____
____
__Ph
ase
II

44
Tabl
e 2.
7 D
ata
Nee
ds
DAT
A L
AYER
S
Rig
hts
of w
ayTo
pogr
aphy
To
pogr
aphy
Bu
ildin
g A
nnot
atio
n(E
asem
ents
)Pa
rcel
s(1
0 ft
. Con
tour
s)(2
-ft C
onto
urs)
Foot
prin
tsSi
dew
alks
Tow
n Li
neW
etla
nds
Wel
ls
Feat
ure
laye
r ran
king
s28
2827
2424
2321
2121
20
GIS
vie
w, l
ocat
e,
XX
XX
XX
XX
XX
and
quer
y da
ta
Com
plai
nt tr
acki
ngX
XX
XX
XX
XX
Mai
ling
list g
ener
atio
nX
XX
XX
XX
Inte
grat
ion
with
exi
stin
g X
appl
icat
ions
Add
ress
mat
chin
g X
XX
XX
XX
X(p
in m
appi
ng)
Perm
it tr
acki
ngX
XX
XX
XX
Insp
ectio
n sc
hedu
ling
XX
XX
Xan
d tr
acki
ng
Mai
nten
ance
trac
king
X
XX
XX
Xan
d in
vent
ory
Inci
dent
map
ping
X
XX
XX
XX
Xan
d tr
acki
ng
GIS
dat
a m
aint
enan
ceX
XX
XX
XX
XX
X
Phas
e I
Phas
e II
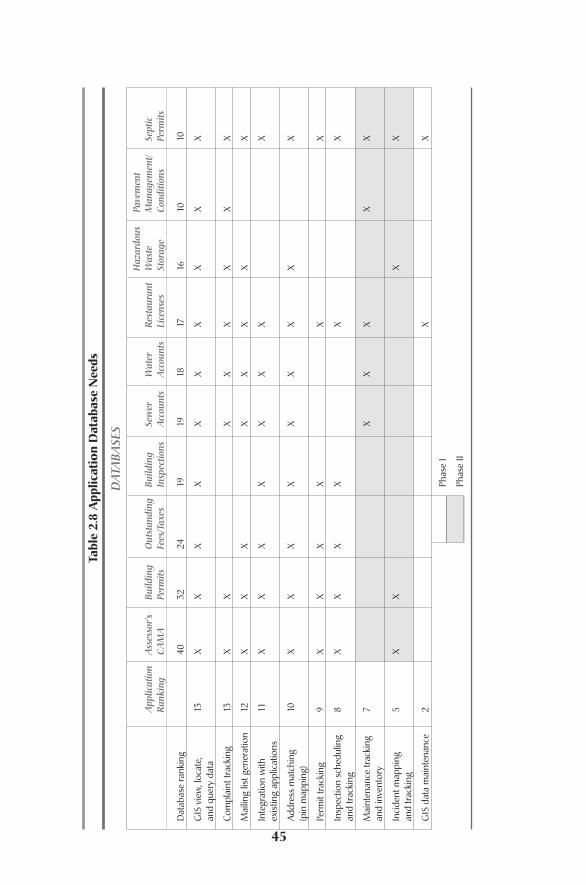
45
Tabl
e 2.
8 A
pplic
atio
n D
atab
ase
Nee
ds
DAT
ABA
SES
Haz
ardo
us
Pave
men
tA
pplic
atio
nA
sses
sor’s
Bu
ildin
gO
utst
andi
ngBu
ildin
gSe
wer
Wat
erR
esta
uran
tW
aste
M
anag
emen
t/Se
ptic
Ran
king
CA
MA
Perm
itsFe
es/T
axes
Insp
ectio
nsA
ccou
nts
Acc
ount
sLi
cens
esSt
orag
eCo
nditi
ons
Perm
its
Dat
abas
e ra
nkin
g40
3224
1919
1817
1610
10
GIS
vie
w, l
ocat
e,
13X
XX
XX
XX
XX
Xan
d qu
ery
data
Com
plai
nt tr
acki
ng13
XX
XX
XX
XX
Mai
ling
list g
ener
atio
n12
XX
XX
XX
XX
Inte
grat
ion
with
11
XX
XX
XX
XX
exis
ting
appl
icat
ions
Add
ress
mat
chin
g 10
XX
XX
XX
XX
X(p
in m
appi
ng)
Perm
it tr
acki
ng9
XX
XX
XX
Insp
ectio
n sc
hedu
ling
8X
XX
XX
Xan
d tr
acki
ng
Mai
nten
ance
trac
king
7
XX
XX
Xan
d in
vent
ory
Inci
dent
map
ping
5
XX
XX
and
trac
king
GIS
dat
a m
aint
enan
ce2
XX
____
____
__Ph
ase
I
____
____
__Ph
ase
II
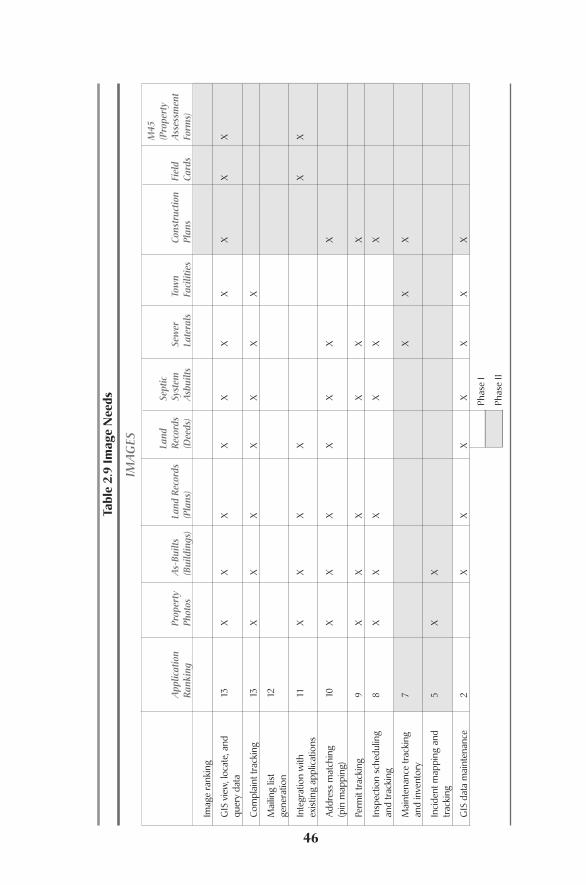
46
Tabl
e 2.
9 Im
age
Nee
ds
IMA
GES
M45
La
ndSe
ptic
(Pro
pert
y A
pplic
atio
nPr
oper
ty
As-
Built
sLa
nd R
ecor
dsR
ecor
dsSy
stem
Sew
erTo
wn
Cons
truc
tion
Fiel
dA
sses
smen
t R
anki
ngPh
otos
(Bui
ldin
gs)
(Pla
ns)
(Dee
ds)
Asb
uilts
Late
rals
Faci
litie
sPl
ans
Card
sFo
rms)
Imag
e ra
nkin
g
GIS
vie
w, l
ocat
e, a
nd
13X
XX
XX
XX
XX
Xqu
ery
data
Com
plai
nt tr
acki
ng13
XX
XX
XX
X
Mai
ling
list
12ge
nera
tion
Inte
grat
ion
with
11
XX
XX
XX
exis
ting
appl
icat
ions
Add
ress
mat
chin
g 10
XX
XX
XX
X(p
in m
appi
ng)
Perm
it tr
acki
ng9
XX
XX
XX
Insp
ectio
n sc
hedu
ling
8X
XX
XX
Xan
d tr
acki
ng
Mai
nten
ance
trac
king
7
XX
Xan
d in
vent
ory
Inci
dent
map
ping
and
5
XX
trac
king
GIS
dat
a m
aint
enan
ce2
XX
XX
XX
X
____
____
Phas
e I
____
____
Phas
e II
Designing the GISDatabase SchemaDatabase designers use the word schema to refer to the diagram and documents
that lay out the structure of the database and the relationships that exist betweenelements of the database.A schema is like a blueprint for a database that tells a knowl-edgeable builder exactly how to construct it. Naturally, designers spend a lot of timethinking about the schema.This work comes before worrying too much about theexact content of tables and even before design concerns for the spatial data. Rushinginto building a database without laying out your schema is like trying to build ahouse without a set of plans; it might stand up for a while, but it will not be as usefulas it could be.
The tools that assist in the construction of these schema are called computerassisted software engineering (CASE) tools.These same tools are used to design thestructure of complex computer programs as well as databases, and most programmersknow how to use them. Many in the GIS world do not, but it is usually possible todesign your database with paper and pencil, and some database designers still workthis way.The ability to erase entire tables, delete relationships, add relationships, and soon, is sometimes easier with pencil and paper or on a whiteboard than mastering anew set of tools. One of the problems with GIS is that it appears to force you todevelop areas of specialization and skill that you didn’t have before. Sometimes it justtakes too long to learn the new tools, so feel free to use simpler ones you have mas-tered instead of new tools that do basically the same thing.
Elements of a SchemaA schema at its simplest consists of an arrangement of tables and the relationshipsbetween them. Because organizations differ so widely in the kind of work they doand the types of data they need to do this work, it is impossible to provide a cook-book schema for every application. Software vendors that have many users of a par-ticular sort, however, have constructed template database schema that can be
CHAPTER
3
47
customized. But even the task of customizing an existing schema in a complexorganization that is planning to construct a large geographic database that inte-grates most of its existing data and incorporating new data tables into that schemaought to be done by highly skilled database administrators and designers. From theperspective of the users of the geographic data, who may be a minority of the totalset of users, it is important that your geographic feature tables be correctly linkedto the other tables you need to do your jobs. Schemas for organizations such aselectric or gas utilities can take up many square feet of paper and hundreds ofpages of documentation, and it is not our intention to outline that process or runthrough an example like that here. Rather, our focus is to ensure that you knowwhat a schema is, why its construction is important, and how to provide input andfeedback to those who are designing the entire system.
Designers of schema may be strict or loose constructionists.A strict construc-tionist designer would insist on a larger number of elements in a schema and acorrespondingly longer time to develop one.A loose constructionist would prefera smaller but adaptable framework before beginning to assemble data, assumingthat the schema will evolve over time and use. Here we take the second approachfor the practical reason that schemas can get very large and involved and thus aredifficult to discuss in this format and because we do basically feel that trying to tiedown every possibility in a database reaches the point of diminishing returnsquickly. So as a compromise Table 3.1 shows what we consider required andoptional elements for a GIS database schema.
Data DictionaryAs a relatively simple example, we present a project conducted by a consultingcompany for an annotated bibliography of study reports and historical documentsof the Snohomish River basin in the state of Washington. The requesting statetransportation agency wanted a GIS interface on this bibliography and documentcollection so that by identifying a feature of interest, say, a particular wetland, userscould pull up all the documents related to that feature and any recommendationsthat had been made for that feature with respect to mitigation, restoration, waterquality, and so on.The data dictionary is shown in Table 3.2.This is a minimal butadequate example; it names fields with reasonable and brief names, and it providesinformation about the type of data the field contains, how many columns in thetable have been allotted for a field, and a description of the field.
Strict constructionists might wonder why a Char (text) data type was given tothe year instead of a numeric data type and what values the Rating field in theCitations table would be allowed to take or, in the Recommendations tablePreserve field, what it would mean if a value was something other than 3.Theseconcerns can be met in the metadata.The three tables that contain informationclearly represent distinctly different objects or features. In the feature tables youfind the geography, or the where, of the particular features, wetlands, environmen-tally sensitive areas, and so on.We are seeing the attribute table; there is an associ-ated table that contains the spatial information that defines the features.There will
Designing the GIS Database Schema48

49
Tabl
e 3.
1 Im
port
ant a
nd O
ptio
nal E
lem
ents
of a
GIS
Dat
abas
e Sc
hem
a
Elem
ent
Des
crip
tion
Exam
ple
Impo
rtan
t ele
men
ts:
Dat
a di
ctio
nary
A fi
eld-
by-f
ield
des
crip
tion
of e
ach
field
in e
ach
tabl
e. A
t a m
inim
um it
mus
t inc
lude
the
data
type
Ta
ble_
Dat
a_D
ict
(e.g
., nu
mer
ic, t
ext,
date
, im
age)
, the
spa
ces
it re
quire
s in
the
field
(if a
ppro
pria
te fo
r the
dat
a ty
pe),
an
da d
escr
iptio
n of
the
data
. It s
houl
d al
so in
clud
e ex
plan
atio
ns o
f the
var
ious
val
ues
that
a re
cord
ca
n ta
ke fo
r eac
h fie
ld. (
See
Dat
a_D
ict T
able
.)
Prim
ary
and
fore
ign
keys
Each
tabl
e m
ust h
ave
a pr
imar
y ke
y, a
fiel
d co
ntai
ning
an
iden
tifie
r for
eac
h re
cord
that
is u
niqu
e to
FE
AT_I
D in
the
Feat
ure
Attr
ibut
e th
at re
cord
. For
eign
key
s ar
e fie
lds
in o
ne ta
ble
that
are
prim
ary
keys
in a
noth
er. P
rimar
y an
d ta
bles
and
tabl
e D
OCR
EC_N
O in
the
fore
ign
keys
are
use
d to
link
tabl
es.
Reco
mm
enda
tions
(see
Fig
ure
3.1)
Entit
y-re
latio
nshi
p di
agra
mA
dia
gram
usi
ng a
sta
ndar
d di
agra
mm
ing
form
at th
at s
how
s ex
actly
how
the
tabl
es a
re re
late
d Fi
gure
3.1,
3.3
to e
ach
othe
r—th
e pr
imar
y an
d fo
reig
n ke
ys a
nd th
e ty
pe o
f rel
atio
nshi
p. It
mus
t sho
w w
heth
er
rela
tions
hips
are
one
to o
ne, o
ne to
man
y, o
r man
y to
man
y an
d w
hat r
elat
ions
hips
are
man
dato
ry
and
whi
ch o
ptio
nal.
Requ
ired
met
adat
a el
emen
tsSe
e M
etad
ata
sect
ion
late
r in
chap
ter.
Opt
iona
l ele
men
ts:
Wor
k flo
w d
iagr
ams
A d
iagr
am o
f exa
ctly
how
var
ious
tabl
es a
re in
corp
orat
ed in
to s
peci
fic ro
utin
e ta
sks
thro
ugh
form
s, re
port
s, m
aps,
etc.
Form
and
repo
rt d
esig
nsTh
e la
yout
and
dat
a so
urce
s fo
r nor
mal
dat
a in
put f
orm
s an
d th
e de
sign
and
dat
a so
urce
s fo
r st
anda
rd o
utpu
t rep
orts
. In
a G
IS d
atab
ase
the
stan
dard
repo
rts
will
incl
ude
map
or l
ayou
t tem
plat
es.
Secu
rity
Expl
anat
ion
of h
ow a
cces
s to
sch
ema
elem
ents
is a
llow
ed o
r res
tric
ted
to u
sers
or c
lass
es o
f use
rs.
Dom
ains
and
val
idat
ion
rule
sA
s pa
rt o
f a d
ata
dict
iona
r y, e
xplic
itly
defin
ed a
llow
ed v
alue
rang
es fo
r dat
a an
d ac
cept
able
uni
que
valu
es fo
r cer
tain
fiel
ds. F
or e
xam
ple,
the
date
allo
wed
in th
e fie
ld fo
r the
dat
e a
perm
it pr
oces
s be
gan
coul
d be
rest
ricte
d to
be
only
the
date
on
whi
ch th
e fo
rm w
as fi
lled
out.
Stan
dard
que
ries
Regu
lar q
uerie
s th
at w
ould
acc
ess
tabl
es a
nd b
e in
put t
o st
anda
rd re
port
s
Opt
iona
l met
adat
a el
emen
tsSe
e M
etad
ata
sect
ion
late
r in
chap
ter.
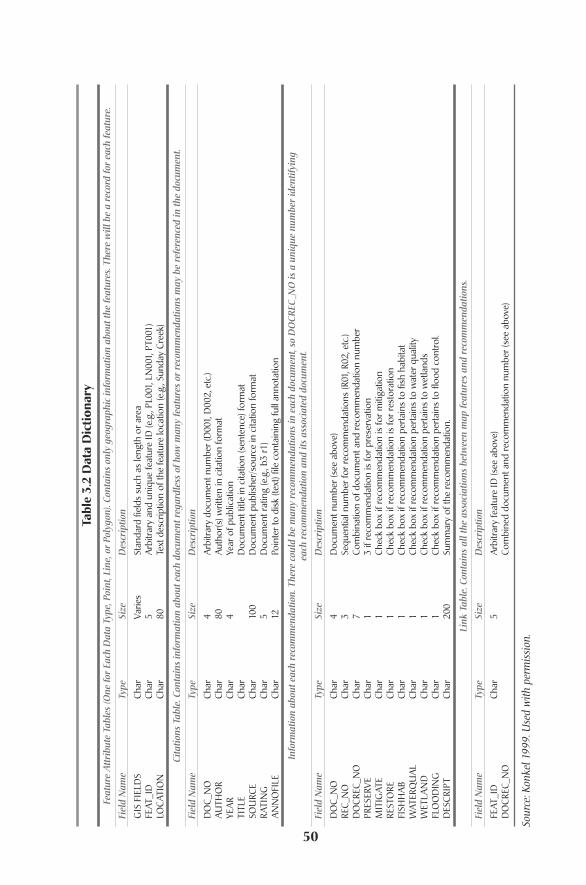
50
Tabl
e 3.
2 D
ata
Dic
tion
ary
Feat
ure
Att
ribu
te T
able
s (O
ne fo
r Ea
ch D
ata
Type
, Poi
nt, L
ine,
or
Poly
gon)
. Con
tain
s on
ly g
eogr
aphi
c in
form
atio
n ab
out t
he fe
atur
es. T
here
will
be
a re
cord
for
each
feat
ure.
Fiel
d N
ame
Type
Size
Des
crip
tion
GIS
FIE
LDS
Char
Varie
sSt
anda
rd fi
elds
suc
h as
leng
th o
r are
aFE
AT_I
DCh
ar5
Arb
itrar
y an
d un
ique
feat
ure
ID (e
.g.,
PL00
1, L
N00
1, P
T001
) LO
CATI
ON
Char
80Te
xt d
escr
iptio
n of
the
feat
ure
loca
tion
(e.g
., Su
nday
Cre
ek)
Cita
tions
Tab
le. C
onta
ins
info
rmat
ion
abou
t eac
h do
cum
ent r
egar
dles
s of
how
man
y fe
atur
es o
r re
com
men
datio
ns m
ay b
e re
fere
nced
in th
e do
cum
ent.
Fiel
d N
ame
Type
Size
Des
crip
tion
DO
C_N
OCh
ar4
Arb
itrar
y do
cum
ent n
umbe
r (D
001,
D00
2, e
tc.)
AU
THO
RCh
ar80
Aut
hor(s
) writ
ten
in c
itatio
n fo
rmat
YEA
RCh
ar4
Year
of p
ublic
atio
nTI
TLE
Char
Doc
umen
t titl
e in
cita
tion
(sen
tenc
e) fo
rmat
SOU
RCE
Char
100
Doc
umen
t pub
lishe
r/so
urce
in c
itatio
n fo
rmat
RA
TIN
GCh
ar5
Doc
umen
t rat
ing
(e.g
., b3
r1)
AN
NO
FILE
Char
12Po
inte
r to
disk
(tex
t) fil
e co
ntai
ning
full
anno
tatio
n
Info
rmat
ion
abou
t eac
h re
com
men
datio
n. T
here
cou
ld b
e m
any
reco
mm
enda
tions
in e
ach
docu
men
t, so
DO
CREC
_NO
is a
uni
que
num
ber
iden
tifyi
ng
each
rec
omm
enda
tion
and
its a
ssoc
iate
d do
cum
ent.
Fiel
d N
ame
Type
Size
Des
crip
tion
DO
C_N
OCh
ar4
Doc
umen
t num
ber (
see
abov
e)RE
C_N
OCh
ar3
Sequ
entia
l num
ber f
or re
com
men
datio
ns (R
01, R
02, e
tc.)
DO
CREC
_NO
Char
7Co
mbi
natio
n of
doc
umen
t and
reco
mm
enda
tion
num
ber
PRES
ERVE
Char
13
if re
com
men
datio
n is
for p
rese
rvat
ion
MIT
IGAT
ECh
ar1
Chec
k bo
x if
reco
mm
enda
tion
is fo
r miti
gatio
nRE
STO
RECh
ar1
Chec
k bo
x if
reco
mm
enda
tion
is fo
r res
tora
tion
FISH
HA
BCh
ar1
Chec
k bo
x if
reco
mm
enda
tion
pert
ains
to fi
sh h
abita
tW
ATER
QU
AL
Char
1Ch
eck
box
if re
com
men
datio
n pe
rtai
ns to
wat
er q
ualit
yW
ETLA
ND
Char
1Ch
eck
box
if re
com
men
datio
n pe
rtai
ns to
wet
land
sFL
OO
DIN
GCh
ar1
Chec
k bo
x if
reco
mm
enda
tion
pert
ains
to fl
ood
cont
rol.
DES
CRIP
TCh
ar20
0Su
mm
ary
of th
e re
com
men
datio
n.
Link
Tab
le. C
onta
ins
all t
he a
ssoc
iatio
ns b
etw
een
map
feat
ures
and
rec
omm
enda
tions
.
Fiel
d N
ame
Type
Size
Des
crip
tion
FEAT
_ID
Char
5A
rbitr
ary
feat
ure
ID (s
ee a
bove
)D
OCR
EC_N
OCo
mbi
ned
docu
men
t and
reco
mm
enda
tion
num
ber (
see
abov
e)
Sour
ce: K
onke
l 199
9. U
sed
with
per
mis
sion
.
Tables and Relationships
be several feature tables in this database, probably one for each class of features thatis involved (a set of wetland features, perhaps a set of environmentally sensitiveareas, etc.).The citation table contains information about the document itself; thistable closely resembles a catalogue card.
The Recommendations table comes out of the needs of the project.The clientsparticularly wanted to track what recommendations had been made for the vari-ous geographic features.This meant that someone had to read each document andidentify the various recommendations made for which features. So a recommen-dation is an object separate from features or documents. This is a key issue inschema design; each table should represent a distinct class of objects and onlyinformation that relates to that type of object should be present in the table. So adocument object and a recommendation object represent different feature classesand belong in different tables.
It is very easy to fall into the practice of mixing feature types, that is, puttingrecommendation fields in the Feature table.This quickly leads to the question ofhow many recommendation fields to create.You can be certain that if you designthe table with space for six recommendations, you will find a feature that has hadseven recommendations made for it.Then you are stuck. Generally, if you need todecide how many fields to leave for a type of information, you have mixed featureclasses in a single table. Consider another example of telephone numbers and peo-ple. A telephone number is not the same thing as a person. One number can belinked to many people and certainly one person can have many telephone num-bers, but you really can’t know how many numbers each person will have. So awell-designed database would have a separate table for people and one for tele-phone numbers with links between those tables. The telephone number tablecould also contain a field that identified the type of number, home telephone,work phone, mobile phone, and so on. Instead, what you usually see in a personalcontact table is a separate field for each possible type of telephone number. But ifa person has only one type of number, you are creating a space, but there is nodata.This is another clue that you are mixing feature types in a single table.
Tables and RelationshipsThe second critical part of a database schema, and actually the one you create first,is a diagram that shows the relationships among the various tables in the database,as shown in Figure 3.1. Relationships have a property called cardinality thatdescribes the type of relationship.The possibilities for relationships are one to one,one to many, and many to many.Additionally, relationships may have the propertyof being required (mandatory) or optional.An example of a required one-to-onerelationship in this figure is the relationship between the Recommendations andCitation tables (in that direction). Each recommendation must have a documentnumber (i.e., come from a document), and that DOC_NO links to the Citationtable that contains information about the document. This means that a recom-mendation without a document is not possible in this database. If you want toallow for that, you can, but as this database is designed, all recommendations mustexist in a document.
51
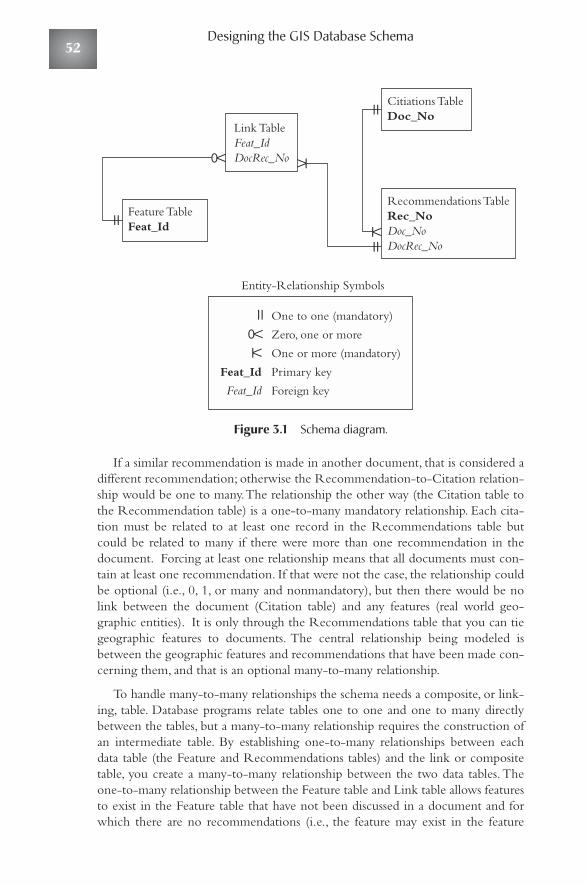
Figure 3.1 Schema diagram.
If a similar recommendation is made in another document, that is considered adifferent recommendation; otherwise the Recommendation-to-Citation relation-ship would be one to many.The relationship the other way (the Citation table tothe Recommendation table) is a one-to-many mandatory relationship. Each cita-tion must be related to at least one record in the Recommendations table butcould be related to many if there were more than one recommendation in thedocument. Forcing at least one relationship means that all documents must con-tain at least one recommendation. If that were not the case, the relationship couldbe optional (i.e., 0, 1, or many and nonmandatory), but then there would be nolink between the document (Citation table) and any features (real world geo-graphic entities). It is only through the Recommendations table that you can tiegeographic features to documents. The central relationship being modeled isbetween the geographic features and recommendations that have been made con-cerning them, and that is an optional many-to-many relationship.
To handle many-to-many relationships the schema needs a composite, or link-ing, table. Database programs relate tables one to one and one to many directlybetween the tables, but a many-to-many relationship requires the construction ofan intermediate table. By establishing one-to-many relationships between eachdata table (the Feature and Recommendations tables) and the link or compositetable, you create a many-to-many relationship between the two data tables.Theone-to-many relationship between the Feature table and Link table allows featuresto exist in the Feature table that have not been discussed in a document and forwhich there are no recommendations (i.e., the feature may exist in the feature
Entity-Relationship Symbols
Link TableFeat_IdDocRec_No
Feature TableFeat_Id
One to one (mandatory)
Zero, one or more
One or more (mandatory)
Primary key
Foreign key
Feat_Id
Feat_Id
Citiations TableDoc_No
Recommendations TableRec_NoDoc_NoDocRec_No
Designing the GIS Database Schema52
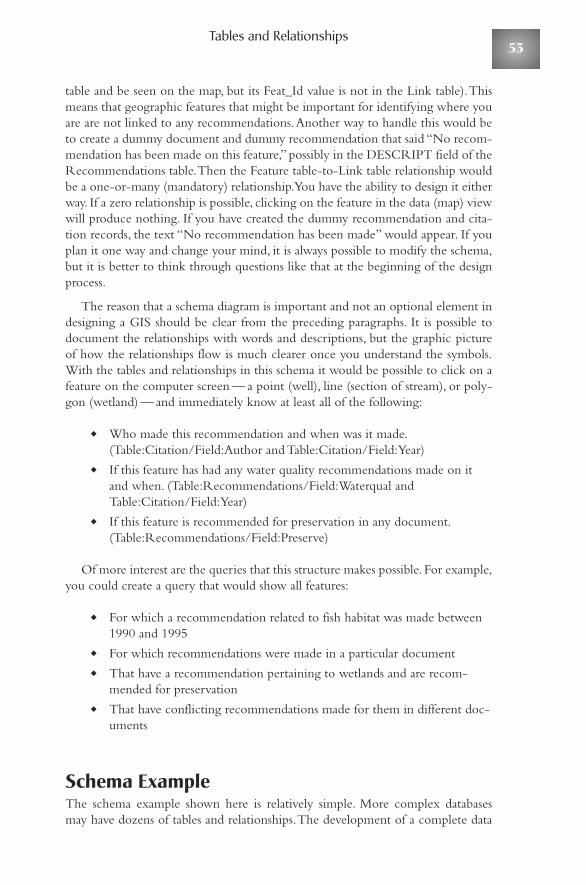
Tables and Relationships
table and be seen on the map, but its Feat_Id value is not in the Link table).Thismeans that geographic features that might be important for identifying where youare are not linked to any recommendations.Another way to handle this would beto create a dummy document and dummy recommendation that said “No recom-mendation has been made on this feature,” possibly in the DESCRIPT field of theRecommendations table.Then the Feature table-to-Link table relationship wouldbe a one-or-many (mandatory) relationship.You have the ability to design it eitherway. If a zero relationship is possible, clicking on the feature in the data (map) viewwill produce nothing. If you have created the dummy recommendation and cita-tion records, the text “No recommendation has been made” would appear. If youplan it one way and change your mind, it is always possible to modify the schema,but it is better to think through questions like that at the beginning of the designprocess.
The reason that a schema diagram is important and not an optional element indesigning a GIS should be clear from the preceding paragraphs. It is possible todocument the relationships with words and descriptions, but the graphic pictureof how the relationships flow is much clearer once you understand the symbols.With the tables and relationships in this schema it would be possible to click on afeature on the computer screen — a point (well), line (section of stream), or poly-gon (wetland) — and immediately know at least all of the following:
◆ Who made this recommendation and when was it made.(Table:Citation/Field:Author and Table:Citation/Field:Year)
◆ If this feature has had any water quality recommendations made on itand when. (Table:Recommendations/Field:Waterqual andTable:Citation/Field:Year)
◆ If this feature is recommended for preservation in any document.(Table:Recommendations/Field:Preserve)
Of more interest are the queries that this structure makes possible. For example,you could create a query that would show all features:
◆ For which a recommendation related to fish habitat was made between1990 and 1995
◆ For which recommendations were made in a particular document◆ That have a recommendation pertaining to wetlands and are recom-
mended for preservation◆ That have conflicting recommendations made for them in different doc-
uments
Schema ExampleThe schema example shown here is relatively simple. More complex databasesmay have dozens of tables and relationships.The development of a complete data
53
dictionary and basic schema diagram before trying to populate it with data arevital steps.The steps to create these schemas are pretty straightforward.As an exer-cise we are going to work the process through for a local tax collector who wantsa GIS database to collect taxes on four classes of features, land parcels, buildings,vehicles, and equipment.The key report that must be created by this database is abill that will be mailed to an owner or owners so that taxes can be collected.Thegeographic features that this database must deal with are the land parcels (poly-gons) and buildings (polygons).The other feature classes, vehicles and equipment,have no inherent geography in this example and exist only as attribute tables.
Step 1. Identify all the possible classes of objects. We began with five objectclasses, land parcels, vehicles, equipment, buildings, and owners. But becausethis database is going to support a billing process, bills are another objectclass. It is important to separate the object classes so that you can design theappropriate fields for each class. A common design mistake in databases forland value assessment is to include the owner in the table for the land parcel.Owners and parcels are quite different classes of objects. They both haveaddresses, for example, but often not the same address. If you include theowner information as fields in the land parcel table, you run into the followingproblems:
■ Some land parcels have multiple owners. You can allow for this withadditional owner fields in the table, but most of them will be empty, andif you allow for only three owners, it is almost a given that you will find aparcel owned by six people.
■ You have to store the owner’s name for each parcel that he or she owns.The fundamental relationship between land parcels and owners is amany-to-many relationship. A single parcel may have more than oneowner and a single owner may own more than one parcel. Storingowner information multiple times provides more opportunities formistakes. Each owner will have only one entry in the owner table, andthis removes the confusion between William J Smith, William J. Smith,and William James Smith. Perhaps this individual owns several parcelsand is on the separate deeds with these slight variations on his name,but they all are the same person. If the name, rather than a parcelidentification number, is part of the parcel table, it will be in the parceltable in these three slightly different variants.
■ When an owner moves and changes addresses, you will have to makethat change for every parcel that person owns. In a correctly designedschema each owner will be a single record in the owner table, and youwill make the change once in that table. The owner’s address is aproperty of the owner, not the parcel. If the parcel has an address, it isappropriate to have that in the parcel table, though. Addresses, althoughthey may seem straightforward, can be rather complex things (seechapter 5 “How They Did It—Kansas Geospatial Data Addressing Standard.”
Designing the GIS Database Schema54
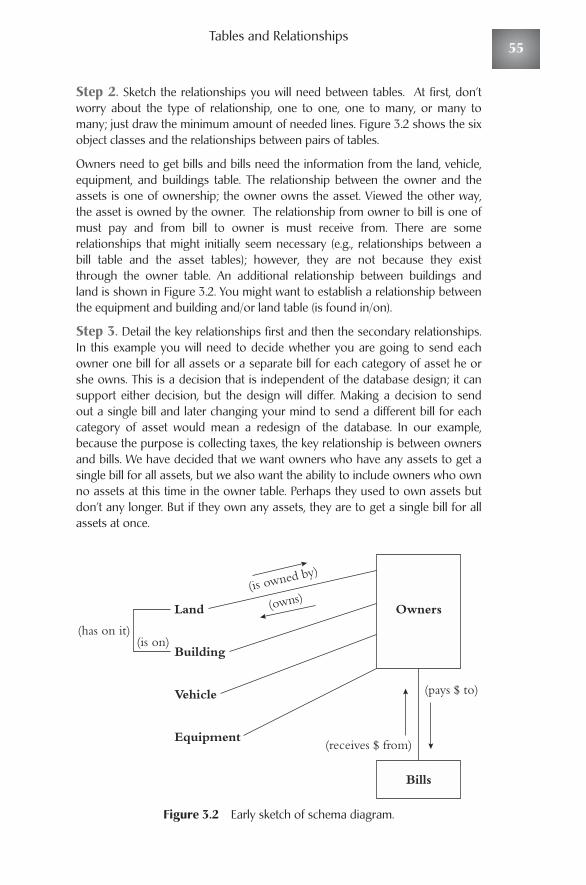
Tables and Relationships
Step 2. Sketch the relationships you will need between tables. At first, don’tworry about the type of relationship, one to one, one to many, or many tomany; just draw the minimum amount of needed lines. Figure 3.2 shows the sixobject classes and the relationships between pairs of tables.
Owners need to get bills and bills need the information from the land, vehicle,equipment, and buildings table. The relationship between the owner and theassets is one of ownership; the owner owns the asset. Viewed the other way,the asset is owned by the owner. The relationship from owner to bill is one ofmust pay and from bill to owner is must receive from. There are somerelationships that might initially seem necessary (e.g., relationships between abill table and the asset tables); however, they are not because they existthrough the owner table. An additional relationship between buildings andland is shown in Figure 3.2. You might want to establish a relationship betweenthe equipment and building and/or land table (is found in/on).
Step 3. Detail the key relationships first and then the secondary relationships.In this example you will need to decide whether you are going to send eachowner one bill for all assets or a separate bill for each category of asset he orshe owns. This is a decision that is independent of the database design; it cansupport either decision, but the design will differ. Making a decision to sendout a single bill and later changing your mind to send a different bill for eachcategory of asset would mean a redesign of the database. In our example,because the purpose is collecting taxes, the key relationship is between ownersand bills. We have decided that we want owners who have any assets to get asingle bill for all assets, but we also want the ability to include owners who ownno assets at this time in the owner table. Perhaps they used to own assets butdon’t any longer. But if they own any assets, they are to get a single bill for allassets at once.
Figure 3.2 Early sketch of schema diagram.
OwnersLand
Building
Vehicle
Equipment
Bills
(pays $ to)
(has on it)(is on)
(receives $ from)
(is owned by)
(owns)
55
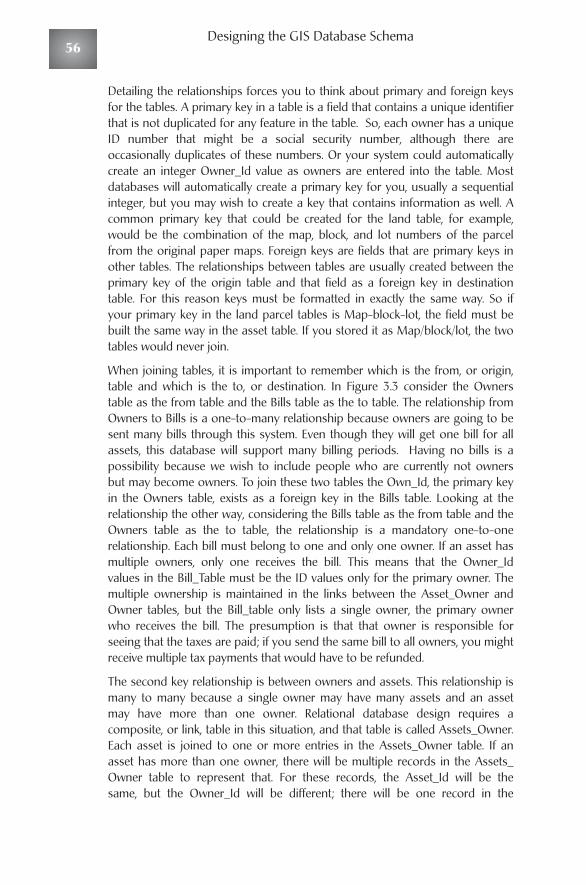
Detailing the relationships forces you to think about primary and foreign keysfor the tables. A primary key in a table is a field that contains a unique identifierthat is not duplicated for any feature in the table. So, each owner has a uniqueID number that might be a social security number, although there areoccasionally duplicates of these numbers. Or your system could automaticallycreate an integer Owner_Id value as owners are entered into the table. Mostdatabases will automatically create a primary key for you, usually a sequentialinteger, but you may wish to create a key that contains information as well. Acommon primary key that could be created for the land table, for example,would be the combination of the map, block, and lot numbers of the parcelfrom the original paper maps. Foreign keys are fields that are primary keys inother tables. The relationships between tables are usually created between theprimary key of the origin table and that field as a foreign key in destinationtable. For this reason keys must be formatted in exactly the same way. So ifyour primary key in the land parcel tables is Map-block-lot, the field must bebuilt the same way in the asset table. If you stored it as Map/block/lot, the twotables would never join.
When joining tables, it is important to remember which is the from, or origin,table and which is the to, or destination. In Figure 3.3 consider the Ownerstable as the from table and the Bills table as the to table. The relationship fromOwners to Bills is a one-to-many relationship because owners are going to besent many bills through this system. Even though they will get one bill for allassets, this database will support many billing periods. Having no bills is apossibility because we wish to include people who are currently not ownersbut may become owners. To join these two tables the Own_Id, the primary keyin the Owners table, exists as a foreign key in the Bills table. Looking at therelationship the other way, considering the Bills table as the from table and theOwners table as the to table, the relationship is a mandatory one-to-onerelationship. Each bill must belong to one and only one owner. If an asset hasmultiple owners, only one receives the bill. This means that the Owner_Idvalues in the Bill_Table must be the ID values only for the primary owner. Themultiple ownership is maintained in the links between the Asset_Owner andOwner tables, but the Bill_table only lists a single owner, the primary ownerwho receives the bill. The presumption is that that owner is responsible forseeing that the taxes are paid; if you send the same bill to all owners, you mightreceive multiple tax payments that would have to be refunded.
The second key relationship is between owners and assets. This relationship ismany to many because a single owner may have many assets and an assetmay have more than one owner. Relational database design requires acomposite, or link, table in this situation, and that table is called Assets_Owner.Each asset is joined to one or more entries in the Assets_Owner table. If anasset has more than one owner, there will be multiple records in the Assets_Owner table to represent that. For these records, the Asset_Id will be the same, but the Owner_Id will be different; there will be one record in the
Designing the GIS Database Schema56
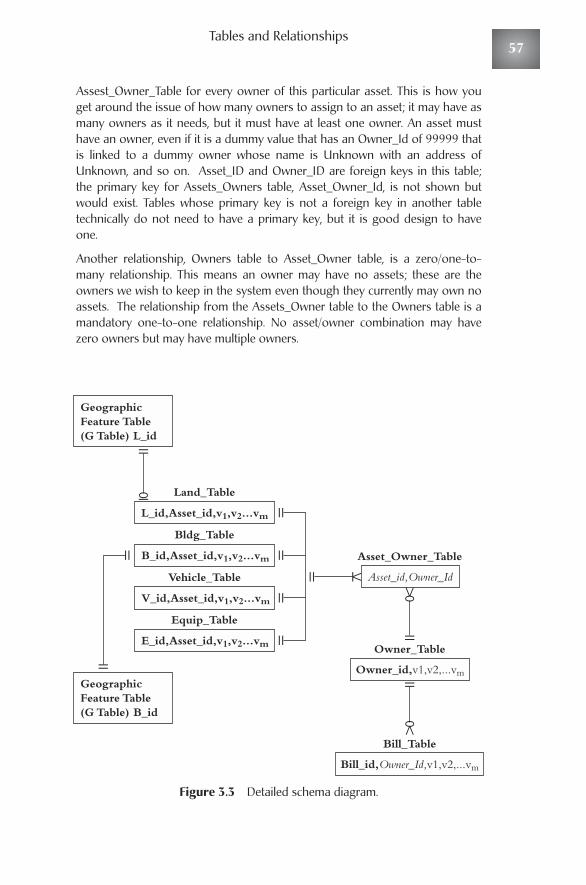
Tables and Relationships
Assest_Owner_Table for every owner of this particular asset. This is how youget around the issue of how many owners to assign to an asset; it may have asmany owners as it needs, but it must have at least one owner. An asset musthave an owner, even if it is a dummy value that has an Owner_Id of 99999 thatis linked to a dummy owner whose name is Unknown with an address ofUnknown, and so on. Asset_ID and Owner_ID are foreign keys in this table;the primary key for Assets_Owners table, Asset_Owner_Id, is not shown butwould exist. Tables whose primary key is not a foreign key in another tabletechnically do not need to have a primary key, but it is good design to haveone.
Another relationship, Owners table to Asset_Owner table, is a zero/one-to-many relationship. This means an owner may have no assets; these are theowners we wish to keep in the system even though they currently may own noassets. The relationship from the Assets_Owner table to the Owners table is amandatory one-to-one relationship. No asset/owner combination may havezero owners but may have multiple owners.
Figure 3.3 Detailed schema diagram.
GeographicFeature Table(G Table) L_id
GeographicFeature Table(G Table) B_id
L_id,Asset_id,v1,v2...vm
Asset_id,Owner_Id
Land_Table
Asset_Owner_TableB_id,Asset_id,v1,v2...vm
Bldg_Table
V_id,Asset_id,v1,v2...vm
Vehicle_Table
E_id,Asset_id,v1,v2...vm
Equip_Table
Owner_id,v1,v2,...vm
Owner_Table
Bill_id,Owner_Id,v1,v2,...vm
Bill_Table
57
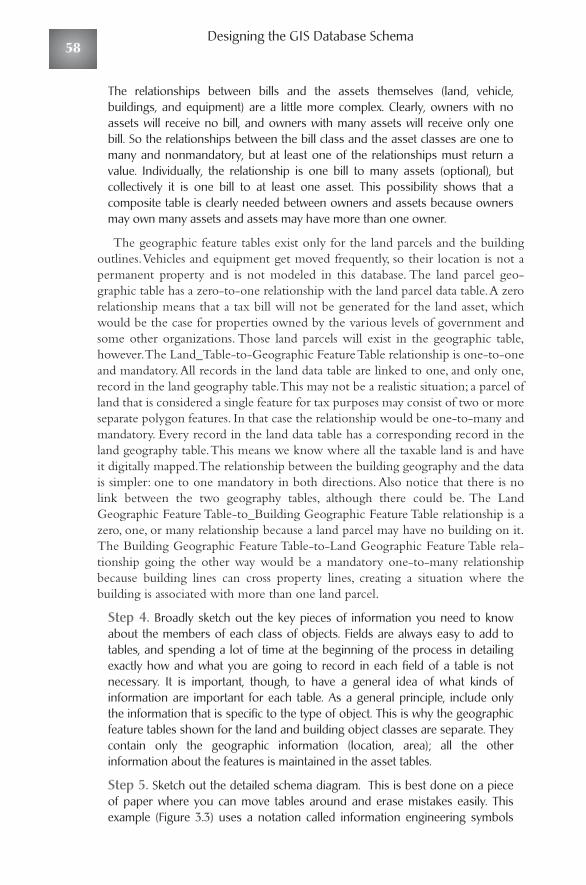
The relationships between bills and the assets themselves (land, vehicle,buildings, and equipment) are a little more complex. Clearly, owners with noassets will receive no bill, and owners with many assets will receive only onebill. So the relationships between the bill class and the asset classes are one tomany and nonmandatory, but at least one of the relationships must return avalue. Individually, the relationship is one bill to many assets (optional), butcollectively it is one bill to at least one asset. This possibility shows that acomposite table is clearly needed between owners and assets because ownersmay own many assets and assets may have more than one owner.
The geographic feature tables exist only for the land parcels and the buildingoutlines.Vehicles and equipment get moved frequently, so their location is not apermanent property and is not modeled in this database. The land parcel geo-graphic table has a zero-to-one relationship with the land parcel data table.A zerorelationship means that a tax bill will not be generated for the land asset, whichwould be the case for properties owned by the various levels of government andsome other organizations. Those land parcels will exist in the geographic table,however.The Land_Table-to-Geographic Feature Table relationship is one-to-oneand mandatory.All records in the land data table are linked to one, and only one,record in the land geography table.This may not be a realistic situation; a parcel ofland that is considered a single feature for tax purposes may consist of two or moreseparate polygon features. In that case the relationship would be one-to-many andmandatory. Every record in the land data table has a corresponding record in theland geography table.This means we know where all the taxable land is and haveit digitally mapped.The relationship between the building geography and the datais simpler: one to one mandatory in both directions. Also notice that there is nolink between the two geography tables, although there could be. The LandGeographic Feature Table-to_Building Geographic Feature Table relationship is azero, one, or many relationship because a land parcel may have no building on it.The Building Geographic Feature Table-to-Land Geographic Feature Table rela-tionship going the other way would be a mandatory one-to-many relationshipbecause building lines can cross property lines, creating a situation where thebuilding is associated with more than one land parcel.
Step 4. Broadly sketch out the key pieces of information you need to knowabout the members of each class of objects. Fields are always easy to add totables, and spending a lot of time at the beginning of the process in detailingexactly how and what you are going to record in each field of a table is notnecessary. It is important, though, to have a general idea of what kinds ofinformation are important for each table. As a general principle, include onlythe information that is specific to the type of object. This is why the geographicfeature tables shown for the land and building object classes are separate. Theycontain only the geographic information (location, area); all the otherinformation about the features is maintained in the asset tables.
Step 5. Sketch out the detailed schema diagram. This is best done on a pieceof paper where you can move tables around and erase mistakes easily. Thisexample (Figure 3.3) uses a notation called information engineering symbols
Designing the GIS Database Schema58
Tables and Relationships
(IES). There are other notation systems for database design (e.g., UniversalModelling Language); the database world has not settled on a single formatyet. The formal design can also be accomplished using CASE tools, whichsometimes come with GIS software packages. Although a complete schema willeventually include every field for each table, this can take up lots of room on apiece of paper. The example shown includes only the primary keys (show inbold) and foreign keys (shown in italic). Of course you will know other piecesof information about each feature in the tables; these are shown as v1, v2, andso on. The design concerns for this attribute information are covered in thenext section.
A data dictionary that describes the contents of the various tables in thedatabase and a schema are the central design elements at this stage. Tables andtheir resulting dictionaries can get quite large, and schemas can require large-format printer or plotters to display them. They are essential documents andcontain all the information a database professional needs to understand thestructure of your database. A schema can take months to complete and bemuch more involved than the simple example we presented here. As you gothrough the process, you need to keep several key issues in mind as youdesign the schema:
■ Tables should be specific to the objects they represent and containinformation only about that class of object. So a table of utility polesshould not contain information about the objects that might be on thepoles, (e.g., transformers). A land parcel table should not containinformation about the owner; all it needs is a foreign key that can link theland parcel table to the owner table. The land parcel is a geographicfeature, and that is the information you store in that table. The owner orowners are people or entities and have different properties, so theybelong in different tables.
■ Often a relationship is one to one, but in a few instances can be one tomany. Even if the situation occurs only once in the database, it must beexplicitly modeled in the schema.
■ Many-to-many relationships require a composite, or link, table. Thesetables contain only a primary key for the table (which was missing in theexample we presented) and foreign keys to the tables containing thefeatures involved in the many-to-many relationship. Composite tablesmay never appear in screens that users see, but they must be in thedatabase to maintain this most complex of relationships.
If you are implementing your GIS using a commercial RDBMS, the varioustypes of relationships (one to one, one to many, etc.) may be referred to withdifferent terminology. The software will probably also have tools for creating adatabase schema. Ultimately the schema is implemented in the databasethrough SQL. Each table is set up with SQL statements, and the relationshipsare defined with SQL. The CASE tools allow you to visually draft the schemathat best represents your view of the world and then automatically generates
59
the SQL statements that will create the database and that become a textualrepresentation of the schema. Those are usually quite technical steps, but theinitial work of identifying the tables and the relationships between them can bedone in a group setting with nothing more than a large piece of paper and amarker. A database professional should be able to take that and generate thenecessary SQL to create the database. The visual representation of thedatabase, as we said earlier, is a blueprint and, like blueprints, is constantlyconsulted during the actual construction process.
MetadataMetadata is usually described as data about the data. It is the information you needto document your data set sufficiently so that an outsider can understand all thekey issues involved in the construction of the data set, what the various values inthe data set mean, what projection you are using, and so on. One analogy is to acatalogue card for a book in a library, although most metadata is considerablymore involved than that.The product of the process of creating metadata is a filethat describes your data set, or pieces of your database.The mountains of informa-tion available on how to produce it, what to include, how to check it against astandard, and publish it is huge, but the actual product is rather small.
The likelihood that this chapter will be out of date by the time it hits print ishigh because there is a lot of work being done around the world to implementstandards and also because the techniques to disseminate metadata are expandingrapidly. Early implementations of geographic metadata were simple text files thatcould be read by word processors. The National Spatial Data Infrastructure(NSDI) initiative of the U.S. government led to a standard for implementingmetadata using hypertext markup language (HTML). Currently, the push is tousing extensions to HTML for producing metadata, Simple Graphics MarkupLanguage (SGML) and Extensible Markup Language (XML). It is almost certainthat there will be new high-level languages developed out of these that will haveadditional advantages for implementing metadata.
Since the 1990s there has been a proliferation of metadata standards, but inrecent years national organizations have begun to cooperate on a set of interna-tional standards that may eventually make it easier to document and share geo-graphic information across the world.The United States Federal Geographic DataCommittee (FGDC) standards were an early version of metadata standards, andnow there are groups in Europe, Australia and New Zealand (anzlic.org.au/asdi/metaelem.htm), and internationally that are working on geographic metadata.Additionally, the Dublin Core is a project that is attempting to integrate metadataefforts across disciplines and digital data types so that groups working on metadatastandards for image data, for example, will have some relationship to standardsdeveloped for other types of data.
The FGDC has been at the task the longest of any of the organizations (seeHow They Did It — U.S. Federal Geospatial Metadata), and the standard is matureand well disseminated. It consists of seven information segments, three supporting
Designing the GIS Database Schema60

Metadata
sections, and major content areas (Table 3.3).Within each content area are oftendozens of elements that specify the details of the content.These details are impres-sive; there are more than 300 elements, including 199 data entry elements.However, the standard has both required and optional elements and only certainitems, fewer than 20, in the Identification and Metadata Reference sections aremandatory. Creators must fill in these sections, and some GIS software systems willread through the data set and produce a template for many of the optional items aswell. For example, if the map projection for the data set is available in a file for-matted for the software to read, some software will read that information and placeit in the appropriate metadata location.
61
How They Did It — U.S. Federal Content Standards
How the current U.S. federal metadata standards came about is anexample of the slow, but careful, process of governmental coordinationand cooperation. In the late 1980s the United States Geological Survey(USGS) set some requirements for how descriptive information aboutdigital geospatial data should be collected and even before the issuingof Office of Policy and Management (OPM) Circular A-16 in October1990 was circulating and discussing draft metadata documentationstandards in the GIS community. The OPM circular established theFGDC with 12 federal agencies on the coordinating committee and theDepartment of the Interior as the lead agency. This new committee(FGDC) began work in 1990 in the Department of the Interior’s USGS.This unit of Interior was the logical location because of the widespreaduse of their digital data at several different scales by many other federal,state, and local agencies. Executive Order No. 12906 of the U.S. federalgovernment in April 11, 1994, is the central document, and it took 4years of coordination, negotiation, and work by the FGDC before itcould be issued. It required federal agencies and organizationsreceiving federal funds to document their geographic information usingthe FGDC’s Content Standard for Digital Geospatial Metadata. Therewere three goals for this order:
■ Minimize the costs of creating geographic information. Byforcing the creation and distribution of metadata, differentagencies of the government are more easily able to search theresources of other agencies before they expend time andmoney creating a near duplicate of a data set that alreadyexists.
■ Encourage cooperative collection activities. The existence ofmetadata for a set of geographic data actually assists in thecreation of the data (i.e., you have to be able to document thedata, which forces you to consider aspects of data design youmight otherwise avoid).
continued
Table 3.3 Metadata — Federal Geographic Data Committee
Major Content Areas — Federal (U.S.) Geographic Data Committee Standards
1. Identification information An abstract of detailed information in theother sections.
2. Data quality information Assessment of the accuracy of the spatialand attribute data being described.
3. Spatial data organization Detailed documentation of the types of information spatial features in the data set. The
feature types, vector and raster, mustcorrespond to the Spatial Data TransferStandard, which was developed alongwith the metadata standards.
4. Spatial reference information Coordinate system, projection, and geo-graphic extent information, includinginformation about elevations or depths.
Designing the GIS Database Schema62
■ Establish a national framework for geographic data. This orderalso established the National Spatial Data Infrastructure todesign a system for creating metadata-based sites on theWorld Wide Web for users to seek out spatial data in anorganized way.
The deadlines established in the order clearly show that most of thework had been already done before the order was issued. Thecommittee held a public forum as early as 1992 and circulated draftstandards in 1993. The first standards were published in June 1994,only a few months after the executive order was issued. After thatpublication a considerable amount of the resources went intoeducating the community about the standards and establishingpartnerships with state, local, tribal, and university data developers todocument their data with the new standard and to set up searchablesites under the NSDI for sharing the data. These partnerships werefunded with grants from the U.S. Department of the Interior, throughthe FDGC, and have been spread all around the country. Staff membersof the FGDC were very active, going to GIS conferences around thecountry and giving presentations on the content standard and how itsuse was going to make geographic data more usable and accessible.Adoption of the content standards, except for federal agencies whomust use them, has been slow, as has the growth of the NSDI; as ofMay 2002 there were only 242 nodes on the NSDI, which, given thesize of the GIS community, is rather small. Ten percent or more of theservers in the NSDI are likely to be down at any time, and establishingan NSDI site is not something a casual user will do. At the time ofwriting the position of metadata coordinator on the FGDC was vacant.The Bureau of Land Management was an early adopter and diffuser ofmetadata and tools to create it, but the Web site that deals with theNSDI had not been modified since September 1998.
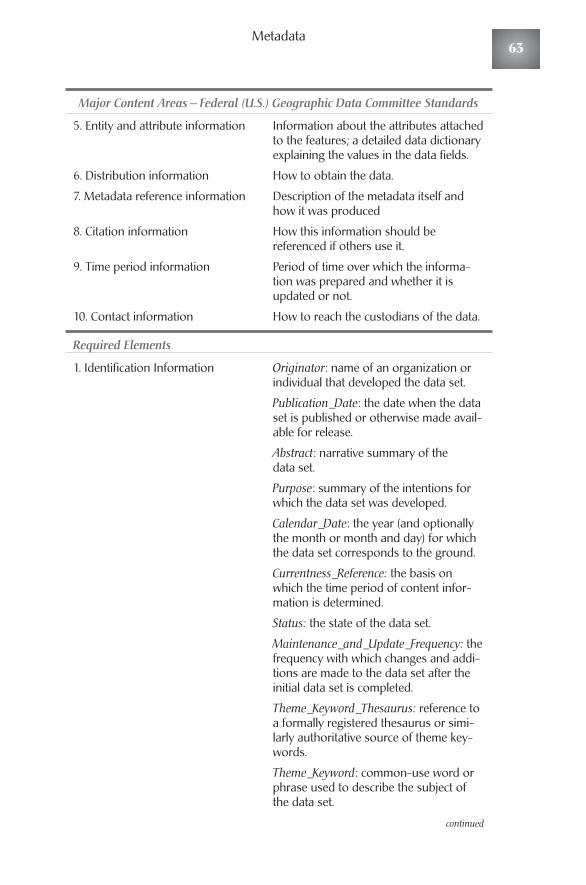
Metadata
Major Content Areas — Federal (U.S.) Geographic Data Committee Standards
5. Entity and attribute information Information about the attributes attachedto the features; a detailed data dictionaryexplaining the values in the data fields.
6. Distribution information How to obtain the data.
7. Metadata reference information Description of the metadata itself andhow it was produced
8. Citation information How this information should be referenced if others use it.
9. Time period information Period of time over which the informa-tion was prepared and whether it isupdated or not.
10. Contact information How to reach the custodians of the data.
Required Elements
1. Identification Information Originator: name of an organization orindividual that developed the data set.
Publication_Date: the date when the dataset is published or otherwise made avail-able for release.
Abstract: narrative summary of the data set.
Purpose: summary of the intentions forwhich the data set was developed.
Calendar_Date: the year (and optionallythe month or month and day) for whichthe data set corresponds to the ground.
Currentness_Reference: the basis onwhich the time period of content infor-mation is determined.
Status: the state of the data set.
Maintenance_and_Update_Frequency: thefrequency with which changes and addi-tions are made to the data set after theinitial data set is completed.
Theme_Keyword_Thesaurus: reference toa formally registered thesaurus or simi-larly authoritative source of theme key-words.
Theme_Keyword: common-use word orphrase used to describe the subject ofthe data set.
continued
63
Table 3.3 (Continued)
Required Elements
Access_Constraints: restrictions and legalprerequisites for accessing the data set.
Use_Constraints: restrictions and legalconstraints for using the data set afteraccess is granted.
10. Metadata reference information Contact_Organization: organizationresponsible for the metadata information.
Contact_Address: four required elementsof the mailing or physical address of thecontact organization.
Contact_Voice_Telephone: telephonenumber of the contact organization.
Minimal required metadata documentation is not the time-consuming taskthat many data creators think it is. Although these metadata efforts are all tied insomehow with development of the International Organization forStandardization (ISO) standards, it is not as clear how well they are tied to theactivities of the Dublin Core.This is partly due to the different backgrounds of theparticipants; the GIS metadata standards have been developed largely by bureau-crats of national governments working either alone or together, but these profes-sionals have principally come from the geographic data community, that is, theyare users and producers of geographic data.The impetus behind the overarchingefforts of the Dublin Core comes from the international librarian community, andit is being staffed and organized by professionals whose concerns are the organiza-tion, storage, and retrieval of information.
The professionals behind the Dublin Core have expressed concern that themany groups, not just producers and consumers of geographic data, working onmetadata standards are going to get so widely separated from each other that theywill have little in common.With those concerns, they have developed a 15-ele-ment metadata standard that is designed to accommodate many different forms ofdigital data, not just geographic data (Table 3.4).Although the FGDC standard hasa hierarchical structure with many sub-elements and sub-sub-elements under eachmajor section and has some strong restrictions on how data are presented, theDublin Core is a much simpler standard.There is no complex hierarchy of ele-ments with long names but only these 15 identifiers with suggestions to use stan-dard lists of elements such as standard lists of data types. Examples areMultipurpose Internet Mail Extensions (MIMEs), describing the data type;Uniform Resource Locators (URLs), documenting the Internet location; andInternational Standard Book Number (ISBN) as a unique identifier.The DublinCore is a much easier standard to implement and has the added advantage of beingusable for all sorts of other data (e.g., documents, nongeographic databases, and
Designing the GIS Database Schema64
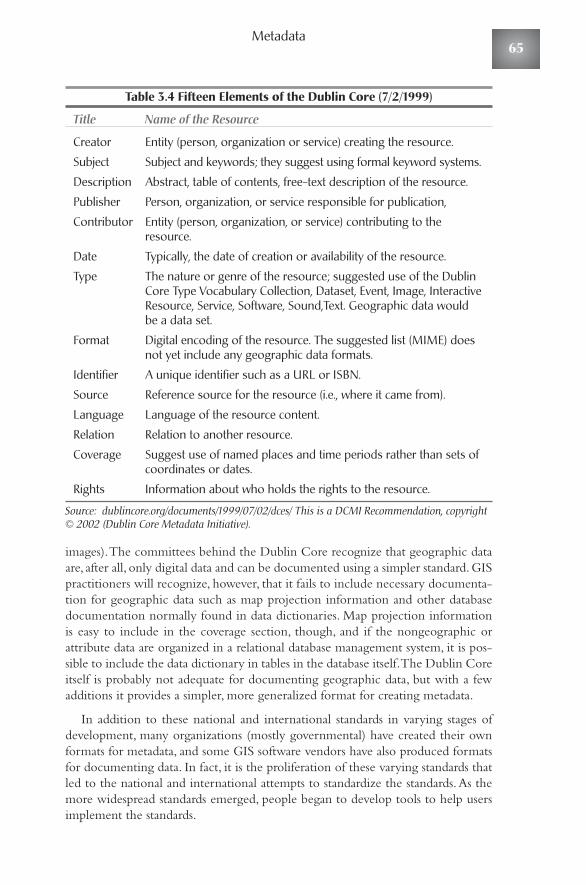
Metadata
Table 3.4 Fifteen Elements of the Dublin Core (7/2/1999)
Title Name of the Resource
Creator Entity (person, organization or service) creating the resource.
Subject Subject and keywords; they suggest using formal keyword systems.
Description Abstract, table of contents, free-text description of the resource.
Publisher Person, organization, or service responsible for publication,
Contributor Entity (person, organization, or service) contributing to theresource.
Date Typically, the date of creation or availability of the resource.
Type The nature or genre of the resource; suggested use of the DublinCore Type Vocabulary Collection, Dataset, Event, Image, InteractiveResource, Service, Software, Sound,Text. Geographic data wouldbe a data set.
Format Digital encoding of the resource. The suggested list (MIME) doesnot yet include any geographic data formats.
Identifier A unique identifier such as a URL or ISBN.
Source Reference source for the resource (i.e., where it came from).
Language Language of the resource content.
Relation Relation to another resource.
Coverage Suggest use of named places and time periods rather than sets ofcoordinates or dates.
Rights Information about who holds the rights to the resource.
Source: dublincore.org/documents/1999/07/02/dces/ This is a DCMI Recommendation, copyright© 2002 (Dublin Core Metadata Initiative).
images).The committees behind the Dublin Core recognize that geographic dataare, after all, only digital data and can be documented using a simpler standard. GISpractitioners will recognize, however, that it fails to include necessary documenta-tion for geographic data such as map projection information and other databasedocumentation normally found in data dictionaries. Map projection informationis easy to include in the coverage section, though, and if the nongeographic orattribute data are organized in a relational database management system, it is pos-sible to include the data dictionary in tables in the database itself.The Dublin Coreitself is probably not adequate for documenting geographic data, but with a fewadditions it provides a simpler, more generalized format for creating metadata.
In addition to these national and international standards in varying stages ofdevelopment, many organizations (mostly governmental) have created their ownformats for metadata, and some GIS software vendors have also produced formatsfor documenting data. In fact, it is the proliferation of these varying standards thatled to the national and international attempts to standardize the standards.As themore widespread standards emerged, people began to develop tools to help usersimplement the standards.
65
In the mid- to late 1990s there was proliferation of these tools. In the UnitedStates, FGDC was pushing users and vendors to document their data, and individ-uals in federal agencies developed and distributed tools for users to create and val-idate FGDC metadata. These were sometimes software-specific but often werestand-alone programs to assist in the creation of metadata. Most of these toolswere labors of love on the part of the creators and have not been maintained orupdated, although there are many who are still using such tools as the metadataArc Macro Language (AML) script written by Sol Katz in the Bureau of LandManagement.
Now metadata creation tools are more likely to be built into the software usedto create the spatial data.There is also a move toward the direct incorporation ofmetadata into the database. Previously you had to locate the metadata somewhereelse and place the file somewhere in close proximity to the actual data.The realityis, though, that many users are confused about metadata, resistant to spending thetime to develop it, and not certain of its utility.
The adoption of standards for metadata has been slow, and many practitionersstill do not document their data or do it very poorly. It seems as though the rate ofdevelopment of the standards is far exceeding the adoption of any standard. Usersor organizations unwilling to document their data to a standard can use this rapid-ity of change as a reasonable excuse.This is unfortunate because metadata answersso many questions about data you have obtained from others and will answer theirquestions if you provide it to them. The problem is that metadata, prepared toalmost any standard, is difficult to create, and it takes specialists to do it correctly. Ithas been likened to cataloguing in libraries; it requires a specialized set of tasks andnot every librarian is very good at it. But organizations with insufficient staff to setaside all or part of one professional to become the metadata expert in the organi-zation face an uphill struggle. And consulting firms who come into an organiza-tion, develop some data, and leave will have no incentive at all to spend the timeto create metadata unless the requirement and resources have been explicitlyincluded in the contract, and they often are not.The documentation of all geo-graphic data sets to a metadata standard is a generic goal of the world of GIS prac-titioners, but practically it lags behind and is the last thing done.
A complete database schema will contain much more information than merelya data dictionary and table/relationships diagrams.The elements listed in Table 3.1,such as queries, reports and forms, optional metadata, and so on, are all part of aschema, but they are generated from the data dictionary, the tables, and relation-ships you have defined.Those items are at the core of your schema, and a well-designed database can support a very wide range of reports, input forms, queries,and workflows. It is the design of the tables and the relationships between themthat is at the core of the schema, and that is why we have focused on them here.
GIS implementations almost always involve existing databases and theirschemas. The decision of whether to try to bundle all the different databasestogether, which is something GIS is particularly well suited to, or to redesign the
Designing the GIS Database Schema66
Metadata
entire system into a single database is important. GIS implementation is always agood time to look at the structure of all your databases, and sometimes the rightdecision is to redesign the system completely and move the existing data into thenew schema. But whether you choose to take that approach or take the approachthat links the databases together, you will need to understand the schemas of theexisting database. At an early point in the process someone will always say, “Wedon’t have to reinvent the wheel here,” that is, we have this perfectly acceptabledatabase that currently meets our needs; let’s just tie in a GIS. However, sometimesthe wheel you have is not particularly round and runs somewhat awkwardly. Inthose situations it is a good idea to sit in a room for a while with a large blankpiece of paper and sketch out a database that might really work for you. Somewheels are better than others, but you have to design them carefully, and that startswith understanding your existing schema or creating a new and better one.
ADDITIONAL READING
Chandler,A., D. Foley, and A. M. Hafez. 1999. Federal Geographic DataCommittee (FGDC) Metadata into MARC21 and Dublin Core:Towards anAlternative to the FGDC Clearinghouse. Lafayette, LA: University ofLouisiana. eeirc.nwrc.gov/pubs/crosswalk/fgdc-marc-dc.htm.
Federal Geographic Data Committee. 1998. Content Standard for DigitalGeospatial Metadata.Washington, D.C.: United States Government PrintingOffice.
Fraser, B., and M. Gluck. 1999.“Special Section — Usability of GeospatialMetadata or Space-Time Matters.” Bulletin of the American Society forInformation Science 25 (6):24–32.
Harrington, J. L. 1998. Relational Database Design Clearly Explained. APProfessional: San Diego, CA.
Konkel, G. 1999. Final Completion Report: Snohomish Basin Literature Review andGIS Data Acquisition Project. Washington Department of TransportationEnvironmental Affairs Office: Olympia,WA. wsdot.wa.gov/eesc/environ-mental/programs/watershed/snobas/other_links/final_report.cfm.
Smits, J. 1999.“Digital Cartographic Materials.” Cataloguing and ClassificationQuarterly 27(3): 321–343.
INTERNET RESOURCES
Metadata Publications, FGDC: fgdc.gov/publications/documents/metadata/metadata.html
Department of Interior, Bureau of Land Management’s Metadata andWWW Mapping Homepage:blm.gov/gis/nsdi.html
67

International Organization for Standardization (ISO) TC/211 —Geographic Information/Geomatics:isotc211.org/
GIS and Metadata: Frequently Asked Questions:standardsinaction.org/gismetadata/FAQMetadata.htm
Designing the GIS Database Schema68
Designing Spatial DataThe real world is a complex place. Hardly an original thought, but one that you
need to keep in mind as you design your GIS.As an example, consider the realityof a land parcel.The parcel is out there in the real world; it exists.There may be peo-ple who live in buildings on the parcel or conduct a business on the parcel, or it mayjust lie unused at the moment, slowly returning to its natural state.The parcel is a realthing, but there are reasons to model this land parcel in different ways because inter-acting directly with the parcel is often difficult. It is easier to deal with one of manymodels of the parcel.
Choosing the Appropriate Mix of Data ModelsOne model of the parcel is its legal model, the deed. That deed records the geo-graphic descriptors of the parcel, a sketch of where it is located relative to adjacentparcels’ ownership information (see Figure 4.1).This model of the parcel is printedon an 8.5- by 11-inch or legal-size piece of paper, and copies of it exist in manyplaces.The purpose of the deed model of the parcel is to facilitate transfer of owner-ship.The information we need to extract from the parcel and its owners is all relatedto the legal aspects of the buying and selling of the parcel.
Another model of that land parcel is in the community’s assessor’s database.Thepurpose of this model of the parcel is to assess property taxes due in a given period oftime to the taxing governmental unit.This model often has a digital (computer) aswell as analogue (paper) form.The assessed value of the land, improvements that havebeen made to it, and the address of the owner(s) are all pieces of information that theassessor has abstracted from the parcel and entered into a database. From that databasethe assessor generates tax bills, the grand list for the public, and other standard reportsnecessary to the functioning of the government.Without a standard model of a landparcel the procedure for assessing land would be ad hoc, capricious, and illegal.Thedesign of the model and the systems that use it provide taxing governments with agood way to demonstrate that the assessment is fair.Without a clear model of the landparcel, it would be impossible to do this.
CHAPTER
4
69
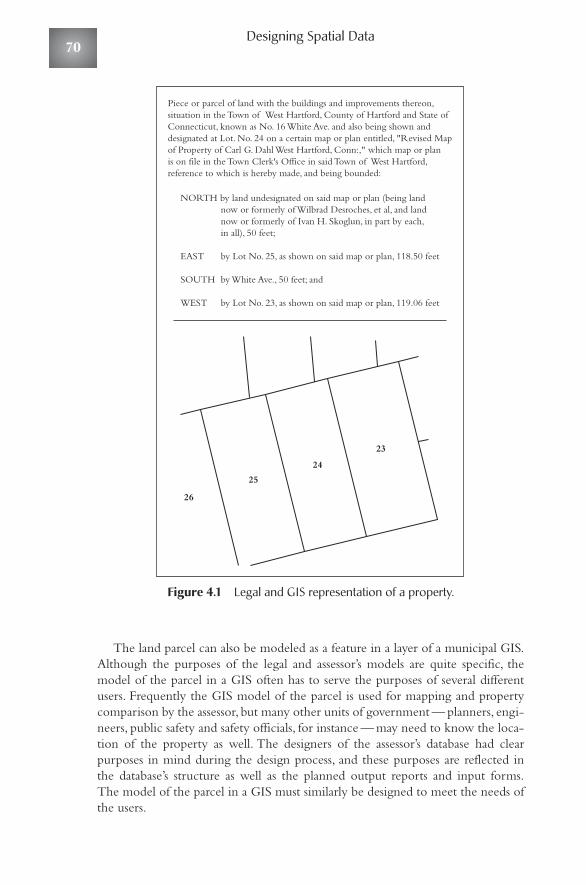
Figure 4.1 Legal and GIS representation of a property.
The land parcel can also be modeled as a feature in a layer of a municipal GIS.Although the purposes of the legal and assessor’s models are quite specific, themodel of the parcel in a GIS often has to serve the purposes of several differentusers. Frequently the GIS model of the parcel is used for mapping and propertycomparison by the assessor, but many other units of government — planners, engi-neers, public safety and safety officials, for instance — may need to know the loca-tion of the property as well. The designers of the assessor’s database had clearpurposes in mind during the design process, and these purposes are reflected inthe database’s structure as well as the planned output reports and input forms.The model of the parcel in a GIS must similarly be designed to meet the needs ofthe users.
Piece or parcel of land with the buildings and improvements thereon,situation in the Town of West Hartford, County of Hartford and State ofConnecticut, known as No. 16 White Ave. and also being shown anddesignated at Lot. No. 24 on a certain map or plan entitled, "Revised Mapof Property of Carl G. Dahl West Hartford, Conn:," which map or planis on file in the Town Clerk's Office in said Town of West Hartford, reference to which is hereby made, and being bounded:
NORTH by land undesignated on said map or plan (being landnow or formerly of Wilbrad Desroches, et al, and landnow or formerly of Ivan H. Skoglun, in part by each,in all), 50 feet;
EAST by Lot No. 25, as shown on said map or plan, 118.50 feet
SOUTH by White Ave., 50 feet; and
WEST by Lot No. 23, as shown on said map or plan, 119.06 feet
23
24
25
26
Designing Spatial Data70
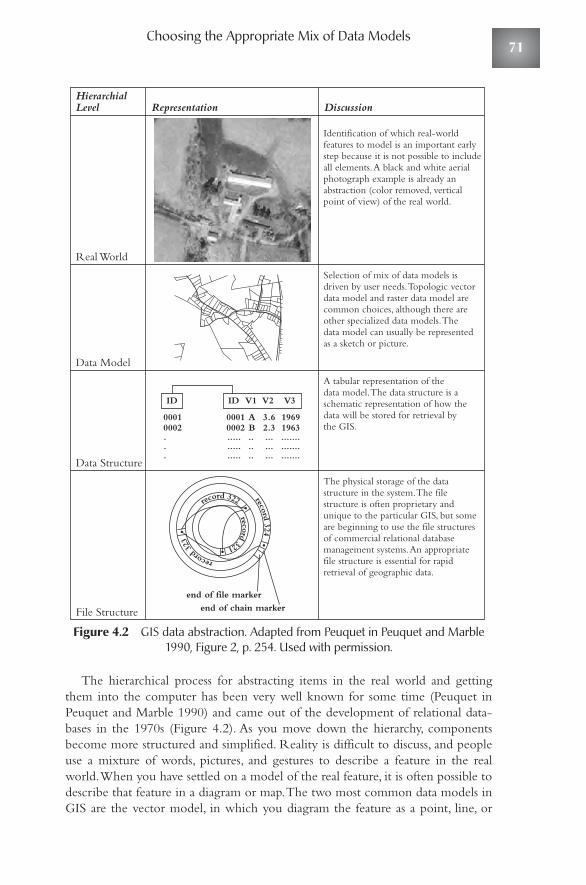
Choosing the Appropriate Mix of Data Models
Figure 4.2 GIS data abstraction. Adapted from Peuquet in Peuquet and Marble1990, Figure 2, p. 254. Used with permission.
The hierarchical process for abstracting items in the real world and gettingthem into the computer has been very well known for some time (Peuquet inPeuquet and Marble 1990) and came out of the development of relational data-bases in the 1970s (Figure 4.2). As you move down the hierarchy, componentsbecome more structured and simplified. Reality is difficult to discuss, and peopleuse a mixture of words, pictures, and gestures to describe a feature in the realworld.When you have settled on a model of the real feature, it is often possible todescribe that feature in a diagram or map.The two most common data models inGIS are the vector model, in which you diagram the feature as a point, line, or
HierarchialLevel
Real World
Identification of which real-worldfeatures to model is an important early step because it is not possible to includeall elements. A black and white aerial photograph example is already an abstraction (color removed, vertical point of view) of the real world.
Selection of mix of data models is driven by user needs. Topologic vectordata model and raster data model arecommon choices, although there areother specialized data models. The data model can usually be representedas a sketch or picture.
A tabular representation of thedata model. The data structure is aschematic representation of how thedata will be stored for retrieval bythe GIS.
The physical storage of the datastructure in the system. The filestructure is often proprietary andunique to the particular GIS, but someare beginning to use the file structuresof commercial relational databasemanagement systems. An appropriatefile structure is essential for rapidretrieval of geographic data.
end of file marker
end of chain marker
Data Model
Data Structure
File Structure
Representation Discussion
record321
record324
record
323
record 322
ID ID V1 V2 V3
0001 A 3.6 19690002
00010002 B 2.3 1963
..... .. ... .......
..... .. ... .......
..... ..
.
.
. ... .......
71

polygon, and the raster data model, in which reality is abstracted as a set of pixelsor rectangular units. At the next level, the data structure, you must specify thedetails of that diagram or map. If you are choosing to model the land parcel as anassessor’s record, each element of that record must be described based on the kindof information will be in it, the maximum/minimum number of characters ornumbers that will be allowed there, and so on.The data structure of the land par-cel at this level is a detailed written description that usually follows a standard setof rules and a set of tabular data locating the parcel in a coordinate system.A fea-ture like a swamp is described in a raster data model by stating the height andwidth of each cell in some coordinate system and what numeric or text valueindicates that the cell represents part of a swamp. Finally, this information needs tobe stored digitally in the computer so it can be retrieved for use.Are you going tostore the data as a string of numbers or will it be stored in some kind of dimen-sional array? Are you going to store it in a file format that many software programscan read directly or will you store in some proprietary format that only selectedprograms and users can read? At each level of this process, reality, data model, datastructure, and file structure, there are important questions to ask and answer in thedesign process.
Choosing a Subset of RealityNo GIS or database can include all aspects of reality; you always have the task ofchoosing a subset of real-world features that you will model in your GIS. Forexample, an electric utility has a view of the world that is quite different from avisiting nurse association, and their different missions and goals require that differ-ent elements of the real world be modeled in their geographic information sys-tems (see Table 4.1).
Knowing what you need to model in your GIS and, as important, what you donot need to model is the critical first step in the design process.The group processof restricting your view of reality so that you can focus on what is really importantto meet the organization’s goal is very important. Failure to restrict your view ofthe world sufficiently means you will be including a lot of expensive informationyou do not need.Too much restriction of your view of the world means you willleave out information critical to your mission. For example, is it necessary to knowthe exact location and information about each utility pole, or is it enough toknow the average number of poles per mile of distribution line? If your only pur-pose is to estimate the number of poles in a community for inventory tax pur-poses, the latter may be sufficient, but if you want to manage the poles for areplacement program, you will need to know details about each one, including itslocation. In the visiting nurse association example, only the topological relation-ships (discussed later in this chapter) in the road network are necessary to reach aclient: take Brown Street to the intersection of Booth Street and turn right. But anelectric utility needs to capture the road network where it really is because theirdistribution network closely parallels it. Both organizations need a road networkwith topological relationships, but how they model the reality of the road networkwill differ. Both will need it for routing practitioners to clients or maintenance
Designing Spatial Data72
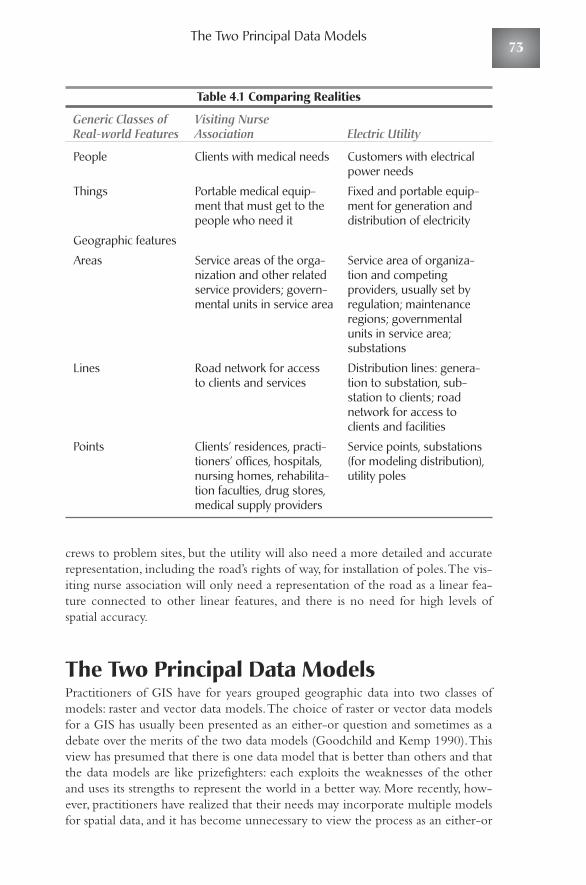
The Two Principal Data Models
Table 4.1 Comparing Realities
Generic Classes of Visiting Nurse Real-world Features Association Electric Utility
People Clients with medical needs Customers with electrical power needs
Things Portable medical equip- Fixed and portable equip-ment that must get to the ment for generation and people who need it distribution of electricity
Geographic features
Areas Service areas of the orga- Service area of organiza-nization and other related tion and competing service providers; govern- providers, usually set by mental units in service area regulation; maintenance
regions; governmental units in service area; substations
Lines Road network for access Distribution lines: genera-to clients and services tion to substation, sub-
station to clients; road network for access to clients and facilities
Points Clients’ residences, practi- Service points, substations tioners’ offices, hospitals, (for modeling distribution), nursing homes, rehabilita- utility polestion faculties, drug stores, medical supply providers
crews to problem sites, but the utility will also need a more detailed and accuraterepresentation, including the road’s rights of way, for installation of poles.The vis-iting nurse association will only need a representation of the road as a linear fea-ture connected to other linear features, and there is no need for high levels ofspatial accuracy.
The Two Principal Data ModelsPractitioners of GIS have for years grouped geographic data into two classes ofmodels: raster and vector data models.The choice of raster or vector data modelsfor a GIS has usually been presented as an either-or question and sometimes as adebate over the merits of the two data models (Goodchild and Kemp 1990).Thisview has presumed that there is one data model that is better than others and thatthe data models are like prizefighters: each exploits the weaknesses of the otherand uses its strengths to represent the world in a better way. More recently, how-ever, practitioners have realized that their needs may incorporate multiple modelsfor spatial data, and it has become unnecessary to view the process as an either-or
73
choice. Rather, you need to consider your needs for modeling your portion of thereal world. Many, but not all, GIS software systems can move data back and forthbetween these two data models, and you may discover that certain tasks are easierto perform in one or the other of the data models. But many users find that oneor the other of the data models meets their needs so that one is best for theirapplications. Organizations that require high-quality mapped output from theirGIS will find that only the vector data model allows that. Users who will be doinglots of overlaying of different geographic features will find out that the raster datamodel is more efficient for that type of task.
When you are trying to develop a model of a real-world object, it is vital tokeep several questions in mind. By knowing the answers to these questions youcan ensure that your model of the real-world objects will relate successfully to theobject.
What Is the Purpose of This Model?If the purpose of the model is solely to be a digital representation of the feature formapping, the design issues are rather simple.You will need to decide what kind ofdigital feature you will use to represent the real-world feature and how to symbol-ize it on the map. In the case of a land parcel, if the sole purpose is mapping of theland parcel for visual representation, the parcel will consist of a set of lines withsymbolization and a point inside these lines where some unique identificationnumber is attached.There may be one symbol representing the coincident featuresof a road right of way and a parcel edge and a second line symbol for the otheredges of a property.The point symbol may not be visible at all because its onlypurpose is to serve as an anchor for some text.The digital line, point, and text fea-tures may exist separately in your GIS because the map reader does the linkingbetween them visually.The presence of a number inside a set of bounding linesinforms the reader that that number identifies the polygon represented by thebounding lines. This is a common way to visually represent land parcels usingCAD tools.
If the model is to serve multiple purposes, design concerns become more com-plex. Using the land parcel example, let us say that in addition to simple mappingyou want to be able to link the assessor’s information so that this information can be included in a report that provides a quick printout of the important information along with a map of the parcel and adjoining parcels. In this case, theland parcel can no long exist only as a set of lines but must be modeled as a poly-gon or area in your GIS. In addition, the unique identifier (parcel identificationnumber, or PIN) must be in the GIS database and directly linked to the parcel sothat it can be connected with the assessor’s information.The system, not havingthe ability to see the PIN inside the lines bounding the parcel, must know the par-cel’s PIN and relate it to that parcel and only that parcel.
The representation or model of a real-world feature may be different depend-ing on the purpose of the model. Although a land parcel in the real world is apolygon, there may be some value in representing that polygon as a point in some
Designing Spatial Data74
The Two Principal Data Models
databases.The fire department may need to have the buildings on land parcel rep-resented as a digital image so that they can see the buildings and where they arerelative to each other when planning or evaluating a fire response. But when theywant to know what hazardous materials are stored in that building and where inthe building they are stored, the building may need only to be a record in a data-base linked to an address or a point.A business responsible for distributing goodsover a wide area may be able to find good locations for a warehouse by modelingtheir regional demand and supply facilities as points along a network of majorhighways, but when they have to actually move goods from a particular warehouseto a set of locations, they will need a larger-scale model of the transportation net-work. So the same real-world feature may exist in your GIS database several timesfor the different purposes.The need to display or analyze geographic data at verydifferent spatial scales also results in this apparent duplication.A state agency tryingto represent all the land parcels in the state may be forced to model each parcel asa point to even begin to display and locate the hundreds of thousands or millionsof parcels that exist.At the state scale that may be the right choice, but at the locallevel modeling the parcels, as point will not suffice. The parcels will have to bemodeled as polygons.At one scale you might want to represent only major arter-ial roads in your database, but at a larger scale you might want to include all roads.
Which Data Model, Raster or Vector, Better SuitsMy Purpose, or Is a Combination Appropriate?Traditionally the highest-level model choice in GIS has been presented as thechoice between the raster (grid) and the vector model.A diagram such as Figure4.3 is standard fare in any introductory text on GIS and is certainly not out ofplace here.The raster model represents the real world as a tesselation, with grid cellshaving a certain length and width and covering the entire rectangular area ofinterest. The value in the cell represents the real-world feature at that locationwithin the cell.The real world is not modeled as set of points, lines, or polygonsbut as a complete covering of regular (usually square) cells.A point can be locatedonly within a cell, a line is a collection of connected cells underneath the feature,and a polygon or area feature is a set of connected cells touching the polygon.
The vector data model represents real-world features as strings of x/y pairs rep-resenting spatial information about the features. A point is a single pair of valueswith an x value representing the longitude or x dimension of the point in somecoordinate space and a y value representing the latitude or y dimension of thepoint. Linear features may consist of a set of connected points or some mathemat-ical function describing the beginning point of the feature and the formula thatconstructs it. All GISs that support the vector data model can model circles andother curved lines as sets of short, connected straight lines. Some are able to storeinformation in such a way as to represent the feature as a curve. If that is importantin your model of the world, you need to ensure that the software you select cantreat features that way. Polygon or area vectors model the real-world feature as aconnected set of lines that closes on itself. These features are discussed in moredetail later in this chapter. For all of these three basic feature types in the vector
75
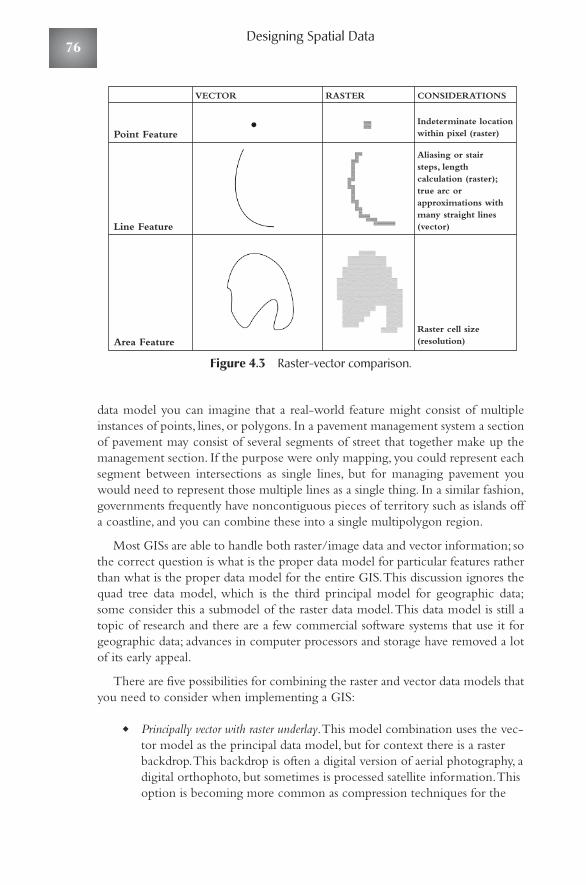
Figure 4.3 Raster-vector comparison.
data model you can imagine that a real-world feature might consist of multipleinstances of points, lines, or polygons. In a pavement management system a sectionof pavement may consist of several segments of street that together make up themanagement section. If the purpose were only mapping, you could represent eachsegment between intersections as single lines, but for managing pavement youwould need to represent those multiple lines as a single thing. In a similar fashion,governments frequently have noncontiguous pieces of territory such as islands offa coastline, and you can combine these into a single multipolygon region.
Most GISs are able to handle both raster/image data and vector information; sothe correct question is what is the proper data model for particular features ratherthan what is the proper data model for the entire GIS.This discussion ignores thequad tree data model, which is the third principal model for geographic data;some consider this a submodel of the raster data model.This data model is still atopic of research and there are a few commercial software systems that use it forgeographic data; advances in computer processors and storage have removed a lotof its early appeal.
There are five possibilities for combining the raster and vector data models thatyou need to consider when implementing a GIS:
◆ Principally vector with raster underlay.This model combination uses the vec-tor model as the principal data model, but for context there is a rasterbackdrop.This backdrop is often a digital version of aerial photography, adigital orthophoto, but sometimes is processed satellite information.Thisoption is becoming more common as compression techniques for the
Point Feature
Line Feature
Area Feature
VECTOR RASTER CONSIDERATIONS
Indeterminate locationwithin pixel (raster)
Aliasing or stairsteps, lengthcalculation (raster);true arc orapproximations withmany straight lines(vector)
Raster cell size(resolution)
Designing Spatial Data76
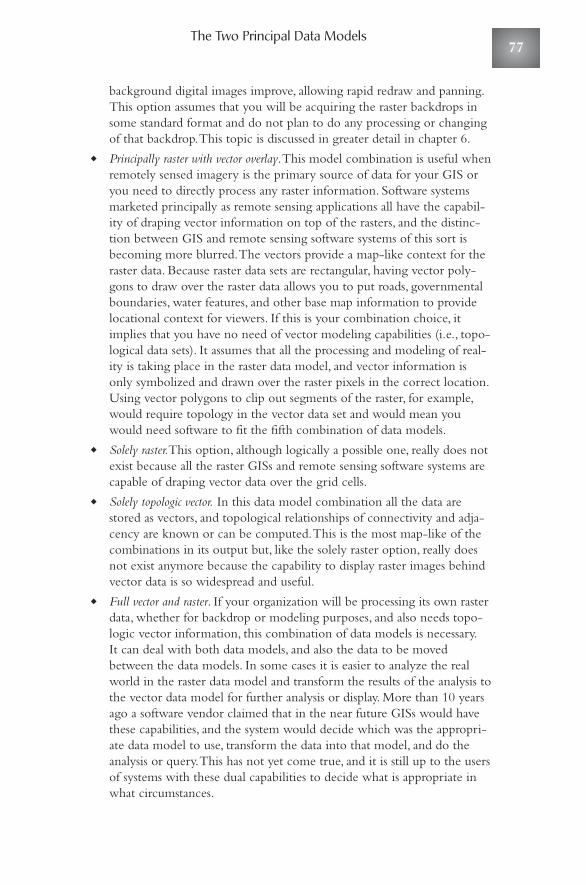
The Two Principal Data Models
background digital images improve, allowing rapid redraw and panning.This option assumes that you will be acquiring the raster backdrops insome standard format and do not plan to do any processing or changingof that backdrop.This topic is discussed in greater detail in chapter 6.
◆ Principally raster with vector overlay.This model combination is useful whenremotely sensed imagery is the primary source of data for your GIS oryou need to directly process any raster information. Software systemsmarketed principally as remote sensing applications all have the capabil-ity of draping vector information on top of the rasters, and the distinc-tion between GIS and remote sensing software systems of this sort isbecoming more blurred.The vectors provide a map-like context for theraster data. Because raster data sets are rectangular, having vector poly-gons to draw over the raster data allows you to put roads, governmentalboundaries, water features, and other base map information to providelocational context for viewers. If this is your combination choice, itimplies that you have no need of vector modeling capabilities (i.e., topo-logical data sets). It assumes that all the processing and modeling of real-ity is taking place in the raster data model, and vector information isonly symbolized and drawn over the raster pixels in the correct location.Using vector polygons to clip out segments of the raster, for example,would require topology in the vector data set and would mean youwould need software to fit the fifth combination of data models.
◆ Solely raster.This option, although logically a possible one, really does notexist because all the raster GISs and remote sensing software systems arecapable of draping vector data over the grid cells.
◆ Solely topologic vector. In this data model combination all the data arestored as vectors, and topological relationships of connectivity and adja-cency are known or can be computed.This is the most map-like of thecombinations in its output but, like the solely raster option, really doesnot exist anymore because the capability to display raster images behindvector data is so widespread and useful.
◆ Full vector and raster. If your organization will be processing its own rasterdata, whether for backdrop or modeling purposes, and also needs topo-logic vector information, this combination of data models is necessary.It can deal with both data models, and also the data to be movedbetween the data models. In some cases it is easier to analyze the realworld in the raster data model and transform the results of the analysis tothe vector data model for further analysis or display. More than 10 yearsago a software vendor claimed that in the near future GISs would havethese capabilities, and the system would decide which was the appropri-ate data model to use, transform the data into that model, and do theanalysis or query.This has not yet come true, and it is still up to the usersof systems with these dual capabilities to decide what is appropriate inwhat circumstances.
77
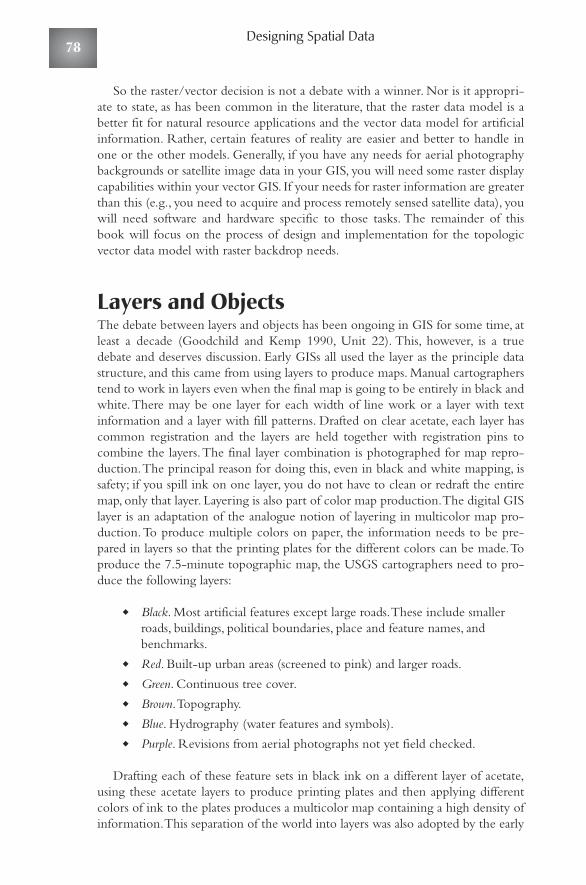
So the raster/vector decision is not a debate with a winner. Nor is it appropri-ate to state, as has been common in the literature, that the raster data model is abetter fit for natural resource applications and the vector data model for artificialinformation. Rather, certain features of reality are easier and better to handle inone or the other models. Generally, if you have any needs for aerial photographybackgrounds or satellite image data in your GIS, you will need some raster displaycapabilities within your vector GIS. If your needs for raster information are greaterthan this (e.g., you need to acquire and process remotely sensed satellite data), youwill need software and hardware specific to those tasks. The remainder of thisbook will focus on the process of design and implementation for the topologicvector data model with raster backdrop needs.
Layers and ObjectsThe debate between layers and objects has been ongoing in GIS for some time, atleast a decade (Goodchild and Kemp 1990, Unit 22). This, however, is a truedebate and deserves discussion. Early GISs all used the layer as the principle datastructure, and this came from using layers to produce maps. Manual cartographerstend to work in layers even when the final map is going to be entirely in black andwhite.There may be one layer for each width of line work or a layer with textinformation and a layer with fill patterns. Drafted on clear acetate, each layer hascommon registration and the layers are held together with registration pins tocombine the layers.The final layer combination is photographed for map repro-duction.The principal reason for doing this, even in black and white mapping, issafety; if you spill ink on one layer, you do not have to clean or redraft the entiremap, only that layer. Layering is also part of color map production.The digital GISlayer is an adaptation of the analogue notion of layering in multicolor map pro-duction.To produce multiple colors on paper, the information needs to be pre-pared in layers so that the printing plates for the different colors can be made.Toproduce the 7.5-minute topographic map, the USGS cartographers need to pro-duce the following layers:
◆ Black. Most artificial features except large roads.These include smallerroads, buildings, political boundaries, place and feature names, andbenchmarks.
◆ Red. Built-up urban areas (screened to pink) and larger roads.◆ Green. Continuous tree cover.◆ Brown.Topography.◆ Blue. Hydrography (water features and symbols).◆ Purple. Revisions from aerial photographs not yet field checked.
Drafting each of these feature sets in black ink on a different layer of acetate,using these acetate layers to produce printing plates and then applying differentcolors of ink to the plates produces a multicolor map containing a high density ofinformation.This separation of the world into layers was also adopted by the early
Designing Spatial Data78

Layers and Objects
(and current) versions of CAD, where features would be placed in layers not onlyon the basis of their color but also their symbolization on the final drawing. CADlayering is extensive; a single drawing may consist of dozens of layers, and individ-ual features may be made up of elements from multiple layers. In a GIS layeringsystem the entire feature is usually stored on a layer, and the result is many fewerlayers to represent the real world.
The notion of structuring the data in layers has a lot of advantages and a longtradition in GIS. In fact, it was the ease with which digital layers of suitability cri-teria could be combined that served as the impetus for the early development ofraster GIS to replace the cumbersome methodology of analogue overlay popular-ized by Ian McHarg (McHarg 1969). On a topographic map, it is difficult toexamine the drainage pattern revealed by the blue lines representing streamsbecause the other information obscures what you want to see. If that layer is rep-resented on a computer screen in a GIS, though, you can simply turn off the otherlayers, and the stream layer is more visible.You can also control the order in whichlayers display on the screen by dragging them to the bottom or top of the list ofavailable layers.The drawing order on a paper map is determined during the print-ing process, and you cannot vary what layer overlays what other layers.Whetheryou are drawing geographic information on a computer screen or printing it on amap, you are drawing on a blank surface, and you will be adding information inlayers that draw in a specified order.At the level of display, all data are presented aslayers in a GIS whether or not it is stored as layers in the database.
But the question here is one of representation in the database, not display onthe screen.The idea of object-oriented databases developed in the 1990s out ofobject-oriented programming languages. This style of programming has mostlyreplaced the traditional style of sequential programming where programmingcode was long and involved, containing many calls to subroutines, programlibraries, and so on. In object-oriented programming systems (OOPS) the soft-ware engineers write code in small snippets. Code can be associated with anobject, a window, a dialogue box, or some other type of object defined in the sys-tem. This object then possesses some “intelligence” and can communicate anddirect activities of other objects if this is allowed within the programming system.
The idea of extending object orientation to databases was a logical outgrowthof this programming style.You can conceptualize features in a database as objects,give them properties, and allow them to communicate with other objects in thedatabase.This functionality elevates the feature from being something passive inthe database that you can retrieve, manipulate, and replace in the database to beingan object with properties of its own and a set of functions it can perform on itselfor other objects. Object-oriented geographic databases are becoming more com-mon in GIS, and each software company has its own terminology for them. Rightnow many organizations are taking their legacy-layered databases and convertingthem to object-oriented databases.To be consistent, we are going to refer to thistype of database as a spatially enabled relational database system (SERD).
Modeling geographic features as objects in a SERD requires that the databaseadhere to the general principals of object orientation:
79
◆ Hierarchical organization. Objects usually belong to a hierarchy, and theposition in the hierarchy is an important property of the object. Objectshigher in the hierarchy own objects below them, and lower objectsbelong to higher-level objects. So a building may belong to one or moreland parcels depending on whether it crosses the boundary of the parcel,and a transformer may belong to zero or one utility pole but not to twopoles.This notion of hierarchies is central to the programming wherethe highest level might be something called a project; other objects,which are different views into data, belong to the project; and layers orsets of features belong to the data views.The project then only owns thelayers through the data views. Organizing the geographic features asobjects implies that there is some kind of hierarchy of objects (i.e., thatsome objects control objects below them in the hierarchy).
◆ Objects have properties.This characteristic of object-oriented databases isnot much different from feature-oriented databases. In both layer andobject geographic databases, a feature must have the property of type.For example, do we represent this feature as a number or text? If it is atext feature, it may have to have a property of length (number of charac-ters). If it is a numeric feature, how many places to the right of the deci-mal point does the system have to store? Object properties are oftenstated in the form of questions such as Can this object be modified onceit is created?, Is this property of this object mandatory to be specified orcan it be left out?, or Is there a particular set of values or range of valuesthat this property may assume?
A key property that an object has in a geographic database is its location.Location may be modifiable or not, depending on how you set up yourdatabase.A land parcel has a location which cannot be modified. If youchange the locational property of a land parcel by combining it withanother parcel, you have actually destroyed the original parcel object andcreated a new one with a nonmodifiable locational property. But abuilding is movable and can change its location, although this is not acommon occurrence. One of the important features of designing data-bases is that if something occurs very rarely but does occur, it needs tobe allowed for in all objects.You could not decide that some buildingsare movable and others are not. In an electric utility geographic database,a transformer is an object that is movable, but it may have the propertythat it must belong to a utility pole, a substation, or a staging yard. Itsabsolute location, latitude, and longitude will change as it is moved froma staging yard to a utility pole, and its relationship with objects will aswell. First it belongs to a particular staging yard and then it belongs to aparticular utility pole, actually sharing the locational property of theobject to which it belongs.This notion that location is just anotherproperty of an object in the database means that the geographic infor-mation is now stored directly with the nonlocational properties, tradi-tionally referred to as the attribute information.This means that deletionor insertion of the object into the database is complete when it occurs.
Designing Spatial Data80
Layers and Objects
And if that object is linked to other objects, changes will occur there aswell.To continue the transformer-utility pole example, if you remove apole from the database, you will have to remove any objects that belongto that pole as well, and the system will force this operation. In a layereddatabase where the poles are on one layer and the transformers another,the user would have to remember to do it, and forgetting could result ina display of transformers appearing to hang in space unattached to apole. In a layered geographic database it is common for a feature to havetwo types of information: geographic information (the where of the fea-ture) and attribute information (the what of the feature). In an object-oriented geographic database this information is not separate but issimply another piece of information we have about the object. It may beactually stored in separate tables from the attribute information, but logi-cally it is integrated data. In a SERD there is no distinction between thespatial and attribute information; it is all information we know about theobject.
◆ Object properties can be geographically conditioned.An object may have differ-ent properties based upon where it is absolutely or relatively.A watercontrol valve that is sitting on the shelf in an inventory warehouse con-trols no water flow, but that valve directly attached to a water pipe doeshave control properties over the downstream pipe.That property is madeavailable by the change in location. In a national distribution system youmay have a class of objects called metropolitan regions.When routingtrucks around the country at one spatial scale, the locations of theseregions can be represented as points in geographic space and a node on atransportation network.When the truck gets to the metropolitan regionand the scale of analysis changes, the metropolitan region needs to bemodeled as set of connected lines; a network within a network.Anotherexample would be to display property parcels as points within a certainscale range, but after you zoom into a tighter, large scale, the parcelswould show as polygon features.At all scales, though, you would haveaccess to the same information. In a layered database you would need tohave separate layers for the feature as points and polygons.
◆ Relationships between objects have properties.The idea that objects haveproperties was part of database design from the start, but object-orienteddatabases have added the idea that objects can relate to other objects andthat these relationships themselves are objects of a sort, so they can haveproperties.An object may have a mandatory ownership property rela-tionship.An example in an object-oriented GIS would be that a buildingobject must belong to one or more land parcel objects.You would haveto define this as one building to one or many land parcels because of thepossibility of a building straddling a parcel line.This relationship prop-erty could be defined so that the addition or removal of a buildingobject from the database would trigger a change in the properties of theland parcel(s) it belonged to (i.e., the properties of the number of build-ings on this parcel).A valve object in a water utility GIS could be related
81
to a pipe segment downstream in such a way that when the property ofthe valve is closed, water can no longer flow into the receiving pipewhen modeling water flow in the system.The ability to define relation-ships between objects is what makes it possible to associate behaviorwith objects. Object properties can act as triggers so that when theproperty is set to, say, true, some behavior is triggered in the object.Thatbehavior could be something as simple as changing the symbol on thedisplay when the object is clicked on.A maintenance crew with a globalpositioning system (GPS) that sends the real-time location to a dis-patcher could change status from working and not available to availablefor work and the symbol on the dispatcher’s display would change color,indicating availability for any nearby service calls. Or the behavior trig-gered by property states for objects could be more complex such as thesudden decrease in monitored pressure in a water main triggering theclosing of the immediately upstream and downstream valves in the dis-tribution system through a supervisory control and data acquisition(SCADA) system linked to a water utility GIS.
◆ Objects can belong to classes.When you consider the number and variety ofobjects that are in the real world, you realize what a challenging task it isto design good geographic databases to represent this real world. But for-tunately there are usually logical groups of objects in which you areinterested.A forestry company might take the standard object of a treeand create three classes of trees: trees that are good for pulp, dimensionlumber, and all other trees.A distribution company might group theobject we call a truck into a number of truck classes such as refrigerated,liquid bulk, dry bulk, and general cargo trucks.All these objects wouldhave their own properties, but they all belong to the superclass of objectwe call truck, which is different from the object class we call automobile.Both these object classes belong to a higher class of objects we mightcall road vehicles.All subclasses share the properties and behaviors of thesuperclass.
◆ Properties can be inherited. Combining the notions of hierarchical structureand properties, object-oriented systems are designed so that subclasses ofobjects inherit the properties of the superclass to which they belong. Inthe example of road vehicles all these classes of objects have a propertyof number of wheels and number of possible passengers and a propertyof a driver.That property is not mandatory — a road vehicle can existwithout a driver — but if it has a driver, it can have only one driver at atime. It could have multiple passengers, however. Each of the subclassessuch as truck or automobile inherits these properties from the superclassof road vehicle in addition to having its own properties.
Making the mental switch to thinking of real-world things as features in a layerof a geographic database to objects with properties, behavior, and relationshipswith other objects is difficult because the notion of layers goes so far back in car-tography, printing, and CAD. Many users will have no need for the additional
Designing Spatial Data82
Layers and Objects
capabilities that object-oriented databases provide. But through the same processthat object-oriented programming languages have almost completely replacedsequential programming systems, object-oriented geographic databases will even-tually replace the layer-based databases. For those people having difficulty with thetransition, however, it is possible to design a geographic database within an object-oriented system that looks and behaves exactly like a layered database. Going the other way, setting up an object-oriented database in a layer-based GIS is notpossible.
SERDs can be simple or complex; you do not need to set up relationshipsbetween objects nor must you program behavior into your objects.You can set upa simple database that replicates a layered database and, over time, define relation-ships and behaviors to make the data more active. Object orientation within thedatabase as well as within the programming system, however, has allowed GISs tomodel the real world more closely. In applications where the GIS has to supportthe actual manipulation of real-world features in real-time, these systems are veryuseful. If a valve can be turned on or off in the GIS and can control the flow ofvirtual water in the downstream distribution lines, you need only to add a com-munication link between the real valve and the GIS, and by changing the propertyof the valve in the GIS from open to closed, you can change the property of thereal valve as well. If a segment in a metropolitan transportation system is suddenlyclosed due to an accident, you can identify all planned routes of delivery trucksthat were supposed to cross that link in the next 2 hours and send a beeper mes-sage to all drivers to reroute around the closed link.The changing of a property ofa link from open to closed can trigger that message automatically if the system isset up that way. Over time all GISs will adopt object-oriented programming anddatabases, and the only layer-based systems will be those whose sole functions areto produce mapped output either to a computer screen or paper.
Construction of GIS systems has been going through radical changes over thelast few years.Traditional GIS deployments have been constructed using a combi-nation of spatial and attribute data that have been stored in separate file formatsand brought together through the process of linking the spatial feature to theattributes by some sort of a unique identifier, the so-called geo-relational model.Spatial data has been stored in varying proprietary file formats, and the attributefiles have typically been stored in database or relational database formats such as DBF (dBase) files, MS-Access tables, or Oracle/SQL tables.We have discussedthis issue previously when considering the geo-relational and SERD models fororganizing your spatial data, but it is at the implementation stage where the finaldecision needs to be made.
One of the leading GIS vendors, Environmental Systems Research Institute(ESRI), has traditionally used a file format known as the coverage. In more recentyears, with the move toward standards and interoperability, it introduced a file for-mat called a shape file, which is a fully documented and a nonproprietary formatfor the spatial data, and the attribute data are stored still in a DBF format. In veryrecent years the company developed a new format called the Geodatabase, its termfor a SERD, in which it stores both the spatial and attribute data in the database
83
itself.This concept is not new. Intergraph has been using this type of data storagemodel for quite a few years, but its solutions haven’t been marketed as widely, so ithasn’t caught on as well as ESRI’s solutions. Oracle introduced a technology calledOracle Spatial a number of years ago that also used this same methodology of stor-ing both spatial and attribute data in the same workspace.This caught on very wellin large organizations, but because of the relatively high cost of its products, it alsohasn’t been used as widely. Other database software developers have also producedspatial data solutions that would fall into the category of a SERD.
Based on trends that have been seem in these recent years, the concept of stor-ing all of the data in one place seems to be here to stay, at least until the next newrevolutionary concept is developed. Nonproprietary, easily accessible formats likethe shape file will probably exist as well and will allow for easier exchange of databetween different systems and platforms.
The decision of whether to use layers or an object-oriented SERD is animportant because it guides the design process. If you are building a set of inde-pendent layers, each layer is its own thing and can be designed separately. If you arebuilding an object-oriented SERD, you need to be aware of relationships betweenfeatures classes and explicitly describe those relationships; it forces you to think ofthe database as a single entity rather than a set of coincident layers.The shift fromlayers to SERDs will take some time, especially for those who are used to work-ing with layers.True objects, if carefully designed and constructed, represent thereal-world features much more closely than features in a layer, and any databasemodel that more closely approximates the world it abstracts is a better model.
Representing Geographic FeaturesIn introductory classes students are always taught that there are three classes ofgeographic vector features: points, line, and polygons. In advanced classes theylearn that there are many more types of geographic features and that not all geo-graphic information systems support all types. Certain types of geographic featuresare extremely useful in some applications and completely useless for others.A fulltopologic linear transportation network is essential for a GIS to support physicaldistribution but absolutely useless for one that is set up to facilitate the legal trans-fer of land. Both systems are GISs, but their model of the world is quite different.So it is important to understand the geographic nature of the features you need torepresent in your GIS so that you can acquire the right kind of software to modelthese features.
In the 1980s, as different software manufacturers started programming for newtypes of features, the U.S. federal government became concerned because differentorganizations within the government were purchasing different GISs, and theywere having trouble exchanging data. So in 1980, the USGS was designated thelead agency for dealing with this problem with respect to spatial data, and they ini-tiated a process which resulted 12 years later in the publication of the standard forthe transfer and exchange of spatial data, the Spatial Data Transfer Standard, orSDTS (FIPSPUB 173-1, 1994.) The most recent version was published in 1998
Designing Spatial Data84
Topologic Relationships
(ANSI NCITS 320-1998), and there will probably be additional changes as userscome up with different representations of real-world features that need to beexchanged between GISs.
It was the need to exchange and transfer real-world features that forced thecreators of the standard to think very clearly about exactly how to represent themfrom the top of the process (the data model) to the bottom (the physical file struc-ture on the computer).Although the many vendors of GIS software often do notuse the same terminology as SDTS, each of their supported data types — whateverthey call them — must conform to one of the SDTS data types if they wish to sellsystems to the federal government, a large market to be sure.The acceptance ofthese standards has not lived up to expectations, and creative people in the GISworld are regularly developing new ways to represent geographic features.We useSDTS as the foundation for our discussion principally because different GISsimplement different features and have their own internal names for these features.What SDTS calls an arc is not what a particular GIS might call an arc. SDTS atleast provides a common language for discussing types of geographic features.There are two profiles in the standard, one for raster or grid cell data and one fortopologic vector data.The discussion that follows is for the topologic vector pro-file. If you wish to understand the raster profile, you can find it on the SDTS Website, mcmcweb.er.usgs.gov/sdts/.
Topologic RelationshipsTopology is one of the most confusing and difficult to understand concepts in thedesign of spatial data sets partly because people often confuse it with topography.They are completely different things. If a data set has topology, it means that rela-tionships of adjacency (for two-dimensional features) or connectivity (connec-tions between linear or one-dimensional features) are explicitly stored in thedatabase. Geographers often make a distinction between absolute and relativelocation. The absolute location of a feature places it in a two- or three-dimen-sional coordinate space (e.g., latitude, longitude, and altitude).The relative locationis that feature’s location relative to other features (e.g., which other features areadjacent to it). It is possible to represent the absolute location of a feature in a dig-ital file with an ordered listing of the number pairs (x/longitude and y/latitude)that describe its location in a coordinate space. This is sometimes referred to asspaghetti vector data because, like a plate of cooked spaghetti, the lines may over-lay each other, but the system has no way of knowing that they do because eachline is stored independently of the other lines; whether a line crosses another is notstored and therefore not known to the system.You, with your birds eye view, cansee that the two lines intersect, but the software does not have that view of thedata; it sees the line only as a series of points in a file.
For topologic vector data, on the other hand, you must explicitly store the rela-tionships of adjacency or connectivity or be able to construct them as needed.Without the knowledge of adjacency and connectivity, you cannot execute spatialqueries. It is possible to query features based on their attributes or properties (i.e., display all the sales territories that had sales increases over 20 percent) but not
85
possible to locate all the sales territories adjacent to one particular territory toaggregate their information. Spatial querying is at the heart of what most users dowith their GIS, so you must have a data model that allows it to occur. In the earlydays of GIS when computer central processing units (CPUs) were small and slow,topology had to be stored explicitly in tables in the database, and spatial querieswere executed by making many hits, or reads, into those tables.As the processorsbecame more powerful and faster, it was no longer necessary to store the topologyin tables. Now we can execute the spatial queries through sophisticated indexingand searching procedures.The systems moved from complex data structures andsimple queries to simple data structures and complex queries, and the user sees thesame result.
Polygon topology is easier to visualize than to describe. Figure 4.4 shows two-polygon data sets, one with topology and one without.The nontopologic data setstores only the coordinates of the points where the line that outlines the polygonchanges direction.The first pair of points in each polygon is duplicated at the endto close the polygon. In this data structure the polygon that appears to be wherethe two overlap is not in the database.The bottom part of Figure 4.4 shows thesame polygons in a topologic structure, and it demonstrates the additional databasecomplexity that topology requires.A single file or table can hold the nontopologicinformation, but storing topology requires a linked set of several data tables.Thekey table in the set of tables shown here is the Chain_node table (often referredto as the Arc_Node table, but we are using the terminology of the SDTS); it ishere that the topology exists. Each chain has a specified node it comes from andone it goes to.This produces an implied direction, and that makes it possible toidentify the polygon to the right and left of the chain.The G-polygon table con-tains the identifiers of the chains that make it up.These chains are listed in clock-wise order, and if a chain needs to be reversed to keep the clockwise order, anegative sign is added. So, for example, G-polygon B is made up of chains 3 and 4,but to get the chains to go in clockwise order, they need to be reversed (see Table4.4 for a discussion of G-polygons). So it does not matter what the implied direc-tion of the chain is, but it does have to have one.This is determined by specifyingwhich is the from and which the to node.The node and chain tables do not con-tain topology, only the coordinates that describe the location of the nodes andchains.
For topology to exist in a G or GT-polygon data layer two conditions need tobe met:
◆ There must be a universe or background polygon. Because every chainmaking up the G-polygons must have a right and left polygon defined,their needs to be a polygon to the right or left of polygons that do nottouch any other polygon.The universe polygon provides for that. Nofeature in the database may extend beyond this universe polygon, so cor-rectly choosing the extent of that polygon is an important early step.Fortunately, if your area of interest extends beyond the current universepolygon, you can create a new one and rebuild the topology.
Designing Spatial Data86
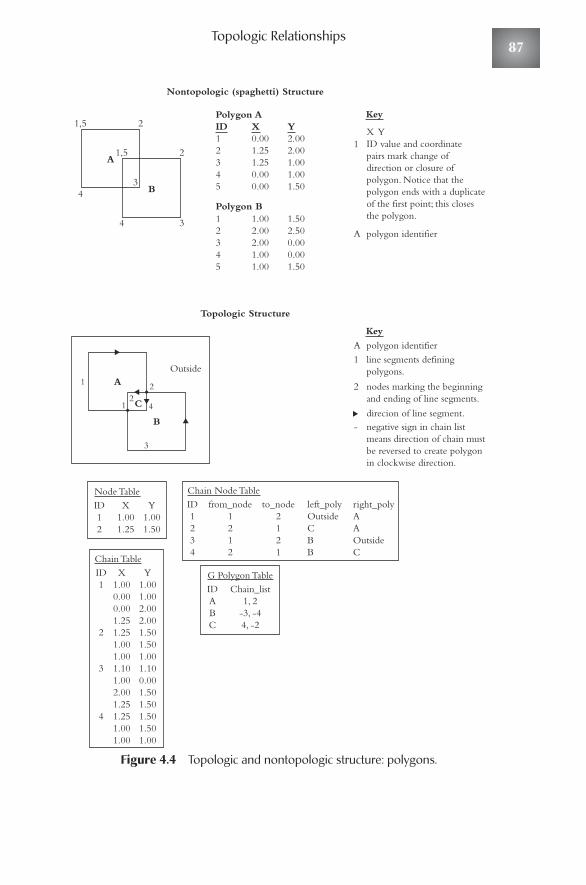
Topologic Relationships
Figure 4.4 Topologic and nontopologic structure: polygons.
1,5
4 B3
2
1,5
4 3
A
Polygon A
Nontopologic (spaghetti) Structure
ID X Y1 0.00 2.002 1.25 2.003 1.25 1.004 0.00 1.005 0.00 1.50
X YID value and coordinatepairs mark change ofdirection or closure ofpolygon. Notice that thepolygon ends with a duplicateof the first point; this closesthe polygon.
1
polygon identifierA
2
Key
Polygon B1 1.00 1.502 2.00 2.503 2.00 0.004 1.00 0.005 1.00 1.50
Topologic Structure
polygon identifierAline segments definingpolygons.
1
nodes marking the beginningand ending of line segments.
2
negative sign in chain listmeans direction of chain mustbe reversed to create polygonin clockwise direction.
-direcion of line segment.
Key
4
OutsideA 2
21
1
3
B
C
Chain Node TableID1234
from_node1212
to_node2121
left_polyOutsideCBB
right_polyAAOutsideC
G Polygon TableIDABC
Chain_list1, 2
-3, -44, -2
Node TableID12
X1.001.25
Y1.001.50
Chain TableID1
2
3
4
X1.000.000.001.251.251.001.001.101.002.001.251.251.001.00
Y1.001.002.002.001.501.501.001.100.001.501.501.501.501.00
87
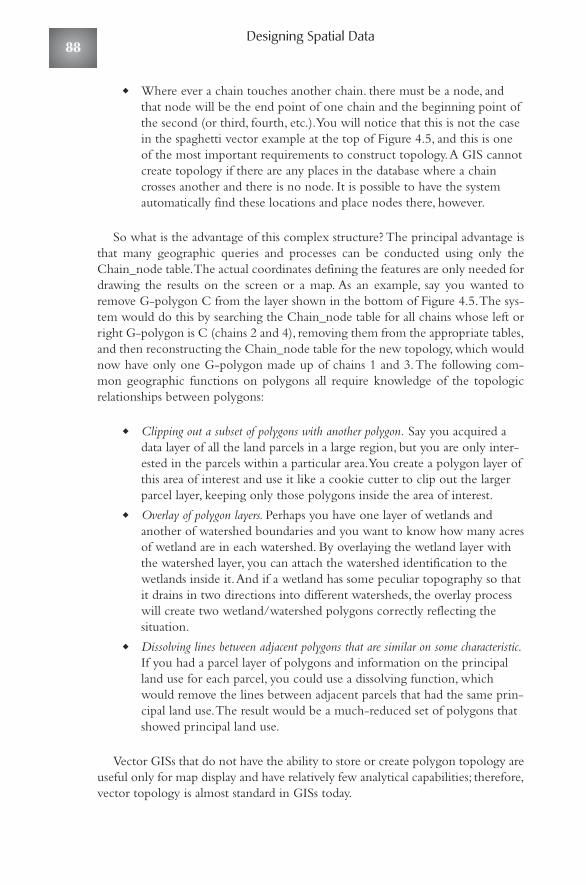
◆ Where ever a chain touches another chain. there must be a node, andthat node will be the end point of one chain and the beginning point ofthe second (or third, fourth, etc.).You will notice that this is not the casein the spaghetti vector example at the top of Figure 4.5, and this is oneof the most important requirements to construct topology.A GIS cannotcreate topology if there are any places in the database where a chaincrosses another and there is no node. It is possible to have the systemautomatically find these locations and place nodes there, however.
So what is the advantage of this complex structure? The principal advantage isthat many geographic queries and processes can be conducted using only theChain_node table.The actual coordinates defining the features are only needed fordrawing the results on the screen or a map. As an example, say you wanted toremove G-polygon C from the layer shown in the bottom of Figure 4.5.The sys-tem would do this by searching the Chain_node table for all chains whose left orright G-polygon is C (chains 2 and 4), removing them from the appropriate tables,and then reconstructing the Chain_node table for the new topology, which wouldnow have only one G-polygon made up of chains 1 and 3.The following com-mon geographic functions on polygons all require knowledge of the topologicrelationships between polygons:
◆ Clipping out a subset of polygons with another polygon. Say you acquired adata layer of all the land parcels in a large region, but you are only inter-ested in the parcels within a particular area.You create a polygon layer ofthis area of interest and use it like a cookie cutter to clip out the largerparcel layer, keeping only those polygons inside the area of interest.
◆ Overlay of polygon layers. Perhaps you have one layer of wetlands andanother of watershed boundaries and you want to know how many acresof wetland are in each watershed. By overlaying the wetland layer withthe watershed layer, you can attach the watershed identification to thewetlands inside it.And if a wetland has some peculiar topography so thatit drains in two directions into different watersheds, the overlay processwill create two wetland/watershed polygons correctly reflecting the situation.
◆ Dissolving lines between adjacent polygons that are similar on some characteristic.If you had a parcel layer of polygons and information on the principalland use for each parcel, you could use a dissolving function, whichwould remove the lines between adjacent parcels that had the same prin-cipal land use.The result would be a much-reduced set of polygons thatshowed principal land use.
Vector GISs that do not have the ability to store or create polygon topology areuseful only for map display and have relatively few analytical capabilities; therefore,vector topology is almost standard in GISs today.
Designing Spatial Data88
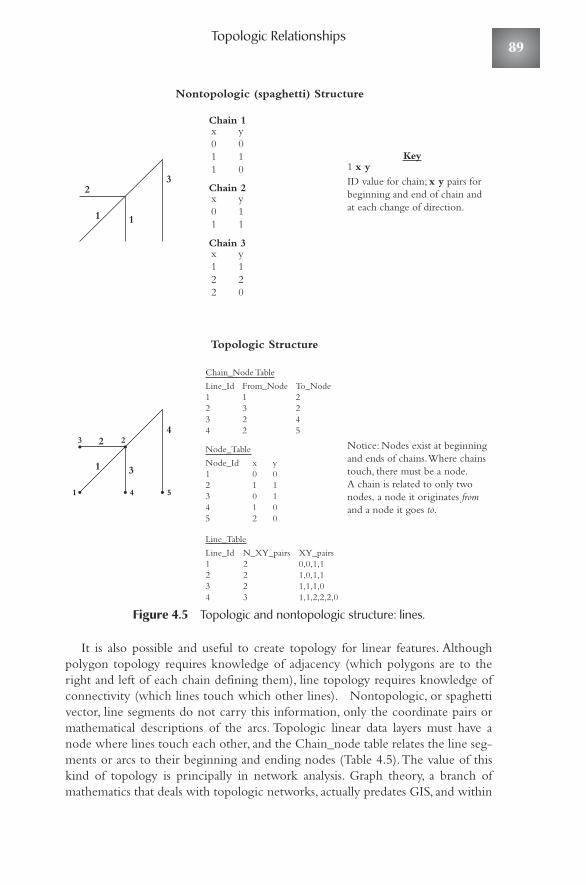
Topologic Relationships
Figure 4.5 Topologic and nontopologic structure: lines.
It is also possible and useful to create topology for linear features. Althoughpolygon topology requires knowledge of adjacency (which polygons are to theright and left of each chain defining them), line topology requires knowledge ofconnectivity (which lines touch which other lines). Nontopologic, or spaghettivector, line segments do not carry this information, only the coordinate pairs ormathematical descriptions of the arcs. Topologic linear data layers must have anode where lines touch each other, and the Chain_node table relates the line seg-ments or arcs to their beginning and ending nodes (Table 4.5).The value of thiskind of topology is principally in network analysis. Graph theory, a branch ofmathematics that deals with topologic networks, actually predates GIS, and within
1 1
32
Chain 1
Nontopologic (spaghetti) Structure
Key1 x yID value for chain; x y pairs forbeginning and end of chain andat each change of direction.
x y0 01 11 0
Chain 2x y0 11 1
Chain 3x y1 12 22 0
1 3
1 4 5
43 2 2
Chain_Node Table
Topologic Structure
Notice: Nodes exist at beginningand ends of chains. Where chainstouch, there must be a node.A chain is related to only twonodes, a node it originates fromand a node it goes to.
Line_Id1234
From_Node1322
To_Node2245
Node_Table
Node_Id12345
x y0 01 10 11 02 0
Line_Table
Line_Id1234
N_XY_pairs2223
XY_pairs0,0,1,11,0,1,11,1,1,01,1,2,2,2,0
89
the last 20 years or so GISs have been incorporating the analytical functions thatnetwork topology makes possible. These are some common functions you canperform if your data layer has linear topology:
◆ Find the shortest path between two locations. So long as the locations arenodes on the network, there are algorithms that will seek out the shortestdistance in time or distance between those two points across the network.
◆ Location-allocation. Given a set of demand points (e.g., grocery stores) anda set of supply points (e.g., warehouses), assign each grocery store to thenearest warehouse in the network. Location-allocation is an importantmodel in operations research (OR), an area of applied mathematics, andsome of the spatial modeling functions developed by OR practitionershave been incorporated into GIS.
◆ Find an alternate route. If a segment of a network is blocked or unavail-able, you can recalculate the new shortest route around the blockage.
◆ Create an optimum route to multiple nodes. Known as the traveling salesper-son problem, it is commonly used for school bus and garbage pickuprouting.This functionality in a network GIS will determine for you theleast-cost path through a network from a given starting point to a givenend point, stopping at a set of selected nodes in the network.
Because of the obvious advantages of the topologic vector data model, it hasbecome standard in GIS.When computers were much less powerful than those oftoday, the Chain_node polygon topology structure was needed because the com-puters could not hold large numbers of features in random access memory(RAM) at one time.With the explosion of computer memory and computationspeed, however, it is now possible to store vector information in the spaghetti vec-tor data model and create topology as needed in the computer’s memory but notin the database.This construction of on on-the the-fly topology is becoming morecommon in GIS and has several advantages.When topology is stored explicitly indata tables, the removal of a single feature requires the reconstruction of the topol-ogy of the entire layer of information.This process can consume significant time,and there is also the danger of losing some key information on relationshipsbetween tables, which destroys the topology as well.The shift from layered GISdatabases to object-oriented databases has also driven the move away from explicittopology maintained in the database to on-the-fly topology constructed whenand where needed. In a layered database the spatial data, the coordinates represent-ing the location of the features, are usually kept in a set of tables separate from theattribute information, what we know about the feature.
This geo-relational data structure for the topologic vector data model has beenaround for many years but is not well suited for the object-oriented data structure.In object-oriented GIS databases, the spatial and attribute information is storedtogether in a single record for each feature in the database. This simplicity of
Designing Spatial Data90
Types of Spatial Objects
storage means it is harder to lose features and easier to completely insert andremove features from the database without having to reconstruct the topologyevery time. To use an analogy of building a house, with the geo-relational, theexplicit topology structure to add a room to the house involves reconstructing theentire house after you put the new room on. But the system knows exactly whatother rooms the new room is next to. In the implicit topology, object-orienteddatabase, you can add the room to the house without affecting the other rooms.When it becomes necessary to know which rooms are next to the new room, thesystem can process the data and discover only that piece of information. Generally,object-oriented implicit topologic databases allow you to deal with the pieceswithout affecting the entire database, but the geo-relational data structure meansyou have to deal with the entire database every time.As databases get very large,this clearly becomes an issue of processing capability and speed.
The type of topology we discussed is implemented in the database through sets of related tables, hard-wired into the data. ESRI’s rules-based topology, thegeodatabase, allows users to specify simple or complex topologic relationships forsingle- or between-feature layers. A simple rule for G-polygons might insist that there be no line segments dangling in the data set.A feature that violated thatrule would be flagged or identified and the user prompted to fix it or allow anexception to the rule.A topologic relationship between layers might require thatall features from one layer (e.g., buildings) lie completely inside a single feature ofanother layer (e.g., land parcels). Buildings that intersected more than one landparcel would be flagged for correction or exception. Within a network there could be a rule that all line segments be linked to at least one other line segment(i.e., there can be no segments that are not part of the network). Rules-basedtopology can get complex; there are 25 possible rules that can be applied in thefirst version of ESRI’s topology and more are planned. Unlike arc-node topology,this type of topology is not directly stored in the database. Rather, the rules areevaluated on the fly during editing when the user expressly requests the rules tobe implemented.
Types of Spatial ObjectsThe creators of SDTS chose to use a classification system based on the number ofspatial dimensions the object requires in the database.There is a hierarchical com-ponent to this structure as well; you cannot describe a line without knowing thepoints that make up at least the beginning point of the line and some way todescribe where the line goes from there. One-dimensional lines, which have pointsas their beginnings and ends, bound two-dimensional features, and everywherethey change direction.A GIS is an abstraction of reality, and one of the most impor-tant abstractions you have to make is do decide what kind of digital feature, orSDTS data type, you are going to associate with the real-world features you mustdeal with:
91
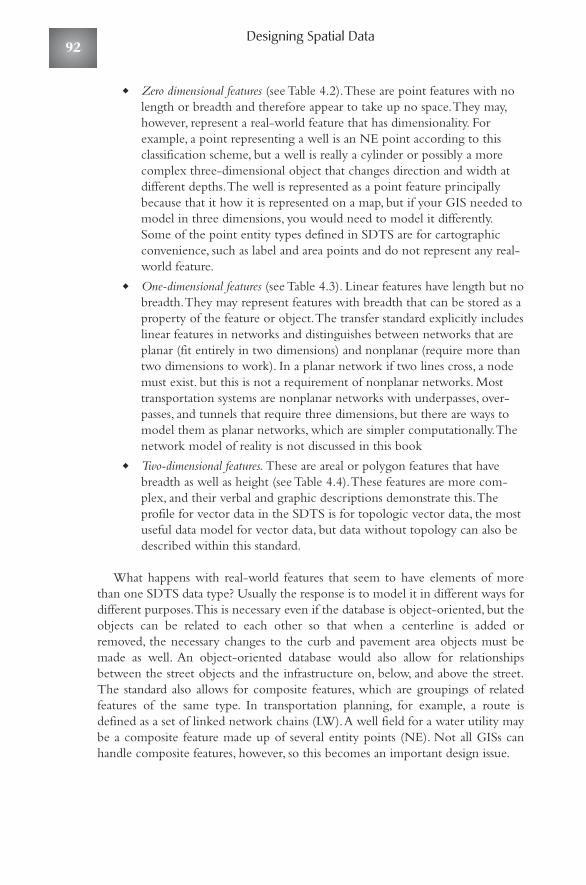
◆ Zero dimensional features (see Table 4.2).These are point features with nolength or breadth and therefore appear to take up no space.They may,however, represent a real-world feature that has dimensionality. Forexample, a point representing a well is an NE point according to thisclassification scheme, but a well is really a cylinder or possibly a morecomplex three-dimensional object that changes direction and width atdifferent depths.The well is represented as a point feature principallybecause that it how it is represented on a map, but if your GIS needed tomodel in three dimensions, you would need to model it differently.Some of the point entity types defined in SDTS are for cartographicconvenience, such as label and area points and do not represent any real-world feature.
◆ One-dimensional features (see Table 4.3). Linear features have length but nobreadth.They may represent features with breadth that can be stored as aproperty of the feature or object.The transfer standard explicitly includeslinear features in networks and distinguishes between networks that areplanar (fit entirely in two dimensions) and nonplanar (require more thantwo dimensions to work). In a planar network if two lines cross, a nodemust exist. but this is not a requirement of nonplanar networks. Mosttransportation systems are nonplanar networks with underpasses, over-passes, and tunnels that require three dimensions, but there are ways tomodel them as planar networks, which are simpler computationally.Thenetwork model of reality is not discussed in this book
◆ Two-dimensional features. These are areal or polygon features that havebreadth as well as height (see Table 4.4).These features are more com-plex, and their verbal and graphic descriptions demonstrate this.Theprofile for vector data in the SDTS is for topologic vector data, the mostuseful data model for vector data, but data without topology can also bedescribed within this standard.
What happens with real-world features that seem to have elements of morethan one SDTS data type? Usually the response is to model it in different ways fordifferent purposes.This is necessary even if the database is object-oriented, but theobjects can be related to each other so that when a centerline is added orremoved, the necessary changes to the curb and pavement area objects must bemade as well. An object-oriented database would also allow for relationshipsbetween the street objects and the infrastructure on, below, and above the street.The standard also allows for composite features, which are groupings of relatedfeatures of the same type. In transportation planning, for example, a route isdefined as a set of linked network chains (LW).A well field for a water utility maybe a composite feature made up of several entity points (NE). Not all GISs canhandle composite features, however, so this becomes an important design issue.
Designing Spatial Data92
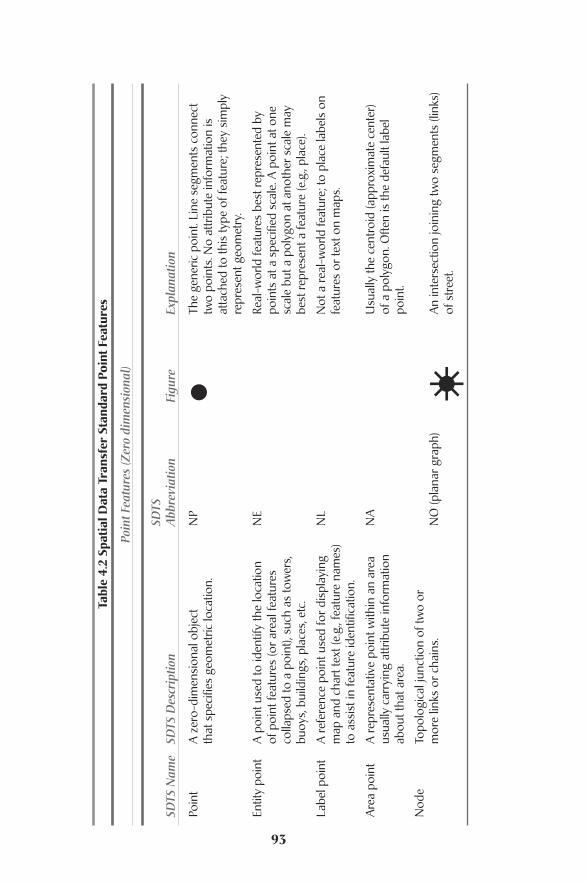
Tabl
e 4.
2 Sp
atia
l Dat
a Tr
ansf
er S
tand
ard
Poin
t Fea
ture
s
Poin
t Fea
ture
s (Z
ero
dim
ensi
onal
)
SDTS
SD
TS N
ame
SDTS
Des
crip
tion
Abb
revi
atio
nFi
gure
Expl
anat
ion
Poin
tA
zer
o-di
men
sion
al o
bjec
t N
PTh
e ge
neric
poi
nt. L
ine
segm
ents
con
nect
th
at s
peci
fies
geom
etric
loca
tion.
two
poin
ts. N
o at
trib
ute
info
rmat
ion
is
atta
ched
to th
is ty
pe o
f fea
ture
; the
y si
mpl
y re
pres
ent g
eom
etry
.
Entit
y po
int
A p
oint
use
d to
iden
tify
the
loca
tion
NE
Real
-wor
ld fe
atur
es b
est r
epre
sent
ed b
y of
poi
nt fe
atur
es (o
r are
al fe
atur
es
poin
ts a
t a s
peci
fied
scal
e. A
poi
nt a
t one
co
llaps
ed to
a p
oint
), su
ch a
s to
wer
s, sc
ale
but a
pol
ygon
at a
noth
er s
cale
may
bu
oys,
build
ings
, pla
ces,
etc.
best
repr
esen
t a fe
atur
e (e
.g.,
plac
e).
Labe
l poi
ntA
refe
renc
e po
int u
sed
for d
ispl
ayin
g N
LN
ot a
real
-wor
ld fe
atur
e; to
pla
ce la
bels
on
map
and
cha
rt te
xt (e
.g.,
feat
ure
nam
es)
feat
ures
or t
ext o
n m
aps.
to a
ssis
t in
feat
ure
iden
tific
atio
n.
Are
a po
int
A re
pres
enta
tive
poin
t with
in a
n ar
ea
NA
Usu
ally
the
cent
roid
(app
roxi
mat
e ce
nter
) us
ually
car
ryin
g at
trib
ute
info
rmat
ion
of a
pol
ygon
. Ofte
n is
the
defa
ult l
abel
ab
out t
hat a
rea.
poin
t.
Nod
eTo
polo
gica
l jun
ctio
n of
two
or
mor
e lin
ks o
r cha
ins.
NO
(pla
nar g
raph
) A
n in
ters
ectio
n jo
inin
g tw
o se
gmen
ts (l
inks
) of
str
eet.
93
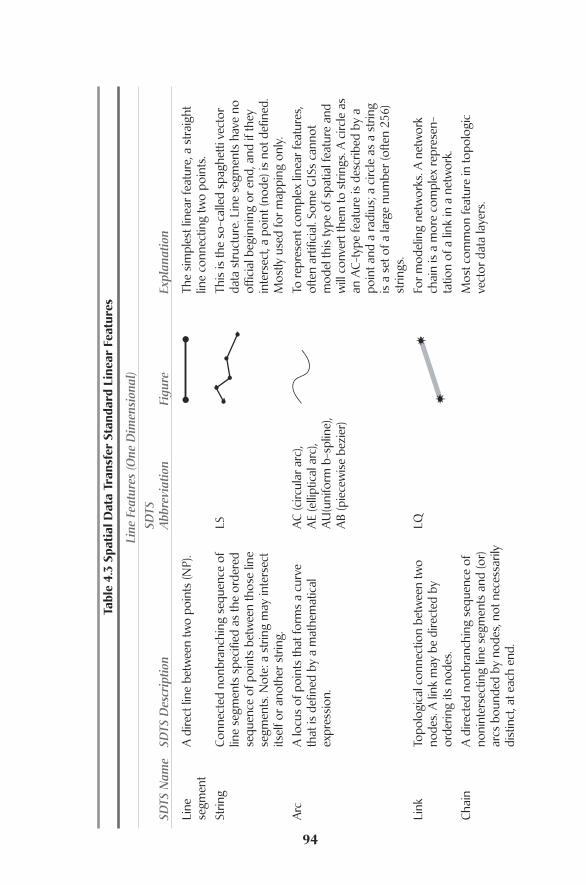
Tabl
e 4.
3 Sp
atia
l Dat
a Tr
ansf
er S
tand
ard
Line
ar F
eatu
res
Line
Fea
ture
s (O
ne D
imen
sion
al)
SDTS
SD
TS N
ame
SDTS
Des
crip
tion
Abb
revi
atio
nFi
gure
Expl
anat
ion
Line
A
dire
ct li
ne b
etw
een
two
poin
ts (N
P).
The
sim
ples
t lin
ear f
eatu
re, a
str
aigh
t se
gmen
tlin
e co
nnec
ting
two
poin
ts.
Strin
gCo
nnec
ted
nonb
ranc
hing
seq
uenc
e of
LS
This
is th
e so
-cal
led
spag
hetti
vec
tor
line
segm
ents
spe
cifie
d as
the
orde
red
data
str
uctu
re. L
ine
segm
ents
hav
e no
se
quen
ce o
f poi
nts
betw
een
thos
e lin
e of
ficia
l beg
inni
ng o
r end
, and
if th
ey
segm
ents
. Not
e: a
str
ing
may
inte
rsec
t in
ters
ect,
a po
int (
node
) is
not d
efin
ed.
itsel
f or a
noth
er s
trin
g.M
ostly
use
d fo
r map
ping
onl
y.A
rcA
locu
s of
poi
nts
that
form
s a
curv
e A
C (c
ircul
ar a
rc),
To re
pres
ent c
ompl
ex li
near
feat
ures
, th
at is
def
ined
by
a m
athe
mat
ical
A
E (e
llipt
ical
arc
), of
ten
artif
icia
l. So
me
GIS
s ca
nnot
ex
pres
sion
.A
U(u
nifo
rm b
-spl
ine)
, m
odel
this
type
of s
patia
l fea
ture
and
A
B (p
iece
wis
e be
zier
)w
ill c
onve
rt th
em to
str
ings
. A c
ircle
as
an A
C-ty
pe fe
atur
e is
des
crib
ed b
y a
poin
t and
a ra
dius
; a c
ircle
as
a st
ring
is a
set
of a
larg
e nu
mbe
r (of
ten
256)
st
rings
.Li
nkTo
polo
gica
l con
nect
ion
betw
een
two
LQFo
r mod
elin
g ne
twor
ks. A
net
wor
k no
des.
A li
nk m
ay b
e di
rect
ed b
y ch
ain
is a
mor
e co
mpl
ex re
pres
en-
orde
ring
its n
odes
.ta
tion
of a
link
in a
net
wor
k.Ch
ain
A d
irect
ed n
onbr
anch
ing
sequ
ence
of
Mos
t com
mon
feat
ure
in to
polo
gic
noni
nter
sect
ing
line
segm
ents
and
(or)
vect
or d
ata
laye
rs.
arcs
bou
nded
by
node
s, no
t nec
essa
rily
dist
inct
, at e
ach
end.
94
Spec
ial C
ases
of C
hain
s
SDTS
SD
TS N
ame
SDTS
Des
crip
tion
Abb
revi
atio
nFi
gure
Expl
anat
ion
Com
plet
e A
cha
in th
at e
xplic
itly
refe
renc
es le
ft
LEA
par
t of a
rc-n
ode
topo
logy
.ch
ain
andr
ight
pol
ygon
s an
d st
art a
nd
end
node
s. It
is a
com
pone
nt o
f a
two-
dim
ensi
onal
man
ifold
.A
rea
chai
nA
cha
in th
at e
xplic
itly
refe
renc
es le
ft LL
A p
art o
f arc
-nod
e to
polo
gy.
and
right
pol
ygon
s an
d no
t sta
rt a
nd
end
node
s. It
is a
com
pone
nt o
f a
two-
dim
ensi
onal
man
ifold
.
Net
wor
k A
cha
in th
at e
xplic
itly
refe
renc
es s
tart
LW
(pla
nar
chai
nan
d en
d no
des
and
not l
eft a
nd ri
ght
netw
ork)
, po
lygo
ns. I
t is
a co
mpo
nent
of a
LY
(non
-pla
nar
netw
ork.
netw
ork)
Ring
A s
eque
nce
of n
onin
ters
ectin
g ch
ains
or
str
ings
and
(or)
arcs
, with
clo
sure
. A
ring
repr
esen
ts a
clo
sed
boun
dary
bu
t not
the
inte
rior a
reas
insi
de th
e cl
osed
bou
ndar
y.G
-rin
gA
ring
cre
ated
from
str
ings
and
RS
(rin
g of
str
ings
), (o
r) ar
cs.
RA (r
ing
of a
rcs,
RM (r
ing
of m
ixed
co
mpo
sitio
n)G
T-rin
gA
ring
cre
ated
from
com
plet
e an
d RU
(or)
area
cha
ins.
95

Designing Spatial Data96
How They Did It — Selecting Software to Support Dynamic Segmentation
People who are explaining GIS to novices quickly learn to discusspoints, lines, and polygons as the fundamental features of a GIS. But asthe tables in the section on the SDTS demonstrate, there are additionaltypes of features that can be modeled in a GIS. Of particular importanceto transportation planners and engineers is the feature known as aroute. A route is a (usually) connected set of lines that make up a singlemanagement unit (e.g., PA Route 34). Although the GIS needs tomanage all the line segments that make up that route, it is the routethat is the principal management unit. It is the feature that getsupgraded, has other facilities and features associated with it, and hasbeen the principal geographic feature for transportation planning andengineering since well before GIS.Secondly, this group of professionals measures location differentlyfrom others. Most GISs rely on latitude and longitude or someprojected coordinate system to measure the where in the system, but inapplications using principally linear features, location along the route orfeature of interest is a simpler, and traditional, way of locating things;this is called linear referencing. A feature, such as a sign, exists at somedistance along a route that has a known beginning point. So a locationsuch as mile 5.432 on Route 34 is as meaningful and locates the sign aswell as the x/y coordinate pair that also locates it. So instead of a pointbeing located with its x/y values, it has x, y, and m values where mrepresents the distance along the route. If a GIS supports dynamicsegmentation, it is possible to attach multiple sets of attributes to anysection of a route. Linear features along the route such as sections ofpavement for management purposes can be described in a table with abeginning and ending location along the route. Within that samesection of route there will be other features like signs that have theirroute location stored as a single point value along the route. You canalso specify side of the route and offset so that it will plot in its correctlocation. It is easy to see how important this data structure is toorganizations that deal with transportation construction and planningand any organization with interests that are principally linear ratherthan areal in nature.For this reason, many transportation planning and engineeringinstallations have selected software systems that support this datastructure. As Eric Solomon of the Transportation and Civil EngineeringDivision of provincial government in Alberta wrote to one of theauthors in email, “Our software was selected through a comparison ofproducts (Intergraph, ESRI, and AutoDesk Map Guide) in 1997. TheDepartment was a long time client of Intergraph, and it was more of aninformal process to validate that we were using the best vendor. Sincewe had a legacy of Intergraph data (Microstation, MGE, IPLOT), andsince Intergraph still seemed to best support dynamic segmentation, westayed with what we had.”
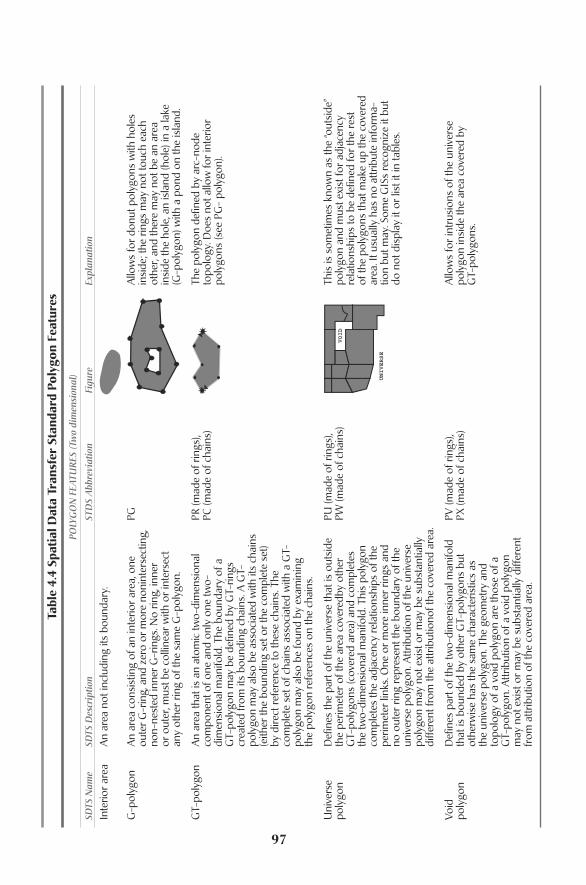
Tabl
e 4.
4 Sp
atia
l Dat
a Tr
ansf
er S
tand
ard
Poly
gon
Feat
ures
POLY
GO
N F
EATU
RES
(Tw
o di
men
sion
al)
SDTS
Nam
eSD
TS D
escr
iptio
nST
DS
Abb
revi
atio
nFi
gure
Expl
anat
ion
Inte
rior a
rea
An
area
not
incl
udin
g its
bou
ndar
y.
G-p
olyg
onA
n ar
ea c
onsi
stin
g of
an
inte
rior a
rea,
one
PG
Allo
ws
for d
onut
pol
ygon
s w
ith h
oles
ou
ter G
-rin
g, a
nd z
ero
or m
ore
noni
nter
sect
ing,
in
side
; the
ring
s m
ay n
ot to
uch
each
no
n-ne
sted
inne
r G-r
ings
. No
ring,
inne
r ot
her,
and
ther
e m
ay n
ot b
e an
are
a or
out
er, m
ust b
e co
lline
ar w
ith o
r int
erse
ct
insi
de th
e ho
le, a
n is
land
(hol
e) in
a la
ke
any
othe
r rin
g of
the
sam
e G
-pol
ygon
.(G
-pol
ygon
) with
a p
ond
on th
e is
land
.
GT-
poly
gon
An
area
that
is a
n at
omic
two-
dim
ensi
onal
PR
(mad
e of
ring
s),
The
poly
gon
defin
ed b
y ar
c-no
de
com
pone
nt o
f one
and
onl
y on
e tw
o-PC
(mad
e of
cha
ins)
to
polo
gy. D
oes
not a
llow
for i
nter
ior
dim
ensi
onal
man
ifold
. The
bou
ndar
y of
a
poly
gons
(see
PG
- po
lygo
n).
GT-
poly
gon
may
be
defin
ed b
y G
T-rin
gs
crea
ted
from
its
boun
ding
cha
ins.
A G
T-po
lygo
n m
ay a
lso
be a
ssoc
iate
d w
ith it
s ch
ains
(e
ither
the
boun
ding
set
or t
he c
ompl
ete
set)
by d
irect
refe
renc
e to
thes
e ch
ains
. The
co
mpl
ete
set o
f cha
ins
asso
ciat
ed w
ith a
GT-
poly
gon
may
als
o be
foun
d by
exa
min
ing
the
poly
gon
refe
renc
es o
n th
e ch
ains
.
Uni
vers
e D
efin
es th
e pa
rt o
f the
uni
vers
e th
at is
out
side
PU
(mad
e of
ring
s),
This
is s
omet
imes
kno
wn
as th
e “o
utsi
de”
poly
gon
the
perim
eter
of t
he a
rea
cove
redb
y ot
her
PW (m
ade
of c
hain
s)po
lygo
n an
d m
ust e
xist
for a
djac
ency
G
T-po
lygo
ns (c
over
ed a
rea)
and
com
plet
es
rela
tions
hips
to b
e de
fined
for t
he re
st
the
two-
dim
ensi
onal
man
ifold
. Thi
s po
lygo
n of
the
poly
gons
that
mak
e up
the
cove
red
com
plet
es th
e ad
jace
ncy
rela
tions
hips
of t
he
area
. It u
sual
ly h
as n
o at
trib
ute
info
rma-
perim
eter
link
s. O
ne o
r mor
e in
ner r
ings
and
tio
n bu
t may
. Som
e G
ISs
reco
gniz
e it
but
no o
uter
ring
repr
esen
t the
bou
ndar
y of
the
do n
ot d
ispl
ay it
or l
ist i
t in
tabl
es.
univ
erse
pol
ygon
. Attr
ibut
ion
of th
e un
iver
se
poly
gon
may
not
exi
st o
r may
be
subs
tant
ially
di
ffere
nt fr
om th
e at
trib
utio
nof t
he c
over
ed a
rea.
Void
D
efin
es p
art o
f the
two-
dim
ensi
onal
man
ifold
PV
(mad
e of
ring
s),
Allo
ws
for i
ntru
sion
s of
the
univ
erse
po
lygo
nth
at is
bou
nded
by
othe
r GT-
poly
gons
but
PX
(mad
e of
cha
ins)
poly
gon
insi
de th
e ar
ea c
over
ed b
y ot
herw
ise
has
the
sam
e ch
arac
teris
tics
as
GT-
poly
gons
.th
e un
iver
se p
olyg
on. T
he g
eom
etry
and
to
polo
gy o
f a v
oid
poly
gon
are
thos
e of
a
GT-
poly
gon.
Attr
ibut
ion
of a
voi
d po
lygo
n m
ay n
ot e
xist
or m
ay b
e su
bsta
ntia
lly d
iffer
ent
from
attr
ibut
ion
of th
e co
vere
d ar
ea.
97
Issues around the Third DimensionPaper and computer screens are two dimensional and the world is three dimen-sional; incorporating the third dimension into GIS has been an ongoing struggle.GIS evolved partly out of the need to transform paper maps into digital form,and paper has only two usable dimensions. Cartographers have developed severalconventions for representing the third dimension — elevation, topography, or ter-rain — on paper and computer screens. Most common is the use of contour lines(hypsography), a straight-down projection of the third dimension onto the two-dimensional paper surface. Requiring more craft and skill, shaded relief and ana-lytical hill shading are ways to depict the third dimension on a paper map orcomputer screen.The key elements of the third dimension that sometimes need tobe modeled in a GIS are as follows:
◆ Elevation.The height of a part of the real world above a chosen three-dimensional starting point (e.g., mean sea level).
◆ Slope.The change in elevation between two points over a given distance.◆ Aspect.The compass direction a part of the real-world faces.
Incorporating these and more complex elements of the third dimension suchas drainage basins and networks into a GIS is not an easy task, and an organizationthat is considering a GIS should expressly deal with the questions of whether andhow to do this.
In the raster profile, SDTS briefly mentions a three-dimensional data object,the voxel. In addition to width and breadth the voxel has height. Using voxels tomodel reality is critical in many application areas. In the environmental field truethree-dimensional systems are used in oceanography, meteorology, and climatol-ogy. And modeling in three dimensions at the scale of the human body is at thecore of magnetic resonating imagery (MRI) and three-dimensional image holog-raphy.These are very specialized systems, and there is no implementation of theuse of voxels in any commercially available system that calls itself a GIS. Part of theproblem is the sheer size of the data sets. In a two-dimensional raster if youdecrease the size of the pixels by half, say, from 10 to 5 m, or extend the study areaa given distance in x and y, you increase the number of cells by 4 times. In a three-dimensional voxel model this is an eightfold increase. Even though computingspeed and abilities are increasing rapidly, it takes very powerful computers to han-dle sizable three-dimensional voxel data sets.
The raster data model incorporates elements of the third dimension as values ina cell (see Figure 4.6).This is sometimes referred to as a 2.5-D model because theelevation is not directly part of the model but is stored as an attribute of a two-dimensional pixel. These models are also referred to as digital elevation models(DEMs) or digital terrain models (DTMs).The use of rasters to store and modelelevation, slope, and aspect is one of the real strengths of the raster model. Someprincipally vector GISs directly incorporate the ability to handle the raster datamodel and treat the third dimension in this fashion, and some provide this func-tionality as add-on software components. So an important part of assessing needsis to understand exactly how the third dimension will be modeled, if at all.
Designing Spatial Data98
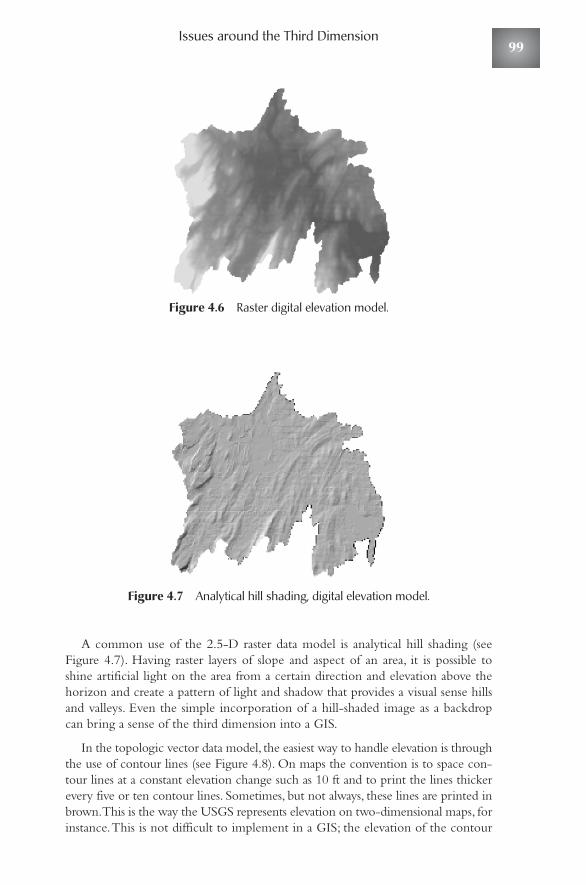
Issues around the Third Dimension
Figure 4.6 Raster digital elevation model.
Figure 4.7 Analytical hill shading, digital elevation model.
A common use of the 2.5-D raster data model is analytical hill shading (seeFigure 4.7). Having raster layers of slope and aspect of an area, it is possible toshine artificial light on the area from a certain direction and elevation above thehorizon and create a pattern of light and shadow that provides a visual sense hillsand valleys. Even the simple incorporation of a hill-shaded image as a backdropcan bring a sense of the third dimension into a GIS.
In the topologic vector data model, the easiest way to handle elevation is throughthe use of contour lines (see Figure 4.8). On maps the convention is to space con-tour lines at a constant elevation change such as 10 ft and to print the lines thickerevery five or ten contour lines. Sometimes, but not always, these lines are printed inbrown.This is the way the USGS represents elevation on two-dimensional maps, forinstance.This is not difficult to implement in a GIS; the elevation of the contour
99
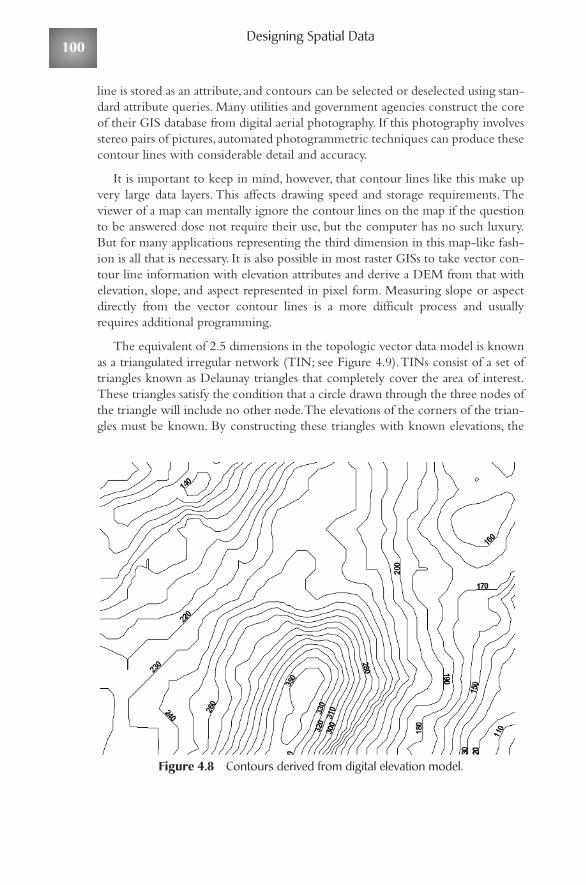
line is stored as an attribute, and contours can be selected or deselected using stan-dard attribute queries. Many utilities and government agencies construct the coreof their GIS database from digital aerial photography. If this photography involvesstereo pairs of pictures, automated photogrammetric techniques can produce thesecontour lines with considerable detail and accuracy.
It is important to keep in mind, however, that contour lines like this make upvery large data layers. This affects drawing speed and storage requirements. Theviewer of a map can mentally ignore the contour lines on the map if the questionto be answered dose not require their use, but the computer has no such luxury.But for many applications representing the third dimension in this map-like fash-ion is all that is necessary. It is also possible in most raster GISs to take vector con-tour line information with elevation attributes and derive a DEM from that withelevation, slope, and aspect represented in pixel form. Measuring slope or aspectdirectly from the vector contour lines is a more difficult process and usuallyrequires additional programming.
The equivalent of 2.5 dimensions in the topologic vector data model is knownas a triangulated irregular network (TIN; see Figure 4.9).TINs consist of a set oftriangles known as Delaunay triangles that completely cover the area of interest.These triangles satisfy the condition that a circle drawn through the three nodes ofthe triangle will include no other node.The elevations of the corners of the trian-gles must be known. By constructing these triangles with known elevations, the
Figure 4.8 Contours derived from digital elevation model.
Designing Spatial Data100
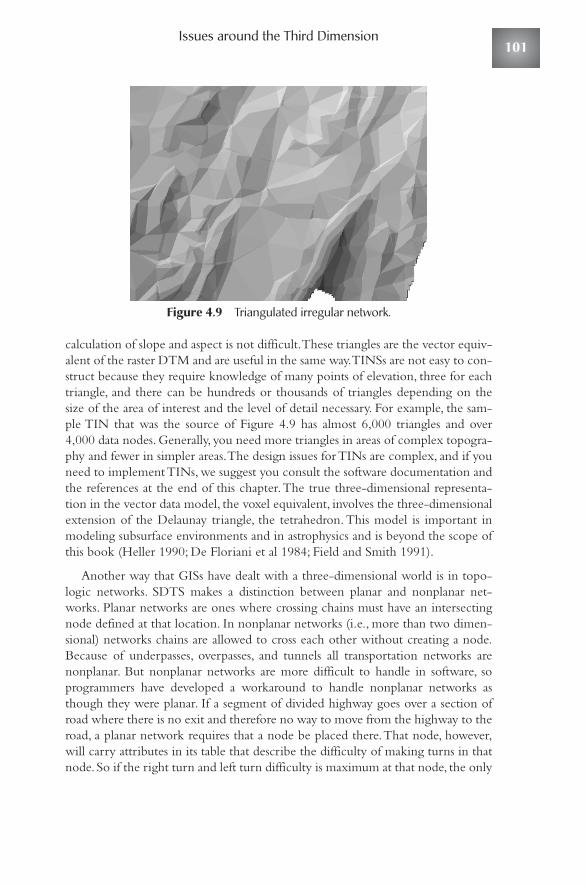
Issues around the Third Dimension
Figure 4.9 Triangulated irregular network.
calculation of slope and aspect is not difficult.These triangles are the vector equiv-alent of the raster DTM and are useful in the same way.TINSs are not easy to con-struct because they require knowledge of many points of elevation, three for eachtriangle, and there can be hundreds or thousands of triangles depending on thesize of the area of interest and the level of detail necessary. For example, the sam-ple TIN that was the source of Figure 4.9 has almost 6,000 triangles and over4,000 data nodes. Generally, you need more triangles in areas of complex topogra-phy and fewer in simpler areas.The design issues for TINs are complex, and if youneed to implement TINs, we suggest you consult the software documentation andthe references at the end of this chapter.The true three-dimensional representa-tion in the vector data model, the voxel equivalent, involves the three-dimensionalextension of the Delaunay triangle, the tetrahedron. This model is important inmodeling subsurface environments and in astrophysics and is beyond the scope ofthis book (Heller 1990; De Floriani et al 1984; Field and Smith 1991).
Another way that GISs have dealt with a three-dimensional world is in topo-logic networks. SDTS makes a distinction between planar and nonplanar net-works. Planar networks are ones where crossing chains must have an intersectingnode defined at that location. In nonplanar networks (i.e., more than two dimen-sional) networks chains are allowed to cross each other without creating a node.Because of underpasses, overpasses, and tunnels all transportation networks arenonplanar. But nonplanar networks are more difficult to handle in software, soprogrammers have developed a workaround to handle nonplanar networks asthough they were planar. If a segment of divided highway goes over a section ofroad where there is no exit and therefore no way to move from the highway to theroad, a planar network requires that a node be placed there.That node, however,will carry attributes in its table that describe the difficulty of making turns in thatnode. So if the right turn and left turn difficulty is maximum at that node, the only
101
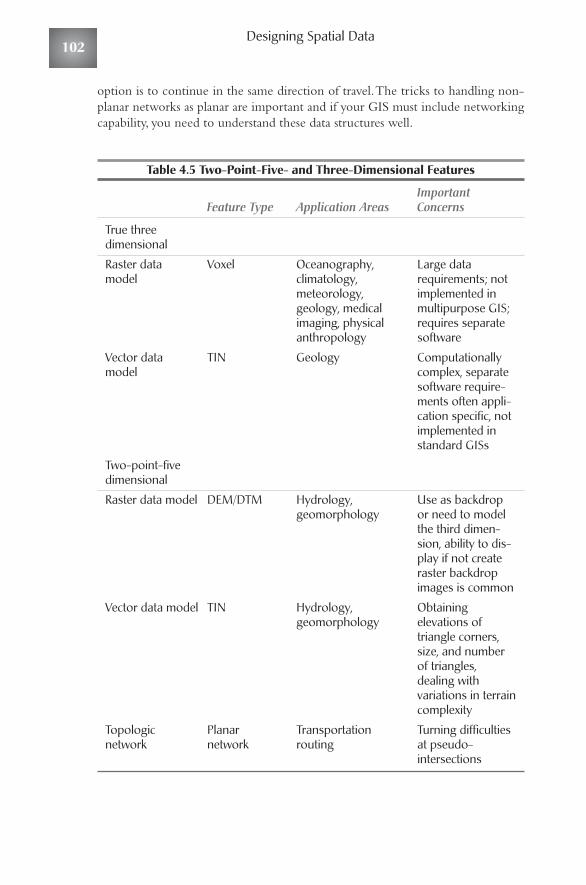
option is to continue in the same direction of travel.The tricks to handling non-planar networks as planar are important and if your GIS must include networkingcapability, you need to understand these data structures well.
Table 4.5 Two-Point-Five- and Three-Dimensional Features
Important Feature Type Application Areas Concerns
True three dimensional
Raster data Voxel Oceanography, Large data model climatology, requirements; not
meteorology, implemented in geology, medical multipurpose GIS; imaging, physical requires separate anthropology software
Vector data TIN Geology Computationally model complex, separate
software require-ments often appli-cation specific, notimplemented instandard GISs
Two-point-fivedimensional
Raster data model DEM/DTM Hydrology, Use as backdrop geomorphology or need to model
the third dimen-sion, ability to dis-play if not createraster backdropimages is common
Vector data model TIN Hydrology, Obtaining geomorphology elevations of
triangle corners,size, and numberof triangles, dealing with variations in terraincomplexity
Topologic Planar Transportation Turning difficulties network network routing at pseudo-
intersections
Designing Spatial Data102
Accuracy, Precision, and Completeness
As the preceding discussions indicate, incorporating elevation and its associatedderivatives of slope and aspect is not a simple matter in a GIS (see Table 4.5).Themathematics and programming necessary to accomplish this have been around forat least 15 or 20 years, and yet the difficulties of implementing even a 2.5-D datamodel in vector GISs have stymied many users. But it can be critical. For example,even calculations of distances traveled over a network vary depending on theunderlying topography.The distance from point A to point B in a flat, or planar,environment is a simple application of the Pythagorean theorem, C2 = A2 + B2.Calculating that distance over a complex terrain model is not nearly as simple.Theeffortless inclusion of the third dimension in vector GISs is probably a decade ormore away. Until then, designers need to consider very carefully whether and howthey will include the real-world elements of elevation, slope, and aspect.
Accuracy, Precision, and CompletenessEnsuring that the coordinates attached to the features in your GIS database areclose to where they are in the real world is always a critical design concern.Thereare a number of factors that are important with respect to accuracy.The first is thepositional accuracy of the data in the system. Positional accuracy is defined as theoverall reliability of how close a feature is represented relative to its actual positionon the surface of the earth. Positional accuracy is usually documented with a state-ment that a certain percentage (say 95 percent) of the visible features are within acertain distance (say, 2.5 ft) of the real-world location as determined by a moreaccurate method. Depending on the application of the GIS, the actual physicallocation of a feature is important to know when you need to make decisions relat-ing a feature on one layer and a feature on another layer in the system. Whendesigning, implementing, and using data in a system, you need to take great care toensure that measurements and decisions made with the system are based on thelayer with the lowest level of positional accuracy.A common error in the use of asystem is to combine two layers with differing levels of positional accuracy andmake measurements on the combined layer as though it were as positionally accu-rate as the most accurate, not the least accurate, source layer. Often the result canresult in improper decisions.
More important to most GIS applications is the relative accuracy of the featuresin the system.The relative accuracy is defined as the overall reliability of how closea feature is to another feature on the same layer. It is possible to have a layer witha high level of relative accuracy but a low level of positional accuracy. For exam-ples, features can be located using either conventional surveying techniques orGPS and have a very high level of relative accuracy (i.e., the measurements of dis-tances between features could be very close to what they are in the real world).Atthe same time, unless the data are properly tied into a standardized coordinate sys-tem, the level of positional accuracy could be quite low. Again, you need to take
103

care that the data development strategy includes processes to correct the positionalaccuracy of features and documents the methods used.
Finally, the last type of accuracy important in spatial data design is absoluteaccuracy, which is a combination of positional and relative accuracy. It is a mea-surement that defines not only the reliability of a feature’s position with respect toother features on the same layer, but also with respect to where it is on the face ofthe earth.
There are fundamentally two different levels of accuracy: map- and surveying-level accuracy. In most cases in GIS design you are dealing with map-level accu-racy, which is always lower than surveying-level accuracy. Getting a GIS databaseto surveying-level accuracy means that all the features in the database, and therecould be hundreds of thousands or more, must be located using precise surveyingtechniques, and the cost would be prohibitive.This is why accuracy is of such con-cern; to attain high levels of accuracy is exceedingly expensive, but inaccurate datamay reduce the utility of the database. As with many things there is a tradeoffbetween accuracy and cost.The relationship between accuracy and cost is nonlin-ear, so if you can calculate the cost of developing data with an accuracy of ±1 mand then decide you would like to improve that accuracy to 1/2 m, the total costwill be more than twice the original. Nobody knows the exact parameters of thisrelationship; we just know it is not a linear progression and that it goes up at leastwith the square of the required additional accuracy. For example, if original designstandards accepted a positional accuracy of ±2.0 ft and managers decided theywanted to double that accuracy to ±1 ft, you can be reasonably certain that thecost of data development will increase at least 4 times, not twice, because the dataare in two dimensions.
In the United States, the USGS published map accuracy standards in 1941,revised them in 1947 and they have not changed since.The standards for horizon-tal accuracy are a function of the map scale (see Table 4.6).
The 1947 map accuracy standards were adequate when most geographic infor-mation existed in paper form but not for digital spatial data. In the late 1990s theU.S. federal government developed a new National Standard for Spatial DataAccuracy. For horizontal data the accuracy is based on root mean square error(RMSE).To determine the RMSE for a set of coordinate values you calculate thesquare of the difference between the coordinate values in the data set and thecoordinate values as determined by an independent source of higher accuracy.Yousum these squared differences across the data set and take the square root of thatsum,which is the RMSE. The accuracy is reported in ground distance (in the dataset’s distance units) at the 95 percent confidence level.This means that 95 percentof the locations tested to determine accuracy are within that distance of theirlocations as determined by the higher-accuracy system. In practice, the higher-accuracy system is either GPS or surveying.There is also a reporting procedure forelevation data.
Designing Spatial Data104
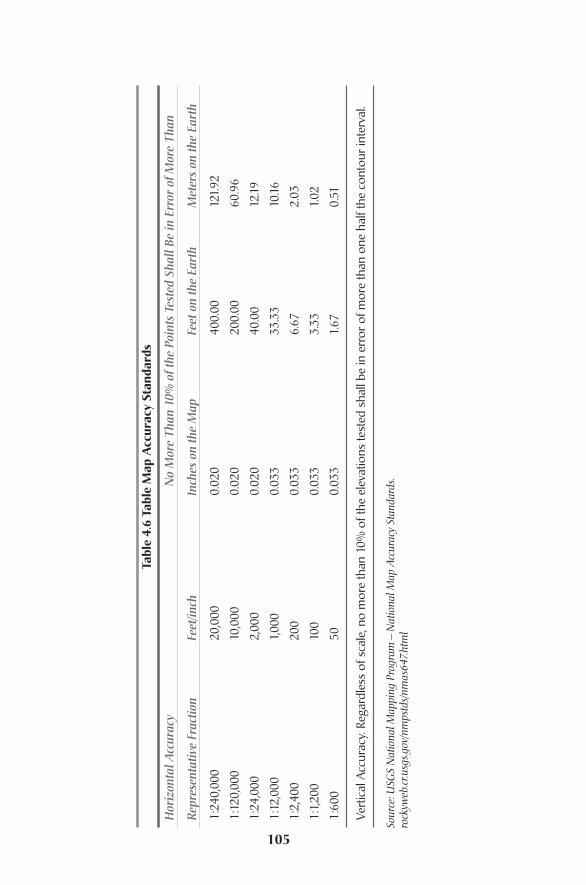
Tabl
e 4.
6 Ta
ble
Map
Acc
urac
y St
anda
rds
Hor
izon
tal A
ccur
acy
No
Mor
e Th
an 1
0% o
f the
Poi
nts
Test
ed S
hall
Be in
Err
or o
f Mor
e Th
an
Rep
rese
ntat
ive
Frac
tion
Feet
/inch
Inch
es o
n th
e M
apFe
et o
n th
e Ea
rth
Met
ers
on th
e Ea
rth
1:24
0,00
020
,000
0.02
040
0.00
121.
92
1:12
0,00
010
,000
0.02
020
0.00
60.9
6
1:24
,000
2,00
00.
020
40.0
012
.19
1:12
,000
1,00
00.
033
33.3
310
.16
1:2,
400
200
0.03
36.
672.
03
1:1,
200
100
0.03
33.
331.
02
1:60
050
0.03
31.
670.
51
Vert
ical
Acc
urac
y. Re
gard
less
of s
cale
, no
mor
e th
an 1
0% o
f the
ele
vatio
ns te
sted
sha
ll be
in e
rror
of m
ore
than
one
hal
f the
con
tour
inte
rval
.
Sour
ce: U
SGS
Nat
iona
l Map
ping
Pro
gram
—N
atio
nal M
ap A
ccur
acy
Stan
dard
s. ro
ckyw
eb.cr
.usg
s.gov
/nm
pstd
s/nm
as64
7.ht
ml
105
Because so much of the source material for GIS databases comes from alreadypublished paper maps, often the accuracy you can attain in your GIS is determinedby the scale of those maps and whether or not they were prepared using the mapaccuracy standards for that scale.There should be a statement to that effect on themap; if it is not there, you can make no assumptions about absolute locationalaccuracy of that data source. But as is clear from the table, if your data source isexisting maps, you need very large-scale mapping to attain high accuracy levels. Ifyou extend that table to a ridiculous extent and state that you want centimeteraccuracy, you would have to have a map scale of 1:1 (i.e., the map would be thereal world). Generally, any desired accuracy below 1 m will require direct survey-ing of your features.
PrecisionAfter accuracy you need to take into account the precision of the features in yourdata development strategy. Precision is the ability of a measurement to be repro-duced and the number of significant digits to the right of a decimal place a featurecan be reliably measured to.This issue of precision is frequently misused in GIS. Itis very easy for the user of a system to change configuration settings and have thecomputer provide locational and distance measurements that can vary from nodecimal places to two decimal places to eight places when measuring the samefeature.This does not mean that the feature’s precision has change, only that theuser has altered the way the computer represents the precision.What determinesthe precision of a feature are the methods used to collect and input the featureinto the system. For example, a surveyor or inspector could measure the founda-tion of a house after it has been built to determine its size. Measurements could betaken to the one-hundredth of a foot and recorded in a field book.When this per-son returns to the office and draws the foundation into the system, it can be drawnusing coordinate geometry (COGO). If properly measured and recorded in thefield, the feature would close and create a polygon representing the foundationwhen the measurements were checked.This would indicate a high level of relativeaccuracy. When in the field, the worker could also record three (or more) GPSpoints to determine the foundation’s location in a standard coordinate system.These points could then be used to locate the foundation in the GIS.
The precision of this foundation and any of its sides would be one-hundredthof a foot, but the precision of any measurements taken from this foundation to anyother feature measured and located in the same manner would be based on theprecision of the GPS locations take to locate the corners. If these locations wereaccurate to 1 m, the precision of measurements between two foundations wouldbe ±2 meters. But if the corners were located to within one-hundredth of aninch, the measurements between foundations would also be that precise.
CompletenessThe third related issue is the need for completeness within a data layer.You shoulddesign standards for absolute accuracy and precision but also for completeness.
Designing Spatial Data106
Accuracy Concerns — Global Positioning Systems
Completeness is defined as locating all the features represented in the data layer orsome stated percentage of those features. Locational accuracy standards are statedas the percentage of visible features that are within a certain distance of their reallocation, and completeness is a statement of the percentage of the actual featuresthat are captured in the database. It is important to state exactly what is the basisfor measuring completeness.You would certainly expect to capture all land parcelsdelimited on the parcel maps for a community as of a certain date, but can you becertain that those maps contain depictions of all the land parcels in the commu-nity? There is a probably apocryphal tale told in GIS of a community that paid forits GIS by discovering many land parcels that had not been correctly entered intothe taxation database or were missing entirely.The back taxes collected on thoseparcels were said to have covered a significant percentage of the GIS developmentcost. It would be nice to be able to document this story, but it probably is not true.
Specifying the desired level of completeness is particularly important whendata are to be captured from aerial photography. It is common for features to beobscured by shadow and branch overhang, and although you might wish to collectevery catch basin and utility pole, that may not be possible at the scale you haveselected. Measuring the delivered positional accuracy and completeness of deliv-ered data are quality control tasks that you need to design in as you are specifyingyour spatial data. Determining that a set of digital data actually meets a certainmap accuracy standard or that you actually have captured 95 percent of the fea-tures you expected to capture is a task that is done after completing the data byfield work with higher accuracy measurement systems and careful field checkingof the presence or absence of visible features. In the design phase you specify yourdesired levels of accuracy, precision, and completeness, and in the implementationphase you document whether or not you have met these standards.
Accuracy Concerns — Global PositioningSystemsGPS is another very common method for obtaining spatial data to include in aGIS. So it is important in the design phase to specify the standards you expect fordata derived from GPS. GPS technology was originally developed by the U.S.Department of Defense and allows the user to determine exactly where they areon the face of the earth by triangulating data from a series of satellites that orbitthe earth.Although the military applications drove the construction of the system,civilian use far outstrips military use of GPS around the world today.The user hasa GPS receiver that receives the signals from a constellation of these satellites,processes them, and then calculates the latitude and longitude of the receiver atthe time the data were collected.The accuracy of the data that can be acquiredfrom this process depends on the type of receiver, the methods that are used tocollect the data, the amount of time that data are collected, and what, if any, post-processing is done on the data with more advanced software. If you are trying toget meter-level accuracy, there are eight major areas in the system that can gener-ate error; getting more accurate than that, the list gets even longer. Error in GPS isa complex topic, and we only introduce it here in general terms.
107
The primary components of the system are the satellites, ground stations,receivers, and software used to correct known errors in the data. The satellitesmake up a worldwide network of 24 satellites that orbit the earth every 12 hours.With this number of satellites moving at that speed there are almost always enoughsatellites in direct line of sight of a receiver that determining location is possible.The signal broadcast by the satellites contains information about exactly when thesignal was sent, and information that tells the receiver which satellite it is listeningto. By comparing the time it receives the signal to its internal clock, the receivercan calculate its distance to the satellite.
If the earth were not nearly spherical, it would require this distance informa-tion from a minimum of three satellites to determine location in latitude and lon-gitude. Let’s say we measure a distance of 10,000 km from the first satellite (thesatellites actually orbit at about 11,000 nautical miles, so these numbers are just forillustration).This first distance defines a sphere with a radius of 10,000,000 km andthe receiver must be on the surface of the sphere. Now, the distance from the sec-ond satellite, let’s say 12,000 km, locates the receiver on the surface of a secondsphere with a radius of 12,000 km.The intersection of these two spheres defines aseries of locations where the sphere must be. Calculate the distance to the thirdsatellite and, if the clocks were perfectly in synchronization, the number of possi-ble locations is narrowed to two points where the receiver may be. One of thosepoints is on the face of the earth (assuming that is where the receiver is), and theother is usually some where in space.
To resolve this conflict and because it is not possible to have clocks tellingexactly the same time on both the satellites and the receivers, a fourth satellite isrequired to eliminate the incorrect location and correct for the clock differential.Because it takes between .05 and .07 seconds for the signal to travel the 11,000nautical miles, accurate clocks are critical, and the clocks on the satellites are largeand accurate atomic clocks. Because you cannot (financially or physically) place anatomic clock on a receiver, a mathematical correction is made in the receiver. Ifthe clocks were perfectly synchronized, the four spheres would intersect at a singlepoint, the location of the receiver. Because of clock error they intersect in a three-dimensional surface, and the receiver applies a correction to its clock until thepoints all intersect at a single location, which it reports to the user.All this happensalmost instantly at the push of a button after the receiver has locked on to at leastfour satellites.This makes GPS receivers very accurate clocks as well.
The United States military, which controls the GPS satellite system, candegrade the signal so that only military receivers will get accurate locations.This isknown as selective availability, and when it is on, the signal is degraded. Since May2000 it is now always turned off, so there is no difference between positional accu-racy from military and civilian receivers.The chief of the U.S. Geodetic Survey hasrelated this to a football field; if selective availability is off, you can only know thatyou are on or off the field, but if it is on, you can tell at which yard marker you arelocated.
Another important factor to making GPS work is knowing the exact locationof the satellites at all times. For low-end or hand-held GPS receivers such as those
Designing Spatial Data108
Differential Processing
used by hikers and boaters this is not important, but for survey-grade receivers,those typically used to collect GIS data, this is important.The U.S. Department ofDefense monitors these satellites very exactly using radar and records the position,altitude, and speed of the satellites.Along with the pseudo-code mentioned above,the satellite also broadcasts this information, which is known as the ephemeriserrors.The errors themselves are usually pretty small, but if you want exact mea-surements, they need to be corrected for.
All of this discussion is based on the premise that you can easily calculate thedistance from a receiver to a satellite.The problem is that the signal itself has totravel from the satellite, through the atmosphere, and a number of factors canaffect the speed of the signal, including the temperature of the atmosphere andhow much moisture is in it.Now, if all of these factors could be known, they couldeasily be accounted for with mathematics, but the reality is that these factors aredifficult if not impossible to track.The way these are accounted for is by trackingtwo different signals from the same satellite and calculating their relative speed. Forthis reason, the receivers that are used to perform accurate measurements need tobe dual frequency where the information is carried twice on different frequencies.A dual-frequency receiver can measure two signals from the same satellite, knowthe time that each signal left the satellite, and calculate correction factors to applyto the results to reduce error in measurements.These types of receivers cost morebut provide much improved accuracy in measurements.
Ground stations are permanent locations, also known as the control segment,that are in constant communication with the satellites. These control stationstransmit signals to the satellites to check their exact position in space and assurethat they are operating properly. The signals sent to them are then used by thesatellites to adjust the position and the signals that they send out to the GPSreceivers on the surface of the earth. Five ground stations exist and are located inHawaii,Ascension Island, Diego Garcia, Kwajalein, and Colorado Springs.
Differential ProcessingAnother type of ground station, much more widely distributed, is known as a basestation.These are locations with highly accurate and expensive GPS receivers thatconstantly monitor their location as determined by the satellite. Because of all thepossible errors in the system, the location changes slightly depending on atmos-pheric conditions, satellite errors, and other factors. But the location of the basestation is know by surveying methods to a very high degree of accuracy, so it ispossible to mathematically model the deviations from the known location com-pared to the location estimated at the same time your receiver was taking mea-surements. Of course, you want to select a base station near to where you aretaking your measurements, and there is a widespread and growing network of basestations around the world. Both receivers, the base station and your receiver, arecommunicating with the satellite at the same time. and this processing is known asdifferential GPS (DGPS).This processing can occur either in real time by havingFM radio links between your receiver and the base station or on a computer afteryou have taken your measurements, known as postprocessing DGPS. Many federal
109
and state agencies have established permanent base stations that transmit theirlocational data constantly and store the files on servers tied to the World Wide Webfor postprocessing. Using DGPS and postprocessing you can anticipate measure-ment results within a couple of meters for moving applications where few pointsare taken at each location. The results can be within subcentimeters if you usedual-frequency real-time DGPS and stay at one location for an extended time.GPS has not yet evolved to the point where you can stand on top of a feature andpush a button and in one or two seconds receive locational information accurateenough to locate that feature within a centimeter of where it is, but the systemsget closer to that goal all the time.
Real-Time Kinematic GPS Real-time kinematic (RTK) GPS is an advanced type of differential GPS. Withthese units a combination of a stationary base station located at a known coordi-nate location and a roving RTK receiver, usually in a backpack, are used at thelocation where you want to calculate new coordinates.The difference between aDGPS and an RTK unit is that the RTK roving unit communicates back to thestationary unit using radio waves, and the unit can calculate its location muchfaster and more precisely.These type of receivers are typically much more expen-sive, but because of their efficiency, they are often used to collect data for a GISwhere a large number of points need to be collected; the positional accuracy isvery high (less than a meter).A typical application of this type of RTK GPS is util-ity infrastructure mapping such as water valves or utility manholes and catchbasins.
With hand-held units and no differential processing you can achieve accuraciesbetween 3 to 5 m, or 10 to15 ft, which approaches map accuracy values at the 1-inch-to-200-ft scale. Differential processing and hand-held units that allow you toprocess the data this way can now achieve accuracies in the 2- to 5-meter (6-to15-ft) range. Submeter accuracy using RTK GPS is very expensive and requiressophisticated equipment, real-time information from multiple base stations, dual-frequency radio, and complex mathematical processing, but submeter accuracy isgetting more affordable over time.
Accuracy across LayersThe largest concern relating to accuracy, however, is not determining how accu-rate one layer of a set of features may be but how to assess accuracy when there aremultiple layers in your GIS, each with differing levels of accuracy.This has beenstumping the profession for years. What is commonly done is to take the mostaccurate data and use that data source to realign the inaccurate information. Forexample, often in GISs that use aerial photography as a backdrop or data source,that is the most accurate information in the database. Features from other sourcescan be shifted to fit visible features on the digital photograph (see Chapter 6).This process of conflating one data set to fit another improves the visual fit of data
Designing Spatial Data110
Choosing a Coordinate System and Map Projection
layers, but you still cannot state that the layer is necessarily more accurate than itwas before. It probably is, but all you can say about it is that you performed thatfunction on the data to improve the fit.
In the end, the level of accuracy you require is determined by the uses to whichyou plan to put the GIS. For many uses (e.g., regional planning over multiplestates), available data at a scale of 1:24,000 (accuracy ±40 ft) is adequate. For cityplanning in dense areas you may need data accurate to a map scale of 1:1,200(±3.3 ft). The issue of accuracy often comes down to differences of opinionbetween engineers, who have been trained to strive for the highest accuracy pos-sible, and others who would be satisfied with the lowest level of accuracy thatkeeps them from making bad locational decisions. How those tensions getresolved and the resources you have to invest will determine the base accuracy youwill be seeking in your database. Keep in mind that most GISs are not built to bedesign tools. Rather they are intended to be a model of the real world.The realworld is a messy place, and sometimes a high level of locational accuracy is notonly unnecessary but also unattainable.
Choosing a Coordinate System and Map ProjectionA human being, as an object, has the properties of height and weight, and we canmeasure those properties in different measurement systems such as inches, meters,pounds, and kilograms. Similarly, geographic objects have the property of location,and we can measure that property in different coordinate systems and map projec-tions. The correct choices of coordinate system and projection are importantbecause this is how you will present your data to the users and how you will takemeasurements from the data. It may seem that the question “How many countiesin the United States are within 100 miles of any part of Franklin County, Ohio?”has a unique answer, but it does not. If you begin with source data that came frommaps at a scale of 1:2,000,000 and use an Albers Equal Area conic projection withthe Clark 1866 spheroid, a central meridian of W96, a reference latitude of N 40,and standard parallels of N 20 and N60, you get an answer of 122 counties, includ-ing Franklin. This projection is designed to show the United States well in thelarger context of North America so that Alaska will show. But if you project thedata with the same type of projection but with reference latitude of N 37.5 andstandard parallels of N 29.5 and N 45.5, a projection designed to display the con-terminous United States, you get an answer of 116.And if you use the geographicprojection (i.e., latitude and longitude), you get an answer of only 90 counties.How many counties are within 100 miles of Franklin County, Ohio? Well, theanswer depends on the projection used for the data. A basic knowledge of mapprojections is essential for all map users and makers,“no matter how much com-puters seem to have automated the operations,” and it holds even more for GISdatabase designers (Snyder 1987, 3). Although there are many terms specific tomap projections,Table 4.7 is a simple glossary of the terms use in this section.
111
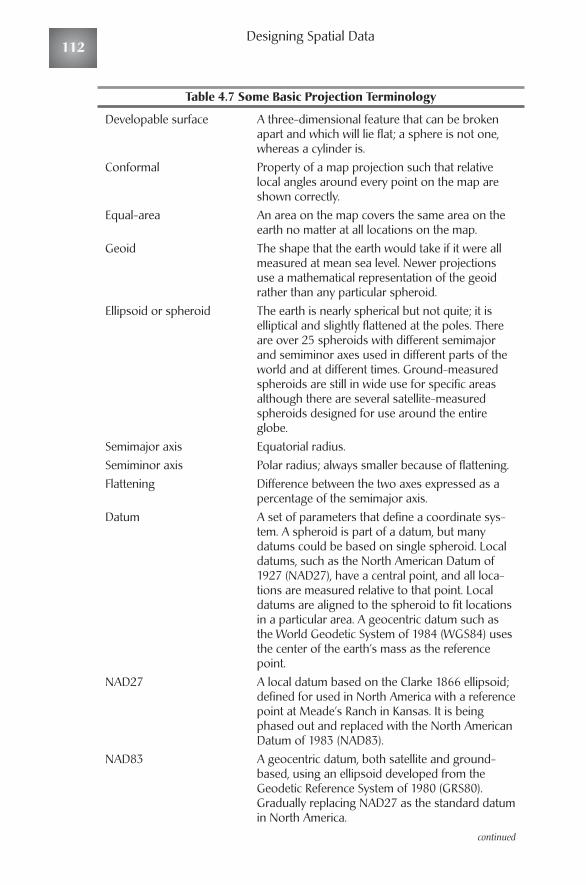
Table 4.7 Some Basic Projection Terminology
Developable surface A three-dimensional feature that can be brokenapart and which will lie flat; a sphere is not one,whereas a cylinder is.
Conformal Property of a map projection such that relativelocal angles around every point on the map areshown correctly.
Equal-area An area on the map covers the same area on theearth no matter at all locations on the map.
Geoid The shape that the earth would take if it were allmeasured at mean sea level. Newer projectionsuse a mathematical representation of the geoidrather than any particular spheroid.
Ellipsoid or spheroid The earth is nearly spherical but not quite; it iselliptical and slightly flattened at the poles. Thereare over 25 spheroids with different semimajorand semiminor axes used in different parts of theworld and at different times. Ground-measuredspheroids are still in wide use for specific areasalthough there are several satellite-measuredspheroids designed for use around the entireglobe.
Semimajor axis Equatorial radius. Semiminor axis Polar radius; always smaller because of flattening.Flattening Difference between the two axes expressed as a
percentage of the semimajor axis.Datum A set of parameters that define a coordinate sys-
tem. A spheroid is part of a datum, but manydatums could be based on single spheroid. Localdatums, such as the North American Datum of1927 (NAD27), have a central point, and all loca-tions are measured relative to that point. Localdatums are aligned to the spheroid to fit locationsin a particular area. A geocentric datum such asthe World Geodetic System of 1984 (WGS84) usesthe center of the earth’s mass as the referencepoint.
NAD27 A local datum based on the Clarke 1866 ellipsoid;defined for used in North America with a referencepoint at Meade’s Ranch in Kansas. It is beingphased out and replaced with the North AmericanDatum of 1983 (NAD83).
NAD83 A geocentric datum, both satellite and ground-based, using an ellipsoid developed from theGeodetic Reference System of 1980 (GRS80).Gradually replacing NAD27 as the standard datumin North America.
continued
Designing Spatial Data112
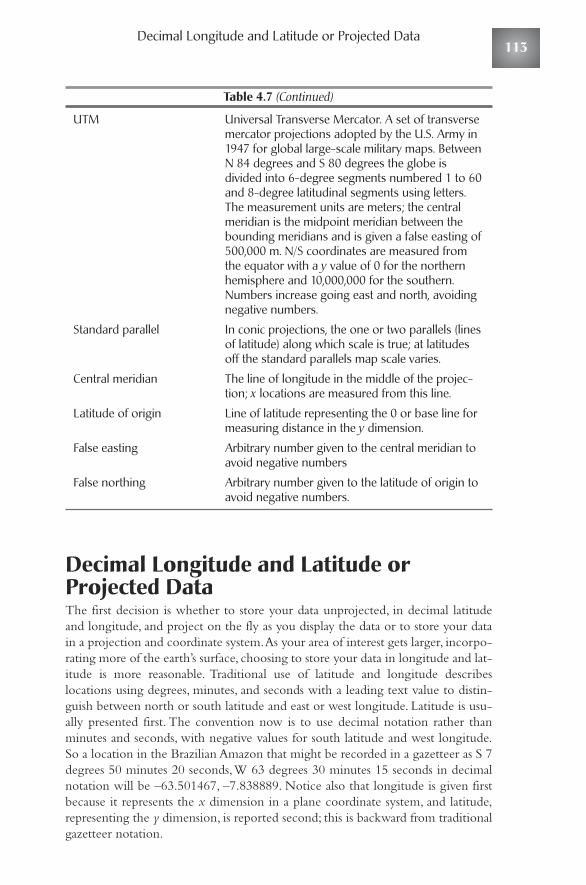
Decimal Longitude and Latitude or Projected Data
Table 4.7 (Continued)
UTM Universal Transverse Mercator. A set of transversemercator projections adopted by the U.S. Army in1947 for global large-scale military maps. BetweenN 84 degrees and S 80 degrees the globe isdivided into 6-degree segments numbered 1 to 60and 8-degree latitudinal segments using letters.The measurement units are meters; the centralmeridian is the midpoint meridian between thebounding meridians and is given a false easting of500,000 m. N/S coordinates are measured fromthe equator with a y value of 0 for the northernhemisphere and 10,000,000 for the southern.Numbers increase going east and north, avoidingnegative numbers.
Standard parallel In conic projections, the one or two parallels (linesof latitude) along which scale is true; at latitudesoff the standard parallels map scale varies.
Central meridian The line of longitude in the middle of the projec-tion; x locations are measured from this line.
Latitude of origin Line of latitude representing the 0 or base line formeasuring distance in the y dimension.
False easting Arbitrary number given to the central meridian toavoid negative numbers
False northing Arbitrary number given to the latitude of origin toavoid negative numbers.
Decimal Longitude and Latitude orProjected DataThe first decision is whether to store your data unprojected, in decimal latitudeand longitude, and project on the fly as you display the data or to store your datain a projection and coordinate system.As your area of interest gets larger, incorpo-rating more of the earth’s surface, choosing to store your data in longitude and lat-itude is more reasonable. Traditional use of latitude and longitude describeslocations using degrees, minutes, and seconds with a leading text value to distin-guish between north or south latitude and east or west longitude. Latitude is usu-ally presented first. The convention now is to use decimal notation rather thanminutes and seconds, with negative values for south latitude and west longitude.So a location in the Brazilian Amazon that might be recorded in a gazetteer as S 7degrees 50 minutes 20 seconds,W 63 degrees 30 minutes 15 seconds in decimalnotation will be –63.501467, –7.838889. Notice also that longitude is given firstbecause it represents the x dimension in a plane coordinate system, and latitude,representing the y dimension, is reported second; this is backward from traditionalgazetteer notation.
113
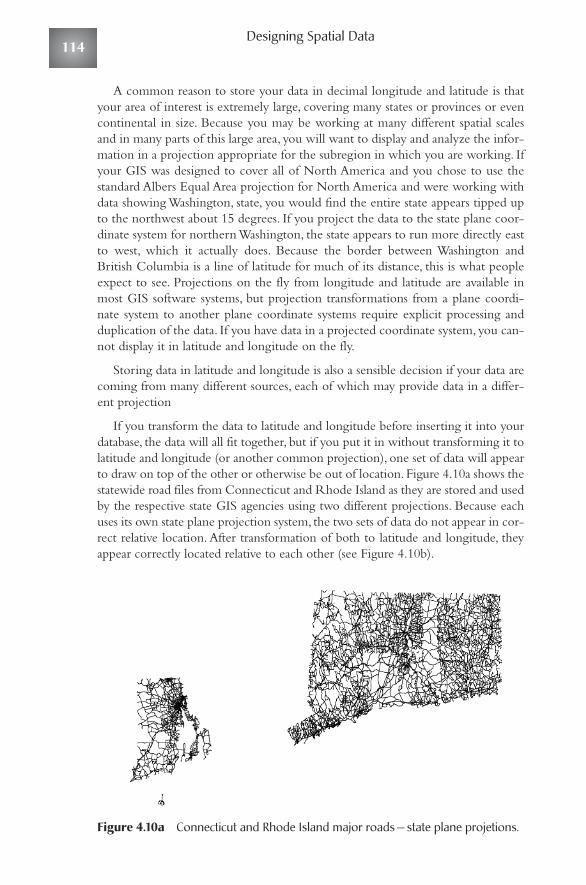
A common reason to store your data in decimal longitude and latitude is thatyour area of interest is extremely large, covering many states or provinces or evencontinental in size. Because you may be working at many different spatial scalesand in many parts of this large area, you will want to display and analyze the infor-mation in a projection appropriate for the subregion in which you are working. Ifyour GIS was designed to cover all of North America and you chose to use thestandard Albers Equal Area projection for North America and were working withdata showing Washington, state, you would find the entire state appears tipped upto the northwest about 15 degrees. If you project the data to the state plane coor-dinate system for northern Washington, the state appears to run more directly eastto west, which it actually does. Because the border between Washington andBritish Columbia is a line of latitude for much of its distance, this is what peopleexpect to see. Projections on the fly from longitude and latitude are available inmost GIS software systems, but projection transformations from a plane coordi-nate system to another plane coordinate systems require explicit processing andduplication of the data. If you have data in a projected coordinate system, you can-not display it in latitude and longitude on the fly.
Storing data in latitude and longitude is also a sensible decision if your data arecoming from many different sources, each of which may provide data in a differ-ent projection
If you transform the data to latitude and longitude before inserting it into yourdatabase, the data will all fit together, but if you put it in without transforming it tolatitude and longitude (or another common projection), one set of data will appearto draw on top of the other or otherwise be out of location.Figure 4.10a shows thestatewide road files from Connecticut and Rhode Island as they are stored and usedby the respective state GIS agencies using two different projections. Because eachuses its own state plane projection system, the two sets of data do not appear in cor-rect relative location. After transformation of both to latitude and longitude, theyappear correctly located relative to each other (see Figure 4.10b).
Figure 4.10a Connecticut and Rhode Island major roads — state plane projetions.
Designing Spatial Data114
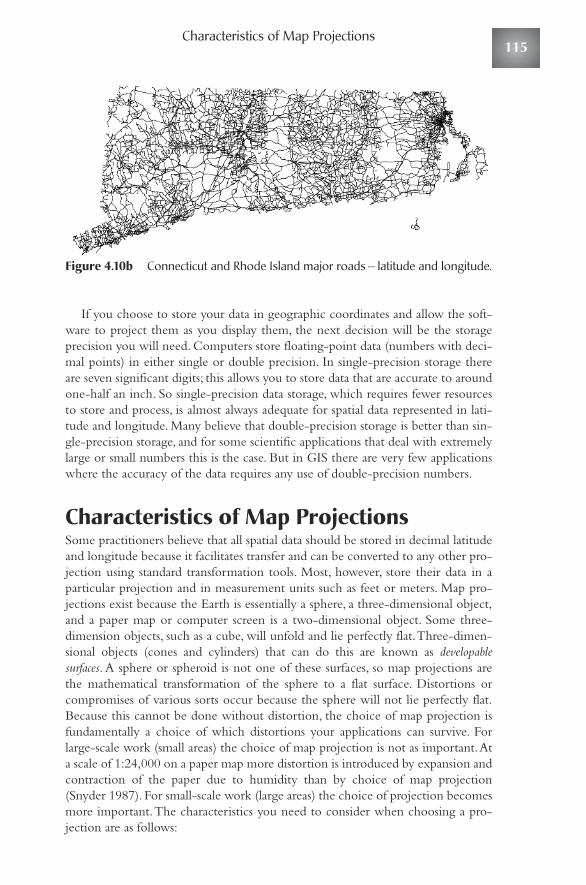
Characteristics of Map Projections
Figure 4.10b Connecticut and Rhode Island major roads — latitude and longitude.
If you choose to store your data in geographic coordinates and allow the soft-ware to project them as you display them, the next decision will be the storageprecision you will need. Computers store floating-point data (numbers with deci-mal points) in either single or double precision. In single-precision storage thereare seven significant digits; this allows you to store data that are accurate to aroundone-half an inch. So single-precision data storage, which requires fewer resourcesto store and process, is almost always adequate for spatial data represented in lati-tude and longitude. Many believe that double-precision storage is better than sin-gle-precision storage, and for some scientific applications that deal with extremelylarge or small numbers this is the case. But in GIS there are very few applicationswhere the accuracy of the data requires any use of double-precision numbers.
Characteristics of Map ProjectionsSome practitioners believe that all spatial data should be stored in decimal latitudeand longitude because it facilitates transfer and can be converted to any other pro-jection using standard transformation tools. Most, however, store their data in aparticular projection and in measurement units such as feet or meters. Map pro-jections exist because the Earth is essentially a sphere, a three-dimensional object,and a paper map or computer screen is a two-dimensional object. Some three-dimension objects, such as a cube, will unfold and lie perfectly flat.Three-dimen-sional objects (cones and cylinders) that can do this are known as developablesurfaces. A sphere or spheroid is not one of these surfaces, so map projections arethe mathematical transformation of the sphere to a flat surface. Distortions orcompromises of various sorts occur because the sphere will not lie perfectly flat.Because this cannot be done without distortion, the choice of map projection isfundamentally a choice of which distortions your applications can survive. Forlarge-scale work (small areas) the choice of map projection is not as important.Ata scale of 1:24,000 on a paper map more distortion is introduced by expansion andcontraction of the paper due to humidity than by choice of map projection(Snyder 1987). For small-scale work (large areas) the choice of projection becomesmore important.The characteristics you need to consider when choosing a pro-jection are as follows:
115
◆ Area. Some projections are equal-area, which means that an area of a cer-tain size on the map covers the same amount of area on the earth’s sur-face no matter where on the map it is.This forces some distortion in theother map properties.
◆ Shape. Some projections are conformal, which means that relative localangles around all points on the map are correct. On conformal mapslines of latitude and longitude cross each other at right angles, but areasare enlarged or reduced except along certain lines in some projections.All the large-scale maps used by the USGS and most other agencies ofthe U.S. federal government involved in mapping or GIS are conformalprojections, and all state plane coordinate projections in the UnitedStates are conformal. No map or set of geographic data can be bothequal area and conformal.
◆ Scale. Map projections do not show scale correctly throughout the map,which is why you will get different measurements between the sametwo points depending on the projection used.There are usually one ortwo lines along which scale is correct, and if you choose those correctly,you can minimize the scale variation across the data or the map.There isa special class of projections, equidistant, where scale is correct to allpoints on the map from one or two specified points on the map or alongall lines of longitude.
◆ Direction. On a group of map projections known as azimuthal the direc-tions of all points on the map are correct with respect to one location atthe center of the map. On other map projections direction is distorted.
Spanning Existing Map Projection ZonesMost large-scale (small area) applications select conformal projections and, in theUnited States, many organizations will choose from the set of state plane coordi-nate systems (SPCSs). For the smaller states and a few of the larger ones there isone projection. Problems arise when your area of interest spans two or moredefined projections as in the example with Connecticut and Rhode Islanddemonstrate (Figure 4.10a and b). This situation occurs within states andprovinces; it is quite likely, for instance, for a municipality to have part of its terri-tory in one state plane coordinate zone and part in another. This is even morelikely when the area of interest includes multiple units of government.
If you are in a mid- or low-latitude region, there are relatively few solutions tothis problem.Locations at high latitudes require different projections. If only a smallpart of the area is in one projection region, you can use the projection of most ofyour area of interest. This would entail transforming the data from the smaller projection area into the projection of the larger. But if your area of interest is ratherevenly split between two projections, you will have to create your own projection.
Designing Spatial Data116
Selection of Projection for Large Areas
Follow the procedure in Table 4.8.This will produce a projection that will allowdata from either of the input projections to display in correct location relative toeach other. If your area covers more than two projection areas, the decisions are alittle more complex but similar.Again, this process is appropriate for small areas inlow or midatitudes.
Selection of Projection for Large AreasIt is not easy to specify when small becomes large and choice of map projectionbecomes more significant. Generally, over small areas of 6 or 7 miles across, chang-ing from one projection to another is hardly noticeable, certainly not visually, andif your data source is paper maps, physical distortion in the paper is greater thanprojection variation. At this scale differences in projections result in distance dif-ferences of only up to 2 ft per mile.When the area of interest extends to a hundredmiles or more, measurements of distance can vary significantly as we saw in theexample of finding counties with 100 miles of Franklin County, Ohio. For regionsthat include an entire nation of the world, there are usually preferred projectionsthat have been chosen by the principal mapping agencies of the nation. Areassmaller than a nation but larger than provinces or states usually do not have prese-lected projections.The decisions are similar to those in Table 4.8, but there is usu-ally no opportunity to use parameters of existing projections such as false eastingsor northing, latitudes of origin, standard parallels, or central meridians.This meansthe designer must choose these parameters of the projection. For a transverse mer-cator projection when extent of the area of interest is principally north/south, theparameters are as follows:
◆ Central meridian. Select a line of longitude (it may include minutes andseconds expressed as decimal degrees).
◆ Latitude of origin. Should be a parallel to the south of the area of interest.It can be the equator, as it is in the Universal Transverse Mercator(UTM) family of projections, but this results in very high y values in themillions of meters or tens of millions of feet.This set of projections wasadopted by the U.S.Army in 1947 and covers the world between lati-tudes 84 degrees north and 80 degrees south.
◆ Scale factor at central meridian. Selecting a value of 1 means that scale isaccurate only along this line.A value of less than 1 means that scale isaccurate along a pair of lines on either side of the central meridian.TheUTM projection uses 0.9996 as the scale factor.
◆ False eastings and northings. Select values in the chosen measurementunits, usually feet or meters, to avoid negative numbers.The false eastingvalue is assigned to the central meridian as its x value and the false nor-thing to the latitude or origin as its y value; x and y values decrease andincrease from these origins.
117

Sele
ct a
tran
sver
se m
erca
tor
proj
ecti
on. T
hese
pro
ject
ions
hav
eth
e fo
llow
ing
prop
ertie
s:Sm
all s
hape
s ar
e m
aint
aine
d bu
t lar
ger r
egio
ns a
re d
isto
rted
aw
ayfr
om th
e ce
ntra
l mer
idia
n. A
real
dis
tort
ion
incr
ease
s w
ith d
ista
nce
from
the
cent
ral m
erid
ian.
Loc
al a
ngle
s ar
e ac
cura
te e
very
whe
re.
Scal
e is
acc
urat
e al
ong
the
cent
ral m
erid
ian
if th
e sc
ale
fact
or is
1.0
.If
the
it is
less
than
1.0
, the
n th
ere
are
two
stra
ight
line
s ha
ving
an
accu
rate
sca
le, e
quid
ista
nt fr
om a
nd o
n ea
ch s
ide
of th
e ce
ntra
lm
erid
ian.
Sele
ctio
n of
Par
amet
ers:
Dat
um: U
se th
e da
tum
for t
he o
rigin
al p
roje
ctio
nsSp
hero
id: U
sual
ly in
clud
ed a
s pa
rt o
f the
dat
um if
app
ropr
iate
.Sm
all a
rea
proj
ectio
ns a
lway
s us
e a
sphe
roid
or t
he g
eoid
.M
easu
rem
ent U
nits
: Fe
et o
r met
ers;
pre
fera
ble
to u
se th
e sa
me
asth
e or
igin
al p
roje
ctio
nsCe
ntra
l Mer
idia
n(li
ne o
f lon
gitu
de):
Sele
ct th
e ne
ares
t who
le d
egre
eof
long
itude
in th
e ce
nter
of t
he a
rea
of in
tere
st. T
his
will
be
diffe
r-en
t fro
m e
ither
of t
he o
rigin
al p
roje
ctio
ns.
Latit
ude
of O
rigi
n: U
se th
e sa
me
valu
e as
for t
he o
rigin
al p
roje
ctio
nsun
less
you
r are
a of
inte
rest
ext
ends
to a
low
er la
titud
e. T
hen
use
adi
ffere
nt v
alue
. It i
s co
mm
on to
use
who
le d
egre
es o
r qua
rter
s of
degr
ees
(e.g
., N
41
degr
ees
45 s
econ
ds).
Scal
e Fa
ctor
: See
pro
pert
ies
abov
e. F
or s
mal
l are
as it
sho
uld
be 1
.0Fa
lse
East
ing:
Use
the
fals
e ea
stin
g of
the
orig
inal
pro
ject
ions
unle
ss th
is w
ill re
sult
in n
egat
ive
y(lo
ngitu
de) n
umbe
rs. I
n th
at c
ase
the
num
ber w
ill h
ave
to b
e in
crea
sed.
All
fals
e ea
stin
gs (a
nd n
or-
thin
gs) u
se ro
und
num
bers
(e.g
., 50
0,00
0).
Fals
e N
orth
ing:
Use
the
sam
e va
lue
as o
rigin
al p
roje
ctio
ns.
Sele
ct la
mbe
rt c
onfo
rmal
con
ic.
ThIs
pro
ject
ion
has
the
follo
w-
ing
prop
ertie
s:A
ll in
ters
ectio
ns o
f lat
itude
and
long
itude
line
s ar
e 90
deg
rees
.Sm
all s
hape
s ar
e m
aint
aine
d.
Min
imal
dis
tort
ion
of a
rea
near
the
stan
dard
par
alle
ls. S
cale
is c
or-
rect
alo
ng th
e st
anda
rd p
aral
lels
but
sm
alle
r bet
wee
n th
en a
ndla
rger
bey
ond
them
. Loc
al a
ngle
s ar
e ac
cura
te.
Sele
ctio
n of
Par
amet
ers:
D
atum
: Sam
e as
Nor
th/S
outh
Sphe
roid
: Sam
e as
Nor
th/S
outh
Mea
sure
men
t Uni
ts:
Sam
e as
Nor
th/S
outh
Cent
ral M
erid
ian
(line
of l
ongi
tude
): Sa
me
as N
orth
/Sou
thLa
titud
e of
Ori
gin:
Sam
e as
Nor
th/S
outh
Stan
dard
Par
alle
ls: I
f you
r are
a of
inte
rest
has
the
sam
eN
orth
/Sou
th e
xten
t as
both
the
orig
inal
pro
ject
ions
, you
can
use
the
stan
dard
par
alle
ls o
f tho
se p
roje
ctio
ns. O
ther
wis
e ch
oose
you
r ow
nst
anda
rd p
aral
lels
. The
gen
eral
reco
mm
enda
tion
is o
ne-s
ixth
of t
hele
ngth
of l
ongi
tude
of t
he a
rea
of in
tere
st fr
om th
e no
rthe
rn a
ndso
uthe
rn e
nds.
Fals
e Ea
stin
g: S
ame
as N
orth
/Sou
th.
Fals
e N
orth
ing:
Sam
e as
Nor
th/S
outh
.
Tabl
e 4.
8 Pr
ojec
tion
Sel
ecti
on. I
s th
e Pr
inci
pal E
xten
t of t
he A
rea
of In
tere
st N
orth
/Sou
th o
r Ea
st/W
est?
Nor
th/S
outh
East
/Wes
t
118
Designing Spatial Data
For a Lambert conformal conic projection when the extent of the area ofinterest is principally east/west, the parameters are as follows:
◆ The concerns for the central meridian, latitude of origin, and false east-ings and northings are the same as for the transverse mercator.
◆ Standard parallels should be selected one-sixth and five-sixths of the dis-tance from the southern edge of the area of interest. Scale is correctalong these two parallels and varies with distance from them.
The issues around projections are important, and this concern for projectingthe real world onto a plane projection is one of the things that make spatial datadifferent. In a database, spatial data are not so special; it is just another form of data.But the design considerations for projecting this data are special, and a basicknowledge of map projections is important. A few key points in summary are asfollows:
◆ If your area of interest is entirely within a single predefined, governmen-tally approved projection, it would make sense to select that projectionunless there are reasons not to do so. Local governments using the SPCSfor their area is an example.
◆ Some organizations and projects require data to be submitted in a partic-ular projection, and if your GIS is part of this project, you should usethat projection. For instance, many scientific projects in the UnitedStates store data in UTM projections with measurement units in meters.
◆ If your area spans two governmentally defined projections but most is inone of them, select that one. If they are evenly split construct a similarprojection.
◆ If your area of interest is a high latitude (above 80 degrees north orsouth) neither the Lambert Conformal Conic nor the TransverseMercator projection is appropriate and you should consult some of thesources listed.
Whatever map projection and measurement units you select, it will be almostcertain that you will be taking in digital data in other projections, so you almostalways need to have the capability of transforming data from one projection toanother. Some of the less expensive GISs do not have this capability, but there isrelatively inexpensive software available that incorporates the standard, public-domain transformation equations. Choosing the wrong map projection is a seri-ous mistake; it is possible to transform from the old projection to a better one, butif you have much data, this is a bothersome process.
Although the mathematics and choices around map projections seem very com-plex and the number of possible projections very large, if your area of interest issmall, there is usually a small set of choices to make.Your reason for choosing a pro-jection will almost always be to preserve shape or area (conformal or equivalentprojections) and rarely to maintain straight line of movements for correct scale
119
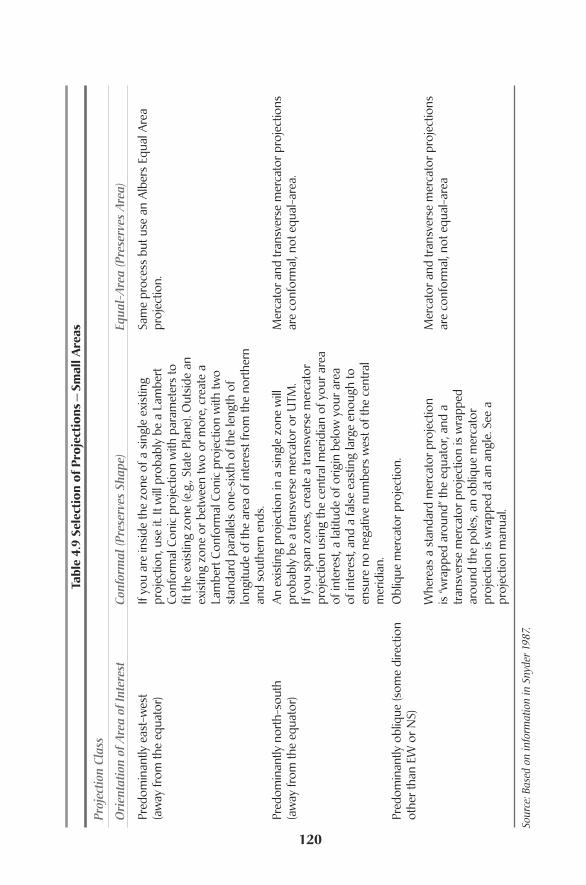
Tabl
e 4.
9 Se
lect
ion
of P
roje
ctio
ns—
Smal
l Are
as
Proj
ectio
n Cl
ass
Ori
enta
tion
of A
rea
of In
tere
stCo
nfor
mal
(Pre
serv
es S
hape
)Eq
ual-
Are
a (P
rese
rves
Are
a)
Pred
omin
antly
eas
t-w
est
If yo
u ar
e in
side
the
zone
of a
sin
gle
exis
ting
Sam
e pr
oces
s bu
t use
an
Alb
ers
Equa
l Are
a (a
way
from
the
equa
tor)
proj
ectio
n, u
se it
. It w
ill p
roba
bly
be a
Lam
bert
pr
ojec
tion.
Conf
orm
al C
onic
pro
ject
ion
with
par
amet
ers
to
fit th
e ex
istin
g zo
ne (e
.g.,
Stat
e Pl
ane)
. Out
side
an
exis
ting
zone
or b
etw
een
two
or m
ore,
cre
ate
a La
mbe
rt C
onfo
rmal
Con
ic p
roje
ctio
n w
ith tw
o st
anda
rd p
aral
lels
one
-six
th o
f the
leng
th o
f lo
ngitu
de o
f the
are
a of
inte
rest
from
the
nort
hern
an
d so
uthe
rn e
nds.
Pred
omin
antly
nor
th-s
outh
A
n ex
istin
g pr
ojec
tion
in a
sin
gle
zone
will
M
erca
tor a
nd tr
ansv
erse
mer
cato
r pro
ject
ions
(a
way
from
the
equa
tor)
prob
ably
be
a tr
ansv
erse
mer
cato
r or U
TM.
are
conf
orm
al, n
ot e
qual
-are
a.If
you
span
zon
es, c
reat
e a
tran
sver
se m
erca
tor
proj
ectio
n us
ing
the
cent
ral m
erid
ian
of y
our a
rea
of in
tere
st, a
latit
ude
of o
rigin
bel
ow y
our a
rea
of in
tere
st, a
nd a
fals
e ea
stin
g la
rge
enou
gh to
en
sure
no
nega
tive
num
bers
wes
t of t
he c
entr
al
mer
idia
n.Pr
edom
inan
tly o
bliq
ue (s
ome
dire
ctio
n O
bliq
ue m
erca
tor p
roje
ctio
n.ot
her t
han
EW o
r NS)
Whe
reas
a s
tand
ard
mer
cato
r pro
ject
ion
Mer
cato
r and
tran
sver
se m
erca
tor p
roje
ctio
ns
is “w
rapp
ed a
roun
d” th
e eq
uato
r, an
d a
are
conf
orm
al, n
ot e
qual
-are
atr
ansv
erse
mer
cato
r pro
ject
ion
is w
rapp
ed
arou
nd th
e po
les,
an o
bliq
ue m
erca
tor
proj
ectio
n is
wra
pped
at a
n an
gle.
See
a
proj
ectio
n m
anua
l.
Sour
ce: B
ased
on
info
rmat
ion
in S
nyde
r 19
87.
120
Spatial Indexing
along meridians or lines or latitude or straight great-circle routes.You merely wanta projection that will fit your portion of the earth well and produce planar mapsand computer displays. And most, though possibly not all, of the readers of thisbook will have an area of interest away from the equator.When you restrict projec-tion choices by that much, it becomes easier.Table 4.9 should serve as a basic guide.
Spatial IndexingAnother design concern for spatial data is indexing of the data. Indexing allowsrapid retrieval of features from large data sets, and without it a GIS may operate soslowly that users will not use the system. GISs automatically index the spatialinformation, so it is really not necessary to understand it unless your database is solarge that the default indexing scheme is not adequate or super-fast access is criti-cal to your applications. In those cases you need to set up the spatial indexes withconsiderable care. Efficient spatial indexing has been an area of research and devel-opment in computer science for almost 30 years, and new techniques for indexingspatial data are regularly proposed. Until they get worked into the existing GISsand RBDMSs, though, they remain essentially research tools.The spatial indexingprocess discussed here is typical of those implemented currently in commerciallyavailable GISs.
As with an attribute-indexed query, (see chapter 5 – Principles for Fields in DTables) a spatially indexed query for features reads from a structured index table ortables and then, through relational joins between the index tables and the featuretable, pulls out only the features that have been requested. Almost every interac-tion with the data in the map view is a spatial query. Panning the map from onelocation to another is the equivalent of
SELECT ALL FEATURES FROM THESE_LAYERS AT THIS_SCALEWITHIN A RECTANGLE OF THIS_X_DIMENSION AND THIS_Y_DIMENSION CENTERED ON THIS X_Y_LOCATION.
Every time you pan the map view, that query is sent again to the database witha different value for the center of the view. Zooming in or out is a spatial query asis selecting features inside a circle drawn on the map view.All these queries requirereads against the feature database, which is not ordered geographically, and byreading against the indexed tables first, you are able to reach directly into the fea-ture table to retrieve the requested geographic features.
The simplest kind of spatial index is created with a set of tiles that exclusivelyand exhaustively cover the area of the geographic features. Exclusively means thatall parts of the region of interest are covered by only one tile and exhaustivelymeans that no area of the region of interest is uncovered by a tile.This is called atessellation. In Figure 4.11 the tiles are numbered T1 through T12.
The spatial query being executed here is a so-called window query that seeksto find and display all the features inside the window you have drawn on thescreen.The search determines which tile(s) touch the query window (in this case,T1,T2,T5, and T6). It then goes into the index table to find out which geographic
121

features are inside these tiles and retrieves only those features from the data set(i.e., features A, B and C).All these features are retrieved from the T1 record in theindex table; the other records,T2,T5, and T6, would have to be read, but no newfeatures would be added to the already selected set. Because tile number organizesthe index table, that first search of the index table is actually an indexed search onthe tile number.With no index the entire feature table would have to be read andeach feature evaluated to see whether it is inside the query window or not.Thereare only five features in this simple example, but what if there were several hun-dred thousand and you were interested only in a small area? One feature retrieved,A, is actually not inside the query window but would be retrieved anyway becauseit, or at least part of it, is inside tile 1. Slightly more sophisticated indexing systemswill execute a second query at this time of selecting from this set (A, B, C) onlythose features that intersect the query window.This will result in A being thrownaway and not displayed and B and C being the only features returned. One GISsystem,ArcInfo, uses a three-step indexed search where each feature is a record ina feature envelope table that contains the x/x pairs of the corner of a rectangle thatcompletely encloses the feature. The first stage of the search pulls the featureenvelopes that touch the selected tiles; the second stage eliminates those featureenvelopes on one of the selected tiles but outside the query window; the thirdstage compares the actual features that remain to identify those that are inside thequery window.
Because the simplest indexing scheme would have retrieved a feature that isnot in the requested set, it is clear that choice of the size of the tile is important. Inmost cases the default tile size will result in adequate results. If you make the tilestoo large, as in this case, you retrieve excess features, but if you make them toosmall, you create a much larger index table; searching that table slows retrievaldown. More complex indexing systems support three levels of tile sizes wherethere are three index tables and the one searched is determined by how far outyou are zoomed in the display. So if you draw a large query window with theentire area of interest in view, the largest tile is searched, but if you draw a smallwindow, the search accesses the index table based on the smallest of the tiles. If youhave literally hundreds of thousands of features to search and typically are zoomedinto a small set of x/x ranges (zoom levels), you could set up the tiling system toapproximate the extent of the areas displayed at these zoom levels as your threelevels of tiling.
Setting up the spatial indexes and correctly locating the various files that needaccess for queries is referred to as tuning the database.Tuning is a craft that databaseprofessionals excel at, and the addition of a spatial index to already existing index-ing schemes is something they will quickly understand and implement. Locatingthe files that are read frequently in the center of the storage medium (disk) andthose that are read less frequently on the periphery will also speed access, as willpartitioning or splitting very large feature tables onto several different disk storagedevices, so long as each with its own disk controlling hardware and software.
Designing Spatial Data122
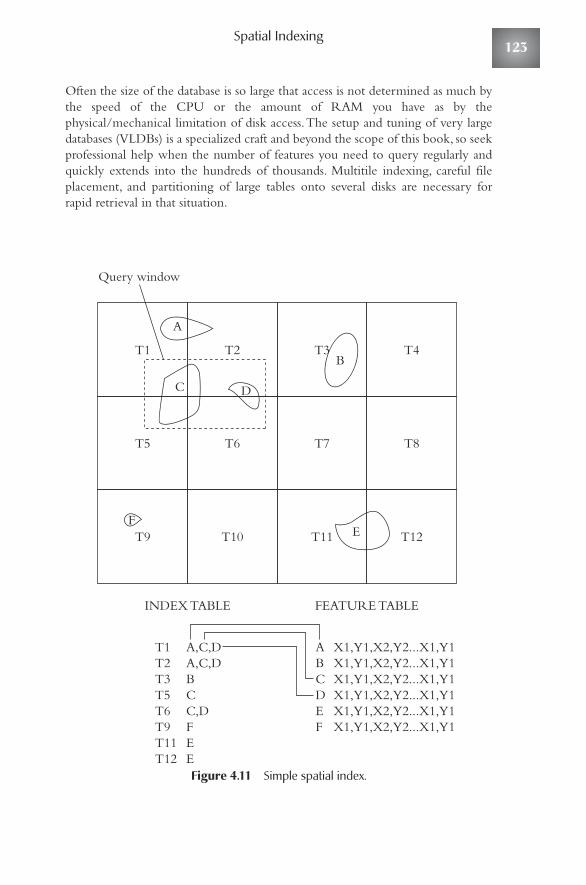
Spatial Indexing
Often the size of the database is so large that access is not determined as much bythe speed of the CPU or the amount of RAM you have as by thephysical/mechanical limitation of disk access.The setup and tuning of very largedatabases (VLDBs) is a specialized craft and beyond the scope of this book, so seekprofessional help when the number of features you need to query regularly andquickly extends into the hundreds of thousands. Multitile indexing, careful fileplacement, and partitioning of large tables onto several disks are necessary forrapid retrieval in that situation.
Figure 4.11 Simple spatial index.
INDEX TABLE
Query window
T1 A,C,DT2 A,C,DT3 BT5 CT6 C,DT9 FT11 ET12 E
A X1,Y1,X2,Y2...X1,Y1B X1,Y1,X2,Y2...X1,Y1C X1,Y1,X2,Y2...X1,Y1D X1,Y1,X2,Y2...X1,Y1E X1,Y1,X2,Y2...X1,Y1F X1,Y1,X2,Y2...X1,Y1
FEATURE TABLE
T1 T2 T3
A
C
EF
B
D
T4
T5 T6 T7 T8
T9 T10 T11 T12
123
ConclusionsIt is because GISs must deal with spatial data that it is a distinct area of inquiry indatabase design and implementation. It is difficult and complex to deal with spa-tial data in flat tables and object-oriented databases. Users are so used to the bird’seye gestalt view we have had of geographic data (the map) that we tend to under-estimate what it takes to store that information in tables and be able to extract itinto a display. How you design your spatial data determines how useful your GISwill be. Some design mistakes are relatively easy to correct, but the design of yourspatial data is so basic and central to the system that it is difficult to alter it afterconstruction. It is like a foundation or skeleton for the entire database. For exam-ple, initially constructing a GIS database using a set of layers and then changingyour mind and deciding to build a SERD out of these layers is almost a completeredesign.At a minimum you should have answered these questions:
◆ Are we going to build this database out of layers, or are we going toconstruct a SERD?
◆ What is the geographic extent of the area we need to cover in this data-base (i.e., which portion of the real world are we going to model)?
◆ What is the appropriate mix of data models, raster and vector, that willbest support our applications?
◆ What are the best projection and measurement units for our data set?◆ What type of spatial feature we will use to represent each layer or set of
real-world features? Do we need any special features of representationsuch as multiple point, line or polygon features, planar networks, ordynamic segmentation?
◆ How accurate are the various layers and feature sets in our databasegoing to be?
More questions will arise during the process, but if you can provide answers forthose questions, you are a long way to an appropriate design for your spatial data.
ADDITIONAL READING
Burrough, P.A., R. MacDonnell, and P.A. Burrough. 1998. Principles ofGeographical Information Systems, 2nd ed.. Oxford University Press: Oxford, UK.
De Floriani, L., B. Falcidieno, G. Nagy, and C. Pienovi. 1984.A hierarchical struc-ture for surface approximation. Computing & Graphics 8(2):183–183.
Heller, M. 1990.Triangulation algorithms for adaptive terrain modeling. InProceedings of the 4th International Symposium on Spatial Data Handling, 163–174.
Field, D.A., and W. D. Smith. 1991. Graded tetrahedral finite element meshes.International Journal for Numerical Methods in Engineering, 31(3):413–425.
Goodchild, M. F., and K. K. Kemp, eds. 1990. NCGIA Core Curriculum in GIS.
Designing Spatial Data124
Conclusions
National Center for Geographic Information and Analysis, University ofCalifornia: Santa Barbara, CA.
Laurini, R., and D.Thompson. 1992. Fundamentals of Spatial Information Systems.Academic Press: San Diego, CA.
Lowell, K., and A. Jaton, eds. 1999. Spatial Accuracy Assessment: Land InformationUncertainty in Natural Resources. Ann Arbor Press: Chelsea, MI.
Maling, D. H. 1973. Coordinate Systems and Map Projections. London: GeorgePhilip & Son, Ltd.
McHarg, I. 1969 Design with Nature. Natural History Press: Garden City, NY.
Peuquet, D.J. 1990.A conceptual framework and comparison of spatial data mod-els. In Introductory Readings in Geographic Information Systems. Bristol, PA:Taylor& Francis.
Robinson,A.H. et al.1995. Elements of Cartography, 6th ed. John Wiley & Sons:New York.
Samet, H. 1990. The Design and Analysis of Spatial Data Structures. Addison-Wesley: Reading, MA.
Snyder, John P. 1987. Map Projections — A Working Manual. U.S. Geological SurveyProfessional Paper 1395.Washington, D.C.: U.S. Government Printing Office
Stem, J. E.1989. State Plane Coordinate System of 1983. NOAA Manual NOSNGS 5.Washington, D.C.: National Oceanographic and AtmosphericAdministration.
INTERNET RESOURCES
Spatial data transfer standards components:ftp://sdts.er.usgs.gov/pub/sdts/standard/latest_draft/pdf/
Global positioning frequently asked questions:vancouver-webpages.com/peter/gpsfaq.txt
Map projections:gisdatadepot.com/helpdesk/projections.html
Datums and geodesy: environment.sa.gov.au/mapland/sicom/sicom/tp_scs.html
Map projections at high latitudes (antarctica):aadc.aad.gov.au/mapping/map_projections.asp
Projections and coordinate systems, GIS lounge:gislounge.com/ll/projections.shtml
National Standard for Spatial Data Accuracy:http://www.fgdc.gov/standards/documents/standards/accuracy/
125

Design Issues forAttribute DataThe move toward incorporating all data in SERDs notwithstanding (see Design
for Spatial Data section on the two models), it is still sensible in GIS to refer totwo types of data, spatial and attribute data.The spatial data are the where and theattribute data are the what (see Figure 5.1).
In the layer data model the two sets of data are joined on the unique ID value, andthere is a one-to-one correspondence between a geographic feature and the row in adata table with the attribute data.This method of having two separate tables joinedon a unique ID field (or some more complex version using more tables) was thestandard for many years in GIS software.The principal reason for this was that thesoftware companies stored the spatial data in proprietary data structures, which theydid not wish to share with others.The attribute data were typically stored in standardformats (e.g., Dbase) for easy maintenance by the users. For many years this caused alot of tension between users of rival GIS systems who were unable to read eachother’s spatial data without going through a translation process to some common datastructure. In the days of small disk storage capacity and small amounts of computermemory, these system-specific data structures often involved dozens of tables in acomplex directory structure.The link between the table(s) containing the locationalinformation about the features and the table containing the attribute informationwas critical, and if it got broken or corrupted, the GIS would not work well.Youmight know where something was but nothing about it, or you might have a lot ofattribute information but no way to visualize it in relation to other features. One GIShad (and still does if you select the layer model) the interesting quirk where if youeliminate the feature from the map-like data view, the associated record in theattribute table is also removed. But if you remove the record from the attribute table,the locational information in the geographic table is not removed. So you end upwith a feature about which you know nothing but which still appears on the screen.
CHAPTER
5
127
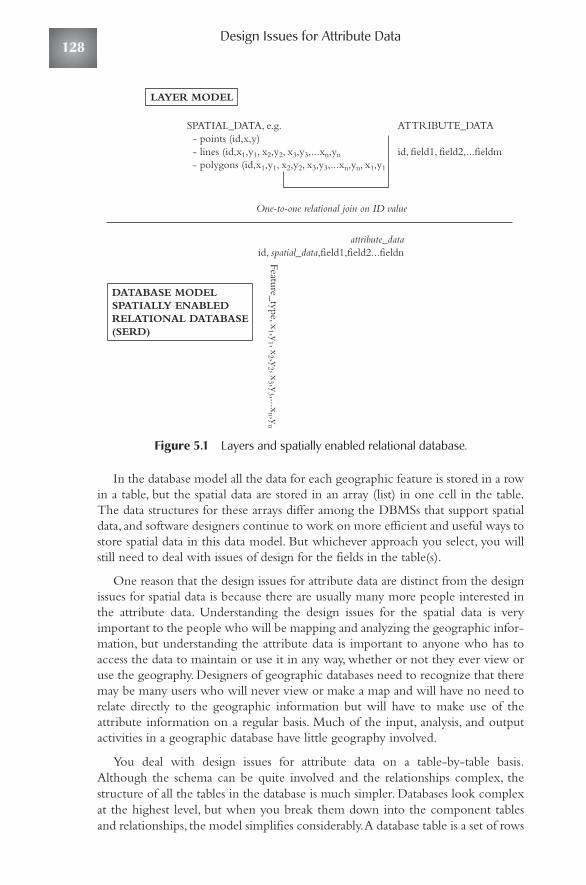
Figure 5.1 Layers and spatially enabled relational database.
In the database model all the data for each geographic feature is stored in a rowin a table, but the spatial data are stored in an array (list) in one cell in the table.The data structures for these arrays differ among the DBMSs that support spatialdata, and software designers continue to work on more efficient and useful ways tostore spatial data in this data model. But whichever approach you select, you willstill need to deal with issues of design for the fields in the table(s).
One reason that the design issues for attribute data are distinct from the designissues for spatial data is because there are usually many more people interested inthe attribute data. Understanding the design issues for the spatial data is veryimportant to the people who will be mapping and analyzing the geographic infor-mation, but understanding the attribute data is important to anyone who has toaccess the data to maintain or use it in any way, whether or not they ever view oruse the geography. Designers of geographic databases need to recognize that theremay be many users who will never view or make a map and will have no need torelate directly to the geographic information but will have to make use of theattribute information on a regular basis. Much of the input, analysis, and outputactivities in a geographic database have little geography involved.
You deal with design issues for attribute data on a table-by-table basis.Although the schema can be quite involved and the relationships complex, thestructure of all the tables in the database is much simpler. Databases look complexat the highest level, but when you break them down into the component tablesand relationships, the model simplifies considerably.A database table is a set of rows
DATABASE MODELSPATIALLY ENABLEDRELATIONAL DATABASE(SERD)
LAYER MODEL
SPATIAL_DATA, e.g.- points (id,x,y)- lines (id,x1,y1, x2,y2, x3,y3,...xn,yn
- polygons (id,x1,y1, x2,y2, x3,y3,...xn,yn, x1,y1
ATTRIBUTE_DATA
id, field1, field2,...fieldm
attribute_dataid, spatial_data,field1,field2...fieldn
Feature_type, x1 ,y
1 , x2 ,y
2 , x3 ,y
3 ,...xn ,y
n
One-to-one relational join on ID value
Design Issues for Attribute Data128
General Principles: Fields in Both D and G Tables
and columns where the rows represent objects or features and the columns, theattributes or things that we know about that particular object or feature. In a GISthese tables may be either geographic or nongeographic. Geographic tables have afield or fields that contain the locational information or a unique identificationnumber field that allows the table to be linked to a geographic table; we will referto them as G tables. Often, however, the database will often have tables that haveno geography and contain information about nongeographic objects; we will callthese D tables. For example, there may be a layer for the zoning polygons in acommunity where each feature in the table contains the geographic information(polygon outline, label point, etc.), a unique identifier for the feature, and the zon-ing category for that particular zoning polygon. Keep in mind that there may bemany polygons representing a particular zoning category that are separated byareas with different zoning, so there will be more rows in this table than there arezoning categories in the community; there will be as many rows as there areunique, closed polygons of zoning areas.This G table may be related to a nongeo-graphic data table (a D table) that contains only as many rows as there are zoningcategories (see Figure 5.2). The fields or attributes in this table could contain adescription of the category, permitted uses, a page reference to the zoning regula-tions where you find more information about the zoning category, and so on.Design issues for the fields in both types of tables are the same and by followingsome basic principles you should have a well-designed set of tables.
General Principles: Fields in Both D and G TablesThe following are the general principles that govern tables:
◆ Every table must have a unique identifier for each record, and it should beearly in the table, preferably the first field.This location may not be pos-sible for G tables because GIS software often reserves the early fields forspatial information. Most GISs actually create and manage a uniqueidentification field for each feature in the table. In database terminologythis field is a primary key, and each one in the table must be unique; noduplicates are allowed.
◆ Fields should relate directly to the objects they model. In the layer model thismeans that only geographic information would be in the G table andattribute information in the D table.A common mistake is to includetoo much information in the G table that properly belongs in a D table.In the example above, only a unique identifier and the zoning categoryare stored in the G table, with all the additional information in the Dtable.This eliminates a lot of redundancy in the database. If you stored allthe information for, say, the R1 zoning category for each R1 polygon,the same data would have to be stored many times.The permitted usesare properties of the particular zoning category, not each separate poly-gon of that zoning category. In the Zoning_Polygons G table, the only
129
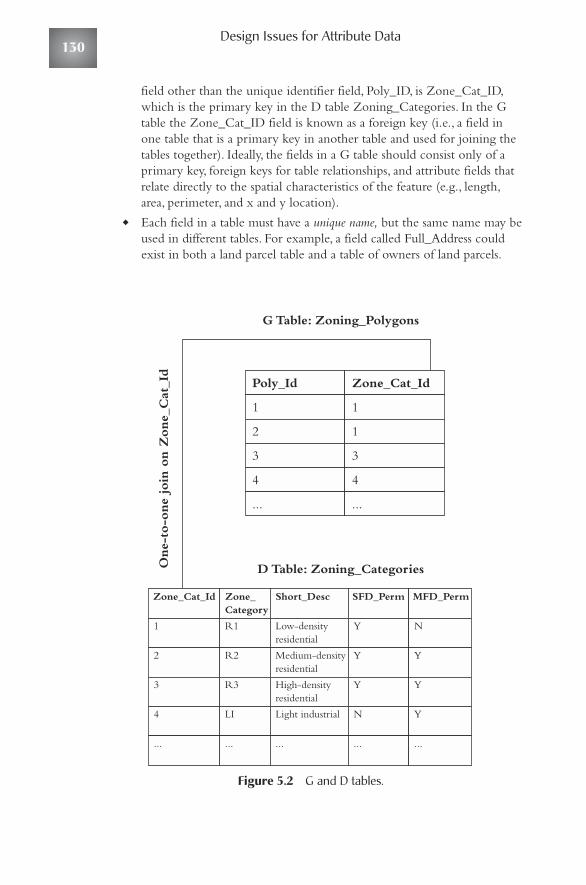
field other than the unique identifier field, Poly_ID, is Zone_Cat_ID,which is the primary key in the D table Zoning_Categories. In the Gtable the Zone_Cat_ID field is known as a foreign key (i.e., a field inone table that is a primary key in another table and used for joining thetables together). Ideally, the fields in a G table should consist only of aprimary key, foreign keys for table relationships, and attribute fields thatrelate directly to the spatial characteristics of the feature (e.g., length,area, perimeter, and x and y location).
◆ Each field in a table must have a unique name, but the same name may beused in different tables. For example, a field called Full_Address couldexist in both a land parcel table and a table of owners of land parcels.
Figure 5.2 G and D tables.
Poly_Id Zone_Cat_Id
D Table: Zoning_Categories
G Table: Zoning_Polygons
One-
to-o
ne
join
on Z
one_
Cat
_Id
Zone_Cat_Id Zone_Category
Short_Desc SFD_Perm MFD_Perm
1 R1 Low-densityresidential
Y N
2 R2 Medium-densityresidential
Y Y
3 R3 High-densityresidential
Y Y
4 LI Light industrial N Y
... ... ... ... ...
1 1
2 1
3 3
4 4
... ...
Design Issues for Attribute Data130

Specific Principles for G Tables
◆ Keep field names as short as possible and do not use spaces in field (ortable) names; if you want to separate elements of a field name, use theunderscore (e.g., Zone_Cat_Id) for unique ID values for zoning cate-gories. Some RBDMSs have restrictions on the character length of afield. Use of both upper- and lowercase letters in the field make it easierto read.
◆ Make field names descriptive so that users will have an idea of what thefield represents.Avoid too much use of numbers in field names. MostRDBMSs have a place for a field description where you can go intomore detail than the name provides. Documentation of the field, itsallowed values, length, and so on, is part of the overall database schemaand also part of the metadata.
◆ Avoid multiple fields of the same general type. Take a pavement managementexample. If you want to maintain the names of the contractors responsi-ble for work on a particular segment, there may be many different con-tractors that have worked on the segment for different purposes.A baddesign is to include a set of fields such as Contractor_1, Contractor_2,and so on, in the segment D table because the relationship between con-tractors and street segments is many to many. Each segment may havemany contractors that work on it, and each contractor may work onmany segments.That would require a composite or link table in yourschema to link contractors to street segments. But in a database repre-senting people you might want to have fields that look like multipleentries but actually represent different things.A database might containtelephone numbers for each person to represent home, work, fax, andmobile telephones.
Specific Principles for G TablesThe following principles apply to G tables:
◆ There is always a set of fields in a G table that will be specific to the GISyou are using.When you create the table for the first time, the GIS putsthese fields in. In some GISs these fields are invisible to the users, and inothers they are visible but not editable.These often contain some spatialinformation such as area or perimeter for polygon layers and length forline layers. If the system uses the geo-relational or layered data model,there will be at least one unique identification field to link the spatialwith the attribute information.The important principle to rememberabout these fields is not to alter them after they are created, losing therelationship between G and D tables.Table 5.1 lists the GIS-createdfields for a table of polygon features in an ArcInfo coverage.The GIS willmaintain at least one unique ID number that good to use as a primary keyfor this table.
131
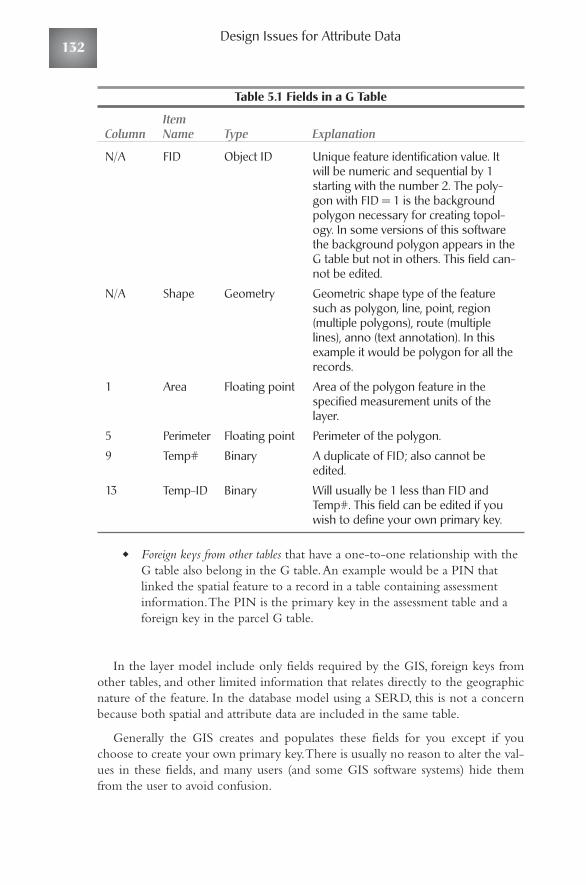
Table 5.1 Fields in a G Table
ItemColumn Name Type Explanation
N/A FID Object ID Unique feature identification value. Itwill be numeric and sequential by 1starting with the number 2. The poly-gon with FID = 1 is the backgroundpolygon necessary for creating topol-ogy. In some versions of this softwarethe background polygon appears in theG table but not in others. This field can-not be edited.
N/A Shape Geometry Geometric shape type of the featuresuch as polygon, line, point, region(multiple polygons), route (multiplelines), anno (text annotation). In thisexample it would be polygon for all therecords.
1 Area Floating point Area of the polygon feature in thespecified measurement units of thelayer.
5 Perimeter Floating point Perimeter of the polygon.
9 Temp# Binary A duplicate of FID; also cannot beedited.
13 Temp-ID Binary Will usually be 1 less than FID andTemp#. This field can be edited if youwish to define your own primary key.
◆ Foreign keys from other tables that have a one-to-one relationship with theG table also belong in the G table.An example would be a PIN thatlinked the spatial feature to a record in a table containing assessmentinformation.The PIN is the primary key in the assessment table and aforeign key in the parcel G table.
In the layer model include only fields required by the GIS, foreign keys fromother tables, and other limited information that relates directly to the geographicnature of the feature. In the database model using a SERD, this is not a concernbecause both spatial and attribute data are included in the same table.
Generally the GIS creates and populates these fields for you except if youchoose to create your own primary key.There is usually no reason to alter the val-ues in these fields, and many users (and some GIS software systems) hide themfrom the user to avoid confusion.
Design Issues for Attribute Data132
Principles for Fields in D Tables
Principles for Fields in D TablesThe fields you need to include in the data tables depend entirely on the applica-tions you wish to support with the information. Most designers work backward,designing a report or form they wish to use and then adding the necessary fieldsto the appropriate data table. In some situations there may be some kind of stan-dard template that sets up the fields for you or even fields the application isrequired by law to define in a certain way. But for each field you add to the table,you will have to define its type. Some RDBMSs and GISs allow for different typesof data than others do and may call the same data type a different name. For exam-ple, some systems call textual data by the type name TEXT and others STRINGor even CHAR, but they all stand for text data such as what you create on thecomputer keyboard. Finally, there are issues of compatibility between systems fordata of the same type. For example, most RDBMSs allow a field generally knownas a Memo field, which allows lengthy descriptions of objects with carriagereturns and special symbols, but often the memo fields of one system will nottransfer as memo fields in another. So the fields you need to define depend onyour application, and the properties you can assign to those fields depend on yourparticular RDBMS and/or GIS.The need to have certain types of fields in yourdata tables sometimes constrains your selection of GIS. Fortunately, there are quitea few data types that are common to all systems as shown in Table 5.2.
There are design issues specific to each of these data types:
◆ Numeric. RDBMSs support many types of numbers, and you must spec-ify exactly which type. Integer numbers allow a very wide range of val-ues from large negative numbers through zero and to large positivenumbers. Decimal points are not allowed in integer data. Byte numericdata is a special category of numbers restricted to the values between 0and 255.They are extremely useful for identifying categorical data suchas land use codes, building type codes, and so on.They are not good datatype for unique feature IDs if there is a chance you would have morethan 256 features in a table, as is very likely.With real, floating point, ordecimal data (you will see all three terms used in databases) the concernis how much precision you need to the right of the decimal place (i.e.,how many digits to allow for).With decimal numbers you must alsoremember when assigning the width for the field to account for the dec-imal point, which takes up a character width. Dates are actually storedand manipulated as numbers, but they may appear in reports and oninput forms in quite different formats.A common date notation isYYYYMMDD, so May 2, 1999, would be 19990502 in the database.Date formats are quite varied, and the transfer of date information fromone RDBMS to another is sometimes difficult.Additionally there aremany different forms of currency notations available for numeric datathat represents a monetary value.
133
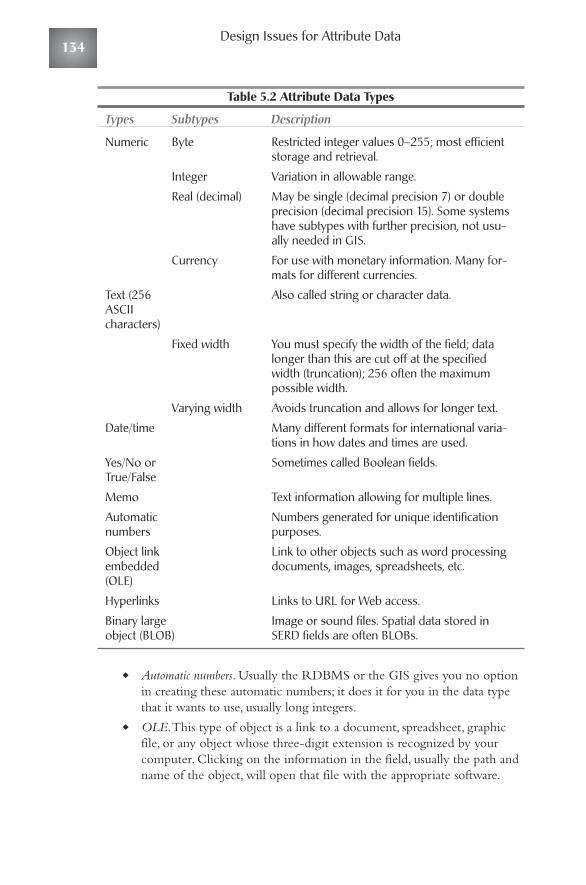
Table 5.2 Attribute Data Types
Types Subtypes Description
Numeric Byte Restricted integer values 0–255; most efficientstorage and retrieval.
Integer Variation in allowable range.
Real (decimal) May be single (decimal precision 7) or doubleprecision (decimal precision 15). Some systemshave subtypes with further precision, not usu-ally needed in GIS.
Currency For use with monetary information. Many for-mats for different currencies.
Text (256 Also called string or character data.ASCII characters)
Fixed width You must specify the width of the field; datalonger than this are cut off at the specifiedwidth (truncation); 256 often the maximumpossible width.
Varying width Avoids truncation and allows for longer text.
Date/time Many different formats for international varia-tions in how dates and times are used.
Yes/No or Sometimes called Boolean fields.True/False
Memo Text information allowing for multiple lines.
Automatic Numbers generated for unique identificationnumbers purposes.
Object link Link to other objects such as word processingembedded documents, images, spreadsheets, etc.(OLE)
Hyperlinks Links to URL for Web access.
Binary large Image or sound files. Spatial data stored inobject (BLOB) SERD fields are often BLOBs.
◆ Automatic numbers. Usually the RDBMS or the GIS gives you no optionin creating these automatic numbers; it does it for you in the data typethat it wants to use, usually long integers.
◆ OLE.This type of object is a link to a document, spreadsheet, graphicfile, or any object whose three-digit extension is recognized by yourcomputer. Clicking on the information in the field, usually the path andname of the object, will open that file with the appropriate software.
Design Issues for Attribute Data134
Principles for Fields in D Tables
This allows you to include spreadsheets, word processing documents, andso on, in the database.The object itself is not there, but the pointer towhere it is and the link to the required software allow you to view theobject from within the database.
◆ Hyperlinks. Similar to OLE objects, the object type has the URL for theobject in the field, and clicking on it will open your specified Internetbrowser and open that object. Most GISs now have the capability toinclude this kind of object, so clicking on a point or polygon will takeyou to a location on the Web. Of course, there is still the problem ofwhether that particular resource is still where it used to be on the Web.
◆ In addition to determining the correct data type for each field in eachtable, you need to consider the acceptable values within the data type.With numeric and date/time fields you can usually specify a domain,which is a range of acceptable values for a field. For example, if a data-base was designed to process deed registration for a municipality, youcould restrict the date for a field called date_filed to disallow any datesahead of the current date. Or in a table that has a currency fieldamt_tendered you could disallow any negative numbers. If you had afield that used an integer to refer to eight possible conditions that anitem could have, you could define the field as byte data and specify adomain from 1 to 8.This would prevent users from entering a valueother one of than those integers. Validation rules apply usually to text dataand can restrict values allowed in the field to a predetermined set. Forexample, if you were assigning land use categories to polygons and had aset of 15 possible text values that a polygon could have, you could set avalidation rule to keep all entries to only those 15 text combinations.Domains and validation rules are critical steps in ensuring high quality inthe attribute data in your GIS.
◆ Blobs.These are very specific to the particular RDBMS that is imple-menting them. Originally used to store image and sound files, they arenow used in SERDs to store the coordinate information in data arrays.
Each field in the table must have its type and, depending on the type of field,other information such as width or precision explicitly determined.You will alsobe presented with a question about whether or not you wish to have an index cre-ated for a field.The primary key is an automatic index because it increases by 1 aseach record is added. Because the data go into tables in no particular order, youhave to search through the entire database, one record at a time, to find a recordyou want to retrieve.Without any indexes the system must sift through the recordsone by one until it finds the desired record. An index is simply a table that isordered from low to high values on a particular field in the original table.The onlyother field in an index table is the primary key field from the original table. So if
135
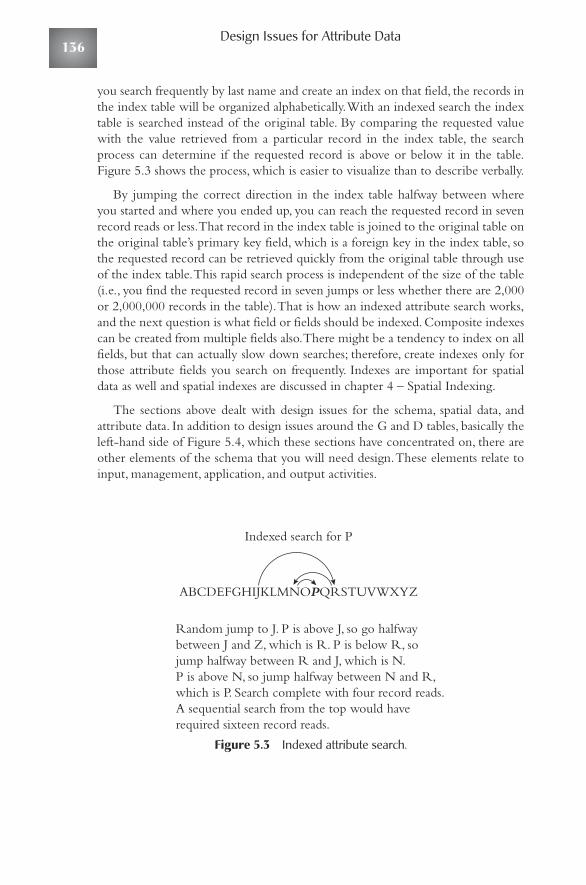
you search frequently by last name and create an index on that field, the records inthe index table will be organized alphabetically.With an indexed search the indextable is searched instead of the original table. By comparing the requested valuewith the value retrieved from a particular record in the index table, the searchprocess can determine if the requested record is above or below it in the table.Figure 5.3 shows the process, which is easier to visualize than to describe verbally.
By jumping the correct direction in the index table halfway between whereyou started and where you ended up, you can reach the requested record in sevenrecord reads or less.That record in the index table is joined to the original table onthe original table’s primary key field, which is a foreign key in the index table, sothe requested record can be retrieved quickly from the original table through useof the index table.This rapid search process is independent of the size of the table(i.e., you find the requested record in seven jumps or less whether there are 2,000or 2,000,000 records in the table).That is how an indexed attribute search works,and the next question is what field or fields should be indexed. Composite indexescan be created from multiple fields also.There might be a tendency to index on allfields, but that can actually slow down searches; therefore, create indexes only forthose attribute fields you search on frequently. Indexes are important for spatialdata as well and spatial indexes are discussed in chapter 4 – Spatial Indexing.
The sections above dealt with design issues for the schema, spatial data, andattribute data. In addition to design issues around the G and D tables, basically theleft-hand side of Figure 5.4, which these sections have concentrated on, there areother elements of the schema that you will need design.These elements relate toinput, management, application, and output activities.
Figure 5.3 Indexed attribute search.
Random jump to J. P is above J, so go halfwaybetween J and Z, which is R. P is below R, sojump halfway between R and J, which is N. P is above N, so jump halfway between N and R, which is P. Search complete with four record reads.A sequential search from the top would haverequired sixteen record reads.
Indexed search for P
ABCDEFGHIJKLMNOPQRSTUVWXYZ
Design Issues for Attribute Data136
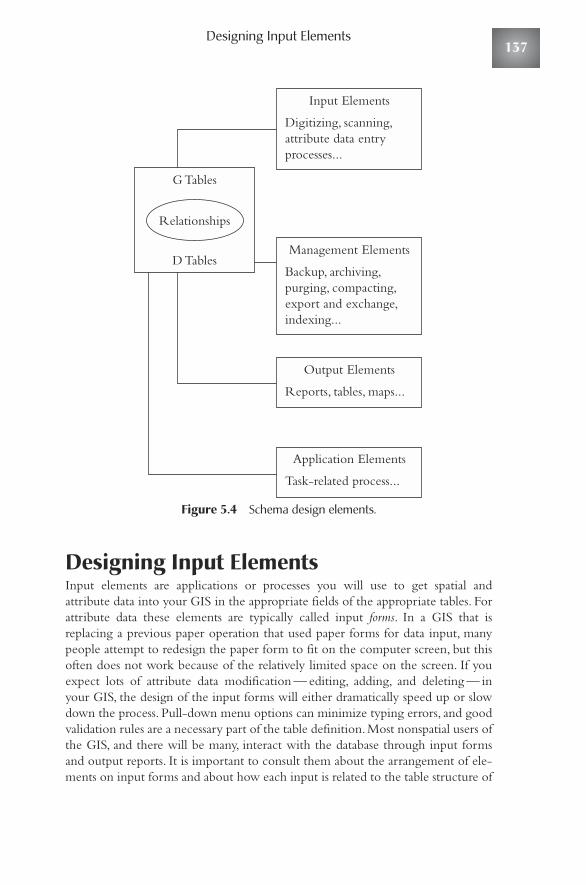
Designing Input Elements
Figure 5.4 Schema design elements.
Designing Input ElementsInput elements are applications or processes you will use to get spatial andattribute data into your GIS in the appropriate fields of the appropriate tables. Forattribute data these elements are typically called input forms. In a GIS that isreplacing a previous paper operation that used paper forms for data input, manypeople attempt to redesign the paper form to fit on the computer screen, but thisoften does not work because of the relatively limited space on the screen. If youexpect lots of attribute data modification — editing, adding, and deleting — inyour GIS, the design of the input forms will either dramatically speed up or slowdown the process. Pull-down menu options can minimize typing errors, and goodvalidation rules are a necessary part of the table definition.Most nonspatial users ofthe GIS, and there will be many, interact with the database through input formsand output reports. It is important to consult them about the arrangement of ele-ments on input forms and about how each input is related to the table structure of
Input Elements
Digitizing, scanning,attribute data entryprocesses...
G Tables
D TablesManagement Elements
Backup, archiving,purging, compacting,export and exchange,indexing...
Output Elements
Reports, tables, maps...
Application Elements
Task-related process...
Relationships
137
the schema. Forms also change, and users discover needs for new forms all thetime, so the maintenance and update processes for input forms are ongoing.Because the table structure is relational, forms will often access and/or update datain more than one table, so there are control and access issues in the design offorms. No user should have access to a form that will allow that user to modifydata the user is not supposed to modify.This is exactly the same in the paper formworld where only certain users have supplies of certain forms and the authority tofill them out. And, like paper forms, data input and modification forms can bereviewed and approved by supervisors before being committed to the database.Most of the concern over electronic signatures involves electronic commerce andlegal paperwork, but input forms in complex relational databases often requiremultiple signatures, and as the legal issues get resolved will be part of the designprocess for input forms.
The design of input forms is important not only because poor design can leadto inefficient data entry; it can lead to data corruption as well.When addresses areentered on a form for a community that might have several thousand differentstreet names, you will want to discourage (or disable) the actual typing of the streetname because of number of errors that will occur.Therefore, you might want todesign a system where the user clicks on the letter of the alphabet the street beginswith to produces a pull-down menu for selecting the street. Boxes on the screencan be constrained, through validation rules for the table column, to accept dataonly in a particular format or range. The input form can automatically placedashes between the elements of telephone numbers and even produce lists ofcommon area codes but allow for input of area codes not on the list. Input formscan also be set up to turn whatever text is typed in into uppercase text so the userdoesn’t have to remember to hit the Caps Lock key on the keyboard.When a formon a computer screen is filled out from a paper form, it is important to design thecomputer screen form so that the user does not have to jump from place to placeto find the corresponding information on the paper form. Although there is lessand less direct attribute entry from paper forms (they have been replaced withdirect database access), there are still many applications where a paper form is filledout in the field and entered into the database later. This paper form then alsobecomes an important backup record of the transaction or information. Finally,the design of many forms that might be used for input into a GIS may have legalrequirements for what must be on the form, so that exact format must be used.Input forms are significant design elements for a GIS, but because they very sowidely from application area to application area, we must leave them for now.
Design of Output ElementsBeginning users of GIS think that most output from a GIS is a paper or computerscreen map of some location or set of locations. However, there are many differenttypes of possible output from a GIS, and each has its own design concerns.
Design Issues for Attribute Data138
Design of Output Elements
Map Design IssuesMap design is a complex issue and really beyond the scope of this book. But it isclearly important, or there would not be some sort of map design competition atalmost every GIS conference or convention ever held.The ability to display infor-mation visually is perhaps the most important way in which a GIS differs from anonspatial information system.
Cartographers and map designers disagree even about the absolutely requiredelements of a map. For example, some will insist that all maps must have an arrowof some sort indicating true north, whereas others might say that is required onlyif north is not parallel to the vertical edges of the paper. Some feel strongly that allmaps should have at least one neat line that surrounds all the design elements onthe map.All do agree that maps needs titles, legends, and some indication of scale.Each of these map elements, in addition to the base geographic information, hasits own design concerns. For each type of textual information you need to decideon type font, style, size, spacing, alignment, and so on.To show scale you need todecide on representative fraction (1:35,000), linear scale bar, or scale statement (1inch equals 1.5 miles). Even the decision of whether or not to use a comma toseparate thousands is a design question. And then there are the questions abouthow to arrange all the elements on the map. Does the title go across the top or thebottom or perhaps the side? Where does the legend go?
Issues of map design become even more important when routine map outputis a planned part of your GIS. For users who need these maps to make decisions orgo into the field, the map really is a surrogate for the entire GIS; without themapped output, the GIS is of limited use to them. Fortunately, GISs come withfunctionality that allows users to create standard templates into which differentdata can be placed. Some even have system-specific programming languages thatallow you to define exactly how you want a particular map to look and where themap elements will be placed.To make the map may require a little screen input,and the program will generate the map.
One choice you must make is where you are going to store the information onmap design.At the very simplest level you can print out how you want a standardmap to look and mark the font types, sizes, colors, line widths, and legend contentswith a pen on the map.This seems rather crude, but it works; it allows multipleusers to produce maps that appear very similar and provides, very easily, a consis-tent look for your mapped output. One step up from that is to store the informa-tion in what are often called map templates. Templates are blank maps that arealready sized and symbolized according to your design criteria, and new informa-tion is plugged into the template. Finally, some GISs have scripting or program-ming languages that allow extremely close control over mapped features. Usingthese programming languages you can locate text exactly where you want it to be,change font types, sizes, and so on. Just by changing the names of some layers,some text for titles, and other small changes in the program, the maps will come
139
out looking exactly the same every time without having to set any of the parame-ters about the mapped information.This kind of programming is very straightfor-ward and does not require high levels of programming skill
One of easiest ways to develop ideas about map design is to look at other peo-ple’s work. Most GIS software systems publish regular newsletters or even maga-zines that highlight how organizations are using the software, and they usuallyhave good examples of well-designed maps. GIS conventions and conferences arealso good areas to look for interesting designs. It is difficult to overestimate theimportance of high-quality mapped output from your GIS, especially with topmanagement.Tangible products that people can hold in their hands, such as maps,help make your complex database more real to people. Relational joins, attributedefinitions, and database schema are excellent tools to demonstrate to other data-base professionals that you have a well-designed system, but a high-quality, largecolor map or set of maps does the same thing for less sophisticated users.
Map design is a creative process that has an information foundation.The infor-mation the map presents must be correct, and the design of the map must presentthe information in such a way that the users find it useful and possibly even attrac-tive. Not all GIS users or designers are skilled at map design, and if your GISinstallation leads to large amounts of mapped output that may be seen by profes-sionals outside your organization, time spent on map design is never wasted.
Application DesignThe applications are where this process all started (see Figure 1.1) because they arethe critical element of a GIS, the element that drives the rest of them. So it is onlynatural that there would be some design concerns around applications.Applications or processes that users execute to interact with the GIS often containother design elements, and you can think of the application as the container forthese elements. It may have several input forms, a management section where thedata go to supervisors for verification and final insertion into the database, and agenerated report that is filed separately as a paper backup of the transaction orupdate.The most common way to design and visualize applications is through con-struction of flow charts, or diagrams, that show how the process moves from theuser’s perspective.These flow charts work as a blueprint for the programmers orsoftware designers who have to make the application operational. Although thefocus here is on applications that are programmed to take the user through theprocess, they can work just as well as descriptive set of procedures the user has toimplement to obtain the desired results. In this case the application is a set ofinstructions. So either way, they are instructions for the user or the program withinput from the user.They can be complex or relatively simple, but at a minimum anapplication design for a GIS application should have the following components:
◆ A list of all required tables and the fields from those tables for the appli-cation. If there are many-to-many relationships that require compositetables, make sure those tables are available as well.
Design Issues for Attribute Data140
Application Design
◆ Diagrams of input screens and output reports, including map-basedforms and reports. If the application is automated with scripting or pro-gramming, these forms and output reports will have to be quite explicit.
◆ A flow chart of the process with decision points clearly marked.Theseare places where the user needs to make a decision or supply someinformation to the application.
Figure 5.5 is a simple version of a zone change notification process that amunicipal government might have to perform.The final decision point was addedafter discussion with a staff person who did notifications such as this because theyoften include a few extra parcels that just look like they ought to be notified, evenif they do not explicitly match the stated distance criterion.This application wouldalso involve programming to allow the removal of the parcel for which the changeis being requested from the set of parcels that are within a distance of 500 ft fromthat parcel.This is because that parcel itself will always pass that query; that owner isnotified differently of the hearing than the nearby neighbors are.The principal out-put of this application,which would also have to be designed, is a set of form lettersthat go to the property owners. In most GISs it is possible to directly create theseform letters, but you may wish to export the information to a spreadsheet or data-base table for merging in a word processor. This application could be easilyextended to provide information to a management report about when the letterswere generated, who did the work, and how the responses were tracked.
141
How They Did It — Kansas Geospatial Data Addressing Standard
Addresses are so important and nonstandardized that the state ofKansas set up a committee of 15 people that had five meetings over ayear and a half, presented its results to a GIS forum, and finallypublished the standard 20 months after the first meeting. As usual,most of the work was done by a handful of people, but the time spentand variety of participants gave it some importance. The standard restson a single table, the master address table or address repository andthe relationships between that table and other tables. This table, “ageospatial dataset of situs address points” provides a single point forevery address. The standard is very specific about the components ofthe address, with all the components of the address being alpha or textinformation except possibly the unique identifier for the address. Suchspecifics as “Numeric street names shall be written using numbersrather than spelled out. For example, ‘1ST’ is to be used rather than‘FIRST.’” This is the level of detail needed in an address standard. It alsoincorporated direct reference and use of other standards such as theU.S. Postal Addressing Standards, Publication 28 and the PlanningAdvisory Service Street Naming and Property Numbering Systems, ReportNo. 332. This is along the lines of not reinventing the wheel.
continued
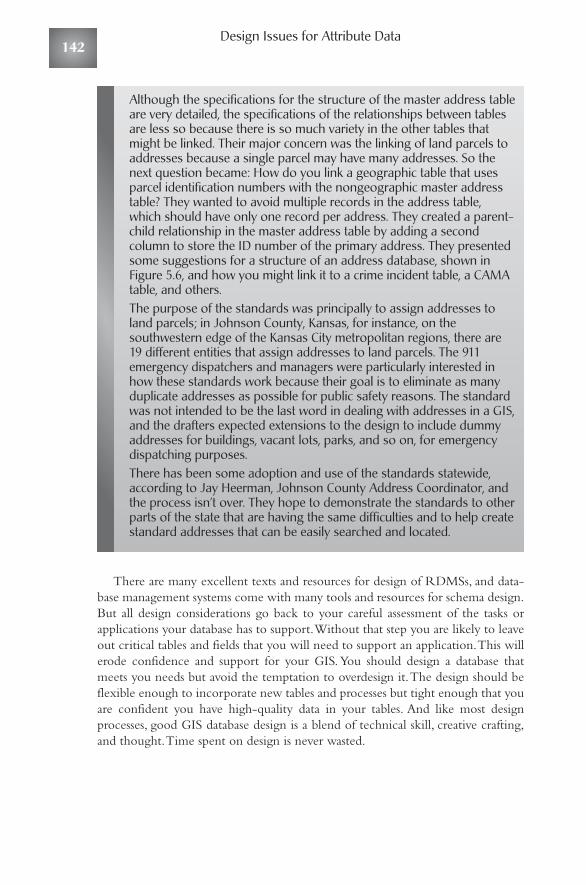
There are many excellent texts and resources for design of RDMSs, and data-base management systems come with many tools and resources for schema design.But all design considerations go back to your careful assessment of the tasks orapplications your database has to support.Without that step you are likely to leaveout critical tables and fields that you will need to support an application.This willerode confidence and support for your GIS.You should design a database thatmeets you needs but avoid the temptation to overdesign it.The design should beflexible enough to incorporate new tables and processes but tight enough that youare confident you have high-quality data in your tables. And like most designprocesses, good GIS database design is a blend of technical skill, creative crafting,and thought.Time spent on design is never wasted.
Design Issues for Attribute Data142
Although the specifications for the structure of the master address tableare very detailed, the specifications of the relationships between tablesare less so because there is so much variety in the other tables thatmight be linked. Their major concern was the linking of land parcels toaddresses because a single parcel may have many addresses. So thenext question became: How do you link a geographic table that usesparcel identification numbers with the nongeographic master addresstable? They wanted to avoid multiple records in the address table,which should have only one record per address. They created a parent-child relationship in the master address table by adding a secondcolumn to store the ID number of the primary address. They presentedsome suggestions for a structure of an address database, shown inFigure 5.6, and how you might link it to a crime incident table, a CAMAtable, and others.The purpose of the standards was principally to assign addresses toland parcels; in Johnson County, Kansas, for instance, on thesouthwestern edge of the Kansas City metropolitan regions, there are19 different entities that assign addresses to land parcels. The 911emergency dispatchers and managers were particularly interested inhow these standards work because their goal is to eliminate as manyduplicate addresses as possible for public safety reasons. The standardwas not intended to be the last word in dealing with addresses in a GIS,and the drafters expected extensions to the design to include dummyaddresses for buildings, vacant lots, parks, and so on, for emergencydispatching purposes.There has been some adoption and use of the standards statewide,according to Jay Heerman, Johnson County Address Coordinator, andthe process isn’t over. They hope to demonstrate the standards to otherparts of the state that are having the same difficulties and to help createstandard addresses that can be easily searched and located.
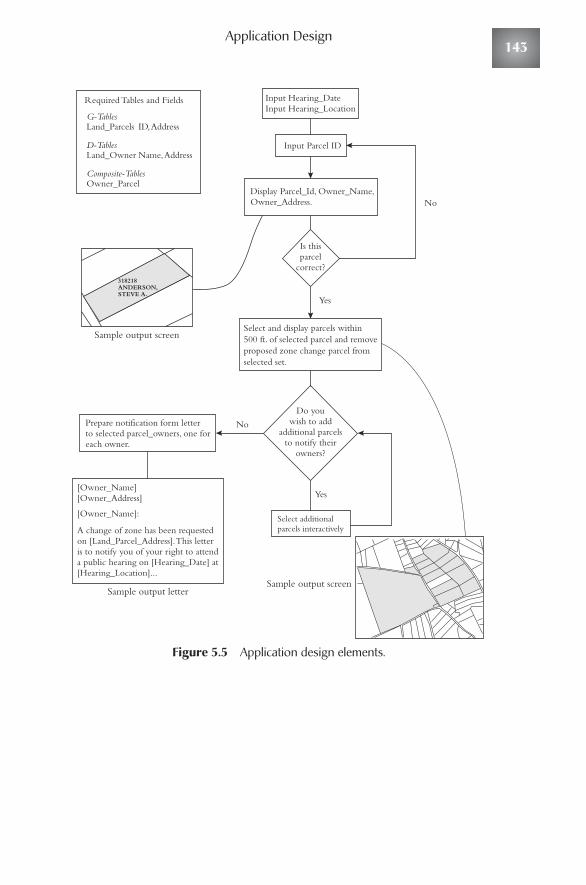
Application Design
Figure 5.5 Application design elements.
Input Hearing_DateInput Hearing_Location
Input Parcel ID
Is thisparcel
correct?
Sample output screen
Sample output screenSample output letter
Do youwish to add
additional parcelsto notify their
owners?
Display Parcel_Id, Owner_Name,Owner_Address.
Yes
No
No
Yes
Select and display parcels within 500 ft. of selected parcel and removeproposed zone change parcel fromselected set.
Select additionalparcels interactively
Prepare notification form letterto selected parcel_owners, one foreach owner.
[Owner_Name][Owner_Address]
[Owner_Name]:
A change of zone has been requestedon [Land_Parcel_Address]. This letteris to notify you of your right to attenda public hearing on [Hearing_Date] at[Hearing_Location]...
Required Tables and Fields
G-TablesLand_Parcels ID, Address
D-TablesLand_Owner Name, Address
Composite-TablesOwner_Parcel
318218ANDERSON,STEVE A.
143
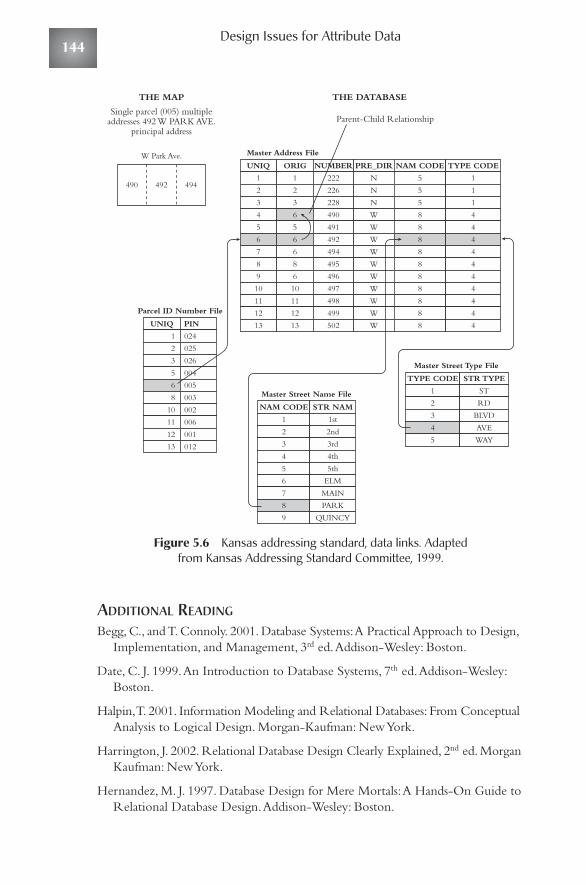
Figure 5.6 Kansas addressing standard, data links. Adapted from Kansas Addressing Standard Committee, 1999.
ADDITIONAL READING
Begg, C., and T. Connoly. 2001. Database Systems:A Practical Approach to Design,Implementation, and Management, 3rd ed.Addison-Wesley: Boston.
Date, C. J. 1999.An Introduction to Database Systems, 7th ed.Addison-Wesley:Boston.
Halpin,T. 2001. Information Modeling and Relational Databases: From ConceptualAnalysis to Logical Design. Morgan-Kaufman: New York.
Harrington, J. 2002. Relational Database Design Clearly Explained, 2nd ed. MorganKaufman: New York.
Hernandez, M. J. 1997. Database Design for Mere Mortals:A Hands-On Guide toRelational Database Design.Addison-Wesley: Boston.
UNIQ
1
2
3
4
5
6
7
8
9
10
11
12
13
ORIG
1
2
3
6
5
6
6
8
6
10
11
12
13
NUMBER
222
226
228
490
491
492
494
495
496
497
498
499
502
PRE_DIR
N
N
N
W
W
W
W
W
W
W
W
W
W
NAM CODE
5
5
5
8
8
8
8
8
8
8
8
8
8
NAM CODE
1
2
3
4
5
6
7
8
9
STR NAM
1st
2nd
3rd
4th
5th
ELM
MAIN
PARK
QUINCY
TYPE CODE
1
1
1
4
4
4
4
4
4
4
4
4
4
TYPE CODE
1
2
3
4
5
STR TYPE
ST
RD
BLVD
AVE
WAY
Master Address File
Single parcel (005) multipleaddresses 492 W PARK AVE.
principal address
W Park Ave.
490 492 494
UNIQ
1
2
3
5
6
8
10
11
12
13
PIN
024
025
026
004
005
003
002
006
001
012
Parcel ID Number File
Master Street Name File
Master Street Type File
Parent-Child Relationship
THE DATABASETHE MAP
Design Issues for Attribute Data144

Application Design
Rigaux, P., M. Scholl, and A.Voisard. 2001. Relational Databases:WithApplication to GIS. Morgan Kaufman Publishers: San Francisco.
Riordan, R. M. 1999. Designing Relational Database Systems. Microsoft Press:Redmond,WA.
Silberschatz,A., H. F. Korth, and S. Sudarshan. 2001. Database System Concepts,4th ed. McGraw-Hill: New York.
INTERNET RESOURCES
Brief discussion of the integration of a geological database with aspatial map database (Kentucky):pubs.usgs.gov/openfile/of99-386/anderson1.html
145

Remotely Sensed Dataas Background Layersand Data SourcesGeographic databases are supposed to be models of the real world, but they often
end up as models of maps. To be sure, a GIS is a single map that covers yourentire area of interest, and you can turn layers on and off, add and remove layers atwill, rearrange layers, resymbolize layers, zoom, and pan, and this has many advantagesover paper maps. But points lines and polygons against the white background of acomputer screen look, feel, and behave more like a map than the real world. Soinstead of a representation of reality, you end up with much better, intelligent maps.This is certainly a step forward, but it is possible to bring more real-world contextinto your GIS if you have a need for it.
A common method for doing this is to have some digital and visual representationof what is on the earth.This is usually an aerial photograph or some processed digitalsatellite data.When you have a need for this background visual information about theearth’s surface, you must work at the intersection of three distinct but increasinglyrelated disciplines: photogrammetry, remote sensing, and GIS. Photogrammetry is theart and science of representing and measuring the real world through photographs,usually taken from airplanes.These photographs may be analog (film) or digital andmay display the world in black and white or in color, sometimes in infrared radiation.Remote sensing is measuring reflectance of the earth using sensors sensitive to spe-cific regions of the electromagnetic spectrum.This digital data can be processed inmany ways to highlight certain earth features. These disciplines evolved indepen-dently and in advance of GIS, but their products can be easily used in a GIS if youtake the appropriate steps in the planning and design phases.
How would you know whether you will benefit from the inclusion of digital background data, either aerial photography or remotely sensed data? Some
CHAPTER
6
147
applications gain little benefit from such information. For example, if the principaluse of your GIS is vehicle routing from address to address, having detailed imagesof buildings, trees, fences, and so on, is no real value and only slows the systemdown. So a GIS application used to route emergency responders to a locationmight not need this kind of background. Once the responders reach an address,there might be a real value in having an aerial photograph behind the data. In onetown a police officer was responding to a breaking and entering call and was dis-patched to the next street to approach the house from the rear. Because there wassome urgency, he was running and tripped over a low fence that he could not seein the dark.As they reviewed the incident with the GIS using a 0.5-ft-scale aerialphotograph image as a backdrop, the fence was clearly visible. A dispatcher withaccess to that information could have warned the officer, and he could haveavoided the injury. Further, it is our experience that even in applications that donot require the presence of a backdrop image of the real world, users prefer to seethat sort of backdrop and have higher levels of confidence in the data when theysee the correspondence between the points, line, and polygons in the GIS andwhat they represent on the surface of the earth.
Aerial Photography as BackdropInformationAerial photography converted to a digital orthophoto image is a common datasource for in many municipal and utility GIS applications. Photographs from theair are taken from a range of platforms including telescoping masts, radio-con-trolled blimps, hot-air balloons, kites, helicopters, and airplanes. Most of the low-elevation platforms are used for oblique photography to show individual buildingsand small areas rather than as backdrops behind GIS data covering larger areas, sowe do not consider oblique photography in this section. Municipal and state gov-ernments take aerial photographs at intervals of 5 to 10 years, if they can afford it,and have used the printed-paper output of the photographic process for manyplanning and management applications.Water, gas, and electric utilities are also bigusers of aerial photography as is any organization with widespread land manage-ment responsibilities such as forestry and range management. For the past 30 to 40years aerial photography has been the source data for most visible mapped data —roads, building outlines, areas of vegetation, sidewalks, driveways, utility poles,fence lines, and so on, and, by using stereo pairs of photographs, for contour lines.Before organizations began using GIS, the photographs were the source of theirpaper maps.They are still the standard source for the federal government’s map-ping activities. Capturing information through photography is, per square mile,much less costly than on-the-ground surveying. Today, aerial photography,corrected for terrain and camera tilt to form an aerial map, is the source for thesame information, except instead of drafting it onto paper maps or producingphotographic prints, the data are prepared digitally for inclusion in a GIS.Thesedigital views of the real world have not completely replaced the paper prints of thefilm negatives, and many organizations use both products for different purposes.
Remotely Sensed Data as Background Layers and Data Sources148
Aerial Photography as Backdrop Information
Beginning users of GIS assume that they can simply scan existing paper aerialphotographs using a desktop scanner and then quickly drape their vector infor-mation on top of the scanned digital image. If it were that easy, everyone would doit, but it is not, so a good idea is to obtain some expert advice before planning useof aerial photography in your GIS. Most civil engineers have some training in thisarea, and even in this increasingly satellite-oriented world there are many pho-togrammetrists and aerial photography firms around, most of whom now haveexperience in producing output for use in GIS.
The best time to plan for the integration of aerial photography into your GISis when you are beginning to design the photography process or preparing theRFP. It is becoming increasingly common for aerial photography firms to providedigital versions of the photography along with the traditional paper prints andfilm negatives, but if your organization wants that, you need to incorporate thedigital version specifications at the beginning. Preparing aerial photography to bevisual backdrop to vector GIS data are much more difficult when you work fromthe final paper photographs; it is orders of magnitude easier to do it simultaneouslywith the production of the paper products.
Our discussion of aerial photography is not going to involve the myriad tech-nical concerns but will rather concentrate on the questions of importance to GIS.We include some of the simpler equations so that you can understand the basicconcepts involved, but there are many more technical questions that users mustconsider before using aerial photographs as backdrops to their vector data. (theequations presented are from Lillesand and Kiefer 2000).We also expect that youwill want your photography processed into digital orthophotographs. Anorthophotograph is processed from original scanned data that have been geo-ref-erenced to a coordinate system and draped over a digital elevation model of thearea that contains the elevation information. The goal is to produce a map-likeimage, which has been corrected for distortions caused by the lens, camera posi-tion during flight, and variations in terrain. Because locations at higher elevationsare closer to the camera than low-lying spots, the scale is not constant. In hilly ter-rain a straight-line feature such as a road or power line will appear to waver in astandard aerial photograph.After processing as an orthophotograph, it will appearas the straight-line feature it is.As an analogue or paper product, orthophotographsare produced through use of a direct optical projection orthophotoscope, but forinclusion in a GIS it is more commonly done with digital computer processing.The mathematical processing is quite complex, and it does require a digital eleva-tion model representing the terrain of the area in question. Usually, this informa-tion is gathered at the same time as the photography, but it is possible to useexisting DEMs as the terrain-correction data source. The mathematical calcula-tions involve the averaging of pixel values, so some direct information is lost, butthe result is a digital photograph in which it appears that the camera was pointingstraight down over the entire photograph. This is basically aerial photographyprocessed to look like a map.You can then draw your GIS vector information ontop of this map-like image (see Figure 6.1).
149

Figure 6.1 Digital orthophoto with vector overlay. Scale: 1:2,000; gray-scale resolution: 256 levels. Source: SBC-Southern New England Telephone(used with permission).
Color or Black and White PhotographyAll the decisions that an organization needs to make around using aerial photog-raphy in a GIS are important, and the choice of color versus black and white isone of the first to make. Color and black and white infrared photography, whichuse film that is sensitive to the infrared range of the spectrum, is also possible, butthese film types are used principally in vegetation studies. Digital color infraredimagery can be processed to produce something close to true color, however.
In choosing between color and black and white you need to consider issues ofexpense and the visibility of features on the ground. Color aerial photography, forthe same size area at the same scale and resolution, is several times more expensiveto fly and process than black and white photography. Additional prints from thecolor negatives are equally more expensive.The other key concern is whether youwill be able to visualize the needed features from color photography. In areas thatare principally covered with trees, and this can include many urban and suburbanregions, the preponderance of leaf cover will hide almost all the features you mightwant to capture.This is why most aerial photography must be flown when leaves
Scale: 1:2,000Cell Resolution: 1ftGray Scale Resolution: 256 levelsSource: SBC - Southern New England Telephone(used with permission)
Remotely Sensed Data as Background Layers and Data Sources150
Aerial Photography as Backdrop Information
are off trees. Generally, black and white photography will provide higher contrastand allow for clearer distinctions between natural and artificial features.Areas thatare almost completely developed with little natural cover, however, are particularlyappropriate for color photography. The recent aerial survey of New York City,NYCEMAP, was flown in color, and the photographs show considerable detail.Color is also good in regions that are not heavily treed. Color images appear morereal, but often more information can be seen on black and white images.And oncethe orthophotograph is in digital form, many different types of enhancements,such as improving contrast and altering brightness, will make certain features standout. Digital color photographic imagery is usually gathered through three sensorsthat record intensity of color in different bands (red, green, and blue) of the elec-tromagnetic spectrum.These bands are combined to produce a single color com-posite image. By varying the importance of the three bands in the production ofthe final image, it is possible to make certain types of features stand out; allowingeach band to be equally important produces the image closest to real-world color.You can also color orthophotographic imagery to approximate black and whitecoverage. Generally you get more options with color, but the additional acquisi-tion, processing, and storage costs are significant, so many organizations continueto use black and white orthophotography as a GIS backdrop.
Another issue of resolution for both color and black and white digital imageryis the level of resolution you want for the color information. It has become almoststandard to use a 256-value gray-scale range for black and white data where thevalue 0 indicates pure black and 255, pure white.The human eye really cannot dis-tinguish that many levels of gray but can at the levels below it (128 and 64, thenext lower powers of 2). Using the powers of 2 (256 is 8 bits, or 28) is a function ofcomputer storage. Because 8 bits equals a byte, it is easy to calculate storagerequirements for black and white data as well because each pixel will require 1byte of storage space. Color resolution is usually has 256 levels as well, with threedifferent bands, red, green, and blue.The number of possible color combinationswith three bands of 256 values is huge and produces many more colors thanhuman eyes can distinguish.
Scale of the Original PhotographyAnyone who has flown in airplanes at different elevations is quite aware that thecloser the ground you fly, the smaller the features you are able to identify. At30,000 feet it is difficult to spot individual cars on a highway, but at 10,000 feetyou can identify them by color. In aerial photography the scale of a photograph isdetermined by the focal length of the camera (distance from the shutter to thefocal plane), the height above the ground of the camera, and the height of the ter-rain being photographed. For a given focal length camera, as the airplane flieshigher the scale gets smaller, the equation is as follows:
S = f/H _ h’
where S = reciprocal of scale (e.g., at 1:24,000, S = 2,000); f = camera focallength (measured in meters; a 200-mm focal length lens would be 0.200); H =height above the ground (meters); and h’ = height of ground above sea level
151
(meters). For example, to obtain photography at scale of approximately 1 inch to200 ft using a camera with a standard focal length of 152 mm flying over a flat areaat sea level would require flying the plane at a rather low level of 370 m (1,220 ft)Using a focal length of 0.210 mm would allow you to capture data at this scalefrom 500 m (1,650 ft). Scale on an aerial photograph is not constant over hilly ter-rain because some of the area is closer to the camera than other portions.Also, thelarger the scale you require, the more photographs will have to be taken andprocessed.
Two primary standards are used to determine the accuracy of the mappingproducts derived from a photogrammetric project.The first is the National MapAccuracy Standards (NMAS) published by the USGS, and the second is theNational Standard for Spatial Data Accuracy published by the American Society ofPhotogrammetry and Remote Sensing (ASPRS) (See chapter 5 — Accuracy,Precision and Completeness). Both of these standards are very clear on the mea-surements and procedures that can be used to test the resulting data products for amapping project, but they both leave much room for interpretation by a pho-togrammetrist. For example, to be in compliance with the NMAS standard andproduce a final mapping product of 1 inch =100 ft, the height of the aerial flightcan vary from a photo scale of 1 inch =600 ft to 1 in =1200 ft.The test to measurethe accuracy of the data is that 90 percent of the features collected are within one-fortieth of the mapping scale, or 2.5 ft.There is nothing in the standard that defineswhat the scale of the flight needs to be to produce this result; thus companies thatprovide these services are left to their own discretion as to what scale to use.
One of the disadvantages of digital orthophotography over traditional film aer-ial photography is the limited range of scale to which you can zoom.The silverhalide crystals in the film negative that contain the level of darkness in a photo-graph are extremely small and vary in size.This means that you can develop printsfrom the negative at a scale much larger than the original photograph and stillhave considerable detail in the image. Eventually small features get fuzzy, but youcan blow up or zoom in very far using photographic negatives. If you process thephotography digitally for inclusion into your GIS, the photographs will be appro-priate for viewing only at certain scales.This is determined by the cell resolutionyou select for the digital information.The smaller the cell sizes the smaller the fea-tures you can recognize.Typically digital orthophotographs use cell resolutions of1 m, 1 ft, or 0.5 ft. If you zoom in too close to the photograph at a large scale, thepixel structure of the data obscures any features you might wish to identify (seeFigure 6.2). Most GISs allow you to control the drawing of layers and restrict thatto a specified scale range. So if your area of interest were large and required severaldozen photograph tiles to cover it with imagery, you probably would not want allthat imagery to draw when you were looking at the entire area. Rather, youwould want the imagery to appear when you were zoomed in to a certain scale.But if you zoom in too far, the pixel structure of the data will be apparent, and itwill not be possible to discriminate features on the image. Setting the scale rangefor orthophotograph drawing is a design question, and the smaller the cell size res-olution the closer in you will be able to zoom.
Remotely Sensed Data as Background Layers and Data Sources152
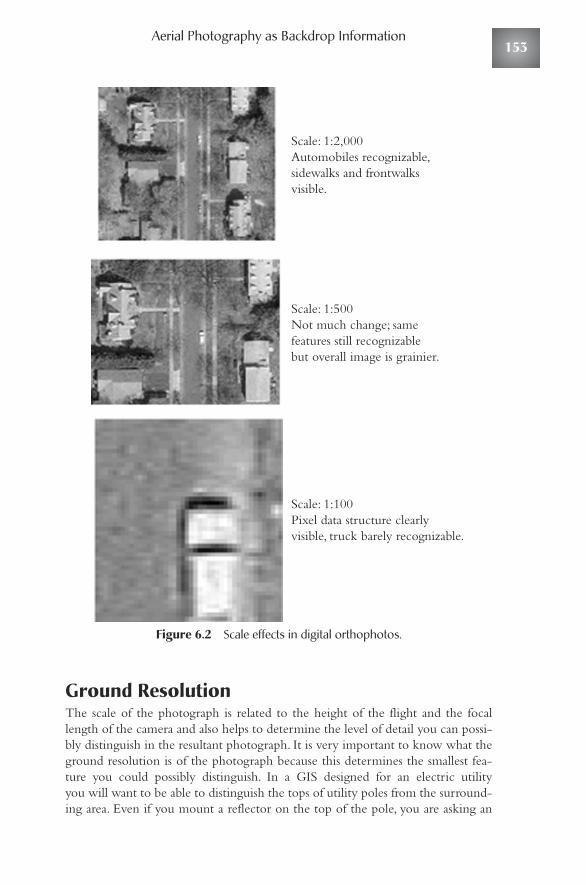
Aerial Photography as Backdrop Information
Figure 6.2 Scale effects in digital orthophotos.
Ground ResolutionThe scale of the photograph is related to the height of the flight and the focallength of the camera and also helps to determine the level of detail you can possi-bly distinguish in the resultant photograph. It is very important to know what theground resolution is of the photograph because this determines the smallest fea-ture you could possibly distinguish. In a GIS designed for an electric utility you will want to be able to distinguish the tops of utility poles from the surround-ing area. Even if you mount a reflector on the top of the pole, you are asking an
Scale: 1:2,000Automobiles recognizable,sidewalks and frontwalksvisible.
Scale: 1:500Not much change; samefeatures still recognizablebut overall image is grainier.
Scale: 1:100Pixel data structure clearlyvisible, truck barely recognizable.
153
interpreter to identify a circle 12 inches or so in diameter; that is quite small.Theamount of spatial resolution you can derive from a particular photographic systemis impossible to quantify because there are so many factors that affect it.Atmospheric conditions, film developing conditions, the contrast level of the film,the speed with which the film accepts light, vibrations to the camera; the list islong.Most factors are difficult to quantify, but there are some that can be measuredto help determine what level of detail you can capture.These are the scale of thephotograph and the resolving power of the lens and film combination.Althoughthere are sophisticated ways to measure resolving power, the final measurementconsists of the number of alternating black and white line pairs that can be distin-guished per millimeter of film.This resolving power for modern films and lenses istremendous and is what allows the identification of relatively small features on thelandscape.Assuming that there is no degradation of ground resolution by the non-quantifiable factors, and there will be, ground resolution is as follows:
GRD = reciprocal of photograph scale/system resolution
So if the resolution of the system of lens and film were 40 lines/mm, and thescale of the photograph was 1:15,000,
GRD = 15,000/40 = 300 mm, or 0.30 m
This is the optimal level of detail you could resolve on the photograph, but youwill rarely attain it.What you can actually see is affected by the visual contrast inthe landscape, distortions caused by camera vibration, air quality, film transport,and so on.The ground resolution provides a theoretical minimum of the size offeature that can be distinguished from something else.
If a cell resolution of 1 m is adequate for your needs and you are not too con-cerned about the regency of the imagery, the most inexpensive way (in the UnitedStates, at least) to incorporate image data in a GIS is to use the digital orthopho-tographs provided by the USGS (digital orthophoto quarter quadrangles orDOQQ). Each image covers one-quarter of a 7.5-minute quadrangle at a scale of1:12,000 with a cell resolution of 1 m. For urban applications the scale is toosmall, but for larger areas of interest the images can be a useful addition to a GIS.They can be obtained at very low cost from the USGS, many are on the WorldWide Web, and there are several resellers and packagers who will enhance andcombine these images at a reasonable cost. Distribution is on CDs with onecounty per disk, and its very affordable pricing policy makes this data source veryinexpensive. Coverage of the United States is not yet complete, and similarresources are not available at such low cost in the rest of the world.The largestproblem with using this digital orthophoto source is that the images are usuallyseveral years old and the update cycle is long.There is a tendency to think that theimage behind the data is representing the world as it is today, but it is always at least6 months old and usually much older than that. It is a little odd to see an up-to-date map of land parcels that clearly indicate a subdivision draped over the farmthat was there when the image was taken. CDs from the USGS come in the UTMprojection, so you would need processing capability to match it with your selectedprojection.
Remotely Sensed Data as Background Layers and Data Sources154
Capture Data as Well?
Number of Required Photographs or TilesThe number of photographs you will need to take is a function of the size of yourarea of interest, the scale and related ground resolution you have selected, and theamount of overlap you need between adjacent photographs.The standard frameaerial camera takes a negative 230 mm on a side, approximately 9 inches. So at ascale of 1:15,000 a single photograph would show an area of 11,250 square feet, or2.1 miles on a side for an area of 5 square miles. If you are going to use the pho-tography to derive contour lines and elevation information, you will need to havesufficient overlap in the photographs so that stereo imaging is possible. Even if youare not going to do that, and most do, you need overlap because of scale and direc-tion distortion that occurs in photographs caused by the camera’s lenses.This dis-tortion reduces the usable area of a photograph.The airplane flies the region inapproximately straight lines of flight, and common overlaps in the direction offlight are 55 to 65 percent, with 30 percent between adjacent flight lines. Thisincreases significantly the number of photographs required to cover a given area.Determining how many photographs to take, at what elevation, with what focal-length camera and on what kind of film are all technical considerations that relatedirectly back to your determination of the smallest feature you wish to be able torecognize on the final photograph.The contractor will be able to calculate thesefactors and their costs, but only the final user can determine the level of detail thatis necessary for a given application.
Capture Data as Well?Three primary types of data are typically collected using aerial photography forinclusion in a GIS: planimetric features, topographic features, and digitalorthophotographs. Planimetric features are those natural or artificial features thatcan be distinguished and are visible on the surface of the earth.Typical planimet-ric features include the following: edge of pavement, sidewalks, driveways, parkingareas, structures, pools, tree outlines, brush/shrubs, street trees, signs, parkingmeters, flag poles, utility poles, lakes, ponds, streams, rivers, wetlands, and bridges.Decisions about which features are going to be captured from the photographyare made before the photography is flown because it is a key determinant of thescale of the photography.The smaller the feature you want to obtain for your GIS(e.g., parking meters), the larger the scale of your photography.
Digital orthophotographs are the principal source for planimetric data used insmall- and medium-scale GIS applications. Because of their map-like appearance,it is possible to use heads-ups digitizing and prepare vector layers from visible fea-tures. The selected cell resolution determines what features you can see on thephotograph, but the decision of what features to capture in vector format off thephotographs is a separate one that also has cost implications. Road centerlines,rights of way, building outlines, hydrographic features, fence lines, walls, elevationcontours (if sufficient overlap was allowed for), pavement striping, street furniture,driveways, and sidewalks can all be seen on 1-ft or better aerial photography.Thecapturing of the vector data is done at the same time as the images are processed,
155
and you may specify as much or as little vector information as you wish and canafford. The derived vector information and the orthophotographs are separateitems and have different uses. One GIS manager in a Maryland County surveyedhis users about their preferences, asking them if they wanted updates of just thephotography or of just the planimetric information and was surprised that theychoose to have the photographic updates. The incorporation of these imagesbrings much of the real world into analysis.
Topographic features are those that represent the vertical elevation of a surfacein a three-dimensional plane.These features are typically referenced by the con-tour increment that they represent. For example, common increments are 2-, 5-,or 10-ft contour increments where each line represents the corresponding changein vertical elevation on the surface of the ground. For a 2-ft contour interval, eachline on the map would represent 2 ft of vertical elevation change.The other com-mon topographic features found are spot elevations; they are specific elevationsthat are found at high pints, low points, and saddles on a topographic map.
With regard to standards applied to typical topographic maps, the vertical accu-racy of a map is typical defined as one-half the contour interval. So for a 2-ft con-tour map, the accuracy of any point on the map would be ±1 ft.The contours aredeveloped from overlapping stereo pairs of photographs and known elevationpoints, and you must select the contour interval before the flight.
Recently a new technology for gathering topographic information has beendeveloped, light detection and ranging (LIDAR). Simply, an air-borne LIDARsystem, on the same plane with the aerial cameras, sends a laser pulse to theground and measures the time it takes for the reflected pulse to return. Becausethe speed of light is a constant and the elevation of the plane can be determinedwhen the pulse was sent, the time it takes to receive the reflection will allow thesystem to calculate the elevation of the point of reflection.With pulses being senthundreds of times per second, LIDAR returns a very complex picture of topogra-phy. For example, in heavily treed areas you will receive some reflection of thepulse from the top of the canopy, some from the understory layer, and some fromthe ground. LIDAR will return rudimentary building outlines. Because manypulses will reflect off a building, the flat roof will be visible and the spaces betweenbuildings as well. LIDAR returns a very detailed three-dimensional picture of thelandscape and what is on it and requires quite a bit of postprocessing analysis forinterpretation. LIDAR has many uses in measuring distances, speeds, rotation, andchemical composition and is heavily used in atmospheric research and volumeestimation. In GIS the principal use is to provide detailed topographic informa-tion either in a high-density, small-pixel raster layer or as processed contour lines.Some exciting applications are being developed for LIDAR data and GIS. One isusing LIDAR to update existing data layers. A shaded-relief LIDAR image withbuilding outlines drawn over it will show buildings that are no longer present.Theoutline of the building in the LIDAR image will not look exactly rectangularbecause of the way the pulses are sent, but the absence of a building underneaththe outline is evident and the outline can be removed.
Remotely Sensed Data as Background Layers and Data Sources156
Dealing with the Images
Although many organizations still fly traditional aerial photography where theoutput is acetate negatives and paper photographic prints, many are using thecombination of aerial photography to capture the planimetric information, air-borne GPS to track horizontal and vertical location during data capture, andLIDAR to capture the digital elevation information necessary for developingtopographic data and the digital orthophotograph.
Dealing with the ImagesOnce processed into digital orthophotographs, the data are usually delivered in aset of files, most commonly using the tagged interchange file (TIF) format.Thisfile format is standard in the graphic design and digital photography areas. If youare going to use these files in a GIS, there is the additional concern of adding loca-tional information to the file.A TIF, by itself, is in a local coordinate system wherethe pixel at the upper left-hand corner of the image is at 0,0 and the pixel at thelower right-hand corner is at whatever the number of rows and columns are in theimage, usually quite large.This raw image will not be properly placed behind yourvector data without additional information.This is provided in an associated file,the TIF world file (.tfw).This file contains information on the projected coordi-nates of the upper left-hand corner and the number of real-world units covered byeach pixel in the x (longitude) and y (latitude) direction, the cell resolution in thedistance units of the projection (usually feet or meters). Other graphic formatssuch as .gif and .bmp, which are also widely used in graphics and digital photog-raphy and on the World Wide Web, do not support these world files and are notuseful as backdrop formats.
The number of image tiles that will be produced from the photography for usein your GIS is a different decision from the number of photographs that must betaken.The orthophotographs can be digitally combined into tiles of any size fordisplay. Unlike the individual photographs, the tiles will show a common size areaand a standard distance in the x (longitude) and y (latitude) dimensions.Table 6.1shows the relationship between cell size and the number of tiles.We selected 50MB as an upper limit for a single tile because images larger than that draw slowlyon normal desktop machines.
Table 6.1 Black and White 256-Gray-Scale Range
Square Tile MinimumDimension (ft) Number of Necessary to Tiles No. of CDs
Cell Keep Area Shown Needed to (670 MB) Resolution Uncompressed on Tile Cover Needed to(ft) Image = 50 MB (sq. miles) 50 Sq. Miles Store Tiles
3 12,247.4 5.4 9 1
1 7,071.1 1.8 28 2
0.5 3,535.5 0.4 112 8
157
If you will be using digital orthophotographs as backdrop data, there are impli-cations that affect hardware selection. The graphic images are large and requireextra RAM in your computers. Redraw speed can be improved with higher-qual-ity video cards as well, which keep a lot of the image processing right on the videocard rather than using the computer’s core memory. Larger and higher-quality flatmonitors also enhance the use of backdrop photography.
Using file compression technologies, it is often possible to mosaic (combine) allthe tiles needed to cover your area of interest into a single image if your area ofinterest is not too large.For example, a single image made up of mosaiced orthopho-tography (0.5 ft. cell resolution, 256 gray-scale levels) of a community of 24 squaremiles requires 151 MB of disk space. Stored as TIF images it would take 2.6 giga-bytes of storage space to cover 24 square miles.These images were compressed witha proprietary compression program (MrSID, Lizard Tech) that can achieve compres-sion ratios of 1:20 with very little loss in image quality; this example achieved a 1:17compression factor. The DOQQs from the USGS are compressed with the JointPhotographic Experts Group (JPEG) compression technology, which is relativelylossy, which means that visual discrimination of features is reduced. Compression isalways a compromise between file size and information on the image, where theuncompressed image always contains more information than the compressed image;the trade-off is in the physical size of the image.
The ability to view compressed image files is present in most GISs, but the abil-ity to compress them is a separate software license. If this is not an option or is tooexpensive, it is not difficult to store the tiles in an image library or catalogue.Withsome additional programming of your GIS, you can load and unload the neededphoto images tiles as you pan and zoom around the map. Either serious file com-pression or storing the images in a library or catalogue will be necessary to usedigital aerial photography in your GIS.You also need to make sure when you arespecifying your hardware needs that you account for sufficient disk storage space(see Table 6.1) for all users of the system.
How Many Users of the Aerial Photography WillThere Be and How Will We Serve Up theNecessary Images?Image data, even when compressed to the maximum possible, are stored in verylarge files. If you plan to store the images centrally and have users access them fromthe remote server, you need to make sure that your network is capable of movingfiles of 50 MB or larger quickly. Slow drawing speed frustrates all users. If this is aproblem, you should investigate the storage of multiple copies of the image dataon individual machines as another solution. Typically image data are acquiredinfrequently, every 5 to10 years, say, whereas the vector data draped over it may beupdated frequently, so a solution of storing many copies of the image data on thedesktop machines and the updated vector data on a server is a good choice. Eachdesktop machine will have to have sufficient storage space and processing powerto quickly draw and redraw the images, though.
Remotely Sensed Data as Background Layers and Data Sources158
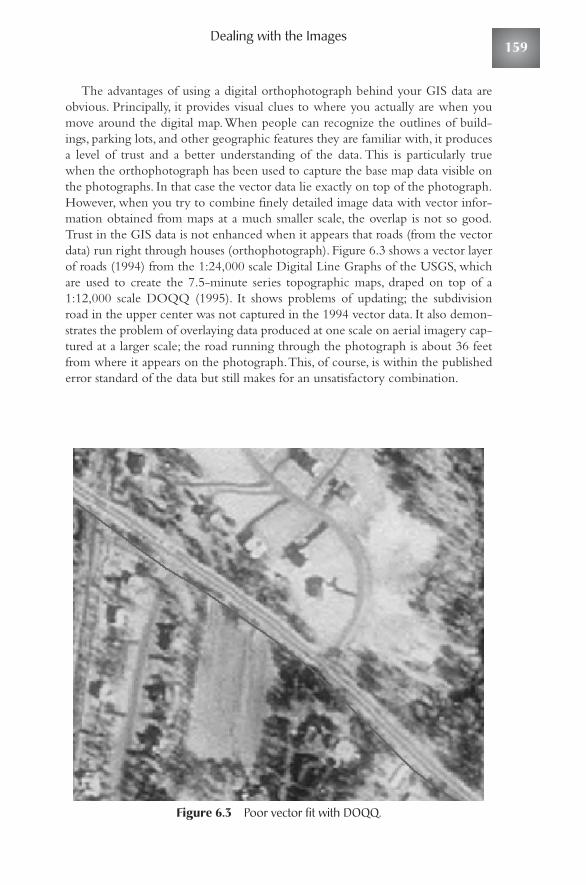
Dealing with the Images
The advantages of using a digital orthophotograph behind your GIS data areobvious. Principally, it provides visual clues to where you actually are when youmove around the digital map.When people can recognize the outlines of build-ings, parking lots, and other geographic features they are familiar with, it producesa level of trust and a better understanding of the data. This is particularly truewhen the orthophotograph has been used to capture the base map data visible onthe photographs. In that case the vector data lie exactly on top of the photograph.However, when you try to combine finely detailed image data with vector infor-mation obtained from maps at a much smaller scale, the overlap is not so good.Trust in the GIS data is not enhanced when it appears that roads (from the vectordata) run right through houses (orthophotograph). Figure 6.3 shows a vector layerof roads (1994) from the 1:24,000 scale Digital Line Graphs of the USGS, whichare used to create the 7.5-minute series topographic maps, draped on top of a1:12,000 scale DOQQ (1995). It shows problems of updating; the subdivisionroad in the upper center was not captured in the 1994 vector data. It also demon-strates the problem of overlaying data produced at one scale on aerial imagery cap-tured at a larger scale; the road running through the photograph is about 36 feetfrom where it appears on the photograph.This, of course, is within the publishederror standard of the data but still makes for an unsatisfactory combination.
Figure 6.3 Poor vector fit with DOQQ.
159
The decision to fly new aerial photography and incorporate it in your GIS isan important one, and you should certainly involve professionals in the processand not rely on the information presented in this section.The additional cost ofcreating digital orthophotographs from the negatives is small compared to the costof flying and producing the original negatives, and the advantages gained from thisbackground information are considerable.
Remotely Sensed Data as Background Layers and Data Sources160
How They Did It — Aerial Photography as Backdrop and Data Source: City of New York
In the early 1990s two staff people in information technology and cityplanning in New York City, Alan Leidner and Richard Steinberg, werelamenting the fact that the multiple agencies of New York City withmapping functions were using maps at different scales with differentlevels of accuracy, and this was seriously hampering coordination. Theysaw the need for an accurate base map for New York City, but it took 5years and two mayoral administrations before the actual photographywas flown. The city’s Department of Environmental Protection, theMayor’s Office, and the Office of Emergency Management were the leadagencies that worked during the 5-year period to get the projectunderway, and the Departments of City Planning, Transportation, Police,Fire, Finance, and Design and Construction were all involved in the mapdesign process. The basic plan was to fly the city twice, once in conditions when theleaves were off and once when they were on. The plan was to capturedetailed planimetric information from both sets of flights and producecolor orthophotography for visual backdrop behind the planimetricinformation. The specifications called for accuracy at NMAS for 1 inch= 100 ft scale mapping, ±2 ft horizontally, and ±1 ft vertically. At thisresolution, home plate at Yankee Stadium is visible, as are individualcrosswalks and fire hydrants. They used airborne GPS and stereo pairsto produce the topographic information, the contours, needed. With aerial photography those were the key spatial decisions to bemade, but because the photography was going to be used to gatherinformation such as curbs and building and block outlines, they had todecide which features they wished to capture from the photography invector format. This almost always leads to heated discussions overwhat to include and what to exclude, and these decisions havesignificant cost implications. The total cost of this mapping was$5,000,000; $3,000,000 was the cost of capturing the planimetric datafrom the photography. Alleys and airshafts were included but not watertowers and fire escapes. Awnings produced a lot of debate and one ofthe initiators, Alan Leidner, was quoted as saying, “Awnings! What doyou do with them? And then driveways! When you capture them, whatdo you do with them?” (Gopnik 2000). There is a tendency to want tocapture everything from the aerial photography, but going back to thequestion of what you will do with it keeps it focused.
Integrating Remotely Sensed Information with GIS
Integrating Remotely Sensed Informationwith GIS
As BackdropThe use of backdrop aerial photographs behind vector information in a GIS isprincipally for locational context. Seeing the outline of a building on a whitebackground provides limited information to the viewer. When you can see the
161
The heads-up digitizing of the planimetric information was contractedout to a firm in Colorado and took a year to complete. Qualityassurance and control are important parts of this process, and that isdifficult to do at a distance (e.g., from Colorado). A local university,Hunter College, was hired to do the quality control and groundchecking for the map, and this process produced over 30,000 changesto the map and took almost 2 years to complete,There were geographic databases consisting of a comprehensive streetname and address database, a tax lot and city block database, and astreet centerline database that had been in place for some time in theCity Planning Department. They have since registered that informationdirectly to the NYCMap data. The city has a unique identificationnumber for every building (BIN), and these numbers were attached tothe building outlines captured from the photography at a cost of$1,000,000. These identification numbers are used in more than 20 citydatabases, which can now be tied to the building outline layer. Theexisting databases were rich and accurate in terms of their attributeinformation, and the NYCMap orthophotography and planimetricdatabases were rich and accurate in geographic information. Themarrying of these databases has created what the city now calls a GISUtility.The actual process used by New York City to produce this GIS Utilitywas not revolutionary in any sense except for the scale of itsdevelopment; New York City is a large, dense, and diverse place toundertake such a project. This project is also a good example ofunexpected uses for digital orthophotography. During an outbreak ofWest Nile virus the Public Health Department used the photography tolocate piles of automobile tires and places where water couldaccumulate in shallow pools to target their spraying program. Theproject and its photography have received a lot of media and publicattention recently because of its use in the recovery during the WorldTrade Center disaster in September 2001. With that base map in place,derived from the photography, it was possible to quickly register thesubsurface infrastructure layers to assist in the recovery effort. Thesuccess of the GIS and mapping efforts around this tragedy has beenwidely reported and could serve as an impetus for other communitiesto update their digital orthophotography and planimetric base.

parking lot, the cars in it, the trees around the building, and walkways leading to it,the screen more closely resembles what you might see in the real world, althoughfrom a perspective you do not often get.
Remotely sensed information can be processed and used as a backdrop as well,and several companies are vigorously pursuing that segment of the market withpanchromatic (black and white) and processed natural color products at resolu-tions of 1 to 15 m.The information is also used to develop layers of informationuseful in analysis or management tasks (e.g., land cover or change analysis).An aer-ial photograph brings a visual context, but remotely sensed information bringsanalytical content into your GIS. Technically, aerial photographs are remotelysensed information, as is MRI of the human body, but here we are referring todata gathered by sensors other than film in a camera (or its digital equivalent) fromairplanes or satellite platforms.
The technology and science of remote sensing predates GIS and was the prod-uct principally of government activity driven first by resource managementrequirements and later for military needs. But now they have become inherentlylinked technologies due to the power of remote sensing to provide information toa GIS that is unobtainable in any other way (Star et al. 1997, xv). Only some GISsoftware systems have the capability of processing remotely sensed data, but all candisplay data that have already been processed. When you are working withremotely sensed information, most of the time any processing is to make theinformation useful for your purpose; typically the analytical tasks will take a rela-tively small percentage of the time involved. The technical problems of takinginformation from multiple sensors, over different time periods, and preparing it soit will overlay closely with the vector information in your GIS are considerableand, like aerial photography, require the skills of trained individuals.
There is no quick fix, no right-out-of-the-box way to integrate remotelysensed information unless you are willing to pay for professionals to do the pro-cessing. If you wish to do it yourself, there will be a significant learning curve. So,as in the previous section, our goal is not to make you experts in remote sensingin a few pages in a book but to expose you to the problems involved and the keydecisions you need to make as you integrate these different but linked informationsources.Also, the technology can be broadly split into passive sensors, which mea-sure energy reflected by the earth’s surface, and active sensors, which send out amicrowave or radar pulse and measure the reflectance of that pulse off earth fea-tures. Our discussion is on passive sensors; data from active sensors are of little util-ity within a GIS with one exception, LIDAR, discussed earlier.
The advance of the technology of remotely sensed imagery has producedsteady increases in spatial resolution, spectral resolution, and temporal frequency ofcoverage. Spatial resolution refers to the sensors internal field of view (IFOV), thesize on the ground of each pixel recorded by the sensor (see Table 6.2). Spectralresolution involves the portions of the electromagnetic spectrum (EMS) the sen-sors can detect. Each band detects energy reflected from the earth within a dis-crete range of the spectrum (e.g., green 0.0 to .60 micrometers). Generally, remotesatellite sensors cover visible light through the near and mid-infrared segments of
Remotely Sensed Data as Background Layers and Data Sources162

Integrating Remotely Sensed Information with GIS
the spectrum, sometimes moving into the thermal infrared segment with a largercell size. Over the past 30 years there have been significant increases in the num-ber of bands and narrowing of the sections they detect, which yields increasedinformation about geographic features.Temporal resolution is how frequently thesatellite returns to take information from the same area of the earth. Higher fre-quencies allow for closer monitoring, and because the system works best duringperiods of no cloud cover, a higher frequency will increase the likelihood of get-ting good imagery around the time you need it. If your need is for black and whiteor natural color background information, the key concern is spatial resolution:The smaller the cell size, the closer to aerial photography the imagery will appear.If you have analytical needs that depend on careful measurement of reflectancewithin certain segments of the electromagnetic spectrum, spectral resolution maybe more important to you than spatial resolution.And if your need is for regular,high-frequency monitoring, temporal resolution will be the paramount issue.Selection of the right source or sources of remotely sensed imagery for inclusionin your GIS is principally a trade-off among these three concerns, the amount ofmoney you have to spend, and how quickly you need the product.
The first sensors were the Landsat Multi-Spectral Scanners (1, 2, and 3)launched by the U.S. government in the 1970s.The scanner on these satellites hada spatial resolution, or pixel size, of 80 m and recorded reflected energy in fourbands covering the green, red, and near-infrared portions of the electromagneticspectrum. It repeated its coverage every 18 days.These early Landsat satellites areno longer in operation, but the archived data are still used for change analysis.Thesecond generation of Landsat satellites,Thematic Mapper 4 and 5, carried the ear-lier sensors but also carried sensors that increased both the spatial resolution (to 30m) and spectral resolution (seven bands plus a thermal infrared sensor). Theincreased resolution in both the spatial and spectral dimensions of these satellitessignificantly increased the usefulness of the information for smaller regions.A spa-tial resolution of 30 m is approximately 100 by 100 ft, and at that scale the infor-mation becomes helpful even at urban and suburban scales.The 80-m resolutionof the first generation of Landsat satellites restricted its use to large areas and smallscales.Thematic Mapper 5 was still sending information as of March 2002, but thestatus of satellites changes frequently.
A major advance in the technology occurred in 1986 with the launching of theSPOT satellite. This satellite, principally the operation of a French firm withBelgian and Swedish partners, was the first to collect panchromatic (black andwhite) imagery and did so with a significantly improved cell resolution of 10 m.For more than a decade this was the highest resolution satellite imagery availableto the public for purchase. For the multispectral bands, they opted to use reducethe amount of the spectrum covered and reduce the cell size to 20 m.Additionally,the sensor can be pointed and can capture information off the vertical.This meansthat with repeat visits it is possible to capture the satellite equivalent of stereo pairs,which allows the calculation of a digital elevation model and some developmentof rudimentary contour lines. Accuracy in the vertical dimension is 7 to 11 m,which means it is not useful for large-scale (small area) work beyond 1:50,000.Five generations of this satellite have been launched, and data are still being
163
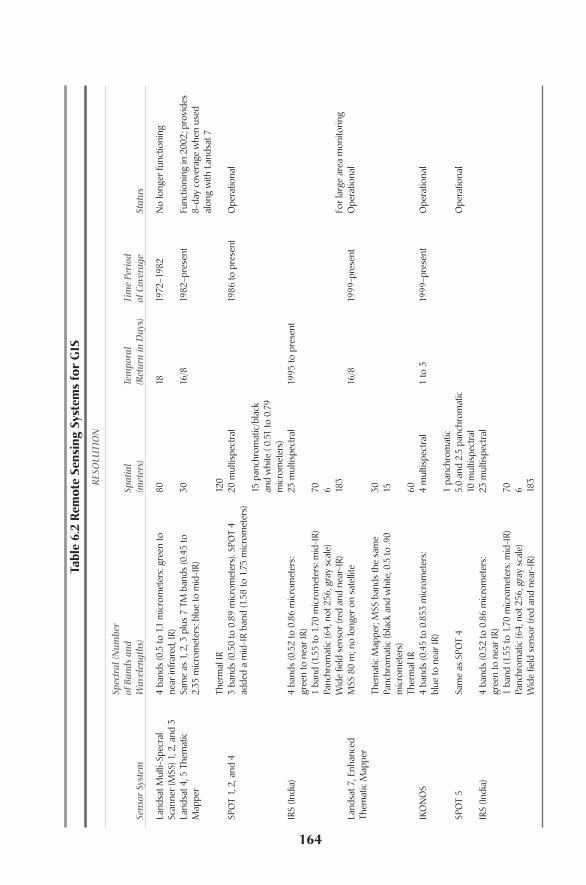
Tabl
e 6.
2 R
emot
e Se
nsin
g Sy
stem
s fo
r G
IS
RES
OLU
TIO
N
Spec
tral
(Num
ber
of B
ands
and
Sp
atia
lTe
mpo
ral
Tim
e Pe
riod
Sens
or S
yste
mW
avel
engt
hs)
(met
ers)
(Ret
urn
in D
ays)
of C
over
age
Stat
us
Land
sat M
ulti-
Spec
ral
4 ba
nds
(0.5
to 1
.1 m
icro
met
ers:
gre
en to
80
1819
72–1
982
No
long
er fu
nctio
ning
Scan
ner (
MSS
) 1, 2
, and
3ne
ar in
frar
ed, I
R)La
ndsa
t 4, 5
The
mat
ic
Sam
e as
1, 2
, 3 p
lus
7 TM
ban
ds (0
.45
to
30
16/8
1982
–pre
sent
Func
tioni
ng in
200
2; p
rovi
des
Map
per
2.35
mic
rom
eter
s: b
lue
to m
id-I
R)8-
day
cove
rage
whe
n us
ed
alon
g w
ith L
ands
at 7
Ther
mal
IR12
0SP
OT
1, 2
, and
43
band
s (0
.50
to 0
.89
mic
rom
eter
s). S
POT
4 20
mul
tispe
ctra
l19
86 to
pre
sent
Ope
ratio
nal
adde
d a
mid
-IR
band
(1.5
8 to
1.7
5 m
icro
met
ers)
15 p
anch
rom
atic
/bla
ck
and
whi
te (
0.51
to 0
.79
mic
rom
eter
s)IR
S (In
dia)
4 ba
nds
(0.5
2 to
0.8
6 m
icro
met
ers:
23
mul
tispe
ctra
l19
95 to
pre
sent
gree
n to
nea
r IR)
1 ba
nd (1
.55
to 1
.70
mic
rom
eter
s: m
id-I
R)70
Panc
hrom
atic
(64,
not
256
, gra
y sc
ale)
6W
ide
field
sen
sor (
red
and
near
-IR)
183
For l
arge
are
a m
onito
ring
Land
sat 7
, Enh
ance
d M
SS 8
0 m
; no
long
er o
n sa
telli
te16
/819
99-p
rese
ntO
pera
tiona
lTh
emat
ic M
appe
rTh
emat
ic M
appe
r; M
SS b
ands
the
sam
e30
Panc
hrom
atic
(bla
ck a
nd w
hite
, 0.5
to .9
0 15
mic
rom
eter
s)Th
erm
al IR
60IK
ON
OS
4 ba
nds
(0.4
5 to
0.8
53 m
icro
met
ers:
4
mul
tispe
ctra
l1
to 3
1999
–pre
sent
Ope
ratio
nal
blue
to n
ear I
R)1
panc
hrom
atic
SPO
T 5
Sam
e as
SPO
T 4
5.0
and
2.5
panc
hrom
atic
Ope
ratio
nal
10 m
ultis
pect
ral
IRS
(Indi
a)4
band
s (0
.52
to 0
.86
mic
rom
eter
s:
23 m
ultis
pect
ral
gree
n to
nea
r IR)
1 ba
nd (1
.55
to 1
.70
mic
rom
eter
s: m
id-I
R)70
Panc
hrom
atic
(64,
not
256
, gra
y sc
ale)
6W
ide
field
sen
sor (
red
and
near
-IR)
183
164
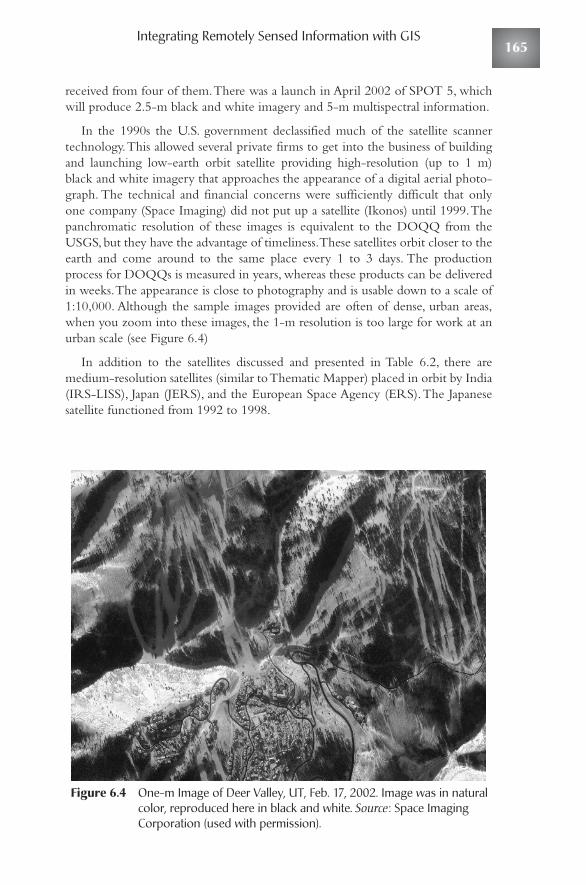
Integrating Remotely Sensed Information with GIS
received from four of them.There was a launch in April 2002 of SPOT 5, whichwill produce 2.5-m black and white imagery and 5-m multispectral information.
In the 1990s the U.S. government declassified much of the satellite scannertechnology.This allowed several private firms to get into the business of buildingand launching low-earth orbit satellite providing high-resolution (up to 1 m)black and white imagery that approaches the appearance of a digital aerial photo-graph. The technical and financial concerns were sufficiently difficult that onlyone company (Space Imaging) did not put up a satellite (Ikonos) until 1999.Thepanchromatic resolution of these images is equivalent to the DOQQ from theUSGS, but they have the advantage of timeliness.These satellites orbit closer to theearth and come around to the same place every 1 to 3 days. The productionprocess for DOQQs is measured in years, whereas these products can be deliveredin weeks.The appearance is close to photography and is usable down to a scale of1:10,000. Although the sample images provided are often of dense, urban areas,when you zoom into these images, the 1-m resolution is too large for work at anurban scale (see Figure 6.4)
In addition to the satellites discussed and presented in Table 6.2, there aremedium-resolution satellites (similar to Thematic Mapper) placed in orbit by India(IRS-LISS), Japan (JERS), and the European Space Agency (ERS).The Japanesesatellite functioned from 1992 to 1998.
Figure 6.4 One-m Image of Deer Valley, UT, Feb. 17, 2002. Image was in naturalcolor, reproduced here in black and white. Source: Space ImagingCorporation (used with permission).
165
Presently this high-resolution imagery is a viable substitute for black and whiteaerial photography at scales down to 1:10,000. If the current trends continue,within 10 years there should be panchromatic imagery available at 1-ft or less res-olution and multispectral/color imagery at 1- to 2-m resolution. Because all theseproducts can be geo-referenced to provide coordinates for the pixels and ortho-rectified to remove terrain-caused distortion, they will be a viable substitute foraerial photography at scales approaching 1:2000 or 1:1000. GIS operations thatrequire higher levels of spatial accuracy, to 1 ft or less, will continue to rely on aer-ial photography gathered using GPS processed with digital photogrammetrictools. But for an increasing number of GIS installations, remotely sensed data are areal alternative and much less expensive than digital aerial photography.
Questions to AskThere are some basic criteria that have to be met before you can successfullyincorporate aerial photography or remotely sensed data as a backdrop:
◆ At a minimum, the data will need to be in the same map projection asyour other GIS data.
◆ If your interest is in small areas, you will need to ortho-rectify theimages to remove effects of terrain and camera tilts; this is a function thatis beyond the capabilities of most, if not all, commercial GISs.
Some summary questions that need answers before planning to incorporateaerial photography or remotely sensed data as backdrop for your GIS are as follows:
◆ What is the smallest feature you need to recognize on the photograph?The smaller this is the smaller a pixel size you will need for your digitalimages.
◆ How current does the information have to be? If you need up-to-dateinformation but only infrequently, your cost considerations are quite different than if you need it frequently.
◆ Is color or black and white imagery the best for the application andregion? Natural color images require more storage space and computerdisplay resources. Black and white imagery often has higher contrast,which makes it easier to distinguish features.
As Analytical LayersThe preceding discussion involved using the remotely sensed images as a visualbackdrop, either in black and white or color, for GIS data. Some GIS operations(e.g., land management and forestry) benefit from use of remotely sensed data toperform analytical tasks such as determining forest or range health.This is wherethe worlds of GIS and remote sensing begin to part ways.Although both are con-sidered part of the geographic information sciences, the issues of image analysis aresufficiently complex that we have chosen not to deal with them in this book.
Remotely Sensed Data as Background Layers and Data Sources166
Questions to Ask
Often what happens in this area of research is that an individual will becometrained in analyzing the satellite imagery visually and will drift into GIS to drapevector information such as roads, political boundaries, and so on, over theprocessed remotely sensed information. Although GIS professionals will pick upenough understanding of aerial photography or remotely sensed information tobring a real-world context to the computer screen to make it look less like a map,remote sensing professionals will acquire enough knowledge of GIS to bring vec-tor information to make the images look more like a map.They will work fromdifferent technologies to the same destination, one putting a background behindthe important data and one draping context on top of that information.The twotechnologies are very complementary, and practitioners of both can benefit fromknowledge of the other’s practice.
ADDITIONAL READING
Gopnik,A. 2000. Street furniture. The New Yorker (Nov. 6): 54–57.
Lillesand,T. M., and R.W. Kiefer. 2000. Remote Sensing and Image Interpretation,Fourth Edition. John Wiley & Sons: New York.
Star, J. L, J. E. Estes, and K. C. McGwuirem eds. 1997. Integration of GeographicInformation Systems and Remote Sensing. Cambridge University Press:Cambridge, UK.
INTERNET RESOURCES
Community Cartography, licensed reseller of NYCmap data:comcarto.com/basemaps.html
How NYCMap was used during the World Trade Center emergency inSeptember, 2001:geoplace.com/gw/2002/0201/0201wtc.asp
Description of the efforts to create and register the undergroundinfrastructure to the NYCMap, accelerated after September 11, 2001:geoplace.com/gr/groundzero/deepinfra.asp
National Oceanographic and Atmospheric Administration “LIDAR Usein a GIS”:csc.noaa.gov/products/nchaz/htm/lidtut.htm
167

Implementation: Data Development and ConversionOnce the assessment and basic design stages of the GIS are complete, the next phase
of an implementation is to develop a detailed implementation plan.That plan isthe point at which you combine the information that was learned from the needsassessment with the knowledge from the design phase and develop a strategy to exe-cute the implementation and achieve success throughout the life cycle of the imple-mentation. There are a number of factors that need to be taken into account thatultimately result in an implementation plan that has all of the following components:
◆ System configuration and product architecture plan◆ Data development and conversion plan◆ Application development plan◆ Staffing and management plan◆ Implementation phasing plan
This chapter discusses the first two sections of this plan.
System Configuration and ProductArchitecture PlanThe system configuration and product architecture plan defines the fundamentalcomponents, or base foundation, that will make the system work.As the name infers,this includes two pieces: the system configuration and the product architecture.Thesystem configuration is primarily composed of the design of the core back end thatwill make the system work. The back end of the system is closely related to the
CHAPTER
7
169
choice of the software solution to be used, but because most of the major softwarevendors have designed their software with an open architecture, they can usuallysupport any back end.Two primary approaches are traditionally taken.The first isto use a file-structured system.This type of a system uses proprietary file formatsto store both the graphic and attribute data. Examples of these types of formatsinclude coverages (ESRI based) and mapinfo file format (MIF).The advantage ofthis type of an approach is that the software manages the data for the user, and alow-level technical knowledge is all that is needed to use, interact, and manage thesystem.The main weaknesses of this approach are that the system lacks securityand can be cumbersome to work with, and in larger systems the data can be diffi-cult for a user to find.This type of an approach only works well with very smallsystems such as for a single user or one to three users. Beyond this size, the secondtype of a system should be used.
The second type of a system is to create a centralized data repository in whichall of the data in the system is stored and managed.Again, two different approachescan be taken to this type of system. For small systems a Microsoft Access back endcan be used that will allow both the spatial and tabular data to be stored in onelocation. Metadata can then be created and attached to each data set to cure theproblem for users of finding the right data set. From a security standpoint, anadvanced user can program security into the front end of the system to restrictusers from having read or write access rights to any individual data set.There aretwo main weaknesses to this approach.The first is the fact that this type of systemcannot manage multiple users editing a single data set. Basically, if two usersattempt to edit the same data set, the last one set that is saved is the one that isstored; the other user’s changes are lost.This is only a problem when the organiza-tion needs to have multiple people editing the same data set. Simple routines canbe written that can restrict a second user from editing the same data set or warnthe user that another user is already editing it.Again, for smaller sites, this type ofsolution isn’t a problem.The second weakness of this approach is that there is alimitation to the amount of data that can be effectively stored in Microsoft Access.The typical size of a file that can be effectively used in this format is a one that hasless than 250,000 features. Once you go beyond this, performance begins todegrade, and unexplained problems start to happen on a more frequent basis.
With recent changes in the primary GIS software, products that use a moresophisticated back end are less of a problem. Most mainstream products supportMicrosoft Access, Microsoft SQL-Server, or Oracle as a back end. Both the lattertwo, more sophisticated back ends, solve the remaining weaknesses of the central-ized data storage approach, but they also add the need for a much more sophisti-cated administrator for the system.
The product architecture component of the plan defines the architecture thatwill be used to disseminate data to the end users.There are two fundamental waysthat this is approached. The first is through a distributed architecture in whicheach client installation has the applications installed on local computers and thedata are stored in the central repository. All users typically access the data in thissingle central location, and maintenance of the data is also done centrally. The
Implementation: Data Development and Conversion170
Data Development and Conversion Plan
second type is client-server architecture.With this approach the applications aretypically also stored and accessed from a central location, and little to no softwareis installed on the client side.The primary benefit of this type of the approach iswith system administration.With a distributed system each time an update is madeto an application, the administrator has to make this change to each client’s station.Much of this can be done through automated software distribution mechanisms,but the purchase, setup, configuration, and implementation of these types of solu-tions can sometimes be costly and require a higher level of expertise.
Because in client-server implementation the applications are stored centrally,the updates and maintenance of the system are much easier and less time consum-ing. A typical example of a client server implementation is the Web-based solu-tions that are becoming so common today. The biggest weakness of theclient-server approach is that there is usually a high level of cost and sophisticationassociated with the setup, configuration, and development of applications that willfunction properly with this method.
The latest developments with this type of approach are Web services.They aredesigned to provide a specific functionality based on sending the server a requestand asking for a result in a formatted manner. For example, Microsoft’s MapPointService is a geo-coding service where you send the service a request, provide thecoordinates of where this address is located, and the service returns the coordinatesof that location in the coordinate system and projection. Many large GIS imple-mentations such as statewide systems, large cities and counties, and federal agenciesare developing systems using Web services approaches.
Data Development and Conversion PlanThe data development and conversion plan details the data sets that will be devel-oped, the sources that will be used to develop them, the methods that will be usedfor automation, the order that the data sets will be developed in, and the qualitycontrol procedures and measures that will be used to check each data set as it iscompleted. Most of the information for this plan has been acquired and docu-mented through the needs assessment process, but at this stage of the implementa-tion, the procedures that will be used must be more thoroughly documented. Foreach of the data sets from the needs assessment, a step-by-step process must bedeveloped that details the operations and methods that must be used to automatethe data set.The concept is to establish a procedure that walks you through a dataset’s creation and establishes the goal for each operation. As an example, we willdiscuss automating a parcel base from scratch using deeds, recorded surveys, andcoordinate geometry to construct the line work.
The first step in this type of automation is to develop a detailed inventory of all of the appropriate source materials for each parcel’s creation.The easiest way to complete this is to start with the best available mapping source, usually theexisting tax maps, and a list of all of the parcels of land in the agency, which canusually be acquired from the assessor’s database. Using the maps and the database,each available source map (subdivision plan, site plan, recorded survey) is reviewed
171
starting at the most recently filed survey.Working backward in time, the parcels onthe map and in the database are coded with a unique identifier representing thesource map plan number. On the tax maps you simply write in the correspondingsource map number, and in the database you create a new field and key in thesource map number. Many times a single plan, such as a subdivision plan, can beused to automate many parcels. Once all of the maps have been inventoried, thenext step is to identify the deeds that will be needed for the automation. Mostassessors also track the current deed volume and page in their database to helpwith this process. Because we have just coded all of the source maps into the data-base, we can now query all of the parcels that do not have a source map. From thiswe can develop a list of all of the deeds that we need to automate for the remain-ing parcels.This list should be sorted in consecutive order so that the deeds can becollected in a sequential order, which is much more efficient than collecting themin a random order.
The next step in the process is to organize all of the source data.There are twoways that this is usually accomplished.The first is if you are going to work fromhard-copy documents.A folder is created for each map sheet that will contain allof the source materials for this sheet. Sorting the parcels by map number creates alist of deeds and plans that is needed to automate each sheet, and a copy of each ofthese documents is placed in the folder.The more modern way to accomplish thisis to use document imaging.With this process, rather than copying, sorting, andfiling the deeds and plans into a folder, the source materials are scanned and putinto a system, and each file is named by its corresponding source maps number orbook and page number.The database and a basic imaging program can them beused for retrieval of the appropriate document when it is needed. In addition,these images will then be available after the automation for easy retrieval by theend users of the system.
Now that all of the source materials are inventoried, a technician can begin theactual automation process. During this step the technician would use a surveypackage to enter the line work using the bearings and distances, angles and dis-tances, or the metes and bound descriptions from the source materials.Workingsystematically, the entire map sheet can be created, and then the technician canmove on to the next adjacent map sheet until all of the parcels have been created.
The next step in the process is to tag each parcel with a unique ID so that theparcel can be linked to the assessor’s database. Usually a unique parcel identifica-tion system such as map-block-lot or plat and lot exists that can be used for thislinking. After the tagging is completed, an important quality-control check isdone.Assessors track the deeded area of a parcel for the purpose of taxation. Fromthe constructed parcel base the area of the automated parcel can be calculated andthen compared to the assessed area.Variations in these two areas can determineparcels that have been automated incorrectly or parcels that have had conveyancesafter the source plans were created.An example of this is when one owner conveysthe eastern 10 ft of their parcel to a neighbor.The two areas would be different,and this would signify that further research would need to be done on a parcel tocompare its deeded area to the area from the parcel automated from a plan source.
Implementation: Data Development and Conversion172
Data Development and Conversion Plan
All of these differences would need to be checked, and if such a conveyance hastaken place, the parcel line would need to be adjusted for the conveyance.
The final step is to place the parcels over the base map that is used for the pro-ject and check to see if any problems such as parcel lines crossing buildings,garages, fences, paved areas, or other evidence of lines of ownership exist. In thesecases the deeds again need to be checked for conveyances that may have takenplace and corrections need to be made. It is important to consider one fact whenthis process is done. Many people who automate parcels assume that if there is afence running between two houses, that must be the property line.This is not thefact.The only time that the fence is definitely the property line is when the fenceis called for in the deed or shown on an accurate survey to be the line. It is actu-ally quite common for people to construct fences or walls 3 to 5 ft off of theirproperty line because they don’t want to intrude on their neighbor’s property, orthey want to be able to run the lawn mower easily on the other side of the fenceto mow their lawn. Hedgerows are another example of this. People also oftenplant hedgerows off of their property line to leave room to trim the hedge with-out having to go onto their neighbor’s property.
The following example details the process that can be used to automate orconvert utility features. Utility features are one of the most complex types of datasets that can be developed in a GIS.The reason for this is that they typically havebeen constructed over a long period of years, have been changed and maintainedthroughout these years, and are composed of features that are visible and those thatare invisible, or under the ground.The biggest challenge with automating theselayers is knowing where to go to find the data about these invisible features.Thekey to determining this is first understanding the sources you have available to youand the desired accuracy and completeness that you want in the data set and thendeveloping an approach that will provide the results you want using what youhave available to you.
With this said, the first and most important aspect of developing a utility layeris to determine the accuracy you want. Utility structures such as catch basins,manholes, and valves can be automated in a number of ways. Using differentmethods of GPS, they can be located to a distance of 3 to 5 ft or as close as thenearest tenth of a foot.The methods that can be used and the resulting accuraciesare discussed later in this chapter. Once the accuracy is determined, an evaluationof source mapping that is available must be performed. In some cases highly accu-rate, as-built drawings may be available that can be used to digitize the featuresfrom. If these as-builts are accurate enough for the desired result, the maps can beused to digitize the features. Another concern that needs to be evaluated for thissources is whether or not they are available for all of the system that is being auto-mated. Often the accuracy of these maps varies based on when they were created,which can result in varying accuracy of the final products.The final issue that mustbe evaluated is whether or not the sources contain all of the information that youwant to have attributed to the features. For pipes the common characteristics thatare desired are the size and material type, the age, and the condition of the pipe.The first three of these are often on the as-built, but the condition can often only
173
be determined by a physical field visitation. For the structures the important char-acteristics are the material type and style of the structure, whether or not thestructure has a sump, and the grate or cover type.The types can usually be deter-mined from the sources, but again, often a field visitation is required to collect theother characteristics.
For the best resulting quality of data the best way to approach the project is touse a combination of the best sources and physical field collection. With thisapproach the first step is to use the source documents to create an inventory of allof the structures. Each source is first inventoried as to what area it covers, and thefeatures on the source are then digitized to their approximate locations. Oncethese locations are created, electronic files can be created and uploaded to a surveydata collector for GPS in the field.The approximate locations will provide the sur-vey crews with an approximate location that helps them find the structure in thefield, but they then locate the feature using either GPS or conventional surveytechniques.As they collect the point, they code each survey location with the typeof feature and any physical characteristic that can be seen from observing a struc-ture. Figure 7.1 is an example of a page from a utility guidebook that can be pre-pared to help make sure that the crew codes each feature properly.This guidebookshould be put together prior to sending the field crews out to assure proper cod-ing, and a different figure for each type of feature should be created.
Once the feature has been located and the survey data have been reduced, thenext step in the process is to collect the attributes of the features that cannot beseen, the below-ground attributes.Typically each structure is again visited, but thistime the grate or cover is removed, and data are collected for the feature below thesurface or in the structure. Measure downs are taken, where the crew measures andrecords the distance from where the survey point was taken to the invert of thepipe.The size and material type of each pipe is also determined and recorded, aswell as the apparent condition. During this collection the crew can also collect dataabout the structure such as what is it made of, if there is a sump, its condition, andif the structure is full of debris or silt.Another important value that should be col-lected is a confidence factor with the data collected. Many times when collectingthe details of a system like this, a crew will encounter a condition where it is diffi-cult to ascertain exactly what the size of a pipe is, or there may be a significantamount of debris that makes it impossible to get a good measurement to the invertof the pipe. In these cases the data collected can be coded with a low confidencefactor so that a user back in the office would know the data might be questionable.
Returning to the office, the data collected can now be reduced and attributed tothe features to create a complete inventory.The only step left is to perform qualitychecks on the data to try to isolate any errors that may have been made in the col-lection process. GIS functions can be used to calculate whether pipes have negativeslope, which may indicate that a bad measurement has been taken. Using the con-nectivity of the system, an analysis can be run that determines whether a pipe runstarts at one size, say 24 inches, then changes to a smaller size, such as 18 inches, andthen goes back to 24 inches.This could be an indication that the wrong size, 18inches, was collected for that pipe because pipes rarely get smaller in a system.
Implementation: Data Development and Conversion174
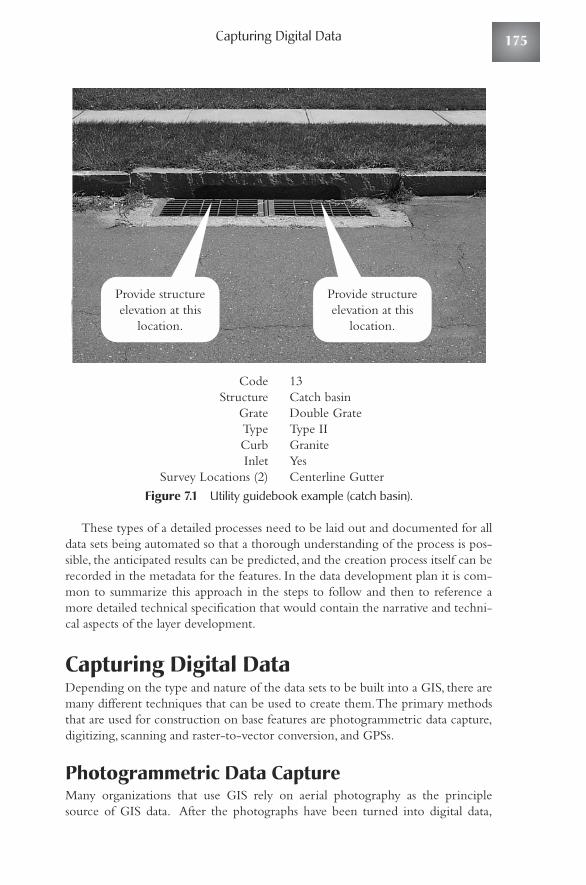
Capturing Digital Data
Figure 7.1 Utility guidebook example (catch basin).
These types of a detailed processes need to be laid out and documented for alldata sets being automated so that a thorough understanding of the process is pos-sible, the anticipated results can be predicted, and the creation process itself can berecorded in the metadata for the features. In the data development plan it is com-mon to summarize this approach in the steps to follow and then to reference amore detailed technical specification that would contain the narrative and techni-cal aspects of the layer development.
Capturing Digital DataDepending on the type and nature of the data sets to be built into a GIS, there aremany different techniques that can be used to create them.The primary methodsthat are used for construction on base features are photogrammetric data capture,digitizing, scanning and raster-to-vector conversion, and GPSs.
Photogrammetric Data CaptureMany organizations that use GIS rely on aerial photography as the principlesource of GIS data. After the photographs have been turned into digital data,
CodeStructure
GrateTypeCurbInlet
Survey Locations (2)
13Catch basinDouble GrateType IIGraniteYesCenterline Gutter
Provide structureelevation at this
location.
Provide structureelevation at this
location.
175
orthorectified, and placed in a map projection and coordinate system visible infor-mation on the images can be captured using specialized photogrammetric tech-niques. The capture of this visible information, called planimetric data, is donethrough specialized line-following software. This software allows technicians toplace a cursor at the beginning of a feature, say the outline of a building, and thesoftware will trace the remaining outline of the building. Through this processyou can create a GIS record for any feature visible and distinguishable from otherfeatures on the photograph. This process requires specialized software and hard-ware and is usually done by the firm that does the aerial photography.
DigitizingDigitizing is the next most common method used for data development projects.It is the process by which the operator converts a document that is in an analogform into digital form by tracing the features depicted on the analog form intothe system using a combination of hardware, software, and operator assistance.There are three primary types of digitizing that are used today: head-down digi-tizing, heads-up digitizing, and automated raster-vector conversion.
Head-Down DigitizingIn head-down digitizing the operator attaches the source document to a digitizingtablet or table, registers the document to the base map using features shown onboth the source document and in the land base, and then traces the features intothe system.This technique was very common 5 to 10 years ago and was one of themost common ways to automate analog data into a system. The adjectives fre-quently attached to this data development process are tedious and time consum-ing, so it is not surprising that its use is decreasing.There are a number of factorsthat have led to this reduction.The first factor is the cost of the digitizing tables ortablets.A good-quality, large-format digitizing table costs $7,000 to $8,000 and isa very high maintenance piece of equipment.They often break down or developdead spots that render them inoperable.
The second is improvements in computer hardware and reduction in costs forimaging software needed for other forms of data development. Five years ago theaverage price for a feature-rich imaging package was $10,000 to $15,000 for thesoftware, and another $10,000 to $15,000 for the computer hardware to run thissoftware.There were very sophisticated software products to learn and use prop-erly and required computer experts that came at a fairly high rate of pay. Overtime, the cost of both the software and hardware products have come done, thusdecreasing the entrance cost to use the product, increasing the user base, anddeveloping a broader user base.
Software procedures for heads-down digitizing are part of all GIS softwarepackages, but many users will develop procedures using CAD software, which iseasily brought into all GIS databases.The advantages to this approach to heads-down digitizing are the widespread availability of the software and the very largenumber of technicians trained in its use.Creating GIS layers of simple points, lines,
Implementation: Data Development and Conversion176
Optical Character Recognition
and polygons is usually a much simpler process than creating the complex three-dimensional drawings CAD operators are used to.You must take care to ensurethat the digitizing tablets are registered to the coordinate system you have selectedfor your database because the default is to return data based on the inches or cen-timeters of the tablet.
Heads-Up DigitizingMore improvements have come in heads-up digitizing, and this is what is com-monly used. It is the process by which the source document is scanned into anelectronic format, the scanned image is then registered to the base map, and theoperator looks up at the screen and traces the features into the system rather thandown at the digitizing table.The lack of the constant need to look down at thetable, then up at the screen, and back again has huge efficiency gains and also elim-inates the need for and problems with the digitizing tables.
Raster-to-Vector ConversionThe last method that is becoming very common is raster-to-vector conversion. Inthis process the source maps are scanned and geo-referenced to the base map, andthen automated routines are used to trace out the features from the source map.The software used by the operator can perform two types of tracing.The first issemiautomated, where the operator selects a starting point, and the software thensolves for the mathematical center of the object being traced and follows it until itcomes to a conflict.The software then moves the operator to the conflict location,and the operator then chooses what direction to go in or what to do to resolve theconflict.The second method is fully automated conversion, where a set of para-meters is configured and then the entire source map is automated all at once.Theoperator then performs cleanup using heads-up techniques to correct any issueswith the automation.This method is also used to perform batch processing andautomating many source maps that have the same properties. It is also becomingmore common and is often used to automate source maps that are very consistent,such as parcel or topographic maps.This process is similar to the capture of plani-metric data from digital orthophotos discussed above.
With all three techniques of analog (map) to digital (vector) conversion, thereare issues of combining maps together. Often the area of interest is covered by a setof maps, and lines from a single feature will extend from one map to another.When you place the maps together you will often find gaps where the lines do notconnect as they should.These gaps will be present in the digital versions as well, soyou must specify standards and processes for matching up the edges of maps andhow you will handle these inevitable discrepancies in the source data.
Optical Character Recognition In addition to vector data, optical character recognition (OCR) conversion isbeing used to automate text into a system. Using OCR an operator can veryquickly automate large amounts of text from a source map.The more advanced
177
OCR software packages allow the operator to distinguish size and style of text onthe source map and selectively automate them or automate them onto differentlayers or into different database fields based on their properties.
In-House or Out-Source DataDevelopment of ConversionAs already stated, data development or conversion for a project can be one of, ifnot the most, labor intensive and costly components of GIS development andimplementation. Photogrammetric mapping projects require a great deal of highlyspecialized equipment and expertise including airplanes, expensive cameras(approximately one-half a million dollars), survey equipment, and analytical stereoplotters or softcopy workstations. It is cost prohibitive for agencies implementinga GIS to ever consider performing this type of development in-house, although afew attempts at this have been seen (none of which have been successful). Insteadthe implementer should consider being an active participant in the process.
The primary role for the average implementer to be involved is in the quality-control aspect of the project.This process really starts at the onset of the projectwith the development of a detailed specification for the base-mapping project.Most agencies look to specialized consultants who can assist the average imple-menter with development of this specification to assure that they will get theproper deliverables on a project such as this.Another option is to look to agenciessimilar to yours that have recently completed a project similar in nature.Their spec-ification can often be reused, but it is important to find a project that is completed.The people who were involved in the project can be questioned about problemsthat may have come up during the project, and you can then see what changes canbe made to the specification to eliminate the problem in your own project.
Selecting a VendorThe next important aspect is to select a firm that specializes in this type of work,has a proven track record, is financially sound, and has adequate, experiencedstaffing to deliver the project on schedule. Experience with this type of projectshould never be held second to a lower cost that may be offered by a firm that hasan unknown track record. If it sounds to good to be true, it is, and it is likely thatthe lower-priced firm just doesn’t know what they are getting themselves in to. Ifthey are reputable, they will at least deliver what they have promised, but it hasbeen our experience that what you may save in initial cost, you will probably payfor in project delays. Don’t forget that these types of projects are based on a flightand photography that is literally a snapshot in time, and the longer it takes to getthe data, the older, and more out of date it will be.You may save money up front,but now you have to worry about updating your data.
Less-complicated development or conversion projects should be carefullythought about in the same way. In general, when projects are done in-house, theytake longer to complete because of limited resources and time. The longer one
Implementation: Data Development and Conversion178
Selecting a Vendor
waits for data for the system, the less useful it is. On the other hand, the initial costto develop or convert data is typically higher when out-sourced then when keptin-house.This is true unless of course specialty equipment is needed or could beused to complete the automation process in a more efficient manner.
Another important factor to consider in deciding whether to complete thework in-house or to out-source is experience. If you have never converted thedata you are about to convert, you have no experience, and it is quite likely thatyou will make some mistakes the first time.This will probably require you to backtrack and redo some, if not all, of the work.Another way to avoid this is to hire aconsultant to help you develop the processes and procedures for completing thework, but don’t actually have them complete the work. Most of the cost and effortof the project is the labor to actually complete the work, not the effort to plan it.The consultants can also provide you with labor estimates of the time it will taketo complete the work using these methods, so you can make sure you have ade-quate resources to meet the time frames you desire for completion.
Costs are almost always one of the biggest concerns of developing a GIS. Muchof the discussion thus far has been centered on doing it right the first time, whichalways leads to lower overall costs, but there are other ways to control cost as well.One is choosing and using the right labor source. Many local universities are nowdeveloping or have developed GIS programs, and many of them, especially thegood ones, have developed internship programs for their students.This labor forcecan be one of the most cost-effective ways to develop GIS data sets, and using stu-dents also gives them valuable experience. Remember that these students are usu-ally very inexperienced and that they need constant supervision to make sure theycomplete the work the right way and must have help resolving difficult issues theyencounter and haven’t seen before.The search for low-cost labor in GIS data con-version has led many companies to overseas locations, principally in South andSoutheast Asia, where costs are lower, and there are even instances where correc-tions facilities are providing low-cost digitizing and scanning conversion services.
Another important factor in developing and converting data for a GIS is tomake sure you do not convert too much information and that you choose thecorrect data format for the conversion. For example, let’s say you are a water util-ity and you have 100,000 customers. For each customer you have a 3- by 5-inchservice connection card that provides information about where the valve is to shutoff or turn on the water service at the customer’s location. On these cards youhave all sorts of important information that tells you the type and size of the valve,the size of the main and the service, how the service connects to the building orbuildings, the type of pipe is used, when it was installed, and so on.The cards arestored by the customer’s account number in a series of file cabinets.
The typical problem that a person would be looking to solve with a GIS is tobe able to respond to a service call such as: There is water coming out of theground in my front yard. Can you come and fix it? What would commonly hap-pen is that the utility staff person would look up the customer’s account number,go to the file cabinet, find the index card, and then head to the location to fix theproblem. GIS can solve this problem in two ways.
179
One way is to automate all of the 100,000 cards into the system and build adetailed network that shows where each of the service connections are. During theconversion process all of the data would be transferred from the cards into the digi-tal model.Then the operator could put in an address, customer’s name, or accountnumber, and the system could bring you to that location and then provide you witha detailed map and/or report of all of the information contained on the index cards.This is a very useful tool, but it also very expensive to implement and maintain.
The second way would be to scan each of the index cards. Name the file withthe same name as the account number, and then tag the appropriate geographicfeature (valve, building, parcel of land) with the account number so that a link canbe built, and the scanned version of the card can be easily retrieved.The applica-tion would then bring up the electronic version of the card in the same amount oftime as it brings up the map and the report, but the total cost to implement wouldbe only 10 to 20 percent of the other, more detailed method.
The main concern that one should have in deciding which type of approach touse is to understand the problem that needs to be solved and know what informa-tion is necessary to solve the problem and the most efficient way to make theinformation available to the end user. In the oreceding example this specific prob-lem is solved by both approaches, but many other things can be done with the firstapproach that cannot be done with the second. For example, if you wanted toknow how many valves of a certain type were located in your service area, youcouldn’t determine this with the second method without looking at each scannedindex card.
Perform a Pilot ProjectOne of the most important aspects of performing a data development or data con-version project is to always perform a pilot project to test the methods, procedures,processes, and final deliverables of any automation project.The exact methods tobe used should be followed for a subset of the data or a small representative area tomake sure that the procedures will result in the desired level or accuracy, precision,and completeness. The pilot will also uncover issues that may not have beenthought about prior to automation, and they can be addressed early on in theprocess and reduce the amount of time spent redoing work.
Once the pilot implementation project is complete, the procedures tested, andquality control done on the features, you are ready to go into full-scale data con-version whether in-house or with a vendor.All the steps described in this chapterare important for a successful conversion and should also be noted in some way inthe metadata. GIS databases, particularly in large organizations, have a long life andusually outlive the careers of the people who created them. So careful documen-tation of the production process allows new users to understand and evaluate theinformation.The rule of thumb is that up to 80 percent of the cost of a GIS is thedevelopment of the data in the system, so careful implementation planning, docu-mentation, and processing are much more important than almost any other step ofthe process.
Implementation: Data Development and Conversion180
Perform a Pilot Project
ADDITIONAL READING
Drecker, D. 2001. GIS Data Sources. John Wiley & Sons: New York.
Montgomery, G., and H. C. Schuch. 1993. Data Conversion Handbook. GIS WorldBooks: Fort Collins, Co.
INTERNET RESOURCES
National Center for Geographic Information and Analysis. 1998. TheNCGIS GIS Core Curriculum for Technical Projects. Unit 12. Planning a Digitizing Project: ncgia.ucsb.edu/cctp/units/unit12/12_f.html
Unit 13. Digitizing Maps:ncgia.ucsb.edu/cctp/units/unit13/13_f.html
Unit 16. Planning a Scanning Project:ncgia.ucsb.edu/cctp/units/unit16/16_f.html
Unit 17. Scanning Maps:ncgia.ucsb.edu/cctp/units/unit17/17_f.html
Digitizing tools:giscafe.com/Download/Digitizing_Tools/
Methods for creating spatial data:gislounge.com/features/aa092700.shtml
181


Implementation:Selecting Hardware and SoftwareSoftware should be selected based on the functionality it offers and the applications
that have been identified from the needs assessment process.Your hardware selec-tion will be based on the software you select, and the operating system will be basedon the product’s requirements and the standards that have been developed by youragency.
Software ConsiderationsThere are many different software products on the market today produced by variousvendors large and small. Selecting a software solution is somewhat dependent on theoperating system and hardware platform you will be using, but in most cases theproducts that are available have standardized on the Windows platforms and require a32-bit operating system. Initially you should evaluate the software solution indepen-dent of the hardware.
The nature of hardware and software technology is that it changes, typically at avery rapid rate. In recent years this has been particularly true. New advances in tech-nology, new software development environments, and drastic changes in approach bymany of the software vendors have lead to an increased amount of confusion andconcerns by the intended users. Existing users that have been using a certain productline for a long time have been hesitant at moving to new versions, and new users havebeen unsure of what to select because of the hesitations by existing users.This is actu-ally very common historically with software. Some users who jump in with both feetand try the newest version as soon as it is available are considered early adopters.Theynot only use products when they are brand new, but they often use products during
CHAPTER
8
183

alpha and beta testing periods.Alpha testing is the period in which software ven-dors are trying to decide which new functionality will be included in the nextversion of their product. They typically solicit feedback from existing usersthrough user’s conferences, focus groups, and mass mailings and try to decide whatthe masses are looking for.They also typically purchase copies of competing prod-ucts and review these products for features that are not currently included in theirown products. From this list of potential features and functionality the softwarevendors develop a product enhancement plan that details what they will beincluding.They then involve a limited set of alpha testers in the program. In thisprogram the vendor typically begins designing and developing the new productenhancements for two reasons; the first is to determine what the total effort willbe to add the feature or function to the product, and the second is to make surethat it understands what the users are looking for.Through this period the finaldecisions are made about what will actually be included in the product.
Beta testing is the name for the time period that a product goes through justprior to release. During this time there are often a large number of bugs with theproduct, and early in this stage it is unstable. The functionality that will beincluded that was ironed out during the alpha testing period is now locked in, andthe features and functionality are in full development.Those who are involved inthis period are typically the more sophisticated users who like to play with newsoftware.They are asked to test each of the new functions and report on any of theproblems or bugs that are encountered.The beta testing period itself usually goesthrough a series of stages that are usually numbered sequentially (i.e., beta 1, beta2, and so on). As each sequential release of a beta product comes out, it usuallybecomes more stable and usable. Products that are in beta should never be used asthe primary solution for any system; they should always be used in a separate test-ing environment. It is not uncommon that data that are used with a beta productcan be corrupted by the software and could be rendered completely useless oncecorrupted. Be cautious about being in an alpha or beta program.Your involvementin the program can have a tremendous amount of influence on what comes out in anew product’s release, but this involvement can be very time consuming and trying.Even some of the earliest of adopters have gotten frustrated with these programs.
The other type of user is typically referred to as a late adopter.This type of auser is more of a skeptic, a person who waits for others to work out the problemsand then changes to the new technology when it isn’t new any more, when it isproven.This is one of the first decisions you need to make about choosing a soft-ware product: Are you an early or late adopter? If you are a late adopter, don’tchoose a product when it has just been released; wait for the second or thirdrelease before you use it. Software releases are typically signified by a series ofnumbers.The standard for many years has been that when a product is first intro-duced, it is referred to as version 1.0.As bugs are worked out of it, and new releasesor patches are introduced, the number to the right of the decimal place is indexed.In other words the next version would be 1.1, then 1.2, and so on. If you are a late
Implementation: Selecting Hardware and Software184
Software Considerations
adopter, you should probably wait until version 1.1 or 1.2 before you even attemptto upgrade to or use a product.
When a major release of a product is developed, the version number to the leftof the decimal is indexed. So the second major version would be version 2.0.Unfortunately, sales and marketing folks have caught on to the fact that users oftenwill not be as receptive to new products and will not purchase them until they aremore mature.As a result they have started releasing initial releases of products thathave higher version numbers than version 1.0. Be leery of this approach andalways make sure you ask the vendor how many versions and releases of this prod-uct there have been. Another change that was first introduced by Microsoft wasnot to give a product a version number, but to name it based on the year it isreleased.The first time Microsoft did this was with the Windows 95 operating sys-tem.The one benefit of this was that it gave the end user an idea of how long theproduct has been around. Some GIS software vendors did this as well. For exam-ple,AutoDesk introduced AutoCAD MAP 2000.
The final practice that is worth pointing out is that products can often jump anumber of releases. ESRI recently did this with their ArcView product line.ArcView was initial released at version 1, went to 2 and 3, and had a series ofinterim releases 3.1, 3.2, and 3.3.The new version of the product that was releasedwas such a change that they released it as version 8.The theory behind this is thatif you add up the total number of releases, full and interim, they would add up toeight versions. Realistically this is just a marketing ploy that makes a user feel likethe product has been around longer.Other GIS vendors are are also using this typeof a process.AutoDesk, which is known more widely as a CADD software vendor,but also plays fairly heavily in the GIS arena, was one of the first to do this.Theystarted with a series of version in the 1s, then some in the 2s, 2.5, 2.6, and 2.7, andthen jumped to version 9 of the software.
The important thing to recognize or question is whether or not the latest ver-sion is really a complete new product or a refinement of the previous version. Hasit been reprogrammed from scratch, using a new development environment andnew standards, and does it have a completely new look and feel? If it does, it willprobably be much less stable for a longer period of time, but ultimately it will mostlikely be a good thing for the product and the users. These type of redesigningefforts take a tremendous investment by the software vendor, and they are ulti-mately a great advancement, but the early adopters of the product will have to dealwith all of the typical issues of a new release. Once the products reach a laterrelease, late adopters will be able to use the product without many concerns andtake advantage of the investment of the software vendor.
One of the most important decisions that should be made is to select a productthat has been proven in the marketplace and continues to have a clear developmentpath.Avoid technology that is outdated or is on the bleeding edge and has not beenproven, and be careful of marketing gimmicks versus actual facts about the product.
185
Evaluating SoftwareThere are two primary factors that need to be evaluated when selecting a softwaresolution: functionality and performance. Standards are also important. During theneeds assessment process specific applications and the functionality required forthose applications have been identified. During the software selection stage iswhen you take the information from this process and apply it to your selection.
FunctionalityFunctionality can simply be defined as the ability of the software product to dothe things you need it to do in a straightforward manner. The first factor thatshould be considered is the graphical user interface (GUI). If those who are goingto be using the product are generally novices with computer technology, it is crit-ical that the product have a straightforward, easy to learn GUI. If they are moreexperienced users, the ease of the interface isn’t necessarily as important as thefunctions that are available to the user. Most hard-core GIS users who have beenaround for a while do not really care about the GUI. Most of them grew up withthe products before a GUI was even introduced. For these users the most impor-tant feature of the products was the command line.
Both ESRI and AutoDesk products were initially very command line driven.Typing in a series of commands on the command line performed all of the fea-tures and functions that could be performed by the product. One of the com-mands allowed the user to display the data or the results of the analysis on thescreen in a graphic format. The next advancement that came was scripting lan-guages. In the case of ESRI’s ArcInfo product, the scripting language was AML.
For AutoDesk it is of LISP (List Processing) called AutoLISP. Basically thesescripting languages allowed the users to store a series of commands that would beused over and over again, and rather than typing the commands over each time,they could call these scripts when needed.
This all changed with the creation of the Windows environment and the addi-tion of the GUI.Most new users now choose the command they want from a but-ton or pull-down menu and don’t use the command line.The older users still usethe command line to execute many functions, but they often use the GUI when itsuits them.With the latest releases of some of the products the command line hasbeen removed in its entirety. This has no impact on newer users, but as usersbecome more experienced, this is likely to be a detriment to their performance.
Another factor that needs to be considered is the ability of the product to becustomized using industry standard programming languages. Some products havelittle to no ability to be customized.They are designed to perform a specific func-tion and perform it well, but that is all. If this is what the end user needs, just thisfunctionality, this is not necessarily a limiting factor.The key is to understand itslimitation before you implement it and make sure it does everything you need.The second level of products are those that can be customized using some type ofan internal programming or scripting language.These products are one step above
Implementation: Selecting Hardware and Software186
Evaluating Software
those that can’t be customized.Typically these products have a customization lan-guage that has been developed by the software vendor. It is good that they can becustomized, but the problem is that the only people who have experience andknow the language are the actual users of the product; this includes the vendoritself and some consulting companies. If the product has a broad user base, this maynot be that much of a limiting factor, but if it does not, it can be significant.Theuse of a standard programming language can open the doors to many potentialdevelopers for customization of a product.
The final level of customization is those products that can be customized usingan industry standard programming language such as Visual Basic.When a productis designed in this manner, it provides for a much broader base of people who areknowledgeable about the environment and can customize it.The only issue is thatindustry standards change very rapidly, and it can be difficult to determine what isa standard and how long it will last.At the time of writing this book, the standardthat is typically used for development of new application is COM technology.Thiswill probably be around for a while, and the Visual Basic programming languageseems to be the most common standard for customization. If you are looking for-ward, it is a pretty safe bet that staying on top of what Microsoft is doing will be agood choice.With this in mind it appears the their .NET technology is going tobe the next wave. Many product vendors are already moving toward .NET tech-nology and Web services solutions.
In summary, if the agency needs to develop specific customized applications,the software should have and use a programming language that allows the softwareto be modified or customized. If you are not going to customize your system,make sure you choose a solution that provides you with all of the functionalityyou need out of the box.
During the needs assessment process, the implementation strategy documentthat was developed included tables and matrices that defined what functionality isneeded for the system. During the software selection process, the next step is tocompare each product you are considering and determine whether the featuresand functions that are required are available in it.When you perform this analysis,you don’t just want to see if the feature or functions are there; you also need torate the software based on how easy it is to use.This can be done in two ways.Thefirst is by having the vendor come in and demonstrate the product, performing thespecific tasks you are looking for. The second way is to visit people who arealready using this product and have them demonstrate it and provide you withtheir impression of its ease of use and its limitations.The second method is rec-ommended, but it is also worth talking to the software vendor after you meet withusers to discuss the concerns that have been raised. Often end users may knowhow to do something one way, but there is actually an easier way, and sometimesthey may not think the product does it at all, but it actually does. The softwarevendor should be able to address all of these questions and concerns in their pre-sentation, but don’t get oversold by the sales pitch. No product does everythingand many times one product does something very well, but does other things verypoorly.
187
The primary difference among products today is with the way they handleraster and vector data. Most products have been designed to support either araster- or a vector-based solution and only provide functionality for the othermodel as a secondary capability. ESRI products, ArcGIS, ArcInfo, and ArcView,were primarily designed to support vector data models, although they have somesupport of raster-based products within their core. In addition they can beextended through additional purchases of product extensions that provide excel-lent raster support and functionality. Similarly, AutoDesk products also primarilysupport vector-based models, but they can also be extended with the addition of anumber of third-party add-ons to provide more robust raster support. Idrisi andERDAS provide excellent functionality in the raster-based world, but they onlyprovide a subset of the functionality of other products in the vector world.
StandardsAs already stated, standards are an important aspect to selecting a software solution.The development and customization environments are two examples of wherestandards should be adhered to. Another standard that is important is whether ornot the product complies with Windows standards. Microsoft has a series of stan-dards that relate to a product’s look and feel as it compares to a published set ofWindow’s compliance standards. This is important because when a product isdeveloped following these standards, certain functions are in the same place, andusers who have already used another Windows-compliant product can learn itmuch quicker. For example, all products that meet this compliance standard have aFile pull-down menu followed by an Edit pull-down menu starting from the leftside of the screen. A user who has used any desktop software such as MicrosoftWord or Excel knows where to find the standard functions such as Save As orUndo on these menus. If they were moved to, say, the third pull-down menu, theuser would have to search for them, and the product would take longer to learn.There are many other aspects to the design of a product that make it compliant ornot, but these are beyond the scope of this book.The important thing to remem-ber is that compliance with mainstream standards can be crucial to a product’sacceptance and adoption. If further information about this standard is required,just go to Microsoft’s Web site.
Another important factor with respect to a software product and standards isthe data format that can be used by the product.This not only includes the nativefile format of the software but also the different formats that the product canimport and export data from and to.There are a number of standards and standardformats that are out there and supported, but the best ones are those that aredeveloped by neutral trade organizations or by federal agencies. The two mostprominent standards today are Open GIS Standards (OGS) and Spatial DataTransfer Standard (SDTS). OGS is an organization that is developing standards fordevelopers to use as they design and engineer software. It is made up of represen-tatives from all of the major software vendors. SDTS is a standard that has beencreated by the USGS for developing, documenting, and transferring data from oneplatform to another.Any product you are considering should be compliant with at
Implementation: Selecting Hardware and Software188
Evaluating Software
least one of these two standards, and the software vendor should be an active par-ticipant in these groups.
PerformanceThe performance of any software product is dependent on two primary factors:the speed of the hardware it is running on and the way the product has beendesigned or engineered. If the product has been engineered well, it will bedesigned to take into account all of the resource available on the hardware onwhich it is running. If it has been engineered well, the next factor is what is actu-ally available to it in the form or system resources (CPU speed, memory, diskspace, etc.). GIS software is very complex and demands a large amount of systemresources.The more complex the software and the functions it performs, the moreresources it will need.
Performance of the overall GIS system will be significantly affected if you do notprovide the appropriate level computer. Because computer technology is constantlychanging, and software versions are also constantly changing, the best way to stay ontop of these needs is to visit a software vendor’s Web site and find the vendor’s mostcurrent specifications to see what is needed.Also, if you are purchasing a new system,try not to go with the minimum specifications; these usually provide borderline per-formance. It is best to go with the recommended or preferred specification. Alsomake sure you look at the date when these specifications were last updated. If theyare over 3 months old, call the software vendor and ask for a more current version.You can also get additional input from a consulting company or other users to findout what their experience has been.These recommendations will give you a moreaccurate idea of the type of configuration you will need and want.
Expandability of ProductsThe one factor that is a given with software is that it will change.The other factorthat is also a given is that from the time you start with your implementation to thetime you become and experienced user, your needs will also change.Another crit-ical aspect to your selection of a software solution is its ability to expand with you.Expansion can be defined in a number of ways. Does the product have function-ality that you will not use initially, but as your needs grow and your systembecomes more mature, you will need then? Does the software have the ability toshare data with other applications? As the system grows, does the software have theability to communicate with other products through an application interface(API) or through other programming languages? In virtually all implementationsone single product will not meet the needs of all the end users.This will mean thatthere will be multiple products in use that will need to share data and to commu-nicate with each other.
Licensing OptionsGIS software is not purchased; it is licensed.There is normally a one-time licensefee with an on-going maintenance fee that provides you with the most current
189
versions of the software as they are released.There are two primary types of licens-ing agreements that you have to choose from.The first is a per-CPU license.Withthis type of agreement an individual license fee is paid for each of the computersthat the software will be installed on, and the license is tied to that computer.Thesecond type of a license is what is called a concurrent, or floating, license. In thistype of licensing a counter is typically installed on the server that tracks the num-ber of simultaneous users using a specific product. Each time a user starts theapplication, a license is checked out until the maximum number of user licensesthat have been purchased is checked. At this point the next user is told that alllicenses are in use and will not be allowed to get in.This type of licensing is quitecommon and is usually the preferred method because fewer licenses can be pur-chased by the agency to serve more people.
Licensing is also becoming more complex. Because many products are nowbeing developed using standards such as COM, the components that make up asoftware product can also be licensed.This can be very complex to both track andadminister, but it can also have some tremendous benefits, primarily associatedwith the licensing costs. For example, ESRI’s newest licensing mechanisms sup-port floating, or concurrent, licenses; standalone, or CPU, licenses; and componentlicensing. Because their latest release of its products, the ArcGIS product lines, aredeveloped and made out of all of the same components, it is possible to share thecomponents of ArcView,ArcEditor, and ArcInfo. User can switch the product theyare using to perform a task, and by design they can choose the lowest-level prod-uct that they need to perform the task.The problem with this is that it is a manualprocess. If a user is logged in using an ArcInfo license, but only needs functionalityof ArcView, an ArcInfo license will be checked out unless the user manuallyswitches to ArcView.A better model would be for ESRI to design the product toautomatically check out the license based on the function being performed andthe object being used rather than the software product chosen by the user.Thistype of licensing will be coming in future releases of many of the common prod-ucts in use today.
How to Select Your SoftwareEvaluation TeamThe first step in selecting software for an agency is to form an evaluation team thatis made up of the ultimate end users of the system.This team should be made upof interested staff from departments involved in implementing GIS within theagency.These individuals need to be objective and not have predefined ideas ofwhat system they want.
Prepare a SpecificationThe next step in the process is to prepare a detailed specification for the software.This should include all of the items discussed above, including the functionalitythat is required, the data that the software will need to be able to read, the
Implementation: Selecting Hardware and Software190
How to Select Your Software
preferred licensing scheme, the number of licenses that will be needed, and theinstallation and training services that you want to get the software installed andoperational. Talk to agencies in your area that have already gone through thisprocess and see if you can get a sample of the specification they used. Be careful tomake sure that they are similar enough to your size so that the specification will fitwell. Use these specifications as a template to work form, and customize all aspectsof it to suit your needs. Once you have a draft of the revised specification devel-oped, have an objective third party look at it.This can be another agency similar insize to yours (maybe one of the ones who gave a copy of theirs as a template touse) or a consultant helping you with the process.
The best way to get started with this process is to either contact other agencieswho have recently developed similar specifications or hire a consultant who spe-cializes in this type of work. Use the sample specifications as guides and ask thepeople who provided them what worked and what didn’t work with the specifi-cations.Adjust your specification accordingly and adjust the scope of what you areasking for to meet your needs. If you decide to work with a consultant, make surethe consultant has no vested interest in developing the specification. Precludethem from actually proposing on the software solution to assure their neutrality inthe selection process.
Prepare a Formal Request There are a number of different approaches to selecting the final solution you willacquire.A request for bid is a process by which you prepare a very detailed speci-fication of what you want and request prices from potential providers.You thenselect the bidder who provides the lowest cost for the requested products. Thisprocess only works well if you are requesting very specific items such as threecopies of a certain software product. Be very careful of exclusions or qualificationsin a proposal. Profit margins on software solutions typically run 15 to 25 percent,and if someone’s proposal varies more than 5 to 10 percent of all of the other bids,that vendor probably has forgotten something, and you may be heading for prob-lems. If it looks too good to be true, it probably is.
The next type of process that can be used is a RFP. During this process a less-detailed request is put out that asks for a proposed approach, qualifications, fees, anda schedule to provide you with what you are looking for. These are typicallyreviewed based on a weighting system where points are given to the proposersbased on all of the categories, and the highest score gets the contract.This process isbest used when to scope of the service is still fairly specific, and you want to weedout firms that do not have any past experience or haven’t performed well on previ-ous projects and to select the best available combination of qualifications and cost.
The final process is a request for qualifications (RFQ) process.This process isvirtually the same as the RFP process except that cost is not included. In thisprocess it is felt that the best solution, the best products, and the most qualifiedvendor are more important than cost. Remember, a GIS implementation is typi-cally long-range project, and first cost is never the last cost.Working with the right
191
vendor with the best solution will ultimately give you the best and most cost-effective solution. It will also eliminate a lot of headaches for you.
Another important consideration is learning about potential consulting com-panies or vendors to work with on your implementation.You will want to invitequalified companies to propose on your project.The best source for this is to go totrade shows or GIS user group meetings and ask around.Again, try to stay objec-tive. Don’t get misled by flashy marketing ploys. Look for experts who have donewhat you are looking for and have quality reference sites.Talk to other agenciesand get recommendations of companies they think are qualified to work withyou, and don’t be afraid to visit their offices and see their operations. Get to knowthe people that a consultant will be using on your project and make sure youunderstand their depth of expertise. Do they only have one person who knowshow to do a specific task on your project? This could be a potential bottleneck.
Evaluating ProposalsEvaluating proposals should be done by the committee that was established at theonset of this process. Each committee member should receive copies of what wassubmitted, attend any formal presentations by the vendors, and have adequate timeto review the submission, ask questions, and check with reference sites. It is impor-tant that the criteria by which these companies would be evaluated be establishedbefore the review of the submissions.Apples to oranges comparisons may happenif the specification and review process is not clear to all of the committee mem-bers. In addition, this entire process should be well documented in case a protestarises from one of the losers. If you have been specific and prepared a solid speci-fication, the evaluation process should be straightforward. Some questions thatshould be asked when evaluating a submission are as follows. Has the vendor donethe following?
◆ Proven it has experience and clear knowledge of the applications youdesire and the functionality that is needed
◆ Described what it is going to do in a clear and understandable fashion◆ Demonstrated that it has past experience providing these services◆ Demonstrated that it has adequate, experienced staff to provide the
services◆ Proven that the project is important to it, and not just another project◆ Shown that it can meet your desired time schedule◆ Proposed a solution that fits with our available budget
Interviews and Benchmark TestingAnother way to review a product and a proposer’s qualifications is to conduct for-mal interviews.At these interview the proposers should be given an opportunityto provide an overview of their companies, explain past projects they have workedon, explain why they are qualified to handle your project, introduce the key staffthat will be working on the project so you know who you will be working with,
Implementation: Selecting Hardware and Software192

Hardware Concerns
and demonstrate and explain what their approach to your project is, and why youshould chose them.These interviews should only take place with companies thatyou feel might be the right firm for you. Don’t waste a lot of time interviewingfirms that you have no intention in using and were weighted low in your initialreview criteria. Sometimes you can learn from these other, less desirable firms, butmore often they will say things in the interviews that will cause more confusion.
The final test that you may perform is what is known as a benchmark test.During this exercise you develop a series of problems, issues, or other functionsthat you would like the system to do, you provide the information and dataneeded to solve the problems or issues to the vendors, and you give them a speci-fied time to solve the problems. Often you give them multiple problems so youcan see how well the project manager organizes his or her team to solve the issuesin an efficient manner.
During this process you will be evaluating the proposer on such things as theability to do the following:
◆ Interact with staff in your agency◆ Listen and break down a problem into its parts◆ Solve technical problems◆ Work together as a team◆ Communicate effectively with you and with each other◆ Present their findings, good or bad
Making the Final SelectionOnce all of the reviews, interviews, and benchmark tests are completed, eachcommittee member should be given time to evaluate each of the companies inde-pendently. Then, after the reviews are completed, the committee should cometogether and discuss their rating as a group.You will be surprised at the outcome.Many times there is a clear submitter who, hands down, is the most qualified, butsometimes there may be things about the team or personalities that are seen byone individual, but not others. It is very important to have adequate time to dis-cuss the strengths and weakness of each potential solution or company. If there arestill questions that need to be answered or concerns you need to address, don’t beafraid to ask for additional information.Take the time to get all of the answers youneed before making the final selection.
Once all of the questions are answered, and the selection is made,move quickly,get your contract in order, and get on with your project.
Hardware ConcernsWhen evaluating and discussing hardware, there are number of fundamental termsor concepts that you need to understand to be able to make a sensible decision.The following is a discussion of each of these concepts; however, your software
193
selection determines the majority of the hardware requirements for you.Computer hardware is essentially composed of four basic components: the operat-ing system (OS), the CPU, the hard drive or drives, and memory.
Operating SystemsAn OS is the core software that makes all the other applications function. It is thisprogram that tells the computer what to do, when to do it, and how to do it. Mostpeople are already familiar with those that are in use today such as Microsoft’sWindows products, Linux, and various kinds of the Unix operating system. Beforeany hardware purchases are made, it is important to decide what operating systemswill be used in your agency.The plan should take into account the departmentsthat will be using the computer system, the type of network being used (or beingplanned), what operating systems are currently being used, how large the databasewill be, and what kind of technical support skills you have access to (in-house orcontractor). Higher-end operating systems like Unix have some tremendousadvantages, but they come with a price and require a specialist to administer.Windows operating systems, on the other hand, have been designed to be moreself-configuring and require less expertise to function. Of course, if you want it tofunction optimally, you will also need to have a specialist involved.
Central Processing Unit The CPU is the part of the computer that actually does the calculations, orprocesses the instructions, that are sent to it by the operating system. The mostcommon term that describes the processor’s capabilities is the clock speed.This isstated in terms of megahertz (MHz) or more recently in gigahertz (GHz). Theclock speed simply describes how many cycles per second the processor uses.Thehigher the clock speed the faster the processor.Another description of the proces-sor’s ability to process information is how many bits it can access at one time.Many of the new processors are 32-bit processors.This means that the CPU canaccess 32 bits of information during each of its cycles.There are still some oldercomputers in use that are 16-bit processors, and now some of the computers thatare available are 64-bit machines. Most of these run the Unix operating system.
Hard DrivesThe hard drive, or hard disk, is the piece of the computer that stores information.The operating system you run, the applications that are used, and the data that areused in the applications are all stored on different types of hard drives. In workingwith your GIS you will quickly find out that GIS hogs disk space. No matter howmuch you plan into your system, you still need more. Now it is common to have20, 40, or 80 gigabytes of hard drive on a single end-user machine and hundredsof gigabytes on your central server. Luckily the prices of hard drives have beencoming down, so you can purchase these drives for next to nothing.
Implementation: Selecting Hardware and Software194

Networking Issues
MemoryMemory on a computer comes in two primary forms.RAM is used as a temporarystorage space by the operating system and by the applications that are runningmore efficiently to complete requests.The simple fact here is that the most applica-tions run faster as the amount of memory is increased.This is true up to a certainpoint. For some application the more RAM you have, the better the performanceis until you add so much that some other part of the computer, maybe the CPU,becomes the limiting factor. In these cases you can keep adding RAM, but the per-formance will begin to taper off after you reach a certain point. In addition somesoftware applications can only use or address so much RAM.After a certain pointthey just ignore that it is there or don’t recognize it.Again, most software vendorscan provide you with data that indicates where this point is.
Networking IssuesThe concept behind networking and the issues that must be considered whenplanning a network can be summarized into the following categories:
◆ The type of communication that will be used◆ Local area network (LAN) versus wide area network (WAN)
considerations◆ The speed of the component hubs, switches, routers and network
interface cards (NICs)◆ The operating system and software that are running on the server◆ Whether or not you will use a file server- or client server-based
architecture◆ Whether you will used centralized or decentralized servers◆ Whether or not to use replication when there are multiple servers
Network Design and Speed ConsiderationsThe network infrastructure and the network communications provide the funda-mental mechanism that allows a centralized GIS to work.The types of networkproducts that are chosen establish a stable and dependable environment by whichthe users of the system communicate with the central servers and each other. Avariety of communication protocols exist today that support distributed applica-tions, centralized applications, and both centralized and distributed databases.Before the advent of the Internet, network technology was a relatively static envi-ronment, whereas computer performance was increasing at an accelerating rate.Recent advances in communication technology to support the requirements ofthe Internet have caused a dramatic shift in network solutions. Some of thesetechnologies as they pertain to a GIS implementation are discussed in the follow-ing sections.
195
The Desktop EnvironmentGIS applications require a significant amount of resources on the desktop andwith respect to network performance. By its nature a GIS allows a user to haveaccess to and analyze large amounts of data and present the results in a graphicalformat. Access to these data for real-time display and analysis puts large demandson network communications. Data must be transported across the network towhere the desktop application is executed to display the information in an effi-cient manner.
Data that are used in a GIS system, whether they are in a spatial, attribute or animage format, are a collection of little pieces of information called bits. Each bittakes up the same space on hard disk when it is stored. For convenience, thesesmall pieces can be organized and stored into bytes of information, with each bytecontaining 8 bits. Data can be moved from one location to another within packetsthat are groups of bytes. Data typically move across a network from one locationto another through a physical wire, in fiber optic cables, or using microwave, radiowave, or satellite signals. Each type of network protocol that is in use has specificlimits to the volume of data that can be moved based on the technology used tosupport the transmission.
Types of NetworksThere are two basic types of networks that must be considered in as GIS: LANsand WANs.The volume of data that can be moved across a network is referred toas the network bandwidth and is typically measured in millions of bits (megabits)or billions of bits (gigabits) per second.
Wide Area NetworksWANs support communication between different physical locations.The technol-ogy that is used in a WAN typically supports much lower bandwidths than LANenvironments, but the movement of data is possible over much longer distances ina WAN environment.The cost for WAN connections are relatively high comparedto LAN connections because resources typically need to be leased from third-party providers such as phone companies to complete the necessary connections.
Local Area Networks LANs function much the same way as a WAN, but there are some important dif-ferences.Typically LANs consist of a server with a network or network cards in itthat are then attached to a hub through physical wiring.The hub then is connectedto other hubs that are located around the building by a physical wire known as thebackbone. From the remote hubs there are again wires that connect to each of theclient computers using a NIC. In a LAN, the network bandwidth capacity is afunction of the combination of the speed of the computer’s NIC and the speed ofeach of the hubs in the system.Whichever of these is the slowest determines theultimate speed of the network.Typical speeds are either 100 or 10 Mbps. In addition,
Implementation: Selecting Hardware and Software196
Types of Networks
newer technologies can now provide a throughput of 1 Gbps.As a minimum 100Mbps should be used for all of the network components for any system that will beused for a GIS.The only exception to this would be if either a Web-based or ter-minal server solution is used, but even then the 100 Mbps is recommended.
There are two different types of hubs supporting most network configurations.A basic hub is the most common and works well for sharing data between LANclients. Distributed client/server applications require much more bandwidth thenthese basic hubs can support. As a result a new type of hub was developed a fewyears ago, the switched hub.A switched hub can support much higher bandwidthsand has intelligence built into it that allows it to better know what computers areattached to it and what information it needs to pass on to one of its computersversus what information it can just pass through to the next hub in the network.This type of technology and routers can drastically improve the performance of anetwork used for a GIS if configured properly.
Designing, sizing, and configuring a network is not something that should notbe left up to a novice. Protocols, capacities, and technologies are still changingrather drastically in this area, and this is an important step that should be carriedout by an expert in these areas.There are many companies that exclusively focuson this as a service because of its complexity.The concepts can be learned overtime and with experience, but it is best if expert advice is sought out, or yourimplementation can seriously suffer.
Basic Client/Server ConceptsApplications move data over the network through proprietary client/server com-munication protocols. A combination of hardware and software located on theclient and server computers define which communication format is used. Datathat are transported are stored within what are called communication packets,which contain information required to transport the data from one location to theother and information about which computer the information should go to.Thisinformation is commonly referred to as its address.
A packet of information contains both the address of the source computer andthe destination address. In addition, the packet contains information that allowsthe packet to be delivered across the network itself.The packet of information isreferred to as the IP, which stands for Internet Protocol. IP packet size variesdepending on the amount of data that are being sent, but the largest IP packet isaround 65 kilobytes (KB).To support files that are larger than, this a series of pack-ets are sent out that comprise the total piece of data that are being sent. A singledata transfer can include several communications back and forth between theserver and the client to complete an entire transfer.
Several client/server communication solutions are available to support networkdata transfer. Each includes a client and server component to support data delivery.The client process prepares the data for transmission, and the server process deliv-ers the data to the application environment. Primary protocols used by GIS solu-tions include the following:
197
◆ NFS (Unix) and SMB (Windows) protocol:Typical used when a clientneeds to access data that are stored on the server’s remote disk.
◆ X.11 Windows protocol:Typically used when only the display of the resultsof some type of information on the server (Unix based) needs to betransferred to the client.
◆ ICA and RDP protocol:Typically used when only the display of the resultsof an application on the server (Windows based) needs to be transmittedto the client.
◆ HTTP protocol:This is the standard protocol that is used by the Web.
Each of these protocols is used in the GIS environment depending on the applica-tion and the solution, the infrastructure that is in place, and the desired results andperformance.
Client/Server Network PerformanceThe amount of data that need to be transferred and the network bandwidth arethe two factors that affect the performance of a network. A typical desktop GISapplication requires up to 1 MB of data to generate a new map display.This meansthat the system has to be able to efficiently transfer 1 MB of data across the net-work for each user to receive the requested results. Obviously, the more users whoare on the system, the more data that are being transferred across the network.
Sufficient bandwidth is the key component to making this work.Another fac-tor that affects the performance is the type of application that is used. Forclient/server-based applications, all of the data are transferred across the networkto the client for processing. When selecting data from a file (coverage or shapefile), the total file must be delivered to the client for processing. Data not requiredby the application are then rejected at the client location.This accounts for a con-siderable amount of network overhead that may not be necessary. Certain types ofapplications perform all of the calculations on the server and then only transfer theresults of the query across the network.Typical applications that work this way areOracle Spatial, ESRI’s SDE, and Web-based applications. Rather than sending thewhole data layer to the client, the first two of these types process the data on theserver and select only the features that are needed by the client.The resulting sub-set of data is sent.This can drastically improve performance. Let’s take for examplea parcel data layer of 18,000 parcels. A typical layer like this can require approxi-mately 35 to 40 MB. If a user were to window into a small area, say one block, theentire layer would be sent to the client, and the client would reject all but maybea few thousand bytes. If one of these technologies were used, only the few thou-sand-byte file would be sent across the network, and performance would be dras-tically improved. Of course, you would need a much higher-end server in thissystem to process all of the requests from all of the clients using the system.
Using HTTP or Internet protocol, the same type of a process occurs. Therequest is received by the server and processed, and a graphic image of the resultsis created and sent across the network to the client. This is the most efficient
Implementation: Selecting Hardware and Software198
The Capacity of the Network
transfer mechanism, but it can be limited to only certain type of functionality.Using some new protocols and languages such as Java, the vector data can also bestreamed across the network to the client using a Web-based solution much likethe other server technologies.
The Capacity of the NetworkThe total capacity of a network is a function of the size of the data that need to betransferred, the network bandwidth, and the total number of concurrent users.Only one client packet of information can be transmitted over a shared networksegment at a time. Multiple transmissions on the same segment will result in whatare called collisions, which will require a retransmission to complete the data’sdelivery. It is important to properly size a network to minimize the number of col-lisions that occur.This means that the network has to be sized so that it has thecapacity to deliver the maximum amount of data that will be required across anysegment during peak usage times.
Sizing a NetworkStandard published guidelines are used for configuring network communicationenvironments. These standards are application specific and based on typical userenvironment needs. Most software vendors produce technical specifications orwhite papers that provide direction about how to properly size your system basedon size of data sets, the selected software solution, the network communicationprotocol, and the number of concurrent users.
Replicated Data Another important consideration when designing a system is to consider whetheror not data should be replicated within it. Replication is the process by which amaster copy of the database is created, and replicas of it are then created, usually onremote or distributed servers.There are a number of reasons why you would dothis.The first is for backup. Having a replicated copy of the entire system allowsyou to have a system to switch over to in the case of a catastrophic failure of themaster database or server. In an enterprise solution, with so many people depend-ing on the system, a replicated version would provide you with an efficient meansof keeping the system operating. Another reason for a replicated copy is for datamaintenance procedures. Often systems are designed with a primary server thatacts as the distribution mechanism to the end users. Meanwhile, a replicated copyof the system provides a working copy where edits and maintenance are done onthe data, and when changes are ready for distribution, the two systems are synchronized.
Functionally, the way this technology works is that a master database is createdon one system or server. Replicated copies of this database are located on anotherserver or servers that are known as replica sets. Based on configuration parametersthat can be set in the relational database software that is being used, the replica sets
199
synchronize themselves on a regular frequency. Synchronization is usually donewhen the users of the system are not there because a significant amount of net-work traffic is created by the volumes of data that are sent back and forth betweenthe two servers.
A common issue that comes up in the replication process is the resolution ofconflicts. A conflict is when a piece of data is edited in both the master databaseand the replica set, but they are edited to be different values. Rules can be set inthe software that define how this is handled. One way of handling it is to defineone of the databases as the master and the other as the slave. For example, maybeone of your departments is physically connected to a replica set server because thatserver is located in the building in which they work.Their edits are posted to thetables they have security to edit on this server, and they are the owner of these datasets. Another user mistakenly edits the same table and records in the masterbecause they have the rights to, but they are not truly supposed to. For those tablesthe system can be configured so that the replica set is the master and changes thatare made on this system are saved and the others are discarded.Another way thatthis can be handled is that when conflicts are detected, they are flagged and storedin a temporary location until a user reviews the conflict and commits the correctchange.
Replication is an important consideration for a GIS system, especially an enter-prise system. If the physical resources exist to use this technology, it should alwaysbe used. Even on small systems, using MS-Access as the back end, replication ispossible and should be used, although it doesn’t have as many options as a MS-SQL server or an Oracle database.
ADDITIONAL READING
Korte, G. 2001. The GIS Book, 5th ed. Chapter 14. Four Leading GIS Vendor’sProducts in Review. OnWord Press: Clifton Park, NY.
INTERNET RESOURCES
GIS Software Survey (2002) — Point of Beginning:pobonline.com/FILES/HTML/PDF/0602survey.pdf
Some free GIS software:gis.com/software/free_software.html
Implementation: Selecting Hardware and Software200

Designing theOrganization for GISThere are multiple design concerns when you are beginning the implementation
process of a multiuser, complex enterprise GIS. In addition to the very technical(and important) design concerns around the spatial and attribute data, there is a man-agement design concern: How this new system is going to fit into the existingreporting and budget structure of the organization. When you are implementingsomething as complex and expensive as a GIS, where it will be housed, how it will bebudgeted for, and other management questions will arise early in the process.To someextent they are quite separate questions from the more technical ones such as Whatcoordinate system should we use? and Should this particular field in this particulartable be a text or numeric field?, but sometimes the answers to the former questionswill lead you to a good decision about where control of the data should reside.Thecentral organizational design issues are control and accountability. Both of these issuesare wrapped up in the question of ownership of geographic information.
Ownership of Geographic InformationThere are two ways to look at ownership: within and outside the organization.Ownership of the data inside the organization is something the organization con-trols; ownership when viewed from the outside the organization can be more com-plex. Inside the organization, in your design process, you need to make decisionsabout control and accountability for each layer, set of features in your database, andtable in your database. These issues will arise early as it becomes clear to differentunits of the organization that data they previously regarded as their domain are goingto be more easily shared and seen by other users. It is no secret that control of infor-mation in an organization is about power within the organization, so the introduc-tion of a new way or organizing and sharing that information — the new GIS — willdisrupt the existing lines of power within the organization.And when the questionsabout whose budget will be supporting the GIS arise, and they will early in the
CHAPTER
9
201
discussions, the power issues become even more important. While some designconcerns are technical and best left to database experts, hired consultants, and soon, organizational design concerns directly affect how power is distributed withinthe organization, so they take the careful attention of reasonably experienced andhigh level people within the organization.
User RolesIf the GIS is going to support the activities of multiple units within the organiza-tion, a basic assumption of this book, these units all have a stake in how the own-ership is arranged. Sometimes, in state and local government, there are legalrestrictions on who may or may not make certain modifications to the data, andthese certainly must be considered. But each layer or set of features, if you haveadopted a database rather than layer model for your GIS, needs to have units iden-tified that will be responsible for the spatial and attribute data. From an organiza-tional perspective, it is the units, and roles individuals have within them, that areimportant, not the actual people themselves. In a business there may be a salesmanager and because that role has certain responsibilities, the sales manager willhave access to certain data in the system, regardless of who occupies that position.
People interact with relational databases through sets of defined roles and priv-ileges. Roles and people are not the same type of thing because one person may, atdifferent times, have several roles.The role describes your overall relationship withthe database.You may just be a viewer who needs to see information, or your rolemay include responsibilities for modifying certain information.With a GIS and itstwo types of information, spatial and attribute, there are roles where the ability tomodify attribute information is important, but some other role may be responsiblefor modifying the spatial information.Within a role is the notion of privileges.Aviewer role may carry privileges only to view certain GIS layers or feature datasets and possibly only certain attributes within those data sets.Although there willprobably be many roles in your final GIS installation, three basic classes of roles areeasy to identify:
◆ Viewer. In this role the user has privileges to view only certain spatial andattribute information.This role usually requires some customization ofthe interface to simplify its appearance, and there may be custom appli-cations that produce routine output.An example would be a clerk whoproduces maps and tabular output of property assessments or someonewho regularly produces mapped output with standard symbolizationover customized geographic areas for use in the field.Access to the pub-lic, whether through the Web or some other means, would be anotherexample of a viewer role.
◆ Modify Spatial Information.This role entails addition, deletion, and editingof the points, lines, and polygons in the various layers of your GIS database.These are specialized skills, and this role will fall on a relatively
Designing the Organization for GIS202
User Roles
small number of people. If a large staff is required to fill these roles, theywill often make up a unit of the organization by themselves.This iscommon in GIS utility installations, for instance, where the databaseundergoes such constant revision. Databases that do not change as fre-quently will have fewer people who have this role.
◆ Modify attribute information.This role might be combined with the previ-ous role and carried out by an individual, or people may have only thisrole and no other. It may make sense for the same unit or person whoedited the spatial information to update the attribute information.Apolice officer who is completing an incident report is the logical personto both locate the incident geographically and to create and populate itwith the necessary feature in the data set that will represent that inci-dent.There are communication systems now that allow this kind of data-base modification directly from the police car. Given the legalrequirements for reporting and tracking crime and arrests, you wouldwant only trained people in this role who knew the meaning of all thevarious codes, what fields are required, which are optional, and so on. Inother cases it might be more appropriate to assign the role of modifyingattribute information to someone other than the unit that modified thespatial information.An engineering draftsperson in one departmentmight be the right person to update the spatial information on a layer ofwater mains, but perhaps the supervisor who oversaw the installation ofthe main is the correct person to document the material, size, and otherattributes about the installation.
◆ Decision-making. Some users will be responsible for making decisionsbased on information in the database. Some of these decisions mayappear small and routine but are spatial decisions nonetheless.The deci-sion to dispatch a fire truck to the scene of a possible fire is a spatialdecision, as is a decision of what value to place on a land parcel.Decision making is a distinct role and may not involve a viewing role atall.There are many examples where decision makers only interact withthe GIS through mapped and tabular output. If you wish to considerthese roles as a hierarchy, this role is at the top, and units and individualswith this role need to be closely involved in the design process so thatthey get the required information to make the decisions.
Table 9.1 shows a simple example that might arise in local government involv-ing these roles. Look across the rows to see what reasons different units might havefor interacting with the data. The mayor, as important as he or she might be,should not have any authority to change land parcel information in the database.That would clearly be an abuse of power. But the mayor may want to have accessto the data for any number of reasons, so there no reason not to make that playerin the system a viewer of all layers (this only represents a subset of the layers or setsof features that might be involved).
203
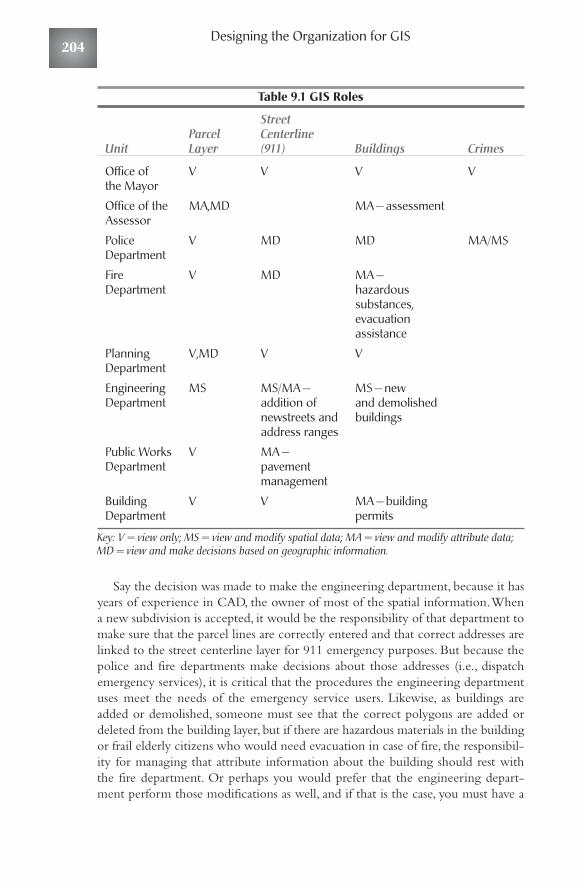
Table 9.1 GIS Roles
Street Parcel Centerline
Unit Layer (911) Buildings Crimes
Office of V V V Vthe Mayor
Office of the MA,MD MA — assessmentAssessor
Police V MD MD MA/MSDepartment
Fire V MD MA —Department hazardous
substances, evacuation assistance
Planning V,MD V VDepartment
Engineering MS MS/MA — MS — new Department addition of and demolished
newstreets and buildingsaddress ranges
Public Works V MA —Department pavement
management
Building V V MA — building Department permits
Key: V = view only; MS = view and modify spatial data; MA = view and modify attribute data;MD = view and make decisions based on geographic information.
Say the decision was made to make the engineering department, because it hasyears of experience in CAD, the owner of most of the spatial information.Whena new subdivision is accepted, it would be the responsibility of that department tomake sure that the parcel lines are correctly entered and that correct addresses arelinked to the street centerline layer for 911 emergency purposes. But because thepolice and fire departments make decisions about those addresses (i.e., dispatchemergency services), it is critical that the procedures the engineering departmentuses meet the needs of the emergency service users. Likewise, as buildings areadded or demolished, someone must see that the correct polygons are added ordeleted from the building layer, but if there are hazardous materials in the buildingor frail elderly citizens who would need evacuation in case of fire, the responsibil-ity for managing that attribute information about the building should rest withthe fire department. Or perhaps you would prefer that the engineering depart-ment perform those modifications as well, and if that is the case, you must have a
Designing the Organization for GIS204
User Roles
regular procedure for communication between the fire and engineering depart-ments about the modification of that information.
The police department is certainly the only unit you would want to be able toadd, delete, or modify information in the layer representing crimes (e.g., a pointlayer of arrests and police calls); the mayor may wish to view them regularly butwould have no other privileges. A well-designed GIS database might even blockcertain fields within that particular table from even being viewed (e.g., the namefield in an arrest layer).The mayor may wish to be able to see yesterday’s arrestsand their geographic distribution, but should the major be able to label that mapwith the names of the individuals arrested? Within the police department itselfthere may be specific roles and access assigned; not every patrol officer should beable to edit other officer’s data, and the chief may have access roles that are verysimilar to the mayor’s — viewing but no editing. Looking across the rows of a tablelike this will give you a good idea of how GIS will be integrated into the workingof the unit. A unit with only viewing needs will have simple software and hard-ware needs. Looking down the columns you should see only one unit responsiblefor modifying spatial data on a layer or set of features.That unit will require soft-ware or licenses for software and perhaps specialized hardware such as a digitizingtablet to modify spatial data. There may be more than one unit responsible formodifying attribute data, however, depending on the fields in the tables as they arefinally designed. One department might best enter some information overanother. In this example when a new land parcel is created, the field that containsthe address for that parcel should be the responsibility of the engineering depart-ment because it will also be represented in the address ranges of the street center-line file for 911 purposes. Generally, it is an excellent idea when building GISs thatwill be used for delivering services to addresses to have one unit of the organiza-tion responsible for the main address file. This avoids lots of confusion aboutaddresses that look different but are the same (e.g., 124 N. Fourth St. and 124NORTH FOURTH STREET).
The information necessary to create a table like Table 9.1 should come out ofthe needs assessment process. Completion of such a table may be a two-stepprocess where you make the initial assignments of ownership and privileges assoon as the layers have been defined and further refine the table after the detailedtables and their attributes have been designed. This is because data viewers andmodifiers may use the same table, but certain fields will be locked out to certainviewers, and you may not know what the fields are until later in the designprocess. So the viewers in the assessor’s office may be able to see all the severaldozen attribute fields it make take to create an assessment of a property, but otherviewers of this data may only need to have a limited set of information visible.Creating those different views into GIS data tables is an important implementa-tion step, but you identify the need during the design process and implement therole after completion of the database. Roles are not difficult to define and assign inRDBMSs, and you may discover new roles you wish to assign long after imple-mentation is complete.
205

Staffing the Design and ImplementationProcessIn this section we are going to deal with staffing the design and implementationprocess; staffing the GIS after implementation is discussed in a later section.Thekey decision here is how much planning and design you want to do with in-housestaff and how much you will contract for with consultants. For most complex,multiuser enterprise GIS designs, there will be some of both. It is rare for an orga-nization that does not already have a GIS to have staff with the necessary skills.This is true even if one or more of the front-line units in the organization alreadyhas a GIS that supports its functions. That unit will be important in the designprocess for the organization because the new enterprise GIS has to meet theirneeds as well as others, but their application may be so focused and specialized thattheir experience is not as helpful as they might think.There may also be units inthe organization that purchased a GIS, developed a small amount of data, and thennever did very much with it.That unit is certainly not likely to have staff with thenecessary skills.
How much and what part of the design and planning work you keep in-houseand how much you farm out to consultants depends on two factors: the skill andinterest levels of your existing staff and the time they have to devote to this processin addition to their existing duties. But even if you plan to contract out for theentire design and implementation process and pay consultants to do the workright up to installation and training, you will need a committee of your existingstaff and managers to oversee the process.There will always be staff input and timeinvolved in this stage, and there needs to be a structure for it. That structure isalmost always a GIS coordinating committee, especially where the organization isin the service state, discussed above. Somers (1995, 1997) recommends a three-tiered committee dealing with policy, technical issues, and users, but this could alsobe handled as a subcommittee.This committee will have to go through all the for-mal and informal steps of formation, statement of mission, settling who will be incharge of what, and communications within and outside the committee that anyad hoc or permanent committee that cuts across units in the organization wouldexperience. It will have at least the following functions:
◆ Overseeing the needs assessment and requirements analysis process.◆ Developing and reviewing any RFPs that goes out to consultants.
Sometimes in large projects a two-step process of a RFQ, which yields areduced set of consultants who actually prepare the RFP, may be helpful.Although a GIS changes rapidly, the questions one should ask of GISconsultants do not.There is an excellent set of questions in Forrest, et al.(1990) to effectively evaluate GIS consultants. If you choose to have aconsulting firm conduct the needs assessment and requirements analysis,that firm will be in an inside position when it comes to bidding for later,and more lucrative, implementation contracts, so careful selection of thevarious first sets of consultants you choose is important.Also, it isincreasingly common for consulting GIS firms to have formal business
Designing the Organization for GIS206

Staffing the Design and Implementation Process
relationships with particular GIS software companies, which can some-times affect their software evaluation.
◆ Reviewing and making recommendations on the proposals that comeback. Selecting consultants is something most organizations have hadsome experience with, and selecting a GIS consultant is not much dif-ferent.
◆ For any part of the process that occurs in-house, the committee willdirect and oversee the overall staff input to the design and planning. Forthis function they need enough senior management that other staff feelscompelled to participate.This coordination role is perhaps the mostimportant function for this committee.Through their actions they canenergize the entire organization around GIS, or they can make theprocess so difficult that the rest of the organization begins to see GIS assomething to be resisted and avoided.
◆ Communicate regularly upward to management and downward to therest of the organization what is happening with the design and imple-mentation process. Some implementation plans have actually preparedregular newsletters on the progress of implementation. However thecommittee chooses to let people know that there is progress, it shouldnot operate in an information vacuum. Let the entire organization knowwhat is being done and how it is proceeding.
The committee may have other functions assigned by management in additionto those listed. In the formation of any committee in any organization, the deci-sion of who should be on the committee (and sometimes what is equally impor-tant, who should not) is key. It is almost impossible to lay out guidelines for thestructure of this kind of committee, but here are some suggestions:
◆ Keep it small but not too small.You should keep subcommittees to aminimum, but you may have to have them.Appoint a small number ofpeople to interact with any hired consultants to simplify their lives a lit-tle. Regular attendance at the meetings is important, so the selected peo-ple need to have the right workload or be assured that they will be ableto participate. Serving on a committee like this is always in addition toexisting full-time duties, so assurances of this sort are necessary to getgood involvement.
◆ Include skeptics as well as committed people.The conversion of skepticalusers is key to successful implementation, and having them on the com-mittee allows the committed ones to develop their skills converting theskeptical.
◆ When selecting members of the committee from technically orienteddepartments, choose those who have demonstrated ability to interactsuccessfully with other units in the organization. Every technical unit haspeople who are very good at what they do but should be left alone intheir unit to do it.These are not good people for a committee like this.
207
◆ Have a definite champion.The word champion has been used in descrip-tions of information systems innovation for at least 20 years (Curley andGremillion 1983) and appears all over the dispersed literature on GISimplementation.A champion is an individual who is almost a missionaryabout spreading the news of GIS but is also articulate and carries someclout inside the organization.A champion is a practiced salesperson andknows how the organization works and how to get it to change indesired directions.Although a draftsperson in a public works departmentmay be a vigorous proponent of GIS and very articulate, he or she is notlikely to be the person who will be able to convince skeptical midlevelmanagers to get involved in the process.The champion need not be thechair of this committee but needs to be there. Often there will be multi-ple people who can play this role in different arenas.
◆ Include representatives who are current front-line users of geographicinformation.A committee completely composed of managers is likely todesign a system that may look good on paper but doesn’t work well.Users can be invaluable when it comes time to prioritizing existing appli-cations for automation. Often, some of the functions a consultant or tech-nical person may want to automate are functions that are being done verywell with the current manual methods.All the GIS will do is force thestaff person to learn a new, and not necessarily better, way to do the sametask. People who actually do the job usually have a better idea of whetherGIS automation is worthwhile than their managers might.
◆ Provide clear timelines and checkpoints for the committee’s work.Acommittee without a deadline is a dangerous thing.
◆ Keep the meetings regular but not too frequent.
As anyone with experience in complex organization knows, committees arestrange things. Some work very well, some fizzle out, and some are so dysfunctionalthat they almost never meet. Others were established at a time of need and neverget disbanded and have a life of their own.They work only if the people on them,or at least most of them,have a reasonably clear idea of where they are going or candevelop one quickly, work well with others, and follow up on what they said theywould do. Running a good interdepartmental committee is something good man-agers should be able to do, so our suggestion would be that a manager should leadit. In an organization in the strategic state (the next section explains states) thismanager may be high-level, but in a service state a logical choice would be a man-ager from one of the units that already have some GIS capabilities, if there are any.It is usually a bad idea to allow the committee to choose its own leader.
Where to Put the GISThe decision about where to locate the various elements of the GIS you are goingto construct and use is critical.There are many options available, and the culture of
Designing the Organization for GIS208

Where to Put the GIS
the organization will determine to a great degree which option you select andeven the process you use to decide where to put these things.Those that do thebasic work of the organization feel that they are already working at a full-time joband now some will be asked to do more.They are wondering, and rightfully so, ifthey are going to have the time and skills to do this new work. Managers are con-cerned about the same thing for their employees and themselves and want toknow from whose budgets the resources will come for this expensive and time-consuming activity.And top-level management should be worried about the over-all costs and benefits of a GIS and whether it is going to move the organizationforward. These concerns come up very quickly as an organization works outwhere the GIS, or the pieces of it, will be located in the organization and whatpieces of it you will contract out to consultants after implementation.
Huxhold and Levinsohn (1995) refer to a useful research project (UrbanInformation Systems, or URBIS) at the University of California. One major find-ing of this project (Kraemer et al., 1989) was to classify organizations into threedifferent states:
◆ Skill state. The information systems department controls informationtechnology and the distribution and use of software and hardware. If anorganization is in this state, GIS is likely to be centralized in the infor-mation systems or technology department, and other users may see thatit as too technical and somewhat isolated from their daily work.
◆ Strategic state. In this kind of organization information technology deci-sions are centralized at high decision-making levels, and the principalgoal of information technology is to support the work of top-level man-agement. In that type of organization GIS may be centralized in a unitthat reports directly to top management, and other potential users mayfeel somewhat left out of the process and benefits.
◆ Service state.A condition that has multiple units that provide differenttypes of services to varied client groups.They all have very differentneeds for a GIS. Implementation of GIS in an organization in either theskill or strategic set is a simpler process than if the organization is in theservice state, as most are. Our discussion of where GIS should fit intoyour organization presumes that your organization is in the service state.
◆ Mixed state.This is an organization that cannot quite fit into any of theprevious three categories. Parts may work like a service state organiza-tion and others like the strategic state, and the IT/IS department mayfeel that it controls a skill state organization. Huxhold and Levinsohn(1995) make an interesting conclusion for an organization in this state:hold off implementing an enterprise GIS until they can figure out whatkind of organization they are.
Generally, there are three type of locations and associated advantages and disad-vantages for an enterprise GIS within an organization, as shown in Table 9.2.
209

Table 9.2 Potential Locations
Advantages Disadvantages
Direct, front-line Direct link with operational Coordination is difficult, no working units. needs and existing budgets. authority of GIS units over
other units, possible weakbudget position, ownership isconcentrated; other units haveno stake, lack of visibility.
High-level High visibility, strong Perception of distance from executive authority. operational needs, potentially placement. precarious budget position
subject to whims.
Support unit Brings GIS within existing Distance from operational (IT/IS) support structure, budget needs, difficulties integrating
protection in early into front-line units.(expensive) stages.
Source: Adapted from Somers, 1994
Every organization is different, but somewhere there should be a chart or tablethat shows the various units of the organization and who reports to whom.Thetable of organization is a key document in any business or government, and at onelevel this is a decision of where to put the elements of GIS into this table, whatbox to draw and where to link that box to the management structure.There canbe no cookie-cutter answers to these questions because of how different organiza-tions are.And the placement of the GIS after initial implementation is not a finaldecision; there are many examples of GIS implementation that started out infront-line units and moved into support units as more departments got involved.Although there is not much discussion of this in the literature, an organizationmight take a phased approach to locating the GIS by beginning in one or twofront-line units with eventual movement into a support or strategic location.
The type of support a GIS needs is little different from other IT implementa-tion. A simple example is if IT training has always been considered an organiza-tionwide responsibility and the budget for that training has always been in, say, thehuman resources department, that is where money for GIS training will go andthat department will be responsible for managing those dollars. But if each unithas always submitted a budget line for training every year or quarter, you will havemore complex decisions about who gets how much of the training budget. In theformer case all training money would go to human resources, but in the latter casesome manager will have to decide who gets how much training.The same wouldapply to cost items such as hardware and software.There are probably countlessexamples of organizations that formerly allowed separate units to purchase hard-ware and software from their own budgets and then brought those functions intothe IT/IS department because the variability in software was hampering collabo-rative operations, and the individual units could not get the same economies ofscale on hardware purchases.
Designing the Organization for GIS210
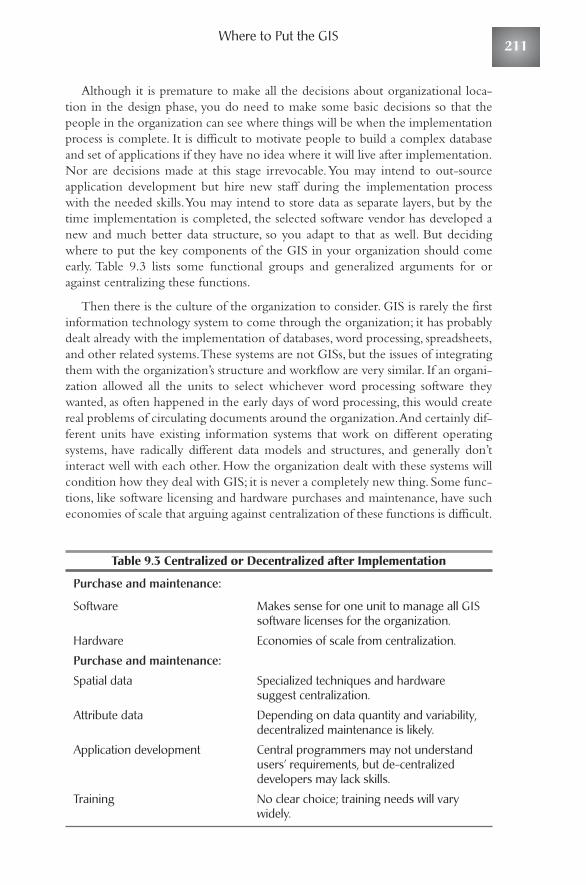
Where to Put the GIS
Although it is premature to make all the decisions about organizational loca-tion in the design phase, you do need to make some basic decisions so that thepeople in the organization can see where things will be when the implementationprocess is complete. It is difficult to motivate people to build a complex databaseand set of applications if they have no idea where it will live after implementation.Nor are decisions made at this stage irrevocable.You may intend to out-sourceapplication development but hire new staff during the implementation processwith the needed skills.You may intend to store data as separate layers, but by thetime implementation is completed, the selected software vendor has developed anew and much better data structure, so you adapt to that as well. But decidingwhere to put the key components of the GIS in your organization should comeearly. Table 9.3 lists some functional groups and generalized arguments for oragainst centralizing these functions.
Then there is the culture of the organization to consider. GIS is rarely the firstinformation technology system to come through the organization; it has probablydealt already with the implementation of databases, word processing, spreadsheets,and other related systems.These systems are not GISs, but the issues of integratingthem with the organization’s structure and workflow are very similar. If an organi-zation allowed all the units to select whichever word processing software theywanted, as often happened in the early days of word processing, this would createreal problems of circulating documents around the organization.And certainly dif-ferent units have existing information systems that work on different operatingsystems, have radically different data models and structures, and generally don’tinteract well with each other. How the organization dealt with these systems willcondition how they deal with GIS; it is never a completely new thing. Some func-tions, like software licensing and hardware purchases and maintenance, have sucheconomies of scale that arguing against centralization of these functions is difficult.
Table 9.3 Centralized or Decentralized after Implementation
Purchase and maintenance:
Software Makes sense for one unit to manage all GISsoftware licenses for the organization.
Hardware Economies of scale from centralization.
Purchase and maintenance:
Spatial data Specialized techniques and hardware suggest centralization.
Attribute data Depending on data quantity and variability,decentralized maintenance is likely.
Application development Central programmers may not understandusers’ requirements, but de-centralizeddevelopers may lack skills.
Training No clear choice; training needs will varywidely.
211
For other activities, such as development of applications, the arguments could goboth ways.
As with any new project or set of tasks that an organization undertakes, thedecision of how much to concentrate the activity in one unit and how much tospread it around to many units is key. GIS is generally thought of as an integratingtechnology. Because so many users need the geographic information, the GIS andits design and implementation process represent a real opportunity for units towork together for common goals. This often happens, but there are also caseswhere a GIS can be effectively concentrated and controlled in one organizationallocation and provide useful information for the other units. Both models canwork and neither is inherently better than the other.
Designing the Organization for GIS212
How They Did It — Fitting GIS into the Organization: Town of West Hartford, Connecticut
West Hartford’s champion in the GIS process was a civil engineer, BillFarrell, who, even though approaching retirement, saw the advantagesfor the community of spreading GIS to multiple units beyondengineering. The engineering department began in the 1980s using thesomewhat primitive DIME files (precursor to the Census Tiger files) formapping pavement conditions and as a tool to improve pavementmaintenance scheduling. Engineering and IT departments had to worktogether because of a tightly managed mainframe and difficult tointerpret software and data structure. At this time GIS was only lightlybeing used by this one department, engineering, with significantsupport from IT.Engineering conducted a feasibility study for GIS, still on the mainframeat this time. The entire governmental structure was being reorganized atthis time, and information technology functions were being movedfrom the finance department and being placed in administrativeservices, a move that was designed to make computing capabilityavailable to all departments and not just centered in finance. The townalso decided, not on the basis of the feasibility study, to go toclient/server architecture and allow the using departments to be moreindependent with the computing needs.Although these two streams were converging in the town, the stategovernment was beginning a pilot GIS study with the towns in a waterand sewer district (the Metropolitan District Commission, or MDC) toexamine the effectiveness of a municipal GIS based on the MDCs dataand expertise with GIS. With this study under way and the town’smovement away from mainframe computing, the engineeringdepartment shelved the feasibility study and became active in the state-sponsored GIS project through the MDC.This project provided software, hardware, digital orthophotography,planimetric data, and training; West Hartford was one of severalcommunities in the MDCs service area that participated. The project

Where to Put the GIS213
was implemented exclusively in the engineering department, but wordof GIS and what it could do was leaking out, on purpose, from thatdepartment, largely through the work of interns who did GIS work fordifferent departments using the engineering department’s equipment,software, and expertise base. During this time Bill Farrell was activelytouting the value of GIS in interdepartmental meetings and generallybuilding an attitude of “you’ve got to have this.”Expansion of GIS into several other departments, principally throughthe intern relationships, helped the town managers realize that theycould provide better services, eliminate internal dependencies for data,and use Internet and intranet technology to do all this. They focused onGIS as a distributive enterprise technology to perform these functionsand moved GIS from engineering into IT. Reorganization and a goldenhand shake retirement left a position open in IT that required not onlyGIS skills but general PC, database, and Internet skills, which they filledwith one of the interns working in GIS with the engineering department.Figure 9.1 is summary of how this happened in West Hartford. Thetiming was critical in this example because the possibility of a staffposition occurred at the same time management was revamping ITanyway, there were state and regional GIS initiatives that saved asignificant amount of start-up costs, and the groundwork had been laidwithin engineering and around the town. It almost seemed naturalwhen the intern moved into her position. She has since move toanother job, but the position was filled, and GIS is firmly entrenched inthe working of community government in West Hartford.There probably is no such thing as a standard process whereby GISmoves from a single department where it got started in theorganization to a centralized location where an enterprise GIS is bestserved from. Figure 9.1 shows how this community went through theprocess from departmental initialization to placement in the ITdepartment. In the case of this community, it would have been unlikelythat GIS would have been initially placed in IT. The experience of theengineering department over a 10-year period was central in theeventual movement of GIS into IT, and that department was verysupportive of that move, even though it meant, effectively, the loss of astaff position.
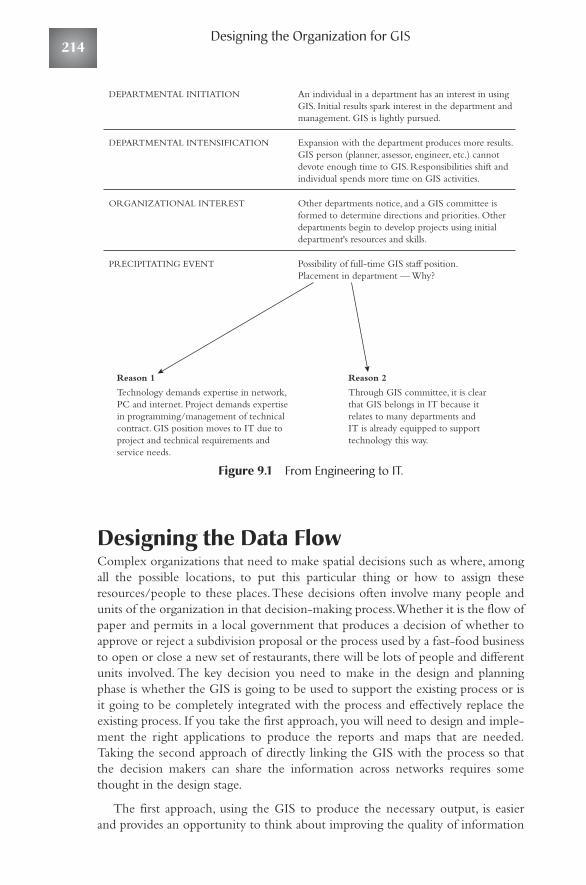
Figure 9.1 From Engineering to IT.
Designing the Data FlowComplex organizations that need to make spatial decisions such as where, amongall the possible locations, to put this particular thing or how to assign theseresources/people to these places.These decisions often involve many people andunits of the organization in that decision-making process.Whether it is the flow ofpaper and permits in a local government that produces a decision of whether toapprove or reject a subdivision proposal or the process used by a fast-food businessto open or close a new set of restaurants, there will be lots of people and differentunits involved. The key decision you need to make in the design and planningphase is whether the GIS is going to be used to support the existing process or isit going to be completely integrated with the process and effectively replace theexisting process. If you take the first approach, you will need to design and imple-ment the right applications to produce the reports and maps that are needed.Taking the second approach of directly linking the GIS with the process so thatthe decision makers can share the information across networks requires somethought in the design stage.
The first approach, using the GIS to produce the necessary output, is easier and provides an opportunity to think about improving the quality of information
DEPARTMENTAL INITIATION An individual in a department has an interest in usingGIS. Initial results spark interest in the department andmanagement. GIS is lightly pursued.
DEPARTMENTAL INTENSIFICATION Expansion with the department produces more results.GIS person (planner, assessor, engineer, etc.) cannotdevote enough time to GIS. Responsibilities shift andindividual spends more time on GIS activities.
ORGANIZATIONAL INTEREST Other departments notice, and a GIS committee isformed to determine directions and priorities. Otherdepartments begin to develop projects using initialdepartment's resources and skills.
Technology demands expertise in network,PC and internet. Project demands expertisein programming/management of technicalcontract. GIS position moves to IT due toproject and technical requirements and service needs.
PRECIPITATING EVENT Possibility of full-time GIS staff position.Placement in department — Why?
Reason 1
Through GIS committee, it is clearthat GIS belongs in IT because itrelates to many departments andIT is already equipped to supporttechnology this way.
Reason 2
Designing the Organization for GIS214
Designing the Data Flow
used in making the particular decision.A GIS usually can deliver different sets ofproducts than you commonly use. For example, it becomes easier to producemapped output at different scales, with information depending on the scale. Indeciding where to locate something, a regional-scale map showing relevant situa-tional features (e.g., competitors, sources of demand) might be needed, but youcould also produce a site-scale map with a digital orthophoto behind it to get aquick feel for any potential site problems. The spatial query capability of a GISmakes it much quicker to produce reports based on nearness. GIS has had atremendous impact in retail site location.The old analog methods of determiningsales potential and analyzing potential locations were so time consuming that itseriously restricted the number of sites that could be evaluated.With a GIS thisanalysis, although still not trivial or simple, can be done much more quickly,whichallows more time to consider information that may be harder to quantify but isvery important.You would want to make sure that the mapped and tabular outputfrom your GIS was at the right scale and in the correct format to support thesedecisions.The GIS becomes the engine that produces reports previously done byhand.The GIS may allow you to produce and report information in ways that youcould not do before, and this information needs to be produced at the right timein the decision process.
In the second approach, where your GIS is completely integrated with thedecision process, you need to redesign the entire process.You need to develop pro-cedures for getting data out of existing spreadsheets or databases or for replacingthe components of those databases with new tables in your GIS.Although it mayseem that this level of design detail is coming too early in the process, rememberthat designing a GIS is more like designing a house.You need to set out the spec-ifications very clearly to be able to get accurate bids on what it will cost to pro-duce it. If you know exactly what fields you will need in what tables, where inexisting data tables the current information is, and what new fields you must cre-ate in these tables, you have a complete template for construction of the database.The decision processes you plan to integrate with your new GIS determine whatinformation you will need. One of the reasons that implementing a GIS seems sodaunting to many organizations is that it forces you to rigorously examine yourcurrent procedures and data tables. In that examination you often discover that theexisting structure is inefficient and the current data are really not adequate for thedecisions you have been making. During the GIS implementation process you getan opportunity to improve your processes and develop more useful data for deci-sion making.
Examining the current flow of information that supports decisions is part ofthe needs assessment. In the design phase you can take time to reflect on that flowof data and see if it can be improved on with the GIS. Implementation of a newinformation system like a GIS is not just adding another layer to an already com-plex situation. Instead you should regard it as an opportunity to improve and sim-plify the decision-making process in your organization. How you deal with theorganizational design issues is more important in attaining those goals than is data-base design and software or hardware selection. GIS implementations usually donot fail for technical reasons but because the organization was not prepared for the
215

technology and the implementation planning was poorly done or not done at all.The new information system must fit within the organization, and the organiza-tion must change sufficiently to make use of the new information. Otherwise youwill have failure, and failed projects are difficult to resurrect.
ADDITIONAL READING
Curley, K. F., and L. L. Gremillion, (1983).The role of the champion inDSSimplementation. Information and Management, 6:203–209.
Forrest, E., G. E. Montgomery, and G. M. Juhl. 1990. Intelligent InfrastructureWorkbook:A Management-Level Primer on GIS.A-E-C Automation Newsletter:Fountain Hills,AZ.
Huxhold,W. E., and A.G. Levinsohn. 1995. Managing Geographic InformationSystem Projects. Oxford University Press: New York.
Kraemer, K. and J. King. 1989. Managing Information Systems: Change and Controlin Organizational Computing. Jossey-Bass: San Francisco.
Somers, R. 1994. GIS organization and staffing. Urban and RegionalInformation Systems Association Annual Meeting Conference Proceedings,41–52. odyssey.ursus.maine.edu/gisweb/spatdb/urisa/ur94004.html.
Somers. R. 1995. Learning from other organizations’ GIS strategies. Geo InfoSystems 5(7):15–16.
Somers, R. 1997. GIS management strategies and issues. Proceedings of the Spatial
Information Research Centre’s 8th Colloquium 1–7. University of Otago: NewZealanddivcom.otago.ac.nz/conferences/geocomp97/CD-ROM/sirc96/papers/key1.pdf.
Somers, R. 1998. Developing GIS management strategies for an organization.Journal of Housing Research 9(1):157–179.fanniemaefoundation.org/programs/jhr/v9i1-somers.shtml.
Designing the Organization for GIS216

Early ManagementConcerns: Interactingwith the SystemThe database is complete, the hardware and software installed, and the applications
developed and tested; your organization’s GIS is ready for use. However, you arereally only part way through the first round of a cyclical process, the database devel-opment cycle (see Figure 10.1).
It may appear that the process is linear, but it is actually circular; after implementa-tion you need to think about evaluation and planning for system maintenance. Butbefore these steps, you need some experience working with this new system you havecreated, which means that staff must be trained.
Before you can start training staff to use the new system, you must outline the var-ious roles that people will adopt when they use the system.A role is a defined set ofdatabase operations and access. Looking at roles rather at individuals is a betterapproach for several reasons. First, people come and go in an organization, but a roleis relatively constant. Secondly, individuals will often have multiple roles in an organi-zation; for some activities a staff member may be a front-line employee doing specificwork on a project, but on another project that same individual may be the projectmanager with the additional responsibilities attached to that role. Nor is a role exactlythe same as a job description, which may also contain multiple roles. Defining theroles allows you to control access to the database, provides a structure to ensure secu-rity of the data, and guides you in setting up the training that the staff will need tomake good use of the new system.Although there may be many subroles within thesegeneral roles, the set of roles consists of viewers, spatial data modifiers, attribute datamodifiers, application developers, and administrators , as shown in Table 10.1.
CHAPTER
10
217
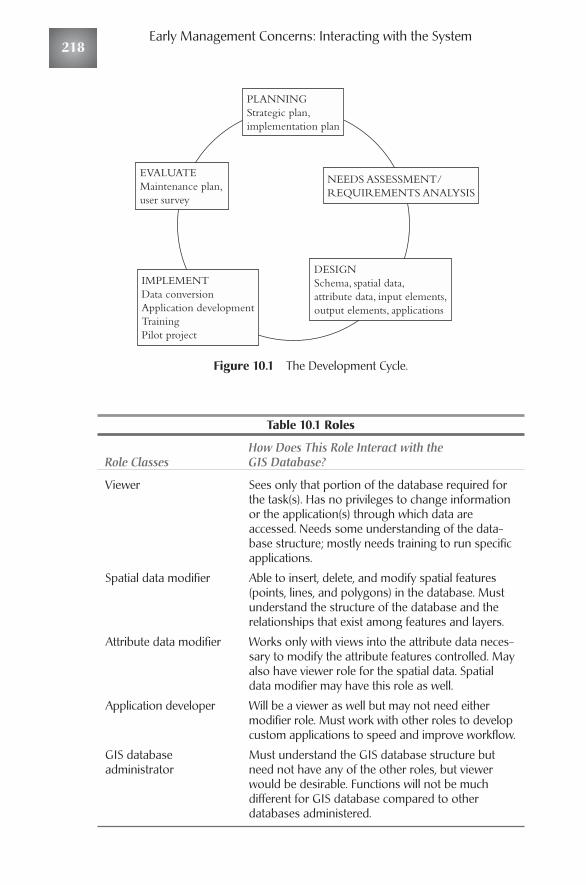
Figure 10.1 The Development Cycle.
Table 10.1 Roles
How Does This Role Interact with the Role Classes GIS Database?
Viewer Sees only that portion of the database required forthe task(s). Has no privileges to change informationor the application(s) through which data areaccessed. Needs some understanding of the data-base structure; mostly needs training to run specificapplications.
Spatial data modifier Able to insert, delete, and modify spatial features(points, lines, and polygons) in the database. Mustunderstand the structure of the database and therelationships that exist among features and layers.
Attribute data modifier Works only with views into the attribute data neces-sary to modify the attribute features controlled. Mayalso have viewer role for the spatial data. Spatialdata modifier may have this role as well.
Application developer Will be a viewer as well but may not need eithermodifier role. Must work with other roles to developcustom applications to speed and improve workflow.
GIS database Must understand the GIS database structure butadministrator need not have any of the other roles, but viewer
would be desirable. Functions will not be much different for GIS database compared to other databases administered.
PLANNINGStrategic plan,implementation plan
EVALUATEMaintenance plan,user survey
IMPLEMENTData conversionApplication developmentTrainingPilot project
DESIGNSchema, spatial data,attribute data, input elements,output elements, applications
NEEDS ASSESSMENT/REQUIREMENTS ANALYSIS
Early Management Concerns: Interacting with the System218
User Roles
User RolesViewerThe simplest role is that of viewer.A viewer needs to understand only the inter-face to the system with which he or she will be working. In many systems this willbe a simplified interface linked to a particular application or set of applications andnot the full set of buttons, tools, and menu items that would normally appear inthe software’s interface. Most GIS software systems allow you to create simplerinterfaces by removing functionality from the standard interface or by construct-ing sets of interaction tools from scratch and building custom interfaces using pro-gramming tools supported by the software. This is how the original softwarevendor builds the full interface. Object-oriented programs are built in pieces withsnippets (or large pieces) of programming code associated with buttons, tools, andmenu options. The core functionality is called from already constructed bits ofprogramming.The first approach to customize the interface to support a particu-lar user application, by using a full license of the software and removing function-ality from a viewer, may appear expensive and backward at first.Why would youwant to pay for a complete license of complicated software when you are going totake away most of what it does to simplify the interface for a routine application?The answer to that question is that it may be quicker and less expensive to do thatthan to develop the custom application from scratch.A GIS installation with a rel-atively small number of users may be better off using full software licenses even forsimple applications and removing the unnecessary functionality to create a simpli-fied, customized interface for the viewers. On the other hand, a system with manyusers would prefer custom interface development.This approach creates custominterfaces from scratch with only the required buttons, tools, and menu options forthe application. This is especially appropriate when many viewers will use thesame set of applications.Whether you simplify full-license interfaces or create cus-tom interfaces from scratch is unimportant to the viewer, however.The viewer justneeds to know how to do the work, which buttons to push, which menus to pulldown, and which decisions to make in dialog boxes that force choices. Muchapplication development consists of taking standard functionality and rearrangingit so that specific tasks are easier to perform.
Usually you want viewers to have little or no control over the interface or the data they are viewing. Locking out a viewer from modifying data is critical,especially if everyone is working with a centralized database; if a viewer is work-ing with a copy or partial copy, it is not as serious.You might even want to lock a viewer from altering how data are symbolized, but there may be reasons forallowing a viewer to change the colors or symbols used to identify different fea-tures. Some users like to be able to customize the application a little bit so theyfeel some ownership, so you might want to allow them to modify some designelements. Some viewers may need, or want, more control than others. But thepure viewer role does not include any ability to modify data.Viewers are userswho routinely go into the database with standard queries and produce standard-ized output in a specified format. The abilities to modify data belong to the next roles.
219
Spatial Data ModifierModifying spatial data can be a relatively simple process.An application that takesthe address of a client, matches the address with a pair of geographic coordinates,and adds that representation of the client to the database is not complex due to thesimple geographic nature of a point. A point needs only a unique identificationnumber, a pair of coordinates, and possibly an elevation to completely describe itslocation. For example, the entering of the location of a police call is a spatial mod-ification process.A user with the spatial modifier role must have access to the datalayer of police calls and appropriate permissions to add features and unique iden-tifiers to these new point features.Additionally, the application should have someprocess of quality control even it is only as simply as on-screen verification of thecontent, checking of the database to see that the unique identification number istruly unique, and providing an opportunity to shift the location of the featurebefore committing it to the database.
If the features are best represented by lines in the database, the level of com-plexity in spatial modification goes up, and the role gets more involved. Lines usu-ally need to be linked up with other lines to be useful features.This means that thespatial modifier must check to see that the new line being entered is linkeddirectly to existing lines if this is a requirement of the application. Unless the link-ages between linear features are explicit, routing applications will not workbecause there is no way to move from one line to another in the system.And justbecause it may appear on the computer screen that one line is linked to another, itmay only touch the second line and not actually be snapped to it (i.e., there is nointersection feature or node defined). Composite linear features such as highwayroutes and pavement management sections that are made up of several separatelinear features take even more care in their insertion into geographic databases.Anexample of an application for a spatial modifier working with linear data is theperson responsible for maintaining the coordinates of a street centerline file for anarea. The line needs to be inserted and its location checked, and it needs to besnapped to other lines in the network.
Polygons or areal features are composed of lines and possibly more complex ele-ments such as arcs (sections of a circle) or splined linear features, which makes theirconstruction more involved. If the database supports topology, anyone modifyingspatial data must take care and know how to rebuild the topology after modifyingthe database. Polygon data are the most difficult to maintain and update in a GIS,particularly if your system requires and supports the topological vector data model.This means that as polygons are added, deleted, or modified, their adjacency toother polygons must be maintained or created.Also, the spatial modifier may haveto add label point features where labels from attribute information will be drawnand possibly annotation or text information that relates to the new or modified fea-ture.An example would be the user whose responsibility it is to process splits andcombines of land parcels in a land parcel layer, a common and important task in anygovernmental unit that is responsible for land assessment and taxation.
Early Management Concerns: Interacting with the System220
User Roles
Attribute information about geographic features is easy to explain to users; thestructure of a table where the rows represent the features (utility poles) and thecolumns stand for what we know or want to know about the features (date ofinstallation, ownership, etc.) is simple. But the structure of spatial data is morecomplex, and modifiers of spatial information need to understand exactly how thesystem stores and retrieves the geographic features.Although viewers need only tounderstand the interface and how it works, spatial modifiers need to understandthe data structure and how the system stores information.
Deleting or moving spatial features in a GIS database is relatively simple.To delete a feature you merely select it with some tool (the screen displays the feature differently because it is selected), and then you hit the Delete key.The sys-tem may prompt you to state that you really do want to remove the feature byclicking Yes to a question, but then it will delete the feature. And, unlike manyRDBMSs, that feature is completely deleted, not just marked for deletion andremoved the next time the database is compressed or backed up. Working withspatial data can have real consequences, and spatial data modifiers learn early towork on copies of the database or portions of it to make changes and then toinsert those changes into the master database after modification.To move a feature,you usually just pick it up with tool and move it to a different location and drop itthere.The attribute information stays the same; all that changes is the location ofthe feature.
Inserting new geographic features in the database often requires special toolssuch as GPS receivers, scanners, and digitizing tablets. More and more informationis coming into GIS databases through GPS, and there are lots of issues of accuracyand processing that you need to know before you can do this. How accurate willthe locations be? To record a point feature such as a road sign, will we take multi-ple points and compute the average, or will we just take a single satellite fix as theestimated location? After taking the points in the field, will we use differentialpostprocessing to improve accuracy? The technical questions around using GPS tobring even relatively simple point information into a GIS are considerable.Scanners have similar technical questions of resolution, accuracy, and the complextask of taking a scanned, large set of pixels that are defined in the local coordinatesystem of the scanner and transforming those grid cells into a much smaller set ofpoint, line, or area vectors in a geographic or projected coordinate system that willallow the new data to fit with your existing database. Just about every novice GISmodifier of spatial data has taken information in some kind of local coordinatesystem such as the scanner or digitizing tablet and tried to overlay it with data inan existing projection only to find that the new data sit way down in the lowerleft-hand corner of the map view, near the 0,0 point of the coordinate system,whereas the projected data it should overlap with sit in the upper right right-handcorner. Digitizing paper maps, whether on the screen with heads-heads-up digi-tizing or from a digitizing tablet, present similar problems that take quite a bit oftechnical understanding and patience to solve.
221
Users and managers who do not understand the structure of GIS databasesoften gloss over these questions by just assuming that GPS or scanning paper mapswill somehow magically result in useful, accurate data.Those in the role of spatialmodifier are the ones who will actually do the necessary transformation, and theyneed to understand how to do it and ensure that new data are correctly insertedinto the database. It is remarkably easy to do it poorly and quite difficult and oftentime consuming to do it well. It is always more efficient to take the time to do itcorrectly the first time than to try to fix it up later, however. So unless the modi-fication of spatial data is simple, as in the police call example earlier, this rolerequires considerable training and, often, specialized equipment, so usually a rela-tively small number of people in the organization will have this role. One finalconcern for the spatial data modifiers is with the spatial indexes. Most GISs willautomatically update the spatial index tables when features are removed or addedor their location is modified, but some require explicit rebuilding of the indextables.
Attribute Data ModifierAttribute data modifiers may appear to have little or no direct interaction with theGIS database because they can often perform their tasks without any map-likeinterfaces. But their role is critical to the maintenance of a useful set of data.Because they do not interact directly with the spatial information and may noteven have the role of data viewer, they may not know (or care) that they are deal-ing with a GIS. In a data set where spatial change is infrequent relative to attributechange, there may be many people who have this role.A property assessor’s data-base in a highly developed large city with few new lots being created is an exam-ple of this combination of change frequencies. Compared to splits and combinesof lots (spatial data), changes of ownership and assessment information (attributedata) are much more frequent.Those changes may be processed in a database man-agement system using sets of input screens that contain no spatial information atall; access is by address or property identification number. Users with little or noGIS experience can do the management and quality control of these changes tothe database.There is one important caveat, though.The attribute modifier rolemust not be allowed to add or delete features in the attribute data set withoutworking with a spatial modifier. In GIS databases that are working with layersrather than fully integrated databases, the GIS software manages the link betweenthe spatial and attribute data, but the data reside in different physical tables.Thereis one very widely diffused GIS that, for very good reasons, will allow the deletionof an attribute record in a data table without deleting the corresponding datarecord in the spatial table. So when your view into the data is through theattribute data table and you delete a record or feature from that table, the corre-sponding record is not removed from the spatial data table. But when your viewinto the data is as a spatial modifier and you remove the feature from a map-likeview into the data, the corresponding record in the attribute table is removed.Thereason this is allowed is that you often have data tables in your applications thathave no associated location information associated with them. Modification onlyof the attribute information without deleting or adding geographic features
Early Management Concerns: Interacting with the System222
User Roles
requires no interaction between the spatial and attribute modifiers.To summarize,if attribute modifiers are working with spatial data, even if they have no need tosee the mapped view of the data, they should have the permission to deleterecords in that table,
Application DeveloperApplication developer is a role that does not require the ability to modify the spa-tial or attribute data, unless that is the purpose of the application. An applicationdeveloper works on procedures and software code that facilitate the other roles.Increasingly, core GIS software systems are designed so that developers may writeapplications in high-level programming languages that access procedures andlibraries inside the GIS core software code. Some systems advertise that their soft-ware can be manipulated and extended using any software built on Microsoft’sCommon Object Model (COM).These so-called COM-compliant software sys-tems allow a developer to write application code in a standard programming lan-guage such as Visual Basic for Applications, (VBA),Visual Basic (VB), C++, andJava.This application code makes use of extended functionality for these languagesthat deals with spatial data. Earlier GIS core software sometimes included a pro-prietary scripting or programming language for applications. This required anapplication developer to learn this new language to customize the GIS. Nowapplication developers already skilled in a particular language need only to under-stand how to use the extended functions and subroutines and the data structure toprogram the GIS to do additional tasks.This is a real advantage for organizationsthat already have programming staff that have been working on nongeographicapplications involving other COM-compliant systems such as word processors,databases, and spreadsheets.The programming interface will be exactly the same, aswill the process of developing code for the application by working with the per-son or group that needs the application and writing, testing, deploying, and updat-ing the code.The industry is quickly moving away from proprietary languages forapplications and toward using these standard programming languages.This meansthat programming your GIS to do new tasks becomes almost exactly the same asprogramming the other software your organization has been using.Your originalimplementation plan included certain applications that were to be automated inthe GIS, but there will be a continuing need for new applications and improve-ments of existing applications.The bulk of the cost of the initial construction ofthe system is in the data development and conversion, but it is the continuingdevelopment of applications that makes the system more useful.
Application developers have the most complex role in the system. Not only dothey need to understand the software and how it works and the database and howit is set up, but also they need to be able to interact with the users who need theapplication so that they can create a useful product.Although many programmersget a little tired of sitting in a cubicle and cranking out code, writing applicationsfor a complex GIS installation can be very interesting work.The implementationplan should outline the order in which applications should be developed, andsometimes it is difficult to keep to that list of priorities. Users will be quick to
223
request modifications of existing applications and bring pressure for new ones tobe written. So it is important to have a procedure for allocating the time of appli-cation developers. If the database is well designed and maintained, most of thegrowth and development over time will be in the applications. For each newapplication or change in an existing one, the product development cycle beginsanew; it just does not take as long to work through the process. It must begin withplanning and move to assessing the needs, designing the application — includingthe process, data required, and output — implementing it, testing it, and having theusers evaluate the final product. Although the development cycle for the entireGIS may take years to work through, it may take only a few weeks for new appli-cations to go through.The cycle gives a structure to the process, and experiencedprogrammers are used to this cycle.
GIS Database AdministratorDatabase administrators (DBAs) are responsible for the overall database, and in thisrespect a GIS database is not much different from any other database that the orga-nization may be using. A DBA may set up roles in the system, back up the data-base, monitor its use, see to its overall security, and generally be the guardian andadministrator of the database. To good DBAs, a GIS database is simply anotherdatabase that puts requirements on them and will not appear to be anything spe-cial. If an organization already has multiple databases to support other activities ofthe organization, the GIS database becomes just another administrative task simi-lar to others. DBAs do need to be familiar with the data model, data structure. andfile structure of the core GIS software and how it is linked with other data in thesystem, however.
If the organization is small, the current DBA may also serve as the GIS DBA,but in larger organizations there is often a need for a separate individual whoseresponsibility, part-time or full-time, is administering the GIS database. In this sit-uation, it is useful to have a division of labor between the two roles of overall DBAand GIS DBA so that there is no duplication. For example, the enterprise DBAwill have procedures for setting up new users in the organization’s technology sys-tem that may involve training and testing. If the new employee is going to workwith the GIS database, it may be the responsibility of the GIS DBA to set up theuser role(s) and do the training and evaluation on the GIS. Perhaps the systemDBA would be responsible for setting up, tuning, and evaluating indexing systemson attribute information, but the GIS DBA would have the same role with respectto the creation and maintenance of spatial indexes.All organizations are different,and larger ones tend to have a larger number and more specified roles within theGIS, so separation of responsibilities is important.
Managing User RolesAs your system matures, the number of possible roles for interacting with the sys-tem will grow; the set of roles is not static.Within the viewer role there will besubroles that may allow viewing and browsing over larger or smaller portions of
Early Management Concerns: Interacting with the System224
Managing User Roles
the database.The spatial modifier role may have many subroles depending on thedistribution of responsibility within the organization for various layers and sets offeatures (e.g., a planning department may be assigned the role of spatially modify-ing the zoning layer but not have rights to touch the layer of land parcels).Youmay even choose to assign some maintenance roles to outside organizations thatwill perform the maintenance and updating on a contract basis. Many consultingfirms will willingly take on many of the more complex and involved roles, leavingyour staff only to work with the applications. Often the consulting firm that wasmost heavily involved in the database design and implementation phases will bewilling to engage in these kinds of maintenance contracts. It is not uncommon, forinstance, for the firm to leave some of its staff in the implementing organization atleast part time during the early management period of the GIS.
Earlier in the book we discussed the relative merits of GIS databases con-structed of data layers and those that adopt a SERD model. If you have adopted aSERD as your GIS data model, security and role creation are integral functions inthe database management programs. But if you construct a layered database, it willbe more difficult to keep the database secure and control access to it. In a databasewith a layer structure, data reside in many different folders, and your principalmeans of access control is through the operating system, which is more difficultthan controlling through a database management system. In a SERD all the dataare inside a single database, and there are management tools to control access tothe tables in the database. However, it is not uncommon for an organization toimplement a hybrid GIS where some units interact with a layered database, otherswith a SERD, and there even may be more than one SERD in use in the organi-zation. One organization had existing databases that used three different databasemanagement systems and wanted to link its existing data with the new GIS data.Obviously, there is no clear, cookbook-like process for managing access to thedata, but the costs of failing to do it well are considerable.
Managing the roles and the associated access controls is important for all GISdatabases but especially important for databases that undergo frequent modifica-tions from multiple users. A local government that processes a relatively smallnumber of land transactions over a month may be able to manage the process ofchanging the database very simply by making occasional changes all at once. Alarge city or public utility, however, may have many concurrent users whose soletask is to modify attribute and/or spatial data, and controlling the quality of thatkind of interaction is very important.A common strategy is to make all changes totemporary files and have a manager or supervisor review the changes before com-mitting them to the database. A second strategy involves the concept of version-ing. In this approach each user works on a version of the database and makeschanges to that version.The software checks those changes to see if they conflictwith changes made by another user. In a large organization it is not uncommonfor two people to be working on the same data simultaneously, requiring a processto reconcile any differences between their two versions.When versioning is beingused, changes are not committed to the database until someone reconciles the ver-sions or tells the system which version to insert.
225
It is clear from this discussion that the really important task in managing rolesis how you establish procedures for modifying the database.These procedures needto be documented and understood by all modifiers of spatial or attribute data.Because the organization has been working well without a GIS and has existingdatabases and procedures for modifying them, the only task is to insert the appro-priate quality control steps for modification of any new data that will be managedin the GIS.
Managing Desktop Interfaces Research in the area of how people interact and actually use a GIS has been goingon for almost a decade, but the published literature is not too useful to day-to-daypractitioners. Over time the improvements to how people interact with a GIS willmove from the researchers to the applications designers and software manufactur-ers. Early GISs had what now seem intimidating black screens with a prompt thatjust waited for the user to type in a command.These interfaces were copied fromthe Unix operating system where a command line interface with a structure likesCommand [required parameter1, required parameter2...] {optional parameter1, optionalparameter 2...}.These interfaces have now all been replaced with GUIs based onWindows icons menus and pointers (WIMP).The acronym that was chosen forthese interfaces says a lot about what the designers thought about the users.Thereis work going on to improve these interfaces, but today most GISs present boththe novice and experienced user with a bewildering array of pull-down menus,buttons, and toolbars. Users are able to modify the appearance of the interface byremoving objects, creating custom toolbars, and placing frequently used objectsconveniently on the interface, but the standard interface is still an intimidatingthing to new users.
Most users will be interacting with the system through a GUI. GIS softwareoften also has command line functionality, but only skilled power users feel com-fortable with a blank screen and no buttons to push or menus to pull down.A man-agement concern is how much customization of interfaces to do. The softwaredesigners wanted the maximum number of tools and functions available to users, sothe menus, button bars, and toolbars are crowded with options. A lot of trainingtime can be consumed explaining things to users who may have no need for thatmuch functionality.A lot of programming time can be consumed by having to cre-ate a large number of customized interfaces as well. Some customization is rela-tively easy in that with most GISs you can define custom toolbars by arrangingfunctions you might need frequently on conveniently organized toolbars that caneither be anchored on the interface or allowed to float over the data view. By doingthis you can move the small set of tools that an application might require from loca-tions that might be hard to navigate to and place them in a usable location.Themetaphor is that of a toolbox, and the system allows you to put the tools you needfrequently within easy reach.This kind of customization of a fully licensed versionof the software is not difficult and can speed work significantly. Figure 10.2 is anexample of this type of interface; most desktop GIS GUIs have a similar structure,although the icons, menu options, and tool arrangement will differ.
Early Management Concerns: Interacting with the System226
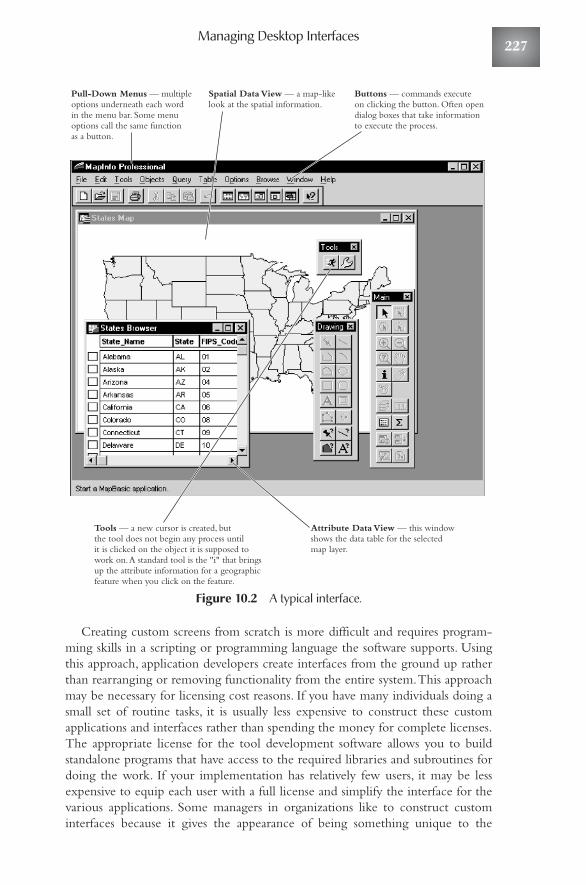
Managing Desktop Interfaces
Figure 10.2 A typical interface.
Creating custom screens from scratch is more difficult and requires program-ming skills in a scripting or programming language the software supports. Usingthis approach, application developers create interfaces from the ground up ratherthan rearranging or removing functionality from the entire system.This approachmay be necessary for licensing cost reasons. If you have many individuals doing asmall set of routine tasks, it is usually less expensive to construct these customapplications and interfaces rather than spending the money for complete licenses.The appropriate license for the tool development software allows you to buildstandalone programs that have access to the required libraries and subroutines fordoing the work. If your implementation has relatively few users, it may be lessexpensive to equip each user with a full license and simplify the interface for thevarious applications. Some managers in organizations like to construct custominterfaces because it gives the appearance of being something unique to the
Pull-Down Menus — multipleoptions underneath each wordin the menu bar. Some menuoptions call the same functionas a button.
Spatial Data View — a map-likelook at the spatial information.
Tools — a new cursor is created, butthe tool does not begin any process untilit is clicked on the object it is supposed towork on. A standard tool is the "i" that bringsup the attribute information for a geographicfeature when you click on the feature.
Attribute Data View — this windowshows the data table for the selectedmap layer.
Buttons — commands executeon clicking the button. Often opendialog boxes that take informationto execute the process.
227
organization. Through customization of the screens the core software is hiddenbehind the interface, and there is a sense of corporate or organizational identitywith the system.
Custom interfaces are also excellent tools for helping less technically mindedusers feel comfortable with the system. All GIS implementations have problemswith difficult, stubborn, and sometimes unwilling-to-learn users. Typically theseusers regard the system as a threat and see it as a statement that they have not beenperforming well. Otherwise, why would you implement a new system to do theirjob? These users are the most difficult for managers to deal with in GIS or anytechnology, and an interface that simplifies the work and makes it accessible to thistype of user goes a long way toward solving that problem.
Managing World Wide Web-BasedInterfacesMore and more viewer interaction with GIS databases is occurring throughInternet and intranet applications. Users gain access to these applications com-pletely through their Internet browsing software (e.g., Netscape or MicrosoftInternet Explorer) and require no GIS functionality on the client side of the con-nection.The software that constructs the maps and processes the requests from theclient’s browser to the map and data server, however, must have specialized soft-ware that facilitates the serving of the GIS database to the internal intranet orexternal Internet.
In this type of interaction, the interface design is of extreme importance, anddecisions about what functionality to place on it and how to design it so that usersget the information they need must be made at relatively high levels in the orga-nization because of the face that it presents to the public.
There is a lot of work going on both by the GIS core software providers andthird parties around Web-based interfaces to geographic data. Given the time ittakes for a book manuscript to actually turn into the object you are holding, any-thing we say here will probably be out of date when you read it. Serving staticgraphic images of maps across the Internet was a very early use of the technologyand is still an important means of distributing geographic information.Taking apaper map, scanning it into digital form, and then making that digital file availableacross the Internet is an effective way to distribute already existing maps.This hasbeen especially useful in making historic maps available to many viewers whootherwise would not be able to access these documents easily.
More recently organizations have taken to placing some or all of their GISdatabase on the World Wide Web for users both inside and outside the organiza-tion to query.And people are using these databases all the time.The map-makingand direction-finding sites on the Internet such as Mapquest.com and MapBlastare among the most frequently visited sites on the Web.These sites are network-based GISs that, due to their efficient indexing and system architecture, can rapidlydetermine least-cost paths from any addressable point in the United States to any
Early Management Concerns: Interacting with the System228
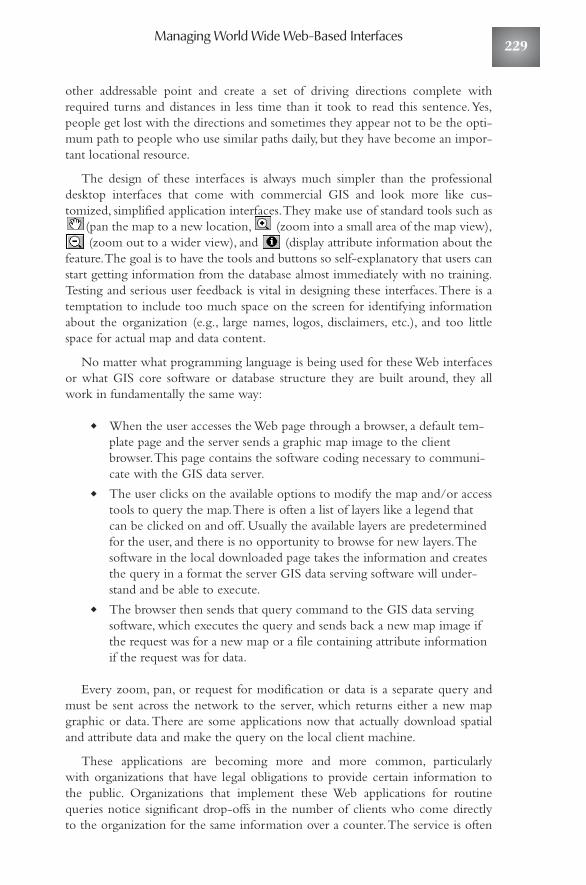
Managing World Wide Web-Based Interfaces
other addressable point and create a set of driving directions complete withrequired turns and distances in less time than it took to read this sentence.Yes,people get lost with the directions and sometimes they appear not to be the opti-mum path to people who use similar paths daily, but they have become an impor-tant locational resource.
The design of these interfaces is always much simpler than the professionaldesktop interfaces that come with commercial GIS and look more like cus-tomized, simplified application interfaces.They make use of standard tools such as
(pan the map to a new location, (zoom into a small area of the map view),(zoom out to a wider view), and (display attribute information about the
feature.The goal is to have the tools and buttons so self-explanatory that users canstart getting information from the database almost immediately with no training.Testing and serious user feedback is vital in designing these interfaces.There is atemptation to include too much space on the screen for identifying informationabout the organization (e.g., large names, logos, disclaimers, etc.), and too littlespace for actual map and data content.
No matter what programming language is being used for these Web interfacesor what GIS core software or database structure they are built around, they allwork in fundamentally the same way:
◆ When the user accesses the Web page through a browser, a default tem-plate page and the server sends a graphic map image to the clientbrowser.This page contains the software coding necessary to communi-cate with the GIS data server.
◆ The user clicks on the available options to modify the map and/or accesstools to query the map.There is often a list of layers like a legend thatcan be clicked on and off. Usually the available layers are predeterminedfor the user, and there is no opportunity to browse for new layers.Thesoftware in the local downloaded page takes the information and createsthe query in a format the server GIS data serving software will under-stand and be able to execute.
◆ The browser then sends that query command to the GIS data servingsoftware, which executes the query and sends back a new map image ifthe request was for a new map or a file containing attribute informationif the request was for data.
Every zoom, pan, or request for modification or data is a separate query andmust be sent across the network to the server, which returns either a new mapgraphic or data.There are some applications now that actually download spatialand attribute data and make the query on the local client machine.
These applications are becoming more and more common, particularly with organizations that have legal obligations to provide certain information tothe public. Organizations that implement these Web applications for routinequeries notice significant drop-offs in the number of clients who come directly to the organization for the same information over a counter.The service is often
229
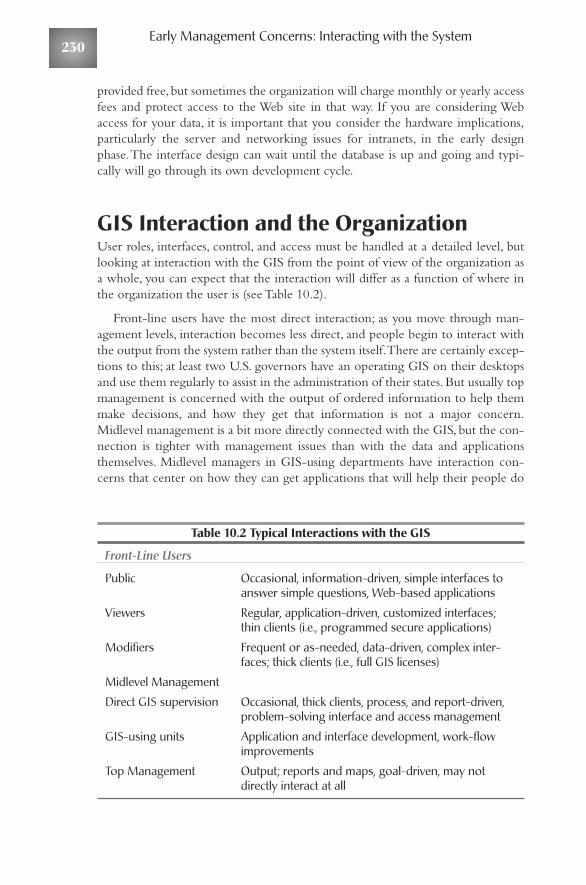
provided free, but sometimes the organization will charge monthly or yearly accessfees and protect access to the Web site in that way. If you are considering Webaccess for your data, it is important that you consider the hardware implications,particularly the server and networking issues for intranets, in the early designphase.The interface design can wait until the database is up and going and typi-cally will go through its own development cycle.
GIS Interaction and the OrganizationUser roles, interfaces, control, and access must be handled at a detailed level, butlooking at interaction with the GIS from the point of view of the organization asa whole, you can expect that the interaction will differ as a function of where inthe organization the user is (see Table 10.2).
Front-line users have the most direct interaction; as you move through man-agement levels, interaction becomes less direct, and people begin to interact withthe output from the system rather than the system itself.There are certainly excep-tions to this; at least two U.S. governors have an operating GIS on their desktopsand use them regularly to assist in the administration of their states. But usually topmanagement is concerned with the output of ordered information to help themmake decisions, and how they get that information is not a major concern.Midlevel management is a bit more directly connected with the GIS, but the con-nection is tighter with management issues than with the data and applicationsthemselves. Midlevel managers in GIS-using departments have interaction con-cerns that center on how they can get applications that will help their people do
Table 10.2 Typical Interactions with the GIS
Front-Line Users
Public Occasional, information-driven, simple interfaces toanswer simple questions, Web-based applications
Viewers Regular, application-driven, customized interfaces;thin clients (i.e., programmed secure applications)
Modifiers Frequent or as-needed, data-driven, complex inter-faces; thick clients (i.e., full GIS licenses)
Midlevel Management
Direct GIS supervision Occasional, thick clients, process, and report-driven,problem-solving interface and access management
GIS-using units Application and interface development, work-flowimprovements
Top Management Output; reports and maps, goal-driven, may notdirectly interact at all
Early Management Concerns: Interacting with the System230
A New Committee
work and how they can manipulate the organizational system to get the GIS tosupport their work.They may have a license for the software and even be skilledusers, but they are not daily producers of work from the GIS. Midlevel managersin GIS units themselves have direct responsibility for the database and the sup-ported applications, so their level of interaction is higher and covers lots of differ-ent types.
That daily interaction is between the front-line users and the GIS.This oftenoccurs through thin clients — small bits of programming or Web tools that per-form a small set of functions quickly. Front-line users who are data modifiers willprobably require thick clients, full software versions, because of their need formore functions and the ability to perform multiple tasks.Thin clients are for sim-ple tasks, and thick clients are for users who often need to be able to figure outdifferent ways to do things.
How different users and units of the organization interact with the GIS willchange with time. Users will discover new things they want the system to do, andunits that were not considered prime users of the system during design and imple-mentation will find that they want to be able to use it as well. GIS systems have atendency to work themselves into lots of areas in an organization where thedesigners originally did not think they would go. So the management of the inter-action with the system is an ongoing task. By the time most people in the organi-zation have some level of interaction with the GIS, the system begins to fade intothe background. It may have started out as a GIS in one or two units and was theirGIS. Then as units came together around the common database, it became thecorporate or enterprise GIS. If the growth of the interaction is managed well,eventually it becomes just the GIS or even the system, and it sits quietly and effec-tively behind the activities it was designed to support. Most people, except thosewho manage it, don’t think much about the information system that generatestheir paychecks. At least until it fails and they miss one. Eventually a GIS gets tothat level of transparency; it is just something that is there, reliable and helpful.
A New CommitteeDuring the design and implementation phases there was a working committee inthe organization that oversaw those elements of the process. Now that the systemis installed and operating, a new group must be established to deal with the ongo-ing development and maintenance issues. The first committee, if they did theirwork correctly, has worked themselves out of any tasks. The GIS managementcommittee has a different set of tasks. Specifically, it does the following:
◆ Sees that the training and applications development specified in theimplementation plan actually occurs. Users will be wary of the new sys-tem, and the committee will have to work with trainers and managers tomake sure that the users understand how to use it and what it can andcannot do for them.
231
◆ Functions as arbitrators and decision makers when conflicting claimsover data or access arise. Even the best design and implementationprocesses miss important things, questions nobody thought to ask before.This committee is the group that will answer those questions.
◆ Sees that the overall maintenance plan is followed, particularly withrespect to system evaluation.
The membership of this committee should have some overlap with the firstcommittee, but that overlap should not be total.You will need a mix of direct usersand management from the key GIS-using units in the organization on this com-mittee.The design and implementation process should identify the correct peoplefor this committee. It is important that there be as little a gap as possible betweenthe dissolving of the committee that oversaw the first parts of the process and theformation of the GIS management committee; too long a period of time andthere is no oversight.This is a new information system that affects many units ofthe organization, and there needs to be a formal structure, this committee, toaddress concerns.
A key responsibility of this GIS management committee is developing andoverseeing the maintenance plan for the system. Just like automobiles and trucks,there is regular maintenance that an information system needs to function well,and there needs to be a plan for that process.
EvaluationAt some point, preferably after users have become familiar with the new system,and the kinks, bugs, and so on, have mostly been worked out, it is time to conducta formal evaluation of the design and implementation process.This is a step oftenoverlooked, and if there is a general level of satisfaction with how the GIS hasworked out, the organization probably will not fall apart if this step is omitted.Sometimes top management, particularly those who might not have been thestrongest supporters, might insist on it. Here is where extravagant claims about thebenefits of GIS for the organization can come back to haunt you.A GIS manageronce was overheard discussing the needs for updates on the aerial photographyand planimetric information for the GIS with the chief budget officer of theorganization.As they were talking about how to fund it, the budget chief wantedto know how much they had saved from the 17 people they got rid of because theGIS was now doing their work. The manager had to quickly go back to theirstrategic plan for GIS and show the budget chief that no such claim had ever beenmade. But whatever claims were made in the planning process about how thistechnology was going to revolutionize the way the company does business andprovide almost immeasurable benefits to the company, at some time someone isgoing to want to evaluate the reality of those claims.
So the GIS management committee is going to have to conduct an evaluation;it is a fact of life. Programs and activities that consume significant resources in anorganization regularly get looked at to see if they are still returning value to the
Early Management Concerns: Interacting with the System232
Evaluation
organization. Nobody really likes to do it, but everyone accepts the necessity.There are several basic components to the evaluation of an enterprise GIS:
◆ Go back to the implementation plan and document whether or noteach of the implementation tasks was accomplished on time and onbudget and if not, why that was the case. Showing that the actual imple-mentation of the GIS followed the plan closely shows that your preim-plementation work was well thought out and executed.
◆ Survey the users and managers of the departments using the enterpriseGIS on their before and after impression of how work is being done.The GIS manager referred to previously had users estimate how manytimes they did certain tasks and how long, on average, it took them to dothe task. He did this before implementation of the GIS and then after-ward during evaluation. So he was able to document time and frustra-tion savings brought about by the GIS.All the other techniques ofsurvey research, such as interviews, focus groups, and so on, are usefulhere as well. If consultants were involved in any stage of the design orimplementation process, be sure to include questions about the level ofsatisfaction with their work.They love to hear that kind of feedback (orshould), and if it is positive, it validates the committee’s selection of thoseparticular consultants.
◆ Try to come up with some kind of summary time or money estimate ofhow the new system is paying off.
◆ Include copies of the routine and nonroutine output from the new sys-tem. It is possible that some individuals in upper management have notyet seen all the products that the system produces, especially the routinefront-line applications.
◆ Make sure you do not whitewash the system and be honest about whatshortcomings there are and how you plan to remedy them.The productdevelopment cycle is never-ending, and the results of the evaluation getfed right back into the planning for the next stage of development.
There are many other management issues around GIS and lots of printed andWeb-based resources to help GIS managers do their jobs better. But like any man-agement activity, sometimes the best sources of information on how to makethings work better is through personal contacts with people who are doing simi-lar things.The GIS community, at least in North America, is an amazingly open,helpful, and friendly community. Virtually every state and many metropolitanregions have some kind of formal or semiformal GIS organization that cuts acrossthe barriers of private/public/quasi-public GIS installations, different softwareusers, large installation, small installations, educational organizations, consultants,and software vendors.The software support sites are excellent places to get answersto specific questions about how to do certain things with your software and hard-ware.These organizations, or more accurately, the people in these organizations,are excellent places to get answers to more difficult management questions likeHow do I know I need to hire more technicians and how do I make a case for it?
233
or My staff is pressuring me for more staff development and training to improvetheir GIS skills, but my production demands are so great that I can’t really meetthose needs even though I have the financial resources.What do I do? Or a verycommon management question: I’m about to lose a key staff person to a better jobin a week.You just did a search; was there anyone in the pool you didn’t hire thatmight be able to do this job? It is likely that someone in that group has dealt withsimilar issues and can help.
So the management concerns and the product development cycle continue tomove forward.The next version of your chosen software is coming out in a fewmonths, and you have to decide if or when you are going to upgrade to that ver-sion.The new version is abandoning the 8-year-old proprietary scripting languageand going to use of COM-compliant programming language, and there will notbe readily available interpreters for the applications.Your server crashes.The net-work you thought was large enough to handle the data transfer volume youexpected doesn’t work quite as well as advertised. On the positive side, manage-ment loves the new map products you can produce and the speed with which youcan produce them. Every week brings a couple of new people down to the GISoperation (they to ask for some specialized product you hadn’t planned on butfind you can do without too much work).Three years have passed quickly, and itis time to start planning the next round of aerial photography, and there have beensuch advances in satellite technology that you need to deal with an entirely differ-ent set of questions this time around.These kinds of questions and concerns neverstop. Nor do they in any management activity that is centered on the rapidlychanging world of information technology.
A well-designed system is a flexible system. If you took the right amount oftime and spent the right amount of resources, more than you really wanted to ofboth, at the time they should have been spent, you should have a system that canadapt and still meet the organization’s need while adapting. Constant, plannedchange is the norm in GIS. The cycles never quit, and before you know it, theorganization and the people in it regard the GIS you labored so long and hardover as just another piece of the infrastructure. It has completely melted into thebackground of the support system of the organization and everyone takes it forgranted.That is really the goal: becoming so integrated with the day-to-day work-ing of the organization that its use is no more remarkable than using a spreadsheetor word processor. New York City calls theirs a GIS utility. It is back there work-ing, supporting the organization just like the water, sewer, and electrical powerutilities support our lives. Most people notice it only when it temporarily fails towork. If you get to that point, you have designed and implemented a successfulenterprise GIS.
Access ControlsOrganizations differ radically in how they control access to the geographic dataand applications they have created in their GISs. Some control access very tightlyfor reasons of confidentiality, security, and/or market concerns, and others opentheir entire databases and applications to everyone in the organization and even
Early Management Concerns: Interacting with the System234
Access Controls
the outside world. This variation in control extends within the organization aswell, with some units being very restrictive and others very open. So questions ofaccess control and data security need to be addressed.
Traditionally, the GIS community has been very open. Partly as a result of thattendency and to make it easier for people to use it,GIS software as it comes off theshelf has little security built in, other than from improper use of the software. Onewidely used software system allows you to put a password on a geographic datalayer, but that password is written into a text file that describes the project and isnot encrypted, almost no security at all. Because there is little security functional-ity in the core GIS software, you have to deal with access, control, and securityfrom within your computer operating system and the RDBMS you are using tomanage your enterprise GIS. Fortunately, both of these components of your sys-tem come with strong ability to manage access and security.Through the operat-ing system you can assign permissions to folders, directories, and individual files.Through the RDBMS you can control access to data tables and can lock peopleout from even viewing selected fields in individual tables.
Control through the RDBMSIf your data are stored on a centralized server, you control access through permis-sions granted to users and classes or groups of users when you set up their profiles.Because a GIS may have dozens of users and people come and go within an orga-nization, setting up access inside defined roles or groups within the RDBMS is asimpler method of control than controlling access on a person-by-person basis.When a new user is entered into the system, the administrator will attach the rolesthat person may assume.When people leave the organization, removing them asusers strips them of all roles and access ability. RDBMSs even have the ability totemporarily lock out users without deleting them from the entire system. In a localgovernment you might want to define a role of Property_Viewer, which wouldallow users to view, in map and table form, selected fields of a complex propertydatabase but not allow any modification or even querying of data other than tolocate a particular property through an address or PIN query. A simple interfaceattached to that role would allow only those queries, but the Property_Viewercould not query the database to find property based on the name of the propertyowner.That functionality could be reserved to a role of Property_Query. Roles areusually hierarchical. If, within the category of users that will be dealing with prop-erty data you have View, Query, Selective_Modifer, and Developer roles, each rolewill need the access privileges of the roles beneath it in the hierarchy.
The setup and modification of roles within a database are tasks that databaseadministrators are trained to do; it is really no different for geographic data accessthan for any other kind of data access within a database. Setting up the roles andthe access privileges is the responsibility of the GIS database administrator work-ing with the overall database administrator. Managers of the operational units thatneed the GIS will be helpful in defining the parameters of the roles that will sup-port their units, but the details of role creation are best left to database administra-tors rather than line managers.
235
Control through the Operating SystemAccess control through the definition of roles can be backstopped by access con-trols at the operating system level.These types of controls were present on the earlymainframe versions of GISs, became easier to manage with the advent of Unixoperating systems, and are now present in the versions of the various Windowsoperating systems.The notion of administrator at this level relates to the hardwarerather than the database. Roles and permissions work within the enterprise data-base, whereas operating system controls work within the pieces of hardware, (i.e.,the disk drives on the system). Although database administrators control access tothe database, machine administrators control access to the hardware on which thedatabase resides. Obviously, these people need to work with each other.Althoughrole assignment is a good way to control data access, permissions assignment is agood way to control application access. If you locate the applications that run yourGIS in folders where only certain individual users have permissions to execute pro-grams, only those users may run the applications. By denying them the right tomodify (write to) those files or directories, you disable their ability to change theapplication; that permission belongs to other users.This kind of control allows youto permit access to certain users during the testing of a new application and thenopen it to a wider set of users after you have worked out the problems.
If your data and applications reside on central servers, the control is also central-ized, but when you distribute data to users’ individual computers, control becomesmore difficult. All GIS software contains functionality to take in a data layer, per-form some kind of query on it, and then export that to be a new data layer. If usersaccess a data layer to which they have viewing access on a server and then create acopy of that data in a folder to which they have write access, they can then work onthat copy of the layer and do whatever they want to with it. Removing that func-tionality from all the users could be difficult if there are lots of users in the organi-zation. It is like a copying machine; you can control the initial access to thedocument, but unless you control access to the copying machine, it is difficult tostop users from copying the data and then distributing them to people who shouldnot have access.The only solution to this problem is completely limiting access tothe user’s desktop machine or removing the functionality to create copies of datawithin the core GIS software. Data are going to get out. Copies and partial copiesof data sets are going to be all over the place, and there is a real possibility that peo-ple will be making decisions and developing output from the copies instead ofusing the centralized, controlled data. If you distribute data across a network orthrough some physical medium like a tape or compact disk rather than serve it cen-trally, this problem will be worse, but it exists even if you control the data on a cen-tral server.Very sophisticated techniques are necessary to completely control theability of a user to copy data to a different location, but it can be done.
Controlling Public AccessFor organizations that used public money to develop their GIS, the issue of how to allow and control access by the public to the database and applications is
Early Management Concerns: Interacting with the System236
Controlling Public Access
important.This aspect of GIS data access frequently receives a lot of attention out-side the organization. Managers and administrators can tightly control who hasaccess to what within the organization and have a responsibility to do that tomaintain the integrity and quality of the data. It is not in anyone’s interest to allowunqualified people to modify data. Controlling the public’s access to the data ismore difficult. This discussion is separate from the question of what you cancharge for the information and deals only with what you have to make availableand how you do it. Any governmental organization has dealt with the concernsbefore, and the implementation of a GIS is only another step in this process ofmaking data accessible.All government’s agencies usually seek legal advice beforeestablishing public access policies, and if they do not, they certainly should.
There are a number of questions the legal department might ask the managersof the line units using the GIS about public access.The first important ones to askwhen deciding what data to make available are: Do you have to provide publicaccess to the information and/or applications? Is it a legal requirement? In the caseof most public data the answer is Yes, but there are constraints.You can deny accessfor certain purposes.A good example of this is the refusal of local school boards toprovide the addresses of the students in the school system. Lots of reputable mar-keters and politicians would love to be able to identify those homes with school-age children to market products or services to the parents or, in the case ofpoliticians, contact the voters in the household about their positions on education.Laudable as those purposes are, it would be rare for a school board to provide thatinformation because of the risk it could get into the hands of people with lesslofty goals. On the other hand, a state will willingly provide the list of individualswho obtained hunting or fishing licenses in a given year. In Connecticut, forexample, that list in a database format on a floppy disk will cost $14.00, and it willarrive in a week after a telephone request.
A simpler request, which is almost impossible for a public agency to deny, is therequest to view the data set, and local and state governments are moving rapidly toprovide map interfaces into their GIS databases across the World Wide Web.Because this is becoming so common, the question frequently arises early in thedesign phase, but it properly belongs in the management phase of the process. Ifthe database is well designed, it can be made available in an Internet or intranetapplication.Web-based access through browser software is the thinnest client youcan use to view the data. It can put information in the hands of a lot of peoplerather quickly. Private corporations, of course, have no legal requirement to makeviewing of their data available to the public because the public did not bear thecost of constructing the data sets.The decision of whether and how to allow pub-lic access is a business decision except around the information that state and fed-eral regulations require for publicly held companies.This information deals withthe company’s structure and financial well being and does not include proprietaryinformation in databases the company uses to create profit (i.e., a GIS database).
The management of access to a GIS database is a balancing act. On the onehand, you want to have as much data available to users as possible because the simple ability to view a wide range of spatial information may suggest new ideas.
237

Pre-GIS processes were stingy with spatial data because of the time and cost ofmaking the maps.When you can put it up quickly on a computer screen, peoplealmost immediately want to see more information and more layers because theycome up with new questions to ask. Generally this is a positive thing for an organi-zation, but you can go a little overboard and add so much information to a screenthat the clutter makes it very difficult to focus on the key issues.On the other hand,you can restrict access to only that information that was needed to do the jobbefore the GIS, having the GIS reproduce the exact process used before. If you takethat approach you lose the ability to consider new processes that might work bet-ter, but you gain the simplicity of an interface that relates directly to the task.Andusers vary widely in their ability to absorb and use spatial information. Some peo-ple do not relate well to maps and want to see their information presented only intabular form, whereas others enjoy and need to see the where as well as the what.Your applications need to be sensitive to the different ways people process infor-mation. Most, but not all, GIS practitioners are visual learners and are almost mes-sianic in diffusing their way of looking at the world. Some users will resist this aswell as the design of access to the database needs to meet their needs. Balancingbetween too little and too much information and meeting the needs of the visualusers and the nonvisual users creates interesting challenges, and how well you meetthose challenges is a key determinant to how successful your GIS will be.
Managing the System — The MaintenancePlanBefore implementation you should have prepared a strategic plan, a managementoverview of how and where GIS would fit in the organization, and an implemen-tation plan, a detailed process of how you are going to do it.You need to preparethose plans, in that order, before implementation.The third of the three plans, amaintenance plan, is no less important but can wait until after the GIS is function-ing.Table 10.3 shows the principal issues you need to treat in maintenance planfor your GIS.
Applications often need updating and maintenance as you get feedback fromusers about problems with the way it works or does not work.Additionally, if yourimplementation is phased, there will be new applications to develop. An agreed-upon schedule for development of applications in new units and the updating ormaintenance of existing applications is important so that all units in the organiza-tions feel that the GIS will work for them and no unit feels left out. Large GISimplementations typically will have dedicated staff for this task, and smaller onesmay outsource it to consultants.As users in GIS-using units get more familiar andskilled with it, they will be able to make concrete suggestions for improving theapplication and may even be able to do it themselves. Additionally, you will dis-cover applications that you originally did not plan to implement in the GIS butlater realize that it makes sense to do so. In the first few years after implementationthis aspect of maintenance will be particularly important, and you should budgetadequate resources.
Early Management Concerns: Interacting with the System238
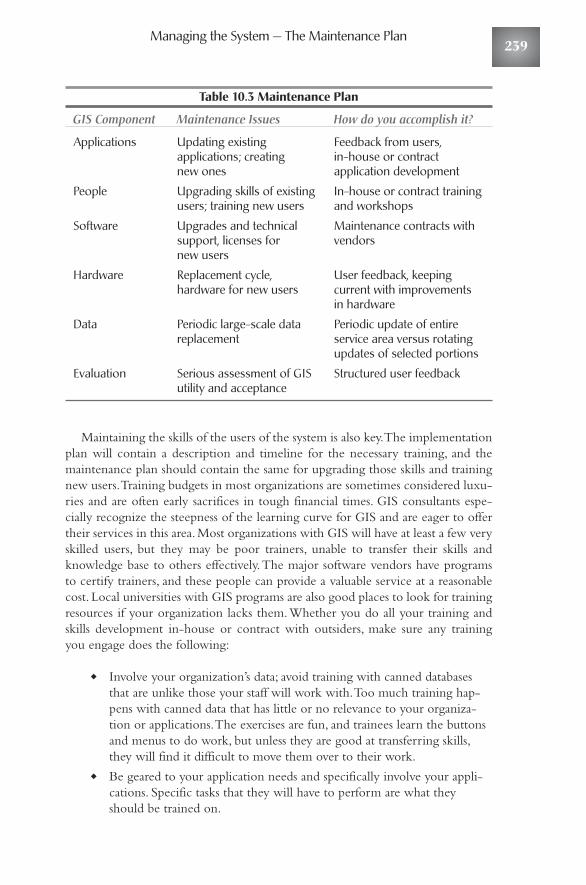
Managing the System — The Maintenance Plan
Table 10.3 Maintenance Plan
GIS Component Maintenance Issues How do you accomplish it?
Applications Updating existing Feedback from users, applications; creating in-house or contract new ones application development
People Upgrading skills of existing In-house or contract training users; training new users and workshops
Software Upgrades and technical Maintenance contracts with support, licenses for vendorsnew users
Hardware Replacement cycle, User feedback, keeping hardware for new users current with improvements
in hardware
Data Periodic large-scale data Periodic update of entire replacement service area versus rotating
updates of selected portions
Evaluation Serious assessment of GIS Structured user feedbackutility and acceptance
Maintaining the skills of the users of the system is also key.The implementationplan will contain a description and timeline for the necessary training, and themaintenance plan should contain the same for upgrading those skills and trainingnew users.Training budgets in most organizations are sometimes considered luxu-ries and are often early sacrifices in tough financial times. GIS consultants espe-cially recognize the steepness of the learning curve for GIS and are eager to offertheir services in this area. Most organizations with GIS will have at least a few veryskilled users, but they may be poor trainers, unable to transfer their skills andknowledge base to others effectively.The major software vendors have programsto certify trainers, and these people can provide a valuable service at a reasonablecost. Local universities with GIS programs are also good places to look for trainingresources if your organization lacks them.Whether you do all your training andskills development in-house or contract with outsiders, make sure any trainingyou engage does the following:
◆ Involve your organization’s data; avoid training with canned databasesthat are unlike those your staff will work with.Too much training hap-pens with canned data that has little or no relevance to your organiza-tion or applications.The exercises are fun, and trainees learn the buttonsand menus to do work, but unless they are good at transferring skills,they will find it difficult to move them over to their work.
◆ Be geared to your application needs and specifically involve your appli-cations. Specific tasks that they will have to perform are what theyshould be trained on.
239
◆ Be paced appropriately for your staff.The software vendors prefer to runmultiday training sessions either at your workplace or at their facilitybecause it minimizes travel and support costs for the trainers. But phasedtraining where the staff can get a section in a day or half a day, go backto the workplace to practice, and then return a week later for anotherday of training allows the necessary time for the material to sink in.
Most consultants who implement GISs for organizations will tell you that thereis great reluctance to spend resources on training.These systems are complex, andit takes a while to learn how to operate them, so some kind of plan to get staff upto speed on the GIS will yield significant dividends.
Software also requires maintenance. Initially, most people think GIS software islike word-processing software; you buy the most recent version out there, andwhen the update comes along you evaluate whether or not you need it and eitherdo or do not upgrade. Some GIS software is like that as well. But the core softwareused to construct and maintain the database is typically licensed rather than pur-chased, and you have to maintain up-to-date licenses to be able to use the soft-ware. There is an initial significant purchase, but that commits you to annualmaintenance fees, typically one-quarter to one-third the original purchase cost.Information systems or technology department staff are knowledgeable aboutsuch contracts and usually find them valuable largely because the contracts comewith technical support that the IT or IS department is not able to deliver.Additionally, it qualifies you for any upgrades or patches that come along whileyour maintenance contract is in force.Although software goes through a complexdevelopment and testing process before it is released to the public, it is cost-pro-hibitive to work absolutely every bug out of the system ahead of time. So justabout the time you are beginning to get used to the software version x.1, someimportant patch becomes available to fix some problems that have come up.Theymay not be problems that affect your organization, but you will need to budgettime and resources to install these upgrades and patches.This is an ongoing task,and although it is easy to ensure there are sufficient financial resources, it is alsoeasy to forget about staff resources that may be required for installation andupgrading.
Hardware maintenance and replacement cycles, along with software mainte-nance, are issues that organizations have been dealing with since computersbecame useful in business and government. Generally, GIS software and hardwarepresent no real new concerns. IT/IS people not familiar with GIS are often sur-prised at the storage requirements of GIS databases. As users start working withdata, keeping local copies, and trying out new things, the amount of data that willaccumulate is impressive. So it is a good idea to build in the purchase of additionaldata storage capacity in the maintenance plan. Even though the implementationplan might have recommended a certain amount of space, it has a way of filling upquickly.The need for some users to visualize the database requires a significantlyhigher investment in graphic processing and larger computer screens.The need forlarge-format output from plotters means more expensive output machinery,which should also be under maintenance contracts. Most organizations already
Early Management Concerns: Interacting with the System240
Managing the System — The Maintenance Plan
deal with this issue of maintenance contracts for important pieces of equipment,and GIS output equipment is just another example. Sometimes it makes sense toplace some computers under maintenance contracts, but in other cases it is moresensible to plan for a 3- to 4-year replacement cycle for the equipment.Maintenance contracts on the computers that actually serve the data are critical,however.
As we stated early, applications drive the entire process, and the data that sup-port the applications drive everything else. So the timeline and budgeting formaintaining the GIS database may be the most important element in a mainte-nance plan. Usually, at least 80 percent of the total cost of GIS development is inthe data, so it is reasonable to assume that a similar percentage of the maintenancecosts will go to the data as well.
Often a lot of the data development and conversion in the implementationprocess is done by consulting firms that deliver the newly formatted data fromlegacy databases so that it is more accessible to the GIS.Through normal, routineprocesses you make updates and modifications to that data. But sometimes youneed to reacquire significant pieces of the GIS database because they have gottenso far out of date. This is particularly true for GIS databases built on digitalorthophotographs and the capturing of the visible planimetric data from thosephotographs. For local, regional, and state government and most public utilitiesthis resource is a central part of the database, and there must be a procedure forreplacing it. There is a point at which the photography is so out of date that itbecomes difficult to make decisions based on it because no one has any belief thatit represents the real world anymore. So, your organization really has no choiceabout whether to update, just choices about how frequently and the spatial extentof updating.
Before GIS implementation most users of data gathered from aerial photogra-phy would update the entire service area on a 5- or 10-year cycle.The deliveredproducts were sets of negatives and photographic prints. Now the deliverableproducts are digital orthophotographs and vector information such as road center-lines, vegetation, fences, utility poles, and so on.You could draw new informationon the old photographs, but it was not very helpful. With GIS you will haveprocesses to add updates to the spatial information but not to the air photo. Soeventually you will have to reacquire photographic or satellite data to placebehind your other information. If your service area is large, it is possible to rotatedata acquisition around the area and spread out the total costs by reacquiring onlya portion of the service area each year. If your service area is small, however, youwill probably have to adopt a reacquisition policy that covers the entire area.Thefrequency of this reacquisition depends on how much change you are expectingin the region and what resources you have to devote to it.
As more organizations in your service area begin to use GIS and need this crit-ical resource, it becomes possible to leverage resources by having organizationsband together to reacquire the data. Utilities and municipalities cooperating onthis kind of data updates are common. There are even instances where utilitieshave contracted for the aerial photography and data acquisition and then make
241
the data available to other organizations in the region or state on a cost recoverybasis with no prior agreements.There are significant economies of scale in aerialphotography and the subsequent processing, so an organization that can afford up front to do it for its own purposes may be able to resell that information toother users.And as the satellite information gets better and more spatially detailed,more GIS users will migrate to that data source. It is even possible to adopt an update strategy of acquiring the expensive, highly detailed photographic infor-mation infrequently and updating it in selected areas with less-expensive, less-detailed satellite imagery. Being creative on how and when to update theexpensive elements of your GIS database can make a huge difference in its utilityto the organization.
Other GIS implementations may rely on updates from government agencies ordata vendors that enhance and resell that data. GISs that are built principally toroute deliveries or people need to ensure that every possible road segment withcorrect address ranges is in the database.Although a local government may be ableto get by with 5-year updates of aerial photography, a regional delivery or publicsafety organization may need quarterly updates of their database. It is dangerousand potentially very expensive from a liability perspective to have a service callcome to an ambulance dispatcher who is unable to find the address. Frequent andaccurate updating of this kind of layer in a GIS is absolutely vital, so you need toplan for it. Usually there are regular releases of this type of data.
The final part of a maintenance plan is a schedule and process for evaluating theGIS.Although among those who were advocating the GIS there may be a feelingthat it is meeting needs and everyone is completely satisfied with it, higher-levelmanagement may need more reassurances than that. Timing of an evaluation isimportant: too soon and people are not used to it, not rapid with their work, andstill tied to the pre-GIS way of doing things. Do the evaluation too late and theymay have forgotten the tedium of the tasks that the GIS has freed them from andbe complacent. Six months to a year after implementation is a good time to do anassessment of the system.This user and manager survey is also a good opportunityto get information on additional applications users might need, suggestions fortraining, additional data, and other aspects of the system.Evaluation is always a riskyactivity because there is a possibility that users are quite dissatisfied with the systemand how it was implemented. However, it is a necessary step and always part of thedevelopment cycle for a new or existing system.
Data Dissemination Ownership of GIS layers and feature data sets inside the organization is deter-mined by who needs to use the information and what kinds of roles and privilegesthey need to do their jobs; it is internal to the organization and driven by its needs.When ownership is examined from outside the organization, legal issues of copy-right, licensing, and access arise. If you separate issues of management from thoseof design and implementation, legal concerns are a management issue, complexand closely linked with legal issues around all kinds of information. But in thedesign process the legal concerns are simpler. If some state or local statute requires
Early Management Concerns: Interacting with the System242
Data Dissemination
that certain information be kept about geographic features, your database designneeds to include space for that information. Highway and engineering depart-ments are required to keep track of the road signage, where it is, what kind of signit is, when it was installed, and so on.Accident liability can be a significant cost fora government. These legal concerns in the design process, however, involve thedetails of the table and not organizational design.
Inside the OrganizationOne organizational issue that does have substantial legal implications is the estab-lishment of procedures to disseminate the GIS data, both within the organizationand outside it.Within the organization, decision-making users need to have timelyinformation that is adequate for their needs. If the organization fails to deliver thatinformation and a poor decision is made, there can be significant consequences forthe organization. Decisions on how to make the information available to all userswithin the organization need to come early in the design process because theyhave significant implications on network and database design and on hardware.There are many options for how to do this, but they all come down to suboptionsor mixes of the following options:
◆ Continuous, real-time interaction between the user and the database,which is maintained centrally.
◆ Regular updates of the entire database or portions of the database delivered to the users to reside on their computers. Delivery can bethrough a network or by some storage medium such as a CD orportable disk drive.
Choosing to have any real-time access for users (not maintainers who, ofcourse,will need direct access) strongly suggests that the unit responsible for main-taining the database be capable of maintaining not just the database but the hard-ware and software needed to make certain that this access is secure andcontinuous.These are not small issues, and it would almost require that your GISdatabase and most of its maintenance activities be located in an IS or IT depart-ment. If you select the regular update methodology of delivering data to users, theunit responsible for maintenance and distribution needs only the database and GISskills, and you avoid the problems of maintaining servers and networks for distrib-ution.The downside of this approach is that data are possibly of out of date by thetime users get it. If you are constructing a GIS database that changes infrequently,the physical distribution option makes more sense. A mixed approach wouldreplace the distribution by physical storage media such as a CD with automateddistribution over a network. In this hybrid situation, a unit that has the databaseand GIS skills maintains the database, and copies of the database or portion of itare transmitted to users over a network; the procedure would delete the existingdata and replace it with the newer data.This avoids problems of multiple users ormodifiers trying to access and work on a single database installed on a server. Insituations where users are widely separated and not on a single network, somekind of physical movement of data will be necessary.
243
Another internal distribution method to consider is through an intranet appli-cation.With Web programming it is possible to push data from a server to multi-ple desktop computers. Network administrators routinely update software across anetwork this way, and it can be used to move files as well. It is also possible to makethe data accessible to users on a Web site; this is an increasingly common way tomake geographic data available to the public, but it can be used within the organi-zation as well. If the access to data updates is simply made available and not physi-cally moved onto the user machines, you must rely on the users to obtain andinstall the data updates, and some will not.This creates the problem of some peo-ple and units working with older versions of the data.This can cause a lot of con-fusion, so any Web-based distribution needs to physically move and install the dataon the correct machines.
What is likely to happen is that there will be multiple means of making thedatabase available to the users and maintainers of the data.The details of exactlywhat data goes to what people how often is determined in the implementationphase, but a decision of how to distribute the data within the organization is animportant task in the design process. It determines how the GIS will mesh withwhat you need to do.
Outside the OrganizationIt does not matter whether you are a private business, a governmental organization,or a nonprofit; once you create a GIS database, someone else will want a copy of allof it or pieces of it, and you need to be prepared for how your organization willdeal with these requests.You will spend a lot of time thinking about this and doingit once you have figured out the process.This is actually part of the design processthat can wait because it does not become a concern until the database is imple-mented.After all, you cannot distribute data you don’t have. If your organization isa private business, your decisions appear to be simpler than if you are a govern-mental organization. If, as a private business, you develop geographic data sets thathelp you do your job and make profits, you do not have to provide copies of thatdata to anyone if you do not wish to. If you do decide to make them available, youcan put whatever price on it you want, and potential users will either purchase it ornot.What is increasingly common among for-profit GIS data providers is to licensethe use of the data rather than directly selling the information.The license agree-ment will specify what the licensee may and may not do with the data and whatthe responsibilities are of the licensor with respect to the data (e.g., delivery ofupdates, answering technical questions about the data).The data are actually deliv-ered, and the license buyer has a copy of them, but the use of the data is governedby the license agreement and, theoretically, if the user violates that agreement, thereare penalties, the data must be returned, and so on.The GIS data of a private firm isa product, and the firm may market it as it does any product.
In the public sector data distribution gets more complicated because publicmoney was the funding source for the development of the data. In the UnitedStates, under the Federal Freedom of Information Act and the state equivalents,
Early Management Concerns: Interacting with the System244
GIS Data Distribution through the World Wide Web
Open Records Acts, the public must get access to this information somehow.Theyhave a right to see the data and in many case a right to obtain copies of the data.The case law in this area is large and frequently changing, so legal advice is impor-tant before you start distributing data. After liability concerns, any organizationthat is distributing data, either by choice or necessity, is concerned with how toprice that data and who will bear the costs of distribution.There are three types ofcost structures in data distribution, whether or not it is geographic data:
◆ Profit making. Only private businesses may make money selling their data.Governmental units in the United States are not allowed to make aprofit on data sales.
◆ Cost recovery. This costing model requires the provider to calculate thecosts of building the data set and estimate the number of potential usersover the life of the data set, and by dividing the costs by the estimatedusers arrive at a cost per user.This would be what you would charge thebuyer. In Europe, governments are allowed to charge for data this way. Inthe United States it is more confusing, so you should definitely seek legalopinion before implementing a cost structure of this sort.
◆ Cost of duplication. It is clear that governments may charge for duplicationcosts and have been doing so with information for many years.You mayinclude staff time, pro-rated hardware and software maintenance, sup-plies, and clerical time to process the request. Some governments set upfees based on the size of the computer files or the medium the data arecopied to. For example, the USGS charges a set amount per compactdisk of data regardless of what is on the disk.
GIS Data Distribution through the World Wide WebOf course you can always make the decision to give your data away to anyonewho asks. Increasingly, organizations that take this approach to outside distributionof their data are using the World Wide Web to make their data available. There are hundreds of Web sites, mostly state and local governmental units, that maketheir data available to all users this way. It still requires staff time to set up the dis-tribution Web pages and to replace old information with updates, but it is a veryefficient way to distribute the data. If you choose to make your data availableeither on a fee basis or at no cost, there are some concerns you need to deal with:
◆ Metadata. Metadata should always be available for any information youplace on the Web. Ideally it should be incorporated directly into the dataor the file that the users will download rather than having a separatebutton they have to click to get the it. Distributing metadata along withthe GIS data is, by itself, a good thing to do, but the real reason youshould do this is to save the time it might take to answer the questions
245
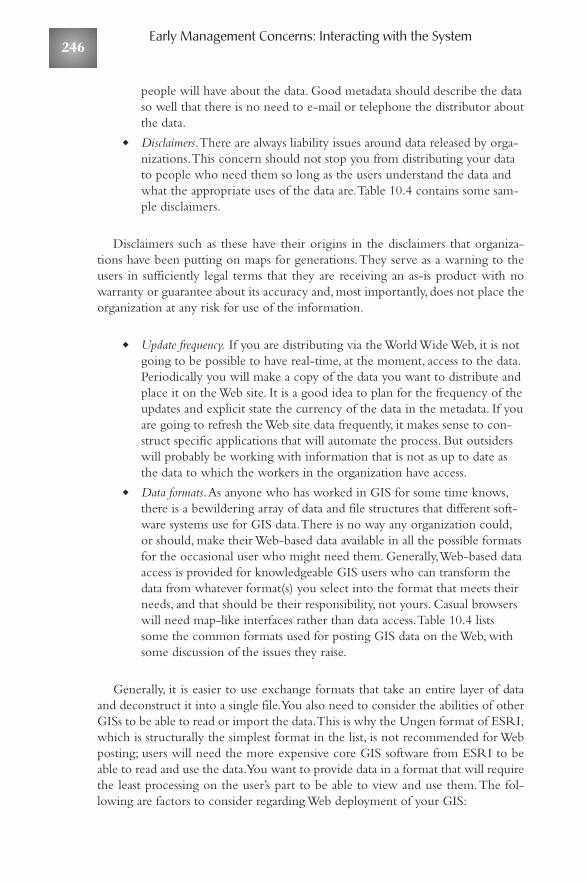
people will have about the data. Good metadata should describe the dataso well that there is no need to e-mail or telephone the distributor aboutthe data.
◆ Disclaimers.There are always liability issues around data released by orga-nizations.This concern should not stop you from distributing your datato people who need them so long as the users understand the data andwhat the appropriate uses of the data are.Table 10.4 contains some sam-ple disclaimers.
Disclaimers such as these have their origins in the disclaimers that organiza-tions have been putting on maps for generations.They serve as a warning to theusers in sufficiently legal terms that they are receiving an as-is product with nowarranty or guarantee about its accuracy and, most importantly, does not place theorganization at any risk for use of the information.
◆ Update frequency. If you are distributing via the World Wide Web, it is notgoing to be possible to have real-time, at the moment, access to the data.Periodically you will make a copy of the data you want to distribute andplace it on the Web site. It is a good idea to plan for the frequency of theupdates and explicit state the currency of the data in the metadata. If youare going to refresh the Web site data frequently, it makes sense to con-struct specific applications that will automate the process. But outsiderswill probably be working with information that is not as up to date asthe data to which the workers in the organization have access.
◆ Data formats.As anyone who has worked in GIS for some time knows,there is a bewildering array of data and file structures that different soft-ware systems use for GIS data.There is no way any organization could,or should, make their Web-based data available in all the possible formatsfor the occasional user who might need them. Generally,Web-based dataaccess is provided for knowledgeable GIS users who can transform thedata from whatever format(s) you select into the format that meets theirneeds, and that should be their responsibility, not yours. Casual browserswill need map-like interfaces rather than data access.Table 10.4 listssome the common formats used for posting GIS data on the Web, withsome discussion of the issues they raise.
Generally, it is easier to use exchange formats that take an entire layer of dataand deconstruct it into a single file.You also need to consider the abilities of otherGISs to be able to read or import the data.This is why the Ungen format of ESRI,which is structurally the simplest format in the list, is not recommended for Webposting; users will need the more expensive core GIS software from ESRI to beable to read and use the data.You want to provide data in a format that will requirethe least processing on the user’s part to be able to view and use them.The fol-lowing are factors to consider regarding Web deployment of your GIS:
Early Management Concerns: Interacting with the System246
GIS Data Distribution through the World Wide Web
Table 10.4 Samples of Disclaimers
California State Lands Commission:March 12, 1995 This data has not been approved by the California State LandsCommission and does not constitute an official map or dataset from such com-mission, nor does this data establish the boundary lines of any state ownedlands depicted there- on. This data is in preliminary form only and is subject tochange without notice. The California State Lands Commission makes no repre-sentation or warranties with respect to the contents hereof and specifically dis-claims any implied warranties of merchantability or fitness for any particularpurpose. The name of the California State Lands Commission may not be usedin advertising or publicity pertaining to distribution of the dataset without spe-cific, written prior permission.gis.slc.ca.gov/slcgis/data/disclaimer.asp
Federal Communications Software, on its GIS page:The Commission makes no warranty whatsoever with respect to the software. Inno event shall the Commission, or any of its officers, employees or agents, beliable for any damages whatsoever (including but not limited to, loss of businessprofits, business interruption, loss of business information, or any other loss)arising out of or relating to the existence, furnishing, functioning or use of thesoftware.uls-gis.fcc.gov/
Institute of Water Research, Michigan State University:The Institute of Water Research is NOT responsible for the accuracy of all dataavailable in this web site. All data were converted from original sources toArc/Info(c) “coverage” format and projected to the same coordinate system. Alldata are provided “as is” and without warranty of any kind. The Institute ofWater Research will NOT distribute any data available in this web site. Please doNOT request any data. However, any comments and suggestions are welcome.gis.iwr.msu.edu/gisdisclaimer.html
Nashville Planning Department:The Nashville Planning Department of The Metropolitan Government ofNashville and Davidson County presents the information on this web site as aservice to the public. We have tried to ensure that the information contained inthis electronic document is accurate. The Planning Department makes no war-ranty or guarantee concerning the accuracy or reliability of the content at thissite or at other sites to which we link. Assessing accuracy and reliability of infor-mation is the responsibility of the user. The Planning Department or TheMetropolitan Government of Nashville and Davidson County shall not be liablefor errors contained herein or for any damages in connection with the use ofthe information contained herein.nashville.org/mpc/disclaimer.html
Camarillo, Calif.:GIS maps created by the City of Camarillo Geographic Information System, aredesigned for the convenience of the City and related public agencies. The Citydoes not warrant the accuracy of these maps, and no decision involving a risk ofeconomic loss or physical injury should be made in reliance thereon.2.ci.camarillo.ca.us/govt/legal.html
247

Early Management Concerns: Interacting with the System248
◆ Interface design. If you have ever cruised the World Wide Web looking forgeographic information for a project, you will appreciate the differentinterfaces people have developed for data access. Some clearly work bet-ter than others, and some seemed designed to hide the data rather thanmake it easy to find. Organizations are usually quite sensitive about howthey present themselves to the world through the Web, and a well-designed interface is important. For the liability-conscious it is not diffi-cult to place disclaimers in the interface so that the user has to click toget by the disclaimer, thereby registering and documenting that theyhave seen the disclaimer.This is just like the many license and use agree-ments that are on the Web for software and other services; most peopledon’t read them and just click by.They are the Web equivalent of thefine-print product information on packages and are a good idea.
◆ Provide an image of the data or not. It is common, but not universal, forproviders to supply a graphic image of what the data will look like oncethey are imported into a GIS or mapping program.This is a nice service,but it adds another layer to the interface. For example, if you choose tomake metadata available and two different formats for the data and agraphic image of the mapped data, you will need at least four separate filesfor each layer. If you update frequently, this can lead to significant work.
◆ Compression technology. Fortunately, file compression has become so stan-dardized and the software much better that there are not many decisionsto make. Because most GIS layers tend to get very large, it is almostessential to compress the files before placing them on the Web.Compression also allows you to assemble multiple files, if your formatrequires it, and the image and metadata into a single file so that whenthe user clicks on the download button, the entire package will be trans-mitted.With the widespread diffusion of the WinZip compression utility,most PC users are using that compression program to zip, or compress,files and folders. Unix users have a slightly different set of compressionutilities, but the WinZip decompression program recognizes and can dealwith that type of compression. Compression is necessary to move largeamounts of data around the Web, but frequently a user will be using aparticular Internet provider that has restrictions of the size of files it willallow you to receive.
◆ Alternate means of distribution. Some people who will need your data maynot have Internet access or their access is not adequate to deal with thevolume of data they may need. For those people you will need an alter-nate means of distribution. Many public organizations provide the dataat no cost on the Web but charge distribution costs for data that must beprepared on CD, disk, or tape.This is also the process adopted by severalcommercial distributors of data; people who wish to wait and do thework themselves can do it free, but if you want the company to copyand send you the data, there will be a charge. Compact disk is becomingthe standard format for that kind of distribution because the technologyto copy disks has become so inexpensive.

Tabl
e 10
.5 D
ata
Dis
trib
utio
n Fo
rmat
s
Res
ults
of S
earc
h on
D
ata
Form
ats
File
Str
uctu
reIm
port
Con
cern
sG
oogl
e (5
/8/0
2) (i
n 00
0s)
Sear
ch T
erm
Aut
ocad
DXF
Sing
le fi
leTo
polo
gy m
ust b
e re
cons
truc
ted
368
.dxf
afte
r im
port
; all
GIS
s w
ill im
port
; m
any
free
vie
wer
s av
aila
ble.
ESRI
sha
pe fi
les
(.shp
)M
ultip
le fi
les,
at le
ast 3
Man
y G
ISs
will
impo
rt.
240
.shp
ESRI
exp
ort (
.E00
)Si
ngle
file
Mus
t hav
e im
port
sof
twar
e;
107
.e00
dist
ribut
ed w
ith a
ll ES
RI s
oftw
are
prod
ucts
, inc
ludi
ng fr
eew
are.
ESRI
cov
erag
eM
ultip
le fi
les
and
fold
ers;
N
eed
ESRI
sof
twar
e to
read
; com
plex
N
o se
arch
not r
ecom
men
ded
file
stru
ctur
e; u
se .E
00.
ESRI
Ung
en (A
SCII
text
, Si
ngle
file
Nee
d co
re E
SRI s
oftw
are
to re
ad;
40U
ngen
unge
nera
ted
cove
rage
)to
polo
gy m
ust b
e re
cons
truc
ted
afte
r im
port
.M
apin
fo In
terc
hang
e Si
ngle
file
Mos
t, no
t all,
GIS
s 7
.mif
and
Form
at (M
IF)
will
impo
rt.
map
info
Map
info
tabl
esM
ultip
le fi
les
Not
reco
mm
ende
d, e
ven
for
No
sear
chex
chan
ge w
ith M
apin
fo
inst
alla
tions
; use
MIF
.Sp
atia
l Dat
a Tr
ansf
er
Mul
tiple
file
s; c
ompl
ex
All
GIS
s ca
n re
ad b
ut n
ot m
ost
110
SDTS
Stan
dard
(SD
TS)
nam
ing
syst
emin
expe
nsiv
e vi
ewer
sys
tem
s.D
igita
l lin
e gr
aph
Sing
le fi
lePr
eser
ves
topo
logy
; all
GIS
s ca
n 23
8D
LG(U
SGS,
DLG
)im
port
and
exp
ort;
mos
t ine
xpen
sive
vi
ewer
ver
sion
s ca
nnot
.To
polo
gica
lly In
tegr
ated
M
ultip
le fi
les;
com
plex
M
any
free
vie
wer
s av
aila
ble.
51Ti
ger a
nd G
ISan
d G
eogr
aphi
cally
na
min
g sy
stem
Enco
ded
Refe
renc
e Sy
stem
(U.S
. Bur
eau
of
the
Cens
us, T
IGER
)
249
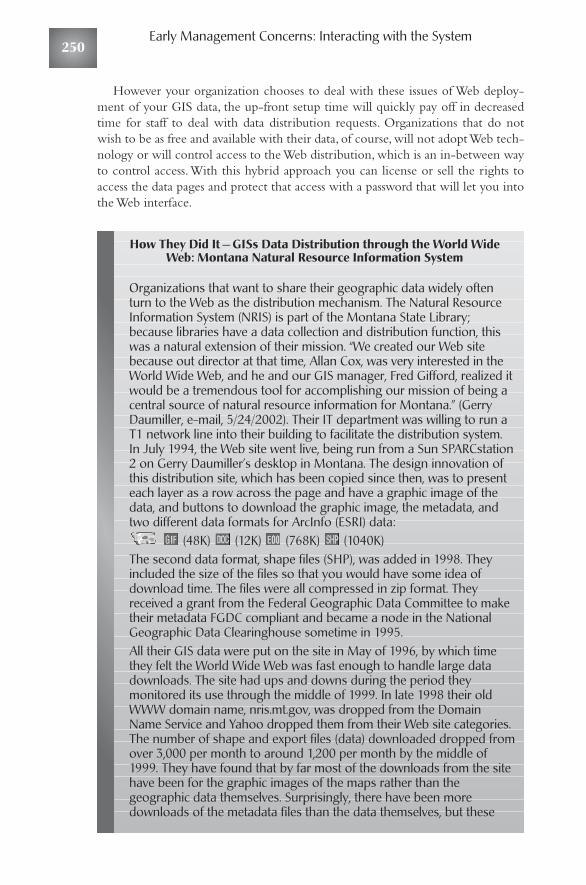
However your organization chooses to deal with these issues of Web deploy-ment of your GIS data, the up-front setup time will quickly pay off in decreasedtime for staff to deal with data distribution requests. Organizations that do notwish to be as free and available with their data, of course, will not adopt Web tech-nology or will control access to the Web distribution, which is an in-between wayto control access.With this hybrid approach you can license or sell the rights toaccess the data pages and protect that access with a password that will let you intothe Web interface.
Early Management Concerns: Interacting with the System250
How They Did It — GISs Data Distribution through the World WideWeb: Montana Natural Resource Information System
Organizations that want to share their geographic data widely oftenturn to the Web as the distribution mechanism. The Natural ResourceInformation System (NRIS) is part of the Montana State Library;because libraries have a data collection and distribution function, thiswas a natural extension of their mission. “We created our Web sitebecause out director at that time, Allan Cox, was very interested in theWorld Wide Web, and he and our GIS manager, Fred Gifford, realized itwould be a tremendous tool for accomplishing our mission of being acentral source of natural resource information for Montana.” (GerryDaumiller, e-mail, 5/24/2002). Their IT department was willing to run aT1 network line into their building to facilitate the distribution system.In July 1994, the Web site went live, being run from a Sun SPARCstation2 on Gerry Daumiller’s desktop in Montana. The design innovation ofthis distribution site, which has been copied since then, was to presenteach layer as a row across the page and have a graphic image of thedata, and buttons to download the graphic image, the metadata, andtwo different data formats for ArcInfo (ESRI) data:
(48K) (12K) (768K) (1040K)The second data format, shape files (SHP), was added in 1998. Theyincluded the size of the files so that you would have some idea ofdownload time. The files were all compressed in zip format. Theyreceived a grant from the Federal Geographic Data Committee to maketheir metadata FGDC compliant and became a node in the NationalGeographic Data Clearinghouse sometime in 1995.All their GIS data were put on the site in May of 1996, by which timethey felt the World Wide Web was fast enough to handle large datadownloads. The site had ups and downs during the period theymonitored its use through the middle of 1999. In late 1998 their oldWWW domain name, nris.mt.gov, was dropped from the DomainName Service and Yahoo dropped them from their Web site categories.The number of shape and export files (data) downloaded dropped fromover 3,000 per month to around 1,200 per month by the middle of1999. They have found that by far most of the downloads from the sitehave been for the graphic images of the maps rather than thegeographic data themselves. Surprisingly, there have been moredownloads of the metadata files than the data themselves, but these
Summary251
requests were dwarfed by the number of people who just wanted astatic map.This distribution Web site demonstrates some of the problemsorganizations encounter when they try distributing over the Web. First,access depends pretty much on how easily search engines on the Webcan find you. When Yahoo dropped the site from its map page, thenumber of requests dropped dramatically. Second, it may not be thedata themselves that people are interested in. In this Web site thegraphic map files are much more popular than the data. It appears thatmost casual users have needs for maps to drop into documents but donot want to or are unable to manipulate a GIS to visualize the data. Acommon complaint among people who manage these Web sites is thenumber of e-mails and telephone calls they have to answer to explainwhy a map does not just pop up on the screen when they click on thedata button. Third, these distribution systems seem to have a life cycleof ecstatic initiation, when the organization and managers monitor thesite and watch its popularity grow to maturity and when they stopupdating the site and monitoring its usage.
SummaryAn enterprise GIS is a complex and dynamic thing. Like an automobile or ahouse, favorite metaphors for a GIS, it will need careful design and construction,regular maintenance, and occasional significant overhauls and improvements. Justas a 20-year-old kitchen begins to look a little worn and not work as well as itused to, a 4-year-old GIS is beginning to show signs of age. Users will come andgo with special needs and skills, and there will be constant new sources of data.Assoftware and computer processors improve, GIS may even move away from its tra-ditional flat map interface, and viewers may interact with something that lookslike an oblique aerial view of the area of interest that they can move around andquery. Staying at the cutting edge or just behind it, which is a safer location, ofthese changes in technology and data requires a lot of hard work, but the rewardsare significant.You can do routine work more rapidly, so the cost-benefit ratios inGIS usually work out reasonably well. If your GIS is well designed, flexible, andinviting, the most significant changes that it will bring to your organization are thenew questions people can now ask and the new ways of looking at the organiza-tion and the information that drives it. A GIS is an empowering and integratingtechnology, and almost all organizations that have developed enterprise GISs areglad they did it and appreciate the amount of work it required.Always rememberthat the database is at the core of your GIS. However cleverly you have designedyour applications and interfaces, without useful data behind them, they give youno assistance in making decisions. Keep that core of your GIS in good shape andyou can always work out the inevitable and never-ending technological and orga-nizational concerns that will get in your way.
Like the organizations whose missions they support, all enterprise GISs are dif-ferent; off-the-shelf solutions always require some modifications and improve-ments. But there are consistencies in the process of design, implementation, and

management that the organization must address if their GIS is to do what it is sup-posed to do.We hope this book has assisted you in identifying issues and will helpyou work through them as you design and implement your enterprise GIS.
ADDITIONAL READING
Mark, D. M., and A. U. Frank. 1992. User Interfaces for Geographic InformationSystems: Report on the Specialist Meeting — Report 92-3. National Centerfor Geographic Information and Analysis: Buffalo, NY.ncgia.ucsb.edu/Publications/Tech_Reports/92/92-3.pdf.
Early Management Concerns: Interacting with the System252
AAbsolute accuracy, 104Absolute location, 85Access controls, 225, 234–238Accuracy:
absolute, 104across layers, 110–111of database information, 5of data layers, 33with GPS, 107–108map-level, 104–106positional, 103relative, 103–104in spatial data, 103–106, 110–111submeter, with RTK GPS, 110surveying-level, 104of topographic maps, 156for utility layer, 173
Address matching, 22Address repository, 141Adjacency, storing relationships of,
85–86Administrators:
as end-users, 19involvement of, in planning process, 14
Aerial photography, 148–161capture data, 155–157color vs. black and white, 150–151completeness of data from, 107ground resolution, 153–154number of required photographs/tiles,
155planimetric features in, 155–156scale of, 151–152topographic features in, 156users of, 158–161using digital orthophotographs from,
157–160
Albers Equal Area projection, 114Alpha testing (software), 184Alternate routes, creation of, 90AML, see Arc Macro LanguageAnalogue overlay, 79Analytical hill shading, 98–100Annual updates, 35Applications:
design of, 140–144determination of, 21–24digital background data for, 147–148as GIS component, 3maintenance of, 238
Application developer role, 217, 223–224ArcEditor, 190ArcGIS, 188Archive years feature, 31ArcInfo, 122, 186, 188, 190Arc Macro Language (AML), 66, 186Arc-node topology, 86ArcView, 185, 188, 190Areal features, see Polygon featuresAspect, 98–101Attribute data design, 24, 127–144
application design, 140–144D tables fields, 133–137general principles governing tables,
129–131G tables, 131–132input elements, 137–138map design, 139–140output elements, 138
Attribute data modifier role, 203, 218,222–223
AutoDesk, 185, 186, 188AutoLISP, 186Automatic numbers, 134Azimuthal projections, 116
INDEX
253
BBack-end database, 38, 169–170Background polygons, 88Background visual information, 147–167
from aerial photography, 148–161questions before incorporating, 166from remote sensing, 161–167
Backups, 199Bandwidth, 198Base stations, GPS, 109–110Below-ground attributes, 174Benchmark tests (for software selection),
193Benefits of GIS, 39–41Beta testing (software), 184Binary large objects (BLOBs), 134, 135Bits, 196Black and white aerial photography,
150–151BLOBs, see Binary large objectsBuild-out analyses, 15Bureau of Land Management, 62Bytes, 196
CCAD (computer aided design), 79California State Lands Commission, 246Camarillo, Calif., 247Cardinality, 51CASE tools, 47Centralization of functions, 211Centralized data repositories, 170Central meridian, 117Central processing unit (CPU), 194Chain-node topology, 86–91Chains, SDTS, 95Champions, 17Checkpoints, 9Citizens (as end-users), 20Classes, object, 82Clients, thin vs. thick, 231Client-server architecture, 171, 197–199Collaboration, viiColor aerial photography, 150–151Color resolution, 151Command line functionality, 226Committees:
coordinating, 206–208management, 231–232
Competition, 15Complaint tracking, 22
Index254
Completeness:of GIS data, 33, 35of spatial data, 106–107
Complexity, enterprise GIS and, 6Complex topologic relationships, 91Component licensing (software), 190Compression:
for image files, 158for Web GIS deployment, 248,
250Computers, 193–200
central processing unit, 194and digitizing, 176hard drives, 194maintenance of, 240–241memory, 195networking issues, 195–200operating systems, 194
Computers, maintenance contracts on, 241
Computer aided design (CAD), 79Computer assisted software engineering
(CASE) tools, 47COM technology, 187, 190Concurrent software licenses, 190Conferences, GIS user, 14–16Confidence level, 104, 174Conflicts, data, 200Conformal projections, 116Connections (to spatial feature), 33Connectivity:
for line topology, 90for polygons, 86
Connect to feature, 31Consistency of output, 5Consultants:
for data conversion, 179for design/planning work, 206for implementation, 192maintenance contracts with, 225during planning stage, 16
Content Standard for Digital GeospatialMetadata, 61–62
Contour lines, 99–101Controls, access, see Access controlsCoordinate system, 113–115Coordinating committee, 206–208Core technology, GIS as, 21Corporate GIS, 1. See also Enterprise GISCost(s):
of aerial photography, 150centralization of, 5–6
Index 255
of data conversion, 179data distribution, 245of GIS implementation, 38–41relationship of accuracy to, 104
Cost-benefits analysis, 38–41Cost of duplication data distribution, 245Cost recovery data distribution, 245Coverage file format, 84, 170Cowan, David, 10Cox,Allan, 250CPU (central processing unit), 194Culture of organization, 211Customization:
of desktop interfaces, 226–228of software, 186–187
DData:
attribute, 127completeness of, 33, 35dissemination of, 243–251evaluating existing, 24–34as GIS component, 3–4layers of, 24–28replicated, 199–200SDTS types, 91–92spatial, 127types of, 24updating of, 241–242
Databases. See also Database schema designback-end, 38enterprise GIS and integrity of, 5as gathering point for different units, 5layer vs. object representation in, 78–79for metadata creation, 66–67object-oriented, 80–84tables in, 128–129tuning, 122–123
Database administrator (DBA), 217, 224,235
Database development cycle, 217Database management systems, 224–225Database schema design, 47–67
data dictionary, 48, 50–51elements in, 47–49example of, 53–60metadata creation, 60–67tables and relationships, 51–53
Data development and conversion plan,171–180
automation process, 172–175choosing data for, 179
digitizing, 176–177in-house vs. out-sourced conversion,
178–180inventory of source materials, 171–172optical character recognition, 177–178photogrammetric data capture, 175–176pilot project to test, 180
Data dictionary, 48, 50–51Data flow design, 214–216Data maintainers, frequency of use by, 21Data models:
choosing mix of, 69–72combinations of, 76–78purpose of, 74–75quad tree, 76raster vs. vector, 73–78
Data owners, 21Data types, attribute, 133–134Daumiller, Gerry, 250DBA, see Database administratorDecentralization of functions, 211Decimal longitude and longitude,
113–115Decision-making users, 203Delaunay triangles, 100DEMs, see Digital elevation modelsDepartments:
data layer analysis by, 31ranking usage by, 31–33
Design and implementation process:for enterprise GIS, 6–8evaluation of, 232–234staffing, 206–208
Designers, strict vs. loose constructionist,48
Desktop, 196, 226–228Developable surfaces, 115Development cycle, database, 217Differential GPS (DGPS), 109–110Digital elevation models (DEMs), 98–100Digital orthophotographs, 148, 149, 152,
156–160Digital terrain models (DTMs), 98–99.
See also Digital elevation modelsDigitizing, 176–177Direction-finding Web sites, 228–229Director (as end-user), 18–19Disclaimers (for Web data), 246–247Dissemination of data, 243–251
inside the organization, 243–244outside the organization, 244–245through World Wide Web, 245–251
Distributed architecture, 170Distribution (for Web GIS deployment),
250Documents, 24
for enterprise GIS design/implementation, 6
final data analysis for, 33historic, 33
Documentation:for metadata, 64of source materials, 31
Document imaging, 172Document retrieval, 18Domain, 135Double-precision data storage, 115D tables, 130, 131, 133–137DTMs, see Digital terrain modelsDublin Core, 60, 64–65Dynamic segmentation, 96
EEastings, false, 117, 121Education. See also Training
about possible GIS functions, 18in planning process, 15–16
Elevation, 98–101Enterprise GIS, 1, 4–8
benefits of, 4–6evaluating need for, 6evaluation of, 233–234single-unit/project-oriented
GIS vs., 4–6steps in design/implementation of, 6–8strategic plan for, 9, 11–12
Environmental Systems Research Institute(ESRI), 83–84, 91, 185, 186, 188,190, 246
Equal-area projections, 116Equidistant projections, 116ERDAS, 188ESRI, see Environmental Systems
Research InstituteEvaluation team (software), 190Exclusive coverage, 121Exhaustive coverage, 121Expandability (of software), 189Expectations, managing, 16Experience, conversion, 179Extensible Markup Language (XML), 60External professionals (as end-users),
19–20
Index256
FFalse eastings/northings, 117, 121Farrell, Bill, 212, 213Features. See also specific types
geographic, table links for, 48mixing types of, 51in raster vs. vector models, 75–76representations of geographic, 84–85SDTS types, 92spatial, connections to, 33
Federal Communications Software, 247Federal Geographic Data Committee
(FGDC) standards, 60–64, 66Fences, property lines vs., 173FGDC standards, see Federal Geographic
Data Committee standardsFields:
in D tables, 133–137in G tables, 131–132names, 130–131types of, 131
File compression, 158Floating-point data, 115Floating software licenses, 190Foreign keys, 132Formats, disclaimers for, 246–247Forms, input, 137–138Freedom of Information Act, 244–245Front-line users, 230, 231Functionality (software), 186–188
GGeodatabase, 84, 91Geographic features:
links to tables of, 48representations of, 84–85
Geographic information system (GIS), 1applications component of, 3construction of, 83–84data component of, 3–4duplication in, 4enterprise, 4–8hardware component of, 4hybrid, 225people component of, 3schedule for evaluating, 242single-unit/project-oriented vs.
enterprise, 4–6software component of, 3–4strategic plan for, 6, 9–12
Geo-relational model, 83–84, 91
Index 257
Geospatial data addressing standard,141–142
Gifford, Fred, 250GIS, see Geographic information systemGlobal positioning systems (GPSs),
107–109“Going forward,” 33Governments:
aerial photography by, 148data updates for, 242GIS as agency integration technology,
24municipal, GIS for, 4–5public access policies of, 237
GPSs, see Global positioning systemsGraphical user interface (GUI), 186, 226Graph theory, 89Grid model, see Raster data modelGround resolution (aerial photographs),
153–154Ground stations, GPS, 109G tables, 130–132GUI, see Graphical user interface
HHard-copy documents, organizing data
from, 172Hard drives, 194Hardware, 193–200
central processing unit, 194and digitizing, 176as GIS component, 4hard drives, 194maintenance of, 240–241memory, 195networking issues, 195–200operating systems, 194
Head-down digitizing, 175–177Heads-up digitizing, 177Hedgerows, 173Heerman, Jay, 142Hill shading, 98–100Historic data, 33HTML (hypertext markup language), 60HTTP protocol, 198Hubs, 197Hybrid GIS, 225Hyperlinks, 134, 135Hypertext markup language (HTML), 60Hypsography, 98
IICA protocol, 198Identifiers, table, 129Idrisi, 188Images:
compressed, 158storage of, 158for Web GIS deployment, 248
Imaging, document, 172Implementation plan, 6
data development and conversion,171–180
development of, 41–46hardware, 193–200software, 183–193
Incident mapping and tracking, 23Indexing (of spatial data), 121–123Index tables, 135–136Information technology (IT) department,
9, 210Infrared photography, 150Inherited object properties, 82In-house data development/conversion,
178–179Initial costs (of GIS implementation),
38–39In-office Kiosk terminal, 20Input elements (attribute data), 137–138Inspectors (as GIS users), 17–18Institute of Water Research, Michigan
State University, 247Integration technology, GIS as, 24Integrity, database, 5Interaction with system, 217–252
access controls, 234–238as application developer, 223–224as attribute data modifier, 222–223data dissemination, 243–251design/implementation process evalua-
tion, 232–234form organization viewpoint, 230–231as GIS database administrator, 224GIS management committee, 231–232maintenance plan, 238–242managing desktop interfaces, 226–228managing user roles, 224–226managing Web-based interfaces,
228–230as spatial data modifier, 220–222as viewer, 219
Interfaces:desktop, 226–228web-based, 228–230for Web GIS deployment, 248
International Organization for Standardization (ISO) standards, 64
International Standard Book Number(ISBN), 64
International standards, metadata, 60–61,64–65
Internet:GIS interaction via, 228as user benefit, 20
Internet browsing software, 228Internet Protocol (IP), 197Internships, GIS, 179Interviews (for software selection),
192–193Intranets:
data dissemination via, 244GIS interaction via, 228
Inventory (of source materials), 171–172IP (Internet Protocol), 197ISBN (International Standard Book
Number), 64ISO standards, 64IT department, see Information technol-
ogy department
KKansas, 141–142Katz, Sol, 66
LLand parcels, 69–72, 74–75
automating, 172–173and geospatial data addressing standard,
142Landsat Multi-Spectral Scanners, 163LANS, see Local area networksLate adopters (software), 184–185Latitude of origin, 117Layers:
accuracy across, 110–111accuracy required for, 33objects vs., 78–80, 83–84ranking of, 25remotely sensed images as, 166–167security with, 225update frequency for, 35–36
Leidner,Alan, 160
Index258
Licensing:of GIS data, 244–245maintenance fees for, 240software, 189–190for tool development software, 227
Light detection and ranging (LIDAR),156–157, 162
Linear features, 94hierarchical component to, 91SDTS, 92, 94topology for, 90
LISP (List Processing), 186Local area networks (LANs), 196–197Locating data, 22Location:
absolute vs. relative, 85of GIS, 208–214from GPS, 107–109as key object property, 80–81for transportation planning, 96
Locational accuracy standards, 107Location-allocation, 90Loose constructionist designers, 48
MMailing list generation, 22Maintenance:
of data in GIS, 35–36relationship of costs to, 39of software products, 37
Maintenance plan, 6, 238–242Maintenance tracking and inventory, 23Management:
of desktop interfaces, 226–228of user roles, 224–226of Web-based interfaces, 228–230
Management committee, 231–232Managers:
education/support/commitment of,15–16
as end-users, 18–19interaction with GIS by, 230–231involvement of, in planning process, 14in planning process, 13–14
Mandatory relationships, 52Many-to-many relationships, 51–53Maps:
accuracy standards for, 104–106design of, 139–140source numbers for, 171–172
Mapinfo file format (MIF), 170
Index 259
Map-making Web sites, 228–229Mapping:
from aerial photographs, 148layers for, 78users of, 17vector data model for, 75
Map projections, 111–121characteristics of, 115–116decimal longitude/ latitude vs.,
113–115for large areas, 117, 119–121spanning existing zones, 116–118terminology related to, 112–113
Map templates, 139–140Master address table, 141–142McHarg, Ian, 79Memory, computer, 90, 195Metadata:
creation of, 60–67for data on Web, 246standards for, 60–66tools for, 66
Microsoft, 188Microsoft Access, 170, 185MIF (mapinfo file format), 170Milestones, 16MIMEs (Multipurpose Internet Mail
Extensions), 64Mission statement, strategic plan and, 9Mixed state, 209Models, data, see Data modelsMontana Natural Resource Information
System (NRIS), 250–251Monthly updates, 35Mosaic (tiles), 158Multipurpose Internet Mail Extensions
(MIMEs), 64Municipal governments:
and cooperative data acquisition, 242enterprise GIS for, 4–5
NNames, field, 130–131Nashville Planning Department, 247National Map Accuracy Standards
(NMAS), 152National Spatial Data Infrastructure
(NSDI), 60, 62National Standard for Spatial Data
Accuracy, 104, 152
Needs assessment/requirements analysis, 6,16–42
accuracy in, 33applications determination, 21–24completeness of, 33, 35current users assessment, 17–21evaluating existing data, 24–34implementation plan development,
41–42maintenance of data, 35–36software selection, 36–37technical environment, 37–41
.NET technology, 187Networks and networking, 195–200
planar/nonplanar, 101topologic, 90, 101
Network environment, 37–38New York City:
aerial photography used by,160–161
NYCMap, 151, 161NFS protocol, 198NIC, 196NMAS (National Map Accuracy
Standards), 152Nodes, 88, 101Nonplanar networks, 101Nontopologic vector data, see Spaghetti
vector dataNorthings, false, 117, 121NRIS, see Montana Natural Resource
Information SystemNSDI, see National Spatial Data
InfrastructureNumeric data, 133, 134NYCMap, 151, 161
OObjects:
classes of, 82direct relation of fields to, 129geographical conditioning of, 81hierarchical organization of, 80inherited properties of, 82–83layers vs., 78–84properties of, 80–81relationships between, 81–82spatial, 91–95, 97
Object link embedded data (OLE), 134,135
Object-oriented geographic databases,79–80, 83, 91. See also Spatiallyenabled relational database system
Object-oriented programming systems(OOPS), 79, 83
Oblique photography, 148Occasional users, 21OCR, see Optical character recognitionOGS (Open GIS Standards), 188OLE, see Object link embedded dataOne-dimensional features, see Linear
featuresOne-to-many relationships, 51, 52One-to-one relationships, 51On-the-fly topology, 90OOPS, see Object-oriented programming
systemsOpen GIS Standards (OGS), 188Open Records Acts, 245Operating systems, 37, 194, 236Optical character recognition (OCR),
177–178Optimum route creation, 90Optional relationships, 52Oracle, 84Oracle Spatial, 83–84Organizational design issues, 201–216
data flow design, 214–216dissemination of data, 242–244location of GIS, 208–214ownership of geographic information,
201–202staffing, 206–208user roles, 202–205
Organizational involvement (in planningstage), 13–15
Organization-wide view of GIS interaction, 230–231
Orthophotographs, 149Output, consistent look/feel of, 5Output elements (attribute data), 138Outside agencies:
data dissemination to, 244–245maintenance of layers created by, 36planning process visits to, 15software demonstrations by, 187
Outsourcing:of data development/conversion,
178–180of maintenance, 225
Overlaying of features, raster data modelfor, 74
Index260
Owner name change application, 39Ownership:
of geographic information, 201–202and staff involvement in planning, 14and users in planning process, 14
PPeople (as GIS component), 3. See also
UsersPer-CPU software licenses, 190Performance, 189Permissions assignment, 236Permitting applications, 23–24Phasing in (of GIS), 11Photogrammetry, 147, 175–176. See also
Aerial photographyPilot project (data
development/conversion), 180Pin mapping, 22Plans:
data development and conversion,171–180
implementation, 6, 41–46maintenance, 6, 238–242strategic, 6, 9–12system configuration and product
architecture, 169–171Planar networks, 101Planimetric features, 155–156Planning stage, 13–16. See also Needs
assessment/requirements analysisPoint features (SDTS), 92, 93Polygons:
topology of, 86–88universe, 88
Polygon features (SDTS), 92, 97Positional accuracy, 103Power users, 21Precision (of spatial data), 106Presenters:
consultants as, 16for planning meetings, 14–15
Product architecture, 170–171Product support (software), 36Professional-level staff (as end-users),
19Professionals, external (as end-users),
19–20Profit making data distribution, 245Progress, visibility of, 16Projections, see Map projectionsProject-oriented GIS, 4–6
Index 261
Promises (about GIS), 16Property lines, fences vs., 173Public access, control of, 236–238
QQuad tree data model, 76Qualitative benefits (of GIS), 40–41Quantitative benefits (of GIS), 39–40Quarterly updates, 35Queries:
of schema diagram, 53spatial, 85–86window, 121–122
Querying data, 22
RRAM, 195Ranking system:
for database usage, 31–33for layers, 25
Raster data, software for, 188Raster data model, 72, 73–78
combination of vector model with,77–78
comparison of vector model with,76
profile for, 85third dimension in, 98–99
Raster-to-vector conversion, 177RDBMSs, see Relational database
management systemsRDP protocol, 198Reality:
choosing subset of, 72–73digital features representing, 73
Real-time access, 243Real-time kinematic (RTK) GPS, 110Receivers, GPS, 107–109Recommendation fields, 51Recurring costs (of GIS implementation),
39Relational database management systems
(RDBMSs), 3–4, 121, 133, 255Relationships:
of adjacency, 86of connectivity, 86between objects, 81–82table, 51–53topologic, 85–91
Relative accuracy, 103–104Relative location, 85
Relief maps, 98Remote sensing, 147, 161–167
as analytical layers, 166–167as backdrop, 161–166
Replicated data, 199–200Request for bid, 191Request for proposal (RFP), 191, 206Request for qualifications (RFQ), 191,
206Requirements analysis, see Needs
assessment/requirements analysisResolution:
in aerial photography, 151of data conflicts, 200ground, 153–154spatial, 162spectral, 162–163temporal, 163
Resources (for GIS), 11RFP, see Request for proposalRFQ, see Request for qualificationsRMSE (root mean square error), 104Roche, Martin, 10, 11Roles of users, 202–203, 218–226
application developer, 218, 223–224assignment of, 236attribute data modifier, 218, 222–223database administrator, 218, 224managing, 224–226setup/modification of, 235spatial data modifier, 218, 220–222and subroles, 224–225viewer, 218, 219
Root mean square error (RMSE), 104Routing applications, 23, 96RTK (real-time kinematic) GPS, 110Rules-based topology, 91
SSatellites:
data quality from, 241GPS, 107, 109remote sensing, 163–165
Scale (of aerial photographs), 151–153Scanned images, final data analysis for, 33,
34Schema, 47. See also Database schema
designSchema diagram, 53, 55, 57SDTS, see Spatial Data Transfer StandardSearches, index, 136
Security:of GIS software, 235with layers, 225
Segmentation, dynamic, 96Selective availability, 108Semi-monthly updates, 35SERD, see Spatially enabled relational
database systemService state, 209SGML (Simple Graphics Markup
Language), 60Shading (on maps), 98–100Shape files, 84Shortest path creation, 90Simple Graphics Markup Language
(SGML), 60Simple topologic relationships, 91Single-precision data storage, 115Single-unit GIS, enterprise GIS vs., 4–6Skills maintenance, 239Skill state, 209Slope, 98–101SMB protocol, 198Snohomish River basin (Washington), 48,
50–51Software, 183–193
customization of, 186–187ease of use, 36evaluating, 186–190expandability of, 189functionality of, 186–188for geographic features representation,
84–85as GIS component, 3–4for heads-down digitizing, 176–177late adopters of, 184–185licensing options with, 189–190maintenance of, 240outdated or unproven, 185performance of, 36, 189product maintenance for, 37raster and vector data handling by, 188for raster-to-vector conversion, 177selecting, 36–37, 190–193standards for, 188–189for storing spatial/attribute data in same
workspace, 84to support dynamic segmentation, 96support for, 36testers of, 183–184training for, 37version number for, 184–185
Index262
Solomon, Eric, 96South Carolina, strategic plan for GIS
coordination in, 10–11Space Imaging, 165Spaghetti vector data, 86, 87, 88–90Spatial data, 24Spatial data design, 69–124, 128
accuracy in, 103–106, 110–111choosing subset of reality, 72–74completeness in, 106–107coordinate system/map projection for,
111–113data models for, 69–72geographic features representations in,
84–85and GPS accuracy, 107–110indexing of data, 121–123layers vs. objects in, 78–84map projections characteristics,
115–116precision in, 106projection selection for large areas, 117,
119–121raster vs. vector data models for, 74–78spanning existing map projection zones,
116–118storage of data, 113–115third dimension issues in, 98–105topologic relationships in, 85–91and types of spatial objects, 91–95, 97
Spatial data modifier role, 202–203, 218,220–222
Spatial Data Transfer Standard (SDTS),84–85, 188
chains, 95composite features, 92data types, 91–92linear features, 92, 94planar/nonplanar networks, 101point features, 92, 93polygon features, 92, 97
Spatial feature, connection to, 33Spatially enabled relational database
system (SERD), 79–84, 127, 225Spatial objects, 91–95, 97Spatial queries, 85–86Spatial resolution, 162SPCSs, see State plane coordinate systemsSpecifications, software, 190–191Spectral resolution, 162–163Speed, network, 195SPOT satellite, 163, 165
Index 263
Staff:as end-users, 19planning process involvement of, 14roles of, in GIS
design/implementation, 11Staffing, 206–208Standalone software licenses, 190Standards:
geospatial data addressing, 141–142for map accuracy, 104–106metadata, 60–66for software, 188–189for spatial data transfer/exchange, 85
State plane coordinate systems (SPCSs),114–116
Steinberg, Richard, 160Storage:
of data, 84in decimal longitude/latitude vs. pro-
jection, 113–115of images, 158maintenance plan funds for, 241of map design information, 139in object-oriented GIS databases, 91of polygon topology, 86–88of topology, 90
Strategic plan, 6, 9–12Strategic state, 209Strict constructionist designers, 48Support (for system), 14Surfaces, developable, 115Surveying (for data quality), 174, 175Surveying-level accuracy, 104Synchronization, 200System configuration, 169–170System configuration and product
architecture plan, 169–171
TTables, 51–53
D, 130, 131, 133–137data stored in, 128digitizing, 176G, 130–132general principles governing, 129–131index, 135–136joining, on unique ID field, 128master address, 141–142recommendations fields in, 51
Tagged interchange files (TIF), 157, 158Tax collectors, schema example for, 53–60
Technical environment, GIS, 37–41Technical staff (as end-users), 19Templates, map, 139–140Template schema, 47–48Temporal resolution, 163Tessellation, 121Tetrahedron, 101Thematic Mapper satellites, 163Thick clients, 231Thin clients, 231Third dimension issues, 98–105TIF, see Tagged interchange filesTimetable (for strategic plan), 9TIN, see Triangulated irregular networkTools:
CASE, 47GIS as, 21–22for metadata, 66web-site, 229
Top-level managers, strategic plan neededby, 9
Topographic features, 156Topographic maps, layers for, 78–79Topologic linear transportation network,
84–85Topologic networks, 101Topologic relationships, 85–91Topologic vector data model, 99–100Training:
in maintenance plan, 239for software use, 37spending on, 239, 240
Transportation planning, 96Traveling salesperson problem, 90Triangulated irregular network (TIN),
100, 103Tuning (of databases), 122–123Two-dimensional features, see Polygon
features2.5-D model, 98, 99, 101–102
UUnderground attributes, 174Ungen format, 248Uniform Resource Locators (URLs), 64United States Geological Survey (USGS),
61, 85, 99digital orthophotographs from, 154map accuracy standards, 104, 105
Universal Transverse Mercator (UTM)projections, 117
Universe polygons, 88Unix operating systems, 236Updates:
data, 241–242disclaimers for, 247frequency of, 35–36
Urban Information Systems (URBIS),209
URLs (Uniform Resource Locators), 64Users, 202–205
assessing current users, 17–21categorizing, 18–20computer proficiency of, 21custom interfaces for, 228frequency of use by, 20–21involvement of, in planning process, 14maintaining skills of, 239managing expectations of, 16real-time access for, 243roles of, 202–203, 218–226
USGS, see United States Geological Survey
Utilities, cooperative data acquisition and,242
Utility features, automation/conversionof, 173–174
UTM (Universal Transverse Mercator)projections, 117
VValidation rules, 135Vector data, software for, 188Vector data model, 72, 74–78
combination of raster model with,77–78
comparison of raster model with, 76Vendors:
for data conversion, 178–180for implementation assistance, 192
Index264
product demonstration by, 187training available from, 239, 240
Versioning, 225Very large databases (VLDBs), 123Viewer role, 202, 218, 219Viewing data, 22Visual Basic, 187VLDBs (very large databases), 123Voxels, 98
WWANs (wide area networks), 196West Hartford, Conn., 212–213Wide area networks (WANs), 196WIMP (Windows icons menus and
pointers), 226Window queries, 121–122Windows icons menus and pointers
(WIMP), 226Windows operating systems, 186, 188, 236World Trade Center disaster, 161World Wide Web:
access to GIS databases via, 237data dissemination via, 245–251GIS services on, 171interfaces via, 228–230metadata-based sites on, 62
XXML (Extensible Markup Language), 60X.11 Windows protocol, 198
YYahoo, 251
ZZero dimensional features, see Point
features