Applications of Geographic Information Systems for Municipal Planning and Management in India
13
Global Ecology and Conservation 3 (2015) 562–574 Contents lists available at ScienceDirect Global Ecology and Conservation journal homepage: www.elsevier.com/locate/gecco Original research article Applications of geographic information systems and remote sensing techniques to conservation of amphibians in northwestern Ecuador Mariela Palacios González a,b , Elisa Bonaccorso b,c , Monica Papeş d,∗ a Universidad Internacional Menéndez Pelayo, Isaac Peral 23, 28040 Madrid, Spain b Centro de Biodiversidad y Cambio Climático, Universidad Tecnológica Indoamérica, Machala y Sabanilla, Cotocollao, Quito, Ecuador c Biodiversity Institute, University of Kansas, Lawrence, KS, USA d Oklahoma State University, Department of Zoology, Stillwater, OK, USA article info Article history: Received 12 December 2014 Received in revised form 9 February 2015 Accepted 9 February 2015 Available online 16 February 2015 Keywords: Amphibian decline Remote sensing Land cover change Land cover classification Cloud forest Restoration and conservation abstract The biodiversity of the Andean Chocó in western Ecuador and Colombia is threatened by anthropogenic changes in land cover. The main goal of this study was to contribute to con- servation of 12 threatened species of amphibians at a cloud forest site in northwestern Ecuador, by identifying and proposing protection of critical areas. We used Geographic In- formation Systems (GIS) and remote sensing techniques to quantify land cover changes over 35 years and outline important areas for amphibian conservation. We performed a su- pervised classification of an IKONOS satellite image from 2011 and two aerial photographs from 1977 and 2000. The 2011 IKONOS satellite image classification was used to delineate areas important for conservation of threatened amphibians within a 200 m buffer around rivers and streams. The overall classification accuracy of the three images was ≥ 80%. For- est cover was reduced by 17% during the last 34 years. However, only 50% of the study area retained the initial (1977) forest cover, as land was cleared for farming and eventually re- forested. Finally, using the 2011 IKONOS satellite image, we delineated areas of potential conservation interest that would benefit the long term survival of threatened amphibian species at the Ecuadorian cloud forest site studied. © 2015 The Authors. Published by Elsevier B.V. This is an open access article under the CC BY-NC-ND license (http://creativecommons.org/licenses/by-nc-nd/4.0/). 1. Introduction The cloud forest of the Chocó region in South America is considered one of the 18 sites of greatest biodiversity and high endemism of species on the planet (Dodson and Gentry, 1991; Myers et al., 2000; Olson and Dinerstein, 1998). The Andean Ecuadorian Chocó, in particular, presents environmental conditions that allow the existence of a diverse flora and fauna (Mit- termeier et al., 1998), with exceptional richness and endemism, especially of amphibians (Ron et al., 2012). However, in this region, amphibian species have been reported to be declining or becoming extinct since the late 1980s (Bustamante et al., 2005; Lips et al., 2005). Likely threats to native amphibians are mostly related to drastic changes in land cover (Toral et al., 2002; Young et al., 2001), including deforestation caused by farming, fires, selective logging, urbanization, and construction of roads. A more recent threat is the introduction of exotic predatory fish in streams (Martín Torrijos, 2011). Finally, infec- tions caused by the chytrid fungus Batrachochytrium dendrobatidis may have contributed to local extinctions in the region (Guayasamin et al., 2014). ∗ Corresponding author. Tel.: +1 405 744 6941. E-mail addresses: [email protected] (M.P. González), [email protected] (E. Bonaccorso), [email protected] (M. Papeş). http://dx.doi.org/10.1016/j.gecco.2015.02.006 2351-9894/© 2015 The Authors. Published by Elsevier B.V. This is an open access article under the CC BY-NC-ND license (http://creativecommons.org/ licenses/by-nc-nd/4.0/).
-
Upload
independent -
Category
Documents
-
view
1 -
download
0
Transcript of Applications of Geographic Information Systems for Municipal Planning and Management in India

Global Ecology and Conservation 3 (2015) 562–574
Contents lists available at ScienceDirect
Global Ecology and Conservation
journal homepage: www.elsevier.com/locate/gecco
Original research article
Applications of geographic information systems and remotesensing techniques to conservation of amphibians innorthwestern EcuadorMariela Palacios González a,b, Elisa Bonaccorso b,c, Monica Papeş d,∗
a Universidad Internacional Menéndez Pelayo, Isaac Peral 23, 28040 Madrid, Spainb Centro de Biodiversidad y Cambio Climático, Universidad Tecnológica Indoamérica, Machala y Sabanilla, Cotocollao, Quito, Ecuadorc Biodiversity Institute, University of Kansas, Lawrence, KS, USAd Oklahoma State University, Department of Zoology, Stillwater, OK, USA
a r t i c l e i n f o
Article history:Received 12 December 2014Received in revised form 9 February 2015Accepted 9 February 2015Available online 16 February 2015
Keywords:Amphibian declineRemote sensingLand cover changeLand cover classificationCloud forestRestoration and conservation
a b s t r a c t
The biodiversity of the Andean Chocó in western Ecuador and Colombia is threatened byanthropogenic changes in land cover. The main goal of this study was to contribute to con-servation of 12 threatened species of amphibians at a cloud forest site in northwesternEcuador, by identifying and proposing protection of critical areas. We used Geographic In-formation Systems (GIS) and remote sensing techniques to quantify land cover changesover 35 years and outline important areas for amphibian conservation.We performed a su-pervised classification of an IKONOS satellite image from 2011 and two aerial photographsfrom 1977 and 2000. The 2011 IKONOS satellite image classification was used to delineateareas important for conservation of threatened amphibians within a 200 m buffer aroundrivers and streams. The overall classification accuracy of the three images was ≥ 80%. For-est cover was reduced by 17% during the last 34 years. However, only 50% of the study arearetained the initial (1977) forest cover, as land was cleared for farming and eventually re-forested. Finally, using the 2011 IKONOS satellite image, we delineated areas of potentialconservation interest that would benefit the long term survival of threatened amphibianspecies at the Ecuadorian cloud forest site studied.© 2015 The Authors. Published by Elsevier B.V. This is an open access article under the CC
BY-NC-ND license (http://creativecommons.org/licenses/by-nc-nd/4.0/).
1. Introduction
The cloud forest of the Chocó region in South America is considered one of the 18 sites of greatest biodiversity and highendemism of species on the planet (Dodson and Gentry, 1991; Myers et al., 2000; Olson and Dinerstein, 1998). The AndeanEcuadorian Chocó, in particular, presents environmental conditions that allow the existence of a diverse flora and fauna (Mit-termeier et al., 1998), with exceptional richness and endemism, especially of amphibians (Ron et al., 2012). However, in thisregion, amphibian species have been reported to be declining or becoming extinct since the late 1980s (Bustamante et al.,2005; Lips et al., 2005). Likely threats to native amphibians are mostly related to drastic changes in land cover (Toral et al.,2002; Young et al., 2001), including deforestation caused by farming, fires, selective logging, urbanization, and constructionof roads. A more recent threat is the introduction of exotic predatory fish in streams (Martín Torrijos, 2011). Finally, infec-tions caused by the chytrid fungus Batrachochytrium dendrobatidis may have contributed to local extinctions in the region(Guayasamin et al., 2014).
∗ Corresponding author. Tel.: +1 405 744 6941.E-mail addresses:[email protected] (M.P. González), [email protected] (E. Bonaccorso), [email protected] (M. Papeş).
http://dx.doi.org/10.1016/j.gecco.2015.02.0062351-9894/© 2015 The Authors. Published by Elsevier B.V. This is an open access article under the CC BY-NC-ND license (http://creativecommons.org/licenses/by-nc-nd/4.0/).

M.P. González et al. / Global Ecology and Conservation 3 (2015) 562–574 563
Table 1List of endangered and vulnerable amphibian speciesrecorded in Reserva Las Gralarias (Guayasamin et al.,2014), with threat categories according to the IUCN RedList (IUCN, 2012).
Species Status
Centrolene ballux Critically endangeredCentrolene heloderma Critically endangeredCentrolene lynchi EndangeredPristimantis crenunguis EndangeredPristimantis eugeniae EndangeredPristimantis sobetes EndangeredPristimantis pteridophilus EndangeredCentrolene peristictum VulnerableNymphargus griffithsi VulnerablePristimantis eremitus VulnerablePristimantis calcarulatus VulnerablePristimantis verecundus Vulnerable
There are many hypotheses that aim to explain global amphibian declines, but it is evident that the most significantfactors are habitat destruction, disturbance, and fragmentation (Blaustein, 1994; Brodman et al., 2006; Crump et al., 1992;Davidson et al., 2001; Dodd and Smith, 2003; Lips, 1998; Marsh and Trenham, 2001; Schiesari et al., 2007; Wake, 1991;Weyrauch and Grubb, 2004). In fact, habitat modification is the best documented cause of amphibian population declines(Alford and Richards, 1999; Gibbons et al., 2000; Smith and Green, 2005). Habitat loss influences amphibian abundance anddiversity directly, by reducing populations in the areas affected (Hecnar and M’Closkey, 1996) and indirectly, by alteringmicroclimatic regimes, compacting and desiccating soils, and reducing habitat complexity (Alford and Richards, 1999).
Amphibian conservation research focusing on drivers of population declines has generated a diverse body of informa-tion, including issues related to translocation of populations (Ficetola and De Bernardi, 2005; Miller et al., 2014), captivebreeding for reintroduction (Becker et al., 2014; Kissel et al., 2014), habitat fragmentation and restoration (Bower et al.,2014; Greenwald et al., 2009), and area selection for prioritization (Pyke, 2005; Russell et al., 2002). Increasingly, in recentyears, questions regarding animal habitat use and changes in vegetation cover have been addressed with satellite imagery,Geographic Information Systems (GIS), and historical aerial photography (Hooftman and Bullock, 2012; Pellikka et al., 2009;Pringle et al., 2009). Combining these powerful tools provides means of investigating the magnitude and consequences oftemporal land cover change in areas of interest, and in the context of preservation of species of concern (e.g., grassland birds,giant panda, resplendent quetzal; Pool et al., 2014; Solórzano et al., 2003; Zhang et al., 2013). Analyses of land cover changescan also identify areas thatmay be included in conservation planning (Fuller et al., 1998), but to our knowledge, this researchavenue has received less attention in the amphibian conservation field. This observation is based on our review of ISI in-dexed journals, via Web of Science database searches with combinations of keywords (‘‘amphibian’’, ‘‘conservation’’, ‘‘landcover’’, ‘‘land use’’, and ‘‘prioritization’’), restricted to 1995–2015. Our study illustrates the use of remote sensing techniquesto study long-term, landscape scale changes of land cover associatedwith endangered and vulnerable amphibians in a cloudforest of western Ecuador and to delineate areas of conservation priority for protecting amphibians. Thus, we investigatedland cover conversion as a strategic step to conserving critical habitat for amphibians in northwestern Ecuador.
2. Methods
2.1. Study area
The study area was comprised of Reserva Las Gralarias, a privately-owned reserve, and adjacent multi-use private lands,encompassing a region of approximately 5000 ha where the presence of 12 species of amphibians listed as endangeredor vulnerable by the International Union for Conservation of Nature (IUCN) has been documented (Table 1; Guayasaminet al., 2014; IUCN, 2012). Reserva Las Gralarias protects 425 ha out of the total study area of 5000 ha in the parish of Mindo,Pichincha province, on the western slopes of the Andes in the Chocó region (Fig. 1; Josse et al., 2003). From a hydrologi-cal standpoint, the area lies within the Esmeraldas river basin and the sub-basins of the Guayllabamba and Blanco rivers.The physiography and vegetation of the area correspond to the Western Montane Forest region of Ecuador (Sierra et al.,1999), covering an elevation range of 1300–3400 m (Sierra et al., 1999). In this evergreen montane forest, the canopy isgenerally less than 25 m tall, with a high abundance of epiphytes, especially mosses, ferns, orchids, and bromeliads. At in-termediate elevations, particularly during the evenings, the forest is covered in fog and precipitation is horizontal, fromlow clouds. These conditions are favorable to direct-development amphibians, such as Pristimantis spp. (Craugastoridae;Ron et al., 2012). Glassfrog species (Centrolenidae), adapted to developing from larvae in permanent streams (Haddad andPrado, 2005), are also present in high numbers in this region (Guayasamin et al., 2014), probably because of the intermediateelevations, climatic conditions (Hutter et al., 2013), and abundance of fast-flowing streams. The area contains primary andsecondary forests, with both high biodiversity and anthropogenic pressures.

564 M.P. González et al. / Global Ecology and Conservation 3 (2015) 562–574
Fig. 1. Location of the study area (white star) in northwestern Ecuador, on an elevation map with province boundaries outlined, and zoomed in over the2011 IKONOS satellite image. The two polygons represent Reserva Las Gralarias and the black squareswithwhite dots the known locations of 12 threatenedamphibian species.
2.2. Satellite image and aerial photo acquisition and processing
Frequent cloudy conditions in the moist tropical regions complicate capturing of satellite or aerial optical sensor data(Lu and Weng, 2007). Thus, a combination of multisensor data with various image characteristics is usually beneficial forinvestigations in such environments (Lefsky and Cohen, 2003). Typical applications of remote sensing involve the use ofimages from passive optical systems, either satellite or aerial imagery (Goward andWilliams, 1997). The present study wasconducted using historical aerial photographs and a recent IKONOS satellite image, with the aim of quantifying the changesin land cover that could have affected the amphibian presence in the region in the last three decades.
Two black-and-white aerial photos (scale 1:60,000), taken on 9 November 1977 (flight line No. 5701 R-28 9-11-77)and 9 November 2000 (flight line No. 15279 R64RC30 9-11-2000), respectively, were acquired from Instituto GeográficoMilitar (IGM), Quito, Ecuador. The aerial photos were georeferenced and rectified for inherent geometric errors using fourdigital topographic maps (scale 1:50,000; UTM coordinate system) acquired from IGM, corresponding to the quadrants ofSanMiguel de los Bancos, Calacalí, Mindo, and Nono. Registration to the digital topographicmapswas carried out using roadintersections that are usually very distinctive and clearly visible on images (Gautam et al., 2003). Finally, we applied first-degree rotation scaling and translation transformation, with the nearest neighbor resampling method (Gautam et al., 2003;Richards, 2013). This procedure allowed for direct comparison of features between aerial photographs and IKONOS, duringthe selection of sample plots to use in image classification and accuracy assessment of classified images (Gautamet al., 2003).

M.P. González et al. / Global Ecology and Conservation 3 (2015) 562–574 565
Table 2Land cover classes, number of field reference plots used for the IKONOS satellite image classification, and dominant taxa in each class. Thenumber of plots for pasture was increased by on-screen selection of additional sites, indicated by the number in parentheses.
Class Numberof plots
Dominant taxa
Riverine forest 6 Cyathea sp.,Melastomataceae, Clusiaceae, bryophytes, Araceae, bromeliads,Meriania maximaMontane forest 77 Croton floccosus, C. magdalensis, Solanum lepidotum, Cecropia aff. montana, M. maxima, Cyathea sp.,
Prestoea cf acuminta, Weinmannia balbisianaPasture 14 (+201) Setaria glaucaPasture inregeneration
42 C. floccosus, P. cf acuminta, C. magdalensis, S. glauca
The IKONOS satellite imagewas acquired on 26 June 2011, 1553 hGMT. The IKONOS sensor has advanced spectral, spatial,and radiometric characteristics (Dial et al., 2003; Lu and Weng, 2007; Thenkabail et al., 2004), and collects 1-m panchro-matic and 4-m multispectral images in four bands with 11-bit resolution (Dial et al., 2003). We created a multiband rastercomposite of the four IKONOS multispectral bands in ESRI ArcMap 9.3 and, although the IKONOS image was geometricallycorrected and projected to UTM zone 17S and datum WGS84, we performed a second orthorectification. This process re-moves distortions in the imagery caused by topography (Jensen, 1996), resulting in a more accurate product (Jensen, 1996;Vassilopoulou et al., 2002).We used the orthorectification function in ENVI 5.0 (Exelis Visual Information Solutions, Boulder,CO, USA) which required a Digital Elevation Model (DEM) and Rational Polynomial Coefficients (RPC). We used the NASASRTM 90-m resolution DEM (Jarvis et al., 2008), masked to the study area, and the RPC captured by the satellite at the timeof image acquisition to improve the relative accuracy of the initial IKONOS image registration (Cheng et al., 2008; Grodeckiand Dial, 2003; Vassilopoulou et al., 2002).
2.3. Field data collection
Field reference data (ground-truthing) for IKONOS image classification were collected in Reserva Las Gralarias between3 and 10 July 2012 (Table 2). Inventory field plots were 30 × 30 m and each plot encompassed approximately 52 IKONOSpixels (Thenkabail et al., 2004). Plots were established within homogeneous areas for the class under consideration, thusavoiding mixed or small patches of other vegetation classes (Thenkabail et al., 2004). The specific location of each plot wasrecorded as a point in the center of the plot, using a Global Positioning System (GPS) Garmin e-Trex R⃝ unit. In addition,qualitative observations of land cover were noted at these and other locations in the region to identify vegetation classes toconsider (Ramírez, unpub. data). Vegetation classes included in this study were as follows: (1) forest with no (or minimal)evidence of anthropogenic disturbance, (2) riverine forest, (3) pasture (grazed by cattle), and (4) pasture in regenerationsince 2000, when grazing was eliminated as land was acquired for establishing Reserva Las Gralarias (Table 2). In the latterplots, reforestation has been occurring by natural or assisted means (i.e., planting native species of trees and shrubs), andvegetation is dominated by the introduced African grass (Setaria glauca) of > 1 m height, surrounded by medium or highcanopy trees (Fig. 2). The field plots were supplemented with on-screen selection of additional reference sites for pasture(Table 2), as well as 50 references for a non-vegetation class, roads.
2.4. Supervised classification
Image classification consists of automatically categorizing all pixels in an image into different classes of land cover (Lille-sand et al., 2004). Since the spectral signature of same objects often varies (Tiwari, 2008), a supervised approach involvesthe selection of training areas (pixels) on the image which statistically characterize the target land cover classes (Richards,2013). This information allows estimating the extent occupied by objects with different spectral signatures and assigningthem to land cover classes. Herein, we applied a supervised classification using ENVI 5.0 (Exelis Visual Information Solutions,Boulder, CO, USA).
To classify the aerial photos, we selected the training samples for each class by means of on-screen drawing of polygons.We used three classes: (1) forest with no (or minimal) evidence of anthropogenic disturbance, (2) pasture, and (3) road.Training sites were chosen for each aerial photo separately to ensure that all classes were adequately represented. In con-trast with the classification of IKONOS satellite image (see below), we did not include pasture in regeneration as a separateclass because it represents a relatively new vegetation cover that could not be identified in the aerial photographs.
We used a minimum distance algorithm that calculates the mean vectors of each spectral end member (correspondingto the class selected) and the Euclidean distance from each unknown pixel to the mean vector for each class, a method rec-ommended when limited training samples are available (Richards, 2013). All pixels were classified to the nearest spectralendmember (class) and the results were refinedwith the aggregateminimum size approach. For the IKONOS satellite imagewe used amaximum likelihood algorithmwith training samples collected in the field and additional pasture sites and roadsdigitized on-screen (described above). The maximum likelihood classifier assigns a pixel to a particular class based on boththe variance and the covariance of the spectral information (Shalaby and Tateishi, 2007). This classifier is one of the fre-quently used supervised classification techniques (Richards, 2013). We used the maximum likelihood classifier because the

566 M.P. González et al. / Global Ecology and Conservation 3 (2015) 562–574
A B
C D
Fig. 2. Field examples of the four classes selected for IKONOS satellite image classification: montane forest (A), riverine forest (B), pasture (C), and pasturein regeneration (D).
number of field reference plots was higher than ten times the number of spectral bands (four IKONOS bands), a sample sizeconsidered adequate for this classifier (Richards, 2013). However, we only located six field plots for the riverine forest class,thus we combined these with the montane forest plots into a single training dataset for a forest class, given the similaritiesin the spectral signature between the two types of forest cover. Finally, we also digitized on-screen areas with clouds totrain the classifier and mask out cloud pixels from subsequent land use change analyses.
2.5. Classification accuracy assessment
Image classification accuracy is assessed by comparing obtained classes to reference data that are assumed to be true(Foody, 2002; Lillesand et al., 2004). We generated a typical error matrix for the aerial photos and the IKONOS satellite im-age classification results, showing pixels correctly identified for a class either as a fraction of the ‘‘true’’ (known) number ofpixels in that class (producer’s accuracy), or as a fraction of the number classified in that class (user’s accuracy; Jones andVaughan, 2010). Misclassification with producer’s accuracy is termed omission error and indicates the number of knownpixels for that class that were not correctly identified (Jones and Vaughan, 2010). We also calculated the kappa statistic,a measurement of agreement between the producer’s accuracy and user’s accuracy (Jones and Vaughan, 2010). The kappastatistic takes values from 0 to 1, with suggested strengths of agreement proposed by Landis and Koch (1977) as follows:moderate below 0.6, substantial 0.61–0.80, and almost perfect 0.81–1.
2.6. Detecting changes in the land cover
We first quantified the percent forest, pasture, and roads of the study area to compare the overall changes in land coverbetween consecutive time frames (1977–2000 and 2000–2011). Our justification of the selection of these classeswas trifold:(1) achieving the objective of this study (quantification of changes in forest cover); (2) relying on a reasonable degree of clas-sification accuracy, and (3) avoiding identification errors associatedwith the aerial photographs (Gautam et al., 2003). In ad-dition to calculating overall percent land cover change between two consecutive time frames, we also quantified the changein forest and pasture cover types from one time frame to another. Of all possible transitions, we tracked the ones that cumu-latively represented 95% of the entire study area. Specifically, for initial (1977) forest cover areas, we calculated the follow-ing transitional patterns, by the three time frames: forest–pasture–forest, forest–forest–pasture, forest–pasture–pasture,and no change (forest in all three time frames). For initial (1977) pasture cover areas, we calculated transitions of pas-ture–forest–forest, pasture–pasture–forest, pasture–forest–pasture, and no change (pasture in all three time frames). By
M.P. González et al. / Global Ecology and Conservation 3 (2015) 562–574 567
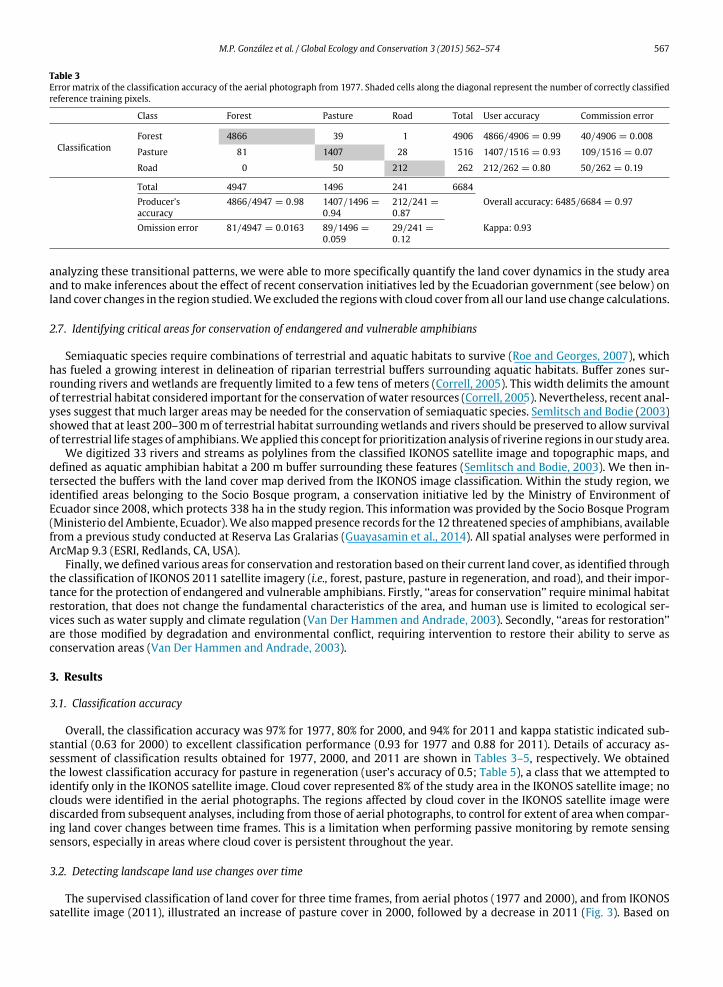
Table 3Error matrix of the classification accuracy of the aerial photograph from 1977. Shaded cells along the diagonal represent the number of correctly classifiedreference training pixels.
Class Forest Pasture Road Total User accuracy Commission error
ClassificationForest 4866 39 1 4906 4866/4906 = 0.99 40/4906 = 0.008
Pasture 81 1407 28 1516 1407/1516 = 0.93 109/1516 = 0.07
Road 0 50 212 262 212/262 = 0.80 50/262 = 0.19
Total 4947 1496 241 6684Producer’saccuracy
4866/4947 = 0.98 1407/1496 =
0.94212/241 =
0.87Overall accuracy: 6485/6684 = 0.97
Omission error 81/4947 = 0.0163 89/1496 =
0.05929/241 =
0.12Kappa: 0.93
analyzing these transitional patterns, we were able to more specifically quantify the land cover dynamics in the study areaand to make inferences about the effect of recent conservation initiatives led by the Ecuadorian government (see below) onland cover changes in the region studied.We excluded the regionswith cloud cover fromall our land use change calculations.
2.7. Identifying critical areas for conservation of endangered and vulnerable amphibians
Semiaquatic species require combinations of terrestrial and aquatic habitats to survive (Roe and Georges, 2007), whichhas fueled a growing interest in delineation of riparian terrestrial buffers surrounding aquatic habitats. Buffer zones sur-rounding rivers and wetlands are frequently limited to a few tens of meters (Correll, 2005). This width delimits the amountof terrestrial habitat considered important for the conservation ofwater resources (Correll, 2005). Nevertheless, recent anal-yses suggest that much larger areas may be needed for the conservation of semiaquatic species. Semlitsch and Bodie (2003)showed that at least 200–300m of terrestrial habitat surrounding wetlands and rivers should be preserved to allow survivalof terrestrial life stages of amphibians.We applied this concept for prioritization analysis of riverine regions in our study area.
We digitized 33 rivers and streams as polylines from the classified IKONOS satellite image and topographic maps, anddefined as aquatic amphibian habitat a 200 m buffer surrounding these features (Semlitsch and Bodie, 2003). We then in-tersected the buffers with the land cover map derived from the IKONOS image classification. Within the study region, weidentified areas belonging to the Socio Bosque program, a conservation initiative led by the Ministry of Environment ofEcuador since 2008, which protects 338 ha in the study region. This information was provided by the Socio Bosque Program(Ministerio del Ambiente, Ecuador).We alsomapped presence records for the 12 threatened species of amphibians, availablefrom a previous study conducted at Reserva Las Gralarias (Guayasamin et al., 2014). All spatial analyses were performed inArcMap 9.3 (ESRI, Redlands, CA, USA).
Finally, we defined various areas for conservation and restoration based on their current land cover, as identified throughthe classification of IKONOS 2011 satellite imagery (i.e., forest, pasture, pasture in regeneration, and road), and their impor-tance for the protection of endangered and vulnerable amphibians. Firstly, ‘‘areas for conservation’’ require minimal habitatrestoration, that does not change the fundamental characteristics of the area, and human use is limited to ecological ser-vices such as water supply and climate regulation (Van Der Hammen and Andrade, 2003). Secondly, ‘‘areas for restoration’’are those modified by degradation and environmental conflict, requiring intervention to restore their ability to serve asconservation areas (Van Der Hammen and Andrade, 2003).
3. Results
3.1. Classification accuracy
Overall, the classification accuracy was 97% for 1977, 80% for 2000, and 94% for 2011 and kappa statistic indicated sub-stantial (0.63 for 2000) to excellent classification performance (0.93 for 1977 and 0.88 for 2011). Details of accuracy as-sessment of classification results obtained for 1977, 2000, and 2011 are shown in Tables 3–5, respectively. We obtainedthe lowest classification accuracy for pasture in regeneration (user’s accuracy of 0.5; Table 5), a class that we attempted toidentify only in the IKONOS satellite image. Cloud cover represented 8% of the study area in the IKONOS satellite image; noclouds were identified in the aerial photographs. The regions affected by cloud cover in the IKONOS satellite image werediscarded from subsequent analyses, including from those of aerial photographs, to control for extent of area when compar-ing land cover changes between time frames. This is a limitation when performing passive monitoring by remote sensingsensors, especially in areas where cloud cover is persistent throughout the year.
3.2. Detecting landscape land use changes over time
The supervised classification of land cover for three time frames, from aerial photos (1977 and 2000), and from IKONOSsatellite image (2011), illustrated an increase of pasture cover in 2000, followed by a decrease in 2011 (Fig. 3). Based on

568 M.P. González et al. / Global Ecology and Conservation 3 (2015) 562–574
Table 4Error matrix of the classification accuracy of the aerial photograph from 2000. Shaded cells along the diagonal represent the number of correctly classifiedreference training pixels.
Class Forest Pasture Road Total User accuracy Commission error
ClassificationForest 4646 325 10 4981 4646/4981 = 0.93 335/4981 = 0.067
Pasture 1436 2749 72 4257 2749/4257 = 0.64 1508/4257 = 0.35
Road 1 193 538 732 538/732 = 0.73 194/732 = 0.265
Total 6083 3267 620 9970Producer’saccuracy
4646/6083 = 0.76 2749/3267 =
0.84538/620 =
0.867Overall accuracy: 7933/9970 = 0.80
Omission error 1437/6083 = 0.23 518/3267 =
0.15882/620 =
0.132Kappa: 0.63
Table 5Error matrix of the classification accuracy of the IKONOS image from 2011. Shaded cells along the diagonal represent the number of correctly classifiedreference training pixels.
Class Pasture Forest Pastureinregeneration
Clouds Road Total User accuracy Commission error
Classification
Pasture 188 0 1 0 14 203 188/203 = 0.92 15/203 = 0.07
Forest 6 70 7 0 3 86 70/86 = 0.81 16/86 = 0.18
Pasture inregeneration
20 12 34 0 1 67 34/67 = 0.5 33/67 = 0.49
Clouds 0 1 0 958 0 959 958/959 = 0.99 1/959 = 0.001
Road 1 0 0 7 32 40 32/40 = 0.8 8/40 = 0.2
Total 215 83 42 965 50 1355Producer’saccuracy
188/215 =
0.8770/83 =
0.8434/42 =
0.81958/965 =
0.9932/50 =
0.64Overall accuracy: 1282/1355 = 0.94
Omissionerror
27/215 =
0.1213/83 =
0.158/42 =
0.197/965 =
0.007318/50 =
0.36Kappa: 0.88
Table 6Comparison of area (ha) and percentage of study area in each land cover class, analyzed by year. Changes in each class were calculated for two time periods,1977–2000 and 2000–2011.
Land cover type Extent of land cover by time frame Change between time frames1977 2000 2011 1977–2000 2000–2011ha % ha % ha % ha % ha %
Forest 4152 87.4 3335.5 70.2 3396.7 71.5 −816.5 −17.2 +61.2 +1.3Pasture 581.2 12.2 1335.6 28.1 683.4 14.4 +754.4 +15.9 −652.2 −13.7Road 16.7 0.4 78.9 1.6 87.0 1.8 +62.2 +1.2 +8.1 +0.2Pasture in regeneration n/a n/a n/a n/a 582.8 12.3
Total 4750 100 4750 100 4750 100
the classification results, we calculated that in any of the three time frames the forest cover represented >70% of the studyarea, specifically 87.4% (4152 ha), 70.2% (3335 ha), and 71.5% (3397 ha) of the total area for years 1977, 2000, and 2011,respectively (Table 6). Pasture cover increased during 1977–2000 from 12.2 to 28.1% and decreased during 2000–2011 from28.1 to 14.4%. The total area covered by roads increased slightly from 1977 to 2000, by 1.2%, and from 2000 to 2011, by 0.2%(Table 6). Since pasture in regeneration class was only produced with IKONOS satellite image classification, we could notinclude it in the temporal analysis. For 2011, this land cover class represented 12.3% of the study area, but this area estimationmay be confounded by the low user’s accuracy for this class (0.5; Table 5), as derived from the IKONOS satellite image.
While the forest coverwas>70% in all three time frames, the analysis of transitional patterns in land cover change by timeframe showed that in 2011 only 50% of the study area was represented by forest cover unchanged since 1977. Ten percent ofthe forest cover was converted to pasture, while a similar extent of the forest cover transitioned to pasture in regenerationstage by 2011 (Fig. 4). The calculation of change from forest to pasture in regeneration may be confounded by the low user’saccuracy for the pasture in generation class (0.5; Table 5). We consider this class important from a conservation standpoint(transition to forest is ongoing) thus we retained it in this analysis, but we present it in the context of changes to pasture, aclass that had higher classification accuracy (0.85±0.11). Other regions experienced reversed changes from pasture in 2000to forest in 2011, thus by comparing only initial (1977) and final (2011) land cover types, the extent of forests unaffected by

M.P. González et al. / Global Ecology and Conservation 3 (2015) 562–574 569
Fig. 3. Classifications of aerial photographs (1977 and 2000) and IKONOS satellite image (2011). Due to lack of detail of aerial photographs, the classpasture in regeneration was used only for IKONOS satellite image classification.
Table 7Type and size of priority areas selectedwithin river buffers, summarizedby land cover class (based on IKONOS2011 satelliteimage classification). The percentages are calculated relative to the total surface of the study area (4750 ha).
Land cover class Management proposal Area within river buffers (ha) Percent of total study area
Montane forest Conservation 2184.6 46Pasture Restoration 260.7 5.5Pasture in regeneration Restoration 348.9 7.3Road Restoration 36.1 0.7Total 2830.3 59.5
farming would have been overestimated. Reforestation of pasture cover in 1977 occurred on about 6% of the study area by2011 (Fig. 4).
3.3. Identifying critical areas for conservation of endangered and vulnerable amphibians
We outlined areas of conservation and restoration priority by overlapping the 2011 IKONOS derived land covermapwiththe limits of Reserva Las Gralarias and Socio Bosque program, the riverine habitat (200 m buffers around 33 digitized riversand streams), and the presence records of endangered and vulnerable amphibians (Fig. 5). We identified a limited numberof regions that qualified as areas for conservation, especially in the core region of Reserva Las Gralarias and in the southernpart of the study area. Most of the regions outlined in this study qualified as areas for restoration, whereby conversion ofpatches of pasture or pasture in regeneration to forest would be required (Fig. 5).
Overall, we identified 2830.3 ha of conservation and restoration priority, representing 59.5% of the entire study area(Table 7). Most of the patches outlined fall in the area for conservation category (2184.6 ha; 46%; Table 7).
4. Discussion
Multiple factors are involved in amphibian population declines (Kiesecker et al., 2001; Lips et al., 2005). We focused onthe major effect of land cover change, with the main goal of illustrating the role of GIS and remote sensing techniques astools for analyzing such changes that could affect amphibians. We analyzed land cover changes at three points in time, overa 34-year period (1977–2011), in the area of Reserva Las Gralarias and adjacent private, multi-use lands. This area encom-passes a region that contains 12 species of amphibians listed as threatened by IUCN (Guayasamin et al., 2014). Our aimwas to inform conservation efforts by providing an understanding of historical land cover changes, as well as incorporatingcurrent herpetological and geographical information available for this area.

570 M.P. González et al. / Global Ecology and Conservation 3 (2015) 562–574
A
B
Fig. 4. Transitions between forest (F) and pasture (P) classes among the three time frames studied, summing to 95% of the study area; panel A showstransitions that occurred in areas initially (1977) forested and panel B transitions in areas used as pasture. No change between the three time frames islabeled as F–F–F (forest in all three time frames) or P–P–P (pasture in all three time frames). Light gray bars indicate pasture in regeneration as the final(2011) stage.
The supervised classification of IKONOS satellite imagery and aerial photographs had high accuracy for forest and pas-ture classes (> 80%, except for forest class in 2000, at 74%). Overall, classification using the minimum distance for aerialphotos and maximum likelihood for the IKONOS satellite image generated thematic maps with relatively good reliability(overall classification accuracy ≥ 80%; kappa statistic ≥ 0.63). We were able to discriminate well up to three land coverclasses in both the aerial photos and in the IKONOS satellite image. A fourth class derived from IKONOS image only, pasturein generation, had the lowest user’s accuracy (0.5; Table 5).
The analysis of land cover changes among three time frames, over 34 years (1977–2011), represented the basis for as-sessing the potential deterioration of amphibian habitat at a landscape scale. Our study showed that, over three decades, themontane forest cover was preserved in about 50% of the region of Reserva Las Gralarias and adjacent lands, although forestrepresented over 70% of the study area in each time frame analyzed. A visible decrease in montane forest cover took placeduring 1977–2000, but this trend slowly reversed during 2000–2011. It is important to note that the first period coincideswith the implementation of the agrarian reform and colonization program that occurred during 1960–1990 (Gondard andMazurek, 2001). This program, promoted by the Ecuadorian government, consisted of turning forests into ‘‘productive land’’and stimulating agricultural expansion (Gondard andMazurek, 2001), and it is likely partially responsible for the forest lossin the region. However, it is difficult to assess how these changes in forest cover contributed to amphibian declines in thestudy area because no amphibian demographic studies were conducted during 1977–2000. On the other hand, the increasein mountain forest cover observed over 2000–2011 could be related to the implementation of private conservation initia-tives that have been thriving in the study area in the last decade (Toral et al., 2002). In particular, the transition from pastureto forest or to pasture in generation, totaling 24% of the study area in 2011, represents a change in the landmanagement thatcould positively affect persistence of amphibians. In addition, forest regeneration may have been promoted by the openingof alternate and faster roads (e.g., Calacalí-La Independencia road), which have re-directed human land use patterns out ofthe study area.
The recovery rate of montane forest cover may be enhanced in the near future by the great potential for assisted and nat-ural forest regeneration derived from both public and private initiatives. In 2008, the Ministry of Environment of Ecuador

M.P. González et al. / Global Ecology and Conservation 3 (2015) 562–574 571
Fig. 5. Map showing priority areas within the 200 m buffers around digitized rivers and streams. These areas are proposed in the present study to eitherconserve (A; dark gray) or restore (B; light gray andwhite) habitat for endangered and vulnerable amphibians in the greater region of Reserva Las Gralarias.
(MAE) established the Socio Bosque program. This initiative consists of providing direct monetary incentives to landownersto conserve forests and other natural ecosystems and seeks to maintain biodiversity, reduce carbon emissions from defor-estation, and reduce poverty in rural areas (MAE, 2012). In addition, in recent years a growing number of private protectedareas have been established in the high Chocó region (independently or associated to Socio Bosque program), that have beendedicated to habitat conservation and restoration, tourism, or ecological research (MAE, 2012).
The ongoing process of forest conservation and regeneration in the region, combined with other specific actions for theconservation of amphibians, may lower the probability of amphibian extinctions in the future. For example, it is well knownthat semi-aquatic organisms such as amphibians depend on both aquatic and terrestrial habitats to complete their life cycleand maintain viable populations (Burke and Gibbons, 1995; Semlitsch and Bodie, 2003). However, environmental policiesand regulations in Ecuador tend to focus only on the protection of rivers or arbitrarily defined portions of the adjacent ter-restrial habitat (Echeverría, 2008). Terrestrial habitats adjacent to rivers are usually not protected, in part because of lackof a clear understanding of distances from river banks that are biologically relevant to maintaining wetland and river fauna(Semlitsch, 1998), as well as ecosystem functions and services. Such information is critical for delineation of terrestrial‘‘buffer zones’’ for rivers, and thus for conservation of semi-aquatic organisms (Semlitsch, 1998).
To assist the habitat preservation for 12 endangered and vulnerable amphibian species, we generated a priority mapbased on the overlap of the 2011 IKONOS derived land cover classes with river buffers that delineated 200 m of habitataround streams and rivers, following recent recommendations (Burke and Gibbons, 1995; Ficetola et al., 2009; Roe andGeorges, 2007; Semlitsch and Bodie, 2003). The map outlines specific areas for conservation and restoration that wouldbenefit amphibian communities (Fig. 5), which may promote conservation initiatives that are centered on protecting am-

572 M.P. González et al. / Global Ecology and Conservation 3 (2015) 562–574
Fig. 6. Location of patches of forest that have not been converted to pasture during 1977–2011, within the 200 m buffers around digitized rivers andstreams. In this study, these patches are identified as of priority conservation for amphibians in the greater region of Reserva Las Gralarias.
phibians in the region studied. If the land cover transitions that have occurredwithin the river buffers are considered, withinareas for conservation, priority could be given to patches of forest that have not been converted to pasture throughout thethree decades analyzed here (Fig. 6), since they would not require restoration investments. These patches amount to ap-proximately 1550 ha, representing 55% of the total area of river buffers outlined for conservation and restoration. The nearcontiguous forest areas in the southern and northeastern part of the region studied could be of particular interest for futureconservation initiatives.
More broadly, the recognition that terrestrial habitat is vital for semiaquatic species (Gibbons, 2003) implies that con-servation focusing only on aquatic habitats is not sufficient. It has been shown that large terrestrial buffers are needed forterrestrial life stages of semiaquatic species (Burke and Gibbons, 1995; Crawford and Semlitsch, 2007; Denoël and Ficetola,2008; Semlitsch, 1998). Furthermore, different life stages require different landscape components, and permeable corridorsare needed for maintenance of population processes (Ficetola et al., 2009). Therefore, a landscape-based approach shouldexpand on the habitat approach (Joyal et al., 2001; Roe and Georges, 2007). The former may be complex because differentlandscape elements require different spatial extents. Nevertheless, a shift of attention toward the management of differentelements is necessary for the long-term persistence of semiaquatic populations (Semlitsch and Bodie, 2003).
5. Conclusions
The integration of GIS and remote sensing techniques facilitated both quantifying land cover changes that threaten am-phibian habitats and prioritizing areas for conservation and restoration. Such an assessment provides conservation plannersand natural resource managers with specific information on the location and size of the candidate areas for restoration andprotection. This strategy could improve the allocation of financial resources at both broad and local scales. However, to fur-ther refine conservation prioritization initiatives, additional information is needed, for example to correlate the change oflandscape and the loss of species with water quality and environmental parameters, and possibly carry out comprehensivestudies on the presence of invasive species, amphibian diseases (e.g., infection by the fungus Batrachochytriumdendrobatidis),and effects of global warming (Lips et al., 2005; Young et al., 2001). Finally, frequent amphibian monitoring is necessary toultimately create an adaptive management framework to understand how these variables, as well as landmanagement andrestoration initiatives, influence amphibian population survival.

M.P. González et al. / Global Ecology and Conservation 3 (2015) 562–574 573
Acknowledgments
This study received financial support as part of the Save Our Species (S.O.S.) (No. 2011A-011) initiative by the GlobalEnvironment Facility, the World Bank, and the IUCN, awarded to Universidad Tecnológica Indoamérica. We thank ReservaLas Gralarias, and especially Jane Lyons, for financial support through accommodation and logistics. Vicki Liu and Tim Kellassisted during fieldwork and provided important information about the study site. Clirsen and IGM provided the IKONOSsatellite image and aerial photos, respectively. We thank DámasoWilfredo Ramírez for assistance with the identification ofspecies in major vegetation types, as well as Herbario Nacional del Ecuador (QCNE) for access to specimens and assistancewith species identification. Juan Guayasamin, Jesús Múñoz, and Janeth Lessman provided comments on a previous draft ofthis manuscript. Most of the work presented here was completed by MPG for her masters thesis, in partial fulfillment of therequirements for the programMaster Oficial en Biodiversidad y Conservación de Áreas Tropicales, Universidad InternacionalMenendez Pelayo.
References
Alford, R.A., Richards, S.J., 1999. Global amphibian declines: a problem in applied ecology. Annu. Rev. Ecol. Syst. 30, 133–165.Becker, M.H., Richards-Zawacki, C.L., Gratwicke, B., Belden, L.K., 2014. The effect of captivity on the cutaneous bacterial community of the critically
endangered Panamanian golden frog (Atelopus zeteki). Biol. Conserv. 176, 199–206.Blaustein, A.R., 1994. Chicken little or nero’s fiddle? A perspective on declining amphibian populations. Herpetologica 50, 85–97.Bower, D.S., Valentine, L.E., Grice, A.C., Hodgson, L., Schwarzkopf, L., 2014. A trade-off in conservation: weed management decreases the abundance of
common reptile and frog species while restoring an invaded floodplain. Biol. Conserv. 179, 123–128.Brodman, R., Parrish, M., Kraus, H., Cortwright, S., 2006. Amphibian biodiversity recovery in a large-scale ecosytem restoration. Herpetol. Conserv. Biol. 1,
101–108.Burke, V.J., Gibbons, J.W., 1995. Terrestrial buffer zones and wetland conservation: a case study of freshwater turtles in a Carolina bay. Conserv. Biol. 9,
1365–1369.Bustamante, M.R., Ron, S.R., Coloma, L.A., 2005. Cambios en la diversidad en siete comunidades de anuros en los Andes de Ecuador. Biotropica 37, 180–189.Cheng, P., Gómez, F., Weber, M., Flingelli, C., 2008. Mapping of IKONOS images using minimum ground controls. Geoinformatics 11, 52–54.Correll, D.L., 2005. Principles of planning and establishment of buffer zones. Ecol. Eng. 24, 433–439.Crawford, J.A., Semlitsch, R.D., 2007. Estimation of core terrestrial habitat for stream-breeding salamanders anddelineation of riparian buffers for protection
of biodiversity. Conserv. Biol. 21, 152–158.Crump, M.L., Hensley, F.R., Clark, K.L., 1992. Apparent decline of the golden toad: underground or extinct? Copeia 1992, 413–420.Davidson, C., Shaffer, H.B., Jennings, M.R., 2001. Declines of the California red-legged frog: climate, UV-B, habitat, and pesticides hypotheses. Ecol. Appl. 11,
464–479.Denoël, M., Ficetola, G.F., 2008. Conservation of newt guilds in an agricultural landscape of Belgium: the importance of aquatic and terrestrial habitats.
Aquat. Conserv.: Mar. Freshw. Ecosyst. 18, 714–728.Dial, G., Bowen, H., Gerlach, F., Grodecki, J., Oleszczuk, R., 2003. IKONOS satellite, imagery, and products. Remote Sens. Environ. 88, 23–36.Dodd, C.K., Smith, L.L., 2003. Habitat destruction and alteration: historical trends and future prospects for amphibians. In: Semlitsch, R.D. (Ed.), Amphibian
Conservation. Smithsonian Institution, Washington, pp. 94–112.Dodson, C.H., Gentry, A.H., 1991. Biological extinction in Western Ecuador. Ann. MO Bot. Gard. 78, 273–295.Echeverría, H., 2008. La Convención Ramsar en el Ecuador. Guía sobre la conservación y uso racional de los humedales. Centro Ecuatoriano de Derecho
Ambiental.Ficetola, G.F., De Bernardi, F., 2005. Supplementation or in situ conservation? Evidence of local adaptation in the Italian agile frog Rana latastei and
consequences for the management of populations. Anim. Conserv. 8, 33–40.Ficetola, G.F., Padoa-Schioppa, E., De Bernardi, F., 2009. Influence of landscape elements in riparian buffers on the conservation of semiaquatic amphibians.
Conserv. Biol. 23, 114–123.Foody, G.M., 2002. Status of land cover classification accuracy assessment. Remote Sens. Environ. 80, 185–201.Fuller, R.M., Groom, G.B., Mugisha, S., Ipulet, P., Pomeroy, D., Katende, A., Bailey, R., Ogutu-Ohwayo, R., 1998. The integration of field survey and remote
sensing for biodiversity assessment: a case study in the tropical forests and wetlands of Sango Bay, Uganda. Biol. Conserv. 86, 379–391.Gautam, A.P., Webb, E.L., Shivakoti, G.P., Zoebisch, M.A., 2003. Land use dynamics and landscape change pattern in a mountain watershed in Nepal. Agric.
Ecosys. Environ. 99, 83–96.Gibbons, J.W., 2003. Terrestrial habitat: a vital component for herpetofauna of isolated wetlands. Wetlands 23, 630–635.Gibbons, J.W., Scott, D.E., Ryan, T.J., Buhlmann, K.A., Tuberville, T.D., Metts, B.S., Greene, J.L., Mills, T., Leiden, Y., Poppy, S., Winne, C.T., 2000. The global
decline of reptiles, déjà vu amphibians. BioScience 50, 653–666.Gondard, P., Mazurek, H., 2001. 30 años de reforma agraria y colonización en el Ecuador (1964–1994): dinámicas especiales. Estud. Geogr. 10, 15–40.Goward, S.N.,Williams, D.L., 1997. Landsat and earth systems science: development of terrestrialmonitoring. Photogramm. Eng. Remote Sens. 63, 887–900.Greenwald, K.R., Gibbs, H.L., Waite, T.A., 2009. Efficacy of land-cover models in predicting isolation of marbled salamander populations in a fragmented
landscape. Conserv. Biol. 23, 1232–1241.Grodecki, J., Dial, G., 2003. Block adjustment of high-resolution satellite images described by rational polynomials. Photogramm. Eng. Remote Sens. 69,
59–68.Guayasamin, J.M., Mendoza, Á.M., Longo, A.V., Zamudio, K.R., Bonaccorso, E., 2014. High prevalence of Batrachochytrium dendrobatidis in an Andean frog
community (Reserva Las Gralarias, Ecuador). Amphib. Reptile Conserv. 8, 33–44.Haddad, C.F.B., Prado, C.P.A., 2005. Reproductive modes in frogs and their unexpected diversity in the Atlantic forest of Brazil. BioScience 55, 207–217.Hecnar, S.J., M’Closkey, R.T., 1996. Regional dynamicas and the status of amphibians. Ecology 77, 2091–2097.Hooftman, D.A.P., Bullock, J.M., 2012. Mapping to inform conservation: a case study of changes in semi-natural habitats and their connectivity over 70
years. Biol. Conserv. 145, 30–38.Hutter, C.R., Guayasamin, J.M., Wiens, J.J., 2013. Explaining Andean megadiversity: the evolutionary and ecological causes of glassfrog elevational richness
patterns. Ecol. Lett. 16, 1135–1144.IUCN, 2012. The IUCN Red List of Threatened Species. Version 2012.2. www.iucnredlist.org (Downloaded on 17 October 2012).Jarvis, A., Reuter, H.I., Nelson, A., Guevara, E., 2008. Hole-Filled Seamless SRTMdata V4. International Centre for Tropical Agriculture (CIAT).Jensen, J.R., 1996. Introductory Digital Image Processing: A Remote Sensing Perspective. Prentice-Hall PTR, Upper Saddle River, NJ.Jones, H.G., Vaughan, R.A., 2010. Remote Sensing of Vegetation: Principles, Techniques, and Applications. Oxford University Press, Oxford, UK.Josse, C., Navarro, G., Comer, P., Evans, R., Faber-Langendoen, D., Fellows, M., Kittel, G., Menard, S., Pyne, M., Reid, M., Schulz, K., Snow, K., Teague, J., 2003.
Ecological Systems of Latin America and the Caribbean: A Working Classification of Terrestrial Systems. NatureServe, Arlington, VA.Joyal, L.A., McCollough, M., Hunter, M.L.J., 2001. Landscape ecology approaches to wetland species conservation: a case study of two turtle species in
Southern Maine. Conserv. Biol. 15, 1755–1762.Kiesecker, J.M., Blaustein, A.R., Belden, L.K., 2001. Complex causes of amphibian population declines. Nature 410, 681–684.

574 M.P. González et al. / Global Ecology and Conservation 3 (2015) 562–574
Kissel, A.M., Palen, W.J., Govindarajulu, P., Bishop, C.A., 2014. Quantifying ecological life support: the biological efficacy of alternative supplementationstrategies for imperiled amphibian populations. Conserv. Lett. 7, 441–450.
Landis, J.R., Koch, G.G., 1977. Measurement of observer agreement for categorical data. Biometrics 33, 159–174.Lefsky, M.A., Cohen,W.B., 2003. Selection of remotely sensed data. In:Wulder, M.A., Franklin, S.E. (Eds.), Remote Sensing of Forest Environments: Concepts
and Case Studies. Kluwer Academic Publishers, Norwell, MA, pp. 13–46.Lillesand, T., Kiefer, R., Chipman, J., 2004. Remote Sensing and Image Interpretation. John Wiley and Sons, Danvers, MA.Lips, K.R., 1998. Decline of a tropical montane amphibian fauna. Conserv. Biol. 12, 106–117.Lips, K.R., Burrowes, P.A., Mendelson, J.R., Parra-Olea, G., 2005. Amphibian declines in Latin America: widespread population declines, extinctions, and
impacts. Biotropica 37, 163–165.Lu, D., Weng, Q., 2007. A survey of image classification methods and techniques for improving classification performance. Int. J. Remote Sens. 28, 823–870.MAE, 2012. Programa de Protección de Bosques, Socio Bosque de Ecuador, http://sociobosque.ambiente.gob.ec/.Marsh, D.M., Trenham, P.C., 2001. Metapopulation dynamics and amphibian conservation. Conserv. Biol. 15, 40–49.Martín Torrijos, L., 2011. Rainbow trout (Oncorhynchus mykiss) as a threat to amphibian populations. Universidad Internacional Menéndez Pelayo, Madrid,
Spain.Miller, K.A., Bell, T.P., Germano, J.M., 2014. Understanding publication bias in reintroduction biology by assessing translocations of New Zealand’s
herpetofauna. Conserv. Biol. 28, 1045–1056.Mittermeier, R., Myers, N., Thomsen, J., Da Fonseca, G., Olivieri, S., 1998. Biodiversity hotspots and major tropical wilderness areas: approaches to setting
conservation priorities. Conserv. Biol. 12, 516–520.Myers, N., Mittermeier, R.A., Mittermeier, C.G., Da Fonseca, G.A.B., Kent, J., 2000. Biodiversity hotspots for conservation priorities. Nature 403, 853–858.Olson, D., Dinerstein, E., 1998. The Global 200: a representation approach to conserving the earth’s most biologically valuable ecoregions. Conserv. Biol.
12, 502–515.Pellikka, P.K.E., Lotjonen, M., Sijander, M., Lens, L., 2009. Airborne remote sensing of spatiotemporal change (1955–2004) in indigenous and exotic forest
cover in the Taita Hills, Kenya. Int. J. Appl. Earth Obs. Geoinf. 11, 221–232.Pool, D.B., Panjabi, A.O., Macias-Duarte, A., Solhjem, D.M., 2014. Rapid expansion of croplands in Chihuahua, Mexico threatens declining North American
grassland bird species. Biol. Conserv. 170, 274–281.Pringle, R.M., Syfert, M., Webb, J.K., Shine, R., 2009. Quantifying historical changes in habitat availability for endangered species: use of pixel- and object-
based remote sensing. J. Appl. Ecol. 46, 544–553.Pyke, C.R., 2005. Assessing suitability for conservation action: prioritizing interpond linkages for the California tiger salamander. Conserv. Biol. 19, 492–503.Richards, J.A., 2013. Remote Sensing Digital Image Analysis. Springer-Verlag, Berlin.Roe, J.H., Georges, A., 2007. Heterogeneous wetland complexes, buffer zones, and travel corridors: landscape management for freshwater reptiles. Biol.
Conserv. 135, 67–76.Ron, S.R., Coloma, L.A., Guayasamin, J.M., Yanez-Muñoz, M.H., 2012. AmphibiaWebEcuador in V. 2012.0, editor, Museo de Zoología, Pontificia Universidad
Católica del Ecuador.Russell, K.R., Guynn Jr., D.C., Hanlin, H.G., 2002. Importance of small isolated wetlands for herpetofaunal diversity in managed, young growth forests in the
Coastal Plain of South Carolina. Forest Ecol. Manag. 163, 43–59.Schiesari, L., Grillitsch, B., Grillitsch, H., 2007. Biogeographic biases in research and their consequences for linking amphibian declines to pollution. Conserv.
Biol. 21, 465–471.Semlitsch, R.D., 1998. Biological delineation of terrestrial buffer zones for pond-breeding salamanders. Conserv. Biol. 12, 1113–1119.Semlitsch, R.D., Bodie, J.R., 2003. Biological criteria for buffer zones around wetlands and riparian habitats for amphibians and reptiles. Conserv. Biol. 17,
1219–1228.Shalaby, A., Tateishi, R., 2007. Remote sensing and GIS for mapping and monitoring land cover and land-use changes in the North western coastal zone of
Egypt. Appl. Geogr. 27, 28–41.Sierra, R., Cerón, C., Palacios, W., Valencia, R., 1999. Mapa de vegetación del Ecuador Continental 1:1’000.000. GEF, Quito, Proyecto INEFAN/GEF-BIRF,
Wildlife Conservation Society and Ecociencia.Smith, M.A., Green, M., 2005. Dispersal and the metapopulation paradigm in amphibian ecology and conservation: are all amphibian populations
metapopulations? Ecography 28, 110–128.Solórzano, S., Castillo-Santiago, M.A., Navarrete-Gutiérrez, D.A., Oyama, K., 2003. Impacts of the loss of neotropical highland forests on the species
distribution: a case study using resplendent quetzal an endangered bird species. Biol. Conserv. 114, 341–349.Thenkabail, P.S., Enclona, E.A., Ashton, M.S., Legg, C., De Dieu, M.J., 2004. Hyperion, IKONOS, ALI, and ETM + sensors in the study of African rainforests.
Remote Sens. Environ. 90, 23–43.Tiwari, P., 2008. Land use changes in Himalaya and their impacts on environment, society and economy: a study of the Lake Region in Kumaon Himalaya,
India. Adv. Atmos. Sci. 25, 1029–1042.Toral, E., Feinsinger, P., Crump, M.L., 2002. Frogs and a cloud-forest edge in Ecuador. Conserv. Biol. 16, 735–744.Van Der Hammen, T., Andrade, G.I., 2003. Estructura Ecológica Principal de Colombia. Primera Aproximación. Instituto de Hidrología, Meteorología y
Estudios Ambientales Bogotá, Colombia.Vassilopoulou, S., Hurni, L., Dietrich, V., Baltsavias, E., Pateraki, M., Lagios, E., Parcharidis, I., 2002. Orthophoto generation using IKONOS imagery and high-
resolution DEM: a case study on volcanic hazard monitoring of Nisyros Island (Greece). ISPRS J. Photogramm. Remote Sens. 57, 24–38.Wake, D.B., 1991. Declining amphibian populations. Science 253, 860–860.Weyrauch, S.L., Grubb, T.C., 2004. Patch and landscape characteristics associated with the distribution of woodland amphibians in an agricultural
fragmented landscape: an information-theoretic approach. Biol. Conserv. 115, 443–450.Young, B.E., Lips, K.R., Reaser, J.K., Ibáñez, R., Salas, A.W., Cedeño, J.R., Coloma, L.A., Ron, S., La Marca, E., Meyer, J.R., Muñoz, A., Bolaños, F., Chaves, G., Romo,
D., 2001. Population declines and priorities for amphibian conservation in Latin America. Conserv. Biol. 15, 1213–1223.Zhang, K.R., Zhang, Y.L., Tian, H., Cheng, X.L., Dang, H.S., Zhang, Q.F., 2013. Sustainability of social-ecological systems under conservation projects: lessons
from a biodiversity hotspot in western China. Biol. Conserv. 158, 205–213.