
On the Evolvability Assurance of Microservices - Universität ...
347
On the Evolvability Assurance of Microservices: Metrics, Scenarios, and Patterns Von der Fakultät für Informatik, Elektrotechnik und Informationstechnik der Universität Stuttgart zur Erlangung der Würde eines Doktors der Naturwissenschaften (Dr. rer. nat.) genehmigte Abhandlung Vorgelegt von Justus Bogner geboren in Eckernförde, Deutschland Hauptberichter: Prof. Dr. Stefan Wagner Mitberichter: Prof. Dr. Alfred Zimmermann, Prof. Dr. Cesare Pautasso Tag der mündlichen Prüfung: Montag, 18.05.2020 Institut für Softwaretechnologie 2020
-
Upload
khangminh22 -
Category
Documents
-
view
0 -
download
0
Transcript of On the Evolvability Assurance of Microservices - Universität ...

On the Evolvability Assurance ofMicroservices: Metrics, Scenarios, and
Patterns
Von der Fakultät für Informatik, Elektrotechnik und Informationstechnikder Universität Stuttgart zur Erlangung der Würde eines Doktors der
Naturwissenschaften (Dr. rer. nat.) genehmigte Abhandlung
Vorgelegt von
Justus Bognergeboren in Eckernförde, Deutschland
Hauptberichter: Prof. Dr. Stefan Wagner
Mitberichter: Prof. Dr. Alfred Zimmermann,Prof. Dr. Cesare Pautasso
Tag der mündlichen Prüfung: Montag, 18.05.2020
Institut für Softwaretechnologie
2020


Zusammenfassung
Kontext: Sich schnell verändernde Märkte und das Zeitalter der Digitalisie-rung erfordern, dass Software innerhalb von kurzer Zeit angepasst oder mitneuer Funktionalität erweitert werden kann. Das zugehörige Qualitätsattri-but wird im Englischen Evolvability (Evolutionsfähigkeit) genannt, also derGrad an Effektivität und Effizienz, mit dem ein System verändert oder er-weitert werden kann. Evolvability ist besonders wichtig für Software, derenAnforderungen sich häufig ändern, z.B. internet-basierte Systeme.Mehrere Vorteile für Evolvability wurden durch den Aufstieg des Service-
Oriented Computings (SOC) erzielt, das sich über das letzte Jahrzehnt alseines der wichtigsten Paradigmen für verteilte Systeme etabliert hat. DieImplementierung von unternehmensweiten Softwarelandschaften im Stilvon service-orientierten Architekturen (SOA) priorisiert dabei lose Kopplung,Datenkapselung, Interoperabilität, Komposition und Wiederverwendbarkeit.In den letzten Jahren haben wiederum Microservices als eine agile, DevOps-fokussierte und dezentralisierte Variante mit fein-granularen Services schnellan Beliebtheit gewonnen. Eine Kernidee dabei ist, dass kleine und losegekoppelte Services, die unabhängig voneinander ausgerollt werden können,einfach zu ändern und zu ersetzen sind. Gleichzeitig soll sich EvolutionaryDesign (evolutionäres Design) als eine der geforderten Eigenschaften vonMicroservices ähnlich positiv auswirken.
3

Problembeschreibung: Diese Eigenschaften bieten zwar ein vorteilhaf-tes theoretisches Fundament für evolvierbare Systeme, aber dennoch keinekonkreten und universell einsetzbaren Lösungen. Wie bei jedem Architek-turstil kann die Implementierung eines einzelnen microservice-basiertenSystems von beliebiger Qualität sein. Auch haben mehrere Studien gezeigt,dass Softwareentwickler ein hohes Vertrauen in das grundsätzlich durchServiceorientierung bereit gestellte Level an Wartbarkeit haben, vor allembei Microservices. Blinder Glaube an diese Eigenschaften ohne gleichzeitigeAbsicherung der Evolvability kann dazu führen, dass wichtige Designprinzi-pien verletzt werden, was sich negativ auf die Softwareevolution auswirkt.Gleichzeitig gibt es im Rahmen von Microservices sehr wenig Forschung zuden Themen Wartung, Evolution und technischer Schuld.Ziele: Das Ziel dieser Thesis ist es deshalb, Entwickler von microservice-
basierten Systemen mit geeigneten Methoden, Techniken und Werkzeugenzu unterstützen, um Evolvability zu bewerten oder zu verbessern und sonachhaltige, langfristige Softwareentwicklung zu ermöglichen. Konkretergesprochen wollen wir Empfehlungen und Werkzeugunterstützung für dieEvaluierungen mit Metriken und Szenarien bereitstellen. Außerdem wollenwir die Wirkung von service-basierten Patterns auf die Evolutionsfähigkeitanalysieren und relevante Antipatterns sammeln.Methoden: Dafür haben wir mit Hilfe empirischer Methoden die in der
Industrie verwendeten Praktiken sowie den akademischen Stand der Technikanalysiert, wodurch wir bestehende Techniken, Herausforderungen und For-schungslücken identifizieren konnten. Auf Basis dieser Ergebnisse entwarfenwir anschließend neue Techniken zur Absicherung von Evolvability undführten zusätzliche empirische Studien durch, um deren Wirksamkeit zudemonstrieren und zu validieren. Verwendete empirische Methoden warenzum Beispiel Umfragen, Interviews, (systematische) Literaturstudien oderkontrollierte Experimente.Beiträge: Zusätzlich zu unseren Analysen der Industriepraxis und der wis-
senschaftlichen Literatur liefern wir Beiträge in drei verschiedenen Bereichen.Für die Bewertung von Evolvability mit Metriken haben wir eine Reihe vonstrukturellen Metriken identifiziert, die speziell für die Serviceorientierung
4

entwickelt wurden, und ihre Anwendbarkeit für Microservices analysiert.Anschließend entwarfen wir werkzeuggestützte Ansätze, um eine Teilmengedieser Metriken automatisch zu erfassen, zum einen aus maschinenlesbarenRESTful-API-Beschreibungen und zum anderen über einen Mechanismusder verteilten Ablaufverfolgung zur Laufzeit.Im Bereich der szenario-basierten Evaluation entwickelten wir eine werk-
zeuggestützte, leichtgewichtigeMethode zur Evolvability-Analyse von service-basierten Systemen mittels hypothetischer Evolutionsszenarien. Die Methodewurde mit einer Umfrage (N=40) sowie interaktiven Befragungen (N=7)evaluiert und auf Grundlage der Ergebnisse weiter verbessert.Im Hinblick auf Patterns und Antipatterns sammelten wir eine große Zahl
service-basierter Patterns und analysierten ihre Anwendbarkeit für Micro-services. Aus diesem ersten Katalog wählten wir anschließend mittels desInstruments der architekturellen Modifizierbarkeitstaktiken eine Reihe vonKandidaten als Evolvability Patterns aus. Der Einfluss von vier dieser Patternsauf Evolvability wurde dann in einem kontrollierten Experiment (N=69)und mit einer metrikbasierten Analyse empirisch untersucht. Die Ergebnissedeuten darauf hin, dass die durch die Muster eingeführte zusätzliche struk-turelle Komplexität sowie das Wissen der Entwickler über Patterns einenEinfluss auf deren Wirksamkeit haben, auch wenn generell ein positiverEffekt sichtbar war. Als letzten Beitrag haben wir eine holistische Sammlungvon service-basierten Antipatterns für SOA und Microservices erstellt und ineinem kollaborativen Repository veröffentlicht.Fazit: Unsere Beiträge liefern erste Grundlagen für eine ganzheitliche
Sichtweise auf die Absicherung der Evolvability von Microservices und de-cken mehrere Perspektiven ab. Metrik- und szenariobasierte Evaluation sowieservice-basierte Antipatterns können zur Identifizierung von Schwachstellenverwendet werden, wohingegen service-basierte Patterns diese beheben undals Mittel zum systematischen Design von Evolvability dienen können. Allesin allem können Wissenschaft und Industrie unsere Artefakte nutzen, umdie Evolutionsfähigkeit ihrer microservice-basierten Systeme zu analysie-ren und zu verbessern, sowie um sich ein konzeptuelles Verständnis vonservice-basierter Evolvability und deren Absicherung aufzubauen.
5

Abstract
Context: Fast moving markets and the age of digitization require that soft-ware can be quickly changed or extended with new features. The associatedquality attribute is referred to as evolvability: the degree of effectiveness andefficiency with which a system can be adapted or extended. Evolvability isespecially important for software with frequently changing requirements,e.g. internet-based systems.Several evolvability-related benefits were arguably gained with the rise
of service-oriented computing (SOC) that established itself as one of themost important paradigms for distributed systems over the last decade.The implementation of enterprise-wide software landscapes in the style ofservice-oriented architecture (SOA) prioritizes loose coupling, encapsula-tion, interoperability, composition, and reuse. In recent years, microservicesquickly gained in popularity as an agile, DevOps-focused, and decentral-ized service-oriented variant with fine-grained services. A key idea here isthat small and loosely coupled services that are independently deployableshould be easy to change and to replace. Moreover, one of the postulatedmicroservices characteristics is evolutionary design.Problem Statement: While these properties provide a favorable theo-
retical basis for evolvable systems, they offer no concrete and universallyapplicable solutions. As with each architectural style, the implementation
6

of a concrete microservice-based system can be of arbitrary quality. Severalstudies also report that software professionals trust in the foundational main-tainability of service orientation and microservices in particular. A blindbelief in these qualities without appropriate evolvability assurance can leadto violations of important principles and therefore negatively impact soft-ware evolution. In addition to this, very little scientific research has coveredthe areas of maintenance, evolution, or technical debt of microservices.Objectives: To address this, the aim of this research is to support de-
velopers of microservices with appropriate methods, techniques, and toolsto evaluate or improve evolvability and to facilitate sustainable long-termdevelopment. In particular, we want to provide recommendations and toolsupport for metric-based as well as scenario-based evaluation. In the contextof service-based evolvability, we furthermore want to analyze the effective-ness of patterns and collect relevant antipatterns.Methods: Using empirical methods, we analyzed the industry state of
the practice and the academic state of the art, which helped us to identifyexisting techniques, challenges, and research gaps. Based on these findings,we then designed new evolvability assurance techniques and used additionalempirical studies to demonstrate and evaluate their effectiveness. Appliedempirical methods were for example surveys, interviews, (systematic) litera-ture studies, or controlled experiments.Contributions: In addition to our analyses of industry practice and scien-
tific literature, we provide contributions in three different areas. With respectto metric-based evolvability evaluation, we identified a set of structural met-rics specifically designed for service orientation and analyzed their value formicroservices. Subsequently, we designed tool-supported approaches to au-tomatically gather a subset of these metrics from machine-readable RESTfulAPI descriptions and via a distributed tracing mechanism at runtime.In the area of scenario-based evaluation, we developed a tool-supported
lightweight method to analyze the evolvability of a service-based systembased on hypothetical evolution scenarios. We evaluated the method witha survey (N=40) as well as hands-on interviews (N=7) and improved itfurther based on the findings.
7

Lastly with respect to patterns and antipatterns, we collected a large setof service-based patterns and analyzed their applicability for microservices.From this initial catalogue, we synthesized a set of candidate evolvabilitypatterns via the proxy of architectural modifiability tactics. The impact of fourof these patterns on evolvability was then empirically tested in a controlledexperiment (N=69) and with a metric-based analysis. The results suggestthat the additional structural complexity introduced by the patterns as well asdevelopers’ pattern knowledge have an influence on their effectiveness. As alast contribution, we created a holistic collection of service-based antipatternsfor both SOA and microservices and published it in a collaborative repository.Conclusion: Our contributions provide first foundations for a holistic
view on the evolvability assurance of microservices and address several per-spectives. Metric- and scenario-based evaluation as well as service-basedantipatterns can be used to identify “hot spots” while service-based patternscan remediate them and provide means for systematic evolvability construc-tion. All in all, researchers and practitioners in the field of microservices canuse our artifacts to analyze and improve the evolvability of their systemsas well as to gain a conceptual understanding of service-based evolvabilityassurance.
8

Acknowledgements
Research is not particularly effective in isolation. Therefore, a lot of peopleare involved in various stages of a project as large as this dissertation. Mygenuine gratitude goes out to all of them, but I want to mention a few peopleand groups that were especially important.First and foremost, I want to thank my two PhD advisors Prof. Dr. Alfred
Zimmermann and Prof. Dr. Stefan Wagner. Alfred was the first to sparkmy interest in research during my master’s degree. His encouragementand support were essential for starting a PhD. He also got me up to speedquickly by immediately taking me to my first conferences and introducingme into the world of scientific publishing. His diverse contacts in industryand academia were very important for several studies. Additionally, his focuson consistency and clarity had a positive influence on my structuring andwording abilities. Throughout my whole PhD, he was a very benevolent andsupportive advisor who always wanted the best for his students and activelyworked to overcome administrative or financing issues.
Stefan became my second supervisor at the end of my first year. While hegave me the space to pursue my own topic and studies, his guidance wasnonetheless very influential. First, he helped me to develop the scope ofmy research by questioning weak spots in my research agenda and studyproposals. And second and more importantly, he introduced me to the magi-
9

cal and sometimes overwhelming world of empirical software engineering,which had a profound impact on my research methodology as well as mygeneral perception of science. Even though I was an external PhD student inhis group, he fostered collaborations with his other students and made sureI was well connected. Lastly, Stefan’s advocacy for open access, open data,transparent review policies, as well as the importance of negative resultshelped shape my views on the integrity and openness of science.Even though my PhD could not strictly be called “industrial”, I nonetheless
worked part-time in industry for the entirety of it, first at Hewlett PackardEnterprise (HPE) and then at DXC Technology. I want to thank Bernd Bren-nenstuhl and his successor Daniel Kroell from the HPE DualStudy programfor financially supporting my PhD, even after I was moved to DXC followinga company split. I also want to thank my managers during this time, whogave me the necessary flexibility and support, specifically Wolf Ortlinghaus,Claus-Michael Rebhan, Frank Niggemann, and Holger Kiemes.During my PhD, I was part of two academic institutions, the Herman
Hollerith Center in Boeblingen and the Software Engineering Group at theUniversity of Stuttgart. I want to thank all members of these institutions forthe pleasant time and the conversations we had. I am, however, especiallygrateful for the effective and motivating collaborations with Jonas Fritzschand the fruitful discussions with Daniel Graziotin and Marvin Wyrich. Fur-thermore, I want to thank all my supervised students who contributed tomy research in various ways, ranging from small implementations or casestudies up to joint publications.Lastly, my gratitude goes out to my close friends and family who went
with me all the way on this journey, cheering with me during the ups andencouraging and consoling me during the downs. I am especially indebtedto that one special person who I met at the beginning of my PhD and who ismiraculously still with me now, having endured both my manic delight uponreceiving awards and my depressed misery after paper rejections. Thankyou for bearing with me and for all your support and love!
Justus Bogner in February, 2020
10

Contents
I. Motivation and Background
1. Introduction 171.1. Motivational Context . . . . . . . . . . . . . . . . . . . . . . . . . . 181.2. Problem Statement . . . . . . . . . . . . . . . . . . . . . . . . . . . 191.3. Research Objective and Scope . . . . . . . . . . . . . . . . . . . . 201.4. Research Methodology and Process . . . . . . . . . . . . . . . . . 221.5. Contributions . . . . . . . . . . . . . . . . . . . . . . . . . . . . . . . 251.6. List of Publications . . . . . . . . . . . . . . . . . . . . . . . . . . . 271.7. Thesis Structure . . . . . . . . . . . . . . . . . . . . . . . . . . . . . 28
2. Technical Background 302.1. Software Architecture . . . . . . . . . . . . . . . . . . . . . . . . . 31
2.1.1. Architecture Documentation and ISO 42010 . . . . . . . 322.1.2. Quality Attributes and ISO 25010 . . . . . . . . . . . . . 352.1.3. Architectural Styles . . . . . . . . . . . . . . . . . . . . . . 362.1.4. Patterns and Antipatterns . . . . . . . . . . . . . . . . . . . 39
2.2. Service Orientation . . . . . . . . . . . . . . . . . . . . . . . . . . . 402.2.1. Service-Oriented Architecture (SOA) . . . . . . . . . . . . 41
11

2.2.2. Web Services (SOAP/WSDL) . . . . . . . . . . . . . . . . . 432.2.3. RESTful Web Services . . . . . . . . . . . . . . . . . . . . . 44
2.3. Microservices . . . . . . . . . . . . . . . . . . . . . . . . . . . . . . . 482.3.1. Characteristics . . . . . . . . . . . . . . . . . . . . . . . . . . 492.3.2. SOA vs. Microservices . . . . . . . . . . . . . . . . . . . . . 53
2.4. Software Evolution . . . . . . . . . . . . . . . . . . . . . . . . . . . 552.4.1. Quality Attribute Definitions . . . . . . . . . . . . . . . . . 572.4.2. Design Properties . . . . . . . . . . . . . . . . . . . . . . . . 602.4.3. Technical Debt . . . . . . . . . . . . . . . . . . . . . . . . . 67
2.5. Evolvability Assurance . . . . . . . . . . . . . . . . . . . . . . . . . 682.5.1. Software Quality Assurance . . . . . . . . . . . . . . . . . 692.5.2. Refactoring . . . . . . . . . . . . . . . . . . . . . . . . . . . . 692.5.3. Quantitative Analysis: Metrics . . . . . . . . . . . . . . . . 702.5.4. Qualitative Analysis: Scenarios . . . . . . . . . . . . . . . 752.5.5. Processes and Continuous Quality Assurance . . . . . . 78
3. Related Work 813.1. Literature Studies . . . . . . . . . . . . . . . . . . . . . . . . . . . . 823.2. Industry Surveys and Interviews . . . . . . . . . . . . . . . . . . . 843.3. Service-Based Metrics . . . . . . . . . . . . . . . . . . . . . . . . . 873.4. Scenario-Based Analysis . . . . . . . . . . . . . . . . . . . . . . . . 903.5. Service-Oriented Patterns and Antipatterns . . . . . . . . . . . . 91
II. Analysis Contributions
4. A Systematic Review of Service-Oriented Maintainability As-surance 974.1. Context and Goals . . . . . . . . . . . . . . . . . . . . . . . . . . . . 984.2. Systematic Literature Review . . . . . . . . . . . . . . . . . . . . . 98
4.2.1. Research Design . . . . . . . . . . . . . . . . . . . . . . . . 994.2.2. Results . . . . . . . . . . . . . . . . . . . . . . . . . . . . . . 102
4.3. Discussion . . . . . . . . . . . . . . . . . . . . . . . . . . . . . . . . . 1164.4. Threats to Validity . . . . . . . . . . . . . . . . . . . . . . . . . . . . 118
12 Contents

4.5. Conclusion . . . . . . . . . . . . . . . . . . . . . . . . . . . . . . . . 118
5. An Analysis of Industrial Maintainability Assurance for ServiceOrientation 1205.1. Context and Goals . . . . . . . . . . . . . . . . . . . . . . . . . . . . 1225.2. Survey . . . . . . . . . . . . . . . . . . . . . . . . . . . . . . . . . . . 123
5.2.1. Research Design . . . . . . . . . . . . . . . . . . . . . . . . 1235.2.2. Results . . . . . . . . . . . . . . . . . . . . . . . . . . . . . . 124
5.3. Interviews . . . . . . . . . . . . . . . . . . . . . . . . . . . . . . . . . 1365.3.1. Research Design . . . . . . . . . . . . . . . . . . . . . . . . 1375.3.2. Results . . . . . . . . . . . . . . . . . . . . . . . . . . . . . . 141
5.4. Discussion . . . . . . . . . . . . . . . . . . . . . . . . . . . . . . . . . 1545.5. Threats to Validity . . . . . . . . . . . . . . . . . . . . . . . . . . . . 1565.6. Conclusion . . . . . . . . . . . . . . . . . . . . . . . . . . . . . . . . 158
III. Main Contributions
6. Service-Based Maintainability Metrics: Identification and Col-lection Approaches 1606.1. Context and Goals . . . . . . . . . . . . . . . . . . . . . . . . . . . . 1626.2. Literature Review: Proposed Metrics and Applicability to Mi-
croservices . . . . . . . . . . . . . . . . . . . . . . . . . . . . . . . . 1636.2.1. Research Design . . . . . . . . . . . . . . . . . . . . . . . . 1636.2.2. Results . . . . . . . . . . . . . . . . . . . . . . . . . . . . . . 1646.2.3. Threats to Validity . . . . . . . . . . . . . . . . . . . . . . . 1756.2.4. Summary . . . . . . . . . . . . . . . . . . . . . . . . . . . . . 175
6.3. RESTful Metrics: Static Analysis and Threshold Derivation . . 1776.3.1. Static Analysis Approach . . . . . . . . . . . . . . . . . . . 1786.3.2. Prototypical Tool Support . . . . . . . . . . . . . . . . . . 1816.3.3. Empirical Threshold Derivation Study . . . . . . . . . . . 1836.3.4. Limitations and Threats to Validity . . . . . . . . . . . . . 1906.3.5. Summary . . . . . . . . . . . . . . . . . . . . . . . . . . . . . 192
Contents 13

6.4. An Approach to Calculate Service-Based Metrics from RuntimeData . . . . . . . . . . . . . . . . . . . . . . . . . . . . . . . . . . . . 1936.4.1. Dynamic Analysis Approach . . . . . . . . . . . . . . . . . 1946.4.2. Prototypical Tool Support . . . . . . . . . . . . . . . . . . 1966.4.3. Demonstration . . . . . . . . . . . . . . . . . . . . . . . . . 2016.4.4. Threats to Validity . . . . . . . . . . . . . . . . . . . . . . . 2026.4.5. Summary . . . . . . . . . . . . . . . . . . . . . . . . . . . . . 203
6.5. Conclusion . . . . . . . . . . . . . . . . . . . . . . . . . . . . . . . . 204
7. Scenario-Based Evolvability Analysis for Service Orientation 2057.1. Context and Goals . . . . . . . . . . . . . . . . . . . . . . . . . . . . 2067.2. Lightweight Method for Service Orientation . . . . . . . . . . . 206
7.2.1. Research Process . . . . . . . . . . . . . . . . . . . . . . . . 2077.2.2. Conceptual Model . . . . . . . . . . . . . . . . . . . . . . . 2077.2.3. Method . . . . . . . . . . . . . . . . . . . . . . . . . . . . . . 2107.2.4. Tool Support . . . . . . . . . . . . . . . . . . . . . . . . . . . 2117.2.5. Example Demonstration . . . . . . . . . . . . . . . . . . . . 212
7.3. Evaluation: Survey and Interviews . . . . . . . . . . . . . . . . . 2167.4. Threats to Validity . . . . . . . . . . . . . . . . . . . . . . . . . . . . 2207.5. Conclusion . . . . . . . . . . . . . . . . . . . . . . . . . . . . . . . . 221
8. Evolvability Patterns and Antipatterns for Service Orientation 2228.1. Context and Goals . . . . . . . . . . . . . . . . . . . . . . . . . . . . 2248.2. Applicability of SOA Patterns for Microservices . . . . . . . . . . 226
8.2.1. Research Design . . . . . . . . . . . . . . . . . . . . . . . . 2268.2.2. Results . . . . . . . . . . . . . . . . . . . . . . . . . . . . . . 2278.2.3. Threats to Validity . . . . . . . . . . . . . . . . . . . . . . . 2308.2.4. Summary . . . . . . . . . . . . . . . . . . . . . . . . . . . . . 230
8.3. Impact on Evolvability: Qualitative Mapping via ArchitecturalModifiability Tactics . . . . . . . . . . . . . . . . . . . . . . . . . . 2328.3.1. Research Design . . . . . . . . . . . . . . . . . . . . . . . . 2338.3.2. Results . . . . . . . . . . . . . . . . . . . . . . . . . . . . . . 2368.3.3. Discussion . . . . . . . . . . . . . . . . . . . . . . . . . . . . 242
14 Contents

8.3.4. Threats to Validity . . . . . . . . . . . . . . . . . . . . . . . 2448.3.5. Summary . . . . . . . . . . . . . . . . . . . . . . . . . . . . . 244
8.4. Impact on Evolvability: Controlled Experiment and Metric-Based Analysis . . . . . . . . . . . . . . . . . . . . . . . . . . . . . . 2468.4.1. Research Design . . . . . . . . . . . . . . . . . . . . . . . . 2478.4.2. Experiment Results . . . . . . . . . . . . . . . . . . . . . . . 2558.4.3. Metric Analysis . . . . . . . . . . . . . . . . . . . . . . . . . 2608.4.4. Discussion . . . . . . . . . . . . . . . . . . . . . . . . . . . . 2658.4.5. Threats to Validity . . . . . . . . . . . . . . . . . . . . . . . 2688.4.6. Summary . . . . . . . . . . . . . . . . . . . . . . . . . . . . . 271
8.5. Service-Based Antipatterns: Systematic Literature Review . . . 2738.5.1. Research Design . . . . . . . . . . . . . . . . . . . . . . . . 2748.5.2. Results . . . . . . . . . . . . . . . . . . . . . . . . . . . . . . 2788.5.3. Threats to Validity . . . . . . . . . . . . . . . . . . . . . . . 2888.5.4. Summary . . . . . . . . . . . . . . . . . . . . . . . . . . . . . 289
8.6. Conclusion . . . . . . . . . . . . . . . . . . . . . . . . . . . . . . . . 290
IV. Discussion and Conclusion
9. Conclusion 2939.1. Summary of Contributions . . . . . . . . . . . . . . . . . . . . . . 2949.2. Discussion and Limitations . . . . . . . . . . . . . . . . . . . . . . 2969.3. Future Research Directions . . . . . . . . . . . . . . . . . . . . . . 3009.4. Closing Remarks . . . . . . . . . . . . . . . . . . . . . . . . . . . . . 302
Bibliography 304
List of Figures 341
List of Tables 345
Contents 15

Part I.
Motivation and Background
16

Chap
ter 1
Introduction
This introductory chapter first motivates the research field of this thesisby describing its general context. For this context, we then derive existingproblems. We subsequently formulate our research objective and guidingresearch questions to address these problems. We also describe the usedresearch methodology to work towards this objective. This methodologysection is then followed by a short description of our contributions and thelist of our associated publications. Lastly, we outline the structure of theremainder of this thesis.
17

1.1. Motivational Context
While there are a lot of different aspects to software quality, attributes relatedto software maintenance and evolution have often been in the dilemmaof being poorly understood despite being seen as generally important forany system of business value [PMVV12]. The quality attribute associatedwith software evolution is referred to as evolvability, i.e. the degree ofeffectiveness and efficiency with which a system can be adapted or extended(see Section 2.4). One reason for the conflicted role of evolvability is thatdeficiencies with it usually are not visible to the end-users of a system,i.e. quality attributes like performance or functional correctness often takepriority. Additionally, the consequences of neglecting evolvability usuallymanifest many months after the initial development.However, studies have repeatedly shown that costs for software mainte-
nance and evolution activities take up a considerable fraction of the completedevelopment budget [BR00; JB11; LST78], although the current popularityof agile and continuous practices obfuscates a clear point in time wheninitial development stops and maintenance actually starts. Nonetheless, itis still important to suitably address evolvability to ensure the sustainablelong-term development of software systems. Furthermore, in a time of glob-alization and digital transformation where more and more companies relyon software as core business assets important for value creation [And11;MHB15], the costs for changes are sometimes outweighed by the durationit takes to implement them. If business models are not only supported bysoftware, but software is the key component generating value for a company,it is critical to introduce changes to these systems at a fast pace. To preparetheir systems for this, software professionals apply a diverse set of activities,which we refer to as evolvability assurance (see Section 2.5). Examples forsuch techniques are the analysis of the system with metrics or scenariosto identify weak spots and the application of design patterns to improvestructural properties.In the past, object-oriented programming brought significant progress for
maintainable software by positively influencing properties like reusability
18 1 | Introduction
and overall structuring. Meanwhile, service-oriented computing has emergedas a prominent paradigm for developing evolvable and interoperable en-terprise software systems in the form of service-oriented architecture (SOA).Service orientation allegedly provides a high base degree of evolvability,since it focuses on beneficial principles like loose coupling, high cohesion,encapsulation, reuse, and composition (see Section 2.2).In recent years, a decentralized, lightweight, and DevOps-focused service-
oriented variant called microservices (see Section 2.3) quickly gained inpopularity and is now trying to renew this promise for a second time. Thegeneral idea with microservices is that fine-grained, loosely coupled, andindependently deployable services should be easy to change and to replace.Moreover, one key principle of microservices is evolutionary design andmaintainability is one of the most frequent drivers reported by practitionersfor migrating to microservices [BFWZ19b; KH19; TLP17].
1.2. Problem Statement
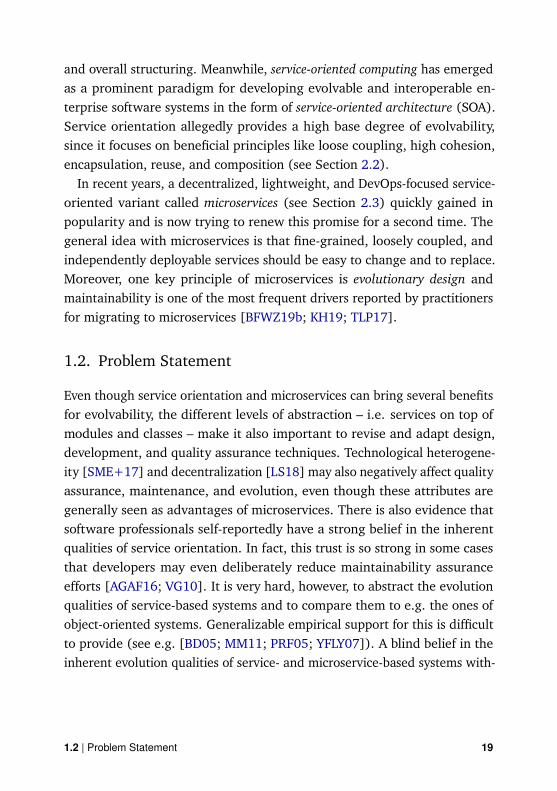
Even though service orientation and microservices can bring several benefitsfor evolvability, the different levels of abstraction – i.e. services on top ofmodules and classes – make it also important to revise and adapt design,development, and quality assurance techniques. Technological heterogene-ity [SME+17] and decentralization [LS18] may also negatively affect qualityassurance, maintenance, and evolution, even though these attributes aregenerally seen as advantages of microservices. There is also evidence thatsoftware professionals self-reportedly have a strong belief in the inherentqualities of service orientation. In fact, this trust is so strong in some casesthat developers may even deliberately reduce maintainability assuranceefforts [AGAF16; VG10]. It is very hard, however, to abstract the evolutionqualities of service-based systems and to compare them to e.g. the ones ofobject-oriented systems. Generalizable empirical support for this is difficultto provide (see e.g. [BD05; MM11; PRF05; YFLY07]). A blind belief in theinherent evolution qualities of service- and microservice-based systems with-
1.2 | Problem Statement 19

out having a clear understanding of influencing factors can lead to violationsof important principles and therefore negatively impact evolvability. As witheach architectural style, the implementation of a concrete microservice-basedsystem can be of arbitrary quality, regardless of advantageous theoreticalfoundations.Above issues were supported by our own industrial analysis (see Chapter 5).
Especially for microservices as a fairly young architectural style, there is a lotof uncertainty how an effective evolvability assurance process should look likeand what instruments are available for systematic evolvability construction.Currently used techniques and tools are very focused on source code andtherefore unfit for the reported challenges, which are mostly related tosoftware architecture. Simultaneously, the current scientific state of the artin the field of microservices maintenance and evolution does not comprisemany publications, which we confirmed with a systematic literature study(see Chapter 4). While approaches proposed for SOA may be adaptable insome areas, the concrete implications of this are not clear so far, e.g. withrespect to decentralization or a high degree of technological heterogeneity.In summary, neither industry nor academia has a sound understanding or
a holistic strategy for the evolvability assurance of microservices, which weaim to change with this thesis.
1.3. Research Objective and Scope
Using Wieringa’s template for design goals [Wie14], we formulate our over-arching research objective to address the described problems in the followingway:
Support developers of microserviceswith methods, techniques, or tools
that are lightweight, multifaceted, and designed for service orientationto evaluate or improve software evolvability
We refine this objective further with research questions that already hint
20 1 | Introduction

at the applied research process. The central research question of this thesis(RQ) is concerned with our main contributions.
RQ: How can developers of microservices be supported to efficiently eval-uate and improve software evolvability?
This central question is framed by two analytical knowledge questions(RQ1 and RQ2) and one design question (RQ3). All three of them guidedthe research leading to our proposed contributions.
RQ1: What are existing approaches to evaluate and improve maintain-ability and evolvability for service-based systems?RQ2: Are these approaches also applicable to microservice-based systems
and what are potential limitations?RQ3: What new approaches can be used to evaluate and improve evolv-
ability for microservice-based systems?
Since these research questions are rather general, most individual studiespresented in this thesis rely on a set of more specific research questions.
While there still is an ongoing discussion about differences between SOAand microservices (see Section 2.3.2), we consciously made microservicesthe focus of this thesis. They are the younger architectural style and aresurrounded by more hype and confusion. With that being said, we generallybelieve that service- and microservice-based systems share more common-alities than differences, which is also supported by several of our studiespresented in this thesis. Therefore, many of our contributions will also be ofvalue for modern service-based systems, but not so much for very centralizedSOA environments based on SOAP/WSDL or an enterprise service bus (ESB).Lastly, we see microservices more as a spectrum than as a binary choice, i.e.real-world systems based on this style will not always adhere to the completeset of postulated characteristics [BFWZ19b; ZLJ+19].
1.3 | Research Objective and Scope 21

1.4. Research Methodology and Process
From a methodological perspective, the research process to achieve theobjective described above was primarily influenced by empirical softwareengineering [SSS08]. Empiricism belongs to epistemology [God03], whichis the area of philosophy of science related to questions about knowledge,evidence, and rationality. Sjøberg et al. [SDJ07] define the implications ofan empirical science as follows:
“ Empirical research seeks to explore, describe,predict, and explain natural, social, or cognitivephenomena by using evidence based on obser-vation or experience. It involves obtaining andinterpreting evidence by, e.g., experimentation,systematic observation, interviews or surveys,or by the careful examination of documents orartifacts. ”— Sjøberg et al.
In the context of software engineering, this manifests in the application ofempirical methods to observe, analyze, and improve software artifacts orprocesses and to ground software-related decisions in empirical evidence.This focus on evidence is also the reason for the alternative term evidence-based software engineering (EBSE) [KDJ04], which is also used within theresearch community. Inspired by evidence-based medicine, Kitchenham etal. [KDJ04] describe the goal of EBSE as:
“ [...] to provide the means by which current bestevidence from research can be integrated withpractical experience and human values in thedecision making process regarding the develop-ment and maintenance of software. ”— Kitchenham et al.
22 1 | Introduction

One important practice within EBSE are systematic literature reviews(SLR) for the meta analysis of existing research. Additionally, EBSE callsfor an alignment of software engineering research with the requirements ofindustry: researchers should analyze real-world challenges and support prac-titioners in making informed and rational decisions. With respect to empiri-cism, this synergizes well with the primary philosophical stance taken in thisthesis, namely constructivism [God03], which Easterbrook et al. [ESSD08]describe as follows:
“ Constructivism [...] rejects the idea that scien-tific knowledge can be separated from its hu-man context. In particular, the meanings ofterms used in scientific theories are socially con-structed, so interpretations of what a theorymeans are just as important in judging its truthas the empirical observations on which it isbased. ”— Easterbrook et al.
For this thesis, this implies that, while we see great value in quantitativestudies in controlled environmentsmore related to positivism [CC18; God03],we also believe that rich and informative results from qualitative industrystudies are an important means to keep the analysis and interpretation ofour research close to a human context. Therefore, this thesis relies on amixture of quantitative and qualitative empirical methods [CC18] and placesa strong emphasis on industry-relevant results.Shaped by the concepts and paradigms described above, the concrete
research process for this thesis (see Fig. 1.1) relied on two separate analysesfor its foundations. One was a broad analysis of the scientific state of the art:with a systematic literature review we identified existing research subfieldsand reported research gaps. Simultaneously, however, we conducted an anal-ysis of the industry state of practice via a survey and interviews. This yieldedapplied industry practices and perceived challenges. As a consequence of
1.4 | Research Methodology and Process 23

the analysis of these combined results, we decided to focus our further con-tributions on three major areas: a) service-based maintainability metrics,b) scenario-based evaluation for service orientation, and c) service-basedpatterns and antipatterns for evolvability.��������� �����
� ��������������������������������������������������� ��� ���
��� !"#$ "��%&!'()
&*(+',"(-%. ( '%�/% 0'%&! 1�+$) !2-%. ( '%�/%3!(* "*'
.45-%.'!6"*'78()'+9("� ("�(#":" 2%&))$!(�*'
.$!6'2-%9("� ("�(#":" 2&))$!(�*'%(�+
;"//'!'�*')%<" 0%.'!6"*')
1� '!6"'<)-%=6�:6(#":" 2&))$!(�*'%�/9"*!�)'!6"*')
��,#"�'+%&�(:2)")
5')'(!*0.$#/"':+)
5')'(!*0>(?)
&??:"'+3!(* "*')
3'!*'"6'+�0(::'�@')
.'!6"*'78()'+9' !"*)
.*'�(!"�78()'+=6(:$( "��
3( '!�)%A&� "?( '!�)
��::'* %=B") "�@C'*0�"D$')%E.F&G5=.CG%' *HI
&�(:2J'%1+'� "/"'+C'*0�"D$')
1,?:','� .':'* '+
C'*0�"D$')%/�!9"*!�)'!6"*')
=6(:$( 'C'*0�"D$')
Figure 1.1.: General research process of this thesis
For each of these areas, we generally followed an iterative process. First,we collected existing research approaches for the specific subfield, e.g. vialiterature studies with a smaller scope. Since not many publications exist formicroservices on this topic, these approaches were mostly for the contextof SOA, web services, or RESTful services. As a second step, we analyzedthe applicability of the identified techniques or concepts for microservices.In a third step, we then implemented or adapted selected techniques forthe context of microservices. Lastly, we evaluated the created or selectedconcepts for their effectiveness. If the result was unsatisfactory, the same
24 1 | Introduction
process could be started for another iteration. Based on the contribution, weused several different empirical methods during this process. The concretemethods are described in detail in the respective contribution chapters.
1.5. Contributions
The central and unique contribution of this thesis is the conceptualizationof a holistic evolvability assurance for microservices: by combining theareas of metric-based evaluation, scenario-based evaluation, and designpatterns, we provide multifaceted and tool-supported techniques for theanalysis and improvement of microservice-based systems. To the best of ourknowledge, nothing in the scarce microservices literature on maintainability,evolvability, or technical debt comes close to such a perspective. This maincontribution has been published for the first time in this dissertation and canbe regarded as the integration of several smaller contributions provided byus in various research subfields. All in all, this thesis includes a total of 12such contributions in six different areas. We summarized these contributionsin the following paragraphs.
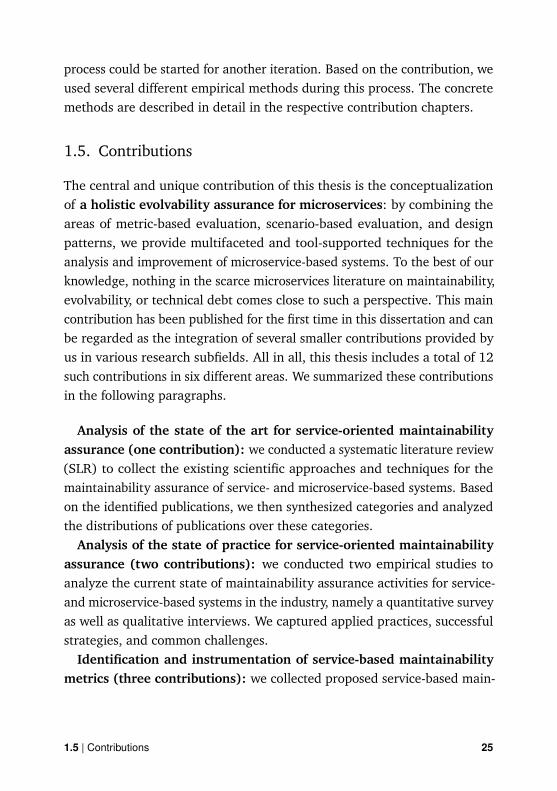
Analysis of the state of the art for service-oriented maintainabilityassurance (one contribution): we conducted a systematic literature review(SLR) to collect the existing scientific approaches and techniques for themaintainability assurance of service- and microservice-based systems. Basedon the identified publications, we then synthesized categories and analyzedthe distributions of publications over these categories.Analysis of the state of practice for service-oriented maintainability
assurance (two contributions): we conducted two empirical studies toanalyze the current state of maintainability assurance activities for service-and microservice-based systems in the industry, namely a quantitative surveyas well as qualitative interviews. We captured applied practices, successfulstrategies, and common challenges.Identification and instrumentation of service-based maintainability
metrics (three contributions): we collected proposed service-based main-
1.5 | Contributions 25

tainability metrics with a literature review and analyzed their applicabilityto microservices. Second, we designed a tool-supported static approachto automatically collect some of these metrics from machine-readable doc-umentation of RESTful interfaces (e.g. OpenAPI) and also conducted anempirical study to derive threshold values for them. Lastly, we developed anddemonstrated a tool-supported dynamic approach to automatically deriveservice-based metrics from runtime data.A scenario-based method for analyzing the evolvability of service-
and microservice-based systems (one contribution): we designed a light-weight scenario-based evolvability analysis method for service orientation.Furthermore, we developed tool support for this method and evaluatedits usability and perceived usefulness with a survey as well as hands-oninterviews.Analysis and evaluation of service-oriented patterns and antipatterns
for evolvability (four contributions): as a first contribution in this area, weanalyzed the applicability of existing SOA patterns for microservices. Second,we created a candidate list of service-based patterns with theoretical benefitsfor evolvability by qualitatively mapping them onto architectural modifiabil-ity tactics. As a third contribution, we empirically analyzed the impact ofselected candidate patterns on evolvability via a controlled experiment andstructural maintainability metrics. Lastly, we conducted an SLR to collectexisting antipatterns for service- and microservice-based systems and createda holistic documentation schema, a taxonomy, and a web-based repositoryfor them.Furthering the understanding of commonalities and differences be-
tween service-based systems / SOA and microservices (one contribu-tion): in several of our studies, we either analyzed existing service-basedtechniques for their applicability to microservices or compared similar con-cepts from both the areas of SOA and microservices. The results of thesecomparisons highlighted the large set of shared properties of the two service-based architectural styles, but also discussed notable differences.
26 1 | Introduction

1.6. List of Publications
Above contributions have been introduced into the scientific discourse in theform of several peer-reviewed publications. The following list consists onlyof the publications that are explicitly discussed in detail within this thesisand of which I am the first author.
1. J. Bogner, S. Wagner, and A. Zimmermann. “Automatically measuringthe maintainability of service- and microservice-based systems: a liter-ature review.” In: Proceedings of the 27th International Workshop onSoftware Measurement and 12th International Conference on SoftwareProcess and Product Measurement on - IWSM Mensura ’17. New York,New York, USA: ACM Press, 2017, pp. 107–115 [BWZ17]
2. J. Bogner, A. Zimmermann, and S. Wagner. “Analyzing the Relevanceof SOA Patterns for Microservice-Based Systems.” In: Proceedingsof the 10th Central European Workshop on Services and their Compo-sition (ZEUS’18). Dresden, Germany: CEUR-WS.org, 2018, pp. 9–16 [BZW18]
3. J. Bogner et al. “Limiting Technical Debt with Maintainability Assur-ance: An Industry Survey on Used Techniques and Differences withService- and Microservice-Based Systems.” In: Proceedings of the 2018International Conference on Technical Debt - TechDebt ’18. New York,New York, USA: ACM Press, 2018, pp. 125–133 [BFWZ18]
4. J. Bogner, S. Wagner, and A. Zimmermann. “Using architecturalmodifiability tactics to examine evolution qualities of Service- andMicroservice-Based Systems.” In: SICS Software-Intensive Cyber-PhysicalSystems 34.2-3 (June 2019), pp. 141–149 [BWZ19b]
5. J. Bogner et al. “Towards a Collaborative Repository for the Documen-tation of Service-Based Antipatterns and Bad Smells.” In: 2019 IEEEInternational Conference on Software Architecture Companion (ICSA-C).Hamburg, Germany: IEEE, Mar. 2019, pp. 95–101 [BBP+19]
1.6 | List of Publications 27

6. J. Bogner, S. Wagner, and A. Zimmermann. “On the impact of service-oriented patterns on software evolvability: a controlled experimentand metric-based analysis.” In: PeerJ Computer Science 5 (Aug. 2019),e213 [BWZ19a]
7. J. Bogner et al. “Assuring the Evolvability of Microservices: Insightsinto Industry Practices and Challenges.” In: 2019 IEEE InternationalConference on Software Maintenance and Evolution (ICSME). Cleveland,Ohio, USA: IEEE, Sept. 2019, pp. 546–556 [BFWZ19a]
8. J. Bogner et al. “A Modular Approach to Calculate Service-Based Main-tainability Metrics from Runtime Data of Microservices.” In: 20thInternational Conference on Product-Focused Software Process Improve-ment (PROFES’19). Barcelona, Spain: Springer Berlin Heidelberg,2019, pp. 489–496 [BSWZ19]
9. J. Bogner et al. “Exploring Maintainability Assurance Research forService- and Microservice-Based Systems: Directions and Differences.”In: Joint Post-proceedings of the First and Second International Confer-ence on Microservices (Microservices2017/2019). Ed. by L. Cruz-Filipeet al. Vol. 78. Dagstuhl, Germany: Schloss Dagstuhl - Leibniz-Zentrumfuer Informatik, 2020, 3:1–3:22 [BWWZ20]
10. J. Bogner, S. Wagner, and A. Zimmermann. “Scenario-based Evolv-ability Analysis of Service-oriented Systems: A Lightweight and Tool-supportedMethod.” In: Proceedings of the 15th International Conferenceon Evaluation of Novel Approaches to Software Engineering (ENASE’20).Prague, Czech Republic: SciTePress, 2020 [BWZ20]
1.7. Thesis Structure
The remainder of this thesis is structured in the following way. First, Chap-ter 2 presents and defines the necessary concepts to understand the laterchapters. Chapter 3 then expands these foundations with more recent andspecialized studies closely related to our contributions, which aims to de-
28 1 | Introduction

scribe existing approaches and to emphasize the research gap per contribu-tion area. This related work discussion is followed by five chapters (Chapters4–8) presenting our major contributions.
Chapter 4 describes our systematic literature review of the general researchfield, while Chapter 5 complements this with our industry studies. On top ofthese analysis contributions, we then present our contributions in the threealready mentioned main areas, namely a) service-based maintainabilitymetrics (Chapter 6), b) scenario-based evaluation for service orientation(Chapter 7), and c) service-based patterns and antipatterns for evolvability(Chapter 8).
Lastly, Chapter 9 briefly summarizes our work, broadly discusses its im-plications and limitations, and finally closes with an outlook on promisingfuture research directions.
1.7 | Thesis Structure 29

Chap
ter 2
Technical Background
This chapter describes the basic terminology, concepts, and technologiesnecessary to understand the contributions of this thesis and therefore coversbroad and foundational topics. Since the main focus of this thesis is on thearchitectural level, we first present the general field of software architec-ture (Section 2.1). After that, we describe the particular types of softwaresystems that we target with our contributions, namely systems based onservice orientation (Section 2.2). As the primarily focused architectural style,microservices are presented in their own section (Section 2.3), even thoughthey obviously represent a service-oriented variant. Finally, we present thecomplex field of software evolution (Section 2.4) as well as the processes andtechniques that should keep this evolution sustainable: evolvability assurance(Section 2.5), a concept which – like microservices – is also prominentlyplaced in the title of this thesis.
30

2.1. Software Architecture
In the general field of software engineering, software architecture establisheditself as an important subdiscipline over the years. In the late 1980s, theincreasing size and complexity of software systems as well as the rise ofdistributed computing created the need for a conceptual framework whichallowed reasoning about coarse-grained structures, communication betweencomponents, as well as non-functional requirements. Many different defini-tions of software architecture exist, even though most of them share somecommonalities. A popular one is from the seminal “Software Architecture inPractice” book from Bass et al. [BCK12]:
“ The software architecture of a system is the setof structures needed to reason about the sys-tem, which comprise software elements, rela-tions among them, and properties of both. ”— Bass et al.
This definition places heavy emphasis on structural abstractions, not onlyfrom a static point of view, but also from a dynamic runtime view as well asfrom an organizational allocation view. Another definition is provided byRozanski and Woods [RW11]:
“ The architecture of a system is the set of fun-damental concepts or properties of the systemin its environment, embodied in its elements,relationships, and the principles of its designand evolution. ”— Rozanski and Woods
While the first part of the definition is similar to the one from Bass et al.,the latter part about “principles” already hints at other definitions that placemore emphasis on design intent. In recent years, architectural decisions
2.1 | Software Architecture 31

and their rationale have received increased attention to describe softwarearchitecture. One early example of this was the approach of Jansen andBosch [JB05]. They proposed a new perspective to define the architectureof a system as a set of design decisions. This perspective should mitigate theloss of architectural knowledge over time because important decisions, theirrationales, pros and cons, as well as considered alternatives become part ofthe documented architecture.Lastly, Garlan [Gar14] describes software architecture as a “bridge” be-
tween the requirements and the actual implementation of a system becauseit allows reasoning about the system’s ability to fulfill its purpose. As such,architecture would be an instrumental abstraction for the areas of under-standability, reuse, construction, evolution, analysis, and management.
2.1.1. Architecture Documentation and ISO 42010
One fundamental part of software architecture is the description and docu-mentation of the system through a set of abstractions. For this documentation,architects and developers often use architectural diagrams or models. Thesedescriptions can take several forms [Gar14]: they can be informal like simplebox-and-line diagrams, semi-formal like unified modeling language (UML)diagrams1, or fully-formal based on an architectural description language(ADL). Regardless of their level of formality though, they usually only depicta certain portion of the system from a very specific angle, i.e. they forma single view on the system. Bass et al. [BCK12] explain this concept asfollows:
“ A view is a representation of a set of systemelements and relations among them – not allsystem elements, but those of a particular type.”— Bass et al.
The first widely known approach using the concept of views was Kruchten’s1https://www.omg.org/spec/UML
32 2 | Technical Background

so-called “4+1 model” [Kru95]. This model included five different views ona system, each for different stakeholders:
• The logical view is concerned with the static decomposition (e.g. anobject-oriented one).
• The process view is concerned with dynamic aspects like concurrencyor synchronization.
• The physical view maps software components onto hardware.
• The development view is concerned with the organization of the soft-ware in its development environment.
• The scenarios view (the “+1”) is concerned with general use casesfrom which architectural elements derive.
Due to the popularity of the 4+1 model, various other approaches basedon different views and types of diagrams were created. One popular generalapproach is Clements et al.’s “Views and Beyond” [CBB+10]. They differen-tiate between three major viewtypes, namely a) the module viewtype (staticelements of implementation units), b) the component-and-connector view-type (dynamic elements during execution), and c) the allocation viewtype(how elements relate to environment entities). Fig. 2.1 shows an example ofa decompositional module view based on a simple webshop application.
2.1 | Software Architecture 33

���������� �����
� ��������������������������������������������������� ��� ���
��� !"#$ %$$&'()*'#+
,,-.�.//(-.*#0�1.
$1#2-(*.
�'&&'+3
."'$$'+3
,,-.�.//,,-.�.//
-',,-.�.// ,,-.�.//
Figure 2.1.: Module view example: decompositional UML package diagram
Since choosing the needed views for a specific architecture descriptionrelies entirely on the system and its stakeholders, the concept was gen-eralized even further and so-called viewpoints were introduced, basicallygeneral meta elements to govern the creation of specific views. Rozanskiand Woods [RW11] define a viewpoint as follows:
“ A viewpoint is a collection of patterns, templates,and conventions for constructing one type ofview. It defines the stakeholders whose concernsare reflected in the viewpoint and the guidelines,principles, and template models for constructingits views. ”— Rozanski and Woods
All of these elements finally culminated in the ISO/IEC 42010 stan-dard [Int11b], also called “Systems and software engineering – Architec-ture description”. Its conceptual model (see Fig. 2.2) therefore consistsof a System that has an Architecture which is expressed through anArchitecture Description. This description is based on a set of Views
34 2 | Technical Background
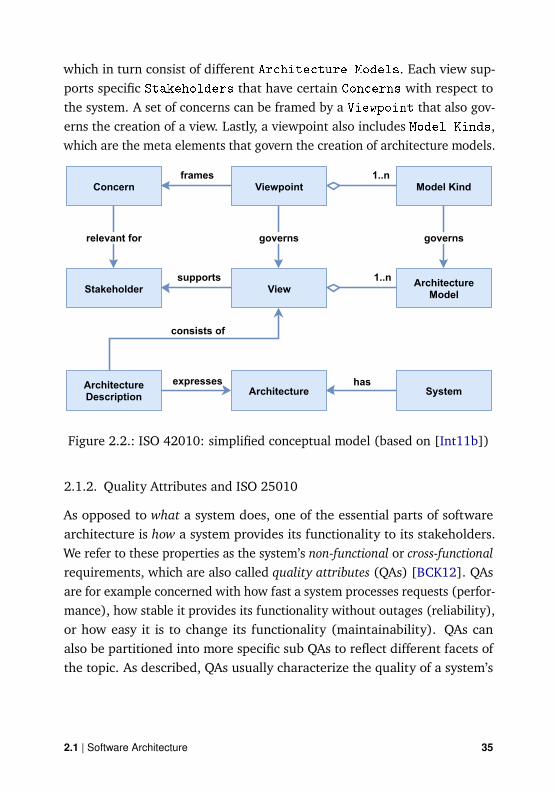
which in turn consist of different Architecture Models. Each view sup-ports specific Stakeholders that have certain Concerns with respect tothe system. A set of concerns can be framed by a Viewpoint that also gov-erns the creation of a view. Lastly, a viewpoint also includes Model Kinds,which are the meta elements that govern the creation of architecture models.���������� �����
���������������������������� ����������� ������������������� ���
�� !"#�$%&'
(")*%#&)#�"&+!,&-
*.�/0�#&1
2!3&"4�
5".1&�$%&' !%4#
2!3&"4�
+!,&-67%4,
"&-&3.4#65!"
8!4)&"4
/#.9&*!-,&"
&: "&��&�
)!4�%�#�6!5
(")*%#&)#�"&;&�)"% #%!4
(")*%#&)#�"&
<==4
<==4
Figure 2.2.: ISO 42010: simplified conceptual model (based on [Int11b])
2.1.2. Quality Attributes and ISO 25010
As opposed to what a system does, one of the essential parts of softwarearchitecture is how a system provides its functionality to its stakeholders.We refer to these properties as the system’s non-functional or cross-functionalrequirements, which are also called quality attributes (QAs) [BCK12]. QAsare for example concerned with how fast a system processes requests (perfor-mance), how stable it provides its functionality without outages (reliability),or how easy it is to change its functionality (maintainability). QAs canalso be partitioned into more specific sub QAs to reflect different facets ofthe topic. As described, QAs usually characterize the quality of a system’s
2.1 | Software Architecture 35

external behavior or aptitude. This is influenced by a system’s design prop-erties, sometimes also referred to as internal QAs. Examples of such designproperties are a system’s size, throughput, or complexity.One example of a structured software quality model with notable qual-
ity attributes is ISO 25010, also known as System and Software QualityRequirements and Evaluation (SQuaRE): System and Software Quality Mod-els [Int11a]. This standard comprises eight quality attributes, namely func-tional suitability, performance efficiency, compatibility, usability, reliability,security, maintainability, and portability. Each of these is refined with sev-eral sub quality characteristics. Unfortunately, ISO 25010 does not providesystem design properties that influence these QAs. Furthermore, no concretemetrics to evaluate the QAs are defined. For a discussion and comparisonof different software quality models with diverse quality attributes, pleaserefer to Ferenc et al.’s excellent overview [FHG14].
2.1.3. Architectural Styles
Since related families of systems often have similar quality requirements, itmay be desirable to reuse existing architectural knowledge and rationales.This is facilitated by architectural styles that provide a common vocabularyof components and connectors as well as constraints on how they can beapplied [BCK12]. They can be seen as reusable “packages” of design decisionsthat are known to produce an architecture with a certain set of qualities.According to Monroe et al. [MKMG97], an architectural style constitutes “a
specialized design language for a specific class of systems”. It usually consistsof four parts: a) a vocabulary of design elements (such as component andconnector types), b) design rules or constraints to govern the compositionof these design elements, c) semantic interpretations that assign meaning tocreated element compositions, and d) suitable forms of analysis for systemsbuilt in that style (like e.g. deadlock detection). The usage of architecturalstyles can have numerous advantages [KG10a; MKMG97]:
• Reuse of well-understood high-level design
36 2 | Technical Background

• Reuse of code via suitable shared implementations
• Reuse of suitable analysis methods and other practices like code gen-eration
• Increased understandability via shared conventions and naming
• Increased interoperability via standardization
A concrete example is the pipes and filters architectural style that is one ofthe most popular data flow styles. We provide an exemplary model of thisstyle in Fig. 2.3 and a tabular description in Table 2.1.We will cover the important service-based styles service-oriented archi-
tecture and microservices in greater detail in the upcoming sections of thischapter. For an extensive list of different architectural styles, please refer tothe recent survey of Sharma and her colleagues [SKA15].���������� �����
���������������������������� ����������� ������������������� ���
�� !"#$ ��%�&#'( )$� *+!( ,
-+ ./(+01�22)0�
3(#�4('$�!
5&$0.(+01�22)0�
Figure 2.3.: Example of a pipes and filters architecture (based on [HW03])
2.1 | Software Architecture 37

Table 2.1.: Concrete example of an architectural style: pipes and filters(based on [CBB+10])
Elements:Filter: a component that receives data on its inputport, performs some kind of transformation with it,and writes it to its output port. Filters execute con-currently and may be configured for e.g. processingrate or data formats.Pipe: a connector that moves data from a filteroutput port to a filter input port. Pipes have a sin-gle data-in and a single data-out role and act as asequence-preserving queue. They may be config-ured for e.g. buffer size or data format.
Relations: Filter output ports are associated with pipe data-inroles, while filter input ports are connected to pipedata-out roles (attachment relation).
Computational model: The system manipulates its external input to anexternal output via a sequence of filter transforma-tions.
Constraints:Pipes connect filter output ports to filter inputports.Connected filters have to agree on the data formatpassed through their pipe.Specialized variants may restrict communicationpaths to an acyclic graph or linear sequence.
Advantages:Improved reusability of filtersImproved throughput via parallelizationImproved analyzability of system behavior
38 2 | Technical Background

2.1.4. Patterns and Antipatterns
Design patterns are a popular way to document working and established so-lutions to recurring design problems. As opposed to architectural styles, theycapture concrete design knowledge at a smaller scale (even though there arealso architectural patterns) and solve a very specific problem. Patterns aredocumented within a certain context and in a technology-agnostic way thatcan serve as a blueprint for several slightly differing concrete implementa-tions. Originating from Alexander’s building pattern language [AIS77], theyquickly became popular in various computer science domains, especiallysoftware engineering and software architecture.The object-oriented design patterns of the “Gang of Four” [GHJV94] may
still arguably be the most popular ones. However, there are meanwhile pat-terns for software architecture [BMR+96], enterprise applications [Fow02],message-based integration [HW03], or cloud computing [FLR+14]. There isalso a significant body of patterns in the field of service-oriented computing,which we will explore later on in this thesis.
The relationship between patterns and quality attributes is often complexand empirical support for their effectiveness is controversial [AE13; HBFG12].Nonetheless, the effect of patterns on quality attributes is a topic of greatinterest [GA12; MPL17; RBW15], as clarity in this regard could greatlyhelp software professionals to choose relevant patterns to achieve qualityattribute goals.Contrary (or even complementary) to patterns as proven solution blueprints,
the concept of antipatterns and bad smells, i.e. frequently occurring sub-optimal solutions [BMMM98], exists. Developers sometimes choose themunder time pressure, but antipatterns most often appear due to insufficientexpertise. Consciously or unconsciously adding antipatterns to a system mayhave negative effects on software quality attributes such as analyzability,testability, or modifiability, i.e. it will hinder a sustainable long-term evo-lution of the system (see e.g. the empirical study performed by Khomh etal. [KDG09]). Antipatterns or bad smells can exist on different levels ofabstractions, such as code smells, design smells, architectural smells, or even
2.1 | Software Architecture 39

business or project management related antipatterns. In this thesis, we usethe terms antipattern and (bad) smell synonymously, i.e. code smells areantipatterns on the implementation level.
2.2. Service Orientation
In the past, the object-oriented programming paradigm [WWW90] hasbrought significant progress in the field of maintainable software by posi-tively influencing reusability, composability, and overall structuring. Mean-while, service-oriented computing (SOC) has emerged as a prominent way fordeveloping maintainable and interoperable enterprise software systems. Aservice-based system adds an additional level of abstraction (namely services)on top of modules and classes. In line with Papazoglou [Pap03], we define aservice-based system as a system that leverages software services as the basiccomputational elements. A service offers a self-describing part of function-ality via a uniform and platform-agnostic interface. Services are supposedto be self-contained, composable, technology-neutral, loosely coupled, andallow for location transparency. In their recent service computing manifesto,Bouguettaya et al. [BMO+17] present the following definition:
“ We define service computing (alternatively termedservice-oriented computing) as the disciplinethat seeks to develop computational abstrac-tions, architectures, techniques, and tools tosupport services broadly. A service orientationseeks to transform physical, hardware and soft-ware assets into a paradigm in which users andassets establish on-demand interactions, bind-ing resources and operations, providing an ab-straction layer that shifts the focus from infras-tructure and operations to services. ”— Bouguettaya et al.
40 2 | Technical Background

They describe software services as the elements that leverage knowledge toperform actions and see them at the top of the computing value chain (aboveknowledge, information, and data). Lastly, they highlight the importanceof decoupling service-oriented computing from concrete technologies toprepare this important distributed computing paradigm for the future.
2.2.1. Service-Oriented Architecture (SOA)
While service orientation represents a general design paradigm, the firstconcrete architectural style to realize the strategic goals associated withservice-oriented computing has been referred to as service-oriented architec-ture (SOA) [Erl05]. Each SOA implementation may look a little different,but, as they originate from the same technology architecture, they usually allshare a set of principles, concepts, and technologies [Erl09]: in general, theavailable units of solution logic, i.e. services, provide parts of their function-ality via public service contracts. These contracts are collected and organizedin a service inventory, i.e. a standardized and governed repository. From thisrepository, service consumers select the service capabilities that they require.For more complex tasks or business processes, several services are combinedvia service composition.Erl [Erl05] defines the following eight service-oriented principles as im-
portant foundations for SOA:
• Standardized service contract: all services within an inventory followthe same design standards for their contracts.
• Service loose coupling: service consumers are decoupled from theimplementation of a service provider. Instead, they rely on low formsof coupling to service contracts.
• Service abstraction: published information in service contracts islimited to essential – usually business-relevant – concepts.
• Service reusability: services provide agnostic logic as reusable enter-prise resources.
2.2 | Service Orientation 41

• Service autonomy: services are mostly in control of their executionenvironment and implementation.
• Service statelessness: by deferring state management, services re-duce resource consumption and enable scalability.
• Service discoverability: entries in service inventories are enrichedwith metadata to enable effective service discovery.
• Service composability: services can act as effective composition part-ners to accomplish larger business goals.
To increase flexibility, common SOA implementations rely on dynamicservice lookup and registration [Sta06] (see also Fig. 2.4): at startup, aservice registers itself at a central service registry. Service consumers thatrequire certain functionality then query this registry to identify fitting serviceproviders. The registry returns viable service endpoints with metadata fromwhich the consumer chooses a fitting service. Finally, the consumer invokesthe required operation.
���������� �����
���������������������������� ����������� ������������������� ���
�� !"#�$%&'()�
*+,-�."'/�
�� !"#�0 %!"1�
�� !"#�-�."'/ 2
3+,4(� 2
5+,6&!%7�
Figure 2.4.: SOA triangle: service registration and dynamic lookup
Lastly, a second typical pattern in SOA environments is an enterpriseservice bus (ESB) [Erl09]. An ESB is a central communication and integra-tion broker that provides asynchronous queuing, intermediate routing, andfeatures like message or protocol translation. These capabilities are offered
42 2 | Technical Background

in the form of a middleware-based messaging environment to increase thereliability, scalability, and interoperability of service communication.
2.2.2. Web Services (SOAP/WSDL)
Software services in an SOA are created to be exposed to a broad audience,e.g. to an enterprise, several enterprises, or even to the public via the Internet.To facilitate convenient usage, they needed to rely on open and existing webtechnology and standards, therefore the name web services [ACKM04]. In thebeginning, they were heavily based on extensible markup language (XML)and tried to provide standards in the areas of communication protocols,service description, and service discovery [CDK+02]. In each of these areas,a broadly accepted technology standard emerged.
SOAP for service communication: the simple object access protocol(SOAP) is an XML-based application level protocol for messaging and remoteprocedure invocation [CDK+02]. It is usually embedded into existing trans-port protocols, typically HTTP or messaging protocols. A SOAP messageconsists of a header with metadata and a body with the request payload. Themessage specifies which operation at what endpoint should be invoked withwhat data. Upon successful processing of the request, the service returns aSOAP response message.
WSDL for service description: while SOAP provides a means for commu-nication with a web service, the web services description language (WSDL) isan XML-based format to document the invocable operations of a web service,i.e. its interface [CDK+02]. This description consists of a protocol-agnosticpart for specifying the message structure per operation – the abstract inter-face – and a protocol-dependent part for mapping the defined operationsto a concrete endpoint and protocol, i.e. the binding interface. As such,WSDL represents a formal and machine-readable definition of the possibleinteractions between client and service.
UDDI for service discovery: the last XML-based web services standard –
2.2 | Service Orientation 43

the universal description, discovery, and integration (UDDI) specification –is concerned with registering and finding service providers [CDK+02]. Acentralized UDDI registry offers a way for services to register with metadataas well as their provided operations. It also offers a query interface to clientsthat want to identify existing operations offered by providers.
In a real-world combination of these three standards, a potential serviceconsumer would first query a UDDI registry to find a service that offerssuitable functionality for its use case. As a response, the registry wouldreturn the WSDL document of such a service. Using this interface description,the client can finally invoke the necessary operation via a SOAP request. Thecomposable request-response model of web services also makes them fittingcandidates for activities in business processes [LRS02]. Complex serviceconversations can be structured into business protocols [ACKM04] that spanseveral operations and handle the control flow. XML-based standards inthis area are the web services conversation language (WSCL), the businessprocess execution language for web services (BPEL), or the business processmodel and notation (BPMN). The set of web service specifications, whichspans much more than what was presented here, is often referred to asWS-* [PZL08].
2.2.3. RESTful Web Services
Representational state transfer (REST) is an architectural style based onthe properties of the world wide web that focuses on resources as the keyabstraction for information [FT02] (as opposed to operations like with SOAPweb services). REST has first been described by Fielding [Fie00] and makesuse of open web standards such as HTTP, URI, XML, JSON, YAML, or HTML.As an alternative to SOAP web services, RESTful web services are thereforeresource-oriented services that employ the full HTTP protocol with methodslike GET, POST, PUT, or DELETE as well as HTTP status codes to expose theirfunctionality on the web [Pau14]. The different HTTP verbs are usuallyassociated with operational CRUD semantics (create, read, update, delete),
44 2 | Technical Background

i.e. a GET request on /api/customers will return a list of all customers,while a POST request on /api/customers will create a new customer.Since RESTful design principles are fairly general, concrete implemen-
tations of RESTful web services can be of very different quality. Overtime, several best practices were developed that can also be applied grad-ually [ECPB12]. One model to capture these different stages of RESTfuldesign is the Richardson Maturity Model that was first proposed by LeonardRichardson [Fow10]. It comprises four maturity levels (level 0 up to level 3)that range from very basic (level 0) to very sophisticated (level 3) [Pau14]:
• Level 0: HTTP is only used as a transport tunnel, which has also beendescribed as “the swamp of plain old XML (POX)” by Fowler [Fow10].On this level, a single service endpoint is exposed instead of resources.Level 0 therefore resembles a typical RPC-style interaction and issimilar to SOAP or XML-RPC.
• Level 1: Instead of a single endpoint, several resources are exposedso that interactions can be directed to them. However, there is still nousage of different HTTP verbs, e.g. POST is used for all request andthe operation to be executed depends on the payload.
• Level 2: The majority of HTTP verbs are used and their semantics andconstraints are respected, e.g. GET is used for the idempotent retrievalof an existing resource, while POST is used for the state-changingcreation of a new resource. Moreover, standard HTTP status codes areemployed and incorporated into the flow of communication, e.g. 404is used to indicate that a specific resource has not been found.
• Level 3: At the highest maturity level, hypermedia controls are em-bedded into responses as links to indicate related resources whichcould be accessed by the client with subsequent requests. This featureenables clients to dynamically navigate through the net of existingresources exposed by the service and leads to increased discoverabilityas well as reduced coupling.
When comparing RESTful web services with SOAP web services based
2.2 | Service Orientation 45

on the WS-* stack, differences w.r.t. representation, resources, and interfaceexist [Pau14]: WS-* web services use exactly one representation (SOAP),while RESTful services may rely on many different formats (e.g. XML,JSON, YAML, CSV). Concerning resources, the same applies: SOAP webservices expose a single endpoint for communication, while their RESTfulsiblings provide several resources via different URIs. For the service interface,however, WS-* web services rely on a potentially large number of operations,while RESTful web services rely on a small number of HTTP verbs, usuallythe four methods GET, POST, PUT, and DELETE. Pautasso et al. [PZL08] alsoconclude that the simplicity of REST derives from the absence of severalsubsequent architectural decisions that would be present in the variousWS-* layers. However, the available tool support and the broad set ofadditional specifications would make SOAP web services more suited tocomplex enterprise scenarios.
46 2 | Technical Background
openapi: 3.0.0
info:
title: Swagger Petstore
paths:
/pets/{petId}:
get:
summary: Info for a specific pet
parameters:
- name: petId
in: path
description: The id of the pet
schema:
type: string
responses:
200:
content:
application/json:
schema:
$ref: "#/components/schemas/Pet"
components:
schemas:
Pet:
type: object
properties:
id:
type: integer
format: int64
name:
type: string
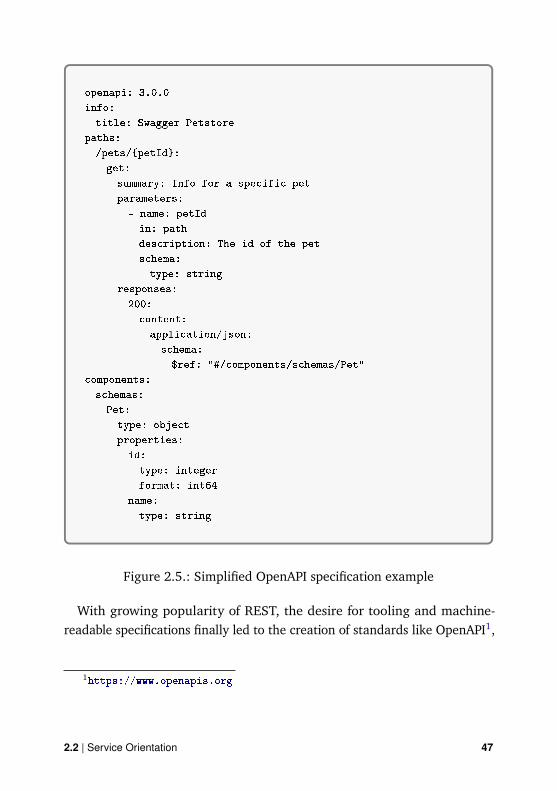
Figure 2.5.: Simplified OpenAPI specification example
With growing popularity of REST, the desire for tooling and machine-readable specifications finally led to the creation of standards like OpenAPI1,
1https://www.openapis.org
2.2 | Service Orientation 47

RAML1, or API Blueprint2. Fig. 2.5 shows a simplified example of an Ope-nAPI specification based on the Swagger Petstore3. In essence the RESTfulequivalent of a WSDL document, such interface specifications describe theavailable resources of a service, which HTTP verbs can be invoked on them,which request parameters and bodies can be sent, and which response bodiescan be expected. Similar to the WS-* stack, these standards can also be usedfor generation of e.g. client-side code.
2.3. Microservices
Many implementations of enterprise-wide software landscapes in the styleof service-oriented architecture resulted in benefits for scalability, interoper-ability, composition, reuse, loose coupling, and maintainability. However,SOA may also come with increased standardization and governance efforts,higher architectural and technological complexity, and sometimes vendoror product lock-in [MV14], all of which caused frustration and led to failedSOA adoption projects. In recent years, a lightweight and decentralizedservice-oriented variant based on fine-grained services therefore quicklygained popularity. With this variant, industry tried to address some of theissues with both large monolithic applications as well as “traditional” SOAimplementations based on SOAP / WSDL and a central enterprise servicebus (ESB). This architectural style is referred to as microservices. Systemsbuilt in this style – microservice-based systems – are the main focus of thisthesis.There is still an ongoing discussion in industry and academia about dif-
ferences and commonalities between SOA and microservices. Some seemicroservices as a very new architectural style that needs to be treated verydifferently (“revolutionary” perspective), some see it merely as a special-ization of SOA (“evolutionary” perspective). The latter perspective is also
1https://raml.org2https://apiblueprint.org3https://github.com/OAI/OpenAPI-Specification/blob/master/examples/
v3.0/petstore.yaml
48 2 | Technical Background

supported by early adopters from industry like Netflix who referred to theirsystem as “fine-grained Service Oriented Architecture” [WT13]. We presenta more detailed discussion about this in Section 2.3.2.The term “microservices” started to rise in popularity in 2014, even though
early adopters like Amazon, Netflix, Soundcloud, Google, or eBay had al-ready used some form of this architectural style for several years. One of thefirst and most influential publications about microservices was a blogpostfrom the ThoughtWorks consultants Martin Fowler and James Lewis [Fow15],where they proposed characteristics and described their experience withmicroservices. This blogpost was followed by a more detailed book fromtheir colleague Sam Newman [New15]. Together, these were the first impor-tant sources that collected and conceptualized details about a service-basedarchitectural style that was already used by several different companies (seeSection 2.3.1). Academia had just barely started to investigate microser-vices at this point. In 2016, an early systematic mapping study by Pahl andJamshidi [PJ16] identified a meager 21 primary studies. One year later, how-ever, a more specialized mapping study on architecting with microservicesby Di Francesco et al. [FML17] already analyzed 71 publications. Mean-while, microservices are a popular research topic with rising numbers inpublications each year. Google Scholar1 reports over 14,000 publications forthe search term “microservices” and more than 1,200 citations for Newman’sbook.
2.3.1. Characteristics
In this section, we briefly present the most common characteristics of mi-croservices. However, it is important to understand that many industryimplementations will not follow all postulated characteristics, i.e. not allmicroservice-based systems are “pure” microservices [BFWZ19b; ZLJ+19].In this sense, microservices can be regarded as a spectrum and not as abinary choice. Moreover, many of the described concepts are by no meansexclusive for microservices and can be part of other architectural styles as
1https://scholar.google.com, queried in December, 2019
2.3 | Microservices 49

well. Fowler and Lewis [Fow15] describe the following characteristics formicroservices:
• Componentization via services: amicroservice-based system consistsof services that are independently deployable and run in their ownprocess, i.e. they have to rely on inter-process communication.
• Organized around business capabilities: following Conway’s Law[Con68], an organization will create a system design that mirrors itsown communication structure. Microservices are therefore formedaround distinct business capabilities and developed by cross-functionalteams that include roles with all necessary skills, e.g. database, appli-cation logic, UI, and even project management.
• Products, not projects: microservices are created in a continuousproduct development mode, not as a project that is then handed overto an operations or maintenance team. A team that develops a mi-croservice is also responsible for its operation (“you build it, you runit”).
• Smart endpoints, dumb pipes: microservices rely on lightweightcommunication protocols like RESTful HTTP or lightweight messag-ing (e.g. AMQP1). Since a microservice-based system usually lacks acentral ESB with extensive routing intelligence, service choreographyis preferred over orchestration.
• Decentralized governance: teams developing a microservice have alot of autonomy w.r.t. the service implementation. That means theycan choose the programming language, framework, or database fortheir service that best fit their requirements or preferences. It alsomeans that usually, no central standardization for the internal servicearchitecture is enforced.
• Decentralized data management: microservices apply polyglot per-sistence, i.e. each service is responsible for its data and this data can be
1https://www.amqp.org
50 2 | Technical Background

stored in diverse databases. The only way for other services to accessthis data is via the public API of the responsible service, i.e. thereis no single central database and no shared databases. This sphereof data responsibility can also be illustrated with the concept of abounded context [Eva04] from domain-driven design (DDD). A domainis mapped out as a bounded context and assigned to a service that isresponsible for the domain entities (this is also related to the organizedaround business capabilities principle).
• Infrastructure automation: to handle the deployment and operationof a large number of small services, teams developing microservicesrely on automation as well as DevOps tools and principles [BWZ15]. Apipeline for continuous integration (CI) and continuous delivery (CD)ensures the automatic building, testing, or even deployment of newservice versions.
• Design for failure: since microservices communicate via the network,developers need to prepare them for the potential failing of down-stream communication partners with reliability patterns such as CircuitBreakers, Timeouts, or Bulkheads [Nyg07]. Resilience and observabilityare therefore key design goals for microservice-based systems.
• Evolutionary design: decomposing a monolith into microservices isoften a long-running step-by-step process. Combined with a decentral-ized environment, this decomposition leads to a dynamically evolvingservice landscape. As teams continuously learn more about the bestallocation of functionality, services are frequently split or merged.Service independence and replaceability are highly valued. Teamsembrace the notion of changing requirements and actively design forit.
In a similar yet slightly different fashion, Newman [New15] outlines thecharacteristics and benefits of microservices as follows:
• Small and focused on doing one thing well: following the SingleResponsibility Principle from Robert C. Martin [Hen10], a microservice
2.3 | Microservices 51

is a small and cohesive unit of business functionality. Newman also usesEvans’s DDD concept of a bounded context [Eva04] to motivate serviceboundaries. While he advocates that developers have an intuitivefeeling for when a piece of software is too big, he also cites a rule ofthumb that a microservice should be small enough to be rewritablewithin two weeks. Interestingly, Fowler and Lewis did not includesomething like “small size” as a primary characteristic, even thoughthey discuss this aspect in their blogpost.
• Autonomous: microservices are autonomous and decoupled entities.They can be changed and deployed independently, i.e. without activelyrequiring changes in other components.
• Technological heterogeneity: microservices of the same system canbe implemented with a wide variety of programming languages andtechnologies. The decentralized teams are free to choose “the righttool for each job”.
• Resilience: if one microservice in the system fails, there is a goodchance that others are still working as expected. Therefore, failureis isolated by service boundaries and system functionality partiallydegrades. Newman also refers to various reliability patterns fromNygard [Nyg07].
• Independent scaling: unlike a monolithic system, a microservice-based system is able to scale efficiently. Services can be scaled inde-pendently according to their load, without the need to replicate thecomplete system functionality every time.
• Ease of deployment: since microservices are independently deploy-able and changes are small, deployments are fast, easy, and associatedwith less risk. Microservices are therefore deployed frequently to bringnew functionality to customers faster.
• Organizational alignment: organizations developing microservicesstrive for an optimal allocation of services to people to maximizeproductivity. Teams are generally kept small and service ownership
52 2 | Technical Background

can be shifted to optimize work. Like Fowler and Lewis, Newmanalso discusses Conway’s Law [Con68] in great detail to explain thisprinciple.
• Composability: microservices are developed to be used by a widevariety of consumers. While they may be initially created for a specificuse case, possible other ways to reuse this functionality in a growingecosystem are consciously left open.
• Optimized for replaceability: due to their small size and cohesivefunctionality, a single microservice can be easily replaced. This opensup possibilities for experimenting with new technologies and preventslarge legacy components that people are afraid to touch.
2.3.2. SOA vs. Microservices
Several academic perspectives on the comparison of SOA and microserviceshave been published so far. Zimmermann [Zim17] first compares the twomost popular descriptions of microservices, namely the one from Lewis /Fowler and the one from Newman. He distills common tenets and warnsthat the two definitions not only encompass concerns related to architectureand development, but also to process and organization, which may make acomparison with other architectural styles that do not include these difficult.He then analyzes the identified tenets for SOA pendants and finds similari-ties for most of them. For him, the most significant differences show withrespect to decentralized governance, infrastructure automation, indepen-dently deployable services, and lightweight communication as opposed toa central ESB. Based on these findings, his analysis concludes that he seesmicroservices as a specific development and deployment approach for SOA.Similarly, Dragoni et al. [DGL+17] argue that microservices are “the
second iteration” of the SOC and SOA concepts with the aim to strip awaycomplexity and to focus on the development of simple and lightweightservices. While SOA addresses the enterprise workflow level, microservicesaim for a smaller application-level scope. Other apparent differences for
2.3 | Microservices 53

them include independent bounded contexts with small services, the highdegree of automation, the organizational aspects related to DevOps teams(“you build it, you run it”), the preference of choreography over orchestration,and a potentially higher degree of technological heterogeneity.Xiao et al. [XWQ16] describe microservices and SOA as allies that should
be leveraged to enable a bi-modal or two-speed IT in the digital age. Theircomparison highlights autonomy, size, and the development and deploymentcycle as main differences. Additionally, decentralized governance and differ-ent communication and message exchange protocols are pointed out. Apartfrom these, a lot of similarities are mentioned, mainly the focus on organiz-ing services around business capabilities and service-oriented principles likestatelessness, reuse, and abstraction.Salah et al. [SJC+16] take a broad evolutionary perspective and compare
the client/server architecture, mobile agents architecture, SOA, and microser-vices. They describe a direct line of evolution from client / server to SOA andfrom there on further to microservices. Main differences for them includehigh service independence and decentralization, fine-grained services withbounded contexts, fast software delivery, and lightweight communicationvia “dumb pipes” with no middleware focus.Lastly, Richards [Ric16b] presents the most “revolutionary” perspective.
He argues that SOA focuses on large, complex, enterprise-wide systems,whereas microservices target small to medium web-based applications. Like-wise, SOA follows a “share-as-much-as-possible” approach, while microser-vices are based on the “share-as-little-as-possible” principle. For Richards,microservices are located on the other side of the service-oriented spectrumas SOA. He focuses very much on differences, not so much on commonalities.Other notable microservices differences presented are the low degree ofcentralization and standardization, a minimal number of lightweight com-munication protocols as opposed to SOA’s protocol-agnostic heterogeneousinteroperability provided by an ESB, and the focus on bounded contexts asopposed to SOA’s focus on abstraction and business functionality reuse.All in all, however, the majority of authors focuses on the broad set of
architectural commonalities, which is a perspective that we also support
54 2 | Technical Background

in this thesis. We conclude this discussion with a quote from Newman’sbook [New15, p. 9], where he comments the following on the SOA vs.microservices debate:
“ So you should instead think of microservices asa specific approach for SOA in the same waythat XP or Scrum are specific approaches forAgile software development. ”— Sam Newman
2.4. Software Evolution
While software continues “to eat the world” [And11], it becomes all themore important that systems can be quickly adapted to new or changedrequirements. As more and more business processes are not only supportedby software, but digital goods and services form the essence of entire busi-nesses, the sustainable evolution of the underlying software is a vital concernfor many enterprises. For applications used in fast-moving markets, it isespecially crucial to adapt existing functionality and to add new function-ality. How well developers are able to do this for existing software can bedescribed with different quality attributes (Section 2.4.1) and is influencedby various factors (Section 2.4.2).Software evolution and flexibility receive much attention today. However,
there is already a long history of research in these areas. One of the firstresearchers who highlighted the importance of preparing software for itsevolution was David Parnas. He conceptualized today’s ubiquitous notion ofmodularization [Par72] and formulated prerequisites to ease the extensionand contraction of software functionality [Par79]. He also was amongthe first to emphasize the design principles of abstraction and informationhiding [PCW85] that are essential for modern software design.Bennett and Rajlich made other important contributions. According to
their staged model of software lifespan [BR00], software can be in five differ-
2.4 | Software Evolution 55
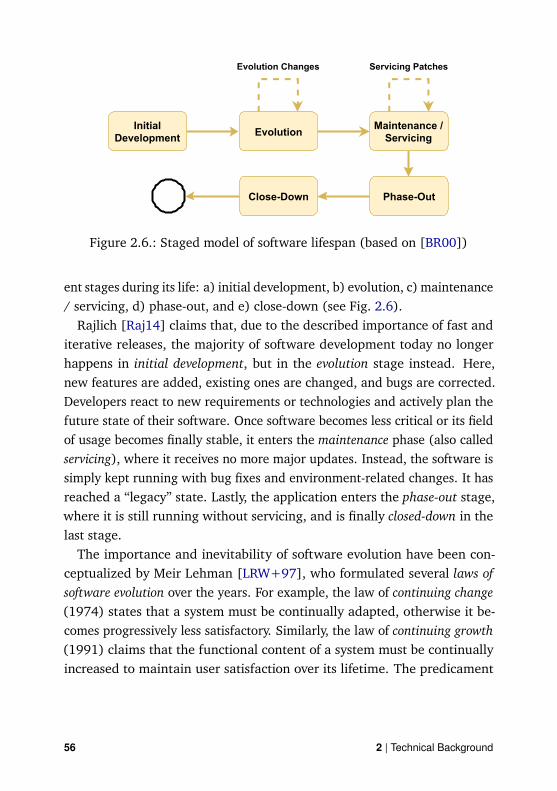
���������� �����
���������������������������� ����������� ������������������� ���
�� ! "#$%&%#'()%�!
*&'#+! '�," �!%�"�-%./0%1& - �2
34"5%67+!8#'5%6$'9�
*&'#+! '�.84"�2%5 0%1& - �2.3"!-4%5
Figure 2.6.: Staged model of software lifespan (based on [BR00])
ent stages during its life: a) initial development, b) evolution, c) maintenance/ servicing, d) phase-out, and e) close-down (see Fig. 2.6).Rajlich [Raj14] claims that, due to the described importance of fast and
iterative releases, the majority of software development today no longerhappens in initial development, but in the evolution stage instead. Here,new features are added, existing ones are changed, and bugs are corrected.Developers react to new requirements or technologies and actively plan thefuture state of their software. Once software becomes less critical or its fieldof usage becomes finally stable, it enters the maintenance phase (also calledservicing), where it receives no more major updates. Instead, the software issimply kept running with bug fixes and environment-related changes. It hasreached a “legacy” state. Lastly, the application enters the phase-out stage,where it is still running without servicing, and is finally closed-down in thelast stage.The importance and inevitability of software evolution have been con-
ceptualized by Meir Lehman [LRW+97], who formulated several laws ofsoftware evolution over the years. For example, the law of continuing change(1974) states that a system must be continually adapted, otherwise it be-comes progressively less satisfactory. Similarly, the law of continuing growth(1991) claims that the functional content of a system must be continuallyincreased to maintain user satisfaction over its lifetime. The predicament
56 2 | Technical Background

gets obvious when this inevitability of evolution is combined with two otherlaws. The law of increasing complexity (1974) states that, as a system evolves,its complexity increases unless work is done to actively reduce it. The law ofdeclining quality (1996) states that the quality of a system will appear tobe declining unless it is rigorously maintained and adapted to operationalenvironment changes. Together, the laws provide an axiomatic foundationfor software evolution. They describe that evolution cannot be avoided for asuccessful system and that a system’s quality needs to be actively improvedto endure this evolution for extended periods of time.
2.4.1. Quality Attribute Definitions
Many names for quality attributes have been coined to describe a system’scapacity to be changed or maintained and their exact meaning as well asdifferences between them are not always apparent. In this thesis, we use twodifferent quality attributes, namely maintainability and evolvability, whichwe define and contrast in this section.
Relying on a mixture of ISO 25010 [Int11a] and the definition from Roweet al. [RLL98], we define maintainability as the degree of effectiveness andefficiency with which a software system can be modified to correct, improve,extend, or adapt it. These four types of maintenance can therefore be putinto two groups (see Fig. 2.7). While requirements are stable, correctiveor perfective maintenance is performed. With a change in requirements,adaptive or extending maintenance becomes necessary. Low maintainabilityof a system is sometimes associated with issues like bugs that are visibleto the end-user, even though this is more related to the quality attributefunctional correctness. Nonetheless, fixing a bug is a frequent maintenancetask and improving maintainability is typically associated with source codequality and low-level design.
2.4 | Software Evolution 57

���������� ����
��� ���������� ��������� ��� �� ����������������������������� ���
� !!"#$%&"
'"!("#$%&"
)*+,$%&"
-.$"/*%/0
1$+23"4!"56%!"7"/$8 �9+/0"*:/";4!"56%!"7"/$8
1 ($;+!"4<+%/$"/+/#"
Figure 2.7.: Modes of maintenance (based on [RLL98])
As pointed out above, the adaptive and extending notions of maintainabil-ity have acquired particular interest over the years. We refer to the qualityattribute for these areas as evolvability. Based on Rowe et al. [RLL98] andBode [Bod09], we define evolvability as the ability of a software systemto efficiently accommodate changes and extensions to its functional andcross-functional requirements that influence the system’s architecture ordesign while maintaining architectural integrity.���������� ����
��� ���������� ��������� ��� �� ����������������������������� ���
� !!"#$%&"
'"!("#$%&"
)*+,$%&"
-.$"/*%/0
1 ($2+!"34+%/$"/+/#"
1 ($2+!"3-& 56$% /
Figure 2.8.: Evolution as a subset of maintenance (based on [RLL98])
58 2 | Technical Background

Following this definition, evolvability can therefore be seen as a subset ofmaintainability that mostly influences adaptive and extending maintenancetasks (see Fig. 2.8). As such, evolvability is associated with new features andchanging requirements. Unlike bugs, issues with this quality attribute areinvisible to the end-user. Users of a system may only notice that new featuresare implemented very slowly or not at all. Apart from this, however, theyhave no indication for a system’s state of evolvability. Improving evolvabilityis mostly focused on architecture and high-level design.A slightly different view is taken by Rajlich [Raj18], who insists on a
very strict separation between maintainability and evolvability: for him,software evolution consists of perfective changes which add new functionalityor properties (as opposed to the notion of adaptive and extending changesfrom Rowe et al.). Evolvability would therefore be more demanding thanmaintainability, which corresponds nicely to our subset definition again.Ergo, software that is evolvable is automatically maintainable, but not viceversa. Likewise, you cannot evolve unmaintainable software, but youmay stillbe able to maintain software that cannot be evolved any longer. This is alsoemphasized by the clear distinction between the evolution and maintenancephases of the staged model of software lifespan (see Fig. 2.6).Lastly, Rajlich [Raj18] states that evolvability is mostly influenced by three
different factors: a) system properties, b) human factors, and c) evolutiondemands. We can only achieve sustainable evolution when the states ofthese fundamental aspects correspond to each other. On the other hand,deficiencies in one area can be compensated by other areas, e.g. a very skilledteam can still take-over and evolve a low-quality system or an inexperiencedteam may still be able to fulfill simplistic evolution demands. Even thoughsome microservices characteristics touch human and organizational factors,the majority of this thesis focuses on system properties to analyze and improveevolvability.
2.4 | Software Evolution 59

2.4.2. Design Properties
As pointed, there are several design properties (also sometimes called inter-nal quality attributes) that influence maintainability and evolvability. Eventhough the intricate details of a relationship between a system design prop-erty P1 and a quality attribute QA1 can be reasonably nuanced, it is usuallypossible to state that – generally speaking – a higher degree of P1 is eitherbetter or worse for QA1. In the following sections, we describe the mostcritical design properties that may impact evolvability. To outline their rela-tionship with evolvability, we use a metamodel concept from the Quamocoquality model [WGH+15] called Product Factor. A Product Factor isa combination of an Entity (some part of a system) and a Property (someinternal attribute of the system part), which impacts a Quality Aspect
(in our case evolvability), either positively or negatively.���������� �����
���������������������������� ����������� ������������������� ���
�� !"#$%�& $&'# ()* +
,-&�&.
�/01//)$�1& *0!�&%
21$&)#
%1/3#)*'$&021$&)#
%1/
%1/4./& 5
67# // /
$)-/�/&/0)8
"#$%�& $&'# 9 /$#�7&�)-
"#$%�& $&'#
71#&:)8
�/:1
)-
;571$&
<'1+�&.0"/7 $&
=>>? =>>?
;4@0ABC=C
<'15)$)
Figure 2.9.: Quamoco in relation to ISO 42010
These concepts can be conveniently related to ISO 42010 via the termsArchitecture Model and System, i.e. a Quamoco Entity can be part of
60 2 | Technical Background

an Architecture Model while a System has several Quamoco QualityAspects (see Fig. 2.9).The following notation is used to describe Product Factors:
[Entity | PROPERTY]+|−−−→ [Quality Aspect]
Or with a concrete example:
[Function | COMPLEXITY]−−→ [Analyzability]
The Entity function has a Property complexity, which has a negativeImpact on the Quality Aspect analyzability. In principle, Entities canbe any element of a software system, as they form a hierarchical decomposi-tion tree. In our case, we use a service or the complete system as the Entityand evolvability as the Quality Aspect.
2.4.2.1. Size
The size (sometimes also called volume) of software has always been a rele-vant yet controversial property. Typical use cases for it are effort predictionfor cost estimation [VT92] or productivity measurement [KM04]. While themost common metrics for the size of a piece of software are lines of code(LOC) or source lines of code (SLOC), there are also programming languageagnostic measurements like function points [AG83]. The larger an applica-tion is (both from the LOC and functionality perspective), the more effortwe usually need to maintain and evolve it. However, there are certainlycases where a large application can be considered more evolvable than asmall one, simply because its other design properties or code quality aremore beneficial. Therefore, size on its own can sometimes be a dubiouspredictor for maintainability. Nonetheless, more volume leads to more timeneeded for program comprehension and a developer can only keep familiarwith a limited amount of code [FOMM10]. In their study of maintainabilitymetrics with small scale software systems, Sjøberg et al. [SAM12] concludedthat size metrics were the only ones to strongly correlate with the observed
2.4 | Software Evolution 61

maintenance effort. LOC is therefore often used for normalization in empiri-cal studies on other software attributes to avoid confounding effects. All inall, however, we can still state that a larger system (or service) is harder toevolve than a smaller one (provided all other properties are similar):
[System | SIZE]−−→ [Evolvability]
2.4.2.2. Granularity
While software size has an important influence on evolution, how this volumeis allocated, i.e. the decomposition or componentization, may be even morecritical for analyzing and maintaining a system [BCDV11]. We refer to thisallocation degree of functionality to top-level components (or services) asgranularity. A system that contains only one or two very large services withall the functionality in there is not very evolvable. Likewise, a system thatconsists of a vast number of very small components may also be hard tomaintain. The cognitive psychologist Miller [Mil56] determined that humansare generally able to use their short-term memory for working with 7 ± 2objects. Systems consisting of much more than seven top-level components(or services) are therefore harder to reason about for developers, whichhas implications for both SOA and microservices. In this sense, Bouwers etal. [BCDV11] concluded that the best degree of analyzability can be achievedwith a manageable number of top-level components of fairly even volume,i.e. low variation in size.In the realm of service-oriented computing, granularity receives special
attention, as the question of how much functionality a service should offer isnot easy to answer [HSLP08]. With SOA, developers usually strive for morecoarse-grained services, while the opposite is true for microservices. Still,the focus on business-relevant functionality reuse is true for both paradigms,which makes services, in general, more coarse-grained than e.g. componentsor classes. Service granularity therefore also influences the degree of servicecomposition necessary to achieve a complete business process [PH06]. Con-trary to other design properties, it is difficult to formulate a simple “more −→
62 2 | Technical Background

better” relationship between granularity and evolvability. As pointed out,both too fine-grained and coarse-grained services may have negative effectson evolvability. Nonetheless, we formulate a product factor with a positiveimpact, in the sense that “better” granularity leads to better evolvability:
[System | GRANULARITY]+−→ [Evolvability]
2.4.2.3. Complexity
Software complexity is a design property that is difficult to define and hasbeen approached from different angles. Early definitions focused on theamount and variety of internal work carried out by a function or moduleand the degree of interaction necessary to achieve this, which is why metricslike McCabe’s cyclomatic complexity [McC76] analyze the possible controlflow paths through a program. Other more general definitions closely linkedcomplexity to analyzability and the effort necessary to understand andinteract with a system [Kem95]. Since this view can make it sometimesdifficult to differentiate between complexity and other design propertieslike size or coupling, we therefore lean more towards McCabe’s notion ofcomplexity in this thesis. Having two services of similar size and with similardependencies, one of them can be much harder to understand and evolveif its provided functionality is very sophisticated and governed by manydifferent control structures.Brooks [Bro87] also made the distinction between essential complexity,
i.e. complexity that is inherent to the problem or functionality at hand,and accidental complexity, i.e. complexity that was unnecessarily createdthrough e.g. bad design or coding. To reduce this accidental complexity onan architectural level, Lilienthal [Lil09] suggested three strategies adoptedfrom cognitive psychology: a) chunking, i.e. aggregating related piecesinto a larger unit, which is the basis for software modularity, b) forminghierarchies, i.e. assigning the created chunks to different structural levels,which is important for the ordering of and relationships between modulese.g. in a layered architecture, and c) using schemata, i.e. familiar mental
2.4 | Software Evolution 63
concepts with known definitions to aid future understanding, which can beachieved with patterns and a consistent style. Bouwers et al. [BVLD10] alsohighlighted the importance of environmental factors like the availabilityand extent of documented information about the architecture, but also theamount and variety of used technologies or libraries, which has implicationsfor microservices.While the definition of complexity is not very straightforward, its relation-
ship with evolvability is clear. The more complex a system or service, theharder it is to understand and evolve:
[Service | COMPLEXITY]−−→ [Evolvability]
2.4.2.4. Coupling
In a modular system that is decomposed into several classes, components,or services, there are usually relationships between those different entities,e.g. one service invokes an operation of a second service. The degree towhich such dependencies exist in a system is referred to as coupling, i.e. ifa module is changed and this specific change leads to subsequent changesin other modules, these modules are coupled together [Fow01]. Couplingbetween two entities can be of different strength and manifest in differentways. In an object-oriented system, a class may e.g. be coupled to anotherclass because it invokes one of the other class’s public methods, because ithas an attribute that is of type of the other class, or because it inherits fromthe other class [BDW99]. Fowler [Fow01] also states that, while we cannotavoid coupling completely in a modular system, we still need to control it byconsciously managing the number and strength of existing dependencies.In the service-oriented world, coupling between services is proclaimed to
be “loose”, meaning that dependencies between services are supposed tobe “weaker”, i.e. based on less assumptions, as e.g. dependencies betweenclasses. To explore this rather fuzzy notion more clearly, Pautasso andWilde [PW09] conceptualized a framework with 12 different service-orientedcoupling facets like discovery, binding, or interface orientation. For each of
64 2 | Technical Background

these facets, they described how tight and how loose coupling would looklike, e.g. for the facet discovery, tight coupling would be based on registration,while loose coupling would rely on referral.Fehling et al. [FLR+14, p. 156f] describe loose coupling in terms of
four dimensions of communication autonomy and set it in close relation tomessage-oriented middleware. Platform autonomy specifies that communica-tion partners can be implemented with different technologies and reside indifferent execution environments. Reference autonomy states that partnerscommunicate via the network without being aware of concrete addressesor even how many parties they are interacting with. Time autonomy meansthat partners may communicate asynchronously, i.e. they can send or receivemessages at their own speed. Furthermore, a receiver can be temporarilyunavailable and still receive the message once connectivity is reestablished.Lastly, format autonomy requires that data (de)serialization and transforma-tion is used to enable communication between partners that use differentdata formats, e.g. JSON and XML.All in all, a system with loosely coupled services and few inter-service
dependencies is easier to maintain. Therefore, a high degree of coupling hasa negative impact on evolvability:
[Service | COUPLING]−−→ [Evolvability]
2.4.2.5. Cohesion
While loose coupling is concerned with reducing relationships betweensoftware entities on the same level (e.g. services), it is also desirable tohave stronger connections between internal elements of such an entity (e.g.between the operations of a service). This degree of internal relatednessis called cohesion [BK95]. In a highly cohesive software entity, code con-tributes towards one task or functionality, which also makes the entity hardto split. The intent of having cohesive software units is to place relatedfunctionality that is likely to change together in the same location. Foran object-oriented system, class cohesion is therefore the degree to which
2.4 | Software Evolution 65

attributes and methods of this class are related to each other [BDUU98].In service-oriented computing, the focus on encapsulating business-relevant
and related functionality in services makes high cohesion very desirable.Perepletchikov et al. [PRF07] derived four characteristics that indicate highcohesion for a service: a) its operations rely on the same input parametersor return values (data), b) individual service consumers use the majority ofoperations offered by the service (usage), c) individual service consumerssequentially invoke different operations from the service (sequential), andd) its operations are provided by the same implementation elements (im-plementation). Furthermore, they defined seven service-oriented cohesioncategories to capture the different aspects of cohesion.
1. Coincidental cohesion: service operations have no meaningful relation-ships with each other (lowest level of cohesion).
2. Logical cohesion: service operations share the same utility-relatedintent, e.g. updating or retrieving data.
3. Communicational cohesion: service operations rely on the same dataabstractions.
4. External cohesion: a service consumer uses all offered service opera-tions.
5. Sequential cohesion: service operations are invoked sequentially andoutput from one operation serves as input for the next.
6. Implementation cohesion: service operations are implemented by thesame software elements.
7. Conceptual cohesion: service operations are connected via meaningfulsemantic relationships, preferably via a domain-level concept (highestlevel of cohesion).
In summary, high cohesion is beneficial for evolvability. A service withstrongly related operations that contribute towards one business function is
66 2 | Technical Background

easier to analyze and evolve:
[Service | COHESION]+−→ [Evolvability]
2.4.3. Technical Debt
As is typical in all human activities, software engineers sometimes producesuboptimal design or code for a problem at hand. This often happens uncon-sciously because of a lack of experience or unknown requirements. However,it may also be a deliberate decision, e.g. because the project is currentlyunder time pressure, so a faster yet inferior solution is implemented, po-tentially with the intention to replace it later on. For this phenomenon,Cunningham [Cun92] coined the metaphorical concept of technical debt, i.e.by delivering working yet suboptimal software, you take on a debt that youeventually have to address:
“ Shipping first time code is like going into debt.A little debt speeds development so long as it ispaid back promptly with a rewrite. [...] Thedanger occurs when the debt is not repaid. Everyminute spent on not-quite-right code counts asinterest on that debt. ”— Ward Cunningham
Since then, the concept of technical debt has become increasingly popularto explain the importance of software quality to non-technical stakeholders,which led to the usage of various terms for different kinds of debt such asarchitectural, code, or even requirements debt. Kruchten et al. [KNO12]state that technical debt is not always caused by suboptimal decisions, butmay also accumulate naturally due to external events, such as changes in theenvironment or the rise of new and better technology. They also proposedto limit technical debt to invisible elements in the space of maintenance andevolution (see Fig. 2.10), i.e. issues that are not visible to end-users of thesoftware.
2.4 | Software Evolution 67

���������� �����
���������������������������� ����������� ������������������� ���
�� �!"# �� �!"#$% &"'()*+� �!"#
,+%"-&�%*() -# .(,+%"+/!�"�&' 0-/"�&'() -# .($/�*&/�*/!�"�&'
1#2(3#/&-4# 56/*7#8(3-*9&�%*/"�&'
:#;#9& <%2(,=*/"(0-/"�&'
>496�	&-4#>496�	&-4#(?@#"" A/&*(��%"/&�%* ?&4-9&-4/"(:#;�9�#*9�#
5%8#5%8#(5%@B"#=�&'5%8#(?@#"" 5%8�*7(?&'"#(��%"/&�%*
C#96*%"%7�9/"(D/B
E&6#4(>4&�;/9& C# &�*7(:#;�9�#*9�# :%9-@#*&/&�%*() -# :#B"%'@#*&() -#
Figure 2.10.: Technical debt landscape (adopted from [KNO12])
In line with the financial metaphor, technical debt is associated with animpact on costs, usually in the form of (additional) development efforts.These costs are a combination of the debt principal, i.e. the costs or effort thatwould need to be expended to remove the debt, and the debt interest, i.e. theaccumulation of additional costs due to the unaddressed debt [AKOS16]. Todeal with these costs, conscious and systematic technical debt managementis suggested. Such management may include activities like debt identifi-cation and documentation, debt quantification and prioritization, or debtmonitoring and repayment [BMB18].
2.5. Evolvability Assurance
After defining and detailing evolvability as the primary quality attributeof this thesis, we now present foundations associated with ensuring that asufficient degree of evolvability is present in the system at hand. We refer tothe set of activities that developers perform to provide sufficient confidencethat they can sustainably evolve their software as evolvability assurance.Important related concepts are evolvability evaluation and quantificationor the improvement of suboptimal code or components, but also process-
68 2 | Technical Background

related aspects. Since evolvability assurance is a subfield of software qualityassurance, we first present the beginnings of this discipline.
2.5.1. Software Quality Assurance
As software became more and more complex and pervasive, defective or low-quality software started to be very likely, often with dramatic impacts. Toaddress this, the software development industry adapted systematic methodsfrom other engineering disciplines, which led to the founding of softwarequality assurance (SQA). Major rationales to apply SQA are the avoidanceof legal liability, the improvement of long-term cost effectiveness, and thethorough satisfaction of customer requirements [BP84].There are generally two facets to SQA [Kit89]: we can evaluate and im-
prove the software process, i.e. how the software is developed, or we candirectly assess the software product, i.e. the outcome of the process. Thisthesis focuses on the latter and is solely concerned with software productquality. SQA activities are usually either of an analytical nature to identifyissues or of a constructive nature to remediate issues [Wag13]. Such activitiesinclude, for example, techniques like code review, refactoring, standardiza-tion, guidelines, conscious technical debt management, and the usage oftools (e.g. for static code analysis), metrics, or design patterns. We explainthe techniques that are most relevant for this thesis in the upcoming sections.For larger systems, SQA activities often form a communicated assuranceprocess and are an essential part of the development workflow.
2.5.2. Refactoring
One of the most important constructive SQA techniques is refactoring, whichhas been defined as “the process of changing a software system in such away that it does not alter the external behavior of the code yet improves itsinternal structure” [Fow99, p. XVI]. As such, refactoring can be a valuableactivity to reduce knowingly incurred technical debt or to eliminate codesmells. However, it can be difficult to convince management of this impor-
2.5 | Evolvability Assurance 69

tance because it usually adds no visible value for end-users and may evenlead to defects if not executed with care [LML+15]. In modern softwaredevelopment organizations, the financial technical debt metaphor and therise of automated software testing usually address both of these concerns.Sound refactoring practices can significantly improve software quality andtherefore decrease long-term development costs, which has been supportedby several empirical studies [KZN12; MC16].While refactoring is usually aimed at the code level, there are also archi-
tectural refactorings [Zim15] that operate on the component and connectorlevel, e.g. to remove architectural smells. Zimmermann [Zim15] differen-tiates between the architectural refactoring categories of elaboration, e.g.the distribution of data processing, adjustment, e.g. moving a deploymentunit to another server, and simplification, e.g. joining adjacent architecturallayers. In the service-oriented world, refactorings that split or merge servicesare very common, not only within the evolutionary design of microservices,but also in SOA environments. For the latter context, Erl [Erl09] conceptu-alized the patterns of service refactoring, service normalization, and servicedecomposition.
2.5.3. Quantitative Analysis: Metrics
Before constructive SQA techniques like refactoring can be applied, we usu-ally need analytical techniques to evaluate software quality and to identifyproblematic areas. One example for this is quantitative analysis with soft-ware metrics [BBL76]. In this context, Boehm et al. [BBL76] define a metricas a measure for the degree or extent to which software exhibits or possessesa specific quality characteristic. They also highlight that, in practice, metricsare usually incomplete measures of their associated attributes and that thereis no single metric for software quality. Nonetheless, it is possible (albeitsometimes difficult) to aggregate metrics and to assign them to e.g. trafficlight labels (green, yellow, red), which makes them more actionable [Kne18].This, however, requires the derivation of sensible metric thresholds.To provide a formal framework for software metric definition, Briand
70 2 | Technical Background

et al. [BMB96] introduced several concepts for “property-based softwareengineering measurement” and defined how these concepts take shape forcommon design properties like size or complexity. We use size as an exampleto illustrate some of these concepts:
• Nonnegativity requires that a size metric cannot have negative values.
• Null value requires that a size metric for a system with an empty set ofelements is 0.
• Additivity requires that values of a size metric for all disjoint modulesof a system can be summed up to the system level.
While there are a lot of challenges associated with the definition, opera-tionalization, and interpretation of effective software metrics, Staron andMeding [SM18] advocate that a lot of benefits can be gained from a holisticand systematic software development measurement program within an or-ganization or company. As such, a measurement program is a frameworkthat uses measurement infrastructure and systems to analyze inputs such asprocesses, products, or people. From this analysis, a measurement programthen generates outputs such as decisions, insights, or early warnings.In the following sections, we explore the field of maintainability metrics
in greater detail. Presented metrics are structured into the two differentmeasurement approaches of static and dynamic analysis.
2.5.3.1. Static Analysis
A common way to evaluate the quality of software is to perform an analysisof existing design or development time software artifacts, most frequentlysource code. This process that is usually automated with tool support iscalled static analysis [Lou06]. A static analyzer receives a software artifactas input (most commonly source code), evaluates this artifact, and producesa quality report as output. This output can be software metric values, butalso identified bugs or antipatterns. Today, the most prominent tool for staticanalysis is SonarQube [CP13].
2.5 | Evolvability Assurance 71

The earliest approaches to measure software maintainability with staticanalysis were based on low-level metrics that focused on control-flow, func-tions, size, complexity, or semantic program understandability. Mentionableones are McCabe’s cyclomatic complexity [McC76] (a metric representingthe number of independent control flows through a program), the metricsof Halstead [Hal77] (using program length and vocabulary to calculatemetrics like program volume or difficulty), Berns’s approach to quantifyprogram difficulty by assigning weights to the different syntactic source codeelements [Ber84], or Coleman et al. [CALO94] who used existing metricsto compute a holistic maintainability index. All these approaches neededthe complete source code of the system and were, to some degree, onlyapplicable to software written in the procedural style. Moreover, the signifi-cance and benefit of most of these relatively old metrics are questionable,especially for modern software systems [OW14].The emergence of object orientation (OO) led to a re-evaluation of existing
metrics and the creation of new ones. The most influential OO metric suiteswere the ones from Li and Henry [LH93] (LH metrics) and Chidamber andKemerer [CK94] (CK metrics). The LH & CK metrics were partly adaptationsof existing metrics to the OO space, e.g. Weighted Methods per Class (WMC)is the summed up complexity of all methods in a certain class. However,they also included new metrics for individual classes like Depth of InheritanceTree (DIT, length of longest inheritance path to the root element), CouplingBetween Object classes (CBO, number of couplings with other classes inducedvia method or attribute usage), Response For a Class (RFC, maximum numberof methods to be executed in response to an incoming method call) or Lack ofCohesion in Methods (LCOM, number of pairwise methods with no commonparameters). These metrics received much attention in the research andpractice community and have been extensively used and evaluated.Bansiya et al. [BD02] created a hierarchical 4-layer design model for
the quality of object-oriented software (Quality Model for Object-OrientedDesign, QMOOD) that associates metrics (level 3) of design components(level 4) with design properties (level 2) that in turn influence design qualityattributes (level 1). However, QMOOD covers slightly more than maintain-
72 2 | Technical Background

ability, e.g. also the quality attributes functionality or effectiveness. The solidfoundations of QMOOD have been evaluated and compared to other OOquality models (see e.g. [EEBF04]).Since the LH and CK metrics mainly target a single class and systems
started to grow larger and larger, several researchers tried to adapt them tothe level of modules. Lindvall et al. [LTC03] proposed the metric CouplingBetween Modules (CBM) to eliminate the notion of intra-module couplingpresent in CBO. Similarly, Sarkar et al. [SRK07] present a set of module-level metrics and their (mostly) derived OO siblings [SKR08] that focus onmodule interfaces. Their metrics include a Module Interaction Index (MII,the degree to which incoming calls use the designated module service API)or a Module Size Uniformity Index (MSUI, the degree to which modules ofa system are of comparable size). Similar to object orientation, the rise ofservice orientation required the adaptation and creation of new metrics, forwhich we discuss recent related work in Section 3.3 and our contributionsin this area in Chapter 6.
2.5.3.2. Dynamic Analysis
Since static analysis is concerned with artifacts at design or developmenttime, its results may be an imprecise representation of the actual executionof the software in some cases. An alternative to collect software metricsis therefore dynamic analysis [TLMT12], i.e. to observe and documentthe system’s behavior at runtime. Dynamic metrics already have a longhistory and a large number of them have been proposed [KG10b; TM12].Analyzing the system execution may also produce additional maintainability-related insights that static analysis cannot, especially in the area of dynamiccoupling [ABF04]. Ergo, dynamic analysis can be used to collect generaldesign time maintainability metrics like static coupling, e.g. the numberof outgoing dependencies of a component, but can also extend this staticinformation with runtime data, e.g. the number of times a componentinvoked another component during the measurement timeframe. Thesedynamic aspects can often provide a more relevant evaluation based on the
2.5 | Evolvability Assurance 73

actual usage of the software. In other cases, static analysis may be infeasiblefor specific metrics, making runtime evaluation the only option.However, there are also some weaknesses of dynamic analysis. For one,
the evaluation quality depends on the richness and completeness of runtimedata. Software elements not used during the recording are not registeredand therefore the resulting metrics may be inaccurate. This may be espe-cially relevant for very large systems with diverse functionality. Similarly,automated measurement at runtime is often very invasive and requires soft-ware modification. Using non-invasive techniques would most likely result ineven larger inaccuracies or even no values for some metrics. In addition tothe invasiveness vs. data quality trade-off, we must also consider potentialperformance impacts. Due to the documentation of runtime calls, there isadditional load in the system, even though this overhead may be small withspecialized tools. Nonetheless, the usage of such an approach with a criticalproduction system needs to be carefully evaluated. All in all, dynamic main-tainability analysis can represent a valuable extension or even alternative tostatic analysis.
2.5.3.3. Criticisms of Maintainability Metrics
There is also a wide variety of publications that focus on the limitations of thecurrent metric-based approaches and of maintainability metrics in general.Pizka and Deißenböck [PD07] argue that traditional maintainability metricsprovide an inferior understanding of what maintainability actually is andinstead propose a software product quality model with strict separationbetween activities and properties of the system. This notion is supported byHeitlager et al. [HKV07], who also tried to create a more practical qualitymodel for industry. Ostberg and Wagner [OW14] criticize existing “aged”metrics like McCabe’s cyclomatic complexity or the Halstead metrics for be-ing not only inconvenient and partly incomprehensible for practitioners, buteven for sometimes producing misleading results. They propose a set of met-rics that apply to most kinds of systems (e.g. clone coverage, test coverage,or comment ratio) based on workshops with industry partners. To alleviate
74 2 | Technical Background

some of the shortcomings of cyclomatic complexity, Campbell [Cam18] sug-gested cognitive complexity as a more sensible replacement. Lastly, Broy etal. [BDP06] pointed out that evolvability has semantic aspects, which aretherefore not easy to measure. While automatically collectable maintainabil-ity metrics may provide fast quantitative insights, they have their limitationsand need to be interpreted with care [BVV12].
2.5.4. Qualitative Analysis: Scenarios
As pointed out above, quantitative software quality assessment with metricscan often be automated with tools and is therefore fast and reliable. However,we also described that achieving healthy metric usage and interpretationis not trivial. Maintainability metrics are a structural proxy for how effec-tively and efficiently software can be modified, which relies on the nature ofthe selected modification. Common maintainability metrics, however, pro-vide a general quantification and cannot take specific changes into account.A promising evaluation alternative or complement is therefore qualitativescenario-based analysis [KABC96], which focuses on the architecture of asystem. Kazman et al. [KABC96] describe scenarios as “brief narratives ofexpected or anticipated use of a system from both development and end-userviewpoints”. While scenarios can be used during requirements engineeringor for the documentation of functionality, they are also valuable for qual-ity evaluation. During such a method, different scenarios for the futureevolution of the system are collected (scenario elicitation) and documented.Elicitation takes place as a group effort from various stakeholders such asdevelopers, architects, operators, or end-users. Scenario documentation of-ten happens according to a standardized scenario template and can includevarious aspects of software architecture change characterization [WC10].Afterwards, the system’s capacity to accommodate the elicited scenariosis evaluated, which may help in identifying architectural issues. Table 2.2shows a concrete example of such an evolution scenario. The used templateis an adapted version of the template from Bass et al. [BCK12].
2.5 | Evolvability Assurance 75

Table 2.2.: Example of an evolution scenario
Scenario Attribute Scenario Value
Title: Add GitHub as a new login optionDescription: To provide a more convenient login and ac-
count management experience for most users,a single sign-on option with a GitHub accountshould be implemented.
Attribute: EvolvabilityStimulus: End-users request new login optionAffected artifacts: LoginComponent, UserInterfaceComponent,
UserManagementComponentEnvironment: Design timeResponse: Modifications are implemented, automatic
tests are created, components are deployedExpected effort: 8 hours
Several scenario-based methods have been proposed so far. An early liter-ature survey by Dobrica et al. [DN02] discussed eight notable architectureanalysis methods, from which six rely on scenarios. One of the earliestapproaches in this area were change cases from Ecklund et al. [EDF96]. Byadapting use cases from object-oriented analysis, they created a concept toidentify and document potential future changes of the system. Change caseswere then used to improve the existing system design. A more prominent andinfluential method was the Software Architecture Analysis Method (SAAM)from Kazman et al. [KABC96]. It can target several quality attributes, but isusually focused on modifiability. SAAM consists of the following steps:
1. Describe candidate architecture: architecture documentation is cre-ated or collected as the foundation for the analysis.
2. Develop scenarios: scenarios are collected and documented. Theyshould cover diverse functions and roles of the system.
76 2 | Technical Background

3. Perform scenario evaluations: for each scenario, the technical stake-holders determine and document if the architecture is able to ac-commodate the scenario directly or if changes are necessary (indirectscenario). Change details and costs estimations are documented, too.
4. Reveal scenario interaction: as an indicator for appropriate separa-tion of concerns, stakeholders determine the degree to which severaldifferent scenarios impact the same component. Few scenario conflictsare beneficial.
5. Overall evaluation: scenarios are weighted based on their importance,which supports coming to a final evaluation verdict.
SAAM served as inspiration or predecessor for several other scenario-based methods, most notably the Architecture Tradeoff Analysis Method(ATAM) [KKC00] that was conceived at the Software Engineering Institute(SEI) in Pittsburgh. ATAM is a very structured and comprehensive methodwhich is not only focused on the analysis of how well a system fulfills itsdiverse quality requirements, but also – as the name suggests – on trade-offsand interplay between quality attribute goals. Similar to SAAM, two typesof scenarios are used within ATAM: a) use case scenarios that describe thecurrent usage of the system and b) change scenarios that try to describe theanticipated system usage in the future. The latter are further subdivided intonear-term and probable growth scenarios and more extreme and stressfulexploratory scenarios. ATAM’s process comprises nine steps:
1. Present the ATAM: the method is explained to the various stakehold-ers.
2. Present business drivers: the system’s business goals are explainedto clarify the most important architectural drivers.
3. Present architecture: the system’s architecture is described and setin relation to its business drivers.
4. Identify architectural approaches: important architectural knowl-edge for the system (e.g. existing patterns or architectural styles) iscollected and documented.
2.5 | Evolvability Assurance 77
5. Generate quality attribute utility tree: the system’s most importantquality attribute goals are refined as a prioritized utility tree.
6. Analyze architectural approaches: the collected architectural ap-proaches are analyzed w.r.t. their impact on quality attribute goals.This includes looking for weaknesses or sensitivity points.
7. Brainstorm and prioritize scenarios: stakeholders collect, docu-ment, and prioritize (e.g. via voting) use case and change scenarios(scenario elicitation step).
8. Analyze architectural approaches: as a reiteration of step 6, eachprioritized scenario is mapped onto existing architectural approachesthat have an impact on it.
9. Present results: all information and results documented during theATAM are summarized and presented back to the stakeholders.
While such methods provide very rich insights and are well suited toevaluate the impact of specific changes, they require significant manualeffort and the presence of several system stakeholders, often in a workshop-like fashion over several days. This large amount of effort with e.g. ATAMled to the creation of more focused and lightweight methods. One notableexample is the Architecture-Level Modifiability Analysis (ALMA) [BLBV04],which exclusively targets modifiability as a quality attribute. It also placesstrong emphasis on change propagation (“ripple effects”) and change costor impact estimation. We describe more recent lightweight methods ormethods proposed for service orientation in Section 3.4 while our owncontribution in the context of scenario-based evaluation for service-basedsystems is presented in Chapter 7.
2.5.5. Processes and Continuous Quality Assurance
Even though this thesis is not concerned with software process qualityassurance, it is nonetheless necessary to introduce some process-relatedconcepts. These concepts belong to the general area of continuous software
78 2 | Technical Background
engineering [FS17], a holistic philosophy to software development that triesto connect and intertwine all phases of the software lifecycle, most notablybusiness strategy & planning, development, and operations. One importantfoundation for this development approach are the following three levels ofcontinuous practices that build upon each other [FS17; SAZ17]:
• Continuous Integration (CI): developers frequently integrate theircode into a main branch of the repository (at least daily). The integra-tion usually triggers an automated workflow with steps like compila-tion or unit test execution. This workflow is also referred to as the CIpipeline. A failed CI pipeline run should be analyzed and fixed quickly.
• Continuous Delivery (CDE): as an extension to CI, the final step of asuccessful pipeline run now generates an executable software artifactthat is transferred to an internal location, e.g. an artifact repositorywhere it can be downloaded.
• Continuous Deployment (CD): as an extension to CDE, the final stepof a successful pipeline run now deploys the software to a customer-facing environment. The software is continuously ready to be releasedand is deployed without strict release cycles.
The described continuous practices have the goal to deliver working soft-ware more frequently while simultaneously striving for high software quality.This objective is also closely related to the DevOps paradigm [BWZ15], whichcan be similarly defined as “a set of principles and practices to bring softwarefaster and more reliably into production”. As the name suggests, DevOpsfocuses specifically on destroying barriers and improving communicationbetween development and operations. An important goal is to reduce cycletime, i.e. the time that passes between the development start of a featureuntil it is deployed to a production environment. To achieve this, strongemphasis is put on automation and tool support, usually in the form of aCI/CD pipeline.Since high quality is an essential prerequisite for delivering software
frequently, several steps of a CI pipeline are usually responsible for various
2.5 | Evolvability Assurance 79
forms of continuous quality assurance [SDP+14]. In principle, these steps cantarget any quality attribute, but, in practice, continuous quality assurancemostly focuses on functional correctness, e.g. via unit and integration tests, ormaintainability, e.g. via static and dynamic analysis. The goal of continuousquality assurance is to identify potential quality issues as early as possible.The earlier issues are detected, the less costly it generally is to address them.Various tools can be used for such an automated analysis that range fromsimple sensors to elaborate project intelligence platforms and dashboardtoolkits [DJH+08]. In addition to these identification techniques and tools,it is also necessary to define concrete quality attribute goals in combinationwith appropriate actions in response to deficits. Within a CI/CD pipeline, theconcept of a quality gate [SCLG16] exists, i.e. a defined rule or threshold thatneeds to be ensured in order for the pipeline step to be successful. Examplesfor quality gates are that a specific metric may not be larger than 20 or thatzero unit tests are allowed to fail. Missed quality gates stop the pipelineexecution and do not lead to the deployment of the artifact. As pointed outby Schermann et al. [SCLG16], the definition of quality gates is therefore atrade-off between deployment velocity and confidence: stricter quality gateslead to less releases, but also come with less risks for faulty or suboptimalsoftware in production.As already pointed out in Section 2.3.1, microservices place great emphasis
on DevOps and CI/CD practices. Without such a focus, it would be difficult toachieve increased deployability and modifiability with such a large number ofsmall services [Che18]. The larger the microservice-based system, the moreimportant continuous software engineering practices and an automatedservice deployment pipeline become. However, establishing these tools andpractices takes significant initial effort and may not be the best choice forevery organization [OEC17].
80 2 | Technical Background

Chap
ter 3
Related Work
In the previous chapter, we presented foundational concepts necessary tounderstand this thesis and described the general research field as a context toframe our contributions. In this chapter, however, we discuss more specializedresearch closely connected to our contributions, i.e. related work. These canbe studies that influenced our conducted research or studies that tried toachieve something similar in a different way. We structure the presentedpublications into thematic sections that resemble our contributions:
• maintainability-related literature studies (Section 3.1)
• empirical studies on the industry state of practice of (service-oriented)maintainability assurance (Section 3.2)
• service-based maintainability metrics (Section 3.3)
• lightweight or service-oriented analysis with scenarios (Section 3.4)
• (service-oriented) patterns and antipatterns for maintainability (Sec-tion 3.5)
In each of these sections, we focus on limitations or research gaps that weaim to address with our contributions later on.
81

3.1. Literature Studies
Systematic literature studies are secondary studies that identify, analyze,and summarize (scientific) publications within a particular research area ofinterest. As such, they present an overview of the state of the art in a specificsubfield – e.g. in our case the evolvability assurance of microservices – andmay point out research gaps or even a research agenda to close them.Several existing literature studies cover maintainability-related aspects
without focusing on a specific system type or architectural style. Breivold etal. [BCL12] conducted a systematic literature review (SLR) to collect studieson the architectural analysis and improvement of software evolvability. Theyidentified 82 primary studies that they structured into five categories, suchas quality considerations during design, architectural quality evaluation,architectural knowledge management, or modeling techniques. They didnot include service-oriented approaches.Similarly, Venters et al. [VCB+18] synthesized existing research for gen-
eral architecture sustainability in a non-systematic review. They definesustainability as a system’s capacity to endure. Service-oriented approachesare only briefly mentioned in the area of reference architectures, where someproposals for SOA are listed. Other described topics are the importance ofarchitectural decisions or metrics for the quantification of sustainability.
There are also several service-based literature studies focusing on SOA.Back in 2009, Gu and Lago [GL09] conducted an SLR to uncover generalservice-oriented system challenges. Using 51 primary studies, they identi-fied more than 400 challenges, most of them related to quality attributes,service design, and data management. Only three reported challenges wereassociated with maintenance, i.e. their review is broader than our intendedscope.A more fine-grained scope than the one intended by us was applied in the
literature review of Bani-Ismail and Baghdadi [BB18a]: they solely focusedon service identification (SI) in SOA and derived eight different challengesfor this activity. For them, the maintainability-related aspect of service
82 3 | Related Work

granularity represents one of the most crucial challenges.In another service-oriented SLR, Sabir et al. [SPR+19] analyzed the evolu-
tion of object-oriented and service-oriented bad smells as well as differenceswith their detection mechanisms. From 78 publications, they identified 56object-oriented and 19 service-based smells and presented details abouttheir detection approaches. Smells related to microservices are not covered.
Several more recent literature studies also focus exclusively on microser-vices. Di Francesco et al. [DLM19] used a systematic mapping study tocreate a research overview on architecting with microservices. They deriveda classification framework and used it to produce a systematic map of thetopics of 103 selected primary studies. While maintainability is mentionedin 43 studies as an important design goal or investigated quality attribute,the broad scope of the review prevents a more detailed discussion of howmaintainability is actually ensured.Lastly, Soldani et al. [STV18] systematically surveyed the existing grey
literature on microservices to distill their technical and operational “painsand gains”. Afterwards, they assigned the identified concerns to typicalstages of the software life cycle such as design or operation. The authorsbriefly discuss maintainability as an advantageous “gain” based on smallservice size and self-containment, but do not mention concrete techniquesfor its assurance.
In summary, none of the presented related studies focuses exclusivelyon evolvability and its assurance while simultaneously targeting service-and microservice-based systems. The studies that have a similar scope donot limit their review to service orientation and the ones that do are eithertoo general or too specific in their discussed aspects. We intend to closethis gap by presenting an SLR that explicitly analyzes the state of the artof evolvability assurance for service- and microservice-based systems (seeChapter 4).
3.1 | Literature Studies 83

3.2. Industry Surveys and Interviews
Complementary to surveying the scientific state of the art, it is essential toanalyze the current industry state of practice when trying to improve a field ofresearch. Such studies can help to identify relevant challenges or to confirmor reject common assumptions. Industry studies are usually performedeither quantitatively, e.g. with a survey via a web-based questionnaire, orqualitatively, e.g. via interviews with practitioners. In our case, we areinterested in the industry state of practice of evolvability assurance formicroservices. While we could not identify publications with a mostly similarfocus, several works survey related topics in the industry.First, we present general industry studies about maintainability or assur-
ance practices. Poort et al. [PMVV12] wanted to identify the importanceof non-functional requirements in software development projects as wellas their relation to project success. To achieve this, they surveyed 39 archi-tects of a Dutch IT services company and conducted two on-site workshops.Modifiability turned out to be the only quality attribute with a significant cor-relation between perceived criticality and project success, i.e. if modifiabilitywas seen as highly business-critical in a project, this project tended to be lesssuccessful. The authors suggested that modifiability was poorly understood,especially by customers. Moreover, it would get too little attention because itwas harder to quantify, had no immediate effect on end-users, and generallybecame much more important after the project’s end and the start of themaintenance phase.Yamashita and Moonen [YM13] conducted a survey with 85 professional
software developers about indicators of bad code quality (code smells). Theywanted to assess the level of knowledge about code smells, their perceivedcriticality, and the usefulness of code smell related tooling. One third ofdevelopers had never heard of code smells and the majority of respondentswas only moderately concerned about them. Those who were concernedstated product evolvability, end-product quality, and developer productivityas reasons. The most mentioned code smells were Duplicated Code, LargeClass, and Long Method. A majority of respondents wished for better tool
84 3 | Related Work

support regarding code smells, specifically during software evolution.To gain insights into the industry practice of refactoring, Leppanen et
al. [LML+15] interviewed 12 senior software architects or developers innine Finnish companies. Participants reported time pressure during pastproject stages as the primary reason for refactoring later on (“knowinglytaking shortcuts”). Furthermore, people would learn new skills and theirexpertise and familiarity with the domain would grow. Some also namedunclear requirements in the beginning as a reason. The authors reported anintuitive knowledge of developers that time spent refactoring paid itself backin the future. However, most had no measurements in place to quantify theneed to refactor and the impact of refactoring. Refactoring was frequentlyperformed in combination with new features because otherwise, it would behard to justify to external customers.
There are also some industry studies with a focus on service-based sys-tems. Voelz and Goeb [VG10] asked 42 quality experts and executivesabout their experience with quality control while developing a very largeservice-oriented software system. Regarding maintainability, participantshighlighted the importance of standardization as well as carefully designingservice interfaces to prevent client ripple effects of future changes. Moreover,the authors analyzed available quality design documents for the project andcompared them with similar documents for non-service-based projects. Theirfindings showed a substantial reduction in the number of concrete qualityrequirements for the service-oriented project. Only 15 new requirementswere introduced. For maintainability, there was a reduction to less than50% with only three new requirements. The authors suggested trust in thepositive influence of service orientation (e.g. modularity or reusability) aswell as the usage of new frameworks and tools as possible reasons. However,they also reported an increase in requirements for the separately treatedcategory testing.Lastly, Ameller et al. [AGAF16] surveyed 56 software professionals about
the importance and handling of quality attributes when designing service-based systems. Most participants saw QAs and functional requirements
3.2 | Industry Surveys and Interviews 85

as equally important. According to the results, dependability was seen asthe most important QA for service orientation. Interestingly, maintainabil-ity or modifiability were not explicitly mentioned. Similar to Voelz andGoeb [VG10], the authors assumed as a reason for this that the generalarchitecture of service orientation already comes with a substantial baselevel of maintainability.
There are also several empirical studies specifically about industry experi-ences with microservices. Baškarada et al. [BNK18] conducted 19 in-depthinterviews with experienced architects. They discussed opportunities andchallenges associated with the adoption and implementation of microser-vices. Based on the results, they identified four types of corporate systemswith different levels of suitability for microservices. Especially large corpo-rate systems of record like Enterprise Resource Planning (ERP) were notseen as appropriate targets. In this context, organizational challenges suchas DevOps methodologies would be less serious for Information and Com-munication Technology enterprises than for traditional organizations, whereIT was perceived as a “necessary evil” [BNK18].Ghofrani and Lübke [GL18] conducted a similar empirical survey among
25 practitioners that were mainly developers and architects. Their objectivewas to find perceived challenges in designing, developing, and maintainingmicroservice-based systems. The results reveal a lack of notations, methods,and frameworks for architecting microservices. Several participants namedthe distributed architecture as responsible for the challenging developmentand debugging of the system. Participants generally prioritized optimizationsin security and performance over aspects like resilience, reliability, or faulttolerance.In their interviews with 10 microservices experts from industry, Haselböck
et al. [HWB18] focused on design areas of microservices and associated chal-lenges. The study identified 20 design areas and their importance as ratedby the participants. The authors confirmed design principles and commonchallenges from earlier mapping studies. Interviewees also discussed theirrationales. Microservices design is a fundamental aspect for their evolvability
86 3 | Related Work
later on. As such, we see this study as a valuable contribution to the topic athand.Lenarduzzi and Taibi [LT18] investigated technical debt interest by means
of a long term industry case study where they monitored the migration of amonolithic legacy system to microservices. The study aims to characterizetechnical debt and its growth comparatively in both architectural styles. Asa preliminary result, they found that the total amount of technical debt grewmuch faster in the microservice-based system.
In summary, the mentioned studies either do not specifically target service-or microservice-based systems or they do not focus on a broad spectrumof concrete maintainability assurance techniques used in industry, e.g. pro-cesses, metrics, tools, or patterns. While some publications are related tosystematic maintainability construction during service design, no study re-ally includes continuous quality assurance during development or whenthe system is already in production. We therefore intend to close this gapby conducting our own studies focused on industry evolvability assuranceprocesses, techniques, and challenges for service- and microservice-basedsystems (see Chapter 5).
3.3. Service-Based Metrics
Once service-based systems started to gain in popularity as a form of dis-tributed systems, the abstraction level for maintainability metrics had to beraised, similarly as during the rise of object orientation. On top of methods,classes, and modules, service-oriented computing added services as anotherlevel. Services constitute the core entities in such systems, which requiredmetrics specifically designed for them. For this reason, many research activ-ities over the last years focused on adapting existing metrics and definingnew metrics for service orientation.One example for such a collection of proposed service-oriented metrics is
the SOA quality model from Shim et al. [SCKP08]. They adopted the layeredstructure of the object-oriented QMOOD model to create a service-oriented
3.3 | Service-Based Metrics 87

variant with concrete metrics at the lowest level. Since the model focuses onthe general area of service design, it covers more QAs than maintainability,e.g. effectiveness.Senivongse and Puapolthep [SP15] built on this quality model and created
a version that focused solely on maintainability. However, they introducedeven more metrics of semantic nature that can not be gathered automatically,such as the adequately named service and operation ratio.Goeb and Lochmann [GL11] used the Quamoco metamodel to design a
domain-specific SOA variation with a wide variety of quality factors and mea-sures. While their approach seems promising, their model is very complexand some of their metrics are of semantic nature. For the metrics that couldbe collected automatically, the authors provide no tool support and alsocomment on the need to develop tool support per used service technology.This issue is also discussed in other approaches: because achieving broadlyapplicable static code analysis with meaningful metrics is very complex forservice-based systems, most suggestions so far have focused on programminglanguage independent workarounds, e.g. using SoaML [GA11] and serviceinterface definitions like WSDL [BM09] or OpenAPI [HLSV17].To collect and categorize structural metrics proposed for SOA, Nik Daud
and Wan Kadir [NW14] conducted a literature review. They sorted the15 identified publications into static or dynamic analysis as well as intocoupling, cohesion, or complexity. Moreover, they assigned them to therelevant lifecycle phase (e.g. design or implementation) and the associatedartifact (e.g. WSDL file or SOAP message).
In the area of microservices, several approaches for dynamic analysis havebeen proposed, like MicroART from Granchelli et al. [GCF+17], which com-bines static information with dynamic runtime data, or the approach fromMayer and Weinreich [MW18], which relies on OpenAPI descriptions andruntime information from intercepted HTTP calls. However, these methodsare primarily focused on architecture reconstruction or documentation ofmicroservice-based systems.An approach that actually focuses on quality evaluation for microservices
88 3 | Related Work

is the MAAT framework from Engel et al. [ELBH18]. It utilizes the Open-Tracing API to create a model and visualization of the system’s architecture.Afterwards, MAAT calculates six metrics to evaluate the system’s confor-mance to principles derived from popular microservice characteristics. Whilethe approach promises to be very interoperable w.r.t. data sources, metricextensibility does not seem to be a high priority. The source code of MAATis also not shared publicly.Cardarelli et al. [CID+19] built on the existing MicroART framework to
use its output for a new customizable quality evaluation framework calledMicroQuality. The complex approach employs model-driven engineeringtechniques as well as the object constraint language (OCL) for specifyingquality attributes. The authors envision an ecosystem where such qualitydefinitions are shared across systems and organizations.In their microservices decomposition framework, Taibi and Systä [TS19]
also proposed three metrics to evaluate the quality of the service decomposi-tion, namely coupling between microservice, number of classes per microservice,and number of classes that need to be duplicated. Their rationale for choosingthese metrics is of a theoretical rather than an empirical nature and is alignedwith popular microservices principles.Lastly, Cojocaru et al. [COU19] conducted a broad literature survey to
identify important quality attributes and metrics to assess a microservicesdecomposition. They subsequently discussed the set of identified attributeswith an industry expert and analyzed their relevance for a minimal setof assessment properties. While they present concrete metrics for someattributes, it is still difficult to judge their reliability.
All in all, there is no clear consensus on meaningful maintainability met-rics for microservices. Several service-based metrics have been proposedin scientific literature, but keeping an overview of the diverse publicationlandscape requires considerable effort. Moreover, the majority of proposedservice-basedmetrics have not been thoroughly evaluated and their relevancefor microservices is unclear. Approaches and tools to automatically gatherthese metrics are also very scarce. We aim to partially address this gap by
3.3 | Service-Based Metrics 89

collecting service-based metrics from literature, analyzing their applicabilityfor microservices, and enabling their evaluation by providing tool-supportedapproaches for their automatic collection (see Chapter 6).
3.4. Scenario-Based Analysis
A drawback of scenario-based analysis as a qualitative evaluation techniqueis the required manual work. To reduce this effort, researchers have pro-posed several lightweight architecture evaluation methods. One examplefor such a method is the Tiny Architectural Review Approach (TARA) fromWoods [Woo11] that relies on a combination of expert judgment and met-rics. While Woods acknowledges that the research community highly valuesscenarios, he sees their elicitation as too time-consuming.Koziolek et al. [KDG+12] proposed another lightweight method called
MORPHOSIS. In addition to analyzing the architecture in terms of futuredevelopment scenarios, MORPHOSIS relies on a reporting framework withseveral architectural metrics. Its scenario analysis is based on an extendedversion of ALMA and uses an ordinal scale for scenario effort estimation.Rostami et al. [RSHR15] created a tool-supported analysis approach for
change propagation called Karlsruhe Architectural Maintainability Prediction(KAMP). With KAMP, the initial architecture is modeled with annotatedcontext information and then compared to the target architecture for thechange request. The tool calculates differences between the two models tojudge the change impact.
While no scenario-based methods for service-based systems have beenproposed, several publications touch related topics. Sabir et al. [SPQM18]analyzed the specifics of the maintenance and evolution of service-based sys-tems. They pointed out key differences and significant research challenges,such as dependency and impact analysis or service-oriented evolution pat-terns.Wang et al. [WYZ10] described an approach for change impact analysis
in service-based business processes. Changes are applied to a model of the
90 3 | Related Work

system with a process and a service layer and subsequently classified basedon their impact.Similarly, Feng et al. [FHPM11] created an evolution taxonomy for service-
based systems that describes changes w.r.t. location or support mechanismsfor the change. They also take service-based mechanisms like late-bindinginto account.Andrikopoulos [And10] conceptualized a theoretical framework based on
formal modeling to support SOA evolution in a non-breaking fashion. Hefocused on shallow changes, i.e. changes which are local to a service butmay lead to ripple effects to consumers. The framework provides models forversioned service interfaces and compatible contract-based evolution.Lastly, Wang et al. [WHHC14] proposed a similar model where a set
of changes are applied to a service. These changes may result in potentialtransitions to other services that depend on this service. Using this model, theauthors also define service evolution patterns like the Compatibility Patternfor changes without propagation or the Transition Pattern for changes withripple effects.
While several lightweight scenario-based methods have been proposedand there is a large body of literature on service-oriented change impactanalysis or service evolution patterns, no concrete scenario-based methodhas been designed for service orientation. We aim to address this gap bycombining the two fields and proposing such a specific method. Our goalis to enable the efficient qualitative architecture evaluation of service- andmicroservice-based systems.
3.5. Service-Oriented Patterns and Antipatterns
One primary driver for the use of patterns is their impact on quality attributes(QAs) like availability, performance, or modifiability. Several studies havebeen conducted to analyze this complex and controversial relationship. Inthe context of object-oriented design, Garzás et al. [GGP09] conducted acontrolled experiment with 47 students who had to analyze and modify four
3.5 | Service-Oriented Patterns and Antipatterns 91

UML class diagrams. One group worked on a standard and straightforwarddesign model, while the other had a semantically equivalent version thatcontained design rules (e.g. “Dependencies between classes must be imple-mented with abstractions.”) and patterns (e.g. State or Composite). Theauthors measured both understandability (via questions) and modifiability(via extension tasks). Results showed that the latter version with rules andpatterns was more difficult to understand (58% less time and 15% more cor-rect answers for the non-pattern version). For modifiability, no statisticallysignificant difference in efficiency could be identified.Hegedűs et al. [HBFG12] used a probabilistic quality model based on
ISO/IEC 9126 to analyze the maintainability of more than 300 revisionsof the Java GUI framework JHotDraw, which employs well-known object-oriented patterns. Every usage of design patterns in JHotDraw is documentedwith JavaDoc and there are many revisions that only introduce patterns.The authors conclude from the analysis that the introduction of additionalpatterns increased the overall maintainability in the system. They mea-sured a strong correlation (r-value: 0.89) between pattern-line-density andmaintainability.Ali and Elish [AE13] give a broader view on the impact of the “Gang
of Four” design patterns on software quality. Their comparative literatureanalysis of 17 empirical studies revealed that only four quality attributesand only a small subset of the patterns have been examined. Moreover,they reported no general consensus concerning the impact of patterns (pos-itive, neutral, or negative). Interestingly, for maintainability, evolution,and change-proneness, the overall tendencies concerning the impact of theanalyzed patterns were negative.
In the domain of architectural patterns, Kassab et al. [KEM12] analyzedthe impact of the patterns Pipes and Filters, Layers, Model View Controller,and Broker on the two quality attributes performance and security. Theydetermined the quantitative effect of patterns on QAs via the proxy of ar-chitectural tactics. From these results, they concluded e.g. that Model ViewController is best suited for performance, while being least suited for security
92 3 | Related Work

and that the Layers pattern is most accommodating for security.Riaz et al. [RBW15] conducted a systematic mapping study to characterize
the research design of empirical studies with human subjects about theapplication of software patterns. With 16 of 30 studies, maintenance wasthe most frequent context. Nearly half of the studies were concerned withobject-oriented design patterns (14). Efficiency and correctness were themost common measures for evaluating the pattern application. The authorsalso report that differences in experiment design make it difficult to comparethe results and that several studies fail to mention limitations as well as howthey minimized the threat of biases.
In the context of service orientation, Galster and Avgeriou [GA12] per-formed a theoretical qualitative mapping of ∼80 service-based design pat-terns to the quality attributes of the S-Cube Quality Reference Model via forceresolution maps (impact from -2 to +2). They reported that the patternsdid not address 53 QAs from the very detailed S-Cube model. Most mappedQAs were performance and scalability. Since S-Cube does not include someimportant QAs, they also used ISO/IEC 9126. For maintainability, theyidentified a total of 12 patterns.Lastly, Palma et al. [PAK+14] analyzed the impact of service-based pat-
terns and antipatterns on maintenance and evolution by collecting historicalsoftware development metadata (# of Changes and Code Churn) for theFraSCAti system. They observed that services involved in patterns requiredless maintenance effort. However, this effect was not statistically significant.Additionally, they found that services with antipatterns needed significantlymore maintenance effort, especially for instances of God Component or ServiceChain.In the area of microservices, the patterns field is still forming. Several
patterns have already been synthesized from practice, but empirical studieswith them are rare. Richardson [Ric19] proposed a pattern language formicroservices, which he structured into application patterns, applicationinfrastructure patterns, and infrastructure patterns. The collection consists ofnearly 50 patterns so far. They are grouped into many smaller subcategories
3.5 | Service-Oriented Patterns and Antipatterns 93

such as data patterns, deployment, or observability.Taibi et al. [TLP18] conducted a systematic mapping study to identify
architectural patterns for microservices. They present the collected patternsin the three categories orchestration & coordination, data management &storage, and deployment.Zimmermann et al. focused on patterns for service interface design of
microservices by engaging in workshop- and experience-based pattern min-ing. So far, they published five interface representation patterns [ZSLZ17],five interface quality patterns [SZZ+18], and eight interface evolution pat-terns [LZP+19].
Concerning service-oriented antipatterns, similar attempts at antipatterncatalogues have been made. One early example for SOA is a discussion ofcommon antipatterns by Král and Žemlička [KŽ09]. They also comment oncausal dependencies between antipatterns and their relationship to designproperties like information hiding. For them, some of the most crucial SOAantipatterns are fine-grained interfaces and fine-grained services.Moha et al. [MPN+12] used a domain-specific language (DSL) based
on rule cards with metrics to formally specify SOA antipatterns. Usingthese specifications, they proposed an approach to automatically detectantipatterns in web services. They evaluated the approach with more than120 real-world web services and achieved a precision of 75% and a recall of100%.
For microservices, Taibi and Lenarduzzi [TL18] defined 11 bad smells byanalyzing 265 bad practices experienced by 72 developers from 61 compa-nies. They mapped the results of their two-year interview phase onto a listof main pitfalls extracted from grey literature and practitioner talks. Out of16 extracted pitfalls, the interviewees confirmed only six. Wrong service cutsduring the split of a monolith turned out to be the most critical challenge,resulting in potential maintenance issues later on.This study was extended by Carrasco et al. [CBD18], who conducted a
literature review to gather migration and architecture smells. The authorsderived best practices, success stories, and pitfalls. By digesting 58 different
94 3 | Related Work

sources from academia and grey literature, they presented nine commonbad smells with proposed solutions.
The first part of the presented related work gives an overview of thecomplex relationship between patterns and QAs as well as the controversialevidence. Not many empirical quantitative studies exist for service-basedpatterns in general and their evolvability in particular, which is why we aimto bring additional quantitative insights into this relationship with the resultsof the first controlled experiment as well as a metric-based analysis. Sincethe patterns field for microservices is still in a formative stage, we also planto analyze the applicability of existing SOA patterns for microservice-basedsystems and specifically focus on service-based evolvability patterns. Lastly,we aim to analyze existing antipattern publications for SOA andmicroservicesand to synthesize a holistic repository with the majority of service-basedantipatterns.
3.5 | Service-Oriented Patterns and Antipatterns 95

Part II.
Analysis Contributions
96

Chap
ter 4
A Systematic Review ofService-Oriented
Maintainability Assurance
As a first contribution, we provide a review of the general research field ofthis thesis, namely maintainability assurance of service-oriented software.We survey existing research with a systematic literature review, which pre-pares the conceptual foundations for our other contributions and aids inhighlighting research gaps. The chapter extends the following publication:
• J. Bogner et al. “Exploring Maintainability Assurance Research forService- and Microservice-Based Systems: Directions and Differences.”In: Joint Post-proceedings of the First and Second International Confer-ence on Microservices (Microservices2017/2019). Ed. by L. Cruz-Filipeet al. Vol. 78. Dagstuhl, Germany: Schloss Dagstuhl - Leibniz-Zentrumfuer Informatik, 2020, 3:1–3:22 [BWWZ20]
97
4.1. Context and Goals
In principle, both SOA and microservices provide beneficial properties formaintainable and evolvable systems. However, concrete maintainabilityassurance processes for such systems are still not trivial to establish. Whentrying to get an overview of assurance approaches for service orientationproposed by academia, it is not easy to quickly scan the scattered variety ofexisting publications. Researchers have suggested a plethora of assurancetechniques explicitly designed for SOA, microservices, or both that try toapproach maintainability from different directions.To enable such an overview, we therefore conducted a systematic literature
review (SLR) to collect and categorize existing maintainability assuranceresearch for service orientation. Our review explicitly included both SOA andmicroservices because the number of relevant publications for the youngerarchitectural style would have been too small on its own. Moreover, webelieved that many approaches designed for SOA will have relevance formicroservices as well. Lastly, the inclusion of both service-based styles willenable an additional comparison on this level. The following four researchquestions guided our SLR:RQ1: How can maintainability assurance research proposed for service-
and microservice-based systems be categorized?RQ2: How are the identified publications distributed among the formed
categories?RQ3: What are the most relevant research directions per identified cate-
gory?RQ4: What are notable differences between the approaches proposed for
service-based systems and those for microservices?
4.2. Systematic Literature Review
In general, an SLR is a secondary study to identify, analyze, and summarize(scientific) publications within a specific research area of interest. As such,it presents an overview of the state of the art in a certain (sub)field and
98 4 | A Systematic Review of Service-Oriented Maintainability Assurance

may point out research gaps or even a research agenda to close them. Sincescientific rigor and replicability are very important in such studies, we reliedon the process and guidelines described by Kitchenham and Charters [KC07].Moreover, we published all research artifacts in an online repository1.
4.2.1. Research Design
Our general research process for this study was as follows (see also Fig. 4.1).First, we brainstormed about research questions we intended to answer anddefined four questions that built upon each other (see Section 4.1). As asecond step, we designed a detailed protocol to guide us through the review.This protocol contained the used data sources (literature databases andsearch engines), a search term with keywords, filter criteria for inclusionand exclusion of studies, as well as a description of the process. We thenused this protocol to retrieve the initial result set from all data sourcesand subsequently applied our filter criteria. Two researchers individuallyanalyzed and filtered all identified publications and afterwards comparedthe results. We discussed any differences until we reached a consensus. Forthe remaining studies, we performed one round of forward citation search(“snowballing”) and applied the same filter criteria to the newly identifiedpublications (again with two researchers). Included studies were mergedinto the existing set and duplicates were removed.This final set of primary studies was then analyzed in an iterative process.
A categorization scheme was derived and subsequently applied to the pub-lications. We then analyzed the result for a second time and implementedpossible improvements for the categorization scheme, which led to the nextround of categorization. As with the inclusion and exclusion criteria, thecategorization of the whole set was performed by two researchers, who dis-cussed any difference of opinion. Once the categories were stable, we starteda detailed evaluation to synthesize the answers to our research questions.
1https://github.com/xJREB/slr-maintainability-assurance
4.2 | Systematic Literature Review 99

���������� �����
���������������������������� ����������� ������������������� ���
�� !"�#$�%�&$'()*�%+!,"%
��%!-"#./01$,+,',2
0�+$!�3�#!"!+!&2%�&$'(#$�%*2+%
41125# !2+�$'$!+�$!&
6�$ ,$7# ,$8&$9'!+&+!,"#%�&$'(
:�$-�#$�%*2+%41125# !2+�$'$!+�$!&
.5"+(�%!;�&"%8�$%#+,#0<%
6�$ ,$7#9�+&!2�9�3&2*&+!,"
=#! #'&+�-,$!�%#&$�#%+&>2�#?
4"&25;�#$�%*2+%
��$!3�'&+�-,$!;&+!,"%'(�7�
@&+�-,$!;�$�%*2+%
Figure 4.1.: General research process
The four used data sources for our initial search (see also Fig. 4.2) wereIEEE Xplore, ACM Digital Library, Springer Link, and ScienceDirect, as theyare prevalent for software engineering and service-oriented topics. For thesnowballing phase, we relied on the publisher-agnostic search engine GoogleScholar.
• IEEE Xplore: https://ieeexplore.ieee.org
• ACM Digital Library: https://dl.acm.org
• Springer Link: https://link.springer.com
• ScienceDirect (Elsevier): https://www.sciencedirect.com
• Google Scholar (for snowballing): https://scholar.google.com
Figure 4.2.: Used digital libraries and search engines for the SLR
As our search string (see also Fig. 4.3), we formed two buckets withkeywords. The two buckets were combined with an AND relation, while
100 4 | A Systematic Review of Service-Oriented Maintainability Assurance

the keywords within each bucket were combined with an OR relation. Thatis, from each bucket, at least one term needed to match. The first bucketcontained our central quality attribute maintainability as well as theclosely related terms modifiability, evolvability, and evolution.The second bucket was responsible for our targeted system types and there-fore consisted of the terms soa, microservice, service-oriented, andservice-based. We did not confine the search string to any particularfield.
(maintainability ∨ modifiability ∨ evolvability ∨evolution) ∧ (soa ∨ microservice ∨ service-oriented ∨service-based)
Figure 4.3.: Used search string for the SLR
Since we only relied on manual filtering to avoid the accidental exclu-sion of fitting studies that use different keywords, we also had to limit theresult set to a manageable amount. We therefore only considered the first250 results per data source, i.e. we had a total of 1000 publications formanual analysis. As our most basic inclusion criteria, we only consideredpublications written in English and published in the years 2007 up until2018. For studies passing this test, we then assessed the title and abstractfor their relevance to our research questions. The main focus of the paperneeded to be on analyzing or improving maintainability (or a related qualityattribute or design property) in the context of service-oriented computing(e.g. SOA or microservices). For example, the architecture sustainabilityreview of Venters et al. [VCB+18] fulfills the first property, but is not pri-marily about service orientation. Conversely, the SOA policy optimizationapproach from Inzinger et al. [ISH+12] is clearly about service orientation,but does not solely target maintainability. If we could not determine thetopic relevance from title and abstract alone, we read other parts of thepaper like the introduction or conclusion. Finally, we excluded the fields
4.2 | Systematic Literature Review 101

of runtime adaptation as in [FL13], software testing as in [JGV+14], andlegacy to SOA or microservices migration as in [LS07]. While these topicsare related to maintenance and evolution, they are very specialized and eachone could probably provide enough material for a separate SLR.
4.2.2. Results
Using the process described above, we obtained an initial set of 1000 papers,i.e. 250 per selected publisher. We then applied our inclusion criteria,which resulted in a filtered set of 122 papers. In the snowballing phase, weidentified a total of 806 publications that cited a paper from our filteredset. Lastly, we applied the same filter criteria to these new publicationsand merged the remaining ones back into the filtered set while removingduplicates. This process resulted in a final set of 223 primary studies (seealso Fig. 4.4).
���������� �����
���������������������������� ����������� ������������������� ���
�� !"#$%&!'()
�* !'$+,-%&&(.!'()
�/ !"#&)(0(.!'()
�1 !2$#)#%&!'(%034!5(67&)6
//*!87-%)#+$6
9/:!87-%)#+$6
1//!87-%)#+$6
1���!87-%)#+$6
;:<:
=:�>
;<�?
@AB 2CCC '80#$D(0'3#($3(E#0(3)
=/?� =/?� =/?� =/?�
Figure 4.4.: SLR results: number of publications per stage
Nearly half of these papers (105) were published by IEEE, followed by40 Springer publications (18%), 31 papers from ACM (14%), and 10 from
102 4 | A Systematic Review of Service-Oriented Maintainability Assurance

ScienceDirect (4%). The remaining 37 publications (17%) were from 31different publishers (see also Fig. 4.5).
105 (47%)
40 (18%)
31 (14%)
10 (4%)
37 (17%)
IEEE Springer ACM ScienceDirect Other
Figure 4.5.: SLR results: publisher distribution
When looking at the number of publications per year (Fig. 4.6), we see aslow beginning in 2007 (six publications), a peak in 2011 (35 publications),smaller yet somewhat similar numbers for 2012 to 2015 (22-24 publications),and finally another decline for 2016 to 2018 (15-18 publications).
6
1211
16
35
2224 24
23
1715
18
0
5
10
15
20
25
30
35
40
2007 2008 2009 2010 2011 2012 2013 2014 2015 2016 2017 2018
Figure 4.6.: SLR results: number of publications per year
4.2 | Systematic Literature Review 103

4.2.2.1. Research Categories (RQ1)
To answer the first research question, we derived a three-dimensional taxon-omy to categorize the identified primary studies (see Table 4.1).
Type Description Mandatory Multiple
Architectural Contains three categories that de-termine if a publication focuses onSOA, microservices, or both styles.
Yes No
Methodical Contains five categories that ei-ther determine the used researchmethod (e.g. literature study)or the study’s contribution (e.g.model or taxonomy).
No Yes
Thematic Contains nine categories that de-termine the topic of a publication,i.e. subfields of maintainability as-surance.
Yes Yes (exceptfor other)
Table 4.1.: Three-dimensional categorization scheme
The first and most apparent category type called architectural consistedof three different categories that determined if a study targeted SOA, mi-croservices, or both architectural styles. Both was selected if the study eitherexplicitly stated the inclusion of both SOA and microservices or if it wasabout concepts like RESTful services that are prevalent in both styles. Thiscategory type was mandatory and exactly one category had to be chosenper publication. Second, the optional methodical category type determinedeither the applied methodology (e.g. case study) or the provided contribution(e.g. process or method). It consisted of five different categories, from whichwe could select multiple ones per study. Lastly, the most important thematiccategory type determined the actual maintainability-related topic of a publi-cation, i.e. a more specific subfield of maintainability assurance. To avoida large number of very fine-grained thematic categories, we created thegeneric Other category. We had to choose at least one thematic category per
104 4 | A Systematic Review of Service-Oriented Maintainability Assurance

publication. The following listing briefly describes all methodical categories.
• Case, Field, or Empirical Study: the publication either describes acase study (e.g. demonstrating an approach with an example system),a field study (e.g. analyzing an industry system), or an empirical study(e.g. a survey, interviews, or a controlled experiment)
• Literature Study: the publication presents the results of a literaturestudy like an SLR or a systematic mapping study
• Model or Taxonomy: the publication contributes a (meta) model ortaxonomy to further the conceptual understanding of a topic
• Process or Method: the publication defines a method or process, i.e.a sequence of activities to achieve a specific goal
• Reference Architecture or Tool: the publication either describes areference architecture (an abstract and reusable template to createsystem architectures) or a tool to e.g. mitigate manual efforts
Lastly, the next listing presents all thematic categories. They refer exclu-sively to a service-based context.
• Architecture Recovery and Documentation: relying on architecturereconstruction (if no current documentation is available) or on gen-eral architecture documentation support to increase analyzability andtherefore maintainability; example: [KUSM18]
• Model-Driven Approaches: approaches that rely on model-drivenengineering to reduce long-term maintenance efforts with e.g. codegeneration from machine-readable models; example: [MZD11]
• Patterns: applying patterns specifically designed for service orienta-tion to systematically improve maintainability-related aspects or todescribe service evolution; example: [WHHC14]
• Antipatterns and Bad Smells: conceptualizing service-based antipat-terns and bad smells or providing detection approaches for them toidentify maintainability weaknesses; example: [PNM+13]
4.2 | Systematic Literature Review 105

• Service Identification and Decomposition: approaches to identifysuitable service boundaries for functionality or to decompose largeexisting services into more fine-grained ones that are more beneficialfor maintainability; example: [LPM15]
• Maintainability Metrics and Prediction: conceptualizing or eval-uating service-based metrics to analyze or predict maintainability;example: [MM14]
• Change Impact and Scenarios: approaches for analyzing the poten-tial propagation of service changes or general scenario-based main-tainability evaluation; example: [HZC11]
• Evolution Management: general approaches to support or improvethe overall service evolution process via e.g. systematic planningtechniques, accelerating the process, increasing fault tolerance, ormitigating other negative consequences; example: [FS16]
• Other: all papers that did not fit one of the other categories weresorted into this one; example: [WWR+12]
4.2.2.2. Category Distributions (RQ2)
The analysis of distributions among architectural categories (SOA, microser-vices, both) immediately revealed that nearly 90% of the 223 publicationsexclusively targeted SOA (see Fig. 4.7). Only 12 publications solely referredto microservices, while an additional 12 included both SOA and microser-vices. This means that only a combined ∼11% of our primary studies wereabout maintainability assurance approaches for microservices. Since mi-croservices are much younger than SOA, it also makes sense to look at amore recent subset, e.g. starting from 2014 when microservices began torise in popularity (see Fig. 4.8). However, from 2014 to 2018, identifiedmicroservices-related publications still only accounted for a combined ∼25%.
106 4 | A Systematic Review of Service-Oriented Maintainability Assurance

199 (89.2%)
12 (5.4%)12 (5.4%)
SOA Microservices Both
Figure 4.7.: Distribution: architec-tural categories 2007-2018
73 (75.3%)
12 (12.4%)
12 (12.4%)
SOA Microservices Both
Figure 4.8.: Distribution: architec-tural categories 2014-2018
Concerning methodical categories (see Fig. 4.9), the most frequent typewas case, field, or empirical study: 63% of publications included such astudy, most often to demonstrate or evaluate a proposed approach or toanalyze industry practices. Moreover, nearly half of the publications (110)described a process or method as part of their contribution, which highlightsthe importance of systematic approaches in this field. Both the conceptualcontribution of a model or taxonomy (75 of 223) and the more practicalcontribution of a reference architecture or tool (72 of 223) were presentin roughly one third of studies. Lastly, 25 publications (11%) described aliterature study for meta analysis. Overall, 124 publications were associatedwith at least two methodical categories (56%) and 68 publications with atleast three (30%).
4.2 | Systematic Literature Review 107

141 (63%)
110 (49%)
75 (34%)
72 (32%)
25 (11%)
Case, Field, or Empirical
Study
Process or Method
Model or Taxonomy
Reference Architecture or
Tool
Literature Study
Figure 4.9.: Distribution: methodical categories (percentages are relative to223 publications)
With respect to thematic categories (Fig. 4.10), around half of the publi-cations were equally distributed among either evolution management (56)or maintainability metrics & prediction (55). These numbers underline thepopularity of approaches to systematically manage service evolution andmitigate potential consequences as well as the interest in maintainabilitymetrics specifically designed for service orientation. In the remaining half,the largest category accounting for 17% of total publications was changeimpact & scenarios, which indicates that qualitative evaluation has not beenas popular as quantitative metric-based evaluation so far. Smaller categorieswere antipatterns & bad smells (9%), service identification & decomposition(9%), patterns (6%), model-driven approaches (5%), and architecture recovery& documentation (4%). Lastly, 18 publications were categorized with other(8%) because they did not fit into any existing category. As opposed tomethodical categories, multiple selections were quite rare here, i.e. only 21publications were related to more than one category (9%).
108 4 | A Systematic Review of Service-Oriented Maintainability Assurance

56 (25%)
55 (25%)
39 (17%)
21 (9%)
21 (9%)
14 (6%)
12 (5%)
9 (4%)
18 (8%)Evolution Management
Maintainability Metrics & Prediction
Change Impact & Scenarios
Antipatterns & Bad Smells
Service Identification &
Decomposition
Patterns
Model-Driven Approaches
Architecture Recovery &
Documentation
Other
Figure 4.10.: Distribution: thematic categories (percentages are relative to223 publications)
4.2.2.3. Research Directions per Category(RQ3)
In this section, we briefly describe the most relevant research directionsper identified thematic category (except for other). We illustrate these bydescribing selected exemplary studies.
Architecture Recovery and Documentation In our smallest thematiccategory, the majority of the nine publications were concerned with (semi-)-automatic architecture reconstruction via static analysis, dynamic runtimeanalysis, or a mixture of both. A static example for SOA is the intelligentsearch support by Reichherzer et al. [REW+11]. Their SOAMiner toolparses and analyzes common SOA artifacts like WSDL or BPEL files andconceptualizes knowledge relevant for architecture and maintenance fromthem. Similarly, Buchgeher et al. [BWH18] provide a platform to provideup-to-date architectural information of large-scale service-based systems viaextraction techniques using source code and other development artifacts likePOM files. With five publications, this category was also especially popular
4.2 | Systematic Literature Review 109

for microservices. One example is the MicroART approach of Granchelliet al. [GCF+17] that combines static information from a code repository(e.g. Docker files) with dynamic runtime data collected via tcpdump. Asecond mixed approach is the MICROLYZE framework from Kleehaus etal. [KUSM18]. By combining data from service registries and OpenTracingmonitoring with static build-time information, it is possible to continuouslyreconstruct the system’s architecture while also taking infrastructure andhardware into account.Overall, approaches in this category were concerned with providing ac-
curate architecture documentation to increase analyzability and to easemaintenance efforts. Automation is used to reduce manual efforts, butthis is challenging in heterogeneous and decentralized environments thatconsist of a very large number of diverse (micro)services. Most modernapproaches combine static with dynamic analysis and sometimes even relyon tool-supported manual steps to increase accuracy.Model-Driven Approaches All 12 publications in this category were re-
lated to SOA and most of them were concerned with model-based verificationduring evolution. To support model evolution and change propagation acrossdifferent model types such as business process or service models, Sindhgattaand Sengupta [SS09] proposed a framework that automatically analyzesMeta-Object Facility (MOF) compliant models and supports the selectiveapplication of changes to downstream models. Similarly, Liu et al. [LCZ12]designed a verification approach that is based on colored reflective Petri netsand simulates adaptive service evolution. A last approach in this area wascreated by Zhou et al. [ZGZW16]: they analyze model consistency using hier-archical timed automata and also support the modeling of time constraints aswell as architectural decomposition. In the area of business process manage-ment, Boukhebouze et al. [BABM11] relied on rule-based specifications withthe event-condition-action model to assess a business process’s flexibilityand to estimate its cost of change. Rules are translated into a graph andsubsequently used for analysis. Lastly, Lambers et al. [LEMP07] proposed avery early holistic approach for model-driven development of service-basedapplications. Their goal was to enable expert users to iteratively and rapidly
110 4 | A Systematic Review of Service-Oriented Maintainability Assurance
develop flexible services through a series of models, code generators, and agraphical user interface for visual model creation and modification.All in all, the presented approaches rely on different kinds of formal
methods to enable faster and less error-prone development and evolutionof service-based systems. Models specific to service orientation like busi-ness process models were frequently used. The predominant themes wereconsistency checking and verification.Patterns We identified 14 studies that discussed service-based design
patterns, i.e. best practice solution blueprints for recurring design problems,in the area of maintenance and evolution. However, contrary to previouscategories, most of them did not follow one major research direction. Afew publications proposed new service-based design patterns beneficial formaintainability like the Service Decoupler from Athanasopoulos [Ath17].Others, like Tragatschnig et al. [TSZ18], used patterns to describe and planthe evolution of service-based systems (“change patterns”), which shouldincrease the efficiency and correctness of modifications. Some approachescentered around existing patterns in a system. Zdun et al. [ZNL17] provideda set of constraints and metrics for automatically assessing the pattern confor-mance in microservice-based system to avoid architectural drift. Demange etal. [DMT13] designed the “Service Oriented Detection Of Patterns” (SODOP)approach to automatically detect existing service-based patterns via metricrule cards, which allows the evaluation of their design quality. Lastly, Palmaet al. [PAK+14] analyzed the change-proneness of selected service-basedpatterns by studying an open source system. Using the metrics number ofchanges and code churn, they discovered that services with patterns neededless maintenance effort, but not with a statistically significant difference.In general, this category was surprisingly heterogeneous with diverse
pattern use cases, ranging from systematic maintainability construction toarchitecture conformance checking or service evolution description. Unfor-tunately, our SLR did not identify more holistic publications with collec-tions and discussion of service-based patterns beneficial for maintainabil-ity, e.g. a literature study. Likewise, we only identified a single empiricalstudy [PAK+14] that analyzed the impact of service-based design patterns
4.2 | Systematic Literature Review 111

on modifiability.Antipatterns and Bad Smells With 21 publications, this category was
50% larger than patterns, which could indicate that preventing subopti-mal designs has been perceived as more important or as more related tomaintainability than to other quality attributes. Research directions in thiscategory were also not as scattered, but followed two main themes. Thesmaller group was concerned with the conceptualization of service-basedantipatterns. Palma and Mohay [PM15] presented a classification taxonomyfor 20 web service and Service Component Architecture (SCA) antipatternsand also defined metrics to specify their existence. In the area of microser-vices, Taibi and Lenarduzzi [TL18] synthesized 11 common bad smells byinterviewing 72 developers. Similarly, Carrasco et al. [CBD18] collected ninemicroservices architecture and migration smells by analyzing 58 sourcesfrom scientific and grey literature. The larger group in this category, how-ever, went one step further and proposed automatic detection approachesfor antipatterns. An example was the SODA (Service Oriented Detection forAntipatterns) approach from Nayrolles et al. [NPMG13], which the sameauthors later improved by mining execution traces [NMV13]. For RESTfulservices, Palma et al. [PGM+15] proposed an approach which uses semanticas well as syntactic analysis to detect linguistic antipatterns. Lastly, Sabir etal. [SPR+19] combined both directions in their SLR that not only collectedexisting antipatterns, but also analyzed detection approaches.The automatic detection of service-based antipatterns to efficiently identify
design flaws was the prevalent theme in this category. Different approacheslike static or dynamic analysis, machine learning, genetic programming, orcombinations have been proposed. An understudied area, however, seemsto be the systematic refactoring of detected antipatterns.Service Identification and DecompositionWe identified 21 publications
that focused on the activities of service identification or decomposition toincrease maintainability. The majority of these (15) proposed a process ormethod to derive service candidates or to decompose existing services orinterfaces either systematically or automatically. A fully automated iden-tification approach has been proposed by Leopold et al. [LPM15]: they
112 4 | A Systematic Review of Service-Oriented Maintainability Assurance

relied on semantic technologies to create a ranked list of service candidatesfrom existing business process models. Athanasopoulos et al. [AZM+15]designed a tool-supported approach to analyze WSDL specifications withcohesion metrics. Based on the results, the existing interface is progressivelydecomposed into more cohesive units. Similarly, Daagi et al. [DOK+17]used a framework for Formal Concept Analysis (FCA) to identify hidden re-lations between WSDL operations and decompose the interface into severalmore fine-grained ones. Because numerous approaches have been proposed,there is also a decent amount of literature studies in this category. Kohlbornet al. [KKCR09] conducted a structured evaluation of 30 service analysisapproaches and proposed a new consolidated method to address collectedshort-comings. A second review by Cai et al. [CLW11] tried to keep theliterature analysis closer to the general software and service engineering pro-cess and derived common “high-value activities”. Lastly, a literature reviewfrom Bani-Ismail and Baghdadi [BB18a] identified eight common serviceidentification challenges. The same authors [BB18b] also conducted anotherreview to gather proposed evaluation frameworks for service identificationmethods.Since a plethora of manual or automatic approaches has been proposed
in this category, it becomes difficult to differentiate between them. Somepublications tried to address this with literature studies, but selecting afeasible approach for a use case may still be challenging.MaintainabilityMetrics and PredictionOur second-largest category con-
sisted of 55 publications. Since existing source code or object-orientedmetrics are only of limited relevance for service-oriented systems, mostpublications in this category proposed maintainability metrics specifically de-signed for service orientation. Some researchers approached this by focusingon a single maintainability-related design property like coupling [PRFT07],complexity [QX09], cohesion [PRF07], or granularity [AZD11]. Others triedto assemble holistic metric suites, like the SOA design quality model fromShim et al. [SCKP08] or the metrics suite from Sindhgatta et al. [SSP09].Because most proposed metrics were architectural and therefore challengingto collect from source code, some publications also focused on metrics for
4.2 | Systematic Literature Review 113

specific service-based artifacts like SoaML [GBO+10] or BPMN [SHM+13]diagrams. To create an overview and to compare proposed metrics, otherresearchers conducted literature studies. Nik Daud and Wan Kadir [NW14]collected and categorized service-based metrics according to structural at-tributes, applied phase, or artifact. A few publications also used metrics andvarious machine learning techniques to predict the future maintainabilityof services. Wang et al. [WKO16] used artificial neural networks to buildprediction models of several web service interface metrics. In a slightly differ-ent fashion, Kumar et al. [KKR17] applied feature selection techniques andsupport vector machines to evaluate the prediction quality of object-orientedmetrics for the maintainability of service-based systems.Overall, the central theme in this category was the definition of new or
adapted service-based maintainability metrics. While many metrics havebeen proposed, their relevance and effectiveness often remained unclear. Weidentified only very few evaluation studies like the one from Perepletchikovand Ryan [PR11]. Comparative literature studies were also rare. Further-more, even though automatic collection was a prevalent topic and severaltools like Q-ImPrESS from Koziolek et al. [KSB+11] or MAAT from Engel etal. [ELBH18] were presented, the number of publicly available tools was verylow, which could hinder replication studies and industry adoption. Lastly,there seems to be much potential in crossing boundaries between e.g. SOA,microservices, WSDL, or SoaML to adapt evaluated metrics to other fields.Change Impact and Scenarios A focus on dependencies between clients
and services has made change impact analysis a popular service-based topic.This category also comprises publications about more general scenario-basedmaintainability evaluation. In total, we identified 39 papers, which made thisthe third largest category. A large number of these publications propose spe-cific approaches. Wang and Capretz [WC11] combined information entropywith dependency analysis to quantify the relative importance of a servicefor change effects. Another approach is taken by Hirzalla et al. [HZC11]:they created a framework (IntelliTrace), which relies on the modeling oftraceability links between SOA artifacts like business goals, processes, orservices. Based on these links, the impact of changes at different levels can
114 4 | A Systematic Review of Service-Oriented Maintainability Assurance

be analyzed. Lastly, Khanh Dam [Kha14] designed an approach based onassociation rule data mining to predict change impact using the versionhistory of web services. To collect and compare proposed approaches, AmjadAlam et al. [AAA14] conducted an SLR about impact analysis and changepropagation for business processes and SOA. Their analysis of 43 studiesconcluded that very few mature approaches and tools existed, especiallyfor bottom-up or cross-organizational analysis. The second major researchdirection was concerned with the analysis of existing systems or APIs toderive information about their evolution change impact. Using a tool calledWSDLDiff, Romano and Pinzger [RP12] extracted and analyzed fine-grainedchanges from the WSDL version histories of four web services from Amazonand FedEx. Similarly, Espinha et al. [EZG15] analyzed the evolution of theTwitter, Google Maps, Facebook, and Netflix APIs. By interviewing six clientdevelopers and by analyzing source code version histories, they investigatedhow the API evolution affected service consumers.The two primary research directions in this category were a) proposing
approaches for change impact analysis and b) empirical studies on the evolu-tion impact of existing service-based systems. Proposed methods were mostlybased on dependency graphs or repository data mining. Artifacts specific forservice orientation like WSDL files were often used. Very few publications,however, were concerned with general scenario-based evaluation, like theone from Leotta et al. [LRRA11], who used the Software Architecture Anal-ysis Method (SAAM) to compare the maintainability of one SOA and onenon-SOA alternative. Our review did not identify a scenario-based methodspecifically designed for service orientation.Evolution Management With 56 papers, this category was the largest
(25%). Since it was also our most general one, it consisted of diverse ap-proaches to control and plan service evolution. Therefore, we could notidentify major research directions. However, one similarity among thesepublications was that most of them (48 of 56) proposed either a process ormethod or a model or taxonomy, i.e. most work was conceptual. To illustratethis diversity, we present some selected approaches. Zhang et al. [ZYL11]designed a framework to manage requirements evolution in service-based
4.2 | Systematic Literature Review 115
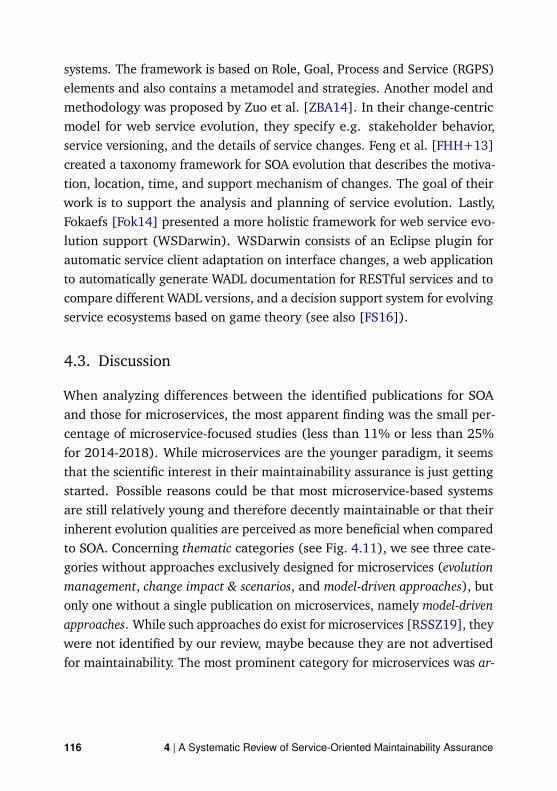
systems. The framework is based on Role, Goal, Process and Service (RGPS)elements and also contains a metamodel and strategies. Another model andmethodology was proposed by Zuo et al. [ZBA14]. In their change-centricmodel for web service evolution, they specify e.g. stakeholder behavior,service versioning, and the details of service changes. Feng et al. [FHH+13]created a taxonomy framework for SOA evolution that describes the motiva-tion, location, time, and support mechanism of changes. The goal of theirwork is to support the analysis and planning of service evolution. Lastly,Fokaefs [Fok14] presented a more holistic framework for web service evo-lution support (WSDarwin). WSDarwin consists of an Eclipse plugin forautomatic service client adaptation on interface changes, a web applicationto automatically generate WADL documentation for RESTful services and tocompare different WADL versions, and a decision support system for evolvingservice ecosystems based on game theory (see also [FS16]).
4.3. Discussion
When analyzing differences between the identified publications for SOAand those for microservices, the most apparent finding was the small per-centage of microservice-focused studies (less than 11% or less than 25%for 2014-2018). While microservices are the younger paradigm, it seemsthat the scientific interest in their maintainability assurance is just gettingstarted. Possible reasons could be that most microservice-based systemsare still relatively young and therefore decently maintainable or that theirinherent evolution qualities are perceived as more beneficial when comparedto SOA. Concerning thematic categories (see Fig. 4.11), we see three cate-gories without approaches exclusively designed for microservices (evolutionmanagement, change impact & scenarios, and model-driven approaches), butonly one without a single publication on microservices, namely model-drivenapproaches. While such approaches do exist for microservices [RSSZ19], theywere not identified by our review, maybe because they are not advertisedfor maintainability. The most prominent category for microservices was ar-
116 4 | A Systematic Review of Service-Oriented Maintainability Assurance

chitecture recovery & documentation (5 of 9 papers, all of them for recovery),which highlights the importance of this topic. While automatic microservicedecomposition and extraction is also a popular topic in academia [FBZW19],only two of the 21 papers in service identification & decomposition were aboutmicroservices. The main reason for this shortage is probably the exclusion ofpure legacy migration approaches. Lastly, for antipatterns & bad smells, pub-lications for microservices were mostly concerned with defining antipatternswhile more established SOA publications already proposed automatic detec-tion approaches. Developing such detection approaches may be a sensiblenext step for microservices.
5350
34
17 19
11 12
4
15
1
22
1
5
2
34
5
2
2
1
0
10
20
30
40
50
60
Evolution
Mgmt
Metrics &
Prediction
CI & Scenarios Antipatterns
& Bad Smells
SI & SD Patterns Model-Driven
Approaches
AR & D Other
SOA Microservices Both
Figure 4.11.: Distribution: thematic categories grouped by architecturalcategory
In general, we identified much potential for the adoption of SOA ap-proaches for microservices, especially in the areas of maintainability metrics& prediction, antipatterns & bad smells, service identification & decomposition,and patterns. Existing SOA research in these categories could be valuable forthe evolution and maintenance of microservices if the techniques are alsoapplicable for e.g. strong decentralization or technological heterogeneity.Moreover, the majority of studies on RESTful services should be directlyapplicable for microservice-based systems. Lastly, our SLR did not identify
4.3 | Discussion 117

studies about possible negative maintainability impacts of microservices, e.g.in the areas of knowledge exchange, team synchronization, technologicalheterogeneity, or code duplication. While the maintainability of microser-vices as an architectural style is generally perceived as positive, we still seethe potential for empirical studies on these topics.
4.4. Threats to Validity
Results derived from systematic literature studies may suffer from limitationsin different areas if not performed rigorously (see e.g. [ZJZ+16]). Eventhough we adhered to a detailed SLR protocol and the complete study se-lection and categorization was performed by two researchers to mitigatesubjective bias, there is still the possibility of threats to validity. One ex-ample for the planning phase is that our search strategy could have beeninsufficient due to missing keywords or not included databases. Likewise,the presentation of exemplary publications to highlight existing directionsper category was subject to our perception of relevance. Other researchersmay disagree or come to different conclusions. However, the most prominentthreat to validity with this SLR is most likely the limiting of search results tothe first 250 entries per publisher (1000 papers from four publishers). Suchfiltering made the results dependent on the relevance sorting of each searchengine and may also hinder replicability if publishers decide to change theiralgorithms in the future. Even though our snowballing nearly doubled theamount of selected primary studies, there is still the possibility that we mayhave missed relevant literature branches without links to our initial set. Weaccepted this threat to keep the effort manageable within the project timeframe.
4.5. Conclusion
Since scientific literature on maintainability assurance for service-orientedsystems is diverse and scattered, we conducted an SLR to categorize the pro-
118 4 | A Systematic Review of Service-Oriented Maintainability Assurance
posed approaches and to analyze differences between SOA and microservices.As an answer to RQ1, we derived a categorization set with architectural (SOA,microservices, both), methodical (method or contribution), and thematic(a subfield of maintainability assurance) categories from the 223 selectedprimary studies. The distribution analysis (RQ2) revealed for example thatnearly 90% of papers exclusively targeted SOA (199) and that evolutionmanagement and maintainability metrics & prediction were the most promi-nent thematic categories (both with ∼25%). For each thematic category,we also presented the most relevant research directions with illustratingstudies (RQ3). Exemplary differences between approaches for SOA andmicroservices (RQ4) were the importance of architecture reconstruction andthe absence of automatic antipattern detection approaches for microservices.While there was only a small number of approaches for microservices, weidentified much potential for adapting SOA approaches in several categories.Future research could be concerned with literature studies for individ-
ual categories to provide more insights into these subfields and to analyzethe adoption potential for microservices in greater detail. An analysis ofmaintainability-related differences between orchestration (SOA) and chore-ography (microservices) across the primary studies may also yield helpfulresults for the usage of these two paradigms. Lastly, it could be interest-ing to replicate this SLR exclusively for microservices in a few years whenmore publications exist for these topics. To enable replication and to allowconvenient reuse of our results, we shared all SLR artifacts in a GitHubrepository1.
1https://github.com/xJREB/slr-maintainability-assurance
4.5 | Conclusion 119

Chap
ter 5
An Analysis of IndustrialMaintainability Assurance
for Service Orientation
Complementary to the analysis of the scientific state of the art in the previouschapter, this contribution chapter describes our empirical studies on industrypractices in the area of maintainability assurance for service orientation.We conducted a quantitative survey (N=60) focused on maintainabilityassurance in general and differences with service orientation as well as aqualitative interview study (N=17) focused on the evolvability assurance ofmicroservices. The chapter extends the following publications:
• J. Bogner et al. “Limiting Technical Debt with Maintainability Assur-ance: An Industry Survey on Used Techniques and Differences withService- and Microservice-Based Systems.” In: Proceedings of the 2018International Conference on Technical Debt - TechDebt ’18. New York,New York, USA: ACM Press, 2018, pp. 125–133 [BFWZ18]
120

• J. Bogner et al. “Assuring the Evolvability of Microservices: Insightsinto Industry Practices and Challenges.” In: 2019 IEEE InternationalConference on Software Maintenance and Evolution (ICSME). Cleveland,Ohio, USA: IEEE, Sept. 2019, pp. 546–556 [BFWZ19a]
4.5 | Conclusion 121

5.1. Context and Goals
An analysis of existing research contributions is an essential precursor forextending the state of the art in a specific field. However, in fields closeto industry practice, it is equally important to have a solid understandingof what practitioners are doing and what challenges they may be facing.Ignoring the state of practice may lead to research contributions that arenot relevant for industry or not usable by practitioners because they werecreated under false premises.Unfortunately, no empirical studies exist on the topic of general main-
tainability assurance for service-oriented software in industry. Especiallyfor microservices, very little is known about what evolvability assuranceprocesses and techniques companies use or if these are different comparedto other architectural styles. In the general area of service-based systems,Schermann et al. [SCL16] even describe a mismatch between what academiaassumes and what industry actually does. An analysis of industry practices inthis regard could identify common challenges, showcase successful processes,and highlight gaps and deficiencies. Such a study would also provide insightsinto how industry perceives academic approaches specifically designed forservice orientation, e.g. service-oriented maintainability metrics. The resultscould help to design new and more suited evolvability assurance processesor techniques.To analyze the state of practice in the field of this thesis, we therefore
conducted two separate empirical studies in industry, namely a quantitativesurvey (see Section 5.2) targeting general maintainability assurance as wellas differences to service-based systems and qualitative interviews (see Sec-tion 5.3) targeting the evolvability assurance of microservices specifically.By combining these two studies, the primary research goal of this chaptercan therefore be formulated in the following way:
Analyze the applied evolvability assurancefor the purpose of knowledge generation
with respect to common practices and challenges
122 5 | An Analysis of Industrial Maintainability Assurance for Service Orientation

from the viewpoint of software professionalsin the context of microservices in industry
5.2. Survey
With this survey, we wanted to gain quantitative insights from softwareprofessionals about their applied maintainability assurance, more specificallya) their used processes, tools, and metrics, b) potentially different treatmentof service- or microservice-based systems, and c) influences on their satisfac-tion w.r.t. their maintainability-related actions. To lessen restrictions on thetarget population, we specifically chose the more general quality attributemaintainability and also deliberately included both SOA and microservicesfor analyzing assurance differences.
5.2.1. Research Design
A quantitative survey is a method with the research objective to gather infor-mation about knowledge, attributes, or behavior of a population, most oftenvia the instrument of a questionnaire [KP08]. In our case, we wanted toidentify maintainability assurance practices within the target population ofsoftware professionals as well as potential differences with service-orientedsoftware. Furthermore, we wanted to analyze potential correlations be-tween applied assurance techniques and positive views of maintainabilityby participants. The second goal is in line with an exploratory survey, whichinvestigates existing relations between factors and conditions within a popu-lation [Kas05; KP08]. Therefore, the research questions for this survey areas follows:RQ1: What processes, tools, and metrics are used in the industry to
measure and control maintainability?RQ2: Is the usage of maintainability assurance different for service- or
microservice-based systems?RQ3: What correlations exist between applied assurance techniques and
participants’ overall view of maintainability in their project?
5.2 | Survey 123

To guarantee appropriate scientific rigor, survey repeatability, as wellas minimal subjective bias, we followed the seven-stage survey processdescribed by Kasunic [Kas05]. Information gathering was done via a web-based questionnaire that was first evaluated in a pilot survey. We thenmade the refined questionnaire publicly available for approximately twoand a half months. We distributed it via industry contacts, mailing lists, andsocial media. Participation was voluntary and anonymous. Only completedresponses were included and further sanity checks were performed to ensurehigh data quality. Participants were asked to focus on one of their softwareproducts or projects for some questions to make it easier for them to givespecific answers. For transparency and replicability, we published the set ofquestions as well as the results in a GitHub repository1.
5.2.2. Results
In total, 127 participants with a context of software development respondedto our online survey. After filtering out incomplete responses, 60 validresponses were left. The vast majority of these 60 participants were fromSoftware & IT Services companies (70%) followed by automotive companies(10%). Moreover, a lot of participants (32 of 60) worked at large enterprises(≥10.000 employees). Team sizes were generally smaller than 20 people(a combined ∼83%), with teams of 6 to 10 being the most frequent size(∼38%). There were a bit more participants in technical roles (softwaredeveloper, software architect, software consultant) than in non-technicalones (36 compared to 24), with the developers being the largest singlegroup (∼38%, see Fig. 5.1). 55% of participants had five or more years ofexperience in the industry, while people with three to five years of experiencewere the largest group (22 of 60 participants).All in all, the sample seems representative for companies and software
professionals that are likely to use service- or microservice-based systems,even though the high drop-out rate may indicate expectation mismatches.Sample size, however, is fairly small.
1https://github.com/xJREB/research-maintainability-survey
124 5 | An Analysis of Industrial Maintainability Assurance for Service Orientation

23
87
6 65
32
0
5
10
15
20
25
Developer Project
Manager
Architect Consultant Team Lead Coach /
Lecturer
Requirements
Engineer
Student /
Intern
Figure 5.1.: The roles of the 60 participants
To evaluate their level of relevant experience, participants were also askedabout used methods and technologies. ∼72% reported to have used someform of agile methodology, while exactly half of the participants (30) statedhaving used DevOps tools or principles. Nearly three quarters (∼73%) hadused RESTful HTTP services, ∼57% had used SOAP web services, while∼38% had even worked with message-based service communication.
5.2.2.1. Assuring Maintainability (RQ1)
To assess how maintainability is handled on a general level in their projects,we asked about the level of sophistication of applied methods. The predefinedlevels ranged from not addressing it at all, implicit and basic handling (e.g.basic refactoring, some team-wide standardization, etc.), explicit yet non-structured handling (e.g. tool support, metrics, quality model, etc.), andlastly the highest level of using a systematic process (i.e. applying explicittechniques in a structured, communicated, and recurring way). A combined60% of participants report that they do not address maintainability at all(∼12%) or only in very basic fashion (∼48%). Only ∼17% (10 of 60) use asystematic process (see Fig. 5.2).
5.2 | Survey 125

7
29
14
10
0
5
10
15
20
25
30
35
No addressing Implicit and basic Explicit, but non-
systematic
Explicit and
systematic
Figure 5.2.: The four sophistication levels of maintainability assurance
When asked about the ISO/IEC 25010 standard, the majority of theparticipants did not hear of or were not familiar with it and its notion ofmaintainability (more than 85%). This lack of knowledge could be seen as anindication that this standard is either not known in industry or not deemeduseful enough by team leads and architects to introduce their developers toit.The free-text question for maintainability tool support was optional and
answered by 40 of 60 participants. With a share of over one third, the de-facto standard reported by participants seems to be SonarQube (23 of 60)followed by FindBugs (10) and six custom implementations. After that, thefield gets extremely wide-spread with 14 different tools being mentioned onlyonce (see Fig. 5.3). A lot of reported tools support only one programminglanguage (e.g. five for Java) or focus on a very specific code quality subset(e.g. test coverage). Interestingly, participants mentioned 10 tools thatare not or only indirectly linked with maintainability, e.g. tools for projectmanagement, version control, continuous integration, or security analysis.Still, the vast majority of the mentioned tools are static source code analyzersor full-blown software quality suites. Although some of the suites can supportquality control on an architectural level, none of the participants explicitlymentioned the usage of these capabilities, e.g. architecture conformancechecking. Lastly, only seven of 60 participants (∼12%) mentioned the usage
126 5 | An Analysis of Industrial Maintainability Assurance for Service Orientation

of commercial tools.
23
10
6
3
2
1
1
1
1
1
1
1
1
1
1
1
1
1
10
2
0 5 10 15 20 25
SonarQube
FindBugs
Self-made tool
Checkstyle
PMD
Maven Jardiff
JMetrics
Lattix
CAST
Error Prone
Teamscale
VersionEye
Codecov
Cobertura
Codacy
HPE ALM Suite
QBench SISSy
Resharper
Non-related tools
None
Figure 5.3.: Used tools to support maintainability assurance
Similar to the used tools, the free-text question about the most importantused maintainability metrics was again optional and answered by 36 of 60participants (see Fig. 5.4). Interestingly, nine people explicitly reported thistime that they did not know which metrics were used and four that theyused no metrics at all (as opposed to two people that explicitly stated notool support). Test coverage is the undisputed metric champion used by onethird (20 of 60 participants). After that, cyclomatic complexity (8 of 60)
5.2 | Survey 127

and clone coverage (7 of 60) are followed by code volume metrics based onLines of Code (6 of 60), e.g. class size or method size. Only three peoplementioned metrics not related to source code, namely the defect resolutiontime and the number of architectural violations. While the nature of couplingand cohesion metrics (mentioned by a total of five) was not defined moreclearly and could theoretically be on an architectural level, the majorityof answers is still in line with the source code focus of the tool supportquestion, which shows a worrying neglect for architecture-level evolvabilityassurance. Moreover, the effectiveness of using cyclomatic complexity andmetrics based on LOC has been a very much discussed topic in recent years.Several publications argue that their values are at best dubious and, in theworst case, completely useless (see e.g. [HKV07] or [OW14]).
20
8
7
6
3
3
2
2
1
1
4
9
0 5 10 15 20 25
Test coverage
Cyclomatic complexity
Clone coverage
LoC
Comment ratio
Coupling metrics
Architectural violations
Cohesion metrics
Naming conventions
Defect resolution time
None
Not sure
Figure 5.4.: Used metrics to quantify maintainability
128 5 | An Analysis of Industrial Maintainability Assurance for Service Orientation

5.2.2.2. Maintainability Satisfaction
The next category addressed the general satisfaction with maintainability aswell as with applied assurance techniques. In general, 40% of participantswere not satisfied with the degree of maintainability of their software, while35% were somewhat satisfied. Only a quarter of participants (15 of 60) wereactually content with the degree of maintainability (see Fig. 5.5).
8
16
21
14
1
0
5
10
15
20
25
Not at all
satisfied
Not really
satisfied
Somewhat
satisfied
Satisfied Very much
satisfied
Figure 5.5.: The participants’ degree of satisfaction w.r.t. maintainability
This is further strengthened by the fact that nearly every participant men-tioned some symptoms of lowmaintainability with their project (see Fig. 5.6).80% of participants (48 of 60) reported three or more symptoms, ∼47%even reported five or more symptoms. Only ∼3% (2 of 60 participants)said they had no significant issues. The most frequently encountered oneswere missing or outdated documentation (∼56%) and inadequate testing(∼51%). These were followed by four symptoms mainly associated withevolvability, namely more time needed to add new functionality (∼48%), highnumber of defects with new releases (∼45%), architectural erosion or com-plexity (∼36%), and low release frequency (∼36%). Unsurprisingly, thereis a medium negative correlation with very high significance between thenumber of reported symptoms and the reported level of satisfaction w.r.t.maintainability (Spearman’s rho: -0.446, p-value: 0.00035).
5.2 | Survey 129

34
31
29
27
22
22
21
20
20
19
15
11
2
0 5 10 15 20 25 30 35 40
Outdated documentation
Inadequate testing
Adding functionality takes longer
Defects with new releases
Architectural erosion
Low release frequency
Problematic dependencies
High issue resolution time
Large/complex components
Inadequate deployment process
Duplicate code
Outdated libraries
No significant issues
Figure 5.6.: Reported symptoms of low maintainability
Participants reported a mixed subjective feeling for the effectiveness andefficiency of the applied methods. ∼53% believed that their maintainabilityrelated actions did increase the quality of their software significantly. ∼38%were somewhat satisfied with the effectiveness, while ∼9% believed thatquality is not or not significantly increased by their actions. So a little bitless than half of participants perceived their maintainability assurance asnot or only partially beneficial (Fig. 5.7). Concerning the efficiency, around62% thought that these actions did not or not substantially hinder theirproductivity in some form. ∼30% felt somewhat hindered and only ∼8%(4 of 60) reported that they truly experienced a decrease in productivity(Fig. 5.8).
130 5 | An Analysis of Industrial Maintainability Assurance for Service Orientation

32
2021
7
0
5
10
15
20
25
Not at all
improved
Not really
improved
Somewhat
improved
Improved Very much
improved
Figure 5.7.: Self-reported impact on software quality
8
25
16
4
00
5
10
15
20
25
30
Not at all
hindered
Not really
hindered
Somewhat
hindered
Hindered Very much
hindered
Figure 5.8.: Self-reported impact on productivity
In accordance with that, 75% of participants reported that they wouldstill like to do more for maintainability (8 of 60 even thought “a lot more”was necessary). 15% wanted to keep their efforts the same, while 10%wanted to do less. Unsurprisingly, there was a highly significant correlationbetween changing the current maintainability-related effort and the numberof reported symptoms of low maintainability (Spearman’s rho: 0.428, p-
5.2 | Survey 131

value: 0.00064), i.e. the more symptoms participants reported, the moredetermined they were to increase current maintainability-related efforts. Inthis entire category, however, no correlation with having a technical rolecould be observed.
5.2.2.3. Treatment of Service-Oriented Software (RQ2)
Questions in the final category aimed to investigate whether service- ormicroservice-based systems received special treatment by participants or ifthe same maintainability assurance methods were applied as for systemsnot based on service orientation. Furthermore, we asked about the specificsof potential differences or, respectively, the reason for not treating themdifferently. ∼67% did not treat maintainability differently for these systems(see Fig 5.9). ∼26% apply a somewhat different strategy and only ∼7% (4of 60) treat these systems in a significantly different way.
40
16
4
0 10 20 30 40 50
No
Yes, to some degree.
Yes, significantly.
Figure 5.9.: Is service-oriented software treated differently?
The differences reported by the 20 participants are mostly in the area ofthe applied process (55%, see also Fig 5.10). Examples are a different testingprocess (additional integration and behavior-driven testing), the usage ofreference architectures, standardization of interfaces, agile methodologies,or a different deployment process. Five participants mention different toolsupport (e.g. due to the increased technological heterogeneity) and onlythree report a different metric usage to respect the additional abstractionof services. Interestingly, six participants mention relaxed maintainabilitycontrols because of trust in the high base level of maintainability gained
132 5 | An Analysis of Industrial Maintainability Assurance for Service Orientation

through service orientation (e.g. flexibility, scalability, less dependencyproblems, separation of concerns), which seems to be in line with the findingsby Voelz and Goeb [VG10] and Ameller et al. [AGAF16].
11
65
3 3
0
2
4
6
8
10
12
Process Trust in
increased
maintainability
Tools Metrics Not sure
Figure 5.10.: Categorized differences when treating services
When the 40 participants that did not treat services differently were askedfor their rationale, over half of them did not know why and had neverthought about it. An additional ∼17% wanted to change something, but didnot quite know what to do. ∼25% regarded their standard approach formaintainability as sufficient. These results seem to indicate that a significantamount of software developing companies is not aware of existing service-oriented approaches and metrics for maintainability or sees no need forspecial treatment despite their vastly different nature (see Fig. 5.11).
5.2 | Survey 133
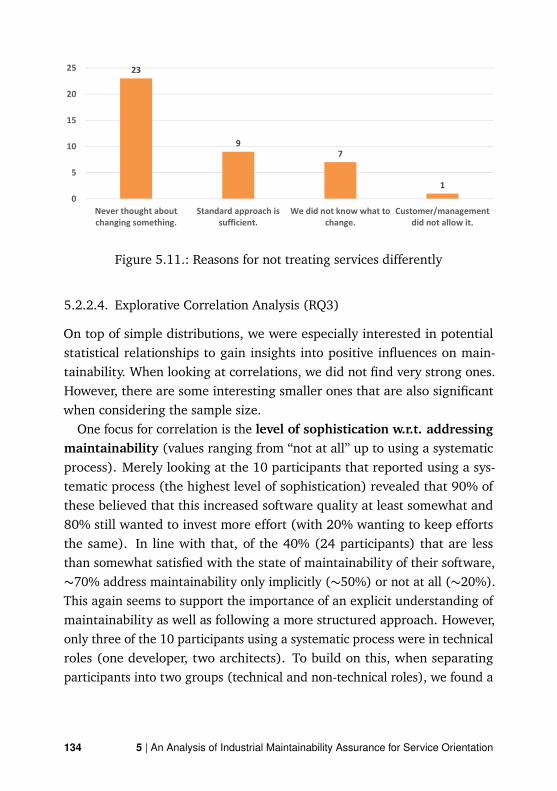
23
97
1
0
5
10
15
20
25
Never thought about
changing something.
Standard approach is
sufficient.
We did not know what to
change.
Customer/management
did not allow it.
Figure 5.11.: Reasons for not treating services differently
5.2.2.4. Explorative Correlation Analysis (RQ3)
On top of simple distributions, we were especially interested in potentialstatistical relationships to gain insights into positive influences on main-tainability. When looking at correlations, we did not find very strong ones.However, there are some interesting smaller ones that are also significantwhen considering the sample size.
One focus for correlation is the level of sophistication w.r.t. addressingmaintainability (values ranging from “not at all” up to using a systematicprocess). Merely looking at the 10 participants that reported using a sys-tematic process (the highest level of sophistication) revealed that 90% ofthese believed that this increased software quality at least somewhat and80% still wanted to invest more effort (with 20% wanting to keep effortsthe same). In line with that, of the 40% (24 participants) that are lessthan somewhat satisfied with the state of maintainability of their software,∼70% address maintainability only implicitly (∼50%) or not at all (∼20%).This again seems to support the importance of an explicit understanding ofmaintainability as well as following a more structured approach. However,only three of the 10 participants using a systematic process were in technicalroles (one developer, two architects). To build on this, when separatingparticipants into two groups (technical and non-technical roles), we found a
134 5 | An Analysis of Industrial Maintainability Assurance for Service Orientation
small but significant negative correlation between having a technical roleand the reported level of sophistication (Spearman’s rho: -0.273, p-value:0.035). A possible interpretation could be that non-technical roles are morelikely to label their used methods as explicit and systematic, which alsowould suggest that the actual number of systematic approaches in practicecould have been even lower.However, there is still a small correlation between the general level of
sophistication of the applied methods and satisfaction with the overall stateof maintainability of the software system (Spearman’s rho: 0.259, p-value:0.046). This supports the general notion of the findings mentioned above,i.e. the more explicit and systematic the applied maintainability controlsare, the more likely people are to be satisfied with this quality attribute. Weneed to keep in mind though that some form of cognitive dissonance couldin theory strengthen this effect: investing a lot of effort in something canlead to higher personal affection. Moreover, we also see a highly significantcorrelation between the level of sophistication and whether services aretreated with special maintainability assurance mechanisms (Spearman’srho: 0.349, p-value: 0.006). A straight-forward explanation would be thatexperienced professionals with sophisticated methods are also aware of thenecessity to respect the differences introduced by service orientation in thisregard.Another interesting focus for correlations is the degree to which partici-
pants believe their maintainability related actions increase software quality.There is for instance a small correlation with the degree to which partici-pants feel hindered in productivity by said actions (Spearman’s rho: 0.273,p-value: 0.047), i.e. participants that feel they managed to improve soft-ware quality are more likely to also feel slightly hindered in productivityby doing so. This suggests that a number of currently applied methods inthis population subset that successfully increased software quality may notbe efficient enough. However, there is no correlation between a hindrancein productivity and the level of sophistication of the applied methods. Sothe intuitive notion that using a systematic process would have a relation todecreased productivity does not seem to hold in this sample.
5.2 | Survey 135

Lastly, there is a highly significant correlation between reported toolusage and wanting to change the current maintainability-related effort(Spearman’s rho: 0.439, p-value: 0.00045), i.e. people that use tools tosupport maintainability control are more likely to say that they want to investeven more time to increase this quality attribute. A suggested explanationcould be that tool support makes it not only easier to identify problems thatdevelopers would have otherwise missed: it can also reduce the effort tocorrect some of them through automation. Interestingly, we did not find thesame for using metrics. While there is a small correlation with investing moreeffort, its p-value of 0.117 is too large to be seen as significant in this sample.Unsurprisingly, however, using metrics is strongly and highly significantlycorrelated with using tool support (Spearman’s rho: 0.667, p-value: 6.04e-09), so there is still an indirect link between the two. A second correlatedproperty to using tools with high significance is treating service-orientedsoftware different in comparison to other types of systems (Spearman’s rho:0.372, p-value: 0.0035). Similarly, the same holds true for reporting theuse of metrics (Spearman’s rho: 0.307, p-value: 0.017). So people thatexplicitly reported the usage of tools or metrics are more likely to applya special treatment to systems based on service orientation. This findingstrengthens the already mentioned correlation between the general level ofsophistication and treating service-oriented systems differently: the moreelaborate the applied processes, tools, and metrics are, the more experiencedand skilled the developers usually are with maintainability and, therefore,they appropriately treat the different nature of services.
5.3. Interviews
While analyzing the survey data for a potentially different assurance treat-ment of service-oriented software, we concluded that a quantitative surveyis not the best instrument to thoroughly investigate such a specialized topic.Only very few participants had provided detailed insights in this area viathe optional free-text field. Even with a larger sample size, the differences
136 5 | An Analysis of Industrial Maintainability Assurance for Service Orientation

and especially rationales would be hard to pin down within the constraintsof a questionnaire. Qualitative methods like expert interviews seemed amuch better way to approach this, especially for such a recent topic asmicroservices.We therefore additionally conducted detailed interviews with 17 software
professionals from 10 different companies. They described 14 differentsystems with various microservices characteristics and their concrete evolv-ability assurance process, including tool, metric, and pattern usage. Wealso talked with them about the evolution qualities of microservices, howmicroservices influence the assurance process, and their perceived challengesfor evolvability in the context of microservices.
5.3.1. Research Design
We generally followed the five-step case study process as described by Rune-son and Höst [RH09] to structure our research. We describe the differentparts in the following subsections. As a first step, we defined our detailedresearch questions. We formulated three research questions to set a directionand scope for our study:RQ1: How do software professionals structure the general evolvability
assurance activities for microservices and for what reasons?RQ2: What tools, metrics, and patterns do software professionals use for
assuring the evolvability of microservices and with what rationales?RQ3: How do software professionals perceive the quality of their microser-
vices and assurance processes and what parts do they see as challenging?Since quantitative survey research with questionnaires would not be in-
depth enough to cover participants’ rationales, we chose a qualitative re-search approach. Qualitative methods analyze relationships between con-cepts and directly deal with identified complexity [Sea08]. Results from suchmethods are therefore very rich and informative and can provide insightsinto the thought process of participants. We selected semi-structured inter-views [HA05; Sea08] as a concrete method. Therefore, we followed a basicagenda, but could also dynamically adapt our questions based on responses.
5.3 | Interviews 137

For our interview participants, we defined the following requirements:
• Significant professional experience (minimum of five years) and solidknowledge of service orientation
• Technical role (e.g. developer or architect) that at least sometimeswrites code
• Recent participation in the development of a system with microservicescharacteristics
We recruited participants via personal industry contacts of the researchgroup and by attending industry meet-up groups on microservices, wherewe approached companies from different domains and of different sizes.To ensure a base degree of heterogeneity within our population, we onlyallowed a maximum of three participants per company. Additionally, if twoparticipants talked about the same system, they needed to have differentroles.
5.3.1.1. Preparation for Data Collection
Before conducting the interviews, we created several documents. We pre-pared an interview preamble [RH09] that explained the interview processand relevant topics. To make participants familiar with the study, theyreceived this document beforehand. The preamble also outlined ethicalconsiderations like confidentiality, requested consent for audio recordings,and guaranteed that recordings and transcripts would not be published. Asa second document, we created an interview guide [Sea08] that containedthe most important questions grouped in thematic blocks. This guide helpedus to scope and organize the semi-structured interviews and we used it as aloose structure during the sessions. We did not share it with intervieweesbeforehand. Furthermore, we created a slide set with additional interviewartifacts for certain topics or questions, such as an exemplary list of assur-ance tools. These slides were also not shared with participants before theinterviews. For the analysis, we created a preliminary set of coding labels
138 5 | An Analysis of Industrial Maintainability Assurance for Service Orientation

and a case characterization matrix [Sea08] containing the most importantcase attributes.
5.3.1.2. Evidence Collection
In total, we conducted 17 individual interviews (no group interviews). Six ofthese were performed face to face and 11 via remote communication softwarewith screen sharing. All interviews except for an English one were conductedin German. Each participant agreed to a recording of the interviews, whichtook between ∼45 and ∼75 minutes. We loosely followed the structure ofthe interview guide and adapted based on how a participant reacted. Asan initial ice breaker, we asked participants to describe their role and thesystem they worked on. Later on, the topic shifted to the evolvability of thesystem and potential symptoms of technical debt. The next thematic blockwas the concrete assurance process for the system. We presented a maturitymodel with four levels that ranged from implicit and basic to explicit andsystematic (see Fig. 5.12). We then asked participants to place themselveson the level that corresponded the most to their current assurance activities.From there, we discussed the details of the process such as techniques, tools,and metrics.Assurance Maturity Levels
7
0No conscious addressing of evolvability
1Implicit and basic (e.g. occasional refactoring, some guidelines and standards without enforcement, etc.)
2Explicit, but non-structured (e.g. tool support, metrics, quality model, elaborate guidelines and standards, etc.)
3Using a systematic process (i.e. applying level 2 techniques in a structured and recurring way at scale)
Figure 5.12.: Used evolvability assurance maturity levels
5.3 | Interviews 139

Lastly, we asked questions about challenges and participants’ satisfactionwith the current process. The satisfaction and reflection questions relied ona five-point Likert scale from -2 (very negative) to +2 (very positive) with 0being the neutral center. After the interviews, we manually transcribed eachaudio recording to create a textual document. We then sent these documentsto participants for review and final approval. During this review, intervieweeswere able to delete sensitive paragraphs or change statements of unclearor unintended meaning. Afterwards, we used the approved transcripts fordetailed qualitative content analysis.
5.3.1.3. Data Analysis
As a first step, we performed the coding of each transcript. Using the createdpreliminary set of codes, we assigned labels to relevant paragraphs. Duringthis process, we created several new labels and revisited already finishedtranscripts. Labels were also renamed, split, or merged as we acquired amore holistic understanding of the cases. These coding activities followed theconstant comparison method that is based on grounded theory [Sea08]. Afterthe coding of all transcripts, we analyzed the details and code relationshipsof each transcript. This activity resulted in a textual description for everycase.In the second step, we applied cross-case analysis [Sea08] to identify
important generalizations and summaries between the cases. We usedthe coding system and the created case characterization matrix as well astabulation [RH09]. For each research question, important findings wereextracted from the transcript and documented. During this process, we alsorefined the case characterization matrix. General trends and deviations weredocumented and later aggregated into results and take-aways. To increasetransparency and reproducibility, we published all interview documents andartifacts (except for the full transcripts) as well as the results of the analysis
140 5 | An Analysis of Industrial Maintainability Assurance for Service Orientation

Table 5.1.: Company and participant demographics (CID: company ID, PID:participant ID, Exp.: years of experience, SID: system ID)
CID Company Domain # of Employees PID Participant Role Exp. SID
C1 Financial Services 1 – 25 P1 Developer 6 S1
C2 SW & IT Services >100,000P2 Lead Architect 30 S2P3 Architect 24 S3P4 Architect 30 S4
C3 SW & IT Services 26 – 100 P5 Architect 20 S5P6 Lead Developer 8
C4 SW & IT Services 101 – 1,000 P7 Architect 9 S6P8 Architect 17 S7
C5 SW & IT Services >100,000 P9 Lead Developer 7 S8
C6 Tourism & Travel 1,001 – 5,000P10 Developer 9 S9P11 Data Engineer 7P12 Architect 12 S10
C7 Public Transport 101 – 1,000 P13 DevOps Engineer 5 S11P14 Architect 17 S11a
C8 Retail 5,001 – 10,000 P15 Lead Architect 9 S12C9 SW & IT Services 101 – 1,000 P16 Architect 18 S13C10 Retail 1,001 – 5,000 P17 Architect 22 S14
on both GitHub1 and Zenodo2.
5.3.2. Results
Our interviewees were from 10 different companies (C1–C10) of differentsizes and domains (see Table 5.1). Half of these were software & IT ser-vices companies that mostly developed systems for external customers. Thecompanies from other domains always had an internal system owner. Everyparticipant was located in Germany, even though some companies had sitesin several European countries or even globally. From our 17 participants(P1–P17), 11 stated architect as their role, while four were developers. Theremaining two roles were data engineer and DevOps engineer. All partici-pants possessed a minimum of five years of professional experience, with a
1https://github.com/xJREB/research-microservices-evolvability-interviews
2https://doi.org/10.5281/zenodo.2586916
5.3 | Interviews 141

Table 5.2.: General case characteristics (1/2): system purpose, # of services,and self-reported assurance maturity level (0-3)
ID System Purpose # of Services Maturity Level
S1 Derivatives management system (banking) 9 2S2 Freeway toll management system 10 3S3 Automotive problem management system 10 1.5S4 Public transport sales system ∼100 1.5S5 Business analytics & data integration system 6 P5: 1
P6: 1.5S6 Automotive configuration management system 60 3S7 Retail online shop ∼250 2.5S8 IT service monitoring platform 9 2S9 Hotel search engine ∼10 P10: 1.5
P11: 3S10 Hotel management suite 20 2S11 Public transport management suite
(S11a: human resource management part)10 products P13: 1.5
P14: 2.5S12 Retail online shop ∼45 2.5S13 Automotive end-user services mgmt. system 7 2S14 Retail online shop ∼175 2
median of 12 and a mean of 14.7 years. Altogether, we discussed 14 systems(S1–S14) and their evolvability assurance processes, where in three cases,two participants talked about the same system (S5, S9, S11).For the sake of brevity, this thesis only contains the aggregated results.
We provide a detailed description of every case in our online repositories1,2.The descriptions include general information about the system, the detailsof the evolvability assurance process, and lastly, reflections and challengesper system. Table 5.2 and Table 5.3 summarize the self-assessed assurancematurity levels as well as the usage of tools, metrics, and patterns to analyzeand improve evolvability. Fig. 5.13 presents the summary of participants’reflections of their assurance processes. Lastly, we list the challenges mostfrequently reported by participants in Fig. 5.14.By analyzing and comparing the individual cases, we identified several
trends or common relationships. These generalizations, summaries, or no-table deviations from common assumptions are presented in the following
142 5 | An Analysis of Industrial Maintainability Assurance for Service Orientation

Table 5.3.: General case characteristics (2/2): tools, metrics, and patternsused for evolvability assurance
ID Tools Metrics Patterns
S1 IDE linting – Event-Driven Messag-ing, Service Registry
S2 SonarQube (FindBugs,Checkstyle, PMD)
Test coverage, cyclomatic com-plexity, clone coverage, # of de-fects per service, # of failed tests,# of code smells, # of endan-gered requirements
Event-Driven Messag-ing
S3 SonarQube (FindBugs,Checkstyle, PMD)
Test coverage, clone coverage, de-fect resolution time
Event-Driven Messag-ing, Strangler
S4 SonarQube (FindBugs), Ver-sionEye
# of code smells, test coverage, #of outdated dependencies
Event-Driven Mes-saging, Backends forFrontends, Consumer-Driven Contracts,Tolerant Reader
S5 SonarQube (FindBugs,Checkstyle, PMD)
Test coverage Event-Driven Messag-ing
S6 SonarQube (FindBugs,Checkstyle)
Test coverage, # of failed tests, #of code smells, cyclomatic com-plexity, clone coverage, LOC
Event-Driven Messag-ing
S7 SonarQube (FindBugs, PMD,Checkstyle), Cobertura, IDElinting, custom static ana-lyzer for coding conventions
Test coverage, cyclomatic com-plexity, clone coverage, # of ruleviolations, velocity
API Gateway
S8 SonarQube (FindBugs), IDElinting
Cognitive complexity, # of codesmells, test coverage
Event-Driven Messag-ing
S9 P10: Checkstyle, IDE lint-ing; P11: SonarQube (Find-Bugs,Checkstyle)
P10: Defect resolution time, burn-down; P11: # of code smells, #of rule violations
Event-Driven Messag-ing, Request-Reaction
S10 SonarQube, IDE linting Test coverage, # of endangeredusage scenarios
Self-Contained Systems,Backends for Frontends
S11 P13: SonarQube (FindBugs,Checkstyle); P14: Find-Bugs, PMD, Cobertura, cus-tom tool for architecturalconformance checking
P13: # of code smells; P14: # ofarchitectural violations, # of ruleviolations
–
S12 SonarQube (FindBugs,Checkstyle, PMD), IDElinting, Codecov, Cobertura
Test coverage, cyclomatic com-plexity, # of code smells, # of ruleviolations
Event-Driven Messag-ing, Consumer-DrivenContracts
S13 SonarQube (FindBugs,Checkstyle, PMD)
Test coverage, # of code smells,# of rule violations
Event-Driven Messag-ing
S14 SonarQube (FindBugs,Checkstyle, PMD), Struc-ture101, Codecov, Cober-tura, Codacy
Test coverage, CI/CD pipeline du-ration, LOC
Event-Driven Messag-ing, Self-ContainedSystems, Event Sourc-ing
5.3 | Interviews 143

subsections that correspond to our three research questions.
5.3.2.1. Assurance Processes (RQ1)
With RQ1, we intended to find out what general techniques participantsused to assure the evolvability of microservices, how they structured theseactivities, and what participants’ rationales for these decisions were. Sinceone microservices characteristic is the decentralization of control and man-agement, we also wanted to analyze how much central governance wasapplied.In general, every analyzed assurance process had some degree of explicit
and conscious addressing of evolvability, even though the sophistication andextensiveness of the applied techniques varied greatly. When looking at thelarger systems, there were two different approaches for assuring evolv-ability: very decentralized with very autonomous teams (e.g. S9, S10, S12,S14) vs. centralized governance for macroarchitecture, technologies, andassurance combined with a varying degree of team autonomy for microar-chitecture (e.g. S2, S3, S4, S7, S13). Participants usually applied the latterkind for systems that were built for external customers and that exhibitedsome project characteristics.In the decentralized variant, the internal system was managed in a con-
tinuous product development mode, which created quality awareness bymaking people responsible and simultaneously empowering them. This vari-ant is more in line with the microservices and DevOps principle “you buildit, you run it”. Techniques in this variant also were by no means basic orimplicit. Even though teams were allowed to choose their assurance activi-ties, they usually created a more or less structured processes that did notdepend on external governance. This flexibility was hard to replicate for ITservice providers that often did not operate the systems themselves (S2, S3,S4, S7, S13) and had to coordinate with external customers or even othercontractors (S4, S7). Therefore, they relied more on central governance.Architect P4 described it as follows: “In our case, the main challenge is toconvince 300 people to move in the same direction. For that, we created a very
144 5 | An Analysis of Industrial Maintainability Assurance for Service Orientation

large number of guidelines and rules for service creation.”Nonetheless, our interviewees saw such guidelines, principles, or stan-
dardizations as important parts of the process in both variants. These codinglabels were among the most frequent ones. Nearly all participants reportedtheir usage in various areas such as architectural principles, rules for servicecommunication, skeleton projects, style guides, cross-cutting concerns likelogging or authentication, candidate technologies, or Docker images. Thedegree of enforcement varied between companies and was usually higherwithin the centralized variant. In the decentralized variant, pragmatism andsimplicity were often more important than the strict adherence to rules andwere reported as key principles (“KISS”) by several participants (P5, P8, P10,P12, P15, P17).To make assurance activities more efficient and objective, all participants
saw automation and tool support as useful, albeit with varying enthusiasm.Several participants reported the integration of quality analysis tools intothe CI/CD pipeline (P2, P3, P8, P9, P11, P14, P15, P17). These tools wereoften combined with quality gates, i.e. automated source code checks thatcould prevent merging or deployment. For P17, the pipeline’s execution timewas crucial: only tools that were absolutely necessary should therefore beintegrated. Additionally, several participants advocated for a sensible usageof quality gates. P11 was frustrated with how difficult it would be to get apassing merge request due to the strict rules. Similarly, P10 mentioned thatstrict quality gates could hinder the deployment of important productionbug fixes. P7’s team did not use any quality gates because of continuousexperimentation and prototyping. Lastly, P2’s team circumvented some ofthese issues by applying quality gates only for releases and not for merge orpull requests.Nearly all participants agreed that test automation was an important
part for the assurance process of microservices. While unit tests were verycommon, several participants also reported automated end-to-end tests forthe integration of microservices and stressed their importance (P2, P3, P7,P12, P16). Some teams also had more elaborate strategies that linked tests torequirements (S2) or usage scenarios (S10). Participants with only unit tests
5.3 | Interviews 145

(P5, P6, P9) or barely any tests (P10) also saw the importance of bringingtheir test automation to a higher level.Despite the reported importance of automation and tool support, several
participants also highlighted the usefulness of manual assurance activities.Code reviews were seen as an important practice to increase code qualityand to share knowledge within the team (P1, P3, P4, P5, P7, P8, P10, P11).For the same reasons, two participants regularly used pair programmingand willingly accepted its downside of additional working-hours (P8, P15).Lastly, refactoring was highly valued and some participants also explicitlymentioned the use of the “boy scout” rule during feature implementations(P11, P15), i.e. the principle to always leave changed code cleaner thanbefore. Activities like these would efficiently increase code quality over time.Even though some participants were proponents of concise documentation
or architectural decision records within the source code repository (P10,P11), several systems relied on more elaborate architecture and servicedocumentation in a system like Confluence or SharePoint (S1, S4, S5, S6,S8). Common types of documentation were system architecture, servicedependencies and contracts between teams, service functionality and APIdescriptions, reference architectures and service blueprints, design rationales,or architectural principles and guidelines. For IT service providers, parts ofthis documentation was also used to communicate with the customer. Lastly,only P7 and P14 reported the conscious tracking of identified technical debtitems for later debt management. P7’s teams held an explicit meeting everytwo weeks, where they discussed the most important technical debt itemsand their prioritization.
5.3.2.2. Tools, Metrics, and Patterns (RQ2)
Our second research question targeted the application of and rationale fortools, metrics, and design patterns. Automation and tool support is an often-cited microservices characteristic and seen as necessary to manage a largenumber of small components. We were also interested if participants usedtools and metrics specifically designed for service orientation. Lastly, we
146 5 | An Analysis of Industrial Maintainability Assurance for Service Orientation

wanted to explore the usage of design patterns for evolvability construction,since there is a large body of patterns for Service-Oriented Architecture(SOA) and more recently also for microservices.
While the usage of over a dozen different tools for evolvability assurancewas reported, 14 of 17 participants named SonarQube as the central tool thatwas usually integrated into the CI/CD pipeline. Since P1 and P10 plannedto introduce it soon, P14 remained the only participant that would not useSonarQube in the foreseeable future. Reported reasons for its popularitywere the open source license, the easy installation, plugin availability, andconfigurability. In Java-focused systems, SonarQube was often extendedwith tools like FindBugs, Checkstyle, and PMD. Additionally, intervieweesused specialized tools for test coverage like Cobertura (P8, P14, P15, P17),Codecov (P15, P17), or Codacy (P17). For a basic degree of local andimmediate quality assurance, IDE linting via e.g. TSLint, ESLint, and PHPLintwas reported by some participants (P1, P8, P10, P12, P15).With respect to metrics, 10 of the 17 participants reported the usage of
test coverage, even though some perceived this metric as less important thanothers and were very aware of possible quality differences with automatedtests. P12 termed it as follows: “Even I could fake the coverage for two classesyou give me in like five minutes. You can write a test that brings coverage toabout 60%, but actually it covers like 2%.” Some participants also focused onadditional metrics for testing and functional correctness like the number offailed tests over time (P2, P7), the number of defects per service (P2), or thenumber of endangered requirements (P2) or usage scenarios (P12). MostSonarQube users also paid attention to standard findings like code smells,code duplication, and cognitive or cyclomatic complexity. Participants withrule-based tools like FindBugs, Checkstyle, or other linters used the numberof rule violations as a simple metric that had to be zero.Overall, most applied metrics were focused on source code quality, even
though a few participants saw their effectiveness for the whole system ascontroversial (P8, P17). P17 described it as follows: “Most of these metricsrelate to a single project, which is very useful when I have a monolith witha million LOC. However, if I have a service with 1000 LOC which code base
5.3 | Interviews 147

is separated from all other 150 microservices, most of these metrics lose theirimportance.” Concerning productivity metrics, some interviewees reportedthe usage of defect resolution time (P3, P10), velocity (P8), sprint burndown(P10), or deployment duration (P17). These were important for them tocontrol and manage software evolution.While architecture-related topics like microservices dependencies were
very prevalent during our interviews, participants generally did not applyarchitecture-level tools and metrics. P14’s team used a custom tool forarchitectural conformance checking in the monolithic code base for a sub-product of S11 and P17 reported the intermittent usage of Structure101 for alarger subsystem that also consisted of one codebase. Apart from that, toolsor metrics were exclusively focused on code quality with a local view for asingle service. Participants did not mention automatic or semi-automaticefforts to evaluate the architecture of a microservice-based system.Likewise, no participant reported the usage of a tool or metric designed for
service orientation. When we explicitly asked about service-oriented metricslike the coupling of a service, the cohesion of a service interface, or thenumber of operations in a service interface, several participants indicatedthat these sounded interesting and useful (P1, P5, P6, P7, P8, P15). Someinterviewees also noted that the underlying principles of these metrics wereimportant guidelines in the architecture and design phase (P7, P8, P10, P15,P17). They tried to manually respect these principles during e.g. servicecutting, even though they currently had no measurements in place to validatethem.Another common theme in this area was the healthy and non-patronizing
usage of tools and metrics, which should be respected when developingmicroservices in decentralized and relatively autonomous teams. As alreadymentioned, several participants voiced reservations against test coverage(P10, P12, P15). P14 also warned that a strict metric focus would posethe danger that people optimized for measurements instead of fixing theunderlying problems. Moreover, P15 perceived it as difficult to interpret mea-surements of a single service without a point of reference or a system-wideaverage (P15). P17 advocated for a sparse usage of tools because developers
148 5 | An Analysis of Industrial Maintainability Assurance for Service Orientation

could only efficiently analyze a small number of metrics. Metric collectioncould also slow down the deployment pipeline. Therefore, only tools thatwould support the analysis of current problems should be kept. Lastly, P8and P14 highlighted the agile principle of “individuals and interactions overprocesses and tools”: the usage of tools and metrics should support develop-ers in their daily work and not be a frustrating and alienating experience forthem.We also analyzed the usage of service-oriented design patterns as con-
sciousmeans to increase evolvability. In general, we did not find awidespreadusage of them. Most common was Event-Driven Messaging that was partiallyapplied in 11 of the 14 cases. While several participants stated that theyused the pattern to decouple services, another intention was to implementreliable asynchronous and long-running communication. The pattern wassometimes paired with Request-Reaction (P10, P16). Apart from messaging,most participants applied activity patterns like Service Refactoring, ServiceDecomposition, and Service Normalization. In line with the philosophy ofevolutionary design, microservices were frequently split and merged.Other patterns were used sporadically. P12 and P17 applied the Self-
Contained System paradigm to achieve vertical isolation between subsystems.In a migration context, P3 and P16 reported the usage of the Stranglerpattern to extend an existing monolith with new microservices until its finalreplacement. To place an intermediary between service consumers andproducers, P4 and P12 implemented the Backends for Frontends patternthat would also prevent too many concurrent long-running HTTP requests.Similarly, P8 chose the API Gateway pattern, which also brought benefitsfor security. The patterns Consumer-Driven Contracts (P4, P15) and TolerantReader (P4) were applied to make service interface evolution more robust andto prepare consumers for future changes. Lastly, P1 was the only participantto explicitly report the usage of the Service Registry pattern for dynamicservice discovery, even though some participants may have used similarfunctionality via Kubernetes.
5.3 | Interviews 149

5.3.2.3. Evolvability Reflections and Challenges (RQ3)
With RQ3, we wanted to analyze participants’ perception of the generalevolution qualities of their microservice-based systems as well as their satis-faction with their current assurance processes (see Fig. 5.13). We also triedto summarize what participants experienced as the most critical challengesfor the evolvability of their microservices (see Fig. 5.14).
3
2
2
7
4
2
2
7
7
11
9
3
3
2
4
0% 10% 20% 30% 40% 50% 60% 70% 80% 90% 100%
Wanted Change in Assurance Efforts
Assurance Impact on Productivity
Assurance Effectiveness
Evolvability Rating
Very negative (-2) Negative (-1) Neutral (0) Positive (+1) Very Positive (+2)
Figure 5.13.: Aggregated evolvability assurance reflections of participants
Generally, our interviewees perceived the evolvability of their microser-vices as positive (mean: +0.88, median: +1), especially in cases with amigration context where they had rewritten a monolith. Only two partic-ipants chose a negative rating (-1). Architect P4 saw the high degree oftechnological heterogeneity and the very different service granularity asthreatening for the large project, especially once S4 would be handed over tothe smaller maintenance team. Data engineer P11 described the chosen ser-vice cuts as inefficient and politically motivated and worried about significantissues with the consistency of the data model as well as the inaccessibility ofcode due to distributed repositories.As for more specific quality attributes, the analyzability of individual ser-
vices would be much improved (P1, P8, P10, P16, P17), even though graspingand understanding the whole system would be difficult (P7, P8, P11, P17).When compared to most monoliths, the modularity of microservices wouldmake it very convenient to change or add functionality (P1, P3, P6, P9,P12, P17) and would also allow to efficiently scale-out the development
150 5 | An Analysis of Industrial Maintainability Assurance for Service Orientation

with multiple teams (P7, P16). Even though reuse is usually a theme morecommon in SOA, several participants reported positive reusability of theirmicroservices (P1, P3, P7, P8, P10, P17). To reduce coupling, some partic-ipants avoided the sharing of non-open source code between services viaduplication (P7, P10, P15, P17). Others tried to consciously increase reusevia shared libraries (P3, P9) or by slightly generalizing service interfaces(P1). Lastly, participants reported that individual services would be easy totest (P3, P7, P10, P13, P15) and to replace (P2, P15, P17).Since most systems were relatively young or even still in the process of
being migrated, individual services were usually of good quality. Basic symp-toms of technical debt or bad code quality were rarely seen as an issue,especially since a single service would be easy to replace. However, prob-lems related to architecture and the data model were reported as severethreats for long-term evolvability (P3, P7, P11, P13, P15). Such issues weresometimes exacerbated because coordination between autonomous teamswould be difficult (P4, P10, P11, P15). Moreover, finding the appropriateservice granularity was a prevalent theme and service cutting was by farnamed as the most challenging activity that was also associated with frequentrefactoring (P2, P3, P4, P6, P7, P9, P11, P12, P15). Harmful inter-servicedependencies sometimes led to ripple effects on changes (P3, P5, P9, P11,P15), which made adding or changing functionality slower and more error-prone. Breaking API changes caused similar effects for service consumers(P1) or automated tests (P2). Participants did not use any tools to supportservice decomposition or metrics to evaluate the quality of the chosen cuts,e.g. via coupling or cohesion. P2 described it as follows: “In my opinion,there are no useful tools to split up a monolith. It’s always a very difficultmanual activity. You can use something like Domain-Driven Design, but that’sjust a methodology which doesn’t give you a concrete solution.”
5.3 | Interviews 151

0 1 2 3 4 5 6 7 8 9 10
Service Cutting
No System-Centric View
Mastering Technologies
Technological Heterogeneity
Missing / Outdated Documentation
Inter-Service Dependencies / Ripples
Architectural / Technical Complexity
Unhealthy Metric Usage
Integrating Legacy Code
Coordination Between Decentralized Teams
Inadequate Testing
Communicating the Importance of Assurance
Microservices Integration
Tool/Process Frustration and Patronization
Breaking API Changes
Distributed Code Repositories
# of participants
Figure 5.14.: Most frequently reported challenges for the evolvability ofmicroservices
Participants were divided when it came to technological heterogeneity.In very decentralized environments, it was generally perceived as overallbeneficial (P10, P15, P17), as it would allow choosing the best solutionfor problems at hand, broaden developers’ experience and skills, and makea company a more attractive employer. Other participants perceived it aspotentially dangerous and wished for a more sensible handling of technologyhypes (P3, P4, P12, P16). Similarly, the mix of legacy and modern servicetechnology would sometimes pose additional problems (P2, P11, P13, P14),like in the case of S9 where additional tooling was necessary to integratelegacy PHP components. Most participants also noted that they had to spendsignificant efforts on mastering new microservices and DevOps technologiesand it would be problematic to find skilled developers (P1, P3, P5, P6, P9,P10, P12, P13, P16). Overall, participants were very aware of the humanfactors of evolvability and sometimes even saw them as more challenging as
152 5 | An Analysis of Industrial Maintainability Assurance for Service Orientation

technical ones. Knowledge exchange between teams was therefore a highpriority for some interviewees (P10, P13, P15).Concerning participants’ reflection of their assurance processes (see
also Fig. 5.13), most saw the effectiveness of their assurance activities (mean:+0.76, median: +1) as well as the overall impact on productivity (mean:+0.59, median: +1) as positive. Only three interviewees (P9, P11, P12)reported that activities would hinder development efficiency (-1) and wouldsometimes slow down feature development. Moreover, participants generallywanted to invest more effort in the assurance (mean: +0.76, median: +1)and try out new techniques or metrics. No one reported the wish to reduceefforts.However, the influence of microservices on the assurance process was
seen as controversial. While testing a single service would be easy, inte-gration testing would be more complex because of an additional layer (P2,P3, P13). Integration testing would be especially critical if microserviceswere developed in independence for a long time and integrated at a laterstage. Furthermore, root cause analysis of issues would be more complexin such a highly distributed system (P3, P11). A very commonly namedconcern was that keeping a system-centric quality view and assessing themacroarchitecture would be much more difficult (P4, P6, P7, P8, P10, P11,P15, P17), which P8 described as follows: “I’d say we are pretty good when itcomes to assuring the evolvability of single services. However, we have a lot ofcatching up to do for everything that crosses product or service boundaries.”Distributed code repositories and autonomous teams would make the accessto code as well as static analysis more complicated. It would also be hard tocompare metrics between services and relate them to system-wide averages(P8, P11, P17).
Nonetheless, participants also named positive factors. Small serviceswould not only be easy to replace, people would also be much more moti-vated to fix a small number of issues for a project (P15, P17), which P15described as follows: “In a monolith with 100.000 FindBugs warnings, you arecompletely demotivated to even fix a single one of those. In a microservice with100 warnings, you just get to work and remove them.” If adopted correctly,
5.3 | Interviews 153

microservices would also bring a cultural change for quality awareness andresponsibility (P10, P15, P17). P17 highlighted the importance of continuousproduct development in this regard: “If you work in a project mode, evolvabil-ity assurance usually annoys you because you have short-term goals and wantto finish the project. In a product mode, the team knows that they sabotagetheir system’s evolvability in the long run if they take too many short-cuts.”Lastly, P15 noted that, while they were relatively satisfied with their currentevolvability assurance activities, they did not really invest much efforts intoresearching and designing a fitting evolvability assurance strategy for thefuture. Finding out which approaches, tools, and metrics worked best fortheir microservices could be a vital advantage in the long-term.
5.4. Discussion
Our detailed analysis of the industry state of practice revealed several impor-tant findings. First, ∼67% of our survey participants reported not to treatservice-oriented software with special maintainability assurance. ∼26% ap-plied somewhat different techniques and only ∼7% mentioned significantlydifferent treatment. While the survey sample population was limited in sizeand further research in this area is necessary to confirm similar distributionin other parts of the population, this finding was replicated in our interviews.Additionally, there was very little reported usage of methods, tools, and met-rics that focused on architecture-level evolvability in both studies. However,most reported challenges and issues were related to software architecture,especially in the interview study. These challenges may indicate the impor-tance of Architectural Technical Debt (ATD) management for service- andmicroservice-based systems.Likewise, no tools or metrics specifically designed for service orientation
were used in both studies, even though most interview participants statedthe significance of their underlying design principles. Combined with thereported trust in the base level maintainability of service orientation, thiscould pose a threat for the quality of long-living service-based systems.
154 5 | An Analysis of Industrial Maintainability Assurance for Service Orientation

Aspects like service granularity, service cohesion, or service coupling canbecome problematic when not tended to and can significantly hinder soft-ware maintenance and evolution, which was confirmed by our interviewparticipants. In the survey data, we identified a correlation between treatingservice-oriented systems differently and the level of sophistication of appliedassurance actions. So there is hope that with a rise in the general proficiencyof maintainability assurance, understanding for a different treatment ofservice orientation will grow as well. However, several interview participantsalso pointed out that, while they acknowledged the usefulness of presentedservice-oriented metrics, they were not aware of reliable tool support forautomatic metric collection.Another takeaway is the suggested usefulness of an explicit and systematic
process for maintainability assurance. While only 10 survey participantsreported using such an approach, the vast majority of them believed thatthis increased software quality and even wanted to invest more into main-tainability. People that used tools were also more likely to invest more time.To strengthen this, there was an overall correlation between the level ofsophistication w.r.t. maintainability assurance and the reported satisfactionwith this quality attribute: participants that used explicit and systematic ap-proaches were more likely to be satisfied with the state of maintainability oftheir software. Moreover, we did not find a direct link between a hindrancein productivity and the level of sophistication of applied actions. While wewere able to replicate these findings in our microservices interview study toa certain degree, several interviewees also highlighted the importance to re-spect decentralization and the agile principle of “individuals and interactionsover processes and tools”. A rigorous and heavy-weight assurance processwas only applied by participants that developed large microservice-basedsystems for external customers in a project-like manner.
5.4 | Discussion 155

5.5. Threats to Validity
The validity of empirical studies like surveys or interviews can suffer fromseveral characteristic limitations. For our survey, we took several precau-tions to increase internal validity. First, participation was voluntary andanonymous to ensure that answers were as honest as possible. Furthermore,participants were presented with definitions of the key terms to create acommon understanding of the main concepts. Participants were also askedabout their experience with the systems of interest to ensure they had thenecessary level of knowledge. We did not include incomplete or obviousfake responses into the evaluation. Lastly, we conducted a pilot surveyto fine-tune questions and analyze if the research objectives can really besufficiently addressed with the results of the questionnaire. With all thatbeing said, we cannot fully exclude the possibility that some participantsunderstood something differently and therefore gave unfitting answers. Thislimitation can also be seen in combination with the mixture of technicaland non-technical roles. As already discussed above, non-technical roleswere for example more likely to label their applied assurance techniques asexplicit and systematic. Additionally, while we did not find any confoundingvariables that may blur interpretation, there still remains a small possibilitythat we missed an important confounder not even present in the answers ofour questionnaire.With respect to external validity, we face the same limitations as every
quantitative survey: can we generalize our results that we obtained froma limited sample to the complete target population? Due to the very largetarget population, the discovered distributions in our sample are only oflimited generalizability. Our sample population was also dominated by largeSoftware & IT Services companies with teams of 20 or less and the majorityof participants were most certainly from Germany. So we should be carefulto give too much attention to the numerical distribution of characteristics.The identified correlations, however, are interesting and valid take-aways,even for such a small sample.Similarly, we need to mention some possible limitations for our interview
156 5 | An Analysis of Industrial Maintainability Assurance for Service Orientation

study. Concerning internal validity, it could be possible that intervieweeswere not completely honest during their answers, which is a common problemin survey- or interview-based studies. Nonetheless, we think that this riskwas rather low in this study. Most participants were quite comfortable todescribe negative aspects of their systems and the discussed topics were onlyof low to medium sensitivity. Furthermore, confidentiality and anonymitywere provided. As a second threat, participants could have provided incorrectanswers because they misunderstood questions or concepts. To limit this risk,important concepts were defined before the corresponding topics. Moreover,we posed additional clarifying questions if participants used terms of unclearmeaning. Some interviewees also asked questions themselves if questions orterms were not entirely clear to them. In some cases, our analysis relied onthe subjective opinion of participants, e.g. how they rated the evolvability oftheir system. Since participants could interpret such ratings very differently,detailed comparisons between systems may be difficult. Moreover, we onlyrelied on one single opinion for most systems and people may have differentopinions of systems.To increase interpretation validity and reduce researcher bias, every tran-
script was proofread by both moderators. Additionally, we strongly encour-aged our participants to adjust wrong or unclear statements in the transcripts.Nevertheless, there still remains the small possibility that some of the morefigurative paragraphs were misinterpreted. Overall, the largest threat inqualitative studies is that summarizing and aggregating results dependsheavily on the subjective interpretation of researchers. We tried to limit thisbias by relying on a precise coding system and by critically discussing allresults between the moderators.Concerning external validity, no distributions can be generalized from
our 17 interviews, e.g. the industry usage of SonarQube for microservices.Because this was a qualitative study, the intentions and opinions of partici-pants as well as the relationships between concepts were at the center ofthis research. An additional threat for generalizability could be that ourparticipants were exclusively based in Germany, even though we includedEuropean and international companies. We also tried to achieve diversity
5.5 | Threats to Validity 157

with respect to company domains and sizes, but had nine participants fromsoftware and IT services companies (∼52%). Lastly, possible selection biascould only be reduced in the case of C2 where we applied a random samplingto pick three out of seven candidates.
5.6. Conclusion
Because there is little scientific research on the industry state of practice inthe area of maintainability assurance for service- and microservice-based sys-tems, we conducted a quantitative survey (N=60) and qualitative interviews(N=17). The survey targeted general maintainability assurance and differ-ences with SOA or microservices, while the interviews specifically focused onthe evolvability assurance of microservices. We identified that explicit andsystematic assurance processes are beneficial, but need to respect some levelof team autonomy for decentralized microservices. Tool and metric usagewas very focused on source code quality. No architectural tools and metricswere applied, even though most reported challenges and issues like servicecutting were related to software architecture. Likewise, no tools or metricsspecifically designed for service orientation were used, even though mostparticipants stated the significance of their underlying design principles.Future work that covers the areas of maintenance, evolution, and technical
debt in the context of microservices should take these findings and indus-try sentiments into account. In particular, academia can support industrywith methods, metrics, or tools that aid macroarchitectural assessment ofmicroservices or provide a more system-centric view. We perceived tool sup-port for service cutting activities and metrics to evaluate service granularity,coupling, or cohesion as concrete gaps that could save industry substantialrefactoring efforts. Finally, issues in the area of human evolvability factorswith microservices like the handling of hyped technologies as well as co-ordinating and exchanging knowledge between decentralized teams weredescribed as important by participants.
158 5 | An Analysis of Industrial Maintainability Assurance for Service Orientation

Part III.
Main Contributions
159

Chap
ter 6
Service-BasedMaintainability Metrics:
Identification andCollection Approaches
This contribution chapter presents our studies in the area of service-basedmaintainability metrics. We first conducted a literature review that revealed46 of these metrics, which we subsequently analyzed for their applicability tomicroservices. Based on the analysis of these metrics, we then designed twoautomatic collection approaches for a subset of metrics: a static approachbased on machine-readable RESTful API descriptions and a dynamic ap-proach based on distributed tracing. For both approaches, we implementedprototypical tool support. To make the metrics of our static approach moreactionable, we also conducted a benchmark-based threshold derivation studywith 1,737 publicly available RESTful API descriptions.
160

The chapter extends the following publications:
• J. Bogner, S. Wagner, and A. Zimmermann. “Automatically measuringthe maintainability of service- and microservice-based systems: a liter-ature review.” In: Proceedings of the 27th International Workshop onSoftware Measurement and 12th International Conference on SoftwareProcess and Product Measurement on - IWSM Mensura ’17. New York,New York, USA: ACM Press, 2017, pp. 107–115 [BWZ17]
• J. Bogner et al. “A Modular Approach to Calculate Service-Based Main-tainability Metrics from Runtime Data of Microservices.” In: 20thInternational Conference on Product-Focused Software Process Improve-ment (PROFES’19). Barcelona, Spain: Springer Berlin Heidelberg,2019, pp. 489–496 [BSWZ19]
161

6.1. Context and Goals
Quantitative maintainability evaluation with metrics is a frequently em-ployed practice in software quality assurance (see Section 2.5.3), especiallyin the area of source code and object-oriented metrics. In systems based onservice orientation, however, many of these metrics lose their importancedue to the increased level of abstraction. For microservices, other factorsmay come into play as well: their decentralized nature and their high de-gree of technological heterogeneity may pose difficulties for metric-basedstatic source code analysis. Moreover, the most critical quality aspects ofmicroservices are concerned with architecture (e.g. coupling and cohesion)and not so much with source code (see Chapter 5).While several service-based maintainability metrics have been proposed to
address this (see Section 3.3), it is still challenging to get an overview of thesemetrics and to judge their relevance for microservices. Second, approaches toautomatically collect these metrics are lacking and most of the few proposalsdid not publish their tool support as open source. This significantly hindersempirical evaluation as well as industry adoption of service-based metrics. Toaddress these issues, we conducted a literature review to identify proposedmetrics and to analyze their applicability for microservices (Section 6.2).Based on these metrics, we then designed two broadly applicable approachesfor automatic metric collection – a static approach (Section 6.3) and adynamic approach (Section 6.4) – and implemented prototypical tool supportfor them.
162 6 | Service-Based Maintainability Metrics: Identification and Collection Approaches

6.2. Literature Review: Proposed Metrics and Applicability toMicroservices
Since service-oriented computing adds another level of abstraction on topof modules, classes, and methods, a lot of procedural and object-orientedmetrics are only of limited relevance for service- and microservice-basedsystems. While it is still possible to use those metrics for a single service,reaching a holistic view of the complete system requires other metrics. Toaddress this issue, several researchers have proposed maintainability metricsthat are specifically designed for service orientation. However, it is difficult toget an overview of these metrics because they are scattered across multipledifferent publications. Moreover, their applicability to microservices has notbeen analyzed so far. Since microservice-based systems may consist of avery large number of services, automatic metric collection is essential. Wetherefore conducted a literature study that was guided by the followingresearch questions.RQ1: What metrics exist to automatically measure the maintainability of
service-based systems?RQ2: To what degree do these metrics also apply to microservice-based
systems and what are their limitations?
6.2.1. Research Design
To answer these questions, we conducted a non-systematic literature reviewthat relied on a simple process. The search string for this review is presentedin Fig. 6.1. Used digital libraries and search engines were ACM, IEEE, andGoogle Scholar (see Fig. 6.2). We then analyzed the identified publicationsfor proposed service-based metrics.
metrics ∧ maintainability ∧ (service-oriented ∨ service-based)
Figure 6.1.: Metric search string
6.2 | Literature Review: Proposed Metrics and Applicability to Microservices 163

• ACM Digital Library: https://dl.acm.org
• IEEE Xplore: https://ieeexplore.ieee.org
• Google Scholar: https://scholar.google.com
Figure 6.2.: Used search engines and digital libraries
To be included in the collection, metrics had to pass four criteria:
1. Explicitly designed for service orientation
2. Related to maintainability
3. Automatically measurable (no semantic notion)
4. Measurable during development (not runtime exclusive)
Metrics excluded based on these requirements were for example Ade-quately Named Service and Operation Ratio [SCKP08] because it is of purelysemantic nature or Network Cohesion in the System [RSD06] because it hassuch a strong runtime and environment focus. Table 6.1 lists the identifiedeight papers from which we extracted metrics that satisfied these require-ments. In the second step of this study, we then qualitatively analyzedwhether the identified metrics are also valuable for microservices. We didthis by relying on typical characteristics of microservices that may limit therelevance or applicability of a proposed metric.
6.2.2. Results
In total, we extracted 46 service-based metrics from eight publications. Themost common maintainability-related characteristics of these metrics weresize, complexity, coupling, and cohesion (see Section 2.4.2 for their definitionsand relationships to evolvability). One publication also mentions centraliza-tion. All metrics are associated with one of these properties. The completelist of all 46 discovered maintainability metrics for service orientation can befound in Table 6.2 and Table 6.3. Using the four most frequently occurring
164 6 | Service-Based Maintainability Metrics: Identification and Collection Approaches

design properties named above as a means of categorization, we describea small selection of metrics in greater detail. We chose the metrics thatappeared most often in the literature, promised to represent the design prop-erty as holistically as possible, were presented with the most solid evaluationapproach, or were applicable to a single service (not the complete system).For metric illustration purposes, we define a system Y that consists of nservices ⟨S1, S2, . . . , Sn⟩, i.e. |Y | = n. A service S has a service interface SIS
that consists of several operations ⟨O1, O2, . . . , Om⟩.
Table 6.1.: List of identified publications with service-oriented metricsSource Authors Metric Focus
[RSD06] Rud et al. Complexity, criticality, and performance[PRFT07] Perepletchikov et al. Coupling[PRF07] Perepletchikov et al. Cohesion[QX09] Qingqing et al. Called “complexity”, but actually focused
on coupling, cohesion, and criticality[HW08] Hofmeister et al. Coupling, aggregation, and centralization[HCA09] Hirzalla et al. Complexity, size, and composition[SCKP08] Shim et al. SOA design quality model based on
QMOOD; coupling, cohesion, complexity,size, service granularity, parameter gran-ularity, and consumability
[SP15] Senivongse et al. Adaptation and extension of [SCKP08]with a focus on maintainability; uses ques-tionnaires to gather metrics for propertieslike readability
6.2 | Literature Review: Proposed Metrics and Applicability to Microservices 165

Table 6.2.: Extracted service-oriented maintainability metrics (1/2)Name Abbrev. Scope Property Source
Number of Services Involved in theCompound Service
NSIC Service Complexity [RSD06]
Services Interdependence in the Sys-tem
SIY System Coupling [RSD06]
Absolute Importance of the Service AIS Service Coupling [RSD06]Absolute Dependence of the Service ADS Service Coupling [RSD06]Absolute Criticality of the Service ACS Service Coupling [RSD06]Weighted Intra-Service Coupling be-tween Elements
WISCE Element Coupling [PRFT07]
Weighted Extra-Service Incoming Cou-pling of an Element
WESICE Element Coupling [PRFT07]
Weighted Extra-Service Outgoing Cou-pling of an Element
WESOCE Element Coupling [PRFT07]
Extra-Service Incoming Coupling ofService Interface
ESICSI Service Coupling [PRFT07]
Element to Extra Service Interface Out-going Coupling
EESIOC Element Coupling [PRFT07]
Service Interface to Intra Element Cou-pling
SIIEC Service Coupling [PRFT07]
System Partitioning Factor SPARF System Coupling [PRFT07]System Purity Factor SPURF System Coupling [PRFT07]Response for Operation RFO Operation Complexity [PRFT07]Total Response for Service TRS Service Complexity [PRFT07]Service Interface Data Cohesion SIDC Service Cohesion [PRF07]Service Interface Usage Cohesion SIUC Service Cohesion [PRF07]Service Sequential Usage Cohesion SSUC Service Cohesion [PRF07]Strict Service Implementation Cohe-sion
SSIC Service Cohesion [PRF07]
Loose Service Implementation Cohe-sion
LSIC Service Cohesion [PRF07]
Total Interface Cohesion of a Service TICS Service Cohesion [PRF07]Service Granularity SG Service Complexity [QX09]Relative Coupling of Service RCS Service Coupling [QX09]Relative Importance of Service RIS Service Coupling [QX09]Service Coupling Factor SCF System Coupling [QX09]
166 6 | Service-Based Maintainability Metrics: Identification and Collection Approaches
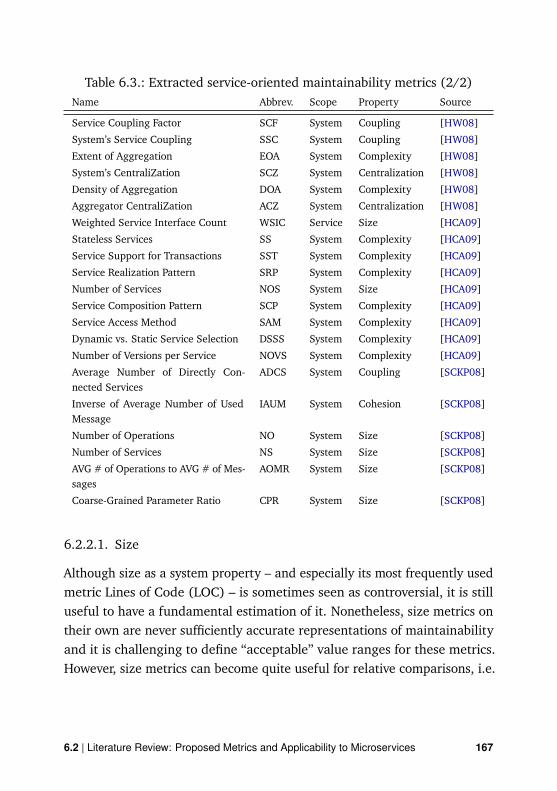
Table 6.3.: Extracted service-oriented maintainability metrics (2/2)Name Abbrev. Scope Property Source
Service Coupling Factor SCF System Coupling [HW08]System’s Service Coupling SSC System Coupling [HW08]Extent of Aggregation EOA System Complexity [HW08]System’s CentraliZation SCZ System Centralization [HW08]Density of Aggregation DOA System Complexity [HW08]Aggregator CentraliZation ACZ System Centralization [HW08]Weighted Service Interface Count WSIC Service Size [HCA09]Stateless Services SS System Complexity [HCA09]Service Support for Transactions SST System Complexity [HCA09]Service Realization Pattern SRP System Complexity [HCA09]Number of Services NOS System Size [HCA09]Service Composition Pattern SCP System Complexity [HCA09]Service Access Method SAM System Complexity [HCA09]Dynamic vs. Static Service Selection DSSS System Complexity [HCA09]Number of Versions per Service NOVS System Complexity [HCA09]Average Number of Directly Con-nected Services
ADCS System Coupling [SCKP08]
Inverse of Average Number of UsedMessage
IAUM System Cohesion [SCKP08]
Number of Operations NO System Size [SCKP08]Number of Services NS System Size [SCKP08]AVG # of Operations to AVG # of Mes-sages
AOMR System Size [SCKP08]
Coarse-Grained Parameter Ratio CPR System Size [SCKP08]
6.2.2.1. Size
Although size as a system property – and especially its most frequently usedmetric Lines of Code (LOC) – is sometimes seen as controversial, it is stilluseful to have a fundamental estimation of it. Nonetheless, size metrics ontheir own are never sufficiently accurate representations of maintainabilityand it is challenging to define “acceptable” value ranges for these metrics.However, size metrics can become quite useful for relative comparisons, i.e.
6.2 | Literature Review: Proposed Metrics and Applicability to Microservices 167

to identify the largest services of a system. Using mean value and standarddeviation, services that are potentially too large are easily identified. Thesystem-level size metrics of e.g. Shim et al. [SCKP08] appear to be of limitedvalue here. Unfortunately, we discovered just one single service-level sizemetric for such comparisons.
Weighted Service Interface Count (WSIC): WSIC(S) [HCA09] repre-sents the number of exposed interface operations of service S. Operationscan be weighted based on the number of parameters or their granularity(e.g. a complex nested object) with the default weight set to 1. Hirzallaet al. proposed no explicit method for assigning weights. With the defaultweight, WSIC is similar to the Number of Operations (NO) metric from Shimet al. [SCKP08], with the difference that NO is a system-wide metric anddifferentiates between synchronous and asynchronous operations. In anycase, WSIC is a much more service-specific metric than LOC. Lower valuesfor WSIC are generally more favorable for the maintainability of a service.As absolute values for this metric are not conclusive on their own, it will
be useful to calculate the system-wide average, i.e. WSICAV G .
WSICAV G(Y ) =
∑
S∈Y WSIC(S)|Y |
(6.1)
By comparing values with the average while also observing the ratio be-tween LOC and WSIC per service, the largest services can be identified andinvestigated for potential splitting. Specifying a binding threshold WSICMAX
may not be a sensible design rule though.
6.2.2.2. Complexity
Because several authors’ understanding of complexity as a system designproperty differed, it proved to be difficult for the categorization of metrics.Some authors did not differentiate between coupling and complexity, othersused size and complexity in unison. Both relations are understandable andmetrics for both have been found to be correlated in the past. For this
168 6 | Service-Based Maintainability Metrics: Identification and Collection Approaches

collection, we chose three complexity metrics that have different notionsthan the selected coupling and size metrics.
Total Response for Service (TRS): Perepletchikov et al. [PRFT07] adaptedthe object-oriented Response for Class (RFC) metric to the level of a service.They define Response for Operation (RFO) for an operation O of service inter-face SIS as the number of sequences of other operations and implementationelements (e.g. local methods) that can be executed in response to an in-coming request for operation O. This includes other services as well. Basedon that, TRS(S) is the sum of all RFO values for all operations of serviceinterface SIS .
TRS(S) =∑
O∈SIS
RFO(O) (6.2)
Again, it will be useful to look at the system-wide TRSAV G to identify outliers.Low values of TRS for a service indicate a low complexity and thereforepositively impact maintainability.
Number of Versions per Service (NVS): Based on Hirzalla et al. [HCA09],NVS(S, Y ) is introduced as the number of versions that are used concurrentlyin Y for service S. It is not uncommon to support several versions of thesame service for the sake of compatibility and to give clients enough timeto accommodate breaking changes in new versions. However, it can bebeneficial to set a threshold for both NVSAV G and NVSMAX . A large NVSAV G
value indicates high complexity and bears down on the maintainability.
Service Support for Transactions (SST): Hirzalla et al. [HCA09] alsodefine a complexity metric based on the transaction-awareness of services.SST(Y ) represents the percentage of services with support for transactionsand is based on the number of transaction-aware services (TAS).
SST(Y ) =TAS(Y )|Y |
(6.3)
6.2 | Literature Review: Proposed Metrics and Applicability to Microservices 169
Since distributed transactions with compensation actions require cumber-some and diligent planning, a high SST percentage indicates high complexity.
6.2.2.3. Coupling
Coupling is probably the most unambiguous of the four presented designproperties. It has no semantic notion and can be comfortably analyzed withgraph theory. Despite the seemingly straightforward nature of coupling, alarge number of different metrics are available in the literature that try todescribe its varying effects up to very fine levels of detail. We present fourof these metrics below.
Services Interdependence in the System (SIY): Rud et al. [RSD06]present SYI as the number of service pairs that are bi-directionally dependenton each other, i.e. pairs ⟨S1, S2⟩ where service S1 calls S2, while service S2
may also call S1 at some point. Such interdependent pairs should be avoided.The ideal value for SIY is therefore zero, SIY(Y ) = 0. If such pairs exist (e.g.S1 and S2), it can be a feasible solution to merge each pair into a singleservice (in the example S12).
Absolute Importance of the Service (AIS):Moreover, Rud et al. [RSD06]define AIS(S) as the number of consumers that depend on S, i.e. the numberof clients that invoke at least one operation of SIS . With a focus on networktraffic, Rud et al. exclude clients that reside on the same node, whichwe do not recommend because it is irrelevant for coupling in terms ofmaintainability. Perepletchikov et al. [PRFT07] come to a similar couplingmetric called Extra-Service Incoming Coupling of Service Interface (ESICSI),the difference being that they count every single calling implementationelement of a consumer instead of just the complete consumer. Defining athreshold for AISMAX is not reasonable. Calculating AISAV G is more usefulfor comparisons and identifying very important services in the system.
Absolute Dependence of the Service (ADS): Similarly to AIS, Rud etal. [RSD06] also introduce its sibling metric ADS(S) as the number of other
170 6 | Service-Based Maintainability Metrics: Identification and Collection Approaches

services that S depends on, i.e. the number of services from which S invokesat least one operation. Again, Perepletchikov et al. [PRFT07] propose acorresponding but more fine-grained metric, namely Element to Extra ServiceInterface Outgoing Coupling (EESIOC) that operates at the implementationelement level. Both AIS(S) and ADS(S) can be set in relation with the systemsize by dividing either by the number of services in the system as proposed byQingqing et al. [QX09] or by the maximum number of couplings that couldoccur for S as pointed out by Hofmeister et al. [HW08]. This is especiallyuseful when dealing with large systems with a high number of services.Again, ADSAV G is valuable to compare the different services in the system.
Absolute Criticality of the Service (ACS): Finally, Rud et al. [RSD06]combine AIS and ADS to form the Absolute Criticality of the Service:
ACS(S) = AIS(S)×ADS(S) (6.4)
They argue that the most critical and potentially problematic parts of asystem are those services that are called from many different clients andalso invoke a lot of other services. ACSAV G is a good value for comparisonsand to identify services that may suffer from too much coupling.
While all presented coupling metric values should be as low as possible, itis not always sensible or even possible to further reduce their values throughre-architecting. Services should be invoked by clients because that is theirsole purpose. However, the presented coupling metrics can aid in findingpain points in the architecture where potential unnecessary invocation maybe present.
6.2.2.4. Cohesion
Cohesion is probably the hardest property to measure automatically, since itis of semantic nature to a large degree. Moreover, it is not widely covered inthe literature, making Perepletchikov et al. the sole source for the selected
6.2 | Literature Review: Proposed Metrics and Applicability to Microservices 171

cohesion metrics. We focus on two cohesion metrics related to the serviceinterface and their aggregate.
Service Interface Data Cohesion (SIDC): The first metric SIDC(S) [PRF07]measures the cohesion of a given service S concerning the similarity of param-eter data types of the operations of its interface SIS . If all operations of SIS
use the same parameter data types, S is highly cohesive with SIDC(S) = 1.To calculate SIDC(S), the number of operations with common data types isdivided by the total number of discrete data types for SIS. SIDC(S) valuesclose to 1 are favorable for the maintainability of S.
Service Interface Usage Cohesion (SIUC): The second metric SIUC(S)[PRF07] is constructed based on the invocation behavior of clients usingoperations from SIS. S is considered highly cohesive if every consumerdepending on S uses every operation of SIS . SIUC(S) is therefore defined asthe ratio between the summed up numbers of used operations per client andthe number of clients multiplied by the number of operations in SIS. LikeSIDC, it produces values between 0 and 1, with values close to 1 indicatinga positive impact on maintenance activities.
Total Service Interface Cohesion (TSIC): Lastly, TSIC(S) [PRF07] triesto give a more holistic measurement for the cohesion of S by representingthe normalized sum for the two metrics introduced above.
TSIC(S) =SIDC(S) + SIUC(S)
2(6.5)
Like with nearly all other presented metrics, it is good practice to comparecalculated values with TSICAV G to identify services with low cohesion thatmight be reasonable candidates for splitting and refactoring activities.
6.2.2.5. Applicability to Microservice-Based Systems (RQ2)
Since most object-oriented metrics are not fully applicable to service-basedsystems, the question arises whether the metrics specifically designed for
172 6 | Service-Based Maintainability Metrics: Identification and Collection Approaches

services are also applicable to the specialization of microservices. While thedifferences between these two may not be as significant as the ones betweenobject and service orientation, it is still of value to have a closer look. Withreference to common characteristics of microservices (see Section 2.3.1), wedescribe three aspects and elaborate how they may influence the usage ofthe presented metrics.
Large number of small services: In general, most microservice-basedsystems have more and smaller services than most service-based systems.While details may vary between implementations (some service-orientedarchitectures can indeed consist of a large number of services), microservice-based systems may consist of several hundreds of services. This fact doesnot per se invalidate the presented size metric. However, the appropriatemicroservice size and granularity is still one of the most discussed properties(“How small is small enough?”). Naturally, this makes it harder to define “ac-ceptable” value ranges for LOC and WSIC of a single microservice. Focusingon the deviation from the AVG values for these metrics becomes even morecritical in such a setting. Because there is such a large number of services,this is not only relevant for size metrics. Similarly, using relative weightingfor some metrics becomes more significant, e.g. for the coupling metricsAIS and ADS. Lastly, the potentially substantial number of services make theautomatic gathering of metrics all the more important.
Technological heterogeneity: While there can already be remarkablediversity in a “classical” service-based systems, microservices take this to an-other level by encouraging the use of the best fitting programming languageor technology for the job. As an example, this can lead to seven differentprogramming languages in a system instead of just two or three. While itcertainly is of value to be able to choose from a wide variety of availabletechnologies, this also poses some risks. Unmanaged diversity can hinder pro-ductivity and current as well as future developers need to have the necessaryskill sets to handle this heterogeneity. Using a basic level of standardizationor encouraging the usage of a certain technology via convenient tool support
6.2 | Literature Review: Proposed Metrics and Applicability to Microservices 173

can ensure reasonable and manageable diversity. For service-based maintain-ability metrics, this means two things. First, this impacts the comparabilityof LOC metric values. Some languages are simply more verbose than othersfor achieving similar functionality (compare for example Java with Go). Ifthis metric is used in such an environment, a solution approach could beto introduce a weighting factor for each programming language that triesto achieve a normalization of LOC values. WSIC is certainly a more stablecandidate. And second, this degree of technological heterogeneity can makethe automatic gathering of source code metrics much more complicatedbecause more languages and tools have to be considered for parsing andanalysis.
Decentralization of control and lightweight communication: As op-posed to some SOA implementations, a microservice-based system mostlikely does not rely on an enterprise service bus (ESB) as a central point forcommunication or potentially even business logic. Instead, such systems tryto follow the concept of “smart endpoints, dumb pipes” and prefer choreog-raphy over orchestration. There is most certainly no BPEL or BPMN enginein such a system and microservices communicate via RESTful HTTP APIs orlightweight messaging. All of this can make the automatic gathering of cou-pling metrics more difficult. Dependencies between services can be implicit –especially in a system based on event-driven publish-subscribe mechanismsor dynamic service invocation – and therefore hard to retrieve by analyzingsource code. Artifacts like BPEL files are not available because the logic forthe different steps of a business process is distributed over the complete sys-tem. An approach to circumvent these problems could be the early creationof machine-readable documentation of service dependencies, which has tobe continually updated. Such a procedure is of course not so easy for anexisting system that did not follow this approach during early development.Alternatively, coupling could be analyzed at runtime by implementing depen-dency monitoring functionality within each service or at the message brokerlevel. Finally, there are a few metrics in the literature that try to measurethe level of centralization, e.g. by Hofmeister and Wirtz [HW08]. A high
174 6 | Service-Based Maintainability Metrics: Identification and Collection Approaches

level of centralization is described as positive for conducting modifications.However, the authors limit the validity of their statement with reference tothe increased coupling and complexity of such a system. Considering thedescribed characteristics of microservices in this section, these centralizationmetrics are probably the only ones not applicable to microservices, sincethese systems voluntarily give up centralization to achieve other benefits.
All in all, the majority of metrics that have been explicitly designed forservice-based systems are also applicable to microservices, sometimes with afew limitations as presented above. However, the specifics of these systemshave a significant impact on the complexity of automatic metric collection,which suggests the need for specialized tool support. A theoretical applica-bility is not sufficient in this case because nobody will manually calculatecoupling metrics for several hundred services.
6.2.3. Threats to Validity
A limitation to our approach is that we did not follow a more rigorousmethodology for this study (e.g. systematic literature review or systematicmapping study). Such procedures could have provided a sounder empiricalfoundation for the selection of publications. Likewise, the selection of thepresented metric candidates could have been based on a stricter processas well to minimize subjective bias. Moreover, we could have includedadditional digital libraries into the search process, which we neglected dueto time constraints. Lastly, the analysis of the metric applicability was basedon theoretical characteristics. Practical applicability may be different inselected real-world cases, especially since not all microservice-based systemswill share all of these characteristics.
6.2.4. Summary
To collect and analyze proposed service-based maintainability metrics, weconducted a literature review that led to the extraction of 46 metrics from
6.2 | Literature Review: Proposed Metrics and Applicability to Microservices 175

eight publications (RQ1). Each metric was associated with one of five identi-fied design properties related to maintainability: size, complexity, coupling,cohesion, or centralization. We then analyzed the applicability of thesemetrics for microservices (RQ2). With the exclusion of centralization metrics,the majority of the existing metrics are indeed also of value for microser-vices. We described some limitations while referring to three microservicecharacteristics with a slightly hindering influence (large number of smallservices, technological heterogeneity, and decentralization of control). Theprimary obstacle identified for the practical applicability of the presentedmetrics is the complicated automatic gathering in microservice-based sys-tems. Researchers and practitioners can use our results as a repository toidentify appropriate metrics for their projects.Potential follow-up research activities may include the (re-)validation of
the compiled metric suite via the development of prototypical tool support,followed by industrial case studies. Similarly, evaluating the practical mi-croservices applicability will be of great interest. Lastly, it will be interestingto investigate other metrics that could be of particular value for microser-vices. Possible candidates could be metrics related to the necessary rapidprovisioning of a microservice (e.g. AVG deployment duration for a service)or metrics focusing on the required sophistication for automatic testing (e.g.test coverage percentage).
176 6 | Service-Based Maintainability Metrics: Identification and Collection Approaches

6.3. RESTful Metrics: Static Analysis and Threshold Derivation
As pointed out in Section 6.2, the increased technological heterogeneity anddecentralization may pose difficulties for the static code analysis of service-and especially of microservice-based systems. Therefore, most proposals forstatic analysis in a service-oriented context have so far focused on program-ming language independent workarounds, e.g. using SoaML [GA11] andservice interface definitions like WSDL [BM09; Sne10] or OpenAPI [HLSV17;KT18].Since RESTful HTTP is one of the primary communication protocols for
microservices [New15] and is very popular in industry [BFWZ19b; SCL16],an analysis approach focused on machine-readable RESTful API descriptionsseems promising. The wide-spread usage of OpenAPI (see Section 2.2.3)with its associated tool ecosystem as well as alternative formats shouldguarantee the applicability of such an approach to a large percentage ofreal-world RESTful services and APIs.Using a format like OpenAPI to collect maintainability metrics has several
advantages. First, it avoids having to implement tool support for all program-ming languages that may occur within a microservice-based system. Second,if a machine-readable API documentation exists, it requires minimal effortsto prepare and conduct the analysis. If such documents do not exist for thesystem, they can often be generated automatically, which is supported forpopular RESTful frameworks like e.g. Spring Boot1 or Express2. And lastly,such documents often exist reasonably early in the development process if adesign-first approach is used. Such an approach would then allow the earlyevolvability evaluation of service interfaces.While formats like OpenAPI have been used in many analysis and reengi-
neering approaches for service- and microservice-based systems [BGD17;MW18; NLB18; PMP+18], there is so far no broadly applicable and conve-niently extensible approach to calculate structural service-based maintain-ability metrics from interface specifications of RESTful services. Moreover,
1https://spring.io/projects/spring-boot2https://expressjs.com
6.3 | RESTful Metrics: Static Analysis and Threshold Derivation 177

for the few existing approaches, tool support is rarely publicly available. Tofill this gap, we propose a new modular approach for the static analysis ofRESTful API descriptions called RAMA (RESTful API Metric Analyzer). Ourprototypical tool support for RAMA is able to parse the popular formatsOpenAPI1, RAML2, and WADL3 and calculates a variety of service interfacemetrics related to maintainability. The implementation is publicly availableon GitHub4. To make measurement results from RAMA more actionable, wealso conducted a benchmark-based threshold derivation study for all metricsimplemented in the RAMA CLI.
6.3.1. Static Analysis Approach
To design RAMA, we first analyzed existing service-based metrics to under-stand which of them could be derived solely from service interface definitionsand what data attributes would be necessary for this. This analysis reliedmostly on the results of our literature review presented in Section 6.2, butalso took some newer or previously undiscovered publications into account.Additionally, we analyzed existing approaches for WSDL and OpenAPI.
Haupt et al. [HLSV17] published the most promising approach. They usedan internal canonical data model to represent the REST API and convertedOpenAPI as well as RAML into this format via the epsilon transformationlanguage (ETL). While this internal model is beneficial for extensibility, thechosen transformation relies on a fairly complex model-driven approach.Moreover, the extensibility with respect to metrics remains unclear andsome of the implemented metrics simply count structural attributes like thenumber of resources or the number of POST requests. The model also doesnot seem to take data types into account, which are part of many proposedservice-based cohesion or complexity metrics. So, while the general approachfrom Haupt et al. is a sound foundation, we adjusted it in several areas andmade our new implementation publicly available.
1https://github.com/OAI/OpenAPI-Specification2https://raml.org3https://www.w3.org/submission/wadl4https://github.com/restful-ma/rama-cli
178 6 | Service-Based Maintainability Metrics: Identification and Collection Approaches

RAMA’s internal data model (see Fig. 6.3) was constructed based onentities necessary to calculate a wide variety of size, cohesion, and complexitymetrics. While we tried to avoid unnecessary complexity, we still neededto include all metric-relevant attributes and also to find common groundbetween the most popular RESTful description languages.���������� �����
���������������������������� ����������� ������������������� ���
�� !"#"!$%"&'(") *+,-
'
+$%./ %.&0'
+$1$2 % 1 3 45 6%7&08 3 6�&'6
' ' '
9&'% '%/ 0"$:8�
'
;$%$/&0 )
'
-+1&� 1%8
'
Figure 6.3.: Simplified canonical data model of RAMA
The hierarchical model starts with a SpecificationFile entity thatcontains necessary metadata like a title, a version, or the specification for-mat (e.g. OpenAPI or RAML). It also holds a single API wrapper entityconsisting of a base path like e.g. /api/v1 and a list of Paths. ThesePaths are the actual REST resources of the API and each one of themholds a list of Methods. A Method represents an HTTP verb like GET orPOST, i.e. in combination, a Path and a Method form a service opera-tion, e.g. GET /customers/1/orders to fetch all orders from customerwith ID 1. Additionally, a Method may have inputs, namely Parameters(e.g. path or query parameters) and RequestBodies, and outputs, namely
6.3 | RESTful Metrics: Static Analysis and Threshold Derivation 179

Responses. Since RequestBodies and Responses are usually complex ob-jects of ContentMediaTypes like JSON or XML, they are both representedby a potentially nested DataModel with Properties. Both Parameters
and Properties contain the used data types, as this is important for co-hesion and complexity metrics. This data model represents the core of theRAMA approach. Based on it, we designed the general architecture of RAMA(see Fig. 6.4) as a simple command line interface (CLI) application whichloosely follows the pipes and filters style (see Table 2.1).���������� �����
���������������������������� ����������� ������������������� ���
�� �!"#$
%&'()'(
%&'()'!*
+++
),'-.!"&/.0/&,-12
3451',)'(
3451',)'!*
3451',)'!6
+++
%&'()'!6
),'-.�)(0/,(!*
),'-.�)(0/,(!6
�378!�%$91':&,!*
�378!�%$91':&,!6
"&212-.&/�378!�%$ 1;)/
"&212-.&/ ),'-.!�)(0/,(
),'-.!* ),'-.!6 ),'-.!< +++
Figure 6.4.: General architecture of the RAMA approach (arrows indicatedata flow)
180 6 | Service-Based Maintainability Metrics: Identification and Collection Approaches

One module type in this architecture is Parser. A Parser takes a specificREST description language like OpenAPI or RAML as input and producesour canonical data model from it. Metrics represent the second moduletype and are calculated from the produced data model. The entirety ofcalculated Metrics form a summarized results model, which is subsequentlypresented as the final output by different Exporters. This architecture iseasily extensible and can also be embedded in other systems or a CI/CDpipeline.
6.3.2. Prototypical Tool Support
The prototypical implementation of this approach is the RAMA CLI1. It iswritten in Java and uses Maven for dependency management. For metricmodules, a plugin mechanism based on Java interfaces and the Java Re-flection API enables the dynamic inclusion of newly developed metrics. Wepresent an overview of the implemented modules in Fig. 6.5.For our internal data model, we used the protocol buffers format2 devel-
oped by Google. Since it is language- and platform-neutral and is easilyserializable, it can be used in diverse languages and technologies. There isalso a tooling ecosystem around it that allows conversion between protocolbuffers and various RESTful API description formats. From this createdprotobuf model, the necessary Java classes are automatically generated.With respect to input formats, we implemented Parsers for OpenAPI,
RAML, and WADL, since these are among the most popular ones basedon GitHub stars, Google search hits, and StackOverflow posts (see also[HLV18]). Moreover, most of them offer a convenient tool ecosystem thatwe can make use of in our Parser implementations. A promising fourthcandidate was the Markdown-based API Blueprint3, which seems to be risingin popularity. However, since there is so far no Java parser for this format,we did not include it in the first prototype.
1https://github.com/restful-ma/rama-cli2https://developers.google.com/protocol-buffers3https://apiblueprint.org
6.3 | RESTful Metrics: Static Analysis and Threshold Derivation 181

���������� �����
���������������������������� ����������� ������������������� ���
�� �!"#$
%&'()'(
*+),�%$!%&'()'
)-'./!"&0/10&-.2,
34+2'-)'(
*+),�%$
"&,2,./&0�356!�%$ 27)0
"&,2,./&0 )-'./!�)(10-(
8"29+0)4.-: )-'./(
;"2<)(.2, )-'./(
=5*>!34+2'-)'
%?@!34+2'-)'
=5*>
%?@
A5.B) )-'./
�� #!%&'()'�� #
C�?#!%&'()'C�?#
Figure 6.5.: Implemented architecture of the RAMA CLI (arrows indicatedata flow)
The RAMA CLI currently implements 10 service-based maintainabilityMetrics proposed in five different scientific publications (see Table 6.4),namely seven complexity metrics, two cohesion metrics, and one size metric.We chose these metrics to cover a diverse set of structural REST API attributes,which should demonstrate the potential scope of the approach. Furthermore,we slightly adjusted some metrics for REST, e.g. the ones proposed for WSDL.For additional details on each metric, please refer to our documentation inthe repository1 or the respective source. We also described some of thesemetrics in our literature review (see Section 6.2).
1https://github.com/restful-ma/rama-cli/tree/master/docs/metrics
182 6 | Service-Based Maintainability Metrics: Identification and Collection Approaches

Table 6.4.: Implemented maintainability metrics of the RAMA CLIName Abbrev. Scope Property Source
Average Path Length APL Service Complexity [HLSV17]Arguments per Operation APO Service Complexity [BM09]Biggest Root Coverage BRC Service Complexity [HLSV17]Data Weight DW Service Complexity [BM09]Distinct Message Ratio DMR Service Complexity [BM09]Longest Path LP Service Complexity [HLSV17]Number of Roots NOR Service Complexity [HLSV17]Lack of Message-Level Cohesion LoCmsg Service Cohesion [AZM+15]Service Interface Data Cohesion SIDC Service Cohesion [PRF07]Weighted Service Interface Count WSIC Service Size [HCA09]
Finally, we implemented two Exporters for the CLI, namely one for aPDF and one for a JSON file. Additionally, the CLI automatically outputs theresults to the terminal. While this prototype already offers a fair amount offeatures and should be broadly applicable, the goal was also to ensure that itcan be extended with little effort. In this sense, the module system and theusage of interfaces and the Reflection API make it easy to add new Parsers,Metrics, or Exporters so that the RAMA CLI can be of even more valueto practitioners and researchers.
6.3.3. Empirical Threshold Derivation Study
Metric values on their own are often difficult to interpret. Some metrics mayhave a lower or an upper bound (e.g. a percentage between 0 and 1) andmay also indicate that e.g. lower values are better or worse. However, that isoften still not enough to derive implications from a specific measurement. Tomake metric values more actionable, thresholds can therefore play a valuablerole [VFF19]. Thresholds have a long history in software measurementand were extensively used with object-oriented metrics [FBB+12; LM06].Hypothetical examples in our context could be that the metric Data Weight
6.3 | RESTful Metrics: Static Analysis and Threshold Derivation 183

should not be larger than 500 or the metric Service Interface Data Cohesionshould not be lower than 0.3. There could also be several thresholds thatform labeled value ranges. Such thresholds or rules can help users of metric-based evaluation to interpret the measurements and derive actions fromthem [DW16]. To ease the application of the metrics implemented withinRAMA, we therefore designed a simple, repeatable, and adjustable thresholdderivation approach.
6.3.3.1. Research Design
Having a single value which a metric should not exceed may be the simplestform of a threshold. It is, however, very difficult to rigorously evaluate sucha single threshold value. Therefore, the majority of proposed thresholdderivation methods analyze the measurement distribution of a large numberof real-world systems to instead form several ranked value ranges or labels.These methods are called benchmark-based approaches [BCSV12; DBCV16]or portfolio-based approaches [BSPK17; PBSK18]. Since a large number ofRESTful API descriptions are publicly available, we decided to implement asimple benchmark-based approach.Inspired by Bräuer et al. [BSPK17], we formed our labels based on the
quartile distribution. Therefore, we defined a total of four ranked bands intowhich a metric value could fall (see also Table 6.5), i.e. with the derivedthresholds, a measurement could be in the top 25%, between 25% and themedian, between the median and 75%, or in the worst 25%. Depending onwhether lower is better or worse for the metric, each band was associatedwith one of the colors green, yellow, orange, and red (ordered from best toworst). If a metric result is in the worst 25% (red) or between the medianand the worst 25% (orange) of analyzed systems, it may be advisable toimprove the related design property of the service. These colored labels arevery easy to interpret for practitioners and may make measurement resultsvery actionable. For unbounded metrics, there is also the possibility thata measurement that is compared with the benchmark is lower than theminimum (Q0) or larger than the maximum (Q5). However, this should be
184 6 | Service-Based Maintainability Metrics: Identification and Collection Approaches

straight forward to interpret because the value is then either worse than theworst API in the benchmark or better than the best one.
Table 6.5.: Used metric threshold bands (colors are based on a metric wherelower is better; for metrics where higher is better, the color or-dering would be reversed)
Band Color Start End
Q1 green lower bound or minimum 1st quartileQ2 yellow 1st quartile 2nd quartile / medianQ3 orange 2nd quartile / median 3rd quartileQ4 red 3rd quartile upper bound or maximum
To derive these thresholds per RAMA CLI metric, we designed an auto-mated benchmark pipeline that operates on a large number of API descriptionfiles. The benchmark consists of the four steps Search, Measure, Combine,and Aggregate (see also Fig. 6.6). The first step was to search for publiclyavailable descriptions of real-world APIs. For this, we used the keyword andfile type search on GitHub. Additionally, we searched the API repositoryfrom APIs.guru1, which provides a substantial number of OpenAPI files, aswell as the developer portal from MuleSoft2, the company behind the RAMLspecification. We downloaded all identified API files and if RAMA CLI couldparse them, we included them in the benchmark repository. Since we identi-fied a large number of OpenAPIv2 / Swagger files, we used a converter3 toautomatically transform them to OpenAPIv3, so that they could be included.Once a sufficiently large collection of parsable files had been established,
we collected the metrics from them via the RAMA CLI (Measure step). Thiswas instrumented by a Node.js script that executed the RAMA CLI for everyfile in the benchmark repository and created a JSON file with the metrics forit. In the third step Combine, this collection of JSON files was then analyzed
1https://apis.guru/browse-apis2https://anypoint.mulesoft.com/exchange/portals/anypoint-platform3https:
//github.com/Mermade/oas-kit/blob/master/packages/swagger2openapi
6.3 | RESTful Metrics: Static Analysis and Threshold Derivation 185

by a second Node.js script that combined them into a single CSV file, whereeach analyzed API represented a row. Using this file with all measurements, aPython script executed the threshold analysis and aggregation (Aggregatestep). Optionally, this script could filter out APIs, e.g. too small ones.���������� �����
���������������������������� ����������� ������������������� ���
�� !"#$%�&$'()#*"+,"-.)
/(.#012*3$4(+-)",-*5
6+(.%�&7"!()
4%8%$9:&
4%8:7"!()
;%':7"!()
<<=$>(2*#0
6+(.%�&7"!()
4%8:7"!()
;%':7"!()
<?=$8(2)�*(>#*"+,@A-B(CD)E
<F=$9-1 ".(
<G=$%HH*(H2,(
>#*"+,@A-B(CD)E
8(,*"#4()�!,)+(*$%�&
I>6A7"!()
9>J7"!(
>#*"+,@�5,0-.E
I>6A7"!(
6+,"-.2!=$7"!,(*
'"2H*21)$+(*$8(,*"#
/-K+!-,) L"),-H*21)
'2,2$7!-M
&.),*�1(.,)
Figure 6.6.: Threshold Benchmark Design
186 6 | Service-Based Maintainability Metrics: Identification and Collection Approaches

As results, this yielded a JSON file with all descriptive statistics necessaryfor the metric thresholds as well as two diagram types to potentially analyzethe metric distribution further, namely a histogram and a boxplot, both inPNG format. Furthermore, the Aggregate step produced its results oncefor the entirety of APIs, but also separately for all three API specificationformats.To make the benchmark as transparent and repeatable as possible, we
published all related artifacts such as scripts, the used API files, and doc-umentation in a GitHub repository1. Every subsequent step after Searchis fully automatable and we also provide a wrapper script to execute thecomplete benchmark with one command. Our goal is to provide a reusableand adaptable foundation for re-executing this benchmark with differentAPIs as input that may be more relevant threshold indicators for a specificREST API under analysis.
6.3.3.2. Results
We initially collected 2,651 real-world API description files (2,619 OpenAPI,18 WADL, and 14 RAML files). This sample was dominated by large cloudproviders like Microsoft Azure (1,548 files), Google (305 files), or AmazonWeb Services (205 files). Additionally, there were cases where we had severalfiles of different versions for the same API.A preliminary analysis of the collected APIs revealed that a large portion
of them were very small, with only two or three operations. Since it seemsreasonable to assume that several of the RAMA CLI metrics are correlatedwith size, we decided to exclude APIs with less than five operations (WeightedService Interface Count < 5) to avoid skewing the thresholds in favor of verysmall APIs. Therefore, we did not include 914 APIs in the Aggregate step.Our exemplary execution of the described benchmark calculated the quartile-based thresholds based on a total of 1,737 public APIs (1,708 OpenAPI, 16WADL, and 13 RAML files). Table 6.6 lists these thresholds for all 10 metricsof the RAMA CLI.
1https://github.com/restful-ma/thresholds
6.3 | RESTful Metrics: Static Analysis and Threshold Derivation 187

Table 6.6.: Calculated metric thresholds from our exemplary benchmark runwith 1,737 API description files
Metric Top 25% 25% - 50% 50% - 75% Worst 25%
APO [0.20, 3.52] ]3.52, 4.60] ]4.60, 8.63] ]8.63, 21.63]APL [1.00, 2.50] ]2.50, 5.00] ]5.00, 8.00] ]8.00, 15.60]BRC [1.00, 1.00] ]1.00, 0.99] ]0.99, 0.60] ]0.60, 0.00]DW [4, 77] ]77, 167] ]167, 378] ]378, 41570]DMR [0.00, 0.26] ]0.26, 0.36] ]0.36, 0.48] ]0.48, 1.00]LoCmsg [0.00, 0.53] ]0.53, 0.62] ]0.62, 0.69] ]0.69, 1.00]LP [1, 3] ]3, 8] ]8, 10] ]10, 19]NOR [1, 1] ]1, 2] ]2, 3] ]3, 359]SIDC [1.00, 1.00] ]1.00, 0.64] ]0.64, 0.55] ]0.55, 0.00]WSIC [5, 8] ]8, 15] ]15, 31] ]31, 1126]
To illustrate the diagrams created during the benchmark, we also presentthe boxplot (see Fig. 6.7) and the histogram (see Fig. 6.8) for the results ofthe metric Average Path Length (APL).
AveragePathLength
2
4
6
8
10
12
14
16
Figure 6.7.: Boxplot for the APL measurement results
188 6 | Service-Based Maintainability Metrics: Identification and Collection Approaches

2 4 6 8 10 12 14AveragePathLength
0
50
100
150
200
250
300
# of
API
s
Figure 6.8.: Histogram for the APL measurement results
The boxplot is a convenient graphical alternative to the quartile-basedthreshold values from Table 6.6, as it shows the minimum, Q1, median, Q3,and maximum. The histogram, on the other hand, allows a more detaileddistribution analysis. In this case, it e.g. reveals that a large number of APIsin our benchmark have an APL value of 2 or 3. Since the execution of thebenchmark can take up to several hours on machines with low computingpower, we also provide all result artifacts of this exemplary run in ourrepository1.Lastly, we present hypothetical measurement examples from a RESTful
service that we compare to the benchmark results to make them moreactionable. The service under analysis is the OrderService of a typicalwebshop system. It provides functionality for creating and managing ordersas well as for the processes of finalizing and refunding orders. In total, itoffers nine different operations, which puts its Weighted Service InterfaceCount (WSIC) value at the beginning of the Q2 band (yellow), i.e. it isa reasonably small API. The complexity metrics related to the resourcepath structure, i.e. Average Path Length (APL), Biggest Root Coverage (BRC),
1https://github.com/restful-ma/thresholds/tree/master/results
6.3 | RESTful Metrics: Static Analysis and Threshold Derivation 189

Longest Path (LP), and Number of Roots (NOR), are all in the Q1 band (green),which indicates that resources are generally well designed. However, themetrics based on the complexity of input parameters, namely Argumentsper Operation (APO) and Data Weight (DW), both fall into the middle ofthe Q3 band (orange). Restructuring and simplifying the input parametersand request bodies of the most complex operations may be a good idea toimprove the analyzability of the OrderService. Finally, we have the metricsDistinct Message Ratio (DMR), Lack of Message-Level Cohesion (LoCmsg), andService Interface Data Cohesion (SIDC), which evaluate the similarity of theused data concepts within all operations. Both DMR and LoCmsg fall intothe Q1 band (green), while the stricter SIDC metric achieves a Q2 ranking(yellow). Therefore, the cohesion of the OrderService is generally high:its operations work to a large degree with similar data concepts like Ordersand therefore contribute to a similar purpose.
6.3.4. Limitations and Threats to Validity
While we pointed out several advantages of the RAMA approach, there arealso some limitations. First, RAMA only supports RESTful HTTP as a com-munication protocol and therefore excludes asynchronous message-basedcommunication. Even though REST is arguably still the most popular com-munication style for microservice-based systems, event-driven microservicesbased on messaging receive more and more attention. Apart from that, theapproach requires a machine-readable RESTful API description to work.While such specification files are quite popular in the RESTful world, notevery RESTful web service under analysis will have one. And thirdly, relyingon an API description file restricts the scope of the maintainability evaluation.Collected metrics are focused on the interface quality of a single serviceand cannot make any statement about the concrete service implementation.Therefore, RAMA cannot calculate system-wide metrics except for aggre-gates like mean or median, which also excludes all metrics for the couplingbetween services.
190 6 | Service-Based Maintainability Metrics: Identification and Collection Approaches

Our prototypical implementation, the RAMA CLI, may also suffer frompotential limitations. While we tried to make it applicable to a wide rangeof RESTful services by supporting the three formats OpenAPI, RAML, andWADL, there are still other used formats for which we currently do not have aparser, e.g. API Blueprint1. Similarly, there are many more proposed service-based metrics we could have implemented in the RAMA CLI. The modulararchitecture of RAMA consciously supports possible future extensions inthis regard. Lastly, we unfortunately cannot guarantee that the prototype iscompletely free of bugs and works reliably with every single specificationfile. While we were very diligent during the implementation, have a testcoverage of ∼75%, and successfully used the RAMA CLI with over 2,500 APIspecification files, it remains a research prototype. There may still be thepossibility that metrics are miscalculated in some cases.
Finally, we need to mention threats to validity concerning our empiricalthreshold derivation study. Since the benchmark uses the RAMA CLI, thesame quality limitations apply: potential bugs in our implementation orused libraries like the Swagger-to-OpenAPI converter may lead to incorrectmeasurements and therefore incorrect thresholds. Due to the large numberof files, however, the risk of significant threshold deviations is relativelylow. A more substantial threat to validity is that the derived thresholds relyentirely on the quality and relevance of the used API description files. If themajority of files in the benchmark are of low quality, the derived thresholdswill not be strict enough. Measurement values of an API may then all fallinto the Q1 band, when, in reality, the service interface under analysis is stillnot well designed. By including a large number of APIs from trustworthysources, this risk may be reduced. However, there still may be services fromspecific contexts that are so different that they need a custom benchmark toproduce relevant thresholds. Examples could be benchmarks based only ona particular domain (e.g. cloud management), on a single API specificationformat (e.g. RAML), or on APIs of a specific size (e.g. small APIs with 10 orless operations).
1https://apiblueprint.org
6.3 | RESTful Metrics: Static Analysis and Threshold Derivation 191

As an example, large cloud providers like Azure, Google, or AWS heavilyinfluenced our benchmark run. Each one of these uses fairly homogeneousAPI design, which influenced some metric distributions and thresholds. Stan-dardized API parameters within companies led for example to Arguments perOperation (APO) values that formed clusters around 5.0 (Azure APIs), 9.0(AWS APIs), and 13.0 (Google APIs). Additionally, our benchmark includedseveral versions of the same APIs. Very similar versions could falsely pro-mote some value clusters. We also eliminated a large number of very smallservices with less than five operations to not skew metrics in this direction.Lastly, the vast majority of our analyzed files were using the OpenAPI format(∼98%). If there were significant quality differences between the threeformats, this would pose a problem for the derived thresholds. So, whileour provided thresholds may be useful for a quick initial quality comparison,it may be sensible to select the input APIs more strictly to create a moreappropriate size- or domain-specific benchmark. To enable such replication,our benchmark focuses on repeatability and adaptability.
6.3.5. Summary
To support static analysis based on proposed service-based maintainabil-ity metrics in the context of microservices, we designed a tool-supportedapproach called RAMA (RESTful API Metric Analyzer). Service interfacemetrics are collected based on machine-readable descriptions of RESTfulAPIs. We designed RAMA with a modular and extensible architecture. Ourimplemented prototypical tool, the RAMA CLI, currently supports the speci-fication formats OpenAPI, RAML, and WADL as well as 10 metrics (sevenfor complexity, two for cohesion, and one size metric). The results can beexported as JSON or PDF.To aid with results interpretation, we also conducted an empirical bench-
mark that calculated quartile-based threshold ranges (green, yellow, orange,red) for all RAMA CLI metrics using 1,737 public RESTful APIs. Since thethresholds are very dependent on the quality and relevance of the used APIs,we designed the automated benchmark to be repeatable.
192 6 | Service-Based Maintainability Metrics: Identification and Collection Approaches

6.4. An Approach to Calculate Service-Based Metrics fromRuntime Data
To overcome difficulties with static analysis for microservices, a promis-ing alternative to gather service-based maintainability metrics seems to bedynamic analysis. Metrics based on runtime data are also valuable comple-ments to an evaluation based solely on static structures, e.g. by additionallyproviding insights into dynamic coupling. Furthermore, microservice-basedsystems highly value observability to operate the complex net of distributedservices [NKFW19]. Ergo, microservices usually rely on monitoring or evendistributed tracing [ERR18]. Such produced runtime data could be reusedfor maintainability evaluations. We therefore propose an extensible approachto calculate service-based maintainability metrics from the runtime data ofmicroservice-based systems.The development of our approach took place in several stages. First, we
analyzed existing service-based metrics (see Section 6.2) to understandwhat data attributes were necessary to calculate a broad set of maintain-ability metrics. We also collected and evaluated existing approaches (seeSection 3.3) as well as general tools for distributed tracing in service-basedenvironments. Based on this initial analysis, we decided that our approachshould focus on the following three principles:
• Simplicity: has a simple and clean data model and architecture
• Extensibility: can be extended with additional data sources or metrics
• Broad applicability: can be used with diverse service-based systems
In the second step, we then designed a modular architecture (see Sec-tion 6.4.1.1) and an internal data model (see Section 6.4.1.2). Afterwards,we decided which data sources and which metrics we would implement forthe first iteration and developed the prototype of the tool (see Section 6.4.2).Lastly, we demonstrated the effectiveness of the tool-supported approach inan exploratory study with an example system that was used by six people(see Section 6.4.3).
6.4 | An Approach to Calculate Service-Based Metrics from Runtime Data 193

6.4.1. Dynamic Analysis Approach
In this section, we describe the abstract details of our general approach,namely the general architecture and data model. For source code and moreextensive documentation, please refer to our GitHub repository1.���������� �����
� ��������������������������������������������������� ��� ���
��� !"#$%&'& ())$
�"*+,-#*)-&
�"*+,-#*)- .
///
0+*-'1 �#$12$#*')"
345)-*+-&
345)-*+- .
345)-*+- 6
///
�"*+,-#*)- 6
0+*-'17+&2$*& .
0+*-'17+&2$*& 6
72"*'8+9#*# .
72"*'8+9#*# 6
�#")"'1#$72"*'8+ 9#*#
�#")"'1#$0+*-'1 7+&2$*&
0+*-'1 . 0+*-'1 6 0+*-'1 : ///
Figure 6.9.: General architecture of the approach (arrows indicate data flow)
1https://github.com/xJREB/microservices-runtime-analysis
194 6 | Service-Based Maintainability Metrics: Identification and Collection Approaches

6.4.1.1. Architecture
Similar to our static RAMA approach (see Section 6.3), our dynamic analysisapproach was designed as a simple command line interface (CLI) applicationand loosely follows a pipes and filters architecture. It consists of several typesof modules which sequentially process data (see Fig. 6.9). For data collec-tion, different types of Integrator modules can be used. An Integrator
queries an external data source with runtime data (e.g. a distributed tracingserver) and produces the internal canonical data model from it. In oneexecution, several different Integrators can be used to construct a morecomplete view of the system. This model is then used as the foundation formetric calculation: each implemented Metric module uses the data modelto derive its metric results. Lastly, each specified Exporter module pro-cesses this list of metric results. An Exporter transforms and forwards theresults to the final location, e.g. it may create an XML file. Likewise, severalExporters can be used in a single execution. For the sake of simplicity andto ease integration into a CI/CD pipeline, the analysis tool has no internalpersistence. Upon execution, it collects data, calculates the metrics, andfinally outputs the results.
6.4.1.2. Data Model
Every Integrator needs to produce our internal canonical representation ofthemicroservice-based system under analysis. This datamodel (see Fig. 6.10)includes the services of the system, but also runtime information like thenumber of times an operation was called during the analysis timeframe. Inprinciple, it represents a directed graph where the nodes are Services andthe edges are Dependencies, e.g. a Dependency could be an outgoing edgefrom node Service S1 to node Service S2. Each Service, in turn, has alist of its offered Operations. They consist of a list of input parameters,a list of how often other services called this operation (calls), and a listof other Operations that were subsequently invoked as a response to thisoperation (responsesForOperation). This simplistic model enables the
6.4 | An Approach to Calculate Service-Based Metrics from Runtime Data 195

calculation of a large number of maintainability metrics for e.g. coupling,cohesion, size, and complexity via efficient graph operations, on the system-as well as on service-level. It could also be easily extended with additionalattributes to facilitate the calculation of new metrics.���������� �����
� ��������������������������������������������������� ��� ���
��� !"�
�����#$����
%&��'(!)*
�����������#$����+,������#-��.$��/��0#1���2���������3��4��������#4�������+,
��
5'*)*!"'678*(!9�:;'('
;�&�*<�*"=
��
��
Figure 6.10.: Canonical data model for runtime data
6.4.2. Prototypical Tool Support
The first prototypical implementation of the approach is a Java CLI applica-tion (see Fig. 6.11). Apache Maven is used to manage dependencies and tocreate an executable JAR file that can be called with various input parame-ters, such as the endpoints of runtime data sources. We rely on the JGraphTlibrary1 to create the internal model of the system as a directed graph. Theplugin mechanism to dynamically include newly developed modules is real-ized with Java interfaces and the Java Reflection API. In the first iteration,we implemented one Integrator, 23 Metrics, and five Exporters (XML,JSON, CSV, Markdown, plain text).
1https://jgrapht.org
196 6 | Service-Based Maintainability Metrics: Identification and Collection Approaches

���������� �����
� ��������������������������������������������������� ��� ���
��� !"#$%&'& ())$
�"*+,-#*)-&
.'/0'"�"*+,-#*)-
1+*-'2 �#$23$#*')"
45/)-*+-&
61� 45/)-*+- 61�
7/+"(-#2'",8#*#
�#")"'2#$93"*':+ 8#*#
�#")"'2#$1+*-'2 9+&3$*&
;<�)3/$'",1+*-'2&
=�):/$+5'*%1+*-'2&
<�)>+&')"1+*-'2&
?@7A 45/)-*+-
�@B 45/)-*+-
1#-0C)D" 45/)-*+-
E$#'"*+5* 45/)-*+-
?@7A
�@B
1#-0C)D"
E$#'"*+5*
F@'G+1+*-'2&
Figure 6.11.: Implemented architecture of the first prototype (arrows indi-cate data flow)
Concerning runtime data sources, we analyzed a wide variety of ap-proaches, among them distributed tracing frameworks like Jaeger and mon-itoring solutions like Prometheus1. In the end, we decided to implementa Zipkin Integrator for the first prototype. Zipkin2 is a distributed trac-ing system based on the Google Dapper architecture. It implements the
1For more details on tool analysis and selection, please refer to https://github.com/xJREB/microservices-runtime-analysis/tree/master/docs/tools
2https://zipkin.io
6.4 | An Approach to Calculate Service-Based Metrics from Runtime Data 197

OpenTracing standard1 and is one of the most popular open source tracingimplementations (over 11k stars on GitHub at the time of writing). Zipkinrequires the inclusion of a small piece of application code, a Tracer, intoeach service that should be instrumented. These Tracers record applicationactivity and then asynchronously send tracing information to a central Zipkinserver. As opposed to non-invasive techniques like e.g. tcpdump, Zipkin istherefore able to gather very rich runtime data. Our implemented ZipkinIntegrator queries the RESTful API of a Zipkin server and retrieves thelist of services with their respective traces within a certain timeframe. Thisinformation is then converted to our canonical data model.With respect to Metrics, we collected a set of 58 service-based main-
tainability metrics proposed in the scientific literature. We summarizedthe majority of them in Section 6.2. These metrics were then analyzed fortheir relevance and applicability to our approach. In the end, we selected16 of these metrics for the first prototype. Since several aspects of service-based maintainability (especially dynamic coupling) were not covered, wedesigned and adapted seven additional metrics, which we briefly presenthere. Metric formalization is based on the following entities:
• The system is represented by the set of services S that contains indi-vidual services, e.g. s1, s2, ..., sn ∈ S.
• The function I D(s) returns the number of incoming dependencies forservice s, i.e. the number of other services that depend on s.
• The function OD(s) returns the number of outgoing dependencies ofservice s, i.e. the number of other services s depends on.
• The set D(S) contains all dependencies between services in S.
• The function c ycles(D) returns the set of cyclic dependencies in D.
• The function cal ls(s1, s2, t) returns the number of calls from service s1
to service s2 within timeframe t.
– All incoming calls to s1 within t are indicated by cal ls(∗, s1, t).
1https://opentracing.io
198 6 | Service-Based Maintainability Metrics: Identification and Collection Approaches

– All outgoing calls from s1 within t are indicated by cal ls(s1,∗, t).
– The total number of calls in S during t is indicated by cal ls(∗,∗, t).
Mean Absolute Importance/Dependence in the System (MAIDS): thismetric is a system-wide variant of AIS/ADS (see Section 6.2.2). It returnsthe mean number of service dependencies a service in S has. At the systemlevel, the mean number of incoming and outgoing dependencies is identical.The value range of MAIDS is [0, |S| − 1].
MAI DS(S) =
∑
s∈SI D(s)
|S|=
∑
s∈SOD(s)
|S|(6.6)
Mean Absolute Coupling in the System (MACS): this metric is a system-wide variant of ACS (see Section 6.2.2). It analyzes the degree of coupling inS by calculating the mean number of dependencies from both sides, incomingas well as outgoing. The value range of MACS is [0, 2 ∗ (|S| − 1)].
MACS(S) =
∑
s∈S
�
I D(s) +OD(s)�
|S|= 2 ∗MAI DS(S) (6.7)
Dynamic Relative Dependence of Service (DRDS): this is a dynamicvariant of the metric RCS (see Section 6.2.2). It describes how strongly s1 iscoupled to s2 based on the percentage of outgoing calls from s1 that went tos2 within timeframe t. The value range of DRDS is [0, 1].
DRDS(s1, s2, t) =cal ls(s1, s2, t)cal ls(s1,∗, t)
(6.8)
Dynamic Relative Importance of Service (DRIS): this metric is a dy-namic variant of RIS (see Section 6.2.2) and therefore the complement toDRDS. It describes how strongly s1 is coupled to s2 based on the percentageof incoming calls to s1 that originated from s2 within timeframe t. The value
6.4 | An Approach to Calculate Service-Based Metrics from Runtime Data 199
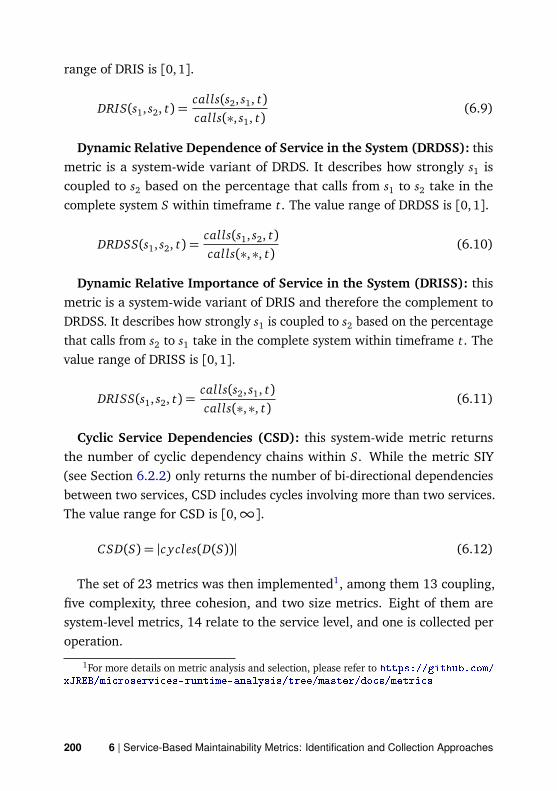
range of DRIS is [0,1].
DRIS(s1, s2, t) =cal ls(s2, s1, t)cal ls(∗, s1, t)
(6.9)
Dynamic Relative Dependence of Service in the System (DRDSS): thismetric is a system-wide variant of DRDS. It describes how strongly s1 iscoupled to s2 based on the percentage that calls from s1 to s2 take in thecomplete system S within timeframe t. The value range of DRDSS is [0, 1].
DRDSS(s1, s2, t) =cal ls(s1, s2, t)cal ls(∗,∗, t)
(6.10)
Dynamic Relative Importance of Service in the System (DRISS): thismetric is a system-wide variant of DRIS and therefore the complement toDRDSS. It describes how strongly s1 is coupled to s2 based on the percentagethat calls from s2 to s1 take in the complete system within timeframe t. Thevalue range of DRISS is [0,1].
DRISS(s1, s2, t) =cal ls(s2, s1, t)cal ls(∗,∗, t)
(6.11)
Cyclic Service Dependencies (CSD): this system-wide metric returnsthe number of cyclic dependency chains within S. While the metric SIY(see Section 6.2.2) only returns the number of bi-directional dependenciesbetween two services, CSD includes cycles involving more than two services.The value range for CSD is [0,∞].
CSD(S) = |c ycles(D(S))| (6.12)
The set of 23 metrics was then implemented1, among them 13 coupling,five complexity, three cohesion, and two size metrics. Eight of them aresystem-level metrics, 14 relate to the service level, and one is collected peroperation.
1For more details on metric analysis and selection, please refer to https://github.com/xJREB/microservices-runtime-analysis/tree/master/docs/metrics
200 6 | Service-Based Maintainability Metrics: Identification and Collection Approaches

Architecture, data model, and implementation fulfill all three principlespostulated for the approach. The approach is simple in the sense that itavoids the complexity of e.g. model-driven engineering and relies only onvery few data model concepts and module types, i.e. the bare minimum ofwhat is needed. It is extensible in the sense that the plugin architecture makesit very easy to develop additional Integrators, Metrics, or Exporters,which follows the open/closed principle (“open for extension, closed formodification”). Lastly, it is broadly applicable in the sense that it is not tiedto specific service technologies or implementation frameworks. In principle,any data source with sufficient information to construct the internal datamodel can be integrated without having to touch any of the downstreamimplementation units.
6.4.3. Demonstration
To illustrate the feasibility and effectiveness of our approach, we conductedan exploratory study with an open source example system. The goals of thisdemonstration were to explore if metrics are calculated correctly and to getan estimation if runtime data produced during normal usage of a systemis sufficient for accurate results. We chose the Twitter-like microbloggingsystem ramanujan1, since it is of decent size (18 services) while still beingsimple enough for a small study and has a web frontend for convenient end-user access. Furthermore, each service already implements a Zipkin tracer sothat no modifications were required. We hosted this system together with aZipkin server in a closed environment and then instructed six test participants(master students) to use it. We divided our testers into two groups withthree participants each (G1 and G2). The groups used the system separatelyand had to work on two tasks (T1 and T2). For T1, they had five minutes tofind and use the complete functionality offered via the web interface. ForT2, they should use the system’s messaging for an additional five minutes todiscuss a topic of their choosing. Afterwards, our tool calculated the metricsfrom the produced Zipkin data and we analyzed the results and differences
1https://github.com/senecajs/ramanujan
6.4 | An Approach to Calculate Service-Based Metrics from Runtime Data 201

per groups and tasks1.In total, 14 of the 18 services were identified from the combined data of
both groups. The remaining four services provided functionality that couldnot be invoked via the web interface, e.g. the manual import of messages intothe system. Based on these 14 services, we were able to correctly calculateall metric values for static coupling, size, and cohesion (dynamic couplingmetrics do not have a “correct” value). When looking at G1 and G2 separately,the results are the same per group. However, an analysis of the individualtasks of G2 revealed that not all service dependencies were identified in T1
as well as T2 because a clustered service relied on load balancing to twoinstances based on chosen usernames. This issue led tominor inaccuracies forthe static coupling metrics. Since the testers of G2 chose different usernamesper task, the combined data sets of T1 and T2 therefore yielded accurateresults. All in all, this small case study was successful in demonstratingour approach with just six participants that used the system for a combinedduration of 20 minutes.
6.4.4. Threats to Validity
However, the demonstration also highlighted weaknesses of dynamic analy-sis: evaluation quality depends on the richness and completeness of runtimedata. Services or operations that are not used during the recording arenot registered and therefore the resulting metrics may be inaccurate. Thisshortcoming may be especially relevant for very large systems with diverseservices and functionality. Similarly, a less invasive Integrator that doesnot require service modification would most likely result in even larger inac-curacies or even no values for certain metrics. In addition to the invasivenessvs. data quality trade-off, we must also consider potential performanceimpacts. Our small demonstration was no suitable evaluation for this. Eventhough modern distributed tracing like Zipkin is specifically designed forminimal performance overhead, there is still additional load in the system.
1We also published the results in our repository: https://github.com/xJREB/microservices-runtime-analysis/tree/master/docs/demonstration-results
202 6 | Service-Based Maintainability Metrics: Identification and Collection Approaches

Therefore, the usage of such an approach with a critical production systemneeds to be carefully evaluated.
6.4.5. Summary
We designed a simple, extensible, and broadly applicable approach to cal-culate service-based maintainability metrics from runtime data and imple-mented a Java prototype with a Zipkin integrator, 23 maintainability metrics,as well as export to XML, JSON, CSV, Markdown, and plain text. We demon-strated the feasibility of our approach via a small exploratory study with anexample microblogging system: metrics for all used services were calculatedcorrectly based on the produced runtime data. Future work could expandthe prototypical implementation with additional Integrators or Metrics.Furthermore, an industrial evaluation with a larger system would yield im-portant insights into metric accuracy as well as performance impact at sucha scale. Lastly, the dynamic approach could also be combined with staticinformation like machine-readable system descriptions to mitigate some ofits shortcomings.
6.4 | An Approach to Calculate Service-Based Metrics from Runtime Data 203

6.5. Conclusion
To support empirical evaluation studies as well as industry adoption of service-based maintainability metrics, we provided a three-fold contribution. First,we identified eight publications about service-based maintainability metricsvia a literature survey and extracted 46 metrics from them. We categorizedthese metrics and analyzed their applicability for microservices. Except forcentralization metrics, all metrics were of relevance for microservices, butdecentralization and technological heterogeneity may make the automaticcollection more difficult.With our second contribution, we therefore provided a static approach
to automatically collect service-based metrics from machine-readable de-scriptions of RESTful services. Our prototypical implementation of thisapproach supports the input formats OpenAPI, RAML, and WADL and is ableto calculate 10 different service interface metrics from them. The resultsare exported as JSON or PDF. To provide guidance for acceptable metricvalues, we conducted a repeatable threshold derivation study with morethan 1,700 publicly available API descriptions. Based on the quartile distri-bution, four threshold labels (green, yellow, orange, and red) are formedfor each implemented metric and can be used for comparison with futuremeasurements.Complementary to this static approach, we thirdly designed a dynamic ap-
proach to calculate metrics from microservices runtime data. The developedprototypical tool support for this approach uses an OpenTracing integra-tor via Zipkin, calculates 23 metrics, and outputs either XML, JSON, CSV,Markdown, or plain text. We demonstrated the feasibility of the approachby analyzing the runtime data of an example system.Both presented approaches can be efficiently extended with additional
input formats, metrics, or output formats. We published the source code forboth implementations on GitHub. In their current state, the approaches canact as a basis for empirical metric evaluation studies and industry adoptioncase studies.
204 6 | Service-Based Maintainability Metrics: Identification and Collection Approaches

Chap
ter 7
Scenario-BasedEvolvability Analysis for
Service Orientation
This chapter describes our contribution in the area of scenario-based evolv-ability evaluation for service orientation. We present our lightweight methodand the prototypical tool support to ease manual efforts. Lastly, we describethe evaluation of the method with a quantitative survey (N=40) and quali-tative interviews (N=7). The chapter extends the following publication:
• J. Bogner, S. Wagner, and A. Zimmermann. “Scenario-based Evolv-ability Analysis of Service-oriented Systems: A Lightweight and Tool-supportedMethod.” In: Proceedings of the 15th International Conferenceon Evaluation of Novel Approaches to Software Engineering (ENASE’20).Prague, Czech Republic: SciTePress, 2020 [BWZ20]
205

7.1. Context and Goals
While quantitative software quality assessment with metrics has the advan-tage that it can often be automated with tools, it is still a challenging taskto find practical and effective metrics (see Section 2.5.3.3). Especially inthe area of maintainability, metrics are a structural proxy for how effectiveand efficient software can be modified. While this relies on the nature of theselected modification, common maintainability metrics cannot take this intoaccount. An alternative or complement is therefore qualitative scenario-basedanalysis, which we introduced in Section 2.5.4. While such methods arewell suited to evaluate the impact of specific changes, they usually requiresignificant manual effort and the presence of several system stakeholders.Since the two service-based architectural styles SOA and microservices
place a strong emphasis on architecture quality and sustainable evolution,they are fitting candidates for such evaluationmethods. We therefore proposea lightweight scenario-based method specifically designed for the evolvabilityanalysis of service-based systems. Properties like service independence andencapsulation, as well as tool support, are leveraged to decrease associatedmanual efforts. We also describe the evaluation of the method with a surveyand hands-on interviews.
7.2. Lightweight Method for Service Orientation
The goal of our method is to provide qualitative scenario-based evolvabilityevaluation for service- and microservice-based systems with reasonable man-ual effort. By focusing on limited system types and one quality attribute, wecan rely on a more precise terminology and change categorization. Further-more, we can assume a decent degree of service independence as well as aclean separation of service interface and implementation. Changes that donot modify a service interface usually do not propagate to service consumers.Lastly, we also tried to keep the method lightweight by focusing on simplicityand tool support. The method is influenced by ALMA [BLBV04], but alsoby service-based change impact analysis such as in [WYZ10] and change
206 7 | Scenario-Based Evolvability Analysis for Service Orientation
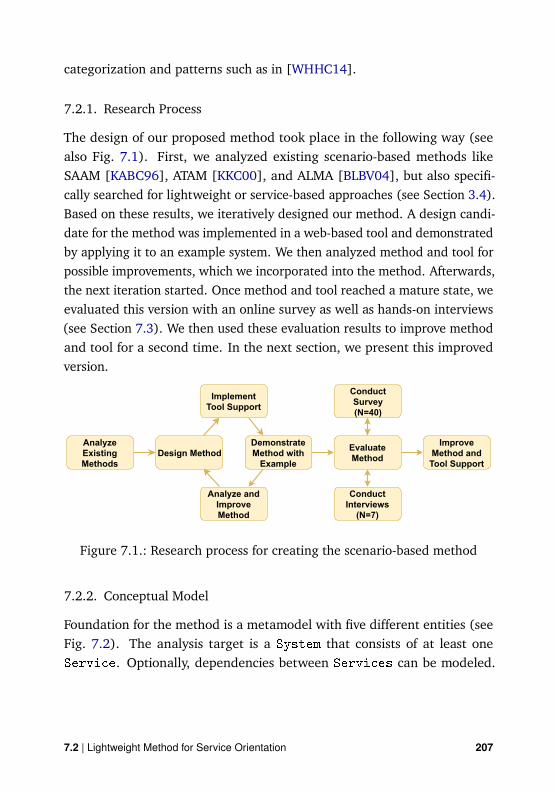
categorization and patterns such as in [WHHC14].
7.2.1. Research Process
The design of our proposed method took place in the following way (seealso Fig. 7.1). First, we analyzed existing scenario-based methods likeSAAM [KABC96], ATAM [KKC00], and ALMA [BLBV04], but also specifi-cally searched for lightweight or service-based approaches (see Section 3.4).Based on these results, we iteratively designed our method. A design candi-date for the method was implemented in a web-based tool and demonstratedby applying it to an example system. We then analyzed method and tool forpossible improvements, which we incorporated into the method. Afterwards,the next iteration started. Once method and tool reached a mature state, weevaluated this version with an online survey as well as hands-on interviews(see Section 7.3). We then used these evaluation results to improve methodand tool for a second time. In the next section, we present this improvedversion.���������� �����
���������������������������� ����������� ������������������� ���
�� !"#$%&'()'�*+$),-.(
/$('*�0+$),-.
123!$2$�)4--!05633-7)
/$2-�()7 )$+$),-.08'),%& 23!$
%9 !6 )$+$),-.
:-�.6;)1�)$79'$8(<=>?@
:-�.6;)5679$"<=>AB@
1237-9$+$),-.0 �.4--!05633-7)
�� !"#$0 �.1237-9$+$),-.
Figure 7.1.: Research process for creating the scenario-based method
7.2.2. Conceptual Model
Foundation for the method is a metamodel with five different entities (seeFig. 7.2). The analysis target is a System that consists of at least oneService. Optionally, dependencies between Services can be modeled.
7.2 | Lightweight Method for Service Orientation 207

The potential evolution of the System (e.g. a service-based webshop) isdescribed by coarse-grained Scenarios (e.g. the addition of a new pay-ment method). A Scenario consists of at least one Change. A Change
always targets a single Service and may be of different Types, namelyaddition (adding a new Service), modification (changing an existingService), or deletion (removing an existing Service). Additionally, aChangemay also ripple to other Services, especially if it modifies a serviceinterface. Previously specified service dependencies are used to suggestpotential ripple effects. Changes also have associated Effort as a measurefor their implementation duration or complexity. Currently, we support theestimation techniques hours, ordinal scale (1 to 10, with 10 being the mosttime consuming / complex), COSMIC function points, and story points.���������� �����
���������������������������� ����������� ������������������� ���
��� ������� ����!���
��� ������"�� �������
����������
��
����������
����������! ������
�����������!����������
��
�����������
�
��������� ��
#���
$�� �������
#���
$�� �������
#���
$�� �������
%!��
$�� �������
&�����
%�����&�����'"��&�������( ������
)������( ������
*���� ��(��"� �
+++
,-./01
,023450
637897/4:;
,50;724:
<=7;>0
Figure 7.2.: Simplified conceptual model of themethod (rectangles represententities, ellipses represent attributes, arrows without cardinalityrepresent 1-to-1 relations)
Based on the created Scenarios, an evolvability Evaluation for theSystem is synthesized. Effort is aggregated to the Scenario level andthen used to compile various system evaluation metrics. In general, infor-
208 7 | Scenario-Based Evolvability Analysis for Service Orientation

mation and metrics provided through an Evaluation should support theestimation of the system’s evolution qualities and the identification of weakspots in the architecture. An Evaluation is based on the list of Scenariosand relies on the following metrics:
• Metrics per Scenario:
– Number of Changes: the number of Changes this Scenario con-sists of
– Scenario Effort: the total estimated Effort for this Scenario,i.e. the summed up Effort of all its Changes
– Number of Affected Services: the number of Services that areimpacted by this Scenario
– Most Impactful Change: the Change that ripples to the largestnumber of Services
• Metrics per System:
– Total Effort per System: the total estimated Effort for this System,i.e. its summed up Scenario Efforts
– Average Effort per Scenario: the average Scenario Effort for thisSystem
– Hardest Scenario: the Scenario associated with the highestEffort
– Most Impactful Scenario: the Scenario that affects the largestnumber of Services
– Critical Service Based on Changes: the Service that is impactedby the largest number of Changes
– Critical Service Based on Effort: the Service that is associatedwith the highest combined Change Efforts
– Service with Lowest Effort: the Service that is associated withthe lowest combined Change Efforts
7.2 | Lightweight Method for Service Orientation 209
7.2.3. Method
The model presented above is the foundation for the four different processsteps of the method. We designed them to also produce reasonable resultswith only very few users, but the quality of the results will increase if variousstakeholders with both technical and business roles are involved. Workwithin different steps can also be distributed and performed independentlywith a later synchronization meeting.
1. Describe the system architecture: a list of Services with a shortdescription and (optionally) dependencies between them is created.This step has to be performed by technical stakeholders like developersor architects. If the System is very large, a subset can be modeledinstead, e.g. a domain or subsystem.
2. Elicit evolution scenarios: possible future evolution Scenarios arecollected and documented. Fitting candidates are cases likely to hap-pen or cases intuitively posing a high risk for the System. For a broadrange of Scenarios, business and domain experts should be includedin this step.
3. Specify and estimate changes for each scenario: the details and im-pact of the identified Scenarios are now worked out by documentingthe concrete Changes. This step again requires technical stakeholders.
a) Specify and estimate initial changes: the initial set of Changes(one per affected Service) is defined and the Effort for eachChange is estimated. Stakeholders should agree on a single esti-mation technique, e.g. hours. If work in this step is distributed,stakeholders should first calibrate their estimation with someexample Changes.
b) Identify ripple effects: for each Change, potential ripple ef-fects to other Services are identified and documented as newChanges. Service interface Changes are especially important forthis step.
210 7 | Scenario-Based Evolvability Analysis for Service Orientation

4. Evaluate results: created Scenarios are analyzed, estimated Effortis aggregated, and Evaluation metrics are calculated. Based on this,System evolvability is interpreted, weak spots are identified, and archi-tecture improvements are derived. This step should be a synchronizedgroup activity.���������� �����
���������������������������� ����������� ������������������� ���
�� !"#$%&#'�(("#)*+,-./0122%3
45*6)!67+89!:;"#*6#/<=6>3
?!@A@�"!7#!67#9"!5=6)!5B�'!#C=)D#B*5�"#B*5�((#")!E"#*B#)D!#�!)D*7:
FG-2#$%&+/*7!:;"#�67#G>E5!"":;"3
FG-2B9(#,-./0122%$%&#C=)D#HFIJ#5!"*95'!"B*5#�((#!6)=)=!"#*B#)D!'*6'!E)9�(#�*7!(:
J�)�@�"!+K*6<*JL3
%!5"=")!6)#")*5�<!#*B#�((!6)=)=!"M#!:<:#NOPQRSPMNTRUVWXYPM#!)':
5!�7"#B5*�#�67#C5=)!"#)*+,-./0K*6<*JL3
I"!5+2!'D6='�(#*5
@9"=6!""#")� !D*(7!53
%!5B*5�"#"'!6�5=*A@�"!7�*7=B=�@=(=)Z#�6�(Z"="#C=)D
)D!#D!(E#*B#)D!#)**(:
'5!�)!"#NOPQRSP#�67NTRUVWXYPM#
implemented in Node.js using the Express framework. Data is persisted inMongoDB. User access is possible via a web interface implemented withVue.js. Components can be easily deployed using Docker containers. Wepresent the architecture of this tool in Fig. 7.3. We published the tool onGitHub1.
7.2.5. Example Demonstration
To demonstrate the application of the described method, we present someconcrete scenarios as well as the aggregated Evaluation metrics. We usethe microservice architecture of the peer-to-peer ridesharing platform Uberas a running example2. A simplified architecture diagram of this platform ispresented in Fig. 7.4.
���������� �����
���������������������������� ����������� ������������������� ���
��
!"##�$%�&'"$"%�(�$)
*&+,�&'"$"%�(�$)
-&+.'"$"%�(�$)
/+00+$%
!" (�$)#
12)+3+4")+2$
!"##�$%�&5�6789
*&+,�&5�6789
'26+0�:..
:!9;")�<"
897=2(.2$�$) 9$3&"#)&>4)>&� ?�&,+4�
@A?-3>0B--!
Figure 7.4.: Simplified architecture of the Uber platform
1https://github.com/xJREB/ms-scenario-evaluation2See https://dzone.com/articles/
microservice-architecture-learn-build-and-deploy-a
212 7 | Scenario-Based Evolvability Analysis for Service Orientation

For this System, we can then elicit Scenarios. We present three simpli-fied Scenario examples, two business-driven ones with ripple effects (seeFig. 7.5 and 7.6) and a technical one with local scope (see Fig. 7.7).
Name: Add Bitcoin as new payment methodDescription: To give users more flexibility, add Bitcoin as a new paymentmethod in the system. Drivers can configure whether they accept this option.Changes:
• Add Bitcoin payment option to Payments
– Change type: modification
– Change effort: 80 hours
– Ripples to: Passenger Management, Driver Management,Mobile App, Passenger Web UI, Driver Web UI
• Add Bitcoin payment functionality to Passenger Management
– Change type: modification
– Change effort: 20 hours
• Add Bitcoin payment functionality to Driver Management
– Change type: modification
– Change effort: 30 hours
• Add Bitcoin payment UI elements to Mobile App
– Change type: modification
– Change effort: 30 hours
• Add Bitcoin payment UI elements to Passenger Web UI
– Change type: modification
– Change effort: 20 hours
• Add Bitcoin payment UI elements to Driver Web UI
– Change type: modification
– Change effort: 30 hours
Figure 7.5.: Scenario 1: add Bitcoin as new payment method
7.2 | Lightweight Method for Service Orientation 213

Name: Add the Rider Music featureDescription: To allow passengers to play their favorite music, add function-ality to integrate music streaming services and to select playlists for a ride.Drivers can configure whether they support this feature.Changes:
• Create a new Music Management service with the basic functionalityfor the Rider Music feature. This service also includes a database topersist associated data.
– Change type: addition
– Change effort: 150 hours
– Ripples to: Trip Management, Mobile App, Passenger Web
UI, Driver Web UI
• Add functionality for configuring a ride playlist to Trip Management
– Change type: modification
– Change effort: 40 hours
• Add Rider Music UI elements to Mobile App
– Change type: modification
– Change effort: 30 hours
• Add Rider Music UI elements to Passenger Web UI
– Change type: modification
– Change effort: 20 hours
• Add Rider Music UI elements to Driver Web UI
– Change type: modification
– Change effort: 10 hours
Figure 7.6.: Scenario 2: add the “Rider Music” feature
214 7 | Scenario-Based Evolvability Analysis for Service Orientation

Name: Replace database of Trip Management
Description: To improve the performance of trip matching and searches, thecurrent relational database of the Trip Management should be replacedwith Elasticsearch.Changes:
• Replace the database of Trip Management with Elasticsearch
– Change type: modification
– Change effort: 80 hours
– Ripples to: /
Figure 7.7.: Scenario 3: replace the Trip Management database
If we now perform an exemplary Evaluation with these Scenarios viathe tool, the described set of metrics will be calculated automatically. A listof Scenarios will be shown in the tool’s Evaluation view with all metricson the Scenario level (illustrated in Table 7.1).
ID # of Changes Effort AffectedServices
Most Impactful Change
1 6 210 hours 6 / 9 Add Bitcoin payment option toPayments
2 5 250 hours 4 / 9 Create new Music Management
service3 1 80 hours 1 / 9 Replace the Trip Management
database with Elasticsearch
Table 7.1.: Scenario evaluation: list of scenarios with metrics
Additionally, the System-level metrics will be calculated. The Total Effortper System is 540 hours, while the Average Effort per Scenario is 180 hours.The Rider Music introducing Scenario 2 is the Hardest Scenario with mostEffort. Most Impactful Scenario on the other hand is the Bitcoin payment
7.2 | Lightweight Method for Service Orientation 215

Scenario 1, since it affects the most Services. Since Trip Management
and the three UI components are impacted by two Changes as opposed tothe other Services, they comprise the Critical Services Based on Changes.With 120 hours, Trip Management is also the Critical Service Based onEffort (even though Music Management is associated with 150 hours, itis currently not part of the System, as it is a hypothetical new Service).Lastly, the Service with Lowest Effort is Passenger Management with 20hours.
7.3. Evaluation: Survey and Interviews
As a first indication for the usefulness and usability of our tool-supportedmethod, we conducted a two-fold evaluation study, namely a web-basedsurvey and personal hands-on interviews1. The survey primarily had the goalto get expert opinions on different Effort estimation techniques and ourproposed Evaluation metrics. It consisted of 17 questions and was hostedon Google Forms for four weeks during April and May 2019. We distributedthe survey via social media, mailing lists, personal contacts, and platformslike Surveycircle or Xing. In the end, we received 40 valid responses that wesubsequently analyzed with descriptive statistics and exploratory correlationanalysis.Of our 40 participants, 14 were active in industry, 13 in academia, and 13
in both fields. Participants had a median of 8 years of professional experience(mean: ∼11 years). On a scale from 1 (“not familiar”) to 5 (“very familiar”),the median of their indicated familiarity with service- andmicroservice-basedsystems was 4 (mean: 4.1), while the median for familiarity with scenario-based methods was 3 (mean: 2.8). Exactly 50% (20) had already used ascenario-based method for a real-world project. In the first part, participantswere presented with five different effort estimation techniques for Changes,namely hours, lines of code, an ordinal scale (1-10), COSMIC functionpoints, and story points. For each of these, they had to use a 5-point Likert
1We shared all study data and artifacts in the GitHub repository (_docs/evaluation).
216 7 | Scenario-Based Evolvability Analysis for Service Orientation

scale to rate how precise the technique is and how applicable the techniqueis for such a method. The results indicate that our participants favoredstory points and hours for both precision (see Fig. 7.8) and applicability(see Fig. 7.9). COSMIC function points and the ordinal scale were seen assomewhat neutral, while only lines of code received mostly negative ratings.As a consequence, we removed LOC estimation from our tool.
18%
38%
42%
40%
65%
45%
30%
22%
18%
8%
38%
32%
35%
42%
28%
Estimating with hours isprecise
Estimating with LOC isprecise
Estimating with an ordinalscale (1−10) is precise
Estimating with Cosmic FP isprecise
Estimating with story pointsis precise
100 50 0 50 100Percentage
Responsestrongly disagree (1) disagree (2) somewhat agree (3) agree (4) strongly agree (5)
Figure 7.8.: Precision ratings for effort estimation techniques (survey)
20%
22%
38%
45%
65%
60%
42%
35%
18%
15%
20%
35%
28%
38%
20%
Hours are applicable for themethod
LOC are applicable for themethod
An ordinal scale (1−10) isapplicable for the method
Cosmic FP are applicable forthe method
Story Points are applicablefor the method
100 50 0 50 100Percentage
Responsestrongly disagree (1) disagree (2) somewhat agree (3) agree (4) strongly agree (5)
Figure 7.9.: Applicability ratings for effort estimation techniques (survey)
In the second part of the survey, participants were presented with screen-shots from our Evaluation view (see Fig. 7.10 and 7.11) and were asked to
7.3 | Evaluation: Survey and Interviews 217

rate the perceived usefulness of five Evaluation metrics with a Likert scale(see Fig. 7.12). The best-rated metric was # of Affected Services / Scenario(75% agreement). Participants saw the metrics Most Modified Service, Servicewith Highest Effort, and Change Impacting Most Services as moderately useful(around 50% agreement with 20-30% neutral). Only AVG Effort / Scenariowas rated negatively overall (45% disagreement, 35% neutral).
Figure 7.10.: Scenario-level metrics from the evaluation view (tool screen-shot for survey)
Figure 7.11.: System-level metrics from the evaluation view (tool screenshotfor survey)
218 7 | Scenario-Based Evolvability Analysis for Service Orientation

12%
22%
18%
18%
45%
75%
55%
52%
50%
20%
12%
22%
30%
32%
35%
Most Modified Service is auseful metric
Service with Highest Effortis a useful metric
AVG Effort / Scenario is auseful metric
Change Impacting MostServices is a useful metric
# of Affected Services /Scenario is a useful metric
100 50 0 50 100Percentage
Responsestrongly disagree (1) disagree (2) somewhat agree (3) agree (4) strongly agree (5)
Figure 7.12.: Usefulness ratings for scenario evaluation metrics (survey)
The interviews had the primary goal to evaluate the simplicity and usabilityof the tool. Participants first read a hand-out with task descriptions thatserved as a step-by-step guide for applying the method to an example system,i.e. modeling the described System with Services, creating Scenarioswith Changes, and lastly, coming to an Evaluation. They then used thetool to work on these tasks while the moderator observed and sometimesasked questions about their rationale. After each step, the moderator askedsome retrospective questions about the perceived complexity and suggestionsfor improvements. For the Evaluation view, the hand-out also containedsome comprehension questions about the results. Afterwards, we createda small case description for each interview. These descriptions were lateranalyzed and improvements were derived from them. Seven PhD candidatesparticipated in hands-on interviews (see Table 7.2). They had a median of6 years of professional experience (mean: 9.3), a median familiarity withservice-based systems (1 to 5) of 2 (mean: 2.4), and a median familiaritywith scenario-based methods (1 to 5) of 3 (mean: 2.9). They were not asexperienced as the survey participants, but since usability was the focus, thiswas not problematic.
7.3 | Evaluation: Survey and Interviews 219

ID Experience FamiliarityScenarios(1-5)
FamiliarityServices(1-5)
Complexityof SystemCreation (1-5)
Helpfulnessof EvaluationView (1-5)
1 19 years 3 2 2 42 17 years 4 3 2 43 6 years 2 3 1 44 8 years 4 2 1 55 6 years 2 2 1 46 6 years 1 3 1 47 3 years 4 2 1 4
Median: 6 years 3 2 1 4Mean: 9.3 years 2.9 2.4 1.3 4.1
Table 7.2.: Interviews: participant demographics and ratings
The interview results indicate that the tool is generally easy and conve-nient to use, e.g. participants rated the complexity of the System creationstep (1 to 5) with a median of 1 (mean: 1.3) or the helpfulness of theEvaluation view (1 to 5) with a median of 4 (mean: 4.1). However, theyalso had many suggestions to improve clarity and ease of use, especiallyw.r.t. to the Scenario creation step. In total, we implemented 15 of theseimprovements, such as making suggested ripples clickable to automaticallyselect them, refining the Scenario creation UI flow, or adding a graphicalSystem representation.
7.4. Threats to Validity
While our two empirical studies indeed led to further improvements formethod and tool support, these small evaluation steps are not sufficient. Theeffectiveness of the method can only be reliably assessed in an industrial set-ting with potentially larger systems and experienced stakeholders. Moreover,survey and interview results may have suffered from typical survey-basedthreats to validity. Participants may have misunderstood or misinterpreted
220 7 | Scenario-Based Evolvability Analysis for Service Orientation

questions. For the survey, participants also had no direct access to the tool,but had to answer based on descriptions and screenshots, which made itmore difficult for them to judge the usefulness of proposals. Another limi-tation may be the participants’ self-reported experience. While the generalexperience level for the survey looks sufficient, participants may have over-estimated their qualifications. Lastly, we must be careful to generalize froma sample size of 40 survey and seven interview participants.
7.5. Conclusion
To provide means for efficient qualitative analysis, we designed a lightweightscenario-based evolvability evaluation method that targets service- andmicroservice-based systems. We implemented web-based tool support toease manual efforts. Method and tool were incrementally improved andfinally evaluated with a survey (N=40) and interviews (N=7). While ourparticipants generally perceived the usefulness and usability of method andtool as positive, these evaluations led to the implementation of 15 additionalimprovements. In conclusion, the method is now ready for first industrialcase studies, from which we expect further refinements.
7.5 | Conclusion 221

Chap
ter 8
Evolvability Patterns andAntipatterns for Service
Orientation
Our last contribution chapter comprises our studies in the field of service-oriented evolvability patterns and antipatterns. We collected existing SOAdesign patterns and analyzed their applicability to microservices. To gaina qualitative notion of a beneficial evolvability influence of patterns, wemapped the identified patterns onto architectural modifiability tactics. Wethen empirically tested the evolvability impact of a subset of these patternsin a controlled experiment (N=69) and metric-based analysis. Lastly, wecollected existing service-based antipatterns and created a holistic repositoryfor them. The chapter extends the following publications:
• J. Bogner, A. Zimmermann, and S. Wagner. “Analyzing the Relevanceof SOA Patterns for Microservice-Based Systems.” In: Proceedingsof the 10th Central European Workshop on Services and their Compo-
222

sition (ZEUS’18). Dresden, Germany: CEUR-WS.org, 2018, pp. 9–16 [BZW18]
• J. Bogner, S. Wagner, and A. Zimmermann. “Using architecturalmodifiability tactics to examine evolution qualities of Service- andMicroservice-Based Systems.” In: SICS Software-Intensive Cyber-PhysicalSystems 34.2-3 (June 2019), pp. 141–149 [BWZ19b]
• J. Bogner, S. Wagner, and A. Zimmermann. “On the impact of service-oriented patterns on software evolvability: a controlled experimentand metric-based analysis.” In: PeerJ Computer Science 5 (Aug. 2019),e213 [BWZ19a]
• J. Bogner et al. “Towards a Collaborative Repository for the Documen-tation of Service-Based Antipatterns and Bad Smells.” In: 2019 IEEEInternational Conference on Software Architecture Companion (ICSA-C).Hamburg, Germany: IEEE, Mar. 2019, pp. 95–101 [BBP+19]
7.5 | Conclusion 223

8.1. Context and Goals
Software design patterns are a well-established form to document proven so-lutions to recurring design problems within a specific context in a technology-agnostic yet easily implementable way. They base their origin in Alexander’sbuilding pattern language [AIS77] and went mainstream with the famousGang of Four “Design Patterns” [GHJV94]. Meanwhile, there is also a signif-icant body of patterns in the field of service-oriented computing. Most ofthese have been conceptualized for the context of SOA. Prominent examplesare the pattern catalogues by Erl [ECPB12; Erl09], Rotem-Gal-Oz [Rot12],or Daigneau [Dai11]. These patterns are usually on an architectural leveland are e.g. concerned with service inventories, communication, and com-position. Nonetheless, they can also focus on the design of an individualservice. Despite existing similarities between SOA and microservices, the firststand-alone pattern languages for the younger service-based architecturalstyle are emerging [Ric19]. Several of these “new” microservices patternshave existing ancestor patterns from SOA or other contexts.One issue with existing service-oriented design patterns is that their rele-
vance for microservice-based systems is not fully clear. Microservices charac-teristics like decentralization may influence the applicability of SOA patterns.We therefore conducted a qualitative study for a large number of SOA pat-terns to analyze whether they apply to microservices (see Section 8.2).Furthermore, we wanted to identify service-oriented patterns with a posi-
tive impact on evolvability so that software professionals can use them forsystematic evolvability construction. To achieve this, we first performed asecond qualitative mapping study via the proxy of architectural modifiabilitytactics (see Section 8.3), which yielded a candidate list of service-basedevolvability patterns. To provide empirical evidence for the impact of a smallsubset of these patterns on evolvability, we then conducted a controlledexperiment and analysis with metrics (see Section 8.4).Lastly, we wanted to improve the systematic knowledge on service-based
antipatterns, i.e. frequently occurring suboptimal solutions in service-orienteddesign, so that software professionals can educate themselves and avoid rel-
224 8 | Evolvability Patterns and Antipatterns for Service Orientation

evant design pitfalls. We therefore collected service-based antipatterns withan SLR and created a holistic repository to browse them (see Section 8.5).
8.1 | Context and Goals 225

8.2. Applicability of SOA Patterns for Microservices
As described in Section 2.3.2, there is still an ongoing discussion about thedifferentiation of SOA and microservices. Even though microservices patternsare slowly emerging, it would therefore be useful to know which of the manyexisting SOA patterns are also relevant in a microservices context. This wouldenable software practitioners to strategically reuse proven service-orienteddesign knowledge without having to reinvent the wheel. Moreover, such anarchitecture- and design-centric comparison could further the understandingof context-specific limitations of these patterns and also adds a pattern-basedperspective to the “SOA vs. microservices” discussion.Guided by popular microservices characteristics, we therefore conducted
a qualitative study to analyze the applicability of existing SOA patterns fora microservices context. The study aimed to answer the following threeresearch questions:RQ1: To what degree are SOA design patterns applicable to microservices?RQ2: What pattern categories are the most or least applicable?RQ3: What are the most frequent microservice-specific properties violated
by not or partially applicable patterns?
8.2.1. Research Design
As a basis for our SOA pattern catalogue, we used Erl’s [ECPB12; Erl09] andRotem-Gal-Oz’s [Rot12] books as sources, as they are well established inindustry and academia and have minimal overlap. From literature (see Sec-tion 2.3), we compiled the following list of microservice-specific principles.
• Bounded Context: fine-grained services according to Bounded Con-texts [Eva04]
• Decentralization: decentralization of control and management, lowdegree of standardization, choreography over orchestration
• Lightweight Communication: communication via RESTful APIs orlightweight messaging (no ESB, no workflow engine), “dumb pipes”
226 8 | Evolvability Patterns and Antipatterns for Service Orientation

• Single System: building a single service-based system of medium size
• Technological Heterogeneity: support of diverse programming lan-guages, databases, or used frameworks / libraries
With these criteria, we qualitatively analyzed the patterns in our threesources and documented if the usage of a pattern violates the compiledcharacteristics. Based on the violations, a pattern was categorized as fullyapplicable, partially applicable (with certain limitations / modifications),or not applicable. The aggregated results of all these pattern categorizationswere then used for further analysis to answers our research questions.
To illustrate this process, we present an example for each label: the patternEnterprise Inventory that provides architecture, standardization, and gover-nance boundaries for every service within the enterprise is categorized as notapplicable because this violates the microservice principles Decentralization,Single System, and Technological Heterogeneity. Likewise, the pattern ProtocolBridging that enables communication between consumers and providers thatrely on different protocols is rated partially applicable because this is usuallynot necessary in a microservice-based system. The principles LightweightCommunication and Single System could be violated by this. However, therecould be rare evolutionary use cases where this pattern could indeed beapplied, e.g. when a service that uses message-based communication (e.g.AMQP) should interact with one that relies on RESTful HTTP because ofnew or changed requirements. Lastly, the Lightweight Endpoint pattern,where a series of fine-grained capabilities replaces a single coarse-grainedcapability to avoid wasteful data exchange and consumer-side processing, iscategorized as fully applicable. It violates none of the defined microservicesprinciples and is, in fact, in line with the core values of this architecturalstyle.
8.2.2. Results
Erl’s catalogue comprises a total of 92 patterns (85 SOA patterns [Erl09]and seven REST-inspired patterns [ECPB12]). He structured the patterns
8.2 | Applicability of SOA Patterns for Microservices 227

into five different categories, namely Service Inventory Design Patterns (24patterns), Service Design Patterns (31 patterns), Service Composition DesignPatterns (23 patterns), Compound Design Patterns (7 patterns), and REST-Inspired Patterns (7 patterns). Rotem-Gal-Oz’s more compact book presents26 patterns [Rot12] in six categories, namely Foundation Structural Patterns(5 patterns), Performance, Scalability, and Availability Patterns (6 patterns),Security and Manageability Patterns (5 patterns), Message Exchange Patterns(4 patterns), Service Consumer Patterns (3 patterns), and Service IntegrationPatterns (3 patterns). So all in all, we analyzed 118 SOA patterns withvery few duplicates (examples being Service Bus or Orchestration). Fortransparency and replicability, we shared the mapping details in a GitHubrepository1.
54
20
26
4
12
20
10
20
30
40
50
60
Erl Rotem-Gal-Oz
Fully applicable
Partially applicable
Not applicable
Figure 8.1.: SOA pattern applicability to microservices
From Erl’s 92 patterns, we have found 54 patterns to be fully applicable(59%), 26 to be partially applicable (28%) and only 12 were categorized asnot applicable (13%). That means that 87% of the patterns were estimatedat least partially applicable in a microservices context. For Rotem-Gal-Oz’ssmaller catalogue, the numbers were even higher: of the 26 patterns, 20
1https://github.com/xJREB/research-soa-patterns-for-microservices
228 8 | Evolvability Patterns and Antipatterns for Service Orientation

were categorized as fully applicable (77%), four as partially applicable(15%), and only two were deemed not applicable (8%). So 92% of thesepatterns were found to be at least partially applicable for microservices.When combining both catalogues (118 patterns), this accounts for 74 fullyapplicable (63%), 30 partially applicable (25%), and 14 not applicablepatterns (12%). This distribution can also be observed in Fig. 8.1.When looking at Erl’s five pattern categories, an immediate observation is
that all of the seven REST-Inspired Patterns are fully applicable. In light ofmicroservice-related communication preferences, this seems understandable.Furthermore, 22 of 31 Service Design Patterns (71%) and 15 of 23 ServiceComposition Design Patterns (65%) were fully applicable, which makes thesetwo categories also very useful design sources when building microservice-based systems. The seven Compound Design Patternswere the least applicablecategory with zero fully and only four partially applicable patterns (57%).This can be explained with the complexity and centralized nature of thesepatterns. For Rotem-Gal-Oz’s six categories, both Message Exchange Patternsand Service Consumer Patterns are 100% fully applicable. Moreover, Per-formance, Scalability, and Availability Patterns with 83% and Security andManageability Patterns with 80% fully applicable patterns are mentionable.All in all, the categories here consisted of fewer patterns, which makes itharder to compare them with Erl’s.When analyzing the most frequent causes why patterns were not or only
partially applicable (see Fig. 8.2), the Decentralization characteristic wasthe most violated one (42% of all violations for Erl, 55% for Rotem-Gal-Oz).After that, Single System (29%) and Bounded Context (17%) were thenext frequent violations in Erl’s catalogue, with Lightweight Communica-tion only accounting for 9%. Interestingly, Technological Heterogeneitywas violated only twice by Erl’s patterns (Enterprise Inventory and Domain In-ventory) and in Rotem-Gal-Oz’s catalogue only by one single pattern (ServiceHost). The reason for this small number of violations may be the technology-agnostic form of design patterns. Moreover, SOA implementations are nostrangers to diversity, so even an increase in technological heterogeneity ina microservice-based system will not invalidate the vast majority of patterns.
8.2 | Applicability of SOA Patterns for Microservices 229
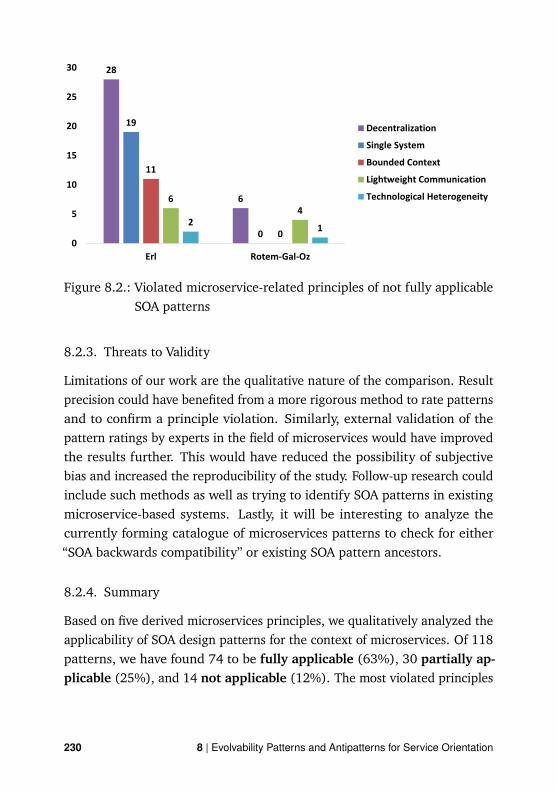
28
6
19
0
11
0
64
2 10
5
10
15
20
25
30
Erl Rotem-Gal-Oz
Decentralization
Single System
Bounded Context
Lightweight Communication
Technological Heterogeneity
Figure 8.2.: Violated microservice-related principles of not fully applicableSOA patterns
8.2.3. Threats to Validity
Limitations of our work are the qualitative nature of the comparison. Resultprecision could have benefited from a more rigorous method to rate patternsand to confirm a principle violation. Similarly, external validation of thepattern ratings by experts in the field of microservices would have improvedthe results further. This would have reduced the possibility of subjectivebias and increased the reproducibility of the study. Follow-up research couldinclude such methods as well as trying to identify SOA patterns in existingmicroservice-based systems. Lastly, it will be interesting to analyze thecurrently forming catalogue of microservices patterns to check for either“SOA backwards compatibility” or existing SOA pattern ancestors.
8.2.4. Summary
Based on five derived microservices principles, we qualitatively analyzed theapplicability of SOA design patterns for the context of microservices. Of 118patterns, we have found 74 to be fully applicable (63%), 30 partially ap-plicable (25%), and 14 not applicable (12%). The most violated principles
230 8 | Evolvability Patterns and Antipatterns for Service Orientation

were Decentralization and Single System while Technological Heterogeneityhad minimal impact. The findings suggest that, from a pattern-based per-spective, microservices and SOA have some small distinct areas of differences,but share a broad set of design-related commonalities.
8.2 | Applicability of SOA Patterns for Microservices 231

8.3. Impact on Evolvability: Qualitative Mapping viaArchitectural Modifiability Tactics
While service- and especially microservice-based systems allegedly providea high base degree of evolvability, it is still challenging to generalize theevolution qualities of systems based on service orientation. A blind belief inthe inherent modifiability of a service-based system – without having a clearunderstanding of the factors that influence this quality attribute – can leadto violations of essential principles and therefore negatively impact softwareevolution. To prevent this, systematic knowledge of service-oriented evo-lution qualities and how to achieve and preserve them via design patternsis necessary. Our approach to address this is based on relating architec-tural modifiability tactics to a) principles of service- and microservice-basedsystems and b) to design patterns for these systems.Architectural tactics are general techniques that support software architects
in achieving quality attribute goals [BCK12]. They have been conceptualizedby the Carnegie Mellon Software Engineering Institute in Pittsburgh, PA,and exist for various quality attributes such as availability, performance, orsecurity. An architectural modifiability tactic therefore is a design decisionor an architectural transformation that positively affects system propertiesrelated to modifiability with the final goal of reducing the time and effortnecessary to introduce future changes [BBN07]. As opposed to patterns,tactics are described in a more general and less complex way without muchimplementation guidance. Moreover, they are only related to a single qualityattribute and are therefore not concerned with design trade-offs.The result of our qualitative study is a matrix that maps these general
modifiability guidelines into a service-oriented context and relates them toconcrete patterns that provide realization blueprints for systematic evolv-ability construction. Practitioners can use these results to deepen theirunderstanding of the evolution qualities of their systems and implementsuggested patterns to enhance modifiability. Moreover, our mapping pro-vides another comparison between the two service-based architectural stylesservice-oriented architecture (SOA) and microservices and their different
232 8 | Evolvability Patterns and Antipatterns for Service Orientation

strategies to achieve evolvability. Our study was framed by the followingresearch questions:RQ1: To what extent are architectural modifiability tactics related to
principles of service- and microservice-based systems?RQ2: What concrete design patterns from the domain of service- and
microservice-based systems can be used to realize modifiability tactics?RQ3: What general statements about the evolution qualities of the two
service-based architectural styles can be derived from the results of RQ1 andRQ2?
8.3.1. Research Design
As the first step in our study, we had to choose recognized principles ofservice- and microservice-based systems. For the first, we used the service-oriented design principles from Erl [Erl05], while for the latter, we reliedon the microservices characteristics described by Lewis and Fowler [Fow15](see Table 8.1).
Table 8.1.: Principles of SOA and microservicesSOA [Erl05] Microservices [Fow15]
Standardized Service Contract Componentization via ServicesService Loose Coupling Organized around Business CapabilitiesService Abstraction Products, not ProjectsService Reusability Smart Endpoints, Dumb PipesService Autonomy DecentralizationService Statelessness Infrastructure AutomationService Discoverability Design for FailureService Composability Evolutionary Design
Minor issues with this comparison are that a lot of Erl’s service-orientedprinciples are undoubtedly valid for microservice-based systems as well.Moreover, the characteristics for the microservices architectural style touchseveral new dimensions (e.g. operations, development, organization) that
8.3 | Impact on Evolvability: Qualitative Mapping via Architectural Modifiability Tactics 233

most “traditional” architectural styles (including SOA) do not consider.Nonetheless, we decided to explicitly include microservices principles toalso incorporate the other side of the service-oriented spectrum. This in-clusion also has the added benefit of providing another perspective on thecontroversial “SOA vs. microservices” debate (see Section 2.3.2).For the service-oriented patterns, we combined the SOA design pattern cat-
alogues from Erl [ECPB12; Erl09] with the one from Rotem-Gal-Oz [Rot12],since they have minimal overlap and provide the most comprehensive essenceof industry knowledge in this regard (118 patterns in total). Following thesame reasoning as with the principles, we decided to include microservicespatterns as well. Since this is a very young and emerging topic, there arenot many options, results may be preliminary, and there certainly is contro-versy around the novelty of these patterns. We used Richardson’s cataloguethat consisted of 42 patterns at the time of writing [Ric19]. While we areaware that all of the sources for principles and patterns are not scientificpeer-reviewed publications, we believe them to be valuable nonetheless.Moreover, they are quite popular in industry and most of them have beenused and referred to in scientific publications.For the other part of the mapping, we compiled a list of existing architec-
tural modifiability tactics from the most prominent sources [BBN07; BCK03;BCK12]. After the extraction and merging process, we arrived at a total of 15different modifiability tactics that represent abstract techniques to increasethe evolution qualities of a system. We present these tactics in Fig. 8.3 andthey are organized in three main categories:
• Increase Cohesion (to localize changes)
• Reduce Coupling (to prevent ripple effects)
• Defer Binding Time (to increase flexibility)
234 8 | Evolvability Patterns and Antipatterns for Service Orientation

���������� �����
���������������������������� ����������� ������������������� ���
�� !"!#$!%!&'(#)&!)*
+, -),.�-/%!01
20)3,#*,.�4,*!�0
5,",36!0 !01(!7,
20)3,#*,89,7#0&!).�4,3,0),:0&!)!/#&,8;</,)&, .4#01,*9/%!&8�� -%,=,0,3#%!>,8�� -%,:$*&3#)&8.�77�0?-0)&!�0#%!&'
@*,8;0)#/*-%#&!�0�#!0&#!08;<!*&!01820&,3"#),+,*&3!)&85,/,0 ,0)!,*8A.�77-0!)#&!�08B#&4*@*,8#0820&,37, !#3'
+-0&!7,8+,1!*&3#&!�08A5'0#7!)8C��D-/+-0&!7,86!0 !01B-$%!*4E9-$*)3!$,9&E@/8(!7,86!0 !015,/%�'7,0&8(!7,86!0 !01.�7/!%,8(!7,86!0 !01
Figure 8.3.: Compiled list of architectural modifiability tactics basedon [BBN07; BCK03; BCK12]
After completing the collection process, we first created a qualitative map-ping between principles (for both service- and microservice-based systems)and tactics, i.e. which principles are related to or have an influence on whichtactics? As the second step, we related patterns (again for both service- andmicroservice-based systems) to the tactics, i.e. which patterns can be usedto realize which tactics? We then documented the mapping results to cap-ture the underlying evolvability-related knowledge and analyzed them forinteresting distributions or anomalies. Please refer to our GitHub repositoryfor the complete data set1.
1https://github.com/xjreb/research-modifiability-tactics
8.3 | Impact on Evolvability: Qualitative Mapping via Architectural Modifiability Tactics 235

8.3.2. Results
After mapping the eight service-oriented principles from Erl and the eightmicroservices principles from Lewis and Fowler onto the modifiability tactics,we quantitatively analyzed the results (see Fig. 8.4). First, while a maximumof 120 relations would be possible per service-oriented paradigm (8 principles* 15 tactics), we identified only 26 for SOA and only 15 for microservices.In both paradigms, “Reduce Coupling” was the tactic category with mostrelations (although for SOA this number was considerably higher), whichemphasizes the importance of loose coupling for systems based on serviceorientation. Second, since SOA principles had nearly twice the number ofmappings than microservices, the SOA design principles seem to be muchmore directed towards architectural aspects related to modifiability than themicroservices principles. As already mentioned, the latter span more thanarchitectural aspects, which is why principles like “Products, not Projects” or“Decentralization” are hard to map onto tactics.
16
7
5 55
3
0
2
4
6
8
10
12
14
16
18
SOA Principles Microservices Principles
Number of Relations between Tactic Categories and Principles
Reduce Coupling
Increase Cohesion
Defer Binding Time
Figure 8.4.: Number of relations between tactic categories and principles
The principle with the highest number of mappings was “Service LooseCoupling” (7) for SOA, while it was “Evolutionary Design” (5) for microser-vices. When looking at the tactics with the most mappings to principlesin each paradigm, “Maintain Existing Interface” was related to six SOA
236 8 | Evolvability Patterns and Antipatterns for Service Orientation
principles and “Restrict Dependencies and Communication Paths” to threemicroservices principles. The following sections provide more detailed infor-mation for each of the principles.
8.3.2.1. SOA Principles
The SOA principle Standardized Service Contract was related to two tac-tics, namely “Maintain Existing Interface” and “Restrict Dependencies andCommunication Paths”. Both tactics capture the important SOA concern torestrict how functionality is offered by standardizing service interfaces andmaintaining them as long as possible to provide backwards compatibility.As mentioned above, Service Loose Coupling was the SOA principle with
the most mappings and is unsurprisingly related to each of the four tacticsfrom the “Reduce Coupling” category. On top of that, we related it to “AbstractCommon Functionality”. Although this is primarily a cohesion tactic, thenewly created dependency on abstracted and relocated functionality shouldmanifest itself in a loosely coupled way in SOA. Moreover, we related it to“Runtime Registration and Dynamic Lookup” and “Publish-Subscribe”, whichare “defer binding” tactics with great importance for SOA that can also helpto reduce coupling.Service Abstraction was mapped onto the coupling tactics “Use Encap-
sulation”, “Maintain Existing Interfaces”, and “Use an Intermediary”. Theyreflect the goals of raising the abstraction level for business logic and to hidethe implementation of it while providing a stable interface for its access.The two principles Service Reusability and Service Composability go
hand in hand and have therefore been mapped to the same four tactics,namely “Generalize Module”, which refers to operations in the service in-terface in this case, “Abstract Common Functionality”, “Use Encapsulation”,and “Maintain Existing Interface”. These tactics ensure that services aregeneral enough to be reusable by many consumers and provide stability aswell as information hiding for sustainable usage.With five mappings, Service Autonomy is the SOA principle with the
second most relations. The tactics “Use Encapsulation”, “Maintain Existing
8.3 | Impact on Evolvability: Qualitative Mapping via Architectural Modifiability Tactics 237

Interface”, and “Use an Intermediary” ensure that a service implementationor even its interface can evolve in a consumer-friendly way. “Runtime Reg-istration and Dynamic Lookup” enable a service to autonomously offer itscapabilities and to choose from available offerings, while “Publish-Subscribe”provides a mechanism to autonomously consume or publish events withouthaving to care too much about potential consumers.We could only map the very specialized Service Discoverability principle
onto one single – albeit perfectly fitting – tactic: “Runtime Registration andDynamic Lookup”.Lastly, the principle Service Statelessness could not be related to any
modifiability tactic and is therefore the only SOA principle without a map-ping.
8.3.2.2. Microservices Principles
For the microservices principles, the total number of mappings was consid-erably smaller. With four relations, Componentization via Services wasone of the more relevant principles. We mapped it onto the tactics “AbstractCommon Functionality”, “Use Encapsulation”, “Maintain Existing Interface”,and “Restrict Dependencies and Communication Paths”. These tactics ensurethat the only way to access functionality is via the provided interfaces thatencapsulate the implementation.The principle Organized around Business Capabilities was related to
the “Increase Semantic Coherence” tactic, which perfectly describes therationale of this principle. In a microservice-based system, each service triesto offer only tightly related functionality via the construct of a BoundedContext.For Smart Endpoints, Dumb Pipes, the identified relations were rather
weak. Nonetheless, we decided to map this principle to the tactics “RestrictDependencies and Communication Paths” and “Publish-Subscribe” becausethis principle prescribes limitations for communication channels and a simpletopic-based “Publish-Subscribe” mechanism is a potential implementation ofa “dumb” pipe.
238 8 | Evolvability Patterns and Antipatterns for Service Orientation

The Decentralization principle was similarly hard to map onto tactics. Inthe end, we decided to relate it to “Restrict Dependencies and Communica-tion Paths” because it includes the restriction of not sharing databases. Dataowned by a service has to be accessed via the API of this service.As expected, the Evolutionary Design principle maps rather well onto
modifiability tactics and is the microservices principle with the most rela-tions (5). The cohesion tactics “Increase Semantic Coherence”, “AnticipateExpected Changes”, and “Split Module” perfectly describe the service de-composition and refactoring philosophy of microservices. Furthermore, “UseEncapsulation” and “Maintain Existing Interface” add to this by providingimportant foundations for sustainable evolution.For Products, not Projects, we could not relate any tactic, since it de-
scribes organizational aspects. Likewise, the Design for Failure principle isrelated to reliability and could probably be mapped very well onto availabil-ity tactics. Since we were only concerned with modifiability in this study,this microservices principle is the second one with zero relations.
8.3.2.3. SOA and Microservices Patterns
As the secondmapping activity, we analyzed the relations of 118 SOA patternsand 42 microservices patterns with modifiability tactics. Because it wassometimes hard to choose a single tactic for a pattern and we did not wantto relate one pattern to several tactics, we compressed multiple closelyrelated tactics together in some cases (e.g. “Abstract Common Functionality”and “Generalize Module”). For SOA, we were able to relate a total of 47patterns (∼40%), while for microservices, we mapped a total of 21 patterns(50%). The “Reduce Coupling” tactic category was again the most prominentcategory for SOA with 23 patterns (∼49%), but for microservices it was“Defer Binding Time” with 11 patterns (∼52%). Fig. 8.5 presents moredetails about the category distribution. The following sections provide moreinformation for each tactic or tactics collection. For the complete list ofpatterns, please refer to the GitHub repository1.
1https://github.com/xjreb/research-modifiability-tactics
8.3 | Impact on Evolvability: Qualitative Mapping via Architectural Modifiability Tactics 239

23
7
14
3
1011
0
5
10
15
20
25
SOA Patterns Microservices Patterns
Number of Related Patterns per Tactic Category
Reduce Coupling
Increase Cohesion
Defer Binding Time
Figure 8.5.: Number of related patterns per tactic category
Since the three tactics Increase Semantic Coherence, Anticipate Ex-pected Changes, and Split Module can be realized by roughly the samepatterns, they were collectively addressed. In a service-oriented context,these tactics are mostly concerned with decomposition and normalization.We related six SOA patterns to this incentive, e.g. “Service Decomposition”,“Service Refactoring”, or “Lightweight Endpoint”. We also chose two mi-croservices patterns concerned with decomposition, namely “Decompose byBusiness Domain” and “Decompose by Subdomain”.Also related to cohesion, the two tactics Abstract Common Functionality
and Generalize Module were treated in unison. Since generalizing capabil-ities to create agnostic and therefore reusable functionality is an importanttheme in SOA, eight patterns were identified for these tactics, e.g. “EntityAbstraction”, “Canonical Resource”, or “Service Host”. For microservices, weselected one pattern, namely “Microservice Chassis”, which is the equivalentof “Service Host”.Coupling tactics were sufficiently distinct to not require compression. The
Use Encapsulation tactic can be realized by the basic SOA patterns “ServiceEncapsulation” and “Decoupled Contract” while in a microservices context,“Service-per-Container” or “Service-per-VM” can be used.
240 8 | Evolvability Patterns and Antipatterns for Service Orientation

For Maintain Existing Interface, SOA provides the patterns “CanonicalVersioning”, “Compatible Change”, and “Version Identification”. A specificmicroservices pattern could not be identified for this tactic, although theversioning of e.g. RESTful APIs is also a popular theme in this space.With governance and centralization being important SOA properties, the
tactic Restrict Dependencies and Communication Paths can be realizedby eight patterns, e.g. “Canonical Protocol”, “Canonical Schema”, or “OfficialEndpoint”. Similarly, we identified two microservices patterns, “Databaseper Service” and “Command Query Responsibility Segregation (CQRS)”.Use an Intermediary with the goal to reduce coupling by indirection was
the tactic with the most SOA pattern matches (9). It can be realized by e.g.“Service Façade”, “Proxy Capability”, or “Service Broker”. For microservices,we chose three patterns, “API Composition”, “API Gateway”, and “Backendfor Front End”.Tactics that defer bindings could also be treated on a single basis. The tactic
Runtime Registration and Dynamic Lookup which is so central to serviceorientation matches surprisingly only one SOA pattern, “Metadata Central-ization”. On the microservices side however, we identified five patterns, e.g.“Self Registration”, “Client-side Discovery”, or “Server-side Discovery”, whichmakes this the tactic with the most microservices pattern matches.For Runtime Binding, it is the other way around. While we chose six
SOA patterns (e.g. “Intermediate Routing”, “Workflodize”, or “EndpointRedirection”), we could not relate a single microservices pattern to thistactic.The Publish-Subscribe tactic can be related to three patterns in each con-
text, namely “Service Messaging”, “Event-Driven Messaging”, and “Inversionof Communication” for SOA, while “Event Sourcing”, “Application Events”,and “Messaging” were identified for microservices.Lastly, Start-Up Time Binding had no related SOA pattern, but can be
realized by the microservices pattern “Externalized Configuration”. Similarly,no SOA pattern could be identified for Deployment Time Binding whiletwo microservices patterns are available, “Service Deployment Platform” and“Serverless Deployment”. For the Compile Time Binding tactic, no pattern
8.3 | Impact on Evolvability: Qualitative Mapping via Architectural Modifiability Tactics 241

could be related in both of the service-based styles, which makes this theonly modifiability tactic without pattern mappings.
8.3.3. Discussion
When trying to interpret the mapping results, several things are of interest.First, the SOA principles are of a more general and technical nature andtherefore produced a larger number of mappings to architectural modifi-ability than the microservices principles (26 vs. 15). Interestingly, SOAfocuses on a smaller number of tactics (seven of 15 tactics had no mapping,the coupling category had more than 60% of mappings), while the latterspread more evenly (only five tactics with no mapping, coupling categorywith ∼47%). The microservices principles often fit extremely well for just afew tactics, e.g. the principle “Organized around Business Capabilities” andthe tactic “Increase Semantic Coherence”. If we had specified the strengthof each mapping (which is very difficult to achieve objectively), the resultsmight not look as far apart as is currently suggested. Furthermore, the“Decentralization” principle could only be mapped to one tactic, but couldpotentially influence modifiability further via the development process andtechnology choices, both of which are not represented amongst the existingtactics.Second, when looking at the mappings of patterns to tactics, we could
relate ∼10% more microservices patterns than SOA patterns, although boththe total number as well as the number of mapped patterns was smaller (SOA:47 of 118, microservices: 21 of 42). This could suggest that microservicesare slightly more tailored towards modifiability in this regard. During theanalysis, however, we identified a number of SOA patterns that we instinc-tively deemed beneficial for modifiability but that we could not easily relateto existing tactics, e.g. “Process Abstraction”, “Process Centralization”, or“Brokered Authentication”. Therefore, the total degree of pattern mappingsof the two service-based styles seems to be similarly close as for the prin-ciples. The distribution, however, is focused on different categories. ForSOA, ∼49% of the mappings are in the category “Reduce Coupling” while
242 8 | Evolvability Patterns and Antipatterns for Service Orientation

for microservices, ∼52% of mapped patterns are in “Defer Binding Time”.Interestingly, only three of the 21 mapped microservices patterns are in the“Increase Cohesion” category, although small and highly cohesive servicesaccording to Bounded Contexts are a key philosophy within microservice-based systems. This suggests a lack of systematic approaches and detailedpatterns to achieve this postulated property.Unsurprisingly, mappings around loose coupling were very prevalent
throughout both service-based styles, which quantitatively strengthens theimportance of this characteristic. The “Reduce Coupling” tactic categoryhad most mappings for both principle lists (SOA: 16, microservices: 7), themost mappings for the SOA patterns (23), and the second-most for the mi-croservices patterns (7). Moreover, “Service Loose Coupling” was the mostfrequently mapped principle (7). A wide variety of patterns exists to ensurethis important service-oriented design property.When comparing the two styles further, however, they both strive for
evolvability in different ways. For SOA, governance through restrictions,reusability via abstraction of common functionality, and the usage of in-termediaries are essential. Furthermore, interoperability, integration, andpreserving interfaces are common themes. Microservices, on the other hand,focus more on “Evolutionary Design” as a key principle to achieve modifia-bility. They also bring in a focus on “Infrastructure Automation” which canbe related to modifiability tactics (deployment and compile-time binding),although it is not really an architectural property and could also be appliedto SOA. Detailed patterns for “Runtime Registration and Dynamic Lookup”further strengthen the importance of the “Defer Binding Time” category formicroservices. Interestingly, “Restrict Dependencies and CommunicationPaths” was the tactic with most principle mappings (3), which at first seemscounterintuitive to the decentralized and heterogeneous nature of microser-vices. When examining these mappings, however, the restrictions are basedon the usage of service interfaces as the sole access point for functionality,the restriction to not share databases, and the incentive to keep as muchlogic as possible inside services and not inside communication channels.So, while microservices generally are not related to strong governance and
8.3 | Impact on Evolvability: Qualitative Mapping via Architectural Modifiability Tactics 243

standardization, they provide standardization on a few foundational topicsand achieve a base level of modifiability with this. Similarly, microservicesconcentrate on just a small number of communication protocols (most oftenRESTful HTTP and a single asynchronous messaging protocol like AMQP),while SOA allows for a much higher degree of heterogeneous interoperability,usually via a central enterprise service bus (ESB).
8.3.4. Threats to Validity
We need to mention several threats to validity with this research. First, thequalitative nature of the approach ties the results to the personal experienceand judgment of the authors. This weakness introduces the possibility ofsubjective bias and could limit research reproducibility. Moreover, microser-vices are much younger than SOA and can therefore not provide such anestablished foundation of principles and patterns. This could add an unevenand temporary connotation to the comparison. As already mentioned, sev-eral principles and patterns are applicable in both architectural styles oreven exist under a different name. Lastly, our results scrutinize “theoretical”evolvability. In a practical setting, software developers can create systems ofarbitrary quality in both architectural styles. The actual value of this researchrelies on how well the results can be transferred to a practical context. In itscurrent form, practitioners may have difficulties to leverage this research fordesign and implementation activities.
8.3.5. Summary
To strengthen systematic knowledge of service-oriented evolution qualities,we related 15 architectural modifiability tactics in three categories to a)principles for both SOA and microservices and b) design patterns for SOAand microservices. As an answer for RQ1, we identified 26 mappings forSOA principles, while the mapping number for microservices principles was15. In the case of patterns (RQ2), we could map ∼40% of SOA and 50%of microservices pattern candidates to tactics, thereby producing a list of
244 8 | Evolvability Patterns and Antipatterns for Service Orientation

service-based patterns that are allegedly beneficial for evolvability. Whilethe two service-based styles showed some similarities in how they achieveevolvability (loose coupling and encapsulation), we could also extract notabledifferences (e.g. standardization and governance vs. evolutionary design)that seem to be in line with the general understanding of these types ofsystems.As a result of these mapping activities and to provide a partial answer to
RQ3, we can conclude that both service-based styles have several intrinsicproperties that are beneficial for evolvability and that a wide variety ofpatterns exists for concrete realizations of the presented tactics. The maindifficulty, however, will be to summarize the essence and preconditionsof these qualities in an easily consumable form for software professionals.Follow-up research could be concerned with methods to unobtrusively and ef-ficiently use these theoretical results for practical design and implementationscenarios.
8.3 | Impact on Evolvability: Qualitative Mapping via Architectural Modifiability Tactics 245

8.4. Impact on Evolvability: Controlled Experiment andMetric-Based Analysis
One issue with design patterns is that their relationship with quality at-tributes (QAs) is often complex and governed by trade-offs. Moreover, whilethe benefits of patterns for e.g. evolvability seem plausible in theoretical andqualitative studies like the one described by us in Section 8.3, quantitativeempirical evidence for their effectiveness is more controversial. In scientificliterature, we find studies that do report a positive impact on quality at-tributes, studies that do not, and studies that do so under certain conditionsor only for selected patterns (see Section 3.5). Awareness of and familiar-ity with the concrete patterns is often discussed as a prerequisite for theireffectiveness.Since most of these studies are concerned with object-oriented or architec-
tural patterns and there is very little empirical research on service-orientedpatterns and evolvability, we conducted a controlled experiment to partiallyaddress this gap. 69 students in two groups changed and extended two func-tionally equivalent versions of a service-based webshop system (one patternversion, one non-pattern version) while the time was measured for each task.Independent of this experiment, we also collected structural maintainabilitymetrics (e.g. size, coupling, cohesion) for both system versions to have afoundation for a second comparison. We therefore summarize the researchobjective for this study in the following way:
Analyze selected service-oriented patternsfor the purpose of improving evolvability
with respect to effectiveness, efficiency, and structural metricsfrom the viewpoint of inexperienced software developers (students)
in the context of a service-based webshop system
We follow the basic structure of the reporting guidelines for experimentsin software engineering as proposed by Jedlitschka et al. [JCP08].
246 8 | Evolvability Patterns and Antipatterns for Service Orientation

8.4.1. Research Design
The research goal for our experiment was to analyze if selected service-based patterns have a significant impact on the evolvability of a system interms of the completion of modifications within a given time (effectiveness)and the time needed per modification (efficiency). The experiment objectwas a simple service-based webshop system that we specifically constructedfor this experiment1. It consists of several RESTful Java services for e.g.customers, orders, products, and notifications and a web-based frontend.Data persistence and unnecessary CRUD operations have not been fully im-plemented. As such, the system is reasonably close to a real-world webshop,but is still of manageable complexity for an experiment. The online shopdomain was chosen because most people are somewhat familiar with it frompersonal experience. Moreover, it is very common to implement such systemsin a service-oriented way.We created two functionally equivalent versions of this webshop. One
version was built in an “ordinary” way (see Fig. 8.6 and 8.7), while the otherversion was designed with several service-based patterns that are believedto be beneficial for evolvability, e.g. Process Abstraction and Service Façade(see Fig. 8.8 and 8.9). Table 8.2 lists the selected patterns together withtheir source, intended effect, and relevant task number. In general, thepattern version of the system exhibits a higher base complexity (e.g. moreservices, special patterns), but has been intentionally prepared for the natureof the task modifications through the used patterns. We chose these patternsbecause their theoretical benefit for evolvability is well documented.
1Seehttps://github.com/xJREB/research-modifiability-pattern-experiment forsource code, task descriptions, survey questions, data set, and analysis results. Zenodo mirrorfor non-source code artifacts: https://doi.org/10.5281/zenodo.3340971
8.4 | Impact on Evolvability: Controlled Experiment and Metric-Based Analysis 247

18/07/2019 draw.io
chrome-extension://pebppomjfocnoigkeepgbmcifnnlndla/index.html 1/1
OrderSrvWebUI
ProductSrv
CustomerSrv NotificationSrv
invokes
Figure 8.6.: Version #1 pre-experiment: initial architecture of non-patternversion
25/04/2019 draw.io
chrome-extension://pebppomjfocnoigkeepgbmcifnnlndla/index.html 1/1
OrderSrvWebUI
WarehouseSrv
CustomerSrv NotificationSrvinvokes
CategorySrv ProductSrv
Figure 8.7.: Version #1 post-experiment: final architecture of non-patternversion
248 8 | Evolvability Patterns and Antipatterns for Service Orientation

18/07/2019 draw.io
chrome-extension://pebppomjfocnoigkeepgbmcifnnlndla/index.html 1/1
OrderProcessSrv(Process Abstraction)WebUI
ProductSrvFacade(Service Facade)
CustomerSrv NotificationSrvinvokes
OrderSrv
ProductSrv(Decomposed Capability)
Kafka Broker
publishes
Figure 8.8.: Version #2 pre-experiment: initial architecture of pattern ver-sion
25/04/2019 draw.io
chrome-extension://pebppomjfocnoigkeepgbmcifnnlndla/index.html 1/1
OrderProcessSrv (Process Abstraction)
WebUI ProductSrvFacade (Service Facade)
CustomerSrv NotificationSrv
OrderSrv
ProductSrv
WarehouseSrvCategorySrvKafka Broker
invokes
publishes
subscribes
Figure 8.9.: Version #2 post-experiment: final architecture of pattern version
8.4 | Impact on Evolvability: Controlled Experiment and Metric-Based Analysis 249
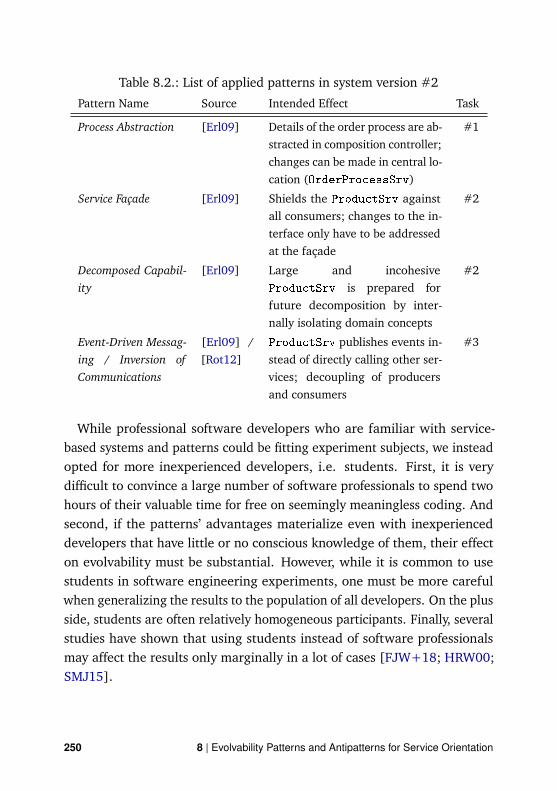
Table 8.2.: List of applied patterns in system version #2Pattern Name Source Intended Effect Task
Process Abstraction [Erl09] Details of the order process are ab-stracted in composition controller;changes can be made in central lo-cation (OrderProcessSrv)
#1
Service Façade [Erl09] Shields the ProductSrv againstall consumers; changes to the in-terface only have to be addressedat the façade
#2
Decomposed Capabil-ity
[Erl09] Large and incohesiveProductSrv is prepared forfuture decomposition by inter-nally isolating domain concepts
#2
Event-Driven Messag-ing / Inversion ofCommunications
[Erl09] /[Rot12]
ProductSrv publishes events in-stead of directly calling other ser-vices; decoupling of producersand consumers
#3
While professional software developers who are familiar with service-based systems and patterns could be fitting experiment subjects, we insteadopted for more inexperienced developers, i.e. students. First, it is verydifficult to convince a large number of software professionals to spend twohours of their valuable time for free on seemingly meaningless coding. Andsecond, if the patterns’ advantages materialize even with inexperienceddevelopers that have little or no conscious knowledge of them, their effecton evolvability must be substantial. However, while it is common to usestudents in software engineering experiments, one must be more carefulwhen generalizing the results to the population of all developers. On the plusside, students are often relatively homogeneous participants. Finally, severalstudies have shown that using students instead of software professionalsmay affect the results only marginally in a lot of cases [FJW+18; HRW00;SMJ15].
250 8 | Evolvability Patterns and Antipatterns for Service Orientation

Our experiment subjects therefore were Bachelor students (N=69) thatneeded to participate in an experiment as part of the “Introduction to Soft-ware Engineering” lecture (mostly 2nd and 3rd semesters). Students couldchoose one of two experiments based on a short description. Data collectionwas anonymous and experiment performance did not influence the students’grades. Participating in the experiment without data collection was alsopossible to pass the course. During experiment execution, students assignedthemselves randomly and unknowingly to one of the two groups by choosinga seat in the PC pool room: either the non-pattern version #1, i.e. the controlgroup, or the pattern version #2, i.e. the treatment group. As experimentmaterials, we provided students with a fully configured virtual machine inthe university PC pool room. They had documentation and task descriptionsin both digital and printed form. They were allowed to use internet searchin case of issues. We also provided a web interface with automatic tests forvalidating the completion of each of the three tasks. Students were advisedto measure their own time per task with a stopwatch of their choosing.Participants had to solve a total of three tasks that depended on each other
(see Table 8.3). In the first task, the ordering process of the webshop systemshould be adjusted (e.g. customer credit rating check) and extended withan additional process step (sending of an email via the NotificationSrv).Version #2 had been prepared with the Process Abstraction pattern so thatall changes had to be implemented in the OrderProcessSrv as opposedto in three different services like in version #1. In the second task, thelarge ProductSrv had to be decomposed into three smaller services: aProductSrv to manage only product domain entities, a CategorySrv tomanage product categories, and a WarehouseSrv for product availability.Version #2 incorporated the Decomposed Capability pattern to ease thedecomposition as well as the Service Façade pattern that shielded the formerProductSrv from consumers. In the final task, a new process in response toadding a new product to the database should be implemented (e.g. sendingout emails, adding the new product to a marketing database). Version #2provided message-based communication via an Apache Kafka broker thatallowed publishing a NewProductEvent, which implements the patterns
8.4 | Impact on Evolvability: Controlled Experiment and Metric-Based Analysis 251

Event-Driven Messaging and Inversion of Communications. Please refer to thedocumentation files per version in our GitHub repository1 for the completetask descriptions.
Table 8.3.: List of experiment tasks
Task Task Description
#1 Adjust the webshop ordering process (customer credit ratingcheck, minimum available number of products) and extend itwith an additional process step (sending of an email via theNotificationSrv).
#2 Decompose the large ProductSrv into three smaller ser-vices: a ProductSrv to manage only product domain enti-ties, a CategorySrv to manage product categories, and aWarehouseSrv for product availability.
#3 Implement a new process triggered in response to adding a newproduct to the database. The new process sends out emails andadds the new product to a marketing database.
As response variables for our experiment, we analyzed effectivenessand efficiency (duration per task). The effectiveness of a participant wasmeasured as the percentage of the three tasks he/she completed within the90 minutes, i.e. 0%, 33%, 67%, or 100%. Efficiency was recorded in secondsor as not available if the task was not completed. Median effectiveness pergroup was only calculated and tested for the total of all three tasks. For meanefficiency, we additionally also analyzed and compared every individual taskto derive the effect per pattern. While these two response variables alsodepend on the skill of the participants, they can characterize the systems’evolvability if the two groups are large enough and roughly equal in skill.The predictor variable was the group or system version (i.e. control ortreatment group). It was either #1 for the non-pattern version or #2 for thepattern version.
1https://github.com/xJREB/research-modifiability-pattern-experiment
252 8 | Evolvability Patterns and Antipatterns for Service Orientation

To formalize our research objective, we constructed five experiment hy-potheses H1i j and their respective null hypotheses H0i j , where i denotes theresearch goal identifier and j the counter if there is more than one hypothesisper goal (see Table 8.4). For effectiveness (i = 1), we have one hypothesis( j = 1), while for efficiency (i = 2), we have four (1≤ j ≤ 4, j ∈ N), namelyone per individual task and one for the complete set of tasks at once. Sincewe have five hypotheses, this also means that we need Bonferroni correctionfor the significance level of our hypothesis tests to account for the increasedprobability of type I errors. The necessary significance level α thereforeis calculated by dividing the desired significance level by the number ofhypotheses, i.e. α= 0.05/5= 0.01.The experiment execution took place in the following way. To prepare
participants for the experiment, an introductory presentation was given ona separate day (45 min). 55 of the 69 students attended (∼80%). In thissession, we explained the structure and procedure of the experiment. Wealso described the data collection and analysis process. Furthermore, anintroduction to the basic concepts of service-oriented computing and RESTfulHTTP services was given to ensure a common base level of knowledge. Lastly,we presented details about the experiment workspace (e.g. Ubuntu VM,Eclipse IDE, directory structure, build scripts, task validation).The actual experiment took place over the course of the week following
the introductory presentation in slots of 10 to 20 students. In such a slot(∼2 h), there was first a short introduction (5 min) explaining the procedureand agenda. Details of what would be measured and what data would becollected via the post-experiment survey were presented. We pointed outthat experiment performance had absolutely no influence on the grade. Datacollection would be anonymous and participant IDs could not be linkedto student IDs. Following these explanations, we asked if there were anyquestions regarding this process and if it was acceptable for everybody(verbal consent). We also specifically pointed out the option to participatein the experiment without data collection.
8.4 | Impact on Evolvability: Controlled Experiment and Metric-Based Analysis 253

Table 8.4.: Pairs of experiment hypotheses (alternative hypothesis H1i j andnull hypothesis H0i j, where i is the goal identifier and j thehypothesis counter; effectiveness: i = 1, efficiency: i = 2; Evx
is the effectiveness for version x; Dvx is the task durations forversion x; Dvx ,t y is the task durations for version x and task y)
Alternative Hypothesis Null Hypothesis
Effectiv
eness H111: More tasks for the pattern
version #2 of the system can becompleted within the given timethan for the non-pattern version#1:
H011: There is no difference inhow many tasks can be com-pleted for both versions of thesystem:
median(Ev2)> median(Ev1) median(Ev1)≈ median(Ev2)
Efficien
cy/Task
Duration
H121: It takes less time to com-plete task#1 for the pattern ver-sion #2 of the system than forthe non-pattern version #1:
H021: There is no difference inthe time it takes to completetask#1 for both versions of thesystem:
mean(Dv2,t1)< mean(Dv1,t1) mean(Dv1,t1)≈ mean(Dv2,t1)
H122: It takes less time to com-plete task#2 for the pattern ver-sion #2 of the system than forthe non-pattern version #1:
H022: There is no difference inthe time it takes to completetask#2 for both versions of thesystem:
mean(Dv2,t2)< mean(Dv1,t2) mean(Dv1,t2)≈ mean(Dv2,t2)
H123: It takes less time to com-plete task#3 for the pattern ver-sion #2 of the system than forthe non-pattern version #1:
H023: There is no difference inthe time it takes to completetask#3 for both versions of thesystem:
mean(Dv2,t3)< mean(Dv1,t3) mean(Dv1,t3)≈ mean(Dv2,t3)
H124: It takes less time to com-plete a task for the pattern ver-sion #2 of the system than forthe non-pattern version #1:
H024: There is no difference inthe time it takes to complete atask for both versions of the sys-tem:
mean(Dv2)< mean(Dv1) mean(Dv1)≈ mean(Dv2)
254 8 | Evolvability Patterns and Antipatterns for Service Orientation

After that, there was a familiarization period (15 min) during whichstudents should get comfortable with the workspace and the system byreading documentation and playing around with the IDE and the buildscripts. This period was followed by the actual task execution with timemeasurement. Participants had 90 minutes to complete all three tasks. Aweb-based evaluation application with automated tests was provided tocheck for successful task completion. Participants recorded their own timewith a stopwatch and paused upon successful validation of a task via theevaluation UI. They then notified an experiment administrator to verify thecompletion and to document the duration. The timer was then reset and thenext task began. After solving all three tasks or after 90 minutes, participantsfinally filled out a short web-based survey with questions about the perceiveddifficulty per task, personal information (e.g. course of study and semester),and their self-reported experience with e.g. Java, service-based systems,and patterns. Their participant ID and system version were also recorded torelate it to the task durations. It was not possible to identify the student byname via the participant ID, which guaranteed the anonymity of the results.Please refer to the repository for the full list of questions. After completingthis survey, participants finished the experiment slot and were allowed toleave.
8.4.2. Experiment Results
For the analysis, we first combined the documented task duration measure-ments per participant with the exported survey results via the participant ID.We then divided the resulting data set into the two groups (version #1 andversion #2) and analyzed it with descriptive statistics. Initially, we wantedto ensure that both versions had comparable characteristics and experience,which is the case in most areas (see Table 8.5).
8.4 | Impact on Evolvability: Controlled Experiment and Metric-Based Analysis 255

Table 8.5.: Group characteristics and self-reported experience (SD representsthe standard deviation; for experience questions based on the10-point ordinal scale, 1 represents “not experienced” while 10represents “very experienced”)
Group #1(no patterns)
Group #2(patterns)
Participants 36 (52%) 33 (48%)B.Sc. Business Information Systems 9 (25%) 7 (21%)B.Sc. Computer Science 4 (11%) 4 (12%)B.Sc. Software Engineering 22 (61%) 20 (61%)Other Study Programs 1 (0.03%) 2 (0.06%)Introduction Attendance 31 (86%) 24 (73%)
SemestersMean 2.36 2.45SD 1.15 1.09
Years of ProgrammingExperience
Mean 2.13 2.70SD 1.80 2.63
Java Experience (1-10)Mean 6.03 6.55SD 2.36 2.18
Web Development Experience(1-10)
Mean 3.61 4.30SD 2.86 3.19
Service-Based SystemsExperience (1-10)
Mean 1.58 2.42SD 1.30 2.68
Design Patterns Experience(1-10)
Mean 3.94 4.61SD 2.93 3.16
Service-Based PatternsExperience (1-10)
Mean 1.86 2.85SD 1.55 2.48
All Experience-RelatedAttributes (1-10)
Mean 3.41 4.15
256 8 | Evolvability Patterns and Antipatterns for Service Orientation

On average, group #1 with 36 participants and group #2 with 33 partici-pants were of roughly the same study program distribution and semester(∼2.5). When comparing programming experience and self-reported skills,group #2 seems to have been slightly more experienced. More participants ofgroup #1, however, attended the introductory presentation (∼13 percentagepoints more), a factor that was correlated with effectiveness (Kendall’s tau:0.346, p-value: 0.0019). The standard deviation for most attributes was alsosimilar in both groups and reasonably low in general (e.g. around or below3 for most 10-point ordinal scale questions). Therefore, we consider the setof participants as sufficiently homogeneous. So all in all, the two groupswere similar enough to assume equal conditions for an effectiveness andefficiency comparison with respect to the treatment, i.e. the patterns.With 1/3, median effectiveness was identical for both groups. Overall, 48
of 69 participants (∼70%) were able to solve task #1, 26 of these additionallysolved task #2 (∼38%), and only 17 participants finished all three tasks(∼25%). Roughly 30% were not able to solve any task, namely 10 out of36 for group #1 (27.8%) and 11 out of 33 for group #2 (33.3%). Theself-reported difficulty / complexity per task (1-10) was also fairly similarfor both groups. The only notable exception for this was task #3 which wasperceived as 2.61 points less difficult by pattern group #2 (6.15 vs 3.54points). When filtering only for the 17 participants who finished this task,the difference is nearly identical (2.64 points), even though the estimateddifficulty is lower (4.86 vs 2.22).When analyzing participant efficiency, i.e. duration for task completion,
we observed that the mean duration per completed task for the total of allthree tasks was about 12% lower for the pattern group #2 (00:32:45 vs.00:28:50). The analysis per individual task revealed that this is caused bytask #2 and #3: group #2 needed on average ∼22% less time for task#2and ∼51% for task#3 respectively. Task#1, on the other hand, took group#2 ∼15% more time to complete. Table 8.6 lists the detailed results for this.
8.4 | Impact on Evolvability: Controlled Experiment and Metric-Based Analysis 257

Table 8.6.: Result measures per group (SD represents the standard deviation;for difficulty questions based on the 10-point ordinal scale, 1represents “not difficult” while 10 represents “very difficult”)
Group #1(no patterns)
Group #2(patterns)
Participants thatSolved Task#1
26 (72%) 22 (67%)
Participants thatSolved Task#2
15 (42%) 11 (33%)
Participants thatSolved Task#3
7 (19%) 10 (30%)
EffectivenessMedian 1 / 3 1 / 31st Quart. 0 / 3 0 / 33rd Quart. 2 / 3 3 / 3
Reported Difficultyfor Task#1 (1-10)
Mean 3.52 3.35SD 2.26 1.92
Reported Difficultyfor Task#2 (1-10)
Mean 5.60 5.43SD 2.63 2.91
Reported Difficultyfor Task#3 (1-10)
Mean 6.15 3.54SD 2.60 2.82
Duration perIndividual Task
Mean 00:32:45 (1965 sec) 00:28:50 (1730 sec)SD 00:17:09 (1029 sec) 00:19:11 (1151 sec)
Duration forTask#1
Mean 00:30:32 (1832 sec) 00:35:10 (2110 sec)SD 00:18:41 (1121 sec) 00:22:03 (1323 sec)
Duration forTask#2
Mean 00:39:41 (2381 sec) 00:30:47 (1847 sec)SD 00:15:38 ( 938 sec) 00:12:27 ( 747 sec)
Duration forTask#3
Mean 00:26:07 (1567 sec) 00:12:45 ( 765 sec)SD 00:09:23 ( 563 sec) 00:04:32 ( 272 sec)
Duration for All 3Tasks (in total)
Mean 01:15:30 (4530 sec) 01:03:39 (3819 sec)SD 00:10:20 ( 620 sec) 00:18:18 (1098 sec)
258 8 | Evolvability Patterns and Antipatterns for Service Orientation

The next step was hypothesis testing, i.e. analyzing if the differencesbetween the groups are statistically significant so that we can reject thenull hypothesis. To prepare the selection of a suitable statistical test, wefirst used the Shapiro-Wilk test to check if our samples were non-normallydistributed. For all samples, the p-value was substantially smaller than0.05, so we had to reject the null hypothesis that our data came from anormal distribution. We therefore needed a non-parametric test that couldhandle non-normal distributions. The Mann-Whitney U test (also known asWilcoxon-Mann-Whitney test) fulfills this requirement. It checks the nullhypothesis that the probability is equal that a random value from one groupis less than or greater than a random value from another group. We used anexact implementation correcting for ties that were likely to happen for theeffectiveness test (only four different values: 0/3; 1/3; 2/3; 3/3).Since the median effectiveness of both groups is identical (1/3), the result-
ing p-value for the hypothesis test is much too large (0.5903). We thereforecannot reject H011 and have no support for H111 that more exercises can becompleted for pattern version #2. For efficiency, we first tested all threetasks at once (H124), where we identified a mean difference of about 12%.The resulting p-value of 0.0496 is barely below the 0.05 level, but sincewe need a significance level of 0.01 due to multiple hypotheses, this is stilltoo large. We therefore cannot confidently reject our null hypothesis H024,i.e. we cannot support H124 that the pattern group #2 was overall moreefficient on a statistically significant level. When performing the same testfor the three tasks individually, the resulting p-values are 0.741 (task#1),0.082 (task#2), and 0.0006 (task#3) respectively. This means that with ourBonferroni-corrected significance level of p ≤ 0.01 (desired significance leveldivided by the number of hypotheses⇒ α= 0.05/5= 0.01) we could onlyreject H023 and identify support for H123 (task#3, patterns: Event-DrivenMessaging / Inversion of Communications). A post-hoc power analysis for ouronly successful hypothesis test (i.e. the probability that the test correctlyrejected the null hypothesis) revealed that the statistical power is sufficient(0.931). As pointed out, we could not reject all other four null hypotheses(H011, H021, H022, H024).
8.4 | Impact on Evolvability: Controlled Experiment and Metric-Based Analysis 259

8.4.3. Metric Analysis
For a second comparison of the two system versions, we chose and collectedmeasurements for nine different maintainability metrics (see Table 8.7)related to structural design properties such as size, complexity, and couplingfrom the final systems (post-experiment optimal solutions, see Fig. 8.7and 8.9). Some of these metrics are pretty simple (e.g. # of Services or Linesof Code). Since several more sophisticated maintainability metrics explicitlydesigned for service orientation have been suggested in scientific literature(see Chapter 6), we also chose some of these (e.g. Service Interface DataCohesion or Absolute Dependence of the Service). All metrics (except for # ofServices) were collected per service and then aggregated to the system levelwith aggregation functions such as SUM, MEAN, or MAX. Before we describethe detailed metric results, we briefly present the selected metrics, explainour rationale for choosing them, and point out how they were collected.
Table 8.7.: List of the nine selected maintainability metrics for the analysis
Metric Name Property Source
# of Services Size –Lines of Code (LOC) Size –Weighted Service Interface Count (WSIC) Size [HCA09]LOC / WSIC Granularity –Cyclomatic Complexity (CC) Complexity [McC76]Service Interface Data Cohesion (SIDC) Cohesion [Per09]Absolute Dependence of the Service (ADS) Coupling [RSD06]Relaxed ADS Coupling –Absolute Importance of the Service (AIS) Coupling [RSD06]
8.4.3.1. Metric Definitions
In the area of size and granularity, we selected four metrics. The premisewith these metrics is that a smaller system with appropriate service gran-
260 8 | Evolvability Patterns and Antipatterns for Service Orientation

ularity (not too many services, not too large services) will be easier tounderstand and maintain. The first one was # of Services, which already is aproxy for system size and therefore does not need to be aggregated. So, if weassume unchanged granularity, fewer services are generally easier to graspand maintain. We manually derived # of Services from the final architecturediagrams. In both versions, the WebUI was counted as a service, while inthe pattern version #2, the Kafka broker was not counted as a service, as itdoes not contain custom code and is an infrastructure component.As a second metric, we selected the prevalent Lines of Code (LOC) met-
ric that we collected for each service via the static analyzer SonarQube1.We then created system-level LOC aggregates with SUM, MEAN, MEDIAN,and MAX. Since LOC is sometimes seen as controversial (e.g. if severalprogramming languages are involved), we also selected a volume metricspecifically designed for service orientation, namely the Weighted ServiceInterface Count (WSIC) by [HCA09]. WSIC represents the count of publiclyavailable operations in a service interface with possible weights for differenttypes of operations (e.g. synchronous and asynchronous). We used thestandard weight of 1, which is the same as # of Operations. We automaticallyderived values for WSIC from the existing OpenAPI2 files using the RAMACLI (see Section 6.3). Like LOC,WSIC was also aggregated with SUM,MEAN,MEDIAN, and MAX.To gain further granularity-related insights in addition to the means and
medians of our two volume metrics, we also calculated their ratio, i.e. LOC/ WSIC. For a given service, this represents the number of lines of codes thatare on average necessary to provide a single operation. Larger values forLOC / WSIC mean a service has large and potentially complex operations.This metric was aggregated with MEAN, MEDIAN, and MAX.
As a measure for complexity, we selected Cyclomatic Complexity (CC)from [McC76] as a traditional source codemetric. While some suggestions forservice-based complexity metrics like Response for Operation (RFO) [PRFT07]
1https://www.sonarqube.org2https://github.com/OAI/OpenAPI-Specification
8.4 | Impact on Evolvability: Controlled Experiment and Metric-Based Analysis 261

or Message Entropy (ME) [MZM+17] exist, tool support for their collectionis not available and they are hard to calculate manually. Despite its criti-cisms [OW14], we therefore relied on the widely used CC metric that wegathered for each service via SonarQube. We then subsequently aggregatedthe values with MEAN, MEDIAN, and MAX. Lower values for CC suggest thata service is easier to understand and maintain.
In the context of cohesion, we chose the Service Interface Data Cohesion(SIDC) metric proposed by [Per09]. SIDC rates the cohesion of a serviceinterface in percent based on the input and response parameter data typesof its operations. If a service interface operates on the same or only a smallset of data abstractions (e.g. CRUD operations for a Customer entity), thevalues for SIDCwill be closer to 100% and the service will be easier to analyzeand change. We used the already mentioned RAMA CLI to automaticallycalculate the percentage values for SIDC. These values were then aggregatedwith MEAN, MEDIAN, and MIN (as lower values are worse).
The last maintainability-related design property that we wanted to mea-sure was coupling. In the service-oriented space, “loose coupling” is a preva-lent theme aiming to reduce the number and strength of service dependenciesand therefore preventing or mitigating ripple effects on changes [PW09].We therefore chose three metrics to analyze the degree of coupling in bothversions, where lower values mean less coupling and therefore increasedmaintainability. We manually derived all coupling metrics from the finalarchitecture diagrams that also include the dependencies between services.Moreover, we used the same aggregations for all of them, namely MEAN,MEDIAN, and MAX.First, we selected the Absolute Dependence of the Service (ADS) metric
proposed by [RSD06]. For a given service, ADS represents the number ofother services that this service depends on, i.e. of which it invokes at leastone operation. For pattern version #2, dependencies to the Kafka brokerwere counted as well. Since ADS treats every static dependency exactlyin the same way, we also collected values for an adjusted variant of ADS
262 8 | Evolvability Patterns and Antipatterns for Service Orientation

that respects looser types of coupling. In that sense, Relaxed ADS workslike ADS, except that dependencies to a Service Façade or the Kafka brokerwere counted with 0.5 instead of 1. The rationale for this was that thesetwo patterns are introduced as intermediaries to reduce coupling. As aconsequence, dependencies to them should not be weighted in the same wayas direct invocations of services. In version #1 of the system, the values forRelaxed ADS are therefore the same as for ADS. Only in the pattern version#2, the values for the two variants differ.The third and last coupling metric, also proposed by [RSD06], is comple-
mentary to ADS, namely the metric Absolute Importance of the Service (AIS).For a given service, AIS represents the number of other services that havea dependency on this service, i.e. that invoke at least one of its operations.Since the invocation origin is irrelevant, we did not gather a Relaxed AISvariant.
8.4.3.2. Metric Results
To compare the two system versions, we only present the aggregated system-level metrics in this section (see Table 8.8). For a detailed comparison ofthe underlying service-level metrics, please refer to the metric evaluationspreadsheet in our repository1 that includes the measurements for eachservice.When comparing the system-level metrics for size, we immediately see that
pattern version #2 is larger. It has two more services (OrderProcessSrvand ProductSrvFaçade) and therefore consists of ∼29% more LOC and∼47% more operations. Even though the Kafka broker is also new in version#2, we did not count it as a service. While MEAN and MEDIAN for the sizemetrics are only slightly worse or stay roughly the same in version #2, theMAX value for WSIC increases by ∼33% (from 9 to 12 operations). Thisincrease is caused by the newly introduced ProductSrvFaçade that relayscalls to the ProductSrv, CategorySrv, and WarehouseSrv. Lastly, the
1https://github.com/xJREB/research-modifiability-pattern-experiment/blob/master/_results/metric-analysis.xlsx
8.4 | Impact on Evolvability: Controlled Experiment and Metric-Based Analysis 263

Table 8.8.: System-level metric results per version (Change in % refers to thechange of the metric value from V1 to V2; a positive percentagemeans V1 is better, a negative one means V2 is better; in caseswith a change of at least 15%, the better version is marked witha colored background)
Metric Aggregate Version #1(no patterns)
Version #2(patterns)
Change in %
# of Services – 7 9 28.6 %
LOC
SUM 2555 3303 29.3%MEAN 365 367 0.5%MEDIAN 324 362 11.7%MAX 591 668 13.0%
WSIC
SUM 32 47 46.9%MEAN 5.33 5.88 10.2%MEDIAN 5 5 0.0%MAX 9 12 33.3%
LOC / WSICMEAN 79.09 105.77 33.7%MEDIAN 77.33 71.73 -7.2%MAX 112.40 373.00 231.9%
CCMEAN 48.57 48.44 -0.3%MEDIAN 50.00 48.00 -4.0%MAX 93 100 7.5%
SIDCMEAN 0.370 0.374 -1.2%MEDIAN 0.40 0.40 0.0%MIN 0.16 0.16 0.0%
ADSMEAN 1.57 1.56 -1.0%MEDIAN 1 1 0.0%MAX 5 4 -20.0%
Relaxed ADSMEAN 1.57 1.28 -18.7%MEDIAN 1 0.5 -50.0%MAX 5 3.5 -30.0%
AISMEAN 1.57 1.22 -22.2%MEDIAN 1 1 0.0%MAX 3 3 0.0%
264 8 | Evolvability Patterns and Antipatterns for Service Orientation

introduction of the OrderProcessSrv in version #2 impacted the LOC /WSIC ratio. While the MEDIAN is slightly better for version #2 (∼7%), boththeMEAN value (∼34%) and theMAX value (∼232%) are worse. The reasonfor this is that the OrderProcessSrv provides only a single operation whilesimultaneously consisting of slightly above average LOC.For both complexity and cohesion, our chosen metrics do not show many
differences between the two versions. CC aggregates are very similar, withthe only notable difference being a slightly larger MAX value (∼8%) forversion #2. This is caused by adding the messaging functionality to theNotificationSrv. Aggregates for SIDC are even more similar, whichsuggests that the patterns at hand do not influence service cohesion all thatmuch.The only design property that seems slightly better in pattern version #2
is coupling. While the MEAN and MEDIAN aggregates of ADS stay the samein both versions, the MAX value in version #2 has been reduced by 20%:the ProductSrvFaçade shields the services behind it so that the WebUI
has one dependency less (four instead of five). If we treat looser forms ofcoupling differently, version #2 improves even further. For Relaxed ADS, allaggregates are better in the pattern version (MEAN by ∼19%, MEDIAN by50%, and MAX by 30%) because the Kafka broker and ProductSrvFaçadereduce the weight of service dependencies. Finally, even though the MEDIANand MAX aggregates for AIS are the same in both versions, the MEAN valueis improved by ∼22% in version #2. This improvement is caused by theEvent-Driven Messaging / Inversion of Communications patterns. The Kafkabroker does not actively call services, but services have to publish or subscribeto it. Therefore, the SUM values for ADS and AIS would also be different inversion #2, even though they would be the same in version #1.
8.4.4. Discussion
From the experiment results, we could not derive support for the majorityof our hypotheses that service-based patterns had a positive impact on par-ticipant effectiveness and efficiency. The mean difference in duration was
8.4 | Impact on Evolvability: Controlled Experiment and Metric-Based Analysis 265

only significant for task#3 in isolation. We offer three main interpretationsto explain these results. One straightforward possibility is that the patternsof task#1 (Process Abstraction) and task#2 (Service Façade and DecomposedCapability) were simply not effective enough to enhance the modifiabilityof the system under test. Their theoretical benefit for the chosen evolutionscenario did not (or only partially) translate to a practical setting. OnlyEvent-Driven Messaging / Inversion of Communications from task#3 led to asignificant advantage for the system’s evolvability. While this seems plau-sible at first sight and our chosen patterns may undoubtedly differ in theireffectiveness, we believe that our second and third interpretations are morelikely.Another explanation for the results may be that the effect of familiarization
and experience was stronger for the pattern version #2. As they progressedthrough the tasks, participants naturally grew more accustomed to thesystem and workspace environment. Since the pattern version #2 exhibiteda higher base complexity (more services, more inter-service communication,more build scripts to start before task validation), participants of this groupwere initially slowed down more than the control group. Throughout theexperiment, they gradually adjusted to this so that the effectiveness ofthe chosen patterns for the evolution scenario could unfold (slightly intask#2 and entirely in task#3). This effect could have been weakened byrandomizing the order of tasks per participant. Unfortunately, this was notpossible because tasks depended on each other.We also offer a third possible explanation in conjunction with the familiar-
ization effect. The patterns’ effect on evolvability seems to have been influ-enced by whether participants had conscious knowledge of and experiencewith patterns beforehand. When we analyzed existing correlations betweeneffectiveness and self-reported experience-related factors, we observed thatboth knowledge of general design patterns as well as service-oriented pat-terns was more strongly correlated with effectiveness in the pattern group#2 than in group #1: about 19% more for general patterns (Kendall’s tau:0.485 vs 0.579) and about 242% more for service-oriented ones (r-values:0.093 vs 0.318). Years of programming experience, for example, was simi-
266 8 | Evolvability Patterns and Antipatterns for Service Orientation

larly correlated with effectiveness in both groups (r-values: 0.509 vs 0.497).So using students instead of experienced professionals who have workedwith patterns before seems to have hurt treatment group #2 more. Thepotential modifiability-related benefit of a pattern may be lessened or evennegated by its complexity and impact on understandability if the participantis not familiar with the pattern. Potential support for this can be found bynarrowing down the sample for both groups to only the best participants.When we filter for only the 26 students that solved at least task#1 andtask#2 (effectiveness >= 67%), the mean efficiency difference increases:instead of ∼12%, participants of pattern group #2 now needed ∼31% lesstime per task.Overall, the results suggest that the theoretical evolvability-related ad-
vantage of service-oriented patterns is difficult to replicate in controlledexperiments: familiarity with the system and experience with the selectedpatterns seem to have an impact on the patterns’ effectiveness. For inexpe-rienced developers unfamiliar with the system, the additional complexityintroduced by the patterns seems to reduce or even outweigh the theoreticalpositive effect on evolvability. Implications of such a conclusion could bethat appropriate documentation of used service-oriented patterns as wellas thorough pattern-focused initial training of new developers become allthe more critical to ensure a long-term and sustainable effect of patterns onsoftware evolvability.
Concerning the metric analysis, we observed that the pattern version #2 isworse in the area of size and granularity and better for coupling. The patternsdid not impact our chosen complexity and cohesion metrics. When countingonly changes in metric values of at least 15%, version #1 is superior for sixsize and granularity aggregates (# of Services, LOCSU M , WSICSU M , WSICMAX ,LOC / WSICM EAN , and LOC / WSICMAX ), while version #2 is better for fivecoupling aggregates (ADSMAX , Relaxed ADSM EAN , Relaxed ADSM EDIAN , RelaxedADSMAX , and AISM EAN ). However, three of these five improvement areas forversion #2 are aggregates of Relaxed ADS, a metric that we specificallyconstructed for the loose coupling nature of the used patterns. Without
8.4 | Impact on Evolvability: Controlled Experiment and Metric-Based Analysis 267
Relaxed ADS, the pattern version would only be significantly better for twocoupling aggregates (ADSMAX and AISM EAN ).All in all, the comparison of structural metrics showed no decisive main-
tainability improvements in the pattern version, which seems to be in linewith the experiment results. The increased system size and slightly worsenedgranularity in version #2 may support our interpretation that it took longerin this group until the familiarization effect kicked in. More services andoperations meant that participants were potentially under higher cognitiveload and required more effort to get familiar with the system. Lastly, the par-tially improved coupling measurements in the pattern version could explainwhy participants in this group required less time for task#2 and especiallytask#3: these tasks relied on the patterns Service Façade and Event-DrivenMessaging, which are both related to decoupling.
8.4.5. Threats to Validity
Threats to validity have to be examined in several areas of this empiricalstudy. With respect to construct validity, our operationalized experimentmeasure (namely the time necessary to implement a feature) seems validto represent the construct in a practical real-world setting. Efficiency isone of the most used measures for software engineering experiments and,in contrast to maintainability metrics for e.g. coupling and cohesion, itis not a structural approximation of this quality attribute. Effectiveness,i.e. the degree to which participants solved all tasks within the given timeframe, is a similarly popular measure in software development, even thoughefficiency is more relevant in a real-world industry setting. Most often, itis not the question, if something can be implemented, but how long it willtake. Lastly, the results of the metric analysis rely on the maintainabilityprediction quality of the chosen metrics. Several of these metrics (e.g. LOCor CC) are well-known and have been extensively studied, but especiallysome of the younger service-oriented metrics have not been evaluated inor accepted by large-scale industry environments. So, while the chosendesign properties seem very fitting for a service-oriented context, the metrics
268 8 | Evolvability Patterns and Antipatterns for Service Orientation

selected to represent them may be of differing quality. Similarly, only alimited number of metrics was analyzed and there is always the possibilityfor more or different metrics.
Internal validity is concerned with how much the treatment was responsi-ble for the observed effect and if there were unknown factors that influencedthe results. During the experiment discussion, we already mentioned theobserved impact of the participants’ pattern knowledge on the effectiveevolvability of the patterns. A possible solution to this could have been toonly accept participants with a base-level of pattern experience or to includea small lecture on service-oriented patterns in the introductory presentation.We also already described the familiarization effect for later tasks, whichmakes it harder to analyze the effectiveness of each pattern. Task random-ization as a solution to this was not possible because the task order wasimportant in the constructed evolution scenarios.Furthermore, we required participants to use the provided experiment
workspace via a virtual machine. While most students should be somewhatfamiliar with Eclipse, their preferred IDE, OS, or build tool may be differentfrom the provided environment. This could have hindered their developmentspeed. We have to assume that this effect was similar for each group andtask. Moreover, participants were allowed to ask questions if they were notrelated to the actual coding, but to the experiment environment (e.g. IDE,build tool, and evaluation UI).A last potential threat in this area is the general coding ability of partici-
pants that may tamper with the results: students that are very slow / fast ingeneral work with similar speed regardless of the group. Since participantsonly worked on one version in our experiment, an uneven distribution of veryslow / fast students could have affected the groups’ mean efficiency. Whileour population of 69 has a smaller risk to be influenced by this than e.g.20 participants and our post-experiment survey did not reveal significantexperience differences between the groups, the self-reported nature of thecomparison still leaves some room for issues. Possible solutions could havebeen to conduct a pilot evaluation study with the participants to divide them
8.4 | Impact on Evolvability: Controlled Experiment and Metric-Based Analysis 269

into two groups of similar skill or to let participants work on tasks from bothgroups in a rotating manner. We did not use both solutions because of timeand effort constraints.Concerning the metric analysis, we relied on the correctness of the col-
lected measurements. More complex metrics were gathered automaticallywith tool support, while simple metrics were manually derived (e.g. fromarchitecture diagrams) and double-checked across researchers. Even thoughit is not very likely, there remains the slight possibility of incorrect metricvalues that may have clouded the analysis.
External validity refers to the generalizability of the results to the targetpopulation and setting. While the usage of students may be a valid proxyfor the desired target population in many cases, our experiment was verychallenging for Bachelor students. Only ∼25% solved all three tasks and∼30% could not solve any task. We also hypothesize that the missing degreeof pattern experience influenced the treatment group’s effectiveness andefficiency. Therefore, we expect that a replication with experienced softwareprofessionals from industry would yield different results. However, such areplication with a sufficient number of participants is very complicated toorganize.We created both versions of the webshop system as close to the real-world
as possible. Nonetheless, controlled experiment tasks are still inherently of asomewhat artificial nature with the potential for subjective bias. The experi-ment results are also bound to the used programming language (Java) andservice-based communication style (RESTful HTTP). Moreover, we designedthe tasks with the intuitive feeling that the pattern version #2 might be fasterto change because the patterns are ideally suited for the changes at hand.The benefit of a pattern will always heavily depend on the specifics of theperformed evolution scenario. In conjunction with this, developers are usu-ally decently familiar with the system that they extend. So, in a real-worldsoftware maintenance scenario, the benefits of evolvability mechanisms andpatterns often manifest over a long time with increasing developer familiaritywith the system.
270 8 | Evolvability Patterns and Antipatterns for Service Orientation

The artificial construction of the two system versions may also have im-pacted the reliability of the metric-based analysis. After all, we evaluatedthe internal quality of artifacts that were created by ourselves, which leavespossibilities for researcher bias. To mitigate these threats, external researchassistants performed the metric collection and the final set of metrics wasnot known during the system construction period. Nonetheless, using severalexisting industry or open source systems for the metric-based analysis ofpatterns would have provided more objective results. In the case of our study,however, the goal of the evaluation with metrics was to provide a secondperspective on the two experiment system versions.Lastly, one must be very careful to generalize from the results of four
patterns, 69 student participants, and nine metrics to all patterns and soft-ware developers. The controlled experiment presents first empirical insightsfor the evolvability of selected service-oriented patterns with inexperiencedhuman participants, while the metric study provides additional structuralinsights that aim to further the understanding of the patterns’ effects. How-ever, many more similar studies should follow to either support or reject theconclusions of this research.
8.4.6. Summary
Our interpretation of these results is that we have no clear indication thatthree of the four selected service-based patterns were beneficial for evolv-ability. We theorize, however, that the additional volume introduced by thepatterns hindered participants to leverage their modifiability-related benefitsat first, which seems to be supported by the size and granularity metrics.Throughout the experiment, participants became more and more familiarwith the system and the patterns, which allowed the treatment group to geta slight edge in task #2 and finally produced full statistical significance intask #3. These results implicate that documentation and training of usedservice-based patterns should not be neglected in software maintenance andevolution scenarios.With respect to possible future work, we already mentioned the lack of
8.4 | Impact on Evolvability: Controlled Experiment and Metric-Based Analysis 271

quantitative empirical research on service-oriented patterns and qualityattributes (in our case evolvability). It is therefore necessary that futureresearch provides additional support in this area. Many patterns for SOA andalso some for microservices are available and one study can only cover somany of them. Moreover, additional research could also aim to confirm andquantify the impact of developers’ pattern experience on the effectivenessof the patterns. Additionally, the metric-based analysis of patterns could beextended to existing industry or open source systems to mitigate the con-struction bias. As an alternative, several practitioners or external researcherscould implement systems with these patterns to allow for a more objectiveanalysis. To support such endeavors and to enable potential replicationstudies, we shared all artifacts related to the experiment and metric analysison GitHub1 and Zenodo2 (source code, task descriptions, survey questions,result data sets, analysis script).
1https://github.com/xJREB/research-modifiability-pattern-experiment2https://doi.org/10.5281/zenodo.3340971
272 8 | Evolvability Patterns and Antipatterns for Service Orientation

8.5. Service-Based Antipatterns: Systematic Literature Review
The earliest software antipatterns were focused on source code [Fow99]. To-day, code smells and object-oriented design smells are arguably still the mostknown antipatterns and several tools like SonarQube [CP13] exist for theirdetection. Their importance and origin are fairly well understood [TPB+15;YM13]. In the area of service-oriented computing, however, the concept isnot as cohesive. Instead, antipatterns are scattered across the two differentservice-based architectural styles service-oriented architecture (SOA) andmicroservices or implementation techniques like web services. While severalantipattern related publications exist for SOA and also for microservices (seeSection 3.5), a holistic repository containing the majority of service-basedantipatterns does not exist. Even though many SOA antipatterns may not beapplicable to a microservice-based system, we believe that there is still muchvalue to be gained from a general service-based view on antipatterns. Someantipatterns may apply for both SOA and microservices, while others mayfurther the understanding of differences between them. The context andorigin of the antipatterns become especially important in this regard. All inall, such a holistic repository would be a valuable source for researchers andpractitioners that makes it easy to browse, compare, and discover relationsbetween antipatterns. It could be used as a common point of reference, forcontinuous quality assurance activities like architectural reviews, and thetraining of novice developers.The identified publication that comes closest to such an objective is the
extensive systematic literature review (SLR) from Sabir et al. [SPR+19]who covered both object-oriented and service-oriented antipatterns. They fo-cused specifically on antipattern detection approaches suggested in scientificliterature and how these approaches evolved. However, they also createdlists of antipatterns as a byproduct of their analysis. While they discovered56 object-oriented smells, they identified only 19 service-based smells. Theyconclude with the following: “As the software concept has already divertedinto the Web era that is service based, researchers should put more effort onservice-oriented smells to ensure high-quality service-based systems.”
8.5 | Service-Based Antipatterns: Systematic Literature Review 273

In summary, we identified the following issues with the existing scientificliterature on service-based antipatterns:
• The described antipatterns are scattered across many different publi-cations with very little links between e.g. SOA, microservices, REST,or SOAP. This distribution makes it difficult to categorize them and toform relationships between them.
• Researchers do not use consistent names and schemas to describe theantipatterns, which makes it more difficult to compare them. In severalcases, there is only a short description, but no context or solution.
• In short: we lack a holistic repository and taxonomy for the majorityof service-based antipatterns.
To provide a solid foundation to address this gap, we conducted a researchproject that can serve as a reference for scientific follow-up activities in thisarea. The following research questions served as guidance for it:RQ1: What service-based antipatterns are described in scientific literature?RQ2: How can these antipatterns be documented in a common data
structure?RQ3: How can these antipatterns be categorized with a holistic taxonomy?RQ4: What is a feasible collaborative repository to browse and extend the
created antipatterns collection?
8.5.1. Research Design
Our study consisted of three major steps. First, we conducted an SLR tocollect the majority of service-based antipatterns as an answer to RQ1. Wedescribe the details of this process below and present its results in Sec-tion 8.5.2.1. In a second step, we analyzed the identified antipatterns,merged duplicates with different names, and synthesized a standardizeddata model for their structured documentation (RQ2). This model was thenused to document each antipattern from the included primary studies in aholistic collection. Likewise, we created a taxonomy for the categorization
274 8 | Evolvability Patterns and Antipatterns for Service Orientation

of the documented antipatterns and implemented links between relatedantipatterns (RQ3). We describe the results of this step in Section 8.5.2.2.In the third and last step, we developed a web application for the convenientbrowsing of the created antipatterns collection. The app includes functional-ity like full-text search, sorting, filtering by category, and navigating betweenrelated antipatterns. By relying on a collaborative GitHub repository1 andGitHub Pages2, we also implemented a workflow for changing and extend-ing the preliminary collection, therefore providing an answer to RQ4 (seeSect. 8.5.2.3).As a general framework, we followed the guidelines described by Kitchen-
ham and Charters [KC07] to plan and conduct our SLR. For transparencyand replicability, all related artifacts can be found in our GitHub repository3.An essential part of the search strategy are keywords, which have to
support the creation of an effective search string. Our research focuses ona combination of two parts, namely a) antipatterns and bad smells andb) service- and microservice-based systems. Therefore, the keywords “badsmell”, “antipattern”, “services” and “microservices” were the first to beincluded. Based on our initial literature sighting, we selected five moresuitable keywords. Lastly, we also added “pattern” as a keyword, sinceliterature about patterns often includes sections describing antipatterns aswell. Fig. 8.10 contains the used list of keywords ranked by their priority.
1https://github.com/xJREB/service-based-antipatterns2https://xjreb.github.io/service-based-antipatterns3https:
//github.com/xJREB/service-based-antipatterns/tree/master/slr
8.5 | Service-Based Antipatterns: Systematic Literature Review 275

1. antipattern
2. bad smell
3. services
4. microservices
5. web services
6. service oriented architecture
7. soa
8. service oriented computing
9. pattern
Figure 8.10.: List of search keywords
For the creation of the search string, we split our keywords into two buck-ets. One contained the keywords “antipattern”, “bad smell”, and “pattern”while the second one contained all remaining keywords. Each bucket wasrepresented as an OR relation of its keywords, while the complete searchstring was an AND relation between the two buckets (see Fig. 8.11).
(antipattern ∨ bad smell ∨ pattern) ∧ (microservices ∨ services ∨web services ∨ service oriented architecture ∨ soa ∨ service orientedcomputing)
Figure 8.11.: Created search string
Concerning search engines and digital libraries, we used four of themost common libraries for software engineering related topics, namely IEEEXplore, ACM Digital Library, Springer Link, and Science Direct. Additionally,we used Google Scholar as a general search engine for publications. This list
276 8 | Evolvability Patterns and Antipatterns for Service Orientation

(see Fig. 8.12) aimed to ensure unbiased coverage across multiple populardigital libraries.
• Google Scholar: https://scholar.google.com
• IEEE Xplore: https://ieeexplore.ieee.org
• ACM Digital Library: https://dl.acm.org
• Springer Link: https://link.springer.com
• Science Direct: https://www.sciencedirect.com
Figure 8.12.: Used search engines and digital libraries
Due to differences in the APIs of the chosen search engines, the searchstring was initially not confined to specific attributes like the title or theabstract. However, after retrieving the initial set of publications, severalfiltering stages were applied. In the first two stages, we used inclusioncriteria to narrow down the field of publications with relevant content. Wedefined that the title of any identified publication had to include at leastone of the key terms “antipattern”, “bad smell”, or “pattern”. If this rulematched via the term “pattern”, the title additionally had to include atleast one service-oriented keyword from our second bucket, i.e. “services”,“microservices”, “web services”, “service oriented architecture”, “soa”, or“service oriented computing”. This was automated with a script in an Excelspreadsheet. As a second content filter, publications had to include one ofthe key terms “antipattern” or “bad smell” in their abstract, table of contents,or conclusion. Several researchers shared this manual activity.After these content filter stages, we filtered for quality via exclusion
criteria that required manual analysis of large parts of each publication.We defined that a publication must have a consistent and structured wayof describing the presented antipatterns. Furthermore, we also excludedpublications that mention antipatterns without providing a description
8.5 | Service-Based Antipatterns: Systematic Literature Review 277

or context. Lastly, a publication was excluded if the antipattern descrip-tion did not cover at least one of the attributes solution, detection, orcause. This filtering ensured basic quality and rigor for the final collectionof antipatterns and also enabled us to conveniently process and extract theinformation for our repository.As a last stage, we performed one level of snowballing [KFD17] in both
directions for all primary studies that had been included so far, i.e. for eachincluded publication, we analyzed its references and research that citedit. The same inclusion and exclusion criteria were applied. This citationsearch ensured that important publications that we may have missed withour selection of search engines and terms were discovered nonetheless.
8.5.2. Results
In the following sections, we present and discuss the detailed results. We startwith the list of primary studies identified by the SLR and the extracted service-based antipatterns. After that, we describe the synthesized antipattern datastructure and taxonomy. Lastly, we provide details about the created webapplication and collaborative antipattern repository.
8.5.2.1. SLR Results (RQ1)
As detailed in the SLR protocol (see Sect. 8.5.1), we first retrieved a set of757 publications from the selected search engines and libraries. This setwas then filtered via the automatic title keyword search leaving us with 239publications. These were now manually filtered via the keyword inclusioncriteria for abstract, table of contents, and conclusion, which further reducedthe set to 45 publications. In the third filtering phase, we manually assessedthe quality and excluded studies with an inconsistent schema or that missedimportant attributes, which left us with 13 publications. For these 13 studies,we then performed snowballing, which yielded one additional publicationthat we missed with our previous search. Fig. 8.13 summarizes this processand the number of publications in each stage. Table 8.9 lists the final result of
278 8 | Evolvability Patterns and Antipatterns for Service Orientation

our SLR, namely the 14 primary studies. Publication years ranged from 2002up to 2018 and the studies had 11 different first authors. We then extractedthe antipatterns from these publications and tried to eliminate duplicatesthat are known under different names. All in all, we finally collected 36service-based antipatterns as listed in Table 8.10.���������� �����
���������������������������� ����������� ������������������� ���
�� !"#$%#&'()* ++,'-
�� !"#.%#/0 +,12#3,+1"4,'-
�� !"#5%#6*!14 718#9(:8#:('7+0!,('#3,+1"4,'-
�� !"#;%#9,1+"#3,+1"4,'-
<',1, +#&" 47�#="!0+1!
;$#>0*+,7 1,('!
;.#>0*+,7 1,('!
$?#>0*+,7 1,('!
5.@#>0*+,7 1,('!
A?A#>0*+,7 1,('!
B?;C
B;@$
B.5
D;
Figure 8.13.: SLR process with the number of publications at each stage
8.5.2.2. Antipattern Schema and Taxonomy (RQ2 & RQ3)
While the specification and documentation of patterns usually rely on acommon format with well-known attributes (“Alexandrian form” [AIS77]),the same does not equally apply for antipatterns. Even though some at-tributes like context or description are useful for the documentation ofboth concepts, antipatterns can additionally benefit from new attributes likecause or detection. During our initial antipattern literature sighting, wetherefore started the definition of a general schema for the documentationof antipatterns that included all essential attributes to grasp the antipattern
8.5 | Service-Based Antipatterns: Systematic Literature Review 279

Table 8.9.: Final list of the 14 primary studies identified by the SLRReference Year Authors Title # of Anti-
patterns
[DAKW03] 2002 Dudney etal.
J2EE antipatterns 7
[Jon06] 2006 Jones SOA anti-patterns 4[KZ07] 2007 Král and
ŽemličkaThe most important service-oriented antipatterns
5
[KŽ09] 2009 Král andŽemlička
Popular SOA antipatterns 4
[GPEM09] 2009 Garcia etal.
Toward a catalogue of archi-tectural bad smells
4
[Rot12] 2012 Rotem-Gal-Oz
SOA patterns 4
[NMV13] 2013 Nayrolleset al.
Improving SOA antipatternsdetection in Service BasedSystems by mining executiontraces
5
[AAC14] 2014 de An-drade etal.
Architectural bad smells insoftware product lines: An ex-ploratory study
4
[PMTG14] 2014 Palma etal.
Specification and detection ofSOA antipatterns in web ser-vices
6
[PM15] 2015 PalmaandMohay
A study on the taxonomy ofservice antipatterns
15
[OGKI15] 2015 Ouni etal.
Web service antipatterns de-tection using genetic program-ming
5
[Ric16a] 2016 Richards Microservices Antipatternsand Pitfalls
1
[OKIC17] 2017 Ouni etal.
Search-based web service an-tipatterns detection
7
[TL18] 2018 Taibi andLenar-duzzi
On the Definition of Microser-vice Bad Smells
6
280 8 | Evolvability Patterns and Antipatterns for Service Orientation

Table 8.10.: Final list of the 36 service-based antipatterns extracted fromthe primary studies (alphabetical order)
Antipattern Name Sources
Ambiguous Interface [AAC14; GPEM09]Ambiguous Service [OGKI15; OKIC17; PM15; PMTG14]API Versioning [TL18]Big Bang [KŽ09]Bloated Service [PM15]Bottleneck Service [NMV13; PM15]Business Process Forever [KZ07]Chatty Service [NMV13; OGKI15; OKIC17; PM15; PMTG14]Client Completes Service [DAKW03]Connector Envy [AAC14; GPEM09]CRUDy Interface [OKIC17; PM15]Cyclic Dependency [TL18]Data-Driven Migration [Ric16a]Data Service [OGKI15; OKIC17; PM15; PMTG14]Duplicated Service [Jon06; PM15; PMTG14]Extraneous Adjacent Connector [AAC14; GPEM09; PM15]Golden Hammer [DAKW03]Hard-Coded Endpoints [Jon06; TL18]Low Cohesive Operations [PM15]Megaservice [DAKW03; NMV13; OGKI15; OKIC17; PM15; PMTG14;
TL18]Nanoservices [DAKW03; KŽ09; NMV13; OGKI15; OKIC17; PM15;
PMTG14; Rot12]No Legacy [KZ07]Nothing New [KŽ09; Rot12]On-Line Only [KZ07]Overstandardized SOA [KZ07; KŽ09]Sand Pile [KZ07; PM15]Scattered Parasitic Functionality [AAC14; GPEM09]Service Chain [Jon06; NMV13]Shared Persistency [TL18]The Shiny Nickel [Jon06]Silver Bullet [DAKW03]SOAPY Business Logic [DAKW03]Stovepipe Service [DAKW03; PM15]The Knot [NMV13; PM15; Rot12]Transactional Integration [Rot12]Wrong Cuts [TL18]
8.5 | Service-Based Antipatterns: Systematic Literature Review 281

and enabled categorization and relationships. Inspired by the Alexandrianform for patterns as well as popular antipattern literature, we then iterativelyrefined this schema with the SLR results until we had a holistic data modelto document all necessary aspects of the identified antipatterns. Table 8.11describes the complete set of attributes we used to uniformly document theantipatterns. Since the extensiveness of antipattern documentation variesdepending on the source, it is also possible to leave attributes empty exceptfor the name, description, and the list of sources.Because the repository should be machine-readable and we also wanted to
provide a web application, we chose JSON as a data format representation.Other considered candidates were XML and YAML, but in the end, we selectedJSON because it is readable by humans and can be natively used in JavaScript.For each identified antipattern, we created and filled out a JSON file withthe same structure (see Fig. 8.14).
282 8 | Evolvability Patterns and Antipatterns for Service Orientation
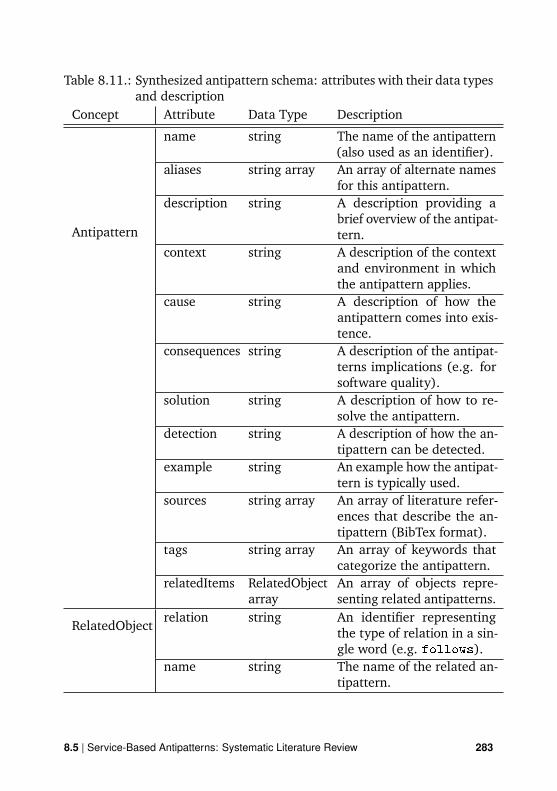
Table 8.11.: Synthesized antipattern schema: attributes with their data typesand description
Concept Attribute Data Type Description
Antipattern
name string The name of the antipattern(also used as an identifier).
aliases string array An array of alternate namesfor this antipattern.
description string A description providing abrief overview of the antipat-tern.
context string A description of the contextand environment in whichthe antipattern applies.
cause string A description of how theantipattern comes into exis-tence.
consequences string A description of the antipat-terns implications (e.g. forsoftware quality).
solution string A description of how to re-solve the antipattern.
detection string A description of how the an-tipattern can be detected.
example string An example how the antipat-tern is typically used.
sources string array An array of literature refer-ences that describe the an-tipattern (BibTex format).
tags string array An array of keywords thatcategorize the antipattern.
relatedItems RelatedObjectarray
An array of objects repre-senting related antipatterns.
RelatedObject relation string An identifier representingthe type of relation in a sin-gle word (e.g. follows).
name string The name of the related an-tipattern.
8.5 | Service-Based Antipatterns: Systematic Literature Review 283

{
"name": "",
"aliases": [""],
"description": "",
"context": "",
"detection": "",
"consequences": "",
"cause": "",
"solution": "",
"example": "",
"sources": [""],
"tags": [""],
"relatedItems": [
{
"relation": "",
"name": ""
}
]
}
Figure 8.14.: JSON representation of an antipattern
As a second important concept, we wanted to provide a holistic taxonomyfor the categorization of the identified antipatterns. Such a categorizationhelps to organize the collection and enables the grouping of antipatterns byimportant criteria. In the created JSON schema, the flexible tags array canbe used for the taxonomy implementation. Palma et al. [PM15] proposedsuch a taxonomy that is focused on antipattern detectionmechanisms. On thefirst level, they distinguish between intra-service and inter-service antipatternsand on the next level between dynamic and static detection approaches. Thistaxonomy is, however, limited when it comes to organizing and grasping anextensive collection. Therefore, we instead followed the approach of Král andŽemlička [KZ07] who categorized patterns by the level of abstraction of theirapplicability and influence. We transferred this classification to antipatterns
284 8 | Evolvability Patterns and Antipatterns for Service Orientation

and used it as the first dimension of our taxonomy. Each antipattern thereforehas to be assigned to exactly one of the following categories:
• Architecture antipatterns impact architecture- and design-related as-pects of the system.
• Application antipatterns impact interactions of application compo-nents and application-level functionality.
• Business antipatterns impact interactions of users, business, and data.
Additionally, our taxonomy includes a differentiation of the architecturalstyle in which the antipattern applies. Each antipattern can therefore betagged with microservices, SOA, or both of these styles. Note that thearchitectural style tag does not necessarily mean that the antipattern hasbeen conceptualized for or is frequently encountered in this style. It simplymeans that, in this style, the antipattern is usually perceived as a suboptimalsolution. For example, this is why the contrary antipatterns Nanoservices andMegaservice are both categorized with soa as well as microservices, eventhough what is considered too small or large may ultimately be very differentin each architectural style. Fig. 8.15 visualizes the distribution of antipatternsin this taxonomy. Most antipatterns are placed in the architectural category,while we assigned only three antipatterns to the business category. Moreover,only three antipatterns are purely applicable to microservices. About halfof the remaining antipatterns are dedicated to SOA, while the other halfis applicable for both architectural styles. In addition to this fixed part ofthe taxonomy, there is also a dynamic tag system that allows creating othermeans of categorization. So far, seven different tags have been assigned,such as coupling, cohesion, ambiguity, or migration.
8.5 | Service-Based Antipatterns: Systematic Literature Review 285

4
9
1
2
1
4
14
1Bu
sine
ssArchite
cture
App
lication
SOA Microservices Both
Figure 8.15.: Number of identified antipatterns per architectural style andcategory
8.5.2.3. Web Application and Collaborative Repository (RQ4)
We had two main goals for the created structured collection of service-basedantipatterns. First, we wanted a convenient way to browse and search thecollection to make it easy for researchers and practitioners to absorb and workwith the antipattern information. And second, we wanted an establishedcollaborative process for the continuous refinement and extension of thecreated collection. With these goals in mind, we developed a small webapplication that displays a list of all identified antipatterns. The list issortable, searchable, and can be filtered by architectural styles, categories,or tags. We also introduced the concept of an antipattern’s evidence as ameasure for its reliability and renownedness. This measure should helpto judge an antipattern’s importance and relies on the number of distinct
286 8 | Evolvability Patterns and Antipatterns for Service Orientation
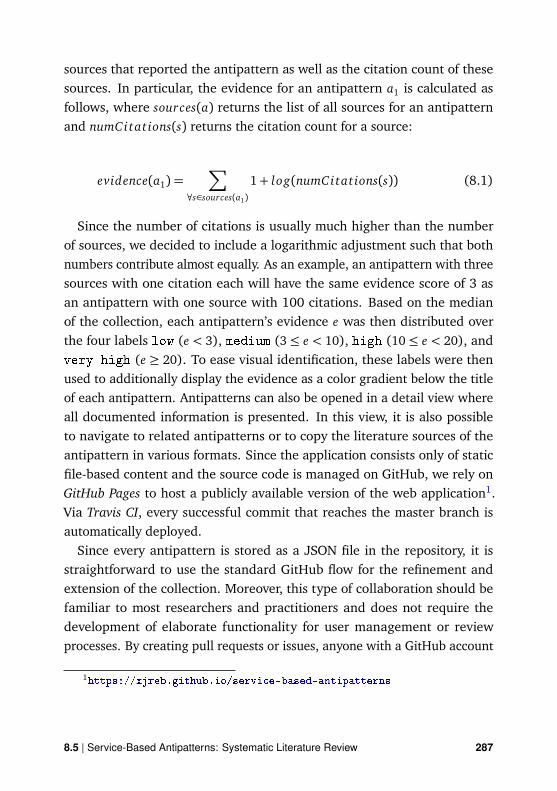
sources that reported the antipattern as well as the citation count of thesesources. In particular, the evidence for an antipattern a1 is calculated asfollows, where sources(a) returns the list of all sources for an antipatternand numCitat ions(s) returns the citation count for a source:
evidence(a1) =∑
∀s∈sources(a1)
1+ log(numCitat ions(s)) (8.1)
Since the number of citations is usually much higher than the numberof sources, we decided to include a logarithmic adjustment such that bothnumbers contribute almost equally. As an example, an antipattern with threesources with one citation each will have the same evidence score of 3 asan antipattern with one source with 100 citations. Based on the medianof the collection, each antipattern’s evidence e was then distributed overthe four labels low (e < 3), medium (3 ≤ e < 10), high (10 ≤ e < 20), andvery high (e ≥ 20). To ease visual identification, these labels were thenused to additionally display the evidence as a color gradient below the titleof each antipattern. Antipatterns can also be opened in a detail view whereall documented information is presented. In this view, it is also possibleto navigate to related antipatterns or to copy the literature sources of theantipattern in various formats. Since the application consists only of staticfile-based content and the source code is managed on GitHub, we rely onGitHub Pages to host a publicly available version of the web application1.Via Travis CI, every successful commit that reaches the master branch isautomatically deployed.Since every antipattern is stored as a JSON file in the repository, it is
straightforward to use the standard GitHub flow for the refinement andextension of the collection. Moreover, this type of collaboration should befamiliar to most researchers and practitioners and does not require thedevelopment of elaborate functionality for user management or reviewprocesses. By creating pull requests or issues, anyone with a GitHub account
1https://xjreb.github.io/service-based-antipatterns
8.5 | Service-Based Antipatterns: Systematic Literature Review 287

is able to contribute to the collection. We also created a template for thecreation of new antipatterns and documented contribution guidelines1 tomake the collaboration easier for others. This crowdsourcing approach maysignificantly improve the quality and quantity of the collection in the longrun and provides the foundation for active collaborative research.
8.5.3. Threats to Validity
We need to mention several limitations with this research. Concerninginternal validity, we tried to reduce the most common threats and biasesfor SLRs by following the Kitchenham guidelines [KC07], defining andadhering to a review protocol, as well as double-checking important stepsbetween several researchers. Nonetheless, our SLR still included qualitativeand subjective parts with possibilities for researcher bias, especially for thestudy exclusion based on soft criteria like the usage of a consistent schema.While we aimed for a high degree of scientific rigor and replicability by alsopublishing all SLR artifacts in our GitHub repository2, the limited time ofthe research project did not allow us to invest more efforts, like conductinga pilot study or assigning the complete search result set simultaneouslyto all researchers. Similarly, the synthesis of a holistic data model andantipattern taxonomy, the placing of antipatterns into categories, as well asthe definition of relations between antipatterns is a qualitative process withroom for interpretation. Even though we tried to perform these activitiesas systematically as possible and discussed different variants between mostresearchers, there is still the possibility for better solutions and others maydisagree with our suggestions.With respect to external validity, one common threat in SLRs is a limited
number of search engines and digital libraries. While we used a total of fivedifferent websites for our search, we did not include others like Scopus orWeb of Science due to time and access constraints. We tried to reduce this
1https://github.com/xJREB/service-based-antipatterns/blob/master/CONTRIBUTING.md
2https://github.com/xJREB/service-based-antipatterns/tree/master/slr
288 8 | Evolvability Patterns and Antipatterns for Service Orientation

limitation by including Google Scholar as a general search engine that isnot bound to one digital library as well as snowballing. However, apart frombooks, we did not include grey literature into our main search process asfor example Soldani et al. [STV18]. Their coverage of microservices “pains”relies on a large number of web articles. The evidence of such findings,however, is very challenging to estimate, which was the reason why werelied primarily on scientific literature. While we cannot guarantee thecompleteness of our created service-based antipattern collection, we stillbelieve our created repository to be of substantial quantity, especially sincewe collected nearly twice as many antipatterns as Sabir et al. [SPR+19]provided in their extensive SLR. Lastly, the collaborative nature of our repos-itory should enable convenient future extensions and adaptations so thatmissed antipatterns can be added or wrongly categorized antipatterns canbe edited.
8.5.4. Summary
Since the literature on service-based antipatterns is very scattered and noholistic collection exists that covers the majority of antipatterns for both SOAand microservices, we conducted a research project to address this gap. Ourcontribution with this study is threefold. First, our SLR identified 14 primarystudies in the field and we extracted 36 service-based antipatterns from them.Second, we synthesized a holistic data model and JSON schema and used itto document these antipatterns. Similarly, we created a taxonomy and cate-gorization scheme for the antipatterns and also implemented relationshipsbetween them. Thirdly, we developed a web application for the convenientbrowsing of the created collection. Due to the GitHub-based repository, thecollection can be easily updated and extended in a collaborative process.Future research in the area of service-based antipatterns can rely on thisrepository as a reference. Moreover, it can be used for training and educationpurposes as well as for quality assurance activities.
8.5 | Service-Based Antipatterns: Systematic Literature Review 289

8.6. Conclusion
We conducted four studies to enable developers of service- and microservice-based systems to make more informed choices about service-based patternsfor systematic evolvability construction and to raise awareness of service-based antipatterns. First, we analyzed 118 SOA design patterns for theirapplicability to microservices and found that 74 were fully applicable (63%),30 partially applicable (25%), and only 14 not applicable (12%). In a secondstep, we then created a candidate list of service-based evolvability patternsby additionally mapping the mentioned 118 SOA and 42 microservicespatterns onto architectural modifiability tactics. The derived list comprises68 patterns (SOA: 47, microservices: 21) that practitioners can use to realizea modifiability tactic in a service-oriented context.To add quantitative empirical evidence to this theoretical qualitative indi-
cation, we also conducted a controlled experiment with Bachelor students(N=69) for four of these patterns. In three tasks, participants had to changeand extend two functionally equivalent versions of a service-based webshop– one version with patterns (treatment group) and one version without pat-terns (control group). Even though participants in the treatment groupwith patterns were on average 12% faster per task (00:32:45 vs. 00:28:50),this difference was not on a statistically significant level. Only the groupdifference for task #3 with the pattern Event-Driven Messaging turned out tobe significant (p-value: 0.0006). A subsequent analysis of the two systemversions with nine maintainability metrics revealed that the pattern version#2 exhibited worse measurements in the area of size and granularity andbetter measurements for coupling. Complexity as well as cohesion measure-ments were similar between the two versions. Overall, we did not observedecisive maintainability metric improvements in the pattern version, whichseems to be in line with the experiment results. Our theory to explain thisis that the additional volume introduced by the patterns hindered the rel-atively unexperienced participants to leverage their modifiability-relatedbenefits at first. As they became more familiar with the system, the patterns’evolvability-related advantages were able to take effect. The implications
290 8 | Evolvability Patterns and Antipatterns for Service Orientation

of these results are that documentation and training of used service-basedpatterns should not be neglected in software maintenance and evolutionscenarios.Lastly, we conducted a fourth study to create a holistic repository of service-
based antipatterns. Via an SLR, we identified 14 primary studies from whichwe extracted 36 antipatterns for service- and microservice-based systems.We then documented these antipatterns with a synthesized data model andJSON schema. We also created a taxonomy and categorization scheme as wellas a web application for convenient browsing. The GitHub-based repositoryof the collection can be easily updated and extended in a collaborativeprocess. Future research in the area of service-based antipatterns can relyon this repository as a reference. Additionally, it can be used for trainingand education purposes as well as for quality assurance activities.
8.6 | Conclusion 291

Part IV.
Discussion and Conclusion
292

Chap
ter 9
Conclusion
This final chapter first briefly summarizes the contributions of this thesis. Forour three main research areas (metrics, scenarios, and patterns), we thendiscuss the implications of these contributions from a holistic perspectiveand also describe their limitations. This discussion leads to a section onpossible future research to address presented short-comings or to extendour work. Lastly, we close with some words on the perceived importance ofthis research field.
293

9.1. Summary of Contributions
Over the last five chapters, we introduced our numerous contributions indifferent areas related to the evolvability assurance of microservices. Beforediscussing their implications for research and practice, we briefly reiteratethe contributions here (C0–C6).C1: we provided an overview of the state of the art in service-oriented
maintainability assurance (Chapter 4). Using a systematic literature re-view (SLR), we collected existing scientific research, synthesized categoriesfor it, and analyzed the distributions of publications over these categories.C2: we provided an overview of the state of practice in service-oriented
maintainability assurance (Chapter 5). By conducting two industry stud-ies (a quantitative survey and qualitative interviews), we captured appliedpractices, successful strategies, and frequent challenges.C3: we identified service-basedmaintainability metrics and designed
tool-supported approaches for their collection (Chapter 6). With a lit-erature study, we collected proposed metrics and analyzed their relevancefor microservices. We then designed a static collection approach basedon machine-readable API descriptions of RESTful services and a dynamiccollection approach based on runtime data. Both approaches are modularand extensible and their prototypical tool support implements a variety ofservice-based metrics.C4: we designed a scenario-based method for analyzing the evolv-
ability of microservice-based systems (Chapter 7). As a means for quali-tative and architecture-centric evolvability analysis, we created a lightweightmethod specifically focused on service orientation. We also provided toolsupport for this method and evaluated its usability and perceived usefulnesswith a survey as well as hands-on interviews.C5: we collected and evaluated service-oriented patterns and antipat-
terns for evolvability (Chapter 8). First, we analyzed the applicability ofexisting SOA patterns for microservices. Second, we derived a candidate listof patterns with theoretical evolvability benefits via the proxy of architec-tural modifiability tactics. Third, we empirically analyzed the impact of four
294 9 | Conclusion

patterns on evolvability via a controlled experiment and structural metrics.Lastly, we collected existing antipatterns for service- and microservice-basedsystems with an SLR and created a taxonomy and a web-based repositoryfor them.C6: we improved the understanding of commonalities and differ-
ences between SOA and microservices. During most of our studies withinthe five contribution areas above, we either analyzed existing SOA techniquesfor their relevance to microservices or compared similar concepts from boththe areas of SOA and microservices. This comparison helped to highlight thelarge set of shared properties, but also discussed notable differences.
The entirety of these smaller related contributions leads to our centraland unique contribution provided by this dissertation, namely the concep-tualization of a holistic and multifaceted evolvability assurance for mi-croservices (C0). For this context, we are the first to thoroughly analyzethe scientific state of the art as well as the industry state of practice. Basedon the identified research areas and gaps as well as industry practices andchallenges, we provided several concrete design contributions. To relatethis back to our research objective and as an answer to our central RQ (seeSection 1.3), we supported developers of microservices with:
• a tool-supported static analysis approach for service-based metricsbased on RESTful API descriptions (RAMA),
• a tool-supported dynamic analysis approach for service-based metricsbased on distributed tracing,
• a tool-supported method for the scenario-based evolvability analysisof service- and microservice-based systems,
• a collection of service-based patterns beneficial for evolvability andthe empirical evaluation of four of these patterns,
• a collaborative repository of diverse service-based antipatterns.
In line with the artifact requirements of the research objective, all theseapproaches are lightweight, explicitly designed for service orientation, and
9.1 | Summary of Contributions 295

try to reduce manual efforts with tool support wherever possible. In Fig. 9.1,we relate the described contributions C0–C6 back to our research processfrom Section 1.4.���������� �����
���������������������������� ����������� ������������������� ���
�� !"#$%!#� &'"()*
'+),(-#).&/!)!(&�0&!1(&'"! 2 ,%*!"3.&/!)!(&�0&4")+!#+(
/56.&/("7#+(89)*(,:)# !)# )$#;#!3&'**%") +(
/%"7(3.&:)# !)# )$#;#!3'**%") +(&) ,
<#00("( +(*&=#!1&/("7#+(*
2 !("7#(=*.&>7�;7)$#;#!3'**%") +(&�0:#+"�*("7#+(*
/("7#+(89)*(,:(!"#+*
/+( )"#�89)*(,>7);%)!#�
4)!!(" *&?' !#@)!!(" *
�A �B
�C �D �E
�F
�F �F
�G
Figure 9.1.: Contributions C0–C6 in relation to research process
9.2. Discussion and Limitations
The presented design contributions (C3–C5) have several implications forresearch and practice, but also some noteworthy limitations.Our static analysis approach (RAMA) can be used to efficiently calculate
suitable service interface metrics for e.g. size, cohesion, or complexity. Sinceit requires API descriptions that often already exist in the design phase, itcan serve as a valuable means for early quality evaluation, but can also beused within continuous quality assurance. Our prototypical tool supporttakes the popular formats OpenAPI, RAML, and WADL as input so far andshould therefore apply to a large percentage of services. Due to its modularstructure, it can also be extended with additional formats like e.g. APIBlueprint with reasonable effort.However, not every microservice uses RESTful HTTP for communication
and not every RESTful service provides a machine-readable interface de-
296 9 | Conclusion

scription. In the latter case, such documents can sometimes be generatedfrom source code (depending on the used framework), but for the former,there is currently no simple solution. Even though similar documentationstandards for message-based microservices are slowly starting to emerge(see e.g. AsyncAPI1), our current internal model and metric implementa-tions are very REST-specific. While several metrics are undoubtedly validin both communication paradigms, substantial efforts would be necessaryto fully support messaging in addition to REST. Moreover, the approach isvery focused on the interface quality of a single service and no system-widemetrics except for aggregates like mean or median can be calculated. Asa consequence, RAMA cannot support metrics for the coupling betweenservices.
Our dynamic analysis approach is therefore a suitable complement forthis. While it requires the complete running system and may come withsome efforts to integrate distributed tracing for each service, the approachsupports both messaging and REST and the variety of calculable metrics ismuch larger. Especially in the area of (dynamic) coupling, this approach isable to provide system-level metrics for a broader perspective. Like its staticsibling, it is designed in a modular way to efficiently support extensions.While we demonstrated the feasibility of the approach with an example
open source system that was used by several participants, we did not conducta large-scale industry case study with it. In such a setting, the effectivenessof the approach may be slightly reduced, even though all metrics were calcu-lated correctly during the small demonstration. We also do not have reliableinsights into potential performance impacts, which at least requires some ad-ditional investigation when using this approach with a performance-criticalsystem. However, this theoretical performance impact is solely attributedto the data collection, e.g. distributed tracing via Zipkin, and not to themetric calculation within our approach. Such tracers are usually designedfor minimal overhead and also configurable to some degree to e.g. reducetheir message size or frequency.
1https://www.asyncapi.com
9.2 | Discussion and Limitations 297

In combination, both metric collection approaches provide a broadly ap-plicable and extensible basis for calculating a diverse set of service-basedmetrics. However, the most significant limitation in the area of metrics is thatthe effectiveness of the majority of them has not been sufficiently evaluated,i.e., for most proposed service-based metrics, the respective authors did notpresent enough empirical support that the metrics are suitably correlatedwith evolvability. While this relation seems plausible on a theoretical level forall metrics implemented by us, only a more rigorous evaluation can providereliable evidence and therefore help with the selection of the most effectivemetrics. Our replicable threshold derivation study is a first step to makethese metrics more actionable, but looking at real-world value distributionsof metrics is no substitute for their empirical evaluation. Moreover, thethreshold study only applies to the static analysis approach.
The scenario-based evaluation method can complement the metric-based approaches and therefore helps to overcome their current shortcom-ings, as it provides a qualitative view on the system’s evolvability. Whilethe method is certainly more time-consuming, the approach is also verycomprehensive and able to evaluate specific evolution scenarios, e.g. themost likely ones or the (presumably) most risky ones, whereas metrics areoblivious to this. Moreover, it incorporates the valuable knowledge of systemstakeholders into the analysis and therefore provides a more human-centricevaluation. Lastly, our prototypical tool support can mitigate manual efforts.Method and tool support were developed and improved in an iterative
fashion and finally validated with a survey and hands-on interviews. Nonethe-less, the approach’s effectiveness has not been evaluated in a large-scaleindustry setting so far. While we believe that usefulness and usability ofthe tool-supported method are sufficient for industry usage after the firstround of validations, we have not conducted any field studies to support thisclaim with further empirical evidence. Lastly, in addition to the increasedanalysis efforts, the method requires more learning and preparation effortsin comparison to the metric-based approaches, which also has to be takeninto account by software professionals.
298 9 | Conclusion

In the area of service-based evolvability patterns, our collection canbe used by researchers and practitioners for systematic evolvability con-struction with selected candidate patterns, e.g. to reduce coupling or toincrease cohesion. We showed that there are many different ways to improveservice-based architectures in this context and that a large percentage ofpatterns apply to microservices. Furthermore, our controlled experimentand metric-based analysis with selected patterns highlighted that they maysimultaneously introduce additional size and complexity in the system. Thiscomplexity may especially hinder new or inexperienced developers whoare not consciously aware of these patterns. Developers that decide to usesuch patterns should keep this in mind: evolvability mechanisms should bethoroughly documented and new developers should be made aware of them.While we qualitatively derived a broad set of evolvability patterns for
service orientation, the beneficial impact was only theoretical in this list.Only for four patterns, we analyzed the impact empirically and the resultsfrom this study were not entirely conclusive, with several threats to validity(see Section 8.4.5) and also modest generalization potential due to thestudent participants. Therefore, we do not have empirical evidence for allcollected evolvability patterns.
Complementary to our pattern collection, our collaborative repository ofservice-based antipatterns can serve as a foundation for future antipatternresearch. Researchers and practitioners can browse the collection for edu-cation purposes or during quality reviews. The web-based interface makesit easy to search for antipatterns and to filter for specific tags or categories.The notion of evidence provides an indication for an antipattern’s relevanceand reliability based on its citation in literature.However, the collected antipattern metadata strongly influences the use-
fulness of the repository. If essential attributes like the detection or theresolution of an antipattern are not or insufficiently described by their initialauthors, those antipatterns from our repository will not be very actionablefor practitioners.
9.2 | Discussion and Limitations 299

9.3. Future Research Directions
Based on our contributions, a wide variety of follow-up research is possible,either to address described limitations or to extend the scope of our work. Inthe area of service-based metrics, a straight-forward option would be theextension of our tool-supported approaches with additional input formats andmetrics to increase their applicability and utility. Additionally, industry casestudies with both approaches could bring further insights into the potentialfor improvement and might reveal overlooked shortcomings. However, themost critical expansion for this line of research would be the evaluation ofproposed service-based maintainability metrics. Due to the lack of automaticcollection approaches, such evaluation studies were previously challengingto execute at scale. Our approaches can serve as a valuable foundation forsuch endeavors. Possible research designs in this area could be based onsoftware repository mining, controlled experiments, industry field studies,or rating-based expert reviews. In the end, it will be crucial for practitionersto focus on a small set of reliable metrics instead of trying to make sense ofan extensive collection of different measures. Such evaluated metrics canalso be used in automatic service decomposition approaches to evaluate thequality of proposed service cuts in a monolith.
For the scenario-based method, industry case studies are the most im-portant line of future work. The effectiveness of the method can only bereliably judged and improved based on its application with diverse real-world systems and stakeholders. Moreover, a systematic combination of thismethod with a metric-based approach could lead to promising evaluationsynergies. Structural metrics could support stakeholders during scenarioeffort prediction or for the final evaluation.
While there is a lot of design knowledge to construct evolvability in theform of service-based patterns, there is little empirical evidence in this area.A single controlled experiment can only cover a small number of patterns andis not sufficient on its own. Replications and additional studies are necessary
300 9 | Conclusion

to reliably assess this complex relationship and to shed light on possibleinfluencing factors for the effectiveness of patterns. Additionally, we see thepotential for a systematic combination of metrics as an analytical techniqueand patterns as a constructive technique. For example, patterns like ServiceFaçade or API Gateway could remediate an architectural hot spot with highcoupling identified by metrics. Based on the metric values, different patternscould be proposed as a solution.
In the area of service-based antipatterns, our provided collection shouldnot be regarded as a final product, but as a living collaborative repository.Future work could enhance its data quality and richness and extend it withadditional antipatterns. However, similar to patterns, detailed empiricalevidence for the negative evolvability impact of most antipatterns is missingso far. Such studies could yield valuable insights into the circumstancesunder which spending the effort to refactor an antipattern is worthwhile.Additionally, automatic approaches for the identification and refactoring ofservice-based antipatterns could save practitioners significant manual efforts.As another potential synergy, structural service-based metrics could be usedas the basis for such an antipattern identification approach.
Lastly, there are also some general future research directions in thecontext of the evolvability assurance for microservices that were out of scopefor this thesis. In a real-world industry project, software quality rarely existsin isolation and different quality attributes have to be balanced out againsteach other. We did not cover such quality trade-offs in this thesis, but inmany cases, improving the evolvability of microservices will have at leastslightly negative consequences for other quality attributes. As an example,the usage of a Service Façade to reduce coupling may have an impact onperformance in the form of increased response times. In many cases, thismay be negligible, in others, it may be an issue. Research that analyzessuch trade-offs in the area of microservices and provides guidance based onquality requirements may be very helpful for practitioners that are new tothis architectural style.
9.3 | Future Research Directions 301

This thesis took a very system-centric look at evolvability. However, human-and organization-related factors play a vital role in this as well. With mi-croservices, this may manifest in the form of e.g. potentially reduced knowl-edge exchange due to decentralized teams or a lack of expertise in specificfields due to the usage of hyped technologies and a substantial degree ofheterogeneity. Empirical studies in these areas could reveal the extent ofthese potential disadvantages and provide reliable best practices to mitigatetheir impact. While microservices are generally associated with continuousproduct development, there are also IT service providers that develop mi-croservices for external customers in a project mode. Investigating possibledownsides and ways to work around them may also be promising futurework.Finally, while a lot of potential evolvability-related issues could be ad-
dressed in a project, it is not always essential or even desirable to fix all ofthem. Especially in highly dynamic microservice-based systems with contin-uous experimentation and a low average service lifetime, some identifiedproblems may solve themselves when a service is decommissioned. Moreover,improving evolvability always means that effort is spent which is not directlyvisible as business value to the end-user. Therefore, research in the area ofevolvability-related issue prioritization, i.e. triage, may support developersin selecting the improvements with the best cost-benefit ratio, especially ifthere is a substantial number of issues.
9.4. Closing Remarks
In this thesis, we covered a lot of different facets to analyze and improve theevolvability of microservices. Because this research field is very young, mucheffort had to be spent on studies like our SLR, our survey, or our interviewsto motivate and frame our design contributions properly. Since we alsowanted to approach the topic from various perspectives (metrics, scenarios,and patterns), we have not evaluated some of our design contributions toan extent that completely satisfies us. We transparently described these
302 9 | Conclusion

limitations and pointed out the necessary steps to address them. Additionalstudies in some areas are already planned or currently ongoing, but will notfind their way into this document. Nonetheless, we believe that this thesisas a whole is a significant and unique contribution to this field and holdsvalue for both researchers and practitioners.
When we started our research, there were no publications on maintenance,evolution, or technical debt of microservices. As we contributed our firstpapers to this topic, other publications gradually emerged over the years.By now, the interest has risen considerably and several authors regularlypublish on these topics. Because microservices are still a somewhat youngphenomenon, most systems developed in this style are also relatively youngand have so far not fallen to Lehman’s law of increasing complexity. Especiallyif the system replaced a decades-old monolith, its evolvability would beregarded as more positive in comparison. Even then, our industry analysesrevealed evolvability issues and challenges perceived by their stakeholders.As these systems get older, it will be even more important to use diverseevolvability assurance techniques. It will not be enough to trust in the“inherent” evolution qualities of microservices and their “innate” low couplingand high cohesion.Lastly, a lot of early adopters of microservices have a very effective treat-
ment to avoid low evolvability: companies like Google, Amazon, Netflix, orSpotify hire the best of the best, provide them with abundant resources, andempower them to do great things with their software. Many other compa-nies do not have that luxury. Without systematic guidance, they will mostlikely not be able to replicate the microservices success stories described incountless blog posts and conference talks. As in many other fields, we have apronounced “survivorship bias” concerning microservices grey literature. It isespecially in this spirit that we want to highlight the importance of a holisticand sustainable evolvability assurance for long-living microservice-basedsystems.
9.4 | Closing Remarks 303

Bibliography
[AAA14] K. Amjad Alam, R. B. Ahmad, M. Akhtar. “Change Impact analysis andpropagation in service based business process management systemspreliminary results from a systematic review.” In: 2014 8th. MalaysianSoftware Engineering Conference (MySEC). IEEE, Sept. 2014, pp. 7–12(cit. on p. 115).
[AAC14] H. S. de Andrade, E. Almeida, I. Crnkovic. “Architectural bad smellsin software product lines.” In: Proceedings of the First InternationalConference on Dependable and Secure Cloud Computing Architecture -DASCCA ’14. New York, New York, USA: ACM Press, 2014, pp. 1–6(cit. on pp. 280, 281).
[ABF04] E. Arisholm, L. Briand, A. Foyen. “Dynamic coupling measurementfor object-oriented software.” In: IEEE Transactions on Software Engi-neering 30.8 (Aug. 2004), pp. 491–506 (cit. on p. 73).
[ACKM04] G. Alonso, F. Casati, H. Kuno, V. Machiraju. “Web Services.” In: WebServices. 09. Berlin, Heidelberg: Springer Berlin Heidelberg, 2004,pp. 123–149 (cit. on pp. 43, 44).
[AE13] M. Ali, M.O. Elish. “A Comparative Literature Survey of Design Pat-terns Impact on Software Quality.” In: 2013 International Conferenceon Information Science and Applications (ICISA). IEEE, June 2013,pp. 1–7 (cit. on pp. 39, 92).
[AG83] A. Albrecht, J. Gaffney. “Software Function, Source Lines of Code,and Development Effort Prediction: A Software Science Validation.”In: IEEE Transactions on Software Engineering SE-9.6 (Nov. 1983),pp. 639–648 (cit. on p. 61).
304

[AGAF16] D. Ameller, M. Galster, P. Avgeriou, X. Franch. “A survey on qualityattributes in service-based systems.” In: Software Quality Journal 24.2(June 2016), pp. 271–299 (cit. on pp. 19, 85, 133).
[AIS77] C. Alexander, S. Ishikawa, M. Silverstein. A Pattern Language: Towns,Buildings, Construction. Oxford University Press, 1977 (cit. on pp. 39,224, 279).
[AKOS16] P. Avgeriou, P. Kruchten, I. Ozkaya, C. Seaman. “Managing Techni-cal Debt in Software Engineering.” In: Dagstuhl Reports 6.4 (2016),pp. 110–138 (cit. on p. 68).
[And10] V. Andrikopoulos. “A theory and model for the evolution of softwareservices.” PhD thesis. Tilburg University, 2010 (cit. on p. 91).
[And11] M. Andreessen. “Why Software Is Eating The World.” In: Wall StreetJournal 20 (2011) (cit. on pp. 18, 55).
[Ath17] D. Athanasopoulos. “Service Decoupler: Full Dynamic Decoupling inService Invocation.” In: Proceedings of the 22nd European Conferenceon Pattern Languages of Programs - EuroPLoP ’17. New York, New York,USA: ACM Press, 2017, pp. 1–9 (cit. on p. 111).
[AZD11] S. Alahmari, E. Zaluska, D. C. De Roure. “A Metrics Framework forEvaluating SOA Service Granularity.” In: 2011 IEEE InternationalConference on Services Computing. IEEE, July 2011, pp. 512–519 (cit.on p. 113).
[AZM+15] D. Athanasopoulos, A. V. Zarras, G. Miskos, V. Issarny, P. Vassiliadis.“Cohesion-Driven Decomposition of Service Interfaces without Accessto Source Code.” In: IEEE Transactions on Services Computing 8.4(2015), pp. 550–5532 (cit. on pp. 113, 183).
[BABM11] M. Boukhebouze, Y. Amghar, A.N. Benharkat, Z. Maamar. “A rule-based approach to model and verify flexible business processes.” In:International Journal of Business Process Integration and Management5.4 (2011), p. 287 (cit. on p. 110).
[BB18a] B. Bani-Ismail, Y. Baghdadi. “A Literature Review on Service Identifica-tion Challenges in Service Oriented Architecture.” In: Communicationsin Computer and Information Science. Springer, Cham, 2018, pp. 203–214 (cit. on pp. 82, 113).
Bibliography 305

[BB18b] B. Bani-Ismail, Y. Baghdadi. “A Survey of Existing Evaluation Frame-works for Service Identification Methods: Towards a ComprehensiveEvaluation Framework.” In: Communications in Computer and Infor-mation Science. Vol. 877. Springer, Cham, Aug. 2018, pp. 191–202(cit. on p. 113).
[BBL76] B.W. Boehm, J. R. Brown, M. Lipow. “Quantitative Evaluation of Soft-ware Quality.” In: Proceedings of the 2Nd International Conference onSoftware Engineering. San Francisco, California, USA: IEEE ComputerSociety Press, 1976, pp. 592–605 (cit. on p. 70).
[BBN07] F. Bachmann, L. Bass, R. Nord.Modifiability Tactics. Tech. rep. CMU/SEI-2007-TR-002. Pittsburgh, PA: Software Engineering Institute, CarnegieMellon University, 2007 (cit. on pp. 232, 234, 235).
[BBP+19] J. Bogner, T. Boceck, M. Popp, D. Tschechlov, S. Wagner, A. Zimmer-mann. “Towards a Collaborative Repository for the Documentationof Service-Based Antipatterns and Bad Smells.” In: 2019 IEEE In-ternational Conference on Software Architecture Companion (ICSA-C).Hamburg, Germany: IEEE, Mar. 2019, pp. 95–101 (cit. on pp. 27,223).
[BCDV11] E. Bouwers, J. P. Correia, A. van Deursen, J. Visser. “Quantifyingthe Analyzability of Software Architectures.” In: 2011 Ninth Work-ing IEEE/IFIP Conference on Software Architecture. IEEE, June 2011,pp. 83–92 (cit. on p. 62).
[BCK03] L. Bass, P. Clements, R. Kazman. Software Architecture in Practice.2nd. Westford, MA, USA: Addison-Wesley Professional, 2003 (cit. onpp. 234, 235).
[BCK12] L. Bass, P. Clements, R. Kazman. Software Architecture in Practice. 3rd.Westford, MA, USA: Addison-Wesley Professional, 2012 (cit. on pp. 31,32, 35, 36, 75, 232, 234, 235).
[BCL12] H. P. Breivold, I. Crnkovic, M. Larsson. “A systematic review of soft-ware architecture evolution research.” In: Information and SoftwareTechnology 54.1 (2012), pp. 16–40 (cit. on p. 82).
[BCSV12] R. Baggen, J. P. Correia, K. Schill, J. Visser. “Standardized code qualitybenchmarking for improving software maintainability.” In: SoftwareQuality Journal 20.2 (June 2012), pp. 287–307 (cit. on p. 184).
306 Bibliography

[BD02] J. Bansiya, C. Davis. “A hierarchical model for object-oriented designquality assessment.” In: IEEE Transactions on Software Engineering28.1 (2002), pp. 4–17 (cit. on p. 72).
[BD05] S. Baker, S. Dobson. “Comparing Service-Oriented and DistributedObject Architectures.” In: Lecture Notes in Computer Science (includingsubseries Lecture Notes in Artificial Intelligence and Lecture Notes inBioinformatics). Vol. 3760 LNCS. 2005, pp. 631–645 (cit. on p. 19).
[BDP06] M. Broy, F. Deissenboeck, M. Pizka. “Demystifying maintainability.”In: Proceedings of the 2006 international workshop on Software quality- WoSQ ’06. New York, New York, USA: ACM Press, 2006, p. 21 (cit. onp. 75).
[BDUU98] L. C. Briand, J.W. Daly, J. Urgen, W. Ust. “A Unified Framework forCohesion Measurement in Object-Oriented Systems.” In: EmpiricalSoftware Engineering 3.2 (1998), pp. 65–117 (cit. on p. 66).
[BDW99] L. Briand, J. Daly, J. Wust. “A unified framework for coupling measure-ment in object-oriented systems.” In: IEEE Transactions on SoftwareEngineering 25.1 (1999), pp. 91–121 (cit. on p. 64).
[Ber84] G.M. Berns. “Assessing software maintainability.” In: Communicationsof the ACM 27.1 (Jan. 1984), pp. 14–23 (cit. on p. 72).
[BFWZ18] J. Bogner, J. Fritzsch, S. Wagner, A. Zimmermann. “Limiting TechnicalDebt with Maintainability Assurance: An Industry Survey on UsedTechniques and Differences with Service- and Microservice-BasedSystems.” In: Proceedings of the 2018 International Conference on Tech-nical Debt - TechDebt ’18. New York, New York, USA: ACM Press, 2018,pp. 125–133 (cit. on pp. 27, 120).
[BFWZ19a] J. Bogner, J. Fritzsch, S. Wagner, A. Zimmermann. “Assuring the Evolv-ability of Microservices: Insights into Industry Practices and Chal-lenges.” In: 2019 IEEE International Conference on Software Mainte-nance and Evolution (ICSME). Cleveland, Ohio, USA: IEEE, Sept. 2019,pp. 546–556 (cit. on pp. 28, 121).
Bibliography 307

[BFWZ19b] J. Bogner, J. Fritzsch, S. Wagner, A. Zimmermann. “Microservices inIndustry: Insights into Technologies, Characteristics, and SoftwareQuality.” In: 2019 IEEE International Conference on Software Archi-tecture Companion (ICSA-C). Hamburg, Germany: IEEE, Mar. 2019,pp. 187–195 (cit. on pp. 19, 21, 49, 177).
[BGD17] L. Baresi, M. Garriga, A. De Renzis. “Microservices IdentificationThrough Interface Analysis.” In: Lecture Notes in Computer Science(including subseries Lecture Notes in Artificial Intelligence and LectureNotes in Bioinformatics). Ed. by M. Villari, W. Zimmermann, K.-K. Lau.Vol. 10465 LNCS. Lecture Notes in Computer Science. Berlin, Heidel-berg: Springer Berlin Heidelberg, 2017, pp. 19–33 (cit. on p. 177).
[BK95] J.M. Bieman, B.-K. Kang. “Cohesion and reuse in an object-orientedsystem.” In: Proceedings of the 1995 Symposium on Software reusability- SSR ’95. New York, New York, USA: ACM Press, 1995, pp. 259–262(cit. on p. 65).
[BLBV04] P. Bengtsson, N. Lassing, J. Bosch, H. van Vliet. “Architecture-levelmodifiability analysis (ALMA).” In: Journal of Systems and Software69.1-2 (Jan. 2004), pp. 129–147 (cit. on pp. 78, 206, 207).
[BM09] D. Basci, S. Misra. “Data Complexity Metrics for XML Web Services.”In: Advances in Electrical and Computer Engineering 9.2 (2009), pp. 9–15 (cit. on pp. 88, 177, 183).
[BMB18] T. Besker, A. Martini, J. Bosch. “Managing architectural technicaldebt: A unified model and systematic literature review.” In: Journalof Systems and Software 135 (Jan. 2018), pp. 1–16 (cit. on p. 68).
[BMB96] L. Briand, S. Morasca, V. Basili. “Property-based software engineeringmeasurement.” In: IEEE Transactions on Software Engineering 22.1(1996), pp. 68–86 (cit. on p. 71).
[BMMM98] W.H. Brown, R. C. Malveau, H.W. " McCormick, T. J. Mowbray. An-tiPatterns: Refactoring Software, Architectures, and Projects in Crisis.1st. New York, NY, USA: John Wiley & Sons, Inc., 1998 (cit. on p. 39).
308 Bibliography

[BMO+17] A. Bouguettaya, B. Medjahed, M. Ouzzani, F. Casati, X. Liu, H. Wang,D. Georgakopoulos, L. Chen, S. Nepal, Z. Malik, A. Erradi, M. Singh,Y. Wang, B. Blake, S. Dustdar, F. Leymann, M. Papazoglou, M. Huhns,Q. Z. Sheng, H. Dong, Q. Yu, A. G. Neiat, S. Mistry, B. Benatallah. “Aservice computing manifesto.” In: Communications of the ACM 60.4(Mar. 2017), pp. 64–72 (cit. on p. 40).
[BMR+96] F. Buschmann, R. Meunier, H. Rohnert, P. Sommerlad, M. Stal. Pattern-Oriented Software Architecture: A System of Patterns. Vol. 1. WileyPublishing, 1996, p. 476 (cit. on p. 39).
[BNK18] S. Baškarada, V. Nguyen, A. Koronios. “Architecting Microservices:Practical Opportunities and Challenges.” In: Journal of Computer In-formation Systems 00.00 (Sept. 2018), pp. 1–9 (cit. on p. 86).
[Bod09] S. Bode. “On the Role of Evolvability for Architectural Design.” In:Informatik 2009: Im Focus das Leben, Beiträge der 39. Jahrestagung derGesellschaft für Informatik e.V. (GI), 28.9.-2.10.2009, Lübeck, Deutsch-land, Proceedings. Ed. by S. Fischer, E. Maehle, R. Reischuk. Vol. 154.LNI. GI, 2009, pp. 3256–3263 (cit. on p. 58).
[BP84] F. J. Buckley, R. Poston. “Software Quality Assurance.” In: IEEE Trans-actions on Software Engineering SE-10.1 (Jan. 1984), pp. 36–41 (cit.on p. 69).
[BR00] K.H. Bennett, V. T. Rajlich. “Software maintenance and evolution.”In: Proceedings of the conference on The future of Software engineering- ICSE ’00. Vol. 225. New York, New York, USA: ACM Press, 2000,pp. 73–87 (cit. on pp. 18, 55, 56).
[Bro87] F. P. Brooks. “No Silver Bullet: Essence and Accidents of SoftwareEngineering.” In: Computer 20.4 (Apr. 1987), pp. 10–19 (cit. on p. 63).
[BSPK17] J. Bräuer, M. Saft, R. Plösch, C. Körner. “Improving Object-OrientedDesign Quality: A Portfolio– and Measurement-Based Approach.” In:Proceedings of the 27th International Workshop on Software Measure-ment and 12th International Conference on Software Process and ProductMeasurement on - IWSM Mensura ’17. New York, New York, USA: ACMPress, 2017, pp. 244–254 (cit. on p. 184).
Bibliography 309

[BSWZ19] J. Bogner, S. Schlinger, S. Wagner, A. Zimmermann. “A ModularApproach to Calculate Service-Based Maintainability Metrics fromRuntime Data of Microservices.” In: 20th International Conference onProduct-Focused Software Process Improvement (PROFES’19). Barcelona,Spain: Springer Berlin Heidelberg, 2019, pp. 489–496 (cit. on pp. 28,161).
[BVLD10] E. Bouwers, J. Visser, C. Lilienthal, A. van Deursen. “A CognitiveModel for Software Architecture Complexity.” In: 2010 IEEE 18thInternational Conference on Program Comprehension. IEEE, June 2010,pp. 152–155 (cit. on p. 64).
[BVV12] E. Bouwers, J. Visser, A. Van Deursen. “Getting What You Measure.”In: Queue 10.5 (May 2012), p. 50 (cit. on p. 75).
[BWH18] G. Buchgeher, R. Weinreich, H. Huber. “A Platform for the AutomatedProvisioning of Architecture Information for Large-Scale Service-OrientedSoftware Systems.” In: Lecture Notes in Computer Science (includingsubseries Lecture Notes in Artificial Intelligence and Lecture Notes inBioinformatics). Vol. 11048 LNCS. Springer International Publishing,2018, pp. 203–218 (cit. on p. 109).
[BWWZ20] J. Bogner, A. Weller, S. Wagner, A. Zimmermann. “Exploring Main-tainability Assurance Research for Service- and Microservice-BasedSystems: Directions and Differences.” In: Joint Post-proceedings of theFirst and Second International Conference on Microservices (Microser-vices2017/2019). Ed. by L. Cruz-Filipe, S. Giallorenzo, F. Montesi,M. Peressotti, F. Rademacher, S. Sachweh. Vol. 78. Dagstuhl, Germany:Schloss Dagstuhl - Leibniz-Zentrum fuer Informatik, 2020, 3:1–3:22(cit. on pp. 28, 97).
[BWZ15] L. Bass, I. Weber, L. Zhu. DevOps: A Software Architect’s Perspective.1st. Addison-Wesley Professional, 2015 (cit. on pp. 51, 79).
[BWZ17] J. Bogner, S. Wagner, A. Zimmermann. “Automatically measuring themaintainability of service- and microservice-based systems: a litera-ture review.” In: Proceedings of the 27th International Workshop onSoftware Measurement and 12th International Conference on SoftwareProcess and Product Measurement on - IWSM Mensura ’17. New York,New York, USA: ACM Press, 2017, pp. 107–115 (cit. on pp. 27, 161).
310 Bibliography

[BWZ19a] J. Bogner, S. Wagner, A. Zimmermann. “On the impact of service-oriented patterns on software evolvability: a controlled experimentand metric-based analysis.” In: PeerJ Computer Science 5 (Aug. 2019),e213 (cit. on pp. 28, 223).
[BWZ19b] J. Bogner, S. Wagner, A. Zimmermann. “Using architectural modifiabil-ity tactics to examine evolution qualities of Service- and Microservice-Based Systems.” In: SICS Software-Intensive Cyber-Physical Systems34.2-3 (June 2019), pp. 141–149 (cit. on pp. 27, 223).
[BWZ20] J. Bogner, S. Wagner, A. Zimmermann. “Scenario-based Evolvabil-ity Analysis of Service-oriented Systems: A Lightweight and Tool-supported Method.” In: Proceedings of the 15th International Con-ference on Evaluation of Novel Approaches to Software Engineering(ENASE’20). Prague, Czech Republic: SciTePress, 2020 (cit. on pp. 28,205).
[BZW18] J. Bogner, A. Zimmermann, S. Wagner. “Analyzing the Relevance ofSOA Patterns for Microservice-Based Systems.” In: Proceedings of the10th Central European Workshop on Services and their Composition(ZEUS’18). Dresden, Germany: CEUR-WS.org, 2018, pp. 9–16 (cit. onpp. 27, 222, 223).
[CALO94] D. Coleman, D. Ash, B. Lowther, P. Oman. “Using metrics to evaluatesoftware system maintainability.” In: Computer 27.8 (Aug. 1994),pp. 44–49 (cit. on p. 72).
[Cam18] G. A. Campbell. “Cognitive complexity.” In: Proceedings of the 2018International Conference on Technical Debt - TechDebt ’18. New York,New York, USA: ACM Press, 2018, pp. 57–58 (cit. on p. 75).
[CBB+10] P. Clements, F. Bachmann, L. Bass, D. Garlan, J. Ivers, R. Little, P. Mer-son, R. Nord, J. Stafford. Documenting Software Architectures: Viewsand Beyond. 2nd. Boston, MA, USA: Addison-Wesley Professional, 2010(cit. on pp. 33, 38).
[CBD18] A. Carrasco, B. van Bladel, S. Demeyer. “Migrating towards microser-vices: migration and architecture smells.” In: Proceedings of the 2ndInternational Workshop on Refactoring - IWoR 2018. New York, NewYork, USA: ACM Press, 2018, pp. 1–6 (cit. on pp. 94, 112).
Bibliography 311

[CC18] J.W. Creswell, J. D. Creswell. Research Design: Qualitative, Quantitative,and Mixed Methods Approaches. 5th. Los Angeles, CA, USA: SAGEPublications, Inc, 2018 (cit. on p. 23).
[CDK+02] F. Curbera, M. Duftler, R. Khalaf, W. Nagy, N. Mukhi, S. Weerawarana.“Unraveling the Web services web: an introduction to SOAP, WSDL,and UDDI.” In: IEEE Internet Computing 6.2 (Mar. 2002), pp. 86–93(cit. on pp. 43, 44).
[Che18] L. Chen. “Microservices: Architecting for Continuous Delivery and De-vOps.” In: 2018 IEEE International Conference on Software Architecture(ICSA). IEEE, Apr. 2018, pp. 39–397 (cit. on p. 80).
[CID+19] M. Cardarelli, L. Iovino, P. Di Francesco, A. Di Salle, I. Malavolta,P. Lago. “An extensible data-driven approach for evaluating the qualityof microservice architectures.” In: Proceedings of the 34th ACM/SIGAPPSymposium on Applied Computing - SAC ’19. New York, New York, USA:ACM Press, 2019, pp. 1225–1234 (cit. on p. 89).
[CK94] S. Chidamber, C. Kemerer. “A metrics suite for object oriented de-sign.” In: IEEE Transactions on Software Engineering 20.6 (June 1994),pp. 476–493. arXiv: 1011.1669 (cit. on p. 72).
[CLW11] S. Cai, Y. Liu, X. Wang. “A Survey of Service Identification Strategies.”In: 2011 IEEE Asia-Pacific Services Computing Conference. IEEE, Dec.2011, pp. 464–470 (cit. on p. 113).
[Con68] M. E. Conway. “How Do Committees Invent?” In: Datamation 14.4(1968), pp. 28–31 (cit. on pp. 50, 53).
[COU19] M.-D. Cojocaru, A. Oprescu, A. Uta. “Attributes Assessing the Qual-ity of Microservices Automatically Decomposed from Monolithic Ap-plications.” In: 2019 18th International Symposium on Parallel andDistributed Computing (ISPDC). IEEE, June 2019, pp. 84–93 (cit. onp. 89).
[CP13] G. A. Campbell, P. P. Papapetrou. SonarQube in Action. Shelter Island,NY: Manning Publications, 2013, p. 392 (cit. on pp. 71, 273).
312 Bibliography

[Cun92] W. Cunningham. “The WyCash portfolio management system.” In:Addendum to the proceedings on Object-oriented programming systems,languages, and applications (Addendum) - OOPSLA ’92. Vol. 4. October.New York, New York, USA: ACM Press, 1992, pp. 29–30 (cit. on p. 67).
[Dai11] R. Daigneau. Service Design Patterns: Fundamental Design Solutionsfor SOAP/WSDL and RESTful Web Services. Addison-Wesley signatureseries. Addison-Wesley, 2011 (cit. on p. 224).
[DAKW03] B. Dudney, S. Asbury, J. K. Krozak, K. Wittkopf. J2EE antipatterns.John Wiley & Sons, 2003 (cit. on pp. 280, 281).
[DBCV16] T. Dohmen, M. Bruntink, D. Ceolin, J. Visser. “Towards a Benchmarkfor the Maintainability Evolution of Industrial Software Systems.”In: 2016 Joint Conference of the International Workshop on SoftwareMeasurement and the International Conference on Software Process andProduct Measurement (IWSM-MENSURA). Berlin, Germany: IEEE, Oct.2016, pp. 11–21 (cit. on p. 184).
[DGL+17] N. Dragoni, S. Giallorenzo, A. L. Lafuente, M. Mazzara, F. Montesi,R. Mustafin, L. Safina. “Microservices: Yesterday, Today, and Tomor-row.” In: Present and Ulterior Software Engineering. Cham: SpringerInternational Publishing, 2017, pp. 195–216. arXiv: arXiv:1606.04036v4 (cit. on p. 53).
[DJH+08] F. Deissenboeck, E. Juergens, B. Hummel, S. Wagner, B.M. y. Parareda,M. Pizka. “Tool Support for Continuous Quality Control.” In: IEEESoftware 25.5 (Sept. 2008), pp. 60–67 (cit. on p. 80).
[DLM19] P. Di Francesco, P. Lago, I. Malavolta. “Architecting with microservices:A systematic mapping study.” In: Journal of Systems and Software150.April (Apr. 2019), pp. 77–97 (cit. on p. 83).
[DMT13] A. Demange, N. Moha, G. Tremblay. “Detection of SOA Patterns.”In: Service-Oriented Computing. ICSOC 2013. Lecture Notes in Com-puter Science. Springer, Berlin, Heidelberg, 2013, pp. 114–130 (cit. onp. 111).
[DN02] L. Dobrica, E. Niemela. “A survey on software architecture analysismethods.” In: IEEE Transactions on Software Engineering 28.7 (July2002), pp. 638–653 (cit. on p. 76).
Bibliography 313

[DOK+17] M. Daagi, A. Ouniy, M. Kessentini, M.M. Gammoudi, S. Bouktif. “WebService Interface Decomposition Using Formal Concept Analysis.” In:2017 IEEE International Conference on Web Services (ICWS). IEEE,June 2017, pp. 172–179 (cit. on p. 113).
[DW16] P. Dmitriev, X. Wu. “Measuring Metrics.” In: Proceedings of the 25thACM International on Conference on Information and Knowledge Man-agement - CIKM ’16. New York, New York, USA: ACM Press, 2016,pp. 429–437 (cit. on p. 184).
[ECPB12] T. Erl, B. Carlyle, C. Pautasso, R. Balasubramanian. SOA with REST:Principles, Patterns & Constraints for Building Enterprise Solutions withREST. The Prentice Hall Service Technology Series from Thomas Erl.Pearson Education, 2012 (cit. on pp. 45, 224, 226, 227, 234).
[EDF96] E. F. Ecklund, L.M. L. Delcambre, M. J. Freiling. “Change cases.” In:Proceedings of the 11th ACM SIGPLAN conference on Object-orientedprogramming, systems, languages, and applications - OOPSLA ’96. NewYork, New York, USA: ACM Press, 1996, pp. 342–358 (cit. on p. 76).
[EEBF04] M. El-Wakil, A. El-Bastawisi, M. Boshra, A. Fahmy. “Object-orienteddesign quality models - A survey and comparison.” In: 2nd Interna-tional Conference on Informatics and Systems. 2004, pp. 1–11 (cit. onp. 73).
[ELBH18] T. Engel, M. Langermeier, B. Bauer, A. Hofmann. “Evaluation of Mi-croservice Architectures: A Metric and Tool-Based Approach.” In:Lecture Notes in Business Information Processing. Ed. by J. Mendling,H. Mouratidis. Vol. 317. Lecture Notes in Business Information Pro-cessing. Cham: Springer International Publishing, 2018, pp. 74–89(cit. on pp. 89, 114).
[Erl05] T. Erl. Service-Oriented Architecture: Concepts, Technology, and Design.Upper Saddle River, NJ, USA: Prentice Hall PTR, 2005 (cit. on pp. 41,233).
[Erl09] T. Erl. SOA Design Patterns. Boston, MA, USA: Pearson Education, 2009(cit. on pp. 41, 42, 70, 224, 226, 227, 234, 250).
[ERR18] S. Esparrachiari, T. Reilly, A. Rentz. “Tracking and Controlling Mi-croservice Dependencies.” In: Queue 16.4 (Aug. 2018), pp. 44–65(cit. on p. 193).
314 Bibliography
[ESSD08] S. Easterbrook, J. Singer, M.-A. Storey, D. Damian. “Selecting Em-pirical Methods for Software Engineering Research.” In: Guide toAdvanced Empirical Software Engineering. London: Springer London,2008, pp. 285–311 (cit. on p. 23).
[Eva04] E. Evans. Domain-driven Design: Tackling Complexity in the Heart ofSoftware. Addison-Wesley, 2004 (cit. on pp. 51, 52, 226).
[EZG15] T. Espinha, A. Zaidman, H.-G. Gross. “Web API growing pains: Looselycoupled yet strongly tied.” In: Journal of Systems and Software 100(Feb. 2015), pp. 27–43 (cit. on p. 115).
[FBB+12] K. A. Ferreira, M. A. Bigonha, R. S. Bigonha, L. F. Mendes, H. C. Almeida.“Identifying thresholds for object-oriented software metrics.” In: Jour-nal of Systems and Software 85.2 (Feb. 2012), pp. 244–257 (cit. onp. 183).
[FBZW19] J. Fritzsch, J. Bogner, A. Zimmermann, S. Wagner. “From Mono-lith to Microservices: A Classification of Refactoring Approaches.”In: Software Engineering Aspects of Continuous Development and NewParadigms of Software Production and Deployment. Ed. by J.-M. Bruel,M. Mazzara, B. Meyer. Toulouse, France: Springer, 2019, pp. 128–141(cit. on p. 117).
[FHG14] R. Ferenc, P. Hegedűs, T. Gyimóthy. “Software Product Quality Mod-els.” In: Evolving Software Systems. Berlin, Heidelberg: Springer BerlinHeidelberg, 2014, pp. 65–100 (cit. on p. 36).
[FHH+13] Z. Feng, P. C. K. Hung, K. He, Y. Ma, M. Farwick, B. Li, R. Peng. “To-wards a Taxonomy Framework of Evolution for SOA Solution: From aPractical Point of View.” In: Lecture Notes in Computer Science (includ-ing subseries Lecture Notes in Artificial Intelligence and Lecture Notesin Bioinformatics). Vol. 7652 LNCS. Springer, Berlin, Heidelberg, Oct.2013, pp. 261–274 (cit. on p. 116).
[FHPM11] Z. Feng, K. He, R. Peng, Y. Ma. “Taxonomy for Evolution of Service-Based System.” In: 2011 IEEE World Congress on Services. IEEE, July2011, pp. 331–338 (cit. on p. 91).
[Fie00] R. Fielding. “Architectural Styles and the Design of Network-basedSoftware Architectures.” Doctor of Philosophy. University of California,Irvine, 2000 (cit. on p. 44).
Bibliography 315

[FJW+18] D. Falessi, N. Juristo, C. Wohlin, B. Turhan, J. Münch, A. Jedlitschka,M. Oivo. “Empirical software engineering experts on the use of stu-dents and professionals in experiments.” In: Empirical Software Engi-neering 23.1 (Feb. 2018), pp. 452–489 (cit. on p. 250).
[FL13] J. L. Fiadeiro, A. Lopes. “A model for dynamic reconfiguration inservice-oriented architectures.” In: Software & Systems Modeling 12.2(May 2013), pp. 349–367 (cit. on p. 102).
[FLR+14] C. Fehling, F. Leymann, R. Retter, W. Schupeck, P. Arbitter. CloudComputing Patterns. Vienna: Springer Vienna, 2014 (cit. on pp. 39,65).
[FML17] P. D. Francesco, I. Malavolta, P. Lago. “Research on Architecting Mi-croservices: Trends, Focus, and Potential for Industrial Adoption.” In:2017 IEEE International Conference on Software Architecture (ICSA).IEEE, Apr. 2017, pp. 21–30 (cit. on p. 49).
[Fok14] M. Fokaefs. “WSDarwin: A Framework for the Support of Web Ser-vice Evolution.” In: 2014 IEEE International Conference on SoftwareMaintenance and Evolution. IEEE, Sept. 2014, pp. 668–668 (cit. onp. 116).
[FOMM10] T. Fritz, J. Ou, G. C. Murphy, E. Murphy-Hill. “A degree-of-knowledgemodel to capture source code familiarity.” In: Proceedings of the 32ndACM/IEEE International Conference on Software Engineering - ICSE ’10.Vol. 1. New York, New York, USA: ACM Press, 2010, p. 385 (cit. onp. 61).
[Fow01] M. Fowler. “Reducing coupling.” In: IEEE Software 18.4 (July 2001),pp. 102–104 (cit. on p. 64).
[Fow02] M. Fowler. Patterns of Enterprise Application Architecture. Addison-Wesley Signature Series (Fowler). Pearson Education, 2002 (cit. onp. 39).
[Fow10] M. Fowler. RichardsonMaturity Model. 2010.url: https://martinfowler.com/articles/richardsonMaturityModel.html (visited on 06/27/2019)(cit. on p. 45).
316 Bibliography

[Fow15] M. Fowler.Microservices Resource Guide. 2015.url: http://martinfowler.com/microservices (visited on 03/05/2018) (cit. on pp. 49, 50,233).
[Fow99] M. Fowler. Refactoring: Improving the Design of Existing Code. Addison-Wesley Professional, 1999 (cit. on pp. 69, 273).
[FS16] M. Fokaefs, E. Stroulia. “Software Evolution in Web-Service Ecosys-tems: A Game-Theoretic Model.” In: Service Science 8.1 (Mar. 2016),pp. 1–18 (cit. on pp. 106, 116).
[FS17] B. Fitzgerald, K.-J. Stol. “Continuous software engineering: A roadmapand agenda.” In: Journal of Systems and Software 123 (Jan. 2017),pp. 176–189 (cit. on p. 79).
[FT02] R. T. Fielding, R.N. Taylor. “Principled design of the modern Webarchitecture.” In: ACM Transactions on Internet Technology 2.2 (May2002), pp. 115–150 (cit. on p. 44).
[GA11] M. Gebhart, S. Abeck. “Metrics for evaluating service designs based onSoaML.” In: International Journal on Advances in Software 4.1 (2011),pp. 61–75 (cit. on pp. 88, 177).
[GA12] M. Galster, P. Avgeriou. “Qualitative Analysis of the Impact of SOAPatterns on Quality Attributes.” In: 2012 12th International Conferenceon Quality Software. IEEE, Aug. 2012, pp. 167–170 (cit. on pp. 39,93).
[Gar14] D. Garlan. “Software architecture: a travelogue.” In: Proceedings ofthe on Future of Software Engineering - FOSE 2014. New York, NewYork, USA: ACM Press, 2014, pp. 29–39 (cit. on p. 32).
[GBO+10] M. Gebhart, M. Baumgartner, S. Oehlert, M. Blersch, S. Abeck. “Evalu-ation of Service Designs Based on SoaML.” In: 2010 Fifth InternationalConference on Software Engineering Advances. IEEE, Aug. 2010, pp. 7–13 (cit. on p. 114).
[GCF+17] G. Granchelli, M. Cardarelli, P. D. Francesco, I. Malavolta, L. Iovino,A. D. Salle. “Towards Recovering the Software Architecture ofMicroservice-Based Systems.” In: 2017 IEEE International Conference on SoftwareArchitecture Workshops (ICSAW). IEEE, Apr. 2017, pp. 46–53 (cit. onpp. 88, 110).
Bibliography 317

[GGP09] J. Garzás, F. García, M. Piattini. “Do Rules and Patterns Affect DesignMaintainability?” In: Journal of Computer Science and Technology 24.2(Mar. 2009), pp. 262–272 (cit. on p. 91).
[GHJV94] E. Gamma, R. Helm, R. Johnson, J. Vlissides. Design Patterns: Ele-ments of Reusable Object-Oriented Software. Boston, MA, USA: Addison-Wesley, 1994, p. 395 (cit. on pp. 39, 224).
[GL09] Q. Gu, P. Lago. “Exploring service-oriented system engineering chal-lenges: a systematic literature review.” In: Service Oriented Computingand Applications 3.3 (Sept. 2009), pp. 171–188 (cit. on p. 82).
[GL11] A. Goeb, K. Lochmann. “A software quality model for SOA.” In: Pro-ceedings of the 8th international workshop on Software quality - WoSQ’11. New York, New York, USA: ACM Press, 2011, p. 18 (cit. on p. 88).
[GL18] J. Ghofrani, D. Lübke. “Challenges of Microservices Architecture: ASurvey on the State of the Practice.” In: 10th Central European Work-shop on Services and their Composition (ZEUS). Vol. 10th. Dresden,Germany: CEUR-WS.org, 2018 (cit. on p. 86).
[God03] P. Godfrey-Smith. Theory and Reality: An Introduction to the Philosophyof Science. Chicago, IL, USA: University of Chicago Press, 2003 (cit. onpp. 22, 23).
[GPEM09] J. Garcia, D. Popescu, G. Edwards, N. Medvidovic. “Toward a Catalogueof Architectural Bad Smells.” In: Architectures for adaptive . . . 2009,pp. 146–162 (cit. on pp. 280, 281).
[HA05] S. Hove, B. Anda. “Experiences from Conducting Semi-structuredInterviews in Empirical Software Engineering Research.” In: 11thIEEE International Software Metrics Symposium (METRICS’05). Metrics.IEEE, 2005, pp. 23–23 (cit. on p. 137).
[Hal77] M.H. Halstead. Elements of Software Science (Operating and Program-ming Systems Series). New York, NY, USA: Elsevier Science Inc., 1977(cit. on p. 72).
[HBFG12] P. Hegedűs, D. Bán, R. Ferenc, T. Gyimóthy. “Myth or Reality? Ana-lyzing the Effect of Design Patterns on Software Maintainability.” In:Communications in Computer and Information Science. Berlin, Heidel-berg: Springer, 2012, pp. 138–145 (cit. on pp. 39, 92).
318 Bibliography
[HCA09] M. Hirzalla, J. Cleland-Huang, A. Arsanjani. “A Metrics Suite for Eval-uating Flexibility and Complexity in Service Oriented Architectures.”In: Service-Oriented Computing – ICSOC 2008 Workshops: ICSOC 2008International Workshops, Sydney, Australia, December 1st, 2008, Re-vised Selected Papers. Ed. by B. J. Krämer, K.-J. Lin, P. Narasimhan.Vol. 4749. Lecture Notes in Computer Science. Berlin, Heidelberg:Springer Berlin Heidelberg, 2009, pp. 41–52 (cit. on pp. 165, 167–169, 183, 260, 261).
[Hen10] K. Henney. 97 Things Every Programmer Should Know. O’Reilly Media,2010 (cit. on p. 51).
[HKV07] I. Heitlager, T. Kuipers, J. Visser. “A Practical Model for MeasuringMaintainability.” In: 6th International Conference on the Quality ofInformation and Communications Technology (QUATIC 2007). IEEE,Sept. 2007, pp. 30–39 (cit. on pp. 74, 128).
[HLSV17] F. Haupt, F. Leymann, A. Scherer, K. Vukojevic-Haupt. “A Frameworkfor the Structural Analysis of REST APIs.” In: 2017 IEEE InternationalConference on Software Architecture (ICSA). Gothenburg, Sweden:IEEE, Apr. 2017, pp. 55–58 (cit. on pp. 88, 177, 178, 183).
[HLV18] F. Haupt, F. Leymann, K. Vukojevic-Haupt. “API governance supportthrough the structural analysis of REST APIs.” In: Computer Science -Research and Development 33.3-4 (Aug. 2018), pp. 291–303 (cit. onp. 181).
[HRW00] M. Host, B. Regnell, C. Wohlin. “Using students as subjects - a compar-ative study of students and professionals in lead-time impact assess-ment.” In: Empirical Software Engineering 5.3 (2000), pp. 201–214(cit. on p. 250).
[HSLP08] R. Haesen, M. Snoeck, W. Lemahieu, S. Poelmans. “On the Definitionof Service Granularity and Its Architectural Impact.” In: AdvancedInformation Systems Engineering. Berlin, Heidelberg: Springer BerlinHeidelberg, 2008, pp. 375–389 (cit. on p. 62).
[HW03] G. Hohpe, B. Woolf. Enterprise Integration Patterns: Designing, Building,and Deploying Messaging Solutions. Boston, MA, USA: Addison-WesleyLongman Publishing Co., Inc., 2003 (cit. on pp. 37, 39).
Bibliography 319

[HW08] H. Hofmeister, G. Wirtz. “Supporting Service-Oriented Design withMetrics.” In: 2008 12th International IEEE Enterprise Distributed ObjectComputing Conference. IEEE, Sept. 2008, pp. 191–200 (cit. on pp. 165,167, 171, 174).
[HWB18] S. Haselbock, R. Weinreich, G. Buchgeher. “An Expert Interview Studyon Areas of Microservice Design.” In: 2018 IEEE 11th Conference onService-Oriented Computing and Applications (SOCA). IEEE, Nov. 2018,pp. 137–144 (cit. on p. 86).
[HZC11] M. Hirzalla, A. Zisman, J. Cleland-Huang. “Using Traceability to Sup-port SOA Impact Analysis.” In: 2011 IEEE World Congress on Services.IEEE, July 2011, pp. 145–152 (cit. on pp. 106, 114).
[Int11a] International Organization For Standardization. ISO/IEC 25010 - Sys-tems and software engineering - Systems and software Quality Require-ments and Evaluation (SQuaRE) - System and software quality models.2011 (cit. on pp. 36, 57).
[Int11b] International Organization For Standardization. ISO/IEC 42010:2011.2011 (cit. on pp. 34, 35).
[ISH+12] C. Inzinger, B. Satzger, W. Hummer, P. Leitner, S. Dustdar. “Non-intrusive policy optimization for dependable and adaptive service-oriented systems.” In: Proceedings of the 27th Annual ACM Symposiumon Applied Computing - SAC ’12. New York, New York, USA: ACM Press,2012, p. 504 (cit. on p. 101).
[JB05] A. Jansen, J. Bosch. “Software Architecture as a Set of ArchitecturalDesign Decisions.” In: 5th Working IEEE/IFIP Conference on SoftwareArchitecture (WICSA’05). Vol. 2005. IEEE, 2005, pp. 109–120 (cit. onp. 32).
[JB11] C. Jones, O. Bonsignour. The Economics of Software Quality. PearsonEducation, 2011 (cit. on p. 18).
[JCP08] A. Jedlitschka, M. Ciolkowski, D. Pfahl. “Reporting Experiments inSoftware Engineering.” In: Guide to Advanced Empirical Software Engi-neering. London: Springer London, 2008, pp. 201–228 (cit. on p. 246).
320 Bibliography

[JGV+14] M. A. Jimenez, A. V. Gomez, N.M. Villegas, G. Tamura, L. Duchien. “AFramework for Automated and Composable Testing of Component-Based Services.” In: 2014 IEEE 8th International Symposium on theMaintenance and Evolution of Service-Oriented and Cloud-Based Systems.IEEE, Sept. 2014, pp. 1–10 (cit. on p. 102).
[Jon06] S. Jones. SOA anti-patterns. 2006. url: https://www.infoq.com/articles/SOA-anti-patterns (cit. on pp. 280, 281).
[KABC96] R. Kazman, G. Abowd, L. Bass, P. Clements. “Scenario-based analysisof software architecture.” In: IEEE Software 13.6 (1996), pp. 47–55(cit. on pp. 75, 76, 207).
[Kas05] M. Kasunic. Designing an Effective Survey. Tech. rep. Pittsburgh, PA:Carnegie Mellon University, Software Engineering Institute, 2005,p. 143 (cit. on pp. 123, 124).
[KC07] B. Kitchenham, S. Charters. Guidelines for performing Systematic Lit-erature reviews in Software Engineering. Tech. rep. Keele, UK: Schoolof Computer Science and Mathematics, Keele University, 2007, p. 65(cit. on pp. 99, 275, 288).
[KDG+12] H. Koziolek, D. Domis, T. Goldschmidt, P. Vorst, R. J. Weiss. “MOR-PHOSIS: A Lightweight Method Facilitating Sustainable SoftwareArchitectures.” In: 2012 Joint Working IEEE/IFIP Conference on Soft-ware Architecture and European Conference on Software Architecture.IEEE, Aug. 2012, pp. 253–257 (cit. on p. 90).
[KDG09] F. Khomh, M. Di Penta, Y.-G. Gueheneuc. “An Exploratory Study of theImpact of Code Smells on Software Change-proneness.” In: 2009 16thWorking Conference on Reverse Engineering. IEEE, 2009, pp. 75–84(cit. on p. 39).
[KDJ04] B. Kitchenham, T. Dyba, M. Jorgensen. “Evidence-based software en-gineering.” In: Proceedings. 26th International Conference on SoftwareEngineering. IEEE Comput. Soc, 2004, pp. 273–281 (cit. on p. 22).
[KEM12] M. Kassab, G. El-Boussaidi, H. Mili. “A Quantitative Evaluation ofthe Impact of Architectural Patterns on Quality Requirements.” In:Software Engineering Research,Management and Applications 2011.Vol. NA. Springer Berlin Heidelberg, 2012, pp. 173–184 (cit. on p. 92).
Bibliography 321

[Kem95] C. F. Kemerer. “Software complexity and software maintenance: Asurvey of empirical research.” In: Annals of Software Engineering 1.1(Dec. 1995), pp. 1–22 (cit. on p. 63).
[KFD17] M. Kuhrmann, D.M. Fernández, M. Daneva. “On the pragmatic de-sign of literature studies in software engineering: an experience-based guideline.” In: Empirical Software Engineering 22.6 (Dec. 2017),pp. 2852–2891. arXiv: 1612.03583 (cit. on p. 278).
[KG10a] J. S. Kim, D. Garlan. “Analyzing architectural styles.” In: Journal ofSystems and Software 83.7 (July 2010), pp. 1216–1235 (cit. on p. 36).
[KG10b] J. Kumar Chhabra, V. Gupta. “A Survey of Dynamic Software Metrics.”In: Journal of Computer Science and Technology 25.5 (Sept. 2010),pp. 1016–1029 (cit. on p. 73).
[KH19] H. Knoche, W. Hasselbring. “Drivers and Barriers for MicroserviceAdoption – A Survey among Professionals in Germany.” In: EnterpriseModelling and Information Systems Architectures (EMISAJ) 14.1 (2019),pp. 1–35 (cit. on p. 19).
[Kha14] H. Khanh Dam. “Predicting change impact in Web service ecosystems.”In: International Journal of Web Information Systems 10.3 (Aug. 2014),pp. 275–290 (cit. on p. 115).
[Kit89] B. A. Kitchenham. “Software quality assurance.” In: Microprocessorsand Microsystems 13.6 (July 1989), pp. 373–381 (cit. on p. 69).
[KKC00] R. Kazman, M. Klein, P. Clements. ATAM: Method for ArchitectureEvaluation. Tech. rep. August. Pittsburgh, PA: Software EngineeringInstitute, Carnegie Mellon University, 2000 (cit. on pp. 77, 207).
[KKCR09] T. Kohlborn, A. Korthaus, T. Chan, M. Rosemann. “Identificationand Analysis of Business and Software Services—A Consolidated Ap-proach.” In: IEEE Transactions on Services Computing 2.1 (Jan. 2009),pp. 50–64 (cit. on p. 113).
[KKR17] L. Kumar, A. Krishna, S. K. Rath. “The impact of feature selection onmaintainability prediction of service-oriented applications.” In: ServiceOriented Computing and Applications 11.2 (June 2017), pp. 137–161(cit. on p. 114).
322 Bibliography

[KM04] B. Kitchenham, E. Mendes. “Software productivity measurement usingmultiple size measures.” In: IEEE Transactions on Software Engineering30.12 (Dec. 2004), pp. 1023–1035 (cit. on p. 61).
[Kne18] R. Kneuper. “Software and Software Process Measurement.” In: Soft-ware Processes and Life Cycle Models. Cham: Springer InternationalPublishing, 2018, pp. 261–285 (cit. on p. 70).
[KNO12] P. Kruchten, R. L. Nord, I. Ozkaya. “Technical Debt: From Metaphor toTheory and Practice.” In: IEEE Software 29.6 (Nov. 2012), pp. 18–21(cit. on pp. 67, 68).
[KP08] B. A. Kitchenham, S. L. Pfleeger. “Personal Opinion Surveys.” In: Guideto Advanced Empirical Software Engineering. London: Springer London,2008, pp. 63–92 (cit. on p. 123).
[Kru95] P. Kruchten. “Architecture blueprints—the “4+1” view model of soft-ware architecture.” In: Tutorial proceedings on TRI-Ada ’91 Ada’s rolein global markets: solutions for a changing complex world - TRI-Ada’95. Vol. 12. November. New York, New York, USA: ACM Press, 1995,pp. 540–555 (cit. on p. 33).
[KSB+11] H. Koziolek, B. Schlich, C. Bilich, R. Weiss, S. Becker, K. Krogmann,M. Trifu, R. Mirandola, A. Koziolek. “An industrial case study onquality impact prediction for evolving service-oriented software.” In:Proceeding of the 33rd international conference on Software engineering- ICSE ’11. New York, New York, USA: ACM Press, 2011, p. 776 (cit. onp. 114).
[KT18] C.M. Kulkarni, M. Takalikar. “Analysis of REST API Implementation.”In: International Journal of Scientific Research in Computer Science, En-gineering and Information Technology (IJSRCSEIT) 3.5 (2018), pp. 108–113 (cit. on p. 177).
[KUSM18] M. Kleehaus, Ö. Uludağ, P. Schäfer, F. Matthes. “MICROLYZE: A Frame-work for Recovering the Software Architecture in Microservice-BasedEnvironments.” In: Lecture Notes in Business Information Processing.Vol. 317. Springer, Cham, June 2018, pp. 148–162 (cit. on pp. 105,110).
Bibliography 323
[KZ07] J. Kral, M. Zemlicka. “The Most Important Service-Oriented Antipat-terns.” In: International Conference on Software Engineering Advances(ICSEA 2007). Icsea. IEEE, Aug. 2007, pp. 29–29 (cit. on pp. 280, 281,284).
[KŽ09] J. Král, M. Žemlička. “Popular SOA antipatterns.” In: ComputationWorld: Future Computing, Service Computation, Adaptive, Content, Cog-nitive, Patterns, ComputationWorld 2009. IEEE, Nov. 2009, pp. 271–276 (cit. on pp. 94, 280, 281).
[KZN12] M. Kim, T. Zimmermann, N. Nagappan. “A field study of refactoringchallenges and benefits.” In: Proceedings of the ACM SIGSOFT 20thInternational Symposium on the Foundations of Software Engineering- FSE ’12. New York, New York, USA: ACM Press, 2012, p. 1 (cit. onp. 70).
[LCZ12] Y. Liu, W. Cazzola, B. Zhang. “Towards a colored reflective Petri-netapproach to model self-evolving service-oriented architectures.” In:Proceedings of the 27th Annual ACM Symposium on Applied Computing -SAC ’12. New York, New York, USA: ACM Press, 2012, p. 1858 (cit. onp. 110).
[LEMP07] L. Lambers, H. Ehrig, L. Mariani, M. Pezzè. “Iterative model-drivendevelopment of adaptable service-based applications.” In: Proceedingsof the twenty-second IEEE/ACM international conference on Automatedsoftware engineering - ASE ’07. New York, New York, USA: ACM Press,2007, p. 453 (cit. on p. 110).
[LH93] W. Li, S. Henry. “Object-oriented metrics that predict maintainability.”In: Journal of Systems and Software 23.2 (Nov. 1993), pp. 111–122(cit. on p. 72).
[Lil09] C. Lilienthal. “Architectural Complexity of Large-Scale Software Sys-tems.” In: 2009 13th European Conference on Software Maintenanceand Reengineering. IEEE, 2009, pp. 17–26 (cit. on p. 63).
[LM06] M. Lanza, R. Marinescu. Object-Oriented Metrics in Practice. Berlin,Heidelberg: Springer Berlin Heidelberg, 2006 (cit. on p. 183).
[LML+15] M. Leppanen, S. Makinen, S. Lahtinen, O. Sievi-Korte, A.-P. Tuovinen,T. Mannisto. “Refactoring-a Shot in the Dark?” In: IEEE Software 32.6(Nov. 2015), pp. 62–70 (cit. on pp. 70, 85).
324 Bibliography

[Lou06] P. Louridas. “Static code analysis.” In: IEEE Software 23.4 (July 2006),pp. 58–61 (cit. on p. 71).
[LPM15] H. Leopold, F. Pittke, J. Mendling. “Automatic service derivation frombusiness process model repositories via semantic technology.” In:Journal of Systems and Software 108 (Oct. 2015), pp. 134–147 (cit. onpp. 106, 112).
[LRRA11] M. Leotta, F. Ricca, G. Reggio, E. Astesiano. “Comparing the Main-tainability of Two Alternative Architectures of a Postal System: SOAvs. Non-SOA.” In: 2011 15th European Conference on Software Main-tenance and Reengineering. IEEE, Mar. 2011, pp. 317–320 (cit. onp. 115).
[LRS02] F. Leymann, D. Roller, M.-T. Schmidt. “Web services and businessprocess management.” In: IBM Systems Journal 41.2 (2002), pp. 198–211 (cit. on p. 44).
[LRW+97] M. Lehman, J. Ramil, P. Wernick, D. Perry, W. Turski. “Metrics andlaws of software evolution-the nineties view.” In: Proceedings FourthInternational Software Metrics Symposium. IEEE Comput. Soc, 1997,pp. 20–32 (cit. on p. 56).
[LS07] G. Lewis, D. B. Smith. “Developing Realistic Approaches for the Mi-gration of Legacy Components to Service-Oriented Architecture En-vironments.” In: Trends in Enterprise Application Architecture. Berlin,Heidelberg: Springer Berlin Heidelberg, 2007, pp. 226–240 (cit. onp. 102).
[LS18] V. Lenarduzzi, O. Sievi-Korte. “On the negative impact of team inde-pendence in microservices software development.” In: Proceedingsof the 19th International Conference on Agile Software DevelopmentCompanion - XP ’18. New York, New York, USA: ACM Press, 2018,pp. 1–4 (cit. on p. 19).
[LST78] B. P. Lientz, E. B. Swanson, G. E. Tompkins. “Characteristics of appli-cation software maintenance.” In: Communications of the ACM 21.6(June 1978), pp. 466–471 (cit. on p. 18).
[LT18] V. Lenarduzzi, D. Taibi. “Microservices, Continuous Architecture, andTechnical Debt Interest: An Empirical Study.” In: Euromicro SEAA.June. Prague, Czech Republic, 2018 (cit. on p. 87).
Bibliography 325

[LTC03] M. Lindvall, R. T. Tvedt, P. Costa. “An empirically-based process forsoftware architecture evaluation.” In: Empirical Software Engineering8.1 (2003), pp. 83–108 (cit. on p. 73).
[LZP+19] D. Lübke, O. Zimmermann, C. Pautasso, U. Zdun, M. Stocker. “Inter-face Evolution Patterns — Balancing Compatibility and Extensibilityacross Service Life Cycles.” In: Proceedings of the 24th European Con-ference on Pattern Languages of Programs - EuroPLop ’19. New York,New York, USA: ACM Press, July 2019, pp. 1–24 (cit. on p. 94).
[MC16] R. Malhotra, A. Chug. “An empirical study to assess the effects of refac-toring on software maintainability.” In: 2016 International Conferenceon Advances in Computing, Communications and Informatics (ICACCI).IEEE, Sept. 2016, pp. 110–117 (cit. on p. 70).
[McC76] T. J. McCabe. “A Complexity Measure.” In: IEEE Transactions on Soft-ware Engineering SE-2.4 (Dec. 1976), pp. 308–320 (cit. on pp. 63, 72,260, 261).
[MHB15] C. Matt, T. Hess, A. Benlian. “Digital Transformation Strategies.” In:Business & Information Systems Engineering 57.5 (Oct. 2015), pp. 339–343 (cit. on p. 18).
[Mil56] G. A. Miller. “The Magical Number Seven, Plus or Minus Two: SomeLimits on Our Capacity for Processing Information.” In: PsychologicalReview 101.2 (1956), pp. 343–352 (cit. on p. 62).
[MKMG97] R. Monroe, A. Kompanek, R. Melton, D. Garlan. “Architectural styles,design patterns, and objects.” In: IEEE Software 14.1 (1997), pp. 43–52 (cit. on p. 36).
[MM11] Y. I. Mansour, S.H. Mustafa. “Assessing Internal Software QualityAttributes of the Object-Oriented and Service-Oriented Software De-velopment Paradigms: A Comparative Study.” In: Journal of SoftwareEngineering and Applications 04.04 (2011), pp. 244–252 (cit. on p. 19).
[MM14] A. A. Mohammed Elhag, R. Mohamad. “Metrics for evaluating thequality of service-oriented design.” In: 2014 8th. Malaysian SoftwareEngineering Conference (MySEC). IEEE, Sept. 2014, pp. 154–159 (cit.on p. 106).
326 Bibliography
[MPL17] G. Me, G. Procaccianti, P. Lago. “Challenges on the Relationship be-tween Architectural Patterns and Quality Attributes.” In: 2017 IEEEInternational Conference on Software Architecture (ICSA). IEEE, Apr.2017, pp. 141–144 (cit. on p. 39).
[MPN+12] N. Moha, F. Palma, M. Nayrolles, B. J. Conseil, Y.-G. Guéhéneuc,B. Baudry, J.-M. Jézéquel. “Specification and Detection of SOA An-tipatterns.” In: Icsoc 2012. 2012, pp. 1–16 (cit. on p. 94).
[MV14] E. MacLennan, J.-P. Van Belle. “Factors affecting the organizationaladoption of service-oriented architecture (SOA).” In: Information Sys-tems and e-Business Management 12.1 (Feb. 2014), pp. 71–100 (cit. onp. 48).
[MW18] B. Mayer, R. Weinreich. “An Approach to Extract the Architectureof Microservice-Based Software Systems.” In: 2018 IEEE Symposiumon Service-Oriented System Engineering (SOSE). Bamberg, Germany:IEEE, Mar. 2018, pp. 21–30 (cit. on pp. 88, 177).
[MZD11] C. Mayr, U. Zdun, S. Dustdar. “View-based model-driven architecturefor enhancing maintainability of data access services.” In: Data &Knowledge Engineering 70.9 (Sept. 2011), pp. 794–819 (cit. on p. 105).
[MZM+17] C. Mateos, A. Zunino, S. Misra, D. Anabalon, A. Flores. “ManagingWebService Interface Complexity via an OOMetric-based Early Approach.”In: CLEI Electronic Journal 20.3 (Dec. 2017), p. 2 (cit. on p. 262).
[New15] S. Newman. Building Microservices: Designing Fine-Grained Systems.1st. Sebastopol, CA, USA: O’Reilly Media, 2015, p. 280 (cit. on pp. 49,51, 55, 177).
[NKFW19] S. Niedermaier, F. Koetter, A. Freymann, S. Wagner. “On Observabilityand Monitoring of Distributed Systems – An Industry Interview Study.”In: Service-Oriented Computing. ICSOC 2019. Lecture Notes in ComputerScience. Vol. 11895. Cham, Germany: Springer, 2019, pp. 36–52. arXiv:1907.12240 (cit. on p. 193).
[NLB18] A. Neumann, N. Laranjeiro, J. Bernardino. “An Analysis of Public RESTWeb Service APIs.” In: IEEE Transactions on Services Computing PP.c(2018), pp. 1–1 (cit. on p. 177).
Bibliography 327

[NMV13] M. Nayrolles, N. Moha, P. Valtchev. “Improving SOA antipatternsdetection in Service Based Systems by mining execution traces.” In:2013 20th Working Conference on Reverse Engineering (WCRE). IEEE,Oct. 2013, pp. 321–330. arXiv: 1402.6456 (cit. on pp. 112, 280,281).
[NPMG13] M. Nayrolles, F. Palma, N. Moha, Y.-G. Guéhéneuc. “Soda: A ToolSupport for the Detection of SOA Antipatterns.” In: Lecture Notes inComputer Science (including subseries Lecture Notes in Artificial Intelli-gence and Lecture Notes in Bioinformatics). Vol. 7759 LNCS. Springer,Berlin, Heidelberg, Nov. 2013, pp. 451–455 (cit. on p. 112).
[NW14] N.M. Nik Daud, W.M.N. Wan Kadir. “Static and dynamic classifica-tions for SOA structural attributes metrics.” In: 2014 8th. MalaysianSoftware Engineering Conference (MySEC). Langkawi, Malaysia: IEEE,Sept. 2014, pp. 130–135 (cit. on pp. 88, 114).
[Nyg07] M. T. Nygard. Release It!: Design and Deploy Production-Ready Software.1st. Pragmatic Bookshelf, 2007 (cit. on pp. 51, 52).
[OEC17] R. V. O’Connor, P. Elger, P.M. Clarke. “Continuous software engineering-A microservices architecture perspective.” In: Journal of Software:Evolution and Process 29.11 (Nov. 2017), e1866 (cit. on p. 80).
[OGKI15] A. Ouni, R. Gaikovina Kula, M. Kessentini, K. Inoue. “Web ServiceAntipatterns Detection Using Genetic Programming.” In: Proceedings ofthe 2015 on Genetic and Evolutionary Computation Conference - GECCO’15. New York, New York, USA: ACM Press, 2015, pp. 1351–1358(cit. on pp. 280, 281).
[OKIC17] A. Ouni, M. Kessentini, K. Inoue, M.O. Cinneide. “Search-Based WebService Antipatterns Detection.” In: IEEE Transactions on ServicesComputing 10.4 (July 2017), pp. 603–617 (cit. on pp. 280, 281).
[OW14] J.-P. Ostberg, S. Wagner. “On Automatically Collectable Metrics forSoftware Maintainability Evaluation.” In: 2014 Joint Conference of theInternational Workshop on Software Measurement and the InternationalConference on Software Process and Product Measurement. IEEE, Oct.2014, pp. 32–37 (cit. on pp. 72, 74, 128, 262).
328 Bibliography

[PAK+14] F. Palma, L. An, F. Khomh, N. Moha, Y.-G. Gueheneuc. “Investigatingthe Change-Proneness of Service Patterns and Antipatterns.” In: 2014IEEE 7th International Conference on Service-Oriented Computing andApplications. IEEE, Nov. 2014, pp. 1–8 (cit. on pp. 93, 111).
[Pap03] M. Papazoglou. “Service-oriented computing: concepts, characteristicsand directions.” In: Proceedings of the 4th International Conference onWeb Information Systems Engineering (WISE’03). Rome, Italy: IEEEComput. Soc, 2003, p. 10 (cit. on p. 40).
[Par72] D. L. Parnas. “On the criteria to be used in decomposing systemsinto modules.” In: Communications of the ACM 15.12 (Dec. 1972),pp. 1053–1058 (cit. on p. 55).
[Par79] D. Parnas. “Designing Software for Ease of Extension and Contraction.”In: IEEE Transactions on Software Engineering SE-5.2 (Mar. 1979),pp. 128–138 (cit. on p. 55).
[Pau14] C. Pautasso. “RESTful web services: Principles, patterns, emergingtechnologies.” In: Web Services Foundations. Ed. by A. Bouguettaya,Q. Z. Sheng, F. Daniel. Vol. 9781461475. New York, NY: Springer NewYork, 2014, pp. 31–51 (cit. on pp. 44–46).
[PBSK18] R. Plösch, J. Bräuer, M. Saft, C. Körner. “Design Debt Prioritization:A Design Best Practice-Based Approach.” In: Proceedings of the 2018International Conference on Technical Debt - TechDebt ’18. New York,New York, USA: ACM Press, 2018, pp. 95–104 (cit. on p. 184).
[PCW85] D. Parnas, P. Clements, D. Weiss. “The Modular Structure of ComplexSystems.” In: IEEE Transactions on Software Engineering SE-11.3 (Mar.1985), pp. 259–266 (cit. on p. 55).
[PD07] M. Pizka, F. Deißenböck. “How to effectively define and measuremaintainability.” In: Software Measurement European Forum (SMEF2007). Rome, Italy, 2007 (cit. on p. 74).
[Per09] M. Perepletchikov. “Software Design Metrics for Predicting Maintain-ability of Service-Oriented Software.” A thesis submitted in fulfilmentof the requirements for the degree of Doctor of Philosophy. College ofScience, Engineering and Health, RMIT University, Melbourne, Aus-tralia, 2009 (cit. on pp. 260, 262).
Bibliography 329

[PGM+15] F. Palma, J. Gonzalez-Huerta, N. Moha, Y.-G. Guéhéneuc, G. Trem-blay. “Are RESTful APIs Well-Designed? Detection of their Linguistic(Anti)Patterns.” In: Lecture Notes in Computer Science (including sub-series Lecture Notes in Artificial Intelligence and Lecture Notes in Bioin-formatics). Vol. 9435. Berlin, Heidelberg: Springer, 2015, pp. 171–187(cit. on p. 112).
[PH06] M. P. Papazoglou, W.-J. V. D. Heuvel. “Service-oriented design and de-velopment methodology.” In: International Journal of Web Engineeringand Technology 2.4 (2006), p. 412 (cit. on p. 62).
[PJ16] C. Pahl, P. Jamshidi. “Microservices: A Systematic Mapping Study.” In:Proceedings of the 6th International Conference on Cloud Computing andServices Science. Vol. 1. Closer. SCITEPRESS - Science, 2016, pp. 137–146 (cit. on p. 49).
[PM15] F. Palma, N. Mohay. “A study on the taxonomy of service antipatterns.”In: 2015 IEEE 2nd International Workshop on Patterns Promotion andAnti-patterns Prevention (PPAP). IEEE, Mar. 2015, pp. 5–8 (cit. onpp. 112, 280, 281, 284).
[PMP+18] F. Petrillo, P. Merle, F. Palma, N. Moha, Y.-G. Guéhéneuc. “A Lexicaland Semantical Analysis on REST Cloud Computing APIs.” In: Com-munications in Computer and Information Science. Vol. 864. Cham,Germany: Springer, 2018, pp. 308–332 (cit. on p. 177).
[PMTG14] F. Palma, N. Moha, G. Tremblay, Y.-G. Guéhéneuc. “Specification andDetection of SOA Antipatterns in Web Services.” In: Lecture Notes inComputer Science. 2014, pp. 58–73 (cit. on pp. 280, 281).
[PMVV12] E. R. Poort, N. Martens, I. Van De Weerd, H. Van Vliet. “How architectssee non-functional requirements: Beware of modifiability.” In: LectureNotes in Computer Science (including subseries Lecture Notes in ArtificialIntelligence and Lecture Notes in Bioinformatics) 7195 LNCS (2012),pp. 37–51 (cit. on pp. 18, 84).
[PNM+13] F. Palma,M. Nayrolles, N.Moha, Y.-G. Guéhéneuc, B. Baudry, J.-M. Jézéquel.“SOA antipatterns: an approach for their specification and detection.”In: International Journal of Cooperative Information Systems 22.04(Dec. 2013), p. 1341004 (cit. on p. 105).
330 Bibliography

[PR11] M. Perepletchikov, C. Ryan. “A Controlled Experiment for Evaluatingthe Impact of Coupling on the Maintainability of Service-OrientedSoftware.” In: IEEE Transactions on Software Engineering 37.4 (July2011), pp. 449–465 (cit. on p. 114).
[PRF05] M. Perepletchikov, C. Ryan, K. Frampton. “Comparing the impact ofservice-oriented and object-oriented paradigms on the structural prop-erties of software.” In: Lecture Notes in Computer Science (includingsubseries Lecture Notes in Artificial Intelligence and Lecture Notes inBioinformatics) 3762 LNCS (2005), pp. 431–441 (cit. on p. 19).
[PRF07] M. Perepletchikov, C. Ryan, K. Frampton. “Cohesion Metrics for Pre-dicting Maintainability of Service-Oriented Software.” In: SeventhInternational Conference on Quality Software (QSIC 2007). Portland,OR, USA: IEEE, 2007, pp. 328–335 (cit. on pp. 66, 113, 165, 166,172, 183).
[PRFT07] M. Perepletchikov, C. Ryan, K. Frampton, Z. Tari. “Coupling Metricsfor Predicting Maintainability in Service-Oriented Designs.” In: 2007Australian Software Engineering Conference (ASWEC’07). IEEE, Apr.2007, pp. 329–340 (cit. on pp. 113, 165, 166, 169–171, 261).
[PW09] C. Pautasso, E. Wilde. “Why is the web loosely coupled?” In: Proceed-ings of the 18th international conference on World wide web - WWW ’09.New York, New York, USA: ACM Press, 2009, p. 911 (cit. on pp. 64,262).
[PZL08] C. Pautasso, O. Zimmermann, F. Leymann. “Restful web services vs."big"’ web services.” In: Proceeding of the 17th international conferenceon World Wide Web - WWW ’08. New York, New York, USA: ACM Press,2008, p. 805 (cit. on pp. 44, 46).
[QX09] Z. Qingqing, L. Xinke. “Complexity Metrics for Service-Oriented Sys-tems.” In: 2009 Second International Symposium on Knowledge Acqui-sition and Modeling. Vol. 3. IEEE, 2009, pp. 375–378 (cit. on pp. 113,165, 166, 171).
[Raj14] V. Rajlich. “Software evolution and maintenance.” In: Proceedings ofthe on Future of Software Engineering - FOSE 2014. New York, NewYork, USA: ACM Press, 2014, pp. 133–144 (cit. on p. 56).
Bibliography 331

[Raj18] V. Rajlich. “Five recommendations for software evolvability.” In: Jour-nal of Software: Evolution and Process 30.9 (Sept. 2018), e1949 (cit. onp. 59).
[RBW15] M. Riaz, T. Breaux, L. Williams. “How have we evaluated softwarepattern application? A systematic mapping study of research designpractices.” In: Information and Software Technology 65 (Sept. 2015),pp. 14–38 (cit. on pp. 39, 93).
[REW+11] T. Reichherzer, E. El-Sheikh, N. Wilde, L. White, J. Coffey, S. Sim-mons. “Towards intelligent search support for web services evolutionidentifying the right abstractions.” In: 2011 13th IEEE InternationalSymposium on Web Systems Evolution (WSE). IEEE, Sept. 2011, pp. 53–58 (cit. on p. 109).
[RH09] P. Runeson, M. Höst. “Guidelines for conducting and reporting casestudy research in software engineering.” In: Empirical Software Engi-neering 14.2 (Apr. 2009), pp. 131–164. arXiv: 9809069v1 [arXiv:gr-qc](cit. on pp. 137, 138, 140).
[Ric16a] M. Richards. Microservices Antipatterns and Pitfalls. 2016 (cit. onpp. 280, 281).
[Ric16b] M. Richards.Microservices vs. Service-Oriented Architecture. Sebastopol,CA: O’Reilly Media, 2016 (cit. on p. 54).
[Ric19] C. Richardson.Microservices Patterns. 1st. Shelter Island, NY: ManningPublications, 2019 (cit. on pp. 93, 224, 234).
[RLL98] D. Rowe, J. Leaney, D. Lowe. “Defining systems architecture evolv-ability - a taxonomy of change.” In: International Conference on theEngineering of Computer-Based Systems. IEEE, 1998, pp. 45–52 (cit. onpp. 57, 58).
[Rot12] A. Rotem-Gal-Oz. SOA Patterns. Shelter Island, NY: Manning, 2012,p. 296 (cit. on pp. 224, 226, 228, 234, 250, 280, 281).
[RP12] D. Romano, M. Pinzger. “Analyzing the Evolution of Web ServicesUsing Fine-Grained Changes.” In: 2012 IEEE 19th International Con-ference on Web Services. IEEE, June 2012, pp. 392–399 (cit. on p. 115).
332 Bibliography

[RSD06] D. Rud, A. Schmietendorf, R. R. Dumke. “Product Metrics for Service-Oriented Infrastructures.” In: IWSM/MetriKon. 2006 (cit. on pp. 164–166, 170, 171, 260, 262, 263).
[RSHR15] K. Rostami, J. Stammel, R. Heinrich, R. Reussner. “Architecture-basedAssessment and Planning of Change Requests.” In: Proceedings of the11th International ACM SIGSOFT Conference on Quality of SoftwareArchitectures - QoSA ’15. New York, New York, USA: ACM Press, 2015,pp. 21–30 (cit. on p. 90).
[RSSZ19] F. Rademacher, J. Sorgalla, S. Sachweh, A. Zündorf. “A model-drivenworkflow for distributed microservice development.” In: Proceedingsof the 34th ACM/SIGAPP Symposium on Applied Computing - SAC ’19.New York, New York, USA: ACM Press, 2019, pp. 1260–1262 (cit. onp. 116).
[RW11] N. Rozanski, E. Woods. Software Systems Architecture: Working WithStakeholders Using Viewpoints and Perspectives. 2nd. Addison-WesleyProfessional, 2011 (cit. on pp. 31, 34).
[SAM12] D. I. Sjøberg, B. Anda, A. Mockus. “Questioning software maintenancemetrics.” In: Proceedings of the ACM-IEEE international symposium onEmpirical software engineering and measurement - ESEM ’12. Mi. NewYork, New York, USA: ACM Press, 2012, p. 107 (cit. on p. 61).
[SAZ17] M. Shahin, M. Ali Babar, L. Zhu. “Continuous Integration, Delivery andDeployment: A Systematic Review on Approaches, Tools, Challengesand Practices.” In: IEEE Access 5 (2017), pp. 3909–3943 (cit. on p. 79).
[SCKP08] B. Shim, S. Choue, S. Kim, S. Park. “A Design Quality Model for Service-Oriented Architecture.” In: 2008 15th Asia-Pacific Software EngineeringConference. IEEE, 2008, pp. 403–410 (cit. on pp. 87, 113, 164, 165,167, 168).
[SCL16] G. Schermann, J. Cito, P. Leitner. “All the Services Large and Mi-cro: Revisiting Industrial Practice in Services Computing.” In: LectureNotes in Computer Science (including subseries Lecture Notes in Artifi-cial Intelligence and Lecture Notes in Bioinformatics). Ed. by A. Norta,W. Gaaloul, G. R. Gangadharan, H. K. Dam. Vol. 9586. Lecture Notesin Computer Science. Berlin, Heidelberg: Springer Berlin Heidelberg,2016, pp. 36–47 (cit. on pp. 122, 177).
Bibliography 333

[SCLG16] G. Schermann, J. Cito, P. Leitner, H. C. Gall. “Towards quality gates incontinuous delivery and deployment.” In: 2016 IEEE 24th InternationalConference on Program Comprehension (ICPC). Vol. 2016-July. IEEE,May 2016, pp. 1–4 (cit. on p. 80).
[SDJ07] D. I. K. Sjoberg, T. Dyba, M. Jorgensen. “The Future of Empirical Meth-ods in Software Engineering Research.” In: Future of Software Engi-neering (FOSE ’07). Vol. SE-13. 1325. IEEE, May 2007, pp. 358–378(cit. on p. 22).
[SDP+14] D. Steidl, F. Deissenboeck, M. Poehlmann, R. Heinke, B. Uhink-Mergenthaler.“Continuous Software Quality Control in Practice.” In: 2014 IEEE In-ternational Conference on Software Maintenance and Evolution. IEEE,Sept. 2014, pp. 561–564 (cit. on p. 80).
[Sea08] C. B. Seaman. “Qualitative Methods.” In: Guide to Advanced EmpiricalSoftware Engineering. London: Springer London, 2008, pp. 35–62(cit. on pp. 137–140).
[SHM+13] I. Solichah, M. Hamilton, P. Mursanto, C. Ryan, M. Perepletchikov. “Ex-ploration on software complexity metrics for business process modeland notation.” In: 2013 International Conference on Advanced Com-puter Science and Information Systems (ICACSIS). IEEE, Sept. 2013,pp. 31–37 (cit. on p. 114).
[SJC+16] T. Salah, M. Jamal Zemerly, Chan Yeob Yeun, M. Al-Qutayri, Y. Al-Hammadi. “The evolution of distributed systems towardsmicroservicesarchitecture.” In: 2016 11th International Conference for Internet Tech-nology and Secured Transactions (ICITST). IEEE, Dec. 2016, pp. 318–325 (cit. on p. 54).
[SKA15] A. Sharma, M. Kumar, S. Agarwal. “A Complete Survey on SoftwareArchitectural Styles and Patterns.” In: Procedia Computer Science 70(2015), pp. 16–28 (cit. on p. 37).
[SKR08] S. Sarkar, A. Kak, G. Rama. “Metrics for Measuring the Quality ofModularization of Large-Scale Object-Oriented Software.” In: IEEETransactions on Software Engineering 34.5 (Sept. 2008), pp. 700–720(cit. on p. 73).
[SM18] M. Staron, W. Meding. Software Development Measurement Programs.Cham: Springer International Publishing, 2018 (cit. on p. 71).
334 Bibliography

[SME+17] A. Shatnawi, H. Mili, G. El Boussaidi, A. Boubaker, Y.-G. Gueheneuc,N. Moha, J. Privat, M. Abdellatif. “Analyzing Program Dependencies inJava EE Applications.” In: 2017 IEEE/ACM 14th International Confer-ence on Mining Software Repositories (MSR). IEEE, May 2017, pp. 64–74 (cit. on p. 19).
[SMJ15] I. Salman, A. T. Misirli, N. Juristo. “Are Students Representatives of Pro-fessionals in Software Engineering Experiments?” In: 2015 IEEE/ACM37th IEEE International Conference on Software Engineering. Vol. 1.IEEE, May 2015, pp. 666–676 (cit. on p. 250).
[Sne10] H.M. Sneed. “Measuring web service interfaces.” In: 2010 12th IEEEInternational Symposium on Web Systems Evolution (WSE). Timisoara,Romania: IEEE, Sept. 2010, pp. 111–115 (cit. on p. 177).
[SP15] T. Senivongse, A. Puapolthep. “A Maintainability Assessment Modelfor Service-Oriented Systems.” In: Proceedings of the World Congress onEngineering and Computer Science. San Francisco, CA, USA: NewswoodLimited, 2015 (cit. on pp. 88, 165).
[SPQM18] B. Sabir, N. Perveen, U. Qamar, A.W. Muzaffar. “Impact Analysis onEvolution Patterns of Service Oriented Systems.” In: International Con-ference on Engineering, Computing & Information Technology (ICECIT2017). 2018, pp. 61–67 (cit. on p. 90).
[SPR+19] F. Sabir, F. Palma, G. Rasool, Y.-G. Guéhéneuc, N. Moha. “A systematicliterature review on the detection of smells and their evolution inobject-oriented and service-oriented systems.” In: Software: Practiceand Experience 49.1 (Jan. 2019), pp. 3–39 (cit. on pp. 83, 112, 273,289).
[SRK07] S. Sarkar, G. Rama, A. Kak. “API-Based and Information-TheoreticMetrics for Measuring the Quality of Software Modularization.” In:IEEE Transactions on Software Engineering 33.1 (Jan. 2007), pp. 14–32(cit. on p. 73).
[SS09] R. Sindhgatta, B. Sengupta. “An extensible framework for tracingmodel evolution in SOA solution design.” In: Proceeding of the 24thACM SIGPLAN conference companion on Object oriented programmingsystems languages and applications - OOPSLA ’09. New York, New York,USA: ACM Press, 2009, p. 647 (cit. on p. 110).
Bibliography 335

[SSP09] R. Sindhgatta, B. Sengupta, K. Ponnalagu. “Measuring the Qualityof Service Oriented Design.” In: Lecture Notes in Computer Science(including subseries Lecture Notes in Artificial Intelligence and LectureNotes in Bioinformatics). Vol. 5900 LNCS. Springer, Berlin, Heidelberg,Nov. 2009, pp. 485–499 (cit. on p. 113).
[SSS08] F. Shull, J. Singer, D. I. K. Sjøberg. Guide to Advanced Empirical Soft-ware Engineering. Ed. by F. Shull, J. Singer, D. I. K. Sjøberg. London:Springer London, 2008, pp. 1–388. arXiv: arXiv:1011.1669v3 (cit.on p. 22).
[Sta06] M. Stal. “Using architectural patterns and blueprints for service-orientedarchitecture.” In: IEEE Software 23.2 (Mar. 2006), pp. 54–61 (cit. onp. 42).
[STV18] J. Soldani, D. A. Tamburri, W.-J. Van Den Heuvel. “The pains and gainsof microservices: A Systematic grey literature review.” In: Journalof Systems and Software 146.September (Dec. 2018), pp. 215–232(cit. on pp. 83, 289).
[SZZ+18] M. Stocker, O. Zimmermann, U. Zdun, D. Lübke, C. Pautasso. “Inter-face Quality Patterns - Communicating and Improving the Quality ofMicroservices APIs.” In: Proceedings of the 23rd European Conferenceon Pattern Languages of Programs - EuroPLoP ’18. New York, New York,USA: ACM Press, 2018, pp. 1–16 (cit. on p. 94).
[TL18] D. Taibi, V. Lenarduzzi. “On the Definition of Microservice Bad Smells.”In: IEEE Software 35.3 (May 2018), pp. 56–62 (cit. on pp. 94, 112,280, 281).
[TLMT12] D. Tosi, L. Lavazza, S. Morasca, D. Taibi. “On the definition of dynamicsoftware measures.” In: Proceedings of the ACM-IEEE internationalsymposium on Empirical software engineering and measurement - ESEM’12. New York, New York, USA: ACM Press, 2012, p. 39 (cit. on p. 73).
[TLP17] D. Taibi, V. Lenarduzzi, C. Pahl. “Processes, Motivations, and Issues forMigrating to Microservices Architectures: An Empirical Investigation.”In: IEEE Cloud Computing 4.5 (Sept. 2017), pp. 22–32 (cit. on p. 19).
336 Bibliography

[TLP18] D. Taibi, V. Lenarduzzi, C. Pahl. “Architectural Patterns for Microser-vices: A Systematic Mapping Study.” In: Proceedings of the 8th Inter-national Conference on Cloud Computing and Services Science. March.Funchal, Madeira, Portugal: SCITEPRESS - Science and TechnologyPublications, 2018, pp. 221–232 (cit. on p. 94).
[TM12] A. Tahir, S. G. MacDonell. “A systematic mapping study on dynamicmetrics and software quality.” In: 2012 28th IEEE International Confer-ence on Software Maintenance (ICSM). IEEE, Sept. 2012, pp. 326–335(cit. on p. 73).
[TPB+15] M. Tufano, F. Palomba, G. Bavota, R. Oliveto, M. Di Penta, A. De Lucia,D. Poshyvanyk. “When and Why Your Code Starts to Smell Bad.”In: 2015 IEEE/ACM 37th IEEE International Conference on SoftwareEngineering. Vol. 1. 11. IEEE, May 2015, pp. 403–414 (cit. on p. 273).
[TS19] D. Taibi, K. Systä. “From Monolithic Systems to Microservices: A De-composition Framework based on Process Mining.” In: Proceedingsof the 9th International Conference on Cloud Computing and ServicesScience. SCITEPRESS - Science and Technology Publications, 2019,pp. 153–164 (cit. on p. 89).
[TSZ18] S. Tragatschnig, S. Stevanetic, U. Zdun. “Supporting the evolution ofevent-driven service-oriented architectures using change patterns.” In:Information and Software Technology 100 (Aug. 2018), pp. 133–146(cit. on p. 111).
[VCB+18] C. C. Venters, R. Capilla, S. Betz, B. Penzenstadler, T. Crick, S. Crouch,E. Y. Nakagawa, C. Becker, C. Carrillo. “Software sustainability: Re-search and practice from a software architecture viewpoint.” In: Jour-nal of Systems and Software 138.December (Apr. 2018), pp. 174–188(cit. on pp. 82, 101).
[VFF19] G. Vale, E. Fernandes, E. Figueiredo. “On the proposal and evaluationof a benchmark-based threshold derivation method.” In: SoftwareQuality Journal 27.1 (Mar. 2019), pp. 275–306 (cit. on p. 183).
[VG10] D. Voelz, A. Goeb. “What is Different in Quality Management forSOA?” In: 2010 14th IEEE International Enterprise Distributed ObjectComputing Conference. IEEE, Oct. 2010, pp. 47–56 (cit. on pp. 19, 85,86, 133).
Bibliography 337

[VT92] J. Verner, G. Tate. “A software size model.” In: IEEE Transactions onSoftware Engineering 18.4 (Apr. 1992), pp. 265–278 (cit. on p. 61).
[Wag13] S.Wagner. Software Product Quality Control. Berlin, Heidelberg: SpringerBerlin Heidelberg, 2013 (cit. on p. 69).
[WC10] B. J. Williams, J. C. Carver. “Characterizing software architecturechanges: A systematic review.” In: Information and Software Tech-nology 52.1 (Jan. 2010), pp. 31–51 (cit. on p. 75).
[WC11] S. Wang, M. A. Capretz. “Dependency and Entropy Based Impact Anal-ysis for Service-Oriented System Evolution.” In: 2011 IEEE/WIC/ACMInternational Conferences on Web Intelligence and Intelligent AgentTechnology. Vol. 1. IEEE, Aug. 2011, pp. 412–417 (cit. on p. 114).
[WGH+15] S.Wagner, A. Goeb, L. Heinemann,M. Kläs, C. Lampasona, K. Lochmann,A. Mayr, R. Plösch, A. Seidl, J. Streit, A. Trendowicz. “Operationalisedproduct quality models and assessment: The Quamoco approach.” In:Information and Software Technology 62 (June 2015), pp. 101–123(cit. on p. 60).
[WHHC14] S. Wang, W. A. Higashino, M. Hayes, M. A.M. Capretz. “Service Evolu-tion Patterns.” In: 2014 IEEE International Conference on Web Services.IEEE, June 2014, pp. 201–208 (cit. on pp. 91, 105, 207).
[Wie14] R. J. Wieringa. “Research Goals and Research Questions.” In: DesignScience Methodology for Information Systems and Software Engineering.Berlin, Heidelberg: Springer Berlin Heidelberg, 2014, pp. 13–23 (cit.on p. 20).
[WKO16] H. Wang, M. Kessentini, A. Ouni. “Prediction of Web Services Evolu-tion.” In: Lecture Notes in Computer Science (including subseries LectureNotes in Artificial Intelligence and Lecture Notes in Bioinformatics).Vol. 9936 LNCS. Springer, Cham, Oct. 2016, pp. 282–297 (cit. onp. 114).
[Woo11] E. Woods. “Industrial Architectural Assessment Using TARA.” In: 2011Ninth Working IEEE/IFIP Conference on Software Architecture. Novem-ber. IEEE, June 2011, pp. 56–65 (cit. on p. 90).
338 Bibliography

[WT13] A. Wang, S. Tonse. Announcing Ribbon: Tying the Netflix Mid-TierServices Together. 2013. url: https://medium.com/netflix-techblog/announcing- ribbon- tying- the- netflix- mid-
tier-services-together-a89346910a62 (visited on 07/22/2019)(cit. on p. 49).
[WWR+12] L. White, N.Wilde, T. Reichherzer, E. El-Sheikh, G. Goehring, A. Baskin,B. Hartmann, M. Manea. “Understanding Interoperable Systems: Chal-lenges for the Maintenance of SOA Applications.” In: 2012 45th HawaiiInternational Conference on System Sciences. IEEE, Jan. 2012, pp. 2199–2206 (cit. on p. 106).
[WWW90] R. Wirfs-Brock, B. Wilkerson, L. Wiener. Designing Object-OrientedSoftware. 1st. Upper Saddle River, NJ: Pearson Education (US), 1990(cit. on p. 40).
[WYZ10] Y. Wang, J. Yang, W. Zhao. “Change impact analysis for service basedbusiness processes.” In: 2010 IEEE International Conference on Service-Oriented Computing and Applications (SOCA). IEEE, Dec. 2010, pp. 1–8(cit. on pp. 90, 206).
[XWQ16] Z. Xiao, I. Wijegunaratne, X. Qiang. “Reflections on SOA and Microser-vices.” In: 2016 4th International Conference on Enterprise Systems(ES). IEEE, Nov. 2016, pp. 60–67 (cit. on p. 54).
[YFLY07] Y. Yu, J. Fernandez-Ramil, J. Lu, P. Yuan. “Comparing web services withother software components.” In: Proceedings - 2007 IEEE InternationalConference onWeb Services, ICWS 2007. Icws. IEEE, July 2007, pp. 388–397 (cit. on p. 19).
[YM13] A. Yamashita, L. Moonen. “Do developers care about code smells?An exploratory survey.” In: 2013 20th Working Conference on ReverseEngineering (WCRE). IEEE, Oct. 2013, pp. 242–251 (cit. on pp. 84,273).
[ZBA14] W. Zuo, A.N. Benharkat, Y. Amghar. “Change-centric Model for WebService Evolution.” In: 2014 IEEE International Conference on WebServices. IEEE, June 2014, pp. 712–713 (cit. on p. 116).
[ZGZW16] Y. Zhou, J. Ge, P. Zhang, W. Wu. “Model based verification of dynami-cally evolvable service oriented systems.” In: Science China InformationSciences 59.3 (Mar. 2016), p. 32101 (cit. on p. 110).
Bibliography 339

[Zim15] O. Zimmermann. “Architectural Refactoring: A Task-Centric View onSoftware Evolution.” In: IEEE Software 32.2 (Mar. 2015), pp. 26–29(cit. on p. 70).
[Zim17] O. Zimmermann. “Microservices tenets.” In: Computer Science - Re-search and Development 32.3-4 (July 2017), pp. 301–310 (cit. onp. 53).
[ZJZ+16] X. Zhou, Y. Jin, H. Zhang, S. Li, X. Huang. “A Map of Threats to Validityof Systematic Literature Reviews in Software Engineering.” In: 201623rd Asia-Pacific Software Engineering Conference (APSEC). Hamilton,New Zealand: IEEE, 2016, pp. 153–160 (cit. on p. 118).
[ZLJ+19] H. Zhang, S. Li, Z. Jia, C. Zhong, C. Zhang. “Microservice Architecturein Reality: An Industrial Inquiry.” In: 2019 IEEE International Con-ference on Software Architecture (ICSA). IEEE, Mar. 2019, pp. 51–60(cit. on pp. 21, 49).
[ZNL17] U. Zdun, E. Navarro, F. Leymann. “Ensuring and Assessing Archi-tecture Conformance to Microservice Decomposition Patterns.” In:Service-Oriented Computing. Vol. 10601. Cham: Springer InternationalPublishing, 2017, pp. 411–429 (cit. on p. 111).
[ZSLZ17] O. Zimmermann, M. Stocker, D. Lübke, U. Zdun. “Interface Repre-sentation Patterns - Crafting and Consuming Message-Based RemoteAPIs.” In: Proceedings of the 22nd European Conference on Pattern Lan-guages of Programs - EuroPLoP ’17. Vol. Part F1320. New York, NewYork, USA: ACM Press, 2017, pp. 1–36 (cit. on p. 94).
[ZYL11] S. Zhang, J. Yin, R. Liu. “A RGPS-based framework for service-orientedrequirement evolution of networked software.” In: 2011 IEEE 3rdInternational Conference on Communication Software and Networks.IEEE, May 2011, pp. 321–325 (cit. on p. 115).
340 Bibliography

List of Figures
1.1. General research process of this thesis . . . . . . . . . . . . . . 24
2.1. Module view example: decompositional UML package diagram 342.2. ISO 42010: simplified conceptual model (based on [Int11b]) 352.3. Example of a pipes and filters architecture (based on [HW03]) 372.4. SOA triangle: service registration and dynamic lookup . . . . 422.5. Simplified OpenAPI specification example . . . . . . . . . . . . 472.6. Staged model of software lifespan (based on [BR00]) . . . . 562.7. Modes of maintenance (based on [RLL98]) . . . . . . . . . . . 582.8. Evolution as a subset of maintenance (based on [RLL98]) . . 582.9. Quamoco in relation to ISO 42010 . . . . . . . . . . . . . . . . 602.10. Technical debt landscape (adopted from [KNO12]) . . . . . . 68
4.1. General research process . . . . . . . . . . . . . . . . . . . . . . 1004.2. Used digital libraries and search engines for the SLR . . . . . 1004.3. Used search string for the SLR . . . . . . . . . . . . . . . . . . . 1014.4. SLR results: number of publications per stage . . . . . . . . . 1024.5. SLR results: publisher distribution . . . . . . . . . . . . . . . . 1034.6. SLR results: number of publications per year . . . . . . . . . . 1034.7. Distribution: architectural categories 2007-2018 . . . . . . . 107
341

4.8. Distribution: architectural categories 2014-2018 . . . . . . . 1074.9. Distribution: methodical categories (percentages are relative
to 223 publications) . . . . . . . . . . . . . . . . . . . . . . . . . 1084.10. Distribution: thematic categories (percentages are relative
to 223 publications) . . . . . . . . . . . . . . . . . . . . . . . . . 1094.11. Distribution: thematic categories grouped by architectural
category . . . . . . . . . . . . . . . . . . . . . . . . . . . . . . . . . 117
5.1. The roles of the 60 participants . . . . . . . . . . . . . . . . . . 1255.2. The four sophistication levels of maintainability assurance . 1265.3. Used tools to support maintainability assurance . . . . . . . . 1275.4. Used metrics to quantify maintainability . . . . . . . . . . . . 1285.5. The participants’ degree of satisfaction w.r.t. maintainability 1295.6. Reported symptoms of low maintainability . . . . . . . . . . . 1305.7. Self-reported impact on software quality . . . . . . . . . . . . 1315.8. Self-reported impact on productivity . . . . . . . . . . . . . . . 1315.9. Is service-oriented software treated differently? . . . . . . . . 1325.10. Categorized differences when treating services . . . . . . . . 1335.11. Reasons for not treating services differently . . . . . . . . . . . 1345.12. Used evolvability assurance maturity levels . . . . . . . . . . . 1395.13. Aggregated evolvability assurance reflections of participants 1505.14. Most frequently reported challenges for the evolvability of
microservices . . . . . . . . . . . . . . . . . . . . . . . . . . . . . . 152
6.1. Metric search string . . . . . . . . . . . . . . . . . . . . . . . . . . 1636.2. Used search engines and digital libraries . . . . . . . . . . . . 1646.3. Simplified canonical data model of RAMA . . . . . . . . . . . . 1796.4. General architecture of the RAMA approach (arrows indicate
data flow) . . . . . . . . . . . . . . . . . . . . . . . . . . . . . . . . 1806.5. Implemented architecture of the RAMA CLI (arrows indicate
data flow) . . . . . . . . . . . . . . . . . . . . . . . . . . . . . . . . 1826.6. Threshold Benchmark Design . . . . . . . . . . . . . . . . . . . 1866.7. Boxplot for the APL measurement results . . . . . . . . . . . . 188
342 List of Figures

6.8. Histogram for the APL measurement results . . . . . . . . . . 1896.9. General architecture of the approach (arrows indicate data
flow) . . . . . . . . . . . . . . . . . . . . . . . . . . . . . . . . . . . 1946.10. Canonical data model for runtime data . . . . . . . . . . . . . 1966.11. Implemented architecture of the first prototype (arrows in-
dicate data flow) . . . . . . . . . . . . . . . . . . . . . . . . . . . 197
7.1. Research process for creating the scenario-based method . . 2077.2. Simplified conceptual model of the method (rectangles rep-
resent entities, ellipses represent attributes, arrows withoutcardinality represent 1-to-1 relations) . . . . . . . . . . . . . . 208
7.3. Architecture of the prototypical tool support . . . . . . . . . . 2117.4. Simplified architecture of the Uber platform . . . . . . . . . . 2127.5. Scenario 1: add Bitcoin as new payment method . . . . . . . 2137.6. Scenario 2: add the “Rider Music” feature . . . . . . . . . . . . 2147.7. Scenario 3: replace the Trip Management database . . . . . 2157.8. Precision ratings for effort estimation techniques (survey) . . 2177.9. Applicability ratings for effort estimation techniques (survey)2177.10. Scenario-level metrics from the evaluation view (tool screen-
shot for survey) . . . . . . . . . . . . . . . . . . . . . . . . . . . . 2187.11. System-level metrics from the evaluation view (tool screen-
shot for survey) . . . . . . . . . . . . . . . . . . . . . . . . . . . . 2187.12. Usefulness ratings for scenario evaluation metrics (survey) . 219
8.1. SOA pattern applicability to microservices . . . . . . . . . . . . 2288.2. Violated microservice-related principles of not fully applica-
ble SOA patterns . . . . . . . . . . . . . . . . . . . . . . . . . . . . 2308.3. Compiled list of architectural modifiability tactics based
on [BBN07; BCK03; BCK12] . . . . . . . . . . . . . . . . . . . . 2358.4. Number of relations between tactic categories and principles 2368.5. Number of related patterns per tactic category . . . . . . . . . 2408.6. Version #1 pre-experiment: initial architecture of non-pattern
version . . . . . . . . . . . . . . . . . . . . . . . . . . . . . . . . . . 248
List of Figures 343

8.7. Version #1 post-experiment: final architecture of non-patternversion . . . . . . . . . . . . . . . . . . . . . . . . . . . . . . . . . . 248
8.8. Version #2 pre-experiment: initial architecture of patternversion . . . . . . . . . . . . . . . . . . . . . . . . . . . . . . . . . . 249
8.9. Version #2 post-experiment: final architecture of patternversion . . . . . . . . . . . . . . . . . . . . . . . . . . . . . . . . . . 249
8.10. List of search keywords . . . . . . . . . . . . . . . . . . . . . . . 2768.11. Created search string . . . . . . . . . . . . . . . . . . . . . . . . . 2768.12. Used search engines and digital libraries . . . . . . . . . . . . 2778.13. SLR process with the number of publications at each stage . 2798.14. JSON representation of an antipattern . . . . . . . . . . . . . . 2848.15. Number of identified antipatterns per architectural style and
category . . . . . . . . . . . . . . . . . . . . . . . . . . . . . . . . . 286
9.1. Contributions C0–C6 in relation to research process . . . . . 296
344 List of Figures

List of Tables
2.1. Concrete example of an architectural style: pipes and filters(based on [CBB+10]) . . . . . . . . . . . . . . . . . . . . . . . . 38
2.2. Example of an evolution scenario . . . . . . . . . . . . . . . . . 76
4.1. Three-dimensional categorization scheme . . . . . . . . . . . . 104
5.1. Company and participant demographics (CID: company ID,PID: participant ID, Exp.: years of experience, SID: system ID)141
5.2. General case characteristics (1/2): system purpose, # ofservices, and self-reported assurance maturity level (0-3) . . 142
5.3. General case characteristics (2/2): tools, metrics, and pat-terns used for evolvability assurance . . . . . . . . . . . . . . . 143
6.1. List of identified publications with service-oriented metrics . 1656.2. Extracted service-oriented maintainability metrics (1/2) . . 1666.3. Extracted service-oriented maintainability metrics (2/2) . . 1676.4. Implemented maintainability metrics of the RAMA CLI . . . 1836.5. Used metric threshold bands (colors are based on a metric
where lower is better; for metrics where higher is better, thecolor ordering would be reversed) . . . . . . . . . . . . . . . . 185
345

6.6. Calculated metric thresholds from our exemplary benchmarkrun with 1,737 API description files . . . . . . . . . . . . . . . . 188
7.1. Scenario evaluation: list of scenarios with metrics . . . . . . . 2157.2. Interviews: participant demographics and ratings . . . . . . . 220
8.1. Principles of SOA and microservices . . . . . . . . . . . . . . . 2338.2. List of applied patterns in system version #2 . . . . . . . . . . 2508.3. List of experiment tasks . . . . . . . . . . . . . . . . . . . . . . . 2528.4. Pairs of experiment hypotheses (alternative hypothesis H1i j
and null hypothesis H0i j , where i is the goal identifier and jthe hypothesis counter; effectiveness: i = 1, efficiency: i = 2;Evx is the effectiveness for version x; Dvx is the task durationsfor version x; Dvx ,t y is the task durations for version x andtask y) . . . . . . . . . . . . . . . . . . . . . . . . . . . . . . . . . . 254
8.5. Group characteristics and self-reported experience (SD rep-resents the standard deviation; for experience questionsbased on the 10-point ordinal scale, 1 represents “not expe-rienced” while 10 represents “very experienced”) . . . . . . . 256
8.6. Result measures per group (SD represents the standard de-viation; for difficulty questions based on the 10-point ordinalscale, 1 represents “not difficult” while 10 represents “verydifficult”) . . . . . . . . . . . . . . . . . . . . . . . . . . . . . . . . 258
8.7. List of the nine selected maintainability metrics for the analysis2608.8. System-level metric results per version (Change in % refers
to the change of the metric value from V1 to V2; a positivepercentage means V1 is better, a negative one means V2 isbetter; in cases with a change of at least 15%, the betterversion is marked with a colored background) . . . . . . . . . 264
8.9. Final list of the 14 primary studies identified by the SLR . . . 2808.10. Final list of the 36 service-based antipatterns extracted from
the primary studies (alphabetical order) . . . . . . . . . . . . . 281
346 List of Tables

8.11. Synthesized antipattern schema: attributes with their datatypes and description . . . . . . . . . . . . . . . . . . . . . . . . . 283
List of Tables 347