An elementary treatise on the dynamics of a particle and of ...
Upload
khangminh22Category
view
1download
0
State of the art of the co-incineration of waste-derived fuels and raw materials in clinker/cement plants
Habilitation Treatise
accepted by the Faculty of Civil and Environmental Engineering
submitted by
Dr.-Ing. Harald Schönberger
2021
Institute for Sanitary Engineering, Water Quality and Solid Waste Management
Main examiner: Prof. Dr.-Ing. Harald Garrecht Examiner: Prof. Dr. techn. Günter Scheffknecht Examiner: Prof. Dr.-Ing. Martin Faulstich Day of submission: 30.03.2020 Date of oral examination: 14.04.2021

2

I am eternally grateful to Gisela. Without her understanding, support and true love, this work would not have been possible. The whole family is my source of strength and energy and makes me aware of the real values in life – I embrace and thank you so much. The work on this treatise started in 2010 under the guidance of Prof. (apl.) Dr. habil. Uwe Lahl (TU Darmstadt). I would like to thank him very much for all the helpful and fruitful discussions and seminal inspiration. The support of Dipl.-Ing. Josef Waltisberg, Holderbank/Switzerland, is invaluable. I learnt so lot from him and the discussions with him were always eye-opening and so helpful. A very big thank you goes to Dr. David Styles (NUI Galway, Bangor University and University of Limerick) for his excellent English proof-reading. Debabar Bikram Basu, Freiburg i. Br., helped me a lot with the drawings in Chapters 3.2.3 (layout drawings) and 4.2 (Sankey diagrams) – thank you. Gottenheim, 30 March 2020 Harald Schönberger

4

Erklärung
gemäß §5 Nr. 1 Absatz 7 der Habilitationsordnung der Universität Stuttgart
Ich erkläre hiermit an Eides Statt, dass die vom Senat der Universität Stuttgart beschlossenen Grundsätze zur Sicherung guter wissenschaftlicher Praxis eingehalten, die vorgelegte Habilitationsschrift selbstständig angefertigt, dabei keine anderen als die darin angegebenen Quellen und Hilfsmittel verwendet und wörtlich bzw. inhaltlich übernommene Stellen als solche kenntlich gemacht wurden.


Executive Summary
State of the art of the co-incineration of waste-derived fuels and raw materials in clinker/cement plants
i
EXECUTIVE SUMMARY
This treatise is about the co-incineration of waste-derived fuels and raw materials in clinker/cement production plants and its impact on emissions to air. The basis is quantitative mass streams thinking, i.e. the output mass streams are determined by input mass streams and the process conditions and abatement techniques. Thus, the relevant input mass streams, the behavior of various inorganic and organic substances under the given process conditions and the emission to air of the different parameters and pollutants are explained. This information is supplemented by basic economic and some life-cycle-assessment considerations. Finally, conclusions and recommendations stress the importance of the right of access to environmental information, that economic aspects are the main driver for the use of waste-derived fuels and raw materials, that the submission to competent authorities of emission to air data and the calibration of self-monitoring devices should be improved, that the environmental operating permits need to be harmonised, and that the amendment of the 17th BImSchV is required including the introduction of the expulsion test. All these aspects are briefly summarised in the following sections starting with clinker production in Germany. The terms “state of the art” and “best available techniques” are understood as synonyms. Clinker production in Germany The 34 German clinker/cement production plants are distributed across 10 German federal states. In terms of quantity, clinker/cement production has been stagnant for the past 50 years. The same is true for clinker/cement production in the European Union. In contrast, the world clinker/cement production grew exponentially, especially in Asia and in particular in China. Basically, the clinker burning process is a high-temperature process which consists of the clinker burning as such (preheating, kiln firing process with or without precalcination, and with or without a chlorine bypass) followed by the clinker cooling and the cement mill where clinker is ground together with additives and wastes to produce the final product: cement. Both in Germany and Europe, clinker is predominantly burned in rotary kilns whereas the use shaft kilns is exceptional. The choice of process is, to a large extent, determined by the state of the raw materials (dry or wet). In Germany and Europe, more than 90 % of production is based on dry processes thanks to the availability of dry raw materials. Process conditions relevant with respect to emissions to air
Inner and outer cycles In principle, there are two types of cycles: the inner and the outer cycles. The outer cycles refer to the mass streams of elements which leave the preheater and are returned to the kiln feed via the raw mill (if they are condensed there) or via the dusts removed in the de-dusting devices. The inner cycles are those that take place within the kiln, between the kiln and the preheater and within the preheater. The outer cycles are most relevant for the volatile thallium and particularly for the highly volatile mercury but also for ammonia. The inner cycle is especially important for sodium and potassium chloride as well as calcium, potassium and sodium sulphate as these compounds can cause coating and clogging.
Preheating Today, the predominant preheating system is the cyclone preheater with 4 – 6 cyclones. Preheating comprises two steps: the drying of the meal in the raw mill by means of the waste gas from the cyclone preheater which still has a temperature of about 300 °C. Therefore, volatile compounds are released and are transported with the flue gas from the kiln (counter-current flow) towards the dust filer and stack. They are measured organic compounds (usually as VOC and sometimes, individual organic compounds are also determined such as benzene, PCDD/F, HCB, PCB, PAH) and inorganic compounds (CO, NH3 and volatile heavy metals, especially mercury).

Executive summary
ii State of the art of the co-incineration of waste-derived fuels and raw materials in clinker/cement plants
Precalcination The objective of precalcination is that the raw meal at the kiln inlet is already highly calcined before entering the kiln and to use the rotary kiln for the real clinkerisation process. Without a precalciner, the calcination takes place in the first part of the rotary kiln, although, to a small extent, some calcination already occurs in the last part of the preheater. Over time, precalcination has increasingly been fed with waste-derived fuels. However, in Germany, the majority of the clinker production plants do not have dedicated precalciners to co-incinerate waste-derived fuels but just feed them to the riser duct. The use of waste-derived fuels in precalciners and in riser ducts can be associated with elevated emissions of organic compounds and carbon monoxide due to incomplete combustion conditions because the turbulence, the residence time and the temperature level may not be sufficient.
Compound and direct operating mode With respect to emissions of volatile compounds, it is important to be aware of the difference and impact of the so-called compound operating mode and direct operating mode. At times when the raw mill is in operation (also called raw mill on), the system is running in the compound operating mode. Due to the enrichment of volatile compounds in the outer cycle, such as thallium, mercury or ammonia, the emissions to air of these compounds can be significantly higher in the direct operating mode because the function of the raw mill as a “dry scrubber” is missing and the waste gas temperature is higher. This difference is especially relevant for mercury as it is highly volatile and has by far the highest ecotoxicity. In case of mercury, the emission is not significantly higher if the waste gas temperature can be kept at the same level as in the compound operating mode.
Chlorine bypass As a rule of thumb, a kiln with a cyclone preheater (with or without a precalciner) can be operated without a chlorine bypass if the chlorine input is below 300 mg Cl/kg clinker. Where this input is exceeded, measures have to be taken to reduce the inner chlorine cycle. The most common measure is to extract a part of the kiln gas stream from the kiln inlet which is called chlorine bypass. This is required to avoid or to reduce coatings and ring formation that result from high concentrations of the volatile minor elements Na, K, S, and Cl. In many cases, clinker production plants have been retrofitted with chlorine bypasses to reduce the chlorine level in the kiln inlet due to the increasing chlorine input with waste-derived fuels. This increased input can be associated with increased emissions of lead and cadmium chlorides as well as with increased HCl emissions and a reduction in energy efficiency due to the heat losses via the bypass system.
Rotary kiln firing system Waste-derived fuel utilisation began in the mid-1980s but accelerated sharply in the early 1990s. As it was easy to establish and the impact on the clinker burner process and the clinker quality was limited, the use of waste-derived fuels often started by introducing secondary firing (dosage of waste-derived fuel to the kiln inlet (riser duct) or, where available, to the precalciner). Multi-fuel burners are essential for increasing the use of waste-derived fuels via the rotary kiln firing system (main burner). Thereby, the adequate pretreatment of the waste-derived fuels (small and defined particle distribution etc.) and the optimal adjustment of these burners is key to optimise the complete combustion of the wastes.
Feeding points for waste-derived fuels and raw materials The feeding points of waste-derived fuels and raw materials can be important with respect to complete or incomplete combustion of organic compounds or their formation in the preheater, and thus for emissions of organic compounds and carbon monoxide to air. Therefore, for each waste used, the optimum feeding point has to be determined.

Executive Summary
State of the art of the co-incineration of waste-derived fuels and raw materials in clinker/cement plants
iii
Driver for the increasing use of waste-derived fuels and raw materials In Germany, the use of waste-derived fuels was mainly economy-driven. The reason behind it is the high energy consumption for the production of clinker. Since the eighties, the energy consumption has been relatively stable. As the energy demand could not be reduced further, additional approaches were identified to further reduce costs. The major measure taken was, and still is, the use of waste-derived fuels, starting in the eighties. Thus, the use of waste-derived fuels was and is mainly economy-driven. Life-cycle-assessment (LCA) considerations There are plenty of available LCA studies concerning the co-incineration of waste in clinker/cement plants. The results depend on a number of factors, specifically the functional unit chosen, methodological decisions, the system boundaries defined, the parameters considered, the assumptions made, the sources of data, and the allocation approach used. The average LCA study is a simplified approach to calculate the global warming potential. In general, the avoidance of fossil fuel is the main advantage of waste treatment scenarios including cement kilns, although the final results strongly depend on the initial assumptions and have a non-negligible degree of uncertainty. Evaluation of emission to air data for all German clinker production plants The core of this habilitation thesis is the waste gas emissions associated with the co-incineration of waste-derived fuels and raw materials in clinker production plants. There is no relevant generation of solid waste or wastewater directly associated with the production process itself. So, the focus is laid on emissions to air. The major findings, conclusions and recommendations on emissions to air are based on the self-monitoring results from all 34 German clinker production plants for the time period 2008 - 2011 whereas the detailed evaluation for each of these installations are documented in ANNEX IV. The data were evaluated with new methodology by means of emission curves and correlations. To date, such emission curves and correlations have not been published. Particular findings concern VOC, CO and mercury. All known and relevant parameters were considered in detail, namely dust, nitrogen oxides (NOx), sulphur dioxide (SO2), mercury (Hg), thallium (Tl), hydrogen chloride (HCl), ammonia (NH3), volatile organic carbon (VOC), carbon monoxide (CO), benzene, hexachlorobenzene (HCB), polychlorinated dibenzo-p-dioxins and furans (PCDD/F), polychlorinated biphenyls (PCB) and polycyclic aromatic hydrocarbons (PAH). Thereby, the contribution of the natural raw materials to emissions to air are also taken into account. Conclusions and recommendations
Right of access to environmental information In this treatise, the successful application of the right of access to environmental information is demonstrated. It works in Germany. For all 34 clinker production plants, the environmental operating permits as well as the results from continuous and discontinuous monitoring of emissions to air could be obtained. The successful application of the right of access to environmental information requires great expertise and experience both for obtaining the information requested and its competent detailed evaluation. Nevertheless, it is recommended to apply this approach in other Member States to see whether and how it works and which difficulties and constraints may occur. In addition, it is recommended to repeat the exercise in Germany again in order to see the progress the past ten years.
The use of waste-derived fuels and raw materials is mainly economy-driven In the past 40 years, the development of the clinker production process was strongly influenced by a steady increase in energy efficiency and a strong increase in the use of waste-derived fuels and raw materials which was and is mainly driven by economic considerations.

Executive summary
iv State of the art of the co-incineration of waste-derived fuels and raw materials in clinker/cement plants
How to submit emission data In the future, the operators should submit the self-monitoring data as excel files together with the emission curves, annual mean values and the frequency distribution for all the monitored parameters. It is recommended to develop a harmonised format for evaluating emission to air data gained from continuous self-monitoring. For this purpose, the methodology applied and shown in ANNEX IV for all German clinker production plants may be taken into account.
Calibration of self-monitoring devices In addition to the application of EN 14181 with respect to calibrating self-monitoring devices, in order to improve the accuracy of continuous self-monitoring, the annual external emission monitoring by certified third-party measurement institutions should not only determine the emissions to air but should also check the in-house continuous self-monitoring (external check of the continuous monitoring of emissions to air). Thus, the operator of the clinker production plant could verify the practiced continuous self-monitoring in addition to the application of EN 14181.
Harmonisation of environmental operating permits The evaluation of the permits reveals that there are significant differences. The harmonised regulation of following aspects appear to be most important for:
- parameters for which emission limit values (ELV) need to be fixed, - parameters which need to be self-monitored continuously by means of which method, - the list of waste-derived fuels and raw materials which are allowed to be used, - stipulations concerning the feeding points for certain wastes.
In addition, the German federal government, together with the German federal states, may develop a model permit which forms the basis of all permits issued for clinker production plants. Such a model permit may be proposed and made available to the European Commission and all European Member States.
Introduction of the expulsion test It is strongly recommended to introduce the expulsion test into legislation to quantify the emissions to air from natural raw materials which may not be exceeded by the use of waste-derived fuels and raw materials. In the future, the scope of the expulsion test should be extended, especially for waste-derived fuels. For this purpose, research and development work is urgently required. The basic concept has already been designed.
Required amendment of the 17th BImSchV The expulsion test needs to be introduced. On the basis of the results derived from it, derogations from ELVs can be determined and a clear distinction can be made of emissions associated with natural raw materials and waste-derived fuels and raw materials. The annual external emission monitoring by certified third-party measurement institutes should not only determine the emissions to air but should also check the in-house continuous self-monitoring (external check of the continuous monitoring of emissions to air). Further, the operators of clinker production plants shall be required to submit to competent authorities the excel files for continuous self-monitoring along with annual emission curves and mean values for all parameters monitored continuously.

Foreword
State of the art of the co-incineration of waste-derived fuels and raw materials in clinker/cement plants
v
FOREWORD
This treatise is about the co-incineration of waste-derived fuels and raw materials in clinker production plants. As clinker is the main and most relevant ingredient of cement which is usually produced from clinker and additives at the same site, both the terms clinker production plant and cement production plant are used although the dominating emissions to air occur from clinker production. In the title, the term “state of the art” is used as Germany kept it from fomer legislation and was not prepared to change it to “best available techniques (BAT)” when implementing the Industrial Emissions Directive (IED) [EU IED, 2010] in 2013. However, in this document, the terms “state of the art” and “best available techniques” are understood as synonyms. The different processes for clinker production are concisely described along with inner and outer cycles of various compounds and specific details to lay the basis for the proper understanding for emissions to the environment. As emissions to water and to soil are negligible compared to emissions to air, this document concentrates on air pollution. The analysis of emissions to air are based on self-monitoring data carried out by the operators of clinker production plants. The latter comprise the parameters which are continuously monitored, namely dust, nitrogen oxides, sulfur dioxide, carbon monoxide, ammonia, mercury, volatile organic compounds as a sum, oxygen content, moisture, temperature, and waste gas flow. For all 34 German clinker production plants, the emission data were obtained from competent authorities using the right of access to environmental information based on the Aarhus Convention (1998) which was implemented in the European Union with the Directive on Public Access to Environmental Information (2003) and in Germany with the Law on Environmental Information (2005) which subsequently had been implemented in all 16 German Member States. The available data concern the years 2008 – 2010, in some cases also for 2011. In summer 2013, the data had been published on the website of the Bundesverband Bürgerinitiativen Umweltschutz e.V. (BBU) which is a German environmental non-governmental organization (see http://www.bbu-online.de/Arbeitsbereiche/Umweltinformationesrecht/Arbeitsbereiche%20Umweltinformationsrecht.html). Against this background, most of the considerations, discussions and conclusions concern this time period. The same is true for production data and the quantities of waste-derived fuels used. However, the overall system has not changed since then and both the approach concerning the evaluation of monitoring data and the conclusions drawn from them are still valid. In addition to the continuously self-monitored data, information is provided for other relevant parameters which cannot be continuously monitored such as PAH, PCB, PCDD/F, HCB, BTEX, HF, and HCl1. For these parameters, data gained after 2008 – 2010 were also used. The emission data were made available as excel files for all 34 German clinker production plants and could be thus evaluated in detail. As these excel files contain daily mean values, emission curves could be generated for the aforementioned time period. It is the very first time that such emission curves are available now. They are very helpful to significantly improve the understanding of emissions to air from clinker production plants. Before that, only spot measurements have been available. So, the continuous monitoring results were compared with the annually published spot measurements results. Further, the data from continuous monitoring could be used to develop correlations between different parameters such as mercury emissions and temperature or nitrogen oxides and carbon monoxide or nitrogen oxides and sulphur dioxide. These correlations enable a deeper insight in important interdependencies between certain parameters. They are also available for the first time. The performance of the continuous monitoring is also assessed with the objective to obtain reliable results; i.e. defined methodologies and maintenance procedures have to be applied. As indicated, the emission curves were generated and the additional evaluation of the emission data were carried out for all the 34 German clinker production plants. These evaluations are contained in Annex IV of this document. In the main text, all mentioned parameters were comprehensively considered and discussed in detail using the aforementioned evaluation of the emission data for all the plants including correlations and the comparison with spot measurements.
1 In a few cases, HCl is continuously self-monitored

Foreword
vi State of the art of the co-incineration of waste-derived fuels and raw materials in clinker/cement plants
The presented information on the clinker production process is as concise as possible and shall form the basis for a deeper understanding of the emission data. The permits for all the 34 plants were also considered and compared with legal requirements. They revealed significant enforcement gaps which are described. This treatise also has the objective to provide the technological and scientific basis for evaluating monitoring data for emissions to air from clinker production plants as well as to reflect prevention and control measures according to ‘state of the art’ and ‘best available techniques’ respectively. It may help industries, authorities, non-governmental organisations, academic institutions etc. to better analyse monitoring data and to identify techniques to minimise emisisons to air. Further, it supports the conclusion that not only abatement techniques are helpful to minimise emissions, but also process- and production-integrated measures including the feeding points of waste-derived fuels and raw materials and optimised combustion conditions of secondary firing systems as well as the analysis of waste-derived fuels and raw materials with respect to their emission to air potential. However, abatement techniques also need to be developed further and implemented. Thus, they are also described along with latest developments.

State of the art of the co-incineration of waste-derived fuels and raw materials in clinker/cement plants
vii
TABLE OF CONTENTS
EXECUTIVE SUMMARY ..................................................................................................................................... I
FOREWORD .................................................................................................................................................... V
TABLE OF CONTENTS ..................................................................................................................................... VII
LIST OF FIGURES ............................................................................................................................................ XII
LIST OF TABLES ............................................................................................................................................. XX
1 INTRODUCTION AND PURPOSE OF THE STUDY ........................................................................................ 1
2 CEMENT PRODUCTION IN GERMANY, EUROPE AND WORLDWIDE .......................................................... 3
3 THE CEMENT PRODUCTION PROCESS....................................................................................................... 7 3.1 Overview of clinker production ................................................................................................................ 7 3.2 The clinker burning process ..................................................................................................................... 8
3.2.1 Short description ........................................................................................................................ 8 3.2.2 Reactions occurring on burning and cooling .............................................................................. 8 3.2.3 Development of clinker burning............................................................................................... 10 3.2.4 Inner and outer cycles of certain compounds .......................................................................... 21
3.2.4.1 Introduction ...................................................................................................................... 21 3.2.4.2 Formation of cycles .......................................................................................................... 22
3.2.4.2.1 Cycles of volatile minor elements (Na, K, S, Cl) ........................................................ 25 3.2.4.2.2 Cycles of trace elements (mainly heavy metals) ...................................................... 31
3.2.5 Conclusions .............................................................................................................................. 39 3.3 Important process details ....................................................................................................................... 40
3.3.1 Preheating ................................................................................................................................ 40 3.3.1.1 General information ......................................................................................................... 40 3.3.1.2 Emission of organic compounds and carbon monoxide during preheating of the raw
meal .................................................................................................................................. 41 3.3.1.2.1 Origin of organic compounds in raw materials ........................................................ 41 3.3.1.2.2 Method to determine the release of carbon monoxide and organic compounds
from raw materials ................................................................................................... 43 3.3.1.2.3 Laboratory test ......................................................................................................... 45 3.3.1.2.4 Measurements at real cement plants ...................................................................... 50 3.3.1.2.5 Applicability of the expulsion test for single natural raw material components
and for waste-derived raw materials ....................................................................... 55 3.3.1.2.6 Possible additional applicability of the expulsion test ............................................. 57 3.3.1.2.7 Conclusions ............................................................................................................... 58
3.3.2 Precalcination ........................................................................................................................... 59 3.3.2.1 Background ....................................................................................................................... 59 3.3.2.2 Calcination degree ............................................................................................................ 60 3.3.2.3 Grouping of precalciners .................................................................................................. 61 3.3.2.4 Example for the optimisation of a precalciner and minimization of the waste gas
emissions .......................................................................................................................... 66 3.3.2.5 Computational Fluid Dynamics (CFD) ............................................................................... 73
3.3.2.5.1 Introduction .............................................................................................................. 73 3.3.2.5.2 Applications .............................................................................................................. 73
3.3.2.6 Conclusions ....................................................................................................................... 75 3.3.3 Compound and direct operating mode .................................................................................... 75
3.3.3.1 Introduction ...................................................................................................................... 75 3.3.3.2 Impact of the two operating modes on emissions to air ................................................. 76 3.3.3.3 Conclusions ....................................................................................................................... 78
3.3.4 Chlorine bypass ........................................................................................................................ 78 3.3.4.1 Introduction ...................................................................................................................... 78 3.3.4.2 Layout of a chlorine bypass .............................................................................................. 79 3.3.4.3 Chlorine bypass dust ........................................................................................................ 81

viii State of the art of the co-incineration of waste-derived fuels and raw materials in clinker/cement plants
3.3.4.4 Removal efficiency ............................................................................................................ 82 3.3.4.5 Way to emit the waste gas from the bypass system ........................................................ 83 3.3.4.6 Conclusions ....................................................................................................................... 83
3.3.5 Rotary kiln firing systems (main burners) ................................................................................. 83 3.3.5.1 Introduction ...................................................................................................................... 83 3.3.5.2 Arrangement of burner air and fuel channels .................................................................. 86 3.3.5.3 Classification of rotary kiln burners .................................................................................. 87 3.3.5.4 Influence of the axial momentum flow on CO and NOx formation .................................. 89 3.3.5.5 Conclusions ....................................................................................................................... 90
4 ENVIRONMENTAL RELEVANCE OF THE INPUT AND OUTPUT MASS STREAMS ........................................ 91 4.1 Introduction ............................................................................................................................................ 91 4.2 Sankey diagrams for clinker production ................................................................................................. 93 4.3 Input mass streams ................................................................................................................................. 95
4.3.1 Raw materials ........................................................................................................................... 95 4.3.1.1 Natural raw materials ....................................................................................................... 95 4.3.1.2 Waste-derived raw materials ........................................................................................... 99
4.3.2 Fuels and electricity ................................................................................................................ 103 4.3.2.1 Energy consumption of clinker production plants .......................................................... 103
4.3.2.1.1 Thermal energy demand of clinker production ...................................................... 103 4.3.2.1.2 Impact of waste-derived fuels on the thermal energy demand ............................. 106 4.3.2.1.3 Electricity consumption of cement production ...................................................... 111
4.3.2.2 Primary fuels ................................................................................................................... 113 4.3.2.3 Waste-derived fuels ........................................................................................................ 115
4.3.2.3.1 Definition ................................................................................................................ 115 4.3.2.3.2 Legal status ............................................................................................................. 116 4.3.2.3.3 Use of waste-derived fuels ..................................................................................... 117 4.3.2.3.4 More detailed information on the most quantitatively relevant waste-derived
fuels ........................................................................................................................ 132 4.3.2.3.5 Classification of waste-derived fuels ...................................................................... 145 4.3.2.3.6 LCA considerations .................................................................................................. 157 4.3.2.3.7 Economic aspects of waste-derived fuels ............................................................... 174
4.3.3 Feeding points for waste-derived raw materials and waste-derived fuels ............................ 179 4.3.3.1 Introduction .................................................................................................................... 179 4.3.3.2 Waste-derived fuels ........................................................................................................ 180 4.3.3.3 Waste-derived raw materials ......................................................................................... 181
4.4 Output mass streams ............................................................................................................................ 182 4.4.1 Basic considerations of the material flow analysis (MFA) – transfer factors ......................... 182 4.4.2 Product (clinker) ..................................................................................................................... 186
4.4.2.1 Introduction .................................................................................................................... 186 4.4.2.2 Estimation of the transfer of non- and low-volatile heavy metals ................................. 187 4.4.2.3 Enrichment of heavy metals in the product ................................................................... 189 4.4.2.4 Leachability of heavy metals from concrete ................................................................... 191 4.4.2.5 Restrictions concerning products ................................................................................... 192
4.4.3 Waste gas ............................................................................................................................... 192 4.4.3.1 Introduction .................................................................................................................... 192 4.4.3.2 Waste gas flow ................................................................................................................ 196 4.4.3.3 Dust ................................................................................................................................. 200
4.4.3.3.1 Introduction ............................................................................................................ 200 4.4.3.3.2 Evaluation of the emission data from continuous dust monitoring at German
clinker production plants ........................................................................................ 200 4.4.3.4 Nitrogen oxides (NOx) ..................................................................................................... 203
4.4.3.4.1 Introduction ............................................................................................................ 203 4.4.3.4.2 Evaluation of the emission data from continuous NOx monitoring at German
clinker production plants ........................................................................................ 204 4.4.3.5 Sulphur dioxide (SO2) ...................................................................................................... 212
4.4.3.5.1 Introduction ............................................................................................................ 212 4.4.3.5.2 Evaluation of the emission data from continuous SO2 monitoring at German
clinker production plants ........................................................................................ 215

State of the art of the co-incineration of waste-derived fuels and raw materials in clinker/cement plants
ix
4.4.3.6 Mercury (Hg) .................................................................................................................. 219 4.4.3.6.1 Introduction ............................................................................................................ 219 4.4.3.6.2 Regulations ............................................................................................................. 220 4.4.3.6.3 Input and behaviour of mercury in cement plants ................................................. 221 4.4.3.6.4 Evaluation of the emission data from continuous mercury monitoring at German
clinker production plants ........................................................................................ 241 4.4.3.6.5 Best available techniques (BAT) to minimise mercury emissions .......................... 250
4.4.3.7 Thallium (Tl) .................................................................................................................... 258 4.4.3.7.1 Introduction ............................................................................................................ 258 4.4.3.7.2 Evaluation of available data monitored at German clinker production plants ...... 260
4.4.3.8 Other heavy metals ........................................................................................................ 261 4.4.3.8.1 Introduction ............................................................................................................ 261 4.4.3.8.2 Evaluation of available data monitored at German clinker production plants ...... 262
4.4.3.9 Hydrogen chloride (HCl) ................................................................................................. 263 4.4.3.9.1 Introduction ............................................................................................................ 263 4.4.3.9.2 Evaluation of available data monitored at German clinker production plants ...... 263
4.4.3.10 Hydrogen fluoride (HF) ................................................................................................... 265 4.4.3.10.1 Introduction ............................................................................................................ 265 4.4.3.10.2 Evaluation of available data monitored at German clinker production plants ...... 266
4.4.3.11 Ammonia (NH3) .............................................................................................................. 266 4.4.3.11.1 Introduction ............................................................................................................ 266 4.4.3.11.2 Evaluation of the emission data from continuous ammonia monitoring at
German clinker production plants .......................................................................... 267 4.4.3.11.3 Conclusions ............................................................................................................. 269
4.4.3.12 Volatile organic compounds (VOC) ................................................................................. 269 4.4.3.12.1 Introduction ............................................................................................................ 269 4.4.3.12.2 Evaluation of available data monitored at German clinker production plants ...... 271 4.4.3.12.3 Correlation between VOC and CO emissions ......................................................... 273
4.4.3.13 Carbon monoxide (CO) ................................................................................................... 281 4.4.3.13.1 Introduction ............................................................................................................ 281 4.4.3.13.2 Evaluation of available data monitored at German clinker production plants
published by VDZ .................................................................................................... 283 4.4.3.13.3 Evaluation of the emission data from continuous CO monitoring at German
clinker production plants ........................................................................................ 283 4.4.3.13.4 Latest development of abatement techniques ...................................................... 287 4.4.3.13.5 Conclusions ............................................................................................................. 287
4.4.3.14 Benzene, toluene, ethylbenzene and xylenes (BTEX) ..................................................... 287 4.4.3.14.1 Introduction ............................................................................................................ 287 4.4.3.14.2 Evaluation of available data monitored at German clinker production plants ...... 288 4.4.3.14.3 Conclusions ............................................................................................................. 291
4.4.3.15 Hexachlorbenzene (HCB) ................................................................................................ 291 4.4.3.15.1 Introduction ............................................................................................................ 291 4.4.3.15.2 Available data on HCB emissions ............................................................................ 291 4.4.3.15.3 The “Görtschitztal” case ......................................................................................... 292 4.4.3.15.4 Conclusions ............................................................................................................. 294
4.4.3.16 Polychlorinated dibenzo-p-dioxins and furans (PCDD/F) ............................................... 294 4.4.3.16.1 Introduction ............................................................................................................ 294 4.4.3.16.2 Evaluation of available data monitored at German clinker production plants ...... 299 4.4.3.16.3 Exceptionally high PCDD/F emission levels ............................................................ 300 4.4.3.16.4 Conclusions ............................................................................................................. 301
4.4.3.17 Polychlorinated biphenyls (PCB) .................................................................................... 301 4.4.3.17.1 Introduction ............................................................................................................ 301 4.4.3.17.2 Evaluation of available data monitored at German clinker production plants ...... 301 4.4.3.17.3 Conclusions ............................................................................................................. 304
4.4.3.18 Polycyclic aromatic hydrocarbons (PAH) ........................................................................ 304 4.4.3.18.1 Introduction ............................................................................................................ 304 4.4.3.18.2 Evaluation of available data monitored at German clinker production plants ...... 305 4.4.3.18.3 Conclusions ............................................................................................................. 307

x State of the art of the co-incineration of waste-derived fuels and raw materials in clinker/cement plants
5 REGULATION OF EMISSIONS AND ENFORCEMENT– TODAY AND TOMORROW ................................... 308 5.1 Introduction .......................................................................................................................................... 308 5.2 Existing regulations ............................................................................................................................... 308
5.2.1 Permitting industrial installations .......................................................................................... 308 5.2.2 Integrated environmental permits ......................................................................................... 309 5.2.3 Best available techniques ....................................................................................................... 311 5.2.4 Emission limit values (of the 17th BImSchV) – development and current status .................. 311
5.3 Required adaptation of existing regulations/permits .......................................................................... 315
6 CONCLUSIONS AND RECOMMENDATIONS .......................................................................................... 316 6.1 Right of access to environmental information ..................................................................................... 316 6.2 The use of waste-derived fuels and raw materials is mainly economy-driven ..................................... 316 6.3 How to submit emission data ............................................................................................................... 316 6.4 Calibration of self-monitoring devices .................................................................................................. 317 6.5 Harmonisation of environmental permits ............................................................................................ 317
6.5.1 Parameters for which emission limit values need to be fixed ................................................ 317 6.5.2 Parameters which need to be self-monitored continuously .................................................. 318 6.5.3 List of waste-derived fuels and raw materials which are allowed to be used ........................ 318 6.5.4 Stipulations concerning the feeding point for certain wastes. ............................................... 318 6.5.5 Model environmental operating permits ............................................................................... 318
6.6 Expulsion test........................................................................................................................................ 318 6.7 Required amendment of the 17th BImSchV ......................................................................................... 319
REFERENCES ................................................................................................................................................ 320
GLOSSARY OF TERMS AND ABBREVIATIONS ................................................................................................ 363
ANNEXES ..................................................................................................................................................... 371 ANNEX I – Stipulations and requirements for the cement works Mergelstetten of Schwenk Zement AG .... 371 ANNEX II – Stipulations concerning waste management of Zement- und Kalkwerke Otterbein ................... 378 ANNEX III - Type and quantity of waste permitted for incineration for the cement plant of the Dyckerhoff
AG in Göllheim ...................................................................................................................................... 381 ANNEX IV – Evaluation of the continuous self-monitoring data of 34 German clinker/cement production
plants .................................................................................................................................................... 391 1. Cement works of HeidelbergCement AG in Leimen/Germany ............................................... 392 2. Cement works of Lafarge Zement in Wössingen/Germany .................................................... 399 3. Cement works Mergelstetten of the Schwenk Zement KG in Mergelstetten/Germany ........ 402 4. Cement works of HeidelbergCement AG in Schelklingen/Germany ...................................... 411 5. Cement works of Holcim (Süddeutschland) GmbH in Dotternhausen/Germany ................... 415 6. Cement works of Schwenk Zement KG in Allmendingen/Germany ....................................... 421 7. Cement works of Märker Zement GmbH in Harburg/Germany ............................................. 428 8. Cement works of Schwenk Zement KG in Karlstadt/Germany ............................................... 434 9. Cement works of HeidelbergCement AG in Lengfurt/Germany ............................................. 440 10. Cement works of Südbayrisches Portland-Zementwerk Gebr. Wieshöck & Co. GmbH in
Rohrdorf/Germany ................................................................................................................. 445 11. Cement works of HeidelbergCement AG in Burglengenfeld/Germany .................................. 449 12. Cement works of Portland Zementwerke GmbH & Co. KG in Solnhofen/Germany ............... 453 13. Cement works CEMEX-OST in Rüdersdorf/Germany .............................................................. 460 14. Cement works of the Dyckerhoff AG in Amöneburg/Germany .............................................. 464 15. Cement works of the Zement- und Kalkwerke Otterbein GmbH & Co. KG in Großenlüders-
Müs/Germany......................................................................................................................... 468 16. Cement works of Holcim(Deutschland) AG in Höver/Germany ............................................. 472 17. Cement works of HeidelbergCement AG in Hannover/Germany ........................................... 479 18. Cement works of Wittekind Hugo Miebach Söhne KG in Ewitte/Germany ........................... 484 19. Cement works of Seibel & Söhne GmbH & Co. KG in Ewitte/Germany .................................. 488 20. Cement works of Gebr. Seibel GmbH & Co. KG in Ewitte/Germany ...................................... 493 21. Cement works of Zement GmbH & Co. KG in Ewitte/Germany ............................................. 496 22. Cement works of the Dyckerhoff AG in Geseke/Germany ..................................................... 501 23. Cement works of HeidelbergCement AG in Geseke/Germany ............................................... 507 24. Cement works of HeidelbergCement AG in Paderborn/Germany ......................................... 511 25. Cement works of HeidelbergCement AG in Ennigerloh/Germany ......................................... 516

State of the art of the co-incineration of waste-derived fuels and raw materials in clinker/cement plants
xi
26. Cement works of the Dyckerhoff AG in Lengerich/Germany ................................................. 520 27. Cement works CEMEX-WEST in Beckum/Germany ................................................................ 528 28. Cement works of Phoenix Zementwerke Krogbeumker GmbH & Co. KG in
Beckum/Germany .................................................................................................................. 532 29. Cement works of Wotan H. Schneider KG in Üxheim-Ahütte/Germany ................................ 537 30. Cement works of the Dyckerhoff AG in Göllheim/Germany .................................................. 544 31. Cement works of Lafarge Zement in Karlsdorf/Germany ...................................................... 548 32. Cement works of Schwenk Zement KG in Bernburg/Germany .............................................. 561 33. Cement works of Holcim (Deutschland) AG in Lägerdorf/Germany ...................................... 566 34. Cement works of the Dyckerhoff AG in Deuna/Germany ...................................................... 575
ANNEX V – Publication “Lignite coke moving bed adsorber for cement plants – BAT or beyond BAT?” ....... 581 ANNEX VI - Synopsis of the clinker/cement-specific parts of the text of the 17th Ordinance on the
implementation the Federal Clean Air Act concerning the incineration and co-incineration of wastes ................................................................................................................................................... 590

xii State of the art of the co-incineration of waste-derived fuels and raw materials in clinker/cement plants
LIST OF FIGURES
Figure 1.1: Scheme on the principle input and output of cement plants .......................................................... 1 Figure 2.1: Cement works with and without clinker() production in Germany in 2010 as well as indications
of available limestone deposits, [VDZ, 2011]; the figure shows 35 clinker production sites but the one in Wetzlar has been closed by the end of 2010 .................................................................. 3
Figure 2.2: Number of cement kilns in the EU Member States in 2008, [EC BREF CLM, 2010] ......................... 5 Figure 2.3: Cement production in Germany from 1959 – 2010, [USGS, 2012; VDZ, 1998-2018] ...................... 5 Figure 2.4: Cement production in Germany, the European Union and worldwide from 1959 – 2010, [USGS,
2012; EC BREF CL; VDZ, 1998-2010, EUROSTAT, 2012] .................................................................... 6 Figure 3.1: Overview of a cement works [EC BREF CLM, 2010, p 11] ................................................................ 7 Figure 3.2: Approximate reaction sequence in clinkerisation, [Chatterjee, 2011] ............................................ 9 Figure 3.3: Reactions of the clinker burning process in a rotary kiln without precalciner, [Winnacker-
Küchler, 2004, p 30] ....................................................................................................................... 10 Figure 3.4: Overview of the wet process.......................................................................................................... 11 Figure 3.5: Overview of the semi-wet process – semi-wet Lepol kiln .............................................................. 12 Figure 3.6: Overview of the semi-dry process – semi-dry Lepol kiln ............................................................... 12 Figure 3.7: Overview of a dry process showing a kiln with 4-stage cyclone preheater without secondary
firing ............................................................................................................................................... 13 Figure 3.8: Dry kiln system with a precalciner prior to the preheater without additional air supply,
according to [Rechmeier, 1970] ..................................................................................................... 13 Figure 3.9: Dry kiln system with a specially designed precalciner prior to the preheater, tertiary air duct
and 5- or 6-stage cyclone preheater .............................................................................................. 14 Figure 3.10: Scheme of the pre-combustion chamber HOTDISC, [FLS, 2011] .................................................... 15 Figure 3.11: Side view and top view (left figure [FLS, 2007]) of the pre-combustion chamber and scheme of
it retrofitted into a 5-stage cyclone preheater with inline precalciner (figure on the right [FLS, 2011]) ............................................................................................................................................. 16
Figure 3.12: Scheme of the PREPOL Step Combustor, according to (Baier/Menzel, 2011) ............................... 18 Figure 3.13: Basic layout of the Holcim clinker production plant in DE-Lägerdorf with an indication of the
retrofitted precombustion chamber, based on (Holcim Lägerdorf, 2012) .................................... 18 Figure 3.14: Dry kiln system with a specially designed precalciner and combustion chamber with a tailor-
made burner prior to the precalciner, tertiary air duct and 5- or 6-stage cyclone preheater [according to Tokheim, 2005; Tokheim, 2006] .............................................................................. 19
Figure 3.15: Gas and solids temperature profile in a cyclone preheater system, [EC BREF CLM, 2010] ........... 20 Figure 3.16: Scheme of the fluidized bed chamber with return cyclone (circulating fluidised bed) installed at
the cement plant of CEMEX Ost in DE-Rüdersdorf [Stark/Wicht, 2000, p 48] ............................... 21 Figure 3.17: Concentration ranges of main, minor and trace elements in Portland cement clinker, [Sprung,
1988] .............................................................................................................................................. 22 Figure 3.18: Location of preheater coatings and of rings in the kiln .................................................................. 23 Figure 3.19: Borderlines and input/output mass streams of the inner and outer material balance of a cement
kiln system ...................................................................................................................................... 24 Figure 3.20: Scheme of the balance for a certain compound (element) of a rotary kiln with cyclone preheater
and raw mill, [Locher, 2000, p 134] ................................................................................................ 25 Figure 3.21: Vapour pressure curves of the alkali chlorides and sulphates as a function of temperature
[Locher, 2000, p 138] ..................................................................................................................... 26 Figure 3.22: Formation and decomposition of calcium sulphate (CaSO4) as function of temperature in rotary
cement kilns ................................................................................................................................... 27 Figure 3.23: Calculation of the molar ratio of sulphur and alkalis corrected by chlorine .................................. 28 Figure 3.24: A typical sulphur cycle in a kiln system having a suspension cyclone preheater and a precalciner
[VDZ-SO2, 2002; Chatterjee, 2011] ................................................................................................. 28 Figure 3.25: Condensates formed of volatile compounds of the gas atmosphere in a cement kiln and calcium
oxide (free lime) of the kiln feed, [Enders/Haeseli, 2010] ............................................................. 29 Figure 3.26: Empirical classification of kiln systems according to chlorine and sulphur content in the hot meal
[Enders/Haeseli, 2010; Chatterjee, 2011; Binninger, 2009] ........................................................... 29 Figure 3.27: Comparison of measured and calculated levels of circulating compounds of volatile minor
elements in the kiln feed, hot meals, clinker and bypass dust [Locher/Klein, 2011a] ................... 31

State of the art of the co-incineration of waste-derived fuels and raw materials in clinker/cement plants
xiii
Figure 3.28: Mass balances for two non-volatile compounds (Ca and As) of two rotary kilns with a 4-stage cyclone preheater (values for CaO in g/kg clinker, for As in mg/kg clinker) [Kirchartz, 1994, pp 56 and 62] ...................................................................................................................................... 32
Figure 3.29: Incorporation of the low-volatile trace elements lead and cadmium into the clinker as a function of the chlorine input to the kiln [Kirchartz, 1994, p 72] ................................................................. 33
Figure 3.30: Incorporation of lead and cadmium into clinker as a function of the molar SO3-/Cl--ratio in the
cycle, [Kirchartz, 1994, p 74] .......................................................................................................... 33 Figure 3.31: Percentage of lead and cadmium incorporated into clinker (related to the hot meal stream) as
a function of the specific sulphur input to the kiln, [Kirchartz, 1994, p 75] .................................. 34 Figure 3.32: Mass balances for the two low-volatile elements lead and cadmium of two rotary kilns with a
4-stage cyclone preheater (values in mg/kg clinker), [Kirchartz, 1994, pp 56 and 62] .................. 34 Figure 3.33: Specific mass stream of low-volatile lead and volatile thallium in the raw gas as a function of
the inner cycle level, [Kirchartz, 1994, p 76] .................................................................................. 35 Figure 3.34: Mass balances for the volatile element thallium of two rotary kilns with a 4-stage cyclone
preheater (values in mg/kg clinker), [Kirchartz, 1994, pp 57 and 63] ............................................ 36 Figure 3.35: Enrichment factor for thallium in the kiln/preheater as a function of the removal efficiency of
the preheater, [Kirchartz, 1994, p 77] ........................................................................................... 36 Figure 3.36: Mass balances for the highly volatile element mercury of two rotary kilns with a 4-stage cyclone
preheater (values in mg/kg clinker), [Kirchartz, 1994, pp 57 and 63] ............................................ 37 Figure 3.37: Mercury removal as a function of the waste gas temperature for rotary kilns with cyclone
preheater in the direct operating mode, [Kirchartz, 1994, p 79] ................................................... 38 Figure 3.38: Scheme of a rotary kiln with 5-stage cyclone heater and precalciner as well as the gas and solids
temperatures in the preheater, [Zunzer, 2002, p 11] .................................................................... 40 Figure 3.39: Transformation of organic compounds during sedimentation and diagenesis ............................. 41 Figure 3.40: Set-up of the expulsion test for the determination of organic compounds released during
heating-up of raw materials [Zunzer, 2002], the first set-up was similar [Waltisberg, 1998] ....... 44 Figure 3.41: Release of carbon monoxide and volatile organic compounds at different oxygen contents of
the overflowing gas for a kiln meal sample (Plant J – see Table), [Zunzer, 2002, p 50] ................ 45 Figure 3.42: Degassing graphs of kiln raw meal A (gas composition: 3 vol. % oxygen and rest nitrogen),
[Zunzer, 2002, p 46] ....................................................................................................................... 46 Figure 3.43: Degassing graphs of kiln raw meal K (gas composition: 3 vol. % oxygen and rest nitrogen),
[Zunzer, 2002, p 46] ....................................................................................................................... 46 Figure 3.44: Release of carbon monoxide from TOC of the kiln raw meals at constant oxygen level (with and
without CO2 in the overflowing gas), [Zunzer, 2002, p 49] ............................................................ 47 Figure 3.45: Release of volatile organic compounds (VOC) from TOC of the kiln raw meals at constant oxygen
level (with and without CO2 in the overflowing gas), [Zunzer, 2002, p 49] ................................... 48 Figure 3.46: Identified organic compounds released during heating of a kiln raw meal in the expulsion test,
[Waltisberg, 2012] ......................................................................................................................... 49 Figure 3.47: Degassing graphs of kiln raw meal N for identified individual organic compounds at a
composition of the overflowing gas of 3 vol. % oxygen and rest nitrogen, [Zunzer, 2002, p 55] .. 49 Figure 3.48: Degassing graphs of kiln raw meal N, comparison of VOC with the sum of identified individual
organic compounds at a composition of the overflowing gas of 3 vol. % oxygen and rest nitrogen, [Zunzer, 2002, p 55] ....................................................................................................... 50
Figure 3.49: Scope for the carbon balance of a 4-stage cyclone preheater, [Zunzer, 2002, p 67] .................... 51 Figure 3.50: Example for the profile of the CO and O2 content of the gas phase within the preheater of a
rotary kiln (Plant D – see Table) for two different oxygen levels, [Zunzer, 2002, p 75] ................. 53 Figure 3.51: Correlation of results on VOC release from the expulsion test and real plant measurements,
[Waltisberg, 2012] ......................................................................................................................... 54 Figure 3.52: Example for the TOC content of the kiln raw meal, the raw gas dust and the kiln meal at various
stages of a preheater (Plant B – see Table), [Zunzer, 2002, p 73] ................................................. 55 Figure 3.53: First approach for the set-up of a test to investigate waste-derived fuels in a modified expulsion
test, [Waltisberg, 2012] ................................................................................................................. 58 Figure 3.54: Scheme of a combustion chamber for burning large-sized solid waste-derived fuels that are
difficult to ignite [according to Mersmann, 2010a] ....................................................................... 60 Figure 3.55: 4-stage preheater kiln with air through secondary firing (on the left) and with air through In-
Line precalciner (on the right)........................................................................................................ 61 Figure 3.56: Types of precalciners using tertiary air [Bech/Mishulovich, 2004] ................................................ 62 Figure 3.57: Air through In-Line calciner (see also Figure 3.55) ......................................................................... 63

xiv State of the art of the co-incineration of waste-derived fuels and raw materials in clinker/cement plants
Figure 3.58: Separate-line Calciner (SLC) where the fuels are exclusively combusted with tertiary air from the clinker cooler............................................................................................................................ 64
Figure 3.59: Air separate hybrid calciner, here with a combustion chamber in which kiln meal is also fed (see Figure 3.14) .................................................................................................................................... 64
Figure 3.60: Example for different flash tube in-line and separate line precalciners with tertiary air supply (here KHD design) for the use of different types of fuels and waste-derived fuels respectively [Mersmann, 2007] .......................................................................................................................... 65
Figure 3.61: Layout of the kiln system, including waste gas treatment at the Norcem AS cement works in Brevik, Norway [Tokheim et al., 2001] ........................................................................................... 66
Figure 3.62: System for feeding solid waste-derived fuels to the precalciner of the cement plant of Norcem AS at Brevik, Norway, [Tokheim et al., 2001] ................................................................................. 68
Figure 3.63: System for feeding solid waste-derived fuels to the primary burner of the cement plant of Norcem AS at Brevik, Norway, [Tokheim et al., 2001] ................................................................... 68
Figure 3.64: The new combustion chamber with the 3-channel burner at the top ........................................... 71 Figure 3.65: The modified calciner/preheater system (red: new/modified parts; yellow: existing), according
to [Tokheim, 2005]; the cyclone numbering relates to Figure 3.66 below .................................... 72 Figure 3.66: The kiln system after the modifications at the Norcem AS cement works in Brevik, Norway,
[Tokheim, 2005] ............................................................................................................................. 72 Figure 3.67: Schematic of the calculation of shredded tyre combustion [according to Mersmann, 2010a] ..... 74 Figure 3.68: Scheme of an in-line flash tube precalciner with split feeding of conventional fuel, air and meal
before injecting shredded tyres [Mersmann, 2010a] .................................................................... 74 Figure 3.69: CFD-calculated oxygen and carbon monoxide concentrations in the precalciner at defined
conditions [Mersmann, 2010a] ...................................................................................................... 75 Figure 3.70: Compound operating mode, i.e. the raw mill is on and the raw gas is passing the mill ................ 76 Figure 3.71: Direct operating mode, i.e. the raw mill is off and the raw gas is not passing the mill but is
directly reaching the bag filter ....................................................................................................... 77 Figure 3.72: Mercury emissions in the direct operating mode as a function of the percentage of removed
dust................................................................................................................................................. 78 Figure 3.73: Example for a chlorine bypass system with air and water cooling which has been installed in a
German cement plant in 2010 ....................................................................................................... 80 Figure 3.74: Extraction part (take-off and mixing (=quenching) chamber) of a chlorine bypass system of a
rotary kiln with cyclone preheater, [Binninger, 2009] ................................................................... 81 Figure 3.75: Roentgenogram of a chlorine bypass dust sample, [Stark/Wicht, 2000, p 52] .............................. 82 Figure 3.76: Old and new burner tip (retrofitted in 2001) of the rotary kiln burner of the cement works of
Holcim (Schweiz) AG in CH-Untervaz, [Jaun, 2004] ........................................................................ 84 Figure 3.77: Burner and related input facilities for various waste-derived fuels installed at the cement works
of Holcim (Schweiz) AG in CH-Untervaz in 2001, [Jaun, 2004] ....................................................... 85 Figure 3.78: Burner and related input facilities for various waste-derived fuels installed at the cement works
of Holcim AG in CH-Eglépens in 2003, [Jaun, 2004], the addition of coal is optional and is only applied in case of problems with the input of waste-derived fuels ............................................... 86
Figure 3.79: Partitioning of combustion air into several streams, [Emberger/Hoenig, 2011] ........................... 87 Figure 3.80: Carbon monoxide (CO) concentration in the kiln inlet gas in relation to the burner’s axial
momentum flow at two different swirl adjustments [VDZ, 2007; Wirthwein/Emberger, 2010] ... 89 Figure 3.81: Nitrogen oxides (NOx) concentration in the kiln inlet gas in relation to the burner’s axial
momentum flow at two different swirl adjustments [VDZ, 2007] ................................................. 90 Figure 4.1: Scheme for the principle mass streams of the economic system with the indication of the option
to recycle waste-derived raw mat. and fuels to cement plants ..................................................... 92 Figure 4.2: Sankey diagram of clinker production, based on the mass balance in [EC BREF CLM, 2010] ........ 93 Figure 4.3: Sankey diagram of the clinker production of the cement works Cemex Ost in
Rüdersdorf/Germany for 2008, based on published input/output data [CEMEX, 2009] ............... 94 Figure 4.4: Sankey diagram for the clinker production of all cement works in Germany in 2010, based on
published input/output data [VDZ, 2011] ...................................................................................... 95 Figure 4.5: Development of the percentage of natural raw materials for clinker production from 1998 –
2011, related to the total input of raw materials, based on [VDZ, 1999; VDZ, 2000; VDZ, 2001; …;VDZ, 2012] ...................................................................................................................... 101
Figure 4.6: The clinker-specific energy demand of different clinker production processes developed over the past fifty years ........................................................................................................................ 104
Figure 4.7: The development of the clinker-specific thermal energy demand, equal to the specific fuel consumption, of the German cement works from 1950 – 2011, [VDZ, 2012] ............................. 105

State of the art of the co-incineration of waste-derived fuels and raw materials in clinker/cement plants
xv
Figure 4.8: Factors influencing the specific thermal energy demand of clinker production kilns, [Klein/Hoenig, 2006; Schneider et al., 2001] ............................................................................... 106
Figure 4.9: The development of the clinker-specific thermal energy demand, equal to the specific fuel consumption, of the German cement works from 1990 – 2011, [VDZ, 2012]; this graph is part of the graph in Table 4.7 above showing the period from 1950 - 2011 ...................................... 107
Figure 4.10: Correlation of the percentage of waste-derived fuels used and the specific energy consumption for clinker production for German cement works from 2003 – 2011, based on [VDZ, 2004; … ; VDZ, 2012] .................................................................................................................................... 107
Figure 4.11: Illustration of the parts of dried sewage sludge which lower the net calorific value and increase the thermal energy demand of the clinker production process .................................................. 108
Figure 4.12: Increase of the thermal energy demand of the clinker production process due to the use of dried sewage sludge .................................................................................................................... 109
Figure 4.13: Influence of the fuel properties on the specific thermal energy demand for a 5-stage cyclone preheater kiln with precalciner, based on [Klein/Hoenig, 2006] ................................................. 110
Figure 4.14: Standard variation of the net calorific value (NCV) of two conventional and three waste-derived fuels, [Wirtwein/Emberger, 2010] ............................................................................................... 111
Figure 4.15: Percentage of the relevant electricity consuming processes of the overall electricity consumption of a cement works ................................................................................................. 112
Figure 4.16: Development of the cement-specific electricity consumption of the German cement works from 1950 – 2011, [VDZ, 2012] ............................................................................................................. 112
Figure 4.17: Development of different cement types produced by Holcim from 1995 – 2009, [Schneider et al., 2011] ...................................................................................................................................... 113
Figure 4.18: Use of the different fossil fuels for clinker production as well as total fossil and waste-derived fuels (dotted lines), based on [VDZ, 1999; VDZ, 2000; VDZ, 2001; …;VDZ, 2012; Scheuer, 2003; Wirtwein/Emberger, 2010] .......................................................................................................... 114
Figure 4.19: Scheme for collating the different terms for waste-derived fuels ............................................... 115 Figure 4.20: Percentage of waste-derived fuels used for clinker production in relation to the total fuel
consumption in different industrialised countries round the word in 2007, based on [CAC, 2011; AT VÖZ, 2011; Cemsuisse, 2012; HDC, 2012; VDZ, 2008] ............................................................ 117
Figure 4.21: Percentage of waste-derived fuels in relation to the total fuel consumption in German clinker production plants from 1987-2011, based on [VDZ, 1998, …,VDZ, 2012; Scheuer, 2003; Wirthwein/Embergerg, 2010; Hoenig, 2012] ............................................................................... 117
Figure 4.22: Development of the use of waste-derived fuels in German clinker production plants from 1998 – 2011, based on [VDZ, 1999; … ;VDZ, 2012]; the less significant waste-derived fuels mentioned in Table 4.11, i.e. packaging waste, wastes from the textile industry, carpet waste, bleaching earth, are not indicated ............................................................................................................... 118
Figure 4.23: Use of the different types of plastics in the most important application areas in Germany in 2011, [Consultic, 20129 ............................................................................................................... 134
Figure 4.24: Disposal, recycling and recovery routes of waste plastic in Germany in 2011, [Consultic, 2012] 136 Figure 4.25: Basic operations for the treatment of residual fractions of municipal wastes, based on
[Scholz/Beckmann, 1998] ............................................................................................................ 137 Figure 4.26: Development of residual municipal waste and certain separately collected and recycled
fractions from municipal waste, based on [Kügler et al., 2009; Destatis Abfallbilanz 2006, 2009; Destatis Abfallbilanz 2007, 2009; Destatis Abfallbilanz 2008, 2010; Destatis Abfallbilanz 2009, 2011; Destatis Abfallbilanz 2010, 2012; Destatis Abfallbilanz Erläuterungen, 2012] .................. 138
Figure 4.27: Development of the quantities of municipal waste fractions from 1995 – 2010 and the prospects to 2020 [Alwast, 2012]() .............................................................................................. 140
Figure 4.28: Process sequence to comminute, separate and sort municipal waste to obtain a SRF which meets high requirements so that it can be used as waste-derived fuels in cement plants, according to [Pretz, 2008] ............................................................................................................ 141
Figure 4.29: Chlorine contents of residual waste reported in different publications, [Schirmer, 2007] ......... 142 Figure 4.30: Available techniques for dewatering, drying and incineration of sewage sludge in Germany
[Schmitt et al., 2007] .................................................................................................................... 144 Figure 4.31: Fuel properties according to [Beckmann et al., 2012; Seifert et al., 2008] ................................. 145 Figure 4.32: Simplified chart for the solid recovered fuels supply chain; the EN 15359 standard applies at the
point of delivery SRF, [EN 15359, 2012] ...................................................................................... 150 Figure 4.33: Correlation between the energy consumption per tonne clinker and the share of waste-derived
fuels of the total heat demand in the German cement plants (average values from 2003-2010)161 Figure 4.34: Conceptual model of the cement life cycle, adapted from [Gäbel et al., 2004] .......................... 163

xvi State of the art of the co-incineration of waste-derived fuels and raw materials in clinker/cement plants
Figure 4.35: Equivalent carbon dioxide emissions per tonne clinker for different wastes used in different clinker production processes, adapted from [Boesch et al., 2009] .............................................. 164
Figure 4.36: Life cycle greenhouse gases emissions vs clinker factor for different US and European cements, data from [Gäbel/Tillman, 2005; Boesch/Hellweg, 2010; Ammenberg et al., 2011] ................... 166
Figure 4.37: Change in alternative fuels vs. change in fossil fuel for the average thermal energy demand in Germany, data from [VDZ, 2011] ................................................................................................. 167
Figure 4.38: Conceptual model for waste treatment options in the cement life cycle – based on Figure 4.34168 Figure 4.39: Simulated frequency distributions: A: cement kiln scenario with the German average efficiency
for electricity co-generation and heat recovery in MSWIP. B: incineration scenario with the German average efficiency for electricity co-generation and heat recovery in MSWIP. C: cement kiln scenario with the Danish average efficiency for electricity co-generation and heat recovery in MSWIP. D: incineration scenario with the Danish average efficiency for electricity co-generation and heat recovery in MSWIP. .................................................................................... 172
Figure 4.40: Schematic development of the clinker-specific fuel costs due to the increasing use of waste-derived fuels and raw materials, based on [KHD, 2007] .............................................................. 175
Figure 4.41: Development and foresight of the price for municipal solid waste (MSW) in Germany, Netherlands and Flanders [ERFO, 2010] ...................................................................................... 176
Figure 4.42: Overview of a cement works with the indication of the basic points (yellow points with the numbers 1, 2 and 3) for the feeding of waste-derived fuels and raw materials, based on [EC BREF CLM, 2010] .......................................................................................................................... 180
Figure 4.43: Input and output flows of a cement plant ................................................................................... 182 Figure 4.44: Basic scheme for the material flow analysis of a certain system with defined system boundaries
[Zeschmar-Lahl, 2003; NRW MUNVL, 2005] ................................................................................ 183 Figure 4.45: 3-year dust emission curves from four different production sites (see clinker production site 17,
21, 30 and 34 in Annex IV) ........................................................................................................... 201 Figure 4.46: 3-year dust emission curves from two different production sites (see clinker production site 19
and 24 in Annex IV) ...................................................................................................................... 202 Figure 4.47: 3-year dust emission curve from a clinker production site (see clinker production site 32 in
Annex IV) ...................................................................................................................................... 202 Figure 4.48: 3-year NOx emission curves from four clinker production sites (see clinker production sites 1
(at the top left), 13 (at the top right), 18 (on the bottom left) and 29 (on the bottom right) in Annex IV) ...................................................................................................................................... 204
Figure 4.49: 3-year NOx emission curves from six clinker production sites (see clinker production sites 11 (at the top left), 15 (at the top right), 22 (in the middle left), 32 (in the middle right), 33 (on the bottom left) and 34 (on the bottom right) in Annex IV)............................................................... 205
Figure 4.50: 3-year NOx emission curves from four clinker production sites (see clinker production sites 7 (at the top left), 19 (at the top right), 21 (on the bottom left) and 26 (on the bottom right) in Annex IV) ...................................................................................................................................... 206
Figure 4.51: 3-year NOx emission curves from two clinker production sites (see clinker production sites 28 (on the left) and 28 (on the right) in Annex IV) ............................................................................ 206
Figure 4.52: The basic three configurations of NOx reduction by means of SCR [Zurhove, 2010; Zurhove, 2014] ............................................................................................................................................ 207
Figure 4.53: Daily mean values for NOx emissions from 2008 – 2010 of the clinker production site of Schwenk Zement in Mergelstetten/Germany (see clinker production site 3 in Annex IV) ......................... 208
Figure 4.54: Daily mean values for NOx emissions in 2011 of the clinker production site of Schwenk Zement in Mergelstetten/Germany (see clinker production site 3 in Annex IV) ...................................... 209
Figure 4.55: Daily mean values for ammonia emissions in 2011 of the clinker production site of Schwenk Zement in Mergelstetten/Germany (see clinker production site 3 in Annex IV) ......................... 210
Figure 4.56: Daily mean values for VOC emissions from 2008 – 2010 of the clinker production site of Schwenk Zement in Mergelstetten/Germany (see clinker production site 3 in Annex IV) .......... 210
Figure 4.57: Daily mean values for VOC emissions in 2011 of the clinker production site of Schwenk Zement in Mergelstetten/Germany (see clinker production site 3 in Annex IV) ...................................... 211
Figure 4.58: Correlation between CO and NOx emissions (see clinker production site 29 in Annex IV) .......... 211 Figure 4.59: Correlation between CO and NOx emissions (see clinker production site 21 in Annex IV) .......... 212 Figure 4.60: Profile of the SO2 concentration in the gas phase of cyclone suspension preheater [Seidler,
2005, p 69] ................................................................................................................................... 213 Figure 4.61: SO2 development of different sulphur compounds depending on temperature determined by
means of the expulsion test [Waltisberg, 2016]. ......................................................................... 214

State of the art of the co-incineration of waste-derived fuels and raw materials in clinker/cement plants
xvii
Figure 4.62: SO2 formation from raw materials containing high and low contents of pyritic sulphur - determined by means of the expulsion test [Waltisberg, 2016] ................................................. 214
Figure 4.63: Correlation of raw gas temperature and degree of SO2 incorporation [Seidler, 2005, p 73] ...... 215 Figure 4.64: Daily mean values for SO2 emissions from 2008 to 2010 of a Lepol kiln (see clinker production
sites 2 in Annex IV) ....................................................................................................................... 216 Figure 4.65: 3-year SO2 emission curves from four clinker production sites (see clinker production sites 22
(at the top left), 25 (at the top right), 28 (on the bottom left) and 13 (on the bottom right) in Annex IV) ...................................................................................................................................... 216
Figure 4.66: 3-year SO2 emission curves from four clinker production sites (see clinker production sites 9 (at the top left), 17 (at the top right), 16 (on the bottom left) and 27 (on the bottom right) in Annex IV) ................................................................................................................................................. 217
Figure 4.67: 3-year SO2 emission curves from four clinker production sites (see clinker production sites 3 (at the top left), 7 (at the top right), 21 (on the bottom left) and 32 (on the bottom right) in Annex IV) ................................................................................................................................................. 218
Figure 4.68: Correlation between CO and SO2 of the classified daily mean values of the clinker production sites 10 and 29 in Annex IV for the time period 2008 - 2010 ...................................................... 218
Figure 4.69: Relative contributions to estimated emissions to air from anthropogenic sources 2010 [UNEP Hg Assessment, 2013] .................................................................................................................. 219
Figure 4.70: Sankey diagrams of the mercury balance of a clinker production plant without and with filter dust removal, based on (Schaefer/Hoenig, 2002) ....................................................................... 226
Figure 4.71: Scheme illustrating the possible conversion reactions of mercury in the clinker production process [Renzoni et al., 2010; Oerter/Zunzer, 2011, ecra, 2013] ................................................ 227
Figure 4.72: Equilibrium distribution of mercury species as a function of temperature in the preheater of a clinker production plant with a mercury input in the ppm-range [Zheng, 2011; Zheng et al., 2012] ............................................................................................................................................ 228
Figure 4.73: Equilibrium distribution of mercury species as a function of temperature in the preheater of a clinker production plant [Zheng, 2011; Zheng et al., 2012] ......................................................... 229
Figure 4.74: The four basic equilibrium reactions for the chlorination of elemental mercury to form HgCl2, based on [Vosteen et al., 2002] ................................................................................................... 229
Figure 4.75: Dependence of the vapour pressure of Hg° and HgCl2 on the temperature (left chart with linear scale and right chart with logarithmic scale), values from Table 4.45 ......................................... 232
Figure 4.76: Hg volatilisation curves of 4 raw meals (left chart) and of 3 filter dusts (right chart) [AiF, 2008]232 Figure 4.77: Investigations of the behaviour of 203Hg-radio-labelled HgO in a Norwegian clinker production
plant (see Figure 3.61) - radioactivity in the emitted waste gas and filter dust [Eriksen et al., 2007] ............................................................................................................................................ 235
Figure 4.78: The external mercury cycle in a clinker production plant considering filter dust recycling and removal, based on [Sikkema et al., 2011] .................................................................................... 236
Figure 4.79: Dependence of the vapour pressure of Hg°and HgCl2 on the temperature between 90 and 190°C (values from Table 4.45) .............................................................................................................. 237
Figure 4.80: Mercury emissions from a dry rotary kiln for clinker production without filter dust recycling for one week along with indication of the waste gas temperature after the electrostatic precipitator (clean gas temperature) and the time periods with raw mill in operation (mill on), based on [Schäfer/Hoenig, 2001], also quoted in [VDZ Activity Report, 2002; Oerter, 2007; Renzoni et al., 2010; Senior et al., 2010; Oerter/Zunzer, 2011; Hoenig, 2013; ecra, 2013] ........ 238
Figure 4.81: Scheme of the installation of a valve to remove filter dust ......................................................... 239 Figure 4.82: Mercury emissions from a dry rotary kiln for clinker production with filter dust recycling for five
days with indication of the waste gas temperature after the electrostatic precipitator (clean gas temperature) and the time periods with raw mill in operation (mill on), based on [Schäfer/Hoenig, 2001], also quoted in [VDZ Activity Report, 2002; Oerter, 2007; Renzoni et al., 2010; Senior et al., 2010; Oerter/Zunzer, 2011; Hoenig, 2013; ecra, 2013] ................................ 239
Figure 4.83: Impact of the percentage direct operating mode without dust removal and with a percentage of dust removal of 100 %. ............................................................................................................ 240
Figure 4.84: Emissions to air of elemental and oxidised mercury according to different sources .................. 241 Figure 4.85: Example for problems with a mercury monitor in 2009 (see clinker production site 26 in Annex
IV) ................................................................................................................................................. 243 Figure 4.86: 3-year mercury emission curve with constantly declining values (see clinker production site 3
in Annex IV) .................................................................................................................................. 243 Figure 4.87: Mercury emission curve for the first six months of 2008 (see clinker production site 16 in Annex
IV) ................................................................................................................................................. 244

xviii State of the art of the co-incineration of waste-derived fuels and raw materials in clinker/cement plants
Figure 4.88: 3-year emission curve with comparatively stable values (see clinker production site 22 in Annex IV) ................................................................................................................................................. 245
Figure 4.89: 3-year emission curve with comparatively stable values (see clinker production site 15 in Annex IV) ................................................................................................................................................. 245
Figure 4.90: 3-year emission curve showing a decreasing emission level (see clinker production site 18 in Annex IV) ...................................................................................................................................... 246
Figure 4.91: 3-year emission curve with varying emission levels (see clinker production site 2 in Annex IV) . 247 Figure 4.92: 6-year mercury emission curve for the time period 01.01.2008 – 31.03.2014 (see clinker
production site 33 in Annex IV) .................................................................................................... 248 Figure 4.93: Four examples for the correlation between mercury emission and waste gas temperature (see
clinker production sites 12, 26, 28 and 31 in Annex IV) ............................................................... 249 Figure 4.94: Example for a missing correlation between mercury emission and waste gas temperature (see
clinker production site 9 in Annex IV) .......................................................................................... 249 Figure 4.95: Hg emission versus waste gas temperature in a clinker production plant where the waste gas is
not passing the raw mill (all values from 2008 – 2010- see clinker production site 33 in Annex IV) ................................................................................................................................................. 250
Figure 4.96: Example for the injection of activated carbon (or of another dry sorbent) downstream to the dust filter requiring an additional filter for sorbent removal [Paone, 2010, p 55] ...................... 257
Figure 4.97: Thallium content in the raw meal at the different stages (cyclones) of the preheater [Winkler, 1986, p 56]; six series of measurements have been conducted and five are presented (M 2 … M 6) whereby for the measurement series M 2, M 3, M 4 and M 5, the dust cycle was closed and for M 6 it was open ...................................................................................................................... 259
Figure 4.98: Thallium (Tl) concentration values for the year 2012 measured in the clean waste gas of 38 rotary kilns [VDZ, 2012] ................................................................................................................ 260
Figure 4.99: Thallium (Tl) emissions (annual releases in 2012) of 38 rotary kilns in Germany [VDZ, 2012] .... 261 Figure 4.100: Daily mean values for HCl emissions from 2008 -2010 of the clinker production plant of Holcim
in Höver/Germany ........................................................................................................................ 264 Figure 4.101: Percentage of HCl spot measurements below the detection limit (1.5 – 2.1 mg/Nm3), equal to
or above 5 mg/Nm3 and equal or above 10 mg/Nm3, source: [VDZ, 2006 … VDZ, 2016]; the number of annual spot measurements were between 108 and 144 ........................................... 264
Figure 4.102: The three maximum values of the years 2005 – 2015 of the spot measurement carried out at the German clinker production plants; source: [VDZ, 2006 … VDZ, 2016]................................... 265
Figure 4.103: Percentage of HF spot measurements below the detection limit (40 – 60 µg/Nm3), equal to or above 0.5 mg/Nm3 and equal to or above 1 mg/Nm3, source: [VDZ, 2006 … VDZ, 2016]; the number of annual spot measurements were between 107 and 145 ........................................... 266
Figure 4.104: Daily mean values for ammonia emissions in 2011 of the clinker production site of Schwenk Zement in Mergelstetten/Germany (see clinker production site 3 in Annex IV) ......................... 268
Figure 4.105: Daily mean values for ammonia emissions in 2010 of the clinker production site of Märker Zement GmbH in Harburg/Germany (see clinker production site 7 in Annex IV) ........................ 269
Figure 4.106: Frequency distribution of the daily mean values derived from continuous VOC monitoring at German clinker production plants in the time period 2008 - 2010.............................................. 271
Figure 4.107: 3-year VOC emission curves from six clinker production sites (see clinker production sites 3 (at the top left), 13 (at the top right), 26 (in the middle left), 24 (in the middle right), 32 (on the bottom left) and 33 (on the bottom right) in Annex IV) showing low VOC emission levels ........ 272
Figure 4.108: 3-year and 4-year VOC emission curves from four clinker production sites (see clinker production sites 22 (at the top left), 8 (at the top right showing the 4-year curve), 5 (on the bottom left) and 29 (on the bottom right) in Annex IV) showing high and varying VOC emission levels ............................................................................................................................................ 273
Figure 4.109: VOC (the lower curve - red) and CO (the upper curve – blue) emission curves (weekly mean values calculated from daily mean values) of a clinker production plant with a 4-stage cyclone preheater (outside Germany) which exclusively uses coal as a fuel and no wastes at all for the main burner and which does not have any secondary firing [Schönberger/Waltisberg, 2014] .. 274
Figure 4.110: No correlation between the VOC and CO emissions (classified daily mean values) of a clinker production plant with a 4-stage cyclone preheater (outside Germany) which exclusively uses coal as fuel and no wastes at all fed via the main burner and which does not have any secondary firing [Schönberger/Waltisberg, 2014]......................................................................................... 275
Figure 4.111: Correlation between CO and VOC with classified daily mean values from 2008 – 2010 of the clinker production plant 29 in Annex IV (the corresponding emission curve can be seen in Figure 4.108 above on the bottom right) ................................................................................................ 276

State of the art of the co-incineration of waste-derived fuels and raw materials in clinker/cement plants
xix
Figure 4.112: Correlation between TOC and CO emissions illustrated by means of classified daily mean values from 2008 – 2010 of the clinker production plant 16 in Annex IV ............................................... 276
Figure 4.113: Correlation between VOC and CO of clinker production plant 6 in Annex IV (correlation of the available daily mean values for 2008 - 2010) ............................................................................... 277
Figure 4.114: Correlation between VOC and CO of clinker production plant 6 in Annex IV (showing the classified daily mean values of Figure 4.113 above) .................................................................... 277
Figure 4.115: Correlation between VOC and CO of clinker production plant 8 in Annex IV (correlation of weekly daily mean values calculated from the daily mean values for 2008 - 2010) .................... 278
Figure 4.116: Correlation between VOC and CO of clinker production plant 22 in Annex IV (correlation of classified daily mean values calculated from the daily mean values for 2008 - 2010) ................ 279
Figure 4.117: Scheme of the combination of regenerative thermal oxidation (RTO) with selective catalytic reduction (SCR); on the left, the RTO is shown and on the right, there is the cross section showing the combination of RTO and SCR with the regenerators, the catalyst layer and the injection of ammonia solution; based on [Mauschitz et al., 2018] .............................................. 280
Figure 4.118: Frequency distribution of the daily mean values derived from continuous CO monitoring at German clinker production plants in the time period 2008 - 2010 ............................................. 283
Figure 4.119: 3-year CO emission curves from four clinker production sites showing very low CO emission levels at the top left and right (clinker production sites 3 and 27 in Annex IV) or low CO emission levels on the bottom left and right (clinker production sites 31 and 33 in Annex IV) ................. 284
Figure 4.120: 3-year CO emission curves from three clinker production sites showing CO emission levels between 500 and 2000 mg/Nm3 (clinker production sites 4 (at the top left), 6 (at the top right) and 10 (on the bottom) in Annex IV) ........................................................................................... 285
Figure 4.121: 3-year CO emission curves from two clinker production sites showing high CO emission levels between 1000 and 5000 mg/Nm3 (graph on the left - clinker production sites 7 in Annex IV) and between 500 and 3500 mg/Nm3 (graph on the right – clinker production site 8 in Annex IV)... 285
Figure 4.122: 3-year CO emission curves from four clinker production sites showing a significant decrease in CO emission levels (see clinker production sites 5 (at the top left), 9 (at the top right), 15 (on the bottom left) and 29 (on the bottom right) in Annex IV) ........................................................ 286
Figure 4.123: Annual average (mean) and median values for VOC spot measurements from 2005 – 2015 at German clinker production plants; data derived from [VDZ, 2006 … VDZ, 2016] ....................... 289
Figure 4.124: Annual average (mean) and median values for BTEX spot measurements from 2005 – 2015 at German clinker production plants; data derived from [VDZ, 2006 … VDZ, 2016] ....................... 289
Figure 4.125: Annual average (mean) and median values for benzene spot measurements from 2005 – 2015 at German clinker production plants; data derived from [VDZ, 2006 … VDZ, 2016] ................... 290
Figure 4.126: Dependency between the annual mean values for BTEX and benzene emissions from 2005 - 2015 ............................................................................................................................................. 291
Figure 4.127: Interdependence between PCDDs/Fs and HCB in exhaust samples with PCDDs/Fs content above 0.1 ng I-TEQ/Nm3 [Wegiel et al., 2011] ........................................................................................ 292
Figure 4.128: HCB in the cycle “soil-plant-fodder-animal-farmyard manure-product” in the valley Görtschitztal from 2014 to 2015 [Gasteiner et al., 2016] ............................................................ 294
Figure 4.129: PCDD/F emissions from clinker production plants depending on kiln types [Waltisberg, 2016]; the values stem from 16 dry long kilns, 28 wet kilns and 40 dry process kilns with suspension preheaters and were collected in 2002 ....................................................................................... 295
Figure 4.130: Catalytically driven, here by copper, Deacon process [Griffin, 1986] .......................................... 296 Figure 4.131: Reaction of molecular chlorine (Cl2) with sulfur dioxide [Griffin, 1986]....................................... 296 Figure 4.132: Assumed formation of HCl from sublimated KCl and hydrogen radicals; the latter are formed
from water at temperatures above 1600 °C [Waltisberg, 2016] ................................................. 297 Figure 4.133: De novo PCDD/F formation in the chlorine bypass system (before the dust filter) depending on
the input of tires [Waltisberg, 2016]............................................................................................ 298 Figure 4.134: Significant increase in PCDD/F emissions as a consequence of feeding contaminated waste-
derived raw materials via the raw material route [Waltisberg, 2016] ........................................ 298 Figure 4.135: Distribution of PCDD/F spot measurements, categorised by the thermal distribution, from
clinker production plants in the EU-27 and EU-23+ countries; the data were collected in 2004 [EC BREF CLM, 2013] .................................................................................................................... 300
Figure 4.136: The chemical structure of PAH which are indicatory for clinker production plants, according to [Yang et al., 1998; Waltisberg, 1998; Ravindra et al., 2008] ........................................................ 305
Figure 4.137: Annual average (mean) and median values for PAH spot measurements from 2005 – 2015 at German clinker production plants; data derived from [VDZ, 2006 … VDZ, 2016] ....................... 306
Figure 5.1: Scheme illustrating integrated environmental permitting in Germany ........................................... 310

xx State of the art of the co-incineration of waste-derived fuels and raw materials in clinker/cement plants
LIST OF TABLES
Table 2.1: The 34 German cement works with their location, capacity, kiln system and competent
authorities (see Figure 2.1 above) .................................................................................................... 4 Table 3.1: Borderlines of the inner and outer material balance of the clinker burning process, [Sprung,
1988] .............................................................................................................................................. 24 Table 3.2: Typical example for volatility values of sulphur, potassium, sodium, and chlorine (values for hot
meal and clinker in weight-%), [Waltisberg, 2012] ........................................................................ 26 Table 3.3: Example for the enrichment of the volatile minor elements Na, K, S, and Cl in a kiln system with
suspension cyclone preheater, [Waltisberg, 2012] ........................................................................ 30 Table 3.4: Concentration of lead in raw meal and hot meal as well as in the coarser and fine fraction,
[Waltisberg, 2012] .......................................................................................................................... 35 Table 3.5: Deposits, composition, TOC contents, CO2 contents as well as the quantities of released CO and
VOC (during preheating) of 15 German kiln meals -according to [Zunzer, 2002] .......................... 42 Table 3.6: TOC contents (related to dry matter) of the main raw materials(); for comparison, the range of
TOC contents of the analysed meals (see Table 3.5 above) is mentioned again – [Zunzer, 2002] 43 Table 3.7: Compilation of the characteristics of the four examined rotary kilns with 4-stage cyclone
preheaters and the results of CO and VOC measurements, according to [Zunzer, 2002] ............. 52 Table 3.8: Benzene quantity released from three different raw material components in the expulsion test,
[Waltisberg, 2012] .......................................................................................................................... 55 Table 3.9: Natural and waste-derived raw material components of a cement works and the benzene
quantities released; determined with the expulsion test, [Waltisberg, 1988] .............................. 56 Table 3.10: Comparison of the increase of VOC and benzene emissions (as a result of the use of road debris)
in the expulsion test and at a real cement plant, [Waltisberg, 1988] ............................................ 57 Table 3.11: Characteristics of the kiln-precalciner system of the Norcem AS cement plant in Brevik, Norway
in 2000 [Tokheim et al., 2001] ....................................................................................................... 67 Table 3.12: Average concentration of selected components in the rotary kiln waste gas of the Norcem AS
cement plant in Brevik, Norway, [Tokheim et al., 2001] ................................................................ 67 Table 3.13: Description of the modifications of the calciner/prehater system, [Tokheim, 2005] .................... 70 Table 3.14: Fuel consumption and heating values in 2005, [Tokheim, 2005; Tokheim, 2006] ......................... 71 Table 3.15: Classification of rotary kiln burners with photos or schemes of the burner tips, based on
[Emberger/Hoenig, 2011]; twist as a synonym to swirl ................................................................. 88 Table 4.1: Chemical analyses of raw materials and cement raw meal for the production of cement clinker,
[EC BREF CLM, 2010] ...................................................................................................................... 96 Table 4.2: Heavy metals in raw materials, raw meal as well as in hard coal and lignite, [EC BREF CLM, 2010]
........................................................................................................................................................ 97 Table 4.3: Heavy metals in raw materials, the raw meal, conventional fuels as well as in the clinker, the
Portland cement and blast furnace cement, [FZKA, 2003] ............................................................ 98 Table 4.4: Natural and waste-derived raw materials used in the German cement industry in 2010, based
on [VDZ, 2011] .............................................................................................................................. 100 Table 4.5: Quantities of waste-derived raw materials used in German cement plants from 1998 – 2011,
based on [VDZ, 1999; VDZ, 2000; VDZ, 2001: …;VDZ, 2012] ........................................................ 101 Table 4.6: Heavy metal content of various waste-derived raw materials, [FZKA, 2003] .............................. 102 Table 4.7: Theoretical thermal energy demand and release from reactions and processes of clinker
production, based on [Locher, 2000] ........................................................................................... 103 Table 4.8: Real clinker-specific energy demand for cement plants according to different sources ............. 104 Table 4.9: Decrease of production due to the substitution of hard coal by lumpy plastics ......................... 109 Table 4.10: Fossil (primary) fuels used in the German clinker production plants from 1996 – 2010 in million
GJ/yr, [VDZ, 1999; VDZ, 2000; VDZ, 2001; …;VDZ, 2012; Scheuer, 2003; Wirtwein/Emberger, 2010] ............................................................................................................................................ 113
Table 4.11: Type and quantity of waste-derived fuels used in German clinker production units from 1998 – 2011, based on [VDZ, 1999; … ;VDZ, 2012] .................................................................................. 118
Table 4.12 Heavy metal content of different waste-derived fuels, all values from [FZKA, 2003], except for municipal sludge for which the values have been taken from [DE Klärschlamm, 2012] ............. 119
Table 4.13: Information on the waste-derived fuels used in the 34 German clinker production sites and the concerned requirements; the source of information is the available permits [BBU, 2013] ........ 121

State of the art of the co-incineration of waste-derived fuels and raw materials in clinker/cement plants
xxi
Table 4.14: Positive list of waste-derived fuels to use in cement and lime plants as well as in large combustion plants; according to [NRW MUNLV, 2005] ............................................................... 127
Table 4.15: Median and maximum values for waste-derived fuels* [NRW MUNLV, 2005], median: i.e. that the values for 50 % of the samples taken and analysed can be higher than the median; therefore maximum values are also set. ...................................................................................................... 128
Table 4.16: Estimation of the concentration of non- and low-volatile heavy metals in waste-derived fuels to double their concentration in the clinker and comparison with the median and maximum values ........................................................................................................................................... 129
Table 4.17: Limits for heavy metals in waste-derived fuels set in the permits of five different German cement works and comparison with the guidance document of the German Federal State North Rhine-Westphalia ......................................................................................................................... 130
Table 4.18: Compilation of the maximum values for waste-derived fuel in Germany, Switzerland and Austria ..................................................................................................................................................... 131
Table 4.19: Plastic wastes from plastic manufacture, plastic processing and from commercial recycling activities as well as from private households in Germany in 2011, [Consultic, 2012] ................. 135
Table 4.20: Quantity of waste per capita for the different fractions of municipal waste from 1996 – 2010, compiled with data from [Destatis Abfallbilanz 2006, 2009; Destatis Abfallbilanz 2007, 2009; Destatis Abfallbilanz 2008, 2010; Destatis Abfallbilanz 2009, 2011; Destatis Abfallbilanz 2010, 2012; Destatis Abfallbilanz Erläuterungen, 2012] ........................................................................ 137
Table 4.21: Mass percentages and load percentages of the chlorine content in residual waste, [Schirmer, 2007] ............................................................................................................................................ 142
Table 4.22: Parameters to characterise sewage sludge and its typical content of heavy metals and other inorganic compounds, based on [DE Klärschlamm, 2012] ........................................................... 143
Table 4.23: Steps taken for the development of the EN 15359 standard ...................................................... 146 Table 4.24: Classification system for SRF according to CEN/TS 15359:2006 .................................................. 150 Table 4.25: Obligatory template for the specification of solid recovered fuels (SRF) according to CEN/TS
15359:2012, [EN 15359/2012] ..................................................................................................... 151 Table 4.26: Compilation of analytical data for mercury in different SRF from seven Member States and
Norway contained in [ERFO, 2005] .............................................................................................. 152 Table 4.27: Comparison of different standards for mercury in SRF in Europe with EN 15359....................... 157 Table 4.28: Compilation of available information on gate fees for solid recovered fuels for cement plants in
Europe .......................................................................................................................................... 177 Table 4.29: Cost estimations concerning the substitution of conventional fuels (here coal) by waste-derived
fuels, here SRF with a NCV of 18.8 MJ/kg; there are two options with a coal price of 100 and 60 EUR/t and within these two options, three different costs for the SRD are considered, based on [Lechtenberg/Diller, 2012]. .......................................................................................................... 178
Table 4.30: Cost estimations concerning the substitution of conventional fuels (here coal) by waste-derived fuels, here SRF with a NCV of 18.8 MJ/kg; there are two options with a coal price of 100 and 60 EUR/t and within these two options, three different costs for the SRD are considered, based on [Lechtenberg/Diller, 2012] ........................................................................................................... 178
Table 4.31: Compilation of transfer factors of heavy metals from the material input to the waste gas ....... 185 Table 4.32: Percentages for the incorporation of heavy metals in to the clinker and for their adsorption to
the removed filter dust [Sprung, 1988; Winkler, 1997; Zeschmar-Lahl, 2003] ............................ 186 Table 4.33: Figures for the estimation of the zinc content in the clinker ....................................................... 188 Table 4.34: Estimation of the zinc content in the clinker without input from waste-derived fuels ............... 188 Table 4.35: Estimation of the zinc content in the clinker including the input of waste tyres as a waste-
derived fuel .................................................................................................................................. 188 Table 4.36: Proposal of maximum heavy metal contents in waste-derived fuels to avoid their enrichment
in the clinker/cement in comparison with other existing standards or standard proposals ....... 190 Table 4.37: Emission limit values (daily mean values if not specified differently) and the self-monitoring of
the waste gas of the 34 German cement works; the information compiled is based on the data published by BBU [BBU, 2013]; values in [mg/Nm3], except for mercury for which the unit is [µg/Nm3] ...................................................................................................................................... 193
Table 4.38: Net calorific value (NCV), stoichiometric air (Astoich), stoichiometric off-gas (OGstoich), and dry stoichiometric off-gas as well the ratios Astoich/NCV, OGstoich/NCV, and OGstoich(dry) /NCV [Waltisberg, 2011] ....................................................................................................................... 197
Table 4.39: Stoichiometric air, stoichiometric off-gas and dry stoichiometric off-gas related to the net calorific value for different fuels and organic compounds present in the fuels [Waltisberg, 2011] ..................................................................................................................................................... 197

xxii State of the art of the co-incineration of waste-derived fuels and raw materials in clinker/cement plants
Table 4.40: Existing and new source standards for cement kilns burning traditional fuels [USA Cement, 2013] ............................................................................................................................................ 220
Table 4.41: Average values and ranges of the mercury content of natural and waste-derived raw materials as well as of conventional and waste-derived fuels according to different sources), values in [ppm] ............................................................................................................................................ 222
Table 4.42: Estimations of the percentages of the Hg input of the raw meal as well as of conventional and waste-derived fuels; for the cases 1a – 1e, average values have been used; for the cases 2a – 2c also average values have been used except for the raw meal for which a higher Hg content has been taken ............................................................................................................................. 223
Table 4.43: Principal mercury input and output mass streams of a clinker production plant with a production capacity of 3000 t/d along with their variations ....................................................... 224
Table 4.44: Calculation of the inaccuracy of a mercury balance .................................................................... 226 Table 4.45: Characterisation and selected physico-chemical properties of elementary mercury, mercury
dichloride and mercury oxide ...................................................................................................... 231 Table 4.46: Inadequate reporting of mercury emission data in [mg/Nm3] – an example .............................. 242 Table 4.47: Compilation of the definition of ‘best available techniques according to the IED, Stockholm
Convention and Minamata Convention ....................................................................................... 251 Table 4.48: Compilation of the different measures and techniques mentioned in available UN and US
documents.................................................................................................................................... 254 Table 4.49: Thallium content of different raw materials [Winkler, 1986] ...................................................... 260 Table 4.50: Overview of the measurement results of emission of low volatile and non-volatile heavy metals
of German clinker production plants; information source: [VDZ, 2006; VDZ, 2006; VDZ, 2016] . 262 Table 4.51: Annual mean values for the ammonia emissions for the compound and direct operating mode
from Portland Zementwerke GmbH & Co. KG in Solnhofen/Germany for 2008 – 2010 (see clinker production site 12 in Annex IV) ........................................................................................ 267
Table 4.52: Calculated VOC annual mean values from continuous monitoring from 2008 – 2010 in comparison with the VDZ mean values from spot measurement in the same period ................ 271
Table 4.53: Calculated CO annual mean values from continuous monitoring from 2008 – 2010 in comparison with the VDZ mean values from spot measurements in the same period ............... 283
Table 4.54: Spot measurements at German clinker production plants in the time period 2005 – 2015 for the parameters VOC and BTEX – number of kilns and spot measurements, average (mean) and median values and the three maximum values for BTEX and benzene – derived/calculated from [VDZ, 2006 … VDZ, 2016]. ............................................................................................................. 288
Table 4.55: Average of the annual mean values for VOC, BTEX and benzene for 2005 – 2015 and the percentage of BTEX and benzene of VOC .................................................................................... 290
Table 4.56: Available data for HCB emissions to air from clinker production plants...................................... 292 Table 4.57: Two HCB spot monitoring actions at the clinker production plant of w&p Zement GmbH in 9373
Wietersdorf / Klein St. Paul in the valley Görtschitztal in 2014 [Land Kärnten, 2014; Land Kärnten, 2015] .............................................................................................................................. 293
Table 4.58: Spot measurements at German clinker production plants in the time period 2005 – 2015 for the parameter PCDD/F – number of kilns, spot measurements, values below detection limit, values between 0.05 – 0.1 and above 0.1 ng I-TEQ/Nm3, and the three maximum values – derived/calculated from [VDZ, 2006 … VDZ, 2016] ...................................................................... 299
Table 4.59: Spot measurements at German clinker production plants in the time period 2005 – 2016 for the parameter PCB – number of kilns, spot measurements, number of values below detection limit, number of measurements according to DIN and WHO measurement standards, and the three maximum values – derived/calculated from [VDZ, 2006 … VDZ, 2017]. ............................ 302
Table 4.60: Chemical description, CAS number, log POW and vapour pressure of the six PCB determined with DIN 51527 (based on [IARC PCB/PBB, 2016]) ............................................................................... 302
Table 4.61: Chemical description, CAS number, log POW and vapour pressure of twelve dioxin-like coplanar PCB based on [IARC PCB/PBB, 2016]), TEQ according to [van den Berg et al., 2006] .................. 303
Table 4.62: Spot measurements at German clinker production plants in the time period 2005 – 2015 for the parameter polycyclic aromatic hydrocarbons (PAH) – number of kilns and spot measurements, average (mean) and median values and the three maximum values – derived/calculated from [VDZ, 2006 … VDZ, 2016]. ..................................................................... 306
Table 5.1: Permitting procedure for clinker production plants according to the 4th BImSchV ......................... 309 Table 5.2: 17th BImSchV - development of the emission limit values for mono waste incineration plants and
for the co-incineration of waste in clinker production plants from 1990 to 2013; values in mg/Nm3, dry waste gas (changes from one version to the next are underlined and coloured) .. 312

State of the art of the co-incineration of waste-derived fuels and raw materials in clinker/cement plants
xxiii


Chapter 1
State of the art of the co-incineration of waste-derived fuels and raw materials in clinker/cement plants
1
1 INTRODUCTION AND PURPOSE OF THE STUDY
The world’s economy is based on huge mass streams. Products are considered as desired mass streams whereas emissions (to air, water and soil, and waste heat) are undesired mass streams. The production of cement is a predominant example for that. Its production requires considerable material input to burn clinker which is mixed with certain additives to form the final product: cement (Figure 1.1). Cement has become an indispensable material to construct buildings and infrastructure elements (bridges, tunnels, dams, sewers, power plants etc.). For the moment, there is no substitute in sight. For decades, the process to produce clinker has been subject to optimisation efforts. From the environmental point of view, this mainly concerns the reduction of energy consumption and the minimisation of emissions, especially to air. From the economic point of view, the focus is on the substitution of fossil fuels by cheaper alternatives, especially the use of waste-derived fuels with sufficient calorific value, also called alternative fuels. These two main issues can be tackled by a solution of synergy but, depending on the applied process conditions, there are also cases of increased emissions (mainly to air) where waste-derived fuels are used. To a minor extent, natural raw materials are also substituted by wastes, also called alternative raw materials.
Figure 1.1: Scheme on the principle input and output of cement plants
The use of waste-derived raw materials and fuels for the clinker burning process is called co-incineration. This co-incineration is the subject of this habilitation treatise. The intention and purpose is to reflect and to describe the current state of knowledge as well as of the state of the art. The structure of this document follows Figure 1.1. The emissions depend on the process with its specific conditions and inputs. Concerning the production process, the description will be kept short for well known facts but will be more detailed where this enhances the understanding of emissions. The emissions to air form the core of the document. For the first time, the continuous monitoring data for all 34 German clinker production sites are available and are evaluated and assessed in detail. In addition, the impact of waste-derived raw materials and fuels on the clinker quality is considered. New findings are presented and important conclusions are drawn with respect to further minimisation of emissions to air as well as to required amendments of existing German regulation to achieve this needed minimisation. Special reference and consideration are given to the revised Reference Document on Best Available Techniques in the Cement, Lime and Magnesium Oxide Manufacturing Industries [EC BREF CLM 2010].
Raw mill Cooler
Pre
hea
ter
raw
materials
natural/conventio.
waste-derived
fuelsconventio. (fossil)
electricity
air
water
clinker
auxiliaries
waste-derived
Grinding(cement mill)
cement
air
air
additives
and
wastes
Clinker
burning
emissions to air
filter dust
INPUT OUTPUT

Chapter 1
2 State of the art of the co-incineration of waste-derived fuels and raw materials in clinker/cement plants
For the time being, this reference document is considered to present the world-wide most challenging best available techniques in the most comprehensive way. However, as even in this reference document, important aspects have been overlooked and some techniques were not sufficiently considered, additional conclusions are drawn which are relevant for the above mentioned amendment of existing legislation.

Chapter 2
State of the art of the co-incineration of waste-derived fuels and raw materials in clinker/cement plants
3
2 CEMENT PRODUCTION IN GERMANY, EUROPE AND WORLDWIDE
Production facilities in the German cement industry are spread evenly all over the Federal Republic of Germany and located in the immediate vicinity of the respective limestone deposits (Figure 2.1). By the end of 2010, 16 companies with 34 clinker production sites produced about 30.3 million t of cement in Germany [VDZ, 2011] with 38 rotary kilns with cyclone preheaters and 6 Lepol kilns (however, one is in stand-by) were in operation. The cement works in Wetzlar was closed at the end of 2010.
Figure 2.1: Cement works with and without clinker(2) production in Germany in 2010 as well as indications of available limestone deposits, [VDZ, 2011]; the figure shows 35 clinker production sites but the one in Wetzlar has been closed by the end of 2010
Table 2.1 contains all 34 German cement works having clinker production with their location (federal state and city), capacity, kiln system and competent authorities (see Figure 2.1 above). The 34 works are located in 10 federal German states where 22 competent authorities are in charge of permitting
(2) Clinker (also called Portland cement clinker) is produced from a raw material mix which is heated up to a
temperature of approximately 1,450 °C in a rotary kiln until it starts sintering. Cement is the finely ground mixture of clinker and calcium sulphate (natural gypsum, anhydrite or gypsum from flue gas desulphurisation) as well as, in most cases, of other components (additives) such as granulated blast furnace slag, natural pozzolana (e.g. trass), fly ash, burnt oil shale or limestone.

Chapter 2
4 State of the art of the co-incineration of waste-derived fuels and raw materials in clinker/cement plants
and enforcement. The total clinker production capacity is about 100 000 t/d and, with 330 production days per year, 33 million tonnes per year, which is significantly more than real production which was 23 million tonnes in 2010 [VDZ, 2011].
Table 2.1: The 34 German cement works with their location, capacity, kiln system and competent authorities (see Figure 2.1 above)
Federal StateCompetent
authorityNo. Name of the operator Location
Capacity
[t/d]Kiln type
1BADEN-
WÜRTTEMBERG
1 RP Karlsruhe 1 HeidelbergCement AG Leimen 2500 2 Lepol kilns
2 Lafarge Zement Wössingen GmbH Walzbachtal 2300 1 RK with 5-st. cycl. preheater
2 RP Stuttgart 3 Schwenk Zement KG Mergelstetten 3400 1 RK with cycl. preheater
3 RP Tübingen 4 HeidelbergCement AG Schelklingen4710 (3610 und
1100)
1 RK with cycl. preheater und 1 Lepol kiln with
1100 t/d, not in operation since 2004
5 Holcim GmbH Dotternhausen 2300 1 RK with cycl. preheater
6 Schwenk Zement KG Allmendingen 4000 1 RK with cycl. preheater
2 BAVARIA
4 LRA Donau-Ries 7 Märker Zement GmbH Harburg 3000 1 RK with cycl. preheater
5 LRA Main-Spessart 8 Schwenk Zement KG Karlstadt 3600 1 RK with cycl. preheater
9 HeidelbergCement AG Triefenstein 3800 1 RK with cycl. preheater
6 LRA Rosenheim 10Südbayrisches Portland-Zementwerk Gebr.
Wieshöck & Co. GmbHRohrdorf 3500 1 RK with cycl. preheater
7 LRA Schwandorf 11 HeidelbergCement AG Burglengenfeld 4000 2 RKs with cycl. preheater
8LRA Weißenburg-
Gunzenhausen12 Portland-Zementwerke GmbH & Co. KG Solnhofen 1500
1 RK with cycl. preheater, Polysius-calciner and
bypass
3 BRANDENBURG
9 LUA Brandenburg 13 Cemex Ost-Zement GmbH Rüdersdorf 60001 RK with 5-st. cycl. preheater, 2 strings, circ.
fluidised bed and KHD-calciner and 1 small RK
with cycl. preheater
4 HESSE
10 RP Darmstadt 14 Dyckerhoff AG Amöneburg 750 1 RK with cycl. preheater
12 RP Kassel 15Zement- und Kalkwerke Otterbein GmbH &
Co. KGGroßenlüders-Müs 650 1 RK with cycl. preheater
5 LOWER SAXONY
13 SGAA Hannover 16 Holcim AG Höver 3000 1 RK with cycl. preheater
17HeidelbergCement AG (ehem. Teutonia
Zement AG)Hannover 2500 1 RK with 4-st. cycl. preheat., KHD-Calciner
6NORTH RHINE-
WESTPHALIA
14 BZR Arnsberg 18 Wittekind Hugo Miebach & Söhne Ewitte 2500 1 RK with cycl. preheater, calciner
19 Seibel & Söhne GmbH & Co. KG Ewitte 1650 3 Lepol kilns
20 Gebr. Seibel GmbH & Co. KG Ewitte 2100 1 RK with cycl. preheater, calciner
21 Spenner Zement GmbH & Co. KG Ewitte 3200 1 RK with cycl. preheater, calciner
22 Dyckerhoff AG Geseke 1500 1 RK with cycl. preheater, calciner
23 HeidelbergCement AG Geseke 3000 1 RK with cycl. preheater
15 BZR Detmold 24 HeidelbergCement AG Paderborn 1250 1 RK with cycl. preheater
17 BZR Münster 25 HeidelbergCement AG Ennigerloh 3500 1 RK with cycl. preheater
26 Dyckerhoff AG Lengerich 5200 2 RKs with cycl. preheater, FLS-calciners
27 Cemex West-Zement GmbH Beckum 3500 1 RK with cycl. preheater
28Phoenix Zementwerke Krogbeumker GmbH &
Co. KGBeckum 1400 1 RK with cycl. preheater
7RHINELAND-
PALATINATE
18 SGD Nord 29 Portlandzementwerk Wotan H. Schneider KG Üxheim-Ahütte 800 1 RK with cycl. preheater
19 SGD Süd 30 Dyckerhoff AG Göllheim 3200 2 RKs with cycl. preheater
8SAXONY-
ANHALT
20 LVA Halle 31 Lafarge Zement Karlsdorf GmbH Karlsdorf 3650 3 RKs with cycl. preheater
32 Schwenk Zement AG Bernburg 50001 RK with 6-st. cycl. preheater, 2 strings, Polysius-
calciner
9SCHLESWIG-
HOLSTEIN
21 StUA Itzehoe 33 Holcim AG Lägerdorf 48001 RK with 3-st. cycl. preheater, 2 strings, Polysius-
calciner
10 THURINGIA
22 LUA Weimar 34 Dyckerhoff AG - Deuna Zement GmbH Deuna 5500 2 RK with cycl. preheater
10 22 34 98550
Plants

Chapter 2
State of the art of the co-incineration of waste-derived fuels and raw materials in clinker/cement plants
5
The number of cement works with clinker production in the 28 EU Member States is shown in Figure 2.2. In the meantime, the number of German works has decreased by about 10 %, most probably in other EU Member States as well. The four biggest economies in the EU also have the highest number of cement works whereas the numbers for Italy and Spain are disproportionately high.
Figure 2.2: Number of cement kilns in the EU Member States in 2008, [EC BREF CLM, 2010]
Figure 2.3 indicates the stagnation of cement production in Germany in the past 50 years. There does not seem to be a growth potential.
Figure 2.3: Cement production in Germany from 1959 – 2010, [USGS, 2012; VDZ, 1998-2018]
The same stagnation is true for the European Union as a whole whereas cement production in Asia, especially in China, is still growing exponentially (see Figure 2.4).
0
10
20
30
40
50
60
70
Au
stri
a
Be
lgiu
m
Bu
lgar
ia
Cze
ch R
ep
ub
lic
Cyp
rus
De
nm
ark
Esto
nia
Fin
lan
d
Fran
ce
Ge
rman
y
Gre
ece
Hu
nga
ry
Ire
lan
d
Ital
y
Latv
ia
Lith
uan
ia
Luxe
mb
ou
rg
Mal
ta
Ne
the
rlan
ds
Po
lan
d
Po
rtu
gal
Ro
man
ia
Slo
vaki
a
Slo
ven
ia
Spai
n
Swe
de
n
Un
ite
d K
ingd
om
Nu
mb
ero
fc
em
en
tk
iln
s
Ce
me
nt
pro
du
cti
on
in [
Mio
t/yr]
1959 - 2017

Chapter 2
6 State of the art of the co-incineration of waste-derived fuels and raw materials in clinker/cement plants
Figure 2.4: Cement production in Germany, the European Union and worldwide from 1959 – 2010, [USGS, 2012; EC BREF CL; VDZ, 1998-2010, EUROSTAT, 2012]
0
500
1000
1500
2000
2500
3000
3500
1959
1961
1963
1965
1967
1969
1971
1973
1975
1977
1979
1981
1983
1985
1987
1989
1991
1993
1995
1997
1999
2001
2003
2005
2007
2009
Germany
European Union
WORLD
1959 - 2010
Ce
me
nt
pro
du
cti
on
in [
Mio
t/yr]
Cement production in Germany, the European Union and in the world from 1959 - 2010

Chapter 3
State of the art of the co-incineration of waste-derived fuels and raw materials in clinker/cement plants
7
3 THE CEMENT PRODUCTION PROCESS
3.1 Overview of clinker production
The production of clinker and cement respectively comprises the raw material winning including preparation, storage, blending, homogenization, the clinker burning process as such, clinker grinding together with additives and wastes, and finally packaging and dispatch. Figure 3.1 provides a principle overview of a cement works.
Figure 3.1: Overview of a cement works [EC BREF CLM, 2010, p 11]
In principle, all cement works have the following sub-processes in common:
raw materials – storage and preparation
fuels – storage and preparation
use of wastes as raw materials and/or fuels, quality requirements, control and preparation
the kiln systems, kiln firing processes and emissions reduction techniques
products – storage and preparation
packaging and dispatch. Here, the focus is directed onto the clinker burning process as it is the dominating source of emissions (to air). However, in Chapter 1, under ‘input and output mass streams’, the most important facts in the other parts of a cement works are also briefly described.

Chapter 3
8 State of the art of the co-incineration of waste-derived fuels and raw materials in clinker/cement plants
3.2 The clinker burning process
Basically, the clinker burning process consists of the clinker burning as such (preheating, kiln firing process with or without precalcination, and with or without a chlorine bypass) followed by the clinker cooling and the cement mill where clinker is ground together with additives and wastes to produce the final product: cement. In Europe, clinker is predominantly burned in rotary kilns; shaft kilns are seldom used and are therefore not described here. First, the heart of the clinker burning process will be described including the developments to date. Then, special consideration will be given to preheating and the associated circles of certain compounds, to the precalcination process, as well as to the chlorine bypass.
3.2.1 Short description
Rotary kilns are refractory-lined steel tubes with a diameter of up to about 6 meters and a length to diameter ratio of between 10:1 and 38:1. They are inclined at an angle of 2.5-4° and rotate at 0.5-5.0, usually 1.2-2, times per minute. As a result of the inclination and rotation of the tube, the material to be burned, fed into the top of the kiln moves down the tube. Thus, it moves towards the coal dust, oil, gas, and/or waste-derived fuel flame burning at the bottom of the tube [Locher, 2000, p 55; Ullmann’s, 1986; EC BREF CLM 2010]. Thus, the gas stream is flowing counter-currently to the solids. All long wet and dry kilns are equipped with internals (chains, crosses, lifters) to improve heat transfer.
3.2.2 Reactions occurring on burning and cooling
The continuous production of high quality cements requires raw material mixtures with an optimal composition only varying within a small range [Winnacker-Küchler, 2004, p 10]. The stoichiometric requirements are controlled by the three important oxide ratios i.e. Lime Saturation Factor (LSF), Silica Modulus (SM) and Alumina Modulus (AM) which are known as moduli values in the industrial practice [Chatterjee, 2011]. The energy released on fuel combustion in the rotary kiln is transferred to the material being processed. This material forms a coherent stream, which fills only a small part of the cross-section of the kiln, and because the kiln gas flows over the material, the area exposed to heat transfer is relatively small. On the other hand, this coherent stream of material facilitates the formation of clinker and tricalcium silicate. Figure 3.2 shows the basic physical and chemical reactions in clinkerisation.

Chapter 3
State of the art of the co-incineration of waste-derived fuels and raw materials in clinker/cement plants
9
Figure 3.2: Approximate reaction sequence in clinkerisation, [Chatterjee, 2011] Legend: C2S: Dicalcium silicate; CA: Monocalcium aluminate ; C12A7: Dodecacalcium hepta-aluminate; C3S: Tricalcium silicate; C3A: Tricalcium aluminate; C4AF: Tetracalcium aluminoferrite
First, up to temperatures to 200 °C, dehydration takes place – i.e. the drying processes where free water is evaporated from the material. In the temperature range of 100 – 400 °C, the pore and interlayer water is released. At elevated temperatures about 400 – 750 °C, depending on the type of clay mineral, the chemical bound water is released in form of hydroxy groups (dehydroxylation). In the temperature range of 300 – 500 °C (i.e. in the preheater), oxidation of sulphides present in the raw meal takes place and thus, SO2 is formed (4 FeS2 + 11 O2 8 SO2 + 2 Fe2O3) being part of the gas phase [VDZ-SO2, 2002; Enders/Haeseli, 2010]. In the temperature range of 600 – 900 °C, the breakdown of alumino silicates takes place. The calcium carbonate, present in the raw meal, decomposes to calcium oxide (CaO) and carbon dioxide (CO2) (decarbonation, also called calcinations or calcining) at temperatures above 896 °C, because at this temperature, the partial pressure of CO2 exceeds one bar [Winnacker-Küchler, 2004]. The reaction enthalpy of this decarbonation reaction is very high and amounts to 2114 kJ/kg clinker which is about two thirds of the total energy demand to burn clinker [Steinbiß, 1979; Locher, 2000, p 69]. This is important to know when considering precalciners. The calcination process takes place before the rotary kiln; therefore, the term precalciner but also just calciner is used. The mentioned high temperature of 896 °C is for pure calcite. However, with an increasing percentage of other compounds, as is always the case for raw kiln meals, the thermal decomposition is shifted to lower temperatures. In practice, decarbonation already starts between 550 and 600 °C. The reason for this is that chemical reactions occur between the formed CaO and the admixtures as SiO2, Al2O3 and Fe2O3. Due to quality requirements, the residual content of free CaO in the clinker shall be below 2 weight-% [Winnacker-Küchler, 2004, p 33].
t1 t2 t3 t4
Heating scheduleTemperature °C
1.2
7 C
O2
+ C
aOt
De
gre
eo
fbu
rnin
g=
CaO
t
t1 t2
t3 t4
Dehydration and dehydroxylation
27°C 600°COHH2O
550°C 1000°C
600°C 950°C
Decarbonation
Break-down of aluminosilicates
Solid-state reactions550°C 1280°C
CaO ~ 17 %
Al2O3 + SiO2 + Fe2O3
CaO < 2 %
1280°C 1450°CC3S + C2S + Melt
1000°C 1300°C
Liquid phase sintering
Melt formation
Cooling C3S + C2S + C3A + C4AF
C2S + CA + C12A7 + ferrite + CaO

Chapter 3
10 State of the art of the co-incineration of waste-derived fuels and raw materials in clinker/cement plants
At temperatures of about 550 – 600 °C, solid-state reactions start between the formed CaO and the compounds resulting from the decomposition of clays. In general, solid-state reactions are slow but can be accelerated by reducing the grain size, by increasing the burning temperature and by foreign ions in the crystal lattice. The first melt formation, and thus the start of sintering, happens at temperatures of about 1260 – 1310 °C. The liquid phase in the clinker increases by increasing temperature. At 1415 °C, it amounts to about 20 – 30% and depends on the chemical composition of the raw material. In the melt, the diffusion of the reaction partners is significantly facilitated. Thus, the main target of the sintering process, the formation of tri calcium silicates, is achieved but this requires the adjustment of very high temperatures (> 1420 °C, see Figure 3.3 below) causing high costs. To achieve these high temperatures in the material, a very high flame temperature of more than 2000 °C is required which can only be achieved with fuels having a high calorific value. In the liquid phase, consisting of aluminate and ferrite, the solid silicate phases tricalcium silicate and dicalcium silicate are embedded. The composition of the melt is approximately 56% CaO, 7% SiO2, 23% Al2O3 and 14% Fe2O3 [Winnacker-Küchler, 2004, p 32]. The melt has to be rapidly cooled down in order to avoid the transformation of tricalcium silicate to dicalcium silicate. Figure 3.3 illustrates the chemical transformation processes along the kiln as well as the temperature profile. As this process is without a calciner, the calcining zone is within the kiln requiring a major part of the energy input.
Figure 3.3: Reactions of the clinker burning process in a rotary kiln without precalciner, [Winnacker-Küchler, 2004, p 30]
3.2.3 Development of clinker burning
The choice of process is, to a large extent, determined by the state of the raw materials (dry or wet). In Europe, more than 90 % of production is based on dry processes thanks to the availability of dry raw materials. Wet processes require more energy, and are thus more expensive. Plants using semi-dry processes are likely to change to dry techniques whenever expansion or major improvement is

Chapter 3
State of the art of the co-incineration of waste-derived fuels and raw materials in clinker/cement plants
11
required. Plants using wet or semi-wet processes normally only have access to moist raw materials, as is the situation in Denmark and Belgium, and to some extent in the UK [EC BREF CLM, 2010, p 10]. There are four main process routes for the manufacture of cement - the wet, semi-wet, semi-dry and dry processes. As indicated above, in Germany and Europe, dry processes are applied in more than 90% of plants. As a consequence, the wet, semi-wet and semi-dry processes are only briefly described.
In the wet process, the raw materials are ground in water to form pumpable slurry with a water content of 28 – 42 %. The slurry is directly fed into the kiln. Figure 3-4 provides the overview of this process. In Germany, there is no wet process in operation any more. The production capacity of this process is between 100 and 3,600 t/d.
Figure 3.4: Overview of the wet process
In the semi-wet process, the slurry is first dewatered in filter presses. The residual water content varies between 18 and 23 %. The filter cake is extruded into pellets and fed to a grate preheater. Figure 3.5 provides the overview of this process. This type of kiln with grate preheaters were developed by O. Lellep and the company Polysius; thus, these kilns are called Lepol kilns [Locher, 2000, p 58]. The production capacity of this process is between 100 and 3,000 t/d.
Slurry
35 % H20, 20 C
200 C, 10 mbar, 2 % O2, Nm3/kg Gas: 900 C
Meal: 400 C
Electrostatic precipitator
Electrostatic precipitator
Stack Stack
Filter dust, 0.15 kg/kg
Filter dust
Gas streamSolids
50 mbar20 mbar
Clinker, 80 C installe:d: 3.0 Nm3/kg, 20 C operation: 2.3 Nm3/kg
Secondary air: 1.4 Nm3/kg, 670 C
0.9 Nm3/kg, 180 C
Raw materials

Chapter 3
12 State of the art of the co-incineration of waste-derived fuels and raw materials in clinker/cement plants
Figure 3.5: Overview of the semi-wet process – semi-wet Lepol kiln
In the semi-dry process, dry raw meal is pelletised with water and fed into a grate preheater before the kiln. Figure 3.6 provides the overview of this process. This type of kiln is also called Lepol kiln. However, the water content of the feed is further reduced to 11 – 14 %. The production capacity of this process is between 500 and 3,200 t/d.
Figure 3.6: Overview of the semi-dry process – semi-dry Lepol kiln
Gas streamSolids
Filter cakes, 20 % H20, 2.1 kg/kg
300 C, 5 % O2, 1.7 Nm3/kg
100 C, 8 mbar, 12 % O2, 3.5 Nm3/kg, dust: 0.01 kg/kg
Electrostatic precipitator
Secondary air: 1.4 Nm3/kg, 670 C
1.3 Nm3/kg, 120 C
Dust, 0.1 kg/kg Dust, 0.02 kg/kg
Stack
1000 C
Grate preheater
ClinkerTravelling grate cooler
Raw materials
Drying chamber
Fuel dosing
Burner
Stack
Grate dust
Clinker
Travelling grate cooler
Travelling grate preheater
Primary air fan
Hot chamber
Homoge-nizing
and storage
silo
WaterGranulating
discCirculation
air fan
Electrostatic precipitator
Nodules
Raw meal
Gas streamSolids

Chapter 3
State of the art of the co-incineration of waste-derived fuels and raw materials in clinker/cement plants
13
In the dry process, the raw materials are ground and dried to raw meal in the form of a flowable powder with a water content of less than 1 %. The dry raw meal is fed to a preheater. Kilns with preheaters are dominate and are significantly shorter (40 – 100 m). First, kiln systems equipped with 4-stage cyclone preheaters were developed without secondary firing (Figure 3.7).
Figure 3.7: Overview of a dry process showing a kiln with 4-stage cyclone preheater without secondary firing
The next step in the kiln system development was the introduction of secondary firing positioned above the kiln inlet. So, a large fraction or most of the calcination already takes place before the rotary kiln and thus the calcining zone in the kiln (see Figure 3.3) is significantly smaller. This means that the fuel input is split into primary (at the kiln head via the main burner) and secondary firing (in the riser duct or in a specifically designed precalciner, also just called calciner). The first calciner was developed to use oil shale as a low-grade fuel having a high calcium carbonate content. The patent concerned was issued in 1965 [Patent, 1965]. Because of the high calcium content, the oil shale could not be fed via the main burner and thus, a system was developed to dose the oil shale in a burning shaft after the kiln inlet (see Figure 3.8).
Figure 3.8: Dry kiln system with a precalciner prior to the preheater without additional air supply, according to [Rechmeier, 1970]
Conditioning tower
Stack Bag filter
Meal dosing
Cyclone preheater
Raw meal in
Raw materi.
in
Homogenisation silo
Raw
meal silo
Gas stream
Solids
Clinker
Air-to-air cooler
Bag filter
Stack
Kiln drive
4-stage suspensioncyclonepreheater
Grate cooler
Main burner
Kiln inlet
Filter dust
Rotary kiln
Precalciner
fuel

Chapter 3
14 State of the art of the co-incineration of waste-derived fuels and raw materials in clinker/cement plants
This calciner and the related 5-stage cyclone preheater kiln went into operation in 1967 [Frankenberger, 1968; Steinbiß, 1979]. In Germany, no calciner was built in the following 12 years, i.e. from 1967 - 1979. However, in Japan, a variety of calciners were developed which first used oil as a fuel [Steinbiß, 1979, Tiggesbäumker, 1985]. In 1979, in Japan, more than 40 kilns were already operated with various calciner processes whereas there were none in Germany. However, at existing kilns, the introduction of fuel into the rising duct of the preheater was initiated. As this is not carried out by means of a specific burner, no stable flame was created and so, this type of combustion was called flameless combustion [Steinbiß, 1979]. So, the basic set-up remained the same as indicated in Figure 3.7. In a conventional 4 stage cyclone preheater kiln (without precalciner), it is only possible to burn fuels in the kiln inlet with substitution rates of up to 25 – 30 %. This means that 70 – 75 % has to be fired in the main firing point at the bottom end of the kiln [Steinbiß, 1979, Kreft et al., 1987; Schneider et al., 2011]. Since precalcining also enables the input of lower-grade fuels, it offers numerous options of using wastes. The motivation for that was and still is mainly economy-driven [Steinbiß, 1979; Kreft et al., 1987; Küppers, 1998; Lübbe-Wolff, 1999; StUA Münster, 2000; Scheuer, 2003; Schöffmann, 2003; EC RDF, 2003; Gemmer/Schneider, 2006;Genon/Brizio, 2008; VDZ Umweltschutz, 2007; Binninger, 2009; Emberger/Hoenig, 2011; Schneider et al., 2011; Locher/Klein, 2011a; Hoenig et al., 2011]. So, for secondary firing, first, oil shale was used for the above mentioned first application, then oil followed by coal. Finally, a wide range of wastes is used. Due to the increasing use of wastes in the precalciners, this specific element of the clinker production process is described in more detail in a separate chapter 3.3.2. To increase the consumption of lower-grade fuels (wastes) for secondary firing in order to precalcine the kiln meal, a tertiary air duct was installed providing hot air from the clinker cooler. In 1993, in Europe, already many of the 4-stage cyclone preheater kilns, most of the 5-stage cyclone preheater kilns, and all of the very few 6-stage cyclone preheater kilns were equipped with a tertiary air duct [Erhard/Scheuer, 1993] but not necessarily with a special calciner as was already the case in many Japanese cement works. But calciners were increasingly being introduced. As already indicated, they are positioned between kiln and preheater and hot air from the clinker cooler was and is provided via the tertiary air duct (Figure 3.9).
Figure 3.9: Dry kiln system with a specially designed precalciner prior to the preheater, tertiary air duct and 5- or 6-stage cyclone preheater
Gas stream
SolidsCalciner
Conditioning tower
Raw mill
Stack Bag filter
Meal dosing
Clinker
Air-to-air cooler
Bag filter
Stack
Kiln drive
5-stage suspension cyclone preheater
Grate cooler
Main burner
Kiln inlet
Raw meal in
Raw materi.
in
Homogenisation silo
Raw
meal silo
Filter dustFuel in
Rotary kiln

Chapter 3
State of the art of the co-incineration of waste-derived fuels and raw materials in clinker/cement plants
15
A further step is the introduction of a pre-combustion chamber prior to the precalciner to use lumpy materials, specifically refuse derived fuels, such as medium-calorific waste-derived fuels with a coarser grain size (up to 120 mm) derived from commercial and also household waste [Pomberger et al., 2012] and also whole waste tyres as well as lumpy waste plastic collected from household by the Deutsches Duales System. However, these pre-combustion chambers are not equipped with a burner system. So, they are called flameless combustion system. Currently, there are two technical applications available: the HOTDISC and the PREPOL Step Combustor; the latter was implemented for the first time at the end of 2012 whereas the HOTDISC technology is already more widely applied. HOTDISC: Following pilot tests, this approach was developed by Polysius AG/Germany and firstly applied at the cement works of Jura Cement Fabriken in Wildegg/Switzerland in 2000 [Scheuer, 2003]. Later on, this technique was commercialised by FLSmidth/Denmark as the so-called HOTDISC with the first application at the cement works Kjøpsvik/Norway of HeidelbergCement AG in November 2001 [Scheuer, 2003]. At the end of 2009, this technique has also been applied at cement works in Canada, Brazil, Slowakia, and Slovenia. The HOTDISC comprises a large, moving hearth furnace consisting of the following elements (see Figure 3.10):
An annular, refractory-lined combustion chamber with a stationary casing, a roof, and a central column (see Figure 3.10). The bottom of the combustion chamber is a horizontal, refractory lined rotary disc.
A wall upon which scraper segments are mounted. The wall itself divides the annular combustion chamber between the fuel inlet and the residual ash outlet (see Figure 3.11 on the left).
A slewing ring which rests on a support and carries the rotary disc. The slewing ring is toothed on the inside and driven by two geared motors with frequency drive. By means of the frequency drives, the speed can be varied from 1 – 22 revolutions per hour.
Figure 3.10: Scheme of the pre-combustion chamber HOTDISC, [FLS, 2011]
The waste-derived fuels are introduced onto the slowly rotating disc, where they start to burn under oxidizing conditions when meeting the supply of hot tertiary air. Fuel residence time can be adjusted
Kiln riser duct
Rotating disc
Scraper
Kiln gases
Ashes/residues
Emercency cold
raw meal inlet
Preheated raw
meal inlet
Alternative
fuel
Tertiary air

Chapter 3
16 State of the art of the co-incineration of waste-derived fuels and raw materials in clinker/cement plants
by the disc’s rotational speed. Operation is also controlled by regulating raw meal feed to the pre-combustion chamber which is placed prior to the precalciner (see Figure 3.11 on the right). In case of required emergency cooling, cold meal can be inserted via a separate inlet pipe.
Figure 3.11: Side view and top view (left figure [FLS, 2007]) of the pre-combustion chamber and scheme of it retrofitted into a 5-stage cyclone preheater with inline precalciner (figure on the right [FLS, 2011])
For integration of the pre-combustion chamber into an existing plant, a tertiary air duct and the possibility to feed preheated raw meal must be available. Further, an air lock has to be installed at the fuel feed point – typically a large triple flap gat, as well as a hot meal dividing gate [FLS, 2011]. The scraper moves the remaining ash including metals as well as the partly calcined meal to the riser duct. Depending on the specific weight, the particle size and form, a fraction of these materials is entrained with the kiln gases. The same applies to the waste gas from the pre-combustion process which, due to the inhomogeneous waste (different type of materials and different grain size), will not be completely incinerated. Post-combustion may occur in the subsequent precalciner. It has not been reported yet whether waste gas strains occur and whether elevated levels of carbon monoxide and organic compounds are associated with this type of pre-combustion (see 3.3.2.5). PREPOL Step Combustor: This technique has also been developed by Polysius AG/Germany and has been implemented at industrial scale for the first time at the Holcim cement works in Lägerdorf/Germany in 2013/2014. As a waste fuel, coarse, large-sized sales packaging collected from households by the Duales System Deutschland are used in a quantity of 80,000 t/a and 10 t/h respectively. In addition, waste roofing felt
Precalciner
Cold raw meal bin
Triple flap sluice
Meal to HOTDISC
HOTDISC
Tertiary air
5-stage
cyclone
preheater
Kiln inlet
Ashes and
metalsKiln gases
Outlet for:
Combustion gases,
hot raw meal,
ashes
Rotating disc
Raw material inlet
Burning
material
Feed inlet chuteScraper
Hot tertiary air Waste
inlet

Chapter 3
State of the art of the co-incineration of waste-derived fuels and raw materials in clinker/cement plants
17
is also fed to the new system. The waste fuel has undergone none or simple pre-treatment (Holcim Lägerdorf, 2012). This is somehow a paradigm change; so far, there was the approach that in cement plants, only well-defined and processed waste-derived fuels can be used which meet certain quality requirements including a maximum size. Now, undefined waste shall be co-incinerated. The driving force seems to be economic considerations as the gate fee for this waste fuel is (much) higher compared to defined waste-derived fuels meeting certain requirements (see Chapter 4.3.2.3.7.3). So, the payback time for the investment of about 11 million EURO may be attractive. According to (Baier/Menzel, 2011; Holcim Lägerdorf, 2012), the new system consists of the following new elements:
Feeding system, part 1 Semi-trailers deliver the waste and unload it in a new dedicated unloading hall on the floor. A wheel loader charges the material to an infeed hopper which is equipped with a walking-floor system to convey the material to a drag chain conveyor. It is the task of the wheel loader driver to look for large-sized, eye-catching impurities and to separate them.
Pre-treatment of the waste The drag chain conveyor feeds a vibrating screen to remove oversized components of the material. The maximum size of the components which can pass the screen is about 250 mm for three-dimensional and about 800 mm for two-dimensional foils. Just before the conveyor belt scales to determine the waste input quantity, over belt magnetic separators remove iron components.
Feeding system, part 2 Then, the material is moved via a tubular belt conveyor system up to a height of 43 m above ground where the precombustion chamber is located. There, the material is fed to a chute followed by a double flap valve and a splitter to divide the material into two lines. Finally, the material is dosed to the precombustion chamber by means of screw conveyors (see Figure 3.12).
The precombustion chamber (see Figure 3.12) The precombustion chamber is completely lined with refractory bricks. It has a slope and 15 steps. The waste is fed from the upper end of the chamber and is moved down the steps by air shock blowers (five per step). A mixture of tertiary air and raw meal is fed from the top to the chamber.
In the precombustion chamber, first, the material is dried and the volatile compounds are evaporated and combusted. It is expected that this will take place in the first one to three minutes. Then, the combustion of the residual material occurs but the burnout is expected to be only 80 – 90 % (Holcim Lägerdorf, 2012). Obviously, the formed coke (see e.g. (Seifert et al., 2008)) cannot be completely combusted. As a consequence, coarse ash/coke particles will fall into the kiln outlet. It is expected that the smaller particles will be entrained by the kiln gas and be completely combusted in the calciner. This means, it is expected that the residual particles which could not be completely combusted at a temperature of about 850 °C in the precombustor at a retention time of 15 – 20 minutes will be completely combusted in the calciner at a retention time of a few seconds. For a better process control, the precombustor will be equipped with nine temperature measurements to determine the gas temperature (four points) and the refractory temperature (five points).

Chapter 3
18 State of the art of the co-incineration of waste-derived fuels and raw materials in clinker/cement plants
Figure 3.12: Scheme of the PREPOL Step Combustor, according to (Baier/Menzel, 2011)
Figure 3.14 shows the basic layout of the clinker manufacturing part of the Holcim cement works in Lägerdorf/Germany with the precombustion chamber and the pipes for the tertiary air, the raw meal and the feeding point of the waste fuel. As the works uses a raw material with a high moisture content, there are only three cyclone stages and a rising duct dryer followed by separation cyclones.
Figure 3.13: Basic layout of the Holcim clinker production plant in DE-Lägerdorf with an indication of the retrofitted precombustion chamber, based on (Holcim Lägerdorf, 2012)
2-3
min
Ignition and
precombustion
ca. 12 min
Drying and
pyrolysis
Course waste fuel
particle size: < 250 -300mm
Vertical part of
the precalciner
Tertiary air and
kiln meal
5 shock blowers at
each of the 15 stagesto move the waste fuel
off-gas
from the kiln
Feedingscrews
Fuel
splitter
plastic
waste
air
waterFabric filter
filter dust
Fan Chlorine bypass
Precombustion chamber
Quenching chamber
Evaporation cooler
Fabric filter
Stack with
continuous
monitoring
raw material
filter dustFan
Mill
Calciner
Clinker cooler
Rising
duct
dryer
Cyclone
stage 1
Separation
cyclones
Clinker cooling air duct260°C
1200°C
400°C
180°C
900°C
530°C
140°C
140°C
Feeding
point for
WDF
Feeding
point for
WDF
fly
ash

Chapter 3
State of the art of the co-incineration of waste-derived fuels and raw materials in clinker/cement plants
19
As a next step, to use lumpy materials difficult to burn and/or to improve the combustion efficiency, at some cement kilns, special combustion chambers with a tailor-made 3-channel burner were introduced (Figure 3.14) in order to optimise the burnout of the wastes and to minimize the emissions of carbon monoxide and organic compounds [Tokheim, 2005; Tokheim, 2006].
Figure 3.14: Dry kiln system with a specially designed precalciner and combustion chamber with a tailor-made burner prior to the precalciner, tertiary air duct and 5- or 6-stage cyclone preheater [according to Tokheim, 2005; Tokheim, 2006]
This development already implies that the incineration conditions of the secondary firing are much less rigorous than in the kiln itself (much lower temperature level, much lower retention time, possibility of stratification and incomplete combustion depending on the type and particle size distribution of fuels used). This can have a considerable impact on emissions to air. As this is very important to understand, the function and impact of precalciners will be explained in more detail in the precalciner Chapter 3.3.2. The typical temperature profile of the counter-current flow of gas and solids is illustrated in Figure 3.15 along with the retention times in the different stages of the process - from the dust removal filter to the clinker cooler.
Conditioning tower
Raw mill
Stack Bag filter
Meal dosing
Clinker
Air-to-air cooler
Bag filter
Stack
Kiln drive
5-stage suspensioncyclonepreheater
Grate cooler
Raw meal in
Raw materi.
in
Homogenisation silo
Raw
meal
silo
Filter dust
Rotary kiln
Fuel dosing
Combustion chamber with burner
Gas stream
Solids

Chapter 3
20 State of the art of the co-incineration of waste-derived fuels and raw materials in clinker/cement plants
Figure 3.15: Gas and solids temperature profile in a cyclone preheater system, [EC BREF CLM, 2010]
The latest development is the implementation of a circulating fluidized bed gasifier upstream of the precalciner [Stark/Wicht, 2000, p 47f]. This technique is operated with wastes having a sufficiently high calorific value at the cement works of CEMEX Ost in Rüdersdorf, Germany. This system is characterized by high efficiency. The new system consists of a fluidized bed chamber followed by the return (Figure 3.16). Through the nozzle floor of the gasification chamber permeable to gas, air is injected. The solid particles to be incinerated (coal dust, grate ash from combustion plants, waste-derived fuels) form a rotary swivel whilst a large percentage of unburned particles are separated in the cyclone and returned to the fluidized bed chamber. This cycle explains the name of the process. The circulating fluidized bed enables the possibility to recycle residues with high mineral contents, such as ashes and filter residues, but also residues with calorific value (waste-derived fuels), such as shredded tyres, waste wood, residues from waste separation plants which cannot be reused or cannot be biologically treated. The big advantage is that this recycling is free of residues. The gas resulting from the fluidized bed gasifier provides a percentage of the heat needed for decarbonation. The mineral components resulting from the process in the form of ash are used as additives for the raw meal preparation.

Chapter 3
State of the art of the co-incineration of waste-derived fuels and raw materials in clinker/cement plants
21
Figure 3.16: Scheme of the fluidized bed chamber with return cyclone (circulating fluidised bed) installed at the cement plant of CEMEX Ost in DE-Rüdersdorf [Stark/Wicht, 2000, p 48]
The above mentioned description of the development of the clinker production process revealed that the co-processing of waste-derived fuels, also called co-incineration, increased significantly over the past 30 years. It is important to make sure that the combustion of organic compounds in the fed waste is as complete as possible. In this respect, it is required to well understand important process details. For this purpose, the preheating of the raw meal, the precalcination and secondary firing, the compound and direct operating mode, the chlorine bypass as well as the kiln firing systems (main burners) are specifically explained in Chapter 3.3.
3.2.4 Inner and outer cycles of certain compounds
3.2.4.1 Introduction
The chemical composition of the clinker and the hot gases leaving the kilns as well as the complex chemical reactions in the kiln systems under the given physical conditions (temperature, inhomogeneous mixture of solids and gases/vapours etc.) are specifically determined by a number of main and minor elements present in the raw materials as well as in the fuels. These two groups represent more than 99 weight-% of the clinker. The residual percentage of less than 1 weight-% is represented by elements at very low concentrations, so-called trace elements whose concentration is lower than 100 ppm (Figure 3.17). Nevertheless, the volatile minor and trace elements can be relevant with respect to emissions to air. In Portland cement clinker, the main elements with more than 5 weight-% are Ca, Si and Al, and minor elements (100 ppm – 5 weight-%) are Fe, Mn, Mg, K, Na, Ti, P, Ba, Sr, Cl, S, and the trace elements (0.1 ppb – 100 ppm) are Cd, Sb, As, Co, Ni, Te, Zn, Pb, Cr, V, Tl, Hg [Sprung, 1988]. The content of the latter can be considerably increased when using secondary raw materials or waste-derived fuels.
Fluidised bed chamber Return cyclone
to the calciner
degassing air
ash being a raw
meal component
coal
dust
dry
ash
alternative
fuels

Chapter 3
22 State of the art of the co-incineration of waste-derived fuels and raw materials in clinker/cement plants
Figure 3.17: Concentration ranges of main, minor and trace elements in Portland cement clinker, [Sprung, 1988]
Concerning emissions to air of certain compounds as well as to specific operational problems, it is necessary to understand the basics on the formation of cycles within the kiln system. Therefore, in the following text, the cycles of relevant compounds are explained. A distinction will be made between the cycle of volatile minor elements (Na, K, S, and Cl) and trace elements (Pb, Cd, Tl, and Hg). Since the 1960s, detailed investigations revealed that the reactions of main, minor and trace elements can be determined by carefully performed mass balance analysis [Sprung, 1988]. A distinction is made between the outer and inner mass balance, which will be explained below. 3.2.4.2 Formation of cycles
In cement rotary kilns, the material flow is counter-current to the hot gas flow. The hot gases leave the kiln at temperatures between 1000 and 1100 °C and heat up the kiln feed (see Figure 3.39). In case there is a precalciner, depending on its type, the hot gases fully or partly pass it before reaching the preheater. Because of this counter-current flow, the mass stream of volatile compounds increases by repeated vaporization and condensation on the surface of the cooler kiln feed and the walls within the preheater, and by fresh material entering the system with raw materials and fuels. Thus, enrichment cycles of the compounds are established. These enrichments may result in preheater coatings and so-called rings in the kiln (see Figure 3.18).
10-12 10 310 010-310-610-9
Concentration in the clinker in g/kg
1 ppq 1 ppt 1 ppb 1 ppm 1 ‰ 1 weight-%
Main elements
Ca, Si, Al
Minor elements
Fe, Mn, Mg, K, Na, Ti, P, Ba, Sr, Cl, S
Trace elements
e.g. Cd, Sb, As, Co, Ni, Te, Zn, Pb, Cr, V, Tl, Hg
Microelements
Microelements
Nano elements

Chapter 3
State of the art of the co-incineration of waste-derived fuels and raw materials in clinker/cement plants
23
Figure 3.18: Location of preheater coatings and of rings in the kiln
As already indicated, in principle, there are two types of cycles: the inner and the outer cycles. The outer cycles refer to the mass streams of elements which leave the preheater and are returned to the kiln feed via the raw mill (if they are condensed there) or via the dusts removed in the de-dusting devices. The inner cycles are those that take place within the kiln, between the kiln and the preheater and within the preheater [Locher/Klein, 2011b]. The cycles of certain compounds (elements) can be quantified by determining mass balances. With regards to the outer cycle, the outer balance consists of the input of untreated raw materials forming the raw meal and the untreated fuels used (see Figure 3.19). The output comprises the clinker including the clinker dust, the removed filter dusts and the sum of emissions to air (residual dust, vapour, gaseous) of the kiln, the raw mill, the cooler and, if present, of the bypass (see Table 3.1). The inner balance comprises the input of the ready-prepared raw meal and the fuels ready to be fed (see Figure 3.19). Thereby, the kiln meal already contains the compounds of the waste gas which were transferred to it in the raw mill as well as the removed and returned filter dusts. The output of the inner balance comprises the clinker, the clinker dust, the emissions of the clinker cooler and, if present, the dust and emissions to air of the bypass. In case of non-volatile elements, such as calcium which is often reported as the lead parameter when carrying out balances, the total inner balance is only slightly higher than the outer one. The difference in practice reflects the calcium quantity present in the raw gas dust [Sprung, 1988]. The same is true for most of the heavy metals.
Ring in the calcining zone of the rotary kiln
Coatings in the preheater system
Main
burner

Chapter 3
24 State of the art of the co-incineration of waste-derived fuels and raw materials in clinker/cement plants
Figure 3.19: Borderlines and input/output mass streams of the inner and outer material balance of a cement
kiln system
Table 3.1: Borderlines of the inner and outer material balance of the clinker burning process, [Sprung, 1988]
Outer mass balance Inner mass balance
Input Raw materials (untreated) Fuels (untreated)
Kiln meal Fuels (ready to be fed)
Output Clinker Clinker dust Removed dusts (bypass dust and filter dust from waste gas treatment) Emissions (dust, gaseous, vapour) of the kiln, raw mill, cooler and bypass
Clinker Clinker dust Raw gas (dust and gas/vapour phase) Removed dusts (bypass dust) Emissions of the clinker cooler
The inner and outer balance is often illustrated by means of Sankey diagrams (see Figure 3.20). Mass balances of volatile elements have to be cross-checked with the mass balance of a non-volatile element. As already indicated above, calcium is often used for this purpose. Whenever the input and output of this lead element differs by more than 2 %, there may have been a mistake and the mass balance should be repeated [Sprung, 1985; Kirchartz, 1994, p 53].
Raw
materials
.
Outer mass balance Inner mass balance
Raw materials
Pre-treatment
Removed
Filter dust
Raw meal in
Tertiary air duct
Raw waste gasl
Meal dosing
5-stage suspension cyclone preheater Bag
filter Stack
Gas stream
Solids Calciner
Fuel-in
Raw material
in
Bypass gas treatment
Raw
meal
silo Homoge- nisation silo
Raw mill
Emissions from bypass
Bypass dust
Fuel for secondary firing
Raw fuels
Raw fuels
pre-treatment
Fuel for main burner
Clinker and clinker dust
Clinker
Main burner
Rotary kiln
Kiln drive
Grate cooler
Air-to-air cooler
Stack
Clinker cooler waste gas
Kiln and raw mill waste
gas
Filter dust
Raw meal
Condi- tioning tower
Kiln inlet

Chapter 3
State of the art of the co-incineration of waste-derived fuels and raw materials in clinker/cement plants
25
Figure 3.20: Scheme of the balance for a certain compound (element) of a rotary kiln with cyclone preheater and raw mill, [Locher, 2000, p 134]
As already indicated, the knowledge of these cycles is essential to achieve stable operating conditions but is also needed for a better understanding of emissions to air as required to minimise them. The inner and outer cycles of volatile compounds can be influenced by controlled removal by means of a bypass, especially for chlorides (see Chapter 3.3.4) or by discarding all or part of the dust from the waste gas abatement system [Locher, 2000, p. 131]. The increasing use of waste-derived fuels can have a significant influence on the cycles [Locher/Klein, 2011; Enders/Haeseli, 2010], both on volatile minor elements (Na, K, S, and Cl) and trace elements (mainly heavy metals). The formation of the cycles mainly depends on the chemical-physical properties of the compounds concerned, i.e. their volatility, and the conditions and chemistry in the kiln system. 3.2.4.2.1 Cycles of volatile minor elements (Na, K, S, Cl)
In terms of coatings and formation of rings in the kiln and in the preheater, the volatile minor elements are relevant. In this respect, the absolute quantities as well as the ratios of sulphur to alkali and sulphur to chlorine are of importance. Because of different compounds and conditions, the chemistry is relatively complex. The formation of cycles is not a new observation. However, the increasing use of waste-derived fuels requires an improved understanding and the development of models to better predict the impact of changing inputs [Locher/Klein, 2010a]. Circulating compounds have a strong affinity to each other. It has been noticed that chlorine first combines with alkalis to form potassium chloride (KCl) and sodium chloride (NaCl). The residual chlorine, if any, combines with calcium to form calcium chloride (CaCl2). Then, the residual alkalis react with sulphur to form potassium sulphate (K2SO4) and sodium sulphate (Na2SO4); the double salts are also formed (Na2K2(SO4)2 and K3Na(SO4)2). Finally, residual sulphur (SO3 or SO2) combines with free lime (CaO), to form calcium sulphate (CaSO4). The volatility is defined as φ = 1 – (cclinker/chot meal). Typical values are compiled in Table 3.2.
Raw gas
Clinker (and clinker
cooler waste gas)
Kiln feed
Fuels
Raw meal
(dry)
Raw mill
Raw materials
Conditioning
tower and
dust filter
Filter dust
Kiln and preheater
Kiln andpreheater cycle)
Waste gas
Outer mass
balance
(hatched)
Inner mass
balance (cross
hatched)

Chapter 3
26 State of the art of the co-incineration of waste-derived fuels and raw materials in clinker/cement plants
Table 3.2: Typical example for volatility values of sulphur, potassium, sodium, and chlorine (values for hot meal and clinker in weight-%), [Waltisberg, 2012]
chot meal cclinker Volatility φ
SO3 1.56 0.60 0.62
K2O 2.55 0.85 0.67
Na2O 0.23 0.22 0.04
Cl 1.83 0.02 0.99
In the following, the most important aspect concerning the cycles of volatile minor elements are described.
a) Volatility of chlorides Solid alkali chlorides, mainly NaCl and KCl, are easily volatilised in response to increasing temperatures. Because of their high vapour pressure (see Figure 3.21), alkali chlorides start to evaporate in the kiln at temperatures above 900°C, and their evaporation is complete at a temperature of 1200°C. Thus, alkali chlorides are fully evaporised already before the sintering zone of the kiln [Enders/Haeseli, 2010]. As a consequence, on the one hand, the chloride concentration in the clinker is very low (< 0.1 mass-%) [Locher, 2000, p 137; Enders/Haeseli, 2010]. On the other hand, they significantly enrich in the kiln inlet. The typical enrichment factor is about 100 (see
Table 3.3 where an example is given). Thus, alkali chlorides as such can contribute to a sustainable cycle. Any new material will contribute to the cycle [Enders/Haeseli, 2010].
Figure 3.21: Vapour pressure curves of the alkali chlorides and sulphates as a function of temperature [Locher, 2000, p 138]
It is known that the energy required in the kiln for the vaporization of alkali chlorides is again released in the lower part of the preheater during condensation. This results in significant effects on the local energy balances [Chatterjee, 2011].
b) Volatility of alkalis Silicate minerals are the main source of alkalis in clinker production [Enders/Haeseli, 2010]. At high temperatures, alkalis are retained in the melt and only a small fraction of alkalis transfer to the gaseous

Chapter 3
State of the art of the co-incineration of waste-derived fuels and raw materials in clinker/cement plants
27
state. Alkalis can only be vaporized if reaction partners are present in the gas phase (flue gas). Chlorine and hydroxyl anions serve as reaction partners to form volatile species, such as alkali chlorides or alkali hydroxides. Sulphur dioxide does not mobilize alkalis in anhydrous systems [Enders/Haeseli, 2010].
c) Volatility of sulphur Alkali sulphate minerals are known as minor constituents in Portland cement clinker. Compared to alkali chlorides, alkali sulphates (mainly Na2SO4 and K2SO4) have a lower volatility (see Figure 3.21). So, the major fraction of alkali sulphate (80-95 %) passes the sintering zone without decomposition [Enders/Haeseli, 2010]. In case of alkali surplus and fully oxidizing conditions, all sulphur in the clinker is alkali sulphate [Locher, 2000, p 138]. The portion of alkali sulphates not incorporated into clinker can be volatilized by dissociation or direct volatilization [Enders/Haeseli, 2010]. In contrast to the alkali chloride system, alkali sulphates require moisture from the atmosphere for dissociation to gaseous alkali hydroxides and sulphur dioxide. The moisture is provided from the combustion air or from the combustion products, e.g. oxidized hydrocarbons. Increasing moisture or low oxygen concentration (reducing atmosphere) will shift the equilibrium to gaseous alkali hydroxide. The dominating sulphur oxide species in the given temperature range will always be sulphur dioxide [Enders/Haeseli, 2010]. Calcium sulphate (CaSO4) is formed as a result of the reaction between sulphur dioxide (SO2) and calcium oxide (CaO) (CaO + SO2 + ½ O2 ↔ CaSO4). It is partly present in the raw materials or is preferentially formed in the temperature range of 800 to 900 °C (see Figure 3.22).
Figure 3.22: Formation and decomposition of calcium sulphate (CaSO4) as function of temperature in rotary cement kilns
At high temperatures in the kiln, calcium sulphate starts to melt and decomposes above temperatures of 1200 °C (see Figure 3.22). Full decomposition to calcium oxide and sulphur dioxide is reached at 1550°C [Enders/Haeseli, 2010]. CaSO4 is rarely found as a phase in clinker (e.g. when petcoke is used as a fuel). This indicates that CaSO4 decomposition is usually complete. Due to low volatility and its homogenous distribution as one of the decomposition products, free lime (CaO) is carried from the kiln with the clinker [Enders/Haeseli, 2010]. The decomposition of CaSO4 supplies sulphur dioxide to the kiln atmosphere; no other cations are vaporized. As seen from the chemical equation above, an oxidizing atmosphere is important to stabilise CaSO4 at increased temperatures. Oxidising conditions will shift the equilibrium right towards solids [Enders/Haeseli, 2010; Locher, 2000, p 141; VDZ-SO2, 2002]. Reducing conditions in the kiln inlet should be avoided in order to enable reaction of SO2 with CaO present in the kiln meal. Due to coarse waste-derived fuels, such as shredded tyres, reducing conditions locally can occur but can be managed as long as there is an overall surplus of oxygen [VDZ-SO2, 2002].
600 800 1000
Reaction Temperature [°C]
SO
2A
bs
orp
tio
n
2323 COCaSOSOCaCO
423
32
CaSOO21CaSO
CaSOSOCaO
Decomposition of
CaSO4
600 800 1000
Reaction Temperature [°C]
SO
2A
bs
orp
tio
n
2323 COCaSOSOCaCO
423
32
CaSOO21CaSO
CaSOSOCaO
Decomposition of
CaSO4

Chapter 3
28 State of the art of the co-incineration of waste-derived fuels and raw materials in clinker/cement plants
In SO2-rich gases, e.g. in case of using petcoke fuel, alkali sulphates can be stabilised by increasing the partial pressure of SO2 in the flue gas. This effect is also used in kiln operation when CaSO4 is added to remove alkalis in the form of alkali sulphate from the kiln with clinker (sulphatisation) [Locher, 2000]. As explained above, the volatility of alkali sulphates is low whereas those of CaSO4 is higher. Therefore, the most important criterion for the total sulphur volatility is the molar ratio of alkalis and sulphur corrected by chlorine (see Figure 3.23) owing its high affinity (see above).
Figure 3.23: Calculation of the molar ratio of sulphur and alkalis corrected by chlorine
The desired value for the ratio is 1.2 (range: 0.8 – 1.2). Where there are sufficient alkalis available to combine with total sulphur input (from raw materials as well as from fuels), the total volatility φ of the sulphur is 0.3 – 0.5. As already indicated above, if there is a surplus of sulphur over alkalis, highly volatile CaSO4 is formed. Its volatility is approximately 0.9 but can be up to 1 depending on the operating conditions of the burning process, especially the maximum temperature in the sintering zone and the retention time of the kiln feed at high sintering zone temperature. The maximum temperature in the sintering zone is critical for the volatilization and is in the order of the burning temperature. Consequently, difficult to burn raw material mixes or overheating of the kiln feed (low free lime content in the clinker) have a very significant bearing on sulphur volatilization. Regarding the retention time, it has to be noted that volatilization of sulphur compounds is a dynamic process. The longer the kiln feed is exposed to high burning temperature, the higher is the total amount of volatilized sulphur. Figure 3.24 shows a typical example for sulphur cycles of a kiln equipped with a suspension cyclone preheater and a precalciner which can be understood with reference to the above submitted explanations.
Figure 3.24: A typical sulphur cycle in a kiln system having a suspension cyclone preheater and a precalciner [VDZ-SO2, 2002; Chatterjee, 2011]
80
SO71
Cl
62
ONa
94
OK
SO
Alk
3
22
3

Chapter 3
State of the art of the co-incineration of waste-derived fuels and raw materials in clinker/cement plants
29
d) Coatings and ring formation Condensates on the surface of preheater walls and in the kiln can form sticky partial melts (see Figure 3.18) formed by volatile compounds and calcium oxide (free lime) of the kiln feed. Figure 3.25 shows important reactions taking place during condensation.
Figure 3.25: Condensates formed of volatile compounds of the gas atmosphere in a cement kiln and calcium oxide (free lime) of the kiln feed, [Enders/Haeseli, 2010]
The overview of the reactions highlights the role of sulphur dioxide as a driving component. Usually, in cement plants, cycles are managed by balancing alkalis in the inner and outer cycle or by empirical solutions limiting chlorine and sulphur concentrations below certain limits (Figure 3.26).
Figure 3.26: Empirical classification of kiln systems according to chlorine and sulphur content in the hot meal [Enders/Haeseli, 2010; Chatterjee, 2011; Binninger, 2009]
Both approaches depend on chemical analysis. For an improved understanding of the phase reactions of hot meal in hot meal atmospheres, additional quantitative and semi-quantitative mineralogical analysis are very helpful [Enders/Haeseli, 2010] as well as the application of advanced models [Locher/Klein, 2011a]. Rings and coatings store volatile species permanently or temporarily. Permanent ring formation reduces open space for the gas and material flow, so permanent rings need to be removed regularly [Enders/Haeseli, 2010; Locher, 2000].
4 CaO + 4 KOH(g) + 6 SO2 + 3 O2 2 K2Ca2(SO4)3 + 2 H2O
4 CaO + 4 KCl(g) + 6 SO2 + 3 O2 + 2 H2O 2 K2Ca2(SO4)3 + 2 HCl
2 Ca2SiO4 + CaSO4 Ca3(SiO4)2(SO4)
10 CaO + 3 SiO2 + 2 KOH(g) + 4 SO2 + 2 O2 Ca10(SiO4)3(SO4)3 (OH)2 + K2SO4
10 CaO + 3 SiO2 + 2 KCl(g) + 4 SO2 + 2 O2 Ca10(SiO4)3(SO4)3 (Cl)2 + K2SO4

Chapter 3
30 State of the art of the co-incineration of waste-derived fuels and raw materials in clinker/cement plants
e) Models for the cycles of volatile minor elements Table 3.3 shows an example for the enrichment of certain compounds in the kiln system as a consequence of the above described cycles. The compounds of the volatile minor elements Na, K, S, and Cl are highlighted in red. It is obvious that the enrichment factor for chlorine between the feed and the hot meal is by far the highest. This is expected with regard to the volatilization of alkali chlorides. Table 3.3: Example for the enrichment of the volatile minor elements Na, K, S, and Cl in a kiln system with
suspension cyclone preheater, [Waltisberg, 2012]
In order to develop better strategies, models have been developed to calculate alkalis, sulphur and chlorine cycles. An advanced model has been developed by the Research Institute of the Cement Industry in Düsseldorf/Germany, especially with respect to the high use of alternative (waste) fuels [Locher/Klein, 2011a and b]. The model describes the clinker burning process from the kiln meal feed to the discharge of the clinker from the cooler and consists of individual models for the different plant components, namely cyclone preheater, precalciner, bypass, rotary kiln, and grate cooler. They are mathematically linked with one another and make it possible to determine a steady-state condition for the entire kiln plant [Locher/Klein, 2011a]. The model has been applied to a rotary kiln with a 4-stage suspension cyclone preheater, a precalciner, and a bypass. The production capacity of the plant is 2400 t/d. The fuel energy is provided by pulverized coal and, up to a maximum of 60% of the thermal rating, by waste-derived fuels, namely animal meal and processed fractions of industrial and commercial wastes. The results determined by means of the model were compared with the detailed real on-site measurement [Locher/Klein, 2011a]. When carrying out the measurements, only 32 % of the thermal rating was provided by fractions of processed industrial and commercial wastes, fed to the precalciner. The results of the modelling and the measurements for all relevant points of the kiln system can be seen from Figure 3.27.
Kiln Feed Hot Meal Clinker
L.O.I 34,8 4,8 0,35
SiO2 20,9 20,5 21,0
Al2O3 4,7 4,2 4,9
Fe2O3 3,1 3,0 2,9
CaO 65,2 61,2 64,9
MgO 2,5 2,3 2,2
SO3 0,10 1,56 0,60
K2O 1,08 2,55 0,85
Na2O 0,09 0,08 0,08
TiO2 0,28 0,28 0,30
Mn2O3 0,06 0,06 0,04
P2O5 0,08 0,11 0,17
Cl 0,01 1,83 0,02
TOTAL 98,1 97,7 98,0
Detection limit approximately 0.005 [weight-%]
Legend: L.O.I. = loss on ignition
Analysis L.O.I. free [weight-%]

Chapter 3
State of the art of the co-incineration of waste-derived fuels and raw materials in clinker/cement plants
31
The model calculations for the circulating sulphur, alkali and chlorine systems are in full qualitative agreement and satisfactory quantitative agreement with the conditions measured in the plant. The chemical and physical relationships that in many cases have been known for decades have been successfully integrated into the model of the clinker burning process. Nevertheless, there are significant differences between the measurements and calculations at some points with regard to the sulphur balance and in the sulphur concentrations in the top cyclone stage and the bypass [Locher/Klein, 2011a].
Figure 3.27: Comparison of measured and calculated levels of circulating compounds of volatile minor elements in the kiln feed, hot meals, clinker and bypass dust [Locher/Klein, 2011a]
3.2.4.2.2 Cycles of trace elements (mainly heavy metals)
Concerning volatility, the trace elements can be classified into the four groups: non-volatile, low volatile, volatile and highly volatile. In the following, these four groups and their cycles will be explained in more detail.
Non-volatile compounds They are characterized by their almost complete incorporation into the clinker, with which they leave the kiln system. There are kiln feed cycles because of dust moving from one stage to the other, however without enrichment. These kiln feed cycles are quantified by the already mentioned lead parameter calcium (Ca) to control the mass balance and arsenic (As) (see Figure 3.28). As already pointed out above, the emission of these compounds occurs in form of dust or adsorbed to dust particles and is thus determined by the residual dust concentration (after abatement) and the content in the input materials. Non-volatile compounds are those containing the main elements Ca, Si, and Al and those of the following elements: Ag, As, Ba, Bi, Ce, Co, Cr, Cu, Ga, La, Mn, Mo, Nb, Nd, Ni, Sb, Sc, Se, Sm, Sn, Sr, Th, U, V, Y, W, Zn, Zr.
All data in mass-%
Left column:
values calculated
Right column:
values measured

Chapter 3
32 State of the art of the co-incineration of waste-derived fuels and raw materials in clinker/cement plants
Figure 3.28: Mass balances for two non-volatile compounds (Ca and As) of two rotary kilns with a 4-stage cyclone preheater (values for CaO in g/kg clinker, for As in mg/kg clinker) [Kirchartz, 1994, pp 56 and 62]
The Figure on the left is for a rotary kiln with a diameter of 4 m, a length of 68 m and a production capacity of 1040 t/d. The Figure on the right is for a rotary kiln with a diameter of 5.2 m, a length of 80 m and a production capacity of 3030 t/d.
Low-volatile compounds Between the kiln and the preheater, lead and cadmium can react with the surplus of chlorides or sulphates to form lead and cadmium chlorides and lead and cadmium sulphates respectively. Because of alternative fuel use, in many cement plants, the chlorine input has significantly increased and therefore, chlorine bypasses had to be installed (see Chapter 3.3.4). The increased chlorine input results in increased formation of alkali but also of lead and cadmium chlorides. As these compounds are classified as low-volatile, they evaporate in the kiln. Consequently, the incorporation of lead and cadmium into the clinker can drastically decrease (see Figure 3.29).
kiln
4 stage
cyclone
preheater
stack
raw mill
f ilter
emissions to air
Clinker
3th stage
Clinker
Raw gasKiln meal
Clinker
kiln
4 stage
cyclone
preheater
stack
raw millf ilter
emissions to air
Clinker
Kiln mealRaw gas
3th stage

Chapter 3
State of the art of the co-incineration of waste-derived fuels and raw materials in clinker/cement plants
33
Figure 3.29: Incorporation of the low-volatile trace elements lead and cadmium into the clinker as a function of the chlorine input to the kiln [Kirchartz, 1994, p 72]
As for the alkali compounds, the ratio of sulphur to chlorine also determines the incorporation of lead and cadmium into the clinker (see Figure 3.30). If there is a surplus of sulphur, the incorporation increases but it significantly decreases when the chlorine input dominates.
Figure 3.30: Incorporation of lead and cadmium into clinker as a function of the molar SO3-/Cl--ratio in the
cycle, [Kirchartz, 1994, p 74]
Cadmium
Lead
Rotary kilns with cyclone
preheater
Specific chloride mass stream in the hot meal
in g Cl-/kg clinker
Incorp
ora
tion
into
clin
ker
in
% o
fth
ekiln
/pre
heate
rcycle
Cadmium
Lead
Molar SO3-/Cl--ratio
Inco
rpo
ratio
no
fle
ad
an
dca
dm
ium
into
clin
ke
rin
% o
fth
ekiln
/pre
he
ate
rcycle

Chapter 3
34 State of the art of the co-incineration of waste-derived fuels and raw materials in clinker/cement plants
These findings also confirm that lead and cadmium sulphates are less volatile than the respective chlorides. Cadmium sulphate is more volatile compared to lead sulphate (Figure 3.31).
Figure 3.31: Percentage of lead and cadmium incorporated into clinker (related to the hot meal stream) as a function of the specific sulphur input to the kiln, [Kirchartz, 1994, p 75]
The lead and cadmium compounds condense in the lower cyclones at temperatures between 700 and 900 °C [Kirchartz, 1994, p 58]. Thus, they significantly enrich there and cycles are formed (see Figure 3.32).
Figure 3.32: Mass balances for the two low-volatile elements lead and cadmium of two rotary kilns with a 4-stage cyclone preheater (values in mg/kg clinker), [Kirchartz, 1994, pp 56 and 62]
The Figure on the left is for a rotary kiln with a diameter of 4 m, a length of 68 m and a production capacity of 1040 t/d. The Figure on the right is for a rotary kiln with a diameter of 5.2 m, a length of 80 m and a production capacity of 3030 t/d. The loss of lead and cadmium compounds with the raw gas is relatively low. A loss of 0.4 % of the quantity present in the inner cycle has been reported [Kirchartz, 1994, p 58]. In many plants, because
Cadmium
Lead
Incorp
ora
tion o
f le
ad a
nd c
adm
ium
into
clin
ker in
% o
f th
e k
iln/p
reheate
r cycle
SO3-content of the hot meal in weight-%
kiln
4 stage
cyclone
preheater
stack
raw mill
f ilter
emissions to air
Clinker
3th stage
Clinker
Raw gasKiln meal
4th stageClinker
Raw gasKiln meal
kiln
4 stage
cyclone
preheater
stack
raw millf ilter
emissions to air
Clinker

Chapter 3
State of the art of the co-incineration of waste-derived fuels and raw materials in clinker/cement plants
35
of the aforementioned increased chlorine input, the inner cycle of lead and cadmium chloride also increases. As a consequence, the concentration in the raw gas increases as well and thus the quantity leaving the preheater. A linear correlation has been found between the quantity of lead and cadmium leaving the preheater with the raw gas and the level of these elements in the inner cycle (see Figure 3.33).
Figure 3.33: Specific mass stream of low-volatile lead and volatile thallium in the raw gas as a function of the inner cycle level, [Kirchartz, 1994, p 76]
As shown, due to the cycles, lead and cadmium compounds (mainly as chlorides) are enriched in the hot meal. They form very fine particles and thus they are also enriched in the fine fraction (< 20 µm). Table 3.4 shows an example for lead. Table 3.4: Concentration of lead in raw meal and hot meal as well as in the coarser and fine fraction,
[Waltisberg, 2012]
This also has an impact on the ratio of the concentration of lead and cadmium, and the same for the volatile thallium, in the filter dust and the residual dust concentration after the filter. A range for this ratio of 1.5 – 5 was reported and an average ratio of 3 was determined [Kirchartz, 1994, p 78]. This ratio is for electrostatic precipitators. However, fabric filters achieving much lower residual dust contents are increasingly applied and thus, this effect of increased emissions of fine lead and cadmium particles may be somewhat mitigated.
Volatile compounds The relevant volatile compounds are thallium sulphate (Tl2SO4) and chloride (TlCl). They are more volatile than lead and cadmium compounds. Consequently, a very small percentage is incorporated into the clinker (see Figure 3.34). Thallium and its compounds condense in the upper part of the cyclone preheater at temperatures between 450 and 550 °C and cycles with high enrichment factors are formed (see Figure 3.35).
Thallium
Lead
Rotary kilns with cyclone
preheaters
Inner cycle of lead and thallium in mg/kg clinker
n = 97.5 %
n = 99.6 %
Ma
ss s
tre
am
of le
ad
an
d th
alli
um
in th
e
raw
ga
s in
mg
/kg
clin
ke
r
unscreened fraction < 90 µm fraction < 20 µm
Raw meal 19 22 42
Hot meal 81 78 231
Concentration in mg/kg

Chapter 3
36 State of the art of the co-incineration of waste-derived fuels and raw materials in clinker/cement plants
Figure 3.34: Mass balances for the volatile element thallium of two rotary kilns with a 4-stage cyclone preheater (values in mg/kg clinker), [Kirchartz, 1994, pp 57 and 63]
The Figure on the left is for a rotary kiln with a diameter of 4 m, a length of 68 m and a production capacity of 1040 t/d. The Figure on the right is for a rotary kiln with a diameter of 5.2 m, a length of 80 m and a production capacity of 3030 t/d. Despite high condensation temperatures of the thallium compounds, Kirchartz could not detect thallium compounds in the vapour phase in the raw gas (leaving the preheater) [Kirchartz, 1994, p 58]. The enrichment factor (ratio of cycled thallium mass in the preheater and the input with raw materials and fuels) depends on the removal efficiency of the preheater by condensation and adsorption. Kirchartz reports a maximum factor of 50 (see Figure 3.35) but indicated that higher factors are to be expected in kiln systems with 5 or 6 cyclone stages and lower temperatures of the raw gas (leaving the preheater). More detailed data are presented in Chapter 4.4.3.6.
Figure 3.35: Enrichment factor for thallium in the kiln/preheater as a function of the removal efficiency of the preheater, [Kirchartz, 1994, p 77]
kiln
4 stage
cyclone
preheater
stack
raw millf ilter
emissions to air
Clinker
1st/2nd stage
Clinker
Raw gasKiln meal
kiln
4 stage
cyclone
preheater
stack
raw millf ilter
emissions to air
Clinker
Kiln meal
Clinker
Raw gas
1st/2nd stage
Thallium removal efficiency of the cyclone preheater in %
Thalli
um
enrichm
ent fa
cto
r

Chapter 3
State of the art of the co-incineration of waste-derived fuels and raw materials in clinker/cement plants
37
As for lead, the quantity of thallium leaving the preheater is proportional to the extent of the inner cycle (see Figure 3.33). In addition, due to the thallium volatility, the percentage of thallium leaving the preheater is higher compared to lead and cadmium; 2.4 % has been reported [Kirchartz, 1994, p 58]. As already pointed out for lead and cadmium, thallium is mainly present in the fine fraction of the dust and its concentration is higher in the residual dust after the filter compared to the concentration in the removed dust (about factor 3 higher).
High-volatile compounds The most important highly volatile element is mercury and its compounds. In addition, ammonia emissions are of relevance where it is used for NOx reduction. Mercury and its compounds Consequently, the percentage of mercury incorporation into clinker is almost zero and it does not enrich within the preheater. Mercury and its compounds are practically completely volatilised and leave the preheater in the gaseous or vapour stage (see Figure 3.36) [Kirchartz, 1994, p 58; Eriksen et al., 2007]. This is true for elementary mercury as well as for its ionic compounds (mainly HgCl2). The chemistry of the different mercury species is explained in Chapter 4.4.3.5.3.
Figure 3.36: Mass balances for the highly volatile element mercury of two rotary kilns with a 4-stage cyclone preheater (values in mg/kg clinker), [Kirchartz, 1994, pp 57 and 63]
The Figure on the left is for rotary kiln with a diameter of 4 m, a length of 68 m and a production capacity of 1040 t/d and the Figure on the right is for rotary kiln with a diameter of 5.2 m, a length of 80 m and a production capacity of 3030 t/d.
After the preheater, in the conditioning tower and in the raw mill (see Figure 3.7 and Figure 3.9), the waste gas further cools down and mercury and its compounds mainly adsorb to the raw meal. The removal efficiency depends on the temperature and the available adsorption surface of particles [Kirchartz, 1994, p 78]. Where the raw gas passes the raw mill (so-called compound operating mode or just “mill on” – see Chapter 3.3.3), the available adsorption surface is orders of magnitude higher compared to the direct operating mode (or just called “mill off” – see Chapter 3.3.3) where the raw gas bypasses the raw mill and directly reaches the dust filter. The removed mercury is returned to the preheater with the raw meal and is volatilised again. So, an external cycle is established, i.e. more mercury enters the system with the raw materials and the fuels, than exits the stack. However, in case of direct operating mode, the gas, enriched in mercury, directly reaches the dust filter and a significant percentage of mercury trapped in the described cycle is released to the environment via the stack. Therefore, in case of direct operating mode, mercury emissions are much higher compared to the compound operating mode. The difference can be 16 to 18 times higher and in one case, a factor of 400 was found [Linero, 2011]. The extreme 400 to 1 ratio observed at a kiln in Florida/USA could be
kiln
4 stage
cyclone
preheater
stack
raw millf ilter
emissions to air
Clinker
stack
f ilter
Filter dust
Clinker
Raw gasKiln meal
Emissionemissions
to air
Raw mill on Raw mill off(Direct operation mode)(Compound operation mode)
kiln
4 stage
cyclone
preheater
stack
raw millf ilter
emissions to air
Clinker
Kiln meal
Clinker
Emission Emission
Raw gas Raw gas
Hg
Raw mill on Raw mill off(Direct operation mode)
(Compound operation mode)

Chapter 3
38 State of the art of the co-incineration of waste-derived fuels and raw materials in clinker/cement plants
caused in part by the high chloride concentration in native limestone which favours the formation of mercury dichloride which is, compared to elementary mercury, more easily adsorbed and thus removed in the raw mill [Linero, 2011]. It has to be stressed that such high factors can only occur if the removed filter dust is completely returned to the raw meal and no filter dust is discarded, so that mercury again enters the preheater to become re-volatilised. This is still the case in many plants in the USA and in Canada. There, practically all mercury is finally emitted to air. In Europe in contrast, the filter dust removed during direct operating mode, containing higher concentrations of mercury, is separated, and, in most cases, conveyed to the cement mill to be mixed (also with other additives) and ground with the clinker and other materials to produce cement. In 1994, systematic investigations on mercury emissions were carried out and published [Kirchartz, 1994]. It was reported that the mercury removal in the dust filter is mainly a function of temperature and the species (see Chapter 4.4.3.5). According to Figure 3.37, at a temperature of more than 200 °C, only 25% of the mercury can be removed, ca. 50 % at a maximum temperature of 170 °C and about 90 % at a maximum temperature of ca. 130 °C [Kirchartz, 1994, p 78-79]. As indicated, such high removal efficiencies are only achievable if the dust is almost quantitatively removed, filter dust is systematically discarded and the waste gas temperatures are below 130 °C.
Figure 3.37: Mercury removal as a function of the waste gas temperature for rotary kilns with cyclone preheater in the direct operating mode, [Kirchartz, 1994, p 79]
Nevertheless, during the direct operating mode, the mercury emissions are significantly higher [Schäfer/Hoenig, 2002]. Ammonia (NH3) Ammonia is mainly present in raw materials. The input of nitrogen compounds (largely as ammonia) is about 50 – 150 g per tonne raw material; there are extreme cases where the input is up to 250 g/t [Waltisberg, 1988]. In addition, ammonia is often used for NOx reduction and is added in excess.
Waste gas temperature in °C
Hg
re
mo
va
l eff
icie
ncy in
%
Rotarykilns with
cyclone preheaters(direct operation
mode)

Chapter 3
State of the art of the co-incineration of waste-derived fuels and raw materials in clinker/cement plants
39
The behaviour of ammonia is very similar to mercury. It completely leaves the preheater and is enriched in the raw mill during compound operating mode but released to the environment during direct operating mode. More detailed data are presented in Chapter 4.4.3.10.
3.2.5 Conclusions
In the past 40 years, the development of the clinker production process was strongly influenced by a steady increase in energy efficiency and a strong increase in the use of waste-derived fuels and raw materials which was and is mainly driven by economic considerations. For the understanding of the emissions to air of the different pollutants, it is required to understand the inner and outer cycles of the relevant compounds.

Chapter 3
40 State of the art of the co-incineration of waste-derived fuels and raw materials in clinker/cement plants
3.3 Important process details
The purpose of this chapter is to provide basic knowledge and information required to understand and to interpret the discussion of the emission data in chapter 3. So, for certain issues, detailed information is presented, e.g. concerning the preheating of raw meal, whereas other aspects are very briefly mentioned or not al all.
3.3.1 Preheating
3.3.1.1 General information
Today, the predominant preheating system is the cyclone preheater with 4 – 6 cyclones. As previously indicated, in Europe and Germany, this system is applied to more than 90 % of plants. Consequently, only this system is described here. Preheating comprises two steps: the drying of the meal in the raw mill by means of the waste gas from the cyclone preheater which still has a temperature of about 300 °C. The waste gas is further cooled down to 90 – 130 °C. The water content of the raw material is usually between 3 and 8 weight-%. In exceptional cases, the water content can be up to 15 weight-% but this maximum content can still be fully removed in the raw mill down to about 0.5 weight-%. The dried meal is fed to the riser duct between the upper two cyclone stages (before the last stage which consists of two cyclones to achieve high dust removal) (see Figure 3.7, Figure 3.9 and Figure 3.14). As in the rotary kiln, the gas flow is counter-current to the flow of solids. This is important to know; the waste gases from the rotary kiln pass through the preheater from the bottom to the top whereas the raw meal, dried in the raw mill, moves from the top down to the kiln (Figure 3.38). In the preheater, the different cyclones are arranged one above the other in a tower 50 – 120 m high.
Figure 3.38: Scheme of a rotary kiln with 5-stage cyclone heater and precalciner as well as the gas and solids temperatures in the preheater, [Zunzer, 2002, p 11]
The meal is fed to the rising pipe of the cyclone below and is suspended in the up-streaming gas. Most of the heat transfer already happens in the rising pipe. As the meal fed to the rising pipe is suspended, it flows with the gas to the cyclone. Over this short distance where the main heat transfer occurs, there is co-current flow of gas and solids. But then, in the upper cyclone, where the final heat transfer occurs, the particles are separated from the gas stream and are fed to the rising pipe of the cyclone below. So,

Chapter 3
State of the art of the co-incineration of waste-derived fuels and raw materials in clinker/cement plants
41
the flow of gas and solids between the different cyclone stages is counter-current [Zunzer, 2002; Locher, 2000; Stark/Wicht, 2000]. The retention time of the meal in a 5-stage cyclone preheater is about 50 seconds and for the gas about 20 seconds. This reflects a solids retention time in each stage of 7 – 9 seconds and about 16 seconds in the bottom cyclone and in the precalciner. In a 4-stage cyclone preheater, the up-streaming gas is cooled down from about 1100 °C to 360 ± 30 °C, while the counter-current flowing meal is heated from about 50 °C to about 850 °C. Depending on the moisture content of the raw meal, through the implementation of a fifth cyclone, the waste gas temperature is further reduced to about 325 ± 25 °C, and by a sixth cyclone to about 275 ± 15 °C [Zunzer, 2002, p 10]. With respect to emissions to air, during heating the raw meal, the release of organic compounds and carbon monoxide is of significant importance. Therefore, all related details are submitted in the following sub-chapter. Because of the counter-current flow of gas and solids as well as the intensive mixing due to suspension of the solid particles in the gas stream, condensation, evaporation, and adsorption effects take place. As a consequence, internal and external cycles build up which are described in more detail in Chapter 3.2.4.2 as these are very important to understand the emission of certain pollutants. Also, with respect to the waste gas, the raw mill acts as a big adsorber due to the mixing of solids and waste gas there. 3.3.1.2 Emission of organic compounds and carbon monoxide during preheating of the raw
meal
3.3.1.2.1 Origin of organic compounds in raw materials
Natural raw materials used for the production of cement, such as lime rock, marl, marl lime, clay, clay marl and quartz sand, always contain traces of organic compounds due to residues of animals and plants present in deposits. Figure 3.39 illustrates their formation process. Usually, at sufficient oxygen concentrations microorganisms metabolise proteins and carbohydrates to amino acids and saccharides and also mineralize part of them to carbon dioxide and water. Lignin and lipids are heavily biodegradable compounds and remain almost unchanged [Tissot/Welte, 1984].
Figure 3.39: Transformation of organic compounds during sedimentation and diagenesis
Polymerization or
polycondensation
Proteins
Polysaccharides
Lipids
Hydrocarbons
Amino acids
Polysaccharides
Kerogens
Huminic acids
Fulvic acids, humin
Geochemical
fossils
Recycling to the
biological cycle
Degradation by
microorganisms
Remain almost
unchanged
Energy source
CO2, H2O
Free hydrocarbons
and similar components
Mineralisation

Chapter 3
42 State of the art of the co-incineration of waste-derived fuels and raw materials in clinker/cement plants
In case of sediment sinking, the residues of plants and organisms which are not degraded by microorganisms can reach deeper rock beds. As a consequence, on the one hand the presence of oxygen ends and on the other hand the remaining organic compounds are exposed to higher temperatures and pressures. Under these conditions, due to polymerization and polycondensation reactions, they are transformed to humic compounds which, depending on their water solubility characteristics, are grouped into humic and fulvic acids and humins. As these compounds have low thermal resistance at higher temperatures, the humic compounds lose their hydrophilic functional hydroxy and carboxy groups leading to a lower O/C-ratio of these compounds. Thus, kerogens result as final products of this transformation process. In the earth’s crust kerogens are the most important organic compounds present. They are defined as fossil organic compounds with a molecular weight of more than 2000 g/mol. They are insoluble in organic solvents. Against this background, the traces of organic compounds in natural raw materials can be understood. Table 3.5 shows the measured total organic carbon (TOC) content of 15 kiln meals in Germany which can be considered to be representative for this country. The deposit and the composition of the meals are also given. The analysed meals had TOC contents between 700 and 4500 mg/kg dm. The same range was reported elsewhere [Locher, 2000, S. 165]. Table 3.5: Deposits, composition, TOC contents, CO2 contents as well as the quantities of released CO and
VOC (during preheating) of 15 German kiln meals -according to [Zunzer, 2002]
The TOC analysis of the main raw materials are shown in Table 3.6. It is evident that specifically marl can contain elevated contents of organic compounds.
Labeling of
the sampleDeposit
Raw material
composition
TOCwater
contentTOC
CO2-
contentVOC CO VOC/TOC CO/TOC
mg/kg mass-% mg/kg d.m. mass-% mg/kg d.m. mg/kg d.m. % %
Kiln meal AUpper
Cretaceous100% marl lime 1600 1.17 1620 36.1 6.7 551 0.41 14.6
Kiln meal B Jurassic80% lime rock, 20%
clay1000 1.63 1020 36.1 3.9 226 0.38 9.5
Kiln meal C Upper tertiary 100% marl lime 1200 2.08 1230 35.7 5.5 163 0.45 5.7
Kiln meal DLower-Middle
Triassic
90% lime rock, 5%
red sandstone, 4.5%
silica sand, 0.3%
iron ore
900 1.38 913 35.3 6.4 239 0.70 11.1
Kiln meal E Jurassicmixture of lime rock,
marl lime, clay marl
and clay2900 2.13 2960 33.3 31.0 923 1.1 13.4
Kiln meal FUpper
Cretaceous
82% marl lime, 18%
lime rock3000 1.80 3060 36.0 31.0 1846 1.0 25.9
Kiln meal G
(plant C)
Upper
Cretaceous
65% marl lime, 35%
lime rock1900 1.55 1930 36.0 17.0 820 0.88 18.2
Kiln meal H unknown
90% marl lime, 6%
silica sand, 4%
fly ash, 0.3%
residues from coal
washing
4300 1.54 4370 36.1 14.2 992 0.33 9.7
Kiln meal I
(plant E)
Upper
Cretaceous100% marl lime 1390 1.22 1410 35.7 6.0 464 0.43 14.1
Kiln meal JUpper
Cretaceous100% marl lime 1235 2.10 1260 35.7 14.4 697 1.1 23.7
Kiln meal K
(plant D)Upper tertiary
mixture of lime rock,
marl lime, clay marl
and clay4360 2.40 4470 34.1 75.0 1292 1.7 12.4
Kiln meal L
(plant F)
Upper
Cretaceous
78% marl, 20%
lime rock, 2% iron
ore1370 1.83 1400 34.7 13.4 855 1.0 26.2
Kiln meal M
(plant A)
Upper
Cretaceous
69% marl, 30%
lime rock, 1% iron
ore1870 1.65 1900 33.8 25.6 856 1.3 19.3
Kiln meal N
(plant B)
Upper
Cretaceous100% marl lime 1790 1.77 1820 35.2 35.6 655 2.0 15.4
Kiln meal OUpper Middle
Triassic
92% lime rock, 7%
clay marl, 1%
iron ore700 1.64 710 34.8 20.7 231 2.9 13.9
Analysis of the solid samplesExpulsion tests with a mixture of nitrogen and 3
vol.-% oxygen

Chapter 3
State of the art of the co-incineration of waste-derived fuels and raw materials in clinker/cement plants
43
Table 3.6: TOC contents (related to dry matter) of the main raw materials(3); for comparison, the range of TOC contents of the analysed meals (see Table 3.5 above) is mentioned again – [Zunzer, 2002]
Raw material TOC
in mg/kg dm
Lime rock 300 – 1400
Marl lime 1600 – 3600
Marl 5600 – 21000
Kiln meal 700 – 4500
In Table 3.5, the meal samples H and K have elevated TOC contents. The origin of meal H is unknown; thus, it is possible that it also contains waste-derived raw materials such as fly ash containing organic compounds that have a different behaviour compared to the natural organic compounds. The reason for the higher TOC content of meal K is its origin from a quarry where there are layers with a significantly higher content of organic materials. This is typical for natural materials, which always have some variations in their composition. Therefore, in a cement works, the raw materials are carefully mixed and homogenised prior to their feeding to the kiln in order to minimise composition variability and to maximise the stability of the clinker production process as stable as possible [Locher, 2000, p10]. 3.3.1.2.2 Method to determine the release of carbon monoxide and organic compounds from raw
materials
Basically, emissions of carbon monoxide and organic compounds result from three sources of the clinker burning process (according to [Locher, 2000, S. 165]):
Incomplete combustion in primary firing
Incomplete combustion in secondary firing (combustion of fuels, mainly waste-derived fuels, fed to the riser duct or to the calciner)
Thermal decomposition of organic compounds present in the natural raw materials during preheating (in cases where waste-derived raw materials are added to the natural ones; in this case, organic compounds can also be released from them).
In principal, incomplete combustion in primary and secondary firing can be influenced by process technology, specifically by adjusting optimal firing conditions, whereas the release of carbon monoxide and organic compounds from raw materials during preheating mainly depends on their chemical properties. Until the early eighties, the emission of organic compounds from cement plants was not yet discovered to be an issue. In 1984, at a Suisse cement plant with a cyclone preheater and without secondary firing, Waltisberg simultaneously measured the VOC concentration at the kiln inlet, after the preheater and at the stack after dust abatement. As he did not find VOC (below the detection limit of 1 mg C/Nm3) in the kiln inlet but at 29 mg C/Nm3 after the preheater as well as at the stack (both at direct and compound operating mode), he concluded that most probably, the measured VOC emissions originated from preheating the raw materials [Waltisberg, 2012]. To distinguish emissions of carbon monoxide and organic compounds due to incomplete combustion conditions from their release from preheating the raw materials, it is necessary to undertake a test. To develop such as test, Waltisberg developed initial ideas at the end of 1992 and carried out first trials with a glass funnel and a Bunsen burner from October to December 1993. At that time, they already detected benzene, methane, ethane and other organic compounds. The further development was crowned with success and was
(3) For the analysis of TOC, the CaCO3, present in the kiln meal at up to about 75 weight-% has to be completely
removed by acidic treatment. As the ratio of C in CaCO3 and in organic compounds is 9 to 0.07-0.45 and therefore very high, this decarbonation has to be carried out very carefully to avoid wrong measurements. It must be ensured that organic compounds are not destroyed or removed.

Chapter 3
44 State of the art of the co-incineration of waste-derived fuels and raw materials in clinker/cement plants
published in 1998 [Waltisberg, 1998]. In the meantime, other investigations carried out elsewhere confirmed that during heating of raw materials in an air stream to more than 600 °C, organic compounds are released [Shkolnik et al., 1996]. However, this research did not come up with findings on the chemical composition of the released organic compounds. Here, Waltisberg made a significant step forward. On the one hand, he developed a laboratory test which simulates the conditions of preheating raw materials prior to the cement kiln. This so-called expulsion test was optimised in several aspects until it was found that the test reproduced the real conditions in a preheater system with sufficient accuracy, i.e. that the raw material behaved similarly in the test and in the real production plant. On the other hand, he used mass spectroscopy to identify the individual organic compounds released. The same organic compounds found in the laboratory test were also detected during the on-site works measurements, and it was possible to show a mathematical relationship between the measured concentrations. This means that the organic emissions from a cement kiln can now be calculated with sufficient accuracy from the results of the expulsion test. Zunzer built on this experience and used a very similar test set-up (Figure 3.40). Waltisberg used a high frequency furnace and not a tube furnace, in which the gas stream passed the material and did not flow over it as in the set-up of Zunzer.
Figure 3.40: Set-up of the expulsion test for the determination of organic compounds released during heating-up of raw materials [Zunzer, 2002], the first set-up was similar [Waltisberg, 1998]
Legend:
It consists of a cylindrical quartz tube of 19 mm diameter enclosed by a tube furnace. The sample is introduced into the furnace with a scoop. The tube furnace is heated with a constant heating rate of 35 K/min from ambient air temperature to 1000 °C to simulate the non-isothermal conditions of a cyclone or grate preheater. The temperature of the tube furnace is measured by means of a thermocouple and is used as a control parameter to adjust the heating programme. During the test, the temperature of the sample surface is continuously measured by means of a temperature sensor. For the whole test period, the sample is overflowed with a gas stream which mainly contains nitrogen
Mass
spectrometer
1
2
3
4
5
8
6
7
9
Carrying gas
Gas mixer
Tube furnace and sample
Thermocouple with furnace control
Dust filter and heated gas pipe
Sample gas treatment (refrigerator and pump)
Analyzers
Data logger
Measuring computer

Chapter 3
State of the art of the co-incineration of waste-derived fuels and raw materials in clinker/cement plants
45
but also various contents of oxygen and carbon dioxide. The desired gas composition and the gas flow are adjusted by a gas mixer. The gas output of the furnace is analysed in continuously operated analysers arranged in parallel. For determining the organic compounds as a whole (the sum parameter concerned is called volatile organic compounds (VOC)), a flame ionization detector is used, and for the identification of specific organic compounds a mass spectrometer is used. In addition, the content of carbon monoxide and carbon dioxide is continuously determined with an infrared analyser. The registration of the sample temperature, the temperature in the tube furnace and the measurement signals of the analysers are carried out with a data logger. The results of Zunzers tests in 2002 will be first presented for the laboratory test followed by those for real cement plants. 3.3.1.2.3 Laboratory test
The laboratory tests were carried out with a gas mixture of nitrogen and oxygen as well as of nitrogen, oxygen and carbon dioxide. It was important to know the influence of oxygen. Increasing the oxygen concentration from 0 to 1 vol.% led to a significant reduction of released VOC and CO. According to Figure 3.41, the released CO quantity decreased from 2427 to 560 mg/kg meal and those for VOC from 580 to 85 mg C/kg meal.
Figure 3.41: Release of carbon monoxide and volatile organic compounds at different oxygen contents of the overflowing gas for a kiln meal sample (Plant J – see Table), [Zunzer, 2002, p 50]
However, a further increase of the oxygen content in the overflowing gas stream does not have a significant influence. So, an oxygen content of 0.5 vol. % is already high enough to provide a sufficient oxygen surplus. A further increase does not lead to a significant additional oxidation of VOC. To be on the safe side, the laboratory tests were carried out at oxygen levels of 3 vol. % in the overflowing gas stream. The degassing curves for kiln meal A and kiln meal K (see Table) are shown in Figure 3.42 and Figure 3.43.
Oxygen content in vol.-%
Ca
rbo
n m
on
ox
ide
co
nc
en
tra
tio
n i
n m
g C
/kg
Carbon monoxide
Volatile organic
compounds (VOC)
VO
C c
on
ce
ntr
ati
on
in
mg
C/k
g2427 mg C/kg

Chapter 3
46 State of the art of the co-incineration of waste-derived fuels and raw materials in clinker/cement plants
Figure 3.42: Degassing graphs of kiln raw meal A (gas composition: 3 vol. % oxygen and rest nitrogen), [Zunzer, 2002, p 46]
Figure 3.43: Degassing graphs of kiln raw meal K (gas composition: 3 vol. % oxygen and rest nitrogen), [Zunzer, 2002, p 46]
The release of volatile organic compounds already starts at 50 °C [Sadowsky et al., 1997]. Depending on the origin of the sample, the VOC formation curve shows several maxima (see the curve for kiln meal K), and normally the biggest maximum is within the temperature range of 350 – 400 °C. At temperatures above 400 °C, in the gas phase, an additional oxidation of volatile organic compounds to carbon monoxide may occur. In the presence of oxygen above temperatures of 500 °C, the residual coke-type compounds remaining in the raw material can also be oxidised. Up to 680 °C, carbon monoxide is formed which, under these thermodynamic conditions cannot be oxidised further to carbon dioxide [Sadowsky et al., 1997]. Significant formation of carbon dioxide starts above 700 °C and is mainly related to the decarbonisation reaction. The carbon dioxide quantity resulting from this decarbonisation is significantly higher than the one resulting from the oxidation of
Temperature in °C
CO
in
mg
CO
/kg
ra
w m
ea
l
Volatile organic
compounds (VOC)
Carbon dioxide
VO
C i
n m
g C
/kg
ra
w m
ea
l, C
O2
in w
eig
ht-
%l
Carbon monoxide
Temperature in °C
CO
in
mg
CO
/kg
ra
w m
ea
l
Volatile organic
compounds (VOC)
Carbon dioxide
VO
C in
mg
C/k
g r
aw
me
al, C
O2
in w
eig
ht-
%l
Carbon monoxide

Chapter 3
State of the art of the co-incineration of waste-derived fuels and raw materials in clinker/cement plants
47
organic compounds. In Table 3.5 showing the 15 analysed kiln meals, the quantities of released VOC and CO are given. The results indicate, that for 12 of the 15 meals, related to the total carbon content, less than 1.5% is released as VOC and for the remaining three meals the release percentage is less than 0.9%. At the same time, related to the total carbon content, percentage released as CO varies between 5 – 26%. The rest of the TOC content is almost completely oxidised to CO2. To simulate the formation of CO2 from decarbonisation, 30 vol. % of CO2 was added to the overflowing gas. The results did not differ significantly. This can be explained by the fact that the oxidation potential of oxygen is significantly higher than that for CO2. So, the Boudouard-Reaction, occurring in the presence of CO2 (CO2 + C 2CO), is of minor relevance. In Figure 3.44 and Figure 3.45, the released CO and VOC quantities for the different meals are summarised. There is a correlation between TOC and released VOC and CO respectively. However, there are exceptions, especially kiln meal H which shows different behaviour. The origin of this meal is unknown and therefore, it will be excluded and not discussed further. Kiln meal K has the highest TOC content of all analysed meals (see Table). However, the measured release of CO2 is not proportional whereas VOC is. In principal, the release of CO and VOC depend on the physical-chemical properties of the organic compounds present in the raw material. Obviously, concerning the kiln meal samples analysed, these properties do not considerably vary widely. But in reality there can be exceptions.
Figure 3.44: Release of carbon monoxide from TOC of the kiln raw meals at constant oxygen level (with and without CO2 in the overflowing gas), [Zunzer, 2002, p 49]
TOC in mg C/kg raw meal
CO
in
mg
CO
/kg
ra
w m
ea
l
CO: 3 vol.-% oxygen, rest nitrogen
CO: 3 vol.-% oxygen, 30 vol.-% carbon dioxide, rest nitrogen
raw meal H

Chapter 3
48 State of the art of the co-incineration of waste-derived fuels and raw materials in clinker/cement plants
Figure 3.45: Release of volatile organic compounds (VOC) from TOC of the kiln raw meals at constant oxygen level (with and without CO2 in the overflowing gas), [Zunzer, 2002, p 49]
From the environmental point of view, it is of high interest to break the VOC down to individual compounds. It was first Waltisberg who published the following compounds identified with mass spectroscopy [Waltisberg, 1998]:
Aliphatic compounds: methane (CH4), ethyne (C2H2), ethene (C2H4), ethane (C2H6), propyne (C3H4), propene (C3H6), propane (C3H8), butadiene (C4H6), butene (C4H8), butane (C4H10), total C5-compounds, total C6-compounds, ...
Aromatic compounds: benzene (C6H6), toluene (C7H8), styrene (C8H8), xylenes (C8H10), naphthalene (C10H8), acenaphthene (C12H10), phenanthrene (C14H10), anthracene (C14H10), …
Basic aromatic compounds: pyridine (C5H6N), benzonitrile (C7H5N),
Chlorinated benzenes: monochlorobenzene (C6H5Cl), dichlorobenzenes (C6H4Cl2),
Compounds containing sulphur: sulphur dioxide (SO2), hydrogen sulphide (H2S), methanethiol (CH4S), carbon oxysulphide (COS), …
Compounds containing nitrogen: ammonia (NH3), nitrogen monoxide (NO), …
Concerning VOC, he found that aliphatic compounds (methane, ethene and propene) dominate and that single aromatic compounds, especially benzene, are also released to a significant extent within the temperature range of 350 – 450 °C (Figure 3.46). It should be noted that not all of the above mentioned compounds can be released from natural raw materials. E.g. the chlorinated compounds and polycyclic aromatic hydrocarbons (PAH) (with more than three rings) have been detected in cases where industrial sludges have been used as waste-derived raw materials.
TOC in mg C/kg raw meal
VO
C i
n m
g C
/kg
ra
w m
ea
lVOC: 3 vol.-% oxygen, rest nitrogen
VOC: 3 vol.-% oxygen, 30 vol.-% carbon dioxide, rest nitrogen
raw meal H

Chapter 3
State of the art of the co-incineration of waste-derived fuels and raw materials in clinker/cement plants
49
Figure 3.46: Identified organic compounds released during heating of a kiln raw meal in the expulsion test, [Waltisberg, 2012]
These findings were also confirmed by Zunzer who found similar profiles (Figure 3.47).
Figure 3.47: Degassing graphs of kiln raw meal N for identified individual organic compounds at a composition of the overflowing gas of 3 vol. % oxygen and rest nitrogen, [Zunzer, 2002, p 55]
In Figure 3.48, the sum of identified aliphatic and aromatic hydrocarbons is compared with the VOC profile and content respectively. In this case, 79% of the concentration of VOC could be explained by the mentioned individual compounds in Figure 3.47.
0 100 200 300 400 500 600 700 800
Co
ncen
trati
on
Temperature [°C]
CH4
C2H2
C2H4
C6H6
Temperature in °C
mg
C/k
g r
aw
me
al
Total released quantity
in mg C/kg raw meal
Methane 10.7
Ethyne 5.3Ethene 4.0
Propene 1.8
Benzene 2.0Toluene 0.2

Chapter 3
50 State of the art of the co-incineration of waste-derived fuels and raw materials in clinker/cement plants
Figure 3.48: Degassing graphs of kiln raw meal N, comparison of VOC with the sum of identified individual organic compounds at a composition of the overflowing gas of 3 vol. % oxygen and rest nitrogen, [Zunzer, 2002, p 55]
3.3.1.2.4 Measurements at real cement plants
The intention of the measurements at real cement plants was to check the transferability of the results from the laboratory tests. Waltisberg succeeded in finding a correlation coefficient between the expulsion test results and 4-stage cyclone preheater kilns and indicated that such a correlation coefficient is specific for the different kiln types [Waltisberg, 2012]. For instance, the coefficient is different for 4-stage and 5-stage cyclone preheater kilns. Zunzer also compared the laboratory results with those from real plants. For this purpose, detailed mass balance studies were carried out at four cement plants with 4-stage cyclone preheaters. Two cement plants with grate preheaters were also examined, but in Germany there are only very few cement plants with grate preheaters left, and thus the results concerned are not considered here. The accurate development of mass balances required the determination of mass streams by helium tracer measurements [Zunzer, 2002, p 57] as well as the regular sampling of solids (kiln raw meal, hot meals from different preheater stages, raw gas dust). The TOC balance included the input and output mass streams as indicated in Figure 3.49.
Temperature in °C
mg
C/k
g r
aw
me
al
Total released quantity
in mg C/kg raw meal
VOC 35.6
Sum single compo. 24.0

Chapter 3
State of the art of the co-incineration of waste-derived fuels and raw materials in clinker/cement plants
51
Figure 3.49: Scope for the carbon balance of a 4-stage cyclone preheater, [Zunzer, 2002, p 67]
The carbon input comprises of the following parameters: ṁC (kiln meal): carbon mass stream from kiln meal TOC
ṁC (CO, kiln inlet gas): carbon mass stream from CO of the kiln inlet gas
ṁC (∑C, kiln inlet gas): carbon mass stream as sum of carbon on the kiln inlet gas
The carbon output comprises of the following parameters: ṁC (raw gas dust): carbon mass stream from raw gas dust
ṁC (hot meal): carbon mass stream from TOC in the hot meal of the lowest cyclone
stage
ṁC (CO, raw gas): carbon mass stream from CO of the raw gas after preheater
ṁC (∑C, raw gas): carbon mass stream as sum of carbon in the kiln gas after preheater
The following simplifications and restrictions were made and applied respectively:
In the case of rotary kilns with secondary firing, for the mass balance study, the gas
composition of the kiln inlet gas is not considered but the composition of the riser duct of the
lowest cyclone stage
For the determination of the total carbon concentration of the gas of the kiln inlet or in the
riser duct of the kiln inlet, a sufficiently accurate measurement technique is not available to
date. Thus, the parameter was neglected.
The TOC content of the hot meal of the lowest cyclone stage is neglected as it can be expected
that, at that temperature level, TOC is fully converted to CO2.
Considering these simplifications and restrictions respectively, the following equations have been used
to calculate the release of CO and VOC from raw materials. It is given in per cent in relation to the TOC
input with the kiln meal, after subtraction of the losses with the dust.
Scope of carbon balance
ṁC (CO, kiln inlet gas)
ṁC (∑C, kiln inlet gas)
ṁC (hot meal)
ṁC (kiln meal)
ṁC (raw gas dust)
ṁC (CO, raw gas)
ṁC (∑C, raw gas)

Chapter 3
52 State of the art of the co-incineration of waste-derived fuels and raw materials in clinker/cement plants
In Table 3.7, the four examined cement kilns are briefly characterised. The types of fuels used are also indicated. Only Plant D is equipped with a calciner. In the plants A, B and C, all the fuel is fed via the main burner. As fuels, coal dust is used and in two trials also waste-derived fuels. In Plant D equipped with the calciner, no waste-derived fuels are applied for secondary firing but hard coal dust is injected. So, waste-derived fuels are not fed via secondary firing or the calciner in any of the plants. Table 3.7: Compilation of the characteristics of the four examined rotary kilns with 4-stage cyclone
preheaters and the results of CO and VOC measurements, according to [Zunzer, 2002]
Since the tests were undertaken, the situation has changed considerably with respect to the use of waste-derived fuels. Today, most of the German cement plants incinerate waste-derived fuels via secondary firing whereas only about one third are equipped with a precalciner (see 3.3.2.1). As no waste has been incinerated in the tests presented here, they only show the contribution of raw materials to CO and VOC emissions. In all four plants, it could be demonstrated that organic compounds and CO are released during the preheating of the kiln meal, especially in the temperature range between 400 and 650 °C. However, there are significant differences. The CO content in the kiln inlet gas of Plant A was very low (< 10 g CO/t kiln meal due to high oxygen surplus) and low for Plant B (75 g CO/t kiln meal at an oxygen surplus of λ = 1.1 and 28 g CO/t at λ = 1.2). In contrast, the CO content in the inlet gas of Plant D was much higher (839 g CO/t kiln meal at 2 vol. % oxygen and 209 g CO/t at 3.9 vol. % oxygen). The secondary firing of Plant D contributes to the increase of CO to a small extent. Thus, the hard coal dust could be completely combusted there. As an example, Figure 3.50 shows the oxygen and CO profile of a preheater at two different oxygen levels (normal and elevated oxygen level). The profile at different oxygen levels is similar, albeit at slightly different levels.
Rotary
kilnTest
Operation
condition
Kiln size
in m
Plant
characterisation
Clinker
productionType of fuel
Percentage
of second.
Fuel
%
CO in raw
gas in
g CO/t kiln
meal
CO in raw
gas in
mg/Nm3 *1
VOC in raw
gas in
g C/t kiln
meal
VOC in raw
gas in
mg C/Nm3 *2
1 normal O2 1270 0 541 367 20.4 13.8
2 elevated O2 1180 0 591 401 22.2 15.1
3 normal O2 980 hard coal dust 0 512 347 32.0 21.7
4 elevated O2 870 hard coal dust 0 474 322 29.5 20.0
5 normal O2 2600lignite coal dust,
hard coal dust0 766 520
6 elevated O2 2940 alternative fuel 0 563 382
7
normal O2/
no sec. firing2270 hard coal dust 0 2144 1454
8
elevated O2/
with sec. firing2250 hard coal dust 0 1305 885
9
normal O2/
no sec. firing2250 hard coal dust 8 1859 1261 250.2 169.7
10elevated O2/
with sec. firing2250 hard coal dust 8 1734 1176 229.4 155.6
*1 calculated from g CO/t kiln meal with a clinker factor of 1.56 and a specific waste gas flow of 2.30 Nm3/kg clinker
*2 calculated from g C/t kiln meal with a clinker factor of 1.56 and a specific waste gas flow of 2.30 Nm3/kg clinker
4-stage, 2-string
cyclone preheater
4-stage cyclone
preheater
4-stage, 2-string
cyclone preheater,
with chlorine bypass
4-stage, 2-string
cyclone preheater,
with calciner
hard coal dust,
alternative fuelA
B
C
D 4.8 x 70
3.8 x 56
4.0 x 56
5.3 x 56
Percentage of TOC converted to CO (in %) = × 100 ṁC (kiln meal) - ṁC (raw gas dust)
ṁC (CO, raw gas) - ṁC (CO, kiln inlet gas)
Percentage of TOC converted to VOC (in %) = × 100 ṁC (kiln meal) - ṁC (raw gas dust)
ṁC (Σ C, raw gas)

Chapter 3
State of the art of the co-incineration of waste-derived fuels and raw materials in clinker/cement plants
53
Figure 3.50: Example for the profile of the CO and O2 content of the gas phase within the preheater of a rotary kiln (Plant D – see Table) for two different oxygen levels, [Zunzer, 2002, p 75]
The results for the measured CO and VOC values are also compiled in Table 3.7 above. Zunzer only documented emission factors related to the kiln (e.g. x g CO/t kiln meal). With a typical clinker factor of 1.56 kg kiln meal/kg clinker (Waltisberg, 2012) and a specific waste gas flow for 4-stage cyclone preheater kilns of 2.30 Nm3/kg clinker (Locher, 2000), emission concentrations can be calculated as follows:
The calculated CO and VOC emission concentrations are also contained in Table 3.7 above. At normal oxygen levels, CO concentrations for the Plants A, B and C are in the range of 320 – 520 mg CO/Nm3 and at elevated oxygen level in the range of 320 – 400 mg CO/Nm3, i.e. about 10 – 20% lower. For the Plants A and B, the VOC concentrations are in the range of 14 – 22 mg C/Nm3 at normal oxygen level and 15 – 20 mg/Nm3 at elevated oxygen level. So, there is no significant difference. The VOC values of Plant C are not available but from the CO values it can be expected that the concentration for this plant is below 25 mg C/Nm3. There is a clear correlation between the laboratory and plant measurements. However, there is a significant deviation for Plant D. This plant represents an extreme case as the TOC content of the kiln meal is the highest found (see Table 3.7 above). In the laboratory, a kiln meal-related VOC emission factor of 75 g C/kg was determined but in the plant, the level was about three times higher. The different oxygen levels were not the reason for it as additional tests revealed [Zunzer, 2002, p 78]. In
oxygen content in vol.-%
normal O2-content
after preheater
after cyclone 2
after cyclone 3
after cyclone 4
Kiln inlet
elevated O2-content
specific mass stream
in g CO/kg raw meal
(emission factor related to kiln meal in g/kg) x (clinker factor in kg raw meal/kg clinker)
spec. waste gas flow in Nm3/kg clinkerEmission concentration in mg/Nm3 =
(emission factor related to kiln meal in g/kg) x 1.56 kg/kg)
2.30 Nm3/kg (for 4-stage cyclone preheater kilns)Emission concentration in mg/Nm3 =

Chapter 3
54 State of the art of the co-incineration of waste-derived fuels and raw materials in clinker/cement plants
the laboratory test, the determined VOC release from Plant D was in line with the other meals but the CO release was not (see Figure 3.44 and Figure 3.45 above). Apart from this extreme case, the expulsion test is a very reliable method to determine the release of CO and VOC from raw materials. Waltisberg’s detailed research on the correlation between test and real plant measurements fully confirms this conclusion. Figure 3.51 shows the results of the performed correlation. The values were grouped into two classes.
Figure 3.51: Correlation of results on VOC release from the expulsion test and real plant measurements, [Waltisberg, 2012]
Class#1 values are derived from own measurements with validated measurement equipment for the parameters concerned (VOC, CO, moisture content, O2, etc.) and one sample during the measurement (composite sample of a period of four to eight hours) was taken. Class#2 values represent measurement results from certified third-party measurement institutes or measurement results of continuous monitoring devices and for one sample taken during the measurements (in most cases, not a composite but a spot sample was taken). Against this background the class#1 values are more reliable but the class#2 values show a sufficiently accurate correlation. The release of CO and VOC accompanies the decrease of the TOC content of the meal during its preheating. Figure 3.52 visualises an example for a plant indicating that the TOC content decreases during preheating and is close to zero when the meal has passed the preheater (after cyclone 4).
0
10
20
30
40
50
60
70
80
0 10 20 30 40 50 60 70 80
Measu
red
Em
issio
n [
mg
C/N
m3]
Determined by means of the Expulsion Test [mg C/Nm3]
Value Class #1
Value Class #2

Chapter 3
State of the art of the co-incineration of waste-derived fuels and raw materials in clinker/cement plants
55
Figure 3.52: Example for the TOC content of the kiln raw meal, the raw gas dust and the kiln meal at various stages of a preheater (Plant B – see Table), [Zunzer, 2002, p 73]
It can be seen that the decrease mainly happens between cyclone 1 and cyclone 3 at the temperature range of 400 – 700 °C. There are differences for normal and elevated oxygen levels but the influence of this parameter is not significant. 3.3.1.2.5 Applicability of the expulsion test for single natural raw material components and for
waste-derived raw materials
The application of the expulsion test for kiln raw meals has been described above. However, it can also be used for single natural raw material components such as marl, lime rock, shale, clay and others. This shall be demonstrated by means of an example. In a cement plant, the VOC emission was within a range of between 25 and 35 mg C/Nm3 but, from time to time, benzene peaks of more than 5 mg/Nm3 were observed. Usually, the benzene emissions were between 2 and 3 mg/Nm3. To identify the reason, the raw materials were analysed (the annual average mix was usually 70 % lime rock, 15 % “upper” marl and 15% “lower” marl). The separate analysis of these three components in the expulsion test showed following benzene releases (Table 3.8). Table 3.8: Benzene quantity released from three different raw material components in the expulsion test,
[Waltisberg, 2012]
Raw material component Quantity of released benzene in mg/kg
Lime rock < 0.5
“Upper” marl 2.5
“Lower” marl 12.0
The results indicate that the “lower” marl contributed most to the detected benzene emissions. Additional investigations revealed that this component also contained elevated contents of pyrite-bearing sulphur resulting in higher SO2 emissions. As a consequence, this component was not used anymore and the benzene emission decreased to a level of 0.8 – 1.5 mg/Nm3.
Temperature in °C
Co
nte
nt o
fto
tal o
rga
nic
ca
rbo
nin
we
igh
t-%
raw meal
normal O2-content
elevated O2-content
raw gas dust
meal after
cyclone 1
meal after
cyclone 2 meal after
cyclone 3
meal after
cyclone 4

Chapter 3
56 State of the art of the co-incineration of waste-derived fuels and raw materials in clinker/cement plants
Cement works also use non-natural raw materials called waste-derived raw materials (see 4.3.1.2). In the following section, two examples are presented. The first example concerns the use of small quantities of a sludge containing organic compounds which was added to the natural raw materials of a cement works with a wet kiln. The percentage was about 2-3 weight-%, related to dry matter, of the raw kiln meal. As VOC emissions at the stack were unusually high (50 – 250 mg C/Nm3), the origin had to be identified. For this purpose, the natural raw materials and the waste-derived raw materials were investigated in the expulsion test. The results are compiled in Table 3.9. Table 3.9: Natural and waste-derived raw material components of a cement works and the benzene
quantities released; determined with the expulsion test, [Waltisberg, 1988]
The main benzene contributors are the chalkstone and the sludge. As the chalkstone could not be substituted, the efforts to reduce the benzene emissions concentrated on the externally provided sludge. Additional, special investigations by means of the expulsion test also showed that significant quantities of polycyclic organic hydrocarbons were also released from the sludge. Thus, the quantities of the sludge were reduced and finally, its input was completely stopped. This also leads to a significant reduction of VOC emissions from the above mentioned 50 – 250 mg C/Nm3 to 10 – 20 mg C/Nm3. The second example concerns road debris. Usually, drainage shafts for de-watering roads are equipped with course filters where course and fine material accumulates over time. These materials are removed from road surfaces with the run-off water. From time to time, the filters have to be emptied and cleaned and the content, also called road debris, has to be disposed of. The use of this material as a waste-derived raw material for cement plants was studied. In a first step, samples of road debris were investigated in the expulsion test and the additional emissions of VOC and benzene were calculated for a 4-stage cyclone preheater kiln for the input of 80 t road debris on a mixing bed of 20000 t. In a second step, the emissions of the cement plant concerned were determined, and in a third step the road debris was added at the above mentioned quantity to see the difference. In Table 3.10, the results for the increase of the VOC and benzene emissions due to the use of road debris are compiled.
Component
Percentage
of the raw
material mix,
Concentration
in the raw
material,
% related to
dry matter
mg/kg
component
mg/kg
mixture%
Chalkstone 88.0 13.6 12.0 40.9
Clay 8.2 18.5 0.8 2.7
Iron oxide 0.2 59.2 0.1 0.4
Sludge (external) 2.6 227.8 16.3 55.6
Filter ash 1.0 34.4 0.1 0.4
Raw material components Quantity of released benzene
Concentration and
percentage in the mix

Chapter 3
State of the art of the co-incineration of waste-derived fuels and raw materials in clinker/cement plants
57
Table 3.10: Comparison of the increase of VOC and benzene emissions (as a result of the use of road debris) in the expulsion test and at a real cement plant, [Waltisberg, 1988]
Operating mode Waste gas
oxygen content Increase of emissions
Benzene VOC
vol. % mg/Nm3 mg C/Nm3
Compound (raw mill in operation)
9.9 expulsion test 0.31 8.1
plant measurement 0.39 7.1
Direct (raw mill out of operation)
7.5 expulsion test 0.48 9.7
plant measurement 0.41 (3.7)
There is a significant increase. The value in brackets cannot be taken into account as it was the consequence of an operational up-set during the baseline measurements. All other values are comparable. This appears as a further proof of the applicability of the expulsion test. Because of the detected benzene emissions, the road debris was analysed for benzene but could not be detected at a detection limit of 2 ppm. As for the kiln raw meals, benzene is not present in the input materials but is formed and released during preheating. 3.3.1.2.6 Possible additional applicability of the expulsion test
The potential known application of the expulsion test does not seem to be exhausted. In the past years, no efforts have been made to detect more single organic compounds present in the waste gas. The most relevant challenge is to apply the test to waste-derived fuels in order to simulate their behaviour in secondary firing and calciners, respectively. This will require the development of a special furnace. The basic ideas for this already exist and the first trials have been carried out. It should be possible to investigate fine (including liquid) and course fuels which shall be injected. Higher temperatures are required (appr. 1000 °C), whereas the available expulsion test can achieve a maximum temperature of about 780 °C. Additional and/or modified analytical methods have to be applied including absorption devices after the reaction zone, e.g. for the elimination of certain compounds. Further, the humification of gases may be required to cover reactions of certain compounds with moisture. Figure 3.53 shows first thoughts for the set-up of a test to investigate waste-derived fuels. It is important to emphasise the fact that organic compounds and carbon monoxide do not only result from the raw materials but can also be formed due to incomplete combustion of waste in the secondary firing in the riser duct or in the precalciner. Thus, volatile organic compounds and carbon monoxide present in the emitted waste gas are released from the natural raw materials but can also originate from incomplete combustion. This will be explained in more detail in Chapter 3.3.2 and will be demonstrated by means of available emission data in Chapter 4.

Chapter 3
58 State of the art of the co-incineration of waste-derived fuels and raw materials in clinker/cement plants
Figure 3.53: First approach for the set-up of a test to investigate waste-derived fuels in a modified expulsion test, [Waltisberg, 2012]
3.3.1.2.7 Conclusions
Comparative investigations concerning the release of carbon monoxide (CO) and volatile organic compounds (VOC) from cyclone preheaters of cement plants clearly showed that
there is a significant release of CO and organic compounds from natural raw materials. Aliphatic compounds dominate but the emission of aromatic hydrocarbons, especially of benzene, is of relevance. Further, many other compounds have been detected. The percentage of CO released from TOC varies between 10.1 and 16.1% and of VOC between 1.2 and 6.1%. Usually, according to available results, the expected emission concentration for CO release from kiln meals is less than 600 mg/Nm3. To be on the safe side, it can be assumed that the release of CO from raw material pre-heating does usually not exceed 700 mg CO/Nm3 (calculated from Figure 3.44 with a clinker factor of 1.56 and a specific waste gas volume of 2.3 Nm3/kg clinker). In cases with extreme TOC contents in the raw material, the release of CO can reach 1600 mg CO/Nm3. For VOC, the release is usually below 20 mg C/Nm3 (calculated from Figure 3.45 with a clinker factor of 1.56 and a specific waste gas volume of 2.3 Nm3/kg clinker). In cases with very high TOC contents (around 3000 mg/kg kiln meal), the release of VOC is about 26 mg C/Nm3. However, in single extreme cases, the release can be even higher (for kiln meal K, used in plant D, in the laboratory 51 mg C/Nm3 was determined but in the real plant (plant D), a factor 3 higher release was found; however, the reason for this significant difference could not be identified),
there are also releases of hazardous compounds from kiln raw meal, such as benzene,
the expulsion test is a reliable method to determine the release of organic compounds from raw materials, and thus the contribution of the preheating phase to the overall emissions can be reliably measured in the laboratory. This is also valid for single organic compounds such as benzene and many other aromatic compounds. For the moment, there

Chapter 3
State of the art of the co-incineration of waste-derived fuels and raw materials in clinker/cement plants
59
is no other laboratory method known to determine the release of organic compounds from preheating kiln raw meal,
in the future, the scope of the expulsion test should be extended, especially for waste-derived fuels. Research and development work is urgently required. The basic concept has already been designed. This is significant as VOC and CO can also be emitted due to incomplete combustion of wastes in secondary firing (riser duct) or in the precalciner.
3.3.2 Precalcination
3.3.2.1 Background
As indicated above, the precalcination technology was developed to use oil shale with a high calcium carbonate content as a fuel. Its further development, which mainly took place in Japan in the seventies, was stimulated by the pursuit of larger clinker burning plants. As the diameter of kilns cannot be limitlessly increased, especially because of the refractory lining, an important approach was to increase the production with the same kiln size which is possible with precalcination. In addition, with precalcined meal, the kiln operation is more stable and smoother [Locher, 2000, p 69]. The objective was and is that the raw meal at the kiln inlet is already highly calcined before entering the kiln (as a consequence, it is called precalcination but nowadays often just calcination and calciner respectively) [Winnacker-Küchler, 2004, p 35], and to use the rotary kiln for the real clinkerisation process [Erhard/Scheuer, 1993]. Without a precalciner, the calcination takes place in the first part of the rotary kiln (see Figure), although, to a small extent, some calcination already occurs in the last part of the preheater. From the energetic point of view, combustion in the precalciner is a heat source and the calcination process is a heat sink. The calcination starts already at temperatures between 550 and 600 °C and mainly occurs at temperatures between 800 and 900 °C. This temperature level can be achieved with low-grade fuels that have significantly lower calorific values compared to oil and hard coal. Nevertheless, first mineral oil was mainly used and later on ground coal, but then more and more so-called waste-derived fuels were and are increasingly used. The latter will be described in detail in Chapter 4.3.2.3. Coal already created problems with respect to incomplete combustion associated with higher emissions of carbon monoxide and organic compounds [Tiggesbäumker, 1985]. The same is true for waste-derived fuels under certain conditions. Further, in precalciner kilns, usually up to 65% of the total fuel energy input is fired into the precalciner and a minimum of 35% through the main kiln burner. In precalciners, fluctuations in fuel quality, which can depend on the type of fuel, have less impact on the kiln performance. As a consequence, most operators first increase waste-derived fuel firing the precalciner. After this, they start to increase the proportion of waste-derived fuels in the primary firing [Schneider et al., 2011;Emberger/Hoenig, 2011]. Efficient performance of the calcination process is characterized by the heat source being in close proximity to the heat sink, so that no losses are incurred due to heat radiation and the released fuel energy is applied to the maximum possible extent for the calcination of the raw meal; under appropriate conditions, the liberation of heat and its consumption maintains the temperature at an equilibrium of about 900°C [Tokheim et al., 2001]. In systems where no large-sized solid fuels and/or difficult to ignite fuels are used, the needs of the process can be met by suitable feeding of the finely ground fuel material. The closer the injection points of the fuel and raw meal are, the smaller the occurring temperature peaks and the more the precalcination and consequently the smoother the kiln operation will be [Mersmann, 2010a].In case of large-sized waste-derived fuels, the fundamental dilemma in the precalciner design is that the ignition and burnout of the waste-derived fuels, which are rather unreactive, such as shredded tyres, have to be ensured by separating the calcination process, which acts as a heat sink, locally and time-related from the combustion process. This means that in systems for burning waste-derived fuels, it is essential for the heat source and the heat sink to be separated. A good example for the nature of this problem is provided by combustion chambers equipped with a tailor-made burner for burning large-sized and/or difficult to ignite solid fuels. Figure

Chapter 3
60 State of the art of the co-incineration of waste-derived fuels and raw materials in clinker/cement plants
3.54 shows a scheme of such a combustion chamber equipped with a top burner. This design varies only very little from vendor to vendor [Mersmann, 2010a].
Figure 3.54: Scheme of a combustion chamber for burning large-sized solid waste-derived fuels that are difficult to ignite [according to Mersmann, 2010a]
Since the introduction of the precalcination technology, no other comparable leap in the pyroprocessing technology took place [Mersmann, 2010a]. A large number of process-technological concepts and new designs have been developed and the large number of proprietary names has led to a confusing variety of terms describing the available technology [Mersmann, 2010a]. It is important to note that in many cases in Germany, no specific precalciners were installed but just secondary firings in the riser duct after the kiln inlet; only about one third of the German clinker production plants are equipped with a precalciner. Like for most precalciners, no additional burner with a stable and shaped flame was installed and thus, as a consequence of self-ignition, combustion took place in unstable flames called “flameless combustion” [Steinbiß, 1979; Locher, 2000, p 61]. In addition, it must be stressed that the combustion conditions in the secondary firing (in the riser duct or in a precalciner) are less well controlled and complete compared to the rotary kiln because temperature, oxygen level, micro mixing and residence time are lower, less intensive and shorter, respectively [Holcim, 2007; Lowes, 2011; Mersmann, 2011]. This knowledge will be demonstrated when discussing the emission data of the German cement plants. 3.3.2.2 Calcination degree
Without a precalciner, calcination also takes place in the last part of the preheater but only with a calcination efficiency of between 40 and 50 %. In a precalciner, this calcination (decarbonation) is usually more than 90 % [Locher, 2000, p 60]. The modern preheater-precalciner kiln systems are designed for at least 85% calcination as computed by the following equation:
C = degree of calcination LOIsample = loss on ignition of the sample analysed LOIraw meal = loss on ignition of the raw meal [Bech/Mishulovich, 2004].
LOI sample x (100-LOI raw meal )
LOI raw meal x (100-LOI sample)C = 100 x 1 -

Chapter 3
State of the art of the co-incineration of waste-derived fuels and raw materials in clinker/cement plants
61
One should bear in mind that it is the control of the calcination reaction that determines the stability of the kiln operation. From the experience gained with the different types of precalciner kilns, there appears to be a relationship between the variations in degree of calcination and the residence time of the material in the precalciner. The systems with shorter solids retention time tend to demonstrate wide fluctuations in the degree of calcination [Chatterjee, 2011]. Another important aspect of precalciner operation is the temperature of the tertiary air. The higher the temperature, the lower the heat consumption and the more stable the kiln system is. Thus, the precalciner kiln systems are strongly linked with the design and efficiency of the clinker cooler [Chatterjee, 2011]. The type and composition of fuels to be fed to the precalciner do not have an influence on the calcination process as long as sufficient energy is provided. The consequent clinkerisation process in the kiln is also not affected by the fuels used in the precalciner. As a consequence, a large variety of low-grade waste-derived fuels are used, as will be described in detail in Chapter 0. 3.3.2.3 Grouping of precalciners
Since combustion in precalciners is the most important process, it is appropriate to first group the precalciners according to the air supply and their placement. Following a proposal of the company Polysius [Locher, 2000, p 61], the precalciner systems can be grouped into:
a) AT (Air Through): firing in the precalciner or riser duct using combustion air drawn through the kiln (Figure 3.55). As the precalcinder is placed between the kiln and the preheater, it is also called In-Line Calciner (ILC) (Figure 3.55 on the right). With this type of precalciner, a reducing zone in the off-gas stream can be created to reduce NOx emissions.
Figure 3.55: 4-stage preheater kiln with air through secondary firing (on the left) and with air through In-Line precalciner (on the right)

Chapter 3
62 State of the art of the co-incineration of waste-derived fuels and raw materials in clinker/cement plants
b) AS (Air Separate): precalciner using tertiary air. Here, basically three versions can be distinguished (see Figure 3.56).
Figure 3.56: Types of precalciners using tertiary air [Bech/Mishulovich, 2004]
“total flow” precalciner In total flow precalciners, combustion takes place in a mixture of kiln exit gases and tertiary air (Figure 3.56). Combustion therefore starts in gases with about 10 – 14 % oxygen. Raw meal from the preheater is fed into the bottom of the precalciner and is conveyed through the precalciner to the lowest stage cyclone by the precalciner gases (Figure 3.57). During the time, fuel combustion and heat transfer to the raw meal are occurring [Bech/Mishulovich, 2004]. As total flow precalciners are also placed between the kiln inlet and the preheater, they are also called In-Line-Calciners (as for “air-through” calciners).
Kiln meal Kiln mealKiln meal

Chapter 3
State of the art of the co-incineration of waste-derived fuels and raw materials in clinker/cement plants
63
Figure 3.57: Air through In-Line calciner (see also Figure 3.55)
tertiary air flow precalciner In tertiary air flow precalciners, combustion takes place in tertiary air flow (Figure 3.57 and Figure 3.58). In other words, it starts in gases with 21 % oxygen. So, they cannot be in line with the kiln inlet and the preheater but are separate. As a consequence, they are called Separate-line Calciners (SLC). Raw meal from the preheater is fed into the precalciner at the level of a burner end and is conveyed to the bottom stage cyclone [Bech/Mishulovich, 2004]. Worldwide, there do not seem to be many applications of this type of precalciner.
precalcined meal
raw meal in
5-stage suspension
cyclonepreheater Mixing
chamber
fuel
waste gas
Kiln meal
Reduction zone

Chapter 3
64 State of the art of the co-incineration of waste-derived fuels and raw materials in clinker/cement plants
Figure 3.58: Separate-line Calciner (SLC) where the fuels are exclusively combusted with tertiary air from the clinker cooler
Hybrid precalciners Hybrid precalciners are essentially a combination of the total flow and tertiary air flow precalciners (Figure 3.56). In hybrid precalciners, combustion starts in tertiary air with 21 % oxygen, as in tertiary air flow precalciners, but is completed in a mixture of kiln off-gas and tertiary air (Figure 3.59), similar to total flow precalciners [Bech/Mishulovich, 2004].
Figure 3.59: Air separate hybrid calciner, here with a combustion chamber in which kiln meal is also fed (see Figure 3.14)
Today, it seems that most of the existing precalciners are In-Line Calciners (ILC) with tertiary air supply, mainly of the total flow and hybrid precalciner type.
5-stage suspensioncyclonepreheater
Raw meal in
Fuel dosing
Combustion chamber with burnerprecalciner
Waste gas

Chapter 3
State of the art of the co-incineration of waste-derived fuels and raw materials in clinker/cement plants
65
Additional possible criteria for type classification of precalciners [according to Mersmann, 2010a and Bhatty et al., 2004] are:
Structural form of a flash tube reactor or as an extended vessel
The type of air or gas supply splitting
The type of combustion system and its suitability for burning large-sized solid fuels
Swirling or non-swirling flow
NOx reduction system
It is relevant to mention that the plethora of design variations of preheater-precalciner systems is aimed towards achieving the following objectives:
a) Meeting the contradictory demands of minimizing the temperature and oxygen levels and complete burn-out of fuel.
b) Relief of the thermal load in the rotary kiln. c) Controllable degree of calcination. d) Abatement of NOx emissions. e) Use of waste-derived fuels, including hard-to-burn ones.
As the above mentioned objectives are concerned, and more particularly the last one, the cement machinery industry has come out with precalciner solutions for different fuel scenarios as shown in Figure 3.60 [Chatterjee, 2011].
Figure 3.60: Example for different flash tube in-line and separate line precalciners with tertiary air supply (here KHD design) for the use of different types of fuels and waste-derived fuels respectively [Mersmann, 2007]
For liquid and very fine solid fuels (conventional or so-called waste-derived fuels) that are easy to ignite, a precalciner with no additional burner and short residence time may be sufficient (about 1 – 2 seconds). The coarser the particles of solid fuels are, and the more difficult they are to ignite, the higher the temperature and oxygen level, the more intensive the micro mixing, and the longer the residence time may have to be [Holcim, 2007; Lowes, 2011; Mersmann, 2011]. In the German precalciners (there are about nine), the residence times are between 2 – 3 seconds which does not seem to be sufficient for a number of them. For lumpy fuels that are difficult to ignite, a separate air precalciner with a tailor-made additional burner may be required as well as a residence time of about 7 seconds to achieve complete combustion and burn-out respectively. Chatterjee reports gas residence times of 1.4 – 1.7 seconds in systems with a separate precalciner (plus the residence time in the duct system) and 4 -5 seconds in extended duct systems [Chatterjee, 2011]. In Chapter 4, it will be demonstrated that in many cases the waste-derived fuels are not completely combusted in the riser duct or in the precalciner. The example below (see 3.3.2.4) provides an illustrative example for that. As the majority of German cement plants do not have a dedicated precalciner, but do all practice secondary firing,
Fuels: suspended in air and easy to ignite Lumpy and difficult to ignite

Chapter 3
66 State of the art of the co-incineration of waste-derived fuels and raw materials in clinker/cement plants
each case has to be carefully considered and assessed with respect to emissions. The waste gas from both the precalciner and the rotary kiln pass the preheater and the raw mill (in case of compound operating mode – see Chapter 3.3.3) and finally reaches the dedusting device (electrostatic precipitator or bag filter). Usually, there is no additional waste gas purification technique between the preheater and the dedusting device. Thus, when burning waste-derived fuels in the precalciner, the prevention of additional waste gas emissions is only possible in case of complete combustion. There seem to be a number of cases in Germany where the imperative target of complete combustion is not met. By means of the emission data of all of them, this indication will be analysed and discussed in detail. In a considerable number of cases, the emissions of VOC and carbon monoxide seem to be significantly elevated. The following real example illustrates this problem and the measures taken to minimize it. 3.3.2.4 Example for the optimisation of a precalciner and minimization of the waste gas
emissions
The example concerns the cement works of Norcem AS in Brevik, one of the two plants in Norway that belong to HeidelbergCement since 1999. It is the only, or one of the very few, publicly available cases describing the problems of precalciners fed with waste-derived fuels. The plant was built in 1966, with a rotary kiln (diameter 4.4 m and a length of 68 m) on three support stations, a 4-stage cyclone suspension preheater, and a grate cooler. In 1987, the feeding of liquid hazardous waste (LHW(4)) via the main burner had been started. In 1988, to use waste-derived fuels for precalcination, the kiln line was retrofitted with an in-line hybrid calciner with tertiary air supply (so-called Pyroclon R-low NOx calciner) and a second 4-stage preheater string as well as with a new grate cooler. The wastes to feed were refuse derived fuels (RDF(5)), solid hazardous waste (SHW(6)) and other solid waste fuels [Tokheim et al., 2001; Tokheim, 2006]. The layout of the retrofitted plant is shown in Figure 3.61.
Figure 3.61: Layout of the kiln system, including waste gas treatment at the Norcem AS cement works in Brevik, Norway [Tokheim et al., 2001]
(4)LHW: Liquid hazardous waste, i.e. organic solvents, paints etc., pumped into the rotary kiln through a separate
channel in the main burner (5)RDF: Refuse derived fuel, i.e. a shredded mixture of municipal solid waste without wet organic compounds and
industrial solid waste. The particle size should be less than 50 mm and are mechanically fed to the precalciner. (6)SHW: Solid hazardous waste, i.e. organic solvents, paints etc., mixed with wood chippings to improve flow
properties. The particle size should be less than 50 mm and are mechanically fed to the precalciner.

Chapter 3
State of the art of the co-incineration of waste-derived fuels and raw materials in clinker/cement plants
67
In the mid-nineties, the precalciner was slightly modified to fire lumpy waste-derived fuels in the riser duct of the precalciner. A new waste reception system for firing fuels derived from non-hazardous and hazardous solid wastes was built in 1998 and at the same time, subsequent to the existing electrostatic precipitators, bag filters were installed to improve the purification of the waste gas, mainly to reduce the dust emissions and at the same time heavy metals and organic compounds adsorbed to the dust particles [Tokheim et al., 2001, Tokheim, 2006]. It should be noted, that in 1998, a new state-owned national plant (of Norway) for the collection and pre-treatment of all organic hazardous waste generated in Norway was erected in Brevik close to the cement works. The thus produced fuels, LHW and SHW, are to be incinerated in the kiln of the Brevik cement plant [Tokheim et al., 2001]. Thus, the cement works form an important element of the national waste management regime. The kiln characteristics and the average waste gas emissions at that time (around 2000) are given in Table 3.11 and Table 3.12. Table 3.11: Characteristics of the kiln-precalciner system of the Norcem AS cement plant in Brevik, Norway
in 2000 [Tokheim et al., 2001]
Table 3.12: Average concentration of selected components in the rotary kiln waste gas of the Norcem AS
cement plant in Brevik, Norway, [Tokheim et al., 2001]
There were no difficulties to meet the prescribed emission limit values (ELVs), except for organic compounds determined as TOC which is practically equivalent to the parameter VOC. The average value just meets the limit of 10 mg/Nm3 but many single values were determined between 10 and 20 mg/Nm3, sometimes even above 20 mg/Nm3. In addition, although there was no ELV for CO, this
Element of the kiln-precalciner system unit value
Rotary kiln length m 68
Rotary kiln (outer) diameter m 4.4
Design clinker production capacity t/d 3300
Typical specific fuel consumption kJ/kg clinker 3300
Representative temperature interval in the rotary kiln °C 1100 - 2000
Representative temperature interval in the precalciner °C 850 - 1050
Typical gas residence time in the rotary kiln s 5
Typical gas residence time in the precalciner s 3
Typical oxygen concentration in rotary kiln exhaust gas % (dry) 3
Typical oxygen concentration in precalciner exhaust gas % (dry) 4
Waste gas parameterunit
(related to 11% O2 and dry gas)Measured ELV
Dust mg/Nm340 7
SOx as SO2 mg/Nm3188 300
NOx as NO2 mg/Nm3750 no ELV
TOC mg/Nm39.7 10
Chlorine compounds, as HCl mg/Nm35.1 10
Fluorine compounds, as HF mg/Nm3
0.049 1.0
Sum Sb, As, Pb, Cr, Co, Cu, Mn, Ni, V and Sn mg/Nm30.086 1.0
Sum Cd and Tl mg/Nm30.002 0.1
Hg µg/Nm312 100
PCDD/F ng TEQ/Nm30.011 0.1

Chapter 3
68 State of the art of the co-incineration of waste-derived fuels and raw materials in clinker/cement plants
parameter was also measured, typically in the range of 3500 – 6500 mg/Nm3. A strong correlation of TOC and CO was observed during the period of incomplete combustion in the precalciner. Both, TOC and CO indicate that the combustion is incomplete and thus, organic compounds and CO do not only reflect releases from the natural raw materials but also result from the incomplete combustion of wastes. The feeding system for the different wastes also had to be established. On one hand, the wastes are fed either to the tertiary air side of the precalciner or to the kiln riser duct (see Figure 3.62).
Figure 3.62: System for feeding solid waste-derived fuels to the precalciner of the cement plant of Norcem AS at Brevik, Norway, [Tokheim et al., 2001]
In addition, a system for feeding wastes via the primary burner (multi-fuel burner as shown in Figure 3.63) was introduced.
Figure 3.63: System for feeding solid waste-derived fuels to the primary burner of the cement plant of Norcem AS at Brevik, Norway, [Tokheim et al., 2001]

Chapter 3
State of the art of the co-incineration of waste-derived fuels and raw materials in clinker/cement plants
69
The operational experience [according to Tokheim et al., 2001; Tokheim, 2005; Tokheim, 2006] revealed that:
staged combustion has to take place solely in the precalciner,
contact between precalcined meal, fuels and kiln exhaust gas in the kiln inlet has to be avoided. If not, the internal cycles of sulphur, chlorine and alkalis (see Chapter 3.2.4.2.1) will be altered, and the operation of the kiln will be disturbed,
fuels should not be supplied to the kiln inlet, but instead to the kiln riser duct. Furthermore, fuel particles that are too heavy to be entrained by the kiln gases (even though they are fed to the kiln riser duct) will fall down into the kiln inlet. As a consequence, they cannot be used. Shredded tyres are an important example of such a waste,
typically, a NOx reduction of 15-20 % is achieved,
in some cases, especially when the system runs at high production with high input of waste-derived fuels, lack of oxygen may lead to high CO peaks up to the order of 12000-13000 mg/Nm3,
the waste-derived fuels should undergo a proper pre-treatment, i.e. sufficient diminution of particle size, homogenisation, removal of foreign objects and reduction of stickiness to ensure stable feeding, undisturbed kiln performance and sufficient burnout,
the concentration of certain elements, specially of chlorine, should be sufficiently low (< 300 g Cl/t clinker),
higher oxygen excess in the kiln is required in order to avoid CO peaks which may disturb the process.
In 2002 and 2003, about 35% waste-derived fuels were fed, both via the precalciner and the main burner. Due to the following three main operational and environmental limitations, this substitution percentage could not be further increased [Tokheim, 2005; Tokheim, 2006]:
- Combustion-related problems leading to exceedance of the TOC emission limit value - Chlorine load limitations (because of the increased input with the wastes used) leading to
process-related problems such as cyclone and tertiary air elbow blockages as well as to exceedance of the emission limit value for HCl and non-compliance with the quality requirements concerning the chlorine content of the clinker
- Flow-related limitations because the gas velocities in the kiln riser duct and in the vertical part of the tertiary air elbow were not sufficiently high to entrain the lumpy fragments of unburnt fuel falling from above.
Consequently, it was decided to modify the kiln system with targets to increase the percentage of waste-derived fuels up to 60%, to eliminate the operational problems and to meet the emission limit values for TOC and HCl while maintaining the clinker production capacity. For this purpose, the following modifications were installed in 2003 and 2004:
- Modification of the calciner/preheater system - Modification of the waste feeding system, and - Installation of a chlorine bypass to remove chlorine.
Here, only the modification of the calciner/preheater system will be explained, which mainly consisted of the elements indicated in Table 3.13.

Chapter 3
70 State of the art of the co-incineration of waste-derived fuels and raw materials in clinker/cement plants
Table 3.13: Description of the modifications of the calciner/prehater system, [Tokheim, 2005]
Description of the measure Purpose
Installation of a “hot spot” combustion chamber (down-draft type) with high-temperature zone, high –oxygen zone, increased residence time and increased turbulence level
Improvement of the burnout of lumpy fuels
Installation of a mixing chamber Mixing kiln gas from the new combustion chamber
Installation of a swirl chamber at the top of the loop duct of the precalciner
Improvement of the burnout of lumpy fuels fed to the precalciner system
Installation of an orifice in the riser duct Balancing the kiln gas and tertiary air as well as ensuring sufficient gas velocity in the riser duct to avoid drop-through of fuel fragments
Re-routing and extension of the tertiary air duct Adapting the tertiary air duct to the new combustion chamber
Modification of lower cyclone stage on string 1 Providing space for the new combustion chamber
Re-routing of meal pipes Providing space for the new combustion chamber
Modification of the kiln inlet chamber Ensuring sufficient inclination of the rerouted meal pipes
Concerning complete combustion, especially of lumpy fuels (also when difficult to ignite) the installation of a “hot spot” combustion chamber (down-draught type) which means a shift from flameless to (defined and stable) flame combustion. This means that the fuels burn in a high-oxygen zone at a higher temperature and with a longer residence time. In the burning chamber, about 85 % of the tertiary air enters the combustion chamber tangentially while at the same time entraining preheated raw meal from the penultimate cyclone stages. The raw meal is distributed in the tertiary air by means of splash bars. The tangential inlets create a raw meal curtain that protects the refractory from the hot flame in the centre of the combustion chamber (see Figure 3.54). As already indicated above, today the design of such a top burner varies only very little from vendor to vendor [Mersmann, 2010a]. The remaining 15 % of the tertiary air is routed to the top of the combustion chamber and used as a primary air component (“top air”) in the burner which is a tailor-made-3-channel burner. A mixture of RDF and SHW enters through the central tube with an inner diameter of 600 mm. Pulverised coal enters through an annulus outside the waste mixture. Swirl air, created by means of a special swirl element, is supplied through an inner annulus. Cooling air is also provided through an outer annulus to protect the burner from the heat. The flame temperature of typically 1200 °C can be controlled by adjusting the percentage of top air and/or the swirl/cooling air supply to the precalciner chamber. The exhaust gas from the combustion chamber and the kiln exhaust gas are mixed in a mixing chamber. The turbulence created in the mixing chamber is another element to facilitate burnout of the fuels and calcination of the meal. The combustion chamber followed by the mixing chamber is shown in Figure 3.64. Further, at the top of the precalciner’s loop duct, a swirl chamber had been installed to achieve optimised burnout of residual fuel fragments in the precalciner gas. This increases the residence time (from 3 seconds according to Table 3.11 to 5 seconds [Tokheim, 2005]) as well as improving the mixing of oxygen and fuel fragments. An orifice was installed in the riser duct to ensure sufficient gas velocity in the riser duct and thus to avoid drop-through of fuel fragments. Some additional modifications were required to adapt to the major changes described, such as re-routing of the tertiary air duct (adaptation to the new combustion chamber), modification of the lower cyclone stage on string 1 (necessary because of space limitations), rerouting of meal pipes (also necessary because of space limitations), and modification of the kiln inlet chamber to ensure sufficient inclination of the rerouted meal pipes [Tokheim, 2005; Tokheim, 2006].

Chapter 3
State of the art of the co-incineration of waste-derived fuels and raw materials in clinker/cement plants
71
Figure 3.64: The new combustion chamber with the 3-channel burner at the top
The modified calciner/preheater system is illustrated as a 3-D-drawing in Figure 3.65 and the whole modified layout in Figure 3.66. The performance of the retrofitted system achieved the specified values, except the pressure drop of the system. The TOC was determined well below 10 mg/Nm3 and the CO concentration below 1250 mg/Nm3. The latter is not a low emission value for CO. This means that significant parts of TOC and CO were emitted due to the incomplete combustion of wastes and that these emissions could be considerably reduced by the described improvements and optimisations. After the modifications, the kiln operation was described as satisfactory with a typical clinker production of 3300 t/d using about 55 % waste-derived fuels, sometimes even more. The consumption of fuels after the modification is given in Table 3.14. However, it should be noted that the energy consumption increased with the increased use of waste fuels. The main reason seems to be the higher water and ash content of the waste-derived fuels to be evaporated. Table 3.14: Fuel consumption and heating values in 2005, [Tokheim, 2005; Tokheim, 2006]
Fuel Quantity, t/yr Lower heating value, MJ/kg
Refuse derived fuel (RDF) 90 000 14
Coal 52 000 28
Solid hazardous waste (SHW) 13 000 17
Liquid hazardous waste (LHW) 10 000 17
Animal meal 8 000 16
Petcoke 8 000 30
Wood 7 000 18
Waste oil (used during startups) 3 000 34
kiln inlet
to precalciner
connection raw
connection swirl
air pipe II
connection
swirl air pipe I
meal pipe
stage 3/string 2bu
rne
rconnection raw
meal pipe
stage 3/string 1
combustion air

Chapter 3
72 State of the art of the co-incineration of waste-derived fuels and raw materials in clinker/cement plants
Figure 3.65: The modified calciner/preheater system (red: new/modified parts; yellow: existing), according to [Tokheim, 2005]; the cyclone numbering relates to Figure 3.66 below
Figure 3.66: The kiln system after the modifications at the Norcem AS cement works in Brevik, Norway, [Tokheim, 2005]
Tertiary air duct
4.1
3.1
2.1
1.1
1.1
4.2
3.2
2.2
1.2
1.2
Two string
4-stage cyclone
preheater
Rotary kiln
„Hot spot“
combustion
chamber
Swirl chamber
at the top of
the loop duct

Chapter 3
State of the art of the co-incineration of waste-derived fuels and raw materials in clinker/cement plants
73
3.3.2.5 Computational Fluid Dynamics (CFD)
3.3.2.5.1 Introduction
With respect to the individual conditions and circumstances in a cement plant, waste-derived fuels used in precalciners have to be carefully selected with regard to physical and chemical properties, such as particle size distribution, fluid dynamics and heating behaviour as well as the contents of chlorine, sulphur, alkalis and nitrogen that have an impact on the timing of heat release and thus the calcination process and also on emissions to air such as nitrogen oxides, organic compounds and carbon monoxide [Hoenig et al., 2011]. It is difficult to predict these impacts and in system planning, their consideration is only possible to a limited extent. Nowadays, computational fluid dynamics (CFD) is seen as an important tool for the optimisation of the use of waste-derived fuels in precalciners [Iliuta et al., 2002; Fidaros et al., 2007; Cong-xi et al., 2010; Mikulčić et al., 2012; Mersmann, 2010a; Mersmann, 2010b; Mersmann, 2011; Lowes, 2011] although it is not the ultimate solution. CFD have been used for five decades for calculating and optimizing industrial processes that involves flows. Single-phase gas or liquid flows can be represented realistically with commercial CFD codes which can also be used for solid loadings of the gas phase up to 5 vol.-% [Mersmann, 2010a]. The cement industry however involves flows which are crucial for the efficiency of the production plants, but with loadings, at least locally, that go beyond the applicability of most commercial CFD programmes/software [Mersmann, 2010b; Hoenig et al., 2011]. 3.3.2.5.2 Applications
CFD applications with respect to precalciners mainly concern the use of waste-derived fuels which appear to be economically attractive. However, the characteristics of these fuels significantly differ from conventional fuels such as (waste) oil, coal and pet coke. Large-sized solid waste-derived fuels that one more difficult to ignite and to combust completely, such as shredded tyres, currently represent one of the greatest challenges in terms of engineering. Here, optimisation is required and CFD simulation may help as follows:
- Calculation of the optimal treatment level (fineness) of the waste-derived fuels regarding the settling velocity
- Assessment of the optimal feeding point of different fuels to ensure complete combustion by improving residence time
- Optimisation of the structural design of precalciners for reduced strand formation and improved mixing [Hoenig et al., 2011].
To achieve that, simulations existing for coal-fired precalciners have been further developed [AIF 15407N, 2010]. Specifically, for shredded tyres, Figure 3.67 shows the schematic sequence to calculate shredded tyre combustion.

Chapter 3
74 State of the art of the co-incineration of waste-derived fuels and raw materials in clinker/cement plants
Figure 3.67: Schematic of the calculation of shredded tyre combustion [according to Mersmann, 2010a]
The model concerned is called Multi-Phase Particle-In-Cell Model (MP-PIC-Model) [Mersmann, 2010a; Mersmann, 2010b], e.g. applied for an in-line flash tube precalciner (see Figure 3.68).
Figure 3.68: Scheme of an in-line flash tube precalciner with split feeding of conventional fuel, air and meal before injecting shredded tyres [Mersmann, 2010a]
The criterion of maximum applicable feed rate of shredded tyres was defined by the following three conditions:
- No shreds may fall through into the kiln inlet chamber - The CO concentration at the precalciner outlet must be below 100 ppm (which is very
ambitious) and the oxygen content must be in the usual range of approximately 4 vol.-%; the target to limit CO to 100 ppm is very ambitious as in many existing plants the CO concentration considerably exceeds 1000 ppm
- The shreds of the largest size fraction have to be 75 % burned upon leaving the precalciner [Mersmann, 2010a]
Following a published example [Mersmann, 2010a], the model allows the identification of the optimal feeding point as well as of the optimal conditions to achieve the above mentioned targets. Figure 3.69
Heating up
< 180°C
Reactions in
the gas phase
Char combustion
Limited by mixing
rate and kinetics
Limited by
mass transfer
Shredded tyres(chemical composition: natural
rubber, butadiene rubber,
styrene-butadiene-rubber,
carbon black and other additives
Pyrolysis
Limited by
heat transfer
and kinectics
CO, C1-C5-volatiles
carbon,
ash

Chapter 3
State of the art of the co-incineration of waste-derived fuels and raw materials in clinker/cement plants
75
shows an example for the oxygen and CO concentrations under certain conditions. For this result, the tertiary air volume had to be increased by 40 % in order to maintain a sufficiently high oxygen concentration and low CO concentration, respectively.
Figure 3.69: CFD-calculated oxygen and carbon monoxide concentrations in the precalciner at defined conditions [Mersmann, 2010a]
In the future, CFD for precalciners will continue to be an important tool to optimise combustion in precalciners and to minimize emissions to air, respectively, but on-line monitoring of carbon monoxide, organic compounds, oxygen etc. will also be indispensable to meet these targets. 3.3.2.6 Conclusions
Over time, the precalcination has been increasingly used to feed waste-derived fuels. However, in Germany, the majority of the cement plants do not have dedicated precalciners to co-incinerate waste-derived fuels but just feed them to the riser duct. The use of waste-derived fuels in precalciners and in riser ducts can be associated with elevated emissions of organic compounds and carbon monoxide due to incomplete combustion conditions because the turbulence, the residence time and the temperature level may not be sufficient. This is illustrated by the submitted real example. This observation will also be explained in Chapter 4.
3.3.3 Compound and direct operating mode
3.3.3.1 Introduction
With respect to emissions of volatile compounds, it is important to know the difference and impact of the so-called compound operating mode and direct operating mode. At times when the raw mill is in operation (also called raw mill on), the system is running in the compound operating mode. This means that the raw gas, after leaving the conditioning tower, is passing the raw mill in order to dry the raw meal and thus part of the residual energy of the raw gas, after the preheater and the conditioning tower, is used (energy recovery). The raw gas should not reach the raw mill at a too high temperature and therefore has to be conditioned in the conditioning tower (see Figure 3.70). The gas leaves the raw mill with a high dust load which is removed in a bag filter (modern and most efficient version of bag filters or in an electrostatic precipitator (less efficient removal efficiency).

Chapter 3
76 State of the art of the co-incineration of waste-derived fuels and raw materials in clinker/cement plants
Figure 3.70: Compound operating mode, i.e. the raw mill is on and the raw gas is passing the mill
3.3.3.2 Impact of the two operating modes on emissions to air
In the raw mill, on one hand additional heat exchange occurs and the temperature of the waste gas is further reduced. On the other hand, the raw mill acts like a “dry scrubber” [Linero, 2011] by adsorbing compounds on to the huge quantity of dust with a specific surface area of about 0.5 m2/g [Kirchartz, 1994, p 81]. When the raw mill is not in operation (also called raw mill off), the system is running in the direct operating mode. Then, the raw gas, after leaving the conditioning tower, directly reaches the dust abatement system (see Figure 3.71).
Conditioningtower
Raw mill
Stack Bag filter
Meal dosing5-stage cyclone
preheater
Raw meal in
Raw material
in
Homogeni-sation silo
Raw meal silo
Raw gas
Raw mill on
Water

Chapter 3
State of the art of the co-incineration of waste-derived fuels and raw materials in clinker/cement plants
77
Figure 3.71: Direct operating mode, i.e. the raw mill is off and the raw gas is not passing the mill but is directly reaching the bag filter
Then, the waste gas reaches the bag filter or electrostatic precipitator at a high temperature unless the conditioning tower had been or could be operated in a way to further cool down the waste gas. This is specifically important for an improved removal efficiency of mercury. In the eighties, the ratio of compound operating mode to direct operating mode was usually in the range 50/50 to 60/40. This means that the mills had excess capacity and were only running about half of the time, mainly during the night due to lower electricity costs. Nowadays, the range is more between 10/90 and 20/80. In many cases, this development was due to the increase in production while not changing the raw mills; they are smaller and are operated much longer than in earlier times. During operation of the mill, volatile compounds reaching the outer cycle, such as thallium, mercury or ammonia, are absorbed in the raw mill to a high extent and are returned with the dust to the preheater. Thus, they continuously enrich in the outer cycle during operation in compound operating mode. When switching to the direct operating mode, the raw gas with elevated concentrations of volatile compounds directly reaches the dust abatement system and higher emissions can occur, especially for the highly volatile compounds mercury (elementary and mercury dichloride) and ammonia. To minimise these emissions, especially for mercury, the temperature of the waste gas should be as low as possible. Figure 3.37 impressively demonstrates the mercury emissions as a function of the waste gas temperature. In addition, the dust removal from the cycle in the direct operating mode also contributes significantly to the reduction of mercury emission. For this purpose, at many cement plants, a valve system has
Conditioning tower
Raw mill
Stack Bag filter
Meal dosing5-stage cyclone
preheater
Raw meal in
Raw material
in
Raw meal silo
Raw gas
Raw mill off
Homogeni-sation silo
Water
Removal of dust
from the kiln
system by means
of a valve

Chapter 3
78 State of the art of the co-incineration of waste-derived fuels and raw materials in clinker/cement plants
been installed (see Figure 3.71). With this dust removal, the level of the cycle can be reduced and thus the associated emissions, especially of mercury (see Figure 3.72).
Figure 3.72: Mercury emissions in the direct operating mode as a function of the percentage of removed dust
In very big cement plants, there may be two raw mills. All possible combinations of operation exist, i.e. both are in operation (e.g. 50 % of the time), one is in operation (e.g. 23% of the time), and none is in operation (e.g. 27 % of the time) [Linero, 2011]. Thus, dust removal can be practiced when both of the raw mills are off.
The two operating modes may also have an impact on the emissions of organic compounds but no detailed investigation could be found concerning this issue. 3.3.3.3 Conclusions
Due to the enrichment of volatile compounds in the outer cycle, such as thallium, mercury or ammonia, the emissions to air of these compounds can be significantly higher in the direct operating mode because the function of the raw mill as a “dry scrubber” is missing and the waste gas temperature is higher. This difference is especially relevant for mercury as it has the highest ecotoxicity by far (see Chapter 4.4.3.5). The emission of ammonia can also be significantly higher (see Chapter 4.4.3.10). In case of mercury, the emission is not significantly higher if it can be managed to keep the waste gas temperature at the same level as in the compound operating mode. 3.3.4 Chlorine bypass
3.3.4.1 Introduction
As a rule of thumb, a kiln with a cyclone preheater (with or without a precalciner) can be operated without a chlorine bypass if the chlorine input is below 300 mg Cl/kg clinker (Waltisberg, 2012). Where this input is exceeded, measures have to be taken to reduce the inner chlorine cycle (see Chapter 3.2.4.2.1). The most common measure is to extract a part of the kiln gas stream from the kiln inlet [Locher, 2000, p 135]. This is required to avoid or to reduce coatings and ring formation that result from high concentrations of the volatile minor elements Na, K, S, and Cl (see Chapter 3.2.4.2.1). These adverse effects are not manageable by the application of mechanical cleaning methods (manual work, air shocks) [Enders/Haeseli, 2010]. The extraction of gas from the kiln inlet is most efficient as the gas temperature there is 1000 – 1250°C, and thus it is sure that all volatile compounds are in the gas and
0
5
10
15
20
25
30
35
40
0 20 40 60 80 100
Em
iss
ion
[u
g H
g/N
m3]
Percentage of dust removal at direct operation mode, in %
Direct
Compound
Percentage of dust removal in direct operation mode, in %

Chapter 3
State of the art of the co-incineration of waste-derived fuels and raw materials in clinker/cement plants
79
vapour phase respectively [Stark/Wicht, 2000, p 51; Schöffmann, 2003]. The extraction rate (percentage of the kiln inlet gas flow, i.e. the percentage of the gas flow leaving the kiln) is between 2 – 15 % for a chlorine bypass [Locher, 2000, p 135; Schöffmann, 2003]. The more usual range is 3 – 7 %. As chlorine compounds (mainly NaCl and KCl – see Chapter 3.2.4.2.1) enrich mostly in the inner cycle, their concentration is higher compared to other volatile minor elements (see Table 3.3). In plants with a precalciner and a tertiary air duct (see Figure 3.9), due to lower specific gas flow, the chlorine concentration in the kiln inlet is slightly higher [Stark/Wicht, 2000, p 51]. This is an important reason why modern plants (with a precalciner and a tertiary air duct) require a chlorine bypass at lower chlorine input. For sulphur bypasses, the extraction rate is significantly higher and the same is true for alkali bypasses (20 – 50 %) [Schöffmann, 2003]. Many plants in North America need a bypass system to produce low alkali cement, which is characterized by a Na-equivalent of less than 0.6 %; roughly a third of the cement produced in North America is low alkali cement [Binninger, 2009]. However, here the focus is laid on chlorine bypasses because, in many cases, they are related to increased chlorine input associated with the use of waste-derived fuels. Of course, there are some cement works which already had to introduce a chlorine bypass from the very beginning due to raw materials with elevated chlorine contents. However, these cases are the exception rather than the rule. A well-known example is the Holcim cement works in Höver/Germany. In the past decade, many chlorine bypasses had to be retrofitted to manage increased chlorine inputs due to increased use of waste-derived fuels [Chatterjee, 2011; Schöffmann, 2003; Binninger, 2009]. 3.3.4.2 Layout of a chlorine bypass
In principle, the layout of a chlorine bypass system of the different suppliers is similar. It consists of the following elements [according to Danuvola/Freimann, 2006]:
Take off chamber
(Cyclone to separate coarse particle dust to be returned to the preheater – usually not applied in Europe but in Japan)
Quenching chamber
Quenching fan
Evaporation cooler (where water is used for further cooling subsequent to air cooling)
Bag filter
Bag filter fan
Meal dosing device into take off stream
Screw conveyors for bypass dust
Bypass dust silo
Bypass dust dosing system
Piping system
Instrumentation

Chapter 3
80 State of the art of the co-incineration of waste-derived fuels and raw materials in clinker/cement plants
Figure 3.73 shows a chlorine bypass system that was installed in a German cement works in 2010.
Figure 3.73: Example for a chlorine bypass system with air and water cooling which has been installed in a German cement plant in 2010
Gas with a temperature of 1000 – 1250 °C is extracted via the take-off from the kiln inlet. Figure 3.74 shows a typical example. The position of the feed chute and the rotation of the kiln are taken into account. Then, the gas is rapidly cooled down by injecting ambient air into the quench chamber (in the Figure 3.73 above, it is called mixing chamber). Rapid cooling is required to avoid the formation of compounds that cause coating and clogging. The constituents present in the gas or vapour phase condense on the entrained dust, and thus their concentration increases. In order to increase the condensation as well as the adsorption surface, to improve the handling (conveyance) of bypass dust, and, depending on the individual circumstances, to incorporate sulphur compounds, raw meal is dosed to the kiln inlet and to the quenching chamber. After the quenching chamber, the temperature of the gas is up to 600 °C and after the evaporation cooler less than 180 °C. With this combination of air and evaporation cooling, the flow gas is only increased by about factor 2 – 3 whereas for pure gas cooling, the factor is about 8 – 9 [Danuvola/Freimann, 2006].
RAW
MEAL
SILO
QUENCH
CHAMBER
P-6
AIREVAPORATION
COOLER
WATER
~1200 °C
~600 °C
~170 °C
BYPASS
DUST
BAG
FILTER
CEMENT KILN WITH
CALCINATOR AND
PREHEATERS
CEMENT MILL
STACK WITH
CONTINUOUS
MONITORING
BYPASS
DUST
SILO
BYPASS
FAN
BYPASS
DUST
COOLING
WATER
<130 °C
DUST
COOLER
ca. 1200°C
Raw
meal
silo
Quench
chamber
ca. 600°C
ca. 170°Cwater
Bypass
dust
silo
Evapo-
ration
cooler
Bypass
dust
Bypass
dust
Bag filter
Bypass
fan
Stack with
continuous
monitoring
Dust cooler
< 170°C
Cooling
water
Cement mill
External use
Rotary kiln
5-stage
cyclone
preheater
Precalciner
Kiln inlet
Take-off
Raw meal
Raw gas
Clinker cooler
Raw meal

Chapter 3
State of the art of the co-incineration of waste-derived fuels and raw materials in clinker/cement plants
81
Figure 3.74: Extraction part (take-off and mixing (=quenching) chamber) of a chlorine bypass system of a rotary kiln with cyclone preheater, [Binninger, 2009]
As a result of the condensation and adsorption mechanisms in the quenching chamber and evaporation cooler, the circulating compounds, especially sodium and potassium chloride, are mainly bound to the dust. Thus, their concentration in the dust drastically increases. An example is provided in Figure 3.17 where the chloride concentration increased from 0.022 (before condensation) to 7.63 weight-% after condensation (about factor 350) [Locher/Klein, 2011a]. Due to the kiln meal injection, the chloride concentration of the dust is reduced (diluted) which improves the handling (conveyance) of the removed bypass dust. In the evaporation cooler, some dust is already separated. The residual dust is removed in a bag filter where residual dust concentrations of less than 10 mg/Nm3 are achieved. The removed dust is conveyed with screw pumps and a pneumatic system to the bypass dust silo. Before the conveyance via the pneumatic system, the dust passes a cooler to reduce its temperature to below 130 °C. This is required to minimize clogging of the dust. The chlorine content of the dust also has a significant influence on its clogging potential. The maximum concentration should be below 10 weight-%, preferably between 5 and 8 weight-% maximum [Schöffelmann, 2003], and is adjusted by raw meal injection to the kiln inlet and to the quenching chamber as mentioned above (see Figure 3.73). The waste gas (after the bag filter) is emitted via the stack. There is the option to recycle the gas to the preheater [Stark/Wicht, 2000, p 51]. However, this option is not often applied. 3.3.4.3 Chlorine bypass dust
In many cases, the bypass dust can be used as an additive for cement formulation, mainly on-site but it may also be transported to other cement works or formulation facilities. Figure 3.75 shows the roentgenogram of a bypass dust sample, indicating the main constituents, such as K2O (26.7 %), Na2O (0.6 %), SO3 (13.9 %) and chlorine (7.2 %) which means that the main compounds are potassium sulphate and potassium chloride [Stark/Wicht, 2000, p 52]. Their elevated levels are due to their enrichment in the inner cycle.
Mixing chamber
Take-off
Rotary kiln
Riser duct
Bypass

Chapter 3
82 State of the art of the co-incineration of waste-derived fuels and raw materials in clinker/cement plants
Figure 3.75: Roentgenogram of a chlorine bypass dust sample, [Stark/Wicht, 2000, p 52]
For reusing the bypass dust, its chlorine content should vary within a small range only. For this purpose, equalisation is carried out in a silo to achieve a variation of only ± 0.1 weight-% [VDZ Bypass dust, 2007]. According to [DIN EN 197-1, 2011], the chloride content of cement may not exceed 0.1 weight-%. This specification requirement sets a limit for the addition of chloride present in the bypass dust. In case the chlorine bypass dust cannot be used, or not completely used, for cement formulation, other disposal routes have to be identified. Landfilling is not an option due to the high content of water-soluble compounds. There are two cases where the dust is washed to extract the sulphates and chlorides and the de-watered dust is returned to the kiln. However, this option is limited to conditions where the salts can be discharged to natural waters with sufficient dilution capacity [VDZ Bypass dust, 2007] and when the content of heavy metals is below stringent emission limit values. Other options are under investigation, e.g. reuse in the glass industry [VDZ Bypass dust, 2007]. 3.3.4.4 Removal efficiency
As already indicated in Chapter 3.2.4.2.1 and in Table 3.3, the enrichment factor of chlorine in the kiln inlet is about 100. For example, a chlorine input of 100 mg/kg clinker will result in about 10000 mg/kg clinker in the kiln inlet. Because of this enrichment, chlorine bypasses are installed to tackle elevated chlorine inputs. If one percent of the gas flow in the kiln inlet is extracted via the chlorine bypass, about 100 mg chlorine/kg clinker are removed. This consideration explains the thumb of rule that each percent of gas flow extracted via the chlorine bypass (percentage of the gas flow in the kiln inlet) is equivalent to the elimination of about 100 mg chlorine/kg clinker. It is often claimed that the retrofit of a chlorine bypass does not cause any increase in emissions to air. However, this statement does not withstand the facts. A chlorine bypass is usually retrofitted to manage increased chlorine input due to increased use of waste-derived fuels. Then, the HCl concentration in the kiln inlet gas is higher. In addition, the inner cycle of cadmium and lead chlorides may also increase (see Chapter 3.2.4.2.2). Further, due to its inner cycle, SO2 concentration is higher. Especially HCl and SO2 will be absorbed to a high extent when passing the preheater and the raw mill respectively. But this is not the case when directly extracted from the kiln inlet. The bypass gas flow is low compared to the kiln inlet gas flow (as indicated 2 – 15 %, mainly 3 – 7 %) but nevertheless, there is an increase of HCl and SO2. Depending on the chlorine input, the emission limit value for HCl, usually 10 mg/Nm3 for German cement plants, can be exceeded.

Chapter 3
State of the art of the co-incineration of waste-derived fuels and raw materials in clinker/cement plants
83
Cadmium and lead chloride cycling will be higher at higher chlorine input. As the particles of these chlorides are very fine, their removal during condensation and in the bag filter is not complete. Due to the high adsorption capacity, it has to be expected that in the preheater and the raw mill (see Chapter 3.2.4.2.2), their removal efficiency will be higher compared to the conditions of bypass gas treatment. Thus, higher cadmium and lead emissions are more likely to occur. It will not just be proportional to the gas flow of the bypass but disproportionately high due to the lower removal efficiency of the chlorine bypass system. For minimising these emissions, the residual dust content after the bag filter should be as low as possible (below 5 mg/Nm3). Mercury emissions will also be higher because the adsorption will be significantly lower in the bypass system due to limited adsorption surface and higher waste gas temperatures. Based on this background, it seems evident that the retrofit of a chlorine bypass, due to increased chlorine input because of increased use of waste-derived fuels will be associated with increased emissions to air, at least for the above mentioned parameters. The same is true for the energy efficiency due to the heat losses via the bypass. 3.3.4.5 Way to emit the waste gas from the bypass system
As already indicated, the return of the treated bypass gas to the preheater is more the exception rather than the rule. In many cases, the waste gas is emitted via an existing stack, often the same stack from which the kiln gas is emitted. In this case, so-called “visible smoke” (opacity) can occur under certain circumstances. HCl present in the bypass waste gas can react with ammonia, injected in surplus for NOx reduction with SNCR (see Chapter 4.4.3.3) and present in the kiln waste gas, especially during direct operating mode (see Chapter 3.3.3), to form ammonium chloride which, as an aerosol, is visible as “visible smoke”. To avoid additional emissions, there are cases where treated bypass waste gas is routed to the front part of the clinker cooler to re-use the oxygen rich (19 – 20 % O2) bypass gas as combustion air in the rotary kiln [Tokheim, 2006].
3.3.4.6 Conclusions
In many cases, cement works have been retrofitted with chlorine bypasses to reduce the chlorine level in the kiln inlet due to the increasing chlorine input with waste-derived fuels. This increased input can be associated with increased emissions of lead and cadmium chlorides as well as with increased HCl emissions and a reduction in energy efficiency due to the heat losses via the bypass system. 3.3.5 Rotary kiln firing systems (main burners)
3.3.5.1 Introduction
Since establishing rotary kiln firing systems for clinker production, firing systems (burners) were developed to enable the required efficient heat transfer from the rotary kiln flame to the kiln feed [Emberger/Hoenig, 2011]. For this purpose, single-channel burners for gas, and later for coal and pet coke, have been used. At the beginning of the 1980s, the single-channel burner was often substituted by the multi-channel burner. Contrary to the blowing-in pipe of the former design, this burner type allows a direct setting of the flame shape. Moreover, the primary air requirement could be considerably reduced, thereby also reducing the overall energy balance [KHD Humboldt, 2004].

Chapter 3
84 State of the art of the co-incineration of waste-derived fuels and raw materials in clinker/cement plants
Waste-derived fuel utilisation began in the mid-1980s but mainly in the beginning of the 1990s [KHD Humboldt, 2004; Wirthwein/Emberger, 2010]. As it was easier to establish and the impact on the clinker burner process and the clinker quality was limited, the use of waste-derived fuels often started by introducing secondary firing (dosage of waste-derived fuel to the kiln inlet (riser duct) or, where available, to the precalciner). However, in a conventional preheater kiln (without precalciner), it is only possible to burn fuels in the kiln inlet with substitution rates of up to 25 – 30% [Schneider et al., 2011]. To further increase the substitution rate, a precalciner has to be introduced (see Chapter 3.3.2), or the proportion of waste-derived fuels fired in the sintering zone, via the rotary kiln firing system, has to be increased [Schneider et al., 2011]. As the majority of the German clinker production plants do not have a precalciner, almost all of them strove to increase the use of waste-derived fuel input via the kiln burner by co-firing with conventional fuels. This co-firing requires specially designed rotary kiln burners (also called main burners). Modern burners consist of multiple-channels and pipes and enable the firing of various fuels and different fuel mixtures. These multi-channel and multi-fuel burners are characterized by a plurality of nozzles, tubes and annular channels facilitating the flexible incineration of ground and coarse solid fuels as well as liquids, pasty and gaseous fuels [Wirthwein/Emberger, 2010]. Three-channel and five-channel burners are in operation. While three-channel solid fuel burners enable the feeding of an additional gaseous or liquid fuel, five-channel burners are designed for simultaneous firing of three fuels in proportioned quantities [Chatterjee, 2011]. Early experiences with such multi-channel and multi-fuel burners were made in Switzerland. First, in the existing burner, two separate channels were introduced to inject waste-derived fuels (photo on the left in Figure 3.76) but results were not optimal, and subsequently, a new multi-channel burner was introduced to achieve desired substitution rates (photo on the right in Figure 3.76).
Figure 3.76: Old and new burner tip (retrofitted in 2001) of the rotary kiln burner of the cement works of Holcim (Schweiz) AG in CH-Untervaz, [Jaun, 2004]
The different input facilities for conventional and waste-derived fuels as well as for the different primary airs can be seen in Figure 3.77.
Axial air
channel
Swirl air
nozzles
Coal channel
Alternative
fuel channels
Axial air
channel
Swirl air
channel
Coal channel
Ch
an
nels
fo
ralt
ern
ati
ve
fuels

Chapter 3
State of the art of the co-incineration of waste-derived fuels and raw materials in clinker/cement plants
85
Figure 3.77: Burner and related input facilities for various waste-derived fuels installed at the cement works of Holcim (Schweiz) AG in CH-Untervaz in 2001, [Jaun, 2004]
In the cement works of Holcim (Switzerland) AG in CH-Eglépens, a new multi-channel burner (Figure 3.78) enabled the operation with 100% waste-derived fuels as follows
- 3.2 t/h animal meal and bone meal (90%:10%) - 2.7 t/h animal fat - 2 t/h saw dust impregnated with pollutants - 0.4 t/h plastics - 0.5 t/h waste solvents - 0.4 t/h contaminated water
In addition, 1.2 t/h tyres are added via the secondary firing [Jaun, 2004].
Additional air for coalAixal air
Swirl air
Additional air
plastics
Additional air for dried
sewage sludge and animal
meal
Plastics
Coal
Dried sewage sludge,
animal meal
Heavy oil /
waste oil
Ignition lance/ waste
water from photographic
processes
Distillation
residue
Burner tip

Chapter 3
86 State of the art of the co-incineration of waste-derived fuels and raw materials in clinker/cement plants
Figure 3.78: Burner and related input facilities for various waste-derived fuels installed at the cement works of Holcim AG in CH-Eglépens in 2003, [Jaun, 2004], the addition of coal is optional and is only applied in case of problems with the input of waste-derived fuels
3.3.5.2 Arrangement of burner air and fuel channels
Today, modern multi-channel burners, which are suitable for the simultaneous use of multiple fuels of different burning characteristics, provide separate channels for the primary air (air injected via the burner) and the fuels. A part of the combustion air is applied as preheated and partially twisted, partially untwisted, air through the burner tip to give the flame the necessary turbulence for mixing combustion air and fuels. The greater part of the combustion air is drawn from the clinker cooler as preheated, so-called secondary air and mixes inside the kiln into the flame. This secondary air is sucked into the kiln, completely separated from the primary air for the burner operation, by down-stream arranged fans. The ratio of primary to secondary air is 13-15%/85-87%, for very modern burners 8-12%/88-92% [Gemmer/Schneider, 2006], depending on the stoichiometric need of combustion air. The flame shape is set by a combination of axial momentum flow, rotation and divergence of the burner air [Emberger/Hoenig, 2011]. The injection velocities depend on the different fuels and are in the following orders:
Lignite 35 - 40 [m/s]
Coal ca. 30 [m/s]
Pet coke ca. 25 [m/s]
Waste-derived fuels 30 - 45 [m/s] The primary air is further divided into the flame-adjusting air flows and fuel conveying air. Burner air serves for the flame shaping and significantly affects the combustion. The conveying air transports the fuel through the burner into the firing. Burner suppliers have different approaches to the arrangement and adjustment facilities of burner and conveying air. Depending on the technical design of the burner, burner air consists of only one air stream or can be split into several streams. If the burner air consists of several air streams, these are referred to as adjusting, axial and twist air, and also as central or swirl air. Furthermore, the combustion air can be characterized by the air demand, which is required for the complete oxidation of the fuels – the stoichiometric minimum air demand – and the technically excess air. Figure 3.79 shows the distribution of combustion air to the individual air streams [Emberger/Hoenig, 2011].
Burner tip
Contaminated saw
meal, plastics
Coal
Dried sewage sludge,
animal and bone meal
Cooling air for coal
channel
Central air
Swirl air
Central and cooling air
Gas.heavy oil,
animal fat
Contaminated water
Waste solvent, waste oil

Chapter 3
State of the art of the co-incineration of waste-derived fuels and raw materials in clinker/cement plants
87
Figure 3.79: Partitioning of combustion air into several streams, [Emberger/Hoenig, 2011]
3.3.5.3 Classification of rotary kiln burners
For the identification of rotary kiln burners, a system of classification has been developed. Table 3.15 shows a classification of the different burner concepts. Column 1 identifies the type. Column 2 indicates the distribution of burner air and the position of the channel for the ground fuels (coal channel which is not used in cases of 100 % substitution rate) relative to the twist-generating (twist as synonymous to swirl air) air channel. In column 3, the arrangement of the annular channels, beginning from the outside, is specified. Column shows examples of burner systems (here the burner tips) currently present on the market.
Total combustion air
Excess air
Secondary air
Primary air
Stoichiometric combustion air
Adjusting air
Axial/external air
Twist /swirl air
Central air
Further flame-shaping air
………………..
Burner air
Conveying air
Conveying air for annular fuel channel
Conveying air for fuel pipe
Further conveying air
……………………….

Chapter 3
88 State of the art of the co-incineration of waste-derived fuels and raw materials in clinker/cement plants
Table 3.15: Classification of rotary kiln burners with photos or schemes of the burner tips, based on [Emberger/Hoenig, 2011]; twist as a synonym to swirl
Type Burner concept Channel arrangement
Burner system (examples) with photos/schemes of burner tips
2E Burner air split on axial and twist air; fuel channel outside of twist air
Axial- fuel- twist
Pyro-Jetand Pyrostream (KHD) - see photo, Turbu-Jet (FCT Combustion)
2EC Burner air split on axial, twist and central air; fuel channel outside of twist air
Axial- fuel-
twist- central
Multi-channel-burner (Rockteq Int.) –see photo
2IC Burner air split on axial, twist and central air; fuel channel within twist air
Axial- twist- fuel-
central
Flexiflame (Greco Combustion System), Rotaflam (Pillard) – see photo
1I
One burner air stream (adjusting air); fuel channel within twist-generation air stream
Adjusting- fuel
Duoflex (FLSmidth)- see photo
1IC Burner air split on adjusting and central air; fuel channel within twist-generating air
Adjusting- Fuel-
central
For three conventional fuels and three waste-derived fuels (M.A.S. – Unitherm Cemcon) –see photo
1E
One burner air stream (adjusting air), fuel channel outside of the twist-generating air
Fuel- adjusting
Polflame (Polysius) – see scheme
Cooling air
channels
Jet nozzles
Concentrical
coal dust
nozzles
Alternative
fuels
channels
Ignition burner
Flame
monitor
Flame
monitor
Nozzle air,
natural gas
Oil,
secondary
fuels
Coal dust
channel,
cooling air

Chapter 3
State of the art of the co-incineration of waste-derived fuels and raw materials in clinker/cement plants
89
The type designation of a burner comprises a combination of numbers and letters. The first digit is a number which indicates the distribution of the largest part of burner air across flame-controlling air streams, which significantly contribute to flame shape. A “1” stands for a burner with adjusting air and a “2” stands for a burner with axial and twist air conveyance. The second digit describes the relative position of the coal channel (the channel which could be used as a coal channel as there are already cases where 100 % waste-derived fuels are dosed and so, no coal is injected anymore but could be when necessary) to the twist-generating air stream. With “I” (internal), the coal supply is within the twist-generating air stream, with “E” (external), the coal channel is arranged outside. The third digit is optional; if central air is used for flame shaping, this is marked with a “C” (central) [Emberger/Hoenig, 2011]. 3.3.5.4 Influence of the axial momentum flow on CO and NOx formation
A research project was undertaken on the impact on CO and NOx emissions of substitution rates of conventional fuels by fluff (a mixture of shredded paper, plastics and foils, textiles and rubber, also containing metallic and mineral impurities [Wirthwein/Emberger, 2010] by up to over 50 %. The study revealed very high CO concentrations in the kiln inlet at low swirl (up to 4000 mg/m3 – see Figure 3.80) and significantly lower values at high swirl but values up to 2000 mg/m3 were still detected (Figure 3.81). The maximum carbon monoxide concentration decreases as the axial momentum flow increases. The dispersion concentration is lower if the flame is heavily swirled, in contrast to a slightly swirled flame. At higher momentums, the mixing of secondary air is better and thus the oxygen availability in the hot reaction zone is higher [VDZ, 2007].
Figure 3.80: Carbon monoxide (CO) concentration in the kiln inlet gas in relation to the burner’s axial momentum flow at two different swirl adjustments [VDZ, 2007; Wirthwein/Emberger, 2010]
As a consequence, CO is decreased but NOx increases by a high swirl (Figure 3.81). So, a heavily swirled flame apparently leads more to carbon monoxide oxidation than a slightly swirled one. A high swirl stabilizes the flame, making it less sensitive to operational variations. Nevertheless, comparatively high carbon monoxide concentrations can occur.
4.0 4.5 5.0 5.5 6.0 6.5
Axial momentum flow [N/MW]
CO
co
nc
en
tra
tio
nin
[m
g C
O/m
3]
Low swirl
High swirl

Chapter 3
90 State of the art of the co-incineration of waste-derived fuels and raw materials in clinker/cement plants
Figure 3.81: Nitrogen oxides (NOx) concentration in the kiln inlet gas in relation to the burner’s axial momentum flow at two different swirl adjustments [VDZ, 2007]
Against this background, it has to be noted that high substitution rates in the rotary kiln burner (i.e. high percentages of waste-derived fuels of more than 50 %) cool flame temperatures in the near burner region and shift the maximum temperature away from the burner tip. A higher flame swirl can compensate the undesired effects of waste-derived fuel firing. The high variation of calorific values and the heterogeneity of combustion characteristics of fluff destabilise the flame, thus lowering the burnout of this waste-derived fuel and boosting the carbon monoxide formation. As indicated, in such cases, increasing the flame swirl restabilises the flame and intensifies the combustion. Flame thermography and analyses of the kiln inlet gases are powerful tools to evaluate the impacts of waste-derived fuel co-firing on flame and kiln operation [VDZ, 2007; Wirthwein/Emberger, 2010]. 3.3.5.5 Conclusions
Multi-fuel burners are essential for increasing the use of waste-derived fuels via the rotary kiln firing system (main burner). Thereby, the adequate pretreatment of the waste-derived fuels (small and defined particle distribution etc.) and the optimal adjustment of these burners is key to optimise the complete combustion of the wastes.
4.0 4.5 5.0 5.5 6.0 6.5
Axial momentum flow [N/MW]
NO
xc
on
ce
ntr
ati
on
in [
mg
NO
/m3]
Low swirl
High swirl

Chapter 3
State of the art of the co-incineration of waste-derived fuels and raw materials in clinker/cement plants
91
4 ENVIRONMENTAL RELEVANCE OF THE INPUT AND OUTPUT MASS STREAMS
4.1 Introduction
The economic system is associated with huge input and output mass streams (Figure 4.1). Naturally available resources, such as mineral oil, natural gas, metal ores, limestone, clay, marl, gravel etc. are extracted from global reserves and processed through manifold industrial processes to produce products used by industries, agriculture, forestry and fishing sectors and directly by consumers. At all stages of the system, water and energy in form of primary fuels and electricity (to produce and to consume the products as well as for all transport activities) are used, and this is associated with greenhouse gas and waste water emissions. Solid wastes are also generated at all stages, and may be partly reused, recycled, recovered, incinerated and/or disposed of in landfills. Due to the subject of this document, the scheme contains the option to use wastes to produce waste-derived raw materials and fuels for cement plants. The waste-derived raw materials and fuels can be obtained from municipal and commercial waste but also from industrial activities, e.g. from the chemical industry, ferrous metal processing industry, paper industry, surface treatment industries, food processing industries and many others. Based on the input/output approach of cement plants as indicated in Figure 1.1, the relevant input and output mass streams are evaluated and characterised in this chapter. First, they are illustrated by three Sankey diagrams derived from different sources to provide an overview and to generate a feeling for the absolute quantities. For instance, the absolute masses of emissions to air are compared with the mass quantities of raw materials and fuels consumed as well as of the clinker produced. Emission masses to air are very small with the exception of carbon dioxide which is released in large quantities from the calcinations process. The emissions to air are nevertheless important and will therefore be described in detail for all the different parameters for which data are available. As the use of wastes, i.e. waste-derived raw materials and waste-derived fuels, is often associated with higher emissions to air, they are also described in more detail. Further, non-volatile heavy metals from input materials (natural raw materials and conventional fuels as well as waste-derived raw materials and waste-derived fuels) are mainly incorporated into the clinker. Therefore, the additional contamination of the product due to the use of waste-derived raw materials and fuels is highlighted.

Chapter 4
92 State of the art of the co-incineration of waste-derived fuels and raw materials in clinker/cement plants
Figure 4.1: Scheme for the principle mass streams of the economic system with the indication of the option to recycle waste-derived raw mat. and fuels to cement plants
Chemical
industry
Energy
industries
Natural resources
(mining and quarrying
Production and
processing of
metals
oil, gas, coal, metal ores, lime-
stone, clay, marl, gravel, etc.
Manufacturing
industries
products / auxiliariesTrade/retail
fertilisers, pesticides,
pharmaceuticals etc.
raw
materials
Mineral industry,
e.g. cement plants
agriculture / forestry / fishing
consumer
products
products
primary energy
and electricity
for all stages
Waste management (reuse, recycling, recovery,
incineration, other disposal)
Waste water collection
and treatment (municipal
and industrial)
natural waters
products
products
Ground and
surface water
Transport
activities
at all parts
productsone
option
Waste-derived raw
materials and fuels
discharge
households and other
consumers (hotels,
canteens, public
administrations,
hospitals, schools,
universities etc.)

Chapter 4
State of the art of the co-incineration of waste-derived fuels and raw materials in clinker/cement plants
93
4.2 Sankey diagrams for clinker production
One of the best approaches to start to understand the environmental relevance of industrial processes is to have a clear picture of the input and output mass streams preferably as Sankey diagrams [Schmidt, 2006]. Based on this picture, the input and output mass streams can be analysed in detail. Figure 4.2 illustrates the mass balance of the clinker production of a cement works.
Figure 4.2: Sankey diagram of clinker production, based on the mass balance in [EC BREF CLM, 2010]
In this case, the air input is also considered. Surprisingly, the mass of air input is about twice as high as the raw materials input. As a consequence, the emissions to air also dominate the output whereas molecular nitrogen is most followed by carbon dioxide, oxygen and water vapour; in comparison to these emissions, emissions to air such as dust, SO2, NOx and others are very low. Nevertheless, they are of environmental relevance. As the air output is so high, the percentage of clinker only represents 20 %. An exact mass balance with fully equal input and output quantities is only possible when the air input and output is taken into account and the uncertainties of the measurements are ignored. But most of the nitrogen and oxygen in the air input are emitted unchanged and thus, the Sankey diagram can be considered to give a distorted picture. So, there are mass balances without their consideration. Figure 4.3 provides one of the very few available examples.
Raw materials
Water
Air
Pet coke
Clinker
CO2
N2
H2O
O2From
raw
mater.
From
fuels

Chapter 4
94 State of the art of the co-incineration of waste-derived fuels and raw materials in clinker/cement plants
Figure 4.3: Sankey diagram of the clinker production of the cement works Cemex Ost in Rüdersdorf/Germany for 2008, based on published input/output data [CEMEX, 2009]
Now, the raw materials input and consequently, the cement and clinker (both are sold) output dominate the mass balance. Concerning the emissions to air, without consideration of nitrogen and oxygen, the carbon dioxide emissions clearly dominate. Compared to them, the other emissions to air (dust, SO2, NOx and others) are low. As already indicated, the input is not fully equal to the output. The same approach was made for the input/output of all cement works in Germany (Figure 4.4).
Lime
rock
Sand
Ash
Blast furnace slagIron ore, mineral
residues, CaF2
Sulphate input
Alternative fuels
Lignite
Animal meal and
sewage sludge
from raw
materials
CO2
from
fuels
Cement
Clinker
Lime rock meal

Chapter 4
State of the art of the co-incineration of waste-derived fuels and raw materials in clinker/cement plants
95
Figure 4.4: Sankey diagram for the clinker production of all cement works in Germany in 2010, based on published input/output data [VDZ, 2011]
As expected, the gap between input and output is greater but the resulting mass balance is adequate to illustrate the situation in principle. In this diagram, the water content of the waste gas is significant. Data for water vapour emissions were not available for the previous Figure (see Figure 4.4 above). Due to the decarbonation reaction of calcium carbonate (see Chapter 3.2.2), the emission of raw materials-derived carbon dioxide is greater than the emission of carbon dioxide originating from fuel combustion.
4.3 Input mass streams
4.3.1 Raw materials
4.3.1.1 Natural raw materials
The natural raw materials used for cement production primarily contain the main elements calcium, silicium and aluminium (see Chapter 3.2.4.1). Naturally occurring calcareous deposits, such as limestone, marl or chalk, provide the source for calcium, mainly as calcium carbonate. Silicium is mainly available as silicium oxide (silica) in sand but also in clay. Aluminium is provided in form of its oxides (alumina) with bauxite and clay. Further, iron, as a minor element, is added with iron ores. In order to obtain nearly all of the natural raw materials, mining and quarrying operations are required. The materials are most often obtained from open surface quarries. The operations necessary include rock drilling, blasting, excavation, hauling and crushing. The main raw materials, like limestone, chalk, marl and shale or clay, are extracted from quarries. In most cases, the quarry is close to the plant. After primary crushing, the raw materials are transported
from raw
materials
CO2
from
fossil
fuels
H2O
from
altern.
fuels
Lime stone,
marl and
chalk
Clay
Sulphate input
Alternative fuels
Fossil fuels
Sand
Oil shale
Clinker
gap of the
input/output

Chapter 4
96 State of the art of the co-incineration of waste-derived fuels and raw materials in clinker/cement plants
to the cement plant for storage and further preparation. Other raw materials, such as bauxite, iron ore, blast furnace slag or foundry sand, are brought in from elsewhere [EC BREF CLM, 2010]. Raw materials must have certain chemical characteristics which are necessary for the clinker burning process, and which may affect the production process and clinker quality. Table 4.1 shows example ranges of the characteristics of natural raw materials and the raw meal used for the production of clinker; it also contains fly ash which is a waste-derived raw material (see Chapter 4.3.1.2). The focus of this compilation is limited to inorganic compounds, and excludes traces of organic compounds as described in Chapter 3.3.1.2.1. Apart from the main components, these raw materials also contain a number of metals that are listed in Table 4.2 and Table 4.3. Thereby, Table 4.3 contains some more individual natural raw materials and conventional fuels and also the heavy metal content of the clinker, the Portland cement and the blast furnace cement.
Table 4.1: Chemical analyses of raw materials and cement raw meal for the production of cement clinker, [EC BREF CLM, 2010]
Components
Limestone,
lime marl,
chalk
Clay Sand PFA2)
Fe
source
Raw
meal
(weight-%)
SiO2 0.5 – 50 33 – 78 80 – 99 40 – 60 0.5 – 30 12 – 16
Al2O3 0.1 – 20 7 – 30 0.5 – 7 20 – 30 0.2 – 4 2 – 5
Fe2O3 0.2 – 5.9 4.0 – 15 0.0 – 4 5 – 15 50 – 93 1.5 – 2.5
Mn2O3 0.02 – 0.15 0.090 0.051 0.127 0.1 – 4 0.0 – 0.5
Fe2O3 and Mn2O3 0.1 – 10 2 – 15 0.5 – 2 19 – 95 <2
CaO 20 – 55 0.2 – 25 0.1 – 3 2 – 10 0.1 – 34 40 – 45
MgO 0.2 – 6 0.3 – 5 0.3 – 0.5 1.0 – 3 0.5 – 7 0.3 – 5
K2O 0 – 3.5 0.4 – 5 0.2 – 3 1 – 5 0.1 – 1 0.1– 1.5
Na2O 0.0 – 1.5 0.1 – 1.5 0.0 – 1 0.2 – 1.5 0.1 – 1 0.1 – 0.5
SO31)
0.0 – 0.7 0.0 – 4 0.0 – 0.5 0.0 – 1 0 – 3 0 – 1.5
Cl 0.0 – 0.6 0.0 – 1 Traces 0.0 – 0.5 0.0 – 0.3
TiO2 0.0 – 0.7 0.2 – 1.8 0.0 – 0.5 0.5 – 1.5 0.0 – 3 0.0 – 0.5
P2O5 0.0 – 0.8 0.0 – 1.0 0.0 – 0.1 0.5 – 1.5 0.0 – 1 0.0 – 0.8
ZrO2 0.02
CaCO3 96
Loss on ignition
(CO2 + H2O), LOI 9503)
2 – 44 1 – 20 <5 6.74 0.1 – 30 32 – 36
1) Total content of sulphur, expressed as SO3 2) Pulverised fly ash 3) LOI 950 = loss on ignition at 950 °C

Chapter 4
State of the art of the co-incineration of waste-derived fuels and raw materials in clinker/cement plants
97
Table 4.2: Heavy metals in raw materials, raw meal as well as in hard coal and lignite, [EC BREF CLM, 2010]
Clay and argillite Limestone, marl
and chalk Raw meal Hard coal/lignite
Antimony Sb No data available 1 – 3 <3 0.4 – 2
Arsenic As 13 – 23 0.2 – 20 1 – 20 1 – 50
Beryllium Be 2 – 4 0.05 – 2 0.1 – 2.5 <0.1 – 3.3
Lead Pb 10 – 40 0.3 – 21 4 – 25 1.5 – 273
Cadmium Cd 0.02 – 0.3 0.04 – 0.7 0.04 – 1 <0.1 – 10
Chromium Cr 20 – 109 1.2 – 21 10 – 40 1.5 – 81
Cobalt Co 10 – 20 0.5 – 5 3 – 10 <1 – 40
Copper Cu No data available 3 – 12 6 – 60 1 – 100
Manganese Mn No data available < 250 100 – 360 82 – 250
Nickel Ni 11 – 70 1.5 – 21 10 – 35 <1 – 100
Mercury Hg 0.02 – 0.15 <0.01 – 0.13 0.01 – 0.5 0.1 – 3.3
Selenium Se No data available 1 – 10 <10 0.6 – 2
Tellurium Te No data available <4 <4 0.2 – 1
Thallium Tl 0.7 – 1.6 0.05 – 1.6 0.11 – 3 0.1 – 5.5
Vanadium V 98 – 170 4 – 80 20 – 102 1 – 200
Tin Sn No data available <1 – 5 <10 0.8 – 2.3
Zinc Zn 59 – 115 10 – 40 20 – 47 6 – 220
Elements
1) dm: dry matter
mg/kg dm 1)

Chapter 4
98 State of the art of the co-incineration of waste-derived fuels and raw materials in clinker/cement plants
Table 4.3: Heavy metals in raw materials, the raw meal, conventional fuels as well as in the clinker, the Portland cement and blast furnace cement, [FZKA, 2003] Legend: Min: minimum value; Max: maximum value; AV: average value
As Be Cd Co Cr Cu Hg Mn Ni Pb Sb Se Sn Te Tl V Zn
Min 0.1 0.01 0.02 0.1 0.5 5 0.005 250 1.4 0.27 0.2 0.4 0.9 0.05 5 0.1
Max 15 12 2 7 184 57 0.1 3300 131 151 27 30 24 3 80 229
Av 0.3 0.3 0.2 3 14 11 0.04 500 18 18 1 0.6 4 0.7 0.3 26 40
Min 0.2 0.02 1.2 4.9 0.005 1.5 0.3 0.05 22
Max 12 1 0.5 28 71 35 0.1 3300 57 57 27 24 0.68 49 79
Av 6 0.5 0.3 5 28 12 0.03 360 16 12 4 1 3 1 0.6 20 48
Min 2 1 0.01 6 15 10 0.01 7 1 0.5 1.6 0.1 30 2
Max 100 7 1 25 260 285 0.5 2500 236 219 13 2.5 30 1.6 300 304
Av 14 3 0.2 20 85 43 0.2 600 63 25 2 0.6 5 0.5 0.5 130 78
Min 0.4 0.6 0.01 0.3 1 1.2 0.01 46 1 0.7 0.3 1.8 0.05 2 42
Max 42 1.5 1 37 220 85 1 2040 73 70 12 40 1 240 112
Av 11 1 0.2 11 19 10 0.02 194 13 10 7 1 3 0.5 0.2 50 25
Min 2 0.8 0.02 109 8 900 5 4 0.1 10 24
Max 1200 2 15 183 1400 1 1200 815 8700 500 13 400 690 9400
Av 37 1 8 144 495 1520 0.5 1090 331 350 26 8 25 10 2 256 3288
Min 1 0 0.01 0.5 1 0.3 0.01 5 1 5 0.05 < 0.01 1.3 0.2 0.1 10 4.5
Max 200 8 10 43 260 60 3 356 110 270 5 6 7.8 5 5 250 405
Av 9 1.4 1 9 14 18 0.3 58 23 27 1 2 4 2 1 39 63
Min 0.1 0.04 0.06 0.5 0.9 0.4 0.01 50 0.6 0.7 0.04 0.4 0.5 0.1 0.05 0.1 1
Max 12 0.6 2.4 4.2 20 15 0.7 160 29 34 2.5 25 15 10 0.4 84 70
Av 0.8 0.2 0.2 1 3.6 1.8 0.2 77 3 3 0.8 2.6 4 3 0.1 10 10
As Be Cd Co Cr Cu Hg Mn Ni Pb Sb Se Sn Te Tl V Zn
Min 1.6 0.1 0.03 3 29 5 0.008 50 12 1.7 0.1 0.7 2 0.1 0.1 6
Max 28 2.5 1.1 14 59 19 1 500 38 96 2.3 30 10 10 12 120
Av 9 1 0.3 7 30 14 0.06 236 20 14 0.7 1.3 3 1 0.5 37
Min 2 0.2 0.01 6 10 5 0.001 218 10 1 0.1 0.2 1 0.2 0.01 10 29
Max 87 2 4 48 422 136 1.2 526 397 105 17 20 36 1 10 136 600
Av 9 1.4 1 13 66 38 0.1 400 38 24 5 4 13 0.6 0.5 57 113
Min 2 0.2 0.03 3 25 14 0.02 107 14 5 0.5 0.02 15 21
Max 117 1.6 6 21 712 98 0.5 3901 97 254 18 14 4.1 144 679
Av 8 1 0.6 11 68 38 0.3 606 45 27 5 3 0.6 74 164
Min 0.8 0.1 0.2 19 5 4 1 62 5
Max 15 1 18 246 160 53 136 444 245
Av 6 3 0.5 6 50 13 0.1 17 13 5 0.5 113 122
Raw meal
Blast
furnace
cement
Clinker
Portland
Cement
Hard coal
Lignite
Limestone
Marl
Clay
Sand
Iron ore

Chapter 4
State of the art of the co-incineration of waste-derived fuels and raw materials in clinker/cement plants
99
Concerning volatile and highly-volatile heavy metals (thallium and mercury respectively), the concentration in the raw material is crucial with respect to their emissions to air. Consequently, their concentrations should be as low as possible. In case of elevated levels and non-availability of other raw materials, certain measures to minimise the emissions of these heavy metals to air should/must be applied. 4.3.1.2 Waste-derived raw materials
Natural raw materials can be replaced by appropriate wastes. In such cases, the wastes are called waste-derived raw materials according to the following definition: “Selected waste and by-products containing useful minerals such as calcium, silica, alumina, and iron can be used as raw materials in the kiln, replacing natural raw materials such as limestone, clay, marl, chalk and others” [based on WBCSD Cement, 2005]. The chemical suitability of waste-derived raw materials is important and they have to provide the constituents required for the production of clinker. Primary desired chemical elements are calcium carbonate, silica, alumina and iron as well as sulphur, alkalis and others which can be classified into different groups according to their chemical composition. The use of waste-derived raw materials in the clinker burning process can also involve the substitution of sulphur and its oxides [EC BREF CLM, 2010]. Table 4.4 compiles the most important natural and waste-derived raw materials used in the German clinker production plants. From the quantity point of view, only granulated blast furnace slag is really of significance followed by fly ash, gypsum from flue gas desulphurization and oil shale. Figure 4.5 indicates the relatively low percentage of waste-derived to natural raw materials. In 2011, the percentage was 14.1 %, and of this 80 % comprises granulated blast furnace slag. Thus, without the blast furnace slag, the percentage of waste-derived raw materials would only be 2.9 %. In the past 13 years, the percentage of waste-derived raw materials increased from 11.8% in 1998 to the mentioned 14.1 % in 2011 (Figure 4.5). This increase of 21 % is not very high. It will be shown that, in contrast, the percentage of waste-derived fuels grew much more strongly over the same period.

Chapter 4
100 State of the art of the co-incineration of waste-derived fuels and raw materials in clinker/cement plants
Table 4.4: Natural and waste-derived raw materials used in the German cement industry in 2010, based on [VDZ, 2011]
Group Natural and waste-derived raw materials - significant examples Quantity 2010
in 1000 t/yr
Limestone/marl/chalk 37517
Waste-derived raw materials, such as 62
• Lime sludge from drinking water and sewage treatment
• Hydrated lime
• Foam concrete granulates
• Calcium fluoride
Si Sand 1187
Spent foundry sand as a waste-derived raw material 148
Si-Al Clay 436
Bentonite/kaolinite as a waste-derived raw material 41
Fe Iron ore 132
Waste-derived raw materials from the iron and steel industries, such as: 92
• Roasted pyrite
• Contaminated ore
• Iron oxide/fly ash blends
• Dusts from steel plants
• Mill scale
Si–Al–Ca Waste-derived raw materials, such as
Granulated blast furnace slag 5365
Fly ash 316
Oil shale 263
Trass 29
Others, such as: 39
• Paper residuals
• Ashes from incineration processes
• Mineral residuals, e.g. soil contaminated with oil
Al Waste-derived raw materials from the metal industry, such as: 55
• Residues from reprocessing salt slag
• Aluminum hydroxide
S Natural gypsum 620
Natural anhydrite 439
Gypsum from flue gas desulfurisation as a waste-derived raw material 313
total 47054
Ca

Chapter 4
State of the art of the co-incineration of waste-derived fuels and raw materials in clinker/cement plants
101
Figure 4.5: Development of the percentage of natural raw materials for clinker production from 1998 – 2011, related to the total input of raw materials, based on [VDZ, 1999; VDZ, 2000; VDZ, 2001; …;VDZ, 2012]
The more detailed development of the use of waste-derived raw materials from 1998 – 2011 can be seen from Table 4.5. Table 4.5: Quantities of waste-derived raw materials used in German cement plants from 1998 – 2011,
based on [VDZ, 1999; VDZ, 2000; VDZ, 2001: …;VDZ, 2012]
The quantity of waste-derived raw materials containing calcium significantly decreased. Obviously, other recycling options have been identified. Concerning spent foundry sand, the quantities have been
0,0
10,0
20,0
30,0
40,0
50,0
60,0
70,0
80,0
90,0
100,0
1998 1999 2000 2001 2002 2003 2004 2005 2006 2007 2008 2009 2010 2011
Pe
rce
nta
ge o
f alt
ern
ativ
e ra
w m
ate
rial
s in
[-%
]
Percentage of alternative raw materials from 1998 - 2011
1998 1999 2000 2001 2002 2003 2004 2005 2006 2007 2008 2009 2010 2011
Group Waste-derived raw material - significant examples
Ca Calcium input materials 180 117 264 396 267 283 101 97 95 118 82 64 62 51
• Lime sludge from drinking water and sewage treatment
• Hydrated lime
• Foam concrete granulates
• Calcium fluoride
Si Silicium input material
Spent foundry sand 100 140 137 111 135 148 151 117 149 164 151 101 148 159
Si-Al Calcium/aluminium input materials
Bentonite/kaolinite 44 40 47 41 36 41 49 41 43 48 35 47 41 39
Residues from coal processing 20 24 22 15 2 4 3 4 3
Fe Iron input materials from the iron and steel industries, such as: 170 170 321 198 152 131 93 111 137 128 149 110 92 106
• Roasted pyrite
• Contaminated ore
• Iron oxide/fly ash blends
• Dusts from steel plants
• Mill scale
Si–Al–Ca Silicium/aluminium/calcium input materials
Granulated blast furnace slag 4600 4900 5200 4650 4650 4760 5110 5001 6400 6602 6430 4480 5365 5844
Fly ash 390 300 329 322 327 325 378 348 392 387 456 311 316 321
Oil shale 340 356 220 186 181 149 164 195 313 233 227 230 263 168
Trass 90 97 83 67 60 59 34 33 32 28 29 25 29 38
Other waste-derived Si-Al-Ca input materials such as: 300 443 354 247 229 234 170 173 107 91 3 50 39 21
• Paper residuals
• Ashes from incineration processes
• Mineral residuals, e.g. soil contaminated with oil
Al Aluminium input materials from the metal industry, such as: 22 43 40 43 66 76 60 70 57 62 51 47 55 75
• Residues from reprocessing salt slag
• Aluminum hydroxide
S Sulphur input materials
Gypsum from flue gas desulfurisation 420 420 420 391 390 426 428 398 415 389 345 310 313 350
Other gypsum from the chemical and ceramic industry 29 30 4 20 8
F Fluorine input material
CaF2- / fluorine-containing residues 43

Chapter 4
102 State of the art of the co-incineration of waste-derived fuels and raw materials in clinker/cement plants
stable over the past ten years. The same is true for bentonite/kaolinite residues whereas nowadays, the residues from coal processing are used elsewhere. Concerning iron-containing waste-derived raw materials, the used quantities also decreased in the past years. With respect to granulated blast furnace slag, fly ash and oil shale, the quantities are stable whereas those of other waste-derived raw materials containing silicium, aluminium and calcium (trass and the sum of paper residuals, ashes from incineration processes and mineral residues) significantly decreased. For aluminium-containing waste-derived raw materials, the quantities used have remained relatively constant. For gypsum as a sulphur-containing waste-derived raw material, the quantities have decreased but are still significant, whereas the use of gypsum from the chemical and ceramic industry ended in 2003. For waste-derived raw materials, detailed analysis of the heavy metal content of the different materials are available (Table 4.6). However, this is not the case for the countless organic contaminants which are also present in various waste-derived raw materials. Table 4.6: Heavy metal content of various waste-derived raw materials, [FZKA, 2003] Legend: Min: minimum value; Max: maximum value; AV: average value
Other waste materials are supplied as so-called ‘inter-ground’ additions to the grinding plants. Fly ash can be used both as waste-derived raw material in the production of clinker (mainly for its content of alumina) as well as an inter-ground addition for cement. Fly ash can replace up to 50 % of the Portland cement clinker; however, attention has to be paid to mercury which may be present in quantities relevant for the environment [EC BREF CLM, 2010]. The wastes used as raw materials enter the clinker burning process or the calciner via the raw meal path or via the kiln inlet and/or the calciner. During the preheating phase in the preheater, organic components may be released from the kiln feed, because of lower temperatures, which are not always sufficient to fully decompose them [EC BREF CLM, 2010]. When processing waste-derived raw materials, these must be checked for potential emissions of volatile organic constituents and the feed point selected. For this purpose, it is best to use the expulsion test as described in Chapter 3.3.1.2.2. In case of certain wastes, such as industrial sludges, spent foundry sand and road debris, it is important to analyse for individual compounds, such as benzene and other organic compounds (e.g. by GC-MS – see Chapter 3.3.1.2.3), in addition to the sum of VOC. Spent foundry sand with a high volatile content, for example, should be fed to the kiln inlet and not via the raw meal route. The residual organic binder used in chemically bonded sand cast systems can be decomposed in the preheater. To summarise, the following requirements are to be considered in the selection and use of waste-derived raw materials:
As Be Cd Co Cr Cu Hg Mn Ni Pb Sb Se Sn Te Tl V Zn
Min 0.5 0.05 1 5 0.03 1 1 0.1 3
Max 10 3 2 150 650 200 4.4 300 200 1 1 50 4.4 200 353
Av 3 2 0.3 90 290 28 0.3 92 62 0.8 0.8 40 0.5 50 75
Min 0.2 0.02 0.03 0.02 1 0.3 0.06 0.3 0.2 0.1 0.6 0.1 1 1
Max 3.5 0.9 2.3 3.9 27.3 12.8 1.3 14.5 20.5 17 17 1 27.8 59
Av 1.5 0.2 0.15 1 8.8 7 0.1 5.5 7 0.8 0.8 0.3 13.5 19
Min 0.01 2 1 2 0.01 1000 1 1 0.2 1
Max 1 1 8 75 10 1 8000 10 21 2 1 50 280
Av 0.8 0.7 4 25 5.2 0.6 3500 5 6 2 1.5 5 0.7 30 38
Min 3 0.05 20 26 0.05 10 0.1 85
Max 37 3 117 95 0.3 50 7 270
Av 10 1.5 60 60 0.2 38 2 190
Min 0.5 0.2 0.11 2.3 36 4.4 0.003 60 6.8 4.7 1 8.9 0.1 0.5 1 5
Max 42 3.6 2.3 15 450 110 1.4 285 240 200 2.5 10 15 10 2.6 64 470
Av 6.6 1.3 0.6 5.5 190 32 0.3 110 23 25 2 1 12 1 0.7 2.3 94
Min 5 5 0.2 11.7 29 41.6 0.04 71 26 7 1 0.7 6 0.2 122 51
Max 321 40 34 101 330 652 2.4 1180 600 800 37 35 64 29 940 1200
Av 79 15 2.6 74 172 247 0.3 484 196 257 14 8 10 1.6 4 345 504
Coal fly ash
Spent foundry
sand
Gypsum/ anhydrite
- also containing
gypsum from flue gas
desulfurisation
Blast furncae slag
Oil shale
Ash from burning
processes;
~ bottom ash from
lignite

Chapter 4
State of the art of the co-incineration of waste-derived fuels and raw materials in clinker/cement plants
103
the waste-derived raw material waste consists primarily of the clinker components;
the concentration of volatile and highly-volatile heavy metals (thallium and mercury respectively) have to be taken into account;
frequent monitoring of waste-derived raw materials by representative sampling and analysis (including the expulsion test as described in Chapter 3.3.1.2.2) determining VOC as well as relevant individual organic compounds and heavy metals.
4.3.2 Fuels and electricity
4.3.2.1 Energy consumption of clinker production plants
4.3.2.1.1 Thermal energy demand of clinker production
Clinker production requires considerable thermal energy quantities. There are exothermic and endothermic reactions which are compiled in Table 4.7. The overall balance is positive and thus energy input is required. Most of the energy is required for the calcinations of calcium carbonate and to heat the raw meal up to about 1450 °C; for both of these processes about 2000 kJ/kg clinker are required whereas the most relevant exothermic processes are the cooling of the clinker (about 1400 kJ/kg clinker) and the cooling of the carbon dioxide released from the sodium carbonate (about 500 kJ/kg clinker). The overall balance is equal to the theoretical energy demand which is the reaction enthalpy, related to 20 °C and to 1 kg of clinker, required to form the clinker from the raw meal dried at 100 °C. The theoretical thermal energy demand varies between 1590 - 1840 kJ/kg clinker [EC BREF CLM, 2010; Locher, 2000] and is 1765 kJ/kg clinker for the example given in the Table below. Table 4.7: Theoretical thermal energy demand and release from reactions and processes of clinker
production, based on [Locher, 2000]
However, the real thermal energy demand is significantly higher as energy is also consumed for water evaporation and to compensate for losses via radiation from the preheater, kiln and clinker cooler, via the waste gas, the cooler off-gas, the waste gas of the chlorine bypass (where existing) and the clinker. The real consumption for the different types of processes is compiled in Table 4.8. The numbers from different sources are similar. The various basic production processes mentioned in
Process
Theoretical
energy demand
in [kJ/kg cli]
Location where
the process
mainly takes
place
Endothermic processesBreak-down of aluminosilicates (clay) 170 preheater
Decomposition of calcium carbonate (calcination) 1990 preheater
Melting heat 105 kiln
Heating the kiln meal up to about 1450 °C 2050 preheater / kiln
total 4315
Exothermic processesCrystallisation of aluminosilicates (clay) 40 preheater
Formation of clinker minerals 420 kiln
Crystallisation of the melt 105 kiln
Clinker cooling 1400 kiln
Cooling of the carbon dioxide from calcination 500 preheater
Cooling of the water vapour 85 preheater
total 2550
Overall balance of the theoretical energy demand 1765

Chapter 4
104 State of the art of the co-incineration of waste-derived fuels and raw materials in clinker/cement plants
the Table also represent developments over the past fifty years. This development is visualised in Figure. Table 4.8: Real clinker-specific energy demand for cement plants according to different sources
Figure 4.6: The clinker-specific energy demand of different clinker production processes developed over the past fifty years
Figure 4.6 also indicates that the reduction of the thermal energy consumption was greatest when shifting from the wet and semi-wet processes to the semi-dry and dry systems. Thus, additional major improvements cannot be expected, but certainly further incremental reductions in the energy demand are likely. The potential to further reduce the energy consumption is 300 – 450 kJ/kg clinker and comprises the following measures [Waltisberg, 2012]:
- additional preheater stage - improvement of the existing preheater - optimisation of the oxygen content of the exhaust gases in the kiln inlet and after the
precalciner - minimisation of leak air in the kiln inlet and of the precalciner - minimisation of leak air at the main burner - optimisation of the grate cooler and the heat recovery from the clinker cooling air - optimisation of air supply for the main burner
[Locher, 2002;
VDI 2094, 2003]
[BREF CLM, 2010] [Waltisberg, 2012] average values
from about 150
plants worldwide
[kJ/kg clinker] [kJ/kg clinker] [kJ/kg clinker] [kJ/kg clinker]
Wet kiln 5000 - 6000 5000 - 6400 5000 - 7000
Semi-wet kiln up to 5000 3500 - 4500
Semi-dry kiln
(Lepol kiln)3100 - 3800 3300 - 5400 3300 - 3700
4-stage cyclone
preheater kiln3000 - 3800 3100 - 4200 3100 - 3600 3510
5-stage cyclone
preheater kiln
with precalciner
3000 - <4000 2900 - 3500 3250
8000
7000
6000
5000
1000
4000
3000
2000
0
wet kiln semi-wet kiln
4-stage preheater
kiln
semi-dry kiln
5-stage preheaterkiln with calciner
before the 1960ies
201x
.
.

Chapter 4
State of the art of the co-incineration of waste-derived fuels and raw materials in clinker/cement plants
105
- optimisation of the kiln operation to minimise shut-downs, to minimise the carbon monoxide content in the exhaust gas, to have precise and stable raw meal feeding, stable flame conditions, a minimised off-gas flow in the chlorine bypass, where existing, and a constantly stable free lime content in the clinker.
Figure 4.7 shows the detailed development of the thermal energy consumption over the past sixty years from 1950 – 2011. It is notable that for the past 10 years, a stagnation and even a slight increase has been observed, which will be evaluated in Chapter 4.3.2.1.2 below after presenting some more information concerning the thermal energy demand.
Figure 4.7: The development of the clinker-specific thermal energy demand, equal to the specific fuel consumption, of the German cement works from 1950 – 2011, [VDZ, 2012]
For the cyclone preheater kilns with and without precalciners, which are mainly applied nowadays, the clinker-specific thermal energy demand is influenced by the following parameters [EC BREF CLM, 2010; Klein/Hoenig, 2006]: - Plant capacity and design - three to six cyclone stages - precalciner - tertiary air - compound operation of the mill - length to diameter ratio of the kiln - type of clinker cooler - actual throughput of the kiln - moisture content of raw materials and fuels - raw material properties, such as burnability - specific net calorific value of the fuels - type of clinker produced - homogenizing and precise metering of kiln feed material and fuels - optimisation of process control including flame cooling - bypass rate In principle, the addition of one stage to the preheater reduces the energy consumption by about 100 kJ/kg [Klein/Hoenig, 2006]. However, the off-gas leaving the preheater must contain sufficient energy to dry the raw meal. Consequently, the raw material moisture mainly determines the suitable number
0
1000
2000
3000
4000
5000
6000
7000
8000
9000
1950
1952
1954
1956
1958
1960
1962
1964
1966
1968
1970
1972
1974
1976
1978
1980
1982
1984
1986
1988
1990
1992
1994
1996
1998
2000
2002
2004
2006
2008
2010
spec
. fu
el c
on
sum
pti
on
in [k
J/kg
clin
ker]
Specific fuel consumption for clinker production in Germany from 1951 - 2011

Chapter 4
106 State of the art of the co-incineration of waste-derived fuels and raw materials in clinker/cement plants
of stages of the cyclone preheater [Klein/Hoenig, 2006]. Therefore, the thermal energy demand also depends on the moisture of the raw materials and raw meal, respectively. Figure 4.8 shows an example concerned. It also indicates, that there is a significant difference between the results of kiln energy performance test carried out for a few days and the specific consumption on an annual basis. The difference has been reported to be 160 – 320 kJ/kg clinker [Klein/Hoenig, 2006; Schneider et al., 2011] but this conclusion should be considered with care as it was drawn with the motivation to demonstrate that the thermal energy demand of 3000 kJ/kg clinker mentioned in the Best Available Techniques Reference Document from 2001 is not achievable [EC BREF CL, 2001]. The difference is due to start-up and shut-down operations but also due to the water and ask content of waste-derived fuels, the lower net calorific value of a number of waste-derived fuels and the chlorine bypass, where existing. This will also be explained in Chapter 4.3.2.1.2 below.
Figure 4.8: Factors influencing the specific thermal energy demand of clinker production kilns, [Klein/Hoenig, 2006; Schneider et al., 2001]
4.3.2.1.2 Impact of waste-derived fuels on the thermal energy demand
As shown in Figure 4.7, the energy efficiency of cement clinker plants significantly improved from 1950 to 2000. However, looking more in detail at the period 1990 – 2011 (Figure 4.9), it reveals that between 1998 and 2010, the specific energy consumption increased by 10.7 %. This is due to the consumption of waste-derived fuels having higher water and ash contents and, true for a number of waste-derived fuels, lower net calorific values compared to conventional fuels.
Th
erm
al e
ne
rgy
de
ma
nd
in [k
J/k
g c
lin
ke
r]
Raw material moisture in weight-% (no. of cyclone stages)
160 – 320 kJ/kg clinker
due to plant utilisationand kiln operation
Varying energydemand because ofe.g. …
bypass
fuel
properties
plant
capacity
kiln energyperformance test
Minimal annual average
< 6 (6) 6 - 8 (5) 8 - 12 (4) > 12 (3)

Chapter 4
State of the art of the co-incineration of waste-derived fuels and raw materials in clinker/cement plants
107
Figure 4.9: The development of the clinker-specific thermal energy demand, equal to the specific fuel consumption, of the German cement works from 1990 – 2011, [VDZ, 2012]; this graph is part of the graph in Table 4.7 above showing the period from 1950 - 2011
In additional, in many plants for clinker production, chlorine bypasses (see Chapter 3.3.4) have been retrofitted to eliminate the additional chlorine input due to feeding of waste-derived fuels, which also contributes to higher energy consumption. There is an obvious correlation between the increase in specific fuel consumption and the percentage of used waste-derived fuels. This correlation for the period 2003 – 2011 can be seen from Figure 4.10.
Figure 4.10: Correlation of the percentage of waste-derived fuels used and the specific energy consumption for clinker production for German cement works from 2003 – 2011, based on [VDZ, 2004; … ; VDZ, 2012]
Sp
ecific
fue
lco
nsum
ptio
nin
[kJ/k
g c
linke
r]
1990 - 2011
3400
3500
3600
3700
3800
3900
2003 2004 2005 2006 2007 2008 2009 2010 2011
30%
40%
50%
60%
Sp
ec
ific
en
erg
y c
on
su
mp
tio
n
[MJ
/to
nn
e c
lin
ke
r]
pe
rce
nta
ge
of
alt
ern
ati
ve
fu
els
[%
]
Percentage of alternative fuel Energy consumption per tonne

Chapter 4
108 State of the art of the co-incineration of waste-derived fuels and raw materials in clinker/cement plants
This disadvantage was to be expected and has to be balanced against the advantage of the substitution of conventional fuels and the disposal of waste. However, this correlation has not been subject to open technical discussion yet. To foster the understanding of this correlation, four examples are presented do demonstrate the adverse impact, waste-derived fuels can have on the thermal energy demand.
a) Use of sewage sludge This example is based on a real case. In a kiln with a 5-stage cyclone preheater and a precalciner with a production capacity of 3000 t/d and a thermal heat consumption of 3200 kJ/kg clinker, part of the hard coal with a net calorific value of 35,600 kJ/kg are replaced by dried sewage sludge with a residual water content of 10 weight-% and an ash content of 50 weight-% which are representative values (DE Klärschlamm, 2012). The dried sludge has a net calorific value of 12,180 kJ/kg sludge (as dry matter) and is injected via the main burner with a quantity of transport air of 0.6 Nm3/kg sludge. Figure 4.11 illustrates that the sludge does not only contain combustible organic matter (first bar in the chart) but a considerable content of non-combustible components, called ash (second bar) and also residual water content (third bar).
Figure 4.11: Illustration of the parts of dried sewage sludge which lower the net calorific value and increase the thermal energy demand of the clinker production process
Additional energy is required to heat up the ash and to evaporate the residual water. As a consequence, the specific thermal energy demand is increasing depending on the quantity of used sewage sludge. The correlation concerned is shown in Figure 4.12. E.g. at an input of 2000 kg/h, the increase is about 4 % which is considerable. When using non-dried sewage sludge, i.e. only mechanically dewatered sludge, the increase is even bigger as the residual water content then is not about 10 but about 65 – 75 weight-% [DE Klärschlamm, 2012].
Net calorific value in [kJ/kg sewage sludge]
31074
15537
12180
0
Dry and
ash free50 % ash
50 % ash
+ 10 % H2O

Chapter 4
State of the art of the co-incineration of waste-derived fuels and raw materials in clinker/cement plants
109
Figure 4.12: Increase of the thermal energy demand of the clinker production process due to the use of dried sewage sludge
b) Use of lumpy plastic materials This example is also based on a real case. In a kiln with a 4-stage cyclone preheater without precalciner with a production capacity of 4000 t/d and a thermal heat consumption of 3400 kJ/kg clinker, part of the hard coal with a net calorific value of 35,600 kJ/kg are replaced by lumpy plastic materials which is a mixture of polythene which is fed via the secondary firing at a quantity of about 1.5 t/h. The plastics have a net calorific value of 43,700 kJ/kg and are fed with quantity of transport air of 0.5 Nm3/kg plastics. The problem is in this case that the plastics are not completely combusted and additional emissions of carbon monoxide (CO) between 2500 and 5000 mg/Nm3(related to an oxygen content of 10 vol. %) occur which mean a loss of energy and an increase of thermal energy demand, respectively. The estimations concerned are compiled in Table 4.9. It contains the feeding of the plastics without transport air which would lead to an increase of production as the net calorific value of the plastics is higher than of the hard coal. However, the plastics cannot be fed without transport air which has to be heated up resulting in a decrease of production which further decreases because of the CO formation as a consequence of incomplete combustion. There are still plants emitting carbon monoxide at the level of several thousands of mg/Nm3. Table 4.9: Decrease of production due to the substitution of hard coal by lumpy plastics
Input of dried sewage sludge in [kg/h]
Incr
eas
eo
fth
erm
al e
ne
rgy
de
man
din
[%
]
[t clinker/h] [%]
Only hard coal (no plastics) 0.0 0.0
Plastics without transport air (theoretical as this is not
possible in practice)0.79 0.47
Plastics + transport air −2.91 −1.75
Plastics + transport air + emission of 1250 mg/Nm3 CO −4.24 −2.54
Plastics + transport air + emission of 2500 mg/Nm3 CO −5.57 −3.34
Plastics + transport air + emission of 3750 mg/Nm3 CO −6.90 −4.14
Plastics + transport air + emission of 5000 mg/Nm3 CO −8.23 −4.94
Increase and decrease of productionProcess condition

Chapter 4
110 State of the art of the co-incineration of waste-derived fuels and raw materials in clinker/cement plants
c) Use of waste-derived fuels with lower net calorific value (NCV) Based on a model which has been verified with real plant data, it has been estimated that the substitution of hard coal by lignite, which has a lower NCV, leads to an increase in the clinker-specific energy consumption of almost 100 kJ/kg clinker. This is mainly caused by the higher combustion air requirement for lignite relative to its NCV [Klein/Hoenig, 2006]. As a consequence, the raw gas flow increased by about 8 % and, in conjunction with the higher raw gas temperature, the energy loss with the raw gas increased by 158 kJ/kg clinker. This was partially offset by the drop in cooler exhaust gas losses by 69 kJ/kg clinker due to reduced quantity of cooler exhaust air as exhaust gas at lower temperature was recycled as tertiary air. These effects are even stronger when substituting hard coal by waste-derived fuels with comparatively low NCV, such as the light fine fraction from municipal waste processing. According to the estimations, the thermal energy demand increases with the substitution rate (Figure 4.12). At a substitution rate of 100 %, compared to the only use of char coal, the increase is 13.5 %. Figure 4.13 shows the figures for the annual average and energy performance test which usually lasts 24 to 36 hours.
Figure 4.13: Influence of the fuel properties on the specific thermal energy demand for a 5-stage cyclone preheater kiln with precalciner, based on [Klein/Hoenig, 2006]
At least partly, the water and ash content of waste-derived fuels, the lower net calorific value of a number of waste-derived fuels and the chlorine bypass, where existing. With respect to the stable operation conditions, the NCV should only vary within a small range. However, for some waste-derived fuels, the range of variation is wide, such as for the light fine fraction from processed municipal waste (Figure 4.14). The use of such waste-derived fuels can be associated with non-stable process conditions and thus with an increased energy consumption.
Fuels and substitution rates (% of thermal rated input)
The
rma
l en
erg
yd
em
and
in [
kJ/
kg c
lin
ker]

Chapter 4
State of the art of the co-incineration of waste-derived fuels and raw materials in clinker/cement plants
111
Figure 4.14: Standard variation of the net calorific value (NCV) of two conventional and three waste-derived fuels, [Wirtwein/Emberger, 2010]
d) Installation of a chlorine bypass because of the use of waste-derived fuels The operation of a chlorine bypass (see Chapter 3.3.4) is associated with loss of sensible heat from the kiln system both with the bypass exhaust gases and the bypass dust. The heat loss is about 5 – 10 KJ/kg clinker and percent of bypass exhaust gas flow (ratio of exhaust gas flow in the kiln inlet to the bypass pass gas flow) for kilns with precalciner and about 10 – 20 kJ/kg clinker and percent of bypass exhaust gas flow for kilns without precalciner [Klein/Hoenig, 2006]. The aforementioned four examples clearly explain the order of magnitude of the increase of the clinker-specific thermal heat demand since 1998 of about 11 %. This is considerable and would not have taken place if this development would had not been associated with an improvement of the economic performance. In principle, the increase of the thermal energy demand is an inacceptable drawback but as the waste-derived fuels are much cheaper compared to conventional fuels, this development took place. For some waste-derived fuels, the cement works even obtain money like a disposal plant. The economic aspects are explained in more detail in Chapter 4.3.2.3.7. 4.3.2.1.3 Electricity consumption of cement production
Usually, electricity consumption is related to the quantity of cement, as most of the electricity is consumed not for the clinker production process but for particle size reduction, such as raw material, coal and cement grinding. The total cement specific electricity consumption varies between 360 and 400 kJ/kg cement [Schneider et al., 2011; VDZ, 2012]. The most relevant processes are cement grinding, raw material grinding and the clinker production process (Figure 4.15)
0
200
400
600
800
1000
1200
1400
1600
1800
2000
Lignite Hardcoal Animal meal Fluff Sewage sludge
Sta
nd
ard
va
ria
tion
of ca
lorific
va
lue
s in
kJ/
kg
Type of fuel

Chapter 4
112 State of the art of the co-incineration of waste-derived fuels and raw materials in clinker/cement plants
Figure 4.15: Percentage of the relevant electricity consuming processes of the overall electricity consumption of a cement works
From 1950 until the mid-eighties, the specific electricity consumption was steadily increasing. Then, until 2008, it reduced due to improved grinding techniques, but then drastically increased in 2009 and 2010 (Figure 4.16). The major reason was said to be the increased demand of finely ground high performance cements within the building and construction industry [VDZ, 2011; VDZ, 2012].
Figure 4.16: Development of the cement-specific electricity consumption of the German cement works from 1950 – 2011, [VDZ, 2012]
0
5
10
15
20
25
30
35
Pe
rce
nta
ge
of
tota
l
co
ns
um
pti
on
, %
300,0
320,0
340,0
360,0
380,0
400,0
420,0
440,0
19
50
19
51
19
52
19
53
19
54
19
55
19
56
19
57
19
58
19
59
19
60
19
61
19
62
19
63
19
64
19
65
19
66
19
67
19
68
19
69
19
70
19
71
19
72
19
73
19
74
19
75
19
76
19
77
19
78
19
79
19
80
19
81
19
82
19
83
19
84
19
85
19
86
19
87
19
88
19
89
19
90
19
91
19
92
19
93
19
94
19
95
19
96
19
97
19
98
19
99
20
00
20
01
20
02
20
03
20
04
20
05
20
06
20
07
20
08
20
09
20
10
20
11
spe
c. e
lect
rici
ty c
on
sum
pti
on
in [k
J/kg
ce
me
nt]
Specific electricity consumption for cement production in Germany from 1950 - 2011

Chapter 4
State of the art of the co-incineration of waste-derived fuels and raw materials in clinker/cement plants
113
This trend was stimulated by the increasing substitution of clinker in the cement as this is the most effective way to reduce the specific carbon dioxide emissions per tonne of cement; only clinker production is related to significant fuel consumption [Schneider et al., 2011]. This development is clearly demonstrated by the change in cement types produced by Holcim, as one of the worldwide leading cement manufacturers. From 1995 – 2009, there is a strong shift from the production of ordinary Portland cement (OPC) to other composite cements, which means the aforementioned substitution of clinker by supplementary cementitious materials, such as fly ash from coal power plants, granulated slag from iron production or natural pozzolans (Figure 4.17).
Figure 4.17: Development of different cement types produced by Holcim from 1995 – 2009, [Schneider et al., 2011]
However, very often, the strength development of these composite cements is slower compared to a purely clinker-based cement of the same fineness and there are different strategies to overcome this problem [Schneider et al., 2011]. An important approach is to grind the cement constituents more finely, which is associated with a significant increase in electricity consumption as observed in the past three years (see the aforementioned Figure 4.17). 4.3.2.2 Primary fuels
Fossil fuels including coal, oil and natural gas, are currently the world's primary energy source; thus, they are also called primary fuels. As it is also used for clinker production, petroleum coke (often abbreviated pet coke or pet coke) is directly derived from oil refinery coker units or other cracking processes, it can also fall under fossil or primary fuel respectively. Table 4.10 shows the use of primary fuels in the German cement industry for the 15 years from 1996 – 2010. Table 4.10: Fossil (primary) fuels used in the German clinker production plants from 1996 – 2010 in million
GJ/yr, [VDZ, 1999; VDZ, 2000; VDZ, 2001; …;VDZ, 2012; Scheuer, 2003; Wirtwein/Emberger, 2010]

Chapter 4
114 State of the art of the co-incineration of waste-derived fuels and raw materials in clinker/cement plants
Today, the lignite is the dominant fuel in German cement production, whereas was hard coal dominated before 2000. The use of petrol coke is also significant but the consumption is much lower. In the past 15 years, the consumption of fossil fuels decreased drastically because of substitution with so-called waste-derived fuels (see Chapter 4.3.2.3 below). This is visualised in Figure 4.18 showing the sharp decrease in fossil fuel use and the corresponding drastic increase in waste-derived fuel use (dotted lines). Since 2006, the percentage share of waste-derived fuels has been greater than the share of fossil fuels. This development was economically driven as the costs for waste-derived fuels are much lower than for fossil fuels [Steinbiß, 1979; Kreft et al., 1987; Küppers, 1998; Lübbe-Wolff, 1999; Scheuer, 2003; Schöffmann, 2003; EC RDF, 2003; Gemmer/Schneider, 2006;Genon/Brizio, 2008; VDZ Umweltschutz, 2007; Binninger, 2009; Emberger/Hoenig, 2011; Schneider et al., 2011; Locher/Klein, 2011a; Hoenig et al., 2011]. For certain waste-derived fuels, the operators of cement plants can even charge a gate fee and there are examples of cement plants with negative net energy costs.
Figure 4.18: Use of the different fossil fuels for clinker production as well as total fossil and waste-derived fuels (dotted lines), based on [VDZ, 1999; VDZ, 2000; VDZ, 2001; …;VDZ, 2012; Scheuer, 2003; Wirtwein/Emberger, 2010]
Fossil fuels are fed via the main burner, or, where available, via the precalciner also.
Fuel type / year 1996 1997 1998 1999 2000 2001 2002 2003 2004 2005 2006 2007 2008 2009 2010 2011
Hard coal 37.9 38.2 32 29.4 31.4 21.8 19.3 19.1 15.5 8.7 11.4 13.9 13.9 10.3 9 10
Lignite 32.1 31.4 33.4 32.1 30.1 28 24.5 27.4 31.6 29.1 27.7 25.1 23.1 20 20.7 23.7
Petroleum coke 9.9 9.5 10.2 9.7 8.4 7.6 7.4 5.7 3.8 4.2 4.4 5.6 4.9 4.4 3.3 2.1
Heavy fuel oil 2.4 2.2 4.5 5.9 1.9 3.4 3.4 2.7 2.6 2.2 1.9 2.1 0.9 1.1 0.6 0.4
Light fuel oil 0.3 0.2 0.3 0.3 0.3 0.3 0.4 0.4 0.2 0.2 0.2 0.2 0.2 0.2 0.3 0.2
Natural gas and other gas 1.3 1.6 0.6 0.6 0.7 0.4 0.3 0.3 0.5 0.5 0.3 0.1 0.3 0.1 0.1 0.2
Other fossil fuels 0.6 0.5 1.1 0.9 1 1.1 0.6 0.8 0.7 0.5 0.3 0.3 0.4 0.6 0.4 0.1
Total fossil fuels 84.5 83.6 81.9 78.9 73.8 62.6 55.9 56.4 54.9 45.4 46.2 47.3 43.7 36.7 34.4 36.7
Total fuel consumption 97.6 99.3 100.7 102.3 99.3 89.8 85.8 91.3 94.9 88.7 92.5 99.5 95.8 88.2 88.1 94.4
0
10
20
30
40
50
60
70
80
90
1996 1997 1998 1999 2000 2001 2002 2003 2004 2005 2006 2007 2008 2009 2010 2011
Fue
l co
nsu
mp
tio
n in
[m
illio
n G
J/yr
]
Use of fossil fuels and total waste-derived fuels for clinker production in Germany from 1996 - 2011
Hard coal
Lignite
Petroleum coke
Heavy fuel oil
Light fuel oil
Natural gas and other gas
Other fossil fuels
Total fossil fuels
Total waste-derived fuels

Chapter 4
State of the art of the co-incineration of waste-derived fuels and raw materials in clinker/cement plants
115
4.3.2.3 Waste-derived fuels
4.3.2.3.1 Definition
Waste-derived fuels are those that are not fossil (or primary) fuels. A more detailed definition has been worded by the World Business Council: “Selected waste and by-products with recoverable calorific value can be used as fuels in a cement kiln, replacing a portion of conventional fossil fuels, like coal, if they meet strict specifications. Sometimes they can only be used after pre-processing to provide ‘tailor-made’ fuels for the cement process”, [WBCSD Cement, 2005]. Concerning waste-derived fuels, there is a confusion of different terms, such as secondary fuel, waste-derived fuel, substitute fuels, refuse derived fuel (RDF), tyre-derived fuel (TDF), recovered fuel (RF), solid recovered fuel (SRF), packaging-derived fuel (PDF), paper and plastic fraction (PPF), fluff (air-classified light fraction), “Climafuel” as a trade name from the cement producer CEMEX, processed engineered fuel (PEF), liquid alternative fuel (LAF), substitute liquid fuel (SLF), and there may exist even more terms [e.g. EC RDF, 2003; Lechtenberg/Diller, 2012; UBA AT, 2012]. Figure 4.19 provides a scheme for collating the different terms as well as the different waste-derived fuels.
Figure 4.19: Scheme for collating the different terms for waste-derived fuels
According to the above scheme, waste-derived fuel, secondary fuel (in contrast to primary fuel) and substitute fuel (to substitute fossil or primary fuel) are synonyms. Refuse derived fuels (RDF) is an often-used term but there is no legal definition and it is interpreted differently across countries [EC RDF, 2003]. Refuse is a general term for solid municipal and commercial wastes and used in English speaking countries. RDF usually refers to the segregated high calorific fraction of solid municipal waste, commercial or industrial wastes [EC RDF, 2003]. However, here RDF is used as a generic term synonymous with solid waste-derived fuel. Solid recovered fuels (SRF) are categorized into three different calorific value classes. SRF is defined in EN 15359 as follows: “Solid fuel prepared from non-hazardous waste to be utilized for energy recovery in incineration or co-incineration plants and meeting the classification and specification requirements laid down in EN 15359” [EN 15359, 2012]. The main difference between RDF and SRF is the fact that RDF also comprises hazardous waste or is derived from hazardous waste whereas SRF is derived from non-hazardous waste only.
Waste-derived fuels (WDF)
= Alternative fuels (AF)
= Secondary fuels
= Substitute fuels
Liquid waste-derived fuels
Substitute liquid fuels (SLF)Solid waste-derived fuels
= refuse derived fuels (RDF)
- biodiesel / bioethanol
- waste oil (mineral
and synthetic as well
as vegetable and
cooking oils)
- spent solvents ( halo-
genated and non-
halogenated)
- mother liquors and
washing liquids (also
halogenated)
-distillation residues
(also halogenated)
- … and others more
Hazardous waste or derived
from hazardous waste
derived from non-
hazardous waste
Solid recovered fuels (SRF)
- waste tyres
- waste plastics
- waste textiles
- bone meal
- animal fat
- processed fractions from
municipal and commercial
waste
Solid hazardous WDF
- paint sludge
- waste paints and varnishes
- filter material contam. with
hazardous compounds
- contamin. waste wood
- bleaching earth
- roofing felt
- acid tar
- oil filter
- halogenated filter cakes
- spent adsorbents contamin.
with hazard. compounds
- waste coating powder
- sludges containg halog. and
other solvents
- industrial sewage sludge
- ….. and many more
SRF with high calorific
value ( ≥ 18 MJ/kg)
SRF with medium calorific
value (11-18 MJ/kg)
SRF with low calorific
value ( < 11 MJ/kg)
- waste pulp, paper, board
- biomass (e.g. straw)
- processed fractions from
municipal and commercial
waste
- non-contaminated waste
wood
- dried municipal sludge
- dewatered
sewage sludge
(not dried)
-oil sludge (high
water content)
- bio waste
Gaseous waste-derived fuels
- biogas
- gaseous output
from gasification

Chapter 4
116 State of the art of the co-incineration of waste-derived fuels and raw materials in clinker/cement plants
4.3.2.3.2 Legal status
Waste-derived fuels are derived from waste, and consequently they remain as waste. In case they are incinerated or co-incinerated, they fall under the Waste Incineration Directive (WID)(7)[EU WID, 2000]. However, in 2008, in Article 6(1)(8), the new Waste Framework Directive (WFD) [EU WFD, 2008] introduces the legal framework under which a waste (e.g. waste fuel or any other waste) that has undergone a recovery can reach end-of-waste (EoW) status, i.e. cease to be waste. As a consequence, if a waste-derived fuel reaches end-of-waste status, the installation incinerating or co-incinerating it, such as a cement plant, a large combustion plant or a blast furnace, would no longer fall under the scope of the WID, provided no other waste is incinerated or co-incinerated. However, depending on their capacity, the above mentioned installations may still be covered by either the LCP Directive (now incorporated into Chapter III of the IED), the IPPC Directive (now incorporated into Chapter II of the IED), or national legislation. So far, no waste-derived waste has reached end-of-waste status, and thus, all waste-derived fuels derived from waste must still be regarded as waste [EU WFD, 2008; EC Guidelines, 2011]. However, following a preparatory study for the implementation of Article 6(1) WFD, the development of criteria to establish end-of-waste status for the following waste-derived fuels seems to be possible:
Animal fat Edible oil and fat Wood waste Waste plastics Waste tyres and waste rubber Waste paper Waste textiles “Clean refuse-derived fuel (RDF)”, i.e. waste-derived fuel derived from non-hazardous, clean,
separately collected materials and production residues [UBA AT, 2012]. In a previous study commissioned by a research institute of the European Commission, waste-derived fuels have been identified as potential candidates for end-of-waste status [JRC-IPTS EoW, 2009].
In Europe, Austria has already introduced end-of-waste criteria for waste-derived fuels. In 2008, a legally non-binding regulation was issued by the Austrian Federal Ministry of Agriculture, Forestry, Environment and Water Management [AT Guidelines, 2008], setting up quality criteria for waste input into co-incineration plants. At the end of 2010, these regulations became legally binding through integration into the Austrian Waste Incineration Ordinance [AT Incineration Ord., 2010], setting limits for antimony, arsenic, lead, cadmium, chromium, nickel, mercury, sulphur and chlorine (medians and 80 percentiles) as end-of-waste criteria. In addition, Portugal intends (or has already done so) to introduce the end-of-waste status for “high quality refuse-derived fuel” (RDF) [PT RDF, 2010] and Italy the same for "high quality solid recovered fuels” [IT SRF, 2012]. Two environmental NGOs (European Environment Bureau, EEB and European Environmental Citizens Organisation for Standardisation, ECOS) expressed their strong disagreement and asked the European Commission to oppose the
(7) The WID is repealed with effect from 7 January 2014 as it has been incorporated into the Industrial Emissions
Directive (IED) in Chapter IV [EU IED, 2010]. The same is true for the IPPC Directive [EU IPPCD, 2008], incorporated into Chapter II of the IED as well as for the Large Combustion Plants Directive [EU LCPD, 2001], incorporated into Chapter III of the IED.
(8) The wording of Article 6(1) is as follows: “Certain specified waste shall cease to be waste within the meaning of point (1) of Article 3 when it has undergone a recovery, including recycling, operation and complies with specific criteria to be developed in accordance with the following conditions: a) the substance or object is commonly used for specific purposes; b) a market demand exits for such a substance or object; c) the substance or object fulfills the technical requirements for the specific purposes and meets the existing legislation and standards applicable to products and d) the use of the substance or object will not lead to overall adverse environmental or human health impact. The criteria shall include limit values for pollutants where necessary and shall take into account any possible adverse environmental effects of the substance or object.”

Chapter 4
State of the art of the co-incineration of waste-derived fuels and raw materials in clinker/cement plants
117
adoption of the Italian legislation [EEB/ECOS, 2012]. It is not known whether additional European Member States have also introduced end-of-waste regulations. 4.3.2.3.3 Use of waste-derived fuels
4.3.2.3.3.1 Development
As already indicated for Germany in Figure 4.18, the use of waste-derived fuels has drastically increased in the past 15 years. This development mainly happened in central Europe so far, but the use of waste-derived fuels is widely discussed and increasingly applied worldwide (Figure 4.20).
Figure 4.20: Percentage of waste-derived fuels used for clinker production in relation to the total fuel consumption in different industrialised countries round the word in 2007, based on [CAC, 2011; AT VÖZ, 2011; Cemsuisse, 2012; HDC, 2012; VDZ, 2008]
In Figure 4.20, the highest substitution of conventional fuels is for the Netherlands, where only one cement plant is in operation. In Germany, there are cement works with a substitution rate of 100% (exclusive use of waste-derived fuels). Thus, Germany with its 34 cement works with clinker production serves as an excellent example from which to benefit, in terms of the experience made and the lessons learnt there. For the last 25 years, the substitution rate of waste-derived fuels has been continuously increasing (Figure 4.21). From 2010 to 2011, a stagnation was observed for the first time.
Figure 4.21: Percentage of waste-derived fuels in relation to the total fuel consumption in German clinker production plants from 1987-2011, based on [VDZ, 1998, …,VDZ, 2012; Scheuer, 2003; Wirthwein/Embergerg, 2010; Hoenig, 2012]
0
10
20
30
40
50
60
70
80
90
100
Per
cen
tage
the
rmal
en
ergy
su
bst
itu
tio
n
Thermal energy substitution rates using alternative fuels
0
10
20
30
40
50
60
70
1986 1988 1990 1992 1994 1996 1998 2000 2002 2004 2006 2008 2010
Pe
rce
nta
ge o
f alt
ern
ativ
e fu
els
in [%
]
Percentage of alternative fuels in German clinker production plants from 1987 - 2011

Chapter 4
118 State of the art of the co-incineration of waste-derived fuels and raw materials in clinker/cement plants
The range of different waste-derived fuels used from 1998 – 2011 are compiled in Table 4.11. All of them are wastes. Table 4.11: Type and quantity of waste-derived fuels used in German clinker production units from 1998 –
2011, based on [VDZ, 1999; … ;VDZ, 2012]
In Figure 4.22, the development from 1998 to 2011 is visualised.
Figure 4.22: Development of the use of waste-derived fuels in German clinker production plants from 1998 – 2011, based on [VDZ, 1999; … ;VDZ, 2012]; the less significant waste-derived fuels mentioned in Table 4.11, i.e. packaging waste, wastes from the textile industry, carpet waste, bleaching earth, are not indicated
It is obvious that the quantities of some waste materials (waste-derived fuels) used are relatively constant through time, such as for waste tyres and waste solvents, whereas the quantities of certain wastes, such as “other fractions from industrial/commercial wastes”, and “plastics” (as another input fraction from industrial/commercial wastes), and sewage sludge, have increased significantly in recent years. In contrary, the quantities of some other wastes, such as “meat and bone meal and animal fat”, waste oil, waste wood, and pulp/paper/cardboard, have significantly decreased.
1998 1999 2000 2001 2002 2003 2004 2005 2006 2007 2008 2009 2010 2011
Waste tyres/rubber 229 236 248 237 225 247 290 288 265 289 266 245 253 286
Waste oil 168 181 140 128 125 116 100 92 69 85 80 73 61 66
Fractions of industrial and commercial waste 176 290 372
(such as plastic, paper, textiles, etc.)
Pulp, paper and cardboard 84 43 156 218 237 244 236 150 175 133 63
Plastics 67 128 177 229 309 363 452 460 556 527 474
Packaging material 12 64 9 13 3 1
Wastes from the textile industry 5 5 15 2 9 2 9 11 10
Others 250 231 269 410 567 754 907 936 911 931 1096
Meat and bone meal and animal and fat 245 380 452 439 355 317 293 231 204 182 187
Processed fraction from municipal waste 102 106 155 157 198 212 186 220 188 287 336
Waste wood 76 77 79 72 63 48 42 42 14 13 12 13 8 8
Waste solvents 18 24 31 33 41 48 72 101 93 100 102 81 98 104
Bleaching earth 13 13 23 29 15 20 11 11 4
Sewage sludge 4 48 157 238 254 267 263 276 304
Carpet waste 18 20
Others such as 84 82 176 8 12 17 20 28 32 90 175 78 146 125
Oil mud
Organic distillation residues
Alternativ fuels / year
0
200
400
600
800
1000
1200
1998 1999 2000 2001 2002 2003 2004 2005 2006 2007 2008 2009 2010 2011
Use
of
alte
rnat
ive
fuel
s in
[to
nn
es/y
r]
Alternative fuels used for clinker production in Germany from 1998 - 2011
Others (fractions from industrial/commercial wastes)
Plastics (fraction from industrial/commercial wastes)
Processed fractions from municipal waste
Sewage sludge
Waste tyres/rubber
Meat and bone meal and animal fat
Others such as oil mud or org. dist. residues
Waste solvents
Waste oil
Pulp, paper and cardboard (fraction from industrial/commercial wastes)
Waste wood

Chapter 4
State of the art of the co-incineration of waste-derived fuels and raw materials in clinker/cement plants
119
For waste-derived fuels, detailed analysis of the heavy metal content of the different fuels are available (Table 4.12). The same is not available for the huge number of organic contaminants. The latter should be completely oxidised in the process but during secondary firing (including precalciners and precombustion chambers), the conditions often do not guarantee complete combustion. Table 4.12 Heavy metal content of different waste-derived fuels, all values from [FZKA, 2003], except for
municipal sludge for which the values have been taken from [DE Klärschlamm, 2012]
4.3.2.3.3.2 Use of waste-derived fuels in the German clinker production plants and its regulation
Some of the waste-derived fuels mentioned in Table 4.11 and Figure 4.22 are more precisely defined than others. Whereas the composition of tyres, waste wood, waste oil and sewage sludge can be clearly characterized and can be expected to be relatively stable, the composition of waste plastics and processed fractions from municipal waste can vary considerably, and the group “Others (fractions from industrial/commercial waste)” comprises a wide range of very different wastes. Therefore, the above mentioned most important fuels will be briefly described and characterised. However, first, an overview is provided of the different waste-derived fuels used by the 34 German cement works derived from available permits. Table 4.13 compiles the available information for all individual sites along with the federal state where they are located and the competent authority. The evaluation of this table reveals the following:
a) For 7 clinker production sites, the available permits do not contain information with respect to the waste-derived fuels used.
b) In 21 clinker production sites, a small number of different waste-derived fuels is permitted to be used. Two examples for these are given in ANNEX I and ANNEX II along with the stipulations and requirements concerned. It is important to note that all the permitted waste-derived fuels represent wastes that are not dangerous. In 6 clinker production sites, a large variety of waste-derived fuels is permitted. They are all mentioned in the European List of Waste [EC Waste List, 2000] and predominantly contain organic compounds. In one extreme case (see Lafarge Zement Karlsdorf GmbH), more than 300 different waste codes are permitted for use. Consequently, for 5 of these 6 sites, also dangerous wastes, especially from the chemical industry, are permitted. An example for such a long list of permitted wastes (waste-derived fuels) is given in ANNEX III along with stipulations and requirements with regards to their use. Such diverse lists of waste-derived fuels reflect the position that co-processing of wastes in cement plants is acceptable for a wide range of wastes and is not limited to a certain type of waste [Holcim/GTZ, 2006; Lechtenberg/Diller, 2012]. This position is not directly consistent with a guidance document of the German Federal State North Rhine-Westphalia [NRW MUNLV, 2005] which is also applied by the competent authorities of other German Federal States as there is no national regulation. This guidance document
As Be Cd Co Cr Cu Hg Mn Ni Pb Sb Se Sn Te Tl V Zn
Min 0.2 0.02 0.04 0.9 0.01 24 1 0.04 45 16
Max 0.8 0.03 4 104 0.09 355 102 3.1 1435 220
Av 0.5 0.03 1 2.5 4.3 2.4 0.05 263 13 0.6 0.3 0.5 758 16
Min 0.1 0.02 0.1 5 5 10 0.1 6 17 3 1 4 0.2 1 14
Max 20 0.5 20 207 640 300 1 890 380 760 410 20 50 60 20500
Av 1.6 0.3 7 30 137 68 0.4 189 90 125 136 4 15 10 19 6100
Min 0.01 0.2 0.2 1 5 0.01 5 1 2 1 3 1 0.02 0.9 1
Max 100 15 15 290 640 2 29 150 5000 2 5 8 5 5 30 4800
Av 2.4 0.6 0.8 1 12 51 0.3 15 20 151 1 3 6 3 0.5 2 700
Min 0.5 0.05 0.2 0.9 0.01 0.5 0.1 2 2.2 0.5 1.4
Max 22 2 24 15 192 160 1 200 264 1776 10 20 50 2 5 3143
Av 3.4 0.5 1.2 10 27 24 0.2 150 13 222 8 5 6 0.8 3 440
Min 0.05 0.2 0.5 0.5 1 8.1 < 0.01 8.4 2.5 5 5 5 1 0.05 0.5 19
Max 11 3.3 11 13 293 655 1.4 524 281 325 2020 33 116 33 0.4 35 1280
Av 3 0.9 2.5 4 51 138 0.3 109 25 74 25 8 20 7 0.1 7 331
Min
Max
Av 0.5 0.1 0.4 2 6 26 0.2 3 3 0.5 140
Min 4 1.5 50 300 0.3 600 30 70 5 1 30 0.2 10 30
Max 30 4.5 80 350 2.5 1500 35 100 30 5 80 0.5 100 80
Municipal
sludge
Pet coke
Waste tyres
Waste oil
Waste wood
Fractions from
municipal,
commercial and
industrial waste
Meat and bone
meal

Chapter 4
120 State of the art of the co-incineration of waste-derived fuels and raw materials in clinker/cement plants
contains the so-called “Positive List” of waste-derived fuels for which the “use for co-incineration has been permitted and permanently practiced and sufficient experience from governmental inspections has been gained” [NRW MUNLV, 2005]. This positive list is presented in Table 4.14.

Chapter 4
State to the art of the co-incineration of waste-derived fuels in cement plants 121
Table 4.13: Information on the waste-derived fuels used in the 34 German clinker production sites and the concerned requirements; the source of information is the available permits [BBU, 2013]
Legend: RP = Regierungspräsidium (Regional State Governmental Office), LRA = Landratsamt (Governmental Office of the County), LUA = Landesumweltamt (State Governmental Office for Environment), SGAA = Staatliches Gewerbeaufsichtsamt (Governmental Inspectorate for the Commercial and Production Sector), BZR = Bezirksregierung (Regional State Governmental Office), SGD = Struktur- und Genehmigungsdirektion (Governmental Directorate for Structuring and Permitting), LVA = Landesverwaltungsamt (State Governmental Administration Office), StUA = Staatliches Umweltamt (Governmental Office of the County for Environment)
Seq
uen
ce n
um
ber
fo
r th
e fe
de
ral
stat
es
Seq
uen
ce n
um
ber
fo
r th
e co
mp
. au
tho
riti
es Federal State
and competent authority
Seq
uen
ce n
um
ber
fo
r th
e p
rod
uct
ion
sit
es
German clinker production sites and use of waste (waste-derived fuel and waste-derived raw materials)
Name of the operator Location Type of waste permitted to use
Requirements concerning the use of waste-derived fuels
1 BADEN-
WÜRTTEMBERG
1 RP Karlsruhe 1 HeidelbergCement AG Leimen No information in the available permit(s) No requirements in the available permits
2 Lafarge Zement Wössingen GmbH Walzbachtal Waste tyres, rubber waste, fuel derived from waste (fluff), animal meal
No requirements in the available permits
2 RP Stuttgart 3 Schwenk Zement KG Mergelstetten
Fuel derived from commercial wastes, fuel derived from municipal waste, sewage sludge, bone, animal and blood meal, waste wood, spelt husks
A concept for inspection and quality management of the waste used has been prescribed in 2009. It also contains limits for the content of heavy metals as well as for the maximum dosage rate.
3 RP Tübingen 4 HeidelbergCement AG Schelklingen Fuel derived from commercial waste, sewage sludge, animal meal
A concept for inspection and quality management of the waste used has been prescribed in 2001. It also contains limits for the content of heavy metals as well as for the maximum dosage rate.
5 Holcim GmbH Dotternhausen No information in the available permit(s) No requirements in the available permits
6 Schwenk Zement KG Allmendingen Waste tyres, fuel derived from commercial waste, fuel derived from municipal waste, garden and park waste, bulky waste
A concept for inspection and quality management of the waste used has been prescribed in 2009. It also contains limits for the content of heavy metals as well as for the maximum dosage rate.

Chapter 4
122 State of the art of the co-incineration of waste-derived fuels in cement plants
Seq
uen
ce n
um
ber
fo
r th
e fe
de
ral
stat
es
Seq
uen
ce n
um
ber
fo
r th
e co
mp
. au
tho
riti
es Federal State
and competent authority
Seq
uen
ce n
um
ber
fo
r th
e p
rod
uct
ion
sit
es
German clinker production sites and use of waste (waste-derived fuel and waste-derived raw materials)
Name of the operator Location Type of waste permitted to use
Requirements concerning the use of waste-derived fuels
2 BAVARIA
4 LRA Donau-Ries 7 Märker Zement GmbH Harburg
Waste tyres, spent solvents, waste oil, solid fuel derived from waste resulting from leather and textile processing, from plastic waste and packaging waste, waste wood, sewage sludge, auxiliary materials contaminated with mineral oil
Limits for the content of heavy metals, chlorine and sulphur, restriction of the maximum dosage rate of the different wastes, prescribed monitoring
5 LRA Main-Spessart 8 Schwenk Zement KG Karlstadt
Waste tyres, fuel derived from commercial waste, sewage sludge, animal meal
Limits for the content of heavy metals, chlorine and sulphur, restriction of the maximum dosage rate of the different wastes, prescribed monitoring
9 HeidelbergCement AG Triefenstein
Waste tyres, spent solvents without halogenated compounds, waste oil, shredded bituminous roofing felt, plastic waste, waste carpets, waste from paper industry, animal meal
Restriction of the maximum dosage of the different wastes, no requirements on the content of pollutants in the available permits
6 LRA Rosenheim 10 Südbayrisches Portland-Zementwerk Gebr. Wieshöck & Co. GmbH
Rohrdorf
Waste tyres, fuel derived from commercial waste, by-products from packaging production, liquid waste-derived fuels (not specified)
Restriction of the maximum dosage of the different wastes, no requirements on the content of pollutants in the available permits
7 LRA Schwandorf 11 HeidelbergCement AG Burglengenfeld
Waste tyres, shredded rubber waste, fuel derived from commercial waste, waste wood, wood impregnated with coal tar oil, sewage sludge, calcium fluoride-containing coal electrodes
Limits for the content of heavy metals, chlorine, fluorine and sulphur in the sewage sludge, sewage sludge must be injected via the main burner, restriction of the maximum dosage rate of the different wastes, prescribed monitoring
8 LRA Weißenburg-Gunzenhausen 12
Portland-Zementwerke GmbH & Co. KG
Solnhofen Waste tyres, fuel derived from commercial waste, animal meal and fat
Limits for the content of heavy metals, chlorine and sulphur, restriction of the maximum dosage rate of the different wastes, prescribed monitoring

Chapter 4
State to the art of the co-incineration of waste-derived fuels in cement plants 123
3 BRANDENBURG
9 LUA Brandenburg 13 Cemex Ost-Zement GmbH Rüdersdorf
Large variety of different wastes, such as fluff, waste from paper production, plastic waste, also from recycled packaging, waste wood and many more
Limits for the content of heavy metals, chlorine and sulphur (PCB and PCP for RDF), restriction of the maximum dosage rate of the different wastes, prescribed monitoring
4 HESSE
10 RP Darmstadt 14 Dyckerhoff AG Amöneburg Spent solvents, fuel derived from waste (fluff)
No requirements in the available permit
12 RP Kassel 15 Zement- und Kalkwerke Otterbein GmbH & Co. KG
Großenlüders-Müs
Fluff, sewage sludge, animal and blood meal, oil-contaminated bleaching earth, fly ash, foundry sand
Limits for the content of heavy metals, chlorine, fluorine and sulphur, restriction of the maximum dosage rate of the different wastes, prescribed monitoring
5 LOWER SAXONY
13 SGAA Hannover 16 Holcim AG Höver
Large variety of different wastes (136 different waste codes), such as spent solvents (also halogenated), waste tyres, animal meal, soot, liquid chemicals wastes (also with halogenated compounds),
Limits for the content of heavy metals, chlorine, PCB, PCDD/F, EOX, restriction of the maximum dosage rate of the different wastes, prescribed monitoring
17 HeidelbergCement AG (former Teutonia Zement AG)
Hannover
Fuels derived from wood, paper and board, packaging, bark and cork waste, from textiles, plastics and other materials such as paint and varnish sludge, waste from coating, printing, spent activated carbon, spent ion exchange resin, single use cameras, organic waste and others, sewage sludge, animal meal
Limits for the content of heavy metals, prescribed quality management and monitoring of used wastes
6 NORTH RHINE-WESTPHALIA
14 BZR Arnsberg 18 Wittekind Hugo Miebach & Söhne Ewitte No information in the available permit(s) No requirements in the available permit
19 Seibel & Söhne GmbH & Co. KG Ewitte Fuel derived from waste, plastic waste, waste from paper production, paper and board packaging, mixed packaging, rubber
Limits for the content of heavy metals, prescribed minimum calorific value, prescribed monitoring

Chapter 4
124 State of the art of the co-incineration of waste-derived fuels in cement plants
20 Gebr. Seibel GmbH & Co. KG Ewitte
Large variety of different wastes, such spent solvents, waste plastic, waste bark and cork, animal and vegetable waste, sewage sludge, reaction and distillation residues, coal tar-containing bitumen mixtures, spent activated carbon, soot and others
Limits for the content of heavy metals, chlorine, fluorine and sulphur, PCB in spent solvents, prescribed monitoring
21 Spenner Zement GmbH & Co. KG Ewitte No information in the available permit(s) No requirements in the available permit
22 Dyckerhoff AG Geseke
Large variety of different wastes, such as spent solvents (also containing halogenated compounds, fuel derived from waste (fluff), plastic waste, waste wood and bark, textiles, composite packaging, rubber, paint and varnish waste, waste coating powder, fuel derived from municipal waste, reaction and distillation residues (also with halogenated compounds) and many other wastes from the chemical industry, animal meal, and others.
Limits for the content of heavy metals, chlorine, fluorine, PCDD/F in spent solvents, prescribed monitoring and quality management
23 HeidelbergCement AG Geseke No information in the available permit(s) No requirements in the available permit
15 BZR Detmold 24 HeidelbergCement AG Paderborn Waste tyres, waste wood, fuel derived from waste (fluff), sewage sludge, animal meal and fat, paper sludge, heavy fuel
Restriction of the maximum dosage rate of the different wastes, limits for heavy metals in heavy fuel, no additional requirements in the available permit
17 BZR Münster 25 HeidelbergCement AG Ennigerloh Waste tyres, waste wood, fuel derived from waste, animal meal
Restriction of the maximum dosage rate of the different wastes, no other requirements in the available permit
26 Dyckerhoff AG Lengerich
Spent solvents (also containing halogenated compounds), fuel derived from waste (fluff), plastic waste, waste bark and cork, paper sludge, textiles, paint and varnish waste, waste wood, animal meal
Limits for the content of heavy metals, chlorine and PCDD/F in spent solvents, prescribed monitoring
27 Cemex West-Zement GmbH Beckum
Waste tyres, plastic waste, fuel derived from waste, waste bark and cork, waste wood, sludge from paper production, textiles, paint and varnish waste, waste coating powder, paper/board and plastic packaging, waste rubber
Limits for the content of heavy metals, prescribed monitoring and quality management

Chapter 4
State to the art of the co-incineration of waste-derived fuels in cement plants 125
28 Phoenix Zementwerke Krogbeumker GmbH & Co. KG
Beckum Waste oil, production waste (not specified), animal meal; no additional information
No requirements in the available permit
7 RHINELAND-PALATINATE
18 SGD Nord 29 Portlandzementwerk Wotan H. Schneider KG
Üxheim-Ahütte No information in the available permit(s) No requirements in the available permit
19 SGD Süd 30 Dyckerhoff AG Göllheim
Large variety of different wastes, such as waste tyres, spent solvents (also containing halogenated compounds), fuel derived from waste (fluff), plastic waste, waste wood and bark, textiles, composite packaging, rubber, paint and varnish waste, waste coating powder, fuel derived from municipal waste, reaction and distillation residues (also with halogenated compounds) and many other wastes from the chemical industry, sewage sludge, animal meal, foundry sand, and others.
Limits for the content of heavy metals, chlorine, fluorine and sulphur, PCB and PCP, restriction of the maximum dosage rate of the different wastes, prescribed monitoring
8 SAXONY-ANHALT
20 LVA Halle 31 Lafarge Zement Karlsdorf GmbH Karlsdorf Waste tyres, spent solvents, waste oil, fuel derived from waste, sewage sludge, animal meal
No requirements in the available permit

Chapter 4
126 State of the art of the co-incineration of waste-derived fuels in cement plants
32 Schwenk Zement AG Bernburg
Large variety of different wastes (more than 300 different waste codes), such as waste tyres, spent solvents (also containing halogenated compounds, fuel derived from waste (fluff), plastic waste, waste wood and bark, textiles, composite packaging, rubber, paint and varnish waste, waste coating powder, fuel derived from municipal waste, reaction and distillation residues (also with halogenated compounds) and many other wastes from the chemical industry, sewage sludge, animal meal, foundry sand, and many others.
Limits for the content of PCB and PCP in waste oil and for PCDD/F and other persistent organic pollutants in all dangerous wastes, prescribed monitoring
9 SCHLESWIG-
HOLSTEIN
21 StUA Itzehoe 33 Holcim AG Lägerdorf
Fuel derived from waste, sewage sludge, roofing felt waste (containing tar or bitumen), solid and liquid non-dangerous and dangerous wastes (not specified in the permit)
Limits for the content of Hg, Cd, Tl and Cr, in addition chlorine for dangerous wastes, prescribed monitoring
10 THURINGIA
22 LUA Weimar 34 Dyckerhoff AG - Deuna Zement GmbH
Deuna No information in the available permit(s) No requirements in the available permit

Chapter 4
State of the art of the co-incineration of waste-derived fuels and raw materials in clinker/cement plants 127
Table 4.14: Positive list of waste-derived fuels to use in cement and lime plants as well as in large combustion plants; according to [NRW MUNLV, 2005]
Waste code Description Indicative explanation
02 01 04 Plastic waste without packaging Polyurethane foam, polyethylene composites
3 01 04 Waste from forestry exploitation
4 01 04 Waste bark and cork
5 01 04 Sawdust, chips, cuttings, wood panels and
veneers other than those mentioned in 030104
6 01 04 Bark and wood waste
7 01 04 Dregs and green liquor sludges from black
l iquor treatment)
De-watered only
8 01 04 Rejects from paper and cardboard recycling Rejects
9 01 04 Wastes from sorting of paper and cardboard
destined for recycling
Paper qualities out of specification
10 01 04 Wastes from composite materials
(impregnated textile, elastomer, plastomer)
Other high calorific impurities
11 01 04 Wastes from unprocessed textile fibres Textiles, carpets, fleeces and insulation
materials from car interiors, hygiene
products (each raw materials and out of
specification products)
12 01 04 Wastes from processed textile fibres Raw materials and out of specification
products
13 01 04 Waste plastic Plastic and rubber waste
14 01 04 Waste paint and varnish other than those
mentioned in 080111
Only hardened paints and varnishes
15 01 04 Waste coating powders
16 01 04 Photographic fi lm and paper containing silver
or silver compounds
17 01 04 Photographic fi lm and paper free of silver or
silver compounds
18 01 04 Plastics shavings and turnings Plastics for cars, polyurethane composites,
injection-moulded parts, foams
19 01 04 Paper and cardboard packaging Décor, packaging and label paper
(production residues), also wax-
impregnated paper
20 01 04 Plastic packaging Packaging fi lm (raw materials and out of
specification products), foams, polystyrene
21 01 04 Wooden packaging Damaged pallets and boxes etc.
22 01 04 Composite packaging Plastic and paper composites
23 01 04 Mixed packaging Packaging of waste code group 1501
24 01 04 Absorbents, fi lter materials, wiping cloths and
protective clothing other than those mentioned
in 150202
Absorbents, fi lter materials, wiping cloths
and protective clothing
25 01 04 Wood
26 01 04 Plastic
27 01 04 Non-composted fraction of municipal and
similar waste
28 01 04 Paper and board
29 01 04 Plastic and rubber
30 01 04 Wood except those mentioned in 191206
31 01 04 Textiles
32 01 04 Combustible waste (waste-derived fuel), also
those mentioned in 191212
High calorific fraction from the mechanical
or mechanical-biological treatment of wastes
(90 - 95 % of the components of the mixed
fuel are part of this positive l ist and/or
belong to waste code groups 2002 and/or
2003 and/or are known from waste code
170904)
33 01 04 Waste tyres Waste tyres, shredded tyres
34 01 04 De-inking sludges from paper recycling They are permanently used in power plants;
they are separately l isted because of their
particular properties (low calorific value,
paste-like properties)
35 01 04 Fibre rejects, fibre-, fi l ler- and coating-sludges
from mechanical separation
Waste codes 030305 and 030310 can be
considered as wastes of the positive l ist and
can be used in power plants.

Chapter 4
128 State of the art of the co-incineration of waste-derived fuels and raw materials in clinker/cement plants
A waste can become part of this positive list if it complies with certain limits for heavy metals (Table 4.15). Table 4.15: Median and maximum values for waste-derived fuels* [NRW MUNLV, 2005], median: i.e. that
the values for 50 % of the samples taken and analysed can be higher than the median; therefore maximum values are also set.
Legend: DM: dry matter *the values are related to a calorific value of the dry matter of at least 20,000 kJ/kg (± 2000 kJ/kg); for the calorific fraction derived from municipal waste, the reference calorific value is 16,000 kJ/kg **in single cases because of inhomogeneities, the exceedance is permitted
This list does not contain any dangerous waste. As a consequence, most of the permits do not allow the use of dangerous wastes, except the aforementioned five cases and the use of spent solvents and waste oils which is permitted for seven additional cases. The values in the table above do not reflect ecotoxicological or environmental considerations but are values that suppliers of waste-derived fuels and operators of cement plants can comply with. In the aforementioned guidance document [NRW MUNLV, 2005], the analytical results of different types of wastes are presented and the defined maximum values cover the whole range of determined values except some extreme ones for lead in paint and varnish sludge and copper in waste-derived fuel as well as a few values for cadmium, thallium, mercury, chromium, cobalt and nickel which slightly exceed the proposed maximum values. The conclusion that the median and maximum values reflect the existing contamination of the waste-derived fuels, rather than being determined to mitigate ecotoxicological and environmental effects can be demonstrated by comparison of values for different heavy metals and their ecotoxicologial or environmental properties as well as with estimations of the increase of the heavy metal content in the clinker. More aspects could be considered but this may not be required. The maximum value for cobalt is 12 mg/kg and for copper 700 mg/kg, which cannot be justified by their ecotoxicological and environmental properties. The same is true for vanadium (max. value: 25 mg/kg) and lead (max. value: 400 mg/kg). These two examples are sufficient to verify the conclusion. The increase of the heavy metal content of the clinker is another appropriate indicator to check the drawn conclusion. For this purpose, the heavy metal content in the waste-derived fuel that would be required to double the heavy metal content in the clinker is compared with the permitted median and
Parameter Unit Median Maximum value
Antimony (Sb) mg/kg DM 50 120
Arsenic (As) mg/kg DM 5 13
Cadmium (Cd) mg/kg DM 4 9
Chromium (Cr) mg/kg DM 40 - 125 120 - 250
Cobalt (Co) mg/kg DM 6 12
Copper (Cu) mg/kg DM 120 - 350** 300 - 700**
Lead (Pb) mg/kg DM 70 - 190 200 - 400
Manganese (Mn) mg/kg DM 50 - 250 100 - 500
Mercury (Hg) mg/kg DM 0.6 1.2
Nickel (Ni) mg/kg DM 50 100
Thallium (Tl) mg/kg DM 1 2
Tin (Sn) mg/kg DM 30 70
Vanadium (V) mg/kg DM 10 25

Chapter 4
State of the art of the co-incineration of waste-derived fuels and raw materials in clinker/cement plants 129
maximum values. To do this, only non-volatile heavy metals (see Chapter 3.2.4.2.2) can be considered, based on the realistic assumption that almost 100 % of non-volatile metals are incorporated into the clinker. Another assumption is that the substitution rate of conventional fuels with waste-derived fuels is 100 %. As more and more German cement plants go for this 100 % rate, this assumption is justifiable and realistic. Thus, the sources of heavy metals are the raw meal and the waste-derived fuels. For the raw meal, the average values have been taken from the above mentioned guidance document [NRW MUNLV, 2005]. The estimations are presented in Table 4.16. Table 4.16: Estimation of the concentration of non- and low-volatile heavy metals in waste-derived fuels to
double their concentration in the clinker and comparison with the median and maximum values
The results are very different. For some heavy metals, the relevance of the waste-derived fuels is negligible (manganese and vanadium) or very low (arsenic and cobalt) whereas for others it is significant (antimony, cadmium, copper and lead). For instance, the maximum value for copper allowed in the waste-derived fuel is 5.6 times higher than the concentration required to double its concentration in the clinker. Similar estimations have been reported earlier, leading to the same conclusion [Lahl, 2000]. They confirm that the above mentioned maximum values reflect existing contamination but do not consider ecotoxicological and environmental considerations. This conclusion is independent from the average heavy metal content in the raw meal chosen to carry out the estimations. As already indicated, the German competent authorities take the aforementioned guidance document into account when drafting the permits. In Table 4.17, the maximum values for different wastes from the permits of five cement works are compiled together with the maximum values of the guidance document. In principle, the maximum values of the permits are equal to those in the guidance document but some numbers were obviously adapted to the application of the specific operator concerned. This also confirms that the existing contamination of the waste-derived fuels is used to define the maximum values.
Concentration
of heavy metals
in the raw meal
(NRW MUNLV,
2005)
Concentration of
heavy metals in
the clinker at a
raw meal factor of
1.6 kg raw meal
per kg clinker*1
Concentration of non- and
low-volatile heavy metals in
the waste-derived fuel for
doubling their content in the
clinker at a substitution rate
of 100 %*1
Maximum value
of the waste-
derived fuel
(limit) (NRW
MUNLV, 2005)
Maximum value
of the waste-
derived fuel*2
Factor
(ratio of the
maximum value to
the concentration of
the waste-derived
fuel to double the
content in the
clinker)
Median of the
waste derived
fuel (NRW
MUNLV, 2005)
Median of the
waste-derived
fuel*2
Factor
(ratio of the median
to the
concentration of
the waste-derived
fuel to double the
content in the
clinker)
mg/kg DM mg/kg cli mg/MJ mg/kg DM mg/MJ mg/kg DM mg/MJ
Antimony (Sb) 2 3.2 0.9 120 6 6.8 50 2,5 2.8
Arsenic (As) 3.5 5.6 1.6 13 0,65 0.4 5 0,25 0.2
Cadmium (Cd) 0.25 0.4 0.1 9 0,45 4.1 4 0,2 1.8
Chromium (Cr) 24 38.4 10.7 250 12,5 1.2 125 6,25 0.6
Cobalt (Co) 5.4 8.6 2.4 12 0,6 0.3 6 0,3 0.1
Copper (Cu) 14 22.4 6.2 700 35 5.6 350 17,5 2.8
Lead (Pb) 13 20.8 5.8 400 20 3.5 190 9,5 1.6
Manganese (Mn) 430 688 191.1 500 25 0.1 250 12,5 0.1
Nickel (Ni) 12.5 20 5.6 100 5 0.9 50 2,5 0.5
Tin (Sn) 2.65 4.2 1.2 70 3,5 3.0 10 0,5 0.4
Vanadium (V) 31 49.6 13.8 25 1,25 0.1 30 1,5 0.1
*1 assumptions: 100 % of the non- and low-volatile heavy metals are incorporated into the clinker, the specific energy consumption is 3.6 MJ/kg clinker
*2 calculated from the content in mg/kg DM with a calorifc value of 20 MJ/kg
Legend: DM = dry matter

Chapter 4
130 State of the art of the co-incineration of waste-derived fuels and raw materials in clinker/cement plants
Table 4.17: Limits for heavy metals in waste-derived fuels set in the permits of five different German cement works and comparison with the guidance document of the German Federal State North Rhine-Westphalia
For instance, in the permit of the cement works Göllheim of Dyckerhoff AG, the limit for antimony in the dried paint sludge is 1.5 mg/kg whereas it is 120 mg/kg for the other type of waste-derived fuels permitted for use. For arsenic, cobalt and vanadium, there are also significant differences. The details on the regulation for the use of waste-derived fuels for this cement works are given in ANNEX III.
c) Zinc is often not considered It is remarkable that the above mentioned guidance document [NRW MUNLV, 2005] and consequently most of the permits do not contain median and maximum values for zinc. This cannot be justified on ecotoxicological and environmental grounds as the ecotoxicological profile of zinc is not very different from other heavy metals such as manganese. In the Table above, there is only one limit given for zinc (sewage sludge to be used in the cement works Mergelstetten of Schwenk AG). The reasons for that could not be identified. In contrast, Switzerland has set a guidance value for zinc (400 mg/kg) for combustible waste [CH BUWAL, 2005]. Austria had the same value [Holcim/GTZ, 2006] but removed it when transferring a voluntary self-commitment into binding regulation [AT Incineration Ord., 2010]. The values for the aforementioned countries are compiled in Table 4.18. For Austria, the values are given before and after revision (first as a guideline [AT Guideline, 2008] in 2008 and as an ordinance in 2010 [AT Incineration Ord., 2010]) as the previous regulation also contained a value for zinc; as a result of the revision, not only has the value for zinc been removed, but also the values for beryllium, copper, thallium, tin and vanadium. In addition, on one hand the values are not maximum values but 80th percentiles and on the other hand, the values have been increased significantly. Thus, the requirements are now significantly less stringent.
Dyckerhoff
AG, works
Lengerich
Märker
Zement,
works
Harburg
Holcim,
works
Höver
NRW Guidance
Document
(NRW MUNLV,
2005)
Pollutant, values
in mg/kg DM if
not specified
otherwise
waste oil /
mixtures of
spent
solvents
Dried paint
sludge
Production-
specific
commercial
waste (fluff)
Oil-contami-
nated
operation
materials
Dried
sewage
sludge
Fuels
derived
from
production-
specific
commercial
waste
Fuels
derived
from
commercial
and
municipal
waste
Sewage
sludge
Different
type of
wastes
Refuse
derived
fuel
Different
type of
wastes
max.-values for
fuels derived
from wastes
Mercury (Hg) 1 0.7 1.2 1.2 1.5 1 1 1 1.2 0.5 1.2 1.2
Cadmium (Cd) 9 6.7 9 9 9 8 9 10 9 10 9 9
Thallium (Tl) 2 1 2 2 2 1 1 2 1 5 2
Antimony (Sb) 120 1.5 120 120 100 120 120 120 75 60 120
Arsenic (As) 30 1.5 13 13 13 13 13 13 10 20 13
Lead (Pb) 710 520 400 400 200 200 400 900 300 100 200 400
Chromium (Cr) 100 600 150 250 100 65 250 185 100 120 250
Cobalt (Co) 250 31 12 12 15 12 12 12 20 25 12
Copper (Cu) 450 750 750 750 700 200 700 800 500 300 400 700
Manganese (Mn) 750 154 500 500 750 85 500 600 100 500
Nickel (Ni) 77 300 100 160 100 40 100 200 100 100 160 100
Vanadium (V) 5 500 25 25 83 15 25 25 25 25
Tin (Sn) 15 150 70 70 200 40 70 70 75 70 70
Zinc (Zn) 2500
Polychlorinated
biphenyls (PCB)10 10 10 10 10 10
Pentachloro-
phenol (PCP)5 5 5 5 5
Chlorine (Cl) 4 weight-% 4 weight-% 4 weight-% 4 weight-% 4 weight-% 1 weight-% 1 weight-% 1 weight-% 3 weight-%
Fluorine (F) 0.1 weight-% 0.1 weight-% 0.1 weight-% 0.1 weight-% 0.1 weight-%
Sulphur (S) 4 weight-% 4 weight-% 4 weight-% 4 weight-% 4 weight-% 2 weight-%
DM = dry matter
Dyckerhoff AG, works GöllheimSchwenk AG, works
Mergelstetten

Chapter 4
State of the art of the co-incineration of waste-derived fuels and raw materials in clinker/cement plants 131
Table 4.18: Compilation of the maximum values for waste-derived fuel in Germany, Switzerland and Austria
*1 the values are related to a net calorific value of the dry matter of at least 20 MJ/kg (± 2 MJ/kg); for the calorific fraction derived from municipal waste, the reference net calorific value is 16 MJ/kg *2 in single cases because of inhomogeneities, the exceedance of the range is permitted *3 the application of the guidance values is limited to those wastes which are not part of the positive list; the values are also given in mg/MJ and can be calculated from the values in mg/kg with a net calorific value of 25 MJ/kg *4 the values are not maximum values but 80th percentiles, the values in the Ordinance are given in mg/MJ and are calculated from them with a net calorific value of 20 MJ/kg *5 for quality controlled waste-derived fuels (waste code 91108 of the Waste Code Ordinance), the limit as 80th percentile is 14 mg/kg dm
The disregard of zinc is not acceptable as there are waste-derived fuels with a very high content of zinc, especially waste tyres which are used in considerable quantities (see Table 4.11). According to different sources, the zinc content of tyres varies between 10000 – 16000 mg/kg [TU Wien, 1999; BiCon, 2003; Councell et al., 2004; ChemRisk, 2009; Initiative Zn, 2012]. The range of zinc in the raw meal varies from 20 to 47 mg/kg dry matter (Table 4.2). As an example to demonstrate the magnitude of possible effects, the substitution of hard coal with a zinc content of 90 mg/kg (average value for German hard coal [Rentz/Martel, 1998]) with waste tyres to a realistic 20 % of the rated thermal input, would increase the content of zinc in the clinker by a factor of 5 – 10 (see the approach to calculate the factor in Chapter 4.4.2. Against the background of this result, it remains difficult to understand why zinc is often not considered.
d) Chlorine content
For about one third of German cement plants, permits contain requirements for the maximum chlorine content, varying between 1 and 4 weight-%. The value 1 weight-% is usually for processed municipal waste, especially for the light fine fraction and the higher value shall cover hazardous waste, especially spent solvents containing chlorinated compounds. In many cases, the increasing intake of chlorine-containing waste-derived fuels leads to input quantities which require a chlorine bypass to discard chlorine in a controlled manner (see Chapter 3.3.4).
Guidance value
80th percentileGuidance value Guidance value
Limit
80th percentile
Parameter UnitGermany
(MUNLV, 2005)*1
Switzerland (CH
BUWAL, 2005)*3
Austria before 2008
(Holcim/ GTZ, 2006)
Austria after 2008
(AT Incineration
Ord., 2010)*4
Antimony (Sb) mg/kg DM 120 5 5 200
Arsenic (As) mg/kg DM 13 15 15 60
Barium (Ba) mg/kg DM − 200 − −
Beryllium (Be) mg/kg DM − 5 5 −
Cadmium (Cd) mg/kg DM 9 2 2 9.2*5
Chromium (Cr) mg/kg DM 120 - 250 100 100 740
Cobalt (Co) mg/kg DM 12 20 20 54
Copper (Cu) mg/kg DM 300 - 700*2
100 100 −
Lead (Pb) mg/kg DM 200 - 400 200 200 720
Manganese (Mn) mg/kg DM 100 - 500 − − −
Mercury (Hg) mg/kg DM 1.2 0.5 0.5 3
Nickel (Ni) mg/kg DM 100 100 100 360
Selenium (Se) mg/kg DM − 5 − −
Silver (Ag) mg/kg DM − 5 − −
Thallium (Tl) mg/kg DM 2 3 3 −
Tin (Sn) mg/kg DM 70 10 10 −
Vanadium (V) mg/kg DM 25 100 100 −
Zinc (Zn) mg/kg DM − 400 400 −
Legend: DM = dry matter

Chapter 4
132 State of the art of the co-incineration of waste-derived fuels and raw materials in clinker/cement plants
e) Feeding points Only one permit for German cement plants contains a stipulation concerning the feeding point. This is the permit for the cement works in Göllheim of the Dyckerhoff AG. Annex III shows the parts of this permit covering the type and quality of waste. There, it is prescribed that “Due to their content of organic pollutants, the waste-derived raw materials spent foundry sand and paper sludge must be fed via the secondary firing”. This provision is important to prevent, or at least to minimise, additional emissions, especially of carbon monoxide and organic compounds. The aforementioned stipulation concerns the two waste-derived raw materials “spent foundry sand and paper sludge”. In case they are used, they would be fed via the raw material route, i.e. these wastes are added to the raw materials. The organic compounds in these wastes are evaporated during heating in the cyclone preheater. Thus, the feeding point is relevant to minimise organic compounds and carbon monoxide. Against this background, it is a surprise that the permits do not regulate the feeding points. This is also important for waste-derived fuels used for secondary firing with and without precalciner, as in many cases the waste-derived fuels are not completely combusted resulting in increased emissions of the aforementioned pollutants.
4.3.2.3.4 More detailed information on the most quantitatively relevant waste-derived
fuels
As aforementioned in the first paragraph of Chapter 4.3.2.3.3.2, the most quantitatively relevant waste-derived fuels are briefly described and characterized. These are: - the very diverse "other fractions from industrial/commercial wastes" - waste plastics as a fraction of industrial/commercial wastes - processed fractions from municipal waste, and - sewage sludge. The quantities of these four groups used significantly increased in the past years (see Figure 4.22), especially the "other fractions from industrial/commercial wastes"; it exponentially grew in the past ten years.
4.3.2.3.4.1 Other fractions from industrial/commercial wastes
On a quantity basis, this is the most relevant waste-derived fuel (in 2011, the input was 1.1 million tonnes (VDZ, 2012), see Table 4.11 and Figure 4.22) but is also the most diverse group of waste used in cement works. So far, the German cement industry has not published more details about the composition of this waste group. The different wastes of this extremely inhomogeneous group have very different properties with regards to chemical composition, net calorific value and size distribution. As a consequence, the combustion properties vary considerably. The following examples constituents demonstrate the diversity of this waste group: - liquid chemical waste, also containing organohalogen compounds - organic chemical wastes (this sub group as such is very diverse; for instance, residues and distillation residues from thousands of products with different chemical properties fall under this group) - paint and varnish waste - spent activated carbon - spent ion exchange resins - waste coating powder - auxiliary materials contaminated with oil - roofing felt - by-products from packaging production - bark and cork waste - waste from leather processing - waste from textile finishing.

Chapter 4
State of the art of the co-incineration of waste-derived fuels and raw materials in clinker/cement plants 133
In principle, for the cement plants it is best to use few well characterised waste-derived fuels in large quantities over the whole year. This is of advantage from the point of logistics and handling but also with regards to stable and smooth operating (particularly combustion) conditions. The permanent change of the waste-derived fuel input (qualitatively and quantitatively) does not support the requirement to have stable and smooth operating conditions. So, in the beginning of the use of waste-derived fuels, only a few, well characterised wastes were used such as waste tyres, waste oil, waste solvents and waste wood. The most logical and understandable explanation for the exponential increase in the use of many different fuels derived from industrial/commercial wastes is the financial aspect. Form the economic point of view, the intake and processing of these wastes is very attractive. Thus, economic considerations seem to be the main driver to co-incinerate these waste-derived fuels, although their handling and processing is more difficult and complicated. An illustrative example for the processing of many different waste-derived fuels with very different chemical properties (including different pollutants), net calorific value and size distribution, and thus very different combustion properties, is the cement works of the Holcim (Deutschland) AG in Lägersdorf/Germany where following waste-derived fuels are used [Holcim Lägersdorf, 2012] - waste oil - spent solvents - refuse-derived fuels - light fraction of processed municipal waste - waste roofing felt - rubber scrap - municipal sludge (thermally dried and sludge which is only mechanically dewatered) - distillation residues - animal meal This list also contains waste-derived fuels which fall into categories other than the aforementioned groups but demonstrate how diverse the used waste mix is. In Chapter 4.3.2.3.3.2, it is explained that in six German cement works producing clinker, the use of a large variety of waste-derived fuels is permitted. This is due to the very diverse group of fuels derived from industrial/commercial wastes. 4.3.2.3.4.2 Waste plastic
In Germany, a variety of different plastics are produced, processed and used for many applications. In 2011, the quantity of plastic products applied in Germany was 11.86 million tonnes [Consultic, 2012]. Figure 4.23 shows the produced quantities of the different types of plastics and the main application areas. The packaging sector is important. There, different types of polyethylene, propylene and polyethylene terephthalate are most relevant. With respect to co-incineration of plastic waste, it must be noted that 217.000 tonnes of PVC have been used for packaging purposes (foils, packaging for fresh meat, bottles for vegetable oil and vinegar etc.) [PVC, 2002]. This contributes to the chlorine content of fuels derived from municipal waste (which also includes commercial wastes) (see Chapter 3.3.4.1). The same is true for PVC tubes and other PVC articles produced for the construction sector.

Chapter 4
134 State of the art of the co-incineration of waste-derived fuels and raw materials in clinker/cement plants
Figure 4.23: Use of the different types of plastics in the most important application areas in Germany in 2011, [Consultic, 20129
Legend: PE = polyethylene, LD = low-density; LLD = linear low-density; PP = polypropylene; PS = polystyrene; PS-E = polystyrene expanded; PVC = polyvinylchloride; ABS = acrylonitrile butadiene styrene; ASA = acrylonitrile styrene acrylate; SAN = styrene acrylonitrile; PMMA = poly(methylmethacrylate); PA = polyamide; PET = polyethylene terephthalate; PUR = polyurethane; the size of the bubbles represents the quantities used in each sector
Basically, plastic wastes result from plastic manufacture, plastic processing and from commercial recycling activities as well as from private households. The quantities for these four basic groups are compiled in Table 4.19. Sales packaging represents the biggest part (about 25%) followed by waste plastic from commercial wastes (about 18 %) and waste plastic contained in household waste (about 15 % - despite the separate collection via the system of Duales System Deutschland (DSD)).
Others
(3,070 kt)
Electro/
electronic
(730 kt)
Vehicles
(1,170 kt)
Construction
(2,780 kt)
Packaging
(4,110 kt)
PE-LD/
LLD
(1,720)
PE-
HD/MD
(1,500)
PP
(2,030)
PS
(385)
PS-E
(315)
PVC
(1,610))
ABS,
ASA, SAN
(260)
PMMA
(75)
PA
(345)
PET
(445)
PUR
(750)
Other
thermo-
plastics
(460)
Other
plastics
(1,965)

Chapter 4
State of the art of the co-incineration of waste-derived fuels and raw materials in clinker/cement plants 135
Table 4.19: Plastic wastes from plastic manufacture, plastic processing and from commercial recycling activities as well as from private households in Germany in 2011, [Consultic, 2012]
Legend:
Figure 4.24 shows the disposal, recycling and recovery routes of waste plastic. Most of the waste plastic is recycled and only a minor part is still landfilled or incinerated without energy recovery (about only 1 %). Thereby, on the one hand, 56 % of the waste plastic is incinerated in municipal waste incineration plants with energy recovery, in dedicated plants for the incineration of solid recovered fuels (SRF – see the definition in Figure 4.18), or co-incinerated, especially in cement plants or power plants. On the other hand, 43 % of the waste plastic is mainly mechanically recycled and a negligible part is used for feedstock recycling.
plastics from commercial wastes or from recycling activities
waste plastics from private households
plastics manufacturing companies
plastics processing companies
Total quantity Recycling/recovery Disposal
kt/2011 kt/2011 kt/2011
Commercial waste collected and processed by private
companies994 974 20
Household-type commercial waste collected and processed
by public bodies162 158 4
Shredder facilities (only end-of-life-vehicles) including
vehicle recyclers and repair garages189 174 15
Collection and recycling systems for commercial packaging
(also transport packaging and repackaging)345 345 0
Other collection and recycling systems (e.g. PVC floor
covering recycling by AgPR, PVC window recycling by
Rewindo, plastic tube recycling, etc.)
95 95 0
Sales packaging 1400 1400 0
Residual household waste 849 829 20
Bulky waste from households 188 186 2
Collection and recycling of recycable materials by public
bodies45 45 0
Waste electrical and electronic equipments from private
households, commercial and industrial companies (taking
back by public bodies, recycling centres, trade and private
comanies)
171 170 1
Plastic producers 74 72 2
Plastic processing companies 936 934 2
Total 5448 5382 66
Source location of plastic waste 2011
Collected and processed quantities of plastic waste

Chapter 4
136 State of the art of the co-incineration of waste-derived fuels and raw materials in clinker/cement plants
Figure 4.24: Disposal, recycling and recovery routes of waste plastic in Germany in 2011, [Consultic, 2012]
As the waste plastics from plastic manufacturing and processing companies are well defined and sorted, they are mechanically recycled to a high extent (about 90 % for the processing companies and about 70 % for the manufacturing companies).
4.3.2.3.4.3 Processed fractions from municipal waste
Figure 4.25 shows the basic operations for the treatment of the residual fractions from municipal wastes, i.e. residual waste from households, commercial activities and sales and packaging; the latter is collected in Germany by the Duales System Deutschland (DSD). In addition, Figure 4.25 also mentions municipal sludge and waste wood. These two groups represent two types of waste which are fed to cement plants as well (see Table 4.11 and Figure 4.22). The sewage sludge will be described in the following section.
Total waste plastic in 2011
5.45 million t (100%)
Recycling/recovery
5.38 million t (99%)
Incineration without heat
recovery or landfill
0.07 million t (ca. 1%)
Energy recovery
3.03 million t (56%)Material recycling
2.35 million t (43%)
Municipal waste
incineration
1.87 million t
(34%)
Waste-derived
fuels (incineration in
dedicated plants or co-
incineration, e..g in
cement plants)
1.16 million t
(22%)
Mechanical
recycling
2.3 million t
(42%)
Feedstock
recycling
0.05 million t
(1%)
.
.

Chapter 4
State of the art of the co-incineration of waste-derived fuels and raw materials in clinker/cement plants 137
2)pyrolysis and gasification techniques were operated in Germany, partially at industrial scale, but recently (2011)
all these installations were shut down due to technical and/or economic reasons [Friege/Fendel, 2011]
Figure 4.25: Basic operations for the treatment of residual fractions of municipal wastes, based on [Scholz/Beckmann, 1998]
In Table 4.20, the quantities per capita for the different fractions of municipal waste are compiled for the period 1996 – 2010. From the uppermost row, it can be seen that the total quantity of municipal waste was not reduced, i.e. prevention of wastes and services associated with the generation of wastes did not take place [Kranert, 2009; Grooterhorst, 2010a; Grooterhorst, 2010b].
Table 4.20: Quantity of waste per capita for the different fractions of municipal waste from 1996 – 2010, compiled with data from [Destatis Abfallbilanz 2006, 2009; Destatis Abfallbilanz 2007, 2009; Destatis Abfallbilanz 2008, 2010; Destatis Abfallbilanz 2009, 2011; Destatis Abfallbilanz 2010, 2012; Destatis Abfallbilanz Erläuterungen, 2012]
Residual
household waste
Residual
commercial
waste
Sales and
transport
packaging (DSD)
Sewage sludge
Waste wood
Incineration
Pyrolysis
Gasification
Drying
each in differ. combinations
Sorting
Comminuting
Screening
Air classifying
Pelletising
Briquetting
Rotting (aerobic)
Anaer. digestion
each in different combinations
Burning
(e.g. binder)
Reduction
(e.g. Fe/non-Fe metal)
Synthesis
(e.g. syngas)
Incineration or co-
incineration
(e.g. power plants or
cement plants)
Drying
(e.g. paper)
Heating
(e.g. district heating)
Electrical energy in
general
each in different combinations
untreated waste
Same calorif ic value
High calorific fraction
Legend
Waste
Low calorif ic f raction
Refuse derived fuel
Fe/non-Fe metal
Plastic granule
Land fill
Inert
residues Inert
residues Inert
residues
Ashes/slags
Fe/non-Fe
Process steam
Syngas
Fuel gas
Electr. energy
District heat.
Steam
Municipal
waste
Mechanical-
biological treatment
Thermal
treatment2)
Production
processes1)
Energy
recovery
Material
recycling/
recovery1) The production-integrated closed material cycle management is not considered
Year 1996 1997 1998 1999 2000 2001 2002 2003 2004 2005 2006 2007 2008 2009 2010
Municipal waste kg/capita and year 604,9 609,4 599,2 639,4 601,4 590,6 568,8 568,8 587,2 595,5 599,2 609,3
thereof Household waste total 441,1 457,9 440,1 565,3 532,3 526,3 506,2 500,4 512,3 532,4 534,8 538,7
Household waste and commercial waste similar to
household waste, both collected via public waste
collection system
242,3 225,2 211,0 209,0 219,2 199,7 207,1 191,7 188,6 168,8 173,2 167,3 173,6 178,0 175,6
Bulky waste 36,6 38,6 38,7 36,8 31,2 32,5 35,5 31,6 31,4 26,3 27,3 28,4 30,0 29,8 29,9
Organic bin waste 29,4 35,8 40,3 38,8 42,9 45,5 42,0 41,8 44,4 45,8 45,6 45,5 47,5 47,5 46,0
Garden and park waste 50,4 46,6 50,6 47,6 49,1 54,8 53,9 56,3 60,7
Glass 43,1 41,9 38,2 37,6 39,9 37,6 43,3 23,4 27,2 30,2 29,9 30,9
Paper, board, cardboard 84,5 88,3 91,6 101,1 102,0 93,8 96,8 98,2 98,8 104,0 98,9 97,9
Light packaging / plastics 20,9 23,0 22,7 68,5 59,7 57,4 55,8 55,1 60,5 59,6 61,1 62,9
Waste electrical and electronic equipment 4,9 5,8 5,6 1,3 1,3 3,2 3,5 5,0 4,8 5,7 7,4 7,2
Other (composites, metals, textiles, etc.) 2,5 5,0 4,1 15,9 14,6 16,2 15,5 19,1 20,5 22,5 19,7 21,7
Hazardous waste 0,5 0,6 0,3 2,9 3,2 3,3 3,9 4,3 4,5 5,4 6,3 5,9
thereof Other municipal waste total 163,8 151,5 159,0 74,1 69,1 64,3 62,6 68,5 74,9 63,1 64,4 70,6
Commercial waste similar to household waste
separately delivered or collected64,8 64,7 61,9 85,5 63,9 80,5 52,2 50,0 41,7 45,3 46,4 52,5 44,2 42,7 46,5
Street cleaning residues / garden and park waste
(soil and stones)47,1 48,7 46,1 61,6 61,5 59,8 11,4 10,7 12,4 8,8 11,8 11,8 9,7 10,3 10,9
Biodegradable kitchen and canteen waste 5,9 4,3 7,0 5,8 7,3 8,1 6,5 8,5 8,9
(Open-air) Market waste 0,8 1,0 1,1 0,7 0,9 0,9 0,9 1,0 1,2 1,1 0,9 0,9 1,0 0,8 0,8
Fluorescent tubes and other mercury-containing
waste0,1 0,2 0,2 0,2 0,2 0,2 0,2 0,2
Other separately collected fractions 15,9 25,3 17,8 3,6 2,9 1,6 1,3 1,4 1,2 1,3 1,5 2,2
Hazardous waste 0,1 0,2 0,2 0,5 0,2 0,3 0,4 1,1
thereof
thereof

Chapter 4
138 State of the art of the co-incineration of waste-derived fuels and raw materials in clinker/cement plants
However, the quantity of residual waste decreased significantly from 242.2 kg per capita in 1996 down to 175.6 kg/capita in 2010. This development that the total waste quantity remains relatively stable but that the residual waste fraction is decreasing as the separately collected and recycled fractions are increasing is visualised in Figure 4.26. There, not all the different fractions of municipal waste are shown, but it does demonstrate the reason for the reduction of the residual waste fraction: the increasing separate collection and recycling of certain waste fractions, such as glass, paper/board/cardboard, bio waste, and light packaging/plastic, as well as the recovery of materials from mixed municipal waste. This is true both for household waste and commercial waste(9).
Figure 4.26: Development of residual municipal waste and certain separately collected and recycled fractions from municipal waste, based on [Kügler et al., 2009; Destatis Abfallbilanz 2006, 2009; Destatis Abfallbilanz 2007, 2009; Destatis Abfallbilanz 2008, 2010; Destatis Abfallbilanz 2009, 2011; Destatis Abfallbilanz 2010, 2012; Destatis Abfallbilanz Erläuterungen, 2012]
It is worth briefly analysing this development in more detail.
(9) As there had been observed high percentages of sham recovery for commercial waste (first described by [Lahl, 1999]), the Commercial Waste Ordinance was issued in 2002 [DE Waste Ord., 2002] which contributed to improved recovery rates of commercial waste [UBA Gewerbeabfälle, 2001; Krause/Wuttke, 2011]
Residual waste
Bio (organic) waste
Paper, board, cardboard
Glass
Light packaging / plastic

Chapter 4
State of the art of the co-incineration of waste-derived fuels and raw materials in clinker/cement plants 139
In 1993, concerning the disposal of household and commercial wastes, there was a turning point in waste management policy in Germany. The Technical Instructions on the Recycling and Treatment and other Type of Disposal of Municipal Waste were issued [DE TI Waste, 1993]. They stipulated that after 1 June 2005, it will not be allowed any more to landfill untreated waste. This date was confirmed by the Ordinance concerning the Environmentally Sound Deposit of Municipal Waste issued in 2001 [DE Deposit Ord., 2001]. As the technical instructions address the competent authorities, the ordinance is directly binding for everyone involved in waste management within those authority area. In 2009, the Ordinance concerning Landfills [DE Landfill Ord., 2009] bundle the ordinance from 2001 and other legal requirements for wastes. So, after June 2005, only the residues from waste incineration (after recovery of metals) or waste after mechanical-biological treatment (MBT) could be landfilled. First, the requirements for landfilling were so strict that they could only be achieved by incineration. This single option was controversially discussed and fought by a number of counties, municipalities and some experts who were not in favour of incinerating residual waste. As a consequence, mechanical-biological treatment was developed and the requirements for landfilling the biologically pre-treated residual waste were adapted to make this new technique applicable [Wendenburg, 2009]. A central element of MBT is the mechanical separation of the combustible components (paper/board, plastic, textile, composites, rubber etc.) from the residual waste resulting in solid recovered fuels (SRF) (see Figure 4.18). Depending on the composition of the processed residual waste and the techniques applied [Grundmann/Balhar, 2009], the composition of the SRF produced can widely vary. Further, the RDF also contains a wide range of inorganic and organic pollutants present in the residual waste (e.g. Jager et al., 1997). After the mechanical treatment, the waste is biologically treated either aerobically or anaerobically or both called mechanical-biological treatment, or is biologically dried (called mechanical-biological stabilisation), or is thermally dried (called mechanical-physical stabilisation) [Grundmann/Balhar, 2009]. Due to the described ban of landfilling of untreated waste, additional waste treatment capacities had to be installed. In 2002, the estimated gap between waste quantities and treatment capacities in Germany was between 4.3 and 8.0 million of tones [Zeschmar-Lahl, 2002]. This gap was filled by erecting additional incineration plants and the aforementioned, recently developed MBT plants. Concerning the co-incineration of SRF in cement plants, the MBT plants are relevant as they produce SRF as an output. Today, there are about 60 MBT plants in operation in Germany [Thiel, 2009; Alwast/Birnstengel, 2010] which do have a capacity to process residual household waste, bulky waste and commercial waste in a quantity of 5.8 – 7.1 million tonnes per year [Bilitewski, 2007; Thiel, 2009; Alwast/Birnstengel, 2010, Alwast, 2012]. However, the concept of MBT plants is considered to be a failure as it is associated with the output of a large fraction of waste to be disposed of in a landfill (but in this case biologically pre-treated) or in a municipal waste incineration plant, and it is not cheaper compared with incineration [Thomé-Kozmiensky/Beckmann, 2004; Bilitewski, 2007]. The SRF output of the MBT plants also led to the erection of 25 dedicated SRF power plants with a total capacity of 3.3 million tonnes per year (Thiel, 2009). In many cases, they supply an industrial installation in the immediate vicinity, such as a paper mill or, in one case, a cement plant (Rüdersdorf) [Thiel, 2009; Alwast/Birnstengel, 2010]. In the meantime, the aforementioned treatment capacity gap has been more than filled and there are now overcapacities now, mainly for incineration and MBT plants. As already indicated above, this is not attributed to waste prevention (which would mean the reduction of the overall waste quantity) but to still increasing rates of separate waste collection and recycling. In the past ten years, the total quantity of waste remained on a constant and relatively high level, whereas, due to increasing recycling activities, the amount of residual waste significantly decreased (Figure 4.26 and Figure 4.27) and is expected to decrease further (Figure 4.27).

Chapter 4
140 State of the art of the co-incineration of waste-derived fuels and raw materials in clinker/cement plants
Figure 4.27: Development of the quantities of municipal waste fractions from 1995 – 2010 and the prospects to 2020 [Alwast, 2012](10)
Also from the energy efficiency point of view, material recycling(11) should be preferred compared to incineration or co-incineration [Fricke et al., 2010; UBA Verpackungsordnung, 2011; Siechau/Thörner, 2012; Urban/Löhle, 2012]. This is also true for packaging plastic which is separately collected by the Duales System Deutschland (DSD) [Heyde et al., 2010]. Due to this further increase in recycling activities, it is expected that by 2020, there will be about 5 million tonnes less waste to be incinerated and about 2 million tonnes less waste to be processed in MBT plants [Alwast, 2012]. So, the recently increased capacities will have to be reduced step by step in the near future. As aforementioned in Chapter 4.3.2, SRF destined for combustion in cement kiln usually have to fulfil high requirements, such as maximum size of components, a certain size distribution, limits for the content of heavy metals and chlorine, and minimum calorific values. As a consequence, the processing is complex and requires several steps and greater effort [Pretz, 2008; Seifert et al., 2008]. With the available separation and sorting techniques, the quality of SRF can be improved [Pretz, 2008; Pretz et al., 2010; Pretz et al., 2012]. But this is associated with a larger fraction of residues to be disposed of, usually in incineration plants. The more complex the processing of municipal waste is, the higher the costs for the disposal of the residues are; for the process sequence illustrated in Figure 4.28, the percentage of the disposal costs is about 50 % of the total costs [Pretz, 2008]. There are economically driven new approaches to use municipal waste which has only undergone simple processing. For this purpose, the HOTDISC and the PREPOL Step Combuster have been
(10) The data for this graph have been taken from [Destatis Abfallentsorgung 2010, 2012]. However, the mentioned quantities reflect the quantities of waste which are delivered to the public German disposal plants. So, as the private sector is missing, the quantity is 16 % lower compared to the overall German waste balance (see Table 4.20). In Table 4.20, for 2010, a waste quantity of 609.3 tonnes per capita is given. With a population of 81.8 million in 2010, this corresponds with a waste quantity of 49.84 million tonnes. Nevertheless, the conclusions drawn in relation to the trend remain valid. (11) The term “material recycling” is used according to the Waste Framework Directive [EU WFD, 2008], i.e. the waste is reprocessed into products, materials or substances whether for the original or other purposes; it does not include energy recovery and the reprocessing into materials that are to be used as fuels or for backfilling operations.
1995 2000 2005 2010(a) 2015(p) 19952020(p)
(a): assumption; (p): prospects
[mio t]
Household waste
Market waste and street-
cleaning residues
Recycable. materials (dry)
Bulky waste
Organic waste
Total residual waste
Green waste (e.g. green cuttings)
Household-type commercial
waste for disposal
Total residual waste
13.8 mio t

Chapter 4
State of the art of the co-incineration of waste-derived fuels and raw materials in clinker/cement plants 141
developed (see Chapter 3.2.3). These approaches are associated with a higher input of pollutants and chlorine.
Figure 4.28: Process sequence to comminute, separate and sort municipal waste to obtain a SRF which meets high requirements so that it can be used as waste-derived fuels in cement plants, according to [Pretz, 2008]
The SRF output of the German MBT plants is 3 – 3.7 million tonnes per year [Grundmann/Balhar, 2009; Friege/Fendel, 2011]. According to the German Association of the Cement Manufacturers, 336,000 tonnes of the processed fraction of municipal waste were used in cement plants in 2011 (see Table 4.11). In contrast, a recent study reports that 752,500 tonnes were used in 2007 [INTECUS, 2010]; for this year (2007), the above mentioned association reports a quantity of 186,000 tonnes. This huge difference cannot be explained. In addition to the content of heavy metals and of organic pollutants present in the SRF derived from municipal waste, the chlorine content is also of relevance. It is significantly higher compared to conventional fuels. It is important to note that about 50 % of the chlorine load is caused by inorganic chlorides, especially contained in food waste (see Table 4.21). Another 38 % are caused by the small fraction (only 6.5 %) of components with a high chlorine content.
Mixed municipal
waste
Simple removal of impurities
by means of a hydraulic grab
Coarse comminution
Coarse screening (150 mm)
Magnetic separator
Fine screening (e.g. 20 mm)
Air classification
Automatic picking
Non-ferrous metal
separation
Automatic picking
Fe
fine
fraction
SRF
SRF
impurities
plastic
without
PVC
heavy
components
non-ferrous
metals

Chapter 4
142 State of the art of the co-incineration of waste-derived fuels and raw materials in clinker/cement plants
Table 4.21: Mass percentages and load percentages of the chlorine content in residual waste, [Schirmer, 2007]
Weight percentage (weight-%)
Percentage of chlorine related to the total chlorine load (%)
Fraction with high chlorine content ( > 1.0 weight-% Cl) (PVC and PVC composites, electronic waste, composites other than packaging, leather and rubber)
6.6 37.6
Fraction with medium chlorine content (0.5 – 1.0 weight-% Cl) (biodegradable organics, fine fraction 10 – 40 mm, fine fraction < 10 mm)
47.6 48.6
Fraction with low chlorine content (< 0.5 weight-% Cl) (hygiene products, composite packaging and plastic packaging except PVC and PVC composites, paper/board/cardboard, textiles, wood)
33.6 13.8
The range of the chlorine content measured by different organisations from 1991 to 2004 is relatively small (0.6 – 0.8 weight-%) (see Figure 4.29) and it is expected that it will not decrease in the future; on the contrary, due to the increasing consumption of polyvinyl chloride (PVC) in the construction sector, the chlorine content may even increase in the future [Schirmer, 2007]. Compared to municipal waste, the reported chlorine contents of commercial waste are even higher (0.9 – 3.5 weight-%) [Ketelhut, 2007; Ketelhut, 2008a; Ketelhut, 2008b].
Figure 4.29: Chlorine contents of residual waste reported in different publications, [Schirmer, 2007]
80 % quantile
20 % quantile
Average: 0.69 weight-%
(anhydrous)
Ch
lori
ne
co
nte
nt
(an
hy
dro
us
) in
[w
eig
ht-
%]

Chapter 4
State of the art of the co-incineration of waste-derived fuels and raw materials in clinker/cement plants 143
The elevated chlorine content of waste-derived fuels forced many operators to retrofit their cement plants with a chlorine bypass (see Chapter 3.3.4). 4.3.2.3.4.4 Sewage sludge
Sewage sludge results from municipal waste water treatment and cannot be avoided. In 2010, 1,887,408 t (as dry matter) of sewage sludge had to be disposed of in Germany. It mainly consists of microbial biomass to which heavy metals and non-polar organic pollutants do adsorb to. More and more organic pollutants, such as pharmaceuticals, pesticides, biocides, industrial chemicals, endocrine disruptive chemicals and organohalogen compounds are being identified in sewage sludges, and more will be detected in the future. So, sewage sludge is considered to be a sink of pollutants, whilst its disposal on agricultural land has been controversially discussed in the past decades owing to its nutrient content and potential contributing to soil humification. The basic composition of sewage sludge and the content of heavy metals as well as other inorganic compounds are compiled in Table 4.22. Concerning the organic pollutants, reference is given to the literature, e.g. [Schmitt et al., 2007; DE Klärschlamm, 2012].
Table 4.22: Parameters to characterise sewage sludge and its typical content of heavy metals and other inorganic compounds, based on [DE Klärschlamm, 2012]
Legend: dm = dry matter
Component / parameter Unit Range
Dry matter
mechanically dewatered sludge weight-% 25 - 35
thermally dried sludge weight-% 80 - 92
Ash content weight-% 30 - 50
Ignition loss weight-% 45 - 80
Net calorific value MJ/kg dm 10 - 12
Carbon weight-% 33 - 50
Oxygen weight-% 10 - 20
Hydrogen weight-% 3 - 4
Nitrogen weight-% 2 - 6
Sulphur weight-% 0.5 - 1.5
Fluorine weight-% < 0.01
Chlorine weight-% 0.05 - 0.5
Phosphorus g/kg dm 2 - 55
Antimony mg/kg dm 5 - 30
Arsenic mg/kg dm 4 - 30
Cadmium mg/kg dm 1.5 - 4.5
Chromium mg/kg dm 50 - 80
Copper mg/kg dm 300 - 350
Lead mg/kg dm 70 - 100
Manganese mg/kg dm 600 - 15000
Mercury mg/kg dm 0.3 - 2.5
Nickel mg/kg dm 30 - 35
Selenium mg/kg dm 1 - 5
Thallium mg/kg dm 0.2 - 0.5
Tin mg/kg dm 30 - 80
Vanadium mg/kg dm 10 - 100
Zinc mg/kg dm 100 - 300

Chapter 4
144 State of the art of the co-incineration of waste-derived fuels and raw materials in clinker/cement plants
A large number of publications explain why sewage sludge should not be distributed again on agricultural land (e.g. [Schönberger, 1990]). From the legal point of view, the application of sewage sludge on agricultural land is still possible in Germany. Nevertheless, more and more federal states strongly recommend to avoid application to land and instead to incinerate the sewage sludge (e.g. [Baden-Württemberg, 2002; Bavaria, 2005]). Due to the raising awareness of the countless number of pollutants in the sewage sludge, its application on agricultural land has progressively decreased and thus more and more sewage sludge is incinerated. In 2010, more than 53 % of sewage sludge was incinerated. The different available technical options are compiled in Figure 4.30. Sewage sludge is also co-incinerated in cement plants; within 8 years from 2003 to 2011, the quantity of sewage sludge co-incinerate in cement works drastically increased from 4,000 to 336,000 tonnes per year (see Table 4.11). So, about one third of the incinerated sewage sludge is co-incinerated in cement works. In most cases, dried sludge is fed through the main burner but also via secondary firing. There are also cases where sludge is co-incinerated following only mechanical dewatering; this is normally for cement plants that process raw materials with a high moisture content. Then, the co-incineration of sewage sludge increases the demand of thermal energy (see Chapter 4.3.2.1.2).
Figure 4.30: Available techniques for dewatering, drying and incineration of sewage sludge in Germany [Schmitt et al., 2007]
Where the sludge is fed via the main burner, it can be expected that the manifold organic pollutants will be completely oxidised due to the high temperature and long retention time in the kiln. This is not always the case for secondary firing (calciner, riser duct etc.). For the volatile heavy metals, especially for mercury, the use of sewage sludge can be associated with an increase in mercury emissions (see Chapter 4.4.3.5.3). In mono-incineration plants, the waste gas treatment is much more sophisticated compared to cement works and, thus, the mercury emissions are an order of magnitude lower [Lahl et
Sludge treatment/
stabilisation
Dewateringand thermal treatment of sewage sludge
Dewatering IncinerationThermal drying
Anaerobic
digestion
Aerobic
stabilisation
Mechanical
dewatering
Belt filter
press
Decanter
Chamber filter
press
Centrifuge
………
Solar drying in
or withoutcombinationwith other
techniques
Conventional
drying
Belt dryer
Thin film dryer
Disc dryer
Drum dryer
Fluidised beddryer
……..
Humification
Mono-incineration
Degassing/
pyrolysis
Gasification
Fluidised bed
furnace
Cyclone
smelting furnace
Multiple-
hearth furnac.
Co-incineration
Cement works
Coal-fired
power plants
Municipal
waste inciner.
conveyance / intermediate storage / transport

Chapter 4
State of the art of the co-incineration of waste-derived fuels and raw materials in clinker/cement plants 145
al., 2012]. The mercury emissions may be a limitation for the co-incineration of sewage sludge in the future unless additional abatement techniques are applied. There are two further limitations. On the one hand, there will be an increasing need to recycle phosphorus as this resource is very limited. As the co-incineration of sewage sludge in cement plants does not allow phosphorus recovery, the emerging policy emphasis on resource efficiency may become an obstacle, on the German [DE Klärschlamm, 2012] as well as on the European level [EC Roadmap, 2011]. On the other hand, the phosphorus content of the sewage sludge (2 – 55 g/kg dry matter – see Table 4.22) can form a limitation on its use as a fuel with respect to cement product quality. Phosphorus oxide (P2O5 = P) is mainly incorporated in crystals of a solid solution of belite (C2S = dicalcium silicate) and C3P (tricalcium phosphate). Belite with a certain amount of C3P-component does not react with free lime at sintering conditions in the kiln, causing clusters of belite and free lime (Schneider et al., 2011). Additionally, ion substitution reactions (2 Si4+ ↔ Al3+ + P5+) lead to a further increase in the belite content and a decrease in the C3A (tricalcium aluminate) content of the clinker. The influence of phosphorus can have effects on the specification of cements produced with the clinker, e.g. lower early strength or longer setting times [Puntke/Schneider, 2008]. As a consequence, limits for the phosphorus content in the clinker have to be individually adjusted for each plant and clinker [Schneider et al., 2011]. As a guidance value, the phosphorus content in the clinker may not exceed 0.8 - 1.0 % P2O5. Of course, such a value covers all input materials (raw materials, conventional fuels, waste-derived fuels and waste-derived raw materials). Where the phosphorus input with the raw materials is already high, the possible additional input with waste-derived fuels and raw materials is small or smaller respectively. 4.3.2.3.5 Classification of waste-derived fuels
From the technical perspective, the characterisation of fuels can be divided into material properties, such as chemical, mechanical and calorific properties, and reaction-technical properties (Figure 4.31).
Figure 4.31: Fuel properties according to [Beckmann et al., 2012; Seifert et al., 2008]
Here, only the chemical and calorific properties are considered, especially with respect to the classification of waste-derived fuels by defining specifications and standards.
Chemical properties- Distinction between combus-
tible and non-combustible
substances
- Volatile matter content
- Elementary and trace
analysis
- ……….
Mechanical properties- Density of combustible and
non-combustible substances
- Bulk properties and shelf life
- Grindability and particle size
distribution
- ……….
Calorific properties- Gross and net calorific value
- Specific minimum air
requirement (flue gas flow)
- Adiabatic combustion
temperature
- ……….
Reaction-technical
properties- Ignition temperature
- Combustion behaviour
- Slag formation, fouling layer
formation and corrosion
potent.
- ……….
Fuel
.
.

Chapter 4
146 State of the art of the co-incineration of waste-derived fuels and raw materials in clinker/cement plants
There are several specifications and standards existing on the European as well as on the national levels which define waste-derived fuels qualities or product qualities for fuels derived from waste sources. An overview has recently been published [UBA AT, 2012]. Concerning co-incineration of waste-derived fuels in cement plants, the Standard of the European Committee for Standardisation (CEN) on specifications and classes for solid recovered fuels (SRF) [EN 15359, 2012] is most important. This standard and its development will be presented in more detail for two major reasons: Firstly, this standard is the only one on the European level, and secondly, this standard cannot be considered as an adequate tool which contributes to a high level of environmental protection as required by the Industrial Emissions Directive (IED) [EU IED, 2010] in which the former Waste Incineration Directive (WID) [EU WID, 2000] had been incorporated. It is necessary to take a closer look at the development of the standard in order to understand the approach applied and to discuss the parameters of the standard in comparison with other existing national standards.
A) Development of the specifications and classes for SRF in the form of EN 15359 [EN 15359, 2012]
A1) Main steps of the development The main steps for the development of the standard are compiled in following Table 4.23.
Table 4.23: Steps taken for the development of the EN 15359 standard
Date Description
1996 The process started in this year when an industrial consortium (13 partners from 7 Member States) filed a project proposal Fuel and Energy Recovery within the Commission’s THERMIE program (contract DIS-1375-97-FI) [CEN, 2002].
26.11.1998 The results of the study were presented at a workshop in Brussels.
1999 An industrial consortium (15 partners from 7 Member States) filed a project proposal Waste to Recovered Fuel with the Commission’s Fifth Framework Programme (contract number NNE5-1999-533) in order to facilitate CEN’s standardisation of solid recovered fuels, and to elaborate a cost-benefit analysis (CBA). The scope of this CBA was fuel recovery and energy recovery versus state-of-the-art landfilling.
April 2000 On proposals from the Finnish Standards Association (SFS) and the European Commission, CEN/Technical Board decided to establish Task Force 118 in order to develop a technical report on Solid Recovered Fuels and a work programme for a technical committee to be established, i.e. a list of needed standards. Delegates from 12 Members States have participated in the work. Guided by the steering committee of the task force (EC contract NNES-1999-00533 “Waste to Recovered Fuel”), the Institute for Environment and Sustainability (IES) of the Joint Research Centre (JRC) of the European Commission collected information about the quality of the produced recovered fuel.
29.05.2001 The results for the above mentioned CBA were presented and discussed at a workshop which was jointly organised by the European Recovered Fuels Organisation (ERFO), and the European Commission [CEN, 2002].
2002 The results of the aforementioned study of the JRC/IES are documented in a report concerned (JRC IES, 2002). One of the conclusions was that the large ranges in analytical results justify the need for a standard with limit values. It was recommended to DG Environment to give a mandate to CEN to draft a European standard for waste-derived fuels based under the Waste Incineration Directive [EU WID, 2000] and the European Waste List [EC Waste List, 2000].

Chapter 4
State of the art of the co-incineration of waste-derived fuels and raw materials in clinker/cement plants 147
26.08.2002 DG Energy and Transport together with DG Environment give the mandate to CEN to develop European Standards concerning the use of SRF [DG ENER/ENV, 2002]. In the mandate, it is indicated that the standard is for SRD prepared from non-hazardous waste and that it has to meet the intention of the WID, inter alia to achieve a high level of environmental and human health protection. Consequently, CEN established the Technical Committee (TC) “Solid Recovered Fuels” under the number 343, abbreviated CEN/TC 343. The CEN/TC 343 work was delegated to following five working groups (WG) engaged in the standardisation of SRF:
WG 1: Terminology and Quality Assurance WG 2: Fuel specifications and classes WG 3: Sampling, sample reduction and supplementary test methods WG 4: Physical/Mechanical tests WG 5: Chemical Tests
Here, the focus is laid on the results of WG 2 as it elaborated the fuel specifications and classes. The results of the other working groups are mentioned in the footnote below [EN 15359, 2012](12).
15-16.09.2003 The first draft standard of Working Group 2 was discussed at its first meeting in FR-Lyon. It foresaw a classification system on a limited numbers of properties which were considered as the seven key properties of SFR [ERFO, 2005]:
- net calorific value - moisture content - ash content - chlorine content - mercury content - cadmium and thallium content (as the sum of those two) - sum of heavy metals
The WG decided at the meeting in Lyon to reduce the number of key properties from seven to only three [ERFO, 2005]:
- net calorific value - chlorine content - mercury content
09-10.02.2004 Meeting of Woking Group 2 in Brussels; it was decided to define closed classes without overlapping between the classes for three parameters and a proposal was
(12) List of results of the other working groups:
prEN 15357, Solid recovered fuels — Terminology, definitions and descriptions EN 15358:2011 Solid recovered fuels – Quality management systems – Particular requirements for their
application to the production of recovered fuels (EN 15358, 2011) prEN 15400, Solid recovered fuels — Methods for the determination of calorific values prEN 15403, Solid recovered fuels — Methods for the determination of ash content prEN 15408, Solid recovered fuels — Methods for the determination of sulphur (S), chlorine (Cl),fluorine (F) and
bromine (Br) content prEN 15411, Solid recovered fuels — Methods for the determination of the content of trace elements (As, Ba, Be,
Cd, Co, Cr, Cu, Hg, Mo, Mn, Ni, Pb, Sb, Se, Tl, V and Zn) prEN 15414, Solid recovered fuels — Determination of moisture content using the oven dry metho — Part 1:
Determination of total moisture by a reference method prEN 15414-2, Solid recovered fuels — Determination of moisture content using the oven dry
method — Part 2: Determination of total moisture by a simplified method prEN 15414-3, Solid recovered fuels — Determination of moisture content using the oven dry
method — Part 3: Moisture in general analysis sample prEN 15415, Solid recovered fuels — Determination of particle size and particle size distribution by screen method prEN 15440, Solid recovered fuels — Method for the determination of biomass content prEN 15442, Solid recovered fuels — Methods for sampling

Chapter 4
148 State of the art of the co-incineration of waste-derived fuels and raw materials in clinker/cement plants
submitted to CEN/TC 343 on 11 February 2004 which was already very close to the final version (see Table 4.24); afterwards, only three values for the chlorine content were slightly changed: ≤ 0.2 instead of ≤ 0.1 for class 1, ≤ 0.6 instead of ≤ 0.5 for class2, and ≤ 3 instead of ≤ 6 for class 5 [ERFO, 2005].
11.02.2004 The Technical Committee passed the proposal of Working Group 2.
24.09.2004 In another meeting, Working Group 2 adopted the final version of the defined classes. In the following eight years until the adoption and publication of the CEN standard, the decision taken at this meeting remained unchanged.
February 2005 Publication of the approach applied in form of the report “Classification of Solid Recovered Fuels” published by the European Recovered Fuel Organisation (ERFO, 2005). It is the only publicly available document which provides indications on the approach for the development of the standard. This document needs to be reflected as there are strong concerns whether the approach applied is appropriate and whether the standard developed is acceptable from the environmental protection point of view (see the section A 3 below). With respect to the above mentioned proposal, strong concerns were already issued by the European Environmental Citizens Organisation for Standardisation (ECOS) in 2005 [ECOS, 2005] stressing that environmental NGOs’ key demands had not been met.
01.06.2010 At the plenary meeting of CEN/TC 343, ECOS again referred to the strong concerns made in 2005. All the different points made were rejected. The chairman explained that “the main reason for the rejection was that CEN/TC 343 is not responsible for how and in what installations the classified SRFs are used. It is the competent authority that gives the case by case permission for each and every fuel a plant uses” (see the electronic message from CENCELEC dated 30.07.2010 in [ECOS, 2011]).
29.06. and 09.07.2010
The technical expert of ECOS (Mr Christian Tebert) summarises the concerns (see his electronic message dated 09.07.2010 in [ECOS, 2011], and his presentation given on 29.06.2010 [ECOS, 2010]. However, no changes were made.
September 2010
The draft standard was sent for formal vote. This consultation did not lead to any changes.
21.10.2010 The formal vote on the draft standard closed with its approval.
18.02.2011 ECOS filed an appeal against the ratification of the standard [ECOS, 2011] along with a technically detailed analysis and argumentation. The points made are practically the same as already tabled in 2005 and 2010 (see above). They are summarised as follows:
There are no limitations concerning the waste used to produce SRF (not using a positive listing)
The preparation of composite samples is carried out on the basis of unacceptable total quantities (only one tenth of a 12 months rolling period of production of the fuel to be classified)
The pollution prevention principle has not been followed. Standardised SRF do not contribute to the minimisation of
pollutants because practically any heavy metal content is allowed. The opportunity to set cut-off criteria for producing “clean"/"green" fuel out of waste was missed.
The mercury values of classes 2, 3, 4, and 5 are too high. Such values are difficult to abate and run the risk of increased emissions, in particular in cement co-incineration with SRF where no abatement for elementary mercury is available
No classes have been defined for Cadmium and Thallium.
No cut-off criteria have been set for other heavy metals with high toxic potential, in particular nickel, lead, chromium, cobalt,

Chapter 4
State of the art of the co-incineration of waste-derived fuels and raw materials in clinker/cement plants 149
arsenic.
The classes defined by CEN TC 343 for net calorific value allow waste to be defined as "fuel" although its contribution to the combustion process is close to zero.
The class 5 defined by CEN TC 343 for chlorine allows very high chlorine content in waste (1.5 - 3.0 %) to be used as a standardised fuel.
14.03.2011 The chairman of CEN/TC 343 (Martin Frankenhäuser) replied to the appeal of ECOS. He shares the view that the Finnish, Italian and German standards are stricter. In addition, he pointed out that “the classification system is designed to incorporate all potential non-hazardous waste streams that can, by today’s technologies, be upgraded to fuel to be used in ‘co-incineration’ in different available combustion technologies in Europe” [CEN/TC 343, 2011].
24.05.2011 The Technical Committee Management Group of the CEN Technical Board met to discuss the ECOS appeal and decided to publish the standard. However, it was pointed out that CEN/TC 343 “Solid recovery fuels” should start an early review of the standard as soon as possible in order to take into account the ECOS comments.
Summer 2011 The Technical Board took the final decision on the appeal and rejected it.
November 2011
Finally, the standard was published in November 2011 as EN 15359 [EN 15359, 2012]. ERFO expressed its opinion that the standard provides for an excellent basis for communication between producers, client and authorities and that SRF produced according to EN 15359 and other standards developed by CEN/TC 343 (see the footnote above) can be safely used in co-incineration [ERFO, 2012]
07.02.2012 At the CEN/TC 343 plenary meeting, it was decided that an “immediate review” of the standard shall not be considered. The representatives pointed out that the standard has been developed using proper scientific preparation and validation. The standard is used beneficially already and it would not make sense to amend it” [ERFO, 2012]. Apart from ECOS, all participants of this meeting were from industry. The “three liaison organisations ERFO, CEMBUREAU and PlasticsEurope had sent their positions to TC secretary” [CEN, 2012] and were rejecting all the objections. For CEN/TC 343, the ECOS-appeal is therefore closed and EN 15359 can be used as it has already been in use for some time. Producers, clients and authorities are encouraged to do so and experience the advantage of using the same “SRF-language”” [ERFO, 2012].
A2) Specifications and classes Figure 4.32 shows a simplified chart which illustrates the application of the developed standard and the actors involved.

Chapter 4
150 State of the art of the co-incineration of waste-derived fuels and raw materials in clinker/cement plants
Figure 4.32: Simplified chart for the solid recovered fuels supply chain; the EN 15359 standard applies at the point of delivery SRF, [EN 15359, 2012]
Table 4.24 presents the developed classification system for SRF and Table 4.25 the obligatory template for the specification of solid recovered fuels. The template asks for a lot of information. However, classes are only defined for the three parameters mentioned in Table. Thereby, concerning waste-derived fuels, the net calorific value shall represent the economic value, the chlorine content the technological restrictions and the mercury content the environmental impact (ERFO, 2005). It is notable that the environmental impact is limited to the consideration of one parameter. As demonstrated in the next section (A3), the definition of the classes was not based on an environmental approach. In addition, the approach used cannot be considered to be satisfactorily science-based.
Table 4.24: Classification system for SRF according to CEN/TS 15359:2006
Legend: (d): dry; (ar): as received
Classification property
Statistical measure
Unit Class
1 2 3 4 5
Net calorific value (NCV)
Mean MJ/kg (ar) ≥ 25 ≥ 20 ≥ 15 ≥ 10 ≥ 3
Chlorine (Cl) Mean % (d) ≤ 0.2 ≤ 0.6 ≤ 1.0 ≤ 1.5 ≤ 3.0
Mercury (Hg) Median mg/MJ (ar) ≤ 0.02 ≤ 0.03 ≤ 0.08 ≤ 0.15 ≤ 0.50
80th percentile mg/MJ (ar) ≤ 0.04 ≤ 0.06 ≤ 0.16 ≤ 0.30 ≤ 1.00

Chapter 4
State of the art of the co-incineration of waste-derived fuels and raw materials in clinker/cement plants 151
Table 4.25: Obligatory template for the specification of solid recovered fuels (SRF) according to CEN/TS 15359:2012, [EN 15359/2012]
Legend: (d): dry; (ar): as received
Obligatory information and parameters to specify SRF
Class code (see Table above):
Origin1:
Particle form2:
Particle size3: Test method6
Parameters Unit Value Test method6
Typical4 Limit value5
Ash % (d)
Water % (ar)
Net calorific value MJ/kg (ar)
Net calorific value MJ/kg (d)
Chlorine (Cl) % (d)
Antimony (Sb) mg/kg (d)
Arsenic (As) mg/kg (d)
Cadmium (Cd) mg/kg (d)
Chromium (Cr) mg/kg (d)
Cobalt (Co) mg/kg (d)
Copper (Cu) mg/kg (d)
Lead (Pb) mg/kg (d)
Manganese (Mn) mg/kg (d)
Mercury (Hg) mg/kg (d)
Nickel (Ni) mg/kg (d)
Thallium (Tl) mg/kg (d)
Vanadium (V) mg/kg (d)
∑ Sb + As + Cr + Co + Cu + Pb + Mn + Ni + V
mg/kg (d)
1 Preferable to European Waste List (EC Waste List, 2000), 4 or 6 digit code; for mixtures and blends a combination of codes can be used 2 Examples of particle forms are pellets, bales, briquettes, chips, powder, fluff. 3 By sieving or equivalent techniques, expressed as dx, where d is the particle size on the distribution curve where x percent oases. 4 The typical value is the mean value for the physical properties and the properties of the elements except for heavy metals and trace elements, in which case the median value should be used, for SRF over an agreed or specified period of time. 5 The limit value (maximum, minimum or 80th percentile, in case the median has been used as typical value) will be agreed upon and defined by the user and producer, and refers to a consignment, e.g. 80th percentile for the heavy metals and trace elements, in which case the median value should be used. 6 According to relevant CEN test methods (Technical Specifications or Standards) or other relevant test methods

Chapter 4
152 State of the art of the co-incineration of waste-derived fuels and raw materials in clinker/cement plants
A3) Reflection of the standard and the approach used to develop the classification The above mentioned report “Classification of Solid Recovered Fuels” published by the European Recovered Fuel Organisation [ERFO, 2005] seems to be the only publicly available report where the approach to develop the standard is laid down. There, analytical data from seven Member States and Norway are presented and statistically processed. The data were produced between 1998 and 2004. For mercury, the results are compiled in Table 4.26. As mercury is the only pollutant that classes were developed for, the development for this parameter is presented and discussed. A conclusion is drawn regarding whether the development of the classes, which form the core of the standard, was based on a scientific approach. In addition, the proposed values for the different classes are compared with standards and limits which already existed in some Member States and in Switzerland.
Table 4.26: Compilation of analytical data for mercury in different SRF from seven Member States and Norway contained in [ERFO, 2005]
Designation Origin of waste Period of dataNumber of
analysis
Number of
analysis
below DL
Share of
analysis
below DL
me-
dian
ave-
rage
80th per-
centile
maxi-
mum
standard
deviation
[%] [mg/ kg d] [mg/ kg d] [mg/ kg d] [mg/ kg d] [mg/ kg d]
AT 2 MSW+sludge 10/2001 54 0 0 0.51 1.31 0.69 13.89 2.51
AT 3 MSW+sludge 8/2003 56 0 0 0.71 0.77 0.96 2.51 0.48
BE 1 selected commercial waste 1/2003 - 6/2003 67 57 85 1.00 1.24 1.00 4.00 0.63
BE 2 selected commercial waste 1/2003 - 6/2003 57 42 74 1.00 1.33 2.00 4.00 0.64
BE 3 filter cake 2003 - 7/2004 30 24 80 0.70 0.90 0.80 2.30 0.52
BE 4 filter cake 2003 - 7/2004 44 39 89 0.90 1.30 0.94 5.30 1.17
BE 5 filter cake 2003 - 7/2004 64 52 81 0.19 3.00 1.92 16.1 2.61
BE 6 wood, sludge, act. carbon 2003 - 7/2004 707 554 78 0.70 1.50 0.69 67.3 3.37
BE 7 resins, act. carbon, bleach. earth 2003 - 7/2004 11 11 100 0.60 0.60 0.62 0.60 0.00
BE 8 polymers 2003 - 7/2004 42 42 100 0.50 0.50 0.50 0.50 0.00
DE 1 selected commercial waste 1/2002 - 9/2003 190 127 67 0.20 0.24 0.21 1.80 0.15
DE 2 MSW 1/2002 - 9/2003 209 93 44 0.25 0.44 0.50 4.80 0.56
DE 3 MSW n.a. 70 n.a. n.a. 0.43 0.47 0.57 1.10 0.15
DE 4 municipal sludge 1/1998 - 12/1998 178 n.a. n.a. 0.49 0.66 0.90 5.50 0.66
DE 5 municipal sludge 1/1998 - 12/1998 178 n.a. n.a. 0.49 0.66 0.90 5.50 0.66
DE 6 demolition wood 1/1998 - 12/1998 65 28 43 0.09 0.14 0.20 0.55 0.11
Finland FI 1 source selected MSW 3/1998 - 4/2003 42 7 17 0.20 0.36 0.27 7.50 1.13
IT 1 MSW 2/2001 - 7/2003 62 0 0 0.40 0.45 0.67 1.16 0.29
IT 2 MSW 2001 - 2002 13 n.a. n.a. 0.23 0.54 0.84 2.80 0.75
IT 3 MSW 1/2003 - 3/2004 13 0 0 0.46 0.62 0.94 1.70 0.47
NL 1 MSW 1/2002 - 8/2003 22 18 82 0.20 0.20 0.20 0.61 0.14
NL 2 MSW 1/2002 - 8/2003 22 2 9 0.28 0.49 0.56 1.79 0.53
NL 3 MSW 1998 - 2001 42 20 48 0.36 0.37 0.54 1.13 0.25
NL 4 MSW (WOF) 9/2002 - 8/2003 42 0 0 0.92 0.92 1.10 1.77 0.27
NL 5 municipal sludge n.a. 21 0 0 0.68 0.70 0.78 1.00 0.11
NO 1 demolition wood 2002 - 2004 20 2 10 0.12 0.13 0.20 0.49 0.13
NO 2 selected commercial waste 2002 - 2004 25 0 0 0.21 0.28 0.35 0.91 0.21
NO 3 light industr./commercial waste 2002 - 2004 31 n.a. n.a. 0.5 0.56 0.90 1.85 0.40
SE 1 waste wood 7/2002 - 1/2004 28 0 0 0.12 0.39 0.36 5.49 1.02
SE 2 waste wood 7/2002 - 1/2004 117 7 6 0.05 0.07 0.08 0.39 0.07
SE 3 selected commercial waste 7/2002 - 1/2004 17 0 0 0.24 0.26 0.28 0.41 0.07
SE 4 selected commercial waste 7/2002 - 1/2004 90 0 0 0.13 0.20 0.21 4.29 0.45
Total 2629 1125 42.8
MSW = Municipal Solid Waste
WOF = Waste Organic Fraction
n.a. = not available
DL = detection limit
Netherlands
Norway
Sweden
Austria
Belgium
Germany
Italy

Chapter 4
State of the art of the co-incineration of waste-derived fuels and raw materials in clinker/cement plants 153
The approach applied comprised following elements:
The ELV (0.05 mg/Nm3) of the Waste Incineration Directive [EU WID 2000](13) can be fully exhausted,
The substitution rate of conventional fuels by waste-derived fuels is 100 %,
The mercury contamination of the raw materials is not taken into account,
Transfer factors (from the input, i.e. from the SRF processed, to the output, here the emissions to air) were used,
The filter dust is regularly discarded (however, this is not explicitly expressed),
Especially for class 5, the results of the calculations and estimations respectively, were ignored. In the following, the aforementioned elements are evaluated by comprehensive consideration. Table 4.26 reports the results of 2629 analysis; surprisingly, 1125 analysis (42.8 %) are below the detection limit. Concerning the emissions of mercury to air, it is assumed that practically no mercury is incorporated into the clinker as quantitatively all mercury is volatilised. This is indeed the case (see Chapters 3.2.4.2.2, 4.4.1 and 4.4.3.5). So, the mercury input by the raw materials and the fuels is completely exhausted from the kiln and preheater and finally reaches the dust filter where part of it is removed from the waste gas by adsorption to dust particles. The removal efficiency mainly depends on the waste gas temperature, the ratio of the compound and direct operating mode (see Chapter 3.3.3), the type of filter (the removal efficiency of bag filters is higher compared to electrostatic precipitators) as well as on the filter dust discarding system. The removal efficiency is equal to the transfer factor of mercury from the input to the waste gas which is one of the output pathways (see Chapter 4.4.1). Thus, part of the mercury is emitted via the waste gas and the other part is adsorbed to the dust which is largely removed in the dust filter (bag filter or electrostatic precipitator). This is expressed in following equation (according to the approach, that mercury is only introduced with the SRF; therefore, the mercury quantity (mass) in the waste gas is called mHg, SRF) (Equation 4-1).
Equation 4-1: The mercury input with SRF which is transferred to the waste gas and filter dust
As the approach is to fully exhaust the ELV for mercury according to the IED (ELVHg,IED/WI: 0.05 mg/Nm3), the maximum amount of mercury that can be introduced to the system with SRF was calculated (mHg
max,SRF) taking into account the elimination in the filter and the transfer factor to air. Consequently, the aforementioned equation can be transferred into the following one (Equation 4-2).
Equation 4-2: The maximum amount of mercury that can be introduced to the system with SRF
The dimension of the summands is [mg/MJ] in order to avoid absolute masses but to have relative masses. For this purpose, the waste gas flow is related to the net calorific value, called specific waste gas flow Vwg,spec (Equation 4-3). The transfer factors are defined in Chapter 4.4.1.
Equation 4-3: The maximum tolerable input of mercury depending on the transfer factor
(13) The Waste Incineration Directive became Chapter IV of the new Industrial Emissions Directive [EU IED, 2010]
mHg,SRF = mHg,waste gas + mHg,filter dust
mHg max,SRF = ELVHg,IED/WI • Vwg,spec + (mHg max,SRF - mHg max,SRF • TFwg)
mHg max,SRF =ELVHg,IED/WI • Vwg,spec
TFwg
=ELVHg,IED/WI • Vwg,spec • 100
TFwg [%]

Chapter 4
154 State of the art of the co-incineration of waste-derived fuels and raw materials in clinker/cement plants
To have the same dimension for the total mercury quantity (mass), the maximum tolerable mercury concentration of the SRF is divided by the net calorific value (see Equation 4-4 below).
Equation 4-4: The maximum tolerable input of mercury in relation to net calorific value
Consequently, the maximum possible mercury concentration in the SRF (as received (ar) at a plant) can be calculated with following equation (Equation 4-5).
Equation 4-5: The maximum tolerable mercury concentration in the SRF
With the mentioned ELV (0.05 mg/Nm3) and a specific waste gas flow of 0.66 Nm3/MJ (this value had been taken from the first edition of [NRW MUNLV, 2005]; the value can be considered to be realistic as it can be cross-checked with an energy demand of 2.9 – 3.5 MJ/kg clinker (see Chapter 4.3.2.1.1) and a clinker-specific waste gas flow of 2.1 – 2.4 Nm3/kg clinker (see Chapter 4.4.3.1), Equation 4-5 can be converted to Equation 4-6.
Equation 4-6: The ELV-specific maximum tolerable mercury concentration in the SRF
The division of this equation with by the net calorific value gives the maximum tolerable mercury concentration in the SRF in mg/MJ ar (Equation 4-7). This dimension is often used to take the net calorific value of wastes into account when comparing different wastes.
Equation 4-7: The ELV-specific maximum tolerable mercury concentration in the SRF directly depending on the transfer factor
Concerning the transfer factors, the aforementioned ERFO report [ERFO, 2005] uses a range of 10 – 40%. This means that only 10 – 40 % of the mercury present in the waste gas reaching the filter will be emitted; conversely 60 – 90 % is removed in the filter and remains in the filter dust. However, the report does not provide a source for this assumption [ERFO, 2005, p 35]. It will be shown that a transfer factor of only 10 % is far too optimistic. Using the transfer factors 10 – 40 %, following range for the maximum possible mercury content in the SRF results: 0.082 – 0.33 mg/MJ ar [ERFO, 2005, pp 8 and 35]. First of all, the approach to exhaust the ELV does not comply with the intention of the Waste Incineration Directive. Recital (27) of it states: “The co-incineration of waste in plants not primarily intended to incinerate waste should not be allowed to cause higher emissions of polluting substances in that part of the exhaust gas volume resulting from such co-incineration than those permitted for dedicated incineration plants and should therefore be subject to appropriate limitations.” However, as explained above, the maximum possible mercury content in the SRF was calculated with the approach to fully exhaust the existing ELV. Consequently, the mandate given by DG Energy and Transport together with DG Environment to develop the standard [DG ENER/ENV, 2002] was not
mHg max,SRF =cHg max,fuel
NCV
cHg max,SRF [mg/kg ar] = [(ELVHg,IED/WI • Vwg,spec • 100) / TFwg [%]] • NCV
cHg max,SRF [mg/kg ar] = [(0.05 mg/Nm3 • 0.66 Nm3/MJ • 100) / TFwg [%]] • NCV
cHg max,SRF [mg/MJ ar] = (0.05 mg/Nm3 • 0.66 Nm3/MJ • 100) / TFwg [%]

Chapter 4
State of the art of the co-incineration of waste-derived fuels and raw materials in clinker/cement plants 155
complied with as it indicated that the standard is for SRF prepared from non-hazardous waste and that it has to meet the intention of the WID, inter alia to achieve a high level of environmental and human health protection. Secondly, the mercury content of raw materials is not taken into account. This does not fit with the other aforementioned element to exhaust the ELV because the contribution of the raw materials would lead to exceeding the ELV. The mercury content of the raw meal varies within a large range (0.01 – 0.5 mg/kg raw meal (as dry matter) – see Table 4.2). Thus, depending on the individual case, the contribution can vary considerably. For instance, with a mercury content of 0.05 mg/kg raw meal, a typical clinker factor of 1.56 kg kiln meal/kg clinker [Waltisberg, 2012] and a specific waste gas flow for 4-stage cyclone preheater kilns of 2.30 Nm3/kg clinker [Locher, 2000], the mercury concentration in the raw gas (before the filter) can be estimated to be 0.068 mg/Nm3 (1.56 x 0.1 / 2.3). With a removal efficiency of 60 %, the mercury concentration in the emitted waste gas would be 0.027 mg/Nm3 which is about half of the ELV for incineration and co-incineration plants. So, the ignoring of the contribution of the raw materials is incompatible with a scientific approach. Conventional fuels would also contribute to the emission of mercury but as the approach foresees 100 % substitution by SRF, this contribution is not considered. Thirdly, the lower value of the range of the transfer factor, i.e. 10 %, is too low leading to high possible maximum mercury content in the SRF. As already indicated, no source is mentioned for this range which is given in [ERFO, 2005, p 35]. However, it seems that it has been taken from the first edition of [NRW MUNLV, 2005]. In this report, a transfer factor of 40 % is mentioned [NRW MUNLV, 2005, pp 55 and 57]. But this value is associated with systematic discarding of the filter dust. This is not mentioned in [ERFO, 2005] but should be. If the filter dust is not discarded (in most cases, it is discarded via a valve and added to the clinker before cement grinding), the transfer factor to the waste gas is practically 100 % [Linero, 2011] (see Chapter 3.2.4.2.2). The transfer factor of only 10 % is indirectly mentioned in Annex 7 of [ERFO, 2005, p 59] referring to [VDI 2094, 2003] where it is said “Indications from measurements performed on cyclone preheater kiln systems are that more than 90 % of the Hg is present in particulate form at exhaust gas temperatures below 130°C. This means that the Hg compounds are virtually completely removed in the electrostatic precipitator of the kiln system”. This statement refers to a doctoral thesis from 1994 [Kirchartz, 1994, pp 78-79]; the graph concerned is shown in Figure 3.36. This directly leads to an important issue: the dependence of mercury emissions on the waste gas temperature. This has not been reflected at all but is critical. It is demonstrated and explained in Chapter 4.4.3.5 in detail. The cement plants actually only achieve waste gas temperatures below 130°C in exceptional cases. Consequently, the transfer factor of 10 % is far too low. Transfer factors according to the so-called black box method (see Chapter 4.4.1) were reported to be between 40 and 93 % (Table 4.31); however, the strong temperature influence was not considered. In [ERFO, 2005, p 8], it is stated: “It is of importance that each plant that wants to use secondary fuel first makes a study to determine what the transfer factors are for each metal”. This statement can be confirmed. But then, it would be a logical consequence not to define the classes of EN 15359. Against this background, the upper value of the range of the maximum possible mercury content of the SRF (see the value 0.33 mg/MJ ar) is not reasonable; it cannot be stated that it was derived from a scientific approach. Nevertheless, for class 5, the median value was set to 0.5 mg/MJ ar and the 80th percentile even to 1.0 mg/MJ ar (see Table 4.24). Such high values will lead to elevated mercury emissions. The reason is that “the classification system is designed to incorporate all potential non-hazardous waste streams that can, by today’s technologies, be upgraded to fuel to be used at ‘co-incineration’ in different available combustion technologies in Europe” [CEN/TC 343, 2011]. Concerning mercury, municipal sludges shall specifically be covered, even those which are merely mechanically dewatered. Although they have a very low net calorific value and cannot be considered as a fuel, their use is justified by the argument that they substitute natural raw materials. However, the use of such sludges is associated with an increase in energy demand (see Chapter 4.3.2.1.2) and an increase in mercury emissions.

Chapter 4
156 State of the art of the co-incineration of waste-derived fuels and raw materials in clinker/cement plants
It has to be concluded that the classes defined for mercury are neither based on the target to achieve a high level of environmental protection nor on a scientific approach. It seems that the main driver was business, i.e. to “support the free trade of these fuels on the internal market” [Frankenhäuser, 2008; Frankenhäuser, 2011], and the strong will to co-process waste-derived fuels in cement plants as much as possible in order to minimise costs. It cannot be considered as a high quality standard for SRF on the European level as claimed by [ERFO, 2010]. This conclusion is also confirmed by the comparison of the mercury values defined in EN 15359 with other existing standards in Europe (see (B) below). In addition, it is a weakness of the standard that it considers only one pollutant. Specifically, lead and cadmium should also be considered as their emission can be higher at the higher chlorine inputs (see Chapter 3.3.4) that are typical at many cement plants due to the use of waste-derived fuels. Concerning the classes for the net calorific value and chlorine, the approach was also not driven by environmental and scientific considerations but by interests of stakeholders. This is confirmed by the convenor of Working Group 2 who wrote in July 2010: “According to the CEN rules I have as a convenor to strive to reach consensus. Some experts wanted the classification to start with a much lower net calorific value (almost zero) whereas other experts wanted it to start at 15 MJ/kg. Some experts wanted a much higher upper value for chlorine (at least 6 %) whereas others wanted it below 3 %.” [ECOS, 2011a]. Here, the standards for the net calorific value and chlorine cannot be discussed in more detail.

Chapter 4
State of the art of the co-incineration of waste-derived fuels and raw materials in clinker/cement plants 157
Comparison of the values laid down in EN 15359 with other existing standards in Europe In Table 4.27, the EN 15359 standard is compared with other existing standards in Austria, Finland, Germany and Switzerland. For this purpose, all the values are expressed in mg/kg dry matter. As the Austrian standard and EN 15359 are given in mg/MJ, the values are converted to make the values comparable. In Germany and Switzerland, only certain waste-derived fuels are allowed to be used (so-called positive list) whereas all types of non-hazardous wastes can be used for EN 15359. It is obvious that EN 15359 is much less stringent compared to the other standards.
Table 4.27: Comparison of different standards for mercury in SRF in Europe with EN 15359
4.3.2.3.6 LCA considerations
4.3.2.3.6.1 Introduction
Today, there are many tools and indicators available for evaluating, assessing and benchmarking of processes, process chains or systems [e.g. Finnveden and Moberg, 2005; Ness et al., 2007]. Important examples include
- Life Cycle Assessment (LCA) - Environmental Impact Assessment (EIA) - Strategic Environmental Assessment (SEA) - Environmental Risk Assessment (ERA), also called ecological risk assessment - Material Flow Analysis (MFA) - Ecological footprinting - Cost-Benefit Analysis (CBA) - System of Economic and Environmental Accounting (SEEA).
Specifically, with regard to industrial or commercial installations, LCA and EIA can be used in a complementary way. Thereby, EIA is often seen as a location-specific environmental evaluation approach for which LCA is less suitable [Tukker, 2000]. However, it has to be noted that LCA is an
FINLANDSWITZER-
LAND
Parameter UnitGuidance
valueLimit Limit
National
standard
Draft
guidance
value
Guidance
value
Guidance
value
before 2008
(Holcim/
GTZ, 2006)
(SFS 5875,
2000)*2
(LAGA,
1997)*3
(MUNLV,
2005)*4
(CH BUWAL,
2005)*5
maximum median
80th
percen-
tile
maximum maximum maximum median
80th
percen-
tile
maximum median
80th
percen-
tile
Mercury (Hg) mg/kg DM 0.5 1.5 3 Class 1: < 0.1 0.4 1.2 0.6 1.2 0.5 Class 1: 0.4 0.8
Class 2: < 0.2 Class 2: 0.6 1.2
Class 3: < 0.5 Class 3: 1.6 3.2
Class 4: 3 6
Class 5: 10 20
Legend: DM = dry matter, NCV: net calorific value
*1 the values are not maximum values but 80 th percentiles, the values in the Ordinance are given in mg/MJ and are calculated from them with a NCV of 20 MJ/kg
*2 in 2011, the standard has been replaced by EN 15358 (EN 15358, 2011)
*3 the draft guidance value is given in mg/MJ and has been converted to mg/kg with a NCV 20 MJ/kg
*5 the application of the guidance values are limited to those wastes which are not part of the positive list; the values are also given in mg/MJ and can be calculated
from the values in mg/kg with a NCV of 25 MJ/kg
*6 the 80th percentile values in the European standard EN 15359 (developed by CEN TC 343) are given in mg/MJ and are calculated from them with a NCV of 20 MJ/kg; this
NCV is also used for the other standards to ensure comparability
EN 15359
Voluntary standard
CEN TC 343 (EN 15359,
2012)*6
*4 the values are related to a NCV of the dry matter of at least 20 MJ/kg (± 2 MJ/kg); for the calorific fraction derived from municipal waste, the reference NCV is 16 MJ/kg
Voluntary
standard
(RAL-GZ 724,
2001/2012)
AUSTRIA
after 2008 (AT
Incineration
Ord., 2010)*1
GERMANY

Chapter 4
158 State of the art of the co-incineration of waste-derived fuels and raw materials in clinker/cement plants
analytical tool specifically designed to assess the environmental impacts relating to the whole production chain of a good, whereas EIA is a procedure that has to support decision making with regard to environmental aspects of a much broader range of activities [Tukker, 2000]. In the field of waste management, LCA has become a common methodology on the assessment of treatment options in order to help decision-making, as it allows identifying treatment options with less environmental impact. In particular, the environmental performance of waste co-incineration has frequently been assessed through LCA methodology. In many cases, LCA results are dependent on the quality of the raw data and on their capacity to represent the real full life cycle. Results are always under a certain degree of uncertainty, and main conclusions from LCA should always be derived taking into account the inherent limitations of the method. This paper is intended as a critical analysis of existing LCA studies on waste co-incineration in cement kilns. Co-processing of waste in cement plants comprises the use of waste-derived fuels and raw materials. The co-processing of waste-derived fuels is also called co-incineration which became very important within many countries around the world, especially in Europe. The published results of life cycle inventories and environmental impact assessment of waste co-processing, specifically the co-incineration of waste-derived fuels need a critical assessment of their assumptions, implications, limitations and main conclusions obtained from the application of different methodology frameworks. 4.3.2.3.6.2 Life cycle assessment methodology and limitations LCA is a tool to assess the potential environmental impacts and resources used throughout a product’s lifecycle, i.e., from raw material acquisition, via production and use phases, to waste management [ISO 14040-LCA, 2006a]. The waste management phase includes disposal as well as recycling. The term ‘product’ includes both goods and services [ISO 14040-LCA, 2006b]. LCA is a comprehensive assessment and considers all attributes or aspects of natural environment, human health, and resources [ISO 14040-LCA, 2006a]. The unique feature of LCA is the focus on products in a life-cycle perspective. The comprehensive scope of LCA is useful in order to avoid problem-shifting, for example, from one phase of the life-cycle to another, from one region to another, or from one environmental problem to another [Finnveden et al., 2009]. In this respect, all the steps of manufacturing a product should be included, from the extraction of raw materials, supply chain, manufacturing, distribution, use, and waste treatment (reuse, recycling or final disposal) in a cradle to grave approach. Four main steps are carried out in any LCA study: Goal and Scope definition, Inventory analysis (LCI), Impact assessment (LCIA) and Interpretation of results. On the understanding of LCA, the scientific method applied plays an important role, as LCA can be interpreted as a part of theoretical prediction with actual, observed phenomena [Guinée, 2004]. Although standards exist, methodological choices are free by each separate study, and LCA environmental information is not complete, neither absolutely objective nor accurate [Ekvall et al., 2007]. Final results tend to be highly influenced by [Ekvall et al., 2007; Van de Heede/De Belie, 2012]:
methodological decisions,
the choice of the functional unit,
the system boundaries defined,
the time perspective,
the parameters considered,
assumptions made,
sources of data,
allocation approach used,
the chosen impact assessment method. Six examples shall demonstrate this influence, the first with respect to the choice of the functional unit, the second concerning the system boundaries, the third with regard to the parameters considered, the fourth with respect to assumptions made, the fifth concerning the allocation approach used and the sixth with regard to the impact assessment method. Concerning the co-incineration of waste-derived fuels in cement plants, the functional unit is often defined as ‘1 tonne of cement’ [e.g. Gäbel and Tillman, 2005; Chen et al., 2010; Huntzinger/Eatmon,

Chapter 4
State of the art of the co-incineration of waste-derived fuels and raw materials in clinker/cement plants 159
2009; Boesch et al., 2009; Feiz et al., 2012]. However, in LCAs on waste management, which compare different techniques for the thermal treatment of wastes and waste-derived fuels in different installations, such as municipal waste incineration plants, hazardous waste incineration plants, co-incineration in cement plants or power plants and SRF power plants, the functional unit is ‘1 tonne waste’ [e.g. CEMBUREAU, 1999; NRW MUNLV, 2007; Vos et al., 2007; Helftewes et al., 2012]. This can make a significant difference, e.g. with respect to energy efficiency as the energy performance of the installation considered is usually not taken into account. The main reason for that is the method of marginal changes in LCA, where the introduction of a minor change in a system is studied and the change of the environmental impact of the assessed system is calculated. For instance, there is no difference whether waste-derived fuels are used in a modern, energy-efficient rotary kiln with a 6-stage preheater and an energy demand of 3100 kJ/kg clinker or in a wet kiln with an energy demand of about 5000 kJ/kg clinker, as in both cases the impact of a fixed quantity of waste (i.e. the functional unit) is the same. In this case, the overall benefit of substitution, in terms of total MJ of fossil fuel in a cement plant, cannot be calculated through LCA: the extrapolation of the results of these studies to the 100% substitution of the two plants, performing as aforementioned, would assume that an inefficient cement plant (5000 MJ/kg) would have a much better environmental performance than the efficient one, operating at 3100 MJ/kg if the results from e.g. [Vos et al, 2007], are directly used. This limitation is inherent to LCA and it is equivalent to the limitations identified by [Ekvall et al., 2007] regarding to the inability of LCA to detect changes in the amount of wastes (waste prevention), but only the differences between different treatments. Also, the higher the energy consumption of clinker production is, the more likely CO2 emissions are not statistically affected per tonne of cement in an uncertainty analysis. In addition, all these studies assume constant energy efficiency when waste-derived fuels are fed. However, this is not the case as shown below. In relation to the system boundary, between the technical system and the environment, it can be noted that a LCA should cover the entire life cycle, from cradle-to-grave [Chen et al., 2010]. However, many studies do not cover the entire life cycle but only cradle-to-gate; they can be called partial LCAs [Finnveden et al., 2009]. This is also true for many studies in the cement sector such as [Gäbel and Tillman, 2005; Chen et al., 2010; Huntzinger/Eatmon, 2009; Boesch et al., 2009; Feizetal., 2012] where the different service lifetimes of different cement products are not taken into account. The number of parameters considered can be directly associated with the level of simplification. In case of cement plants, the number of parameters of a complete LCA is higher than 50 [Feiz et al., 2012]. Nevertheless, there are LCA considerations published covering 6 parameters which are called ‘simplified LCA’. It seems that simplified LCAs are increasingly evaluated with respect to greenhouse gas emissions and global warming [e.g. Ammenberg et al., 2011; Feiz, 2011; Feiz et al., 2012; Helftewes et al., 2012]. Specifically, the co-incineration of waste-derived fuels in cement plants is usually characterised to have environmental benefits with regard to primary energy consumption but not for the so-called toxicity categories [e.g. Boesch et al., 2009; Fruergaard/Astrup, 2011]. A simplified LCA has to be understood with its limitations; it is important that authors define well the scope and that an environmental category, e.g. global warming potential, is not confused with the overall environmental performance. Assumptions made can have a significant impact on the result for at least certain parameters of the LCA. For instance, concerning mercury emissions to air of cement plants, the transfer factor chosen determine the estimated mercury emissions to air. E.g. a transfer factor of only 2 – 4 % in [Vos et al., 2007, Annex 6] is far too low as the commonly reported range of transfer factors for mercury emissions to air is between 16 and (almost) 100 % [Goosmann et al., 1993; Winkler, 1998; Graf AG, 1998; Braungart et al., 1999; PRIZMA, 1999; Lahl et al., 2000; NRW MUNLV, 2005; NRW MUNLV, 2007; Linero, 2011]. The wide range indicates that the transfer factor depends on certain factors such as the waste gas temperature, the operating mode (direct or compound operating mode) and whether the filter dust is discarded in the direct operating mode or not or to which extent. But these conditions are often not mentioned together with the assumption for the transfer factor chosen. In current LCA studies, no environmental burdens are usually affected to waste production (except for their disposal or pre-treatment for recycling or recovery), as they are unintentionally produced [Chen et al., 2010]. However, the choice of an allocation procedure has proven to be one of the most

Chapter 4
160 State of the art of the co-incineration of waste-derived fuels and raw materials in clinker/cement plants
controversial methodological issues in LCA, largely because it can significantly influence the results of a study [e.g. Frichknecht, 2000; Ekvall/Finnveden, 2001; Weidema, 2001; Weidema, 2003; Curran, 2007; Heijungs/Guinée, 2007; Lundie et al., 2007; Reap et al., 2008; Finnveden et al., 2009; Chen et al., 2010; Sayagh et al., 2010; Van den Heede/De Belie, 2012]. Following the European Waste Framework Directive [EU WFD, 2008], waste which can be considered as a by-product has to be allocated with the environmental impact associated with the production process, e.g. in case of granulated blast furnace slag and fly ash, both largely used for cement production [Chen et al., 2010]. Different allocations end up in totally different results of the LCA. The same is true for the allocation of environmental benefits considering the incineration of waste in solid waste incineration plants compared with the co-incineration in a cement plant. Whereas for incineration plants, the environmental benefit is referred to the energy produced, the benefit in case of cement plants is allocated to the substitution of 1 MJ of fossil fuel by 1 MJ of waste-derived fuel. Usually, a certain electricity mix is used to refer to. If it changes, the result for allocating the benefit will also change; e.g. as the percentage of renewable energy significantly increased in Germany during the past years, the benefit for waste incineration plants decreased whereas there is no change for cement plants. The chosen impact assessment method can also play a significant role, especially if weighing factors are used and the results for the different environmental aspects are aggregated. On the one hand, the aggregation may not reflect the real situation if only a limited number of parameters are considered. On the other hand, the use of weighing factors is problematic as there is no objective way to perform weighing and hence no “correct” set of ranks or weighing factors [Finnveden et al., 2009]. The ISO standard for life cycle impact assessment does not permit weighing to be performed in studies supporting comparative assertions disclosed to the public [ISO 14044-LCA, 2006; Finnveden, 2009]. Nevertheless, there are studies using weighing factors and aggregation [e.g. CEMBUREAU, 1999; Josa et al., 2007; Vos et al., 2007] whereas others do not [e.g. Gäbel et al., 2004; Boesch et al., 2009; Fruergaard/Astrup, 2011]. Against this background, the results of an LCA depend on many factors and therefore, every LCA has to be critically analysed and used with adequate care. Thus, LCAs typically do not provide objective answers [Ekvall et al., 2007]. 4.3.2.3.6.3 Extent of the co-incineration of waste-derived fuels In the U.S., there is an average of 11% fuel substitution in the cement industry. In Europe, the percentage is significantly higher (about 28 %). However, amongst EU Member States, the substitution rates are very different varying from less than 5 % to more than 80 %; for instance, current substitution rate in Austria is 46 %, in Germany 61 % and in the Netherlands 83 % (Figures for 2011). In these three European Member States, waste co-incineration is well implemented and clinker manufacturing can play an important role in the international and national waste policies. As indicated above, in Germany, the use of waste fuels is currently providing 61% of thermal heat input of 34 clinker production plants [VDZ, 2011]. The German case is a singular example of fossil fuel substitution, as the trend of waste co-incineration in recent years has been quite fast. Figure 4.33 shows how the increasing substitution rate of fuels is likely to reduce the energy efficiency of kilns. Energy efficiency of burning processes may be reduced due to the intrinsic characteristics of waste-derived fuels, which can be influenced by pre-treatment techniques.

Chapter 4
State of the art of the co-incineration of waste-derived fuels and raw materials in clinker/cement plants 161
Figure 4.33: Correlation between the energy consumption per tonne clinker and the share of waste-derived
fuels of the total heat demand in the German cement plants (average values from 2003-2010)
4.3.2.3.6.4 Life cycle assessment on waste co-incineration in cement kilns
a.) Introductory remarks The use of waste-derived fuels was and still is mainly economy-driven [Steinbiß, 1979; Kreft et al., 1987; Küppers, 1998; Lübbe-Wolff, 1999; Scheuer, 2003; Schöffmann, 2003; EC RDF, 2003; Gemmer/Schneider, 2006; Genon/Brizio, 2008; VDZ Umweltschutz, 2007; Binninger, 2009; Emberger/Hoenig, 2011; Schneider et al., 2011; Locher/Klein, 2011a; Hoenig et al., 2011]. It could be a consequence of this fact that almost all of the specific life cycle studies concerning the co-incineration of waste in cement plants that are available in literature were commissioned by cement companies or cement industry associations. In the past 20 years, almost all cement plant operators became also waste managers charging a gate fee for most waste-derived fuels and raw materials. The co-incineration requires changes of the process, such as the installation of storage and feeding systems, multi-fuel burners, tertiary air duct or a chlorine bypass but were minimised as far as possible. Consequently, only at very few cement plants dedicated pre-combustion chambers prior to a precalciner were installed and none of them was equipped with additional flue gas treatment systems to minimise the additional emissions of organic compounds, carbon monoxide and heavy metals, especially of mercury which occur due to the use of waste-derived fuels and raw materials. With regard to the clinker production process, the co-incineration of waste is not associated with other advantages than the substitution of fossil fuels, except the substitution of natural raw materials but this is of minor importance. Waste-derived fuels do not improve the energy efficiency of the process but need additional efforts with respect to their reception, storage and feeding. As a disadvantage, it can cause the aforementioned higher emissions to air, and can lead to a substantial increase in the heavy metal content of the clinker and cement. Against this background, it may be understandable that many LCA studies have a focus on greenhouse gas emissions and global warming because of the substitution of fossil fuels. Here, the available studies are divided into two groups: the first covers the use of waste-derived fuels in cement plants with ‘1 tonne cement’ as the functional unit and the second the thermal waste treatment options of which the con-incineration is one of them and the functional unit is ‘1 tonne waste’. As already indicated, practically all studies laid the focus on energy efficiency and global warming.

Chapter 4
162 State of the art of the co-incineration of waste-derived fuels and raw materials in clinker/cement plants
b.) Main results from available studies Studies concentrating on energy efficiency and global warming potential of cement production For the operation of a cement production plant, the co-incineration of waste-derived fuels is not expected to produce any other environmental advantage than the substitution of fossil fuels. Waste-derived fuels do not improve the energy efficiency of the process per se and they are likely to increase the carbon footprint of the product, i.e. cement, as well as other emissions to air due to their higher pollutants content. This expectation is confirmed in many of the analysed LCA studies: waste-derived fuels are able to reduce the amount of fossil fuel resources used at cement plants and have an important impact on the economic performance of a cement works. As a general observation, many raw data for the analysis stem from industry averages, secondary data sources, and assumptions based on linear models; so, any conclusion from observed results has always a certain level of uncertainty. The global warming potential of cement production is not significantly reduced by the use of waste co-incineration, although this result is highly dependent on the assumptions made by the authors and on the system boundary. The biogenic content of wastes-derived fuel and the quality of substituted fossil fuel are key factors to understand the observed variability. In this section, reference is only given to those LCA studies which focus on cement production and use ‘1 tonne of cement’ or ‘1 tonne of clinker’ as the functional unit. The Swedish cement company Cementa AB commissioned the development and building of a life cycle based model for calculating the environmental performance of cement, along with its product performance and costs [Gäbel et al., 2004]. A linear model was built, and the system boundaries of the system are well defined and divided in a background and foreground subsystem, as made by other authors in LCA [Tillman 2000], with a cradle-to-gate approach. Figure 4.34 shows a scheme of the division of [Gäbel et al., 2004], with some amendments to make it more illustrative. A wider system is included by the authors for the alternative life cycle of waste-derived fuels and raw materials, although the performance of the processes in this wider system is excluded from the environmental impact assessment. The level of simplification of the life cycle is remarkable, where the clinker production appears only as a black box (compared to the many available details of cement plants), and the remaining complexity of the model as a whole.

Chapter 4
State of the art of the co-incineration of waste-derived fuels and raw materials in clinker/cement plants 163
Figure 4.34: Conceptual model of the cement life cycle, adapted from [Gäbel et al., 2004]
The model is used to study the combination of three different variables [Gäbel/Tillman 2005]: waste-derived raw materials (6.5 – 20%), fossil fuel substitution with wastes (25 %, 40 %, and 80 %) and cement type (type II with 84% clinker and type 3 with 60% clinker). Regarding the waste co-incineration in the kiln, the different combinations of fuels are: 25% tyres (for the 25% substitution option), 30% tyres and 10% plastic (for the 40% substitution option), and 37.5% tyres, 10% plastic and 32.5% liquid (for the 80% substitution option). No further details on the composition of the waste streams are given and no information about the energy performance of the kiln or about the loss of efficiency due to waste co-incineration can be found in the text, which is a non-negligible weak point of this assessment, especially with regard to its reproducibility. The main results show that, for waste-derived fuels, fossil fuel is reduced, while its effect on the foreground subsystem is not relevant with respect to CO2 emissions. On the other hand, the background subsystem seems to be more favourable for higher fuel substitution rates, as the impact of production and distribution of fossil fuels is higher than the preparation and transport of waste-derived fuels. Sponsored by the Swiss government and Holcim, the ETH (Eidgenössische Technische Hochschule) Zürich developed in close collaboration with Holcim a detailed model for the cradle-to-gate assessment of clinker production [Boesch et al., 2009], and assessed the influence of 4 types of wastes on the clinker life cycle performance (whole tyres, prepared industrial waste, dried sewage sludge and blast furnace slag). Results from their study have been adapted and presented in Figure 4.35. Maximum

Chapter 4
164 State of the art of the co-incineration of waste-derived fuels and raw materials in clinker/cement plants
fossil energy reduction, achieved with tyres, do not produce a reduction of more than 12 % of the total energy consumption but with an impact on total equivalent carbon emissions lower than 3 %, with unknown uncertainty. Also, they compare different clinker production methods, confirming with data the expected conclusion that the higher the energy efficiency the lower the environmental impact is. The system boundaries are similar to those defined by [Gäbel et al., 2004], but this model includes other waste treatment options.
Figure 4.35: Equivalent carbon dioxide emissions per tonne clinker for different wastes used in different clinker production processes, adapted from [Boesch et al., 2009]
The model can be considered robust, as data from 169 cement plants is used, although it may be assumed that not all the plants report the same environmental information. The same research group applied the model to a comprehensive study on the environmental performance of different cement formulations [Boesch/Hellweg, 2010], going beyond of the clinker production. In this study, the authors compared the energy performance calculated for average US and European types of cement, identifying improvement potentials, and assessing the impact of waste co-processing. Carbon dioxide coming from limestone calcination is the main responsible for the global warming potential, while the combustion of fuel is also a relevant process generating an important amount of CO2. The authors assumed an average for the use of waste-derived fuels of 18%, in average, of the total heat input for the European CEMI, and for the US Portland cement, 12% of waste-derived fuels is computed. Then, a fuel substitution rate of 50% would allow a reduction of 9% CO2 in the European case and 18% in the US, if the same best available techniques (BAT) are used. The BAT are developed in the so-called Sevilla Process [Schönberger, 2009] on the basis of the Industrial Emissions Directive (before that the directive was called ‘Integrated Pollution Prevention and Control Directive’ [EU IPPCD, 1996/2008] and are documented in the so-called Best Available Techniques Reference Documents (BREFs) – see Chapter 5. Regarding the environmental performance, the effect of substituting high impact cement by lower impact is highly significant. As a matter of fact, cement life cycle environmental impact depends on the final quality of the product, so market share changes have probably more relevant influence on the environmental impact of the cement industry. According to the different cement types and market shares, the improvement potential is already achievable by changing consumption patterns, where it is technically possible. In the United States, more than 97% of total cement consumption is Ordinary Portland Cement, while in Europe it has only a market share of 30 %. So, in general, low impact cements are those with lower clinker content due to less embodied energy and less embodied equivalent CO2 emissions. The same confirmation can be found in another Swedish study sponsored by CEMEX [Ammenberg et al., 2011; Feiz, 2011; Feiz et al., 2012]. It revealed that cement products with a high share of by-products (here granulated blast furnace slag from the steel

Chapter 4
State of the art of the co-incineration of waste-derived fuels and raw materials in clinker/cement plants 165
industry) had the best climate performance. A so-called ‘simplified LCA’ model was developed which was based on the following 6 global warming-related key performance indicators: clinker substitution rate, CO2 emissions due to calcination, specific energy consumption (fuel), share of renewable fuels (biogenic), specific energy consumption (electrical) and share of renewable electricity [Ammenberg et al., 2011, p 48]. The comparison of the results with those of a comprehensive LCA showed good concurrence. However, such a ‘simplified LCA’ can only be applied to greenhouse gas emissions and global warming potential and never to other environmental categories; in other words, the full picture of environmental performance of the cement life cycle cannot be deduced from those indicators. According to the results, global warming emissions can be highly predictable if the aforementioned parameters are known. But, regarding to their results, a very high percentage can be explained by the clinker substitution rate and from the CO2 emissions from calcination and, in a less extent, from the energy efficiency of the system. Then, the high energy consumption of clinker production is the main source of environmental impact regarding the global warming potential. Similar conclusions can be derived from the work of [Huntzinger/Eatmon 2009], where U.S. average cements are assessed in a cradle-to-gate perspective. In that work, the effect of reducing the clinker factor in blended cements is significantly higher than introducing CO2 sequestration or recycling clinker kiln dust. However, the results from this author are aggregated into the environmental impact scores of EcoIndicator95, and no comparison is possible with the results from other authors. Although using scores has strong implications in the derivable conclusions from a LCA, the results from this author show that the weighted environmental impact of traditional Portland cement manufacturing come, in a high proportion, from the use and production of energy: clinker manufacturing is responsible for 84.4 % of cement environmental impact, where, at least, 67% of the impact comes from energy (coal, gas, oil and electricity used in the process). The influence of different variables regarding the clinker embodied environmental impact has been analysed in a quantitative way. An important result from the models from [Boesch et al., 2009), (Gäbel et al., 2004) and (Ammenberg et al., 2011; Feiz, 2011; Feiz et al., 2012] is the relationship between the global warming potential for the different typologies of cements. Figure 4.36 shows the variation of greenhouse gases emissions with the clinker factor for the average performance of different cements US and European cements [Boesch et al., 2009] and for different clinker contents, raw meal composition and fossil fuel substitution [Gäbel and Tillman, 2005].

Chapter 4
166 State of the art of the co-incineration of waste-derived fuels and raw materials in clinker/cement plants
Figure 4.36: Life cycle greenhouse gases emissions vs clinker factor for different US and European cements,
data from [Gäbel/Tillman, 2005; Boesch/Hellweg, 2010; Ammenberg et al., 2011]
Global warming potential results show that clinker factor and co-processing of waste-derived fuels and raw materials reduce the carbon footprint of a tonne of cement. Differences between authors are due to differences on the system assumptions and definitions, so the absolute values cannot be compared. Nevertheless, the trends and the rate of variation observed are quite similar for the three models. The slope of the curves from the three studies are similar, showing the great influence of the clinker factor on the cement life cycle performance. From the data of [Boesch/Hellweg, 2010], it can be calculated that the substitution of 1% of clinker would reduce the carbon dioxide emissions of American cements by 9.6 kg per tonne and 8.7 kg per tonne for the European ones. If 1% of the energy input is substituted by waste, the carbon footprint is then reduced by about 1.65 kg per tonne of cement for both cases. So, the potential environmental benefits from clinker substitution are much more significant than fuel substitution in clinker production. This was also found by other authors (e.g. [Van den Heede/De Belie, 2012]). Statistically, global warming potential can be reduced with changes in the clinker factor and alternative raw materials processing, while waste-derived fuels do not have a significant influence on the global warming potential of cement life cycle (i.e. the unexplained variability observed in the results is higher than the variability due to the influence of waste-derived fuels). A deeper analysis shows similar conclusions from the results derived from [Josa et al., 2004] for the amount of conventional materials

Chapter 4
State of the art of the co-incineration of waste-derived fuels and raw materials in clinker/cement plants 167
(comprising the clinker factor and the amount of alternative raw materials, as studied by [Gäbel et al., 2004]). This amount has a direct influence on the thermal energy demand and CO2 emissions of cement production. Very similar trends were reported through the analysis of KPI of cement production [Feiz et al., 2012]. Furthermore, it is important to note that waste-derived fuels may not have any influence on the global warming potential of cement life, neither positive nor negative. In general, it is assumed that the increase of the fuel substitution rate has no effect on the energy performance of the kiln (so, the thermal energy demand of the kiln is not varied, although the primary fossil energy demand is substantially reduced). [Boesch/Hellweg, 2010] take into account the lower performance of the kiln when waste-derived fuels are fed, as they assume a thermal energy demand increase in 100 MJ per tonne of clinker when 50% of fuel is substituted (from 3200 to 3300 MJ per tonne) compared to a zero substitution rate. However, the average energy efficiency loss can be even higher. An observable fact from the data published by the German Federation of Cement Producers, VDZ, is that the thermal energy demand of clinker production has increased in the past 10 years (see Figure 4.7 and Figure 4.22). At the same time, the rate of fuel substitution has increased from 30% to 60%. In particular, the rate of sludges, plastics and a fraction called “Others” (mainly industrial and commercial wastes) has increased from 10 up to 80 kg per tonne of clinker in the period 2001-2010. In the same period, the average thermal energy demand has increased from 3570 to 3810 MJ/tonne clinker. Thus, the variation of fossil fuel demand and the variation of energy from waste-derived fuels can be analysed with the chart of Figure 4.37.
Figure 4.37: Change in alternative fuels vs. change in fossil fuel for the average thermal energy demand in
Germany, data from [VDZ, 2011]
Figure 4.37, the linear trend does not show a 1 : 1 substitution ratio but 1 : 1.15. As the net calorific value of wastes already takes into account the water and ash content, the change in efficiency can only be explained by a loss of efficiency of the combustion process which is also due to the introduction of chlorine bypasses and the higher waste gas flows which is often associated with the co-incineration of waste-derived fuels. The increased demand of thermal energy may produce an increase of the net CO2 emissions, but the most probable outcome from fossil fuel substitution in a LCA perspective is that CO2 emissions are neither increased nor reduced per tonne of cement or clinker due to:
the high variability observed on LCA results and their high dependency on assumptions;

Chapter 4
168 State of the art of the co-incineration of waste-derived fuels and raw materials in clinker/cement plants
the higher biogenic fraction of waste-derived fuel may compensate the higher thermal energy demand in the accountability of emissions;
the low influence of actually avoided emissions in the waste life cycle by reducing the waste flow to incinerators (see next section).
Studies concentrating on the energy efficiency and global warming potential of waste co-incinerated as another treatment option Waste co-incineration in cement kilns is usually assessed taking a tonne of waste as the functional unit in LCA studies, allowing the evaluation of different waste treatment technologies for that tonne of waste. In the literature, this approach is mainly used to compare waste co-incineration (in cement kilns or in power plants) with municipal solid waste incineration plants (MSWIP). Then, without any assessment, it can be assumed that this approach would give fossil fuel substitution scenarios a great advantage regarding global warming potential over MSWIP: the emissions from burning waste in cement kilns can be considered not reduced or increased when burning fossil fuel, the emissions from the incinerator would be fully avoided. Many of the papers in the literature support this statement, although all the reported results are highly dependent on the assumed waste treatment scenario, the efficiency of energy recovery in MSWIP, local circumstances, data sources and the system boundaries used in the LCA. The approach and the system boundaries include other waste treatment options for comparison, usually waste incineration. The conceptual model for waste co-incineration in clinker kilns is represented by Figure 4.38, and can be extended to other waste treatment options (e.g. co-incineration in coal power plants).
Figure 4.38: Conceptual model for waste treatment options in the cement life cycle – based on Figure 4.34

Chapter 4
State of the art of the co-incineration of waste-derived fuels and raw materials in clinker/cement plants 169
Again, many waste co-incineration studies using LCA methodologies are commissioned or sponsored by the cement industry. This is the case of the work produced in [Vos et al., 2007] a study commissioned by the Belgium cement industry association, Febelcem [Vos et al., 2007]. This study is focused on the evaluation of the thermal treatment of waste in cement kilns and compares the results with other treatment alternatives. Several elements of the study, especially the different specific types of wastes as well as the cement plant of Holcim in Obourg, Belgium, which was specifically considered, are similar compared to a previous study Vos et al. had prepared for the European Cement Association (CEMBUREAU) [CEMBUREAU, 1999]. The study had been commissioned in order to tackle a controversy between the Flemish Region and FEBELCEM [Vos et al., 2007, p 105]. Thus, it is “a response on the proposed change in taxation on secondary fuels” [Vos et al., 2007, p 7]. The following five types of waste were considered:
Waste oil/waste solvents
Industrial sludges
Filter cakes
Impregnated saw dust and paint sludge
Fluff (mixture of light plastics, textiles, rubber etc.). The results show that the main environmental benefit is a huge reduction of CO2 emissions when compared to incinerators, not only because of the avoidance of emissions from coal at cement kilns. The overall results seemed to satisfy most of the reviewers, but the lack of data reporting does not enable the replication of the obtained results. The method of marginal changes is used, so changes are introduced in the baseline scenario (situation in 2006) when a small variation is introduced in the system defined per tonne of waste. The use of this approach, according to the authors, justifies that the energy efficiency produced by waste co-incineration in cement kilns is not taken into account as the avoided impact of 1 MJ less from fossil fuel is invariant, independently of how that MJ would be used (i.e. the efficiency of the kiln). Results are presented in an aggregated form, under the categories of the CML method or the Ecoindicator 99, and disclosed per category in the annex of the study. The conclusions show that the waste treatment in cement kilns is much more environmentally friendly than the treatment in a MSWIP, even with heat or electricity recovery. These results are dominated by the huge weight of the avoided depletion of fossil resources and on the avoided impact of greenhouse gases reduction, so, the main difference between co-incineration and incineration is the avoided coal, as it was presumed. The scientific approach of the study is sound and the definition of the system and most of the assumptions seem appropriate. But the lack of transparency for some results and assumptions, considered confidential by the industry (e.g. air emissions), and the absence of the chemical composition of the assessed wastes reduce the credibility of the conclusions. Only the net calorific values of the wastes can be deduced, which are very low for the industrial sludge (< 4 MJ/kg upon reception, so they have to be thermally dried first), and also low for the filter cakes (4.7 MJ/kg). Consequently, these two wastes can hardly be called fuels. This is especially remarkable as the aforementioned plant in Obourg has a wet kiln with a very high energy demand, about 5000 MJ/kg clinker [Vos et al., 2007, p 96]. In addition, weighing factors were used and aggregation of the results were carried out which should be avoided according to [ISO 14044-LCA, 2006; Finnveden et al., 2009]. It should also be noted that the substitution of coal and petcoke was considered; however, petcoke is not a waste per se but a by-product from refineries. Thus, it is not adequate to allocate the environmental impact to the substitution of petcoke [Chen et al., 2010]. A further study laid its focus on greenhouse gas emissions and the global warming potential [Helftewes et al., 2012]. This paper uses a simplified approach, as only the mass balance of carbon and the energy balance is analysed for MSWIP, power plants and cement plants, evaluating the impact of fossil fuel substitution by five types of household-type commercial waste: waste from catering (restaurants, hotels, cinemas etc.), healthcare (nursing homes, hospitals, charitable institutions etc.), food (bakeries, butchers etc.), craft (construction, various trades) and institutional (governmental agencies, universities, banks, insurances etc.). The results of this paper show a great advantage of co-incineration in cement plants against any other option. The assumed scenario for cement plants would reduce net

Chapter 4
170 State of the art of the co-incineration of waste-derived fuels and raw materials in clinker/cement plants
emissions by 675 kg CO2 per tonne of waste (average for all wastes), while the scenario for waste incineration would only save 51 kg CO2 per tonne, and the power plant using SRF would save 213 kg CO2 per tonne. The result is very much influenced by following parameters:
The yield of mechanical waste treatment to SRF of the studied fractions is assumed as 72 – 82 %, which is rather optimistic; two other sources report yields between 32 and 38 % [UBA Gewerbeabfälle, 2011; NRW, MUNLV, 2007].
The biogenic fraction of analysed wastes is higher than 50%.
Energy recovery efficiency in MSWIP, heat and electricity, is assumed at the German average, 11.3% and 21.2% respectively.
The high rate of CO2 generation from the substituted fossil fuels, hard coal and lignite dust (390 and 495kg CO2 per MWh, respectively).
These assumptions resulted in a very favourable situation to the co-incineration option. Very different results from those obtained by [Helftwes et al., 2012], were obtained by another study from Holcim, which compared the greenhouse gas and global warming performance of the incineration of plastic waste in MSWIP with the co-incineration in a cement plant [Fux, 2011]. The study was performed with the LCA4WASTE model, developed by [Boesch et al.,2010], in order to assess the best option for waste treatment in a specific case study of a Czech Republic cement plant. Results showed that, regarding to carbon emissions and energy performance, best performing incinerators and cement plants produce very similar results, although results would always depend on the thermal efficiency, the electricity generation efficiency and the quality of the fuel substituted. In line with those studies for cement, [Fruergaard/Astrup, 2011] studied different options for waste co-combustion in coal power plants and compared to incinerators using a LCA perspective: waste with high calorific value, SRF, organic waste and mixed waste (not fitting in any of the other fractions). Technologies assessed were waste incineration without energy recovery and with energy recovery, co-combustion in coal-fired power plant, anaerobic digestion for CHP production and anaerobic digestion to produce biogas for transportation. For waste incineration, average efficiencies from Denmark are assumed, 19.5 % for electricity generation and 65.4% for heat recovery. Results show that co-combustion is preferable against waste incineration with energy recovery in all non-toxicity impact categories, and the opposite happens for the toxicity impacts, although the absolute differences are far from those observed by [Helftewes et al., 2012]. In fact, there are no relevant differences between waste mass incineration with energy recovery and co-combustion in coal power plants regarding to global warming potential. On toxicity aspects, heavy metals flows are evaluated with constant transfer coefficients and the result is favourable to waste incinerators, due to the better flue gas cleaning system. On the assessment of different scenarios, the authors found that the efficiency of heat and electricity generation is a very sensitive parameter for waste incinerators. Also, it is argued that power plants introducing more efficient cleaning systems would be able to reduce the toxicity load. Very similar conclusions were drawn from a detailed LCA study concerning the different options for the thermal treatment of wastes [NRW MUNLV, 2007] in the German federal state North Rhine-Westphalia. Thereby, the following three different types of wastes were considered:
Residual waste from households (i.e. paper, glass, plastics, metals and organic (food) waste and green cuttings are separately collected)
Household-type commercial waste
Residual fraction from the sorting of light packaging material.
For these wastes, the thermal treatment in MSWIP and the co-incineration of waste fractions with high net calorific value derived from the processing of household and household-type commercial waste in power plants and cement plants was evaluated. For this purpose, 4 mechanical-biological treatment plants, 16 MSWIP, 11 coal-fired power plants and 10 cement works were considered. It has to be noted that the whole system of pre-treatment, waste incineration, cement production and electricity production in power plants with their supply chains was considered; e.g. the electricity produced from waste incineration substitutes some coal in power plants as the electricity produced from waste has

Chapter 4
State of the art of the co-incineration of waste-derived fuels and raw materials in clinker/cement plants 171
not to be produced from coal. With respect to environmental impact categories, all relevant parameters were investigated, specifically also mercury emissions.
With regards to global warming, greenhouse gas emissions and energy consumption, the results show that the co-incineration in power plants and cement plants has a slightly better average performance compared to MSWIP. Thereby, the energy and global warming performance of the 10 cement plants varied only little whereas the differences between the 16 MSWIP were considerable. In case the produced electricity and steam can be fully used, the energy and global warming performance of MSWIP is equal or even better than cement plants. The results were mainly influenced by the following three parameters:
Figure 4.37) in the pre-treatment plants,
the type of substituted fossil fuel, and
the energy efficiency of the MSWIP.
The observed variation on these LCA results requires special attention in this section. First, the lack of uncertainty assessment in most of the published studies is noticeable. Second, there are key parameters, which are not deeply studied through a sound sensitivity analysis. For a better insight, the simplified system assumed by [Helftewes et al., 2012], has been replicated and uncertainties have been introduced. If the efficiency assumed by [Helftewes et al., 2012], from German MSWIPs, is changed to the Danish average assumed by [Fruegaard/Astrup, 2011], results change completely and emissions from cement kiln co-incineration scenarios and MSWIP are rather similar. In total, four sources of uncertainty have been introduced to the results of [Helftewes et al., 2012]:
- log normal frequency distributions for the electricity co-generation, - heat recovery in MSWIP and SRF power plants, - uniform distributions for waste separation efficiency in mechanical-biological treatment (MBT)
plants, - the avoided emissions from electricity production in national grids.
The final resulting frequency distribution is calculated through a Monte-Carlo simulation, using 104 random samples from the above mentioned distributions. As seen in Figure 4.39, there is a wide dispersion of the results when analysing the uncertainty through the frequency distribution of net emissions from both scenarios.

Chapter 4
172 State of the art of the co-incineration of waste-derived fuels and raw materials in clinker/cement plants
Figure 4.39: Simulated frequency distributions: A: cement kiln scenario with the German average efficiency for electricity co-generation and heat recovery in MSWIP. B: incineration scenario with the German average efficiency for electricity co-generation and heat recovery in MSWIP. C: cement kiln scenario with the Danish average efficiency for electricity co-generation and heat recovery in MSWIP. D: incineration scenario with the Danish average efficiency for electricity co-generation and heat recovery in MSWIP.
Figure 4.39 shows how, when assuming different values of the efficiency of MSWIP, results do change significantly. Even the cement kiln scenario is improved and the dispersion of results is reduced, as MSWIP are assumed to treat the reject from MBT plants. There is an important overlapping between the cement kiln scenario and the incineration scenario with improved efficiency, so both processes would likely produce the same avoided CO2 emissions. If less efficiency is assumed for MSWIP, the cement kiln scenario would produce less emissions. Then, to reduce the influence of uncertainty and to obtain a really accurate result, every specific case should be regarded, as no best option can be derived from LCA results. Anyway, if the uncertainty level of these results is introduced in the cement life cycle assessment, the impact reduction may not be significant. Emissions to air Concerning emissions from cement plants, emissions to air are most important, whereas emissions to water and soil are of low relevance. The range of pollutants is broad and includes inorganic (dust, SO2, NOx, CO2, CO, HCl, HF, NH3, heavy metals) and organic parameters (VOC, benzene, PCDD/F, naphthalene and other PAH, etc.). Most of the available LCA studies for cement plants do not cover emissions to air or consider only a limited number of parameters [e.g. Josa et al., 2004; Josa et al., 2007; Strazza et al., 2011, Van den Heede/De Belie, 2012], and very few reflect the whole range of parameters [Boesch et al., 2009; Boesch/Hellweg, 2010] indicating that the applied model provides good conformity for CO2, SO2 and NOx, whereas large deviations are observed for heavy metals. Of course, LCA is not the appropriate methodology to determine the conformity of emissions, as yearly aggregated values are usually estimated or reported and the range of concentrations and, therefore, the local impact cannot be estimated with accuracy. The lack of data on air emissions can even be fixed by a cap modelling, where the air emission value is equal to a legal limit value. The result of that approximation gives similar results to other LCA studies where data from the industry is used [Boesch et al., 2009]. A study of the life cycle of cement in Italy compiled emission data from 73 Italian cement kilns where 22 are using waste-derived fuels [Del Borghi et al., 2009; Strazza et al., 2011]. From the data is deduced

Chapter 4
State of the art of the co-incineration of waste-derived fuels and raw materials in clinker/cement plants 173
that, except for volatile organic compounds, the emissions of cement plants without co-incineration is usually higher compared with those practicing co-incineration. However, the reported data distributions are not significantly different. Also, the specific conditions of the plants with co-incineration were not analysed as it makes a big difference which types of waste are co-incinerated in which way, such as the feeding via the main burner or via secondary firing whereby the way of secondary firing varies a lot in practice; incomplete combustion occurs in some cases whereas in others, the combustion conditions are not associated with elevated emissions of volatile organic compounds, carbon monoxide, benzene etc. The same observations are true for the described emissions to air for these compounds in the Best Available Techniques Reference Document [EC BREF CLM, 2010]. For heavy metals, transfer factors are used to estimate the transfer to emissions to air and to the clinker. Especially for mercury, these estimations have a very high degree of uncertainty. When comparing cement kilns to MSWIP, due to more advanced and efficient waste gas purification systems of MSWIP, the emissions of mercury to air from them is lower compared to power plants and cement plants [NRW, MUNLV, 2007]. The two main factors that may change this result are the selectivity of the pre-treatment process to produce SRF, and the presence of specific mercury abatement techniques in power plants and cement plants (adsorption to coke, selective separation techniques in scrubbers of power plants, filter dust discarding in cement plants). For instance, the ten cement plants in North Rhine-Westphalia apply techniques to abate dust, nitrogen oxides and sulphur dioxide but not for organic compounds, carbon monoxide and mercury. Similar results were observed by [ruegaard/Astrup, 2011] for co-incineration in coal power plants. [Vos et al., 2007] contradicts these results, but the assumptions made on the transfer factor for the cement kiln emissions are considered confidential and are not reported. All these results are modelled in LCA with transfer factors. The transfer of the input to the different output streams (Figure 1.1) is quantified by the so-called transfer factors which are defined as ratios of the different output pathways relative to the total input (see Chapter 4.4.1). They can only be derived for inorganic compounds, especially for heavy metals, as the organic compounds are mostly oxidised in the system. Under the prerequisite of stable operating conditions, the transfer factors are usually only constant within a certain range of loads and concentrations [Zeschmar-Lahl, 2003]. As shown in Chapter 4.4.1, compared to all other heavy metals, the transfer factors for mercury for emissions to air are significant. As a consequence, for a LCA considering mercury emissions, no reliable transfer factor can be used.
4.3.2.3.6.5 Discussion It is important to note that LCA considerations concerning the thermal treatment of wastes can be used as an approximation to select the most environmentally friendly disposal option. For that comparison, it has to be understood that only certain types of wastes (‘cherry picking’) can be co-incinerated in cement plants (those with high calorific value or processed for it), while the rest has to be thermally treated in incineration plants. MSWIP are an integrated and indispensable part of the waste disposal infrastructure and would never be replaced by power plants or cement plants to treat low calorific value or hazardous wastes. So, 1 MJ from HCV waste in cement plants is producing cement, while 1 MJ of HCF waste entering into a MSWIP feeds the required heat to completely oxidise the organic compounds (and to purify the flue gas according to best available techniques) of a certain amount of other wastes, including hazardous wastes, and, also, co-generates electricity and heat. This conceptual difference would affect to the functional unit if non-marginal variations are to be considered in co-incineration LCA studies. A marginal variation is produced when the foreground system studied in the LCA does not affect the background system. Except from a probable loss of efficiency in the kiln, the use of alternative waste does not affect the cement production operation. But this is not usually the case for larger perspectives, as large-scale production systems or for environmental policy decisions seeking best solutions for a region, which cannot be assessed through single LCA, as a whole economic system is

Chapter 4
174 State of the art of the co-incineration of waste-derived fuels and raw materials in clinker/cement plants
affected. The most evident example is the use of biofuels, where direct consequences of replacement of fossil fuels are positive at local scale, but the indirect consequences have shown an increase of emissions higher than emissions attributed to fossil fuel substitution credit [Searchinger et al., 2008; Fargione et al., 2008]. A non-marginal variation is likely to happen when a large volume of wastes is treated differently, e.g. through co-incineration. These variations can be studied through consequential LCA [Ekval, 2007], although there is not a standard methodology for it. The most common techniques to perform consequential LCA are the rules of general economic equilibrium models to life cycles [Dandres et al., 2011], when assessing policies, or, specifically for waste flows, changing the functional unit introducing the regional scope (e.g. from “1 tonne of waste” to “amount of waste generated in a certain region”). Only consequential LCA would be able to evaluate the consequences of co-incineration on the performance of MSWIP. In that case, 1 MJ of SRF co-incinerated in a cement plant can result in a significant reduction of calorific value input in incineration plants. This reduces the energy input and thus the heat recovery or electricity generation. 4.3.2.3.6.6 Conclusions There are plenty of available LCA studies concerning the co-incineration of waste in cement plants. The results depend on a number of factors, specifically the functional unit chosen, methodological decisions, the system boundaries defined, the parameters considered, the assumptions made, the sources of data, and the allocation approach used. The average LCA study is a simplified approach to calculate the global warming potential. In general, the avoidance of fossil fuel is the main advantage of waste treatment scenarios including cement kilns, although the final results strongly depend on the initial assumptions and have a non-negligible degree of uncertainty. Concerning the co-incineration of waste-derived fuels in cement plants when assessing the production of cement, it seems that the reduction of greenhouse gas emissions is minor and, statistically, not significant. The much more important option is to reduce the clinker content in the cement. In most studies, it is overseen that the co-incineration of waste-derived fuels in cement plants is associated with a loss of energy efficiency, which may compensate the benefit of biogenic CO2 emissions produced from wastes. Other methodologies than LCA would be required for the assessment of the local impact produced by the increased amount of pollutants fed to the kiln. Transfer factors may not be adequate to model the emission of all heavy metals, especially of mercury.
4.3.2.3.7 Economic aspects of waste-derived fuels
4.3.2.3.7.1 Introduction and general considerations
The energy consumption for the production of clinker and cement is high (see Chapter 4.3.2). As a consequence, the energy costs are crucial. Many sources indicate that they account for 30 – 40 % of the total operating costs of cement manufacturing [StUA Münster, 2000; Lorenz/Gwosdz, 2001; Mokrzycki et al., 2003; WBCSD Cement, 2005; Asthana/Patil, 2006; Murray/Price, 2008; Genon/Brizio, 2008; WWF, 2008; EC BREF CLM, 2010; Hoenig, 2012] whereas some sources mention that, when using conventional fuels, the fuel costs account for 20 – 30 % of the total cement production costs [VÖZ, 2012; Bell, 2007] and others for almost half of the total production costs [Lechtenberg, 2010]. At any rate, the percentage is considerable and the cement industry always strove for decreasing the energy consumption and continuously reduced it from the fifties to the late seventies (see Figure 4.6); however, since the eighties, the energy consumption has been relatively stable and in fact increased in the past ten years (see Figure 4.9) due to the increasing use of waste-derived fuels (see Figure 4.10 and Figure 4.22). As the energy demand could not be reduced further, additional approaches were identified to further reduce costs. The major measure taken was, and still is, the use of waste-derived fuels, starting in the eighties (see for instance the development in Germany in Figure 4.21). Thus, the use of waste-derived fuels was mainly economy-driven [Steinbiß, 1979; Kreft et al., 1987; Küppers, 1998; Lübbe-Wolff, 1999; Scheuer, 2003; Schöffmann, 2003; EC RDF, 2003; Gemmer/Schneider, 2006; Genon/Brizio, 2008; VDZ Umweltschutz, 2007; Binninger, 2009; Emberger/Hoenig, 2011; Schneider et al., 2011; Locher/Klein, 2011a; Hoenig et al., 2011]. Figure 4.40 schematically shows the development

Chapter 4
State of the art of the co-incineration of waste-derived fuels and raw materials in clinker/cement plants 175
of the clinker-specific fuel costs. The scheme distinguishes between waste-derived fuels and animal meal. The latter also falls under waste-derived fuels but it has been indicated separately as its impact on the costs can be significant. According to the scheme, the energy costs can even become a negative value, i.e. the plant does not spend money for the waste-derived fuel(s) but is receiving a gate fee for it/them. For certain waste-derived fuels, this is achieved in reality.
Figure 4.40: Schematic development of the clinker-specific fuel costs due to the increasing use of waste-derived fuels and raw materials, based on [KHD, 2007]
One of the first cement plants in Europe with a negative energy bill was the cement works of Holcim Belgique S.A. in Obourg/Belgium. At this site, two wet kilns are operated with a high energy demand [UK EA, 1999] and a production capacity in 2011 of 1.77 million tonnes per year [Edwards, 2012]. So, there was an even stronger need to reduce the costs. As waste-derived fuels, organic solvent, waste oils, animal meals and fats, sawdust soaked with organic residues were/are used [EC RDF, 2003] as well as so-called coal residues including dredged materials from rivers.
4.3.2.3.7.2 Developing market for waste-derived fuels
The development of the market in Germany can be taken as an illustrative example. However, it is not representative yet for many other states but it is likely that in many of them, similar developments will occur. There are three main elements which led to the situation observed in the German market [Friege/Fendel, 2011]:
- The enforcement of the provision that no untreated waste is allowed to be landfilled after 1st
June 2005 led to the erection and operation of additional incineration capacities as well as of MBT plants and dedicated SRF power plants (see Chapter 4.3.2.3.4.3 for the details).
- There is a growing market or all types of waste which has been fostered by the liberalisation of the German waste legislation and the opening of borders within Europe so that waste can be recovered,
- The liberalisation of the energy market and the increasing prices for conventional fuels in combination with the emission trading scheme encouraged market participants to substitute conventional with waste-derived fuels. In the (German) cement sector, due to the high percentage of energy costs within total production costs, the substitution activities started very early, already in the eighties.
Development of absolute costs
Waste-derivedfuels
Was-der. raw mat.
Animal mealCo
sts
pe
r to
nn
e c
lin
ke
r

Chapter 4
176 State of the art of the co-incineration of waste-derived fuels and raw materials in clinker/cement plants
As a consequence, the energy market and the waste market are interacting more and more [Friege/Fendel, 2011]. From 2005 – 2007, due to the aforementioned ban of landfilling untreated waste, the existing treatment capacities were not sufficient and the specific costs considerably increased by a factor of about 2.5 (Figure 4.41). But as a consequence of additionally installed capacities (see above), the price for one tonne of municipal solid waste again went down to the level of 2004. At the same time, the recovery rates increased and the quantity of residual waste decreased (see Figure 4.26); thus, there were and are overcapacities that explain the sharp decrease in the price. In the Netherlands, the open borders (e.g. waste sent to cheaper German plants) as well as overcapacities also lead to a decrease in the price for municipal solid waste (Figure 4.41) whereas the price in Flanders remained relatively stable. As the market for SRF produced from municipal waste is dependent on the price for municipal waste, the SRF-platforms are increasingly by-passed and the prices for them are hardly sufficient to justify the pre-treatment stage [ERFO, 2010]; i.e. SRF production is not economically feasible [BVSE, 2010]. The ERF production costs depend on the SRF quality and thus on the techniques applied and vary in the range of 30 – 70 EUR per tonne [Alwast, 2007; ADEME, 2009; ERFO, 2010; Walsh, 2010; AT UBA, 2012].
Figure 4.41: Development and foresight of the price for municipal solid waste (MSW) in Germany, Netherlands and Flanders [ERFO, 2010] Legend: DE = Germany/German; NL = Netherlands/Dutch; Fle = Flanders/Flemish
4.3.2.3.7.3 Prices for waste-derived fuels
In general, the availability of information on prices demanded or paid for waste-derived fuels is very limited. Most information is available for solid recovered fuels (SRF). Further, the prices for waste-derived fuels are not stable and are influenced by changing market conditions. For instance, after the introduction of the feed ban of mammalian meat and bone meal, feasibility studies showed that this material can be co-incinerated in cement plants [DE BMU, 2001]. In the beginning (2001-2002), high gate fees were paid to incinerating or co-incinerating plants such as cement plants. For instance, the gate fees in Belgian cement kilns were in the range of 74 – 124 EUR per tonne at that time [EC RDF, 2003]. In the meantime, meat and bone meal with a net calorific value of typically 16 – 19 MJ/kg has
2004 2005 2007 2008
60
100
140
200
40
20
80
0
120
EU
R/t
on
ne
wa
ste
160
180
2006 2009 2010 2011 2012
DE
MSW
NL
MSW
Fle.
MSW
German landfill ban
German overcapacityNL‘s MSW open borders
& overcapacity
German, Dutch and Flemish evolution and prognosis of MSW treatment prices

Chapter 4
State of the art of the co-incineration of waste-derived fuels and raw materials in clinker/cement plants 177
become a commonly used waste-derived fuel in cement plants and they are ready to pay for it but very little, e.g. in Germany and the Czech Republic a few EUROs per tonne [UBA AT, 2012]. Also the price for RDF underwent a development. For instance, for Germany for the time period 2002 - 2006, gate fees of 40 - 70 EUR/tonne [Zeschmar-Lahl, 2002], 20 – 100 EUR/tonne [Thomé-Kozmiensky/Beckmann, 2004], 25 – 40 EUR/tonne, specifically for cement plants, [Alwast, 2007], and 0 – 80 EUR/tonne, specifically for cement plants, [ADEME, 2009] were reported. The price mainly depends on the SRF quality and the local market conditions. In the meantime, there are some cement plants which pay for SRF but little; this is not only true for Germany but also for Poland and Northern Europe [ERFO, 2011]. In general, it is still common that a gate fee is paid to the cement plant operator. Available examples are compiled in Table 4.28.
Table 4.28: Compilation of available information on gate fees for solid recovered fuels for cement plants in Europe
In the following two tables (Table 4.29 and Table 4.30), simple examples of the cost implications with respect to the use of waste-derived fuels are presented. The examples concern a “typical” cement plant with an annual clinker production capacity of around 1 million tonnes that uses coal as the main fossil fuel and intends to substitute part of the coal by waste-derived fuels with different net calorific values for which a price of 35 EUR/t has to be paid, or which is received for free, or for which a gate fee of 20 EUR/t is obtained. Economic savings arising from carbon dioxide emission savings, additional costs for the substitution of conventional fuels, such as costs for storage, handling and dosage, higher energy consumption due to increased heat losses and water evaporation, wear on refractories, clogging, unplanned shut-downs, permitting, etc. are not taken into consideration [Lechtenberg/Diller, 2012]. The relationship between the costs for conventional fuels, the net calorific values of the conventional and the waste-derived fuel and the SRF price is the basis for feasibility studies of waste-derived fuel projects [Lechtenberg/Diller, 2012]. The estimations show that the savings can be considerable, especially where a gate fee is obtained.
Gate fees in the
cement industryMember State Source Remark
[EUR/t]
20 - 50 France (ADEME, 2009)IF the NCV is between 15 and 18 MJ/kg, including
transport costs, price depends on the calorific value and
chlorine content
0 - 20 France (ADEME, 2009)IF the NCV is greater than 18 MJ/kg, including transport
costs, price depends on the calorific value and chlorine
content
25 - 40 Germany (Alwast, 2007)
0 - 80 Germany (ADEME, 2009) The price depends on the SRF quality
35 Greece (EC ALF-CEMIND, 2008) For a NCV of 14 MJ/kg
30 - 40 Ireland (Walsh, 2010)
50 - 62 United Kingdom (UK DEFRA, 2008)Price seems also to be valid for the cement industry, for
a NCV of 11 - 14 MJ/kg
Legend: NCV = net calorific value; SRF = solid recovered fuels

Chapter 4
178 State of the art of the co-incineration of waste-derived fuels and raw materials in clinker/cement plants
Table 4.29: Cost estimations concerning the substitution of conventional fuels (here coal) by waste-derived fuels, here SRF with a NCV of 18.8 MJ/kg; there are two options with a coal price of 100 and 60 EUR/t and within these two options, three different costs for the SRD are considered, based on [Lechtenberg/Diller, 2012].
In the following Table 4.30,the cost savings can be negative if a price of 35 EUR/t has to be paid for the SRF because of the low net calorific value. However, if the SRF is delivered for free or even a gate fee is obtained, the savings are also high.
Table 4.30: Cost estimations concerning the substitution of conventional fuels (here coal) by waste-derived fuels, here SRF with a NCV of 18.8 MJ/kg; there are two options with a coal price of 100 and 60 EUR/t and within these two options, three different costs for the SRD are considered, based on [Lechtenberg/Diller, 2012]
Where the gate fees for SRF are decreasing, like e.g. in Germany, it can be expected that the cement industry is looking for other options, i.e. for other waste-derived fuels in order to obtain higher gate fees. This could be non-hazardous waste with no or minimal pre-treatment such as coarse, large-sized sales packaging collected from households by the Duales System Deutschland (see the example from the Holcim cement works in Lägerdorf/Germany (see Chapter 3.2.3). For this purpose, new techniques were developed, such as the HOTDISC and the PREPOL Step Combustor (see Chapter 3.2.3). Another alternative is the plastics fraction from processing industrial or commercial waste, and particularly “other fractions from industrial or commercial wastes”. The quantities of the latter used in cement plants grew exponentially in the past ten years (see Chapter 4.3.2.3.3.1 and Figure 4.22). As
Baseline
coal remaining coal
Net calorific value [MJ/kg] 26.8 26.8
Fuel dosage [t/h] 16.1 11.3
[t/a] 127875 89451
Substitution rate [%]
Costs
Option 1 [EUR/t] 100 35 0 -20 100
[EUR/a] 12787500 1912680 0 -1092960 8945063
Savings [EUR/a] 1929757 3842437 4935397
Option 2 [EUR/t] 60 35 0 -20 60
[EUR/a] 7672500 1912680 0 -1092960 5367038
Savings [EUR/a] 392782 2305462 3398422
Subsitution scenario
SRF
18.8
6.9
54648
30
Baseline
coal remaining coal
Net calorific value [MJ/kg] 26.8 26.8
Fuel dosage [t/h] 16.1 11.3
[t/a] 127875 89451
Substitution rate [%]
Costs
Option 1 [EUR/t] 100 35 0 -20 100
[EUR/a] 12787500 2869020 0 -1639440 8945063
Savings [EUR/a] 973417 3842437 5481877
Option 2 [EUR/t] 60 35 0 -20 60
[EUR/a] 7672500 2869020 0 -1639440 5367038
Savings [EUR/a] -563558 2305462 3944902
81972
30
Subsitution scenario
SRF
12.5
10.4

Chapter 4
State of the art of the co-incineration of waste-derived fuels and raw materials in clinker/cement plants 179
already indicated in Chapter 4.3.2.3.7.1, the most logical and understandable explanation for this drastic increase is the financial aspect. Economic considerations seem to be the main driver to co-incinerate these waste-derived fuels, although their handling and processing is more difficult and requires more effort. Particularly for dangerous wastes, it can be expected that gate fees are the highest. For instance, in Germany, the gate fee for the dangerous wastes of oil-contaminated spent bleaching earth and waste roofing felt is about 100 EUR/t. For distillation residues from the chemical industry containing organohalogen compounds, the price is even (much) higher. At least five German cement plants have permission to use a large variety of waste-derived fuels including dangerous wastes (see Chapter 4.3.2.3.3.2). Against the background of the described economic considerations, it can be expected that more operators of cement plants will follow this approach. Concerning the economic aspects of waste-derived fuels, they can be grouped into five classes: The cement plant operator
receives a moderate gate fee (less than 50 EUR/t); for instance, in Germany, the gate fee for waste tyres, sewage sludge and waste wood is about 25 EUR/t, and for waste plastics about 20 EUR/t,
receives a considerable gate fee (more than 50 EUR/t); for instance, in Germany, the gate fee for the dangerous wastes of oil-contaminated spent bleaching earth and waste roofing felt is about 100 EUR/t,
receives the waste-derived fuel (plus/minus) for free; for instance, in Germany, residues from paper manufacturing or animal meal are delivered for free,
pays a moderate price (less than 50 EUR/t); for instance, in Germany, about 25 – 35 EUR/t is paid for waste oil, and about 10 – 20 EUR/t for spent solvents (not containing organohalogen compounds),
pays a considerable price (more than 50 EUR/t); for instance, in Germany, more than 100 EUR/t is paid for animal fat
Today, in Central Europe, the earnings due to the use of waste-derived fuels are in the range of 4 – 11 EUR per tonne clinker with an average range of 5 – 7 EUR per tonne clinker. The extrapolation of this range to the European Union shows that the potential of earnings by using waste-derived fuels is about 1 billion EUR per year. This huge amount offers one compelling explanation for the ongoing activities to increase the use of waste-derived fuels.
4.3.3 Feeding points for waste-derived raw materials and waste-derived fuels
4.3.3.1 Introduction
The feeding points of waste-derived fuels and raw materials can be important with respect to complete or incomplete combustion of organic compounds or their formation in the preheater, and thus for emissions of organic compounds and carbon monoxide to air. Therefore, for each waste, the optimum feeding point has to be determined. In principal, for the dry process with a three- to six-stage cyclone preheater, there are three different feeding points (1), (2) and (3) as indicated in Figure 4.42.

Chapter 4
180 State of the art of the co-incineration of waste-derived fuels and raw materials in clinker/cement plants
Figure 4.42: Overview of a cement works with the indication of the basic points (yellow points with the numbers 1, 2 and 3) for the feeding of waste-derived fuels and raw materials, based on [EC BREF CLM, 2010]
These three principle feeding points are:
the main burner at the rotary kiln outlet end (1) the secondary firing (2) for which a number of different versions exist (see the list below) the raw material route (3)
Concerning the secondary firing, the following feeding points exist in practice:
via a feed chute at the transition chamber at the rotary kiln inlet end (used for lumpy fuels such as waste tyres) – see Figure 3.7
via secondary burners to the riser duct – see Figure 3.7 (the burner is not indicated but the basic layout is according to this figure)
via a precalciner without a burner (so-called flameless combustion – see Figure 3.9) via a precalciner equipped with a burner via a pre-combustion chamber, that is not equipped with a burner (so-called flameless
combustion), prior to the precalciner - see Figure 3.13 via a combustion chamber, equipped with a burner, prior to the precalciner - see Figure 3.14 circulating fluidized bed prior to the precalciner – see Figure 3.16
4.3.3.2 Waste-derived fuels
Waste-derived fuels are usually fed via the main burner and the secondary firing. Waste-derived fuels which are fed through the main burner are usually completely oxidised in the primary burning zone within the rotary kiln at high temperatures of up to 2000 °C. Today, multi-channel burners are designed for the use of different types of fuels including waste-derived fuels (see Chapter 3.3.5). As indicated above, secondary firing is practiced in different ways. The temperature and the residence time is significantly shorter compared to the co-incineration via the main burner. The incineration efficiency depends on the combustion conditions, the time-specific quantities fed as well as on the
12
3

Chapter 4
State of the art of the co-incineration of waste-derived fuels and raw materials in clinker/cement plants 181
properties of the waste-derived fuels, such as their chemical, mechanical and calorific properties, and reaction-technical properties (see 3.3.2.3). The combustion conditions (mainly the temperature and temperature distribution within a certain device, turbulence and residence times) depend on kiln design and kiln operation [EC BREF CLM, 2010]. For the different precalciners, detailed information is provided in Chapter 3.3.2. There, a concrete example is described for the optimisation of a precalciner to minimise the emissions to air (see Chapter 3.3.2.4). The time-specific quantities of waste-derived fuels fed (dosage regime) also have an influence on the emissions to air. For instance, the overdosing with waste tyres can lead to significantly increased emissions of volatile organic compounds and carbon monoxide (see Annex IV, 16). The chemical, mechanical and calorific properties, and reaction-technical properties, also have an important influence. For instance, a complete combustion of large-sized and rather unreactive waste-derived fuels, such as shredded tyres, can often not be achieved. 4.3.3.3 Waste-derived raw materials
Waste-derived raw materials are often added to the raw materials and thus enter the preheater with the raw meal. However, waste-derived raw materials are also fed via the kiln inlet and in some cases to the precalciner. As already described in Chapter 4.1.2.1, during the preheating phase in the preheater, organic components and carbon monoxide may be released from the kiln feed due to evaporation or decomposition. This occurs in addition to the release of organic compounds and carbon monoxide from the natural raw materials (see Chapter 3.3.1). Thus, when processing waste-derived raw materials, they must be checked for potential emissions of volatile organic constituents and carbon monoxide, and the feeding point selected. For this purpose, it is recommended to use the expulsion test as described in Chapter 3.3.1.2.2. For certain wastes, such as industrial sludges, spent foundry sand and road debris, it is important to analyse for individual compounds, such as benzene and other organic compounds (e.g. by GC-MS – see Chapter 3.3.1.2.3), in addition to the sum of VOC. In some cases, the analysis of PCDD/F, PCB and HCB is also required as they can be released from certain waste-derived raw materials. For instance, it was recognised that the feeding of so-called coal residues including dredged materials from rivers via the raw material route (because it was wet it could not be fed elsewhere) was associated with high PCDD/F emissions in the range of 3 – 7 ng I-TEQ/Nm3. This is an extreme case but it can happen. It was observed at the cement works of Holcim Belgique S.A. in Obourg/Belgium in the nineties. As a consequence, this material was dried, ground and fed via the main burner. In addition, a long-term PCDD/F-sampling was introduced [Reinmann et al., 2006; Reinmann et al., 2008; Reinmann et al., 2010]. Another very severe case was recently discovered in Austria (Görtschitztal/Federal State of Carinthia) where hexachlorobenzene (HCB) containing residues were mainly fed via the raw material route. As a consequence, the high HCB emissions resulted in a significant contamination of the valley Görtschitztal (cow milk, meat of farm animals, contamination of residents etc.) [Funk et al., 2015; Land Kärnten, 2014; Land Kärnten, 2015; Gasteiner et al., 2016] (see Chapter 4.4.3.14). Surprisingly, the relevance of the feeding points is not widely recognised in the operating permits. E.g., as already indicated in Chapter 4.3.2.3.3.2, from the available German operating permits, only one contains a stipulation concerning the feeding points. There, it is prescribed that “Due to their content of organic pollutants, the waste-derived raw materials spent foundry sand and paper sludge must be fed via the secondary firing”. As an example in this context, foundry sand is also mentioned in the [EC BREF CLM, 2010].

Chapter 4
182 State of the art of the co-incineration of waste-derived fuels and raw materials in clinker/cement plants
4.4 Output mass streams
4.4.1 Basic considerations of the material flow analysis (MFA) – transfer factors
The transfer factors are based on material flow analysis [Baccini/Brunner, 1991; Lahl, 2000; Lahl, 2001; Friedrich et al., 2001; Zeschmar-Lahl/Lahl, 2003] which can be also applied to technical processes such as for cement plants [e.g. Zeschmar-Lahl, 2003; NRW MUNLV, 2005]. The MFA describes the material input and output of a system. In cases of production plants such as a cement works, the system consists of a combination of individual technical processes (the rotary kiln, the preheater, the clinker cooler, the raw mill etc.) within defined system boundaries. For cement plants, the input flows are mass streams such as natural raw materials, conventional fuels, waste-derived raw materials and fuels, chemical auxiliaries, electricity, and air etc. (Figure 4.43), and the output materials are the clinker, filter dust, and the various emissions to air. For a cement plant, the MFA is applied for inorganic compounds (materials), especially for heavy metals. It does not make much sense to consider organic compounds as they are largely oxidised in the system, especially in the rotary kiln and, where available, in the precalciner or pre-combustion chamber.
Figure 4.43: Input and output flows of a cement plant
In principle, the MFA is only applicable if a number of process-related conditions are fulfilled. The most important condition is that, in relation to the considered processes, the transfer factors are constant. They should be independent from the input material and the input quantity of the parameter (e.g. a chemical compound) considered [Zeschmar-Lahl, 2003]. This requires stable operation conditions for the processes considered. For carrying out the MFA, the system concerned is usually considered as a ‘black box’ (Figure 4.44). One or more mass streams entering the system (input) result in one or more mass streams leaving it (output). Figure 4.44 shows the basic scheme for this approach and Figure 4.43 its application to the cement production system. The input and output are quantified, e.g. in load by time (e.g. in kg/h) or as a concentration (e.g. mg/Nm3) and flow.
raw
materials
natural/convent
.waste-derived
fuelsconvention. (fossil
electricity
air
water
clinker
auxiliaries
waste-derived
Grinding(cement mill)
cement
air
air
additives
and wastes
Clinker
burning
emissions to air
filter dust
INPUT OUTPUT
Raw millCooler
Pre
heate
r
Filter

Chapter 4
State of the art of the co-incineration of waste-derived fuels and raw materials in clinker/cement plants 183
Figure 4.44: Basic scheme for the material flow analysis of a certain system with defined system boundaries [Zeschmar-Lahl, 2003; NRW MUNVL, 2005]
In principle, the sum of the input mass streams is equal to the sum of the output mass streams (pathways) (Equation 4-8).
Equation 4-8: Equation for the material input and output of a technical system Legend: m = material or mass streams
The transfer of the input to the different output streams is quantified by the so-called transfer factors which are defined as quotient of the different output pathways of the total input (Equation 4-9). Under the prerequisite of stable operating conditions, as mentioned above, they are usually only constant within a certain range of load and concentration [Zeschmar-Lahl, 2003].
Equation 4-9: Definition of the transfer factor from the input to the output of a technical system
For cement plants, the most important output pathways are the clinker, and cement, and emissions to air (see Figure 4.43). The filter dust is recycled to the raw materials, or, more frequently, is discarded and added to the clinker. In some cases, the filter dust is externally disposed of. The transfer factors from the input to the product and the emissions to air can be determined for the different heavy metals. So, the input is equal to the sum of all the products of the different transfer factors and the input, and consequently, the sum of all transfer factors is equal to 1 (Equation 4-10).
Equation 4-10: Equation showing that the input is equal to the sum of the products of transfer factors and the input [Zeschmar-Lahl, 2003]
Black box
System boundary
Input
Output
here: the clinker and cement
production system
.
.
∑ minput = ∑ moutput
TFx = moutput
minput
x: index for the output pathways
.
.
minput = TFa ∙ minput + TFb ∙ minput + ...... TFx ∙ minput
TFa + TFb + ….. TFx = 1 ;
a, b …. x: indices for different output pathways such
as the product(s), waste gas or solid waste

Chapter 4
184 State of the art of the co-incineration of waste-derived fuels and raw materials in clinker/cement plants
For instance, the transfer of mercury from the raw materials and fuels to the waste gas (emission to air) can be expressed with the following equation (Equation 4-11).
Equation 4-11: Equation for the transfer factor of mercury from the input to the waste gas (emission to air) Legend: TFwg,Hg = transfer factor (TF) from the material input (minput) to the waste gas (wg) for mercury (mwg,Hg)
In Table 4.31, transfer factors from the material input to the waste gas (after the waste gas filter) for different heavy metals are compiled. The data stem from different sources. From the transfer factors for mercury, it can be seen that the filter dust is discarded. If not, the transfer factor is practically 100 % [Linero, 2011]; this is also explained in Chapter 3.2.4.2.2 and Chapter 4.3.2.3.5. In the case of the transfer factor of 93 % mentioned in the Table above, the dust was not discarded, or if it was only to a very low extent. The other factors can only be explained if the filter dust is systematically discarded. This is due to the fact that mercury is completely volatilised during the process and completely leaves the preheater. It is not incorporated into the clinker at all [Sprung, 1988; Kirchartz, 1994; Bhatty, 1995; Locher, 2000] and thus, it is either adsorbed to the raw meal or to the filter dust or emitted with the waste gas. With the raw meal and the fraction of filter dust returned to the raw meal, the mercury re-enters the preheater and fully evaporates again in the kiln and the preheater, so that an external cycle is formed (see Chapter 3.2.4.2.2). However, a relatively high percentage is always leaving the system with the waste gas emissions. This percentage strongly depends on the waste gas temperature (see Figure 3.37 and Chapter 4.4.3.5 about mercury emissions). Further, the emissions are different for the compound and direct operating mode (see Chapter 3.2.4.2.2 and Chapter 3.3.3). As a consequence, for mercury, the transfer factors for the emissions to air are not constant and thus, the aforementioned prerequisite is not fulfilled. The mercury emissions vary by time and thus there are different transfer factors. The transfer factors for different cement plants are even less comparable. Against this background, the transfer factor’s range in Table 4.31 (values between 16 and 93 %) are only indicative. Compared to all other heavy metals, the transfer factors for mercury are significant.
TFwg,Hg = mwg,Hg
minput
.
.

Chapter 4
State of the art of the co-incineration of waste-derived fuels and raw materials in clinker/cement plants 185
Table 4.31: Compilation of transfer factors of heavy metals from the material input to the waste gas
Parameter Unit
(Lahl et al., 2000), based on VDZ data *1 and (NRW
MUNLV, 2005)*2
(VDZ, 2001)*3 (Braungart et al., 1999)
(Lahl et al., 2000),
based on data from (Winkler, 1998)*4
(Goosmann et al.,
1993)*5 (Graf AG, 1998)*6
(Fehringer et al.,
1999)*7
compound direct
Antimony (Sb) % 0.03 <0.01 - <0.05 0.02 0.03 0.16 0.05 0.19
Arsenic (As) % 0.02 <0.01 - 0.02 0.02 0.01 0.06 0.05 0.19
Cadmium (Cd) % 0.17 <0.01 - <0.2 0.05 0.28 0.44 0.05 0.19
Chromium (Cr) % 0.01 <0.01 - <0.05 0.00 0.01 0.05 0.02 0.14
Cobalt (Co) % 0.02 <0.01 - <0.05 0.03 0.02 0.02 0.14
Copper (Cu) % 0.01 <0.01 - <0.05 0.02 0.01 0.02 0.14
Lead (Pb) % 0.05 <0.01 - <0.2 0.02 0.36 0.64 0.06 0.19 0.04
Manganese (Mn) % 0.02 <0.001 - <0.01 0.01
Mercury (Hg) % 40 93 75 16 20 40
Nickel (Ni) % 0.03 <0.01 - <0.05 0.01 0.02 0.02 0.14
Thallium (Tl) % 1.3 <0.01 - <1 1.1 2.70 0.05 0.07 0.13
Tin (Sn) % 0.07 0.00 0.10
Vanadium (V) % 0.05 <0.01 - <0.05 0.01
Zinc (Zn) % 0.03 0.01 0.01 0.08 0.39 0.01
*1 average values for Germany according to the Verein Deutscher Zementwerke e.V. (VDZ), data taken from (Lahl et al., 2000)
*2 the transfer factors in (Lahl et al., 2000) are the same as in (NRW MUNLV, 2005)
*3 it is pointed out that no transfer factor can be submitted for mercury as the measurement results for it depend on the individual operating conditions *4 average values for the cement plants in North Rhine-Westphalia, calculated according to the black box method (TFwg = mwg / minput) with data from (Winkler, 1988)
*5 average values from mass balance measurements from 34 cement kilns (Goosmann et al., 1993)
*6 theoretical transfer factors derived from the model developed by Dr. Graf AG (Graf AG, 1998), Hg values for a waste gas temperature of 140 °C
*7 transfer factors determined for the dry process according to the black box model
Mercury is the only highly-volatile and thallium the only volatile heavy metal (see Chapter 3.2.4.2.2). Thallium strongly enriches in the external cycle. The enrichment factor is higher compared to mercury as the losses of mercury with the residual dust after the filter are much lower. However, in case of CO trips for electrostatic precipitators (see also Chapter 4.4.3.7), the emission can be significant although the transfer factor as such is only in the range of 0.05 – 1.3 % (see Table 4.31). Concerning the transfer factors from the input materials to the product, i.e. to the clinker, it has to be noted that they are practically zero for mercury, thallium and selenium as these metals are completely volatilised in the kiln [Sprung, 1988; Kirchartz, 1994; Bhatty, 1995; Locher, 2000; Zeschmar-Lahl, 2003]. In contrast, the non-volatile heavy metals are incorporated into the clinker to a very high extent, namely more than 99 % [RW MUNLV, 2005], provided the filter dust is discarded and added to the clinker. When considering the direct incorporation into the clinker during the manufacturing process as such, the percentages are lower, i.e. depending on the volatility, the heavy metals are directly incorporated into the clinker and the other part is present in the filter dust (Table 4.32). Together with other additives, the filter dust and the clinker is ground to obtain the final product – the cement.

Chapter 4
186 State of the art of the co-incineration of waste-derived fuels and raw materials in clinker/cement plants
Table 4.32: Percentages for the incorporation of heavy metals in to the clinker and for their adsorption to the removed filter dust [Sprung, 1988; Winkler, 1997; Zeschmar-Lahl, 2003]
The range is biggest for cadmium and lead. This is due to the fact that the incorporation of these low-volatile heavy metals (see Chapter 3.2.4.2.2) into the clinker depends on the chlorine and sulphur input (see Figure 3.29 and Figure 3.31). With the available information, the lower end of the ranges for tin and zinc cannot be explained as these two heavy metals are considered to be non-volatile (see Chapter 3.2.4.2.2). Tellurium can form unstable tellurates which may leave the preheater and end up in the filter dust and the emissions to air [Bhatty, 1995].
4.4.2 Product (clinker)
4.4.2.1 Introduction
The product from the rotary kiln is the clinker. For producing cement, additives are added to the clinker, and in many cases also filter dust from waste gas purification. This mixture is ground to obtain the cement. The non- and low-volatile heavy metals are incorporated into the clinker or are adsorbed to the filter dust which, as indicated above, is added to the clinker. So, the transfer factors for these heavy metals to the cement are more than 98 or 99 % (see Table 4.31). However, the transfer factor for the two low-volatile heavy metals cadmium and lead depend on the chlorine and sulphur input (see Chapter 3.2.4.2.2). The formed chlorides and sulphates leave the system via two pathways: via the fine dust after the filter of the chlorine bypass, where available, and via the filter for the kiln waste gas. In both cases, dusts accumulate in the filters which also contain lead chloride and lead sulphate as well as cadmium chloride and cadmium sulphate. If the dust from the chlorine bypass is also added to the clinker, the transfer factor may be more than 90 % for these two heavy metals.
Heavy metal UnitPercentage incorporated
into the clinker
Percentage adsorbed to the
dust (which is removed in
the filter)
Antimony (Sb) % 83 - 91 5 - 17
Arsenic (As) % 83 - 91 5 - 10
Beryllium (Be) % ca. 99 ca. 1
Cadmium (Cd) % 74 - 88 5 - 20
Chromium (Cr) % 91 - 97 3 - 9
Cobalt (Co) % ca. 93 ca. 7
Copper (Cu) % ca. 88 ca. 12
Lead (Pb) % 72 - 96 2 - 25
Mercury (Hg) % 0 40 - 60
Nickel (Ni) % 83 - 97 3 - 13
Selenium (Se) % ca. 0 ca. 95
Tellurium (Te) % ca. 80 ca. 20
Thallium (Tl) % 0 99.9
Tin (Sn) % ca. 80 ca. 20
Vanadium (V) % 90 - 95 ca. 9
Zinc (Zn) % 80 - 99 ca. 9

Chapter 4
State of the art of the co-incineration of waste-derived fuels and raw materials in clinker/cement plants 187
4.4.2.2 Estimation of the transfer of non- and low-volatile heavy metals
For the following estimations, to a first approximation, it is assumed that the transfer factor is 100% for the non- and low volatile heavy metals. The transfer factor is defined in Equation 4-12.
Equation 4-12: Definition of the transfer factor for the product (here clinker and cement respectively)
The input of the heavy metals derives from the raw materials and fuels (Equation 4-13).
Equation 4-13: Composition of the material input
The raw materials can be distinguished into natural and waste-derived raw materials and the fuels into conventional and waste-derived fuels (Equation 4-14).
Equation 4-14: More detailed equation for the composition of the material input
However, the percentage of waste-derived raw material is usually low and therefore, it is not considered. Consequently, the equation above can be simplified (Equation 4-15).
Equation 4-15: Practical equation for the composition of the material input
The different summands of this equation can be substituted with appropriate parameters (Equation 4-16).
Equation 4-16: Equation to determine the specific material input (related to “kg clinker”)
Legend: craw meal = concentration of a certain heavy metal in the raw meal fraw meal = raw meal factor in kg raw meal per kg clinker: 1.6 kg raw meal/kg clinker cconv, fuel = concentration of a certain heavy metal in the conventional fuels NCVconv. fuel = net calorific value of the conventional fuel Espec = specific energy consumption for clinker production: 3.6 MJ/kg clinker cwdf = concentration of a certain heavy metal in the waste-derived fuel NCVwdf. fuel = net calorific value of the waste-derived fuel
This equation has been used to estimate the zinc concentration in the clinker (it could be also the cement if the filter dust(s) is/are added to the clinker) as presented in Chapter 4.3.2.3.3.2.c. For this example, the figures used are compiled in Table 4.33.
TFproduct = mproduct
minput
.
.
minput = mraw mat. + mfuel
minput = (mnat. raw mat. + mwaste-d. raw mat) + (mconv. fuel + mwaste-d. fuel)
minput = mnat. raw mat. + (mconv. fuel + mwaste-d. fuel)
minput = craw meal• fraw meal + (cconv. fuel/NCVconv. fuel
• Espec.• fconv. fuel + cwdf/NCVwdf
• Espec.• (1 - fconv. fuel)

Chapter 4
188 State of the art of the co-incineration of waste-derived fuels and raw materials in clinker/cement plants
Table 4.33: Figures for the estimation of the zinc content in the clinker
First, the zinc content was estimated without using waste-derived fuels but only hard coal. The result is contained in Table 4.34 below. In this case, the zinc stems from the coal and the raw meal, i.e. the natural raw materials. Table 4.34: Estimation of the zinc content in the clinker without input from waste-derived fuels
In a next step, the zinc content is estimated with the input of waste tyres as a typical waste-derived fuel. The percentage of the rated thermal input as tyres is assumed to be 20 % which is realistic and reflects practice. The results can be seen from Table 4.35. Table 4.35: Estimation of the zinc content in the clinker including the input of waste tyres as a waste-derived
fuel
This estimation shows that the zinc content of the clinker is 5 to 10 times higher when using waste tyres. Thus, the use of waste-derived fuels can have a significant influence on the heavy metal content of the clinker. Equation 4-16 can also be used to calculate the concentration of non- and low-volatile heavy metals in the waste-derived fuel needed to double their concentration in the clinker. For this purpose, the
Specific energy consumption for
clinker production (representative
value)
Espec 3600
Energy content of hard coal (net
calorific value)NCVconv. fuel 29300
Energy content of waste tyres (net
calorific value)NCVwdf 28000
Percentage of fuel input from coal
(for estimation 1)fconv. fuel 100 %
Percentage of fuel input from coal
(for estimation 2)fconv. fuel 80 %
Percentage of fuel input from waste
tyresfwdf 20 %
Specific raw meal factor fraw meal 1,6
Zn content of hard coal cconv. fuel 90 maximum average value for German hard coal
Zn content of waste tyres cwdf 10000 - 16000
Zn content of raw meal craw meal 20 - 47
Zn transfer factor for clinker TFclinker 100 %
kJ/kg cli
kJ/kg coal
kJ/kg waste tyres
for the calculation of the Zn input when using 20 % waste tyres, i.e. 720 kJ
are provided from waste tyres
for the calculation of the Zn input when using 100 % hard coal
mg Zn/kg
mg Zn/kg
for the calculation of the Zn input when using 80 % hard coal; i.e. 2880 kJ
are provided from coal
kg/kg cli
mg Zn/kg
the real factor is very close to 100 %
available data from literature
1. Zn content in the clinker when using 100 % coal
Spec. input of hard coal: mspec. conv. fuel 3600 : 29300 is 0,123 kg coal/kg cli
Spec. Zn input with the coal mspec. conv. fuel, Zn 0.123 x 90 is 11,1 mg Zn/kg cli
Spec. Zn input with the raw meal mspec. nat. raw mat, Zn 1.6 x 20-47 is 32 - 75 mg Zn/kg cli
Total specific Zn input 33 - 86 mg Zn/kg cli
2. Zn content of the clinker when using waste tyres (20 % of the rated thermal input) and coal (80 % of the thermal rated input)
Spec input of hard coal mspec. conv. fuel 3600 : 29300 is 0,123 kg coal/kg cli
Spec. Zn input with the raw meal mspec. nat. raw mat, Zn 1.6 x 20-47 is 32 - 75 mg Zn/kg cli
Spec input of hard coal 3600 : 29300 is 0,123 kg coal/kg cli
thereof 80% 0.123 x 0.8 is 0.0983 kg coal/kg cli
Spez. Zn input with the coal mspec. conv. fuel, Zn 0.0983 x 90 is 8,85 mg Zn/kg cli
Spec. input of waste tyres mspec. wdf 720 : 28000 is 0,0257 kg waste tyres/kg cli
Spec. Zn input with waste tyres mspec. wdf, Zn 0.0257 x10000 -
16000is 257 - 411 mg Zn/kg cli
Total specific Zn input 298 - 495 mg Zn/kg cli
mspec. conv. fuel

Chapter 4
State of the art of the co-incineration of waste-derived fuels and raw materials in clinker/cement plants 189
additional assumption is made that no conventional fuel but 100 % waste-derived fuel is used. Then, the following equation results (Equation 4-17).
Equation 4-17: Equation to determine the specific material input (related to “kg clinker”) in case of using 100 % waste-derived fuel
For doubling the concentration in the clinker, the input with the waste-derived fuels is equal to the input with the raw meal (Equation 4-18).
Equation 4-18: Equation to estimate the concentration of a non- or low-volatile heavy metal in the waste-derived fuels to double the heavy metal concentration in the clinker
With this equation, the values contained in Table 4.16 in Chapter 4.3.2.3.3.2 are estimated. 4.4.2.3 Enrichment of heavy metals in the product
As the non- and low-volatile heavy metals are mainly transferred to the product (clinker/cement), the use of waste-derived fuels may lead to an increase of their content in the product. Zeschmar-Lahl called this increase ‘enrichment’ [Zeschmar-Lahl, 2001a] and highlighted the fact that the “disposal” of heavy metals in the clinker/cement does not comply with the precautionary principle [Zeschmar-Lahl, 2001b]; the heavy metal content could lead to significant long-term problems, especially in the end-of-life phase of buildings or other constructions and associated recycling activities. She published an approach to calculate the maximum values for waste-derived fuels which are not associated with an increase of heavy metals in the product [Zeschmar-Lahl, 2003, p 74]. The reference is the heavy metal input with the natural raw material (raw meal) and coal as a conventional fuel without any use of waste-derived fuels. The results are compiled in Table 4.36 together with guidance values from Germany, Switzerland and Austria. In 2010, Austria has introduced limits as median values and 80th percentiles which are also listed in the Table 4.36.
minput = craw meal• fraw meal + cwdf/NCVwdf
• Espec.
craw meal• fraw meal = cwdf/NCVwdf
• Espec.

Chapter 4
190 State of the art of the co-incineration of waste-derived fuels and raw materials in clinker/cement plants
Table 4.36: Proposal of maximum heavy metal contents in waste-derived fuels to avoid their enrichment in the clinker/cement in comparison with other existing standards or standard proposals
*1 the application of the guidance values is limited to those wastes which are not part of the positive list *2 the values are given in mg/kg DM and have been calculated from them with a net calorific value of 20 MJ/kg *3 in single cases because of inhomogeneities, the exceedance of this range is permitted *4 the values are given in mg/kg DM and have been calculated from them with a net calorific value of 25 MJ/kg *5 for quality controlled waste-derived fuels (waste code 91108 of the Waste Code Ordinance), the median is 0.45 mg/MJ and the 80th percentile is 0.7 mg/MJ
The values calculated by Zeschmar-Lahl are similar to those of the Working Group of the German Federal States on Waste Management (LAGA), Switzerland and Austria before 2008. The German LAGA-values remained as a draft and have so far not been introduced as a regulation. In contrast, the values of North Rhine-Westphalia as one of the sixteen German federal states (the values are also used by other federal states) and of Austria after 2008 are significantly higher for antimony, chromium, copper, and lead. This means that these heavy metals can be enriched in the product. However, for thallium, tin and vanadium, the values proposed by Zeschmar-Lahl are higher than in the other aforementioned sources. As demonstrated above, the zinc content of waste-derived fuels can be significantly increased in the product by using certain waste-derived fuels, especially waste tyres. Other examples for paint and varnish sludges and sludges containing mineral oil show similar results for lead and copper respectively [Zeschmar-Lahl, 2001b]. In addition, the estimations presented in Table 13 in Chapter 4.3.2.3.3.2 also show that enrichments may occur for antimony, cadmium, copper, lead, and tin. In order to avoid the enrichment of heavy metals in the product, Zeschmar-Lahl proposed (Zeschmar-Lahl, 2003, pp 241-245) that a regulation should be issued on the basis of the above mentioned draft LAGA guidance values [LAGA, 1997]. This regulation shall be based on Article 5(4 and 5) of the German Closed Substance Cycle and Waste Management Act [DE KrWG, 2012]. This Article has already been introduced into the act in 1994. In Article 5(4), the duty is prescribed to recycle waste as far as it is technically feasible and economically acceptable, especially where there is a market or a market can be created for a recovered compound or waste, or for recovered energy. Article 5(4) has to be considered together with Article 5(5) which states that the recycling priority does not apply if the disposal option is more environmentally friendly. Thereby, the following aspects have to be taken into account:
Proposal (to
avoid
enrichment in
the clinker)
Guidance
value (draft)
Guidance
value
Guidance
value
(maximum
value)
Guidance
value
Limit
(median)
Limit
(80th
percentile)
Parameter Unit(Zeschmar-
Lahl, 2003)
LAGA (LAGA,
1997)
Switzerland
(CH BUWAL,
2005)*1
Germany
(MUNLV,
2005)*2
Austria before
2008 (Holcim/
GTZ, 2006)*4
Antimony (Sb) mg/MJ 0.6 0.07 0.2 6 0.2 7 10
Arsenic (As) mg/MJ 6.0 1.9 0.6 0.65 0.6 2 3
Barium (Ba) mg/MJ − − 8 − − − −
Beryllium (Be) mg/MJ − − 0.2 − 0.2 − −
Cadmium (Cd) mg/MJ 0.11 0.3 0.08 0.45 0.08 0.23*5 0.46*5
Chromium (Cr) mg/MJ 10.8 3.7 4 6 - 12.5 4 25 37
Cobalt (Co) mg/MJ 2.2 1.2 0.8 0.6 0.8 1.5 2.7
Copper (Cu) mg/MJ 4.6 3.7 4 15 - 35*34 − −
Lead (Pb) mg/MJ 8.4 10 8 10 - 20 8 20 36
Manganese (Mn) mg/MJ 73 − − 5 - 25 − − −
Mercury (Hg) mg/MJ 0.008 0.02 0.02 0.06 0.02 0.075 0.15
Nickel (Ni) mg/MJ 6.6 3.5 4 5 4 10 18
Selenium (Se) mg/MJ − − 0.2 − − − −
Silver (Ag) mg/MJ − − 0.2 − − − −
Thallium (Tl) mg/MJ 2.9 0.15 0.12 0.1 0.12 − −
Tin (Sn) mg/MJ 8.9 0.4 0.4 3.5 0.4 − −
Vanadium (V) mg/MJ 29.7 − 4 1.25 4 − −
Zinc (Zn) mg/MJ 16.9 − 16 − 16 − −
Austria after 2008 (AT
Incineration Ord., 2010)

Chapter 4
State of the art of the co-incineration of waste-derived fuels and raw materials in clinker/cement plants 191
expected emissions, the target to minimise the use of natural resources, the required energy consumption or the energy to be recovered, the enrichment of pollutants in products or wastes to recover, or products generated from the
waste. The last bullet point concerns the above mentioned enrichment. There is the interpretation that a waste, such as a certain waste-derived fuel or raw material, has to be disposed of if its use is associated with an increase of certain pollutants in the product [Zeschmar-Lahl, 2003, p 38]. In contrast, two legal commentaries do not support this and clearly stress that the non-applicability of the recycling priority does not necessarily mean that the waste has to be disposed of but can still be recycled [Frenz, 2002; von Lersner/Wendenburg, 2001]. During the legislative process for the introduction of Article 5 in 1993/1994, the different documents do not reflect the aforementioned issue concerning the recycling priority [DE KrW-/AbfG, 1993/1994]. 4.4.2.4 Leachability of heavy metals from concrete
As mentioned above, the transfer of heavy metals to the product can significantly increase their content in the final product. As a consequence, there are questions concerning environmental impact, such as
Can the heavy metals leach from concrete or mortar? What are the long-term implications with respect to the end-of-life phase of buildings and
other constructions; can the heavy metals be released from aggregates derived from demolition waste (as more and more demolition waste is processed and recycled)?
Regarding environmental contamination, the analysis of the total content of heavy metals is less relevant than their leachability [DHI, 2011]. Consequently, many leaching tests were conducted. Thereby, it is crucial to always report leaching test results along with the exact specification of the leaching test applied, or the specific test conditions [DHI, 2011]. The different tests applied are not described here. For the German situation, Zeschmar-Lahl compiled the available methods [Zeschmar-Lahl, 2003] and for the European level, with specific consideration of aggregates, the available tests are mentioned in [DHI, 2011]. Already in the initial phase of using waste-derived fuels in cement plants, the leachability of heavy metals from concrete was investigated (Sprung, 1988). Focus was laid on the volatile heavy metals, such as thallium, as they are added to the clinker with the filter dust in the form of their water-soluble salts (thallium chloride and thallium sulphate). It was found that the leachability of heavy metals from dense concrete is very low and no adverse environmental impact may be expected [Hohberg et al., 1996; Zeschmar-Lahl, 2003]. However, according to [Zeschmar-Lahl, 2003], the leachability differs
for the different heavy metals considered; e.g. in general, it is significantly higher for chromium,
for the different types of clinker and concrete, for the different types of concrete; e.g. it is higher for pore concrete than for water-tight
concrete, for heavy metals which have been chemically incorporated into the clinker matrix during the
clinker burning process (lower leachability) compared to heavy metals which are added with the filter dust or with other additives to the clinker (higher leachability),
for block concrete compared to concrete aggregates which have a much larger specific surface; this is relevant for concrete recycling where it is crushed into small-sized aggregates.

Chapter 4
192 State of the art of the co-incineration of waste-derived fuels and raw materials in clinker/cement plants
Concerning recycled concrete (aggregates) which represents the highest percentage of mineral demolition waste [IPTS Construction, 2012], it was found that chromium and sulphate show the highest leachability, followed by copper, molybdenum, nickel, lead, antimony, selenium, tin, and vanadium [DHI, 2011]. An assessment of the environmental impact of these results is required. 4.4.2.5 Restrictions concerning products
The use of waste-derived fuels can also lead to product quality issues. As already mentioned in Chapter 4.3.2.3.4.4, the use of sewage sludge, and other phosphorus- containing waste-derived fuels, is limited with regard to the phosphorus input. As a guidance value, the phosphorus content in the clinker may not exceed 0.8 - 1.0 % P2O5 [Schneider et al., 2011]. In order to protect the concrete reinforcement against chloride corrosion [Sprung, 1988], according to [DIN EN 197-1, 2011], the chloride content of cement may not exceed 0.1 weight-%. As already stated in Chapter 3.3.4.3, this specification requirement sets a limit for the addition of chloride present in the bypass dust. However, due to the increasing production and sales of blended cements, associated with a decreasing clinker content (see Figure 4-16 in Chapter 4.3.2.1.3), this limitation can be overcome in many cases.
4.4.3 Waste gas
4.4.3.1 Introduction
From the environmental point of view, the emissions to air, i.e. the waste gas emissions are by far most relevant. Therefore, they are considered in more detail. Thereby, the focus is laid on the waste gas from the kiln; i.e. channelled dust emissions from the clinker coolers and mills for raw material, cement and coal as well as diffuse which mainly derive from storage and handling of raw materials, fuels and lime and from vehicles at the manufacturing site are not considered. By means of emission curves for the continuously monitored pollutants (daily mean values mainly for the parameter dust, NOx, SOx, Hg, CO, VOC, and in some cases also for HCl and NH3), the emission situation is demonstrated and linked to the process, used wastes and waste-derived fuels and applied abatement techniques. Further, important correlations will be presented. To date, such emission curves and correlations have not been published yet except from a few examples in two German articles of the author [Schönberger et al., 2012; Schönberger/Waltisberg, 2014]. The emission curves have been derived from emission data of 34 German cement works which have been published by BBU, a non-governmental organisation, as excel files containing daily mean values for the time period 2008 – 2010, for some plants also for 2011 [BBU, 2013]. The emission values were compared with the emission limit values (ELVs) of the permits concerned which were also published by BBU [BBU, 2013]). The emission data and the permits were gained from competent authorities using the right of access to environmental information based on the Aarhus Convention [UNECE Aarhus Convention, 1998] which was implemented in the European Union with the Directive on Public Access to Environmental Information (EU Info, 2003) and in Germany with the Act on Environmental Information in 2005 [DE UIG, 2014]. The ELVs and the self-monitoring to be performed for the different installations were taken from the permits and are compiled in Table 4.37. The self-monitoring performed was also taken from the emission data as they demonstrate which parameters are continuously monitored. Table 4.37 directly corresponds with Table 2.1 and Table 4.13. The latter also contains information on the German federal state where the installations mentioned are located, the competent authority, the location of the installation and the type of wastes used as well as the requirements concerning the use of waste-derived fuels.

Chapter 4
State of the art of the co-incineration of waste-derived fuels and raw materials in clinker/cement plants 193
Table 4.37: Emission limit values (daily mean values if not specified differently) and the self-monitoring of the waste gas of the 34 German cement works; the information compiled is based on the data published by BBU [BBU, 2013]; values in [mg/Nm3], except for mercury for which the unit is [µg/Nm3]
Legend:
ELVs according to the available permits which deviate
from the 17th Ordinance of the Federal Clean Air Act
Self-monitoring to be carried out according to available permits
Information is not available
x data from continuous self-monitoring available
hha half-hourly average
d direct operating mode
c compound operating mode
ELV Emission limit value
No. Name of operator Dust SOx NOx TOC COBen-zene
HCl HF NH3 Hg O2 p T m V
20 350 500 no ELV no ELV 10 1 30
x x x x x
20 295 500 no ELV no ELV 5 10 1 28
x x x x
10 100 200 20 1000 5 10 1 30 30
x x x x x x
20 300 500 no ELV 2500 10 1 30
x x x x x x x x x x
20 175 500 50 no ELV 10 1 30
x x x x x x x x x x x
20 350 350 no ELV no ELV 10 1 30
x x x x x x
10 50 500 no ELV no ELV 5 10 hha 1 hha30/ 50
d/c
x x x x x x x x x x x
10 no ELV 200 no ELV 6250 10 1 30
x x x x x x x
10 ? 200 50 ? ? ? ?
x x x x x x x x x
10 200 475 100 2500 5 hha 10 1 30
x x x x x x x x x
14 50 333 no ELV no ELV 10 1 30
x x x
20 50 500 no ELV no ELV 5 10 1 30
x x x x x x x x x x x
1
2
HeidelbergCement AG
Lafarge Zement Wöss ingen GmbH
3
4
Schwenk Zement KG
HeidelbergCement AG
5
6
Holcim GmbH
Schwenk Zement KG
7
8
Märker Zement GmbH
Schwenk Zement KG
9
10
HeidelbergCement AG
Südbayrisches Portland-Zementwerk
Gebr. Wieshöck & Co.
GmbH
11
12
HeidelbergCement AG
Portland-Zementwerke GmbH &
Co. KG

Chapter 4
194 State of the art of the co-incineration of waste-derived fuels and raw materials in clinker/cement plants
No. Name of operator Dust SOx NOx TOC COBen-
zeneHCl HF NH3 Hg O2 p T m V
20 350 500 30 no ELV 10 1 30
x x x x x x x x
20 50 500 no ELV 2000 10 1 30
x x x x x x
20 200 500 10 3000 10 1 30
x x x x x x x x
14 400 317 70 3000 10 1 30
x x x x x x x x x x
13.9 400 318 no ELV 3000 10 1 50
x x x x x x
10 50 230 10 50 10 1 30
x x x x
20 350 200 50 no ELV 10 1 30
x x x x
10 200 200 100 no ELV 10 1 30
x x x x x
20 225 500 100 no ELV 10 1 50
x x x x x x
12.5 200 245 100 50 10 1 30
x x x x x x
20 350 500 no ELV no ELV 5 30 3 50
x x x x
10 200 350 100 no ELV 10 1 30
x x x x x
11 no ELV 230 no ELV no ELV no ELV
x x x x x x x
20 350 500 20 no ELV 10 1 30
13 350 275 20 no ELV 10 1 30
x x x x x x x x x
12 no ELV 260 no ELV no ELV no ELV
x x x x x x x x x
12 no ELV 260 no ELV no ELV no ELV
x x x x x x x x x
13
14
Cemex Ost-Zement
GmbH
Dyckerhoff AG
15
16
Zement- und
Kalkwerke Otterbein
GmbH & Co. KG
Holcim GmbH
17
18
HeidelbergCement AG
(former Teutonia
Zement AG)
Wittekind Hugo
Miebach & Söhne
19
20
Seibel & Söhne GmbH
& Co. KG
Gebr. Seibel GmbH &
Co. KG
21
22
Spenner Zement
GmbH & Co. KG
Dyckerhoff AG
23
24
HeidelbergCement AG
HeidelbergCement AG
25
26
HeidelbergCement AG
Kiln 4
Kiln 8
27
28
Dyckerhoff AG
Cemex West-Zement
GmbH
Phoenix Zementwerke
Krogbeumker GmbH &
Co. KG

Chapter 4
State of the art of the co-incineration of waste-derived fuels and raw materials in clinker/cement plants 195
From the table above, the following lessons can be drawn:
- all cement plants have a valid permit which are issued by competent authorities on the local or regional level depending on the German federal state concerned,
- all permits contain emission limit values for a number of parameters o dust and NOx: all operators must comply with an ELV for dust and for NOx, o 4 operators do not have an ELV for SO2, o 3 operators do not have an ELV for Hg, o 3 operators do not have an ELV for HCl and HF, o 16 operators, i.e. about half of them, do not have an ELV for TOC, o 20 operators, i.e. 60 %, do not have an ELV for CO, o only 8 operators, i.e. only 25 %, do have an ELV for benzene, o only 2 operators do have an ELV for NH3,
- all operators do practice continuous self-monitoring for dust and NOx, o all operators do continuously monitor dust, NOx and SO2 (one exemption for SO2), o 30 operators, i.e. about 90 %, do continuously monitor Hg, o 18 operators, i.e. about half, do continuously monitor TOC, o 20 operators, i.e. 60 %, do continuously monitor CO, o only 3 operators do continuously monitor HCl, o only 2 operators do continuously monitor NH3.
The ELVs, defined as daily mean values, for the different parameters vary for dust within a relatively small range (10 – 20 mg/Nm3). The same is true for NOx (200 – 500 mg/Nm3) and HCl (10 – 30 mg/Nm3), HF (1 – 3 mg/Nm3) and Hg (28 – 50 mg/Nm3) whereas the range is bigger for SO2 (50 – 400 mg/Nm3) and TOC (20 – 100 mg/Nm3), and is extremely wide for CO (50 – 6250 mg/Nm3). In the eight cases of an ELV for benzene, the value is 5 mg/Nm3, and for the two cases for NH3, the value is 30 mg/Nm3.
No. Name of operator Dust SOx NOx TOC COBen-zene
HCl HF NH3 Hg O2 p T m V
? ? ? ? ? ?
x x x x x x x x
12 50 260 50 hha 2000 10 1 30
x x x x x x x
10 400 200 50 2000 10 1 30 50x x x x x x x x
15 350 335 50 no ELV 5 10 1 30
x x x x x
20 285 500 no ELV no ELV 5 10 1 50
x x x x x x x x x x
16 ? 400 ? ? ? ?
x x x x x x
33 Holcim GmbH
34Dyckerhoff AG - Deuna Zement GmbH
30 Dyckerhoff AG
31Lafarge Zement Karlsdorf GmbH
32 Schwenk Zement KG
29Portlandzementwerk Wotan H. Schneider
KG

Chapter 4
196 State of the art of the co-incineration of waste-derived fuels and raw materials in clinker/cement plants
In Annex IV, the available emission data are evaluated for each installation in detail for all measured parameters. In the following, the different parameters are discussed against the background of these individual evaluations which may serve as a source for even more detailed considerations. Regarding the different parameters, more text is presented for parameters for which available knowledge is more limited and have a high environmental relevance at the same time. This is specifically true for mercury. In addition, this hazardous heavy metal is subject of the Minamata Convention recently issued in 2013 [UN Minamata Convention, 2013]. As a consequence, the chapter for mercury is most detailed and served as a main input to the “Guidance on best available techniques (BAT) and on best environmental practices (BEP)” according to Article 8 of the Minamata Convention [Minamata BAT/BEP Cement, 2015]. As indicated, the focus is laid on the continuously monitored parameters but also information on discontinuously monitored parameters such as heavy metals other than mercury, benzene, PCB, PCDD/F and PAH is submitted. 4.4.3.2 Waste gas flow
The waste gas results from combustion processes, the release of carbon dioxide from the calcinations process, and the evaporation of water present in the raw materials but also added via the conditioning tower. 4.3.2.1.1 Approximation formula to estimate the waste gas flow The waste gas flow is composed of the off-gas from the combustion of the organic compounds, mainly present in the fuels and to a very minor extent in the raw meal, and of the carbon dioxide from the calcinations process (see Chapters 3.2.2 and 3.3.2). In addition, the emitted waste gas also contains water vapour released from the combustion process, in the preheater from the residual water content (0.5 – 1 weight-%) [Klein/Hoenig, 2006] as well as from the water injected in the conditioning tower and from the moisture present in the raw materials (5 – 20 weight-%). In the following section, the formula to estimate the off-gas flow from combustion and calcinations is presented, expressed in relation to dry off-gas. Consequently, the water vapour will not be taken into account. a) Off-gas from combustion First, it is necessary to know the net calorific value (NCV), the stoichiometric air (Astoich)(14), the stoichiometric off-gas (OGstoich)(15), and the stoichiometric off-gas without moisture (OGstoich(dry)). In Table 4.38, for some conventional and waste-derived fuels, these data are compiled. In addition, this Table also contains the ratios of Astoich/NCV,OGstoich/NCV, and OGstoich(dry)/NCV, as they are relatively constant and can be used for the approximation formula of the off-gas flow.
(14) stoichiometric off-gas, which is the theoretical off-gas volume from the complete combustion of an organic compound or of a fuel in Nm3/kg (15) stoichiometric off-gas, which is the theoretical off-gas volume from the complete combustion of an organic compound or of a fuel in Nm3/kg

Chapter 4
State of the art of the co-incineration of waste-derived fuels and raw materials in clinker/cement plants 197
Table 4.38: Net calorific value (NCV), stoichiometric air (Astoich), stoichiometric off-gas (OGstoich), and dry stoichiometric off-gas as well the ratios Astoich/NCV, OGstoich/NCV, and OGstoich(dry) /NCV [Waltisberg, 2011]
Looking at the values of more fuels and organic compounds which are present in fuels, the average value for the dry off-gas related to the net calorific value can be derived as 0.25 Nm3/MJ. It has been assumed that coal still represents a significant percentage of the fuel mix. Especially in cases where the substitution rate of conventional fuels is very high, the average is a little bit lower (e.g. 0.245 Nm3/MJ which is 2 % less). This average is defined as follows (Equation 4-19):
Equation 4-19: Definition of the dry off gas flow related to the net calorific value
Table 4.39: Stoichiometric air, stoichiometric off-gas and dry stoichiometric off-gas related to the net calorific value for different fuels and organic compounds present in the fuels [Waltisberg, 2011]
Parameter
Astoich/NCV OGstoich/NCV OGstoich(dry)/NCV
[Nm3/kg] [Nm3/kg] [Nm3/kg]
Fuel
Coal
Lignite 0.255 0.274 0.247
Bituminous coal 0.257 0.271 0.250
Gasing coal 0.258 0.270 0.251
Gas coal 0.259 0.269 0.252
High bituminous coal 0.260 0.269 0.253
Forge coal 0.260 0.268 0.254
Glance coal 0.260 0.267 0.255
Hard coal (anthracite) 0.260 0.267 0.255
Coke 0.259 0.260 0,258
coal average 0.258 0.269 0.252
Wood
Pulp 0.244 0.278 0.242
Wood wet (10% moisture) 0.248 0.290 0.246
Wood wet (20% moisture) 0.252 0.304 0.251
NCV Astoich OGstoich OGstoich(dry) Astoich/NCV OGstoich/NCV OGstoich(dry)/NCV
[MJ/kg] [Nm3/kg] [Nm3/kg] [Nm3/kg] [Nm3/MJ] [Nm3/MJ] [Nm3/MJ]
FuelLignite 28.2 7.18 7.74 6.96 0.255 0.274 0.247
Coke 33.3 8.61 8.65 8.59 0.259 0.260 0,258
Wood 18.9 4.61 5.25 4.58 0.244 0.278 0.242
Natural rubber 42.0 10.99 11.65 10.33 0.262 0.277 0.246
Tyres 30.2 7.87 8.54 7.50 0.261 0.283 0.248
Polyester 22.2 5.57 6.04 5.57 0.251 0.272 0.251
Polyurethane 23.7 5.80 6.53 5.65 0.245 0.276 0.238
Diesel oil 42.8 11.19 11.93 10.45 0.261 0.279 0.244
Waste oil 37.6 9.87 10.61 9.27 0.262 0.282 0.247
Parameter
OGstoich, NCV(dry) = average OGstoich, NCV(dry) in Nm3/MJ = 0.25 Nm3/MJ

Chapter 4
198 State of the art of the co-incineration of waste-derived fuels and raw materials in clinker/cement plants
Wood wet (30% moisture) 0.259 0.324 0.257
Wood wet (30% moisture) 0.268 0.353 0.266
Waste wood 0.246 0.288 0.245
wood average 0.253 0.306 0.251
Rubber
Natural rubber 0.262 0.277 0.246
Polyisoprene 0.262 0.278 0.246
Buna rubber 0.262 0.277 0.247
Neoprene 0.261 0.274 0.248
Vulcanised rubber 0.260 0.274 0.248
Tyres 0.261 0.283 0.248
rubber average 0.261 0.277 0.247
Plastic material
Polyacrylamide 0.240 0.270 0.237
Polyethene 0.262 0.280 0.244
Polyester 0.251 0.272 0.251
Polyisobutane 0.262 0.280 0.244
Polypropene 0.262 0.280 0.244
Polystyrene 0.262 0.273 0.251
Polyurethane 0.245 0.276 0.238
plastics average 0.255 0.276 0.244
Oil
Diesel oil 0.261 0.279 0.244
Waste oil 0.262 0.282 0.247
oil average 0.262 0.281 0.246
Aliphatic hydrocarbons
Pentane 0.262 0.283 0.241
Hexane 0.262 0.282 0.242
Heptane 0.262 0.282 0.242
Octane 0.262 0.282 0.242
Petrol 0.262 0.281 0.243
aliphatic hydroc. average 0.262 0.282 0.242
Aromatic hydrocarbons
Benzene 0.262 0.283 0.241
Toluene 0.262 0.282 0.242
Xylenes 0.262 0.282 0.242
aromatic hydroc. average 0.262 0.282 0.242
The multiplication of the described and defined average ratio of the dry stoichiometric off-gas volume to the net calorific value with the specific heat demand of the clinker burner process ‘q’ in MJ/kg clinker is equal to the specific dry off-gas flow in Nm3/kg clinker (see following equation in Equation 4-20). So, knowledge of the specific heat demand is sufficient to reliably estimate the specific dry off-gas flow from the combustion of fuels.

Chapter 4
State of the art of the co-incineration of waste-derived fuels and raw materials in clinker/cement plants 199
Equation 4-20: Determination of the specific dry off-gas flow in Nm3/kg clinker Legend: q = specific heat demand of the clinker burning process in [MJ/kg clinker]-see Chapter 4.3.2.1.1
b) Off-gas from calcinations The main reason that the quantity of raw meal is significantly higher than the quantity of clinker produced is the fact that a high percentage of mass is lost via the off-gas route as carbon dioxide which is formed during calcinations (see Chapter 4.3.2.1.1). The quantity of carbon dioxide released from this process can be estimated with the equation below (Equation 4-21).
Equation 4-21: Estimation of the quantity of carbon dioxide released from the calcination process Legend: CF = clinker factor w = water content of the raw meal in weight-% Vm = molar volume (22.4 l/mol) MWCO2 = molecular weight of carbon dioxide (44 g/mol)
c) Off-gas flow from combustion and carbon dioxide release Taking the aforementioned average clinker factor of 1.55 kg raw meal/kg clinker and a residual water content of 1 weight-%, results in a clinker specific off-gas flow of 0.27 Nm3/kg clinker. Consequently, the off-gas flow from combustion and carbon dioxide release can be estimated with following formula (Equation 4-22).
Equation 4-22: Estimation of the off-gas flow from combustion and carbon dioxide release Legend: q = specific heat demand of the clinker burning process in [MJ/kg clinker]-see Chapter 4.3.2.1.1
The approximation formula is developed on the basis of stoichiometry. But in the clinker process, there is a surplus of combustion air and also air leaks occur. As a consequence, the formula has to be adapted with the oxygen correction factor as follows (Equation 4-23), where O2,dry is the actual dry oxygen content of the off-gas.
Equation 4-23: Oxygen correction factor
OGspec(dry) in [Nm3(dry)/kg cli] = q x OGstoich, NCV(dry) = q x 0.25 Nm3/MJ
OGCO2, spec = (CF x (1- w) – 1) x = (CF x (1-w) – 1) x 0.509 in [Nm3/kg cli]Vm
MWCO2
OGspec(dry) in [Nm3(dry)/kg cli] = q x 0.25 Nm3/MJ + 0.27 Nm3/kg cli
21 - O2,dry
21fO2 =

Chapter 4
200 State of the art of the co-incineration of waste-derived fuels and raw materials in clinker/cement plants
So, the final approximation formula for the dry clinker specific off-gas flow reads as following (Equation 4-24):
Equation 4-24: Estimation of the dry clinker specific off-gas flow Legend: q = specific heat demand of the clinker burning process in [MJ/kg clinker]-see Chapter 4.3.2.1.1
4.4.3.3 Dust
4.4.3.3.1 Introduction
For the removal of dust, two proven techniques are applied: fabric filters and electrostatic precipitators (ESPs) or a combination of both, the so-called hybrid filters. They are sufficiently described in the Best Available Techniques Reference Document for the Production of Cement, Lime and Magnesium Oxide (EC BREF CLM, 2013, Chapter 1.4.4.3). Concerning fabric filters, the development in the past 20 years is remarkable. In the run-up to the first BREF issued in 2001, very few fabric filters were existing and there was the discussion whether they can be considered to be BAT at all although it was already pointed out that “the use of modern fabric filters can reduce dust emissions to below 5 mg/m3 (dry gas, 273 K, 10 % O2” [EC BREF CL, 2001]. Nevertheless, at that time, the BAT emission level associated with the application of fabric filters or electrostatic precipitators was concluded to be 20-30 mg dust/m3 on a daily average basis. After the first BREF, many operators invested in the substitution of ESP by fabric filters and are achieving very low residual dust quantities as shown in the following. Regarding ESPs, during special conditions, such as high CO concentration, kiln start-up, kiln shutdown or switching from compound operation (raw mill on) to direct operation (raw mill off), the efficiency of ESPs can be significantly reduced while the efficiency of fabric filters is less affected [EC BREF CLM, 2013, p 116]. Today, the design of fabric filters with multiple compartments and ‘burst bag detectors’ is common technology. Both, for ESP and fabric filters, the well-designed and carried out maintenance is key for achieving a constant low residual dust level. Lowest levels are certainly achieved with fabric filters. 4.4.3.3.2 Evaluation of the emission data from continuous dust monitoring at German
clinker production plants
4.4.3.3.2.1 Aspects about dust measurements
In principle, dust values below about 10 mg/Nm3 can only be measured with scattered light dust monitors. Depending on the type and supplier, they have a detection limit of about 0.1 mg/Nm3. In contrast, the detection limits for transmission dust monitors are significantly higher. However, the calibration of scattered light dust monitors can be a problem as they have to be calibrated with an extractive method. The detection limit of such methods is significantly above 1 mg/Nm3. Thus, in the measurement range below 3 mg/Nm3, the monitors cannot be calibrated with sufficient accuracy. Consequently, the reported very low dust concentrations of less than 1 mg /Nm3, sometimes of around 0.1 mg/Nm3 are not realistic monitoring data. So, the question arises whether the dust emissions are really very low or whether the dust monitor was not adequately calibrated. In case the concentrations are really low, the results should be reported as ‘below 3 mg/Nm3‘.
OGspec(dry) in [Nm3(dry)/kg cli] = (q x 0.25 Nm3/MJ) + 0.27 Nm3/MJ x 21 - O2,dry
21

Chapter 4
State of the art of the co-incineration of waste-derived fuels and raw materials in clinker/cement plants 201
Concerning the aforementioned extractive measurement of dust concentrations, the European Standard for dust measurement (EN 13284-1)(16) refers to the following characteristics for the measurement of dust concentrations in the range of 2.6 – 6.4 mg/Nm3:
• Detection limit: 0.3 mg/Nm3 (only filter) • Uncertainty: in the range of 1.8 - 4.0 mg/Nm3 • Repeatability: in the range of 1.7 - 2.1 mg/Nm3 • Reproducibility17: in the range of 2.6 - 5.7 mg/Nm3
This confirms that in the measurement range below 3 mg/Nm3, the monitors cannot be calibrated with sufficient accuracy. 4.4.3.3.2.2 Electrostatic precipitators versus fabric filters
The results show that, today, very low residual dust concentrations can be achieved. From the evaluation of the continuous self-monitoring data contained in Annex IV, it can be seen that annual averages below 1 mg/Nm3 are reported (see clinker production site 3, 4 and 22). Such very low values can only be achieved by means of well-designed and well operated and maintained bag filters whereas the residual dust values from electrostatic precipitators (ESP) are significantly higher. This is demonstrated in Figure 4.45 showing the 3-year dust emission curve from four clinker production sites. There, the residual dust values are normally below 20 mg/Nm3. The fluctuation is significantly higher compared to fabric filters. This can be seen from the left-hand curve in Figure 4.46 which is interpreted as the replacement of an ESP by a fabric filter at the end of 2009 by a fabric filter. After the replacement, the values are significantly lower and more stable (see the values of the year 2010).
Figure 4.45: 3-year dust emission curves from four different production sites (see clinker production
site 17, 21, 30 and 34 in Annex IV)
(16) Stationary source emissions - Determination of low range mass concentration of dust - Part 1: Manual gravimetric method (EN 13284-1:2001) 17 Defined as maximum difference of the measurements carried out by the same team; confidence interval: 95 %
0
5
10
15
20
25
30
35
40
01.01.2008 31.12.2008 31.12.2009 31.12.2010
Du
st [m
g/N
m3]
0
5
10
15
20
25
30
35
40
01.01.2008 31.12.2008 31.12.2009 31.12.2010
Du
st [m
g/N
m3]
0
5
10
15
20
25
30
35
40
45
01.01.2008 31.12.2008 31.12.2009 31.12.2010
Du
st [m
g/N
m3]
0,0
2,0
4,0
6,0
8,0
10,0
12,0
14,0
16,0
18,0
20,0
01.01.2008 31.12.2008 31.12.2009 31.12.2010
Du
st
[mg
/Nm
3]

Chapter 4
202 State of the art of the co-incineration of waste-derived fuels and raw materials in clinker/cement plants
Figure 4.46: 3-year dust emission curves from two different production sites (see clinker production site
19 and 24 in Annex IV)
On the right-hand curve of Figure 4.46, the residual dust values are also stable but on a slightly higher level compared to the aforementioned values below 1 mg/Nm3 for well-designed and well maintained fabric filters. Concerning this installation, in 2008, a problem with the dust monitor is assumed as many values are missing. The same can be observed from two more clinker production sites: from site 16, in 2008, only 57 daily mean values are reported, in 2009 118 values and in 2010 258 values; from site 34A, in 2008, only 28 values are reported, zero in 2009 and 262 in 2010 (see the evaluation of the clinker production sites number 16 and 34 in Annex IV). However, the reason for zero values in 2009 could have been a stop of production. Dust monitors should have an availability of at least 90 % throughout the year. The annual mean values of the curve in Figure 4.47 are 6.2, 6.7 and 9.2 mg/Nm3. The fluctuation of the values is relatively high indicating that dust is abated by means of an ESP but operated at an excellent performance level.
Figure 4.47: 3-year dust emission curve from a clinker production site (see clinker production site 32 in
Annex IV)
In summary, it can be concluded that, today, low residual dust vales can be achieved with ESPs and very low with fabric filters. With fabric filters, the residual dust content is more stable and the achievable values are much lower; even values around 1 mg/Nm3 are achieved. However, the accuracy of continuous dust monitoring at low dust levels has to be taken into account. Very low values can only be monitored by scattered light monitors but their calibration is difficult. Consequently, very low values around 1 mg/Nm3 should be reported as ‘below 3 mg/Nm3‘.
0
5
10
15
20
25
30
35
40
01.01.2008 31.12.2008 31.12.2009 31.12.2010
Du
st [m
g/N
m3]
0,0
1,0
2,0
3,0
4,0
5,0
6,0
7,0
01.01.2008 31.12.2008 31.12.2009 31.12.2010
Du
st [m
g/N
m3]
0
2
4
6
8
10
12
14
16
18
01.01.2008 31.12.2008 31.12.2009 31.12.2010
Du
st
[mg
/Nm
3]

Chapter 4
State of the art of the co-incineration of waste-derived fuels and raw materials in clinker/cement plants 203
4.4.3.4 Nitrogen oxides (NOx)
4.4.3.4.1 Introduction
Nitrogen oxides belong to the most relevant pollutants emitted from clinker production installations. The basic information on the formation of NOx is well described in a couple of document [Gardeik et al., 1984a and 1984b; Scheuer, 1987; Tokheim, 1999; Bodendiek, 2004; EC BREF CLM, 2013]. The same is true for prevention measures, also called primary measures [BREF CLM, 2013], such as
• Flame cooling, e.g. high water content, liquid/solid wastes • Low NOx burners • Mid kiln firing • Addition of mineralisers to improve the burnability of the raw meal (mineralised
clinker) • Staged combustion (conventional or waste fuels) also in combination with a
precalciner and the use of optimised fuel mix • Process optimisation,
as well as control or abatement measures, also called secondary measures [EC BREF CLM, 2013], such as
• SNCR technique and high efficiency SNCR technique • SCR technique.
Usually, a combination of prevention and control measures are applied. All the mentioned measures have been recently described [EC BREF CLM, 2013, chapters 1.4.5.1 and annexes 6.2.4 and 6.2.5]. Consequently, they are not repeated here. However, when evaluating the monitoring results of all 34 German cement works, basic knowledge is considered as far as it is required for a better understanding. In Germany, 33 SNCR plants are in operation [EC BREF CLM, 2013, p 126]; i.e. almost every kiln is equipped with this technology. For the moment, one SCR plant is in operation since April 2010. In the future, it is likely that this technology will be applied more frequently as Germany has introduced a stringent emission limit value for NOx of 200 mg/Nm3 the operators have to comply with from 01.01.2019 onwards at the latest [DE IED Ordinance, 2013b]. The justification for tightening the ELV from 500 to 200 mg/Nm3 is the adaptation to the technical progress [DE IED draft, 2012a]. In case, SNCR or SCR is applied, the ammonia slip shall not exceed 30 mg/Nm3 [DE IED Ordinance, 2013b].

Chapter 4
204 State of the art of the co-incineration of waste-derived fuels and raw materials in clinker/cement plants
4.4.3.4.2 Evaluation of the emission data from continuous NOx monitoring at German clinker production plants
4.4.3.4.2.1 General evaluation
NOx emission curves of the daily mean values over a longer time, here three years, provide a quick overview of the emission level and whether a process is operated in a constant and controlled way. The manifold SNCR facilities in Germany installed should be operated with an advanced process control based on continuous NOx online monitoring. In Figure 4.48, the NOx reduction process is not very well controlled as the high fluctuations indicate. The curves are not curtailed and a dedicated emission level is not maintained. The graph on the top left is for a Lepol kiln where a smooth NOx control is more difficult whereas the other three graphs are for suspension preheater systems.
Figure 4.48: 3-year NOx emission curves from four clinker production sites (see clinker production sites
1 (at the top left), 13 (at the top right), 18 (on the bottom left) and 29 (on the bottom right)
in Annex IV)
In contrast, the following six curves show well controlled NOx reduction processes (Figure 4.49). The curves are curtailed not exceeding a defined level. Only very few peaks are visible which may represent a short-term disturbance of the process or of the NOx monitor. From the curve on the bottom left, it can be seen that there was a lower setting point in the second half of 2008 and in the beginning of 2009. There is no information available to provide the reason for that.
0
100
200
300
400
500
600
700
800
01.01.2008 31.12.2008 31.12.2009 31.12.2010
NO
x[m
g/N
m3]
0
100
200
300
400
500
600
01.01.2008 31.12.2008 31.12.2009 31.12.2010
NO
x [m
g/N
m3]
0
100
200
300
400
500
600
700
800
900
NO
Xin
[mg
/Nm
3]

Chapter 4
State of the art of the co-incineration of waste-derived fuels and raw materials in clinker/cement plants 205
Figure 4.49: 3-year NOx emission curves from six clinker production sites (see clinker production sites
11 (at the top left), 15 (at the top right), 22 (in the middle left), 32 (in the middle right), 33
(on the bottom left) and 34 (on the bottom right) in Annex IV)
The following four curves from clinker production sites 7, 19, 21 and 26 serve as examples for the improvement of the control of the NOx reduction process. In 2008/2009, the fluctuations were much higher than in 2009/2010 (Figure 4.50).
0
100
200
300
400
500
600
01.01.2010 02.05.2010 31.08.2010 30.12.2010
NO
x[m
g/N
m3]
0
100
200
300
400
500
600
NO
xin
[mg
/Nm
3]
0
100
200
300
400
500
600
700
01.01.2008 31.12.2008 31.12.2009 31.12.2010
NO
x[m
g/N
m3]
0,0
50,0
100,0
150,0
200,0
250,0
300,0
350,0
400,0
01.01.2008 31.12.2008 31.12.2009 31.12.2010
NO
x[m
g/N
m3]
0
100
200
300
400
500
600
700
800
900
01.01.2008 31.12.2008 31.12.2009 31.12.2010
NO
x[m
g/N
m3]
0
100
200
300
400
500
600
01.01.2008 31.12.2008 31.12.2009 31.12.2010
NO
x[m
g/N
m3]

Chapter 4
206 State of the art of the co-incineration of waste-derived fuels and raw materials in clinker/cement plants
Figure 4.50: 3-year NOx emission curves from four clinker production sites (see clinker production sites
7 (at the top left), 19 (at the top right), 21 (on the bottom left) and 26 (on the bottom right)
in Annex IV)
Such an improvement seems to be still necessary for the installations with the curves below (Figure 4.51).
Figure 4.51: 3-year NOx emission curves from two clinker production sites (see clinker production sites
28 (on the left) and 28 (on the right) in Annex IV)
0
100
200
300
400
500
600
01.01.2008 31.12.2008 31.12.2009 31.12.2010
NO
x[m
g/N
m3]
0
100
200
300
400
500
600
700
800
900
01.01.2008 31.12.2008 31.12.2009 31.12.2010
NO
x[m
g/N
m3]
0
100
200
300
400
500
600
700
800
01.01.2009 02.07.2009 31.12.2009 01.07.2010 30.12.2010
NO
x[m
g/m
3]
0
100
200
300
400
500
600
01
.01
.20
08
01
.03
.20
08
01
.05
.20
08
01
.07
.20
08
01
.09
.20
08
01
.11
.20
08
01
.01
.20
09
01
.03
.20
09
01
.05
.20
09
01
.07
.20
09
01
.09
.20
09
01
.11
.20
09
01
.01
.20
10
01
.03
.20
10
01
.05
.20
10
01
.07
.20
10
01
.09
.20
10
01
.11
.20
10
NO
xin
[mg
/Nm
3]
0
100
200
300
400
500
600
700
800
900
01
.02
.20
08
01
.04
.20
08
01
.06
.20
08
01
.08
.20
08
01
.10
.20
08
01
.12
.20
08
01
.02
.20
09
01
.04
.20
09
01
.06
.20
09
01
.08
.20
09
01
.10
.20
09
01
.12
.20
09
01
.02
.20
10
01
.04
.20
10
01
.06
.20
10
01
.08
.20
10
01
.10
.20
10
01
.12
.20
10
NO
xin
[mg
/Nm
3]
0
100
200
300
400
500
600
700
800
01.01.2008 31.12.2008 31.12.2009 31.12.2010
NO
x[m
g/N
m3]

Chapter 4
State of the art of the co-incineration of waste-derived fuels and raw materials in clinker/cement plants 207
4.4.3.4.2.2 Evaluation of the SCR facility at the cement works of Schwenk Zement AG in Mergelstetten
a.) Background
The SCR technology for NOx abatement is applied in various sectors. In the cement sector, its application is still limited but seems to be mature enough to be applied more frequently. As it is an end-of-pipe-technique, the investment costs and operating costs are an obstacle. Nevertheless, Germany has lowered the emission limit value for cement plants to 200 mg/Nm3 the operators have to comply with from 01.01.2019 onwards at the latest [DE IED Ordinance, 2013b]. The justification for tightening the ELV from 500 to 200 mg/Nm3 is the adaptation to the technical progress [DE IED draft, 2012a]. Concerning the configuration, in principal, there are basically three options as indicated in Figure 4.52.
Figure 4.52: The basic three configurations of NOx reduction by means of SCR [Zurhove, 2010;
Zurhove, 2014]
The SCR technology can be combined with the abatement of VOC and CO emisisons (see Chapter 4.4.3.12.3.3). According to [Zurhove, 2010], the high dust configuration is favored as it has:
lowest investment cost,
lowest power consumption,
flue gas temperature suitable for SCR,
no interference with main process,
easiest option for retrofits, and
high dust protects against poisoning. However, the high amount of dust in the flue gas leaving the preheater needs a well-functioning online cleaning. In 2001, the first plant went into operation at Portland-Zememtwerke GmbH & Co.KG in Solnhofen/Germany [ERG, 2006; Schreiber/Russel, 2006; EC BREF CLM, 2013, annex 6.2.5]. The

Chapter 4
208 State of the art of the co-incineration of waste-derived fuels and raw materials in clinker/cement plants
investment in this plant was considerably subsidised. It was a high dust SCR facility. In 2006, due to economic considerations and operating problems, it was taken out of operation. It was designed to achieve NOx levels below 400 – 500 mg/Nm3; the NOx removal efficiency was in the range of 59 – 67 % [EC BREF CLM, 2013, annex 6.2.5]. There were no long-term periods where NOx emissions have been maintained at levels significantly below 500 mg/Nm3 [Schreiber/Russell, 2006]. Against the background of the experience available today, the Solnhofen experience revealed that high dust SCR was not mature enough at that time for the application in the cement industry [Zurhove/Terry, 2013]. In June 2006, the high dust SCR at Cementeria di Nonselice in Monselice/Italy went into operation. Significant operating problems had to be solved, especially the dust cleaning system (Zurhove/terry, 2013). Since then, the availability of the system increased to 100 %. The poisoning of the catalyst by thallium, as reported for semi dust SCR [Mauschitz et al., 2012], was not observed as high dust SCR keeps the poisons in their diluted state and has lower residence time due to higher cleaning frequency [Zurhove/Terry, 2013]. In April 2010, the high dust SCR at the cement works of Schwenk Zement AG in Mergelstetten/Germany went into operation. The state granted considerable subsidies. There are the following specific conditions:
- Use of waste-derived fuels up to 100 %, - Very high moisture content of the flue gas due to the co-incineration of sewage sludge, - Strong variations of raw gas NOx concentration from 500 – 2500 mg/Nm3 [Zurhove, 2014].
b.) Emission values of the Mergelstetten plant
The emission values are evaluated in more detail in Annex IV (clinker production site 3. In 2009 and 2010, the NOx emission level was kept below 400 mg/Nm3 by means of process-integrated measures and a SNCR facility. In April 2010, the SCR facility went into operation (Zurhove, 2014) followed by a significant drop of the emission level but it was not constantly lower (Figure 4.53).
Figure 4.53: Daily mean values for NOx emissions from 2008 – 2010 of the clinker production site of
Schwenk Zement in Mergelstetten/Germany (see clinker production site 3 in Annex IV)
After nine months of operation, in January/February 2011, catalyst masking was detected associated with a drastic drop in catalytic performance [Zurhove/Terry, 2013]. For this time period, no monitoring results are reported (see Figure 4.54). After this period, no stable emission level can be observed and the NOx concentration varies between 150 and 350 mg/Nm3. However, at the end of 2011, a more stable emission level of about 330 mg/Nm3 and finally below 200 mg/Nm3 was achieved (Figure 4.54).
0
100
200
300
400
500
600
700
01.01.2008 31.12.2008 31.12.2009 31.12.2010
NO
x [m
g/m
3]

Chapter 4
State of the art of the co-incineration of waste-derived fuels and raw materials in clinker/cement plants 209
Figure 4.54: Daily mean values for NOx emissions in 2011 of the clinker production site of Schwenk
Zement in Mergelstetten/Germany (see clinker production site 3 in Annex IV)
However, there were still operating problems. As a consequence, in the summer 2012, a water spray system was put into operation in the downcomer duct upstream of the SCR which limited peak values of the preheater gas outlet temperature; by just limiting the SCR inlet temperature, the catalyst masking was drastically reduced and there was an immediate and dramatic improvement in availability [Zurhove/Terry, 2013]. In 2012, the Mergelstetten plant SCR system operated with 95% availability, related to kiln operating time, while reducing the uncontrolled NOX emissions of 700 - >2000 mg/Nm3 to less than 200 mg/Nm3. Unfortunately, the emission curve for 2012 is not available to demonstrate the constantly low emission level of 200 mg/Nm3 since then. Furthermore, from 2012 onwards, the SCR has been operated with either aqueous ammonia or urea. Compared to its existing system, the ammonia consumption of the high dust SCR was approximately 33% of the SNCR, while achieving lower stack NOx values of 200 mg/Nm3 with SCR versus 350 mg/Nm3 with SNCR [Zurhove/Terry, 2013]. The ammonia slip shall be minimised. The atypical profile of ammonia emissions in 2011 was probably the result of ongoing trials. However, also at the end of 2011, the ammonia emission remains at a constantly low level of about 5 mg/Nm3 (Figure 4.55). Unfortunately, the emission values for the following years are not available. The reported ammonia slip is <5 mg/Nm3 [Zurhove, 2014].
Due to the waste gas temperature of less than 400 °C in the SCR facility, the CO emissions are not
reduced [Zurhove, 2014]. This is confirmed by the emission curves for 2008 – 2011 (see clinker
production site 3 in Annex IV). The same is true for methane but this is present in the waste gas at very
low concentration only. In contrast, organic compounds are significantly reduced to about 60 – 70 %
[Zurhove, 2014]. This can be seen from the emission curves. After the SCR facility went into operation
in April 2010, the VOC was reduced a lot (Figure 4.56).
0
50
100
150
200
250
300
350
400
01.01.2011 02.04.2011 02.07.2011 01.10.2011 31.12.2011
NO
x[m
g/N
m3]

Chapter 4
210 State of the art of the co-incineration of waste-derived fuels and raw materials in clinker/cement plants
Figure 4.55: Daily mean values for ammonia emissions in 2011 of the clinker production site of Schwenk
Zement in Mergelstetten/Germany (see clinker production site 3 in Annex IV)
Figure 4.56: Daily mean values for VOC emissions from 2008 – 2010 of the clinker production site of
Schwenk Zement in Mergelstetten/Germany (see clinker production site 3 in Annex IV)
In 2011, the VOC emission values fluctuate between 10 mg/Nm3 and very low values of between 2 and 4 mg C/Nm3 (Figure 4.57). These variations can be explained with the operation of the SCR facility although the emission level was not constant due to non-stable operating conditions. After the aforementioned improvement of the dust cleaning system, the curve should be much more constant. Unfortunately, this cannot be demonstrated as the emission curves for 2012 and subsequent years are not available. As another indicator for the increase in VOC reduction is the annual average value for VOC emissions which was reduced from 14.7 mg/Nm3 in 2009 to 4.6 mg/Nm3 in 2011 which is a removal efficiency of 68 %.
0
10
20
30
40
50
60
01.01.2011 02.04.2011 02.07.2011 01.10.2011 31.12.2011
NH
3[m
g/N
m3]
0
5
10
15
20
25
30
01.01.2008 31.12.2008 31.12.2009 31.12.2010
VO
C [
mg
C/N
m3]

Chapter 4
State of the art of the co-incineration of waste-derived fuels and raw materials in clinker/cement plants 211
Figure 4.57: Daily mean values for VOC emissions in 2011 of the clinker production site of Schwenk
Zement in Mergelstetten/Germany (see clinker production site 3 in Annex IV)
It is likely that the catalyst used for the reduction of NOx emissions also reduces organic compound concentrations. As no information is available on the SCR plant, no conclusions on this possible effect can be drawn. 4.4.3.4.2.3 Correlation between CO and NOx emissions
Some of the clinker production plants show high CO concentrations. This may be due to so-called staged combustion in secondary firing where reducing conditions are created in order to form CO which shall react with NOx to reduce it to N2 (see subsequent reaction equation).
In such cases, strong correlations behave been NOx and CO emissions have been observed (Figure 4.58).
Figure 4.58: Correlation between CO and NOx emissions (see clinker production site 29 in Annex IV)
0
2
4
6
8
10
12
14
16
01.01.2011 02.04.2011 02.07.2011 01.10.2011 31.12.2011
VO
C [
mg
C/N
m3]
2NO + 2CO N2 + 2CO2
0
100
200
300
400
500
600
0 1000 2000 3000 4000 5000
NO
x[m
g/N
m3]
CO [mgN/m3]

Chapter 4
212 State of the art of the co-incineration of waste-derived fuels and raw materials in clinker/cement plants
However, only part of the CO formed does react with NOx and thus, the considerable remaining CO level should be oxidised, also to comply with emission limit values concerned. In case that the CO level is not very high, the correlation between CO and NOx emission is less strong (Figure 4.59).
Figure 4.59: Correlation between CO and NOx emissions (see clinker production site 21 in Annex IV)
4.4.3.5 Sulphur dioxide (SO2)
4.4.3.5.1 Introduction
Concerning the content of dust and nitrogen oxides in waste gas before treatment, there is no correlation with the content of nitrogen and particulates in the raw materials. In contrast, the emission of SO2 depends more on the sulphur content of the raw materials, especially when they contain readily oxidizable sulphur compounds such as pyrite or marcasite [VDI 2094, 2003]. However, it is shown that reducing conditions in the burning process can be associated with elevated SO2 emissions both in the kiln itself and in secondary firing. Specifically, reducing conditions during secondary firing, in case of staged combustions (see Chapters 3.3.2.4 and 4.4.3.3) or insufficiently controlled combustion conditions, may cause increased SO2 emissions. The basic information on the formation and behaviour of SO2 in kiln systems is provided in Chapter 3.2.4.2.1.c. In the latest BREF for the production of cement, lime and magnesium oxide [EC BREF CLM, 2013], the end-of-pipe abatement measures (addition of SO2 absorbent, wet scrubber, activated carbon) are sufficiently described. However, with respect to prevention measures, also called primary measures, they are only mentioned without description; e.g. optimising the clinker burning process including the smoothing out of kiln operation, uniform distribution of the hot meal in the kiln riser and prevention of reducing conditions in the burning process, as well as the choice of raw materials and fuels. Therefore, in the following, information is submitted to understand these measures while adding another important measure, which is the adjustment of the sulphur to alkalis ratio. Sulphur introduced into the kiln via the main burner in the form of conventional and waste-derived fuels is completely oxidised to SO2. This SO2 leaves the kiln and enters the calcining zone of the kiln system (see Chapter 3.3.2) together with the SO2 resulting from the decomposition of CaSO4 and the low concentrations of SO2 from the usually minor decomposition of K2SO4 and Na2SO4 (see Chapter 3.2.4.2.1.c). In order to keep the decomposition of K2SO4 and Na2SO4 low, and the decomposition of CaSO4 at a moderate rate, an excessively hot burning zone should be avoided which may occur in kilns
0
100
200
300
400
500
600
700
0 200 400 600 800 1000
NO
x[m
g/N
m3]
CO [mg/Nm3]

Chapter 4
State of the art of the co-incineration of waste-derived fuels and raw materials in clinker/cement plants 213
burning fuel mixes with low combustibility [EC BREF CLM, 2013, p 68]. It is important to continuously maintain the right temperature in the kiln (smooth operation). Figure 4.60 shows a typical profile of the SO2 concentration of a cyclone suspension preheater, i.e. between the kiln inlet and the raw gas leaving the preheater for a case of significant sulphur input via the raw material. The graph shows that the SO2 concentration in the kiln inlet is high but is fully absorbed by the partly calcined meal in the second lowest cyclone.
Figure 4.60: Profile of the SO2 concentration in the gas phase of cyclone suspension preheater [Seidler, 2005, p 69]
In the third cyclone, the SO2 concentration is significantly increasing due to the oxidation of sulphides present in the raw meal which is the case in the presented example. However, after the fourth cyclone, the SO2 concentration is reduced due to the reaction of SO2 with components of the raw meal. This possibility is enhanced by addition of calcium hydroxide into the gas stream or by adding it to the raw meal (see the technique concerned described in [EC BREF CLM, 2013]). In the reactions concerned, K2SO4, Na2SO4 and CaSO4 are formed but also some sulphites which again decompose to SO2 in the temperature range of 500 – 600 °C [Seidler, 2005, p 69]. The dosage of lime can have an impact on the lime saturation factor18 (see also Chapter 3.2.2) which should be kept constant. It can also vary for the direct and compound operating modes. However, Figure 4.60 does not indicate the aforementioned case where the raw material contains readily oxidizable sulphur compounds. They are oxidised in the top cyclone and leave the preheater with the gas. This fact is underpinned by Figure 4.61 which shows the formation of SO2 in the expulsion test (see Chapter 3.3.1.2.2) depending on the temperature. The figure indicates that elemental sulphur
18 The Lime Saturation Factor (LSF) is defined as the percentage of the total CaO content, contained in the raw material, which, under technical burning and cooling conditions, can potentially be bound to SiO2, Al2O3 and Fe2O3 compounds present in the raw meal (ratio of CaO to the other three main oxides). Applied to clinker, it is calculated as: LSF=CaO/(2.8SiO2 + 1.2Al2O3 + 0.65Fe2O3)
SO2 in [mg/Nm3]
Measurement 2
Measurement 1
Raw meal

Chapter 4
214 State of the art of the co-incineration of waste-derived fuels and raw materials in clinker/cement plants
easily oxidizes at temperatures between 100 and 200°C and pyrites in the temperature range between 300 and 500 °C, iron(II) sulphate between 400 and 650°C whereas calcium sulphate is stable below 900 °C.
Figure 4.61: SO2 development of different sulphur compounds depending on temperature determined by means of the expulsion test [Waltisberg, 2016].
Figure 4.62 shows the expulsion test results of two samples, of which sample 1 contains a high concentration of pyrite In practice, pyrite or marcasite are the most relevant compounds. These compounds are not completely oxidised in the top cyclone; e.g. conversation rates between 30 and 60 % have been observed [Waltisberg, 2016]. Figure 3 shows that only pyritic sulphur is expelled in the temperature range between 350 and 450 °C (sample 1) where as raw materials not containing pyritic sulphur release very little SO2 (sample 2 in Figure 4.62).
Figure 4.62: SO2 formation from raw materials containing high and low contents of pyritic sulphur - determined by means of the expulsion test [Waltisberg, 2016]
In order to form the low volatile K2SO4 and Na2SO4, alkali has to be present in the right ratio (see Chapter 3.2.4.2.1.c); otherwise the level of the inner sulphur cycle could be too high.
100 200 300 400 500 600 700 800 900
SO
2co
ncen
trati
on
Temperature [ C]
pure S Calcium Sulfate CaSO4
Iron(II)-Sulfate FeSO4 Pyrites (FeS2)
0
100
200
300
400
500
600
700
0 100 200 300 400 500 600 700 800
Ex
pu
lsio
n [
mg
/m3]
Temperature [ C]
Sample 1
Sample 2
Sulfur [mg/kg] Sample 1 Sample 2
SO3 Total sulfur 8200 4020
SO3 Pyritic sulfur 6200 n.d.
SO3 Expulsion Test 1745 34

Chapter 4
State of the art of the co-incineration of waste-derived fuels and raw materials in clinker/cement plants 215
The temperature of the gas leaving the preheater also contributes to the incorporation of SO2. The higher the temperature, the better the reaction conditions and the higher the SO2 incorporation respectively (Figure 4.63). In order to achieve this high absorption rate, it is important to have a uniform distribution of the hot meal.
Figure 4.63: Correlation of raw gas temperature and degree of SO2 incorporation [Seidler, 2005, p 73]
Usually, a combination of prevention and control measures are applied. All the mentioned measures have been recently described [EC BREF CLM, 2013, chapters 1.4.5.1 and annexes 6.2.4 and 6.2.5]. Consequently, they are not repeated here. However, when evaluating the monitoring results of all 34 German cement works, basic knowledge is considered as far as it is required for a better understanding. 4.4.3.5.2 Evaluation of the emission data from continuous SO2 monitoring at German
clinker production plants
4.4.3.5.2.1 General evaluation
SO2 emissions are mainly associated with the sulphur content of the raw materials, especially when they contain readily oxidizable sulphur compounds such as pyrite or marcasite. This means that in case of a low sulphur content in the raw materials, the SO2 emissions will be also low. Thus, for twelve clinker production plants, the annual mean values were below 25 mg/Nm3 (see clinker production sites 2, 5,12,14,18,20,21,23,24,30,33 and 34 in Annex IV). In Germany, most of the kilns are dry kiln systems with cyclone preheaters (see Figure 3.7). In these systems, at smooth operating conditions, the SO2 incorporation is usually high. In contrast, in Lepol kilns (see Figure 3.5 and Figure 3.6), the SO2 incorporation is lower and less constant (high variations) as indicated in Figure 4.64. Another example demonstrating the higher SO2 incorporation of dry kiln systems can be seen from the shift from a semi-dry to a dry process (clinker production facility 2 in Annex IV); with respect to SO2 emissions, the completely modernised and retrofitted plant was associated with a reduction of the annual mean value from about 160 mg/Nm3 to lower than 20 mg/Nm3.
Raw gas temperature in [°C]
Kiln system 2
SO
2in
co
rpo
rati
on
in %
of
the
inp
ut
of
su
lph
ide
s
Kiln system 3 Kiln system 4

Chapter 4
216 State of the art of the co-incineration of waste-derived fuels and raw materials in clinker/cement plants
Figure 4.64: Daily mean values for SO2 emissions from 2008 to 2010 of a Lepol kiln (see clinker
production sites 2 in Annex IV)
In the cases where the SO2 emissions without abatement are lower than the emission limit value (see Table 4.37), the emission curve is not curtailed and shows the typical variations (Figure 4.65). However, the graph on the bottom right in Figure 4.65 shows that in 2010, a control measure was applied as the emission curves start to be curtailed there. Thus, the SO2 emission concentration is kept below 350 mg/Nm3 which is the emission limit value (seeTable 4.37).
Figure 4.65: 3-year SO2 emission curves from four clinker production sites (see clinker production sites
22 (at the top left), 25 (at the top right), 28 (on the bottom left) and 13 (on the bottom right)
in Annex IV)
Where the SO2 concentration is high and would exceed the emission limit values (the range of the existing emission limit values is between 50 and 400 mg/Nm3 (see Table 4.37) but most of the values are between 200 and 350 mg/Nm3), the main mitigation measure is the aforementioned addition of calcium hydroxide. With a proper control system, the emission curves are curtailed, but not as sharply as for NOx. However, the control efficiency is not as high as for NOx. It is very well for the emission curve at the top left in Figure 4.66. The other three emission curves have peaks, especially
0
100
200
300
400
500
600
01.01.2008 31.12.2008 31.12.2009 31.12.2010
SO
2[m
g/N
m3]
0
20
40
60
80
100
120
140
160
01.01.2008 31.12.2008 31.12.2009 31.12.2010
SO
2[m
g/N
m3]
0
100
200
300
400
500
600
01.01.2008 31.12.2008 31.12.2009 31.12.2010
SO
2[m
g/N
m3]
0
50
100
150
200
250
300
350
400
01.01.2008 31.12.2008 31.12.2009 31.12.2010
SO
2[m
g/N
m3]
0
50
100
150
200
250
300
350
400
450
500
01.01.2008 31.12.2008 31.12.2009 31.12.2010
SO
2[m
g/N
m3]

Chapter 4
State of the art of the co-incineration of waste-derived fuels and raw materials in clinker/cement plants 217
the emission curve at the right top. In this case, noticeably many exceedenaces were detected on Sundays and Mondays. It is assumed that on certain weekends, the calcium hydroxide was in short supply and the quantities added were insufficient. Then, on Monday, addional calcium hydroxide was ordered and compliance with the limit could again be achieved. Whether this observation is due to insufficient silo capacity or inadequate management cannot be concluded.
Figure 4.66: 3-year SO2 emission curves from four clinker production sites (see clinker production sites
9 (at the top left), 17 (at the top right), 16 (on the bottom left) and 27 (on the bottom right)
in Annex IV)
For a couple of emission curves, there are doubts about the accuracy of the continuous measurement (Figure 4.67). First, in the curves at the top left and right, many values are missing especially in 2010. The monitors should have an availability of more than 90 % (correct measurement for more than 90 % of the operating time). This requirement is not met for the curves at the top left and right. The other two curves (on the bottom left and right) show high fluctuations which are unusual and cannot be explained by fluctuations in the percentage of volatile sulphur compounds in the raw material or by shifts between the direct and compound operating modes or non-constant operating conditions in the kiln. In fact, there may be a monitoring problem. As the moisture of the waste gas is not continuously monitored, most probably there is a monitoring system with a sample gas cooler and ammonia can react with SO2 to form ammonium sulphate and thus significantly less SO2 is reaching the SO2 monitor and too low SO2 concentrations are measured.
0
100
200
300
400
500
600
700
01.01.2008 31.12.2008 31.12.2009 31.12.2010
SO
2[m
g/N
m3]

Chapter 4
218 State of the art of the co-incineration of waste-derived fuels and raw materials in clinker/cement plants
Figure 4.67: 3-year SO2 emission curves from four clinker production sites (see clinker production sites
3 (at the top left), 7 (at the top right), 21 (on the bottom left) and 32 (on the bottom right)
in Annex IV)
4.4.3.5.2.2 Correlation between CO and SO2 emissions
In preheater kilns with a carbon monoxide emission below about 1000 mg/Nm3, SO2 emissions mainly result from volatile sulphur compounds present in the raw materials, in case they are present in significant amounts. Under these conditions, the sulphur emissions from the kiln are negligible. However, in case high amounts of the carbon monoxide are present in the area of the kiln inlet, the incorporation of sulphur (sulphates present in the raw material and sulphur in the fuels) into the clinker is inhibited due to the reducing effect of carbon monoxide. As a consequence, SO2 is emitted from the kiln inlet via the waste gas path (preheater, conditioning tower, raw mill, dust filter). This observation is confirmed by the correlation between the CO and SO2 emission. Figure 4.68 shows this correlation by means of the classified daily mean values for two clinker production sites. Thus, reducing conditions have the adverse impact of both elevated carbon monoxide and SO2 emissions.
Figure 4.68: Correlation between CO and SO2 of the classified daily mean values of the clinker
production sites 10 and 29 in Annex IV for the time period 2008 - 2010
0
10
20
30
40
50
60
70
80
01.01.2008 31.12.2008 31.12.2009 31.12.2010
SO
2[m
g/N
m3]
0
5
10
15
20
25
30
35
40
01.01.2008 31.12.2008 31.12.2009 31.12.2010
SO
2 [m
g/N
m3]
0
10
20
30
40
50
60
70
80
90
100
01.01.2008 31.12.2008 31.12.2009 31.12.2010
SO
2[m
g/N
m3]
0
100
200
300
400
500
600
700
01.01.2008 31.12.2008 31.12.2009 31.12.2010S
O2
[mg
/Nm
3]
0
10
20
30
40
50
60
70
0 500 1000 1500 2000
SO
2[m
g/N
m3]
CO [mg/Nm3]
0
50
100
150
200
250
0 1000 2000 3000 4000 5000
SO
2[m
g/N
m3]
CO [mg/Nm3]

Chapter 4
State of the art of the co-incineration of waste-derived fuels and raw materials in clinker/cement plants 219
4.4.3.6 Mercury (Hg)
4.4.3.6.1 Introduction
The chapter on mercury emissions is more detailed than for other parameters because of three reasons:
The mercury emissions from cement plants is still an important issue; worldwide, they represent the fourth biggest mercury source. It can be expected that the new Minamata Convention on Mercury [UN Minamata Convention, 2013] will be a major driver for the further reduction of mercury emissions - also from cement plants. As indicated in Chapter 4.4.3.1, the following chapter on mercury emissions served as a main input to the “Guidance on best available techniques (BAT) and on best environmental practices (BEP)” according to Article 8 of the Minamata Convention [Minamata BAT/BEP Cement, 2015].
Compilation of available information on the behaviour of mercury in cement plants in a way that techniques and measures for the reduction of mercury emissions to air can be understood better,
Presentation of the different options to minimise and to reduce mercury emissions including the reflection of the recently revised Best Available Techniques (BAT) Reference Document for the Production of Cement, Lime and Magnesium Oxide [EC BREF CLM, 2013] and the conclusions drawn from it [EC CLM Conclusions, 2013].
Concerning anthropogenic mercury emissions to air, ranking after coal combustion, artisanal and small-scale gold mining and primary production of non-ferrous metals, cement plants are the fourth biggest source (Figure 4.69). Against this background, it can be expected that the emissions from cement plants will be subject of further reduction efforts.
Figure 4.69: Relative contributions to estimated emissions to air from anthropogenic sources 2010 [UNEP Hg Assessment, 2013]

Chapter 4
220 State of the art of the co-incineration of waste-derived fuels and raw materials in clinker/cement plants
4.4.3.6.2 Regulations
4.4.3.6.2.1 Minamata Convention on mercury
After a week of intensive negotiations, on 19 January 2013, the governments agreed to a global, legally-binding treaty to prevent emissions and releases of mercury. The treaty is called Minamata Convention on Mercury [UN Minamata Convention, 2013]; it is named after a city in Japan where serious health damage occurred as a result of mercury pollution in the mid-20th Century. The Convention provides controls and reductions across a range of products, processes and industries where mercury is used, released or emitted. The treaty, which has been four years in negotiation and which will be open for signature at a special meeting in Japan in October 2013, also addresses the direct mining of mercury, export and import of the metal and safe storage of waste mercury. This will lead to more stringent emission limit values for relevant industrial installations, such as cement plants, in the future. Control measures and best available techniques have already been published by UN bodies (e.g. [UNEP Hg, 2010; UN BAT heavy metals, 2012; UNECE, 2013; UNEP Hg Assessment, 2013]). 4.4.3.6.2.2 European emission limit values and emissions levels associated with BAT
In case of co-incineration of waste in cement kilns, the emission limit is 50 µg/Nm3 determined as the average value over the sampling period of a minimum of 30 minutes and a maximum of 8 hours (part 4 of ANNEX VI of the IED [EU IED 2010, p 70]). The same value is defined as BAT-associated emission level determined as average over the sampling period (spot measurement, for at least half an hour) for cement kiln where no waste is co-incinerated [EC CLM Conclusions, 2013, p 22]. 4.4.3.6.2.3 New stringent emission limit values for mercury from cement plants in the United
States
The USA has recently introduced emission limit values for mercury for cement plants which are much more stringent than in Europe (Table 4.40) [USA Cement, 2013]. They have been developed according to the concept of maximum achievable control technology (MACT) [US Cement, 2013, p 10009; Barnett, 2013].
Table 4.40: Existing and new source standards for cement kilns burning traditional fuels [USA Cement, 2013]
Pollutant Existing source
standard New source
standard
EPA expected emission reduction
Mercury 55 lb/MM tons clinker
(30 day average)
21 lb/MM tons clinker (30 day
average) 93 %
Depending on the heat consumption of the plant concerned, the conversion of the units to European units show that the emission limit values are between 17 and 22 µg/Nm3 for existing plants (existing sources). For new plants (new sources), the range is 6.5 – 8.5 µg/Nm3. These values are monthly averages. In case of co-incineration of non-hazardous waste, the values are even more stringent: for existing plants, the emission limit values are 11 µg/Nm3 for existing and 3.7 µg/Nm3 for new plants. These values are also monthly averages. 4.4.3.6.2.4 Comparison of the European and the US emission limit values
The emission limit values of the European Union and the US are not directly comparable as the averaging periods are very different. Whereas the averaging period in the EU is half an hour (minimum) to 8 hours (maximum), it is the monthly average in the US. In Germany, the permits usually contain two emission limit values for mercury: 50 µg/Nm3 as half-hourly mean value and 30 µg/Nm3 as daily

Chapter 4
State of the art of the co-incineration of waste-derived fuels and raw materials in clinker/cement plants 221
mean value. The ratio of the two values is 1.67. It is not known whether this ratio reflects the real situation. The experience shows that, at first approximation, the daily mean values are normal distributed for cement kilns (if they have a bag filter or an electrostatic precipitator which is usually the case; it may be different in case of selective catalytic reduction techniques and activated carbon filters). For technical systems like cement plants, the values are not statistically independent. The investigation of a 3-year-emission curves of daily mean values reveals that the ratio of daily mean values to monthly averages is in the range of 1.2 - 2.0. Taking the highest ratio and the aforementioned ratio for half-hourly to daily mean values of 1.67, the ratio from half-hourly mean values to monthly averages is 2.0 - 3.3. Consequently, an emission limit value of 50 µg/Nm3 with an averaging period of half an hour would correspond with a monthly average of 15 - 25 µg/Nm3. This falls into the range of the new US emission limits for existing sources where no co-incineration takes place. In case of co-incineration, the new US emission limit for existing sources (11 µg/Nm3) is more stringent but not that much as it appears from the numbers. 4.4.3.6.2.5 Minimisation principle according to section 5.2.7 TA Luft (Germany)
Section 5.2.7 of the TA Luft [DE TA Luft, 2002] concerns carcinogenic and mutagenic substances or substances toxic to reproduction. It prescribes: “Carcinogenic and mutagenic substances or substances toxic to reproduction or heavily degradable, highly accumulative and highly toxic organic compounds that are present in emissions to air shall be limited as much as possible while taking into account the principle of proportionality (emissions minimisation principle)”. The legal interpretation of this emissions minimisation principle would not allow the permission of additional mercury emissions associated with the co-incineration of waste-derived fuels or raw materials, e.g. the co-incineration of municipal sludge (which is always contaminated with mercury) cannot be permitted. However, this interpretation requires that mercury and inorganic mercury compounds are listed as carcinogenic, mutagenic or toxic to reproduction in the Regulation of the European Commission on classification, labelling and packaging of substances and mixtures [EC Regulation, 2013] or in the German Technical Rules on Hazardous Substances TRGS 905 (DE TRGS, 2008). This is not the case yet, although mercury and inorganic mercury compounds are listed as toxic to reproduction with respect to agents at work in Austria [AT Ordinance, 2011]. It can be assumed that this classification will be adopted in Germany and other countries. 4.4.3.6.3 Input and behaviour of mercury in cement plants
4.4.3.6.3.1 Percentages of the different mercury inputs
Mercury can be present in all types of input mass streams, i.e. in the natural and waste-derived raw materials as well as in the conventional and waste-derived fuels (see Figure 1.1). This means, that it enters the clinker production systems by all three principal feeding points, i.e. via the raw materials, the main burner and the secondary firing system (see Figure 4.42). Based on available sources, the mercury content of the aforementioned input mass streams are compiled in Table 4.41 which also contains the values given in Table 4.2 for natural raw materials. This compilation confirms that all inputs can contain mercury.

Chapter 4
222 State of the art of the co-incineration of waste-derived fuels and raw materials in clinker/cement plants
Table 4.41: Average values and ranges of the mercury content of natural and waste-derived raw materials as well as of conventional and waste-derived fuels according to different sources), values in [ppm] Legend: Min: minimum; Max: maximum; Av: average
The percentages of the different input mass streams as well as their mercury content depend on the individual circumstances of a clinker production unit. In Table 4.42, average values have been taken from Table 4.41 above to estimate the percentages of the Hg inputs. As the influence of the raw meal on the Hg input is significant, the average value (cases 1a – 1e) and a higher value (cases 2a – 2c) has been taken. The results show that the raw meal can dominate the mercury input but this is not a general conclusion as the percentages follow the individual circumstances. If certain waste-derived raw materials and fuels are used, their input can dominate the mercury input (see cases 1d and 1e). All cases reflect real cases. Consequently, general statements that the mercury input is mainly dominated by the raw materials (e.g. in [Oerter/Zunzer, 2011]) cannot be confirmed. There are cases where this statement applies but also others where it doesn’t.
[Oerter, 2007] [US PCA, 2006]
Min Max Av Min Max Min Max 50 Percentile Min Max Av Av
Natural raw materials
Limestone 0.005 0.1 0.04 0.02 0.017
Marl 0.005 0.1 0.03 0.052
Clay 0.01 0.5 0.2 0.002 0.45 0.02 0.15 0.09
Sand 0.01 1 0.02 < 0.005 0.55 0.03 0.029
Gypsum < 0.005 0.08
Iron ore 1 0.5 0.001 0.8 0.17 0.078
Raw meal 0.008 1 0.06 0.01 1 0.01 0.5 0.03 0.02 0.6 0.07
Waste-derived raw materials
Spent foundry sand 0.03 4.4 0.3 0.02
Gypsum/ anhydrite - also
containing gypsum from flue gas
desulfurisation
0.06 1.3 0.1 0.03 1.3
Blast furnace slag 0.01 1 0.6 < 0.005 0.2 0.012
Oil shale 0.05 0.3 0.2 0.05 0.3 0.057
Ash from burning processes;
~ bottom ash from lignite
0.003 1.4 0.3
Coal fly ash 0.04 2.4 0.3 < 0.002 0.8 0.34 0.2
Conventional fuels
Hard coal 0.01 3 0.3 0.1 13 0.4 0.1 3.3 0.42
Lignite 0.01 0.7 0.2 0.03 0.11 0.09
Heavy oil 0.006
Waste-derived fuels
Pet coke 0.01 0.09 0.05 0.01 0.71 < 0.5
Waste tyres 0.1 1 0.4 0.01 0.4 0.17
Waste oil 0.01 2 0.3 0.1 0.001 0.2
Waste wood 0.01 1 0.2 0.18 1 0.31 0.37
Fractions from municipal,
commercial and industrial
waste
< 0.01 1.4 0.3
Fractions of industrial waste 0.25
Fractions of municipal waste 0.26
Meat and bone meal 0.2
Municipal sludge*1 0.3 2.5 0.31 1.45 1 5 2.6
Liquid waste-derived fuel < 0.06 0.22
Solid waste-derived fuel < 0.07 2.77
Secondary fuel 0.04 10
*1 in Germany, in the past 25 years, the mercury content decreased, mainly due to the implementation of best available techniques in industries
(in the 1980ies, reported values were 1 - 5 mg/kg dm (average 2.6) [BUWAL, 1997] and 0.01 - 144 mg/kg dm (average 3.1) [Schönberger, 1990]
0.006
0.1 3.3
< 0.01 0.13
[FZKA, 2003] [Renzoni et al., 2010] [BREF CLM, 2013] [CH BUWAL, 1997]
< 0.005 0.4

Chapter 4
State of the art of the co-incineration of waste-derived fuels and raw materials in clinker/cement plants 223
Table 4.42: Estimations of the percentages of the Hg input of the raw meal as well as of conventional and waste-derived fuels; for the cases 1a – 1e, average values have been used; for the cases 2a – 2c also average values have been used except for the raw meal for which a higher Hg content has been taken Assumptions
- Percentage of the raw material input whereby the clinker factor is 1.6 kg raw meal/kg clinker
- Percentage of the fuel input whereby the total energy consumption is 3.2 MJ/kg clinker
Case 1a: raw meal 100%, hard coal 100% Case 1b: raw meal 100%, hard coal 96, dried municipal sludge 4 % Case 1c: raw meal 100 %, hard coal 80 %, solid waste-derived fuels 20 % Case 1d: raw meal 100%, hard coal 27 %, waste tyres 10 %, dried municipal sludge 8 %, solid waste-derived fuels 40 %, meat and bone meal 15 % Case 1e: raw meal 90 %, fly ash 10 %, hard coal 65 %, waste tyres 10 %, dried municipal sludge 5 %, solid waste-derived fuels 20 % Case 2a: like case 1a but higher Hg content in the raw meal Case 2b: like case 1c but higher Hg content in the raw meal Case 2c: like case 1e but higher Hg content in the raw meal
4.4.3.6.3.2 Mercury balances
Due to the high volatility of elemental mercury and most of mercury compounds, the mercury content in the clinker is nil or negligible [Weisweiler/Keller, 1992; Kirchartz, 1994, pp 57 and 63; Locher, 2000, p 156; Eriksen et al., 2007; Renzoni et al., 2010, pp 57, X and XIII]. As already indicated in 3.2.4.2.2, an external mercury cycle is formed. More details on the behavior of mercury in clinker production plants are submitted in the following chapter. As a consequence of the external cycle, mercury enriches between the preheater and the dust abatement facilities (electrostatic precipitator or bag filter), often just called dust filter. However, always a part of mercury is emitted with the kiln waste gas. If no filter dust is discarded, on the long run and in the end, practically all mercury input will be finally emitted with the waste gas [Weisweiler/Keller, 1992; Paone, 2008; Crowley, 2010; Linero, 2011; ecra, 2013]. This is logic from the material balance point of view: as mercury does not end up in the clinker, the only way of mercury to leave the system is its emission with the waste gas. In order to quantify the enrichment of mercury in the external cycle as well as the percentage of its emission with the waste gas, mercury balances need to be carried out. To perform such a balance in a correct way, and to quantify the considerable measurement error, instructions and indications are submitted in the following. First, it has to be stressed that a correct mercury balance requires considerable time as it should be carried out at steady-state conditions which could take nearly a month [Paone, 2008]. Therefore, a balance should be carried out for at least a week, whereby a high frequency of sampling (e.g. hourly averages) is required in order to see the variations. In practice, such a long investigation period is often not maintained. For the subsequently presented mercury balance, the described assumptions and
Hg content Hg content
Average
[mg Hg/kg]
Raw materials
Raw meal 0.03 0.048 49 0.048 44 0.048 39 0.048 28 0.043 24 0.07 0.112 70 0.112 60 0.101 43
Coal fly ash 0.3 0.048 27 0.3 0.048 20
Fuels
Hard coal 0.4 0.049 51 0.047 44 0.039 32 0.013 8 0.032 18 0.4 0.049 30 0.039 21 0.032 14
Lignite 0.1 0.1
Waste tyres 0.3 0.003 2 0.003 2 0.3 0.003 1
Dried municipal sludge 0.8 0.013 12 0.026 15 0.016 9 0.8 0.016 7
Solid waste-derived fuels 1 0.036 29 0.071 42 0.036 20 1 0.036 19 0.036 15
Meat and bone meal 0.2 0.008 5 0.2
Total 0.097 100 0.108 100 0.123 100 0 100 0.178 100 0.161 100 0.187 100 0.236 100
First column of each case is the Hg input in [mg/kg clinker] and the
percentage of the overall Hg input in the second column[mg Hg/kg]
First column of each case in Hg input in
[mg/kg clinker] and the percentage of the
overall hg input in the second column
Average Hg values and different percentages of the input materials
Average Hg values and different percentages of the input
materials, except for the raw meal for which a higher Hg
content is assumed
Case 1a Case 1b Case 1c Case 1d Case 1e Case 2 a Case 2b Case 2c

Chapter 4
224 State of the art of the co-incineration of waste-derived fuels and raw materials in clinker/cement plants
conditions could be ideal; thus, they have to be adapted to the circumstances of individual cases. The assumptions made are compiled in Table 4.43 which shows the principal input and output mercury mass streams of a clinker production plant.
Table 4.43: Principal mercury input and output mass streams of a clinker production plant with a production capacity of 3000 t/d along with their variations
For the different mass streams, following explanations and additional information are given:
Clinker production In the example, the clinker production is 125 t/h and 3000 t/d respectively. The variation is about ±1 %, equal to ±1.25 t/d. Cement works usually do not have a clinker scales. The clinker quantity is normally calculated with the clinker factor (here 1.6 kg raw meal per kg clinker). However, this inaccuracy does not have an impact on the balance as it can be assumed that no mercury is contained in the clinker.
Raw meal input In the example, the raw meal input is 200 t/h and 4800 t/d respectively. Investigations revealed that the inaccuracy is about ±1 %, equal to ±2.0 t/d. A scales for the
Assumptions:Raw meal: 200 t/h ± 1 % ==> 125 t/h ± clinker, clinker factor: 1.6 kg raw meal/kg clinker
Heat demand: 3.5 MJ/kg clinker ==> waste gas flow: 170000 m3/h ± 5 %
Dust removal
(raw mill):3.0 t/h (7 %; removal of about 1/3 in the direct operating mode)
Hg content: raw meal: 60 ± 20 µg/kg (variation: ± 30 %)
coal: 300 ± 100 µg/kg (variation: ± 30 %)
Material
mi ± Δmi ci ± Δci mi ± Δmi
[kg/h] [kg/h] [mg/kg] [mg/kg] [g/h] [g/h]
Raw meal 200000 2000 0.06 0.02 12 4
Fuel 1 Hard coal 15625 156 0.3 0.1 4.7 0.02
Fuel 2
Fuel 3
Material
mi ± Δmi ci ± Δci mi ± Δmi
[kg/h] [kg/h] [mg/kg] [mg/kg] [g/h] [g/h]
Clinker 125000 1250 0 0 0 0
Dust 1 Dust direct 3000 300 4.49 1.3 13.5 0.4
Dust 2
Vi ± ΔVi ci ± Δci mi ± Δmi
[Nm3/h] [Nm3/h] [µg/Nm3] [µg/Nm3] [g/h] [g/h]
Emission 1Hg emission with
kiln waste gas170000 8500 19 6 3.2 0.05
Emission 2
Emission 3
*1 standard conditions
Hg mass stream
Hg mass stream
I N P U T
O U T P U T 2 (kiln waste gas emission)
O U T P U T 1 (clinker and dust)Hg mass stream
Waste gas flow Hg concentration*1
Mass stream Hg content
Mass stream Hg content

Chapter 4
State of the art of the co-incineration of waste-derived fuels and raw materials in clinker/cement plants 225
determination of the raw meal input is usually available. The scales are seldom calibrated. In a cement works, the main interest is on the quantity of the final product, the cement. Cement scales are available and calibrated.
Filter dust removal For the example, the quantity of removed dust is assumed to be 3t/h and 72 t/d respectively. The variation is considerable; it is assumed to be 10 %, equal to ±0.3 t/d. A scales to measure the quantity is not available. Thus, the exact quantity is usually not known. It, if at all, could only be determined with considerable efforts. It is known from experience that the dust quantity in the gas from the preheater is 5 – 7 % related to the clinker quantity, i.e. 50 – 70 g dust/kg clinker. In case of a ratio of direct to compound operating mode of 1/3, for the aforementioned production capacity, the order of magnitude of the dust quantity is about 3.0 t/h but the variation is high.
Variation of the mercury content It is known from experience that the variation of heavy metal contents in the ppm-range is about 30 – 40 %. Representative sampling is difficult and there is also the inaccuracy of the analytical methods. Consequently, a value for the variation of ±30 % is assumed which is considered to be realistic.
Waste gas flow and mercury concentration in the waste gas The inaccuracy of a measurement consists of the inaccuracy of the flow measurement (gas velocity, temperature, pressure) and the inaccuracy of the determination of the concentration. Experiences from stack monitoring, whether continuous or discontinuous, show that for replicates at the same operating conditions (direct and compound operating mode) variations of heavy metal concentrations of ±30 % are to be expected.
Balance error For the mercury balance in Table 4.43 for a kiln with a clinker production of 3000 t/h, it is assumed that about 20 % of the mercury input is emitted with the kiln waste gas; the rest is discarded (removed) with the filter dust. Further, there is the assumption that there is no balance error, i.e. the mercury input mass stream is equal to the output mass stream which is ideal as it is known from practical experience that such a balance is very rare.
The mercury balance for a dry kiln with the aforementioned production capacity (see Table 4.43) is compiled in Table 4.44. The ratio of the mercury emission with the waste gas and the mercury input is 0.194 (3.230/16.688) which concerns the assumed emission percentage (20 %). The variation of them is as follows:
Mercury emission with the waste gas: 3.230 ± 1.033 ±32.0 %
Total mercury input: 16.688 ± 4.296 ±25.7 % Consequently, the percentage of the emission to air varies between 10.5 and 34.4 % which concerns an inaccuracy of about 50 %.

Chapter 4
226 State of the art of the co-incineration of waste-derived fuels and raw materials in clinker/cement plants
Table 4.44: Calculation of the inaccuracy of a mercury balance
Against the background of the aforementioned, it is possible to estimate the emissions of mercury with the waste gas but the inaccuracy is considerable and should always be mentioned. The inaccuracy is at least ±50 %. A mercury balance was published in the form of Sankey diagrams in 2002 [Schäfer/Hoenig, 2002], which has been referenced since then a considerable number of times [Oerter, 2007; Renzoni et al., 2010; Oerter/Zunzer, 2011; Zheng et al., 2012; Hoenig, 2013; ecra, 2013]. The diagrams are given in Figure 4.70. It is the result of a so-called outer mass balance where the untreated raw materials and fuels are the input and the clinker, the clinker dust, removed dusts (in case of a chlorine bypass and/or filter dust is removed) as well as emissions to air of the kiln, raw mill, cooler and chlorine bypass [Sprung, 1988] (see Figure 3.19 and Table 3.1). The chart on the left shows the mercury balance without and the chart on the right with filter dust removal.
Figure 4.70: Sankey diagrams of the mercury balance of a clinker production plant without and with filter dust removal, based on (Schaefer/Hoenig, 2002)
The mercury balance has been carried out by continuous mercury monitoring at the stack and by taking hundreds of solid samples [Schäfer/Hoenig, 2001]. The chart on the left indicates a balance loss of
Total quadr. error
Input 16.688 ± 4.296 18.455806
Output 16.700 ± 4.253 18.090891
Balance -0.012 ± 6.045 36.546698
Hg in the material
considered in
[g/h] mass/volume content/concentration
Raw meal 12.000 16.000000 0.0144
Fuel 1 Coal 4.688 2.441406 0.000000
Fuel 2
I N P U T 16.688 18.441406 0.014400
Clinker 0.000 0.000000 0.000000
Dust 1 Dust direct 13.470 15.210000 1.814409
Dust 2
Emission 1Hg emission with
kiln waste gas3.230 1.040400 0.026082
Emission 2
O U T P U T 16.700 16.250400 1.840491
Mass [g/h]
Quadratic error caused by
Mercury cycle without filter dust removal Mercury cycle with filter dust removal
Removed filter dust

Chapter 4
State of the art of the co-incineration of waste-derived fuels and raw materials in clinker/cement plants 227
0.108 g Hg/t clinker. As indicated above, all mercury will be emitted via the stack in the end if no filter dust is removed. However, the balance indicates that only half of the input is emitted. But as the balance loss is as big as the input with the raw materials and fuels, it can be concluded that the emission must be higher – as high as the input. This would mean that the balance indicates the measurement results but does not reflect the real situation. This conclusion cannot be drawn for the operation with filter dust removal (chart on the right). Here, the balance loss is also indicated but it is not known whether the difference contributes to the ‘emission’ or to ‘removed filter dust’. Figure 4.70 also indicates that the silo is a considerable reservoir for mercury. This will be explained in the next chapter. 4.4.3.6.3.3 Behaviour of mercury in clinker production plants
As the temperature is the most important parameter for the behaviour of mercury and its compounds in the clinker production system, the different mercury species and the reaction conditions will be explained following the temperature profile (see Figure 3-15) starting at the hot end with the main burner and the rotary kiln and ending up with the dust filter and stack emissions. Figure 4.71 also contains the temperature profile and provides a non-exhaustive overview of the possible reaction partners and the respective reaction products which will be explained (ecra, 2010). It also points out that, in principal, there are three classes of mercury species: elemental mercury (Hg°), mercurous (Hg+) and mercuric (Hg2+) forms.
Figure 4.71: Scheme illustrating the possible conversion reactions of mercury in the clinker production process [Renzoni et al., 2010; Oerter/Zunzer, 2011, ecra, 2013]
Three possible mercury input points (main burner, secondary firing/precalciner, raw meal) are important and will be discussed accordingly. Main burner and rotary kiln Thermodynamic equilibrium calculations indicate that above 700-800 °C, only elemental mercury is present in the gas phase [Martel, 2000; Schreiber et al., 2005; Krabbe, 2010]. This is important for the main burner and the rotary kiln with gas temperatures up to 2000°C (see Figure 3-15). Thus, all mercury compounds entering the system via the main burner will be transformed into elemental mercury and will leave the kiln as such. As already indicated in the previous chapter, practically no mercury is incorporated into the clinker.
Hg in fuels
Evaporation
Elementary mercuryHg0
Hg in rawmaterials
Evaporation and reaction
Continuous Hgmonitoring
Removal in the rawmill and filter
2000 °C 700 °C 120 °C

Chapter 4
228 State of the art of the co-incineration of waste-derived fuels and raw materials in clinker/cement plants
Preheater In the preheater, there are complex reaction conditions and a temperature profile of the gas phase of about 900 – 1000°C in the kiln inlet and 270 – 330°C after the preheater. In case of the existence of a chlorine bypass in a plant (see Chapter 3.3.4), a part of the elemental mercury may be extracted and will be partly adsorbed to the filter dust and partly emitted to air (see Figure 3-73). The elemental mercury from the kiln may be partly transformed to other species in the preheater. No detailed knowledge could be identified about the combination of homogeneous gas phase and heterogeneously catalysed gas-solid reactions to form the different mercury species; the same is true for reaction kinetics [Zheng, 2011, p 25; Sikkema, 2011]. However, the results of thermodynamic calculations provide an idea about the distribution of mercury species in a kiln preheater [Larsen et al., 2007] that are summarised elsewhere [Zheng, 2011; Zheng et al., 2012]. The calculations took chloride as well as sulphide and sulphate compounds into account. The alkaline dust was represented by CaO, which is in excess compared to the acidic compounds such as HCl and SO2, which are therefore both completely bound as Ca species and are thus not available for reactions with Hg species. Figure 4.72 illustrates the calculated equilibrium distribution of mercury species as a function of temperature and the defined conditions.
Figure 4.72: Equilibrium distribution of mercury species as a function of temperature in the preheater of a clinker production plant with a mercury input in the ppm-range [Zheng, 2011; Zheng et al., 2012] Input: - solid: 5.00 kmol CaO, 0.000025 kmol HgCl2, 0.000025 kmol HgSO4, 0.000025 kmol
HgS, 0.000025 kmol Hg - gas: 0.03 kmol HCl, 1 kmol H2O, 1 kmol O2, 30.00 kmol CO2, 0.05 kmol SO2, 67.95 kmol N2.
According to the results, some HgO is formed at temperatures below 800°C and HgCl2 below 300°C. This would mean that HgCl2 will not be a reaction product in the preheater. This is in contradiction to other calculations stating that HgCl2 is formed in the temperature range between 480 and 590°C [Schreiber et al., 2005]. However, Larsen et al. [Larsen et al., 2007] came to the same results when changing some assumptions for the calculations. Then, CaO and HCl are not included in the calculation, i.e. assuming that HCl is captured by the large amount of CaO in the raw material; on the other hand, SO2 is assumed available for the reaction with Hg species [Zheng et al., 2012]. This might be reasonable since the capture of SO2 is slow under preheater conditions. The different assumptions lead to completely different results compared to those in Figure 4.72, where both HCl and SO2 are bound in Ca species. The equilibrium distribution for the modified assumptions are shown in Figure 4.73.
Temperature in [ C]
Am
ou
nt
of
su
bs
tan
ce
in [
km
ol]
.
.

Chapter 4
State of the art of the co-incineration of waste-derived fuels and raw materials in clinker/cement plants 229
Figure 4.73: Equilibrium distribution of mercury species as a function of temperature in the preheater of a clinker production plant [Zheng, 2011; Zheng et al., 2012] Input:
- solid: 0.025 kmol HgCl2, 0.025 kmol HgSO4, 0.025 kmol HgS, 0.025 kmol Hg, - gas: 1 kmol H2O, 1 kmol O2, 30.00 kmol CO2, 0.05 kmol SO2, 97.95 kmol N2
The dominant mercury species at temperatures above 450°C are Hg°(g) and HgCl2(g). The HgSO4(g) decomposes at around 450°C. Concerning the formation of HgCl2, the direct chlorination of elemental mercury with free chlorine is most likely (Kanefke, 2008, p 389]. The Gibbs free energy for this reaction is negative. Very complex models consider about 250 intermediate reactions [Kanefke, 2008, p 36]. However, there are four basic equilibrium reactions to describe the chlorination of mercury (Figure 4.74).
Figure 4.74: The four basic equilibrium reactions for the chlorination of elemental mercury to form HgCl2, based on [Vosteen et al., 2002]
In addition, mercury silicates could be formed by reaction of mercury with silicate. These silicates could be incorporated into the clinker [Schreiber et al., 2005; Sikkema et al., 2011; Zheng et al., 2012]. However, this is not confirmed yet. In this respect, reference is given to the mercury content of 5.2 ppb in a clinker sample which was previously reported in a study from Slovenia [Mlakar et al., 2010] but this finding needs to be confirmed.
Temperature in [ C]
Am
ou
nto
fsu
bsta
nce
in [
km
ol]
Hg + ½ O2 HgO
HgO + 2HCl HgCl2 + H2O
Hg + 2HCl + ½ O2 HgCl2 + H2O
2HCl + ½ O2 Cl2 + H2O
Hg + Cl2 HgCl2
Hg + 2HCl + ½ O2 HgCl2 + H2O
Cl2 + SO2 + H2O SO3 + 2HCl Chlorine-Griffin-Reaction
Chlorine-Deacon-Reaction
Direct chlorination

Chapter 4
230 State of the art of the co-incineration of waste-derived fuels and raw materials in clinker/cement plants
The mercury input via the main burner is described above. The next input point is the secondary firing which could be the feeding of fuels (conventional or waste-derived fuels) to the kiln inlet or to a precalciner (see Chapter 3.3.2). At temperatures above 700 – 800°C, mercury, present in the fuel will be converted to elemental mercury which, as described above, can be transformed to other mercury species in the preheater. In clinker production plants, usually, the main mercury species are elemental mercury (Hg°), mercury dichloride (HgCl2) and mercury oxide (HgO); other mercury species are of less importance (ecra, 2013). All these three species have a high volatility. HgO decomposes at temperatures above 400°C. The physic-chemical properties of the three most important mercury species in clinker plants are compiled in Table 4.45.

Chapter 4
State of the art of the co-incineration of waste-derived fuels and raw materials in clinker/cement plants 231
Table 4.45: Characterisation and selected physico-chemical properties of elementary mercury, mercury dichloride and mercury oxide It seems that the vapour pressure values for elementary mercury and mercury dichloride presented in [CRC Handbook, 1995] and [CRC Handbook, 2012] are calculated on the basis of the values given in [Stull, 1947]
Property Hg0 HgCl2 HgO Reference
CAS Number 7439-97-6 7487-94-7 21908-53-2
Appearance volatile, heavy liquid
metal
crystals, powder,
granulate
crystals, powder HW
Colour silvery white, translucent
yellowish or reddish
HW
Water solubility [mg/l] at 20°C
insoluble 66000 [Rippen, 2009]
Partition coefficient (log POW)
4500 0.1 3230 [Hocquel, 2000]
Melting point [°C] -38.8 280/277 decomposition at T > 400 °C
HW, HB 1976
Boiling point [°C] 357 303 356 HW
Vapour pressure [Pa] depending on T
Vapour pressure [Pa] temperature [°C]
temperature [°C]
0.0467 0°C [Hill, 1922]
0.103 10°C [Hill, 1922]
0.242 20°C [Hill, 1922]
0.543 30°C [Hill, 1922]
1 42°C 64.4 HB 2012
2 50°C HB 1995
9 75°C HB 1995
10 76.6°C 94.7 HB 2012
37 100°C HB 1995
100 120°C 130.8 HB 2012
129 125°C HB 1995
133 126.2°C 136.2 [Stull, 1947]
383 150°C HB 1995
670 164.8°C [Stull, 1947]
1000 175.6°C 174.5 HB 2012
1333 184°C 180.2 [Stull, 1947]
2660 204.6°C [Stull, 1947]
5332 228.8°C 212.5 [Stull, 1947]
8000 242.2°C [Stull, 1947]
10000 250.3°C 228.5 HB 2012
13330 261.7°C [Stull, 1947]
26700 290.7°C [Stull, 1947]
53300 323°C [Stull, 1947]
100000 355.9°C 304 HB 2012
101325 357°C [Stull, 1947] Legend: HW = [Holleman-Wiberg, 1985]; HB 1976 = [CRC Handbook, 1976]; HB 1995 = [CRC Handbook, 1995]; HB 2012 = [CRC Handbook, 2012]

Chapter 4
232 State of the art of the co-incineration of waste-derived fuels and raw materials in clinker/cement plants
The vapour pressure of Hg° and HgCl2 exponentially increases with temperature. This illustrated in Figure 4.75 which shows the concerned curves with linear and logarithmic scale.
Figure 4.75: Dependence of the vapour pressure of Hg° and HgCl2 on the temperature (left chart with linear scale and right chart with logarithmic scale), values from Table 4.45
The numbers illustrate the high volatility of these mercury species. Consequently, they are volatilised in the preheater and leave it in the gas phase. These physic-chemical properties are confirmed by volatilisation tests of the raw meal which represents the third input. These tests indicate that the raw meal contains different mercury species which are volatilised between 180 and 500°C. The left chart in Figure 4.76 shows the mercury volatilisation curves of four different raw meals.
Figure 4.76: Hg volatilisation curves of 4 raw meals (left chart) and of 3 filter dusts (right chart) [AiF, 2008]
In comparison, the volatilisation curves for filter dusts are more narrow (180 – 400°C) indicating the presence of Hg°, HgCl2 and HgO being adsorbed to the surface of the dust particles (right chart of Figure 4.76. The aforementioned temperature range for the volatilisation of mercury species means that most of the mercury present in the raw meal is already volatilised in the first two upper cyclones of the preheater [AiF, 2008; Paone, 2008; Renzoni et al., 2010]. Due to kinetics, the volatilisation may not be 100 % in the preheater but close to it and will be fully completed in the kiln. This conclusion is confirmed by an investigation with radio-labelled mercury. As the performance of it is unique and the concerned results are illustrative, they are presented in more detailed in the following text box.
0
20000
40000
60000
80000
100000
120000
0 50 100 150 200 250 300 350 400
Va
pp
ou
r p
ressu
re in
[P
a]
Temperature in [°C]
Vapour pressure of Hg° and HgCl2
HgCl2
Hg°
1
10
100
1000
10000
100000
1000000
0 100 200 300 400
Vapo
ur p
ress
ure
in [P
a]
Temperature, °C
Hg° HgCl2
Temperature [ C]
Hg
conc
entr
atio
nin
*10
-1[p
pt/
C]
.
.
Temperature [ C]
Hg
co
nce
ntr
ation
in *
10
-1[p
pt/ C
]
.
.

Chapter 4
State of the art of the co-incineration of waste-derived fuels and raw materials in clinker/cement plants 233
There is one publication available showing the behaviour of mercury by means of injecting 203Hg-radio-labelled HgO19 [Eriksen et al., 2007]. Three tests were carried out with this tracer. The layout of the kiln system is shown in Figure 3.61. There, the tracer was injected to the raw meal to string 1 (before it reaches cyclone 2.1) (test 1), to the precalciner (test 2) and to the main burner (test 3) in order to investigate the distribution of mercury in the system, to determine the retention time therein, to find out the quantity of mercury present in the clinker and in the emitted waste gas, and to see the influence of the feeding points. It is important to note that string 1 has no raw mill; this means that this string is permanently operated in the direct operating mode whereas string 2 is commonly operated in the compound and direct operating mode. The tracer was continuously detected at the two stacks for string 1 and string 2; the results are given in counts per second (cps). In addition, sampling gas extracted from the waste gas was absorbed in bottles containing an acidic solution of KMnO4to determine the total quantity of the absorbed tracer; the results are given in counts per second per litre (cps/l). Further, the radioactivity of the filter dust was determined; the results are given in Becquerel per gram (Bq/g). However, the filter dust regime is not explained, i.e. it is not told how the filter dusts (from 3 electrostatic precipitators and two bag filters – see Figure 3.61) are processed, whether they are directly returned to the kiln system or fed to the silo) and how the filter dust processing varies over time. With this information, the behaviour of mercury in the whole systems could be interpreted better. Nevertheless, in the following, the results for the three described tests are briefly summarised.
a) Injection of the tracer to the raw meal, just before it reaches cyclone 2.1 (see Figure 3.61) After about one minute, there is an immediate sharp peak in the count rate of the detector at the stack of string 1 (see ‘stack of string 1 detector’ in chart 1a in Figure 4.77). However, only about 5 % of the injected tracer was immediately emitted via the stack. This means that most of the mercury was absorbed by the raw meal and filter dust and remained in the system and slowly left it with the waste (see the hyperbolic emission curve of the stack of string 1 detector in chart 1a in Figure 4.77). Consequently, the accumulative curve of the total tracer quantity absorbed in the bottles (stack of string 1, bottle detector) is mirror-inverted to the aforementioned curve of the detector at the stack of string 1. As expected, the curve of the radioactivity in the filter dust has the same trend (sharp increase and hyperbolic decrease – see chart 1b in Figure 4.77). The retention time of the meal in the preheater is just a few minutes. If at least part of the tracer would reach the precalciner, it would appear in the waste gas of the stack of string 2 after another one or two minutes. However, this is not the case. It took about 26 minutes until the tracer could be detected in the waste gas of the stack of string 2. This means that the tracer was practically completely volatilised in the preheater and largely absorbed by the filter dust. The latter reaches the silo from where it is distributed both to string 1 and string 2. On this route, the tracer reached string 2 and a part was emitted with the waste gas but, as expected, in a much lower quantity (see stack of string 2, bottle detector in chart 1a in Figure 4.77). The same is for the radioactivity of the filter dust of string 2 (see chart 1b). The curves for the filter dusts are also time-delayed (about half an hour – similar to the detectors). Consequently, the sharp increase of the tracer in the filter dust of string 1 was observed after 5 minutes whereas this was the case for string 2 after 26 minutes (like for the waste gas).
b) Injection of the tracer to the precalciner (see Figure 3.61) Again, after about 1 minute, there was also a sharp peak in the count rate of both the detectors at the stack of string 1 (see stack of string 1 detector in chart 2a in Figure 4.77) and string 2. The absolute count rate of the detector at the stack of string 1 was lower compared to the first test which is understandable as the tracer was distributed between string 1 and string 2. Again, it can be observed that most of the tracer remains within the system and is emitted according to a hyperbolic curve (see chart 2a in Figure 4.77). The accumulative curve of the total tracer quantity absorbed in the bottles (stack of string 1, bottle detector) is again mirror-inverted to the aforementioned curve of the detector at the stack of string 1. As expected, the curve of the radioactivity in the filter dust has the same trend (sharp increase and hyperbolic decrease – see chart 2b in Figure 4.77). Compared to the first test, the curves for the radioactivity of the dusts of string 1 and string 2 are not time-delayed as the tracer entered the two strings at the same time. However, due to the high waste gas
19HgO has been taken as the authors assumed that, due to the very high temperature and surplus of oxygen in the kiln, probably all mercury will be transformed to HgO. However, the available knowledge does not confirm this assumption (see the Chapter about mercury species). Nevertheless, the results are more than interesting and illustratively show the behaviour in clinker production plants. Consequently, they are presented here.

Chapter 4
234 State of the art of the co-incineration of waste-derived fuels and raw materials in clinker/cement plants
temperature and, as a consequence, the concentration of mercury in the filter dust of string 1 should be lower but this is not the case. This could be explained with the regime of filter dusts processing which is not told. It is striking that there is a significant difference between thee accumulative curve of the total tracer quantity absorbed in the bottles for string 1 and string 2 because very similar curves can be expected since the distribution of the injected tracer in string 1 and string 2 is the same. However, this is not the case (see the curves of the bottle detectors at the stacks of string 1 and string 2 in chart 2a of Figure 4.77). The explanation for the significant difference is the different waste gas temperatures. During the second test, the waste gas temperature of string 2 was on average 126°C, whereas on string 1, it was 183°C. As shown above, the temperature has a significant impact on the vapour pressure and thus on the volatilisation of the mercury. This is most probably the reason for the difference. As no mercury is incorporated into the clinker, there may be no difference in the emission on the long run (many days) but in the first hours because the absorption rate of mercury is higher at lower temperature and it takes more time to release it from the existing outer cycle (see also Chapter 3.2.4).
c) Injection of the tracer to the main burner (see Figure 3.61) As expected, the curves for the waste gas and the dusts are very similar compared to the second test (see charts 3a and 3b in Figure 4.77) and the aforementioned explanations apply. However, concerning the absolute quantities, there are differences. First, the bottle count rate on string 2 is much higher and therefore very similar to that on string 1 (see the curves of the bottle detectors at the stacks of string 1 and string 2 in chart 3a of Figure 4.77). The reason is that there was no raw meal production during the third test and thus, the temperature of the waste gas of string 2 is much higher and the absorption to the raw meal did not take place. In addition, the count rate in the bottles was higher compared to the tests 1 and 2 which may be due to “old” tracer in the system from the previous two tests. The same is true for the radioactivity of the filter dusts (see chart 3b in Figure 4.77): From these tests, following lessons can be learnt:
- A mercury cycles between the preheater and the dust filter establishes as the raw meal and filter dust absorb the mercury strongly depending on the gas temperature.
- Practically no mercury is incorporated into the clinker. - In the preheater, mercury is completely volatilised and does not reach the precalciner or the kiln
inlet. - The lower the waste gas temperature the higher is the mercury level of the established outer mercury
cycle. However, if no dust is discarded, in the end, all the mercury will be emitted by time as there is no other option (sink) to remove it.
- The reported retention times until mercury could be detected in the stacks do not provide information about the retention time of mercury in the whole system over time.
- As the three tests were carried out on three consecutive days and the retention time of mercury in the whole system is high at low waste gas temperature, some interference between the tests may have occurred. However, the described observations are also valid in case of some interference.
- As the tests were carried with HgO, the findings refer to this compound. There is no indication in the aforementioned publication whether it is converted to other mercury compounds. It decomposes at temperatures above 400 °C (see Table 4.45) and desorbs from inorganic compounds at significant higher compounds than elementary mercury and mercury dichloride but at lower temperature compared to mercury sulphate [Senior/Eddings, 2006]. So, due to the high temperature in the preheater, at first order, the findings may be valid for all mercury compounds.

Chapter 4
State of the art of the co-incineration of waste-derived fuels and raw materials in clinker/cement plants 235
1.) Injection to the raw meal of string 1 2.) Injection to the precalciner 3.) Injection to the main burner
a) Radioactivity in the waste gas (chart 1a) a) Radioactivity in the waste gas (chart 2a) a) Radioactivity in the waste gas (chart 3a)
b) Radioactivity in the filter dust(chart 1b) b) Radioactivity in the filter dust (chart 2b) b) Radioactivity in the filter dust (chart 3b)
Figure 4.77: Investigations of the behaviour of 203Hg-radio-labelled HgO in a Norwegian clinker production plant (see Figure 3.61) - radioactivity in the emitted waste gas and filter dust [Eriksen et al., 2007]
Stack of string 1, bottle detector
Stack of string 1 detector
Stack of string 2, bottle detector
Change of bottles
Corr
ecte
dcount
rate
of
the
bott
ledete
cto
r[c
ps/l]
Time of measurement
Corre
cte
dcount
rate
[cps]
Dete
cto
rat
the
sta
ck
ofstrin
g1
Stack of string 2, bottle detector
Stack of string 1 detector
Stack of string 1, bottle detector
Change of bottles
Time of measurement
Corre
cte
dcount
rate
[cps]
Dete
cto
rat
the
sta
ck
ofstrin
g1
Corr
ecte
dcount
rate
ofth
ebott
ledete
cto
r[c
ps/l]
Stack of string 2, bottle
detector
Stack of string 1 detector
Stack of string 1, bottle
detector
Change of bottles
Time of measurement
Corre
cte
dcount
rate
[cps]
Dete
cto
rat
the
sta
ck
ofstrin
g1
Corr
ecte
dcount
rate
ofth
ebott
ledete
cto
r[c
ps/l]
Filter dust, string 1
Filter dust, string 2
Filter dust, string 1
Filter dust, string 2

Chapter 4
236 State of the art of the co-incineration of waste-derived fuels and raw materials in clinker/cement plants
The part of the system between the preheater and the dust filter It has already been indicated that mercury enriches between the preheater and the dust filter due to the formation of the aforementioned external cycle. Due to the decrease in the gas temperature and the adsorption, the mercury is removed to a certain extend (mainly depending on the gas temperature) with the filter dust which is recycled to the raw meal to be fed to the preheater where the mercury is volatilised again. Thus, an external mercury cycle is formed as illustrated in Figure 4.78 where filter dust recycling as well as its removal is considered.
Figure 4.78: The external mercury cycle in a clinker production plant considering filter dust recycling and removal, based on [Sikkema et al., 2011]
The gas leaving the preheater has usually a clinker-specific dust content of 5 – 7 %, i.e. 50 – 70 g dust/kg clinker. Modern plants have more efficient upper cyclones. In these cases, the clinker-specific dust content is less than 5 %. However, directly after the preheater, most of the mercury species are still almost completely in the gas phase and not particle-bound. The heat of the waste gas is further recovered by heat exchange by passing it though the raw mill heating up the raw meal. However, for this purpose, the gas has to be conditioned before, i.e. the temperature has to be adjusted to a certain level. Therefore, usually water is injected prior to the raw mill in the so-called conditioning tower (see Figure 3.1). This cooling leads to the first major shift of the mercury species from the gas phase to the dust particles. A small amount of dust also results from the conditioning tower. In the raw mill, the heat exchange of the gas takes place and thus, the gas is further cooled down. For the temperature range 0 – 400°C, it has been shown that the vapour pressure increases exponentially. This is also true for the temperature range, the dust filters are operated (about 90 – 190°C) (Figure 4.79).
Particle-bound Hg
Gas-phase Hg
Hg input & output
Raw materials
Wa
ste
ga
s
100 – 150 C
Sorbing
Dust recycl.
Volatisation
Raw mill and
dust filter
.
.

Chapter 4
State of the art of the co-incineration of waste-derived fuels and raw materials in clinker/cement plants 237
Figure 4.79: Dependence of the vapour pressure of Hg°and HgCl2 on the temperature between 90 and 190°C (values from Table 4.45)
Looking at the curve, it appears to be logic that the minimisation of the waste gas temperature will result in a higher percentage of the particle-bound mercury which can be removed in dust filter. At optimised removal conditions, the dust particles will be removed to a very high extend. Today, the dust content after modern fabric filters is less than 5 mg/Nm3, even less than 1 mg/Nm3. Thus, at waste gas temperatures below 130°C, the mercury removal efficiency is more than 90 % [Kirchartz, 1994, p 79; Oerter, 2007; Hoenig, 2013; ecra, 2013]. If the removed filter dust is recycled to the raw meal silo, the mixing efficiency there depends on the type of silo system; batch type homogenising silo systems achieve better homogenising effects compared to continuous homogenising silo systems [CEMBUREAU BAT, 1999, pp 90-91]. From the silo, with the raw meal, the mercury is returned to the preheater where it volatilizes again and is removed again. Thus, the cycle is formed (see Figure 4.78). Consequently, the silo acts as a big buffer and reservoir and contains the major part of the overall mercury present in the whole system (see Figure 4.70). The situation described above concerns the compound operating mode (see Chapter 3.3.3). In case of the direct operating mode, the gas from the preheater also passes the conditioning tower but not the raw meal but is directly directed to the dust filter. Therefore, on the one hand, the mercury content is not diluted with the raw meal and on the other hand, the gas (the waste gas) temperature is higher as there is no heat exchange in the raw mill. The relationships concerning the outer cycle, the enrichment of mercury, the influence of the waste gas temperature, and the operating modes were published and presented in a comprehensive way for the first time in 2001 [Schäfer/Hoenig, 2001]. The figures of this publication have been republished a number of times [VDZ Activity Report, 2002; Oerter, 2007; Renzoni et al., 2010; Senior et al., 2010; Oerter/Zunzer, 2011; Hoenig, 2013; ecra, 2013]. Figure 4.80 shows one of these graphs for the operation with recycling of the removed filter dust, i.e. for one week the mercury emission curve (values were determined continuously), the related waste gas temperature and the time periods of the compound and direct operation modes.
0
200
400
600
800
1000
1200
1400
90 110 130 150 170 190
Vapo
r Pre
ssur
e, P
a
Temperature, °C
Hg° HgCl2
Temperature in [ C]
Vap
ou
rp
ress
ure
in [
Pa]
Hg HgCl2

Chapter 4
238 State of the art of the co-incineration of waste-derived fuels and raw materials in clinker/cement plants
Figure 4.80: Mercury emissions from a dry rotary kiln for clinker production without filter dust recycling for one week along with indication of the waste gas temperature after the electrostatic precipitator (clean gas temperature) and the time periods with raw mill in operation (mill on), based on [Schäfer/Hoenig, 2001], also quoted in [VDZ Activity Report, 2002; Oerter, 2007; Renzoni et al., 2010; Senior et al., 2010; Oerter/Zunzer, 2011; Hoenig, 2013; ecra, 2013]
It is clearly demonstrated that the waste gas temperature and emissions are higher at direct operating mode. This is also due to the enrichment of mercury in the outer cycle during the compound operating mode. The percentage of direct operating mode was about 26 %. Today, many plants have only about 10 %. This is often associated with higher enrichment factors. The example from 2001 clearly shows that mercury emissions are higher during the direct operating mode but the difference is less than factor two whereas much higher factors are reported from other plants: up to factor 400 [Linero, 2011]. The reasons for the different factors are:
- The dust content in the gas leaving the preheater; modern kilns have lower dust contents and thus, after precipitation at lower temperatures, the mercury concentration of the dust is higher.
- The ration of compound to direct operating mode; today, the ratio is often 90:10, whereas it was earlier 50:50, 60:40 or 70:30. At higher ratios, the mercury can enrich more in the outer cycle and thus, the factor for the mercury emissions between compound and direct operating mode increases.
- The waste gas temperature; the lower the waste gas temperature, the lower the vapour pressure and the higher the precipitation of the mercury species on the dust particles.
- The removal efficiency of the dust filter; in former times, the emitted dust concentrations were 50 – 100 mg/Nm3 (with electrostatic precipitators) but were constantly reduced. Since the application of well-designed bag filter, dust concentrations of less than 5, even less than 1 mg/Nm3 are achieved. In combination with low waste gas temperatures, this also contributes to lower mercury emissions. Due to the low dust concentrations, its influence on the mercury emissions is minor; e.g. taking a high dust concentration of 20 mg/Nm3 and a high mercury concentration in the dust of 50 mg/kg, the contribution is just 1 µg/Nm3.
- The ratio of elemental and oxidized mercury species as there are sources indicating that oxidized mercury species are easier to capture due to their physical properties [Paone, 2010, p 51]. However, this may be true for electrostatic precipitators but it is doubtful that there is a significant difference in case of bag filters.

Chapter 4
State of the art of the co-incineration of waste-derived fuels and raw materials in clinker/cement plants 239
Another important factor is the removal of filter dust by means of a valve and to which extend the filter dust is removed. Figure 4.81 shows the scheme of using a valve to remove the filter dust.
Figure 4.81: Scheme of the installation of a valve to remove filter dust
Then, the mercury emission is more constant as indicated in Figure 4.82. However, the indicated time period is relatively short (5 days) and the ratio of compound to direct operating mode surprisingly high (88:12 %) at that time (2001).
Figure 4.82: Mercury emissions from a dry rotary kiln for clinker production with filter dust recycling for five days with indication of the waste gas temperature after the electrostatic precipitator (clean gas temperature) and the time periods with raw mill in operation (mill on), based on [Schäfer/Hoenig, 2001], also quoted in [VDZ Activity Report, 2002; Oerter, 2007; Renzoni et al., 2010; Senior et al., 2010; Oerter/Zunzer, 2011; Hoenig, 2013; ecra, 2013]
Waste gas
to the stack
Output from
preheater (gas and dust)
Removal of dust(s) by
means of VALVE
Use of the dust outside the kiln
process (e.g. as additive in the
cement mill)
1: Conditioning tower
2: Homogenising silo
3: Raw mill
4. Dust filter
Dust and raw meal
Gas stream (containing dust)
.
.

Chapter 4
240 State of the art of the co-incineration of waste-derived fuels and raw materials in clinker/cement plants
But the effect of dust removal is obvious. Figure 4.83 shows the impact of the percentage of direct operating mode without dust removal and with a percentage of dust removal of 100 % on mercury emissions. The difference for the compound operating mode is very small whereas it is significant for the direct operating mode. If no dust is removed, the mercury emissions to air significantly increase, provided the removal efficiency of the dust filter is constant. Due to dust removal, the mercury emissions can be reduced by 35 – 40 %.
Figure 4.83: Impact of the percentage direct operating mode without dust removal and with a percentage of dust removal of 100 %. Legend: COM: compound operating mode; DOM: direct operating mode
However, the chart of Figure 4.83 provides an example with certain assumptions. In other cases, the reduction can be less but also higher, e.g. 78 % as reported elsewhere [Renzoni et al., 2010, p X]. The mercury concentration of the filter dust also depends on the individual circumstances. If the mercury removal efficiency of the dust filter is more than 90 %, the waste gas temperature around 100°C, the ratio of compound to direct operating mode about 90:10, and the mercury input level not on a low level, the mercury concentration in the filter dust of up to 40 mg/kg can be reached (Renzoni et al., 2010, p XI). 4.4.3.6.3.4 Emitted mercury species
The transport and deposition of atmospheric mercury depend greatly on whether the mercury is elemental or oxidised [UNEP Hg Assessment, 2013, p 19]. Elementary mercury stays in the atmosphere long enough for it to be transported around the world the currently believed lifetime in the atmosphere is between 0.5 and 1.5 years), whereas oxidised and particulate mercury have much shorter lifetimes (hours to days) and are therefore subject to fast removal by wet or dry deposition (UNEP Hg, 2008, p 65). Consequently, the gaseous elemental mercury is a global pollutant whereas oxidised mercury compounds and those associated with particles are deposited locally or regionally [UNEP Hg, 2008. P 65]. Against this background, it is of importance to know which species are emitted from cement plants. In Figure 4.84 concerned data are compiled from different sources. There are plants where elemental mercury dominates and others where this is the case for oxidised mercury. It depends on the individual conditions, whether the percentage elemental mercury is high compared to the input of oxidised mercury with the raw meal, on the internal and external cycles and the reaction conditions etc.. This means, that no rule can be established.
Percentage of direct operating mode [%]
Hg
em
iss
ion
toa
ir[µ
g/N
m3]
COM, dust rem.: 0 %
DOM, dust rem.: 0 %
COM, dust rem.: 100 %
DOM, dust rem.: 100 %

Chapter 4
State of the art of the co-incineration of waste-derived fuels and raw materials in clinker/cement plants 241
Figure 4.84: Emissions to air of elemental and oxidised mercury according to different sources Indications for the sources of data: Plant 1 and plant 2: [Oerter/Zunzer, 2011] Plant 3: [VDZ Activity Report, 2005] Plant 4: [Mlakar et al., 2010] Plant 5 and plant 6: [Linero, 2011]
4.4.3.6.4 Evaluation of the emission data from continuous mercury monitoring at German
clinker production plants
As indicated above, emission data from all 34 German clinker production sites have been published. For mercury, emission data from 30 production sites have been reported. In the following, they will be evaluated in a comprehensive way. More details are presented in the evaluation of emission data for each site (see Annex IV). The emission data were derived from continuous mercury emission monitoring and represent daily mean values. In a number of cases, there are doubts that the measured and reported values do not represent the real emission situation. This will be discussed first, followed by the discussion of additional 3-year emission curves. Finally, the correlation between mercury emission and waste gas temperature will be illustrated and discussed. For some clinker production sites, the mercury emission concentration was reported in [mg/Nm3] to two decimal places. An example is given in Table 4.46. In summary: For mercury emissions to air, the unit “[mg/Nm3]” is inadequate.
0
20
40
60
80
100
120
140
Dir
ect
tota
l
Dir
ect
Co
mp
ou
nd
to
tal
Co
mp
ou
nd
Dir
ect
tota
l
Dir
ect
Co
mp
ou
nd
to
tal
Co
mp
ou
nd
Dir
ect
tota
l
Dir
ect
Co
mp
ou
nd
to
tal
Co
mp
ou
nd
Dir
ect
Co
mp
ou
nd
Dir
ect
Co
mp
ou
nd
Dir
ect
Co
mp
ou
nd
Hg2+
Hg°
Hg total
Plant 1 Plant 2 Plant 3 Plant 4 Plant 5 Plant 6
Hg
em
iss
ion
co
nc
en
tra
tio
nin
[µ
g/N
m3]

Chapter 4
242 State of the art of the co-incineration of waste-derived fuels and raw materials in clinker/cement plants
Table 4.46: Inadequate reporting of mercury emission data in [mg/Nm3] – an example
Date Daily mean value
[mg/Nm3]
03.10.2009 0.01
04.10.2009 0.01
05.10.2009 0.03
06.10.2009 0.01
07.10.2009 0.02
08.10.2009 0.02
09.10.2009 0.02
10.10.2009 0.01
11.10.2009 0.01
12.10.2009 0.03
13.10.2009 0.03
14.10.2009 0.02
15.10.2009 0.03
16.10.2009 0.03
Some years ago, there was the idea to present the measurement results in the same units and to the same number of decimal places as the emission limit values are defined in the regulation concerned, such as
the Waste Incineration Directive (now part of the Industrial Emissions Directive); there, the emission limit value for mercury is 0.05 mg/Nm3 (daily mean value – for the co-incineration of waste in cement plants), or
the 17th Ordinance of the German Federal Clean Air Act; there, the emission limit value for mercury is 0.03 mg/Nm3 (daily mean value).
Especially with regards to mercury, this format is inadequate as, according to this approach, the emission values are reported as 0.00, 0.01, 0.02, 0.03 mg/Nm3 etc. This is not sufficiently precise. Consequently, mercury emissions should be reported with the unit [µg/Nm3] and one decimal. 4.4.3.6.4.1 Emission curves from mercury monitors which may not work properly
It is known that there might occur problems with continuous mercury monitors [AiF, 2007]. For instance, certain compounds can have an impact on the converter which reduces oxidized mercury species to elemental mercury. Then, the converter does not or insufficiently works and thus, the determined mercury concentration is too low. Further, there may be interferences; e.g. in the range of the UV absorbance range of mercury, other compounds, such as SO2 or certain hydrocarbons, may also absorb resulting in higher than the real mercury emission concentration. The available data do not allow to draw definitive conclusions but, against the background of available experience, the examples shown in the Figure 4.85 and Figure 4.86 clearly indicate that there might be problems. Figure 4.85 shows the emission curve of site 26 for 2008 and 2009. In 2008, the measured values appear to be realistic but not in 2009 as the values remain on a constant low level for some time. For 2010, there are no data available at all. It seems that the operation of the monitor had been stopped.

Chapter 4
State of the art of the co-incineration of waste-derived fuels and raw materials in clinker/cement plants 243
Figure 4.85: Example for problems with a mercury monitor in 2009 (see clinker production site 26 in Annex IV)
In Figure 4.86, the values of the 3-year emission curve are constantly declining. Such a drift is difficult to explain by means of declining mercury in put or filter dust removal.
Figure 4.86: 3-year mercury emission curve with constantly declining values (see clinker production site 3 in Annex IV)
Moreover, a decreasing efficiency of the converter can be assumed resulting in the drift towards lower values.
0
5
10
15
20
25
30
35
40
45
50
01.01.2008 31.12.2008 31.12.2009
Hg
[u
g/N
m3]
0
5
10
15
20
25
30
35
40
01.01.2008 31.12.2008 31.12.2009 31.12.2010
Hg
[u
g/N
m3]

Chapter 4
244 State of the art of the co-incineration of waste-derived fuels and raw materials in clinker/cement plants
The emission curve in Figure… shows extreme peaks which are up to an order of magnitude higher than the ‘normal’ emission levels (10 – 20 µg/Nm3). A daily mean value of 339 µg/Nm3 (see Figure 4.87) cannot be explained by the process and variations of the input. Here, it can be concluded that a problem with the monitor occurred. This can also be concluded for the other peaks.
Figure 4.87: Mercury emission curve for the first six months of 2008 (see clinker production site 16 in Annex IV)
4.4.3.6.4.2 Discussion of additional emission curves
a) Clinker production plants with relatively constant Hg emissions The following two 3-year emission curves illustrate a relatively stable mercury emission profile (Figure 4.88 and Figure 4.89). There is no drift visible. However, from time to time, there are data gaps. It is not known whether these gaps occurred due to problems with the mercury monitor or due to other reasons. The fluctuations observed are within a comparatively small range and reflect a normal situation. So, it can be concluded that the mercury input with raw materials and fuels is comparatively stable. The same is true for the operating conditions of the kilns concerned.
0
50
100
150
200
250
300
350
400
01.04.2008 01.05.2008 31.05.2008 30.06.2008
Hg
[u
g/N
m3]

Chapter 4
State of the art of the co-incineration of waste-derived fuels and raw materials in clinker/cement plants 245
Figure 4.88: 3-year emission curve with comparatively stable values (see clinker production site 22 in Annex IV)
Figure 4.89: 3-year emission curve with comparatively stable values (see clinker production site 15 in Annex IV)
0
5
10
15
20
25
30
35
40
01.01.2008 31.12.2008 31.12.2009 31.12.2010
Hg
[u
g/N
m3]
0
5
10
15
20
25
30
01
.01
.20
08
01
.03
.20
08
01
.05
.20
08
01
.07
.20
08
01
.09
.20
08
01
.11
.20
08
01
.01
.20
09
01
.03
.20
09
01
.05
.20
09
01
.07
.20
09
01
.09
.20
09
01
.11
.20
09
01
.01
.20
10
01
.03
.20
10
01
.05
.20
10
01
.07
.20
10
01
.09
.20
10
01
.11
.20
10
Hg
in [
µg
/Nm
3]

Chapter 4
246 State of the art of the co-incineration of waste-derived fuels and raw materials in clinker/cement plants
a.) Clinker production plants with varying Hg emissions In contrast to the two aforementioned mercury emission curves, the two following emission curves show a strongly changing profile (Figure 4.90 and Figure 4.91). From the data as such, it is not possible to conclude on a clear source. Possible reasons will be discussed. In the following curve, there are high mercury emissions in the first 7 weeks with values between 40 and 70 µg/Nm3 (Figure 4.90). Then, except of some peaks, the emission level went down to values between 10 and 30 µg/Nm3, at the end of 2010 even below 10 µg/Nm3. In this case, either the mercury input had been significantly reduced, or more mercury had been discarded with the filter dust. It could also be possible that the mercury monitor had a drift towards lower values (see the explanations above).
Figure 4.90: 3-year emission curve showing a decreasing emission level (see clinker production site 18 in Annex IV)
Figure 4.91 shows a curve where the values were on a low level in the beginning. Then, the values increased with a subsequent phase with decreasing values. In this case, either the mercury input increased or the less filter dust was discarded. However, again, a problem with the mercury monitor could have been the reason. As the emission level is low, a zero drift of the monitor would have significant impact on the measured values. Additional information is required to draw a conclusion.
0
10
20
30
40
50
60
70
80
90
100
01
.01
.20
08
01
.03
.20
08
01
.05
.20
08
01
.07
.20
08
01
.09
.20
08
01
.11
.20
08
01
.01
.20
09
01
.03
.20
09
01
.05
.20
09
01
.07
.20
09
01
.09
.20
09
01
.11
.20
09
01
.01
.20
10
01
.03
.20
10
01
.05
.20
10
01
.07
.20
10
01
.09
.20
10
01
.11
.20
10
Hg
in [
µg
/Nm
3 ]

Chapter 4
State of the art of the co-incineration of waste-derived fuels and raw materials in clinker/cement plants 247
Figure 4.91: 3-year emission curve with varying emission levels (see clinker production site 2 in Annex IV)
b.) Special case Figure 4.92 shows the 6-year emission curve for a specific plant where, due to wet raw material, the waste gas does not pass a raw mill but a dryer. Consequently, there is only one operating mode and not two as it is the case for the conventional dry process. Thus, the mercury cannot be adsorbed to the raw meal. Secondly, the waste gas temperatures are very high which prevents high adsorption rates of mercury to dust present in the waste gas. As a consequence, there may be practically no cycle (or to a very low extent) between the preheater and the dust filter and the mercury is emitted with the waste gas as it enters the kiln system. This means that the output directly depends on the input. In this case, the discarding of dust from the system will be not an efficient approach to remove mercury, i.e. practically all the mercury in the input will be emitted with the waste gas. From 2008 – 2010, the fluctuations are within a normal range and could be the result of the variation of a couple of parameters, such as the raw meal input, the grain size, the waste gas temperature etc.. From 2011 – 2012, the emission level is significantly lower with many values close to zero. This was due to problems with the mercury monitor which had been exchanged in the end. Consequently, from 2013 onwards, after a period with no measurement values, the new monitor provides a more plausible emission curve.
0
5
10
15
20
25
30
35
40
45
50
01.04.2009 07.09.2009 14.02.2010 24.07.2010 31.12.2010
Hg
[u
g/m
3]
Hg
in [µ
g/N
m3]

Chapter 4
248 State of the art of the co-incineration of waste-derived fuels and raw materials in clinker/cement plants
Figure 4.92: 6-year mercury emission curve for the time period 01.01.2008 – 31.03.2014 (see clinker production site 33 in Annex IV)
4.4.3.6.4.3 Correlation between mercury emission and waste gas temperature
As already described above, the vapor pressure of elemental mercury and its oxidized species exponentially increases with the temperature. Consequently, it is expected that the mercury emission with the waste gas directly correlates with the waste gas temperature. This is confirmed with real measured data. Figure 4.93 shows four examples from four different plants. For this purpose, the data available for three years have been aggregated to classified mean values. The slope of the curves is very similar. However, other examples have a different slope. An analysis and comparison of all available correlations (contained in the evaluations in Annex IV) is not submitted as there is no proof that the measured mercury concentration is really or fully reflecting the real emission situation. In addition, it would be required to know the practice of filter dust removal which is not the case. The example left above indicates that, in many cases, mercury emissions are higher during the direct operating mode as then the waste gas does not pass the raw mill and thus the waste gas temperature is usually higher which results in higher mercury emissions.
0
5
10
15
20
25
30
35
40
45H
g in
[µ
g/N
m3 ]
new Hg monitor
Hg emission from 01.01.2008 - 31.03.2014

Chapter 4
State of the art of the co-incineration of waste-derived fuels and raw materials in clinker/cement plants 249
Figure 4.93: Four examples for the correlation between mercury emission and waste gas temperature (see clinker production sites 12, 26, 28 and 31 in Annex IV)
Figure 4.94 provides an example where there is no correlation between mercury emission and waste gas temperature. It is possible (but not confirmed for the given case) that during the direct operation mode (almost) all the filter dust is discarded (removed) which is associated with significantly reduced Hg emissions. In this case, they are almost constant and their dependency on the waste gas temperature is no longer significant. Consequently, Figure 4.94 could be an example for this case.
Figure 4.94: Example for a missing correlation between mercury emission and waste gas temperature (see clinker production site 9 in Annex IV)
In the aforementioned special waste where the waste gas is not passing the raw mill and the waste gas temperature is on a high level, it is expected that the mercury input will be completely emitted with the waste gas. In addition, there is practically now outer cycle between the preheater and the filter. As a consequence, there is no correlation between mercury emission and waste gas temperature (Figure 4.95).
0
2
4
6
8
10
12
60 80 100 120 140Temperature [°C]
Hg
[u
g/N
m3]
Compound
Direct
0
2
4
6
8
10
12
14
16
18
100 110 120 130 140 150 160
Hg
em
issi
on
co
nce
ntr
atio
n [
ug
/Nm
3]
Waste gas temperature [ C]
0
2
4
6
8
10
12
14
120 130 140 150 160
Hg
em
issi
on
co
nce
ntr
atio
n [
ug
/Nm
3]
Waste gas temperature [ C]
0
2
4
6
8
10
12
14
100 120 140 160 180 200 220
Hg
em
iss
ion
co
nc
en
tra
tio
n [
ug
/Nm
3 ]
Waste gas temperature [ C]

Chapter 4
250 State of the art of the co-incineration of waste-derived fuels and raw materials in clinker/cement plants
Figure 4.95: Hg emission versus waste gas temperature in a clinker production plant where the waste gas is not passing the raw mill (all values from 2008 – 2010- see clinker production site 33 in Annex IV)
4.4.3.6.5 Best available techniques (BAT) to minimise mercury emissions
4.4.3.6.5.1 Introduction
With respect to the minimization of emissions, the term ‘best available techniques (BAT)’ was introduced with the Integrated Pollution Prevention and Control Directive [EU IPPCD, 1996/2008] which was later integrated into the Industrial Emissions Directive (IED) [EU IED, 2010]. This definition was slightly modified by the Stockholm Convention on Persistent Organic Pollutants [UN Stockholm Convention, 2001] as well as by the Minamata Convention on Mercury [UN Minamata Convention, 2013]. In Table 4.47, the aforementioned definitions are compiled and compared.
0
5
10
15
20
25
30
35
40
45
140 150 160 170 180 190 200
Hg
em
issi
on
co
nce
ntr
atio
n [
µg/
Nm
3]
Waste gas temperature [°C]

Chapter 4
State of the art of the co-incineration of waste-derived fuels and raw materials in clinker/cement plants 251
Table 4.47: Compilation of the definition of ‘best available techniques according to the IED, Stockholm Convention and Minamata Convention
Defined term IPPC Directive (1996) / Industrial Emissions Directive (2010)
Stockholm Convention on Persistent Organic Chemicals (2001)
Minamata Convention on Mercury (2013)
Best available Techniques ‘Best available techniques’ means the most effective and advanced stage in the development of activities and their methods of operation which indicates the practical suitability of particular techniques for providing the basis for emission limit values and other permit conditions designed to prevent and, where that is not practicable, to reduce emissions and the impact on the environment as a whole.
‘Best available techniques’ means the most effective and advanced stage in the development of activities and their methods of operation which indicate the practical suitability of particular techniques for providing in principle the basis for release limitations designed to prevent and, where that is not practicable, generally to reduce releases of chemicals listed in Part I of Annex C and their impact on the environment as a whole.
‘Best available techniques’ means those techniques that are the most effective to prevent and, where that is not practicable, to reduce emissions and releases of mercury to air, water and land and the impact of such emissions and releases on the environment as a whole, taking into account economic and technical considerations for a given Party or a given facility within the territory of that Party.
Techniques ‘Techniques’ includes both the technology used and the way in which the installation is designed, built, maintained, operated and decommissioned.
‘Techniques’ includes both the technology used and the way in which the installation is designed, built, maintained, operated and decommissioned.
‘Techniques’ means technologies used, operational practices and the ways in which installations are designed, built, maintained, operated and decommissioned.
Available ‘Available’ techniques means those developed on a scale which allows implementation in the relevant industrial sector, under economically and technically viable conditions, taking into consideration the costs and advantages, whether or not the techniques are used or produced inside the Member State in question, as long as they are reasonably accessible to the operator.
‘Available’ techniques means those techniques that are accessible to the operator and that are developed on a scale that allows implementation in the relevant industrial sector, under economically and technically viable conditions, taking into consideration the costs and advantages.
‘Available’ techniques means, in respect of a given Party and a given facility within the territory of that Party, those techniques developed on a scale that allows implementation in a relevant industrial sector under economically and technically viable conditions, taking into consideration the costs and benefits, whether or not those techniques are used or developed within the territory of that Party, provided that they are accessible to the operator of the facility as determined by that Party.
Best ‘Best’ means most effective in achieving a high general level of protection of the environment as a whole.
‘Best’ means most effective in achieving a high general level of protection of the environment as a whole.
‘Best’ means most effective in achieving a high general level of protection of the environment as a whole.

Chapter 4
252 State of the art of the co-incineration of waste-derived fuels and raw materials in clinker/cement plants
Against this background, the best available techniques for cement plants as defined by the European Commission within the so-called Sevilla Process (Schönberger, 2009) are reflected. In addition, the BAT according to the UN conventions are mentioned. It is not possible to describe the different techniques here. However, the lignite coke moving bed adsorber for cement plants has been evaluated in detail and the publication concerned is given in ANNEX V. 4.4.3.6.5.2 Reflecting BAT as defined by the Sevilla Process
Within the aforementioned Sevilla Process, the BAT are elaborated for the different industrial sectors and published in form of the Best available techniques REFerence documents (BREFs). For the cement and lime industry, the first BREF was issued in 2001 [EC BREF CL, 2001]. In 2013, the revised version [EC BREF CLM, 2013] as well as the BAT Conclusions [EC CLM Conclusions, 2013] were issued. According to the latest BREF, the most relevant measure is the input control of mercury, i.e. the selection of input materials with a low content of relevant metals, especially of mercury [EC BREF CLM, 2013, pp 81 and 111; EC CLM Conclusions, 2013, p 21]. Other important options are not or only marginally mentioned, such as that the “mercury removal increases with decreasing exhaust gas temperature“ [EC BREF CLM, 2013, p 81] However, the document does not contain a technique clearly describing the minimisation of the waste gas (equivalent to the term ‘exhaust gas’) temperature. In addition, in chapter 1.4.7 (Reduction of metal emissions), only one sentence indicates that lowering the waste gas temperature is “one way to minimise mercury emissions” [EC BREF CLM, 2013, p 155]. But lowering the waste gas temperature is only an efficient measure if the filter dust is systematically discarded which is also called filter dust removal or filter dust shuttling. So, a precise and more detailed technical description is missing. Consequently, the BAT conclusions do not indicate such a technique. Only in the footnote of the table presenting the BAT-associated emissions level for mercury (50 µg/Nm3), it is pointed out that “values close to 50 µg/Nm3 require consideration of additional techniques (e.g. lowering of the flue-gas temperature, activated carbon” [EC BREF CLM, 2013, p 353; EC CLM Conclusions, 2013, p 22]). This means that the minimisation of the waste gas temperature has not been considered in general. This in line with the fact that the lowering of the waste gas temperature is not explicitly mentioned in the chapter “Techniques to consider in the determination of BAT” [Chapter 1.4 of the EC BREF CLM, 2013]. Consequently, with respect to mercury emissions, the EC BREF CLM and the BAT Conclusions concerned need to be more technical, precise, clear and detailed. Further, the BREF presents 306 spot measurements for mercury in the “EU-27 and EU-23+ countries” [EC BREF CLM, 2013, p 82]. About 94 % of the values are lower or equal to 50 µg/Nm3. The achievable emission level associated with the application of BAT (BAT-AEL) was defined as “<50 µg/Nm3” as spot measurement (average over the sampling period which is at least half an hour) [EC BREF CLM, 2013, p 368; EC CLM Conclusions, 2013, p 22] which is not in line with the basic approach to define BAT as these should represent the 10 – 20 % best performing plants of a sector concerned [Schönberger, 2009]. But here, BAT represent the cut-off criterion of the 6 % worst performing plants. It seems that just the emission limit value of the Waste Incineration Directive (WID) [EU WID, 2000] has been taken which is 50 µg/Nm3: In the meantime, the WID has been incorporated into the IED. There, in ANNEX VI, Part 4, number 2 (special provisions for cement plants co-incinerating waste), the emission limit value for mercury is given as 50 µg/Nm3 (average values over the sampling period of a minimum of 30 minutes and a maximum of 8 hours; such averaging times are in case of spot measurements) [EU IED, 2013, p 70]. Consequently, as indicated above, the concluded BAT-AEL is “<50 mg/Nm3”. But this value does not really reflect BAT. The value concerned of the 20 % best performing plants is <5 µg/Nm3 which is one order of magnitude lower than the BAT-AEL of the BREF. Thus, the BAT-AEL should be significantly lower. 4.4.3.6.5.3 Reflecting techniques, including BAT, as defined by the UN and the US
As indicated above, the US has recently introduced more stringent emission limit values for mercury. With regard to the implementation of the Stockholm Convention, the Basel Convention and the new Minamata Convention, the UN has issued several reports telling techniques to minimize and to control

Chapter 4
State of the art of the co-incineration of waste-derived fuels and raw materials in clinker/cement plants 253
mercury emissions from cement plants. The different measures and techniques mentioned in the UN and US documents are compiled in Table Table 4.48. The comments in the table provide additional information to enhance the understanding of the mentioned measures and techniques.

Chapter 4
254 State of the art of the co-incineration of waste-derived fuels and raw materials in clinker/cement plants
Table 4.48: Compilation of the different measures and techniques mentioned in available UN and US documents
Measure/Technique Description Achievable reduction percentage or emission concentration
Reference Comment
Careful selection of input materials
Selection and control of input materials (natural and waste-derived raw materials as well as conventional and waste-derived fuels) with a low content of relevant metals and limiting the content of relevant metals, especially mercury.
no values given [UNECE, 2013] [UNEP Basel Convention, 2012]
This is based on the BAT as defined by the European Commission [EC BREF CLM, 2013; CLM Conclusions, 2013]; for instance, high carbon fly ash from power plants should not be used due to high mercury content [Linero/Read, 2008]
Using a quality assurance system
The quality assurance system shall guarantee the characteristics of the waste materials (waste-derived raw materials and fuels) used
no values given [UNECE, 2013] [UNEP Basel Convention, 2012]
This is based on the BAT as defined by the European Commission [EC BREF CLM, 2013; CLM Conclusions, 2013]
Dust shuttling/filter dust removal
During direct operating mode, the filter dust from the bag filter or ESP is removed, often added to the clinker to produce cement.
no general value given, the reduction can be significant
[Barnett, 2013] The US-EPA stated that in one case, the mercury emissions during direct operating mode could be reduced from about 400 to about 20 µg/Nm3 (Barnett, 2013), another source reports for the same a reduction from about 400 to about 40 µg/Nm3 [Linero, 2011].
Minimisation of waste gas (= exhaust gas) temperature
The volatility of mercury species exponentially increases in temperature. Consequently, the waste gas temperature plays an important role.
no values given [UNECE, 2013] Already in 1994, it was reported that the mercury removal efficiency is more than 90 % at waste gas temperatures below 130°C [Kirchartz, 1994]. But to lower the waste gas temperature is only efficient if it is combined with efficient dust shuttling.
Activated carbon injection (ACI)
Injection of activated carbon upstream or downstream of the dust control device (bag filter or ESP).
>90 % or even >95 %, about 95%
[Barnett, 2013]
[Barnett, 2013] and [US Cement, 2010, p 55001] state that ACI includes a second filter downstream the dust control device. The US standards for mercury (and other pollutants) rely on control strategies involving injection and removal of added particulates, such as activated carbon [US Cement, 2012, p 42386]

Chapter 4
State of the art of the co-incineration of waste-derived fuels and raw materials in clinker/cement plants 255
>95%, 1-3 µg/Nm3
[UNEP/AMAP, 2013, p 175] [UNECE, 2013, p 27]
This for a plant in Japan equipped with wet flue gas desulphurization, ACI, fabric filter (= bag filter), scrubber, and SNCR. [UNEP, 2007, p 38] emphasises that ACI is not effective if the filter dust is recycled to the kiln as the collected mercury will once again be released in the kiln. It is not told whether ACI is upstream or downstream of the dust control device
Moving bed adsorber Mercury and other pollutants are adsorbed to lignite coke (or activated carbon) in a moving bed adsorber.
>90% <5 µg/Nm3
[UNEP, 2007, p 37] [Schönberger, 2011]
There is only one plant existing so far at the Holcim plant in Siggenthal in Switzerland. Fixed bed solutions have been recently proposed [Knotts et al., 2012]
Legend: ESP = electrostatic precipitator; SNCR = Selective Non-catalytic Reduction

Chapter 4
256 State of the art of the co-incineration of waste-derived fuels and raw materials in clinker/cement plants
4.4.3.6.5.4 Discussion on BAT
In the following, the different techniques and measures are briefly discussed. Additional information is presented as long as it is not contained in the two chapters above (Chapters 4.4.3.6.3 and 4.4.3.6.4). The careful selection of input materials is certainly a very important option as any kilogram or gram of mercury that is not entering the system has not to be tackled. The same is true for a quality assurance system with respect to waste-derived raw materials and fuels as this instrument improves the management of the mercury input. The dust shuttling (other terms: filter dust removal, discarding the filter dust or dust bleeding) is not sufficiently described in the BREF as well as in the UN papers. It is important to note that this measure is based on the fact of the external mercury cycle (see Figure 4.78 and the text concerned above). Dust shuttling is considered as a proven method which is systematically applied in many cement plants to specifically separate mercury from the external cycle [Hoenig, 2013]. The enrichment of mercury between the preheater and the dust filter depends on a number of factors, such as the waste gas temperature, the ratio of direct and compounds operating mode, the dust content in the gas leaving the preheater, the efficiency of the dust removal device and the ratio of the different mercury species. However, the waste gas temperature and the ratio of the direct and compound operating mode are most important. As shown, the volatility of elemental and oxidized mercury exponentially increases in the temperature. Conversely, the adsorption to the filter dust decreases in the waste gas temperature. This fact is also confirmed by the real measurement (see Chapter 4.4.3.6.4.3 above). Consequently, the reduction and effective control of the waste gas temperature plays an important role. During the compound operating mode, the waste gas temperature is usually higher as there is no heat exchange in the raw meal. By means of the conditioning tower, the waste gas temperature can be adjusted and controlled but in many cases, there are limitations due to the insufficient capacity of the conditioning tower. Waste gas temperatures of 110°C (and even below) can be achieved in the compounds and direct operating mode. To maintain this low temperature level, in many cases, the improvement or enlargement of the conditioning tower is required. At low waste gas temperatures, efficient dust control (residual dust concentrations below 5, at least below 10 mg/Nm3) and a high ratio of compounds to direct operating mode (e.g. 90:10), the enrichment factor will be very high (a factor up to 400 has been reported [Linero, 2011]) and the efficiency of dust shuttling, if all filter dust is removed during the direct operating mode, is very high. For instance, a removal efficiency of about 78 % can be achieved [Renzoni et al., 2010, p X]. Often, dust shuttling is only considered to be appropriate if the removed filter dust can be added to the clinker during cement grinding. Otherwise, the removed filter dust has to be disposed of. It is a prerequisite for the acceptability of adding the removed filter dust to the clinker that mercury is practically not leachable from concrete and end-of-life aggregates. The available detailed technical information on activated carbon injection is not sufficiently detailed although this technique is mentioned in the BREF and the aforementioned UN and US documents. For instance, in the BREF, it just stated that in one German plant, activated carbon is injected as an adsorbent to the flue gas [EC BREF CLM, 2013, p 81]. Nevertheless; it is considered as an efficient technique. Again, it is stressed that the waste gas temperature should be low in order to achieve high adsorption rates [Renzoni et al, 2010]. There are additional references pointing out that the injection of activated carbon downstream to the dust filter with the consequence of the need of an additional bag filter is the better solution compared to the upstream injection [Paone, 2010, p 54; Renzoni et al., 2010, p 62]; e.g. when adding the filter dust to the clinker to produce cement, the present activated carbon can cause quality problems. The scheme of the activated carbon injection downstream to the dust filter is illustrated in Figure 4.96 below.

Chapter 4
State of the art of the co-incineration of waste-derived fuels and raw materials in clinker/cement plants 257
Figure 4.96: Example for the injection of activated carbon (or of another dry sorbent) downstream to the dust filter requiring an additional filter for sorbent removal [Paone, 2010, p 55]
Concerning the only existing lignite coke moving bed adsorber at a cement plants which has been successfully operated since 1994, detailed information is provided in ANNEX V. During the Sevilla Process, it was concluded to consider this technique as being beyond BAT, especially with respect to cost considerations. However, it could have been considered to be BAT under the certain circumstances and conditions (conditional BAT) (see ANNEX V). The conditions refer to the extent co-incinerated waste (qualitative and quantitative conditions) and to the level of emissions of hazardous pollutants such as SO2, benzene, mercury and also halogenated compounds Vice versa, the lignite coke moving bed adsorber can be considered to be beyond BAT (e.g. for cement plants with zero or very low waste input and low emissions of hazardous pollutants) as well as BAT under the above mentioned, and possibly further, conditions. There are further techniques under discussion such as wet scrubbers, dry scrubbers (gas suspension absorbers) and mercury roasters [Paone, 2010]. Wet and dry scrubbers are only applied in cases where acidic pollutants, especially SO2, have to be reduced. Then, these techniques can be combined with mercury removal [Paone, 2010; Miller et al., 2011]. The mercury roaster volatilises mercury from removed filter dust. It is reported that investigations with a pilot plant revealed positive results [Paone, 2010, pp 57-59] but it seems that no plant has been installed on industrial scale so far (April 2014).

Chapter 4
258 State of the art of the co-incineration of waste-derived fuels and raw materials in clinker/cement plants
4.4.3.7 Thallium (Tl)
4.4.3.7.1 Introduction
Thallium is not continuously monitored by cement companies. In Germany, it is monitored by spot measurements by certified third party measurement institutes. The results are annually published as “Environmental Data of the German Cement Industry” 20 by the Verein Deutscher Zementwerke e.V. (VDZ) which is the economic, technical and scientific association for the German cement industry. In the time period 2005 – 2015, the number of annual measurements were between 108 and 142. Mercury is the only highly volatile heavy metal and thallium as well as selenium the only volatile ones (see Chapters 3.2.4.2.1 and 4.4.1). The relevant volatile thallium compounds are thallium sulphate (Tl2SO4) and thallium chloride (TlCl) (see Chapter 3.2.4.2.2). Both thallium compounds are toxic [Kemper/Bertram, 1984; Schoer, 1984]. Thallium sulphate is even used as rat poison. The significance of thallium emissions from clinker production was first discovered at the cement works of Dyckerhoff in Lengerich/Germany (see Figure 2-1 and Table 2.1). In 1979, in the vicinity of the plant, 20 rabbits and 7 sheep died and adverse impacts on vegetation were observed [Spiegel, 1979; Kemper/Bertram, 1984]. The latter were investigated in detail [e.g. Kemper/Bertram, 1984; Schoer, 1984; Kurz et al., 2002]. Further, the behaviour of thallium in the kiln system was studied [Keinhorst, 1980; Welzel/Winkler, 1981; Kamm, 1985]. The results were presented in a comprehensive report [Winkler, 1986]. The basic information on the behaviour of thallium compounds in kiln systems is provided in the Chapters 3.2.4.2.2 and 4.4.1 telling that only a very small percentage of thallium is incorporated into the clinker and that the thallium compounds condense in the upper part of the cyclone preheater at temperatures between 450 and 550 °C. Due to the (moderate) volatility of the thallium compounds, they rarely reach the kiln but evaporate in the lower stages and condense in the upper stages of the preheater (Figure 4.97) and move back to the preheater (inner cycle – see Chapter 3.2.4.2, [Winkler, 1986, p 57]). A part of the thallium compounds also leave the preheater with the gas and condense in the cooling tower, raw mill and waste gas filter. If the filter dust is returned, the thallium compounds are returned as well, enrich in the raw meal and thus, an outer cycle is established (see Chapter 3.2.4.2, [Winkler, 1986, p 62]). The higher the thallium removal efficiency of the dust filter – this directly correlates with the dust removal efficiency – and the lower the thallium incorporation into the clinker, the higher the thallium enrichment in the system, provided the dust is returned and not discarded (closed dust cycle) [Winkler, 1986]). Kirchartz reports a maximum enrichment factor of 50 (Kirchartz, 1994, p 77 and see Chapter 3.2.4.2.2) and Winkler of up to 2 orders of magnitude [Winkler, 1986, p 39]. In case of the direct operating mode and in case the filter dust is directly returned to the raw meal (not waiting with dust return until there is again a change to the compound operating mode), extremely high emission peaks can occur which are 3 to 4 times higher than the usual emission concentration [Winkler, 1986]. But, most probably, with respect to thallium emissions, the CO trips of the electrostatic precipitator were most relevant as in this case the dust, enriched with thallium (and maybe with mercury also) is directly emitted to the environment. The frequency of CO trips increased with the use of waste-derived fuels as it was more difficult to avoid them. Of course, if the dust and thus the thallium removal efficiency of the dust filter is high the thallium emissions to air are low. Today, with the replacement of electrostatic precipitators by fabric filters, the residual dust content is very low and thus, the same is true for thallium emissions. However, this means that the enrichment factor is also higher. In case of a closed system, i.e. the filter dust is returned (closed dust cycle), the thallium emissions are higher during the direct operating mode and even higher in case the dust is directly returned during the direct operating mode. But it is stressed again that in the 1970s and 1980s, the thallium emissions during CO trips may have been much more significant.
20 Verein Deutscher Zementwerke e.V. (VDZ), Environmental Data of the German Cement Industry, https://www.vdz-online.de/en/publications/environmental-data/

Chapter 4
State of the art of the co-incineration of waste-derived fuels and raw materials in clinker/cement plants 259
Figure 4.97: Thallium content in the raw meal at the different stages (cyclones) of the preheater
[Winkler, 1986, p 56]; six series of measurements have been conducted and five are
presented (M 2 … M 6) whereby for the measurement series M 2, M 3, M 4 and M 5, the
dust cycle was closed and for M 6 it was open
At equilibrium conditions and return of the dust (closed dust cycle), as the incorporation into the clinker is low, the thallium output with the waste gas is almost equal to the input with the raw materials. This means that the reduction of the input also reduces the emissions to air. In the case of the cement works of Dyckerhoff AG in Lengerich, the input could be drastically reduced by stopping the use of roasted pyrite. As a consequence, the thallium deposition in the vicinity of the plant could be reduced from 2000 to less than 20 µg/m2 x d [Scholl/Metzger, 1981]. In Table 4.49, the minimum, maximum and average thallium concentrations of different raw materials are compiled and it is obvious that roasted pyrite is highly contaminated with thallium. It is also important to note, that thallium sulphate and thallium chloride are mainly contained in the fine dust fraction smaller than 20 µm. Compared to the coarser dust particles, the fine dust fraction is less removed in the dust filter, especially in case of electrostatic precipitators. Thus, the thallium concentration in the fine dust leaving the dust filter can be 2 – 5 time higher compared to the filter dust [Winkler, 1986 p 58].
Tl content of the meal at the different stages in [mg/kg]
°C = meal temperature in the heat exchanger
= flow direction of the gas
= Flow direction of the meal
kiln
inlet
stage 4
stage 3
stage 2
stage 1
raw waste gas
raw meal
stage 1
stage 2
stage 3
stage 4
30 °C
520-560 °C
340-360 °C
850-900 °C
870-920 °C
0 200 400 600 800 12001000
M 6 M 4M 5
M 3 M 2

Chapter 4
260 State of the art of the co-incineration of waste-derived fuels and raw materials in clinker/cement plants
Table 4.49: Thallium content of different raw materials [Winkler, 1986]
Further, as for mercury, the dust shuttling (other terms: filter dust removal, discarding the filter dust or dust bleeding) is another efficient option to reduce thallium emissions to air. 4.4.3.7.2 Evaluation of available data monitored at German clinker production plants
As mentioned above, the thallium emissions are determined once a year at German clinker production plants. The names of the different plants are not mentioned. The results, published by VDZ, show that today the thallium emissions are low. The emission concentrations are usually below the detection limit, i.e. below 4 – 6 µg/Nm3. As an example, the measured values are presented for the year 2011 (Figure 4.98). Only three values were above the detection limit. The highest value was about 28 µg/Nm3.
Figure 4.98: Thallium (Tl) concentration values for the year 2012 measured in the clean waste gas of 38
rotary kilns [VDZ, 2012]
The VDZ is estimating the annual thallium releases with the assumption of an emission concentration as high as the detection limit (4 µg/Nm3) and presents the results as in Figure 4.99. According to this calculation, the annual thallium load released to the environment is between 1 and 18 kg. The aforementioned highest measured concentration (28 µg/Nm3- see the three triangles) is associated with an annual thallium release of about 27 kg.
Raw materialminimum maximum average
0.2 0.7 0.33
0.2 0.39 0.28
0.25 0.42 0.32
0.27 0.38 0.32
0.14 0.40 0.25
0.24 0.25 0.24
Limestone 0.05 0.06 0.05
Iron ore 0.9 1.7 1.2
Iron ore (low in Tl) 0.14 0.42 0.28
3 7.4 4.8
2.3 8.2 4.6
1.0 3.8 2.4
282 367 328
172 281 231
242 338 273
301 356 334
1.2 1.8 1.4
0.9 1.7 1.3
0.32 0.58 0.45
0.45 0.50 0.48
Lignite dust 0.1 0.2 0.16
Tl content in [g/t]
Lime marl
Iron oxide residue from
sulphuric acid production
Roasted pyrite
Hard coal dust
Measurement results in the clean gas,123 values are below the detection limit

Chapter 4
State of the art of the co-incineration of waste-derived fuels and raw materials in clinker/cement plants 261
Figure 4.99: Thallium (Tl) emissions (annual releases in 2012) of 38 rotary kilns in Germany [VDZ,
2012]
At some plants, there are still electrostatic precipitators in operation. In case of CO trips, the thallium emissions may be higher depending on the dust management, i.e. to which extent the dust is discarded. These circumstances are not included in the values in Figure 4.98 and Figure 4.99. 4.4.3.8 Other heavy metals
4.4.3.8.1 Introduction
Heavy metals other than mercury are not continuously monitored by cement companies. In Germany, they are monitored by spot measurements by certified third party measurement institutes. The results are annually published as “Environmental Data of the German Cement Industry” [VDZ, 1999; … ; VDZ, 2016] by Verein Deutscher Zementwerke e.V. (VDZ)20. In the time period 2005 – 2015, the number of annual measurements were between 104 and 143 for antimony, arsenic, cadmium, chromium, copper, lead, nickel, tin and vanadium, between 15 and 22 for beryllium, between 14 and 22 for selenium, between11 and 17 for tellurium and between 6 and 8 for zinc. The highly volatile mercury and the volatile thallium are separately discussed because of their specific behavior in clinker production plants (see Chapters 4.4.2.5 and 4.4.2.6). The basics on the low volatile lead and cadmium are submitted in Chapter 3.2.4.2.2 telling that
- lead and cadmium compounds condense in the lower cyclones at temperatures between 700
and 900 °C; thus, they significantly enrich there and internal cycles are formed,
- the chlorine input into the kiln system has increased at many plants and thus, an increased
formation of lead and cadmium chlorides may be formed which are more volatile and thus,
the incorporation of lead and cadmium into the clinker can drastically decrease,
- cadmium and lead compounds are present as very small particles (< 20 µm) in the raw waste
gas and thus enrich in this fine dust fraction. As a consequence; as for thallium (see Chapter
4.4.3.6), the concentration of cadmium and lead compounds in the fine dust after the dust
removal filter is 1.5 – 5 times higher than in the filter dust itself.
In Chapter 4.4.1, the transfer factors for the relevant heavy metals are presented. It is important to know that the non-volatile and low volatile heavy metals do not occur in the gas phase but form or are adsorbed to fine dust particles. This means that, as a first approximation, the dust removal directly correlates with the reduction of particulates (dust). In other words: the more efficient the dust removal from waste gas is, the more efficient is the removal of heavy metals. Against this background, the low
Determination by measuredconcentration value
Estimated range with assumed emissionconcentration of up to 0.004 mg/Nm3

Chapter 4
262 State of the art of the co-incineration of waste-derived fuels and raw materials in clinker/cement plants
volatile and non-volatile heavy metals are not discussed one by one but as a group. This is also the case in the best available techniques reference document [EC BREF CLM, 2013] and in the aforementioned VDZ reports “Environmental Data of the German Cement Industry”. 4.4.3.8.2 Evaluation of available data monitored at German clinker production plants
As mentioned above, the heavy metal emissions other than mercury are not continuously monitored but are determined once a year at German clinker production plants. The names of the different plants are not mentioned. The results, published by VDZ, show that the heavy metal emissions are low. As shown in Table 4.50, the emission concentrations are usually below the detection limit. As examples, the values are compiled for the years 2005, 2010 and 2015. From the table, it can be seen that
- between 2005 and 2015, the detection limits did not change,
- between 2005 and 2015, the emission level did not significantly change,
- some heavy metals (beryllium, selenium, tellurium and zinc) are not measured at all plants,
- in most cases, the emission concentration was below the detection limits.
Table 4.50: Overview of the measurement results of emission of low volatile and non-volatile heavy
metals of German clinker production plants; information source: [VDZ, 2006; VDZ, 2006;
VDZ, 2016]
As indicated, in only a few cases did the emission concentration of a specific heavy metal exceed the detection limit. As expected, this is more often the case for the low volatile heavy metals cadmium and lead. Also for tin, there are values above the detection limit. Where the emission concentration is above the detection limit, an annual load can be estimated. The estimated maximum loads are also mentioned in Table 4.50. For lead, the maximum load in one case was 115 kg/yr, for cadmium 26 kg/yr, for tin 110 kg/yr, for antimony 26 kg/yr and for nickel 52 kg/yr. As the names of the plant concerned as well as the specific circumstances are not known, the reasons for these maximum loads cannot be discussed. The maximum values for tin are very high and difficult to understand. The average tin concentration in the continental rust [Wedepohl, 1995] is 2.3 ppm and thus, the contribution of the natural raw materials will be very low. The tin content in waste-derived raw materials and fuels can be higher but may not be so high as to explain the maximum observed emission values. Consequently, it should be considered whether the measurements were carried out correctly as it is known that cross-contamination in the measurement devices can occur.
n n (< DL) DL
maximum
measured
conc.
maximum
determined
load
n n (< DL) DL
maximum
measured
conc.
maximum
determined
load
n n (< DL) DL
maximum
measured
conc.
maximum
determined
load
[µg/Nm3] [kg/yr] [µg/Nm3] [µg/Nm3] [kg/yr] [µg/Nm3] [µg/Nm3] [kg/yr]
Antimony 107 107 5 - 8 all < DL no value 110 104 5 - 8 28 26 138 138 5 - 8 all < DL no value
Arsenic 109 106 5 - 8 12 n.a. 113 113 5 - 8 all < DL no value 137 137 5 - 8 all < DL no value
Beryllium 22 22 3 - 5 all < DL no value 15 14 3 - 5 4 6 17 17 3 - 5 all < DL no value
Cadmium 107 92 2 - 5 80 16 114 110 2 - 5 5 4 143 136 2 - 5 9 n.a.
Chromium 107 102 10 - 15 75 102 114 109 10 - 15 28 n.a. 139 139 10 - 15 26 n.a.
Copper 108 93 8 - 12 22 28 117 85 8 - 12 4 50 143 105 8 - 12 80 n.a.
Lead 108 92 10 - 20 80 55 117 86 10 - 20 250 115 143 115 10 - 20 30 n.a.
Nickel 109 89 6 - 9 145 15 114 84 6 - 9 110 52 143 105 6 - 9 50 n.a.
Selenium 22 20 6 - 9 13 7 14 13 6 - 9 15 18 21 21 6 - 9 all < DL no value
Tellurium 16 15 1,5 - 4 3 3 11 11 1,5 - 2 all < DL no value 17 17 1,5 - 2 all < DL no value
Tin 102 62 7,5 - 11 39 110 110 86 7,5 - 11 150 100 142 137 7,5 - 11 11 n.a.
Vanadium 108 101 5 - 8 13 18 114 112 5 - 8 11 10 143 142 5 - 8 6 n.a.
Zinc 8 8 50 - 100 all < DL no value 6 6 50 - 100 all < DL no value 6 6 50 - 100 all < DL no value
Legend: n: number of measurements; n (<DL): number of measurements with a value below DL; Detection Limit; n.a.: not available; conc.: concentration
2005 2010 2015

Chapter 4
State of the art of the co-incineration of waste-derived fuels and raw materials in clinker/cement plants 263
4.4.3.9 Hydrogen chloride (HCl)
4.4.3.9.1 Introduction
Only very few clinker production plants in Germany continuously monitor HCl. From three plants, continuous monitoring data is available. Usually, the German plants are monitored by spot measurements by certified third party measurement institutes. The results are annually published as “Environmental Data of the German Cement Industry” by Verein Deutscher Zementwerke e.V. (VDZ)20. In the time period 2005 – 2015, the number of annual measurements were between 108 and 144. Chlorine compounds are minor additional constituents contained in the raw materials and fuels of the clinker burning process. They may enter into the kiln system with the different inputs and during the firing process in the kiln system. They react with the alkalis of the kiln charge to form alkali chlorides (see Chapter 3.2.4.2.1). These compounds, which are initially vaporous, condense on the kiln feed or the kiln dust at temperatures of between 700 and 900°C, subsequently re-enter the rotary kiln system and evaporate again. Thus, an internal cycle is formed (see Chapter 3.2.4.2.1). In Germany, due to increasing chlorine input, the threshold input value of 200 - 300 mg chlorine/kg clinker [EC BREF CLM, 2013; Waltisberg, 2012] was exceeded and many clinker production plants were retrofitted with a so-called chlorine bypass (see Chapter 3.3.4) in order to diminish operational malfunctions. As mentioned in Chapter 4.4.3.10, in case of a chlorine bypass, there are cases where the waste gas from the bypass is emitted via the same stack from which the kiln waste gas is released to the environment. In this case, so-called “visible smoke” (opacity) can occur under certain circumstances. HCl as a component of the bypass waste gas can react with ammonia, if present because of its release from the raw materials or because of the dosage of ammonia solution (NH3) in excess for NOx reduction. Then, HCl and NH3 will form ammonium chloride (NH4Cl) which, as an aerosol, is visible as “visible smoke”. 4.4.3.9.2 Evaluation of available data monitored at German clinker production plants
As indicated above, three German clinker production plants do continuously monitor HCl. However, two of them emit very low concentrations. In one case, the annual mean values are between 0.3 and 1.1 mg/Nm3 (see clinker production site 5 in Annex IV) and in the other case, the annual mean values are between 0.3 and 2.1 (see clinker production site 12 in Annex IV). In these cases, it is does not make sense to present the emission curves. The third plant with continuous monitoring is a special case, as at that plant, the raw material contains high chloride contents (see clinker production site 16 in Annex IV). Therefore, the cement works had to install a chlorine bypass from the very beginning. The gas from the chlorine bypass (after removal of the dust in a bag filter) is discharged via the main chimney which is used for the emission of the kiln waste gas. Thus, the HCl concentration is significantly higher compared to most other cement works. The annual mean values are between 7 and 11 mg/Nm3. However, the emission curve from 2008 – 2010 shows peak values up to 40 mg/Nm3 (Figure 4.100). The emission limit value of 10 mg/Nm3 is often exceeded, for a couple of periods even persistently.

Chapter 4
264 State of the art of the co-incineration of waste-derived fuels and raw materials in clinker/cement plants
Figure 4.100: Daily mean values for HCl emissions from 2008 -2010 of the clinker production plant of
Holcim in Höver/Germany
The aforementioned emission levels published by VDZ show that, for the period 2005 – 2015, about two thirds of the values are below the detection limit (Figure 4.101). For the whole time period, the detection limit was ‘1.5 - 2.1 mg HCl/Nm3’. The percentage of measurements exceeding the emission limit value (usually 10 mg/Nm3) is in the range 0 – 5.6 %. The percentage of values equal to or above 5 mg/Nm3 is between 8.6 and 19.1 % (Figure 4.101).
Figure 4.101: Percentage of HCl spot measurements below the detection limit (1.5 – 2.1 mg/Nm3), equal
to or above 5 mg/Nm3 and equal or above 10 mg/Nm3, source: [VDZ, 2006 … VDZ, 2016];
the number of annual spot measurements were between 108 and 144
0
5
10
15
20
25
30
35
40
45H
Cl i
n [
mg
/Nm
3]
Pe
rce
nta
gein
[%
]
0
10
20
30
40
50
60
70
80
2005 2006 2007 2008 2009 2010 2011 2012 2013 2014 2015
Percentage of values equal or higher than 5 mg/Nm3
Percentage of values equal or higher than 10 mg/Nm3
Percentage of values below the detection limit (1.5 - 2.1 mg/Nm3)

Chapter 4
State of the art of the co-incineration of waste-derived fuels and raw materials in clinker/cement plants 265
Figure 4.101 does not show a trend. Looking at the three maximum values for each of the years from 2005 – 2015, it can be seen that they increased in 2008 and 2009, decreased in 2010 and 2011 and slightly increased again until 2015 (Figure 4.102). However, this look at the three maximum values for the different years only indicates that the HCl emissions increased for a few clinker production plants which could be associated with the use of waste-derived fuels and raw materials. But this is more of a possible interpretation rather than a proven statement.
Figure 4.102: The three maximum values of the years 2005 – 2015 of the spot measurement carried out
at the German clinker production plants; source: [VDZ, 2006 … VDZ, 2016]
The HCl values presented above are similar to those published by the European Commission for 2004 [EC BREF CLM, 2013]. 4.4.3.10 Hydrogen fluoride (HF)
4.4.3.10.1 Introduction
HF is not continuously monitored by cement companies. In Germany, it is monitored by spot measurements by certified third party measurement institutes. The results are annually published as “Environmental Data of the German Cement Industry” by Verein Deutscher Zementwerke e.V. (VDZ)20. In the time period 2005 – 2015, the number of annual measurements were between 107 and 143. Of the fluorine present in rotary kilns, 90 to 95% is captured in the clinker, and the remainder is bound with dust in the form of calcium fluoride (CaF2) which is stable under the conditions of the burning process; some cement works even add CaF2 to the raw meal as a mineraliser. Owing to the great excess of calcium, the emissions of gaseous fluorine compounds and of hydrogen fluoride in particular, are virtually excluded. Ultrafine dust fractions that pass through the measuring gas filter may simulate low contents of gaseous fluorine compounds in rotary kiln systems. Minor amounts of fluorides are discharged with the kiln dust, such as in the form of CaF2 [EC BREF CLM, 2013; VDZ, 2006 … VDZ, 2016].
10,5
14,515
111112
10
12
1817
1819
11
20
27
7 7,5
9,59,510
14
9,59,5
1210,2
12,5
15,5
13
15,517
1414
16
2005 2006 2007 2008 2009 2010 2011 2012 2013 2014 2015
HC
l in
[m
g/N
m3]

Chapter 4
266 State of the art of the co-incineration of waste-derived fuels and raw materials in clinker/cement plants
4.4.3.10.2 Evaluation of available data monitored at German clinker production plants
The aforementioned emission levels published by VDZ show that, for the period 2005 – 2015, most of the values were below the detection limit (between 46.6 and 84.4 % of the measured values) (Figure 4.103). For the whole time period, the detection limit was ’40 – 60 µg HF/Nm3’. In the last three years (2013 – 2015), every year, two values were above 1 mg/Nm3 which is usually the emission limit value. It is not known whether these values are associated with the use of waste-derived fuels or raw materials. The percentages of values equal or above 0.5 mg/Nm3 is between 0 and 5.7 % and the percentage of values equal or above 1 mg/Nm3 (the usual emission limit value) is between 0 and 2.8 % (Figure 4.103). Against this background, in general, HF emissions are of minor significance.
Figure 4.103: Percentage of HF spot measurements below the detection limit (40 – 60 µg/Nm3), equal to
or above 0.5 mg/Nm3 and equal to or above 1 mg/Nm3, source: [VDZ, 2006 … VDZ, 2016];
the number of annual spot measurements were between 107 and 145
The HF values presented above are similar to those published by the European Commission for 2004 [EC BREF CLM, 2013]. 4.4.3.11 Ammonia (NH3)
4.4.3.11.1 Introduction
As indicated in Chapter 3.2.4.22, ammonia (NH3) is mainly present in raw materials. The input of nitrogen compounds (largely as ammonia) is about 50 – 150 g per tonne of raw material; there are extreme cases where the input is up to 250 g/t [Waltisberg, 1988]. In addition, ammonia is often used as a reducing agent for NOx abatement and is added in excess. The excess in the waste gas emitted to air is called ammonia slip [EC BREF CLM, 2013, p 89] and should be kept as low as possible [EC CLM Conclusions, 2013]. The behaviour of ammonia is very similar to mercury. It completely evaporates in the preheater, leaves the preheater and is enriched by adsorption to the meal in the raw mill during compound operating mode. Thus, an outer cycle is formed. When switching to the direct operating mode, the raw gas with elevated concentrations of ammonia as a highly volatile compound directly reaches the dust abatement system. As a gas, ammonia is not removed and thus higher ammonia emissions occur (see Table 4.51).
0
10
20
30
40
50
60
70
80
90
2005 2006 2007 2008 2009 2010 2011 2012 2013 2014 2015
Diagrammtitel
Percentage of values equal or higher than 0.5 mg/Nm3
Percentage of values equal or higher than 1 mg/Nm3
Percentage of values below the detection limit (40 - 60 µg/Nm3)
Pe
rce
nta
gein
[%
]

Chapter 4
State of the art of the co-incineration of waste-derived fuels and raw materials in clinker/cement plants 267
As presented in Chapter 3.3.4.5, in case of a chlorine bypass, there are cases where the waste gas from the bypass is emitted via the same stack as the waste gas from the kiln. Then, so-called “visible smoke” (opacity) can occur under certain circumstances. HCl as a component of the bypass waste gas can react with ammonia, present in the kiln gas due to its aforementioned content in the raw materials or because of its injection in surplus for NOx reduction (see Chapter 4.4.3.4.1), especially during direct operating mode, to form ammonium chloride which, as an aerosol, is visible as “visible smoke”. 4.4.3.11.2 Evaluation of the emission data from continuous ammonia monitoring at
German clinker production plants
So far, only limited information is available about ammonia emissions from cement kilns. The German VDZ annually reports the emission data of all German clinker production plants19 but not for the parameter ammonia so far. It can be expected that the monitoring results will be presented in the future as the German Government has introduced a stringent emission limit value for NOx of 200 mg/Nm3 that operators have to comply with from 01.01.2019 as well as a limit for the ammonia slip of 30 mg/Nm3 [DE IED Ordinance, 2013b]. It has been reported that the ammonia slip can be as high as in the range between 50 and 200 mg/Nm3 [EC BREF CLM, 2013, p 90]. However, this may only be the case of non-optimal operating conditions. From three German clinker production plants, emission data are available from continuous monitoring. One of these plants is the cement works of Portland Zementwerke GmbH & Co. KG in Solnhofen/Germany (see clinker production site 12 in Annex IV). There is no emission curve available but the average ammonia emission levels for three years both for the compound and direct operating mode are available (Table 4.51). As expected, the ammonia emission concentration is significantly lower in the compound operating mode (high adsorption of ammonia in the raw mill) compared to the direct operating mode when the gaseous ammonia is not adsorbed but released with the waste gas to a much higher extent. For the period of three years (2008 – 2010), the ratio was between 11.2 and 23.0 whereby the level of the ammonia emission concentration decreased in 2009 and 2010. The optimisation measures taken are not known. In Solnhofen, a SCR plant went into operation in 2001 but has not been operated since 2005/2006 (see clinker production site 12 in Annex IV). The elevated ammonia emissions may occur due to high dosage of urea or ammonia for NOx reduction by means of the SNCR facility.
Table 4.51: Annual mean values for the ammonia emissions for the compound and direct operating mode from Portland Zementwerke GmbH & Co. KG in Solnhofen/Germany for 2008 – 2010 (see clinker production site 12 in Annex IV)
NH3 [mg/Nm3] Ratio of direct to compound
Compound Direct operating mode
2008 6.4 104.8 16.4
2009 5.6 62.8 11.2
2010 1.8 41.5 23.0
As indicated above, the elevated level of ammonia during direct operating mode may lead to the formation of ammonium chloride (NH4Cl) that forms an aerosol which, most probably, will be noticeable as a “(visible) plume” (opacity) from time to time. For the interpretation of the results, it is also required to know the ammonia input from the raw meal and from the dosage of urea or ammonia for SNCR. For NOx reduction by means of SCR or SNCR, the ammonia input of the raw meal should be taken into account.

Chapter 4
268 State of the art of the co-incineration of waste-derived fuels and raw materials in clinker/cement plants
The second plant is that of Schwenk Zement KG in Mergelstetten/Germany (see clinker production site 3 in Annex IV). At this site, in 2012, a SCR plant went into operation to abate NOx emissions (see clinker production site 3 in Annex IV). As a reducing agent, aqueous ammonia or urea solution is used. Compared to the former SNCR, the consumption of reducing agents of the high dust SCR was only approximately 33%, while achieving lower stack NOx values of 200 mg/Nm3 with SCR versus 350 mg/Nm3 with SNCR [Zurhove/Terry, 2013]. In 2011, the ammonia slip was still being optimised. The atypical profile of ammonia emissions in that year was probably the result of ongoing trials. However, at the end of 2011, the ammonia emission remains at a constantly low level of about 5 mg/Nm3 (Figure 4.104). Unfortunately, the emission values for the following years are not available. The reported ammonia slip is <5 mg/Nm3 (Zurhove, 2014).
Figure 4.104: Daily mean values for ammonia emissions in 2011 of the clinker production site of Schwenk Zement in Mergelstetten/Germany (see clinker production site 3 in Annex IV)
For 2010, the data of the third plant at the cement works of Märker Zement GmbH in Harburg/Germany show an emission curve with a lot of missing values (Figure 4.105). The highly varying values are difficult to explain. As a conclusion, the values and the curve do not seem to be trustworthy. Thus, an interpretation of the curve is not advisable or possible.
0
10
20
30
40
50
60
01.01.2011 02.04.2011 02.07.2011 01.10.2011 31.12.2011
NH
3[m
g/N
m3]

Chapter 4
State of the art of the co-incineration of waste-derived fuels and raw materials in clinker/cement plants 269
Figure 4.105: Daily mean values for ammonia emissions in 2010 of the clinker production site of Märker Zement GmbH in Harburg/Germany (see clinker production site 7 in Annex IV)
4.4.3.11.3 Conclusions
The behaviour of ammonia is very similar to mercury. It completely evaporates in the preheater, leaves the preheater and is enriched by adsorption to the meal in the raw mill during compound operating mode. Thus, an outer cycle is formed. When switching to the direct operating mode, the raw gas with elevated concentrations of ammonia as a highly volatile compound directly reaches the dust abatement system. As a gas, ammonia is not removed and thus higher ammonia emissions occur (see Table 4.51). As presented in Chapter 3.3.4.5, in case of a chlorine bypass, HCl, if present in sufficient concentration, can react with ammonia to form ammonium chloride which can be noticed as so-called “visible smoke” (opacity). Elevated ammonia emissions can also occur in case of a related elevated ammonia content in raw materials or, in case of adding urea or ammonia in excess for NOx abatement. This excess is also called ammonia slip. It is significantly higher in case of SNCR compared to SCR abatement technology. 4.4.3.12 Volatile organic compounds (VOC)
4.4.3.12.1 Introduction
VOC and TOC respectively is a sum parameter for all organic compounds present in the waste gas. It has been introduced as it is not practically possible to determine the manifold organic compounds. As it comprises the organic compounds which volatilise during the process, it is, in first order, equal to the parameter volatile organic carbon (VOC)21. The specific legal background is of importance for this sum parameter. The regulation started with the European Waste Incineration Directive (WID) [EU EID, 2000] which was later integrated into the European Industrial Emissions Directive (IED) [EU IED; 2010]. Basically, the emission limit for TOC (in the form of the daily mean value) is 10 mg/Nm3. But there is a specific derogation for the co-
21 The sum parameter „Volatile Organic Compounds (VOC)“ comprise all organic compounds in waste gas which have a vapour pressure of more than 0.1 mbar at 20 °C or a boiling point of less than 240 °C at 1013.25 mbar. VOC is usually measured by means of flame ionization detectors. The term “Total Organic Carbon” was originally used in the field of wastewater and sludge analysis but is now also used in the field of waste gas analysis. In the latter, VOC and TOC are synonyms.
0
5
10
15
20
25
30
35
40
01.01.2010 20.02.2010 11.04.2010 31.05.2010
NH
3[m
g/N
m3]

Chapter 4
270 State of the art of the co-incineration of waste-derived fuels and raw materials in clinker/cement plants
incineration of waste in cement plants laid down in Annex VI, PART 4, clause 2.322. It says that “The competent authority may grant derogations for emission limit values set out in this point in cases where TOC and SO2 do not result from the co-incineration of waste”. In Germany, before the aforementioned integration into the IED, the WID was implemented by amending the 17th Ordinance on Waste Incineration and Co-Incineration [DE 17th BImSchV, 2003]. The very first draft of this implementation [DE 17th BImSchV-draft, 2002] already contained the following derogation for TOC: ”Upon application by the operator, the competent authority may grant derogations for sulphur dioxide and total organic carbon provided that such derogations are necessary on account of the composition of natural raw materials and the release of additional total organic carbon and sulphur dioxide emissions from the incineration of waste or substances pursuant to Art. 1 para (1) can be ruled out”. This derogation is very similar to the current one and was mainly based on investigations of the German cement industry as, for instance, published by Zunzer (Zunzer, 2002). In the discussion at that time, it was repeatedly stressed that ”The carbon monoxide and TOC emissions of cement works mainly derive from the raw material”, e.g. in [DE 17th BImSchV-Committees, 2003] and [DE 17th BImSchV-Federal Council, 2003]. When implementing the IED into German law, this derogation was maintained (see clause 2.1.3 of Annex 3 of the 17th Ordinance on Waste Incineration and Co-Incineration - 17. BImSchV [DE 17th BImSchV, 2013]. As indicated above, the derogation was based on investigations of the German cement industry. The Verein Deutscher Zementwerke e.V. (VDZ) annually publishes the “Environmental Data of the German Cement Industry”19. Concerning TOC, the available issues from 1999 – 2012 state the following: “The exhaust gas concentrations of CO and organically bound carbon are a yardstick for the burn-out rate of the fuels utilised in energy conversion plants, such as power stations. By contrast, the clinker burning process is a material conversion process that must always be operated with excess air for reasons of clinker quality. In concert with long residence times in the high-temperature range, this leads to complete fuel burn-up. The occurring emissions of carbon monoxide and total carbon do not result from combustion, but from the thermal decomposition of organic compounds of the raw material in the preheater. The emissions of CO and organically bound carbon during the clinker burning process are caused by the small quantities of organic constituents input via the natural raw materials (remnants of organisms and plants incorporated in the rock in the course of geological history). These are converted during kiln feed preheating and become oxidised to form CO and CO2. In this process, small portions of organic trace gases (total organic carbon) are formed as well. In case of the clinker burning process, the content of CO and organic trace gases in the clean gas therefore does not permit any conclusions on combustion conditions” [VDZ, 1999 … VDZ, 2012]. However, this statement as well as the justification for the derogation is only partially correct. They are only valid for the main burner but not for the secondary firing, i.e. the combustion in the riser duct or in the precalciner. This may be the reason why VDZ deleted the underlined part in the aforementioned citation in the “Environmental Data of the German Cement Industry for the years 2013 – 2018 [VDZ, 2014 … VDZ, 2019]. The technical background for the conclusion that the aforementioned statement and justification of the derogation are not fully correct will be submitted in the following evaluation of emission data based on the basic information on the emission of organic compounds in Chapter 3.3.1.2. Before doing so, reference is given to Table 4-38 providing the emission limit values of the 34 German cement works. Its evaluation with respect to TOC reveals that
- about half of the cement works do not have a TOC emission limit value which is not in
conformity with European and German regulations,
- of those cement works for which a TOC emission limit value is prescribed, only one cement
works has to comply with the 10 mg/Nm3 value; for all the others, the aforementioned
derogation is applied and, thus, up to ten times higher emission limit values (cement works no
10, 20, 21, 22 and 24 in Table 4-38) are fixed.
22 The detailed source is as follows: Industrial Emissions Directive, ANNEX VI (Technical provisions relating to waste incineration plants and waste co-incineration plants), PART 4 (Determination of air emission limit values for the co-incineration of waste), clause 2 (Special provisions for cement kilns co-incinerating waste), clause 2.3 (C – total emission limit values (mg/Nm3) for SO2 and TOC)

Chapter 4
State of the art of the co-incineration of waste-derived fuels and raw materials in clinker/cement plants 271
So far, the reasons for this considerable enforcement deficit remains unclear. The same is true for the range of different emission limit values. As already indicated, the following evaluation will demonstrate that there are cases where part of the TOC emission cannot be related to natural raw materials but to secondary firing. 4.4.3.12.2 Evaluation of available data monitored at German clinker production plants
4.4.3.12.2.1 Comparison of continuously monitored data with the spot measurements yearly published by VDZ
For VOC, and in the next sub-chapter for CO as well, the data available from continuous monitoring is compared with the results of VOC spot measurements that are annually published by VDZ19 in order to see whether the results are directly comparable. For this purpose, the data for the time period 2008 – 2010 are compared. From continuous monitoring, the annual mean values as well as the minimum and maximum values are compared with VDZ mean values (Table 2.1).
Table 4.52: Calculated VOC annual mean values from continuous monitoring from 2008 – 2010 in
comparison with the VDZ mean values from spot measurement in the same period
VOC emission [mg C/Nm3]
2008 2009 2010
Number of kilns 17 16 16
Annual mean value 21.9 19.8 20.5
VDZ mean value 24.3 21.2 24.0
Maximum value 50.6 54.8 81.3
Minimum value 5.6 6.2 3.6
At first approximation, the annual mean values from continuous monitoring are comparable with the mean values of the spot measurements. However, it is conspicuous that there are high maximum values which cannot be explained by the release of organic compounds from natural raw materials. In addition, the results from continuous monitoring are classified into 7 groups to see that most of the clinker production plants have very low (25% of the daily mean values are below 10 mg C/Nm3), low (31 % of the daily mean values are between 10 and 20 mg C/Nm3) or moderate (19 % of the daily mean values are between 20 and 30 mg C/Nm3) VOC emissions (Figure 4.106). But there are also plants having elevated (17 % of the daily mean values are between 30 and 50 mg C/Nm3), high (6 % of the daily mean values are between 50 and 60 mg C/Nm3) and very high (2 % of the daily mean values are above 80 mg/Nm3) VOC emissions (Figure 4.106).
Figure 4.106: Frequency distribution of the daily mean values derived from continuous VOC monitoring
at German clinker production plants in the time period 2008 - 2010
VOC [mg/Nm3]
Pe
rce
nta
geo
fd
aily
me
anva
lue
s

Chapter 4
272 State of the art of the co-incineration of waste-derived fuels and raw materials in clinker/cement plants
The reasons for high VOC emissions will be discussed in the following section. 4.4.3.12.2.2 Evaluation of the emission data from continuous VOC monitoring at German
clinker production plants
First, the data for clinker production plants with a low VOC emission level are presented. For this purpose, six 3-year VOC emission curves with a VOC level of lower than 20 mg C/Nm3 are compiled. In addition, these curves do not show high peaks. This means that on the one hand the whole process is operated in a stable way and on the other hand the impact of waste-derived fuels and raw materials is not visible or minor respectively (Figure 4.107).
Figure 4.107: 3-year VOC emission curves from six clinker production sites (see clinker production sites
3 (at the top left), 13 (at the top right), 26 (in the middle left), 24 (in the middle right), 32
(on the bottom left) and 33 (on the bottom right) in Annex IV) showing low VOC emission
levels
However, there are also plants showing high VOC emission levels as well as high variations or differences concerning the VOC emission (Figure 4.108).
0
5
10
15
20
25
30
01.01.2008 31.12.2008 31.12.2009 31.12.2010
VO
C [
mg
C/N
m3]
0
5
10
15
20
25
30
01.01.2008 31.12.2008 31.12.2009 31.12.2010V
OC
[m
g C
/Nm
3]
0
5
10
15
20
25
30
35
40
01.01.2008 31.12.2008 31.12.2009 31.12.2010
VO
C [
mg
C/N
m3]
0,0
10,0
20,0
30,0
40,0
50,0
60,0
01.01.2008 31.12.2008 31.12.2009 31.12.2010
VO
C [m
g C
/Nm
3]
0
5
10
15
20
25
30
01.01.2008 31.12.2008 31.12.2009 31.12.2010
VO
C [
mg
C/N
m3]
0
2
4
6
8
10
12
14
01.01.2008 31.12.2008 31.12.2009 31.12.2010
VO
C [
mg
C/N
m3]

Chapter 4
State of the art of the co-incineration of waste-derived fuels and raw materials in clinker/cement plants 273
Figure 4.108: 3-year and 4-year VOC emission curves from four clinker production sites (see clinker
production sites 22 (at the top left), 8 (at the top right showing the 4-year curve), 5 (on the
bottom left) and 29 (on the bottom right) in Annex IV) showing high and varying VOC
emission levels
The emission curve at the top left shows high variations reflecting instable process conditions assuming that the measurements are reliable. It is possible that the co-incineration of waste-derived fuels and raw materials do have a significant influence on these variations. The 4-year VOC emission curve at the top right shows a strong increase of organic compounds to a very high level (more than 200 mg C/Nm3). Definitely, this level cannot be caused by raw materials but by waste23. In 2010, the emission level was reduced but was still at a comparatively high level. At the end of 2001, the emission level considerably increased again. The curve on the bottom left shows a continuous decrease of the VOC emission level down to 20 mg C/Nm3. It remains unclear how this was achieved technically. It is unlikely that this is the result of a change in the composition of raw materials but more likely reflects improvement of the process to achieve a more complete combustion of organic compounds. On the bottom right, the emission curve shows a significant decrease in 2009 followed by an increase again in 2010 to a level between 20 and 40 mg C/Nm3. There is not information available to explain this distinct pattern. 4.4.3.12.3 Correlation between VOC and CO emissions
This section is particularly important as it demonstrates that significant emissions occur due to the co-incineration of waste which is legally not allowed. The details on CO emissions are submitted in the subsequent section. 4.4.3.12.3.1 VOC and CO emissions of a clinker production plants which exclusively uses
fossil fuels
In case the VOC and CO emissions are only caused from the natural raw materials (limestone, marl, clay, sand) (see Chapter 3.3.1.2) and the raw materials feed is not changed, i.e. no wastes are used as input materials, they only vary within a small range, usually the maximum variation is about ± 20 % (standard deviation of the mean value). Then, there is also no correlation between VOC and CO emissions. This is demonstrated by means of a clinker production plant which does exclusively use fossil fuels but no wastes at all. As such cases do not exist anymore in Germany, the data and figures presented below are from a clinker production plant outside Germany. This plant does not have any
23 However, cases are known where the switch from (conventional) fossil fuels, such as coal, to pet coke was also associated with increased VOC emissions
0
10
20
30
40
50
60
70
80
90
100
01.01.2008 31.12.2008 31.12.2009 31.12.2010
VO
C [m
g C
/Nm
3]
0
50
100
150
200
250
300
VO
C in
[m
g C
/Nm
3]
0,00
10,00
20,00
30,00
40,00
50,00
60,00
01
.01
.20
08
01
.03
.20
08
01
.05
.20
08
01
.07
.20
08
01
.09
.20
08
01
.11
.20
08
01
.01
.20
09
01
.03
.20
09
01
.05
.20
09
01
.07
.20
09
01
.09
.20
09
01
.11
.20
09
01
.01
.20
10
01
.03
.20
10
01
.05
.20
10
01
.07
.20
10
01
.09
.20
10
01
.11
.20
10
VO
C [
mg
C/N
m3]
0,0
10,0
20,0
30,0
40,0
50,0
60,0
70,0
80,0
90,0
VOC
in [m
g C/
Nm
3 ]

Chapter 4
274 State of the art of the co-incineration of waste-derived fuels and raw materials in clinker/cement plants
secondary firing but is exclusively firing fossil fuel (coal) via the main burner. It is equipped with a 4-stage cyclone preheater. By means of a gas measurement probe, positioned in the kiln inlet, the kiln is operated with an oxygen content of 2.5 – 3 vol.-% at as constant a rate as possible. Amongst other parameters, the flue gas at the stack is continuously monitored for VOC and CO. From the indicated daily mean values, weekly mean values were calculated with a reference oxygen content of 10 vol.-% (Figure 4.109).
Figure 4.109: VOC (the lower curve - red) and CO (the upper curve – blue) emission curves (weekly
mean values calculated from daily mean values) of a clinker production plant with a 4-
stage cyclone preheater (outside Germany) which exclusively uses coal as a fuel and no
wastes at all for the main burner and which does not have any secondary firing
[Schönberger/Waltisberg, 2014]
As already indicated above, the VOC and CO emissions do not show a correlation (Figure 4.110). Volatile organic compounds and CO are released from the raw meal in the upper cyclones where it is heated but the variations of the content of the two parameters are small and depend on the variation of organic compounds contained in the natural raw materials.
week
VO
C [
mg
C/N
m3]
CO
[m
g/N
m3]

Chapter 4
State of the art of the co-incineration of waste-derived fuels and raw materials in clinker/cement plants 275
Figure 4.110: No correlation between the VOC and CO emissions (classified daily mean values) of a
clinker production plant with a 4-stage cyclone preheater (outside Germany) which
exclusively uses coal as fuel and no wastes at all fed via the main burner and which does
not have any secondary firing [Schönberger/Waltisberg, 2014]
4.4.3.12.3.2 Examples for the correlation of VOC and CO emissions of a clinker production
plants
In contrast to the above, there is a correlation between VOC and CO emissions as well as elevated levels of VOC and CO for those clinker production plants which use significant amounts of fuels, conventional or waste-derived fuels, for secondary firing (supply to the riser duct or to the precalciner) where incomplete combustion takes place. This means that there are plants which use considerable amounts of waste-derived fuels, or in exceptional cases of conventional fuels, for secondary firing but do have good to optimal combustion conditions (no increase in VOC and CO emissions) whereas there are other plants where elevated VOC and CO emission occur due to “over feeding” (too high input of waste-derived fuels) or due to inadequate combustion conditions such as poor air distribution. In these cases, significant additional VOC and CO emissions are released to the environment which contravenes the aforementioned requirement that no additional emissions may occur as a consequence of waste co-incineration. In the following, examples are presented for elevated VOC and CO emissions. Example 1: In the following example, below a certain CO level (about 2200 mg/m3, which is comparatively high), the VOC emissions are constant and do not depend on the CO emissions. Here, the emission level of organic compounds is slightly below 20 mg C/Nm3 (Figure 4.111). They mainly consist of aliphatic compounds with up to three carbon atoms (see Chapter 3.3.1.2.2). The CO level with constant VOC emissions of 2200 mg/Nm3 depends on the one hand on the feeding point of the fuels and on the other hand on the type of fuels used. Specifically coarse fuels, such as waste tyres, tend to create locally reducing combustion conditions resulting in elevated carbon monoxide emissions. The combustion of the same amount of fuels with a small size distribution is usually associated with much lower CO and VOC emissions.
CO [mg/Nm3]
VO
C [
mg
C/N
m3]

Chapter 4
276 State of the art of the co-incineration of waste-derived fuels and raw materials in clinker/cement plants
Figure 4.111: Correlation between CO and VOC with classified daily mean values from 2008 – 2010 of
the clinker production plant 29 in Annex IV (the corresponding emission curve can be seen
in Figure 4.108 above on the bottom right)
At CO emissions which are above the aforementioned CO level of 2200 mg/Nm3, the VOC emissions significantly increase due to the incomplete combustion of fuels during secondary firing. The composition of the additional VOC emissions significantly differs from the emissions from the raw material and depends on the characteristics of the fuel. Example 2: This clinker production plant uses a variety of different wastes. A part of the waste is fed via the main burner. Another part, here waste tyres, are fed into the kiln inlet. In case the tyres are combusted with sufficient oxygen, the CO emission at the stack is in the range between 100 and 300 mg/Nm3 and the VOC emission is about 15 mg C/Nm3. Both, organic compounds and CO derive from the natural raw materials as the contribution from the tyres is negligible low. However, if the tyre input is too high and the oxygen supply in the kiln inlet insufficient for complete combustion, the VOC and CO emissions increase. This can be clearly seen from Figure 4.112.
Figure 4.112: Correlation between TOC and CO emissions illustrated by means of classified daily mean
values from 2008 – 2010 of the clinker production plant 16 in Annex IV
0
10
20
30
40
50
60
0 1000 2000 3000 4000 5000
VO
C [m
g C
/Nm
3]
CO [mg/Nm3]
secondaryfiring
0
10
20
30
40
0 500 1000 1500 2000
VO
C [
mg
C/N
m3]
CO [mg/Nm3]

Chapter 4
State of the art of the co-incineration of waste-derived fuels and raw materials in clinker/cement plants 277
The Figure 4.112 above is similar to that for Example 1. Example 3: The clinker production plant comprises of a rotary kiln with a cyclone preheater. A precalciner does not seem to exist. In 2008, a chlorine bypass was installed (see plant 6 in Annex IV). Conventional fuels are replaced by waste-derived fuels with a high calorific value by up to 100 %, mainly externally pre-treated waste plastics and packaging waste but also waste tyres and dewatered sewage sludge. The daily mean values for the emissions of VOC vary between 20 and 100 mg C/Nm3 with annual averages between 44 and 55 mg C/Nm3; the standard deviation is in the range of 25 – 30 %. There is a clear correlation between CO and VOC emissions (Figure 4.113 and Figure 4.114). It may be inferred that the VOC values above 40 mg C/Nm3 are associated with incomplete combustion in secondary firing.
Figure 4.113: Correlation between VOC and CO of clinker production plant 6 in Annex IV (correlation
of the available daily mean values for 2008 - 2010)
It is not known to what extend VOC and CO emissions are derived from natural raw materials. However, it can be assumed that less than 1000 mg CO/Nm3and thus less than about 40 mg C/Nm3 are released from this source and the residual fraction derives from the aforementioned incomplete combustion. Thus, this plant also does not comply with the regulation that no additional emission may occur because of waste co-incineration.
Figure 4.114: Correlation between VOC and CO of clinker production plant 6 in Annex IV (showing the
classified daily mean values of Figure 4.113 above)
0,0
20,0
40,0
60,0
80,0
100,0
120,0
0 500 1000 1500 2000 2500 3000
VO
C [
mg
C/N
m3]
CO in [mg/Nm3]
0
10
20
30
40
50
60
70
80
0 500 1000 1500 2000 2500
VO
C [
mg
C/N
m3]
CO [mg/Nm3]

Chapter 4
278 State of the art of the co-incineration of waste-derived fuels and raw materials in clinker/cement plants
Example 4: The plant consists of a rotary kiln with a cyclone preheater. The annual mean values for VOC significantly increased from 34.2 (2008) to 51.2 (2009) and 81.3 mg C/Nm3 (2010). In 2011, the annual mean value was slightly lower (75.1 mg C/Nm3). The emission curve of the daily mean values indicates a drastic increase in the VOC emissions in the second half of 2010. In 2011, they went down but again increased at the end of that year (see the emission curve of plant 8 at the top right in Figure 4.108 and in Annex IV). The subsequent Figure 4.115 shows the correlation of VOC and CO emissions. The VOC emissions vary between 15 and 85 mg C/Nm3 and the CO emissions between 600 and 2900 mg/Nm3. Such large ranges cannot be explained with changes of the raw materials composition. They have their origin from reducing conditions in secondary firing. The increase in VOC and CO indicate the increasing use of waste-derived fuels. As a consequence, the emissions of VOC and CO increase.
Figure 4.115: Correlation between VOC and CO of clinker production plant 8 in Annex IV (correlation
of weekly daily mean values calculated from the daily mean values for 2008 - 2010)
Example 5: The plant consists of a rotary kiln with a preheater and a precalciner. Secondary firing takes place in the precalciner, where a large variety of different wastes such as fuel derived from waste (fluff), plastic waste, waste wood and bark, waste textiles, composite packaging, rubber, paint and varnish waste and waste coating powder are combusted. The following Figure 4.116 shows the result of two measuring periods. In both periods, there is a dependency between CO and VOC emissions. Consequently, the waste gas from the combustion in the precalciner contributes to the VOC and CO emission. However, the correlation in the first measuring period (circles) is stronger as the level of formed volatile organic compounds is higher compared to the second period (squares). This indicates different mixtures of waste-derived fuels associated with different completeness of combustion.
0
10
20
30
40
50
60
70
80
90
0 500 1000 1500 2000 2500 3000
CO [mg/Nm3]
VO
C [
mg
C/N
m3]

Chapter 4
State of the art of the co-incineration of waste-derived fuels and raw materials in clinker/cement plants 279
Figure 4.116: Correlation between VOC and CO of clinker production plant 22 in Annex IV (correlation
of classified daily mean values calculated from the daily mean values for 2008 - 2010)
4.4.3.12.3.3 Latest development of abatement techniques
So far, VOC emissions have not been abated by end-of-pipe-techniques apart from the fact that SCR plants also have a reducing effect on organic compounds in the range of 60 – 70 % (see 4.4.3.4.2.2,b). However, some years ago, the so-called regenerative thermal oxidation (RTO) has been developed for cases where combustion conditions of secondary firing are highly incomplete (e.g. due to too small precalciner and/or, too short residence time and/or too high dosage of waste-derived fuels). Then VOC values of more than 100 mg/Nm3 (with maximum values up to 1000 mg C/Nm3 – see the example described below) were measured [Mauschitz et al., 2018]. At the same time, CO values of several thousands of milligrams occurred [Mauschitz et al., 2018]. This elevated VOC emission level does not comply with European law, as briefly described in Chapter 4.4.3.12.1 and in more detail in Chapter 5, as the use of waste-derived fuels may not be associated with increased emissions of VOC and TOC respectively. In order to tackle such cases, the available RTO technique was adapted to the conditions of clinker production. The scheme concerned is shown in Figure 4.117. The waste gas after efficient de-dusting (it is a prerequisite that the dust content is low, i.e. < 10 mg dust/Nm3 [Philipp, 2013]) is pre-heated in a regenerative heat exchanger (number 4 on the left side, blue colour, of the left part of Figure 4.117), where pre-heating efficiencies between 95 and 98 % are achievable [Svehla/Moser, 2015], and then heated in the combustion chamber to more than 850°C by combusting additional fuel such as natural gas or by combusting organic compounds (VOC) and carbon monoxide (CO), present in the raw waste gas, which are then converted to CO2. At such a high temperature and a sufficiently long residence time, both VOC and CO are practically completely combusted. After combustion, the waste gas is heating the second part of the regenerative heat exchanger (number 4 on the right side, red colour, of the left part of Figure 4.117) and is then emitted to air. Large, pneumatically operated poppet valves are opening and closing in sequence to control the gas flow in and out of the system [Binninger/Schulze, 2016]. The change of the flow direction occurs about every minute.
0
10
20
30
40
50
60
70
80
0 500 1000 1500 2000 2500
VO
C [m
g C
/Nm
3]
CO [mg/Nm3]
26.05.2009 - 12.09.2010
23.10.2010 - 31.12.2010

Chapter 4
280 State of the art of the co-incineration of waste-derived fuels and raw materials in clinker/cement plants
Figure 4.117: Scheme of the combination of regenerative thermal oxidation (RTO) with selective catalytic
reduction (SCR); on the left, the RTO is shown and on the right, there is the cross section
showing the combination of RTO and SCR with the regenerators, the catalyst layer and
the injection of ammonia solution; based on [Mauschitz et al., 2018]
In order to avoid peak concentrations for VOC and CO in the emitted clean gas, usually, an additional heat exchanger is in the flushing mode. Thus, three (or five or even more) heat exchanger are operated in a rolling mode of waste gas pre-heating, clean gas cooling and flushing. The flushing gas is either added to the waste gas or injected into the combustion chamber. This process can be autothermally operated, i.e. without additional fuel, at high CO concentrations of about 5000 – 7000 mg/Nm3 or higher. From the very beginning in 2008, the development of this process was combined with the reduction of NOx by means of SCR (see 4.4.3.4.2.2,a). This combination has been commercialized as DeCONOX process and has been successfully operated at the cement works of Kirchdorfer Zement in Kirchdorf/Austria [Lorber et al., 2015; Mauschitz et al., 2018]. The starting point of this development was a precalciner, retrofitted at the plant in Kirchdorf, which was too small for the quantity of waste-derived fuels fed to it. As a consequence, the combustion was very incomplete and very high concentrations of CO (7000 – 8000 mg/Nm3 with peak values up to 18500 mg/Nm3) and VOC (70 – 400 mg/Nm3 with peak values up to 1000 mg/Nm3) resulted and were emitted to air [Mauritz et al., 2018]. As indicated above, this was not in compliance with European law. In Figure 4.117, on the right, the scheme shows the reaction tower where the regenerator is divided into two layers with the catalyst layer in between. The waste gas enters the lower regenerator layer and is there pre-heated to a temperature of at least 240°C. Then, an ammonia solution is sprayed in to the waste gas prior to the catalyst where a significant percentage of nitrogen oxides is reduced to elemental nitrogen. After a subsequent narrow space, the waste gas passes the upper regenerator to be heated to about 850°C and finally reaches the combustion chamber where the organic compounds and CO are practically completely oxidised to CO2 [Mauschitz et al., 2018]. The removal efficiencies achieved with this RTO/SCR unit between 2016 and 2017, as mean values for the continuously measured parameters NOx, CO and VOC, are as follows [Mauschitz et al., 2018]:
- NOx: 78.5 % (at an average emission concentration of about 150 mg/Nm3) - CO: 99.2 % - VOC: 99.7 %.
As result of three discontinuous measurements, the removal efficiency for PCDD/F was determined as 61.4 %, for PCB as 82.3 %, and for PAH as 96.4 % [Mauschitz et al., 2018]. In the meantime, the DeCONOX technique has been also applied in the following German cement/clinker production plants: Cement works of Schwenk Zement KG in Allmendingen and cement works of Dyckerhoff AG in Geseke (State: October 2019).

Chapter 4
State of the art of the co-incineration of waste-derived fuels and raw materials in clinker/cement plants 281
A combination of RTO and SNCR has been applied for a couple of years at another Austrian cement works [Philipp, 2013]. Also in this case, the development was initiated by high concentrations of VOC and CO emitted to air but also by odour nuisance in the neighbourhood. Since 2001, several techniques for odour nuisance abatement were tested. Finally in 2009, a RTO pilot plant revealed promising removal efficiencies both for CO, VOC and odour. Then in 2011, a RTO with integrated SNCR was commissioned at industrial scale. The removal efficiencies achieved with this RTO/SNCR unit, determined by means of mean values for the continuously measured parameters NOx, CO and VOC, are as follows [Philipp, 2013]:
- NOx: about 40 % (at NOx concentrations of about 350 before and less than 200 mg/Nm3 after RTO/SNCR)
- CO: >95 % (at CO concentrations between 3000 and 10000 and less than 100 mg/Nm3 after RTO/SNCR)
- VOC: >95%.(at VOC concentrations between 500 and 1500 before and less than 20 mg/Nm3 after RTO/SNCR).
The odour is reduced by more than 95 % from >5000 to less 200 OU24. The operation of the RTO/SNSR unit has increased the specific electricity consumption by about 8 kWh/t clinker [Philipp, 2013]. Related to cement production, the increase is about 5.6 %. For NOx abatement by means of SNCR, up to five liters of an ammonia solution (25 %) is required to reduce the NOx emissions down to about 200 mg/Nm3 [Philipp, 2013]. 4.4.3.12.3.4 Conclusions
As indicated above, for about half of the German clinker production plants, also called cement works, no VOC emission limit values are fixed although, since the Waste Incineration Directive had been issued in 2000, the permits concerned should prescribe it. So far, this lack of enforcement is not explainable. Of the approximately 50 % of cement works for which VOC emission limit values were fixed, about 90 % the competent authorities applied the derogation option. This means that emission limit values higher than 10 mg C/Nm3 are fixed [Schönberger/Tebert/Lahl, 2012]. As already explained, the derogation may only be granted if VOC concentrations above 10 mg C/Nm3 stem from natural raw materials. The aforementioned statement of the VDZ that VOC emissions do not originate from combustion cannot be confirmed at all. On the basis of the presented monitoring results, it is obvious that significant percentages of VOC emissions are associated with the co-incineration of wastes. The VOC and CO emission from natural raw materials can be determined by means of the expulsion test (Waltisberg, 1998; Zunzer, 2002). Thus, the emission from the natural raw materials and from secondary combustion can be distinguished. So far, the derogation has not been linked to quantitative evidence. Such evidential proof has been proposed [Lahl et al., 2012; Schönberger et al., 2012]. As a consequence, this evidential proof should be introduced into enforcement practice. Surprisingly, the latest conclusions on best available techniques do not adequately consider the VOC issue associated with the co-incineration of waste-derived fuels [EC BREF CLM, 2013; EC CLM Conclusions, 2013]. There is only the conclusion that “BAT is to avoid feeding raw materials with a high content of VOC into the kiln via the raw material feeding rout” [EC CLM Conclusions, 2013, p 20]. There is no single conclusion on secondary firing in the riser duct or in a precalciner which is a significant gap to be filled in the future revision. The revision will also consider the latest developments of abatement techniques such as RTO/SCR as described above. 4.4.3.13 Carbon monoxide (CO)
4.4.3.13.1 Introduction
In the VOC section above, CO emissions are repeatedly mentioned as they correlate with VOC emissions in many cases. Thus, this CO section is kept shorter as the correlation between VOC and CO will not be explained again. The Waste Incineration Directive (WID) was implemented into German law
24 OU is the European standard odour unit for quantifying odours. It is standardized in EN 13725:2003-07.

Chapter 4
282 State of the art of the co-incineration of waste-derived fuels and raw materials in clinker/cement plants
in 2003 [DE 17th BImSchV, 2003]. In principle, the CO emission limit value, expressed as a daily mean value, is 50 mg/Nm3 [DE 17th BImSchV, 2013, paragr. 8(1)]; however, the competent authority can derogate from this value. This derogation was introduced in 2003 when implementing the WID (see [DE 17th BImSchV-draft, 2002; DE 17th BImSchV-Committees, 2003; DE 17th BImSchV-Federal Council, 2003]). It can be granted under the same condition as for VOC: ”Upon application by the operator, the competent authority may grant derogations for carbon monoxide provided that such derogations are necessary on account of the composition of natural raw materials and the release of additional carbon monoxide emissions from the use of waste or substances pursuant to Art. 1 para (1) can be ruled out” (see clause 2.4.2 of Annex 3 of the 17th Ordinance on Waste Incineration and Co-Incineration - 17. BImSchV [DE 17th BImSchV, 2013]. Surprisingly, in 2010/2011, two thirds of the clinker production plants did not have a CO emission limit value. The reasons for this significant enforcement deficit remain unclear. As already indicated in the VOC section, the Verein Deutscher Zementwerke e.V. (VDZ) stated in its annually published “Environmental Data of the German Cement Industry”19 from 1999 – 2012 the following: “The exhaust gas concentrations of CO and organically bound carbon are a yardstick for the burn-out rate of the fuels utilised in energy conversion plants, such as power stations. By contrast, the clinker burning process is a material conversion process that must always be operated with excess air for reasons of clinker quality. In concert with long residence times in the high-temperature range, this leads to complete fuel burn-up. The occurring emissions of carbon monoxide and total carbon do not result from combustion, but from the thermal decomposition of organic compounds of the raw material in the preheater. The emissions of CO and organically bound carbon during the clinker burning process are caused by the small quantities of organic constituents input via the natural raw materials (remnants of organisms and plants incorporated in the rock in the course of geological history). These are converted during kiln feed preheating and become oxidised to form CO and CO2. In this process, small portions of organic trace gases (total organic carbon) are formed as well. In case of the clinker burning process, the content of CO and organic trace gases in the clean gas therefore does not permit any conclusions on combustion conditions” [VDZ, 1999 … VDZ, 2012]. However, this statement is only valid for the main burner but not for the secondary firing, i.e. the combustion in the riser duct or in the precalciner. This may be the reason why VDZ deleted the underlined part of the aforementioned citation in the “Environmental Data of the German Cement Industry for the years 2013 – 2018 [VDZ, 2014 … VDZ, 2019]. The technical background for the conclusion that the aforementioned statement and justification of the derogation are not fully correct will be submitted in the following evaluation of emission data based on the basic information on the emission of CO in Chapter 3.3.1.2. Before doing so, reference is given to Table 4-38 providing the emission limit values of the 34 German cement works. Its evaluation with respect to TOC reveals the following about cement plants
- about two third of the cement works do not have a CO emission limit value, which is not in
conformity with German regulations,
- the few CO emission limit values, prescribed by the competent authorities, vary within a huge
range (two orders of magnitude) from 50 to 6250 mg/Nm3. Only two plants have to meet the
CO emission limit value laid down in paragraph 8(1) of the ordinance concerned (DE 17th
BImSchV, 2013). In using the derogation, most of the fixed CO emission limit values were
between 1000 and 3000 mg/Nm3 (Table 4-38). In one extreme case, the CO emission limit
value is 6250 mg/Nm3.
The regulation prescribes [DE 17th BImSchV, 2013] that the emissions to air shall not increase as a consequence of using wastes. Thus, only CO emissions which derive from natural raw materials are permitted. However, in the VOC chapter above, it is already demonstrated that both significant VOC and CO emissions are associated with waste co-incineration in secondary firing. For CO also, no test method is used to determine the percentage of CO release from natural raw materials although such tests are available, specifically the so-called expulsion test [Waltisberg, 1998; Zunzer, 2002].

Chapter 4
State of the art of the co-incineration of waste-derived fuels and raw materials in clinker/cement plants 283
4.4.3.13.2 Evaluation of available data monitored at German clinker production plants published by VDZ
As for VOC, the CO emission data available from continuous monitoring is compared with the results of spot measurements which are annually published by VDZ19 in order so see whether the results are directly comparable. For this purpose, the data for the time period 2008 – 2010 are compared. From continuous monitoring, the annual mean values as well as the minimum and maximum values are compared with VDZ mean values (Table 4.53).
Table 4.53: Calculated CO annual mean values from continuous monitoring from 2008 – 2010 in
comparison with the VDZ mean values from spot measurements in the same period
CO emission [mg/Nm3]
2008 2009 2010
Number of kilns 20 20 20
Annual mean value 1071 895 965
VDZ mean value 955 1175 1044
Maximum value 3341 2522 3344
Minimum value 117 158 161
At first approximation, the annual mean values from continuous monitoring are comparable with the mean values of the spot measurement. However, it is conspicuous that there are high maximum values which cannot be explained by the release of CO from natural raw materials. In addition, the results from continuous monitoring are classified into 11 groups, demonstrating that most of the clinker production plants (about two thirds) have CO emission levels below 1000 mg/Nm3. But 16 % of the plants, for which CO emission data are available, have elevated or even very high CO emission levels (Figure 4.118).
Figure 4.118: Frequency distribution of the daily mean values derived from continuous CO monitoring
at German clinker production plants in the time period 2008 - 2010
4.4.3.13.3 Evaluation of the emission data from continuous CO monitoring at German
clinker production plants
Some of the clinker production plants continuously monitor CO although they do not have an emission limit value. Thus, only one third of the plants have to meet a CO emission limit value but at 20 out of the existing 40 kilns, CO was continuously monitored. First, the data of clinker production plants with a low and stable low CO emission level is presented. For this purpose, four 3-year CO emission curves
CO [mg/Nm3]
Pe
rce
nta
geo
fd
aily
me
anva
lues

Chapter 4
284 State of the art of the co-incineration of waste-derived fuels and raw materials in clinker/cement plants
with a CO level of lower than usually 500 (two plants) and 800 mg/Nm3 (two plants) are compiled in Figure 4.119.
Figure 4.119: 3-year CO emission curves from four clinker production sites showing very low CO
emission levels at the top left and right (clinker production sites 3 and 27 in Annex IV) or
low CO emission levels on the bottom left and right (clinker production sites 31 and 33 in
Annex IV)
The emission curves on the top left and right show very low CO emission levels. At these levels, CO mainly originates from the organic compounds present in the raw meal. The impact of the secondary firing (riser duct or precalciner) is negligible. The reason why the CO emission levels in the curve on the top right increase in 2010 is not known. It could be associated with the co-incineration of waste-derived fuels. The fluctuations of the emission curves on the bottom left and right are bigger compared to those at the top left and right; they indicate that the operating conditions are not very stable and that part of the CO emissions originate from the co-incineration of waste-derived fuels. Figure 4.120 submits three curves where both the CO emission level and the fluctuations are higher (500 – 2000 mg/Nm3).
0
100
200
300
400
500
600
700
800
CO
[m
g/N
m3]
0
200
400
600
800
1000
1200
1400
1600
01.01.2008 31.12.2008 31.12.2009 31.12.2010
CO
[m
g/N
m3]
0
200
400
600
800
1000
1200
1400
01.01.2008 31.12.2008 31.12.2009 31.12.2010
CO
[m
g/N
m3]

Chapter 4
State of the art of the co-incineration of waste-derived fuels and raw materials in clinker/cement plants 285
Figure 4.120: 3-year CO emission curves from three clinker production sites showing CO emission levels
between 500 and 2000 mg/Nm3 (clinker production sites 4 (at the top left), 6 (at the top
right) and 10 (on the bottom) in Annex IV)
In the graph at the top left, the CO emission values are comparatively high; in 2010, the annual mean value was almost 1500 mg/Nm3. It can be assumed that probably less than half of the emitted CO is released from the natural raw materials and the other half originates from secondary firing. The same seems to be true for the graph on the top right. In the graph on the bottom, the fluctuations are also high and, at least, the CO values above 1000 mg/Nm3 may derive from the co-incineration of waste-derived fuels. The curves at the top left and right show large gaps indicating an insufficient availability of the CO monitor. In the following Figure 4.121, the CO emission levels are very high.
Figure 4.121: 3-year CO emission curves from two clinker production sites showing high CO emission
levels between 1000 and 5000 mg/Nm3 (graph on the left - clinker production sites 7 in
Annex IV) and between 500 and 3500 mg/Nm3 (graph on the right – clinker production
site 8 in Annex IV)
0
500
1000
1500
2000
2500
3000
CO
in [
mg/
Nm
3]
0
500
1000
1500
2000
2500
3000
CO
[m
g/N
m3]
0
500
1000
1500
2000
2500
01.0
1.2
008
01.0
3.2
008
01.0
5.2
008
01.0
7.2
008
01.0
9.2
008
01.1
1.2
008
01.0
1.2
009
01.0
3.2
009
01.0
5.2
009
01.0
7.2
009
01.0
9.2
009
01.1
1.2
009
01.0
1.2
010
01.0
3.2
010
01.0
5.2
010
01.0
7.2
010
01.0
9.2
010
01.1
1.2
010
CO
in [
mg
/Nm
3]
0
1000
2000
3000
4000
5000
6000
7000
8000
9000
CO
in [
mg/
Nm
3]
0
500
1000
1500
2000
2500
3000
3500
4000
CO
[m
g/N
m3]

Chapter 4
286 State of the art of the co-incineration of waste-derived fuels and raw materials in clinker/cement plants
Concerning the two graphs above, it is not known how much CO was released from the raw material. This part cannot be avoided or reduced. However, it can be assumed that this part is, at least, less than 1000 mg/Nm3. Consequently, the source of the considerable residual part is incomplete combustion during secondary firing in the riser duct or, if available, in the precalciner. For the graph on the left, according to the CO emission curve, almost all daily mean values are above 1000 mg/Nm3. The annual mean values are between 2500 and 3350 mg/Nm3. This means that the part of the CO emission from incomplete combustion of waste-derived fuels in secondary firing is significant. The same is true for the emission curve on the right. Expressed as annual mean values, the CO emission increased from 1301 mg/Nm3 in 2008 to 1983 and 2240 mg/Nm3 in 2009 and 2010. Also in this case, the CO emissions from incomplete combustion of waste-derived fuels in secondary firing are significant. The following four CO emission curves show cases with a significant decrease in CO emissions (Figure 4.122).
Figure 4.122: 3-year CO emission curves from four clinker production sites showing a significant
decrease in CO emission levels (see clinker production sites 5 (at the top left), 9 (at the top
right), 15 (on the bottom left) and 29 (on the bottom right) in Annex IV)
The graph at the top left shows a significant decrease in CO emissions in the beginning of 2009. There is also along gap in CO measurements. Obviously, there was a technical improvement of the conditions of secondary firing. The CO annual mean values decreased from 2626 mg/Nm3 in 2008 to 827 mg/Nm3 in 2009 and to 534 mg/Nm3 in 2010. This example demonstrates that the combustion conditions can be significantly improved in secondary firing with the consequence of much lower CO and VOC emissions. The technical possibilities for reducing the release of CO from natural raw materials are very limited but the combustion conditions in secondary firing can be optimised. The graph at the top right shows a continuous reduction of CO emissions. The annual mean value in 2008 was 961.6 mg/Nm3, in 2009 853.3 mg/Nm3 and, after a drastic decrease, 435.8 mg/Nm3 in 2010. This example visualizes that a reduction from a comparatively lower level is still possible. The graph on the bottom left is an example showing a reduction of CO emissions after 2008. The annual mean value was reduced from 2352 mg/Nm3 in 2008 to 1454 mg/Nm3 in 2009. However, the CO emission level remained at a high level indicating that the combustion conditions of waste-derived fuels, especially of fluff, in secondary firing are still non-optimal. The graph on the bottom right presents an extreme example where the
CO
[m
g/N
m3]
0,00
1.000,00
2.000,00
3.000,00
4.000,00
5.000,00
6.000,00
01
.01
.20
08
01
.02
.20
08
01
.03
.20
08
01
.04
.20
08
01
.05
.20
08
01
.06
.20
08
01
.07
.20
08
01
.08
.20
08
01
.09
.20
08
01
.10
.20
08
01
.11
.20
08
01
.12
.20
08
01
.01
.20
09
01
.02
.20
09
01
.03
.20
09
01
.04
.20
09
01
.05
.20
09
01
.06
.20
09
01
.07
.20
09
01
.08
.20
09
01
.09
.20
09
01
.10
.20
09
01
.11
.20
09
01
.12
.20
09
01
.01
.20
10
01
.02
.20
10
01
.03
.20
10
01
.04
.20
10
01
.05
.20
10
01
.06
.20
10
01
.07
.20
10
01
.08
.20
10
01
.09
.20
10
01
.10
.20
10
01
.11
.20
10
01
.12
.20
10
0
500
1000
1500
2000
2500
CO
[m
g/N
m3]
0
500
1000
1500
2000
2500
3000
3500
4000
4500
CO
in [m
g/N
m3]
0
1000
2000
3000
4000
5000
6000
CO
[m
g/N
m3]

Chapter 4
State of the art of the co-incineration of waste-derived fuels and raw materials in clinker/cement plants 287
very high CO emissions were reduced from 3341 mg/Nm3 (annual mean value in 2008) to 2256 mg/Nm3 (annual mean value in 2009) but remained at a very high level. This plant obviously practiced stage combustion for NOx reduction which is demonstrated in Figure 4.58. This is associated with significantly higher VOC and CO emissions. 4.4.3.13.4 Latest development of abatement techniques
The latest development of abatement techniques is described in Chapter 4.4.3.12.3.3 for VOC. These techniques can also be applied for CO. Thus, reference is given to the aforementioned chapter. 4.4.3.13.5 Conclusions
As indicated above, only about one third of German clinker production plants, also called cement works, have to meet a CO emission limit value although, since the Waste Incineration Directive had been issued in 2000, the permits concerned should prescribe it. So far, this lack of enforcement is not explainable. Out of the 12 cement works for which CO emission limit values were established, for 10 plants the competent authorities applied the derogation option. This means that CO emission limit values higher than 50 mg/Nm3 are fixed [Schönberger/Tebert/Lahl, 2012]. As already explained, the derogation may only be granted if CO concentrations above 50 mg/Nm3 stem from natural raw materials. The aforementioned statement of the VDZ that CO emissions do not originate from combustion cannot be confirmed at all. On the basis of the presented monitoring results, it is obvious that significant percentages of CO emissions are associated with the co-incineration of wastes. The VOC and CO emission from natural raw materials can be determined by means of the expulsion test [Waltisberg, 1998; Zunzer, 2002]. Thus, the emission from the natural raw materials and from secondary combustion can be distinguished. As already indicated in the VOC chapter above, so far, the derogation has not been linked to quantitative evidence. Such evidential proof has been proposed (Lahl et al., 2012; Schönberger et al., 2012). As a consequence, this evidential proof should be introduced into enforcement practice. Surprisingly, the latest conclusions on best available techniques do not adequately consider the CO issue associated with the co-incineration of wastes [BREF CLM, 2013; EC CLM Conclusions, 2013]. There is only a conclusion on the minimisation of CO strips in case of application of electrostatic precipitators for de-dusting [EC CLM Conclusions, 2013, p 20]. The revision will also consider the latest developments of abatement techniques such as RTO/SCR as described in Chapter 4.4.3.12.3.3. 4.4.3.14 Benzene, toluene, ethylbenzene and xylenes (BTEX)
4.4.3.14.1 Introduction
BTEX are aromatic organic compounds. They are part of the parameter VOC, i.e. when measuring the parameter VOC, BTEX are part of it. Due to their environmental relevance, BTEX are also specifically determined as individual compounds by a dedicated method [DIN CEN/TS 13649, 2015]. As benzene is a carcinogenic compound, it is of particular concern and therefore, its emission to air should be minimised as far as possible. However, very little information is provided in the best available techniques reference document [EC BREF CLM, 2013] and no conclusions on benzene and the other aromatic hydrocarbons (toluene, ethylbenzene and xylenes) were drawn [EC CLM Conclusions, 2013]. In Chapter 3.2.1.2, it is explained in detail that VOC and CO are released from heating natural raw materials, fed in the form of the so-called raw meal, in the preheater (see Chapter 3.2.3). There is a reliable method available, the expulsion test, for quantifying the release of VOC and CO from natural raw materials but also from waste-derived raw materials and fuels (Chapter 3.3.1.2.2). The same is true for BTEX which are also released from natural raw materials but also from waste-derived raw materials (Table 3.9 and Table 3.10 in Chapter 3.3.1.2.5). As a rule of thumb, BTEX usually account for about 10 % of VOC and benzene for more than half of the BTEX emission [VDZ, 2001 … VDZ, 2016]. In Chapter 4.4.3.11, the correlation between VOC and CO emissions are explained in detail. As benzene also correlates with VOC and with BTEX as well, it is expected that elevated VOC emissions that

Chapter 4
288 State of the art of the co-incineration of waste-derived fuels and raw materials in clinker/cement plants
originate from the co-incineration of waste-derived materials are associated with higher BTEX emissions. This conclusion is also expressed in the evaluation of the emission data of clinker production plants 16 and 29 in Annex IV. 4.4.3.14.2 Evaluation of available data monitored at German clinker production plants
In Germany, BTEX are not continuously monitored but are checked by spot measurements by certified third party measurement institutes. The results are annually published as “Environmental Data of the German Cement Industry” by Verein Deutscher Zementwerke e.V. (VDZ)20. In the following, the results are evaluated for the time period 2005 – 2015. As correlations between VOC and BTEX are possible, the VOC values are also presented. The number of kilns and spot measurements for the time period 2005 – 2015 as well as the average, median and the three maximum vales for the different years are compiled in Table 1. The maximum values of BTEX were in 2009 and 2010 but for benzene in 2006 and 2009, although they should coincide. For benzene, the annual mean values were significantly lower from 2012 – 2015, but this is not the case for BTEX. There are some unreasonable ratios of BTEX and benzene, especially in 2006 and 2007. In 2006 the maximum BTEX value is 4.3 mg/Nm3 and the benzene value is 15.5 mg/Nm3 and in 2007 the maximum BTEX value is 4.2 mg/Nm3 and the maximum benzene value is 13.0 mg/Nm3 (Table 4.54); this is unreasonable as the value for benzene should be lower than for BTEX.
Table 4.54: Spot measurements at German clinker production plants in the time period 2005 – 2015
for the parameters VOC and BTEX – number of kilns and spot measurements, average
(mean) and median values and the three maximum values for BTEX and benzene –
derived/calculated from [VDZ, 2006 … VDZ, 2016].
First, the annual median and average (mean) values for VOC are presented (Figure 4.123). With these annual mean values, it is not possible to see correlations between VOC and BTEX, specifically for benzene. For VOC, there is also no clear trend visible which is the case for individual plants (see Chapter 4.4.3.11).
Year
VOC BTEX Benzene average median average median 3 max.-values average median 3 max.-values
2005 20 / 67 13 / 27 19 / 54 24.46 18.32 2.13 1.60 6.2/5.6/3.9 1.72 1.08 6.7/4.9/4.5
2006 26 / 82 9 / 21 22 / 69 23.61 19.40 1.95 1.72 4.3/3.8/3.8 2.29 1.07 15.5/12.2/10.4
2007 30 / 76 12 / 21 28 / 69 27.22 17.20 2.13 2.02 4.2/3.9/3.7 1.76 1.17 13.0/8.2/5.8
2008 39 / 73 9 / 19 27 / 81 26.99 18.58 2.01 2.36 4.0/3.7/3.1 1.92 1.28 5.7/7.2/7.0
2009 34 / 65 9 / 28 28 / 78 22.63 14.22 2.87 2.50 15.3/6.5/6.0 1.79 1.21 13.2/8.3/7.5
2010 32 / 66 9 / 33 26 / 79 24.45 17.95 4.58 4.33 9.9/9.3/8.2 1.96 1.41 8.5/8.2/6.2
2011 29 / 50 6 / 16 24 / 78 24.22 20.22 2.96 2.87 6.6/3.6/3.5 1.75 1.18 5.8/5.4/5.2
2012 34 / 75 10 / 38 25 / 89 22.76 21.32 2.67 2.59 5.3/5.1/4.2 1.32 0.83 4.6/4.5/4.2
2013 32 / 60 11 / 42 26 / 98 20.78 20.86 2.06 2.31 3.6/3.3/3.3 1.12 1.04 3.7/3.4/3.4
2014 33 / 57 11 / 40 27 / 85 17.84 18.66 2.99 2.93 6.3/6.2/5.8 1.50 1.10 3.6/3.4/3.4
2015 33 / 54 6 / 16 26 / 94 21.94 12.30 2.86 2.62 7.2/4.5/3.8 1.13 0.85 4.5/3.9/2.9
2005 - 2015 23.54 18.27 2.68 2.56 1.62 1.17
number of kilns /
number of measurementsVOC [mg C/Nm3] Benzene [mg/Nm3]BTEX [mg/Nm3]

Chapter 4
State of the art of the co-incineration of waste-derived fuels and raw materials in clinker/cement plants 289
Figure 4.123: Annual average (mean) and median values for VOC spot measurements from 2005 – 2015
at German clinker production plants; data derived from [VDZ, 2006 … VDZ, 2016]
Looking at the BTEX annual mean values between 2005 and 2015, the elevated mean value in 2010 is eye-catching (Figure 4.124). This peak value cannot be explained with the available information. Obviously, the kilns measured may have an elevated emission level. In addition, the emission level from 2005-2009 is lower compared to 2011-2015. This may be associated with the co-incineration of waste-derived materials and fuels. Although there is no evidence to support this assertion, the assumption is reasonable against the background of findings with respect to VOC and CO emissions (see Chapter 4.4.3.11 and Chapter 4.4.3.12).
Figure 4.124: Annual average (mean) and median values for BTEX spot measurements from 2005 – 2015
at German clinker production plants; data derived from [VDZ, 2006 … VDZ, 2016]
Although there is a dependency of BTEX and benzene emissions, the annual mean values for benzene look different compared to those for BTEX (Figure 4.125). The annual median value for the year 2010 is also the highest, but not nearly as significant as for BTEX. It also seems that the values of the past years (2012 – 2015) are lower compared to the values before that time period but there is no statistical evidence.
VO
C [
mg
C/N
m3]
average
median
BTE
X [
mg
/Nm
3]
averagemedian

Chapter 4
290 State of the art of the co-incineration of waste-derived fuels and raw materials in clinker/cement plants
Figure 4.125: Annual average (mean) and median values for benzene spot measurements from 2005 –
2015 at German clinker production plants; data derived from [VDZ, 2006 … VDZ, 2016]
For the whole time period 2005 – 2015, the BTEX percentage of the volatile organic compounds (VOC) is 10.6 % (Table 4.55), and the benzene percentage of BTEX is 59.6 % (Table 4.55) which is in line with the aforementioned quotation in the “Environmental Data of the German Cement Industry” by Verein Deutscher Zementwerke e.V. (VDZ)20 (“BTEX account for about 10 % of total organic carbon”; the parameter “Total organic carbon” is equal to VOC”, and “Benzene accounts for more than half of the BTEX emissions”. This comes as no surprise as the VDZ statements refer to the same data considered here.
Table 4.55: Average of the annual mean values for VOC, BTEX and benzene for 2005 – 2015 and the
percentage of BTEX and benzene of VOC
The dependency between the BTEX and benzene emissions is there but the correlation is not fully evident (Figure 4.126).
BTE
X [
mg
/Nm
3]
average
median
Be
nze
ne
[mg
/Nm
3]
Percentage of
VOC
Percentage of
BTEX
[mg/Nm3] [mg C/Nm3] [%] [%]
VOC 23.54
BTEX 2.70 2.49 10.6
Benzene 1.61 1.49 6.3 59.6
Average of the annual mean
values from 2005 - 2015

Chapter 4
State of the art of the co-incineration of waste-derived fuels and raw materials in clinker/cement plants 291
Figure 4.126: Dependency between the annual mean values for BTEX and benzene emissions from 2005
- 2015
4.4.3.14.3 Conclusions
From the environmental point of view, it is important to measure BTEX emissions. Specifically, carcinogenic benzene has to be taken into consideration and should be measured and minimised. In cases where the TOC and CO emissions are elevated due to the co-incineration of waste-derived raw materials and fuels, the BTEX emissions will be also higher, specifically for the carcinogenic benzene. As a consequence, the co-incineration of waste-derived raw materials and fuels has to be carried out in a way that practically no additional emissions, here of VOC, CO and BTEX, take place. “Practically no additional emissions” means that the emissions are not higher than 10 % compared to the VOC, CO and benzene emissions determined by means of the expulsion test. 4.4.3.15 Hexachlorbenzene (HCB)
4.4.3.15.1 Introduction
HCB is a persistent organic pollutant (POP) belonging to the first twelve POPs, the so-called “Dirty Dozen”, which have been regulated by the Stockholm Convention on POPs [SC, 2001]. HCB is listed in Annex A of the Stockholm Convention as an industrial POP used formerly as a pesticide and is listed in Annex C as an unintentional POP formed in thermal processes and in particular in the production of organochlorine chemicals where it has been unintentionally generated in large amounts up to the scale of 10,000 tonnes for single factories [Lysychenko et al. 2015; Mumma and Lawless 1975; Weber et al. 2011]. Most of the residues containing HCB were deposited. HCB has a low acute toxicity but considerable chronic toxicity, such being toxic for reproduction, and is classified as a probable human carcinogen [Zitko, 2003]. In addition, it is highly bioaccumulative [Rippen, 1994]. Due to its persistence and vapour pressure (1.1 x 10⁻³ Pa at 20°C, 2.5 x 10⁻³ Pa at 25°C and 8.43 x 10⁻³ Pa at 35°C [Farmer et al., 1980; Rippen, 1994]), HCB is mobile in the environment and thus became an ubiquitous pollutant [Fiedler et al., 1995]. In Germany, the emissions to air from clinker production plants are normally not monitored for HCB. The same is true for other countries. 4.4.3.15.2 Available data on HCB emissions
Ther are not many data available. The few identified figures data are compiled in Table 4.56.
0,00
0,50
1,00
1,50
2,00
2,50
3,00
3,50
4,00
4,50
5,00
0 0,2 0,4 0,6 0,8 1 1,2 1,4 1,6
Benzene [mg(Nm3]
BTE
X [
mg
/Nm
3]

Chapter 4
292 State of the art of the co-incineration of waste-derived fuels and raw materials in clinker/cement plants
Table 4.56: Available data for HCB emissions to air from clinker production plants
For combustion processes, often a dependency between HCB and PCDD/F emissions have been observed. An example is provided in Figure 4.127. The data used for this graph also stem from clinker production plants. In this case, the interdependency is only there for PCDD/F concentrations higher than 0.1 ng I-TEQ/Nm3.
Figure 4.127: Interdependence between PCDDs/Fs and HCB in exhaust samples with PCDDs/Fs content
above 0.1 ng I-TEQ/Nm3 [Wegiel et al., 2011]
4.4.3.15.3 The “Görtschitztal” case
The HCB emission level is usually low but there are exceptions of high emissions. As a learning exercise, one case of high HCB emissions from a clinker production plant is described in the following. The case concerns the w&p Zement GmbH with its cement production site in A-9373 Wietersdorf / Klein St. Paul in the valley Görtschitztal in the federal state of Carinthia in Austria. There, residues from an old dumping site (contaminated site) of Donauchemie in Brückl, located in the lower part of the valley Görtschitztal, were transported to the clinker production plant in Wietersdorf. This residue is called ‘carbide lime’ which resulted from the acetylene production process. However, the carbide lime from Brückl is highly contaminated with HCB as an
Reference Emission factor
Concentration calculated
from emission factor with
2100 Nm3/t clinker
Measured emission
concentration
[mg/t clinker] [ng/Nm3] [ng/Nm3]
[Bailey, 2001] 0.17*1 81
[Andrijewski, 2004]*2 0.021*3 10
[Karstensen, 2006] 0.9 - 4*4
[Wegiel et al., 2011] 0.98 - 60.5*5
[Danish EPA, 2013] 0.011*3,65.2
*1 Just this average value is reported without presenting any detailed measured values. It is assumed that the
low emission factor is one order of magnitude lower and the high emission factor is one order of magnitude higher
*2 Reported by [Danish EPA, 2013]
*3 The figure refers to 1 tonne of cement; this could be understood to be equal to 1 tonne of clinker but this is not sure
*4 The range represents eight measured values from the time period 1997 and 2002, the average value is 1.8 mg HCB/Nm 3
*5 The range represents 27 measured values from three clinker production plants; the average value is 10 ng/Nm 3
*6 The emission factor is taken from a document of the European Environment Agency (EEA) which is not properly cited
in [Danish EPA, 2013]

Chapter 4
State of the art of the co-incineration of waste-derived fuels and raw materials in clinker/cement plants 293
unintentionally formed by-product from organochlorine solvent production that is known as “HCB waste” [Lysychenko et al 2015; Weber et al 2011]. From June 2012 to October 2014, about 100,000 tonnes were processed in the Wietersdorf clinker production plant. It had been estimated that this mass contained 430 – 750 kg HCB (in the worst case up to 1000 kg HCB) [Land Kärnten, 2014; Land Kärnten, 2015]. It was foreseen that the highly contaminated carbide lime is fed to the kiln inlet at temperatures between 850 and 1100°C by means of a chute [Funk et al., 2015]. However, about 95 % of the carbide lime was fed via the raw material route (see Chapter 4.3.3.1) [Land Kärnten, 2014; Land Kärnten, 2015]. At 1013 Pa, the boiling point of HCB is 332°C [Rippen, 1994]. Thus, with respect to the conditions of a clinker production plant, HCB is a volatile compound as defined in Chapter 3.2.4.2.2. At the plant in Wietersdorf, the filter dust from the fabric dust filter was not shuttled but returned to the raw meal silo in a quantity of 5 – 7 t/h (Land Kärnten, 2015). As a consequence, it will form an external cycle between the upper cyclone of the preheater and the fabric filter. This means that most of the HCB will have been evaporated in the upper cyclone at 360 – 400 °C [Land Kärnten, 2015] and will be mostly removed in the fabric filter by condensation and adsorption and, via the raw meal silo, will have been returned to the preheater. Thus, a significant enrichment will have been taken place. The HCB content of the raw meal was not published. It is also not stated whether the emissions were measured during direct or compound operating mode (see Chapter 3.3.3). It was assumed that about 30 – 50 % of the HCB input was finally emitted to the environment. However, as the filter dust was completely returned to the raw meal, this percentage could be even higher as there is no other way of output than the emission to air via the fabric filter. In the latter, HCB cannot and was not completely removed by adsorption to the filter dust. This is confirmed by HCB measurements of ambient air in Görtschitztal [Land Kärnten, 2015] and available literature which revealed that HCB is adsorbed to particulates to a low extent only (e.g. [Kaupp/Umlauf, 1992; Popp et al. 2000]). The results of two published spot monitoring actions are compiled in Table 4.57. The emission concentrations are very high. They are about 100 to 1000 times higher than the emission concentrations in Table 4.56 above. It was not documented whether the emission concentrations were measured during direct or compound operating mode (see Chapter 3.3.3). It is not known whether the HCB emission concentration is significantly higher in case of the direct operating mode; probably, the very high emission concentration on 14.11.2014 was determined during the direct operating mode.
Table 4.57: Two HCB spot monitoring actions at the clinker production plant of w&p Zement GmbH
in 9373 Wietersdorf / Klein St. Paul in the valley Görtschitztal in 2014 [Land Kärnten,
2014; Land Kärnten, 2015]
The significant release of HCB to the environment in the order of several 100 kg resulted in a severe contamination of the food chain, including the citizens, in the valley Görtschitztal, and existing limit values in food were exceeded in many cases. Also, the HCB blood levels of citizens were elevated. This “HCB Scandal” was publicly discussed and documented (e.g. [ORF, 2017]). A lot of measures and efforts
HCB measurements Commentunit 18.10.2014 14.11.2014
Value without feeding of carbide lime [ng HCB/Nm3] at 10 % O2 2880
Feeding of carbide lime to the kiln inlet [ng HCB/Nm3] at 10 % O2 3550
Feeding of carbide lime to the kiln inlet [ng HCB/Nm3] at 10 % O2 82000Value confirmed but
not explainable
Feeding of carbide lime to the mixing
chamber[ng HCB/Nm3] at 10 % O2 3720 18300
Feeding of carbide lime to the raw
meal[ng HCB/Nm3] at 10 % O2 8080 7070
HCB content of carbide lime [µg HCB/kg] 321 - 779 18700 - 24600
Date of monitoring

Chapter 4
294 State of the art of the co-incineration of waste-derived fuels and raw materials in clinker/cement plants
were taken to manage the HCB contamination of the valley Görtschitztal. This resulted in a significant decrease in HCB contamination within one year (Figure 4.128).
Figure 4.128: HCB in the cycle “soil-plant-fodder-animal-farmyard manure-product” in the valley
Görtschitztal from 2014 to 2015 [Gasteiner et al., 2016]
4.4.3.15.4 Conclusions
Concerning the HCB case in the valley Görtschitztal, the conclusion is that the carbide lime should have been investigated by means of the expulsion test in order to quantify the release of the volatile HCB. However, even without this testing, for experts, it was obvious that the raw material route is a totally inappropriate feeding point. In the permitting process, the feeding point was considered and determined [Funk et al., 2015] but it seems that inspection and enforcement was poor. In general, when using waste-derived raw materials, the raw material route is only possible if no organic compounds (“no” means below an established limit value), especially of hazardous compounds like HCB, are present which can be volatilised. The expulsion test can be used to determine and to quantify the release of organic compounds (see Chapter 3.3.1.2.2). 4.4.3.16 Polychlorinated dibenzo-p-dioxins and furans (PCDD/F)
4.4.3.16.1 Introduction
The 75 PCDD and 135 PCDF congeners are environmental contaminants detectable in almost all compartments of global ecosystems in trace amounts. In contrast to other organochlorine pollutants of environmental concern such as hexachlorobenzene (HCB) and polychlorinated biphenyls (PCB) or others, PCDD/PCDF (PCDD/F) were never produced intentionally and do not serve any useful purpose. They are formed as by-products of numerous industrial activities and all combustion processes [Fiedler, 2003]. Many of the PCDD/F congeners have been associated with a number of adverse effects in humans, including immune and enzyme disorders and chloracne, and they are classified as possible human carcinogens. PCDD/F are persistent in the environment and accumulate in animal fat. Excluding occupational or accidental exposure, most human exposure to PCDD/F occurs as a result of dietary intake, mainly by eating meat, milk, eggs, fish, and related products [Fiedler, 2003]. Clinker production with its thermal processes is also a source of PCDD/F. Generally, PCDD/F emissions from the dry process (kilns with suspension preheaters – see Chapter 3.2.3) are of minor relevance [Quaß/Fermann, 1997, Karstensen, 2008; EC BREF CLM, 2013]. However, there have been single cases
Meat Milk
Fodder
Animal
Soil
Plant
Farmyard manure
2014/15: >10 µg/kg milk (4 % fat)
2015/16: <1 µg/kg milk (4 % fat)
2014/15: >30 µg/kg d.m.
2015/16: <10 µg/kg d.m.
2014/15: >10 µg/kg d.m. (88 %)2015/16: <2 µg/kg d.m. (88 %)

Chapter 4
State of the art of the co-incineration of waste-derived fuels and raw materials in clinker/cement plants 295
of elevated and partly high PCDD/F emission levels. As a consequence, the presentation of emission data will be kept short. In the European Union, when co-incinerating waste in a cement kiln, the emission limit value of 0.1 ng/Nm3 25 has to be met [EU IED, 2010, Annex VI, part 4, point 2]. In contrast to dry process kilns with suspension preheaters, the flow of gas and solids is co-current in wet, semi-wet and semi-dry kiln with the consequence of different chemical reactions. As a consequence, PCDD/F emissions from these old technologies can be significantly higher compared to the kilns with suspension preheaters where the gas and solid streams are counter-current (Figure 4.129). However, most of these old kiln types have been closed down; therefore, they are not considered here where the focus is on dry process kilns with suspension preheaters as they are most important.
Figure 4.129: PCDD/F emissions from clinker production plants depending on kiln types [Waltisberg,
2016]; the values stem from 16 dry long kilns, 28 wet kilns and 40 dry process kilns with
suspension preheaters and were collected in 2002
In principle, there are three possibilities to explain the presence of PCDD/F in emissions to air [Fiedler, 2003]:
- PCDD/F are already present in the waste-derived raw materials and fuels,
- PCDD/F are formed from related chlorinated precursors such as polychlorinated biphenyls,
chlorinated phenols and chlorinated benzenes,
- PCDD/F are formed via de novo synthesis, i.e. from the burning of chlorinated or non-
chlorinated organic matter in the presence of chlorine donors.
For clinker production plants, the first possibility is of relevance in practice and is the most important reason for the few individual cases where elevated PCDD/F emissions occur from dry process kilns with suspension preheaters. Some known cases are presented in section 4.4.3.16.3 below. For cement plants, PCDD/F which are present in fuels fed via the main burners are not of relevance as they are completely destroyed in the kiln with its very high gas temperatures (above 1200 °C) and long retention times (6 - 10 s). PCDD/F which are present in fuels for secondary firing may not be fully destroyed. The experience shows that the second possibility may happen where chlorinated precursors are present in waste-derived raw materials. So, this possibility is also associated with cases where waste-derived raw materials enter the system via the raw material route (see Chapter 4.3.3).
25 The value is standardised at 10 % oxygen and is the average value over the sampling period of a minimum of 6 hours and a maximum of 8 hours. Toxic equivalency factor (TEF) expresses the toxicity of PCDD, PCDF and PCB in terms of the most toxic form of dioxin, 2,3,7,8-TCDD. The toxicity of the individual congeners may vary by orders of magnitude. With the TEFs, the toxicity of a mixture of dioxins and dioxin-like compounds can be expressed in a single number - the toxic equivalency (TEQ), usually as International TEQ (I-TEQ). It is a single figure resulting from the product of the concentration and individual TEF values of each congener (Van den Berg et al., 2006). In case of the Industrial Emissions Directive [EU IED, 2010], relating to waste incineration plants and waste co-incineration plants, the equivalence factors for PCDD/F are specifically defined in Annex VI, part 2.
0,316
0,1260,0150,046 0,015 0,004
2,643
1,678
0,143
0,000
0,500
1,000
1,500
2,000
2,500
3,000
Dry long kilns Wet kilns Dry kilns with suspensionpreheaters
PC
CD
/F in
[n
g TE
Q/N
m3]
PCDD/F emission from different kiln types
average median maximum
2.643
1.678
0.1260.015
0.316
0.046 0.015 0.0040.143
0.000
0.500
1.000
1.500
2.000
2.500
3.000
dry long kilns wet kilns dry process kilns withsuspension preheater

Chapter 4
296 State of the art of the co-incineration of waste-derived fuels and raw materials in clinker/cement plants
The third possibility concerns the de novo synthesis. In the past, knowledge about this de-novo synthesis of PCDD/F in thermal processes was mainly gained from municipal solid waste incinerators. Derived from them, the de-novo synthesis requires the simultaneous presence of following factors [Fiedler, 2003]:
- Hydrocarbons
- Chlorine-containing substances
- A suitable catalyst (preferably copper)
- An appropriate temperature window (200 – 550 °C)
- A sufficient retention time in the mentioned temperature window
- Sufficient concentration of oxygen in the gas stream.
The BREF [EC BEEF; CLM, 2013, p 73-74] mentions but does not reflect these factors for the clinker production process. But this is required as the conditions of that compared to solid waste incineration are very different. Before reflecting on the aforementioned factors, another factor is mentioned that is often not adequately considered. It is the sulphur-to-chlorine ratio (S/Cl ratio). The role of the S/Cl ratio is presented in the textbox below.
Sulfur-to-chlorine ratio (S/Cl ratio) In municipal and hazardous waste incineration as well as in coal-fired power plants and sludge incineration plants, the sulphur-to-chlorine ratio (S/Cl ratio) plays an important role with respect to the de novo synthesis of PCDD/F. There are a couple of studies pointing out that PCDD/F formation depends on the chlorine and sulphur concentration of the input materials and that PCDD/F formation is suppressed when burning fuels with high S/Cl ratio [Hagenmaier/Beising, 1989; Lindbauer, 1992; Ogawa et al., 1996; Raghunathan/Gullett, 1996; Ruokojärvi et al., 1998; Gullett et al., 2000; Hunsinger et al., 2002; Hunsinger et al., 2003; Hunsinger et al., 2007; Hunsinger et al., 2009]. A high S/Cl ratio is 5/1 which is found in, e.g., in coal-fired power plants, whereas much lower ratio is found in municipal waste (1/3) [Fiedler, 2003]. The latter allows the formation of molecular chlorine according to the Deacon process catalytically driven by metals, e.g. copper (Figure 4.130). Gaseous molecular chlorine (Cl2) was found to be the most efficient chlorinating agent [Gullett et al., 1990]. The oxygen content pushes the Deacon reaction towards Cl2 formation; i.e. increasing oxygen concentrations and thus higher Cl2 formation can result in higher PCDD/F formation.
Figure 4.130: Catalytically driven, here by copper, Deacon process [Griffin, 1986]
In case of a surplus of sulfur over chlorine, molecular chlorine will be “captured” according to the equation in Figure 4.131. Thus, as the reaction in Figure 4.131 dominates over the one in Figure 4.130, sulfur dioxide can significantly suppress PCDD/F formation which can be used for this purpose [Hunsinger et al., 2007; Hunsinger et al., 2009]. This chemical background is the reason of the generally low PCDD/F formation in coal-fired power plants and sludge incineration plants. The critical S/Cl ratio was determined to be 0.64 (higher chlorine compared to sulfur input) and a further increase in sulfur input was not associated with less PCDD/F formation [Raghunathan/Gullett, 1996].
Figure 4.131: Reaction of molecular chlorine (Cl2) with sulfur dioxide [Griffin, 1986]
CuCl2 + 1/2O2 CuO + Cl2
CuO + 2HCl CuCl2 + H2O
2 HCl + 1/2O2 H2O + Cl2
Cl2 + SO2 + H2O SO3 + 2 HCl

Chapter 4
State of the art of the co-incineration of waste-derived fuels and raw materials in clinker/cement plants 297
Considering dry process kilns with suspension preheaters, the question rises whether there is an area in clinker production kilns where the aforementioned factors may exist. Against this background, the different areas are discussed such as the main burner and the kiln, the kiln inlet, the chlorine bypass (where existing), the preheater, the conditioning tower, the raw mill and the dedusting device (electrostatic precipitator or fabric filter). From the main burner and the kiln itself, no de novo synthesis is observed as the burning process in this area of the sintering zone is operated with excess air at very high flame temperatures (in the order of 2000 °C), high gas temperatures in the kiln (above 1200 °C) and long retention times (6 – 10 s) (see Chapter 3.2.2). Any organic compound is completely oxidised and organochlorine compounds are converted to CO2 and HCl. This means that it is not an environmental concern if waste-derived fuels containing PCDD/F or other chlorinated compounds are fed via the main burner (this has been done in various cases) provided the chlorine input quantities are not associated with operating problems such as coatings and ring formation (see Chapter 3.2.4.2.1,d). The usual temperature range of the gas in the kiln inlet is 1000 – 1100 °C. There, very high contents of HCl (about 4000 - 20,000 ppm) and SO2 (about 10,000 – 15,000 ppm) have been measured and confirmed by simulations [Waltisberg, 2016]. It is assumed that at temperatures above 1600 °C in the kiln, water is cleaved, also into hydrogen radicals which react with sublimated potassium chloride (KCl) to form HCl (Figure 4.132). A similar reaction is assumed between alkali and oxygen radicals [Waltisberg, 2016].
Figure 4.132: Assumed formation of HCl from sublimated KCl and hydrogen radicals; the latter are
formed from water at temperatures above 1600 °C [Waltisberg, 2016]
With the mentioned HCl and SO2 concentrations in the kiln inlet, the S/Cl ratio (see the textbox above) can be about 1:4 and thus, the capture of potentially formed Cl2 is very limited. However, PCDD/F cannot be formed as the temperature is far too high for de novo synthesis. Here, the HCl will rapidly react with alkalis (the reaction between HCl and alkali is fastest) of the raw meal to form KCl and NaCl (see Chapter 3.2.4.2.1). Usually, there is a surplus of alkali. If not, the residual HCl combines with calcium to form CaCl2. Thus, the HCl content in the gas leaving the preheater is very low (often below the detection limit of about 2 mg/Nm3 – see Chapter 4.4.3.8). When extraction gas from the kiln inlet by means of a chlorine bypass (see Chapter 3.3.4), the de novo synthesis of PCDD/F has been observed but on a low level which can be explained by heterogeneous reactions of organic compounds and chlorine in the temperature range between 200 and 400 °C. Organic compounds are only there in case of incomplete combustion of fed waste-derived fuels, especially tires. An example is provided in Figure 4.133. It shows the increase of PCDD/F formed by de novo synthesis depending on the quantity of tires fed to the kiln inlet. As already stressed, the quantity
Water isdissociated Reaction
to HCl
KCl sublimates
Kiln inletArea of the flame / sintering zone

Chapter 4
298 State of the art of the co-incineration of waste-derived fuels and raw materials in clinker/cement plants
of PCDD/F formed is small, i.e. below the IED emission limit value of 0.1 ng TEQ/Nm3. If no waste-derived fuels are fed to the kiln inlet or if the combustion there is complete, no measurable de novo synthesis of PCDD/F has been observed. The chlorine bypass is equipped with a fabric filter which reduces PCDD/F emissions by about 70-80 % [Waltisberg, 2016].
Figure 4.133: De novo PCDD/F formation in the chlorine bypass system (before the dust filter) depending
on the input of tires [Waltisberg, 2016]
In the preheater itself, HCl is rapidly absorbed in the lower cyclones. Thus, no reactive chlorine according to the deacon process can be formed (see the textbox above). And the temperatures there are above the de novo synthesis window; so no, or very little, PCDD/F are formed. Thus, the preheater is not an area where PCDD/F de novo synthesis can occur. However, if the raw meal, due to waste-derived raw materials fed via the raw material route, contains precursors, such as chlorinated benzenes or phenols or ashes with de novo potential, PCDD/F can be formed in the upper cyclones and will be partly emitted to air. Another part will adsorb to the filter dust which is often returned to the raw meal. This recycling of filter dust will be associated with additional PCDD/F emissions to air. Due to the adsorption of PCDD/F to the filter dust and the aforementioned return of filter dust, a PCDD/F cycle between the dust filter and the preheater establishes. Then, PCDD/F emissions are significantly higher during direct operating mode (see Chapter 3.3.3). An example for such a case is given in Figure 4.134. According to the values of this figure, the enrichment factor of PCDD/F in the filter dust is between 10 and 100. This is significant.
Figure 4.134: Significant increase in PCDD/F emissions as a consequence of feeding contaminated waste-
derived raw materials via the raw material route [Waltisberg, 2016]
0.001 0.0020.007
0.019
0.004
0.066
0.268
0.2260.236
0.2
0
0.05
0.1
0.15
0.2
0.25
0.3
Uncontaminatedraw materials
Raw meal
PC
DD
/F e
mis
sio
ns
in [
ng
TEQ
/Nm
3]
Compound operating mode Direct operating mode
Raw meal with contaminated waste-derived raw materialsUncontaminatedraw materials

Chapter 4
State of the art of the co-incineration of waste-derived fuels and raw materials in clinker/cement plants 299
In case of operating electrostatic precipitators at temperatures above 200 °C, de novo synthesis of PCDD/F can happen there (see section 4.4.3.16.3 below). In contrast, fabric filters are usually operated well below 200 °C. Thus, they are not an area of PCDD/F de novo synthesis. 4.4.3.16.2 Evaluation of available data monitored at German clinker production plants
In the time period from 2005 to 2015, 1125 spot measurements have been performed at German clinker production plants. The results confirm a generally low PCDD/F level. Just nine values (0.8 %) were above the aforementioned emission limit value of 0.1 ng I-TEQ/Nm3 and only 37 values were in the range of 0.05 – 0.1 ng I-TEQ/Nm3 (Table 4.58). One fifth of the PCDD/F spot measurements were below the detection limit. In the nine cases where the emission limit value was exceeded, the exceedance was minor. The highest value was 0.15 ng I-TEQ/Nm3 (Table 4.58). This does not represent a significant exceedance.
Table 4.58: Spot measurements at German clinker production plants in the time period 2005 – 2015
for the parameter PCDD/F – number of kilns, spot measurements, values below detection
limit, values between 0.05 – 0.1 and above 0.1 ng I-TEQ/Nm3, and the three maximum
values – derived/calculated from [VDZ, 2006 … VDZ, 2016]
Values slightly higher than the IED emission limit value (0.1 ng/Nm3) do not necessarily represent an exceedance as the uncertainty of the measurement has to be taken into account. The uncertainty is in the order of 0.04 ng TEQ/Nm3. These results are in line with the data presented in the Best Available Techniques Reference Document for the Cement, Lime and Magnesium Oxide Manufacturing Industries [EC BREF CLM, 2013] (Figure 4.135). The figures are categorised by thermal substitution rate. There is no general influence of the use of waste-derived fuels visible.
Year
number of
kilns
monitored
number of spot
measurements
Number of
measurements below
detection limit
Number of values
between 0.05 and 0.1
ng I-TEQ/Nm3
Number of
measurement above
0.1 ng I-TEQ/Nm3
Three maximum
values
in [ng I-TEQ/Nm3]
2005 37 107 12 10 2 0.135 / 0.123 / 0.095
2006 36 109 23 4 1 0.107 / 0.085 / 0.10
2007 41 108 33 5 1 0.134 / 0.085 / 0.065
2008 42 122 26 4 1 0.143 / 0.086 / 0.067
2009 40 110 20 1 1 0.14 / 0.095 / 0.04
2010 37 89 10 2 0 0.068 / 0.06 / 0.0495
2011 40 101 7 2 1 0.113 / 0.06 / 0.057
2012 39 104 10 2 0 0.095 / 0.057 / 0.0395
2013 39 80 38 0 1 0.1505 / 0.043 / 0.035
2014 39 89 20 4 1 0.115 / 0.10 / 0.075
2015 36 106 20 5 0 0.097 / 0.09 / 0.068
2005 - 2015 1125 219 39 9

Chapter 4
300 State of the art of the co-incineration of waste-derived fuels and raw materials in clinker/cement plants
Figure 4.135: Distribution of PCDD/F spot measurements, categorised by the thermal distribution, from
clinker production plants in the EU-27 and EU-23+ countries; the data were collected in
2004 [EC BREF CLM, 2013]
4.4.3.16.3 Exceptionally high PCDD/F emission levels
In Chapter 4.3.3.3, it is already mentioned that high PCDD/F emissions to air (3 – 7 ng TEQ/Nm3) occurred at the cement works of Holcim Belgique S.A. in Obourg/Belgium in the nineties. The high PCDD/F emissions from that wet kiln (see Figure 4.129 above indicating that this type of kiln has, in general, higher PCDD/F emissions) were a result of feeding of so-called coal residues including dredged materials from rivers via the raw material route (see Chapter 4.3.3.1) because it was wet it could not be fed elsewhere. In order to significantly reduce the PCDD/F emission below the emission limit value, the aforementioned material was dried, ground and fed via the main burner. For semi-continuous monitoring, a long-term PCDD/F-sampling was introduced [Reinmann et al., 2006; Reinmann et al., 2008; Reinmann et al., 2010]. Another extreme case was reported from the UK where PCDD/PCDF emissions in 2004 from a long dry kiln in the UK reached 136 ng TEQ/Nm3 and averaged more 50 ng TEQ/Nm3 over the year with total emissions of more than 40 g TEQ. Considering such extremely high values, the sampling and measurement have to be checked in order to be sure that the emission really occurred at this level. The kiln, closed before 2007, was operating with relatively high temperatures in the electrostatic precipitator and used raw material with high organic content together with waste pulverised fuel ashes [UNEP, 2007; Karstensen, 2008]. So again, the feeding of materials containing hazardous compounds via the raw material route can be associated with high emissions of volatilised hazardous compounds such as PCDD/F. In addition, the operation of electrostatic precipitators at elevated temperature may contribute to the increase in PCDD/F emissions. Data from several kilns in the United States showed PCDD/F emissions of 1.76 ng I-TEQ/Nm3 when operating their air pollution control devices in the range of 200 °C – 230 °C [UNEP, 2007]. It is reported that tests at one clinker production plant revealed that PCDD/F emissions were highest at 400 °C operating temperature of an electrostatic precipitator, and decreased fiftyfold at 255 °C [UNEP, 2007]. However, nowadays, it would be very unusual and not energy efficient to operate an electrostatic precipitator above temperatures of 200 °C. Fabric filters are operated at a much lower temperature level (significantly lower than 200 °C). Further, it has been observed that the feed of the following waste-derived raw materials can be associated with additional PCDD/F emissions to air [Waltisberg et al., 2016]:
- iron –corrective components containing mono and/or dichlorobenzenes,
- fly ashes with de novo potential,
- soils contaminated with organochlorine compounds,
- certain residues from chemical industries containing PCDD/F or related precursors.

Chapter 4
State of the art of the co-incineration of waste-derived fuels and raw materials in clinker/cement plants 301
4.4.3.16.4 Conclusions
Against the background of the aforementioned observations, it can be concluded that waste-derived raw materials containing PCDD/F or related organochlorine compounds which are fed via the raw material route can lead to elevated PCDD/F emissions. However, only a few cases have been identified so far where elevated PCDD/F emission were observed due to contaminated waste-derived raw materials. Against this background, any waste-derived material fed via the raw material route should be carefully analysed for organochlorine compounds, also for organofluorine and brominated compounds and for de novo synthesis potential. Elevated operating temperatures of electrostatic precipitators, i.e. above 200 °C, could contribute to an increase in PCDD/F emissions. However, due to energy losses, such high waste gas temperatures are avoided nowadays. 4.4.3.17 Polychlorinated biphenyls (PCB)
4.4.3.17.1 Introduction
PCB are a class of aromatic pollutants in which some or all hydrogen atoms attached to the biphenyl ring are substituted by chlorine atoms. Depending on the position and number of the chlorine atoms, there are theoretically 209 individual PCB compounds (congeners) [IARC PCB/PBB, 2016, p 419]. A number is attributed to each individual congener in ascending order of the number of chlorine substitutions within each sequential homologue [Ballschmiter/Zell, 1980; Ballschmiter et al., 1992]. Due to the physical and chemical properties of PCB, such as non-flammability, chemical stability, high boiling point, and high dielectric constants, PCB were widely used in several industrial and commercial open and closed applications [IARC PCB/PBB, 2016, p 71] such as dielectric fluid in transformers and capacitors, heat-transfer fluid, lubricant, hydraulic fluid as well as a component of products and materials such as rubber, synthetic resins, pipeline valve grease, wax extenders, caulk and joint sealants, insulation and other building materials, de-dusting agents, inks, cutting oils, and wire and cable coatings [IARC PCB/PBB, 2016, p 73]. Thus, in contrast to PCDD/F, PCB were intentionally produced and applied in considerable quantities which is the major reason for their ubiquitous occurrence in environmental compartments. 4.4.3.17.2 Evaluation of available data monitored at German clinker production plants
The European Best Available Techniques Reference Document for the Cement, Lime and Magnesium Oxide Manufacturing Industries [EC BREF CLM, 2013] does not report any PCB emission values although it mentions their presence in waste gas and many values have been published from German clinker production plants since 1998 [VDZ, 1999 … VDZ, 2017]. Here, the last twelve aforementioned reports are considered. In the time period from 2005 to 2016, 660 spot measurements have been performed at German clinker production plants (Table 4.59).

Chapter 4
302 State of the art of the co-incineration of waste-derived fuels and raw materials in clinker/cement plants
Table 4.59: Spot measurements at German clinker production plants in the time period 2005 – 2016
for the parameter PCB – number of kilns, spot measurements, number of values below
detection limit, number of measurements according to DIN and WHO measurement
standards, and the three maximum values – derived/calculated from [VDZ, 2006 … VDZ,
2017].
*1: the available data contain values according to DIN and WHO standards but there is no clear distinction between DIN and WHO values
From 2005 – 2011, the measurements have been carried out according to the German Industry Norm (DIN) [DIN 51527, 2000] but this is not a standardised guideline for the measurements of PCB in the clean gas of clinker rotary kilns. With this method, the following six PCB congeners are determined (numbers according to [Ballschmiter/Zell, 1980; Ballschmiter et al., 1992]): PCB-28, PCB-52, PCB-101, PCB-153, PCB-138, PCB-180. The exact chemical description, the CAS number, the octanol/water partition coefficient (log POW
26) as well as the vapour pressure of these six PCB are compiled in Table 4.60.
Table 4.60: Chemical description, CAS number, log POW and vapour pressure of the six PCB
determined with DIN 51527 (based on [IARC PCB/PBB, 2016])
The content of PCB in waste gas is expressed as the sum of these six congeners mentioned in Table 4.60. This means that the total quantity of all 209 congeners is considerably higher. For instance, a
26 log POW is the octanol/water partition coefficient; that is the ratio of concentrations of a compound in a mixture of the two immiscible phases octanol and water indicating the polarity/non-polarity of the organic compound concerned
Yearnumber of
kilns
number of
measurements
number of
measurements
according to
DIN
number of
measurements
according to
WHO
number of
measurements
below detection
limit
Three maximum
values of
measurements
according to DIN
2005 13 34 34 0 8 0.06 / 0.05 / 0.04
2006 13 30 30 0 2 0.04 / 0.03 / 0.02
2007 15 42 42 0 19 0.13 / 0.13 / 0.13
2008 11 34 34 0 4 0.04 / 0.03 / 0.03
2009 10 29 29 0 7 0.08 / 0.06 / 0.06
2010 12 35 35 0 8 0.08 / 0.05 / 0.05
2011 11 35 35 0 3 0.08 / 0.03 / 0.03
2012 7 32 20 12 2 *1
2013 10 62 25 37 16 *1
2014 23 93 24 69 16 0.11 / 0.09 / 0.08
2015 25 113 24 89 11 0.03 / 0.02 / 0.015
2016 35 121 29 92 7 0.021 / 0.017 / 0.011
2005-2016 660 361 299 103
PCB number Chemical name CAS no. log POW
Vapour
pressure
[10-4
hPa]
PCB-28 2,4,4'-Trichlorobiphenyl 7012-37-5 5.67 1.5 - 3.3
PCB-52 2,2',5,5'-Tetrachlorobiphenyl 35693-99-3 5.84 1.8 - 8.9
PCB-101 2,2',4,5,5'-Pentachlorobiphenyl 37680-73-2 6.38 0.14 - 0.35
PCB-138 2,2',3,4,4',5'-Hexachlorobiphenyl 35065-28-2 6.83 0.052
PCB-153 2,2',4,4',5,5'-Hexachlorobiphenyl 35065-27-1 6.92 0.019 - 0.69
PCB-180 2,2',3,4,4',5,5'-Heptachlorobiphenyl 35065-29-3 7.36 0.013

Chapter 4
State of the art of the co-incineration of waste-derived fuels and raw materials in clinker/cement plants 303
factor of “5” was reported; this means that the total PCB concentration in waste gas is five times higher than the sum of the aforementioned six congeners [Johnke et al., 2001]. From 2012 onwards, PCB were increasingly determined according to World Health Organization (WHO). WHO has selected 12 dioxin-like coplanar PCB (which are considered to be more toxic) and, like for PCDD/F, have attributed toxic equivalency factors (TEQ) to them (Table 4.61). These PCB are measured according to a specific method [CEN, 2006].
Table 4.61: Chemical description, CAS number, log POW and vapour pressure of twelve dioxin-like
coplanar PCB based on [IARC PCB/PBB, 2016]), TEQ according to [van den Berg et al.,
2006]
Against this background, it is obvious that measurements made according to DIN comprise 6 specific PCB which are totally different from the 12 PCB measured according to WHO. In addition, the measured values according to WHO are multiplied with the toxic equivalency factors given in Table 4.61. Thus, the measurement results according to DIN and WHO are not comparable. Nevertheless, surprisingly, the German Association of Cement Manufacturers published the measurement results according to the two methods from 2012-2015 in one chart with the same ordinate axis although the PCB according to DIN are reported in µg/Nm3 whereas the measurement values for PCB according to WHO are reported in ng TEQ/Nm3. After being informed about this mistake by an external expert in 2017, the association reports the measurement values in two charts, one for PCB according to DIN (ordinate axis in ng/Nm3) and one for PCB according to WHO (ordinate axis in ng TEQ/Nm3) for the first time with data for 2016 (VDZ, 2017, pp 21-22). The charts for the years 2012 and 2013 did even not contain a clear distinction between the values measured according to DIN and WHO respectively. Therefore, no maximum values could be mentioned in Table 4.59. The values for the years 2014-2015 corresponded with the former DIN values. As a consequence, it was assumed that the ordinate axis was for the DIN values which are compiled in Table 4.59. In general, PCB emission concentrations are low. The maximum value reported (for measurements according to DIN) in the time period 2005 – 2016 was 0.13 mg/Nm3 (see Table 4.59). With an assumed specific waste gas flow of 2300 Nm3/t clinker (see Chapter 3.3.1.2.4) and a production of 3000 t clinker/d (realistic production quantity), an annual load of about 300 grams results. The total annual PCB emission would be about 1 kg. This is the maximum load detected in the time period 2005 – 2016. Most of the emission concentrations were much lower, by more than factor 10. Thus, it can be concluded that, in general, the emission of PCB from clinker production plants are not of high relevance. However, in some individual cases, the emission of PCB could be an issue.
PCB number Chemical name CAS no. log POW
Vapour
pressure
[10-4
hPa]
Toxic
equivalency
factor (TEQ)
PCB-77 3,3',4,4'-Tetrachlorobiphenyl 32598-13-3 6.36 0.052 - 0.21 0.0001
PCB-81 3,4,4',5-Tetrachlorobiphenyl 70362-50-4 6.36 n.a. 0.0001
PCB-105 2,3,3',4,4'-Pentachlorobiphenyl 32598-14-4 6.65 0.086 0.0001
PCB-114 2,3,4,4',5-Pentachlorobiphenyl 74472-37-0 6.65 n.a. 0.0005
PCB-118 2,3',4,4',5-Pentachlorobiphenyl 31508-00-6 6.74 0.12 0.0001
PCB-123 2',3,4,4',5-Pentachlorobiphenyl 65510-44-3 6.74 n.a. 0.0001
PCB-126 3,3',4,4',5-Pentachlorobiphenyl 57465-28-8 6.89 n.a. 0.1
PCB-156 2,3,3',4,4',5-Hexachlorobiphenyl 38380-08-4 7.18 0.021 0.0005
PCB-157 2,3,3',4,4',5'-Hexachlorobiphenyl 69782-90-7 7.18 n.a. 0.0005
PCB-167 2,3',4,4',5,5'-Hexachlorobiphenyl 52663-72-6 7.27 n.a. 0.00001
PCB-169 3,3',4,4',5,5'-Hexachlorobiphenyl 32774-16-6 7.42 n.a. 0.01
PCB-189 2,3,3',4,4',5,5'-Heptachlorobiphenyl 39635-31-9 7.71 n.a. 0.0001

Chapter 4
304 State of the art of the co-incineration of waste-derived fuels and raw materials in clinker/cement plants
It had been reported that the input of PCB- and other POPs-containing wastes via the main burner, for instance PCB-containing waste oil, is associated with the complete destruction of these hazardous pollutants [Karstensen, 2008]. This was also confirmed by combustion trials with waste containing POPs in developing countries [Karstensen et al.,2010]. However, the two following aspects have to be taken into account that are the feeding point and the specific chlorine input. Any PCB-containing waste has to be fed via the main burner (see feeding points in Chapter 4.3.3.1). Only then can it be made sure that the temperature is high enough and the retention time is long enough for complete destruction of PCB or other hazardous pollutants. Secondly, in order to avoid operating problems, the specific chlorine input should be below 300 g Cl/kg clinker (see Chapter 3.3.4.1). With respect to PCB, since 1998, the Environmental Data of the German Cement Industry contain the following statement: “The rotary kiln systems of the cement industry guarantee a virtually complete destruction of these trace components” [VDZ, 1999 … VDZ, 2017]. This statement is only valid if the PCB-containing input material is fed via the main burner. It is not valid for feeding PCB-containing waste via the secondary firing or the raw material route (see Chapter 4.3.3.1). Then, the destruction may be incomplete (in case of secondary firing) or PCB are evaporated and emitted with the waste gas (in case of the raw material route). Thus, this statement needs to be changed accordingly, for example “The rotary kiln systems of the cement industry guarantee a virtually complete destruction of these trace components if they are fed via the main burner”. 4.4.3.17.3 Conclusions
According to the available data from German clinker production plants for the past 20 years, in general, the emission level of PCB is not of high relevance. It can be an issue in individual cases if PCB-containing waste is fed via the secondary firing or raw material route. As a consequence, the aforementioned statement in the Environmental Data of the German Cement Industry needs to be modified as proposed. 4.4.3.18 Polycyclic aromatic hydrocarbons (PAH)
4.4.3.18.1 Introduction
PAH are organic compounds containing only carbon and hydrogen that are composed of multiple aromatic rings. They are nonpolar molecules. The major sources are the fossil sources (oil, coal, and oil shale). PAH are also major products of incomplete combustion of fossil fuels and organic matter, e.g. in coal and wood burning, in combustion engines, in heat and power generation, and in refuse burning [Harvey, 1998]. Anthropogenic combustion sources are thought to account for over 90 % of the environmental concentrations of PAH and are thus much higher compared to natural combustion such as forest fires and volcanoes [Howsam/Jones, 1998]. Two mechanisms are thought to result in PAH being emitted from combustion processes: -‘Pyrosynthesis’ of PAH from aliphatic hydrocarbons and aromatic compounds: - ‘Survival’ of PAH in the starter fuel [Howsam/Jones, 1998]. In clinker production, combustion processes take place in the kiln and in secondary firing. In the kiln, the oxidation is complete whereas in secondary firing, depending on the specific circumstances, it can be incomplete. From the clinker production process, the emission of PAH with two and three rings usually dominates. Thus, they are called indicatory PAH [Yang et al., 1998; Ravindra et al., 2008]. The chemical structures of these indicatory PAH are shown in Figure 4.136. Normally, they are released when heating natural raw materials [Yang et al., 1998; Waltisberg, 1998] (see Chapter 3.3.1.2.2). There are cases where PAH can be detected in the neighborhood of a clinker production plant at a higher concentration than the background concentration (Cho et al., 2014). However, the origin was not identified in this particular case, and it remains unclear whether elevated PAH emissions stemmed from incomplete combustion or from their release from waste-derived raw materials which were fed via the raw material route (see Chapter 4.3.3.1).

Chapter 4
State of the art of the co-incineration of waste-derived fuels and raw materials in clinker/cement plants 305
Figure 4.136: The chemical structure of PAH which are indicatory for clinker production plants,
according to [Yang et al., 1998; Waltisberg, 1998; Ravindra et al., 2008]
However, other PAH can be emitted in cases where waste-derived raw materials such as industrial sludges are fed via the raw material route (see Chapter 4.3.3.1). Then, PAH with more than three rings can be detected. The standard method for analysing PAH is still the one developed by the US EPA [US EPA Method 610, 1984] which comprises the following 16 PAH: acenaphthene, acenaphthylene, anthracene, benzo(a)anthracene, benzo(a)pyrene, benzo(b)fluoranthene, benzo(ghi)perylene, benzo(k)fluoranthene, chrysene, dibenzo(a,h)anthracene, fluoranthene, indeno(1,2,3-cd)pyrene, naphthalene, phenanthrene, pyrene. In the abbreviated form, they are also called “EPA PAH 16 or EPA 16”. In Germany, PAH emissions to air are also monitored according to this method [VDZ, 1999 … VDZ, 2016]. The aforementioned indicatory compounds with two and three rings are part of the “EPA 16”. 4.4.3.18.2 Evaluation of available data monitored at German clinker production plants
In the time period 2005 – 2015, 41 – 64 measurements were annually carried out at 14 – 24 kilns. The number of kilns and measurements as well as the annual mean values, the annual medians and the three maximum values are compiled in Table 4.62.

Chapter 4
306 State of the art of the co-incineration of waste-derived fuels and raw materials in clinker/cement plants
Table 4.62: Spot measurements at German clinker production plants in the time period 2005 – 2015
for the parameter polycyclic aromatic hydrocarbons (PAH) – number of kilns and spot
measurements, average (mean) and median values and the three maximum values –
derived/calculated from [VDZ, 2006 … VDZ, 2016].
In addition, the annual averages (mean) values and medians are illustrated in Figure 4.137.
Figure 4.137: Annual average (mean) and median values for PAH spot measurements from 2005 – 2015
at German clinker production plants; data derived from [VDZ, 2006 … VDZ, 2016]
It has to be stressed that, usually, PAH emissions are dominated by naphthalene which accounts for a share of more than 90 % by mass [VDZ, 1999 … VDZ, 2016]. This statement may be valid for “normal PAH emissions”, i.e. for emission levels below 0.3 mg/Nm3, at least below 0.5 mg/Nm3. In the time period 2005 – 2015, there were ten PAH emission concentrations above 0.5 mg/Nm3. In these cases, “abnormal” conditions are assumed. Such elevated emission levels could have occurred due to the co-incineration of waste-derived raw materials which are fed via the raw material route. For instance, iron containing materials are added for quality reasons. For this purpose, often iron containing residues of different origins are used which can also contain organic impurities such as phenol, BTEX or PAH which are volatilized and thus emitted to air. The same is true for other types of residues such as the industrial sludges mentioned above. Unfortunately, detailed analysis for all 16 PAH are not reported. With detailed analysis, a more in-depth evaluation would be possible.
Yearnumber of
kilns
number of
measurementAverage Median
Three maximum
values
2005 15 41 0.094 0.058 0.36 / 0.215 / 0.21
2006 16 42 0.134 0.109 0.53 / 0.505 / 0.275
2007 17 45 0.133 0.105 0.485 / 0.41 / 0.395
2008 24 64 0.128 0.061 1.0 / 0.81 / 0.63
2009 21 58 0.149 0.141 0.52 / 0.47 / 0.46
2010 19 49 0.155 0.132 1.56 / 0.53 / 0.44
2011 15 47 0.083 0.088 0.35 / 0.27 / 0.2
2012 14 43 0.095 0.039 1.0 / 0.7 / 0.3
2013 16 52 0.114 0.088 0.505 / 0.4 / 0.34
2014 16 46 0.101 0.059 0.46 / 0.43 / 0.3
2015 16 47 0.064 0.035 0.3 / 0.25 / 0.22
2005 - 2015 534 0.133 0.083
0
0,02
0,04
0,06
0,08
0,1
0,12
0,14
0,16
2005 2007 2009 2011 2013 2015
BE
TX
na
ch
VD
Z [
mg
/m3N]
Mittelwert
Median
0.16
0.14
PAH
[m
g/N
m3] 0.12
0.10
0.08
0.06
0.04
0.02AverageMedian

Chapter 4
State of the art of the co-incineration of waste-derived fuels and raw materials in clinker/cement plants 307
The Best Available Techniques Reference Document does not contain information on PAH [EC BREF CLM, 2013] and, as a consequence, the same is true for the BAT Conclusions [EC CLM Conclusions, 2013]. 4.4.3.18.3 Conclusions
The available data for emissions of PAH for the time period 2005 – 2015 vary to only a small extent from 0.08 – 0.16 mg/Nm3. Thereby, the percentage of naphthalene is very high, i.e. more than 90 %. From the measured values in 2005 - 2015, ten PAH emission concentrations were above 0.5 mg/Nm3. In these cases, “abnormal” conditions are assumed whereas values below 0.3 mg/Nm3 are considered to represent “normal PAH emissions”. Elevated emission levels can occur in case of co-incinerating waste-derived raw materials which are fed via the raw material route. Then, the PAH, i.e. mainly naphthalene that is more volatile than other PAH, can be evaporated and emitted. The other PAH with three and more rings adsorb to the raw meal and filter dust to a much higher extent. In principal, incomplete combustion conditions during secondary firing may also be a source of higher PAH emissions but the knowledge concerned could not be identified.

Chapter 5
308 State of the art of the co-incineration of waste-derived fuels and raw materials in clinker/cement plants
5 REGULATION OF EMISSIONS AND ENFORCEMENT– TODAY AND TOMORROW
5.1 Introduction
Concerning industrial installations, globally, there is no convincing alternative so far to the command-and control approach. This means that the erection and operation of industrial installations require an environmental permit. Although effective implementation of the command-and-control approach is not fully in place in many countries round the world, e.g. due to corruption, inadequate structure of competent authorities and limited availability of well-educated staff, non-efficient permitting and enforcement procedures and the requirement of different permits for different emission sources, there is no other system available which works better in practice. It is not possible to present a detailed overview of the advantages and drawbacks of different permitting approaches in this thesis. But the European approach of integrated environmental permitting for large industrial installations is strongly recommended. It was introduced in 1996 [EU IPPCB, 1996/2008] and further developed in 2010 [EU IED, 2010]. This approach, which is based on best available techniques (BAT), defined for all the different industrial sectors, is supported by OECD [OECD, 2007]. In line with the topic of this thesis, the following information focuses on the regulations on co-incinerating waste-derived fuels and on co-processing waste-derived raw materials. For this purpose, the existing regulations and their development are presented and explained for Germany. There, the European legislation, especially the Directive on the Incineration of Waste [EU WID, 2000], which has been integrated into the Industrial Emissions Directive (IED) [EU IED, 2010] in 2010, and the Conclusions on Best Available Techniques for the Production of Cement, Lime and Magnesium Oxide [EC CLM Conclusions, 2013] has been implemented into national legislation. Thus, the German example can be considered as a good one in the European Union.
5.2 Existing regulations
5.2.1 Permitting industrial installations
According to paragraph 4 of the Federal Clean Air Act [DE BImSchG, 2019], the erection and operation of industrial installations with significant environmental pollution potential require a permit. All the installations requiring a permit are listed in the 4th Ordinance on Installation Requiring a Permit [DE 4th BImSchV, 2017]. Installations for the production of clinker and cements are also listed (4th BImSchV, paragraph 2.3 of the Annex). In this paragraph, a distinction is made between the types and sizes of production plants Table 5.1).

Chapter 5
State of the art of the co-incineration of waste-derived fuels and raw materials in clinker/cement plants 309
Table 5.1: Permitting procedure for clinker production plants according to the 4th BImSchV
In Germany, the 38 existing rotary kilns with cyclone preheater have an average production capacity of around 2500 t/d. All plants are above the threshold capacity value of 500 t/d as indicated in Table 5.1 above. The average capacity of the rotary kilns with grate preheater is about 900 t/d also exceeding the aforementioned threshold value of 500 t/d. There are still 8 shaft kilns in operation with an average capacity of about 150 t/d exceeding the threshold value 50 t/d according to Table 5.1. Thus, all German clinker production plants require a permit according to paragraph 10 BImSchG which is the most detailed one which also includes public participation.
5.2.2 Integrated environmental permits
Today, there is the “one-face-to-customer approach” which means that the operator of an industrial installation communicates only with one competent authority (Figure 5.1). Depending on the different federal German states, there is just one competent authority which directly regulates all relevant aspects (national and international legislation, especially the BREF conclusions (Figure 5.1), but there are also federal states where a few different competent authorities will be coordinated by one of them. The competent authorities regulate all aspects in one permit. This “concentration effect” is defined in paragraph 13 BImSchG, of which the target is to coordinate all activities of authorities involved and to accelerate the permitting procedure and to minimise the time for issuing a permit [Jarras, 2017 – comments on paragr. 13]. But there is one exemption: in case of direct discharge of wastewater, e.g. cooling water or run-off water, a separate second permit is required specifically for that (see Figure 5.1). This is a specific German situation due to historic development of environmental legislation.
Kiln type Production capacity Permitting procedure
[t/d]
All kiln types 500 or higher
Permitting procedure according to
paragr. 10 BImSchG (with public
participation)
Shaft kiln 50 to less than 500
Permitting procedure according to
paragr. 10 BImSchG (with public
participation)
Rotary kiln < 500
Simplified permitting procedure
according to paragr. 19 BImSchG
(without public participation)
Shaft kiln < 50
Simplified permitting procedure
according to paragr. 19 BImSchG
(without public participation)

Chapter 5
310 State of the art of the co-incineration of waste-derived fuels and raw materials in clinker/cement plants
Figure 5.1: Scheme illustrating integrated environmental permitting in Germany
The permitting procedure also covers the legislation on environmental assessment27; in Germany, the European Directive on the Assessment of the Effects of certain public and private Projects on the Environment [EU EIA Directive, 1985/2011 – codified version] has been implemented with the Act on the Assessment of Environmental Impacts [DE UVPG, 1990/2010]. According to this act, an environmental impact assessment has to be carried out for clinker or cement production plants with a production capacity of 1000 t/d or higher. The same is true for substantially changing or enlarging such a plant to a capacity exceeding the aforementioned threshold value or if significant adverse effects, such as on human health, animals, plants and biodiversity or on soil, water, air or landscape, can occur. In case the threshold value is not reached, a general pre-assessment of the individual case is carried out. If the result reveals that significant adverse effects cannot be expected, the requirement for an environmental impact assessment may be waived. In such a case where there is no obligation to carry out an environmental impact assessment, the competent authority has to publish the decision concerned, for instance on its website. Today, the permit of large industrial installations such as clinker production plants must cover all environmental issues, except for the direct discharge of wastewater (as aforementioned), such as:
- emission limit values, - stipulations on monitoring of emissions (which parameters, type and frequency of
measurements, continuous and discontinuous monitoring, documentation and reporting of measured results),
- stipulations on monitoring of emissions to air by independent certified and notified third-party measurement institutes (usually once a year),
- conditions/stipulations on the type and quantities of waste-derived fuels and raw materials which may be co-incinerated and co-processed respectively,
- conditions/stipulations on noise protection,
27 According to https://ec.europa.eu/environment/eia/index_en.htm (accessed 19 April 2019): Environmental assessment is a procedure that ensures that the environmental implications of decisions are taken into account before the decisions are made. Environmental assessment can be undertaken for individual projects, such as a dam, motorway, airport or factory, on the basis of Directive 2011/92/EU [EU EIA Directive, 2011] (known as 'Environmental Impact Assessment' – EIA Directive) or for public plans or programmes on the basis of Directive 2001/42/EC [EU SEA Directive, 2001] (known as 'Strategic Environmental Assessment' – SEA Directive). The common principle of both directives is to ensure that plans, programmes and projects likely to have significant effects on the environment are made subject to an environmental assessment, prior to their approval or authorisation. Consultation with the public is a key feature of environmental assessment procedure.
Owner or operator of an IED installation
Probably supportby consultants
Competent authority(„one face to customer“)
Ap
plic
atio
nfo
ra
per
mit
on
th
eb
asis
of
the
Fed
eral
Cle
an A
ir A
ct
and
, in
cas
eo
fd
ire
ctw
aste
wat
erd
isch
arge
on
th
eb
asis
of
the
Fed
eral
Wat
er M
anag
eme
nt
Act
1 in
tegr
ated
per
mit
bas
edo
n t
he
Fed
eral
Cle
an A
ir A
ct
1 p
erm
itfo
rd
irec
tw
aste
wat
erd
isch
arge
bas
edo
n t
he
Fed
eral
W
ater
Man
agag
em
en
tA
ct
BREF(s) andBREF Conclusions
IED, other EU Directivesand international
conventions
- Stockholm Convention- Minamata Convention- CLRTAP …
National regulations foremissions to water, airand soil (AbwV, BImSchG, BImSchVs, TA Luft, TA Lärm, KrWG etc.)

Chapter 5
State of the art of the co-incineration of waste-derived fuels and raw materials in clinker/cement plants 311
- conditions/stipulations on all water management issues (except the direct discharge of wastewater – see above),
- conditions/stipulations on handling and storage of waste-derived fuels and raw materials, - conditions/stipulations on occupational health aspects - further conditions and stipulations.
Basically, there are two ways of changing an existing permit. In case of insignificant changes, the permit is amended by a written notice according to paragraph 15 BImSchG whereas in case of substantial changes, a formal permitting procedure according to paragraph 16 BImSchG has to be carried out.
5.2.3 Best available techniques
Due to European legislation, i.e. according to the Industrial Emissions Directive [EU IED, 2010] (before that, the directive was called “Integrated Pollution Prevention and Control Directive” [EU IPPCD, 1996/2008]), the emission limit values and all required permit conditions and stipulations must be based on best available techniques (BAT). As already indicated in Chapter 4.4.3.6.5.2, the range of BAT for different industrial sectors are elaborated and published by the so-called ‘Sevilla Process’ (e.g. in [Schönberger, 2009]) in the form of the Best available techniques REFerence documents (BREFs). For the cement and lime industry, the first BREF was issued in 2001 [EC BREF CL, 2001]. In 2013, the revised version [EC BREF CLM, 2013] as well as the BAT Conclusions [EC CLM Conclusions, 2013] were issued. The BAT Conclusions are binding and directly applicable. However, the emission values associated with the application of BAT, as laid down in the BAT Conclusions, are not emission limit values. For that, the emission values have to be implemented into national legislation first which has to be done within one year after publishing the BAT Conclusions at the latest. Existing installations have to comply with the BREF Conclusions within four years after their publication at the latest [EU IED, 2010, Article 21(3)]. At the end of 2019, Germany still has not formally implemented the BREF Conclusions by amending the existing TA Luft [DE TA Luft, 2002]. So far, there is only a draft available for the required amendment [TA Luft draft, 2018].
5.2.4 Emission limit values (of the 17th BImSchV) – development and current status
The production of clinker and cement is associated with the emission to air of waste gas from different process sources such as waste gas from the kiln, the crushing plant, the clinker cooler, the coal silos etc. The emission limit values are set in TA Luft [DE TA Luft, 2002] except for the waste gas from the kiln if waste-derived fuels and raw materials are co-incinerated. From the environmental point of view, the emissions of waste gas from the kiln to air is by far the most relevant parameter. In case of co-incineration waste-derived fuels and raw materials, the emission limit values of the 17th BImSchV [DE 17th BImSchV, 2013] have to be met. This is for all German clinker production plants (with possibly one exception). Against this background, the development of the emission limit value of the 17th BImSchV is considered in detail. In Germany, the scope of the 17th BImSchV comprises [Landmann/Rohmer, 2018]:
- 68 solid municipal waste incineration plants, - co-incineration plants, especially in coal-fired power plants and in 34 clinker production plants, - 30 refuse-derived fuel power plants, - 30 hazardous waste incineration plants.
So, the co-incineration of waste-derived fuels and raw materials in clinker production plants is a substantial part of the scope. In 1990, the 17th BImSchV was issued [DE 17th BImSchV, 1990]. A major objective was to fix lower emission limit values for incineration plants compared to the regulation at that time in the TA Luft [DE TA Luft, 1986]. Concerning the number of parameters regulated and the emission limit values, there were not many changes in the past 30 years. This can be seen from Table 5.2. In this long period, only

Chapter 5
312 State of the art of the co-incineration of waste-derived fuels and raw materials in clinker/cement plants
one parameter was added (ammonia, in 2013) and some emission limit values were reduced (e.g. for nitrogen oxides and dust). The scope of the first 17th BImSchV from 1990 did not cover the co-incineration of wastes. This was introduced with the amendment in 2003 (see Table 5.2).
Table 5.2: 17th BImSchV - development of the emission limit values for mono waste incineration plants and for the co-incineration of waste in clinker production plants from 1990 to 2013; values in mg/Nm3, dry waste gas (changes from one version to the next are underlined and coloured)
The clinker/cement-specific changes made since 1990 are compiled in the synopsis in ANNEX VI. As a synopsis cannot be translated without losing track of the former and newer versions, it is in German. Only the headings are translated to English. The main purpose of the amendment of the 17th BImSchV in 1999 [DE 17th BImSchV, 1999] was to implement the Council Directive on the Incineration of hazardous Waste [EU IHW, 1994]. With this amendment, the threshold value of 40 % was introduced, i.e. the emission limit values for dedicated waste incineration plants apply for co-incineration plants (e.g. in clinker production plants) if the rated thermal input of hazardous waste is 40 % or higher. Due to the implementation of the Waste Incineration Directive [EU WID, 2000], major changes of the 17th BImSchV were introduced in 2003. Particularly, clinker/cement-specific requirements were introduced in an annex (see ANNEX VI of this document). In summary, the following main changes were made:
- Clear definition of mono waste incineration plants (whose sole, at least main, purpose is to incinerate waste) and co-incineration plants (whose main purpose is to produce energy or certain materials)
17. BImSchV - year of
version
Waste
inc ineration
plant
Co-inc iner.
in a CPP
Waste
inc ineration
plant
Co-inc iner.
in a CPP
Waste
inc ineration
plant
Co-inc iner.
in a CPP
Waste
inc ineration
plant
Co-inc iner.
in a CPP
Dust 10 - 10 20 10 20 5 10
Total organic carbon (TOC) 10 - 10 10 10 10 10 10
Carbon monoxide (CO) 50 - 50 * 50 * 50 *
Sulphur dioxide (SO2) 50 - 50 50 50 50 50 50
Nitrogen oxides (NOx) 200 - 200 500 200 200 150 200
Hydrogen chloride (HCl) 10 - 10 10 10 10 10 10
Hydrogen fluoride (HF) 1 - 1 1 1 1 1 1
Mercury (Hg) 0.05** - 0.03** 0.03** 0.03 0.03 0.03 0.03
Ammonia (NH3) - - - - - - 10 30
Emission l imit value for a
certain sampling period
Sum of cadmium and thallium
(Cd + Tl)0.05 - 0.05 0.05 0.05 0.05 0.05 0.05
Sum of ten heavy metals*** 0.5 - 0.5 0.5 0.5 0.5 0.5 0.5
sum of carcinogenic
compounds**** - - 0.05 0.05 0.05 0.05 0.05 0.05
PCDD/F***** 0.1 - 0.1 0.1 0.1 0.1 0.1 0.1
Legend
2013: 17th BImSchV as amended on 02.05.2013 (DE 17th BImSchV, 2013)
** until 2009, the emission limit value was set for a certain sampling period (i.e. not as daily mean value)
**** Sum of Arsenic (As), Benzo(a)pyrene (BaP), Cadmium (Cd), Cobalt (Co) and Chromium (Cr)
***** in nanogramme toxicity equivalents per standard cubic metre of wastegas (ng TEQ/Nm 3)
* The competent authority has to set an emission limit value in consideration of the emission limit value for mono waste incineration plants (50 mg/Nm 3 as daily mean value)
*** Sum of Antimony (Sb) + Arsenic (As) + Lead (Pb) + Chromium (Cr) + Cobalt (Co) + Copper (Cu) + Manganese (Mn) + Nickel (Ni) + Vanadium (V) + Tin (Sn)
2003: 17th BImSchV as amended on 14.08.2003 (DE 17th BImSchV, 2003)
2009: 17th BImSchV as amended on 27.01.2009 (DE 17th BImSchV, 2009)
1990 2003 2009 2013
Co-inciner. in a CPP = Co-incineration in a clinker production plant; standard oxygen content: 11 vol.-% for waste incineration plants and 10 vol.-% for the co-incineration in a CPP
1990: 17th BImSchV (DE 17th BImSchV, 1990)

Chapter 5
State of the art of the co-incineration of waste-derived fuels and raw materials in clinker/cement plants 313
- Reducing the application of the ‘Mixing Rule’28 as much as possible which had been wrongly or differently understood and interpreted by competent authorities resulting in unequal requirements for the installations concerned [Lübbe-Wolff, 1999]. However, concerning the emission of nitrogen oxides (NOx), the application of the ‘Mixing Rule’ only applied for a waste percentage higher than 60 % (of the rated thermal input). This means that at percentages lower or equal to 60 %, the less stringent emission limit value for NOx for clinker production plants applied (500 mg /Nm3) and only at percentages higher than 60 %, the calculated emission limit value according to the given percentages was fixed. Thus, at percentages of waste-derived fuels higher than 60 %, the emission limit value linearly decreased and reached at a percentage of 100 % the emission limit value of mono incineration plants (200 mg/Nm3) [Ludwig/Lahl, 2003]. With the amendment of the 17th BImSchV in 2013, the ‘Mixing Rule’ was abolished.
- Change of the ‘Threshold Rule’ with the objective to align the requirements for mono waste and co-incineration plants [DE 17th BImSchV-FedGov, 2003]. Co-incineration plants which use significant quantities of waste-derived fuels shall comply with the same emission limit values as mono waste incineration plants. For clinker production plants, the threshold value concerned is 60 %, i.e. if the rated thermal input of waste-derived fuels is higher than 60 %, the co-incinerating clinker production plant has to comply with the same emission limit values as mono waste incineration plants. The aforementioned threshold value for hazardous wastes, introduced in 1999, also applies.
- The introduction of the possibility to derogate from certain emission limit values is a very important change and has considerable implications on the emission of waste gas from clinker production kilns. Derogations are possible upon application to the competent authority for the parameters total organic carbon (TOC), sulphur dioxide (SO2), carbon monoxide (CO) and mercury (Hg). The derogation can only be granted if higher emission values occur because of the use of natural raw materials. However, it is explicitly prescribed that emission values higher than the emission limit values of the 17th BImSchV may not occur due to the co-incineration of waste. But the 17th BImSchV does not contain any proof to demonstrate that emissions exceeding the emission limit values are not associated with the input of waste-derived fuels or raw materials. This waste-derived fuels- or raw materials-related derogation is independent from the aforementioned ‘Threshold Rule’. When amending the 17th BImSchV in 2013, another raw-materials-related derogation option was introduced for ammonia.
The possibility to derogate from the fixed emission limit values in case it can be demonstrated that higher emissions result from the use of natural raw materials was, and still is, used by many operators. As the relevance of derogation is very high in practice, more detailed information is provided in the text box below.
28 The fixing of emission limit values according to the ‚Mixing Rule‘ means the individual calculation of them for each single waste co-incineration plant. Thereby, the emission limit values are calculated taking into account the percentage of used regular fuels (especially of coal) and the percentage of waste-derived fuels. This is foreseen because the emissions limit values for the combustion of regular fuels are less stringent than for waste incineration. The weighting is done on the basis of the rated thermal input percentage of waste-derived fuels compared to regular fuels. The ‘Mixing Rule’ follows the approach that the calculated emission limit value is as more stringent as higher the percentage of waste-derived fuels is [DE 17th BImSchV-FedGov, 2003; Lahl/Ludwig, 2003].

Chapter 5
314 State of the art of the co-incineration of waste-derived fuels and raw materials in clinker/cement plants
For the first time, the Waste Incineration Directive [EU WID, 2000] contained the possibility for derogating from the fixed emission limit values for the parameters sulphur dioxide (SO2) and total organic carbon (TOC) whereas TOC and VOC are practically the same. According to the very first official draft for the WID, specifically for cement plants, it is possible that “Exemptions may be authorised by the competent authority in cases where TOC and SO2 do not result from the incineration of waste” [EC WID Proposal, 1998; EC WID Proposal, 1999]. This means that competent authorities can set higher emission limit values than 50 mg/Nm3 for SO2 and 10 mg/Nm3 for TOC (and also as daily mean values). It could not be identified why and in which way this possibility of derogation was introduced. But at least for TOC, and also for carbon monoxide (CO), it seems to be very likely that the derogations were based on investigations of the German cement industry as, for instance, published by Zunzer [Zunzer, 2002]. The WID did not contain an emission limit value for carbon monoxide (CO) but stated that “emission limit values for CO can be set by the competent authority” [EC WID Proposal, 1999]. In its first report on the proposal of the European Commission, the European Parliament expressed its concern on the possibility of derogation as follows: “Because the competent authority, in the Commission proposal, can grant a derogation for the emission limit values of SO2 and TOC, this opens the door to less stringent standards. It can also lead to unfair competition. The cement kilns need to provide clean base materials and if others can be used there is a need to clean the flue gases. If cement kilns co-incinerate waste, this will be a considerable source of revenue. High sums are charged for the reception of dangerous waste. This extra income and the savings on fuel costs can be used to cover the costs of flue gas purification” [EP WID Proposal, 1999] but did not repeat this concern in its second and third reports [EC WID Proposal, 2000a; EC WID Proposal, 2000b]. When implementing the WID into legislation, Germany introduced the possibility for derogations not only for SO2 and TOC but also for CO and Hg. The derogations were controversially discussed by the different parliamentary committees [DE 17th BImSchV-Committees, 2003]. The economic committee repeatedly stressed that ”The CO and TOC emissions of cement works mainly derive from the raw material”, e.g. in [DE 17th BImSchV-Committees, 2003] and [DE 17th BImSchV-Federal Council, 2003]. However, this statement is not correct. As explained in Chapter 4.4.3.12 (VOC) and Chapter 4.4.3.13 (CO), it is only true for the kiln with the main burner where the temperature level and the residence time make sure that the VOC and CO level is very low. But it is not true for the secondary firing from where elevated VOC/TOC and CO emissions can derive from the use of waste-derived fuels. Both, the WID, and consequently the 17th BImSchV as well, require that the exemption may be only authorized by the competent authority in cases where TOC, CO, SO2 and Hg emissions do not result from the incineration of waste. Surprisingly, this regulation is not linked to a proof to demonstrate that no additional emissions to air are associated with the co-incineration of waste-derived fuels or raw materials. When implementing the Industrial Emissions Directive [EU IED, 2010] in to German law [DE IED Ordinance, 2013a; DE IED Ordinance, 2013b; DE IED Act, 2013; DE IED and ordin., 2013], the aforementioned possibility for derogation was maintained without changes. In fact, one more parameter was introduced for possible derogation, ammonia (NH3).
ANNEX VI contains the synopsis of the development of the clinker/cement-specific regulations of the 17th BImSchV from the first issue in 1990 to date. Thereby, a distinction is made between the main text (part 1) and the annex (part 2). This reveals that the requirements for mono and co-incineration plants were largely aligned in 2003 but with the possibility to derogate from the emission limit values for TOC, CO, SO2, Hg and NH3. Thus, much higher emission limit values can be fixed in the individual permit concerned. This possibility is often used in practice (see Table 4.37). As already indicated, the regulation does not prescribe a need for specific proof to demonstrate that higher emission levels are not associated with the use of waste-derived fuels and raw materials. It is shown in Chapter 4.4.3.12 (for VOC) and Chapter 4.4.3.13 (for CO) as well as in [Schönberger/Waltisberg, 2014], that many elevated values cannot be explained by the release of VOC and CO emissions from natural raw materials, but likely arise from the use of waste-derived fuels and raw materials. So, there is a significant deficit in proper permitting and enforcement.

Chapter 5
State of the art of the co-incineration of waste-derived fuels and raw materials in clinker/cement plants 315
5.3 Required adaptation of existing regulations/permits
In the majority of permits (about 90 %), the competent authorities applied the derogation option for VOC/TOC (see Chapter 4.4.3.1). This means that emission limit values higher than 10 mg C/Nm3 were or are fixed [Schönberger/Tebert/Lahl, 2012]. The annually repeated statement of the VDZ [VDZ, 1999 … VDZ, 2018] that TOC/VOC emissions do not originate from combustion cannot be confirmed at all. On the basis of the presented monitoring results, it is obvious that significant percentages of TOC/VOC emissions are associated with the co-incineration of wastes (see Chapter 4.4.3.1). The same is true for carbon monoxide (CO)29. The TOC/VOC and CO emission from natural raw materials can be determined by means of the expulsion test [Waltisberg, 1998; Zunzer, 2002]. With this test, the emissions to air resulting from wastes and waste-derived fuels can be determined and can be distinguished from emissions from pre-heating the kiln feed. This is especially relevant with respect to emissions to air of CO, VOC, benzene and SO2. The 17th Ordinance to the Clean Air Act would be the best option to place the introduction of this test into legislation. So far, the derogation has not been linked to quantitative evidence. Such evidential proof has already been proposed [Lahl et al., 2012; Schönberger et al., 2012]. As a consequence, this evidential proof should be introduced into regulation and enforcement practice. In addition, the regular calibration of continuous monitoring systems for the different parameters should be prescribed in detail giving reference to EN 14181 [EN 14181, 2014] as in many cases, the quality management requirements for the online monitoring of missions to air are not fulfilled. In order to improve this situation, the annual external emission monitoring by certified third-party measurement institutes should not only determine the emissions to air but should also check the in-house continuous self-monitoring (external check of the continuous monitoring of emissions to air). Thus, the operator of the clinker production plant can verify the practiced continuous self-monitoring in addition to the application of EN 14181. Further, the operators of clinker production plants shall be required to submit the annual emission curves for all parameters monitored continuously (see many of them in ANNEX IV and in Chapter 4.4.3). This provides much more meaningful information and allows significantly better interpretation of the emission situation of a plant, including important correlations between different parameters, than the frequency distribution of emission values that operators often submit so far.
29 Surprisingly, the latest conclusions on best available techniques do not adequately consider the TOC/VOC issue associated with the co-incineration of waste-derived fuels [EC BREF CLM, 2013; EC CLM Conclusions, 2013]. There is only the conclusion that “BAT is to avoid feeding raw materials with a high content of VOC into the kiln via the raw material feeding rout” [EC CLM Conclusions, 2013, p 20]. There is no single conclusion on secondary firing in the riser duct or in a precalciner which is a significant gap to be filled in the future revision. The same is true for CO emissions [BREF CLM, 2013; EC CLM Conclusions, 2013]. There is only a conclusion on the minimisation of CO strips in case of application of electrostatic precipitators for de-dusting [EC CLM Conclusions, 2013, p 20].

Chapter 6 - Conclusions and recommendations
316 State of the art of the co-incineration of waste-derived fuels and raw materials in clinker/cement plants
6 CONCLUSIONS AND RECOMMENDATIONS
6.1 Right of access to environmental information
The emission data and the permits for this treatise were gained from competent authorities using the right of access to environmental information based on the Aarhus Convention [UNECE Aarhus Convention, 1998] which was implemented in the European Union with the Directive on Public Access to Environmental Information [EU Info, 2003] and its implementation in Germany with the Act on Environmental Information in 2005 [DE UIG, 2014] which consequently was implemented by the 16 German Federal States. It is the only known case where emission data was collected for a whole industrial sector of a big industrialised country, i.e. for all installations concerned. It could be argued that in case of clinker/cement production, there is a relatively small number of installations (34 installations) and thus it is not that demanding but, nevertheless, it could be demonstrated that this comparatively new legal instrument properly works all over Germany, i.e. for all the installations, the permits and emission data could be collected by applications to the competent authorities (see Table 4.37). Further, it may be argued that the use of the right of access to environmental information does work in Germany but may not do so in other European Member States. This may be true. So, it is recommended to apply this approach in other Member States to see whether and how it works and which difficulties and constraints may occur. One of the main objectives of the Aarhus Convention is to counter the lack of enforcement by enabling efficient public participation [Almeling, 2008, p 31]. Thus, this instrument can be used for controlling public administrations [Almeling, 2008, p 33]. In case of industrial installations, these are the so-called competent authorities [EU IED, 2010] as they are directly responsible for lack of enforcement. Important results regarding the collection of environmental operating permits and emission data were already published in 2014 [Schönberger/Waltisberg, 2014]. From the Federal Member States Baden-Württemberg, Bavaria and North Rhine-Westphalia, oral information was obtained that this publication initiated significant improvements in a number of cases. As there is no systematic evaluation of the impact in the clinker/cement sector, it is recommended to repeat the exercise again in order to see the progress which may have happened since 2010. It has to be stressed that the successful application of the right of access to environmental information requires great expertise and experience both for obtaining the information requested and its competent detailed evaluation and publication of results. In addition, it required a long breath, i.e. the collection and evaluation of data may require months and years. Nevertheless, the introduced right of access to environmental information is a significant step forward and, as demonstrated in this treatise, it can be successfully applied, at least in Germany. As a consequence, it should be used much more often in the various sectors. The same is true for other European Member States, both to see whether there are obstacles to obtaining the data and limitations and to evaluate the quality of permitting and enforcement.
6.2 The use of waste-derived fuels and raw materials is mainly economy-driven
In the past 40 years, the development of the clinker production process was strongly influenced by a steady increase in energy efficiency and a strong increase in the use of waste-derived fuels and raw materials which was and is mainly driven by economic considerations (see Chapter 4.3.2.3.7).
6.3 How to submit emission data
In Germany, the operators of clinker production plants have to annually submit the self-monitoring data to competent authorities. Usually, the permits just stipulate to send a report with the continuous monitoring results but do not prescribe a certain format or specific evaluations. The operators often provide the competent authorities only with frequency distributions of the continuously self-

Chapter 6 - Conclusions and recommendations
State of the art of the co-incineration of waste-derived fuels and raw materials in clinker/cement plants 317
monitored parameters. This is not sufficient as it does not show the time variation curve, i.e. the time variation curve of the daily mean values. These emission curves show whether the emission situation is stable or varying or whether there is a trend towards higher or lower values. Against this background, it is strongly recommended that the operators should submit the emission curves along with detailed comments and explanations. This also includes annual mean values and related standard deviations. The operators also should provide the excel files concerned. Then, the competent authorities could undertake their own evaluations, such as correlations between different parameters, e.g. between TOC and CO, NOx and CO or Hg and temperature. In ANNEX IV, it is demonstrated by many examples how to evaluate emission to air data, specifically by emission curves and correlations as they are very helpful to understand the emissions to air better. It is recommended to develop a harmonised format for evaluating emission to air data gained from continuous self-monitoring. For this purpose, the methodology applied and shown in ANNEX IV for all German clinker production plants may be taken into account.
6.4 Calibration of self-monitoring devices
In ANNEX IV, the evaluation of emission data also reveals that in a number of cases, the self-monitored data is not reasonable, possibly due to incorrect measurements. Therefore, it is recommended that the regular calibration of continuous monitoring systems for the different parameters should be prescribed in detail giving reference to EN 14181 [EN 14181, 2014]. In addition, in order to improve the accuracy of continuous self-monitoring, the annual external emission monitoring by certified third-party measurement institutions should not only determine the emissions to air but should also check the in-house continuous self-monitoring (external check of the continuous monitoring of emissions to air). Thus, the operator of the clinker production plant could verify the practiced continuous self-monitoring in addition to the application of EN 14181.
6.5 Harmonisation of environmental permits
The evaluation of permits reveals that there are significant differences. The harmonised regulation of the following aspects should be a priority: - parameters for which emission limit values (ELV) need to be fixed, - parameters which need to be self-monitored continuously, - list of waste-derived fuels and raw materials which are allowed to be used, - stipulations concerning the feeding point for certain wastes.
6.5.1 Parameters for which emission limit values need to be fixed
It is surprising that permits for 16 operators, i.e. half of the 34 plants, did not have an ELV for TOC in 2011 and that 20 operators, i.e. 60 %, did not have an ELV for CO in 2011 although this is prescribed. This is a significant lack of enforcement which has to be improved upon. Harmonisation is also needed for benzene (only 8 operators, i.e. only 25 %, had an ELV) as well as for SO2, Hg, HCl and HF (see Chapter 4.4.3.1). This statement also concerns the year 2011. In the meantime, some improvement may have happened. However, a systematic equal regulation is urgently required. Also the ELVs as such, defined as daily mean values, need to be harmonised. The ELVs for dust vary within a relatively small range (10 – 20 mg/Nm3). The same is true for NOx (200 – 500 mg/Nm3) and HCl (10 – 30 mg/Nm3), HF (1 – 3 mg/Nm3) and Hg (28 – 50 mg/Nm3) whereas the range is bigger for SO2 (50 – 400 mg/Nm3) and TOC (20 – 100 mg/Nm3), and is extremely wide for CO (50 – 6250 mg/Nm3) (see Chapter 4.4.3.1).

Chapter 6 - Conclusions and recommendations
318 State of the art of the co-incineration of waste-derived fuels and raw materials in clinker/cement plants
6.5.2 Parameters which need to be self-monitored continuously
In 2011, only 18 operators, i.e. about half, did continuously monitor TOC and 20 operators, i.e. 60 %, did monitor CO. Also here, harmonization is urgently needed. This statement also concerns the year 2011. In the meantime, some improvement may have happened. However, systematic and consistent application of regulation is strongly required.
6.5.3 List of waste-derived fuels and raw materials which are allowed to be used
In 2011, there were considerable differences concerning the lists of waste-derived fuels and raw materials which were permitted to be used (see Chapter 4.3.2.3.3.2). Whereas there are permits which only allow a small number of different waste-derived fuels (see ANNEX I and ANNEX II as two examples), there are six permits which allow the use of very long lists (lists with more than 300 different waste codes) (see ANNEX III as an example). Five of these six permits also allow the use of dangerous wastes, especially from the chemical industry. Against this background, it is recommended to follow the approach of North Rhine-Westphalia (NRW) to develop a positive list of waste-derived fuels which can be used. NRW has developed a guidance document which contains the so-called “Positive List” of waste-derived fuels for which the “use for co-incineration has been permitted and permanently practiced and sufficient experience from governmental inspections has been gained” [NRW MUNLV, 2005]. This positive list is presented in Table 4.14 and may be further developed and adapted.
6.5.4 Stipulations concerning the feeding point for certain wastes.
The different possible feeding points are described in Chapter 4.3.3. It is recommended that for each waste-derived fuel or raw material, the feeding point should be fixed in the permit in order to make sure that no additional emission to air occurs which c is in compliance with the requirements of the 17th BImSchV (see Chapter 6).
6.5.5 Model environmental operating permits
In order to achieve harmonised environmental operating permits in Germany, it is recommended that the federal government, together with the German federal states develop a model permit which forms the basis of all permits issued for clinker production plants. Such a model permit may be proposed and made available to the European Commission and all European Member States.
6.6 Expulsion test
The expulsion test is a reliable method to determine the release of organic compounds from raw materials, and thus the contribution of the preheating phase to the overall emissions can be reliably measured in the laboratory (see Chapters 3.3.1.2.2 - 3.3.1.2.7). This is also valid for single organic compounds such as benzene and many other organic compounds. For the moment, there is no other laboratory method known to determine the release of organic compounds from preheating kiln raw meal. The testing of the natural raw materials reveals the baseline of TOC and CO emissions, and also for other organic compounds. According to current legislation, the co-incineration of waste-derived fuels and raw materials may not be associated with emissions to air higher than those deriving from natural raw materials. Of course, a reasonable range shall be developed to cover variations in raw material composition and test method accuracy. Against this background, it is strongly recommended to introduce the expulsion test into legislation to quantify the emissions to air from natural raw materials which may not be exceeded by the use of waste-derived fuels and raw materials. In the future, the scope of the expulsion test should be extended, especially for waste-derived fuels. For this purpose, research and development work is urgently required. The basic concept has already been designed. This is significant as VOC and CO can also be emitted due to incomplete combustion of wastes in secondary firing (riser duct) or in the precalciner.

Chapter 6 - Conclusions and recommendations
State of the art of the co-incineration of waste-derived fuels and raw materials in clinker/cement plants 319
6.7 Required amendment of the 17th BImSchV
The expulsion test needs to be introduced to determine the VOC, CO and benzene emissions from natural raw materials. On the basis of this data, derogations from the ELVs can be determined and a clear distinction can be made of emissions associated with natural raw materials and waste-derived fuels and raw materials (see Chapter 5.3). The annual external emission monitoring by certified third-party measurement institutes should not only determine the emissions to air but should also check the in-house continuous self-monitoring (external check, or validation, of the continuous monitoring of emissions to air). Thus, the operator of the clinker production plant can verify the practiced continuous self-monitoring in addition to the application of EN 14181. The latter also need to be prescribed more precisely. Further, the operators of clinker production plants shall be required to submit the annual emission curves for all parameters monitored continuously (see many of them in ANNEX IV and in Chapter 4.4.3) (see Chapter 5.3). The terms ‘state of the art” and ‘best availale techniques (BAT)’ are understood to be synonyms. They comprise both prevention (process- and production-integrated) and control (also called abatement or end-of-the-pipe) techniques.

References
320 State of the art of the co-incineration of waste-derived fuels and raw materials in clinker/cement plants
REFERENCES
A [ADEME, 2009]
Agence de l’Environnement et de la Maîtrise de l’Enérgie (ADEME), Etat de l’art de la valorisation énergétique des déchets non dangereux en cimenteries – Situation actuelle, enjeux et perspectives, Revised final report, Angers, December 2009, www2.ademe.fr, (accessed 04.08.2012
[AiF, 2007] Angewandte industrielle Forschung (AiF), AiF-Forschungsvorhaben-Nr. 14747 N: Kontinuierliche Messung von Quecksilber-Emissionen im Abgas von Drehrohrofenanlagen der Zementindustrie (2007)
[AiF, 2008] Angewandte industrielle Forschung (AiF), AiF-Forschungsvorhaben-Nr. 14547 N: Betriebstechnische Möglichkeiten zur Minderung von Hg-Emissionen an Drehrohranlagen der Zementindustrie (2008)
[AIF 15407 N, 2010] Publication about the project “Process optimization of precalciners in cement plants by means of CFD methods with consideration of aspects concerning alternative fuels and NOx optimisation” (short version), sponsored by AIF (project number AIF 15407 N), (2010)
[Almeling, 2008] Almeling, S., Die Aarhus-Konvention - Auswirkungen auf das deutsche Recht, Verlag Dr. Köster, Berlin (2008)
[Alwast, 2007] Alwast, H., Ersatzbrennstoffmarkt-Entwicklung in Deutschland – Mengen, Preise, Markttendenzen, 19. Kasseler Abfallforum und Bioenergieforum on 03.05.2007, http://bisa-bernburg.de/wp-content/uploads/Vortrag_Alwast_Kassel_2007.pdf (accessed 23.07.2011)
[Alwast, 2012] Alwast, H.; Was ändert sich mit dem neuen Kreislaufwirtschaftsgesetz für die Stoffströme und Abfall-behandlungskapazitäten, Manuskript zum Vortrag bei der Berliner Abfallwirtschafts- und Energiekonferenz „Optimierung der Abfallverbrennung“ am 30. Januar 2012 in Berlin (2012)
[Alwast/Birnstengel, 2010] Alwast, H.; Birnstengel, B.; Verbrennungs- und Ersatzbrennstoffmarkt in Deutschland und Europa, Müllhandbuch MuA, Lfg. 2/10 (2010)
[Ammenberg et al., 2011] Ammenberg, J.; Feiz, R.; Helgstrand, A.; Eklund, M.; Baas, L., Industrial symbiosis for improving the CO2-performance of cement production – Final report of the CEMEX-Linköping University industrial ecology project, Linköping/Sweden (2011), http://liu.diva-portal.org/smash/get/diva2:474457/FULLTEXT01 (accessed 17 March 2013)
[Andrijewski, 2004] Andrijewski, M., Poland, National implementation plan for the Stockholm Convention. Enabling activities to facilitate early action on the implementation of the Stockholm Convention on Persistent Organic Pollutants (POPs) (2004)
[Asthana/Patil, 2006] Asthana, S.R.; Patil, R.K., Use of alternative fuels in Indian cement industry, Advances in Energy Research (AER – 2006): Proceedings of the 1st National Conference on Advances in Energy Research, Macmillan India (2006) 347-349

References
State of the art of the co-incineration of waste-derived fuels and raw materials in clinker/cement plants 321
[AT Guidelines, 2008] Österreichisches Lebensministerium (Austrian Federal Ministry of Agriculture, Forestry, Environment and Water Management), Richtlinie für Ersatzbrennstoffe (Guidelines for Waste Fuels) (2008)
[AT Guidelines, 2008] Bundesministerium für Land- und Forstwirtschaft, Umwelt- und Wasserwirtschaft, Richtlinie für Ersatzbrennstoffe (2008)
[AT Incineration Ord., 2010] Austrian Waste Incineration Ordinance: „Verordnung des Bundesministers für Land- und Forstwirtschaft, Umwelt und Wasserwirtschaft und des Bundesministers für Wirtschaft, Familie und Jugend über die Verbrennung von Abfällen (Abfallverbrennungsverordnung – AVV)“. BGBl. II Nr. 389/2002, amended in 2010 BGBl. II Nr. 476/2010
[AT Ordinance, 2011] Anonymous, Verordnung des Bundesministers für Arbeit, Soziales und Konsumentenschutz über Grenzwerte für Arbeitsstoffe sowie über krebserzeugende und über fortpflanzungsgefährdende (reproduktionstoxische) Arbeitsstoffe (Grenzwerteverordnung 2011 – GKV 2011), BGBl. II Nr. 429/2011 (2011)
[AT VÖZ, 2011] Vereinigung der österreichischen Zementindustrie (VÖZ), Emissionen aus Anlagen der österreichischen Zementindustrie, Berichtsjahr 2010 (2011)
B [Baccini/Brunner, 1991]
Baccini, P.; Brunner, P.H., Metabolism of the Anthroposhere, Springer Verlag Heidelberg (1991)
[Baier/Menzel, 2011] Baier, H.; Menzel, K., Alternative fuels in the cement industry, Zement-Kalk-Gips 64 (2011), No. 10, 50-58
[Baden-Württemberg, 2002] Ministry for the Environment and Traffic (MinisteriumfürUmwelt und Verkehr) Baden-Württemberg, Sewage Sludge Disposal (Klärschlammentsorgung), Brochure (2002) (in German) and press release ofthe Ministry for Environment and Traffic concerning its recommendation tostop the disposal of sewage sludge on agricultural land – issued on 2 December 2002, http://www.um.baden-wuerttemberg.de/servlet/is/3162/Klaerschlammentsorgung.pdf?command=downloadContent&filename=Klaerschlammentsorgung.pdf (accessed 07.09.2012)
[Bailey, 2001] Bailey, R.E., Global hexachlorobenzene emissions, Chemosphere 4 (2001) 167-182
[Ballschmiter/Zell, 1980] Ballschmiter, K.; Zell, M., Analysis of polychlorinated biphenyls (PCB) by glass capillary gas chromatography: composition of technical Arochlor- and Clophen-PCB mixtures, Fresenius Zeitschrift für Analytische Chemie, 302(1) (1980) 20-31
[Ballschmiter et al., 1992] Ballschmiter, K.; Bacher, R.; Mennel, A.; Fischer, R.; Riehle, U.; Swerev, M., The determination of chlorinated biphenyls, chlorinated dibenzodioxins, and chlorinated dibenzofurans by GC-MS, Journal of High Resolution Chromatography 15(4) (1992) 260-270

References
322 State of the art of the co-incineration of waste-derived fuels and raw materials in clinker/cement plants
[Barnett, 2013] Barnett, K., Final Portland Cement Rule 2013, http://www.unep.org/chemicalsandwaste/Portals/9/RoundTableMercury_6_24-13-final.pdf (accessed 15 December 2013)
[Bauer/Hoenig, 2010] Bauer, K.; Hoenig, V., Energy efficiency of cement plants, Cement International 8 (2010) No. 3, 50-57
[Bayer.LAU, 2007] Bayerisches Landesamt für Umwelt, Möglichkeiten und Grenzen der SNCR-Technik bei einer klassischen Drehrohrofenanlage der Zementindustrie (2007)
[Bavaria, 2005] Bavarian Ministry for Environment and Health, New strategy concerning the disposal of sewage sludge, http://www.stmug.bayern.de/umwelt/abfallwirtschaft/klaerschlamm/neuausrichtung.htm, the Bavarian Parliament has decided on 20.07.2005 to increase the incineration of sewage sludge (Landtags-Drucksachen 15/3285, 15/3777 and 15/3883 dated 20.07.2005)(accessed 07.07.2012)
[BBU, 2013] Bundesverband Bürgerinitiativen Umweltschutz e.V. (BBU), Arbeitsbereich Umweltinformationsrecht: Beispiel für die Nutzung des Umweltinformationsrechts (34 deutsche Zementwerke), website in German (Federal Association of Citizens' Initiatives on Environmental Protection (BBU),The right of access to environmental information as one field of activity, example for using the right of access to environmental information: 34 German cement works), http://www.bbu-online.de/Arbeitsbereiche/Umweltinformationesrecht/Arbeitsbereiche%20Umweltinformationsrecht.html (accessed in September 2013)
[Beckmann et al., 2012] Beckmann, M.; Pohl, M.; Bernhardt, D.; Gebauer, K., Criteria for solid recovered fuels as a substitute for fossil fuels – a review, Waste Management & Research 30 (2012) No. 4, 354-369
[Bech/Mishulovich, 2004] Bech, C.; Mishulovich, A., Preheaters and precalciners, in (Bhatty et al., 2004) 269-286
[Bell, 2007] Bell, J., Concrete energy savings, World Alliance for Decentralized Energy (WADE) (2007)
[Bhatty, 1995] Bhatty, J.I., Role of minor elements in cement manufacture and use, Research and Development Bulletin RD109T of the Portland Cement Association/USA (1995)
[Bhatty et al., 2004] Bhatty, J.I., Miller, F.M., Kosmatka, S.H. (Eds), Innovations in Portland Cement Manufacturing, PCA, Skokie, Illinois, USA (2004)
[BiCon, 2003] Bally, A., Altreifenentsorgung – Was ist ökologisch sinnvoll?, BiCon AG, CH Kreuzlingen (2003)
[Bilitewski, 2007] Bilitewski, B.; Ist die MBA gescheitert?, in: Faulstich, M.; Urban, I.; Bilitewski, B. (Hrsg.), 12. Fachtagung Thermische Abfallbehandlung, Schriftenreihe des Fachgebietes Abfalltechnik Universität Kassel (2007) 225-229
[Binninger, 2009] Binninger, T.; Bypassing problems, International Cement Review (2009), No. 5, pp 67-69

References
State of the art of the co-incineration of waste-derived fuels and raw materials in clinker/cement plants 323
[Binninger/Schulze, 2016] Binninger, T.; Schulze, K., Regenerative thermal oxidation in the cement industry – technology and operation. In: Thomé-Kozmiensky, K. J.; Thiel, S. (eds.): Waste Management, Volume 6, TK Verlag Karl Thomé-Kozmiensky (2016) 417-428
[Bodendiek, 2004] Bodendiek, N., NOx-Minderung durch gestufte Verbrennung und deren Wechselwirkung mit dem SNCR-Verfahren bei Vorcalcinieranlagen der Zementindustrie, Dissertation an der Fakultät für Bergbau, Hüttenwesen und Maschinenwesen der Technischen Universität Clausthal (2009)
[Boesch et al., 2009] Boesch, M.E.; Koehler, A.; Hellweg, S., Model for cradle-to-gate life cycle assessment of clinker production, Environmental Science & Technology 43 (2009) 7578-7583
[Boesch/Hellweg, 2010] Boesch, M.E.; Hellweg, S., Identifying improvement potentials in Cement Production with Life Cycle Assessment. Environmental Science and Technology 44 (2010) 9143-9149
[Boneß et al., 2013] Boneß, M.;Kanefke, R.; Vosteen, B.W., Neue Verfahren zur Minderung und Erfassung von Quecksilber-Emissionen in der Abgasbehandlung, in: Thomé-Kozmiensly, K.J.; Beckmann, M. (Hrsg.), Energie aus Abfall, Band 10, TK Verlag Thomé-Kozmiensly, Neuruppin/Germany (2013)
[Braungart et al., 1999] Braungart, M.; Eickhoff, U.; Ketelhut, R. (all EPEA GmbH, Hamburg/Germany), Gallenkemper, B.; Flamme, S.; Walter, G. (all INFA, Ahlen/Germany), Vermeiden durch Verwerten, Untersuchung zur Umwelt- und Gesundheitsverträglichkeit von Substitut-Brennstoffen, Rethmann (ed.) Entsorgungswirtschaft GmbH & Co. KG, Region West, Bochum-Gerthe/Germany (1999)
[BVSE, 2010] Bundesverband Sekundärrohstoffe und Entsorgung e.V. (BVSE), Germany, Ersatzbrennstoffe: Marktbericht 2009/2010 (2010),
http://www.bvse.de/20/4197/Ersatzbrennstoffe:%20Marktbericht%202009/2010, accessed 04.08.2012)
C [CAC, 2011]
Cement Association of Canada: Canadian Cement Industry, Sustainability Report 2010 (2011)
[Carrasco et al., 2002] Carrasco, F.; Bredin, N.; Heitz, M., Gaseous contaminant emissions as affected by burning scrap tires in cement manufacturing, Journal of Environmental Quality 31 (2002) 1484-1490
[CEMBUREAU, 1999] CEMBUREAU, Environmental Benefits of Using Alternative Fuels in Cement Production, A life cycle approach, Brussels/Belgium (1999)
[Cembureau, 2009] Cembureau, Sustainable Cement Production – Co-processing of alternative fuels and raw materials in the European cement industry (2009)
[CEMBUREAU BAT, 1999] CEMBUREAU – The European Cement Association, “BEST AVAILABLE TECHNIQUES”FOR THE CEMENT INDUSTRY - A contribution from the European Cement Industry to theexchange of information and preparation of the IPPC BATREFERENCE Document for the cement industry (1999)
[CEMEX, 2009] CEMEX, Gemeinsame Umwelterklärung 2010, Zementwerke Beckum und Rüdersdorf (2009)

References
324 State of the art of the co-incineration of waste-derived fuels and raw materials in clinker/cement plants
[Cemsuisse, 2012] Verband der Schweizerischen Zementindustrie, Zement – Kennzahlen 2011 (2012)
[CEN, 2002] European Committee for Standardization (CEN), De Jongh, G.; Fankenhaeuser, M., European Standardisation of Solid Recovered Fuels, http://www.google.de/#hl=en&tbo=d&sclient=psy-ab&q=De+Jongh+European+standardisation+of+Solid+Recovered+fuels&oq=De+Jongh+European+standardisation+of+Solid+Recovered+fuels&gs_l=serp.12...39217.62919.0.63950.60.53.0.0.0.0.2719.24067.0j12j24j5j2j1j2j1j3j2.52.0.les%3B..0.0...1c.1.2.serp.KxoHndvyrC4&pbx=1&bav=on.2,or.r_gc.r_pw.r_qf.&fp=58a1b92c094174ef&biw=1253&bih=764 (2002) (accessed 07.11.2012)
[CEN, 2006] European Committee for Standardization (CEN), Stationary source emissions – Determination of the mass concentration of PCDDs/PCDFs and dioxin-like PCBs – Part 4: Sampling and analysis of dioxin-like PCBs, final draft prCEN/TS 1948-4 (KRdL-4/1/13.2 N 2006-19) (2006)
[CEN/TC 343, 2011] Frankenhaeuser, M., Reply to the ECOS appeal against ratification of EN 15359 (see (ECOS, 2011a) in the function of Frankenhaeuser as chairman of the CEN Technical Committee 343, dated 14.03.2011
[CEN, 2012] European Committee for Standardization (CEN), Draft minutes on the 10th plenary meeting of CEN/TC 343 in Brussels on 7 February 2012
[CH BUWAL, 1997] Bundesamt für Umwelt, Wald und Landschaft (BUWAL), Abfallentsorgung in Zementwerken – Thesenpapier -, Umwelt-Materialien Nr. 70 (1997)
[CH BUWAL, 2005] Bundesamt für Umwelt, Wald und Landschaft (BUWAL), Richtlinie Entsorgung von Abfällen in Zementwerken, 2. Aufl. (2005)
[Chatterjee, 2011] Chatterjee, A.K., Chemistry and engineering of the clinkerization process – Incremental advances and lack of breakthroughs, Cement and Concrete Research 41 (2011) 624-641
[ChemRisk, 2009] ChemRisk LLC, Tyre generic exposure scenario end of life tyre guidance (2009)
[Chen et al., 2010] Chen, C.; Haberta, G.; Bouzidib, Y.; Jullien, A.; Venturac, A., LCA allocation procedure used as an incitative method for waste recycling: An application to mineral additions in concrete, Resources, Conservation and Recycling 54 (2010) 1231–1240
[Cho et al., 2014] Cho, Y.; Kim, G.B.; Cho, Y.S.; Choi, M.S.; Ryu, S.H.; Choi, S.H.; Park, Y.K.; Choi, J.W., Polycyclic aromatic hydrocarbons exposure in residents living near a cement factory with kilns, International Archives of Occupational and Environmental Health 87 (2014) 889-896
[Cong-xi et al., 2010] Cong-xi, T.; Lin, Z.; Wei-min, Y.; Xiao-yan, L., A correlation between the combustion of fuels and the design of calciners, Zement-Kalk-Gips 63 (2010) No. 4, 59-67
[Consultic, 2012] Lindner, C.; Produktion, Verarbeitung und Verwertung von Kunststoffen in Deutschland 2011 – Kurzfassung, Consultic Marketing & Industrieberatung GmbH, DE-Alzenau (2012)
[Councell et al., 2004] Councell, T.B.; Duckenfield, K.U.; Landa, E.R.; Callender, E., Tire-wear particles as a source of zinc to the environment, Environmental Science & Technology 38 (2004), No 14, 4206-4214

References
State of the art of the co-incineration of waste-derived fuels and raw materials in clinker/cement plants 325
[CRC Handbook, 1976] Weast R.C., CRC Handbook of Chemistry and Physics 1976-1977, CRC Press, Inc., 57rd edition (1976), D-185-D-191
[CRC Handbook, 1995] Lide, D.R., CRC Handbook of Chemistry and Physics 1995-1996, CRC Press, Inc., 76rd edition (1995), 6-77 and 6-110
[CRC Handbook, 2012] Haynes, W.M.; Lide, D.R.; Bruno, T.J., CRC Handbook of Chemistry and Physics 2012-2013, CRC Press, Taylor&Francis Group Boca Raton/USA, 93rd edition (2012), 6-88-9-92
[CRI/FORCE/ifeu, 2009] Copenhagen Resource Institute/Force Technology/Institut für Energie- und Umweltforschung Heidelberg GmbH, Ökobilanzieller Vergleich zweier Verwertungsalternativen für Altreifen: Stoffliche Verwertung und Mitverbrennung im Zementofen – Kurzfassung (2009)
[Crowley, 2010] Crowley, D., Cement Kiln Mercury Reduction Strategies, a Case Study in Materials Management, Manuscript for the presentation given at 52nd IEEE/PCA/IAS Cement Industry Technical Conference held from 28 March – 1 April 2010 in Colorado Springs/USA (2010)
[Curran, 2007] Curran, M.A., Co-product and input allocation approaches for creating lifecycle inventory data: a literature review, International Journal of Life Cycle Analysis (2007) 65–78 (special issue)
D [Dandres et al., 2011]
Dandres, T., Gaudreault, C., Tirado-Seco P., Samson, R. Assessing non-marginal variations with consequential LCA: Application to European energy sector. Renewable and Sustainable Energy Reviews 15 (6), 3121-3132
[Danish EPA, 2013] Nielsen, O.-K., Plejdrup, M.S., Winther, M., Nielsen, M., Fauser, P., Mikkelsen, M.H., Albrektsen, R., Hjelgaard, K., Hoffmann, L., Thomsen, M., Bruun, H.G. (2013). Danish emission inventory for hexachlorobenzene and polychlorinated biphenyls. Aarhus University, DCE – Danish Centre for Environment and Energy, 65 pp. Scientific Report from DCE – Danish Centre for Environment and Energy No. 103, http://www.dce2.au.dk/pub/SR103.pdf (accessed 20.03.2017)
[Danuvola/Freimann, 2006] Danuvola, L.; Freimann, W., Chlorine Bypass, World Cement (January 2006) pp 107-111
[DE BImSchG, 2013] Gesetz zum Schutz vor schädlichen Umwelteinwirkungen durchLuftverunreinigungen, Geräusche, Erschütterungen und ähnlicheVorgänge (Bundes-Immissionsschutzgesetz - BImSchG) in der Fassung der Bekanntmachung vom 17. Mai 2013 (BGBl. I S. 1274), das zuletzt durch Artikel 1 des Gesetzes vom 8. April 2019 (BGBl. I S. 432) geändert worden ist; Federal Clean Air Act (BImSchG) in the version dated 17 May 2013 (Federal Law Gazette, pp 1274ff) with its latest amendment by Article 1 of the act dated 8 April 2019 (Federal Law Gazette, pp 432)
[DE 4th BImSchV, 1975 … 2017] Vierte Verordnung zur Durchführung des Bundes-Immissionsschutzgesetzes (Verordnung über genehmigungsbedürftige Anlagen – 4. BImSchV) vom 14.02.1975, BGBl. I, S. 499, ber. 727; 4th Ordinance for the Implementation of the Federal Clean Air Act on Installations Requiring a Permit dated 14.02.1975, Federal Law Gazette, pp 499ff, corrected on p 727 – this ordinanace has been amended several times, especially for the implementation of the Council Directive 96/61/EC concerning integrated pollution prevention and control (EU IPPCD, 1996/2008) and of the Industrial Emissions Directive 2010/75/EC (EU IED, 2010); the latest version has been issued on 31.05.2017, Federal Law Gazette, pp 1440

References
326 State of the art of the co-incineration of waste-derived fuels and raw materials in clinker/cement plants
[DE 17th BImSchV, 1990] Siebzehnte Verordnung zur Durchführung des Bundes-Immissionsschutzgesetzes (Verordnung über Verbrennungsanlagen für Abfälle und ähnliche brennbare Stoffe – 17. BImSchV) vom 23.11.1990, BGBl. I 2545, ber. 2832; 17th Ordinance for the Implementation of the Federal Clean Air Act concerning the Incineration of Wastes dated 23.11.1990, Federal Law Gazette dated 19.08.2003, p. 2545, corrected on p. 2832
[DE 17th BImSchV, 1999] Verordnung zur Änderung der Siebzehnten, der Neunten und der Vierten Verordnung zur Durchführung des Bundes-Immissionsschutzgesetzes vom 23 Februar 1999, BGBl. I vom 26.02.1999, S. 186; Ordinance for amending the 17th, the 9th and the 4th Ordinance for the Implementation of the Federal Clean Air Act dated 23 February 1999, Federal Law Gazette dated 26.02.1999, p. 186
[DE 17th BImSchV-draft, 2002] Entwurf der Bundesregierung für die “Verordnung zur Änderung der Verordnung über Verbrennungsanlagen für Abfälle und ähnliche brennbare Stoffe und weitere Verordnungen zur Durchführung des Bundes-Immissionsschutzgesetzes” , BT-Drs. 15/14 vom 25.10.2002; draft of the German Government for the amendment of the 17th Ordinance for the Implementation of the Federal Clean Air Act concerning the Incineration and Co-incineration of Wastes, Bundestag Document 15/14 dated 25.10.2002
[DE 17th BImSchV-Committees, 2003] Empfehlungen der Ausschüsse für die “Verordnung zur Änderung der Verordnung über Verbrennungsanlagen für Abfälle und ähnliche brennbare Stoffe und weitere Verordnungen zur Durchführung des Bundes-Immissionsschutzgesetzes”, BR-Drs. 5/1/03 vom 04.03.2003; Recommendations of the Committees on the ordinance to amend the 17th Ordinance for the Implementation of the Federal Clean Air Act concerning the Incineration and Co-incineration of Wastes, Bundesrat Document 5/1/03 dated 04.03.2003
[DE 17th BImSchV-Federal Council, 2003] Beschluss des Bundesrates zur “Verordnung zur Änderung der Verordnung über Verbrennungsanlagen für Abfälle und ähnliche brennbare Stoffe und weitere Verordnungen zur Durchführung des Bundes-Immissionsschutzgesetzes” , BR-Drs. 5/03 vom 14.03.2003; decision of the Federal Council on the amendment of the 17th Ordinance for the Implementation of the Federal Clean Air Act concerning the Incineration and Co-incineration of Wastes, Bundesrat Document . 5/03 dated 14.03.2003
[DE 17th BImSchV-FedGov, 2003] Verordnung der Bundesregierung zur Änderung der Verordnung über Verbrennungsanlagen für Abfälle und ähnliche brennbare Stoffe und weiterer Verordnungen zur Durchführung des Bundes-Immissionsschutzgesetzes, BT-Drs. 15/947 vom 07.05.2003; Ordinance of the Federal Government to amend the 17th Ordinance for the Implementation of the Federal Clean Air Act concerning the Incineration and Co-incineration of Wastes, Bundestag Document 15/947 dated 07.05.2003
[DE 17th BImSchV, 2003] Siebzehnte Verordnung zur Durchführung des Bundes-Immissionsschutzgesetzes (Verordnung über die Verbrennung und die Mitverbrennung von Abfällen – 17. BImSchV vom 14.08.2003), BGBl. I, Nr 41 vom 19.08.2003, S. 1633-1651; 17th Ordinance for the Implementation of the Federal Clean Air Act concerning the Incineration and Co-incineration of Wastes dated 14.08.2003, Federal Law Gazette, issue 41 dated 19.08.2003, pp 1633-1651
[DE 17th BImSchV-Env. Committewe, 2012] Beschlussempfehlung und Bericht des Ausschusses für Umwelt, Naturschutz und Reaktorsicherheit (16. Ausschuss) zu der Verordnung der Bundesregierung – Drucksachen 17/10605, 17/10707 Nr. 2.3 – Verordnung zur Umsetzung der Richtlinie über Industrieemissionen, zur Änderung der Verordnung zur Begrenzung der Emissionen flüchtiger organischer Verbindungen beim Umfüllen

References
State of the art of the co-incineration of waste-derived fuels and raw materials in clinker/cement plants 327
oder Lagern von Ottokraftstoffen, Kraftstoffgemischen oder Rohbenzin sowie zur Änderung der Verordnung zur Begrenzung der Kohlenwasserstoffemissionen bei der Betankung von Kraftfahrzeugen und zu dem Antrag der Abgeordneten Dirk Becker, Gerd Bollmann, Marco Bülow, weiterer Abgeordneter und der Fraktion der SPD – Drucksache 17/9555 –, BT-Drs. 17/11060 vom 17. 10.2012; Proposed resolution and report of the Environmental Committee (16th Committee) on the Ordinance for the Implementation of the Industrial Emissions Directive, for the Amendment of the Ordinance for Limiting the Emission of Volatile Organic Compounds when Transfilling or Storing Petrol, Blended Fuels or Naphtha as well as for the Amendment of the Ordinance for Limiting the Emissions of Hydrocarbons when Fueling Motor Vehicles and on the request of the Members of Parliament Dirk Becker, Gerd Bollmann, Marco Bülow, further members and the SPD parliamentary group – Bundestag Document 17/9555 -, Bundestag Document 17/11060 dated 17.10.2012
[DE IED Federal Council, 2012] Verordnung der Bundesregierung „Verordnung zur Umsetzung der Richtlinie über Industrieemissionen, zur Änderung der Verordnung über Immissionsschutz- und Störfallbeauftragte und zum Erlass einer Bekanntgabeverordnung, BR-Drs. 319/12 vom 25.05.2012; Ordinance of the Federal Government for the Implementation of the Industrial Emissions Directive and to amend the Ordinance on Emissions to Air Control Officers and Major Accidents Officers, Bundesrat Document 319/12 dated 25.05.2012
[DE 17th BImSchV, 2013] Verordnung zur Umsetzung der Richtlinie über Industrieemissionen, zur Änderung der Verordnung zur Begrenzung der Emissionen flüchtiger organischer Verbindungen beim Umfüllen oder Lagern von Ottokraftstoffen, Kraftstoffgemischen oder Rohbenzin sowie zur Änderung der Verordnung zur Begrenzung der Kohlenwasserstoffemissionen bei der Betankung von Kraftfahrzeugen – Artikel 3: Siebzehnte Verordnung zur Durchführung des Bundes-Immissionsschutzgesetzes (Verordnung über die Verbrennung und die Mitverbrennung von Abfällen – 17. BImSchV vom 02.05.2013, BGBl. I, Nr. 21 vom 02.05.2013, S. 1044-1067; Ordinance for the Implementation of the Industrial Emissions Directive, for the Amendment of the Ordinance for Limiting the Emission of Volatile Organic Compounds when Transfilling or Storing Petrol, Blended Fuels or Naphtha as well as for the Amendment of the Ordinance for Limiting the Emissions of Hydrocarbons when Fueling Motor Vehicles -Article 3: 17th Ordinance for the Implementation of the Federal Clean Air Act concerning the Incineration and Co-incineration of Wastes dated 02.05.2013, Federal Law Gazette, issue 21 dated 02.05.2013, pp 1044-1067; see also the drafts in Bundestag Documents 17/10605 dated 06.09.2012 (contains justification), 17/12164 dated 25.01.2013, and 17/12411 dated 20.02.2013
[DE BMU, 2001] Nottrodt, A., Technische Anforderungen und allgemeine Empfehlungen für die Entsorgung von Tiermehl und Tierfett in Verbrennungsanlagen, Report prepared on behalf of the Federal Ministry for the Environment, Nature Conservation and Nuclear Safety (BMU) (2001), http://www.hanse-ing.de/drno/de/dok/leitfaden.pdf (accessed 30.10.2012)
[DE Deposit Ord., 2001] Verordnung über die umweltverträgliche Ablagerung von Siedlungsabfällen (Ablagerungsverordnung – AbfAblV) (Ordinance concerning the Environmentally Sound Deposit of Municipal Waste) of 20.02.2001, BGBl. I p 305, amended on 24.07.2002, BGBl. I p 2807
[DE IED draft, 2012a] Verordnung über die Umsetzung der Richtlinie über Industrieemissionen (und weiterer Verordnungen) (Ordinance for the Implementation of the Industrial Emissions Directive) (and of further ordinances), BT-Drs. 17/10605, dated 06.09.2012
[DE IED draft, 2012b] Gesetzentwurf der Bundesregierung „Entwurf eines Gesetzes zur Umsetzung der Richtlinie über Industrieemissionen“, BT-Drs. 17/10486 vom 15.08.2012, draft of an act for the implementation of the Industrial Emissions Directive, Bundestag Document 17/10486 dated 15.08.2012

References
328 State of the art of the co-incineration of waste-derived fuels and raw materials in clinker/cement plants
[DE IED Federal Council, 2012] Verordnung der Bundesregierung „Verordnung zur Umsetzung der Richtlinie über Industrieemissionen, zur Änderung der Verordnung über Immissionsschutz- und Störfallbeauftragte und zum Erlass einer Bekanntgabeverordnung, BR-Drs. 319/12 vom 25.05.2012; Ordinance of the Federal Government for the Implementation of the Industrial Emissions Directive and to amend the Ordinance on Emissions to Air Control Officers and Major Accidents Officers, Bundesrat Document 319/12 dated 25.05.2012
[DE IED Ordinance, 2013a] Verordnung der Bundesregierung „Verordnung zur Umsetzung der Richtlinie über Industrieemissionen, zur Änderung der Verordnung über Immissionsschutz- und Störfallbeauftragte und zum Erlass einer Bekanntgabeverordnung, BGBl. I S. 973 vom 2. Mai 2013; Ordinance of the Federal Government for the Implementation of the Industrial Emissions Directive and to amend the Ordinance on Emissions to Air Control Officers and Major Accidents Officers, Federal Law Gazette dated 02.05.2013, p. 973
[DE IED Ordinance, 2013b] Verordnung über die Umsetzung der Richtlinie über Industrieemissionen (und weiterer Verordnungen) (Ordinance for the Implementation of the Industrial Emissions Directive) (and of further ordinances) of 02.05.2013, BGBl. I No 21, issued on 02.05.2013, pp 1021ff
[DE IED Act, 2013] Gesetz zur Umsetzung der Richtlinie über Industrieemissionen vom 8. April 2013 (BGBl. I vom 12.04.2014, S. 734, 3753); act for the implementation of the Industrial Emissions Directive dated 8 April 2013, Federal Law Gazette dated 12.04.2013, p. 734, p. 3753
[DE IED and ordin. - draft, 2013] Verordnung zur Umsetzung der Richtlinie über Industrieemissionen, zur Änderung der Verordnung zur Begrenzung der Emissionen flüchtiger organischer Verbindungen beim Umfüllen oder Lagern von Ottokraftstoffen, Kraftstoffgemischen oder Rohbenzin sowie zur Änderung der Verordnung zur Begrenzung der Kohlenwasserstoffemissionen bei der Betankung von Kraftfahrzeugen - Entwurf -, BT-Drs. 17/12164 vom 25.01.2013; Ordinance to implement the Industrial Emissions Directive, to amend the Ordinance to Limit the Emissions of Volatile Organic Compounds when Refilling or Storing Petrol, Blends of Fuel or Naphtha as well as to amend the Ordinance to Limit the Emissions of Hydrocarbons at Fuel Uplift of Vehicles - draft, Bundestag Document 17/12164 dated 25.01.2013
[DE IED and ordin., 2013] Verordnung zur Umsetzung der Richtlinie über Industrieemissionen, zur Änderung der Verordnung zur Begrenzung der Emissionen flüchtiger organischer Verbindungen beim Umfüllen oder Lagern von Ottokraftstoffen, Kraftstoffgemischen oder Rohbenzin sowie zur Änderung der Verordnung zur Begrenzung der Kohlenwasserstoffemissionen bei der Betankung von Kraftfahrzeugen, BGBl. I vom 02.05.2013, S. 1021, 1044, 3754; Ordinance to implement the Industrial Emissions Directive, to amend the Ordinance to Limit the Emissions of Volatile Organic Compounds when Refilling or Storing Petrol, Blends of Fuel or Naphtha as well as to amend the Ordinance to Limit the Emissions of Hydrocarbons at Fuel Uplift of Vehicles, Federal Law Gazette dated 02.05.2013, p. 1021, p. 1044, p. 3754
[DE Klärschlamm, 2012] Wiechmann, B.; Dienemann, C.; Kabbe, C.; Brandt, S.; Vogel, I.; Roskosch, A.; Klärschlammentsorgung in der Bundesrepublik Deutschland, Umweltbundesamt (2012), http://www.umweltdaten.de/publikationen/fpdf-l/4280.pdf
[DE KrWG, 2012] Gesetz zur Förderung der Kreislaufwirtschaft und Sicherung der umweltverträglichen Bewirtschaftung von Abfällen (Kreislaufwirtschaftsgesetz - KrWG) (Act for promoting closed substance cycle waste management and ensuring environmentally sound Waste Management) of

References
State of the art of the co-incineration of waste-derived fuels and raw materials in clinker/cement plants 329
24.02.2012, BGBl. I S. 212); before the latest major amendment in 2012, the act was called “Closed Substance Cycle and Waste Management Act – KrW-/AbfG)”
[DE KrW-/AbfG, 1993/1994] Entwurf eines Gesetzes zur Vermeidung von Rückständen, Verwertung von Sekundärrohstoffen und Entsorgung von Abfällen – KrW-/AbfG (Draft act of the government concerning the prevention of residues, recycling of secondary raw materials and disposal of wastes), BT-Drs. 12/5672, dated 15.09.1993, BT-Drs. 12/7240, dated 13.04.1994, BT-Drs. 12/7284, dated 14.04.1994, BT-Drs. 12/7672, dated 24.05.1994, and BT-Drs. 12/7675, dated 24.05.1994
[DE Landfill Ord., 2009] Verordnung über Deponien und Langzeitlager (Deponieverordnung – DepV), (Ordinance concerning Landfills and Long-term Deposit) of 27.04.2009, BGBl.I p 900, lastly amended on 24.02.2012, BGBl. I p 212
[DE Luftqual., 2009] Verordnung zur Absicherung von Luftqualitätsanforderungen in der Verordnung über Großfeuerungs- und Gasturbinenanlagen und der Verordnung über die Verbrennung und die Mitverbrennung von Abfällen vom 27. Januar 2009, BGBl. I, Nr. 5 vom 30.01.2009, S. 129; Ordinance to hedge air quality requirements in the Ordinance on Large Combustion Plants and Gas Turbines and in the Ordinance concerning the Incineration and Co-incineration of Wastes, Federal Law Gazette, issue 5 dated 30.01.2009, p. 129
[DE TA Luft, 1986] Erste Allgemeine Verwaltungsvorschrift zum Bundes-Immissionsschutzgesetz (Technische Anleitung zur Reinhaltung der Luft – TA Luft) vom 27.02.1986, GMBl. 1986, S. 95, ber. S. 202 (Technical Instructions on Air Quality Control – TA Luft); see also the following technical commentary of the TA Luft 1986: Davids, P.; Lange, M. (1986), Die TA Luft ’86 – Technischer Kommentar, VDI-Verlag, Düsseldorf
[DE TA Luft, 2002] Erste Allgemeine Verwaltungsvorschrift zum Bundes-Immissionsschutzgesetz (Technische Anleitung zur Reinhaltung der Luft – TA Luft) vom 24.06.2002, GMBl. 2002, Heft 25, S. 511 – 605; the English version of these ‘Technical Instructions on Air Quality Control – TA Luft‘ is available under http://www.bmu.de/fileadmin/bmu-import/files/pdfs/allgemein/application/pdf/taluft_engl.pdf (accessed 20.10.2013)
[DE TA Luft - draft, 2018] Neufassung der Ersten Allgemeinen Verwaltungsvorschrift zum Bundes–Immissionsschutzgesetz (Technische Anleitung zur Reinhaltung der Luft – TA Luft). Entwurf - Stand: 16.07.2018; Revised First General Administrative Regulation based on the Federal Clean Air Act (Technical Instructions on Air Quality Control – TA Luft), draft - issued on 16.07.2018, https://www.bmu.de/fileadmin/Daten_BMU/Download_PDF/Glaeserne_Gesetze/19._Lp/ta_luft/entwurf/ta_luft_180716_refe_bf.pdf (accessed 10.10.2018
[DE TI Waste, 1993] Technische Anleitung zur Verwertung, Behandlung und sonstige Entsorgung von Siedlungsabfällen (TA Siedlungsabfall) (Technical Instructions on the Recycling and Treatment and other Type of Disposal of Municipal Waste) of 14.05.1993, Federal Gazette no. 99a of 29.05.1993
[DE TRGS, 2008] Technische Regeln für Arbeitsstoffe (TRGS 905), Verzeichnis krebserzeugender, erbgutverändernder oder fortpflanzungsgefährdender Stoffe (2008)
[DE UIG, 2014] Umweltinformationsgesetz (UIG) in der Fassung der Bekanntmachung vom 27. Oktober 2014 (BGBl. I vom 05.11.2014, S. 1643); Act on Environmental Information in the version of 27 October 2014),

References
330 State of the art of the co-incineration of waste-derived fuels and raw materials in clinker/cement plants
BGBl. I Issue 49 dated 05.11.2014, p 1643; remark: The European Directive 2003/4/EC on public access to environmental information (see EU Info, 2003) was implemented in 2005
[DE UVPG, 1990/2010] Gesetz über die Umweltverträglichkeitsprüfung (UVPG) vom 12. Februar 1990 (BGBl. I S. 205) in der Fassung vom 24. Februar 2010, BGBl. I S. 94, das zuletzt durch Artikel 2 des Gesetzes vom 12. Dezember 2019 (BGBl. I S. 2513) geändert worden ist; Act on the Assessment of Environmental Impacts of 12 February 1990 (Federal Law Gazette, pp 205ff) in the version of 24 February 2010 (Federal Law Gazette, pp 94ff) with its latest amendment by Article 2 of the act dated 12 December 2019 (Federal Law Gazette, p 2513)
[DE Waste Ord., 2002] Verordnung über die Entsorgung von gewerblichen Siedlungsabfällen und von bestimmten Bau- und Abbruchabfällen (Gewerbeabfallverordnung) (Ordinance on the Disposal of Commercial Municipal Waste and of Certain Construction and Demolition Waste) of 16.06.2002, BGBl. I S. 1938, lastly amended on 24.02.2012, BGBl. I p 212); the justification of this Ordinance is available in document 1084/01 (Bundesrats-Drucksache 1084/01), dated 19.12.01 of the German Bundesrat (2002)
[Del Borghi et al., 2009] Del Borghi, M.; Strazza, C.; Del Borghi, A., Utilizzo di combustibili alternativi nei forni da cemento. Influenza sulle emissioni atmosferiche: l'esperieza italiana, La Rivista dei Combustibili 63 (2009) 27-40
[Destatis Abfallaufkommen nach Wirtschaftszweigen 2008, 2011] Statistisches Bundesamt, Umwelt – Abfallaufkommen nach Wirtschaftszweigen gemäß EU-Abfallstatistikverordnung 2006 (2011)
[Destatis Abfallbilanz 2006, 2009] Statistisches Bundesamt, Umwelt – Abfallbilanz 2006 (2009)
[Destatis Abfallbilanz 2007, 2009] Statistisches Bundesamt, Umwelt – Abfallbilanz 2007 (2009)
[Destatis Abfallbilanz 2008, 2010] Statistisches Bundesamt, Umwelt – Abfallbilanz 2008 (2010)
[Destatis Abfallbilanz 2009, 2011] Statistisches Bundesamt, Umwelt – Abfallbilanz 2009 (2011)
[Destatis Abfallbilanz 2010, 2012] Statistisches Bundesamt, Umwelt – Abfallbilanz 2010 (2012)
[Destatis Abfallbilanz Erläuterungen, 2012] Statistisches Bundesamt, Umwelt – Erläuterungen zur Abfallbilanz (2012)
[Destatis Abfallentsorgung 2010, 2012] Statistisches Bundesamt, Umwelt – Abfallentsorgung 2010, Fachserie 19, Reihe 1 (2012)
[Destatis Abfallaufkommen 1996-2010, 2012] Statistisches Bundesamt, Umwelt – Zeitreihe zum Abfallaufkommen 1996 – 2010 (2012)
[DG ENER/ENV, 2002] European Commission, General Direction Energy and Transport and the General Direction Environment, Mandate to CEN on Solid Recovered Fuels (SRF) dated 26.08.2002,
http://ec.europa.eu/enterprise/standards_policy/mandates/database/index.cfm?fuseaction=search.detail&id=68# (accessed 30.11.2012)
[DHI, 2011] DHI, Study on methodological aspects regarding limit values for pollutants in aggregates in the context of the development of end-of-waste criteria under the EU Waste Framework Directive,

References
State of the art of the co-incineration of waste-derived fuels and raw materials in clinker/cement plants 331
prepared for the Joint Research Centre/Institute for Prospective Technological Studies 8contact no. 151932-2010-A08-DK (2011)
[DIN 51527, 2000] Deutsche Industrienorm (DIN), DIN 51527, Part 1: Testing of petroleum products: determination of polychlorinated biphenyls (PCB): preseparation by liquid chromatography and determination of 6 selected PCB by gaschromatography with electron capture detector (2000)
[DIN CEN/TS 13649, 2015] German Industry Norms (DIN)/European Committee for Standardization (CEN) (2015), Stationary source emissions - Determination of the mass concentration of individual gaseous organic compounds - Sorptive sampling method followed by solvent extraction or thermal desorption; German version CEN/TS 13649:2014
[DIN EN 197-1, 2011] Anonymous, DIN EN 197-1 – Cement – Part 1, Composition, specifications and conformity criteria for common cements (2011)
[Dr. Graf AG, 1998] Bundesamt für Umwelt, Wald und Landschaft (BUWAL), Regelungen über die Abfallentsorgung in Zementwerken, Grundlagen, Methoden, Berechnungen, Report No. 91.2018, prepared by Dr. GRAF AG Umweltschutz und Wärmetechnik in CH-Gerlafingen/Switzerland (1998)
E [EC ALF-CEMIND, 2008]
Komioti, N., ALF-CEMIND: Supporting the use of alternative fuels in the cement industry – Final publishable report, Project on behalf of DG TREN under the 6th Framework Programme for Research, Technological Development and Demonstration, Contract No: TREN/05/FP6/EN/S07.54356/020118 (2008), http://alf-cemind.com/docs/publications/Final_publishable_report.pdf (accessed 07.11.2012)
[EC BREF CL, 2001] Reference Document on Best Available Techniques in the Cement and Lime Manufacturing Industries, (2001)
[EC BREF CLM, 2010] Reference Document on Best Available Techniques in the Cement, Lime and Magnesium Oxide Manufacturing Industries, (2010), http://eippcb.jrc.es/reference/BREF/clm_bref_0510.pdf
[EC BREF CLM, 2013] European IPPC Bureau of the Joint Research Centre of the European Commission, Best Available Techniques (BAT) Reference Document for the Production of Cement, Lime and Magnesium Oxide, JRC Reference Report (2013)
[EC CLM Conclusions, 2013] European Commission, Commission Implementing Decision of 26 March 2013 establishing the best available techniques (BAT) conclusions under Directive 2010/75/EU of the European Parliament and of the Council on industrial emissions for the production of cement, lime and magnesium oxide (2013/163/EU), OJ L 100/1, 09.04.2013
[EC Feed ban, 1994] Commission Decision of 27.06.1994 concerning certain protein protection measures with regard to bovine spongiform encephalopathy and the feeding of mammalian derived protein (94/381/EC)OJ L 172/23, 07.07.1994
[EC Feed ban, 2001] Commission Decision of 27.12.2000 amending Decision 2000/418/EC regulating the use of material presenting risks as regards transmissible spongiform encephalopathies (2001/2/EC), OJ L 1/21, 04.01.2001

References
332 State of the art of the co-incineration of waste-derived fuels and raw materials in clinker/cement plants
[EC Guidelines, 2011] European Commission Directorate-General Environment, Guidelines on the interpretation of the R1 energy efficiency formula for incineration facilities dedicated to the processing of municipal solid waste according to Annex II of Directive 2008/98/EC on Waste (2011)
[EC RDF, 2003] European Commission – Directorate General Environment, Refuse derived fuel, current practice and perspectives (B4-3040/2000/306517/MAR/E3), Final Report (2003)
[EC Roadmap, 2011] European Commission, Roadmap to a Resource Efficient Europe, Communication from the Commission to the European Parliament, the Council, the European Economic and Social Committee and the Committee of the Regions, dated 20.9.2011, COM(2011) 571 final
[EC Waste List, 2000] European Commission Decision of 3 May 2000 (2000/532/EC) replacing decision 94/3/EC establishing a list of wastes pursuant to Article 1(a) of Council Directive 75/442/EC on waste and Council Decision 94/904/EC establishing a list of hazardous waste pursuant to Article 1(4) of Council Directive 91/689/EEC on hazardous waste, OJ L 226, 6.9.2000, p. 3, amended by Commission Decision of 16 January 2001 (2001/118/EC), OJ L 047, 16.02.2001, pp 1-31, by Commission Decision of 22 January 2001 (2001/119/EC), OJ L 047, 16.02.2001, p 32 and Council Decision of 23 July 2001 (2001/573/EC), OJ L 203, 28.07.2001, pp 18-19; the list of waste is currently under revision (August 2012), see http://ec.europa.eu/environment/waste/framework/list.htm (accessed 18.08.2012)
[EC Waste Strategy, 2005] Communication from the Commission to the Council, the European Parliament, the European Economic and Social Committee and the Committee of the Regions, Taking sustainable use of resources forward: A Thematic Strategy on the prevention and recycling of waste, COM(2005) 666 final, dated 21.12.2005 (2005)
[ECOS, 2005] European Environmental Citizens Organisation for Standardisation (ECOS), Position of the Environmental NGOs on the Standardisation of Recovered Fuels, dated July 2005,http://www.ecostandard.org/wp-content/uploads/ecos_position_paper_on_srf_standard_2005.pdf (accessed on 20.11.2012)
[ECOS, 2010] Tebert, C., Solid Recovered Fuels – Where to Draw the Line between Standardisation and Legislation?, presentation at the ECOS/EFTA Workshop in Brussels on 29.06.2010 on behalf of the European Environmental Citizens Organisation for Standardisation (ECOS), http://www.efta.int/~/media/Documents/eea/eea-news/Christian%20Tebert%20-%20Okopol.ashx (accessed on 20.11.2012)
[ECOS, 2011a] European Environmental Citizens Organisation for Standardisation (ECOS), ECOS Appeal against Ratification of EN 15359 ‚Solid Recovered Fuels – Specifications and Classes‘, dated 18.02.2011, http://cniid.fr/IMG/pdf/ECOS_appeal_prEN15359_final.pdf (accessed on 20.11.2012)
[ECOS, 2011b] European Environmental Citizens Organisation for Standardisation (ECOS), Addendum to ECOS publication of prEN 15359 (Specification and Classes), CEN TC 343 statements arguments against appeal (numbered questions) and ECOS replies (in italics, right below), dated 31.03.2011
[ECOS/EEB, 2012] European Environmental Citizens Organisation for Standardisation (ECOS) and European Environmental Bureau (EEB), Common letter to DG Environment dated 05.11.2012 ‘Notification of an Italian Draft Legislation Establishing End-of-waste Criteria for Solid Recovered Fuels (SRF)’ with an annex,

References
State of the art of the co-incineration of waste-derived fuels and raw materials in clinker/cement plants 333
http://www.eeb.org/EEB/?LinkServID=959E55A5-5056-B741-DBCAE043D7FC9D5D&showMeta=0 (accessed on 10.01.2013)
[ecra, 2010]
European cement research academy (ecra), Continuous monitoring of specific industrial emissions, ecra Newsletter 1/2010 (2010) pp 2-3
[ecra, 2013] Hoenig, V.; Harrass, R.; Zunzer, U.; Guidance Document on BAT-BEP for Mercury in the Cement Industry, Technical report ofthe European Cement Research Academy (ecra) on behalf of WBCSD Cement Sustainability Initiative (2013)
[EC Regulation, 2013] European Commission; Commission Regulation (EU) No 944/2013 of 2 October 2013 amending, for the purposes of its adaptation to technical and scientific progress, Regulation (EC) No 1272/2008 of the European Parliament and of the Council on classification, labelling and packaging of substances and mixtures, Official Journal of the European Union, L 261/5, issued on 3.10.2013
[EC WID Proposal, 1998] European Commission, Proposal for a Council directive on the incineration of waste (98/C 372/07), COM(1998) 558 final - 98/0289(SYN), OJ C 372/11, 02.12.1998
[EC WID Proposal, 1999] European Commission (1999), Amended proposal for a European Parliament and Council Directive on the incineration of waste, COM(1999) 330 final - 98/0289(COD), OJ C 150 E/1, 30.05.2000
[Edwards, 2012] Edwards, P., Cement in Belgium and the Netherlands, Global Cement Magazine, March 2012
[EEB/ECOS, 2012] European Environment Bureau (EEB)/European Environmental Citizens Organisation for Standardisation (ECOS), Request to the DG Environment to oppose the adoption of the "Notification of an Italian draft legislation establishing end-of-waste criteria for Solid Recovered Fuel (SRF), letter dated 5 November 2012, accessed on 13 November 2012 (http://www.eeb.org/EEB/?LinkServID=959E55A5-5056-B741-DBCAE043D7FC9D5D&showMeta=0)
[Ekvall/Finnveden, 2001] Ekvall, T.; Finnveden, G., Allocation in ISO 14041 - a critical review, Journal of Cleaner Production 9 (2001) 197–208
[Ekvall et al., 2007] Ekvall, T.; Assefa, G.; Björklund, A.; Eriksson, O.; Finnveden, G., What life-cycle assessment does and does not do in assessments of waste management, Waste Management 27 (2007) 989-996
[Emberger/Hoenig, 2011] Emberger, B.; Hoenig, V., Rotary kiln burner technology for alternative fuel co-firing, Cement International 9 (2011) No. 5, 48-60
[EN 14181, 2014] EN 14181:2014, Stationary source emissions - Quality assurance of automated measuring systems, European Committee for Standardization (CEN) (2014)
[EN 15359, 2012] EN 15359:2012-01 (E), Solid recovered fuels – Specification and classes, European Committee for Standardization (CEN) (2012)
[Enders/Haeseli, 2011] Enders, E.; Haeseli, U., Reactions of alkalis, chlorine and sulfur during clinker production, Cement International 9 (2011) No. 3, 38-53

References
334 State of the art of the co-incineration of waste-derived fuels and raw materials in clinker/cement plants
[EP WID Proposal, 1999] European Parliament (1999), I Report on the proposal for a Council directive on the incineration of waste (COM(98)0558 -C4-0668/98 - 98/0289(SYN)) Committee on the Environment, Public Health and Consumer Protection, Rapporteur: Johannes Blokland, A4-0183/99 dated 31 March 1999, http://www.europarl.europa.eu/sides/getDoc.do?pubRef=-//EP//NONSGML+REPORT+A4-1999-0183+0+DOC+PDF+V0//EN (accessed 1 17.05.2019)
[EP WID Proposal, 2000a] European Parliament (2000), II Recommendation for second Reading on the Council common position for adopting a European Parliament and Council directive on the incineration of waste (11472/1/1999 – C5-0274/1999 – 1998/0289(COD)) Committee on the Environment, Public Health and Consumer Policy, Rapporteur: Hans Blokland, FINAL A5-0056/2000 dated 1 March 2000, http://www.europarl.europa.eu/sides/getDoc.do?pubRef=-//EP//NONSGML+REPORT+A5-2000-0056+0+DOC+PDF+V0//EN (accessed 17.05.2019)
[EP WID Proposal, 2000b] European Parliament (2000); III Report on the joint text approved by the Conciliation Committee for a European Parliament and Council directive on the incineration of waste (C5-0371/2000 – 1998/0289(COD)), European Parliament delegation to the Conciliation Committee, Rapporteur: Hans Blokland, FINAL 1998/0289(COD) dated 6 November 2000, http://www.europarl.europa.eu/sides/getDoc.do?pubRef=-//EP//NONSGML+REPORT+A5-2000-0321+0+DOC+PDF+V0//EN (accessed 17.05.2019)
[ERG, 2006] ERG, Inc., Assessment of NOx emissions reduction strategies for cement kilns – Ellis County, Final Report (2006), http://tceq.state.tx.us/assets/public/implementation/air/sip/agreements/BSA/CEMENT_FINAL_REPORT_70514_final.pdf (accessed on 13.09.2014)
[ERFO, 2005] European Recovered Fuel Organisation (ERFO), Classification of solid recovered fuels (2005)
[ERFO, 2010] Straetmans, B. (president of the European Recovered Fuel Organisation (ERFO)), SRF Market Views in Europe, presentation at the International Workshop on Solid Recovered Fuels in Helsinki on 31.05.2010, http://erfo.info/fileadmin/user_upload/erfo/documents/presentations/helsinki_2010/Bert_Straetmans.pdf (accessed on 07.11.2012)
[ERFO, 2011] Straetmans, B. (president of the European Recovered Fuel Organisation (ERFO)), SRF Development, 7th Annual Energy from Waste Conference on 16-17.02.2011 in London (2011)
[ERFO, 2012] European Recovered Fuel Organisation (ERFO), No discussion on the SRF standard – ECOS appeal closed, Information of ERFO dated 08.02.2012, http://erfo.info/News.21+M5f7c4e7cf72.0.html (accessed on 07.11.2012)
[Erhard/Scheuer, 1993] Erhard, H.S.; Scheuer, A., Brenntechnik und Wärmewirtschaft, Zement-Kalk-Gips 46 (1993) No. 12, 743-754
[Eriksen et al., 2007] Eriksen, D.Ø.; Tokheim, L.-A.; Eriksen, T.A.; Meyer, J.; Qvenild, C., Assessment of mercury emisisons at Norcem’s cement kiln by use of 203Hg-tracer, Journal of Radioanalytical and Nuclear Chemistry 273 (2007) No. 3, 739-745

References
State of the art of the co-incineration of waste-derived fuels and raw materials in clinker/cement plants 335
[EU AAQAM, 1996] Council Directive 96/62/EC of 27 September 1996 on ambient air quality assessment and management, OJ L 296, 21.11.1996, p. 55
[EU EIA, 2011] Council Council Directive 85/337/EEC of 27 June 1985 on the assessment of the effects of certain public and private projects on the environment (OJ L 175, 5.7.1985, pp 40ff) in the codified version of Directive 2011/92/EU of the European Parliament and of the Council of 13 December 2011 on the assessment of the effects of certain public and private projects on the environment, OJ L 26, 28.1.2012, pp 1ff
[EU IED, 2010] Directive 2010/75/EC of the European Parliament and of the Council of 24 November 2010 on industrial emissions (integrated pollution prevention and control), OJ L 334, 17.12.2010, p 17
[EU IHW, 1994] Council Directive 94/67/EC of 16 December 1994 on the incineration of hazardous waste, OJ L 365, 31.12.1994, p. 34
[EU Info, 2003] Directive 2010/75/EC of the European Parliament and of the Council of 24 November 2010 on industrial emissions (integrated pollution prevention and control), OJ L 041, 14.02.2003, pp 26-32
[EU IPPCD, 2008] Directive 2008/1/EC of the European Parliament and of the Council of 15 January 2008 concerning integrated pollution prevention and control, OJ L 24, 29.1.2008, p. 8
[EU IPPCD, 1996/2008] Council Directive 96/61/EC of 24 September 1996 concerning integrated pollution prevention and control, OJ L 257 , 10.10.1996, p. 26, amended with Directive 2008/1/EC of the European Parliament and of the Council of 15 January 2008 concerning integrated pollution prevention and control, OJ L 24, 29.1.2008, p. 8
[EU LCPD, 2001] Directive 2001/80/EC of the European Parliament and of the Council of 23 October 2001 on the limitation of emissions of certain pollutants into the air from large combustion plants, OJ L 309, 27.11.2001, p. 1
[EU NEC, 2001] Directive 2001/81/EC of the European Parliament and the Council of 23 October 2001 on national emission ceilings for certain atmospheric pollutants, OJ L 309, 27.11.2001, p. 22
[EU SEA, 2011] Directive 2001/42/EC of the European Parliament and of the Council of 27 June 2001 on the assessment of the effects of certain plans and programmes on the environment, OJ L 197, 21.7.2001, p. 30
[EU WFD, 2008] Directive 2008/98/EC of the European Parliament and of the Council of 19 November 2008 on waste and repealing certain Directives, OJ L 312, 22.11.2008, p. 3
[EU WID, 2000] Directive 2000/76/EC of the European Parliament and of the Council of 4 December 2000 on the incineration of waste, OJ L 332, 28.12.2000, p. 91
F [Fargione et al., 2008]
Fargione, J., Hill, J., Tilman, D., Polasky, S., Hawthorne, P. Land clearing and the biofuel carbon debt. Science 319 (2008), 1235-1238

References
336 State of the art of the co-incineration of waste-derived fuels and raw materials in clinker/cement plants
[Farmer et al., 1980] Farmer, W.J.; Yang, M.S.; Letey, J.; Spencer, W.F., Hexachlorobenzene: Its vapor pressure and vapor phase diffusion in soil, Soil Science Society of America Journal 44 (1980) 676-680
[Feiz, 2011] Feiz, R., Improving climate performance of cement production - Developing an assessment framework and applying it to a CEMEX cement production cluster in Germany, Thesis Report of the Linköping University/Sweden (2011), http://liu.diva-portal.org/smash/get/diva2:496645/FULLTEXT01 (accessed 17 March 2013)
[Feiz et al., 2012] Feiz, R.; Ammenberg, J.; Baas, L.; Eklund, M.; Helgstrand, A.; Marshall, R., Utilizing LCA and key performance indicators to assess development within the cement industry – a case study of a cement production cluster in Germany, Conference paper of the 18th Conference of the Greening of Industry Network (GIN 2012) on 21-24 October 2012, Linköping/Sweden (2012)
[Fidaros et al., 2007] Fidaros, D.K.; Baxevanou, C.A.; Dritselis, C.D.: Vlachos, N.S., Numeric modeling of flow and transport processes in a calciner for cement production, Powder Technology 171 (2007) 81-95
[Fiedler et al., 1995] Fiedler, H.; Hub, M.; Willner, S.; Hutzinger, O., Stoffbericht Hexachlorbenzol (HCB). Hrsg.: Landesanstalt für Umweltschutz Baden-Würtemberg, Abteilung Boden, Abfall, Altlasten, Referat 53 – Altlastenbewertung (1995), https://www.ktn.gv.at/308444_DE-Dateien-A2_Altlasten-Stoffbericht-HCB.pdf (accessed on 20.03.2017)
[Fiedler, 2003] Fiedler, H., Dioxins and Furans /PCDD/PCDF), in: Hutzinger O. (editor-in-chief), The Handbook of Environmental Chemistry, Vol 3 Anthropogenic Compounds, Part O, Fiedler, H. (volume editor) Persistent Organic Pollutants, Springer (2003) 123-201
[Finnveden et al., 2009] Finnveden, G.; Hauschild, M.Z.; Ekvall, T.; Guinée, J.; Heijungs, R.; Hellweg, S.; Koehler, A.; Pennington, D.; Suh, S., Recent developments in Life Cycle Assessment, Journal of Environmental Management 91 (2009) 1-21
[Finnveden and Moberg, 2005] Finnveden, G.; Moberg, Å., 2005. Environmental systems analysis tools – an overview; Journal of Cleaner Production 13 (2005) 1165–1173
[Flamme/Geiping, 2012] Flamme, S.; Geiping, J., Quality standards and requirements for solid recovered fuels: a review, Waste Management & Research 30 (2012) No. 4, 335-353
[FLS, 2007] FLSMIDTH, HOTDISC technology, www.flsmidth.com (accessed on 05.08. 2012
[FLS, 2011] FLSMIDTH, HOTDISC combustion device, www.flsmidth.com (accessed on 05.08. 2012
[Frankenhäuser, 2008] Frankenhäuser, M., European Standardization of Solid Recovered Fuels, presentation in his function as chairman of CEN/TC 343 on 06.11.2008 in London, http://www.resourcesnotwaste.org/upload/documents/webpage/RRF%20Conference%20Materials/SRF(2008)/2.2.Martin%20Frankenhaeuser.pdf, (2008) (accessed on 07.11.2012)
[Frankenhäuser, 2011] Frankenhäuser, M., European Standardization of Solid Recovered Fuels, presentation at the Workshop “Processing Routes for Solid Recovered Fuels” in Dublin on 20.10.2011 in his function as Chairman of CEN/TC 343,

References
State of the art of the co-incineration of waste-derived fuels and raw materials in clinker/cement plants 337
http://www.ieabcc.nl/workshops/task32_Dublin_SRF/05%20Frankenhauser.pdf (accessed on 07.11.2012)
[Frenz, 2002] Frenz, W., Kreislaufwirtschafts- und Abfallgesetz (KrW-/AbfG) (Closed Substance Cycle and Waste Management Act), Legal commentary, 3rd edition, Carl Heymanns Verlag (2002)
[Frichknecht, 2000] Frichknecht, R., Allocation in Life Cycle Inventory Analysis for joint production, International Journal of Life Cycle Analysis 5 (2000) 85–95
[Fricke et al., 2010] Fricke, K.; Bahr, T.; Bidlingmaier, W.; Turk, T., Energieeffizienz der stofflichen und energetischen Verwertung ausgewählter Abfallfraktionen, Müll und Abfall (2010) No. 2, 63-68
[Friedrich et al., 2001] Friedrich, H.; Lahl, U.; Zeschmar-Lahl, B., Die Stoffflussanalyse (SFA) als neues Instrument der abfallrechtlichen Beurteilung der Umweltverträglichkeit von Entsorgungsmaßnahmen in immissionsschutzrechtlich genehmigungsbedürftigen Anlagen, Müll und Abfall (2001) No. 2, 83 – 94
[Friege/Fendel, 2011] Friege, H.; Fendel, A.; Competition of different methods for recovering energy from waste leading to overcapacities, Waste Management & Research 29 (2011) 30-38
[Frankenberger, 1968] Frankenberger, R., Die Brennverfahren der Zementindustrie, Zement-Kalk-Gips 21 (1968) 73
[Fruergaard/Astrup, 2011] Fruergaard, T.; Astrup, T., Optimal utilization of waste-to-energy in an LCA perspective, Waste Management 31 (2011) 572-582
[Funk et al., 2015] Funk, B.-C.; Hutter, H.-P.; Neubacher, F.; Raschauer, B., HCB-Belastung Görtschitztal/Kärnten: Verfahrenstechnische – juristische – medizinische Beurteilung, Bericht vom 15. Mai 2015 (Contamination of the Görtschitztal valley in Kärnten/Austria: Assessment of the technical process and of the legal and medical situation, Report dated 15 May 2015), http://www.ktn.gv.at/308442_DE-HCB-Bericht_Funk-Kommission.# (accessed on 20 January 2016)
[Fux, 2011] Fux, B., Mixed Waste Plastics – an LCA4Waste Case Study from Czech Republic, Presentation in Brussels on 05.07.2011, http://www.acrplus.org/upload/documents/events/Holcim%202011/LCA4Waste_Czech%20Republic_FUX_F01.pdf (accessed on 17 January 2013)
[FZKA, 2003] Achternbosch, M.; Bräutigam, K.-R.; Hartlieb, N.; Kupsch, C.; Richers, U.; Stemmermann, P.; Gleis, M., Heavy Metals in Cement and Concrete Resulting from the Co-incineration of Wastes in the Cement Kilns with Regard to the Legitimacy of Waste Utilisation, Wissenschaftliche Berichte des Forschungszentrums Karlsruhe FZKA 6923 (2003)
G [Gäbel et al., 2004]
Gäbel, K.; Forsberg, P.; Tillman, A.M., The design and building of a life cycle-based process model for simulating environmental performance, product performance and cost in cement manufacturing, Journal of Cleaner Production 12 (2004) 77-93

References
338 State of the art of the co-incineration of waste-derived fuels and raw materials in clinker/cement plants
[Gäbel/Tillmann, 2005] Gäbel, K.; Tillman, A.-M., Simulating operational alternatives for future cement production, Journal of Cleaner Production 13 (2005) 1246-1257
[Galvin et al., 2012] Galvin, A.P.; Ayuso, J.; Jimenez, J.R.; Agrela, F., Comparison of batch leaching tests and influence of pH on the release of metals from construction and demolition wastes, Waste Management 32 (2012), 88-95
[Gardeik et al., 1984a] Gardeik, H.O., Rosemann, H., Sprung, S., Rechenberg, W., Verhalten der Stickstoffoxide in Drehofenanlagen der Zementindustrie (in German), Zement-Kalk-Gips, 37 (1984) No 10, 499-507
[Gardeik et al., 1984b] Gardeik, H.O., Rosemann, H., Scheuer, A., Bildung und Abbau von NO in Zementofenanlagen, Teil I: Messungen an Industrieanlagen (in German), Zement-Kalk-Gips, 37 (1984) No 10, 508-512
[Gasteiner et al., 2016] Gasteiner, J.; Buchgraber, K.; Steinwidder, A.; Zefferer, P., Endbericht Hexachlorbenzol (HCB), Projekt Nr. 101070 - Wissenschaftliche Begleitung der HCB-Problematik im Kärntner Görtschitztal, Hrsg.: Höhere Bundeslehr- und Forschungsanstalt für Landwirtschaft, Raumberg-Gumpenstein, A-8952 Irdning-Donnersbachtal des Bundesministeriums für Land- und Forstwirtschaft, Umwelt und Wasserwirtschaft, A-1010 WIEN (2016), https://www.raumberg-gumpenstein.at/cm4/de/forschung/publikationen/downloadsveranstaltungen/viewdownload/672-forschungsberichte/28976-hcb-im-goertschitztal-abschlussbericht.html (accessed on 20.03.2017)
[Gemmer/Schneider, 2006] Gemmer, M.; Schneider, W., Development status of a modern rotary-kiln burner, Zement-Kalk-Gips 59 (2006), No. 8, 40-46
[Genon/Brizio, 2008] Genon, G.; Brizio, E., Perspectives and limits for cement kilns as a destination for RDF, Waste Management 28 (2008) 2375-2385
[Giddings, 2000] Giddings, D., Investigation into the operation of a cement works precalciner vessel, doctoral thesis submitted to the University of Nottingham (2000)
[Goosmann et al., 1993] Goosman, D.; Constans, D.; Woodford, J. et al., Metal equilibration and process capture efficiencies in cement kilns, AWMA International Specialty Conference on Waste Combustion in Boilers an Industrial Furnaces ( 1993)
[Griffin, 1986] Griffin, R.D., A new theory of dioxin formation in municipal solid waste combustion, Chemosphere 15 (1986), Nos 9-12, 1987-1990
[Grooterhorst, 2010a] Grooterhorst, A.; Die Nachhaltigkeitslücke – oder – Kann Abfallwirtschaft nachhaltig sein?, Müll und Abfall (2010) No. 9, 440-447
[Grooterhorst, 2010b] Grooterhorst, A.; Gefangen in der Kreislaufwirtschaft – oder – Abfallwirtschaft und starke Nachhaltigkeit, Müll und Abfall (2010) No. 10, 493-500
[Grundmann/Balhar, 2009] Grundmann, T.; Balhar, M., Stand und Perspektiven der Mechanisch-Biologischen Abfallbehandlung (MBA) in Deutschland, Müll und Abfall (2009) No. 4, 204-209

References
State of the art of the co-incineration of waste-derived fuels and raw materials in clinker/cement plants 339
[Guinée, 2004] Guinée, J.B., Handbook of Life Cycle Assessment: Operation Guide to ISO Standards, Kluwer Academic, New York (2004)
[Gullett et al., 1990]
Gullett, B.K.; Bruce, K.R.; Beach, L.O., Formation of chlorinated organics during solid waste combustion, Waste Management & Research 8 (1990) 203-214
[Gullett et al., 2000] Gullett, B.K.; Dunn, J.E.; Raghunathan, K., Effect of co-firing coal on the formation of polychlorinated dibenzo-p-dioxins and dibenzofurans during waste combustion, Environmental Science & Technology 34 (2000) 282-290
H [Hagenmaier/Beising, 1989]
Hagenmaier, H.; Beising, R., Untersuchung von Kraftwerksrauchasen auf polychlorierte Dibenzodioxine and Dibenzofurane, VGB Kraftwerkstechnik 69 (1989) 1024
[Harvey, 1998] Harvey, R.G., Environmental Chemistry of PAHs, in: Neilson, A.H. (volume editor) PAHs and related compounds, Springer
[Heijungs/Guinée, 2007] Heijungs, R.; Guinée, J.B., Allocation and ‘‘what-if’’ scenarios in life cycle assessment of waste management systems, Waste Management 27 (2007) 997–1005
[Helftewes et al., 2012] Helftewes, M.; Flamme, S.; Nelles, M., Greenhouse gas emissions of different waste treatment options for sector-specific commercial and industrial waste in Germany, Waste Management & Research 30 (2012, No. 4, 421-431
[Heyde et al., 2010] Heyde, M.; Gerke, G.; Mühle, S., Werkstoffliche Verwertung von Verpackungsstoffen aus der Getrenntsammlung Dualer Systeme, Müll und Abfall (2010) No. 1, 32-37
[HDC, 2012] HeidelbergCement Northern Europe, Energy and climate; http://www.heidelbergcement.com/no/en/country/sustainability/energy_climate.htm, accessed 8 August 2012
[Hill, 1922] Hill, C.F., Measurement of mercury vapor pressure by means of the Knudsen pressure gauge, Physical Revue 20 (1922) 259-267
[Hocquel, 2000] Hocquel, M., Quecksilber und seine Verbindungen bei der Abfallverbrennung, Study carried out bythe University of Stuttgart (Institut für Verfahrenstechnik und Dampfkesselwesen) in charge of the Landesumweltamt of the German federal state Northrhine-Westphalia (2000)
[Hoenig et al., 2011] Hoenig, V.; Bluhm-Drenhaus, T.; Wirtz, S.; Scherer, V.; Perumalsamy, S.; Oeljeklaus, G.; Görner, K.; Aslan, Z.; Schäfer, S.; Hoenig, V., CDF simulation of the co-incineration of solid recovered fuels in the precalciner, Cement International 9 (2011) No. 3, 54-63
[Hoenig, 2012] Hoenig, V., Energy and resources efficiency in the cement industry, European cement research academy, presentation given at Industrial Technologies 2012 from 19 – 21 June 2012 (2012)

References
340 State of the art of the co-incineration of waste-derived fuels and raw materials in clinker/cement plants
[Hoenig, 2013] Hoenig, V., Sources of mercury, behavior in cement process and abatement options, Presentation at the event “Cement Industry Sector Partnership on Mercury, Partnership Launch Meeting” of European Cement Research Academy on 19 June 2013, http://www.unep.org/hazardoussubstances/Portals/9/ECRA_WBCSD-CSI%20Mercury_20130618_upload.pdf
[Hohberg et al., 1996] Hohberg, I.; Müller, C.; Schießl, P., Umweltverträglichkeit zementgebundener Baustoffe: Zusammenfassung eines Sachstandsberichtes des DAfStb., Beton 46 (1996) No. 3, pp 156-160
[Holcim Lägerdorf, 2012] Application of Holcim (Deutschland) GmbH for a permit from 22 June 2012 for retrofitting the clinker production plant in DE-Lägerdorf with a PREPOL Step Combustor to use pre-sorted lumpy packaging material collected by the Duales System Deutschland Ltd. (DSD) and coarse roof felt (2012)
[Holcim, 2007] Dekeukelaere, A.; Lowes, T.; Co Processing of AFR in Holcim and its Enhancement with CFD, presentation at the 1st Global Fuels Conference and Exhibition in London, UK on 5-6 February 2007
[Holcim/GTZ, 2006] Holcim Group Support Ltd/Deutsche Gesellschaft für Technische Zusammenarbeit (GTZ), Guidelines on co-processing waste materials in cement production – The GTZ-Holcim Public Private Partnership (2006)
[Holleman-Wiberg, 1985] Holleman, A.F.; Wiberg, E., Lehrbuch der Anorganischen Chemie, 91.-100. Verbesserte und stark erweiterte Auflage, Walter de Gruyter, Berlin/New York (1985), pp 1042-1049
[Howsam/Jones, 1998] Howsam, M.; Jones, K.C., Sources of PAHs in the Environment, in: Neilson, A.H. (volume editor) PAHs and related compounds, Springer (1998) 137-174
[Hunsinger et al., 2002] Hunsinger, H.; Jay, K.; Vehlow, J., Formation of pollutants during municipal solid waste incineration in a grate furnace under different air/fuel ratios, In 21th Annual International Conference on Incienration and Thermal Treatment Technologies (IT3), New Orleans, LA, 13-17 May 2002, Proc. CD-ROM (2002)
[Hunsinger et al., 2003] Hunsinger, H.; Seifert, H.; Jay, K., Formation of PCDD/F during start-up of MSWI, Organohalogen Compounds 63 (2003) 37-40
[Hunsinger et al., 2007] Hunsinger H.; Seifert, H.; Jay, K., Reduction of PCDD/F Formation in MSWI by a Process-Integrated SO2 Cycle, Environmental Engineering Science 24 (2007) No. 8, 1145-1159
[Hunsinger et al., 2009] Hunsinger, H.; Seifert, H.; Jay, K., Design and operation of low-PCDD/F municipal solid waste incineration, Dioxin 2009 - 29th International Symposium on Halogenated Persistent Organic Pollutants in Beijing/China (2009)
[Huntzinger/Eatmon, 2009] Huntzinger, D.H.; Eatmon, T.D., A life-cycle assessment of Portland cement manufacturing: comparing the traditional process with alternative technologies, Journal of Cleaner Production 17 (2009) 668-625

References
State of the art of the co-incineration of waste-derived fuels and raw materials in clinker/cement plants 341
I [IACR PCB/PBB, 2016]
International Agency for Research on Cancer (IACR) of the World Health Organization (2016), Polychlorinated biphenyls and polybrominated biphenyls, IARC Monographs on the evaluation of carcinogenic risks to humans, Volume 107, http://monographs.iarc.fr/ENG/Monographs/vol107/mono107.pdf (accessed on 20.06.2017)
[IFEU, 1999] Giegrich, J.; Fehrenbach, H.; Orlik, W.; Schwarz, M., Ökologische Bilanzen in der Abfallwirtschaft, Institut für Energie- und Umweltforschung Heidelberg GmbH (IFEU), UBA-Texte 10/99 (1999)
[Iliuta et al., 2002] Iliuta, I.; Dam-Johansen, K.; Jensen, L.S., Mathematical modeling of an in-line low-NOx calciner, Chemical Engineering Science 57 (2002) 805-820
[Initiative Zn, 2012] INITIATIVE ZINK in der WirtschaftsVereinigung Metalle, Mit Zinkoxid im Reifen sicher auf der Überholspur, press release dated 9 July 2012
[IPTS Construction, 2012] Galvez Martos, J. L.; Schönberger, H.; Styles, D., Reference document on best environmental Management Practice in the building and construction sector, JRC/Institute for Prospective Technological Studies, Final Report (2012),
http://susproc.jrc.ec.europa.eu/activities/emas/documents/ConstructionSector.pdf (accessed 31.01.2013)
[ISO 14040-LCA, 2006] ISO 14040 International Standard, In: Environmental Management - Life Cycle Assessment - Principles and Framework, International Organisation for Standardization, Geneva/Switzerland (2006)
[ISO 14044-LCA, 2006] ISO 14044 International Standard, In: Environmental Management - Life Cycle Assessment - Requirements and Guidelines, International Organisation for Standardisation, Geneva/Switzerland (2006)
[IT SRF, 2012] Italian Minister for the Environment and Land and Sea Protection, Draft legislation establishing end-of-waste criteria for Solid Recovered Fuel (SRF) dated 22 August 2012, accessed on 13 November 2012 (http://ec.europa.eu/enterprise/tris/pisa/app/search/index.cfm?fuseaction=getdraft&inum=1836604)
J [Jäger et al., 2006]
Jäger, U.; Thorwarth, H.; Acuna-Caro, C.; Scheffknecht, G., Verhalten von Quecksilber und seinen Verbindungen in staubhaltigen Rauchgasen, Schlussbericht zum AiF-Forschungsvorhaben Nr. 13 534 N (2006)
[Jager et al., 1997] Jager, J.; Lahl, U.; Kruse, H.; Tim, R.; Zeschmar-Lahl, B., Emissionen aus Mechanisch-biologischen Restabfallbehandlungsanlagen (MBA): Anorganische und organische Stoffe mit toxischem Wirkungspotential, Müll und Abfall (1997) No. 6, 333-341
[Jarras, 2017] Jarass, H. D. (2017): Bundes-Immissionsschutzgesetz (BImSchG) – Kommentar, C.H. Beck, München, 12. Aufl.

References
342 State of the art of the co-incineration of waste-derived fuels and raw materials in clinker/cement plants
[Jaun, 2004] Jaun, W., Betriebserfahrung mit dem Einsatz von Sekundärbrennstoffen im Zementdrehofen der Werke in CH-Untervaz und Eclépens der Holcim (Schweiz) AG, http://www.pillard.de/bilder/kommunikation/vortraege-praesentationen/PILLARD-sekundaerbrennstoffe-zement-drehofen.pdf (accessed on 24.10.2014)
[Johnke et al., 2001] Johnke, B.; Menke, D.; Böske, J., Neue Bewertung bei den Toxizitätsäquivalenten für Dioxine/Furane und für PCB durch die WHO, UWSF – Z Umweltchemie und Ökotoxikologie 13 (2001) 175-180
[Josa et al., 2004] Josa, A.; Aguado, A.; Heino, A.; Byars, E.; Cardim, A., Comparative analysis of the life cycle inventories of cement in the EU, Cement and Concrete Research 34 (2004) 1313-1320
[Josa et al., 2007] Josa, A.; Aguado, A.; Cardim, A.; Byars, E., Comparative analysis of the life cycle impact assessment of available cement inventories in the EU, Cement and Concrete Research 37 (2007) 781-788
[JRC IES, 2002] Joint Research Centre of the European Commission (JRC), Institute for Environment and Sustainability (IES), Langenkamp, H.; Nieman, H, Survey on Solid Recovered Fuels Production in Europe, EU 20237 EN, http://publications.jrc.ec.europa.eu/repository/bitstream/111111111/241/1/EUR%2020237%20EN.pdf (2002) (accessed 07.11.2012)
[JRC-IPTS EoW, 2009] Villanueva, A.; Delgado, L.; Luo, Z.; Eder, P.; Catarino, A.; Litten, D.; Study on the selection of waste streams for end-of-waste assessment, Final report commissioned by the Institute for Prospective Technological Studies (IPTS), one of the seven institutes of the Joint Research Centre (JRC) of the European Commission (2009)
K [Kamm, 1985]
Kamm, K., Das Verdampfungs- und Kondensationsverhalten von Thallium im inneren Kreislauf eines Zementofens mit Wärmetauscher, Zement-Kalk-Gips 38 (1985) 324-329
[Kanefke, 2008] Kanefke, R., Durch Quecksilberbromierung verbesserte Quecksilberabscheidung aus den Abgasen von Kohlekraftwerken und Abfallverbrennungsanlagen, Doctoral thesis, Martin-Luther-Universität Halle-Wittenberg, Beiträge zum Umweltschutz, Band 5/2008, Shaker Verlag GmbH, Aachen/Germany (2008)
[Kanefke, 2011] Kanefke, R., Grundlagen der Quecksilberabscheidung und –messung, Manuscript for the presentation at the ‘VDI-Fachkonferenz – Messung und Minderung von Quecksilber-Emissionen‘ on 13 April 2011 in Düsseldorf/Germany
[Karstensen, 2006] Karstensen, K.H., Formation and Release of POPs in the Cement Industry, Second edition, World Business Council for Sustainable Development - Cement Sustainability Initiative (2006), http://wbcsdpublications.org/project/formation-and-release-of-pops-in-the-cement-industry-second-edition/ (accessed on 20.03.2017)
[Karstensen, 2008] Karstensen K.H., Formation, release and control of dioxins in cement kilns, Chemosphere 70 (2008) 543–560

References
State of the art of the co-incineration of waste-derived fuels and raw materials in clinker/cement plants 343
[Karstensen et al.,2010] Karstensen, K.H.; Mubarak, A.M.; Gunadasa, H.N.; Wijagunasekara, B.; Ratnayake, N.; De Alwis, A.; Fernando, J., Test burn with PCB-oil in a local cement kiln in Sri Lanka, Chemosphere 78 (2010) 717-723
[Kaupp/Umlauf, 1992] Kaupp, H.; Umlauf, G., Atmospheric Gas-Particle Partitioning of Organic Compounds: Comparison of Sampling Methods, Atmos. Environ. 26A (1992) 2259-2267
[Kemper/Bertram, 1984] Kemper, F.H.; Bertram, H.P., Thallium, in: Merian, E. (Ed.), Metalle in der Umwelt, Verlag Chemie (1984) 571-583
[Ketelhut, 2007] Ketelhut, R.; Qualitätssicherung für Ersatzbrennstoffe in Schleswig-Holstein – Abschlussbericht (2007)
[Ketelhut, 2008a] Ketelhut, R.; Chloranalytik in heizwert-reichen Abfällen – nicht mehr (als) nötig!, Müll und Abfall (2008), Nr. 1, 25-32
[Ketelhut, 2008b] Ketelhut, R.; Chloranalytik in heizwert-reichen Abfällen – nicht mehr (als) nötig! – 2. Teil, Müll und Abfall (2008), Nr. 2, 80-86
[KHD Humboldt, 2004] Knoch A., KHD Humboldt Wedag AG, Burner Technology (Copy of World Cement, December 2004), http://www.khd.com/publications.html, accessed on 19 January 2012
[KHD, 2007] Hand, A.; HUMBOLDT WEDAG International Ltd. (KHD), Technology Options for the Cement Industry with the Use of Alternative Fuels, presentation at the Alf-Cemind Workshop in GR-Athens on 16 May 2007, (2007), http://search.babylon.com/?q=alf-cemind+workshop+technology+options+for+the+cement+industry+with+the+use+of&babsrc=HP_ss&s=web&rlz=0&as=3&ac=0%2C170, accessed 26 November 2012
[Kirchartz, 1994] Kirchartz, B., Reaktion und Abscheidung von Spurenelementen beim Brennen des Zementklinkers, Schriftenreihe der Zementindustrie, (1994)Heft 56, Verlag Bau + Technik, Düsseldorf
[Klein/Hoenig, 2006] Klein, H.; Hoenig, V., Model calculations of the fuel energy requirement for the clinker burning process, Cement International 4 (2006) No. 3, 45-63
[Kleinhorst, 1980] Kleinhorst, H., Emissionsverhältnisse beim Einsatz von thalliumhaltigen Rohstoffen, Zement-Kalk-Gips 33 (1980) 648-652
[Knotts et al., 2012] Knotts, J.; Kolde, J.; Polizzi, C.; Stark, S., A fixed bed gas remediation solution for mercury control,53rd Cement Industry Technical Conference of IEEE-IAS/PCA on 14-17 May 2012 (2012)
[Krabbe, 2010] Krabbe, H.-J., Grundlagen zur Chemie des Quecksilbers am Beispiel von Rauchgasreinigungsanlagen, Manuscript of the presentation at the ‘VDI Wissensforum – Messung und Minderung von Quecksilberemissionen’ on 28 April 2010 in Düsseldorf/Germany (2010)
[Krause/Wuttke, 2011] Krause, S.; Wuttke, J.; Erhebliche Potentiale bei der Verwertung gemischter gewerblicher Siedlungsabfälle, Müll und Abfall (2011), Nr. 12, 564-569

References
344 State of the art of the co-incineration of waste-derived fuels and raw materials in clinker/cement plants
[Kranert, 2009] Kranert, M.; Abfallvermeidung – Wunsch und Wirklichkeit, Müll und Abfall (2009) No. 3, 101
[Kreft et al., 1987] Kreft, W.; Scheubel, B.; Schütte, R., Klinkerqualität, Energiewirtschaft, Zement-Kalk-Gips 40 (1987) No. 3, 127-133
[Kügler et al., 2009] Kügler, T.; Baumann,J.; Bilitewski, B., Veränderung der Restabfallzusammensetzung im Lauf der Zeit und Auswirkungen auf den Input der thermischen Abfallbehandlung, Müll-Handbuch, E. Schmidt Verlag Berlin, Lieferung 4/09 (2009)
[Küppers, 1998] Küppers, P.; Ersatzbrennstoffe aus Abfällen, in: KGV-Rundbrief 1/1998 (1998) 10-13
[Kurz et al., 2002] Kurz, H.; Schulz, R.; Römheld, V., Anbauempfehlungen für mit Thallium belastete Böden: Einfluss von Pflanzenart und Sorte auf die Thallium-Aufnahme (2002), http://www.fachdokumente.lubw.baden-wuerttemberg.de (accessed 14 September 2015)
L [LAGA, 1997]
N.N., LAGA – Länderarbeitsgemeinschaft Abfall 1997: Maßstäbe und Kriterien für die energetische Verwertung von Abfällen in Zementwerken, Entwurf 31.10.1997 (draftofthe Federal States Working Group forWaste Management (LAGA), dated 1997: Standards andcriteriafortheenergyrecoveryfromwastes in cementplants, draft 31.10.1997)
[Lahl, 1999] Lahl, U.; Ökodumping und Scheinverwertung, Manuskript zur KKS-Veranstaltung auf der IFAT 1999 (1999)
[Lahl et al., 2000] Lahl, U.; Zeschmar-Lahl B.; Weiler M., Beurteilung der Umweltverträglichkeit von thermischen Entsorgungsmaßnahmen; Study on behalf of the North Rhine-Westphalian Ministry of Environment, Nature Conservation, Agriculture and Consumer Protection (NRW MUNLV ) (1999), and, based on that, the guidance document „Stoffflussanalyse bei abfallrechtlichen Beurteilungsfragen“ issued by the NRW MUNLV(2000)
[Lahl, 2000] Lahl, U.; Ecological aspects of co-incineration of solid waste in cement kilns, in: Pawlowski, L.; Dudzinska, M.R.; Gonzalez, M.A. (Eds.), Thermal Solid Waste Utilisation in Regular and Industrial Facilities, Environmental Science Research 58 (2000) 11-17
[Lahl, 2001] Lahl, U., Entscheidungshilfen durch stoffstromanalytische Betrachtungen bei der Bewertung von abfallwirtschaftlichen und immissionsschutzrechtlichen Maßnahmen, Habilitation Treatise, Technical University of Darmstadt/Germany (2001)
[Lahl et al., 2012] Lahl, U.; Schönberger, H.; Zeschmar-Lahl, B.: Substanzielle ökologische Verbesserungen möglich: Bei der Umsetzung der Industrieemissions-Richtlinie der EU in nationales Recht können Bundestag und Bundesrat wichtige Anregungen berücksichtigen, ReSource(2012) No. 2, 41 – 48
[Lahl/Ludwig, 2003] Lahl, U.; Ludwig, O. (2003): Die Novelle der Abfallverbrennungsverordnung (17. BImSchV) schafft angeglichene Anforderungen für Mono- und Mitverbrennungsanlagen, Müll und Abfall, Nr. 12, S. 648-653

References
State of the art of the co-incineration of waste-derived fuels and raw materials in clinker/cement plants 345
[Land Kärnten, 2014] Kärnten, Hexachlorbenzol-Belastung in der Region Görtschitztal; Maßnahmen; Statusbericht für das Kollegium der Kärntner Landesregierung vom 08.12.2014 (2014), http://www.ktn.gv.at/302799_DE%2dInformationDokumentation%2dStatusberichte (accessed on 20.03.2017)
[Land Kärnten, 2015] Kärnten, HCB Görtschitztal Statusbericht mit Ergebnissen, Maßnahmen des Expertenstabes und der Dienststellen des Landes Stand November 2015: HCB Görtschitztal – Zwischenergebnisse vom 5. März 2015 (2015), http://www.ktn.gv.at/302799_DE%2dInformationDokumentation%2dStatusberichte (accessed on 20.03.2017)
[Landmann/Romer, 2018] Landmann/Rohmer (2018), Siebzehnte Verordnung zur Durchführung des Bundes-Immissionsschutzgesetzes (Verordnung über die Verbrennung und die Mitverbrennung von Abfällen – 17. BImSchV); 17th Ordinance for the Implementation of the Federal Clean Air Act concerning the Incineration and Co-incineration of Wastes, Umweltrecht, Kommentar, Band IV, C.H. Beck, 87. Ergänzungslieferung (July 2018)
[Larsen et al., 2007] Larsen, M.B.; Schmidt, I.; Paone, P.; Salmento, J.; Petersen, A.; Jørgensen, A.W., Mercury in cement production – A literature review, FLSmidth internal report (2007) quoted according to Zheng Y., Mercury Removal from Cement Plants by Sorbent Injection upstream of a Pulse Jet Fabric Filter, PhD Thesis at the Technical University of Denmark (2011), http://wwwx.dtu.dk/upload/kt-chec/phd%20thesis,%20yuanjing%20zheng,%20endelig%20version,%20klar%20til%20print.pdf (accessed 23 January 2014)
[Lechtenberg, 2010] Lechtenberg, D.; Alternative fuels in Ireland – How the Celtic tiger lost its claws, globalcementMagazine (December – January 2010) 56-58
[Lechtenberg/Diller, 2012] Lechtenberg, D.; Diller, H.; Alternative Fuels and Raw Materials Hanbook for the Cement and Lime Industry, Vol. 1, Verlag Bau + Technik GmbH, Düsseldorf/Germany, (2012)
[Liebel/Gerger, 1993] Liebel, P.; Gerger, W., Nutzen und Grenzen beim Einsatz von Sekundärstoffen, Zement-Kalk-Gips 46 (1993) No. 10, 632-638
[Lindbauer, 1992] Lindbauer, R.L., Combustion dioxin suppression in municipal solid waste incineration with sulfur additives, Chemosphere 25 (1992) 1409-1414
[Linero, 2011] Linero, A.A., Synopsis of Mercury Controls at Florida Cement Plants, Manuscript for the presentation at 104st Annual Conference and Exhibition of the Air and Waste Management Association in Orlando, Florida/USA on 22 June 2011 (2011)
[Linero/Read, 2008] Linero, A.A.; Read, D.L., Will the Hg Cycle be Unbroken? An Air and Waste Management Issue!, Manuscript for the presentation at 101st Annual Conference and Exhibition of the Air and Waste Management Association from 24-27 June 2008 in Portland, Oregon/USA (2008), http://www.dep.state.fl.us/air/emission/construction/cement/a658_6.pdf (accessed on 12.08.2013)
[Locher, 2000] Locher, F.W., Zement - Grundlagen der Herstellung und Verwendung, Verlag Bau und Technik (2000)

References
346 State of the art of the co-incineration of waste-derived fuels and raw materials in clinker/cement plants
[Locher, 2006] Locher, F.W., Cement: principles of production and use, Verlag Bau+Technik Düsseldorf/Germany (2006)
[Locher/Klein, 2011a] Locher, G.; Klein, H., Modelling circulation sulfur, chlorine and alkali systems in the clinker burning process; part 1: comparison of measurement and calculation, Cement International 7 (2009) No. 3, 74-87
[Locher/Klein, 2011b] Locher, G.; Klein, H., Modelling circulation sulfur, chlorine and alkali systems in the clinker burning process; part 2: theory and discussion, Cement International 7 (2009) No. 4, 64-75
[Lorber et al., 2015] Lorber, K.E.; Wruss, K.; Sarc, R.; Pomberger, R., Durch den Aufgabeort bedingte Immissionen beim Einsatz alternativer Roh- und Brennstoffe im Zementwerk. In: Thomé-Kozmiensky, K.J.; Löschau, M. (Hrsg.): Immissionsschutz, Band 5 (2015) 241-262, https://www.vivis.de/wp-content/uploads/IS5/2015_IS_241-262_Lorber.pdf (accessed on 23.07.2019)
[Lorenz/Gwosdz, 2001] Lorenz, W.; Gwosdz, W., Trends in der Zementindustrie, Bundesanstalt für Geowissenschaften und Rohstoffe Hannover, Commodity Top News No. 15 (2001)
[Lowes, 2011] Lowes, T., Calciner modifications for lower CO and NOx using MI-CFD Analysis to optimize OH radicals and hot reburn conditions, presentation at IEEE St. Louis on 24 May 2011
[Lübbe-Wolff, 1999] Lübbe-Wolff, G.; Abfallmitverbrennung in Industrieanlagen, DVBl. (1999) 1091-1106
[Lundie et al., 2007] Lundie, S.; Ciroth, A.; Huppes, G., Inventory methods in LCA: towards consistency and improvement - Final Report, UNEP-SETAC Life Cycle Initiative (2007)
[Lysychenko et al., 2015] Lysychenko, G.; Weber, R.; Gertsiuk, M.; Kovach, V.; Krasnova, I., Hexachlorobenzene waste deposits at Kalush city (Ukraine) – Threat to Western Ukraine and transboundary water bodies and remediation efforts. Environmental Science and Pollution International 22 (2015) 14391-14404
M [Martel, 2000]
Martel, C., Brennstoff- und lastspezifische Untersuchungen zum Verhalten von Schwermetallen in Kohlenstaubfeuerungen, VDI Fortschritts-Berichte, Reihe 15, Nr. 225 (2000)
[Mauschitz et al., 2012] Mauschitz, G.; Hagn, S.; Philipp, G; Secklehner, A., Pilot trials for catalytic reduction of nitrogen oxides in exhaust gases from Austrian cement plants, Cement International 10 (2012), No. 1, 40-41
[Mauschitz et al., 2018] Mauschitz, G.; Secklehner, A.; Hagn, S., The DeCONOx process – an example of advanced exhaust gas cleaning technology in the Austrian cement industry, Cement International 16 (2018), No. 2, 34–52
[Mersmann, 2007] Mersmann, M., Pyroprocessing technology – continuous improvement, IEEE – IAS/PCA Conference, Charleston, USA (2007)
[Mersmann, 2010a] Mersmann, M., Optimization of calciners in the cement industry, Zement-Kalk-Gips 63 (2010) No. 2, 27-35

References
State of the art of the co-incineration of waste-derived fuels and raw materials in clinker/cement plants 347
[Mersmann, 2011] Mersamann, M., Increasing secondary fuel burning by calciner and burner optimization Presentation at the Global Secondary Fuels Conference (2011)
[Mersmann, 2010b] Mersmann, M., New ways of calculating dense suspension flows, Cement International 8 (2010) No. 5, 36-40
[Miller et al., 2011] Miller, S.W.; Jensen, F.; Nielsen, K.E., The gas suspension absorber at Norcem’s Brevik plant, IEEE-IAS/PCA 53rd Cement Industry Technical Conference on 22-26 May 2011 (2011)
[Mikulčić et al., 2010] Mikulčić, H.; von Berg, E.; Vujanović, M.; Priesching, P.; Perković, L.; Tatschl, R.; Duić, N., Numerical modelling of calcination reaction mechanism for cement production, Chemical Engineering Science 69 (2012) 607-615
[Minamata Convention, 2013] N.N., Draft Minamata Convention on Mercury, http://unep.org/hazardoussubstances/Portals/9/Mercury/Documents/INC5/5_7_e_annex_advance.pdf
[Minamata BAT/BEP Cement, 2015] Minamata Convention on Mercury, Draft guidance on cement clinker production facilities on best available techniques and best environmental practices (BAT/BEP), http://mercuryconvention.org/Negotiations/BATBEPExpertGroup/CommentsonBATBEPguidance/tabid/4545/Default.aspx (accessed on 20 February 2016)
[Mlakar et al., 2010] Mlakar, L.T.; Horvat, M.; Vuk, T.; Stergaršek, A.; Kotnik, J.; Tratnik, J.; Fajon, V., Mercury species, mass flows and processes in a cement plant, Fuel 89 (2010) pp 1936-1945
[Mokrzycki et al., 2003] Mokrzycki, E.; Uliasz-Bocheńczyk, A.; Mieczyslaw, S., Use of alternative fuels in the Polish cement industry, Applied Energy 74 (2003) 101-111
[Mumma/Lawless, 1975] Mumma, C.E.; Lawless, E.W., Survey of industrial processing data: Task I – hexachlorobenzene and hexachlorobutadiene pollution from chlorocarbon processing. Midwest Research Institute prepared for US Environmental Protection Agency (1975), available online at the National Service Center for Environmental Publications (NSCEP)
[Murray/Price, 2008] Murray, A.; Price, L., Use of alternative fuels in the cement manufacture: Analysis of fuel characteristics and feasibility for use in the Chinese cement sector, Ernest Orlando Lawrence Berkeley National Laboratory (2008)
N [Ness et al., 2007]
Ness, B.; Urbel-Piirsalu, E.; Anderberg, S.; Olsson, L., Categorising tools for sustainability assessment. Ecol. Economics 60 (2007) 498–508.
[NRW MUNLV, 2005] Ministerium für Umwelt und Naturschutz, Landwirtschaft und Verbraucherschutz (MUNLV) des Landes Nordrhein-Westfalen (NRW), Leitfaden zur energetischen Verwertung von Abfällen in Zement-, Kalk- und Kraftwerken in Nordrhein-Westfalen, 2. Auflage (2005)

References
348 State of the art of the co-incineration of waste-derived fuels and raw materials in clinker/cement plants
[NRW MUNLV, 2007] Ministerium für Umwelt und Naturschutz, Landwirtschaft und Verbraucherschutz (MUNLV) des Landes Nordrhein-Westfalen (NRW), Ökobilanz thermischer Entsorgungssysteme für brennbare Abfälle in Nordrhein-Westfalen (2007)
O [OECD, 2007]
OECD, Guiding Principles of Effective Environmental Permitting Systems (OECD), https://www.oecd.org/env/outreach/37311624.pdf (accessed 19.04.1018)
[Oerter, 2007] Oerter, M., Influence of raw materials on the emissions of mercury, presentation at the seminar of the European cement research academy (ecra) on 26 April 2007
[Oerter/Zunzer, 2010] Oerter M.;Zunzer, U.; Kontinuierliche Messung von Quecksilberemissionen bei der Zementherstellung, in: Emissionsminderung 2010: Stand – Konzepte – Fortschritte, VDI Berichte 2110, VDI Verlag, Düsseldorf/Germany (2010) 221-224
[Oerter/Zunzer, 2011] Oerter, M.; Zunzer, U., Messung und Minderung von Quecksilber in der Zementindustrie, Manuscript and presentation of/at the VDI Fachkonzerenz „Messung und Minderung von Quecksilber-Emissionen“ on 13 April 2011
[Ogawa et al., 1996] Ogawa, H.; Orita, N.; Horaguchi, M.; Suzuki, T., Okada, M.; Yasuda, S., Dioxon reduction by sulfur component addition, Chemosphere 32 (1996) 151-157
[ORF, 2017] Österreichischer Rundfunk (orf.at), Umweltskandal HCB: Eine Chronologie, http://kaernten.orf.at/news/stories/2683507/ (accessed on 20.03.2017)
P [Paone, 2008]
Paone, P.; Heavy metals in the cement industry: A look at volatile cycles and simple mitigation techniques, http://www.asocem.org.pe/bivi/sa/dit/icem/01-04-2008. pdf (accessed 34.11.2013)
[Paone, 2010] Paone, P., Mercury reduction technologies for ́ cement production, Manuscript for the presentation given at 52nd IEEE/PCA/IAS Cement Industry Technical Conference held from 28 March – 1 April 2010 in Colorado Springs/USA (2010)
[Patent, 1965] Deutsches Patent 1251688, Rohrbach, R., Rechmeier, H., Verfahren zur Herstellung von Zementklinkern (Process for the manufacture of clinker), date of filing: 26 March 1965
[Philipp, 2013] Philipp, G., Regenerative Thermische Oxidation (RTO) mit integrierter NOx-Reduktion, Zement Kalk Gips 11 (2013) 30-37
[Pomberger et al., 2012] Current issues on the production and utilization of medium-calorific solid recovered fuel: a case study on SFR for HOTDISC technology, Waste Management & Research 30 (2012) no. 4, 413-420
[Popp et al., 2000] Popp, P.;Brüggemann, L.; Keil, P.; Thuß, U.; Weiß, H., Chlorobenzenes and hexachlorocyclohexanes (HCHs) in the atmosphere of Bitterfeld and Leipzig (Germany), Chemosphere 41 (2000) 849-855

References
State of the art of the co-incineration of waste-derived fuels and raw materials in clinker/cement plants 349
[Pretz, 2008] Pretz, T.; Sekundärbrennstoff – Aufbereitung und Verwertung, Müll und Abfall (2008) No. 11, 556-560
[Pretz et al., 2010] Pretz, T.; Schmalbein, N.; Wens, B., Verwertung von Siedlungsabfall – ein Beitrag zur Ressourceneffizienz, Müll und Abfall (2010) No. 12, 576-581
[Pretz et al., 2012] Pretz, T.; Raulf, K.; Schockert, Y., Neue Wege in den Sensortechnologien, Müll und Abfall (2012) No. 2, 72-79
[PRIZMA, 1999] Fehringer, R.; Rechberger, H.; Brunner, H.P., Positivlisten für Reststoffe in der Zementindustrie: Methoden und Ansätze (PRIZMA), Final Report on behalf of the Association of the Austrian Cement Industry, Vienna/Austria (December 1999)
[PT RDF, 2010] Council of the European Union, Note from the Portuguese Delegation concerning “Directive 2008/98/EC) on waste – Strategic importance of end of waste for high quality refuse-derived fuel in the near future”, 17916/10 (ENV 865 / ENER 364), 15 December 2010
[Puntke/Schneider, 2008] Puntke, S; Schneider, M., Effects of phosphate on clinker mineralogy and cement properties, Cement International 6 (2008) No. 5, 80-93
[PVC, 2002] PVCplusKommunikations GmbH in Bonn/Germany / API PVC- und Umweltberatung GmbH in Vienna/Austria / PVCH Arbeitsgemeinschaft der Schweizerischen PVC-Industrie in Aarau/Switzerland, PVC Product Information No. 13 (2002), http://www.pvc-partner.com/fileadmin/user_upload/downloads/Produktinformationen/3_4_11_Prodinfo_Verpackungen.pdf, accessed 5 Oktober 2012
Q [Quaß/Fermann, 1997]
Quaß, U.; Fermann, M., Identification of relevant industrial sources of dioxins and furans in Europe (The European Dioxin Inventory) – Final Report, North-Rhine Westphalia State Environment Agency (LUA NRW), Materialien No. 43 (1997)
R [Raghunathan/Gullett, 1996]
Raghunathan,K.; Gullett, B.K., Role of sulfur reducing PCDD and PCDF formation, Environmental Science & Technology 30 (1996) 1827-1834
[RAL-GZ 724, 2001/2012] Bundesgütegemeinschaft Sekundärbrennstoffe und Recyclingholz e.V. (BGS), RAL-Gütezeichen Sekundärbrennstoffe – Sekundärbrennstoffe aus heizwertreichen Abfällen (May 2001, latest issue January 2012), quoted according to (Zeschmar-Lahl, 2003), (ECOS, 2005), (ERFO, 2005) and (UBA AT, 2012)
[Ravindra et al., 2008] Ravindra, K.; Sokhi, R.; Grieken, R.-V., Atmospheric polycyclic aromatic hydrocarbons: Source attribution, emission factors and regulation, Atmospheric Environment, 42 (2008) Issue 13, 2895-2921
[Reap et al., 2008] Reap, J.; Roman, F.; Duncan, S.; Bras, B., A survey of unresolved problems in life cycle assessment, Part I: goals and scope and inventory analysis, International Journal of Life Cycle Analysis 13 (2008) 290–300

References
350 State of the art of the co-incineration of waste-derived fuels and raw materials in clinker/cement plants
[Rechmeier, 1970] Rechmeier, H., Der fünfstufige Wärmetauscherofen zum Brennen von Klinker aus Kalkstein und Ölschiefer, Zement-Kalk-Gips23 (1970) No. 6, 249-253
[Reinmann et al., 2006] Reinmann, J.; Kuch, B.; Weber, R. , Continuous monitoring of unintentionally formed POPs listed under the Stockholm Convention (PCDD/Fs, PCBs and HCB) by using the AMESA® long-term sampling system, Organhalogen Compounds 68 (2006) pp 852-855
[Reinmann et al., 2008] Reinmann, J.; Weber, R.; Watson, A., Validation tests for PCDD/PCDF long-term monitoring systems: Short comings of short term sampling and other lessons learned, Organohalogen Compounds 70 (2008) pp 521-527
[Reinmann et al., 2010] Reinmann, J.; Weber, R.; Haag, R., Long-term monitoring of PCDD/PCDF and other unintentionally produced POPs – Concepts and case studies from Europe, Science China Chemistry 53 (2010) No. 5, pp 1017-1024
[Rentz/Martel, 1998] Rentz, O.; Martel, C., Analyse der Schwermetallströme in Steinkohlefeuerungen – Einfluß der Kohlesorte und des Lastzustandes, Projekt Europäisches Forschungszentrum für Maßnahmen zur Luftreinhaltung (PEF), Förderkennz. PEF 496001 (1998)
[Renzoni et al., 2010] Renzoni, R.; Ullrich, C.; Belboom, S.; Germain, A., Mercury in the Cement Industry, Report ofthe University of Liège independently commissioned by CEMBUREAU (2010)
[Rippen, 1994] Rippen, G., Hexachlorbenzol, Handbuch der Umwelt-Chemikalien. Physikalisch-chemische und ökotoxikologische Daten ausgewählter chemischer Stoffe, 24. Erg.Lfg. 5/94, ecomed Landsberg/Lech (1994)
[Rippen, 2009] Rippen, G., Handbuch Umwelt-Chemikalien, ecomed Sicherheit, 3. Auflage (2009), Band 9
[Ruokojärvi et al., 1998] Ruokojärvi, P.H.; Halonen, I.A.; Tarhanen, K.A.; Ruuskanen, J., Effect of gaseous inhibitors on PCDD/F formation, Environmental Science & Technology 32 (1998) 3099-3103
S [Sadowsky et al., 1997]
Sadowsky, U.; Kuhlmann, K.; Schneider, M., Entstehung von Kohlenmonoxid aus den organischen Bestandteilen des Rohmaterials bei der Zementherstellung, Zement-Kalk-Gips50 (1997) No. 5, 272-280
[Sayagh et al., 2010] Sayagh, S.; Ventura, A.; Hoang, T.; François, D.; Jullien, A., Sensitivity of the LCA allocation procedure for BFS recycled into pavement structures, Resources, Conservation and Recycling 54 (2010) 348-358
[SC, 2001] Anonymous, Stockholm Convention on Persistent Organic Pollutants adopted on 22 May 2001 (the Convention entered into force on 17 May 2004), http://chm.pops.int/TheConvention/Overview/TextoftheConvention/tabid/2232/Default.aspx (accessed 23.01.2015)

References
State of the art of the co-incineration of waste-derived fuels and raw materials in clinker/cement plants 351
[Schäfer/Hoenig, 2001] Schäfer, S.; Hoenig, V.; Operational factors affecting the mercury emissions from rotary kilns in the cement industry, Zement Kalk Gips 54 (2001) No. 11, 591-601
[Schäfer/Hoenig, 2002] Schäfer, S.; Hoenig, V., Effects of process technology on the behaviour of mercury in the clinker burning process: Technical Field 6: Sustainability and cement production; Presentation slides and documentation in: Process Technology of Cement Manufacturing: VDZ Congress 23-27 September 2002 in Düsseldorf/Germany, Verein Deutscher Zementwerke (VDZ) (Hrsg.), Verlag Bau+Technik (2003) p 484-488
[Scheuer, 2003] Scheuer, A., Utilization of alternative fuels and raw materials (AFRs) in the cement industry, Cement International 1 (2003) No. 1, 48-66
[Scheuer, 1987] Scheuer, A., Theoretische und betriebliche Untersuchungen zur Bildung und zum Abbau von Stickstoffmonoxid in Zementdrehofenanlagen (in German), Schriftenreihe der Zementindustrie, 49, Beton-Verlag, Düsseldorf (1987)
[Schirmer, 2007] Schirmer, M.; Ersatzbrennstoffe und Chlor – ein immer noch ungelöstes Problem, in: Faulstich, M.; Urban, I.; Bilitewski, B. (Hrsg.), 12. Fachtagung Thermische Abfallbehandlung, Schriftenreihe des Fachgebietes Abfalltechnik Universität Kassel (2007) 185-199
[Schmidt, 2006] Schmidt, M.; Der Einsatz von Sankey-Diagrammen im Stoffstrommanagement, Beiträge der Hochschule Pforzheim, Nr. 124 (2006)
[Schmitt et al., 2007] Schmitt, T.G.; Welker, A.; Steinbrück, C.; Dierschke, M., Perspektiven einer zukunftsfähigen Klärschlammentsorgung in Rheinland-Pfalz, Technische Universität Kaiserslautern, Fachgebiet Siedlungswasserwirtschaft (2007)
[Schneider et al., 2011] Schneider, M.; Romer, M.; Tschudin, M.; Bolio, H., Sustainable cement production – present and future, Cement and Concrete Research 41 (2011) 642-650
[Scholl/Metzger, 1981] Scholl, G.; Metzger, F., Erhebung über die Thalliumbelastung von Nutzpflanzen auf kontaminierten Böden im Raum Lengerich. Landwirtsch. Forsch. Sonderh. 38 (1981) 216–223
[Scholz/Beckmann, 1998] Scholz, R.; Beckmann, M.; Substitution von Brennstoffen und Rohstoffen durch Abfälle in Hochtemperaturprozessen, in: 11. DVV-Kolloquium Stoffliche und thermische Verwertung von Abfällen in industriellen Hochtemperaturprozessen. Braunschweig (1998) 21-46
[Schöffmann, 2003] Schöffmann, H., Gas-Bypass-Anlagen zur Beherrschung von Chlorid-Kreisläufen im Zementwerk, Lafarge CTEC, Vienna/Austria, http://institute.unileoben.ac.at/ghiwww/pdf/schoeffmann.pdf (2003)
[Schönberger, 1990] Schönberger, H., Klärschlamm – Kontamination auf Raten. Zur Schadstoffproblematik des Klärschlamms; Institut für ökologisches Recycling, Berlin (1990)
[Schönberger, 2009] Schönberger, H., Integrated pollution prevention and control in large industrial installationson the basis of best available techniques – The Sevilla Process, Journal of Cleaner Production 17 (2009) 1526–1529

References
352 State of the art of the co-incineration of waste-derived fuels and raw materials in clinker/cement plants
[Schönberger, 2011] Schönberger, H., Lignite coke moving bed adsorber for cement plants – BAT or beyond BAT?, Journal of Cleaner Production 19 (2011) 1057-1065
[Schönberger et al., 2012] Schönberger, H., Tebert, C., Lahl, U., Expertenanhörung im Umweltausschuss – Fachleute nahmen Stellung zum Regierungsentwurf der EU-Industrieemissionsrichtlinie in deutsches Recht (Expert hearing of the Environment Committee – experts take a stand on the governmental draft of the implementation of the European Industrial Emissions Directive into German legislation), ReSource 25 (2012), No. 4, 4-11
[Schönberger/Waltisberg, 2014] Schönberger, H., Waltisberg, J., Einfluss der Mitverbrennung von Abfällen in deutschen Zementwerken auf die Abgasemission (Impact of the co-incineration of wastes in cement plants on waste gas emissions), in: Thomé-Kozmiensky, K.J; Beckmann, M. (Hrsg.), Energie aus Abfall, Band 11, TK Verlag K. Thomé-Kozmiensky, Neuruppin, ISBN 978-3-944310-06-0 (2014), 871-927
[Schoer, 1984] Schoer, J., Thallium, in: Hutzinger, O. (Ed.), Anthropogenic Compounds, The Handbook of Environmental Chemistry, Springer-Verlag (1984) 143-214
[Schreiber et al., 2005] Schreiber, R.J.; Kellet, C.D.; Joshi, N., Inherent Mercury Controls Within the Portland Cement Kiln System, Research & Development Information, Skokie, Illinois/USA, Portland Cement Association, Serial No. 2841 (2005)
[Schreiber/Russel, 2006] Schreiber, R.J.; Russell, C.O., The Experience of SCR at Solnhofen and its Applicability to US Cement Plants, Report prepared on behalf of the Portland Cement Association (2006), http://www.dep.state.pa.us/dep/deputate/airwaste/aq/transport/comments/Lehigh_Attachment_Solnhofen.pdf (accessed on 13.09.2014)
[Searchinger et al., 2008] Searchinger, T., Heimlich, R., Houghton, R.A., Dong, F., Elobeid, A., Fabiosa, J., Tokgoz, S., Hayes, D., Yu, T.H. Use of US croplands for biofuels increases greenhouse gases through emissions from land-use change. Science 319 (2008), 1238-1240.
[Seifert et al., 2008] Seifert, H.; Kolb, T.; Gehrmann, H.-J.; Beckmann, M.; Flamme, S.; Scholz, R., Charakterisierung von Ersatzbrennstoffen für den Einsatz in Industrie- und Kraftwerksfeuerungen, Abfalltage Baden-Württemberg 24.-25.09.2008, Stuttgart ISBN 978-3-8356-3163-2 (2008)
[Senior/Eddings, 2006] Senior, C.; Eddings, E., Evolution of Mercury from Limestone, Portland Cement Association (PCA) R&D Serial No. 2949 (2006)
[SFS 5875, 2000] Finish Standards Association (SFS), SFS 5875 Solid recovered fuels. Quality control system, dated 24.01.2000, withdrawn on 18.04.2011 it was replaced by EN 15359 (2011), http://sales.sfs.fi/sfs/servlets/ProductServlet?action=quicksearch&info=SFS+5875 (accessed 07.11.2012), quoted according to (Zeschmar-Lahl, 2003), (ERFO, 2005) and (UBA AT, 2012)
[Shkolnik et al., 1996] Shkolnik, E., et al., Differential scanning calorimetry for determining the volatility and combustibility of cement raw meal organic matter, World Cement Research and Development, (May 1996) 81-87
[Siechau/Thörner, 2012] Siechau, R; Thörner, R., Wertstoffwirtschaft in Hamburg: Die Recycling-Offensive der Stadtreinigung, Müll und Abfall (2012) No. 7, 345-349

References
State of the art of the co-incineration of waste-derived fuels and raw materials in clinker/cement plants 353
[Sikkema et al., 2011] Sikkema, J.K.; Alleman, J.E.; Ong, S.K.; Wheelock, T.D., Mercury regulation, fate, transport, transformation, and abatement within cement manufacturing facilities: Review, Science of the Total Environment 409 (2011) 4167 – 4178
[Spiegel, 1979] Anonymous, Gift aus dem Schlot (Poison from the stack), DER Spiegel (1979) No. 36, 33-34
[Sprung, 1988] Sprung, S., Spurenelemente, Zement-Kalk-Gips 41 (1988) No. 5, 251-257
[Stark/Wicht, 2000] Stark, J.; Wicht, B., Zement und Kalk – Der Baustoff als Werkstoff, Hrsg. F.A. Finger-Institut für Baustoffkunde der Bauhaus-Universität Weimar, Birkhäuser (2000)
[Steinbiß, 1979] Steinbiß, E., Erfahrungen mit der Vorcalcinierung unter Berücksichtigung von Ersatzbrennstoffen, Zement-Kalk-Gips 32 (12979) No. 5, 211-221
[Stockholm Convention, 2016] Stockholm Convention, The 12 initial POPs under the Stockholm Convention, http://chm.pops.int/TheConvention/ThePOPs/The12InitialPOPs/tabid/296/Default.aspx (accessed on 17 May 2016)
[Strazza et al., 2011] Strazza, C.; Del Borghi, A.; Gallo, M.; Del Borghi, M., Resource productivity enhancement as means for promoting cleaner production: analysis of co-incineration in cement plants through a life cycle approach, Journal of Cleaner Production 19 (2011) 1615-1621
[StUA Münster, 2000] Staatliches Umweltamt Münster / Governmental Authority for Environmental Protection (Ed.), Böker, M.; Conrady-Pigorsch, R. (authors), Sekundärbrennstoffe in der Zementindustrie – Neue Wege in der Abfallverwertung, Berichte und Informationen, Vol. 5 (2000)
[Stull,1947] Stull, D.R., Vapor pressure of pure substances - inorganic compounds, Industrial and Engineering Chemistry 39 (1947) No. 4, 540-550
[Svehla/Moser, 2015 Svehla, J.; Moser, G., Stand der Technik bei Anlagen zur Oberflächenbehandlung mit organischen Lösungsmitteln. Umweltbundesamt, REPORT REP-0545, Wien (2015), https://www.umweltbundesamt.at/fileadmin/site/publikationen/REP0545.pdf (accessed on 17.10.2019)
T [Thiel, 2009]
Thiel, S.; Überblick über die Ersatzbrennstoff-Kraftwerke in Deutschland, Stand 30. Juni 2009, in: Bilitewski, B.; Schnurer, H.; Zeschmar-Lahl, B. (eds), Müll-Handbuch, Kz. 7101, ESV, Berlin (2009)
[Tiggesbäumker/Merz, 1985] Tiggesbäumker, P.; Merz, H., Untersuchungen zur Bestimmung des Ausbrennverhaltens feinkörniger Brennstoffe in Calcinatoren, Zement-Kalk-Gips 38 (1985) No. 5, 233-238
[Tillman, 2000] Tillman, A.M., Significance of decision-making for LCA methodology, Environmental Impact Assessment Review 20 (2000) 113-123

References
354 State of the art of the co-incineration of waste-derived fuels and raw materials in clinker/cement plants
[Thomé-Kozmiensky/Beckmann, 2004] Thomé-Kozmiensky, K.J.; Beckmann, M., Risiken der mechanisch-biologischen Abfallbehandlung; in: Thomé-Kozmiensky, K.J. (ed.): Ersatzbrennstoffe 4 – Optimierung der Herstellung und der Verwertung, TK Verlag Thomé-Kozmiensky, Neuruppin (2004), pp 113-140
[Tissot/Welte, 1984] Tissot, B.P.; Welte, H., Petroleum Formation and Occurence, 2nd ed., Springer (1984)
[TNO, 2007] Vos, S.; Görtzen, J.; Mulder, E.; Ligthart, T.; Hesseling, W., LCA of thermal treatment of waste streams in cement clinker in Belgium – Comparison to alternative treatment options, TNO Report I&T-A R 2007/036, TNO, NL-7300 AH Apeldoorn (2007) (http://www.febelcem.be/en/waste-treatment/IT-A-R-2007-036-Febelcem.pdf) (accessed 14 March 2013)
[Tokheim, 1999] Tokheim, L.-A., The impact of staged combustion on the operation of a precalciner cement kiln, doctoral thesis (1999)
[Tokheim et al., 2001] Tokheim, l.; Gautestad, T.; Axelsen, E.P.; Bjerketvedt, D., Energy recovery from wastes: experience with solid alternative fuels combustion in a precalciner kiln, Proceedings 3rd International Symposium on Incineration and Flue Gas Treatment Technologies, Brussels, Belgium, 2-4 July 2001
[Tokheim, 2005] Tokheim, L.-A., Burning chamber installation for increased use of alternative fuels at Norcem Brevik, Norway (2005), http://teora.hit.no/dspace/bitstream/2282/289/1/Konferanse.pdf
[Tokheim; 2006] Kiln system modification for increased utilization of alternative fuels at Norcem Brevik, Cement International 4 (2006) no. 4, 52-59
[TU Wien, 1999] Fehringer, R.; Rechberger, H.; Brunner, B., Positivlisten für Reststoffe in der Zementindustrie (PRIZMA), Technische Universität Wien, Institut für Wassergüte und Abfallwirtschaft (1999)
[Tukker, 2000] Tukker, A., Life cycle assessment as a tool in environmental impact assessment, Environmental Impact Assessment Review 20 (2000) 435–456
U [UBA AT, 2012]
Umweltbundesamt / Environment Agency Austria, Study on the suitability of the different waste-derived fuels for end-of-waste status in accordance with Article 6 of the Waste Framework Directive, Final report of a study commissioned by the Institute for Prospective Technological Studies (IPTS) of the Joint Research Centre (JRC) of the European Commission (2012)
[UBA Gewerbeabfälle, 2011] Dehne, I., Oetjen-Dehne, R, Kanthak, M.; Aufkommen, Verbleib und Ressourcenrelevanz von Gewerbeabfällen, Bericht im Auftrag des Umweltbundesamtes (Forschungskennzahl 370933314), UBA-Texte 19/2011 (2011)
[UBA Verpackungsabfälle, 2012] Schüler, K.; Aufkommen und Verwertung von Verpackungsabfällen in Deutschland im Jahr 2009, Bericht im Auftrag des Umweltbundesamtes (Forschungskennzahl 36301320), UBA-Texte 13/2012 (2012)

References
State of the art of the co-incineration of waste-derived fuels and raw materials in clinker/cement plants 355
[UBA Verpackungsverordnung, 2011] Bünemann, A.; Rachut, G.; Christiani, J.; Langen, M.; Wolters, J., Planspiel zur Fortentwicklung der Verpackungsverordnung, Teilvorhaben 1: Bestimmung der Idealzusammensetzung der Wertstofftonne, UBA-FB 001459 (Förderkennzeichen 3710933131), UBA-Texte 08/2011 (2011)
[UK DEFRA, 2008] Department for Environment, Food and Rural Affairs (DEFRA), Waste Wood as a Biomass Fuel -Market Information Report, http://archive.defra.gov.uk/environment/waste/topics/documents/wastewood-biomass.pdf (2008) (accessed 07.11.2012)
[UK EA, 1999] Environment Agency of the United Kingdom, International use of substitute liquid fuels (SLF) used for burning in cement kilns, R&D Technical Report P282 (1999)
[Ullmann’s, 1986] Locher, F.W.; Kropp, J., Cement and Concrete, in Ullmann’s Encyclopedia of Industrial Chemistry, 5th ed., Vol. A 5 (1986) 489-537
[UN BAT heavy metals, 2012] United Nations Economic and Social Council/Economic Commission for Europe (Executive Body for the Convention on Long-range Transboundary Air Pollution, Draft decision on adoption of guidance document on best available techniques for controlling emissions of heavy metals and their compounds from the source categories listed in annex II (2012), http://www.unece.org/fileadmin/DAM/env/documents/2012/EB/ECE_EB_AIR_2012_L5_E_19112012.pdf
[UNECE, 2013] United Nations Economic Commission for Europe (UNECE)/Economic and Social Council, Guidance document on best available techniques for controlling emissions of heavy metals and their compounds from the source categories listed in annex II to the Protocol of Heavy Metals, ECE/EB.AIR/116 (24 July 2013), http://www.unece.org/fileadmin/DAM/env/documents/2012/EB/ECE_EB.AIR_116_E.pdf (accessed 27.10.2013
[UNEP/AMAP, 2013] UNEP/AMAP, Technical Background Report for the Global Mercury Assessment 2013 (2013)
[UNEP, 2007] UNEP, Guidelines on Best Available Techniques and Provisional Guidance on Best Environmental Practices relevant to Article 5 and Annex C of the Stockholm Convention on Persistent Organic Pollutants (2007), http://chm.pops.int/Implementation/BATBEP/Guidelines/tabid/187/Default.aspx (accessed on 28 April 2015)
[UNEP Basel Convention, 2012] UNEP Basel Convention, Technical Guidelines, Technical guidelines on theenvironmentally soundco-processing of hazardouswastes in cement kilns (2012)
[UNEP Hg, 2008] UNEP, Technical Background Report to the Global Atmospheric Mercury Assessment (2008)
[UNEP Hg, 2010] UNEP, Study on mercury sources and emissions, and analysis of cost and effectiveness of control measures “UNEP Paragraph 29 study” (2010), http://www.unep.org/hazardoussubstances/Portals/9/Mercury/Documents/Paragraph29Study/Final%20Report%20Para29_5%20Nov%202010.pdf

References
356 State of the art of the co-incineration of waste-derived fuels and raw materials in clinker/cement plants
[UNEP Hg Assessment, 2013] UNEP, Global Mercury Assessment 2013: Sources, emissions, releases, and environmental transport (2013), http://www.unep.org/PDF/PressReleases/GlobalMercuryAssessment2013.pdf
[UNEP Toolkit Hg, 2013] Toolkit for Identification and Quantification of Mercury Releases, Reference Report and Guideline Inventory Level 2, Version 1.2 (April 2013)
[UN Minamata Convention, 2013] N.N., Minamata Convention on Mercury (2013),http://www.mercuryconvention.org/Portals/11/documents/conventionText/Minamata%20Convention%20on%20Mercury_e.pdf
[UN Stockholm Convention, 2001] N.N., Stockholm Convention on Persistent Organic Pollutants (2001), amended in 2009 and 2011, http://chm.pops.int/TheConvention/Overview/TextoftheConvention/tabid/2232/Default.aspx
[UNECE Aarhus Convention, 1998] UNECE, Convention on Access to Information, Public Participation in Decision-making and Access to Justice in Environmental Matters, done at Aarhus, Denmark on 25 June 1998, http://www.unece.org/env/pp/treatytext.html (accessed on 15 September 2013)
[Uni Dresden, 2010] Hoffmann, G.; Brunn, L.; Schingnitz, D.; Baumann, J.; Bilitewski, B., (Universität Dresden und INTECUS GmbH, DE-Dresden), Nutzung der Potenziale des biogenen Anteils im Abfall zur Energieerzeugung, Abschlussbericht zum UBA-Forschungsvorhaben UFOPLAN-Nr. 370733303 (2010)
[Urban/Löhle, 2012] Urban, A.I.; Löhle, S., Die Wertstofftonne – Analysen und Potenziale, Müll und Abfall (2012) No. 1, 28-32
[US Cement, 2012] Environmental Protection Agency, National Emission Standards for Hazardous Air Pollutants for the Portland Cement Manufacturing Industry and Standards of Performance for Portland Cement Plants; Proposed Rule, 40 CFR Parts 60 and 63, Federal Register, Vol. 77, No. 138, July 18, 2012 (2012), http://www.gpo.gov/fdsys/pkg/FR-2012-07-18/pdf/2012-16166.pdf
[USA Cement, 2013] Environmental Protection Agency, National Emission Standards for Hazardous Air Pollutants for the Portland Cement Manufacturing Industry and Standards of Performance for Portland Cement Plants; Final Rule, 40 CFR Parts 60 and 63, Federal Register, Part II, Vol. 78, No. 29, 12 February 2013
[US EPA Method 610, 1984] United States Environmental Protection Agency (US EPA), Method 610: Polynuclear Aromatic Hydrocarbons (1994), https://www.epa.gov/sites/production/.../method_610_1984.pdf (accessed 34.07.2015)
[US Fact Sheet, 2012] US/EPA, Fact sheet ‘Final amendments to air toxics standards for Portland cement manufacturing’ (2012); http://www.epa.gov/airquality/cement/pdfs/20121220_port_cement_fin_fs.pdf
[US PCA, 2006] Hills, L.M.; Stevenson, R.W., Mercury and lead content in raw materials, Portland Cement Association (PCA) R&D Ser. No. 2888 (2006)

References
State of the art of the co-incineration of waste-derived fuels and raw materials in clinker/cement plants 357
V [Van den Berg et al., 2006]
Van den Berg, M.; Birnbaum, L.S.; Denison, M.; De Vito, M.; Farland, W.; Feeley, F.; Fiedler, H.; Hakansson, H.; Hanberg, A.; Haws, L.; Rose, M.; Safe, S.; Schrenk, D.; Tohyama, C.; Tritscher, A.; Tuomisto, J.; Tysklind, M.; Walker, N.; Peterson. R.E., The 2005 World Health Organization reevaluation of human and mammalian toxic equivalency factors for dioxins and dioxin-like compounds, Toxicological Sciences 93 (2006) 223–241
[Van den Heede/De Belie, 2012] Van den Heede, P.; De Belie, N., Environmental impact and life cycle assessment (LCA) of traditionaland ‘green’ concretes: Literature review and theoretical calculations, Cement & Concrete Composites 34 (2012) 431–442
[van Oss/Padovani, 2002] van Oss, H.G.; Padovani, A.C., Cement manufacture and the environment, part I: chemistry and technology, Journal of Industrial Ecology 6 (2002) 89–105
[van Oss/Padovani, 2003] van Oss, H.G.; Padovani, A.C., Cement manufacture and the environment, part II: environmental challenges and opportunities, Journal of Industrial Ecology 7 (2003) 93–127
[VDI 2094, 2003] Verein Deutscher Ingenieure, Emission control cement plants, VDI 2094 (2003)
[VDZ, 1999] VDZ Verein Deutscher Zementwerke e.V., Umweltdaten der deutschen Zementindustrie 1998, (1999)
[VDZ, 2000] VDZ Verein Deutscher Zementwerke e.V., Umweltdaten der deutschen Zementindustrie 1999, (2000)
[VDZ, 2001] VDZ Verein Deutscher Zementwerke e.V., Umweltdaten der deutschen Zementindustrie 2000, (2001)
[VDZ, 2002] VDZ Verein Deutscher Zementwerke e.V., Umweltdaten der deutschen Zementindustrie 2001, (2002)
[VDZ, 2003] VDZ Verein Deutscher Zementwerke e.V., Umweltdaten der deutschen Zementindustrie 2002, (2003)
[VDZ, 2004] VDZ Verein Deutscher Zementwerke e.V., Umweltdaten der deutschen Zementindustrie 2003, (2004)
[VDZ, 2005] VDZ Verein Deutscher Zementwerke e.V., Umweltdaten der deutschen Zementindustrie 2004, (2005)
[VDZ, 2006] VDZ Verein Deutscher Zementwerke e.V., Environmental Data of the German Cement Industry 2005, (2006)
[VDZ, 2007] VDZ Verein Deutscher Zementwerke e.V., Environmental Data of the German Cement Industry 2006, (2007)

References
358 State of the art of the co-incineration of waste-derived fuels and raw materials in clinker/cement plants
[VDZ, 2008] VDZ Verein Deutscher Zementwerke e.V., Environmental Data of the German Cement Industry 2007, (2008)
[VDZ, 2009] VDZ Verein Deutscher Zementwerke e.V., Environmental Data of the German Cement Industry 2008, (2009)
[VDZ, 2010] VDZ Verein Deutscher Zementwerke e.V., Environmental Data of the German Cement Industry 2009, (2010)
[VDZ, 2011] VDZ Verein Deutscher Zementwerke e.V., Environmental Data of the German Cement Industry 2010, (2011)
[VDZ, 2012] VDZ Verein Deutscher Zementwerke e.V., Environmental Data of the German Cement Industry 2011, (2012)
[VDZ, 2013] VDZ Verein Deutscher Zementwerke e.V., Environmental Data of the German Cement Industry 2012, (2013)
[VDZ, 2014] VDZ Verein Deutscher Zementwerke e.V., Environmental Data of the German Cement Industry 2013, (2014)
[VDZ, 2015] VDZ Verein Deutscher Zementwerke e.V., Environmental Data of the German Cement Industry 2014, (2015)
[VDZ, 2016] VDZ Verein Deutscher Zementwerke e.V., Environmental Data of the German Cement Industry 2015, (2016)
[VDZ, 2017] VDZ Verein Deutscher Zementwerke e.V., Environmental Data of the German Cement Industry 2016, (2017)
[VDZ, 2018] VDZ Verein Deutscher Zementwerke e.V., Environmental Data of the German Cement Industry 2017, (2018)
[VDZ, 2019] VDZ Verein Deutscher Zementwerke e.V., Environmental Data of the German Cement Industry 2017, (2019)
[VDZ Activity Report, 2002] Verein deutscher Zementwerke e.V. (VDZ), Activity Report 1999-2001 (2002)
[VDZ Bypass dust, 2007] Verein Deutscher Zementwerke e.V., Verwertung von Bypassstaub, Verfahrenstechnik der Zementherstellung, VDZ-Tätigkeitsbericht 2005 – 2007 (2007)
[VDZ-SO2, 2002] Verein Deutscher Zementwerke e.V. (VDZ), Merkblatt SO2-Minderung/Stoffkreisläufe, Stand 3/02 (2002)
[VDZ Umweltschutz, 2007] Verein Deutscher Zementwerke e.V. (VDZ), Tätigkeitsbericht 2005 – 2007, Umweltschutz bei der Zementherstellung (2007) 42-61

References
State of the art of the co-incineration of waste-derived fuels and raw materials in clinker/cement plants 359
[VÖZ, 2012] Verband der Österreichischen Zementindustrie (VÖZ), Ressourcen und Umweltschutz, website http://www.zement.at/index.php/zement/zement/ressourcen-und-umweltschutz, accessed 31 August 2012 (2012)
[Vosteen et al., 2002] Vosteen, B.W.; Beyer, J.;Bonkhofer, T.-G., Verhalten von Quecksilber in Rauchgasen von Verbrennungsanlagen, Manuscript of the presentation at the VDI-Wissensforum Seminar ‘Quecksilber – Emissionen, Mess- und Minderungstechniken‘ on 26/27 September 2002 in Düsseldorf/Germany (2002)
[von Lersner/Wendenburg, 2001] Von Lersner, H.;Wendenburg, H., Recht der Abfallbeseitigung des Bundes, der Länder und der Europäischen Union – Kommentar (Legal commentary on waste legislation of the federal state, the federal states and the European Union), Erg.-Lfg 6/01 XI.01 concerning Article 5 of the Closed Substance Cycle and Waste Management Act, E. Schmidt Verlag (2001)
W [Walsh, 2010]
Walsh, C., Refuse derived fuel industry in Ireland, http://www.een-ireland.ie/userfiles/Conor%20Walsh%20SLR%20Consulting.pdf (accessed 07.11.2012)
[Waltisberg, 1988] Waltisberg, J., Ammoniumverbindungen in Rohstoffen und Stäuben der Zementherstellung, Zement-Kalk-Gips 41 (1988) No. 12, 613-615
[Waltisberg, 1998] Waltisberg. J., Laborversuch zur Bestimmung der Emission von organischen Substanzen aus Zementrohstoffen, Zement-Kalk-Gips 51 (1998) No. 11, 593-599
[Waltisberg, 2011] Waltisberg, J., Manuscript for the lecture on thermodynamics at the Zürich University for Applied Sciences (ZHAW), issue 2011 (2011)
[Waltisberg, 2012] Waltisberg, J., personal communications (2012)
[Waltisberg, 2016] Waltisberg, J., personal communications (2016)
[Wang et al., 2014] Wang, F.; Wang, S.; Zhang, L.; Yang, H.; Wu, Q.; Hao, J., Mercury enrichment and its effects on atmospheric emissions in cement plants of China, Atmospheric Environment, 92 (2014) 421-428
[WBCSD Cement, 2005] World Business Council for Sustainable Development, Cement Sustainability Initiative (CSI) - Guidelines for the selection and use of fuels and raw materials in the cement manufacturing industry, (2005)
[Weber et al., 2011] Weber, R.; Watson, A.; Malkov, M.; Costner, P.; Vijgen, J., Unintentionally produced hexachlorobenzene and pentachlorobenzene POPs waste from solvent production – the need to establish emission factors and inventories. Organohalogen Compounds 73 (2011) 2205-2208. http://www.dioxin20xx.org/pdfs/2011/5002.pdf
[Wedepohl, 1995] Wedepohl, K.H., The composition of the continental crust, Geochimica et Cosmochimica Acta 59 (1995) No. 7, 1217-1232

References
360 State of the art of the co-incineration of waste-derived fuels and raw materials in clinker/cement plants
[Wegiel et al., 2011] Wegiel, M.; Chrzaszcz, R.; Maslanka, A.; Grochowalski, A., Study on the determination of PCDDs/Fs and HCB in exhaust gas, Chemosphere 85 (2011) 481-486
[Weidema, 2001] Weidema, B.P., Avoiding co-product allocation in life cycle assessment, Journal of Industrial Ecology 4 (2001) 11–33
[Weisweiler/Keller, 1992] Weisweiler, W.; Keller, A., Zur Problematik gasförmiger Quecksilber-Emissionen aus Zementwerken, Zement-Kalk-Gips (45 (1992) No. 10, 529-532
[Weidema, 2003] Weidema, B.P., Market Information in Life Cycle Assessment, In: Environmental Project No. 863, Danish Environmental Protection Agency, Copenhagen/Denmark (2003)
[Welzel/Winkler, 1981] Welzel, K.; Winkler, H.-D., Thalliumemissionen, Ursachen und interner Kreislauf, Zement-Kalk-Gips 34 (1981) No. 10, 530-534
[Wendenburg, 2009] Wendenburg, H.; Von der Müllkippe zur Ressourcenpolitik – 40 Jahre Abfallpolitik in Deutschland, Müll und Abfall (2009) No. 4, 163-171
[Winkler, 1986] Winkler, H.-D., Thalliumemissionen bei der Zementindustrie - Ursachen. und Minderungsmaßnahmen. Landesanstalt für Immissionsschutz des Landes Nordrhein-Westfalen (1986), http://www.irbnet.de/daten/rswb/87009500964.pdf (accessed 14 September 2015)
[Winkler, 1997] Winkler, H.-D., Emissionsverhalten von Drehrohröfen zur Herstellung von Zementklinker beim Einsatz von Abfällen – Einflusskriterien und Prognosemodelle, Landesumweltamt Nordrhein-Westfalen, Essen/Germany (1997)
[Winkler, 1998] Winkler, H.-D., Praxis der energetischen Verwertung von Abfällen in Nordrhein-Westfalen, in: Bayerisches Landesamt für Umweltschutz (Hrsg.): Zementwerke – NOx-Minderung – Abfallverwertung, Proceedings of the conference on 2.7.1998 in Wackersdorf/Germany (1998) pp 65–98
[Winnacker-Küchler, 2004] Plank, H.; Stephan, D.; Hirsch, C., Bauchemie, in Winnacker – Küchler (Hsrg.: Dittmeyer, R.; Keim, W.; Kreysa, G.; Oberholz,A.), Chemische Technik, Prozesse und Produkte, Band 7: Industrieprodukte, 5 ed., WILEY-VCH(2004) 1-163
[Wirtwein/Emberger, 2010] Wirthwein, R.; Emberger, B., Burners for alternative fuels utilisation – optimisation of kiln firing systems for advanced alternative fuel co-firing, Cement International 8 (2010) No. 4, 42-47
[Won/Lee, 2012] Won, J.H.; Lee T. G.; Estimation of total annual mercury emissions from cement manufacturing facilities in Korea, Atmospheric Environment 62 (2012) 265-271
[WWF, 2008] WWF International, A blueprint for a climate friendly cement industry (2008)
Y [Yang et al., 1998] Yang, H.-H.; Lee, W.-J.; Chen, S.-J.; Lai, S.-O. (1998). PAH emission from various industrial stacks, Journal of Hazardous Materials 60 (1998) Issue 2, 159-174

References
State of the art of the co-incineration of waste-derived fuels and raw materials in clinker/cement plants 361
Z [Zheng, 2011]
Zheng Y., Mercury Removal from Cement Plants by Sorbent Injection upstream of a Pulse Jet Fabric Filter, PhD Thesis at the Technical University of Denmark (2011), http://wwwx.dtu.dk/upload/kt-chec/phd%20thesis,%20yuanjing%20zheng,%20endelig%20version,%20klar%20til%20print.pdf (accessed 23 January 2014)
[Zheng et al., 2012] Zheng, Y.; Jensen, A.D.; Windelin, C.; Jensen, F., Review of technologies for mercury removal from flue gas from cement production processes, Progress in Energy and Combustion Science 38 (2012) 599-629
[Zeschmar-Lahl, 2001a] Zeschmar-Lahl, B., Schadstoffanreicherung im Erzeugnis – Kriterien für eine umweltverträgliche Verwertung, VDI-Wissenschaftsforum: Ersatzbrennstoffe in Industrieanlagen in Osnabrück/Germany on 11-12-09.2001 (2001), http://www.bzl.info/de/sites/default/files/VDI_43_04_05.pdf (accessed 18.11.2011)
[Zeschmar-Lahl, 2001b] Zeschmar-Lahl, B., Energetische Verwertung unter dem Gesichtspunkt von Stofffluß und Schadstoffen, Abfalltage Baden-Württemberg in Stuttgart/Germany on 25.-26.09.2001 (2001),
http://www.bzl.info/de/sites/default/files/BZL_AT_BaWue_01.pdf (accessed 18.11.2011)
[Zeschmar-Lahl, 2002] Zeschmar-Lahl, B.; Der Markt für Ersatzbrennstoffe, 7. Fachtagung Thermische Abfallbehandlung in Berlin vom 5.-7. März 2002 (2002)
[Zeschmar-Lahl, 2003] Zeschmar-Lahl, B., Schadstoffanreicherung im Erzeugnis aufgrund des Einsatzes von Ersatzbrennstoffen in Zementwerken und Feuerungsanlagen, Dissertation at the Technical University of Berlin (2003), http://www.bzl.info/de/sites/default/files/BZL_Diss_end.pdf, (accessed 04.04.2011)
[Zeschmar-Lahl, 2010] Zeschmar-Lahl, B.; Lahl, U., Die Chancen der Stoffflussanalyse im Hinblick auf übergeordnete abfallwirtschaftliche Planungen, presentation on 11.11.2003, http://www.bzl.info/de/sites/default/files/SFA_Zeschmar-Lahl_OEWAV_2003_end.pdf (accessed 23.05.2011
[Zeschmar-Lahl, 2010] Zeschmar-Lahl, B., Waste-to-energy compared to mechanical biological treatment (MBT) and co-combustion of municipal waste, ISWA World Congress in Hamburg/Germany on 17.11.2010
[Zitko, 2003] Zitko, V., Hexachlorobenzene, in: Hutzinger O. (editor-in-chief), The Handbook of Environmental Chemistry, Vol 3 Anthropogenic Compounds, Part O, Fiedler, H. (volume editor) Persistent Organic Pollutants, Springer (2003) 91-122
[Zunzer, 2002] Zunzer, U., Umsetzung der organischen Bestandteile des Rohmaterials beim Klinkerbrennprozess, Schriftenreihe der Zementindustrie, Heft 63 (2002)
[Zurhove, 2010] Zurhove, F.-J., Experience with SCR, Presentation at the IEEE-IAS/PCA 52nd Cement Industry Technical Conference on 28 March – 1 April 2010 in Colorado Springs/USA
[Zurhove, 2013] Zurhove, F.-J., Terry, M.S., 10 Years experience with high dust SCR in cement plants, World Cement, Issue August 2013, pp 51-58

References
362 State of the art of the co-incineration of waste-derived fuels and raw materials in clinker/cement plants
[Zurhove, 2014] Zurhove, F.-J., Catalysts for cement, Presentation at the 2nd Global Cement EnviroCem Conference on Environmental Technology for Cement & Lime on 20-21 March 2014 in London/UK

Glossary
State of the art of the co-incineration of waste-derived fuels and raw materials in clinker/cement plants 363
GLOSSARY OF TERMS AND ABBREVIATIONS
This glossary may provide better understanding of the information contained in this document. This glossary is divided into the following sections: I. ISO country codes II. Unit prefixes, number separators and notations III. Units and measures IV. Chemical elements V. Chemical formulae VI. Acronyms VII. Technical terms
I. ISO country codes
ISO code Country / Organisation
EU European Union
EU Member States (*)
AT Austria
BE Belgium
DE Germany
FR France
NL Netherlands
PT Portugal
UK United Kingdom
Non-member countries
CH Switzerland
US United States
(*) The protocol order of the Member States is based on the alphabetical order of their geographical names in the original language(s).

Glossary
364 State of the art of the co-incineration of waste-derived fuels and raw materials in clinker/cement plants
II. Unit prefixes, number separators and notations Numbers in this document are written using the '.' character as the decimal separator and the space as the separator for thousands. The symbol ~ (around; more or less) is the notation used to indicate approximation. The symbol Δ (delta) is the notation used to indicate a difference. The following table contains the frequently used prefixes:
Symbol Prefix 10n Word Decimal Number
T tera 1012 Trillion 1 000 000 000 000
G giga 109 Billion 1 000 000 000
M mega 106 Million 1 000 000
k kilo 103 Thousand 1 000
h hecto 102 Hundred 100
da deca 101 Ten 10
------- ------- 1 One 1
d deci 10−1 Tenth 0.1
c centi 10−2 Hundredth 0.01
m milli 10−3 Thousandth 0.001
µ micro 10−6 Millionth 0.000 001
n nano 10−9 Billionth 0.000 000 001
p pico 10−12 Trillionth 0.000 000 000 001

Glossary
State of the art of the co-incineration of waste-derived fuels and raw materials in clinker/cement plants 365
III. Units and measures
Unit Symbol
Unit Name (comment)
Measure name (Measure symbol)
Conversion and comment
bar bar Pressure (P) 1.013 bar = 100 kPa = 1 atm
°C degree Celsius Temperature (T)
d day Time
g gram Weight
h hour Time
I-TEQ international toxicity equivalent
Toxicity
K kelvin Temperature (T) Temperature difference (ΔT)
0 °C = 273.15 K
kcal kilocalorie Energy 1 kcal = 4.1868 kJ
kg kilogram Weight
kJ kilojoule Energy
kWh kilowatt-hour Energy 1 kWh = 3 600 kJ
m metre Length
m2 square metre Area
m3 cubic metre Volume
mg milligram Weight 1 mg = 10-3 g
min minute
m/min metre/minute Speed
m3/h cubic metre per hour Volume flow
if not otherwise mentioned in this document, the volume flows refer to 10 vol-% oxygen and standard state
mg/m3 or µg/Nm3 or ng/Nm3
milligram per normal cubic metre or micro gram per normal cubic metre or nanogram per normal cubic metre
Concentration
if not otherwise mentioned in this document, the concentrations of gaseous substances or mixtures of substances refer to dry flue gas at 10 vol-% oxygen and standard state
mm millimetre Length 1 mm = 10-3 m
Mt megatonne Weight 1 Mt = 106 tonne
MJ megajoule Energy 1 MJ = 1 000 kJ = 106 joule
m micrometre Length 1 m = 10-6 m
MW megawatts Energy
ng nanogram Weight 1 ng = 10-9 gram
Nm3 normal cubic metre Volume at 101.325 kPa, 273.15 K
ppm parts per million Composition of mixtures 1 ppm = 10-6
t metric tonne Weight 1 t = 1 000 kg or 106 g
vol.-% percentage by volume Composition of mixtures
weight-% percentage by weight Composition of mixtures
yr year Time

Glossary
366 State of the art of the co-incineration of waste-derived fuels and raw materials in clinker/cement plants
IV. Chemical elements
Symbol Name Symbol Name
Ag Silver Ni Nickel
Al Aluminium P Phosphorus
As Arsenic Pb Lead
Ba Barium Pd Palladium
Be Beryllium Pt Platinum
Bi Bismuth Rh Rhodium
Ca Calcium S Sulphur
Cd Cadmium Sb Antimony
Ce Cerium Sc Scandium
Cl Chlorine Se Selenium
Co Cobalt Si Silicon
Cr Chromium Sm Samarium
Cu Copper Sn Tin
F Fluorine Sr Strontium
Fe Iron Te Tellurium
Ga Gallium Th Thorium
Hg Mercury Ti Titanium
K Potassium Tl Thallium
La Lanthanum U Uranium
Mg Magnesium V Vanadium
Mn Manganese W Tungsten
Mo Molybdenum Y Yttrium
Na Sodium Zn Zinc
Nb Niobium Zr Zirconium
Nd Neodymium

Glossary
State of the art of the co-incineration of waste-derived fuels and raw materials in clinker/cement plants 367
V. Chemical formulae
Chemical formula
Name (explanation)
Al2O3 Aluminium oxide
CA Monocalcium aluminate
C12A7 Dodecacalcium hepta-aluminate
C3A Tricalcium aluminate
C4AF Tetracalcium aluminoferrite
C3S Tricalcium silicate
CaCl2 Calcium chloride
CaCO3 Calcium carbonate
CaO Calcium oxide
CaSO3 Calcium sulphite
CaSO4 Calcium sulphate
CH4 Methane
CH4S Methanethiol
C2H2 Ethyne
C2H4 Ethene
C2H6 Ethane
C3H4 Proyne
C3H6 Propane
C4H6 Butadiene
C4H8 Butene
C4C10 Butane
C6H6 Benzene
C7H8 Toluene
C8H8 Styrene
C8H10 Xylenes
C10H8 Naphthalene
C12H10 Acenaphthene
C14H10 Phenanthrene and anthracene
C6H5Cl Monochlorobenzene
C6H4Cl2 Dichlorobenzene
C5H6N Pyridine
C7H5N Benzonitrile
CO Carbon monoxide
CO2 Carbon dioxide
COS Carbon oxysulphide
Fe2O3 Iron oxide
FeS2 Iron sulphide
HCl Hydrochloric acid
HCB Hexachlorobenzene
HF Hydrofluoric acid
H2O Water
H2S Hydrogen sulphide
KCl Potassium chloride
K2O Potassium oxide
K2SO4 Potassium sulphate
N2 Nitrogen
MgO Magnesium oxide
Mn2O3 Manganese oxide
NaCl Sodium chloride
Na2O Sodium oxide
Na2SO4 Sodium sulphate

Glossary
368 State of the art of the co-incineration of waste-derived fuels and raw materials in clinker/cement plants
Chemical formula
Name (explanation)
NH3 Ammonia
NH4 Ammonium
NO Nitrogen monoxide
NO2 Nitrogen dioxide
NOx Nitrogen oxides
O2 Oxygen
PAH Polycyclic aromatic hydrocarbons
PCB Polychlorinated Biphenyls
PCDD/F Polychlorinated dibenzo-p-dioxins and furans
PET Polyethylene terephthalate
P2O5 Phosphorus pentoxide
PVC Polyvinyl chloride
SiO2 Silicon oxide
SO2 Sulphur dioxide
SO3 Sulphur trioxide
SOx Sulphur oxides
TCDD Tetrachlorodibenzo-p-dioxin
TiO2 Titanium dioxide
TlCl Thallium chloride
Tl2SO4 Thallium sulphate

Glossary
State of the art of the co-incineration of waste-derived fuels and raw materials in clinker/cement plants 369
VI. Acronyms
ADEME Agence de l'Environnement et de la Maitrise de l'Energie
AFR Alternative fuels and raw materials
17th BImSchV 17th Ordinance on the implementation the Federal Clean Air Act concerning the incineration and co-incineration of wastes
BUWAL Bundesamt für Umwelt, Wald und Landschaft, Switzerland
CEN/TC 343
European Committee for Standardisation Working group CEN/TC 343 ‘Solid Recovered Fuels’ with mandate of the European Commission to develop and produce all necessary standards on solid recovered fuels (SRF), such as technical specification which will be transformed into standards (European Norms (EN) after validation
EPA Environmental Protection Agency
ESP Electrostatic precipitator
EU European Union
EU-27 Member states of the European Union from 1 January 2007
EU-23+
Refers to Cembureau's member countries: Austria, Belgium, Croatia, the Czech Republic, Denmark, Estonia, Finland, France, Germany, Greece, Hungary, Ireland, Italy, Latvia, Luxembourg, the Netherlands, Norway, Poland, Portugal, Romania. Slovenia, Spain, Sweden, Switzerland, Turkey and the United Kingdom
log POW
Octanol/water partition coefficient; that is the ratio of concentrations of a compound in a mixture of the two immiscible phases octanol and water indicating the polarity/non-polarity of the organic compound concerned
L.O.I./LOI Loss on ignition, technique for the determination of, e.g. organic matter, carbonate, CO2
MSW Municipal solid waste
MSWIP Municipal solid waste incineration plant
NVC (Net) calorific value
POPS Persistent organic pollutants (according to the Stockholm Convention on POPs)
RDF Refuse derived fuel; waste fuel derived from pretreated and sorted waste fractions
SCR Selective catalytic reduction
SNCR Selective non-catalytic reduction
TEQ International toxicity equivalents (for PCDDs and PCDFs)
TOC Total organic carbon
UBA Umweltbundesamt/Federal Environmental Agency
VDZ Verein Deutscher Zementwerke/German Cement Association
VOC Volatile organic compounds

Glossary
370 State of the art of the co-incineration of waste-derived fuels and raw materials in clinker/cement plants
VII. Technical terms
Calorific value Expressed in this document as net calorific value
Channelled emissions Emissions of pollutants into the environment through any kind of pipe, regardless of the shape of its cross-section [151, European Commission, 2003]
Diagenesis The physical, chemical or biological processes that turn sediment into sedimentary rock by modifying the mineralogy and/or texture
Diffuse emissions
Emissions arising from direct contact of volatile or light dusty substances with the environment (atmosphere, under normal operating circumstances). These can result from: inherent design of the equipment (e.g. filters, dryers, etc.) operating conditions (e.g. during transfer of material between containers) type of operation (e.g. maintenance activities) or from a gradual release to other media (e.g. to cooling water or waste water) [151, European Commission, 2003] Fugitive emissions are a subset of diffuse emissions.
Exhaust gas Off-gas from firing/combustion processes
Flue gas Off-gas/exhaust gas from firing/combustion processes
Leak air Air, which arrives by leakages into the kiln
Pozzolana
Pozzolanas are materials that, though not cementitious in themselves, contain silica (and alumina) in a reactive form able to combine with lime in the presence of water to form compounds with cementitious properties. Natural pozzolana is composed mainly of a fine, chocolate-red volcanic earth. An artificial pozzolana has been developed that combines a fly ash and water-quenched boiler slag
PRODCOM PRODCOM provides statistics on the production of manufactured goods. The term comes from the French "PRODuction COMmunautaire" (Community Production) for mining, quarrying and manufacturing
Special cement Products that fall under the PRODCOM code: 26.51.12.50 – Alumina cement 26.51.12.90 – Other hydraulic cements
Spot measurement Sampling of spots, not a continuous measurement
Standard conditions for the cement and magnesium oxide industries
Referring to a temperature of 273.15 K and a pressure of 1 013 hPa and oxygen content of 10 %
White cement Products that fall under the PRODCOM code: 26.51.12.10 – White Portland cement

Annexes
State of the art of the co-incineration of waste-derived fuels and raw materials in clinker/cement plants 371
ANNEXES
ANNEX I – Stipulations and requirements for the cement works Mergelstetten of Schwenk Zement AG
Stipulations and requirements concerning the use of alternative fuels according to the permits issued on 23 June 2009 for the cement works Mergelstetten of Schwenk Zement AG (file reference: 51.1-8823.81/Schwenk/HDH/100% SBS time-limited) and on 15 March 2010 (reference number: 541-8823.81/Schwenk/HDH/Ofen4/100% SBS).
Monitoring and concept for quality management, input materials (permit issued on 15 March 2010) Concerning the permitted alternative fuels (BPG, BGS, wood waste, sewage sludge, animal by-products not intended for human consumption, and spelt husks), the requirement according to Annex I have to be complied with. The existing concepts for monitoring and quality management are still valid and remain unchanged. Annex I – Used alternative fuels In rotary kiln 4 of the cement plant in Mergelstetten, the following alternative fuels may be used provided they comply with the intake criteria referred to below. The maximum percentages of the respective instantaneous rated thermal input (RTI) and the maximum input mass streams of alternative fuels at the maximum rated thermal input of 128 MW are given in brackets. At part load, they must be reduced accordingly. 1. Wood waste (max. 40 % of the respective instantaneous RTI, max. 14.5 t/h at an average net calorific value (NCV) of 12.5 MJ/kg) Wastes without mechanical wood processing
19 12 06 Wood containing hazardous substances 19 12 07 Wood other than those fractions mentioned in 19 12 06
Wood wastes from mechanical wood processing
03 01 04 Sawdust, shavings, cuttings, wood, particle boards and veneers containing hazardous substances
03 01 05 Sawdust, shavings, cuttings, wood, particle boards and veneers other than those mentioned in 03 01 04

Annexes
372 State of the art of the co-incineration of waste-derived fuels and raw materials in clinker/cement plants
Only wood wastes may be co-incinerated which comply with subsequent criteria (related to the dry matter of the waste)
Net calorific value (NCV) 9.7 – 15.4 MJ/kg
Limit in [mg/kg]
Chlorine (Cl) 3000
Fluorine (F) 100
Pentachlorophenol (PCP) 5
Tar oils (benzo-a-pyrene) 5
Antimony (Sb) 5
Arsenic (As) 10
Lead (Pb) 500
Cadmium (Cd) 6
Chromium (Cr) 50
Cobalt (Co) 10
Copper (Cu) 50
Nickel (Ni) 50
Mercury (Hg) 0.6
Thallium (Tl) 3
Vanadium (V) 10
Tin (Sn) 12
Previously granted permits for the use of wood wastes:
Change of the permit issued on 10.07.1998, file reference: PG 55-8823.81-2.3 Schwenk AHV/34, for the erection and operation of a plant for the storage and dosage of wood wastes, and for the use of wood wastes respectively, of max. 30 % of the total fuel demand of rotary kiln plant 4.
Change of the permit issued on 15.03.2000, file reference: PG 55-8823.81-2.3 Schwenk AHV/72, 73, 74, for increasing the use of wood wastes from 30 % to max. 40 % of the total rated thermal input of rotary kiln plant 4.
The provisions in the above mentioned permits concerning the handling and storage, the self-monitoring as well as the quality management measures and concerning occupational health and fire prevention remain unchanged. 2. Fuels derived from production-specific commercial waste, FPSCW, (up to 100 % of the respective instantaneous RTI, max. 20.0 t/h at an average net calorific value(NCV) of 23 MJ/kg) 19 12 10 Combustible wastes (waste-derived fuels) FPSCW is a fuel composed of different production-specific commercial wastes. These are wastes from the following groups of materials: plastics, paper/board/punch residues/residues from paper production, carpets and cellulosic fibres/pulps. These materials are free of contaminants not specific for the process they result from. They are processed in external waste treatment plants to form a homogeneous mixture which is called FPSCW. With respect to co-incineration, the following criteria must be fulfilled: Every single component of the FPSCW must comply with the assessment criteria of wastes to recycle according to Article 6(2) of the Recycling and Waste Management Act. The use of dangerous wastes is not permitted.

Annexes
State of the art of the co-incineration of waste-derived fuels and raw materials in clinker/cement plants 373
Only FPSCW which complies with subsequent criteria (related to the dry matter of the waste) may be co-incinerated:
Net calorific value (NCV) 18 - 28 MJ/kg
50th percentile (value
reflecting common practice)
100th percentile (maximum value)
[mg/kg] [mg/kg]
Antimony (Sb) 45 120
Arsenic (As) 5 13
Lead (Pb) 25 200
Cadmium (Cd) 1.5 8
Chromium (Cr) 25 65
Cobalt (Co) 5 12
Copper (Cu) 80 200
Manganese 50 85
Nickel (Ni) 15 40
Mercury (Hg) 0.3 1
Thallium (Tl) 0.5 1
Vanadium (V) 3 15
Tin (Sn) 15 40
Chlorine (Cl) - < 1 weight-%
Concerning self-monitoring and quality management, the control and quality management concept must be implemented as described in part 7 of the application for the permit issued on 23.06.2009 (file reference: 54.1-8823.81/Schwenk/HDH/100% SBS time-limited). Previously granted permits for the use of FPSCW:
Change of the permit issued on 06.06.2000, file reference: PG 55-8823.81-2.3 Schwenk AHV/78, 79, 80, for the use of fuels derived from production-specific commercial wastes up to a quantity of max. 20 % of the total fuel demand of rotary kiln plant 4.
Change of the permit issued on 30.07.2001, file reference: PG 55-8823.81-2.3 Schwenk AHV/138, 139, for the use of meat and bone meal/animal meal/blood meal up to a quantity of max. 30 % of the total fuel demand of rotary kiln plant 4, and for the erection and operation of a silo with dosing station for the above mentioned materials as well as for increasing the percentage of FPSCW from 20 % to max. 40 % of the total fuel demand.
Notification dated 14.08.2003, file reference: PG 55-8823.81-2.3 Schwenk AHV/225, concerning the increase of the use of FPSCW from 40 % to 60 % of the rated thermal input.
Change of the permit issued on 28.06.2006, file reference: PG 55-8823.81/Schwenk/HDH/ Ofen 4/BGS, for the experimental increase of the use of alternative fuels in rotary kiln 4 from 60 % to 80 % of the rated thermal input as well as the use of fuel derived from commercial and municipal waste (FCMW), time-limited until 31.10.2007.
Change of the permit issued on 30.10.2007, file reference: PG 55-8823.81/Schwenk/HDH/ Ofen 4/80% SBS, for the increase of the use of alternative fuels in rotary kiln 4 from 60 % to 80 % of the rated thermal input as well as the use of fuel derived from commercial and municipal waste (FCMW), time-limited until the end of the kiln operation in 2009.
Change of the permit issued on 23.06.2009, file reference: PG 55-8823.81/Schwenk/HDH/ Ofen 4/100% SBS time limited, for the increase of the use of alternative fuels in rotary kiln 4 from 80 % to 100 % of the rated thermal input and the existing SNCP plant, time-limited until the end of the kiln operation in 2009 as well as the permanent change of the quality management concept for monitoring the FPSCW and FCMW quality.

Annexes
374 State of the art of the co-incineration of waste-derived fuels and raw materials in clinker/cement plants
The provisions in the above mentioned permits concerning handling and storage as well as concerning occupational health and fire prevention remain unchanged. 3. Fuels derived from commercial and municipal waste, FCMW, (up to 100 % of the respective instantaneous RTI, max. 21.3 t/h at an average net calorific value(NCV) of 21.5 MJ/kg) 19 12 10 Combustible wastes (waste-derived fuels) FCMW is a fuel composed of different production-specific commercial wastes and high-calorific fractions from the mechanical or mechanical-biological treatment of the following municipal wastes: Garden and park wastes 20 02 03 Other non-compostable wastes Other municipal waste 20 03 01 Mixed municipal waste 20 03 02 Wastes from markets 20 03 07 Bulky wastes 20 03 99 Municipal waste not otherwise specified They are processed in an external waste processing plant to form a homogeneous mixture which is called FCMW. With respect to co-incineration, the following criteria must be fulfilled: Every single component of the FPSCW must comply with the assessment criteria of wastes to recycle according to Article 6(2) of the Recycling and Waste Management Act. The use of dangerous wastes is not permitted.

Annexes
State of the art of the co-incineration of waste-derived fuels and raw materials in clinker/cement plants 375
Only FCMW which complies with subsequent criteria (related to the dry matter of the waste) may be co-incinerated:
Net calorific value (NCV) 18 - 28 MJ/kg
50th percentile (value
reflecting common practice)
100th percentile (maximum value)
[mg/kg] [mg/kg]
Antimony (Sb) 50 120
Arsenic (As) 5 13
Lead (Pb) 130 400
Cadmium (Cd) 4 9
Chromium (Cr) 125 250
Cobalt (Co) 6 12
Copper (Cu) 350* 700*
Manganese 250 500
Nickel (Ni) 50 100
Mercury (Hg) 0.5 1
Thallium (Tl) 0.5 1
Vanadium (V) 10 25
Tin (Sn) 30 70
Chlorine (Cl) - < 1 weight-%
*in single cases, due to inhomogeneities, the exceedance of the value is permitted Until the end of 2011, a monitoring programme shall be carried out for antimony. With this programme, the uncertainties related to the analysis of antimony shall be determined. For this purpose, an interlaboratory test with the involvement of different laboratories shall be initiated. In addition, in co-operation with the alternative fuel suppliers, the possibilities for separating out individual material streams with high antimony contents must be investigated. A detailed report about the results of the monitoring programme must be submitted to the Regional State Governmental Office of Stuttgart by 31.12.2011. Concerning self-monitoring and quality management, the control and quality management concept must be implemented as described in part 7 of the application for the permit issued on 23.06.2009 (file reference: 54.1-8823.81/Schwenk/HDH/100% SBS time-limited). Previously granted permits for the use of FCMW:
Change of the permit issued on 28.06.2006, file reference: PG 55-8823.81/Schwenk/HDH/ Ofen 4/BGS, for the experimental increase of the use of alternative fuels in rotary kiln 4 from 60 % to 80 % of the rated thermal input as well as the use of fuel derived from commercial and municipal waste (FCMW), time-limited until 31.10.2007.
Change of the permit issued on 30.10.2007, file reference: PG 55-8823.81/Schwenk/HDH/ Ofen 4/80% SBS, for the increase of the use of alternative fuels in rotary kiln 4 from 60 % to 80 % of the rated thermal input as well as the use of fuel derived from commercial and municipal waste (FCMW), time-limited until the end of the kiln operation in 2009.
Change of the permit issued on 23.06.2009, file reference: PG 55-8823.81/Schwenk/HDH/ Ofen 4/100% SBS time limited, for the increase of the use of alternative fuels in rotary kiln 4 from 80 % to 100 % of the rated thermal input and the existing SNCP plant, time-limited until the end of the kiln operation in 2009 as well as the permanent change of the quality management concept for monitoring the FPSCW and FCMW quality.

Annexes
376 State of the art of the co-incineration of waste-derived fuels and raw materials in clinker/cement plants
The provisions in the above mentioned permits concerning handling and storage as well as concerning occupational health and fire prevention remain unchanged. 4. Sewage sludge from municipal waste water treatment plants (max. 10 % of the respective instantaneous RTI, max. 2.4 t/h sewage sludge – dried sludge equivalent) 2 t/h sewage sludge as dried equivalents, i.e. equivalent to 8 t/h of mechanically dewatered sewage sludge with a dry matter content of 30 %. Wastes from waste water treatment plants not otherwise specified 19 08 05 Sludges from the treatment of municipal waste water Only municipal sewage sludge that comply with the following criteria may be co-incinerated:
Net calorific value (NCV) 0 – 12 MJ/kg
Limit in [mg/kg dry matter]
Lead (Pb) 900
Cadmium (Cd) 10
Chromium (Cr) 900
Copper (Cu) 800
Nickel (Ni) 200
Mercury (Hg) 1
Zinc (Zn) 2500
Previously granted permits for the use of FCMW:
Change of the permit issued on 24.03.2004, file reference: PG 55-8823.81/2.3 Schwenk AHV/242, for the erection and operation of plant for the experimental use of sewage sludge in the rotary kiln plant 4, time-limited for 18 months.
Decision issued on 06.03.2006, file reference: 541-8823.81/Schwenk/HDH/ Ofen4/experiment with sewage sludge; extension of the permit for the experimental use of sewage sludge in the cement works Mergelstetten until 31.12.2006.
Decision issued on 09.01.2007, file reference: PG 541-823.81/Schwenk/HDH/Ofen4/ experiment with sewage sludge; extension of the permit for the experimental use of sewage sludge in the cement works Mergelstetten until 13.01.200731.12.2006.
Change of the permit issued on 25.06.2007, file reference: 541-8823.81/Schwenk/HDH/ Ofen4/use of sewage sludge, for the erection and operation of a hall for the storage of mechanically dewatered sewage sludge and for the permanent use of sewage sludge in the rotary kiln plant 4.
The provisions in the above mentioned permits concerning handling and storage as well as concerning occupational health and fire prevention remain unchanged.

Annexes
State of the art of the co-incineration of waste-derived fuels and raw materials in clinker/cement plants 377
5. Animal by-products not intended for human consumption (max. 30 % of the respective instantaneous RTI) Meat and bone meal, animal meal or blood meal may be used up to a maximum of 30 % of the respective instantaneous rated thermal input. This concerns max. 9.7 t/h meat and bone meal or max.6.9 t/h animal meal or max. 6.0 t/h blood meal at the maximum rated thermal input of 128 MW. Only material may be used which has been treated according to one of the methods described in Annex V, Chapter III of the Regulation (EC) No 1774/2002*. *Regulation (EC) No 1774/2002 of the European Parliament and of the Council of 3 October 2002 laying down health rules concerning animal by-products not intended for human consumption, OJ L 273, 10.10.2002, p.1 as last amended by Commission Regulation (EC) No 93/2005 of 19 January 2005, OJ L 19, 19.01.2005, p. 34
Previously granted permits for the use of animal by-products not intended for human consumption:
Notification decision issued on 19.03.2001, file reference: 55-8823/81-2.3 Schwenk AHV/119, for the experimental use of domestic meat and bone meal and animal meal produced by means of pressure sterilisation according to Article 5 of the Ordinance for rendering plants, time-limited to four months.
Change of the permit issued on 30.07.2001, file reference: PG 55-8823.81-2.3 Schwenk AHV/138, 139, for the use of meat and bone meal/animal meal/blood meal up to a quantity of max. 30 % of the total fuel demand of rotary kiln plant 4, and for the erection and operation of a silo with dosing station for the above mentioned materials as well as for increasing the percentage of FPSCW from 20 % to max. 40 % of the total fuel demand.
Notification decision issued on 17.05.2002, file reference: 55-8823/81-2.3 Schwenk AHV/166, for the incineration in the rotary kiln plant 4 of processed mammalian animal wastes produced from specified risk materials (SRM).
Notification decision issued on 26.02.2008, file reference: 541-8823.81/Schwenk/HDH/Tiermehl, for the use of animal meal, meat and bone meal, and blood meal which has been treated according to the methods described in Annex V, Chapter III of the Regulation (EC) No 1774/2002.
The provisions in the above mentioned permits concerning handling and storage as well as concerning occupational health and fire prevention remain unchanged. 6. Spelt husks (max. 9 % of the respective instantaneous RTI, max. 3 t/h at an average net calorific value (NCV) of 14 MJ/kg) 02 01 03 Plant-tissue waste Previous granted permits for the use of spelt husks: Notification decision of 05.12.2002, file reference 55-8823/81-2.3/Schwenk AHV/190 for the use of spelt husks. The provisions in the above mentioned permits concerning handling and storage as well as concerning occupational health and fire prevention remain unchanged.

Annexes
378 State of the art of the co-incineration of waste-derived fuels and raw materials in clinker/cement plants
ANNEX II – Stipulations concerning waste management of Zement- und Kalkwerke Otterbein
Zement- und Kalkwerke Otterbein GmbH & Co. KG in 36137 Großenlüder-Müs Permit dated 21 October 2008 Section IV. 6.0 Stipulations concerning waste management and waste legislation 6.1 Permission of different wastes 6.1.1 Deviating from the application, only following wastes with the waste codes and characterizations according to the ordinance about the European List of Waste (List of Waste Ordinance – AVV), dated 10.12.2001 [Federal German Law Gazette, BGBL. I p 3379] are allowed to be used in the plant.
Waste key Waste description Internal characterisation
02 02 03 For consumption or processing inappropriate substances
Animal meal, blood meal
10 01 02 Filter dust from coal combustion Fly ash
19 12 10 Burnable wastes (waste-derived fuels) Fluff (light fraction)
19 08 05 Sludges from municipal waste water treatment Dried municipal sewage sludge
02 02 01 02 03 01
Sludges from washing, cleaning and separation processes
Oil-contaminated bleaching earth (origin: food industry)
10 09 08 Casting mould and sands after casting except those which fall under 10 09 07
Spent foundry sand
According to the definition of the List of Waste AVV, the mentioned wastes are not hazardous wastes. 6.2 Documentation 6.2.1 The operator must keep an operations log book in which every intake of waste to the site is documented. The documentation shall comprise the following:
Information about intake wastes (type of waste and the characterization and waste key, quantity, quality, origin, results of eventual visual intake control including eventual notes/proof for the classification and declaration respectively)
Chronological collection of acceptance slips (delivery slips)
Results concerning the waste-specific control
Special incidents, such as operational disruptions, including possible reasons and performed remedial measures
The operations log book has to be regularly checked and counter-signed by the competent person. The operations log book has to be chronologically kept in the form of lists and tables. It can be compiled in electronic form or as hard copies and has to be submitted to the competent authority on request any time. The operations log book shall be designed in a reliably documented way; it has to be protected against unauthorized access and has to be stored for at least five years in relation to the last record.

Annexes
State of the art of the co-incineration of waste-derived fuels and raw materials in clinker/cement plants 379
These requirements on the documentations are to ensure accurate recording of the practiced disposal routes and thus to make them verifiable. Within three months after the end of every calendar year, the operator shall establish an annual overview of the required documentation as described above. Therein, specifically for each waste code, the above mentioned information and data must be listed in a table and the total amounts must be calculated. The remarks related to special incidents must be documented in the form of a comprehensive assessment. The annual overview has to be submitted to the officials of the competent authorities on request. 6.3 Intake control 6.3.1 For every single delivery, an intake control of the delivered materials must be carried out onsite. In each case, the intake control comprises the determination and documentation of following specification:
Type of the waste including the waste code according to the List of Waste
Quantity
Date and time of the intake
Origin
Results of the visual check
The deliverers of the alternative fuels have to demonstrate their quality by regular declaration analysis. The analysis must comprise at least the following parameters:
Calorific value according to no. 38 of the form “Declaration analysis” of annex 1 of the Ordinance, and
Heavy metals )
Total chlorine )
Sulphur ) according to Fehler! Verweisquelle konnte nicht gefunden werden.
Total fluorine )
Polychlorinated biphenyls (PCB) )
Pentachlorophenol (PCP) )
From each delivery of alternative fuels, a composite sample must be taken and stored for one year. Four times a year, an independent laboratory shall analyse two samples from each composite, taken unannounced in irregular intervals, for the parameters mentioned in Fehler! Verweisquelle konnte nicht gefunden werden.. For any change of the providers of light fine fractions and dried municipal sewage sludge respectively, in addition, during the first two months, three spot samples are to be analysed for each composite. When each of the analysed samples does not exceed the max.-value according to Fehler! Verweisquelle konnte nicht gefunden werden., the limit values are considered to be complied with. In case of exceedance of a max.-value, five retained samples taken directly before and after the rejected sample shall be analysed for the exceeded parameters; subsequently, the 80th percentile and the 90th percentile shall be determined. Thus, it is determined whether the exceedance of the max.-value is systematic or whether there is a single outlier. In case the 90th percentile is not exceeded, the value is considered to be complied with.

Annexes
380 State of the art of the co-incineration of waste-derived fuels and raw materials in clinker/cement plants
In case of non-compliance with a max.-value the waste supplier has to be informed. The alternative fuel may not be accepted it until it is ensured, that the required quality is met. When filling in the consignment note/acceptance slip, the following numbers of the waste producer and of the waste disposal, respectively, are collated by the applicant:
Number of the waste producer: F72E02110 Number of the waste disposal company: F72RD0027
Tabel A: Specification according to Article 21 paragraph 3 of the 9th Ordinance to the Clean Air Act
Fluff (light
fraction)Animal meal
Dried municipal
sewage sludgeFly ash
Oil-contaminated
bleaching earth
19 12 10 02 02 03 19 08 05 10 01 0202 03 01
02 02 01
Quantities min. t/h 0 0 0 0 0
max. t/h 1.97 1.47 0.89 1.47 0.5
max. t/a 17170 12877 7796 12877 4380
40 30 10 2 5.6
min. MJ/kg 12 12 8 1 5
max. MJ/kg 35 24 20 10 25
PCB mg/kg
PCP mg/kg
Chlorine w.-% < 1 < 1 < 1 < 0.5 < 0.5
Fluorine w.-% < 0.2 < 0.2 < 0.2 < 0.2 < 0.2
Sulphur w.-% < 2 < 2 < 2 < 2 < 2
Hg 1.2 0.1 1.5 0.3 0.1
Cd 9 10 11 12 13
Tl 2 2 2 0.5 0.2
Sb 200 10 100 20 10
As 13 5 13 2 10
Pb 400 5 200 10 140
Cr 250 10 100 10 315
Co 12 3 12 20 24
Cu 700 30 500 10 172
Mn 500 45 750 20 414
Ni 160 7 100 12 150
V 25 4 83 20 33
Sn 70 3 500 10 29
Legend: PCB: Polychlorinated biphenyls; PCP: Pentachlorophenol
w.-%: weight-%
no values because of low load and complete combustion at high temperatures
max. percentage of the rated
thermal input in %
Content of
hazardous
compounds
max.-values
Heavy metals
max.-values in
mg/kg
Waste code
Upper calorific
value

Annexes
State of the art of the co-incineration of waste-derived fuels and raw materials in clinker/cement plants 381
ANNEX III - Type and quantity of waste permitted for incineration for the cement plant of the Dyckerhoff AG in Göllheim
Permit for the operation of the cement plant of the Dyckerhoff AG in Göllheim, issued on 16.06.2006, file reference 7/139-17/29Dyck.
Type and quantity of waste permitted for incineration (any waste marked with an asterisk (*) is considered as a hazardous/dangerous wastes) Composite waste solvents (same as in Table 4.1-1 in the application documents, dated 20.01.2006)
Waste code Description
070103* Organic halogenated solvents, washing liquids and mother liquors from the manufacture, formulation, supply and use of basic organic chemicals
070104* Other organic solvents, washing liquids and mother liquors from the manufacture, formulation, supply and use of basic organic chemicals
070107* Halogenated still bottoms and reaction residues from the manufacture, formulation, supply and use of basic organic chemicals
070108* Other still bottoms and reaction residues from the manufacture, formulation, supply and use of basic organic chemicals
070203* Organic halogenated solvents, washing liquids and mother liquors from the manufacture, formulation, supply and use of plastics, synthetic rubber and man-made fibres
070204* Other organic solvents, washing liquids and mother liquors from the manufacture, formulation, supply and use of plastics, synthetic rubber and man-made fibres
070207* Halogenated still bottoms and reaction residues from the manufacture, formulation, supply and use of plastics, synthetic rubber and man-made fibres
070208* Other still bottoms and reaction residues from the manufacture, formulation, supply and use of plastics, synthetic rubber and man-made fibres
070303* Organic halogenated solvents, washing liquids and mother liquors from the manufacture, formulation, supply and use of organic dyes and pigments (except 070611)
070304* Other organic solvents, washing liquids and mother liquors from the manufacture, formulation, supply and use of organic dyes and pigments (except 070611)
070307* Halogenated still bottoms and reaction residues from the manufacture, formulation, supply and use of organic dyes and pigments (except 070611)
070308* Other still bottoms and reaction residues from the manufacture, formulation, supply and use of organic dyes and pigments (except 070611)
070403* Organic halogenated solvents, washing liquids and mother liquors from the manufacture, formulation, supply and use of organic pesticides (except 010105)
070404* Other organic solvents, washing liquids and mother liquors from the manufacture, formulation, supply and use of organic pesticides (except 010105)
070407* Halogenated still bottoms and reaction residues from the manufacture, formulation, supply and use of organic pesticides (except 010105)
070408* Other still bottoms and reaction residues from the manufacture, formulation, supply and use of organic pesticides (except 010105)
070503* Organic halogenated solvents, washing liquids and mother liquors from the manufacture, formulation, supply and use of pharmaceuticals
070504* Other organic solvents, washing liquids and mother liquors from the manufacture, formulation, supply and use of pharmaceuticals
070507* Halogenated still bottoms and reaction residues from the manufacture, formulation, supply and use of pharmaceuticals
070508* Other still bottoms and reaction residues from the manufacture, formulation, supply and use of pharmaceuticals
070603* Organic halogenated solvents, washing liquids and mother liquors from the manufacture, formulation, supply and use of fats, grease, soaps, detergents disinfectants and cosmetics
070604* Other organic solvents, washing liquids and mother liquors from the manufacture, formulation, supply and use of fats, grease, soaps, detergents disinfectants and cosmetics

Annexes
382 State of the art of the co-incineration of waste-derived fuels and raw materials in clinker/cement plants
070607* Halogenated still bottoms and reaction residues from the manufacture, formulation, supply and use of fats, grease, soaps, detergents disinfectants and cosmetics
070608* Other still bottoms and reaction residues from the manufacture, formulation, supply and use of fats, grease, soaps, detergents disinfectants and cosmetics
070703* Organic halogenated solvents, washing liquids and mother liquors from the manufacture, formulation, supply and use of fine chemicals and chemical products not otherwise specified
070704* Other organic solvents, washing liquids and mother liquors from the manufacture, formulation, supply and use of fine chemicals and chemical products not otherwise specified
070707* Halogenated still bottoms and reaction residues from the manufacture, formulation, supply and use of fine chemicals and chemical products not otherwise specified
070708* Other still bottoms and reaction residues from the manufacture, formulation, supply and use of fine chemicals and chemical products not otherwise specified
080111* Waste paint and varnish containing organic solvents and other dangerous substances
080112* Waste paint and varnish other than those mentioned in 080111
080113* Sludges from paint or varnish containing organic solvents and other dangerous substances
080115* Aqueous sludges containing paint or varnish containing organic solvents and other dangerous substances
080117* Aqueous sludges containing paint or varnish other than those mentioned in 080115
080121* Waste paint or varnish remover
120119* Easily biodegradable oils from metal processing
130119* Easily biodegradable hydraulic oil
130701* Fuel oil and diesel
130702* Petrol
130703* Other fuels (including mixtures)
140602* Other halogenated solvents and solvent composites
140603* Other solvents and solvent composites
190204* Premixed waste composed of at least waste marked as hazardous
190208* Liquid flammable waste containing hazardous compounds
200113* Solvents
200127* Paint, inks, adhesives and resins containing dangerous substances
200128 Paints, inks, adhesives and resins other than those mentioned in200127
Fluff: Wood, paper, board, cardboard (same as in Table 4.1-2 in the application documents, dated 20.01.2006)
Wastecode Description Origin
020103 Plant tissue waste From producing basic materials
020107 Waste from forestry exploitation From producing basic materials
030101 Waste bark and cork From wood processing and from producing panels and furniture
030105 Sawdust, chips, cuttings, wood, panels and veneers other than those mentioned in 030104
From wood processing and the production of panels and furniture
030301 Bark and wood waste From the production and processing of pulp, paper, and board
030302 Dregs and green liquor sludges (from black liquor treatment)
From the production and processing of pulp, paper and board which, in particular cases, can be recovered in a cement works
030307 Rejects from paper and cardboard recycling From the production and processing of pulp, paper and board
030310 Fibre rejects, fibre-, filler- and coating-sludges from mechanical separation
From the production and processing of pulp, paper and board
030308 Wastes from sorting paper and cardboard destined for recycling
Not suitable for material recycling
150101 Paper and cardboard packaging
Packaging
150103 Wooden packaging
Packaging

Annexes
State of the art of the co-incineration of waste-derived fuels and raw materials in clinker/cement plants 383
170201 Wood (Construction and demolition waste) wood, glass, and plastic
191201 Paper and board Wastes from mechanical treatment of wastes
191207 Wood other than those mentioned in 191206
Wastes from mechanical treatment of wastes
200101 Paper and cardboard (Municipal waste) Separately collected fractions
200138 Wood other than those mentioned in 200137
(Municipal waste) Separately collected fractions
Fluff: Textiles, textile fibres (same as in Table 4.1-3 in the application documents, dated 20.01.2006)
Waste code Description Origin
040221 Wastes from untreated textile fibres From the textile industry
040222 Wastes from processes textile fibres From the textile industry
040209 Wastes from composite materials (impregnated textile, elastomer, plastomer)
From the textile industry
040210 Organic matter from natural products (e.g. grease, wax)
From the textile industry
040215 Waste from finishing other than mentioned in 040214
From the textile industry
150109 Packaging consisting of textiles
191208 Textiles Wastes from mechanical waste treatment
200110 Clothes (Municipal waste) Separately collected fractions
200111 Textiles (Municipal waste) Separately collected fractions
Fluff: Plastics (same as in Table 4.1-4 in the application documents, dated 20.01.2006)
Waste code Description Origin
020104 Waste plastics (except packaging) From producing basic materials
070213 Waste plastic Used devices and shredder residues
080318 Waste toner other than mentioned in 080317
From the production, formulation, marketing and application (PFMA) of printing inks, toner percentage < 5 w.-%
120105 Plastic particles From mechanical surface treatment
150102 Plastic packaging Packaging
150105 Composite packaging Packaging
150106 Mixed packaging Packaging
160119 Plastics End-of-life vehicles, vehicle maintenance
170203 Plastic (Construction and demolition wastes) Insulation materials not containing hazardous mineral fibres
170604 Insulation materials other than those mentioned in 170601 and 170603
(Construction and demolition wastes) Wood, glass and plastic
191204 Plastic and rubber Wastes from mechanical waste treatment
200139 Plastics (Municipal waste) Separately collected fractions

Annexes
384 State of the art of the co-incineration of waste-derived fuels and raw materials in clinker/cement plants
Fluff: Other materials (same as in Table 4.1-5 in the application documents, dated 20.01.2006) Waste code Description Origin
080112 Waste paint and varnish other than those mentioned in080111
From the production, formulation, marketing and application (PFMA) of paints and varnishes
080114 Sludges from paint or varnish other than those mentioned in 080113
From PFMA of paints and varnishes
080118 Waste from paint or varnish removal other than those mentioned in 080117
From PFMA of paints and varnishes
080201 Waste coating powders From PFMA of paints and varnishes (prevent dust emissions)
080313 Waste ink other than mentioned in 080312 From PFMA of printing inks
080410 Waste adhesive or sealant other than those mentioned in 080409
From PFMA of adhesives and sealants
080414 Aqueous sludges containing adhesives or sealants other than those mentioned in080113
090107 Photographic film and paper containing silver or silver compounds
From the photographic industry, inapplicable for recovery
090108 Films and photographic papers free of silver or silver compounds
From the photographic industry
090110 Single-use cameras without batteries From the photographic industry
150203 Absorbents, filter materials, wiping cloths and protective clothing other than those mentioned in 150202
160103 End-of-life tyres
160306 Organic waste other than mentioned in 160305
Off-specification batches not containing solvents
190210 Flammable wastes other than those mentioned in191209 and 190209
Wastes resulting from the physico-chemical treatment of wastes
190904 Spent activated carbon From the treatment of drinking water or industrial process water
190905 Saturated or spent ion exchange resins From the treatment of drinking water or industrial process water
191210 Combustible wastes (waste-derived fuels) Wastes from mechanical waste treatment
Fluff: High-calorific fractions from separately collected wastes with following waste codes (same as in Table 4.1-6 in the application documents, dated 20.01.2006)
Waste code Description Origin
170904 Mixed construction and demolition waste other than those mentioned in170901, 170902 and 170903
Only high-calorific factions
190501 Non-composted fraction of municipal and similar waste
From aerobic treatment of solid wastes
190502 Non-composted fractions of animal and vegetable waste
From aerobic treatment of solid wastes
190503 Off-specification compost From aerobic treatment of solid wastes
200108 Organic kitchen waste (Municipal waste) Separately collected fractions
200201 Compostable waste (Municipal waste) garden and park waste
200203 Other non-compostable waste (Municipal waste) garden and park waste
200301 Mixed municipal waste (Municipal waste) other municipal waste
200302 Waste from markets (Municipal waste) other municipal waste
200303 Street cleaning residues (Municipal waste) other municipal waste

Annexes
State of the art of the co-incineration of waste-derived fuels and raw materials in clinker/cement plants 385
Oil-contaminated operation materials (same as in Table 4.1-7 in the application documents, dated 20.01.2006)
Waste code Description Origin
150110* Packaging containing residues of hazardous compounds or contaminated with such compounds
Packaging (including separately collected municipal packaging)
150202* Adsorbents, filter materials (including oil filters not otherwise specified), wiping cloths, protective clothing contaminated with dangerous substances
Adsorbent and filter materials, wiping cloths and protective clothing
160107* Oil filter End-of-life vehicles of different type (including mobile machines) and wastes from dismantling of end-of-life vehicle and vehicle maintenance (except 13, 14, 1606 and 1608)
Dried paint sludges (same as in Table 4.1-8 in the application documents, dated 20.01.2006)
Wastecode Description
080112 Waste paint and varnish other than those mentioned in080111
080115* Aqueous sludges containing paint or varnish containing organic solvents or other dangerous compounds
080117* Aqueous sludges containing paint or varnish other than those mentioned in 080115
080201 Waste coating powders
191210 Flammable fuels (refused derived fuels)
Animal meal (same as in Table 4.1-9 in the application documents, dated 20.01.2006)
Waste code Description
020202 Animal tissue waste
020203 Materials unsuitable for consumption or processing
Total capacity of the plant The total capacity of the plant is characterized by the daily production of 3200 tonnes of clinker. Smallest and biggest mass streams of the wastes permitted for incineration
Alternatives fuels for co-incineration Smallest mass stream in [t/h]
Biggest mass stream in [t/h]
Waste oil / mixtures of spent solvents 0.5 20
Waste tyres 0.5 5.6
Dried paint sludges 0.5 2.0
Production-specific commercial wastes (fluff) 0.5 6.75
Animal meal 0.5 5.0
Oil-contaminated operation materials 0.5 3.6
Dried sewage sludge 0.8 4.0
Lowest and highest calorific value of the wastes permitted for incineration
Alternatives fuels for co-incineration Lowest calorific value in [MJ/kg]
Highest calorific value in [MJ/kg]
Average calorific value in [MJ/kg]
Waste oil / mixtures of spent solvents 12 44 18
Waste tyres 25
Dried paint sludges 15 20 17
Production-specific commercial wastes (fluff) 14 25 20
Animal meal 14 25 20
Oil-contaminated operation materials 16.5 32 25
Dried sewage sludge 8.5 14 11

Annexes
386 State of the art of the co-incineration of waste-derived fuels and raw materials in clinker/cement plants
Maximum content and 50th percentile of pollutants in the wastes permitted for incineration Type of waste: waste oil / mixtures of spent solvents
Pollutant Maximum content in mg/kg dry matter (or in weight-%, as indicated)
50th percentile in mg/kg dry matter
Mercury (Hg) 1 0.3
Cadmium (Cd) 9 4
Thallium (Tl) 2 1
Antimony (Sb) 120 50
Arsenic (As) 30 20
Lead (Pb) 710 410
Chromium (Cr) 100 97
Cobalt (Co) 250 250
Copper (Cu) 450 450
Manganese (Mn) 750 750
Nickel (Ni) 77 77
Vanadium (V) 5 5
Tin (Sn) 15 10
Polychlorinated biphenyls (PCB) 10 -
Pentachlorophenol (PCP) 5 -
Chlorine (Cl) 4 weight-% -
Fluorine (F) 0.1 weight-% -
Sulphur (S) 4 weight-% -
Waste type: Dried paint sludge
Pollutant Maximum content in mg/kg dry matter (or in weight-%, as indicated)
50th percentile in mg/kg dry matter
Mercury (Hg) 0.7 0.2
Cadmium (Cd) 6.7 0.3
Thallium (Tl) 1 0.3
Antimony (Sb) 1.5 1.4
Arsenic (As) 1.5 0.5
Lead (Pb) 520 152
Chromium (Cr) 600 200
Cobalt (Co) 31 4.8
Copper (Cu) 750 294
Manganese (Mn) 154 78
Nickel (Ni) 300 30
Vanadium (V) 500 14
Tin (Sn) 150 32
Polychlorinated biphenyls (PCB) 10 -
Pentachlorophenol (PCP) 5 -
Chlorine (Cl) 4 weight-% -
Fluorine (F) 0.1 weight-% -
Sulphur (S) 4 weight-% -

Annexes
State of the art of the co-incineration of waste-derived fuels and raw materials in clinker/cement plants 387
Waste type: Production-specific commercial waste (fluff) Pollutant Maximum content in mg/kg dry matter
(or in weight-%, as indicated) 50th percentile in mg/kg dry
matter
Mercury (Hg) 1.2 0.6
Cadmium (Cd) 9 4
Thallium (Tl) 2 1
Antimony (Sb) 120 50
Arsenic (As) 13 5
Lead (Pb) 400 190
Chromium (Cr) 150 125
Cobalt (Co) 12 6
Copper (Cu) 750 350
Manganese (Mn) 500 250
Nickel (Ni) 100 50
Vanadium (V) 25 10
Tin (Sn) 70 30
Polychlorinated biphenyls (PCB) 10
Pentachlorophenol (PCP) 5
Chlorine (Cl) 4 weight-% -
Fluorine (F) 0.1 weight-% -
Sulphur (S) 4 weight-% -
Waste type: Oil-contaminated operation materials
Pollutant Maximum content in mg/kg dry matter (or in weight-%, as indicated)
50th percentile in mg/kg dry matter
Mercury (Hg) 1.2 0.6
Cadmium (Cd) 9 4
Thallium (Tl) 2 1
Antimony (Sb) 120 50
Arsenic (As) 13 5
Lead (Pb) 400 190
Chromium (Cr) 250 200
Cobalt (Co) 12 6
Copper (Cu) 750 350
Manganese (Mn) 500 250
Nickel (Ni) 160 80
Vanadium (V) 25 10
Tin (Sn) 70 30
Polychlorinated biphenyls (PCB) 10
Pentachlorophenol (PCP) 5
Chlorine (Cl) 4 weight-% -
Fluorine (F) 0.1 weight-% -
Sulphur (S) 4 weight-% -

Annexes
388 State of the art of the co-incineration of waste-derived fuels and raw materials in clinker/cement plants
Waste type: Dried sewage sludge Pollutant Maximum content in mg/kg dry matter
(or in weight-%, as indicated) 50th percentile in mg/kg dry
matter
Mercury (Hg) 1.5 1
Cadmium (Cd) 9 1.5
Thallium (Tl) 2 0.5
Antimony (Sb) 100 6.4
Arsenic (As) 13 5
Lead (Pb) 200 89
Chromium (Cr) 100 52
Cobalt (Co) 15 12
Copper (Cu) 700 450
Manganese (Mn) 750 450
Nickel (Ni) 100 80
Vanadium (V) 83 25
Tin (Sn) 200 25
Polychlorinated biphenyls (PCB) 10
Pentachlorophenol (PCP) 5
Chlorine (Cl) 4 weight-% -
Fluorine (F) 0.1 weight-% -
Sulphur (S) 4 weight-% -
No individual pollutants are mentioned for the waste animal meal. Note: Concerning the use of alternative raw materials, the application mentions following permitted contents of pollutants. These figures are part of the application and thus they are binding for the operator. Paper sludges as alternative raw material
Pollutant 50th percentile[mg/kg] Maximum value [mg/kg]
Mercury (Hg) 0.2 0.5
Cadmium (Cd) 3 9
Thallium (Tl) 0.5 2
Antimony (Sb) 10 60
Arsenic (As) 3 13
Lead (Pb) 45 250
Chromium (Cr) 32 150
Cobalt (Co) 10 12
Copper (Cu) 300 500
Manganese (Mn) 90 350
Nickel (Ni) 8 30
Vanadium (V) 3 20
Tin (Sn) 1.5 30

Annexes
State of the art of the co-incineration of waste-derived fuels and raw materials in clinker/cement plants 389
Spent foundry sand as alternative raw material Pollutant 50th percentile[mg/kg] Maximum value [mg/kg]
Mercury (Hg) 0.03 0.5
Cadmium (Cd) 0.12 9
Thallium (Tl) 0.5 2
Antimony (Sb) 3.3 60
Arsenic (As) 2.6 13
Lead (Pb) 9 500
Chromium (Cr) 54 600
Cobalt (Co) 3.2 100
Copper (Cu) 29 700
Manganese (Mn) 447 500
Nickel (Ni) 20 100
Vanadium (V) 7 20
Tin (Sn) 4 30
Note: Concerning the use of alternative raw materials, the application mentions following permitted waste codes. These codes are part of the application and thus they are binding for the operator. Table mentioning the waste codes with respect to paper sludges (concerns Table 4.1-10 of the application dated 20.01.2006
Waste code Description
03 03 05 De-inking sludges from paper recycling
03 03 07 Rejects from paper and cardboard recycling
03 03 10 Fibre rejects, fibre-, filler- and coating-sludges from mechanical separation
03 03 11 Sludges from on-site effluent treatment other than those mentioned in 03 03 10
Table mentioning the waste codes with respect to spent foundry sand (concerns Table 4.1-10 of the application dated 20.01.2006
Waste code Description
10 09 08 Casting cores and moulds which have undergone pouring other than those mentioned in 10 09 07
Stipulations with respect to emissions to air The percentage of the alternative fuels of the rated thermal input may not exceed 80 % for each of the rotary kilns. The permitted percentages of the alternative fuels are listed as follows:

Annexes
390 State of the art of the co-incineration of waste-derived fuels and raw materials in clinker/cement plants
Alternatives fuels for co-incineration Maximum percentage of the
total rated thermal input Feeding point
Waste oil / mixtures of spent solvents 40 % including the required additional fuels(*) to incinerate
them Main burner
Waste tyres 30 % Kiln inlet
Dried paint sludges 20% Main burner
Production-specific commercial wastes (fluff) 30 % Main burner
Animal meal 30 % Main burner
Oil-contaminated operation materials 20 % Kiln inlet
Dried sewage sludge 12 % Kiln inlet
(*) Liquid alternative fuels with a net calorific value of more than 30 MJ/kg and a PCB and PCP content of less than 10 mg/kg are excluded from this exemption. The use of fossil fuels (lignite, hard coal, petrol coke, light heating oil and industrial soot) may vary in the range from 20 % to 100 % of the total rated thermal input. The use of alternative fuels fed to the kiln inlet may not exceed 30 % of the total rated thermal input. On 19.01.2006, the applied maximum percentage of dried paint sludge was belatedly reduced from 30 % to 20 %. The percentage of the rated thermal input of co-incinerated dangerous wastes may not exceed 40 %. In the tables above, according to the European List of Waste, hazardous/dangerous wastes are market with the asterisk (*). Liquid combustible wastes or compounds with a content of polychlorinated aromatic hydrocarbons such as polychlorinated biphenyls (PCB) or pentachlorophenol (PCP) of more than 10 mg/kg as well as with a calorific value of less than 30 MJ/kg must be classified as dangerous waste. During start-up and shut-down of the rotary kilns, alternative fuels may not be fed. Due to their content of organic pollutants, the alternative raw materials spent foundry sand and paper sludge must be fed via the secondary firing. The stipulations concerning self-monitoring of the used alternative fuels and wastes are not presented here.

Annexes
State of the art of the co-incineration of waste-derived fuels and raw materials in clinker/cement plants 391
ANNEX IV – Evaluation of the continuous self-monitoring data of 34 German clinker/cement production plants

Annexes
392 State of the art of the co-incineration of waste-derived fuels and raw materials in clinker/cement plants
1. Cement works of HeidelbergCement AG in Leimen/Germany
Cement works of HeidelbergCement AG
in Leimen/Germany
Evaluation of the daily mean values derived from continuous self-monitoring (2008 – 2010)
1. Introduction
The results from continuous self-monitoring of emissions to air for the period 01.01.2008 - 31.12.2010 have been evaluated for following parameters:
Dust [mg/Nm3]
Nitrogen oxides NOx [mg NO2/Nm3]
Sulphur dioxide SO2 [mg/Nm3]
Temperature T [°C]
Waste gas flow [Nm3/h]
Reference conditions:
The waste gas flow is related to norm conditions (0 °C, 1013 mbar) and to dry waste gas.
According to German provisions, all values refer to an oxygen content of 10 volume %. It is assumed that the provided data have been calculated with relation to this reference oxygen content.
Additional information: SO2, NOx and O2 are measured in one monitor. For this purpose, the sampling waste gas is pretreated. As a consequence, according to the operator, a correction with respect to pressure, temperature and moisture of the waste gas is not required. It can be assumed that a sampling gas cooler is used. In this case, condensation occurs. If the waste gas also contains ammonia which can be introduced to the system with the raw materials or which is added as a reducing agent for NOx (surplus is required), the measured SO2 concentration can be lower than the real concentration due to its reaction with ammonia (to form ammonium sulphate) and the condensation conditions in the cooler.
The calculation to relate the concentration of the measured parameters to 10 volume % oxygen can be carried out in the available 'emissions calculator'.
Concerning the dust measurement, with respect to pressure and moisture, a constant factor is used, and is, together with the temperature and the oxygen content, processed in the 'emissions calculator'.
Regarding the waste gas flow measurement, the pressure and oxygen content are determined by the monitor and the moisture is considered to be constant.
The values for NOx and SO2 refer to standard conditions, to dry waste gas and to a reference oxygen content of 10 volume %.
The values for dust are determined as follows: Dust is measured under operating conditions; the values reported refer to standard conditions (using the temperature

Annexes
State of the art of the co-incineration of waste-derived fuels and raw materials in clinker/cement plants 393
and constant figures for moisture and pressure) and to an oxygen content of 10 volume %. In 2009, during calibration, the following factors for moisture were determined by measurements:
o Lepol kiln 2: 13.4 volume % o Lepol kiln 3: 15.9 volume %.
Concerning the waste gas flow: the measurement device determines the values with reference to standard conditions and the 'emissions calculator' converts them to dry conditions by means of a constant factor for the moisture. Waste gas flow is not referred to on a 10 volume % oxygen content basis. The calculation of the loads is carried out by multiplication of the dry waste gas flow and the waste gas parameters which are referred to standard conditions; the loads are not referred to on a 10 volume % oxygen basis.
2. Brief description of the plant
The cement works in Leimen are equipped with two Lepol kilns. According to the environmental report, NOx is abated in a dedicated plant. Here, as indicated above, it is possible that additional ammonia is released which could interfere with the monitoring of SO2.
3. Evaluation of the daily mean values 3.1 Annual mean values
The annual mean values are compiled in following table. Table 1: Annual mean values of Lepol kiln 2
Dust SO2 NOx
Waste gas flow
Tempe-rature
[mg/Nm3] [mg/Nm3] [mg/Nm3] [Nm3/h] [°C]
2008 6.5 256.5 309.1 68784 103.5
2009 7.2 217.7 273.1 68810 102.6
2010 5.5 230.7 286.2 81968 99.3

Annexes
394 State of the art of the co-incineration of waste-derived fuels and raw materials in clinker/cement plants
Table 2: Annual mean values of Lepol kiln 3
Dust SO2 NOx
Waste gas flow
Tempe-rature.
[mg/Nm3] [mg/Nm3] [mg/Nm3] [Nm3/h] [°C]
2008 4.5 246.1 293.8 99303 100.9
2009 5.9 221.9 354.1 98922 97.7
2010 4.1 262.3 347.0 116880 99.7
3.2 Differences
The emission profile for the two kilns is the same. However, with respect to NOx, the emission level for 2009 and 2010 of Lepol kiln 3 is slightly higher but this is not significant.
3.3 Dust
The measured values are low. In its environmental report 2010, the company points out following: In 1994, for dedusting the waste gas from the kilns, modern electrostatic precipitators were installed in the Leimen cement works. As a consequence, the emission concentration is well below the emission limit value. In 2005, due to additional investments in electrical equipment, further improvements were achieved. In 2006, the emission limit value for dust (as average daily mean value) was reduced to 20 mg/Nm3. Figure 1a shows the development of the annual mean values for dust emissions from 2000 – 2010 as published in the environmental report of the company. Figures 1b and 1c provide the emission curves of the daily mean values for dust emission for the time period 2008 - 2010. For electrostatic precipitators, the dust emission is on a low level confirming the annual average value given in the environmental report. From time to time, there are some peak values, especially for Lepol kiln 2.
Figure 1a: Dust emission of the Lepol kilns - graph from the environmental report of the operator

Annexes
State of the art of the co-incineration of waste-derived fuels and raw materials in clinker/cement plants 395
Figure 1b: Daily mean values for dust emissions from 2008 to 2010 of Lepol kiln 2
Figure 1c: Daily mean values for CO emissions from 2008 to 2010 of Lepol kiln 3
3.4 Nitrogen oxides (NOx)
The NOx emissions of the two kilns are similar. In the environmental report 2010, the following is pointed out: For NOx abatement, we operate a so-called SNCR plant. So, we are able to safely meet the currently valid emission limit values. Also for NOx, the daily mean values were reduced (in 2006 - see Figure 2a). The NOx emission curves of the daily mean values from 2008 – 2010 (Figures 2b and 2c) clearly show the impact of the SNCR plant as the NOx values above 500 mg/Nm3 are curtailed.
0
5
10
15
20
25
30
01.01.2008 31.12.2008 31.12.2009 31.12.2010
Du
st [m
g/N
m3]
0
5
10
15
20
25
30
01.01.2008 31.12.2008 31.12.2009 31.12.2010
Du
st
[mg
/Nm
3]

Annexes
396 State of the art of the co-incineration of waste-derived fuels and raw materials in clinker/cement plants
Figure 2a: NOx emission of the Lepol kilns - graph from the environmental report of the operator
Figure 2b: Daily mean values for NOx emissions from 2008 to 2010 of Lepol kiln 2
Figure 2c: Daily mean values for NOx emissions from 2008 to 2010 of Lepol kiln 3
0
100
200
300
400
500
600
700
800
900
01.01.2008 31.12.2008 31.12.2009 31.12.2010
NO
x[m
g/N
m3]
0
200
400
600
800
1000
1200
01.01.2008 31.12.2008 31.12.2009 31.12.2010
NO
x[m
g/N
m3]

Annexes
State of the art of the co-incineration of waste-derived fuels and raw materials in clinker/cement plants 397
3.5 Sulphur dioxide (SO2) The SO2 emissions of the two kilns are similar. In the environmental report 2010, the following is pointed out: The SO2 emissions of the Lepol kilns are caused by the raw materials to a large extent. Due to optimised operating conditions, the SO2 emissions are kept as low as possible. In 2006, the emission limit value (as daily mean value) was reduced from 400 to 350 mg/Nm3 (see Figure 3a). The SO2 emission curves of the daily mean values from 2008 – 2010 (Figures 3b and 3c) show that the values vary in the range of 100 – 400 mg/Nm3 indicating that the emission limit value of 350 cannot always be met.
Figure 3a: SO2 emission of the Lepol kilns – graph from the environmental report of the operator
Figure 3b: Daily mean values for SO2 emissions from 2008 to 2010 of Lepol kiln 2
0
100
200
300
400
500
600
01.01.2008 31.12.2008 31.12.2009 31.12.2010
SO
2[m
g/N
m3]

Annexes
398 State of the art of the co-incineration of waste-derived fuels and raw materials in clinker/cement plants
Figure 3c: Daily mean values for SO2 emissions from 2008 to 2010 of Lepol kiln 3
The aforementioned statement of the company concerning SO2 emissions is true for preheater kilns. However, the absorption of SO2 in the grate preheater of Lepol kilns is usually incomplete. Consequently, the fuel also contributes to the SO2 emissions in addition to the raw materials. The ratio of fossil (conventional) fuels to waste-derived fuels is about 50 % and has been relatively constant from 2001 – 2010 (see Figure 4).
Figure 4: Percentage of waste-derived fuels – graph from the environmental report of the operator
0
100
200
300
400
500
600
01.01.2008 31.12.2008 31.12.2009 31.12.2010
SO
2[m
g/N
m3]

Annexes
State of the art of the co-incineration of waste-derived fuels and raw materials in clinker/cement plants 399
2. Cement works of Lafarge Zement in Wössingen/Germany
Cement works of Lafarge Zement in Wössingen/Germany
Evaluation of the daily mean values derived from continuous self-
monitoring (2008 – 2010)
1. Introduction
The results from continuous self-monitoring of emissions to air for the period 01.01.2008 - 31.12.2010 have been evaluated for the following parameters:
Dust [mg/Nm3]
Nitrogen oxides NOx [mg NO2/Nm3]
Sulphur dioxide SO2 [mg/Nm3]
Mercury Hg [µg/Nm3] Reference conditions:
The waste gas flow is related to norm conditions (0 °C, 1013 mbar) and to dry waste gas.
According to German provisions, all values refer to an oxygen content of 10 volume %. It is assumed that the provided data have been calculated in relation to this reference oxygen content.
2. Brief description of the plant The available information is very limited.
Kiln II:
This kiln was in operation until March 2009. Presumably, it was a Lepol kiln which was operated according to the semi-dry process.
Kiln III:
In 2008/2009, the plant was completely modernised and retrofitted. The process was changed from the semi-dry to the dry process. A 5-stage cyclone preheater was installed.
3. Evaluation of the daily mean values 3.1 Differences between the process of kiln II and kiln III (before and after the change of the
process) There are fundamental differences between the process carried out in kiln II and the one in kiln III. This fact will be reflected in the evaluation of the emission data of the two processes.

Annexes
400 State of the art of the co-incineration of waste-derived fuels and raw materials in clinker/cement plants
3.2 Annual mean values The annual mean values are compiled in following table.
Table 1: Annual mean values
Annual mean value
Dust SO2 NOx Hg
[mg/Nm3] [mg/Nm3] [mg/Nm3] [ug/Nm3]
2008 - Kiln II 10.4 163.7 388.6 11.3
2009 - Kiln III 0.5 19.1 470.2 18.0
2010 - Kiln III 0.7 9.6 449.4 25.7
3.3 Dust
The modernisation of the plant was also associated with a significant decrease in the dust emissions. The measured values of the new kiln III are very low (Table 1). In the range below 3 mg/Nm3, an accurate measurement is not possible with the most commonly applied monitors (transmission dust monitors). To measure such low values, a scattered light dust monitor is needed. When using a transmission dust monitor that is well designed and calibrated, the measured values should be given as “< 3 mg/Nm3”.
3.4 Nitrogen oxides (NOx) It is not known whether the company is operating a SNCR plant. Compared with old kiln (kiln
II), the NOx emissions have increased. According to the experience, in most cases, the NOx emissions of semi-dry kilns are lower than those of dry kiln systems. This seems to be confirmed in the given case.
3.5 Sulphur dioxide (SO2)
The SO2 emission of the new kiln is significantly lower compared with the old one. This is due to the different process conditions in the two kiln systems.
Kiln II with the semi-dry process is a more or less open system. Here, part of the sulphur compounds which enter the rotary kiln with the raw materials and/or fuels are emitted with the waste gas.
In modern kilns with cyclone preheaters, a sulphur cycle is formed in the rotary kiln and the lowest cyclone. From there, no significant quantities of sulphur compounds reach the waste gas. For this kiln type, significant sulphur emissions can only occur if the raw materials contain volatile sulphur compounds which are transferred to the waste gas in the upper cyclones. In 2009, the emission of SO2 was 19.1 mg/Nm3- twice as high as in 2010 (9.6 mg/Nm3). However, this could, be a random result as the accuracy of emission monitors in this measuring range does not allow accurate measurements. 3.6 Mercury (Hg)
The differences between the two kiln systems cannot be commented as relevant information is not known, such as the dust recycling and the temperature profiles of the waste gas. Kiln III
3 (2010). The emission curve shows a trend (Figure 1).

Annexes
State of the art of the co-incineration of waste-derived fuels and raw materials in clinker/cement plants 401
Short-term variations: The short-term variations can be explained by the retention capacity of the system (comounds and direct operation mode).
Long-term trend: The observed trend (Figure 1) cannot be expalined with the limited available information of the process and the input materials. It can be assumed that there was a slight decrease in the mercury content of a fuel or of the raw meal. With the assumption that the fuels do not contain a significant quantity of mercury and that all of the input mercury is finally emitted to air (no removal via discarding the filter dust), the raw meal would have a mercury content of 15 – 20 µg/kg which is a realsitic vlaue. In this case, the long-term variations would be caused by a change of the mercury content in the raw meal of ± 5 µg/kg.
Figure 1: Daily mean values for Hg emissions of kiln III from April 2009 (start of operation) to December 2010
0
5
10
15
20
25
30
35
40
45
50
01.04.2009 07.09.2009 14.02.2010 24.07.2010 31.12.2010
Hg
[u
g/m
3]

Annexes
402 State of the art of the co-incineration of waste-derived fuels and raw materials in clinker/cement plants
3. Cement works Mergelstetten of the Schwenk Zement KG in Mergelstetten/Germany
Cement works Mergelstetten of the Schwenk Zement KG in Mergelstetten/Germany
Evaluation of the daily mean values derived from continuous self-
monitoring (2008 – 2010 and 2011) As the company took a selective catalytic reduction plant into
operation in 2011, the values of this year are compared with the three years before (2008 – 2010)
1. Introduction
The results from continuous self-monitoring of emissions to air for the period 01.01.2008 - 31.12.2011 have been evaluated for following parameters:
Dust [mg/Nm3]
Nitrogen oxides NOx [mg NO2/Nm3]
Sulphur dioxide SO2 [mg/Nm3]
Volatile organic compounds VOC [mg C/Nm3]
Carbon monoxide CO [mg/Nm3]
Mercury Hg [µg/Nm3]
Reference conditions:
The waste gas flow is related to norm conditions (0 °C, 1013 mbar) and to dry waste gas.
According to German provisions, all values refer to an oxygen content of 10 volume %. It is assumed that the provided data have been calculated in relation to this reference oxygen content.
2. Brief description of the plant
There is preheater kiln with a capacity of 3400 t/d. There is no information available whether the kiln has a precalciner and at which feeding point and which type of waste-derived fuels and waste-derived raw materials are fed. Until 2011, the NOx emissions were abated with a SNCR plant. At the end of 2010/beginning of 2011, a SCR plant went into operation.

Annexes
State of the art of the co-incineration of waste-derived fuels and raw materials in clinker/cement plants 403
3. Evaluation of the daily mean values 3.1 Annual mean values
The annual mean values are compiled in following table. Table 1: Annual mean values
Dust NOx SO2 VOC Hg CO
[mg/Nm3] [mg/Nm3] [mg/Nm3] [mg C/Nm3] [µg/Nm3] [mg/Nm3]
2008 0.1 363.2 19.0 20.0 12.6 116.5
2009 0.1 330.6 7.8 14.7 9.4 157.8
2010 0.1 256.1 2.2 11.4 4.1 243.2
2011 0.8 231.4 9.9 4.6 16.0 195.4
3.2 Dust 3.2.1 Time period 2008 - 2010 Scattered light dust monitors can achieve detection limits in the order of 0.1 mg/Nm3. In contrast, the detection limits for transmission dust monitors are significantly higher. However, the calibration of scattered light dust monitors can be a problem. In the measurement range below 3 mg/Nm3, they cannot be calibrated with sufficient accuracy. Consequently, the reported very low dust concentrations of around 0.1 mg/Nm3 are not realistic monitoring data. So, the question arises whether the dust emissions are really very low or whether the dust monitor was not adequately adjusted for three years. In case the concentrations are really low, the results should be reported as below 3 mg/Nm3.
3.2.2 Year 2011 The reported values are slightly higher compared to the time period 2008 – 2010 but they are still not realistic. Thus, the question remains unanswered whether the dust emission was below 3 mg/Nm3. 3.3 Nitrogen oxides (NOx) 3.3.1 Time period 2008 - 2010 The annual average for 2008 is 363.2 mg/Nm3, for 2009 330.6 mg/Nm3, and for 2010 256.1 mg/Nm3. The higher values are curtailed by means of a SNCR plant; this means that the maximum NOx concentration is controlled below a certain target value, except for few outliers.
0
100
200
300
400
500
600
700
01.01.2008 31.12.2008 31.12.2009 31.12.2010
NO
x [m
g/m
3]

Annexes
404 State of the art of the co-incineration of waste-derived fuels and raw materials in clinker/cement plants
Figure 1: Daily mean values for NOx emissions from 2008 - 2010
3.3.2 Year 2011 In May 2010, a high dust SCR plant (Selective Catalytic Reduction) commenced operation (Zurhove 2014). According to Figure 1, it seems that trials had been undertaken until November 2010. After that, an emission concentration of about 200 mg/Nm3 was achieved. After nine months of operation, catalyst masking was detected associated with a drastic drop in catalytic performance (Zurhove/Terry, 2013). At the beginning of 2011, measurement results are missing for about three months. After that, no stable emission level can be observed and the NOx concentration varies between 150 and 350 mg/Nm3. However, at the end of 2011, a more stable emission level of about 330 mg/Nm3 and finally below 200 mg/Nm3 was achieved (Figure 2). In the summer 2012, a water spray system was put into operation in the downcomer duct upstream of the SCR which limited peak values of the preheater gas outlet temperature; by just limiting the SCR inlet temperature, the catalyst masking was drastically reduced and there was an immediate and dramatic improvement in availability (Zurhove/Terry, 2013). Unfortunately, the emission curve for 2012 is not available to demonstrate the constantly low emission level of 200 mg/Nm3.
Figure 2: Daily mean values for NOx emissions in 2011
In 2011, the ammonia emissions also show an atypical profile which could have been the results of
ongoing trials. However, also at the end of 2011, the ammonia emission remains at a constantly low
level of about 5 mg/Nm3 (Figure 3).
0
50
100
150
200
250
300
350
400
01.01.2011 02.04.2011 02.07.2011 01.10.2011 31.12.2011
NO
x[m
g/N
m3]

Annexes
State of the art of the co-incineration of waste-derived fuels and raw materials in clinker/cement plants 405
Figure 3: Daily mean values for ammonia emissions in 2011
3.4 Sulphur dioxide (SO2) 3.4.1 Time period 2008 - 2010 The results of SO2 monitoring do not appear to be plausible. Considering the whole 3-year period, it is obvious that in 2008 the values vary considerably around a mean value of about 20 mg/Nm3. From spring 2009 onwards, the variation is much smaller and the mean value decreases to a level of below 5 mg/Nm3 (Figure 4).
Figure 4: Daily mean values for SO2 emissions from 2008 - 2010
0
10
20
30
40
50
60
01.01.2011 02.04.2011 02.07.2011 01.10.2011 31.12.2011
NH
3[m
g/N
m3]
0
10
20
30
40
50
60
70
80
01.01.2008 31.12.2008 31.12.2009 31.12.2010
SO
2[m
g/N
m3]

Annexes
406 State of the art of the co-incineration of waste-derived fuels and raw materials in clinker/cement plants
3.4.2 Year 2010 In 2010, only 95 daily mean values are reported indicating a severe problem with the SO2 monitor (Figure 5).
Figure 5: Daily mean values for SO2 emissions in 2010
3.4.3 Year 2011 For 2011, only 15 daily mean values are reported. This indicates a completely inadequate monitoring of the SO2 emissions.
Conclusions
The SO2 emissions seem to be very low; the annual mean value is below 20 mg/Nm3.
The emission curve indicates a severe problem with the SO2 monitor.
3.5 Carbon monoxide (CO)
3.5.1 Time period 2008 - 2010 At the beginning of 2008, the CO emissions are on a level of about 120 mg/Nm3 and increase until the end of 2010 on a level of about 250 mg/Nm3(Figure 6).
0,0
0,5
1,0
1,5
2,0
2,5
3,0
3,5
4,0
4,5
5,0
01.01.2010 02.07.2010 31.12.2010
SO
2[m
g/N
m3]

Annexes
State of the art of the co-incineration of waste-derived fuels and raw materials in clinker/cement plants 407
Figure 6: Daily mean values for CO emissions from 2008 – 2010
This slight increase could have been caused by changes in the kiln operation. It is possible that the secondary firing or the calciner (if available) was operated with a slightly reduced excess of air. Alternatively, a change in the fuels used could have been the reason for this development. However, the lack of air in the aforementioned zones was not of sufficiently magnitude that an increase in the VOC should have been noticed. 3.5.2 Year 2011 In 2011, except for the period April/May 2010, the CO emissions are in the range of 200 – 250 mg/Nm3 and slightly decrease at the end of 2011 (Figure 7). This confirms the trend of 2008 – 2010.
Figure 7: Daily mean values for CO emissions in 2011
Due to too low temperature level, CO cannot be oxidised in SCR facilities. This is confimed by the the continuous measurement results (see clinker production site in Annex IV). In contrast, organic compounds, determeined as VOC, can be reduced in the order of 60 %.
0
50
100
150
200
250
300
350
400
450
500
01.01.2008 31.12.2008 31.12.2009 31.12.2010
CO
[m
g/m
3]
0
50
100
150
200
250
300
350
400
01.01.2011 02.04.2011 02.07.2011 01.10.2011 31.12.2011
CO
[m
g/N
m3]

Annexes
408 State of the art of the co-incineration of waste-derived fuels and raw materials in clinker/cement plants
3.6 Emission of volatile organic compounds (VOC) 3.6.1 Time period 2008 - 2010 At the beginning of 2008, the VOC values were at a level of about 15 mg C/Nm3 and then decreased to a very low level of around 3 mg C/Nm3 (middle of 2010). At the end of 2010, the VOC level was about 8 mg C/Nm3 (Figure 8). It could be possible that the VOC monitor had a drift over the three-years period. If this explanation is ignored, the decrease in the values can be explained with a change in the content of organic compounds in the raw materials. Such a change could be possible and could be the reason for the slight increase in the CO emission.
Figure 8: Daily mean values for VOC emissions from 2008 - 2010
3.6.2 Year 2011 In 2011, the VOC emission values fluctuate between 10 mg/Nm3 and very low values of between 2 and 4 mg C/Nm3 (Figure 9).
Figure 9: Daily mean values for VOC emissions in 2011
These variations can be explained with the operation of the SCR facility although the emission level was not constant due to non-stable operating conditions. After the aforementioned improvement of the dust cleaning system, the curve should be much more constant. Unfortunately, this cannot be
0
5
10
15
20
25
30
01.01.2008 31.12.2008 31.12.2009 31.12.2010
VO
C [
mg
C/N
m3]
0
2
4
6
8
10
12
14
16
01.01.2011 02.04.2011 02.07.2011 01.10.2011 31.12.2011
VO
C [
mg
C/N
m3]

Annexes
State of the art of the co-incineration of waste-derived fuels and raw materials in clinker/cement plants 409
demonstrated as the emission curves for 2012 and subsequent years are not available. As another indicator for the increase in VOC reduction is the annual average value for VOC emissions which was reduced from 14.7 mg/Nm3 in 2009 to 4.6 mg/Nm3 in 2011 which is a removal efficiency of 68 %. 3.7 Mercury (Hg)
3.7.1 Time period 2008 - 2010 For the time period 2008 – 2010, there is trend towards lower values (Figure 10). In addition, the variation of the daily mean values is considerable. Compared to the annual average, the relative standard deviations are 35.5 % in 2008, 49.0 % in 2009 and 77.0 % in 2010.
Figure 10: Daily mean values for Hg emissions from 2008 – 2010
Considering only the year 2010, one detects that about one fourth of the daily mean values are missing (Figure 11). Probably, the Hg monitor indicated negative values which had been eliminated.
Figure 11: Daily mean values for Hg emissions in 2010
0
5
10
15
20
25
30
35
40
01.01.2008 31.12.2008 31.12.2009 31.12.2010
Hg
[u
g/N
m3]
0
5
10
15
20
25
30
35
40
01.01.2010 02.07.2010 31.12.2010
Hg
[u
g/N
m3]

Annexes
410 State of the art of the co-incineration of waste-derived fuels and raw materials in clinker/cement plants
3.7.2 Year 2011 In contrast to the time period 2008 – 2010, the emission values for 2011 are given in [mg/Nm3] with two decimals; this is inadequate. The values are between 0.01 and 0.03 mg/Nm3 (Figure 12).
Figure 12: Daily mean values for Hg emissions in 2010
3.7.3 Conclusions There are doubts that the measured values are correct. The available data do not allow conclusions on the real level of emission.
0,000
0,005
0,010
0,015
0,020
0,025
0,030
0,035
0,040
01.01.2011 02.04.2011 02.07.2011 01.10.2011 31.12.2011
Hg
[m
g/N
m3]

Annexes
State of the art of the co-incineration of waste-derived fuels and raw materials in clinker/cement plants 411
4. Cement works of HeidelbergCement AG in Schelklingen/Germany
Cement works of HeidelbergCement AG
in Schelklingen/Germany
Evaluation of the daily mean values derived from continuous self-monitoring (2008 – 2010)
1. Introduction
The results from continuous self-monitoring of emissions to air for the period 01.01.2008 - 31.12.2010 have been evaluated for the following parameters:
Dust [mg/Nm3]
Nitrogen oxides NOx [mg/Nm3]
Sulphur dioxide SO2 [mg/Nm3]
Carbon monoxide [mg/Nm3]
Mercury Hg [µg/Nm3]
Oxygen [volume %]
Temperature [°C]
Moisture [volume %]
Waste gas flow [Nm3/h], a fix value of 250 000 Nm3/h is assumed Reference conditions:
The waste gas flow is related to norm conditions (0 °C, 1013 mbar) and to dry waste gas.
According to German provisions, all values refer to an oxygen content of 10 volume %. It is assumed that the provided data have been calculated in relation to this reference oxygen content.
2. Brief description of the plant
The available information is limited. The plant consists of a rotary kiln with a cyclone preheater, probably with a precalciner. The NOx emissions are abated by means of a SNCR plant. Elevated SO2 emission can occur if the raw material contains sulphur in form of pyrite as is the case in Schelklingen. According to the environmental report, appropriate techniques are applied to achieve the emission limit value. However, there are no indications of which measures have been taken.

Annexes
412 State of the art of the co-incineration of waste-derived fuels and raw materials in clinker/cement plants
3. Evaluation of the daily mean values 3.1 Annual mean values
The annual mean values are compiled in following table. Table 1: Annual mean values
Dust SO2 NOx CO Hg [mg/N3] [mg/Nm3] [mg/Nm3] [mg/Nm3] [µg/Nm3]
2008 0.11 114.3 340.2 1178.1 12.4
2009 0.07 50.3 326.1 915.0 14.0
2010 0.02 74.1 404.9 1468.9 11.8
3.2 Dust
The measured values are very low (Table 1). In principle, dust values below about 10 mg/Nm3 can only be measured with scattered light dust monitors. Depending on the type and supplier, they have a detection limit of about 0.1 mg/Nm3. These monitors have to be calibrated with an extractive analytical method. The detection limit of such methods is significantly above 1 mg/Nm3. This means that the reported values do not provide exact values but indicate that the dust emissions are very low, probably below 3 – 5 mg/Nm3. In the environmental report for 2010, the company reported (according to the 17th Ordinance of the German Federal Clean Air Act) heavy metal emissions a value of 0.084 mg/Nm3 which is about 4 times higher than the reported dust concentration. This indicates that the measurements of low dust concentrations are inaccurate.
3.3 Nitrogen oxides (NOx) The annual mean values (Table 1) are comparatively low and can be only achieved because of
the SNCR plant. The slight increase in 2010 cannot be explained with the available data and information.
3.4 Sulphur dioxide (SO2) The variations of the annual mean values (Table 1) cannot be explained with the available data and information. As indicated above, the SO2 emission are related to the pyrite content of the raw material.
3.5 Carbon monoxide (CO) The carbon monoxide emission values are comparatively high; in 2010, the annual mean value was almost 1500 mg/Nm3. In the following Table 2, the statistical data for the time period 2008 – 2010 are compiled and Figure 1 shows the available values in the time period 2008 – 2010. In 2010, there was a significant increase (Table 2 and Figure 1). The reasons for that are not known.

Annexes
State of the art of the co-incineration of waste-derived fuels and raw materials in clinker/cement plants 413
Table 2: Statistical data for the carbon monoxide emissions
2008 2009 2010
CO [mg/Nm3]
Number of values 152 230 202
Mean value 1178 915 1469
Standard devia. 370 253 338
Maximum 1996 1625 2766
Minimum 401 249 645
Figure 2: Daily mean values for CO emissions from 2008 – 2010 (there are considerable data gaps)
0
500
1000
1500
2000
2500
3000
CO
in [
mg/
Nm
3]

Annexes
414 State of the art of the co-incineration of waste-derived fuels and raw materials in clinker/cement plants
3.6 Mercury (Hg) 3 (2010) indicating a
relatively low level. The measured daily mean values show low variations. The mercury emission directly correlates with the waste gas temperature (Figure 2).
Figure 2: Hg emission as a function of the waste gas temperature; for the graph classified daily mean values were used
0
2
4
6
8
10
12
14
16
18
100 105 110 115 120 125 130 135
Hg
[u
g/N
m3]
Temperature [ C]

Annexes
State of the art of the co-incineration of waste-derived fuels and raw materials in clinker/cement plants 415
5. Cement works of Holcim (Süddeutschland) GmbH in Dotternhausen/Germany
Cement works of Holcim (Süddeutschland) GmbH
in Dotternhausen/Germany
Evaluation of the daily mean values derived from continuous self-monitoring (2008 – 2010)
1. Introduction
The results from continuous self-monitoring of emissions to air for the period 01.01.2008 - 31.12.2010 have been evaluated for following parameters:
Dust [mg/Nm3]
Nitrogen oxides NOx [mg/Nm3]
Sulphur dioxide SO2 [mg/Nm3]
Carbon monoxide CO [mg/Nm3]
Mercury Hg [µg/Nm3]
Volatile organic compounds VOC [mg C/Nm3]
Hydrogen chloride HCl [mg/Nm3]
Oxygen O2 [volume %]
Temperature [°C]
Moisture [volume %]
Waste gas flow [Nm3/h]
Reference conditions:
The waste gas flow is related to norm conditions (0 °C, 1013 mbar) and to dry waste gas.
The reference oxygen content is not mentioned. According to German provisions, all values shall refer to an oxygen content of 10 volume %. It is assumed that the provided data have been calculated in relation to this reference oxygen content.

Annexes
416 State of the art of the co-incineration of waste-derived fuels and raw materials in clinker/cement plants
2. Brief description of the plant The cement works in Dotternhausen is unique I the world as it uses oil shale as a fuel and, in form of burnt oil shale, as an additive to produce so-called Portland-oil shale cement. This special cement contains about 25 – 28 % of burnt oil shale which is produced in a special process (Figure 1)30.
Figure 1: Scheme of the production of burnt oil shale at the cement works of Holcim AG in Dotternhausen/Germany, based on (www.dvv.uni-duisburg-essen.de/download/pdf_34Fach/Holcim_P1.pdf)
The clinker is produced in a rotary kiln with a 5-stage preheater and an in-line precalciner. In 2009, the plant was retrofitted to increase the production capacity from 1570 to 2000 t clinker per day. For this purpose, amongst other parts, the precalciner was replaced by a new one, the kiln head and the tertiary air duct were renewed, and the electrostatic precipitator was replaced by a bag filter1. Before the retrofit, about 70 % of the energy input was provided via the main burner in form of coal, heavy oil (optional), dried sewage sludge, oil emulsions and fly ash, and about 30 % of the energy input via the precalciner in form of oil shale, shredded waste tyres, residues from paper production, fly ash (optional) and waste roofing felt. The raw materials used are limestone, clay, foundry sand and pyrite cinder. The retrofit took place from the end of February to first of October 2009; this can be seen from the available data for the waste gas flow in 2009 (Figure 2). Before the retrofit, the waste gas flow was at a level of about 122000 Nm3/h, and after the retrofit it was at the level of about 166000 Nm3/h (after October 2009).
30The basic layout of the cement works and specifically the production of burnt oil shale is described in www.dvv.uni-duisburg-essen.de/download/pdf_34Fach/Holcim_P1.pdf
Fabricfilter
Fluidisedbed
furnace
Steamboiler
Power generator
Waste gas
Coolingtower
Burntoilshalecooler
Burnt oil shale
Cooled screw conveyor
Raw oilshale
0 – 10 mm

Annexes
State of the art of the co-incineration of waste-derived fuels and raw materials in clinker/cement plants 417
Figure 2: Waste gas flow in 2009; the wide gap represents the time period needed for retrofitting the plant
The NOx emissions are abated by means of a SNCR plant.
3. Evaluation of the daily mean values 3.1 Values given as “0.00“
There are many values given as „0.00“. This should be avoided. There can be different reasons for the non-availability of monitoring results, such the kiln being out of operation or the failure of the device for monitoring the emissions to air. Kiln is not in operation: In this case, no value should be given. Failure of the monitoring device There can be different reasons that a signal of the monitoring device is missing. This should be documented. In this case, it should be noted “not available” instead of “0.00”.
Example: In 2010, the dust values for the time period from 03.02.2010 to 14.04.2010 are given as “0.00”. In this period, the dust monitor was not in operation or there was no dust monitor installed.
The monitors should have an availability of more than 90 % (correct measurement for more than 90 % of the operating time). This minimum availability is not achieved for the given case. E.g. in 2010, from 329 daily mean values only 260 are given which translates into availability of only 79 %.
0
40.000
80.000
120.000
160.000
200.000
01.01.2009 02.04.2009 02.07.2009 01.10.2009 31.12.2009
Wa
ste
ga
s f
low
[N
m3/h
]

Annexes
418 State of the art of the co-incineration of waste-derived fuels and raw materials in clinker/cement plants
3.2 Annual mean values
The annual mean values are compiled in following table.
Table 1: Annual mean values
Dust NOx SO2 Hg VOC CO HCl mg/Nm³ mg/Nm³ mg/Nm³ µg/Nm³ mg C/Nm³ mg/Nm³ mg/Nm³
2008 4.5 341 2.21 3.11 37.5 2'626 0.26
2009 3.6 391 2.81 0.73 20.6 827 1.08
2010 1.8 395 1.41 0.48 10.3 534 0.71
3.3 Dust
The measured values are very low (see Table 1). In principle, dust values below about 10 mg/Nm3 can only be measured with scattered light dust monitors. Depending on the type and supplier, they have a detection limit of about 0.1 mg/Nm3. These monitors have to be calibrated with an extractive analytical method. The detection limit of such methods is significantly above 1 mg/Nm3. This means that the reported values do not provide exact values but indicate that the dust emissions are very low, probably below 3 – 5 mg/Nm3.
3.4 NOx und CO
As a consequence of the retrofit in 2009, there is a slight increase in the NOx emissions.
In 2008, the NOx emissions were strongly influenced by the very high CO concentrations which reduced the NOx concentrations in the secondary firing (Figure 3). There is no significant reduction attributable to the installation of the SNCR plant.
After the retrofit, the CO emissions were significantly lower. This means, the combustion was much more complete. Consequently, the reducing effect of CO with respect to NOx was lower and the NOx concentrations increased (Figure 3). But the higher values are curtailed by means of the SNCR plant.
Figure 3: Daily mean values for NOx emissions in 2008 and 2010
200
250
300
350
400
450
500
0 100 200 300 400
NO
x[m
g/N
m3]
Day in 2008 and 2010 respectively
2008
2010

Annexes
State of the art of the co-incineration of waste-derived fuels and raw materials in clinker/cement plants 419
3.5 Emission of volatile organic compounds (VOC) In 2008, the VOC emissions were significantly higher than in 2010. Most probably, the aforementioned incomplete combustion in the secondary firing contributed to the elevated values. In 2010, due to the new precalciner, the VOC emissions were significantly lower. Whereas the annual mean value of 2008 was 37.5 mg C/Nm3, it was only 10.3 mg C/Nm3 in 2010 (Table 1). The high variations in 2010 cannot be explained with the available data and information (Figure 4). It can be assumed that variations are associated with changes in the raw material composition. However, problems with the monitoring device could also be the reason for the variations.
Figure 4: Daily mean values for VOC in 2010
3.6 Sulphur dioxide (SO2) and hydrochloric acid (HCl) The emission of SO2 and HCl are very low. Probably, the measured values are in the range of the detection limits of the monitors.
3.7 Mercury (Hg) It seems that mercury emissions are significantly lower after the retrofit in 2009. The annual mean values in 2008 was 3.11 µg/Nm3, in 2009 0.73 µg/Nm3 and in 2010 0.48 µg/Nm3(Table 1). The emission curves for 2008 and 2010 are presented in Figure 5. However, a question arises concerning the accuracy of the reported data. With the assumption that the mercury monitor is adjusted for the measurement of the emission limit value of 30 µg/Nm3 it will have a higher inaccuracy in the range of 2 – 4 µg/Nm3. The inaccuracy of the calibration gas at the reference point alone may be in the range of 2 – 3 µg/Nm3. Further, no calibration according to EN 14181 is reported. As a consequence, the reported values may be interpreted simply as mercury emissions below5µg/Nm3. The presentation of more accurate numbers does not seem to be possible based on the monitoring equipment and calibration.
0
2
4
6
8
10
12
14
16
18
20
0 100 200 300 400
VO
C [
mg
C/N
m3]
days in 2010

Annexes
420 State of the art of the co-incineration of waste-derived fuels and raw materials in clinker/cement plants
Figure 5: Results of the mercury monitoring in 2008 and 2010 (daily mean values)
0
1
2
3
4
5
6
7
8
9
10
0 100 200 300 400
Hg
[
g/N
m3]
2008
2010

Annexes
State of the art of the co-incineration of waste-derived fuels and raw materials in clinker/cement plants 421
6. Cement works of Schwenk Zement KG in Allmendingen/Germany
Cement works of Schwenk Zement KG
in Allmendingen/Germany
Evaluation of the daily mean values derived from continuous self-monitoring (2008 – 2010)
1. Introduction
The results from continuous self-monitoring of emissions to air for the period 01.01.2008 - 31.12.2010 have been evaluated for the following parameters:
Dust [mg/Nm3]
Nitrogen oxides NOx [mg/Nm3]
Sulphur dioxide SO2 [mg/Nm3]
Mercury Hg [µg/Nm3]
Volatile organic compounds VOC [mg C/Nm3]
Carbon monoxide CO [mg/Nm3]
Reference conditions:
The waste gas flow is related to norm conditions (0 °C, 1013 mbar) and to dry waste gas.
The reference oxygen content is not mentioned. According to German provisions, all values shall refer to an oxygen content of 10 volume %. It is assumed that the provided data have been calculated in relation to this reference oxygen content.
2. Brief description of the plant The available information is very limited. The company operates a rotary kiln with a cyclone preheater. There does not appear to be a precalciner does not seem to exist. In 2008, a chlorine bypass was installed. A scheme of the plant is shown in Figure 1.

Annexes
422 State of the art of the co-incineration of waste-derived fuels and raw materials in clinker/cement plants
Figure 1: Scheme of part of the plant of Schwenk Zement KG in Allmendingen/Germany –
based on the brochure of the cement works31, the chlorine bypass is also indicated Conventional fuels are replaced by waste-derived fuels with a high calorific value by up to 100 %, mainly externally pre-treated waste plastics and packaging waste but also waste tyres and dewatered sewage sludge. There is no information available concerning measures to abate NOx and SO2 emissions.
31Schwenk Zement KG, Das Zementwerk Allmendingen, Broschure issued in April 2011, http://www.schwenk-zement.de/aktuelles/broschueren-infomaterial/Broschueren/Allgemeine_Informationen/Das-Zementwerk-Allmendingen.pdf
limes
ton
e
Iro
n o
re
san
d
raw mill
rotary kiln chlorine bypass
waste tyres
fabric filter
stack
cyclonepre-
heater
fabric filter
silos

Annexes
State of the art of the co-incineration of waste-derived fuels and raw materials in clinker/cement plants 423
3. Evaluation of the daily mean values 3.1 Exclusion of measured values
The values given for the time period 9 May to 2 June 2008 are not plausible and were excluded from the evaluation.
Example: The NOx values are between 0.3 and 188 mg/Nm3. Assuming the kiln was really in operation, the values reported are not plausible; they are too low.
Until 16 September 2008, the dust values do not appear to be reasonable and were excluded.
3.2 Annual mean values
The annual mean values are compiled in the following table. Table 1: Annual mean values
Dust NOx SO2 Hg VOC CO
[mg/Nm3] [mg/Nm3] [mg/Nm3] [mg/Nm3
] [mg C/Nm3] [mg/Nm3]
2008 4.4 412.8 33.6 6.5 44.0 1059
2009 3.3 316.0 120.9 8.1 54.8 1175
2010 3.7 305.5 39.3 11.8 44.1 951
3.3 Dust
With the retrofitted fabric filters low dust values around 4 mg/Nm3 are achieved.
3.4 Nitrogen oxides (NOx) The emission curve for 2008 – 2010 clearly shows that the higher values are curtailed by means
of an abatement technique (Figure 2). It is not known whether the NOx emissions are reduced with a SNCR plant or another technique. It is obvious that additional measures were introduced in the middle of 2009 as the NOx emissions were reduced by about 20 – 30 % to a comparatively low level of 320 – 350 mg/Nm3. The relatively high CO emissions indicate that e.g. the dosage of waste tyres created reducing conditions in the secondary firing which reduced the NOx emissions on the one hand but increased the CO and VOC emissions on the other hand.

Annexes
424 State of the art of the co-incineration of waste-derived fuels and raw materials in clinker/cement plants
Figure 2: Daily mean values for NOx emissions from 2008 – 2010; there are large data gaps
3.5 Sulphur dioxide (SO2) The sulphur dioxide emissions show high variations. This is demonstrated by the daily mean values for the time period 25 June – 9 December 2009 (Figure 3).
Figure 3: Sulphur dioxide emissions in the second half of 2009
0
100
200
300
400
500
600
NO
x in
[m
g/N
m3
]
0
50
100
150
200
250
300
350
16.06.2009 31.07.2009 14.09.2009 29.10.2009 13.12.2009
SO
2[m
g/N
m3]

Annexes
State of the art of the co-incineration of waste-derived fuels and raw materials in clinker/cement plants 425
Possible explanation: The cement works has a chlorine bypass (Figure 1). For this purpose, gas is extracted from the kiln inlet and cooled down; subsequently, the dust is removed in a fabric filter and the thus treated gas is emitted via the stack. The reason for such a chorine bypass is to reduce the chlorine cycle which is established in the kiln inlet and the lower cyclones. But here, not only chlorine enriches but also sulphur dioxide. In a cement works without a chlorine bypass, the sulphur dioxide is almost fully absorbed by the raw meal and only small quantities reach the stack (not considering sulphur dioxide which is released in the upper cyclones where the raw materials contain volatile sulphur compounds such as pyrite). In case of a chlorine bypass, part of the enriched sulphur dioxide is emitted via this route. It is possible that the bypass was not permanently operated, i.e. depending on the chlorine input and chlorine enrichment respectively, a variable quantity or no gas was extracted from the kiln inlet. This could explain the observed long-term variations (Figure 3).
3.6 Emission of organic compounds (VOC) and CO The daily mean values for the emissions of VOC vary between 20 and 100 mg C/Nm3 with annual averages between 44 and 55 mg C/Nm3 (Table 1); the standard deviation is in the range of 25 – 30 %.. There is a clear correlation between CO and VOC emissions (Figures 4 and 5). It may be inferred that the VOC values above 40 mg C/Nm3 are associated with incomplete combustion in the secondary firing (it seems that there is no precalciner).
Figure 4: Correlation between VOC and CO (correlation of the available daily mean values for
2008 - 2010)
It is not known to what extend CO and VOC emissions are derived from the natural raw materials. However, it can be assumed that less than 1000 mg CO/Nm3and thus less than about 40 mg C/Nm3 are released from this source and the residual fraction derives from the aforementioned incomplete combustion.
0,0
20,0
40,0
60,0
80,0
100,0
120,0
0 500 1000 1500 2000 2500 3000
VO
C [
mg
C/N
m3]
CO in [mg/Nm3]

Annexes
426 State of the art of the co-incineration of waste-derived fuels and raw materials in clinker/cement plants
Figure 5: Correlation between VOC and CO (with classified daily mean values)
At a CO concentration of 1000 mg/Nm3, the heat loss is about 20 kJ/kg clinker. In case of a modern rotary kiln with cyclone preheater and a heat demand in the range of 3000 – 3500 kJ/kg clinker, this loss represents about 0.6 – 0.7 %.
3.6 Mercury (Hg)
The annual mean values are 6.5 (2008), 8.1 (2009) und 3 (2010). The daily mean values vary considerably as can be seen by means of the data for 2010 (Figure 6). However, the mean value remains relatively constant (Figure 6). The possible explanation is as follows:
Long-term stability: Most probably, the mercury content of any raw material or fuel does not vary sufficiently to cause the observed variations in mercury emissions.
Short-term variations: In the compound operation mode (raw mill in operation), mercury is largely adsorbed and is returned to the system. In the direct operation mode (raw mill is out of operation), the waste gas temperature is higher and more mercury is emitted. Table 2 provides an example for this explanation, i.e. for a time period of 15days, the daily mean values are compiled indicating the short-term variation.
Figure 6: Daily mean values for Hg in 2010
0
10
20
30
40
50
60
70
80
0 500 1000 1500 2000 2500
VO
C [
mg
C/N
m3]
CO [mg/Nm3]
0
5
10
15
20
25
30
01.03.2010 05.05.2010 09.07.2010 12.09.2010 16.11.2010
Hg
[u
g/N
m3]

Annexes
State of the art of the co-incineration of waste-derived fuels and raw materials in clinker/cement plants 427
Table 2: Variation of the mercury emission during a period of 15 days (daily mean values)
Hg [µg/Nm3]
Hg [µg/Nm3]
17.08.2010 4.0 25.08.2010 11.7
18.08.2010 8.8 26.08.2010 9.8
19.08.2010 10.6 27.08.2010 11.8
20.08.2010 10.4 28.08.2010 6.2
21.08.2010 9.7 29.08.2010 6.2
22.08.2010 10.3 30.08.2010 12.4
23.08.2010 15.9 31.08.2010 14.6
It is not known whether dust is discarded in addition to the removal of a small part of the dust via the chlorine bypass. In case of discarding filter dust, significant quantities of mercury would be removed from the system. In principle, the aforementioned short-term variations can occur but with the available information and data, a final conclusion cannot be drawn.

Annexes
428 State of the art of the co-incineration of waste-derived fuels and raw materials in clinker/cement plants
7. Cement works of Märker Zement GmbH in Harburg/Germany
Cement works of Märker Zement GmbH
in Harburg/Germany
Evaluation of the daily mean values derived from continuous self-monitoring (2008 – 2010)
1. Introduction
The results from continuous self-monitoring of emissions to air for the period 01.01.2008 - 31.12.2010 have been evaluated for following parameters:
Dust [mg/Nm3]
Nitrogen oxides NOx [mg/Nm3]
Sulphur dioxide SO2 [mg/Nm3]
Carbon monoxide [mg/Nm3]
Volatile organic compounds VOC [mg C/Nm3]
Mercury Hg [µg/Nm3], for the direct and compounds operation mode
Ammonia NH3 [mg/Nm3]
Oxygen O2 [volume %]
Temperature [°C]
Moisture [volume %] – a constant value is assumed until 10.06.2009 (14 volume %), after this date it was measured
Waste gas flow [Nm3/h]; no measurement as a constant value is assumed
Temperature [°C] Reference conditions:
The waste gas flow is related to norm conditions (0 °C, 1013 mbar) and to dry waste gas.
The reference oxygen content is not mentioned. According to German provisions, all values shall refer to an oxygen content of 10 volume %. It is assumed that the provided data have been calculated in relation to this reference oxygen content.

Annexes
State of the art of the co-incineration of waste-derived fuels and raw materials in clinker/cement plants 429
2. Brief description of the plant
The available information is very limited.
The plant consists of a rotary kiln with a cyclone preheater.
The NOx emissions are abated by means of a SNCR plant. 3. Evaluation of the daily mean values 3.1 Annual mean values
The annual mean values are compiled in Table 1 and Table 2. Table 1: Annual mean values
Dust SO2 NOx CO VOC [mg/Nm3] [mg/Nm3] [mg/Nm3] [mg/Nm3] [mg C/Nm3]
2008 4.1 24.0 214.8 2669.6 14.5
2009 2.6 19.3 271.3 2521.9 22.3
2010 3.2 7.0 275.4 3344.4 18.3
NH3
Hg (direct) Hg
(compound) [mg/Nm3] [µg/Nm3] [µg/m3]
2008 7.8 9.7 4.0
2009 10.7 11.5 2.4
2010 13.9 18.0 3.7
Table 2: Other waste gas parameters
O2 Moisture Waste gas flow [volume %] [volume %] [Nm3/h]
2008 7.8 9.7 221067
2009 10.7 11.5 227275
2010 13.9 18.0 228167
3.2 Dust
The measured values are low. They can only be achieved with a fabric filter.

Annexes
430 State of the art of the co-incineration of waste-derived fuels and raw materials in clinker/cement plants
3.3 Nitrogen oxides (NOx) The annual mean values are 214.8 (2008), 271.3 (2009) und 275.4 mg/Nm3 (2010). Such low
emission values can only be achieved by means of an abatement technique, for instance by means of a SNCR plant. Figure 1 shows the NOx emission curve for the time period 2008 – 2010. In 2008, the emissions varied substantially whereas the values varied little in 2009 and 2010. This suggests that a more efficient adjustment control, usually based on the continuous NOx monitoring, was implemented.
Figure 1: Daily mean values for NOx emissions from 2008 – 2010 3.4 Sulphur dioxide (SO2)
The annual mean values are 24.0 (2008), 19.3 (2009) und 7.0 mg/Nm3 (2010). From Figure 2, it can be seen that the SO2 monitor did not work properly in 2010. Consequently, the mean value for this year is not correct. The question arises whether the monitor was also not properly working in 2009. It seems that the extracted sampling waste gas is dried in a gas cooler which leads, due to the reaction of SO2 with ammonia, to lower measurement results32.
32Zwick R.; Emission monitoring using the example of continuous monitoring of the rotary kiln of Märker Zement GmbH in Harburg/Germany, EU-Twinning project SL04/EN/01 – Integrated Pollution Prevention and Control (IPPC), Ljubljana, 18-20 July 2006, http://okolje.arso.gov.si/ippc/uploads/File/2_Kontinuirliche%20Hg-Messungen%20de.pdf
0
100
200
300
400
500
600
01.01.2008 31.12.2008 31.12.2009 31.12.2010
NO
x[m
g/N
m3]

Annexes
State of the art of the co-incineration of waste-derived fuels and raw materials in clinker/cement plants 431
Figure 2: Daily mean values for SO2 emissions from 2008 – 2010
3.5 Carbon monoxide (CO) and volatile organic compounds (VOC) CO At a CO concentration of about 1000 mg/Nm3, the associated heat loss is about 20 kJ/kg clinker. Given a modern kiln with a heat demand between 3000 and 3500 kJ/kg clinker, the heat loss is between approximately 0.6 and 0.7 %. It is not known how much CO was released from the raw material. This part cannot be avoided or reduced. However, it can be assumed that this part is less than 1000 mg/Nm3. Consequently, the source of the considerable residual part is incomplete combustion during secondary firing, or, if available, in the precalciner. According to the CO emission curve (Figure 3), almost all daily mean values are above 1000 mg/Nm3. The annual mean values are between
Figure 3: Daily mean values for CO emissions from 2008 – 2010
0
5
10
15
20
25
30
35
40
01.01.2008 31.12.2008 31.12.2009 31.12.2010
SO
2 [m
g/N
m3]
0
1000
2000
3000
4000
5000
6000
7000
8000
9000
CO
in [
mg/
Nm
3]

Annexes
432 State of the art of the co-incineration of waste-derived fuels and raw materials in clinker/cement plants
2500 and 3350 mg/Nm3. This means that the part of the CO emission from incomplete combustion is significant. VOC The VOC concentrations are at a comparatively low level. Notably, the ratio of CO to VOC is unusually high. Probably, either the CO concentrations are too high or the VOC concentrations are too low. The correlation between these two parameters indicates that at a CO concentration of 1000 mg/Nm3, the VOC concentration is about 15 mg C/Nm3(Figure 4). Considering the aforementioned statement related to the CO concentrations, the VOC concentration released from the raw material is about 15 mg C/Nm3. This means that higher values are the consequence of incomplete combustion during secondary firing, or, if available, in the precalciner.
Figure 4: Correlation between CO and VOC emissions (by means of classified daily mean
values)
3.6 Ammonia (NH3) Ammonia enters the system either with the raw material or is injected to reduce the NOx emissions in the SNCR plant. In the compound operation mode, ammonia is largely absorbed by the raw meal and returned to the preheater and thus enriches in the system. As a consequence, the ammonia emissions are lower in the compound operation mode but significantly increase in the direct operation mode due to the absence of absorption and higher waste gas temperatures; they vary according to the two aforementioned operating modes. The emission curve for 2010 discloses that a lot of values are missing and that the variations are difficult to explain (Figure 5). The values and the curve do not seem to be trustworthy. Therefore, a further interpretation is not submitted.
0
5
10
15
20
25
30
0 1000 2000 3000 4000 5000 6000
VO
C [
mg
C/N
m3]
CO [mg/Nm3]

Annexes
State of the art of the co-incineration of waste-derived fuels and raw materials in clinker/cement plants 433
Figure 5: Daily mean values for NH3 emissions in 2010
3.7 Mercury (Hg) The mercury emission concentrations are continuously monitored for the compound and direct operation mode. Specifically for the mercury monitoring at Märker Zement GmbH in Harburg/Germany, the following statements were made in 20061: Concerning the monitor used:
Märker had results for discontinuous waste gas measurement of Hg
Since 1988, the measurement indicated elevated values
On 23.04.1999, the first SM-3 mercury monitor from Mercury Instruments was installed.
First results: The monitor did not determine ionic mercury; probably, the monitor was operated without a converter.
In spring 2001, Mercury Instruments retrofitted the monitor and in August 2001 a calibration was carried out.
The approved monitor did not provide a reliable calibration function.
Manifold retrofits resulted in an improvement of the measurement and the last calibration attempt showed that a calibration of the monitor was possible. For the emission limit value of 50 µg/Nm3, the tolerance range was 19 µg/Nm3.
Concerning the mercury sources:
The mercury input from the raw materials is in the range of 85 – 90 %; the input from the fuels represents only a small percentage.
A mercury cycle between the preheater and the electrostatic precipitator is formed. This cycle can be reduced by discarding filter dust.
The quantity of mercury stored in the raw meal silo is huge. The annual mean values for the direct and compound operation modes are given in Table 1 for 2008 - 2010. With the assumption of a percentage of the compound operation mode of 75 %, the average Hg emission level is about 5 µg/Nm3. Assuming that mercury is quantitatively emitted to air, a mercury content in the raw meal can be calculated at about 6 µg/kg. However, in the past, higher emissions were reported. So, it can be concluded that part of the mercury is removed from the system by discarding filter dust. With respect to mercury emissions, it is important to note that the waste gas temperature has a significant influence.
0
5
10
15
20
25
30
35
40
01.01.2010 20.02.2010 11.04.2010 31.05.2010
NH
3[m
g/N
m3]

Annexes
434 State of the art of the co-incineration of waste-derived fuels and raw materials in clinker/cement plants
8. Cement works of Schwenk Zement KG in Karlstadt/Germany
Cement works of Schwenk Zement KG
in Karlstadt/Germany
Evaluation of the daily mean values derived from continuous self-monitoring (2008 – 2011)
1. Introduction
The results from continuous self-monitoring of emissions to air for the period 01.01.2008 - 31.12.2010 have been evaluated for the following parameters:
Dust [mg/Nm3]
Nitrogen oxides NOx [mg/Nm3]
Sulphur dioxide SO2 [mg/Nm3]
Volatile organic compounds VOC [mg C/Nm3]
Carbon monoxide CO [mg/Nm3]
Mercury Hg [µg/Nm3]
Waste gas flow [Nm3/h] Remark: The mercury emissions were reported in [mg/Nm3] to two decimal places. This is inadequate. Some years ago, there was the idea to present the measurement results in the same units and to the same number of decimal places as the emission limit values are defined in the regulation concerned, such as
the Waste Incineration Directive (now part of the Industrial Emissions Directive); there, the emission limit value for mercury is 0.05 mg/Nm3 (daily mean value – for the co-incineration of waste in cement plants), or
the 17th Ordinance of the German Federal Clean Air Act; there, the emission limit value for mercury is 0.03 mg/Nm3 (daily mean value).
Especially with regards to mercury, this format is inadequate as, according to this approach, the emission values are reported as 0.00, 0.01, 0.02, 0.03 mg/Nm3 etc.. This is not precise enough. Consequently, mercury emissions should be reported with the unit [µg/Nm3] and one decimal.
Reference conditions:
The waste gas flow is related to norm conditions (0 °C, 1013 mbar) and to dry waste gas.
According to German provisions, all values refer to an oxygen content of 10 volume %. It is assumed that the provided data have been calculated in relation to this reference oxygen content.

Annexes
State of the art of the co-incineration of waste-derived fuels and raw materials in clinker/cement plants 435
2. Brief description of the plant
The available information is limited. The plant consists of a rotary kiln with a cyclone preheater. It is not known whether dedicated techniques to abate NOx or SO2 emissions are operated.
3. Evaluation of the daily mean values 3.1 Annual mean values
The annual mean values are compiled in following table. Table 1: Annual mean values
Dust SO2 NOx VOC CO [mg/Nm3] [mg/Nm3] [mg/Nm3] [mg C/Nm3] [mg/Nm3]
2008 2.2 106.8 145.6 34.2 1301
2009 2.5 71.4 140.0 51.2 1983
2010 2.3 88.9 157.4 81.3 2240
2011 5.9 61.3 146.7 75.1 2253
Table 2: Annual mean values for the waste gas flow
Waste gas flow Hg [Nm3/h] [mg/Nm3]
2008 403374 0.010
2009 374823 0.016
2010 339107 0.020
2011 246300 0.022
3.2 Dust
3.2.1 Time period 2008 - 2010
The measured values are very low (see Table 1). In principle, dust values below about 10 mg/Nm3 can only be measured with scattered light dust monitors. Depending on the type and supplier, they have a detection limit of about 0.1 mg/Nm3. These monitors have to be calibrated with an extractive analytical method. The detection limit of such methods is significantly above 1 mg/Nm3. This means that the reported values do not provide exact values but indicate that the dust emissions are very low, probably below 3 – 5 mg/Nm3.
3.2.2 Year 2011 The measured dust concentrations are higher compared to the time period 2008 – 2010. The annual mean value of 2011 (5.9 mg/Nm3) is almost three times higher. The reason for this increase is not known.

Annexes
436 State of the art of the co-incineration of waste-derived fuels and raw materials in clinker/cement plants
3.3 Nitrogen oxides (NOx) 3.3.1 Time period 2008 - 2011 The annual mean values are 145.6 (2008), 140.0 (2009), 157.4 (2010) and 147.6 mg/Nm3
(2011). These values are very low. They cannot be achieved without a dedicated abatement technique, probably with a SNCR plant. When discussing the CO values below, it will be shown that the CO emissions are very high which contributes to lower NOx emissions: in the kiln inlet, or in the precalciner, if available, a reduction of nitrogen oxides takes place (NO + CO N2+ CO2). The exact contribution of this reaction to the reduction in NOx emissions cannot be calculated.
3.4 Sulphur dioxide (SO2) 3.4.1 Time period 2008 - 2010
The annual mean values are 106.8 (2008), 71.4 (2009) and 88.9 mg/Nm3 (2010). The emissions significantly change in these three years which cannot be explained with the available information and data. The high CO emissions have an influence on the volatility of sulphur in the kiln inlet, or, if available in the precalciner. However, this influence cannot be clearly demonstrated.
Figure 1: Daily mean values for SO2 emissions from 2008 – 2010
3.4.2 Year 2011 The annual mean value for 2011 is 61.3 mg/Nm3, i.e. in the same range as the values in the three previous years. The SO2 emissions vary strongly again.
0
50
100
150
200
250
300
01.01.2008 31.12.2008 31.12.2009 31.12.2010
SO
2[m
g/N
m3]

Annexes
State of the art of the co-incineration of waste-derived fuels and raw materials in clinker/cement plants 437
Figure 2: Daily mean values for SO2 emissions in 2011
3.5 Carbon monoxide (CO) in the time period 2008 - 2011
The carbon monoxide emissions were provided in [volume %] and were converted to [mg/Nm3] (factor 12500). Probably, the CO monitor has a relatively high maximum threshold value, presumably in the range of 0.3 – 0.5 volume % (3750 - 6250 mg/Nm3). Consequently, the uncertainty in measurement can be estimated to about ±150 to ±300 mg/Nm3.Usually, a monitor with such a high uncertainty would not be approved for emission monitoring. Table 3 shows that the CO emissions are very high. Table 3: Annual mean values for CO emissions
2008 2009 2010 2011
Number of values 306 243 274 309
Mean value [mg/Nm3] 1301 1983 2240 2253
Standard dev. [mg/Nm3] 385 486 416 639
Maximum [mg/Nm3] 2500 3750 3500 5625
Minimum [mg/Nm3] 375 500 1000 625
Such high emissions are not released from the raw material but result from the reducing conditions in the secondary firing, or, if available from the precalciner. The reasons for these high emissions cannot be identified with the available information and data. There are two possibilities: 1.) „Overfeeding of the secondary firing“
Waste-derived fuels often have negative costs as a gate fee is paid by the supplier. Thus, it is economically attractive to co-incinerate high quantities of waste-derived fuels. In some cases, too much waste-derived fuels are fed, which is called ‘overfeeding’. Usually, this has no adverse impact on the operation of the kiln or on the clinker quality.
2.) NOx reduction The reduction of NOx via reducing conditions in the kiln inlet or, if available, in the precalciner is propagated by some operators and experts. In case of simple secondary firing, this can be easily achieved with course fuels. In contrast to well-designed precalciners, the CO formed cannot be completely oxidised. Thus, the advantage of
0
20
40
60
80
100
120
140
160
180
18.11.2010 07.01.2011 26.02.2011 17.04.2011 06.06.2011 26.07.2011 14.09.2011 03.11.2011 23.12.2011 11.02.2012
SO2
in [
mg/
Nm
3]

Annexes
438 State of the art of the co-incineration of waste-derived fuels and raw materials in clinker/cement plants
reduced NOx emissions is associated with significantly increased CO, and, as CO correlates with VOC (see below), increased emission of organic compounds.
3.6 Volatile organic compounds (VOC)
The annual mean values for VOC significantly increased from 34.2 (2008) to 51.2 (2009) and 81.3 mg C/Nm3 (2010). In 2011, the annual mean value was slightly lower (75.1 mg C/Nm3). The emission curve of the daily mean values indicates a drastic increase in the VOC emissions in the second half of 2010. In 2011, they went down but again increased at the end of that year (Figure 3).
Figure 3: Daily mean values for VOC emissions from 2008 – 2011
There is a clear correlation between CO and VOC emissions as it can be seen from Figure 4 for the time period 2008 – 2010 and from Figure 5 for 2011.
Figure 4: Correlation between CO and VOC for the time period 2008 – 2010 (classified daily
mean values)
0
50
100
150
200
250
300
VO
C in
[m
g C
/Nm
3]
0
20
40
60
80
100
0 500 1000 1500 2000 2500 3000
VO
C [
mg
C/N
m3]
CO [mg/Nm3]

Annexes
State of the art of the co-incineration of waste-derived fuels and raw materials in clinker/cement plants 439
Figure 5: Correlation between CO and VOC in 2011 (classified daily mean values)
It can be assumed that about 20 mg C/Nm3, maximum 25 mg C/Nm3, of VOC emissions are released from the raw material. This means that the major part of the CO and VOC emissions result from the secondary firing (or, if available from the precalciner) with its reducing conditions, i.e. from incomplete combustion. The type of organic compounds resulting from incomplete combustion differ from those released from the raw material and depend on the composition (chemistry) of the waste-derived fuels. In case of waste tyres for instance, it is known that additional emissions of organic compounds consist to a large extend of methane (about 50 – 60 %) and benzene (about 10 – 20 %).
Emission limit values The Waste Incineration Directive (now part of the Industrial Emissions Directive) stipulates that for the co-incineration of waste in cement plants (Annex II), the following emission limit values must be complied with:
SO2: 50 mg/Nm3
TOC: 10 mg C/Nm3 (TOC means total organic carbon; this parameter is equal to the aforementioned VOC)
In an apodosis, it is expressed: „Exemptions may be authorised by the competent authority in cases where TOC and SO2 do not result from the incineration of waste“. As explained above, most of the VOC emission results from the co-incineration of waste. As a consequence, it seems that the emission limit value for VOC (and TOC respectively) is significantly exceeded.
3.7 Mercury (Hg)
As indicated in the remark in the introduction, the mercury emissions were reported in an inadequate way. The annual mean values may be in the range of 10 – 20 µg/Nm3 and cannot be evaluated in more detail.
0
20
40
60
80
100
120
140
160
0 1000 2000 3000 4000 5000
VO
V i
n [
mg
C/N
m3
]
CO in [mg/Nm3]
VO
C in
[m
g C
/Nm
3]

Annexes
440 State of the art of the co-incineration of waste-derived fuels and raw materials in clinker/cement plants
9. Cement works of HeidelbergCement AG in Lengfurt/Germany
Cement works of HeidelbergCement AG
in Lengfurt/Germany
Evaluation of the daily mean values derived from continuous self-monitoring (2008 – 2010)
1. Introduction
The results from continuous self-monitoring of emissions to air for the period 01.01.2008 - 31.12.2010 have been evaluated for the following parameters:
Dust [mg/Nm3]
Nitrogen oxides NOx [mg/Nm3]
Sulphur dioxide SO2 [mg/Nm3]
Carbon monoxide [mg/Nm3]
Mercury Hg [µg/Nm3]
Oxygen O2 [volume %]
Temperature [°C]
Moisture [volume %]
Waste gas flow [Nm3/h] Reference conditions:
The waste gas flow is related to norm conditions (0 °C, 1013 mbar) and to dry waste gas.
According to German provisions, all values refer to an oxygen content of 10 volume %. It is assumed that the provided data have been calculated in relation to this reference oxygen content.
2. Brief description of the plant
The available information is limited. The plant consists of a rotary kiln with a 4-stage cyclone preheater and a chlorine bypass with a gas extraction percentage of about 5 %. The NOx emissions are abated by means of a SNCR plant and the SO2 emissions by addition of calcium hydroxide.

Annexes
State of the art of the co-incineration of waste-derived fuels and raw materials in clinker/cement plants 441
3. Evaluation of the daily mean values 3.1 Annual mean values
The annual mean values are compiled in Table 1 and Table 2. Table 1: Annual mean values for dust, SO2, NOx, Hg and CO
Dust SO2 NOx Hg CO [mg/Nm3] [mg/Nm3] [mg/Nm3] [µg/Nm3] [mg/Nm3]
2008 7.5 179.8 278.8 15.7 961.6
2009 7.4 145.6 264.1 16.6 853.3
2010 6.3 151.5 231.7 16.9 435.8
Table 2: Annual mean values for waste gas flow, moisture, oxygen content and temperature of the waste gas
Waste gas
flow Moisture O2 Temperature
[Nm3/h] [volume %] [volume %] [°C]
2008 219599 20.1 8.5 151.3
2009 221198 18.6 8.8 156.7
2010 226578 19.1 9.0 156.2
3.2 Dust
The measured annual mean values are about 7 mg/Nm3.
3.3 Nitrogen oxides (NOx) The annual mean values are 269.8 (2008), 227.6 (2009) und 197.1 mg/Nm3 (2010). These
relatively low emissions are achieved by means of a SNCR plant. Figure 1 shows the NOx emission curve for the time period 2008 – 2010. In 2008 and 2009, the emissions varied more than in 2010. This suggests that a more efficient adjustment control, usually based on the continuous NOx monitoring, was implemented. Probably as a consequence of that, the NOx emissions are about 10 % lower.

Annexes
442 State of the art of the co-incineration of waste-derived fuels and raw materials in clinker/cement plants
Figure 1: Daily mean values for NOx emissions from 2008 – 2010
3.4 Sulphur dioxide (SO2)
The annual mean values are 179.89 (2008), 145.6 (2009) und 151.5 mg/Nm3 (2010). The SO2 emissions are abated by dosing calcium hydroxide (Ca(OH)2). In the environmental report 2010, the operator stated: The sulphur dioxide emissions mainly depend on the input of sulphur-containing raw materials. The sulphur concentration of the raw materials strongly vary according to the actual geological situation. The emission limit value can be complied with by adding calcium hydroxide.
Figure 2: Daily mean values for SO2 emissions from 2008 – 2010
0
50
100
150
200
250
300
350
400N
Ox
in [
mg/
Nm
3]

Annexes
State of the art of the co-incineration of waste-derived fuels and raw materials in clinker/cement plants 443
It has to be noted that the plant is equipped with a chlorine bypass. This means that some SO2 is also emitted via this route. In case the waste gas from the chlorine bypass is also emitted via the main stack, it contributes to the monitored SO2 emissions.
3.5 Carbon monoxide (CO) and organic compounds (VOC) The annual mean values for CO are below 1000 mg/Nm3; in 2010, a significant reduction was observed. The annual mean value in this year was about half the values of 2008 and 2009. It can be expected that the major part is released from organic compounds in the raw material. The content of organic compounds can vary like the content of volatile sulphur compounds. It seems that the part of CO resulting from incomplete combustion is very low. The parameter VOC is not monitored. Due to its correlation with CO, it can be expected that the major part is also released from the raw materials.
3.6 Mercury (Hg) All the annual mean values for the time period 2008 – 2010 are close to16 µg/Nm3. The mercury emission usually depends on the waste gas temperature This cannot be demonstrated with the available data (Figure 3). It is possible (but not confirmed for the given case) that during the direct operation mode (almost) all the filter dust is discarded which is associated with significantly reduced Hg emissions. In this case, they are almost constant and their dependency on the waste gas temperature is no longer significant.
Figure 3: Waste gas temperature versus mercury emissions (on the basis of daily mean values)

Annexes
444 State of the art of the co-incineration of waste-derived fuels and raw materials in clinker/cement plants
3.7 Waste gas flow The mean values for the time period 2008 – 2010 for the waste gas flow and the oxygen content are:
Waste gas flow: 222‘500 [m3/h] (dry)
Oxygen: 8.8 [volume %]
With this mean value for the waste gas flow, the specific waste gas flow can be estimated for different clinker production quantities:
2850 t/d clinker production: 1.87 [m3/kg clinker]
3000 t/d clinker production: 1.78 [m3/kg clinker]
3150 t/d clinker production: 1.70 [m3/kg clinker]
At a typical heat demand in the kiln of between 3000 and 3300 kJ/kg clinker, the specific waste gas flow should be as follows:
Heat demand [kJ/kg clinker]
Spec. waste gas flow at 8.8 volume % O2 [m3/kg clinker]
Spec. waste gas flow at 10 volume % O2 [m3/kg clinker]
3000 1.76 1.95
3100 1.80 2.00
3200 1.84 2.04
3300 1.88 2.09
As a consequence, it can be assumed that, most probably, the waste gas flow is related to the actual oxygen content and not to the reference oxygen content of 10 volume %.

Annexes
State of the art of the co-incineration of waste-derived fuels and raw materials in clinker/cement plants 445
10. Cement works of Südbayrisches Portland-Zementwerk Gebr. Wieshöck & Co. GmbH in Rohrdorf/Germany
Cement works of Südbayrisches Portland-Zementwerk Gebr.
Wieshöck & Co. GmbH in Rohrdorf/Germany
Evaluation of the daily mean values derived from continuous self-
monitoring (2008 – 2010)
1. Introduction
The results from continuous self-monitoring of emissions to air for the period 01.01.2008 - 31.12.2010 have been evaluated for the following parameters:
Dust [mg/Nm3]
Nitrogen oxides NOx [mg/Nm3]
Sulphur dioxide SO2 [mg/Nm3]
Carbon monoxide CO [mg/Nm3]
Mercury Hg [µg/Nm3]
Oxygen O2 [volume %]
Temperature [°C]
Moisture [volume %]
Waste gas flow [Nm3/h] Reference conditions:
The waste gas flow is related to norm conditions (0 °C, 1013 mbar) and to dry waste gas.
According to German provisions, all values refer to an oxygen content of 10 volume %. It is assumed that the provided data have been calculated in relation to this reference oxygen content.
2. Brief description of the plant
The available information is limited. The plant consists of a rotary kiln with a 4-stage cyclone preheater. The NOx emissions are abated by means of a SNCR plant, and the SO2 emissions by addition of calcium hydroxide.

Annexes
446 State of the art of the co-incineration of waste-derived fuels and raw materials in clinker/cement plants
3. Evaluation of the daily mean values 3.1 Annual mean values
The annual mean values are compiled in Table 1. Table 1: Annual mean values for dust, SO2, NOx, Hg and CO
Dust SO2 NOx Hg CO mg/Nm³ mg/Nm³ mg/Nm³ µg/Nm³ mg/Nm³
2008 1.8 46.1 305.1 3.8 735.5
2009 1.6 41.4 294.5 7.1 810.8
2010 1.1 63.7 294.3 10.4 1057.0
Table 2: Annual mean values for oxygen, temperature, waste gas flow and moisture
O2 Temperature Waste gas flow Moisture Volume % °C Nm³/h Volume %
2008 7,0 153,4 286863 23,0
2009 7,5 153,3 259251 22,0
2010 7,3 149,3 275488 21,4
3.2 Dust
The measured values are very low (see Table 1). In principle, dust values below about 10 mg/Nm3 can only be measured with scattered light dust monitors. Depending on the type and supplier, they have a detection limit of about 0.1 mg/Nm3. These monitors have to be calibrated with an extractive analytical method. The detection limit of such methods is significantly above 1 mg/Nm3. This means that the reported values do not provide exact values but indicate that the dust emissions are very low, probably below 3 – 5 mg/Nm3.
3.3 Nitrogen oxides (NOx) According to available information, „special lime“ is used as a waste-derived raw material
which results from the manufacture of fertilisers. It contains about 10 % graphite, ammonia and dicyandiamide.
This „special lime“ is fed to the kiln inlet in the form of a slurry and acts as a reducing agent (SNCR technique). Consequently, the NOx emissions are relatively low (Figure 1). The NOx adjustment control is not very precise as the curve is not curtailed.

Annexes
State of the art of the co-incineration of waste-derived fuels and raw materials in clinker/cement plants 447
Figure 1: Daily mean values for NOx emissions from 2008 – 2010
3.4 Sulphur dioxide (SO2)
The SO2 emissions are comparatively low. However, in 2010 they are 40 – 50 % higher than in 2008 and 2009 (Table 1). This increase cannot be explained by means of the available data and information. It could be that more sulphur was volatilized in the area of the preheater. This assumption is supported by the fact that the CO emissions also increased (see the emission curve in Figure 2) and the correlation of SO2 and CO (Figure 3).
Figure 2: Daily mean values for CO emissions from 2008 – 2010
0
100
200
300
400
500
600
700
01.0
1.2
008
01.0
3.2
008
01.0
5.2
008
01.0
7.2
008
01.0
9.2
008
01.1
1.2
008
01.0
1.2
009
01.0
3.2
009
01.0
5.2
009
01.0
7.2
009
01.0
9.2
009
01.1
1.2
009
01.0
1.2
010
01.0
3.2
010
01.0
5.2
010
01.0
7.2
010
01.0
9.2
010
01.1
1.2
010
NO
xin
[m
g/N
m3]
0
500
1000
1500
2000
2500
01.0
1.2
008
01.0
3.2
008
01.0
5.2
008
01.0
7.2
008
01.0
9.2
008
01.1
1.2
008
01.0
1.2
009
01.0
3.2
009
01.0
5.2
009
01.0
7.2
009
01.0
9.2
009
01.1
1.2
009
01.0
1.2
010
01.0
3.2
010
01.0
5.2
010
01.0
7.2
010
01.0
9.2
010
01.1
1.2
010
CO
in [
mg
/Nm
3]

Annexes
448 State of the art of the co-incineration of waste-derived fuels and raw materials in clinker/cement plants
Figure 3: Correlation between CO and SO2 (classified daily mean values)
3.5 Mercury (Hg)
The mercury emissions are at a low level. However, from the emission curve (Figure 4), it can be seen that the measured emission concentrations (daily mean values) significantly increase over time. The reasons for this development could be as follows:
Over the three years, the Hg monitor drifted towards higher values. The calibration of such monitors is not simple; often, it is not carried out for long periods. In the given case, it should be checked whether the monitor has been regularly calibrated.
With the assumption that the increase was not caused by a drift of the monitor, it can only be explained by an increase in the Hg input; this means that Hg input with the raw materials and fuels gradually increased.
Looking at the emission curve, it appears that the drift of the Hg monitor is more likely rather than a continuous increase in the Hg input. However, the latter possible reason cannot be excluded.
Figure 4: Increasing Hg daily mean values in the time period 2008 - 2010
0
10
20
30
40
50
60
70
0 500 1000 1500 2000
SO
2[m
g/N
m3]
CO [mg/Nm3]
0
10
20
30
40
50
01.01.2008 31.12.2008 31.12.2009 31.12.2010
Hg
[
g/N
m3]

Annexes
State of the art of the co-incineration of waste-derived fuels and raw materials in clinker/cement plants 449
11. Cement works of HeidelbergCement AG in Burglengenfeld/Germany
Cement works of HeidelbergCement AG
in Burglengenfeld/Germany
Evaluation of the daily mean values derived from continuous self-monitoring (2008 – 2010)
1. Introduction
The results from continuous self-monitoring of emissions to air for the period 01.01.2008 - 31.12.2010 have been evaluated for following parameters:
Dust [mg/Nm3]
Nitrogen oxides NOx [mg/Nm3]
Mercury Hg [µg/Nm3]
Reference conditions:
The waste gas flow is related to norm conditions (0 °C, 1013 mbar) and to dry waste gas.
According to German provisions, all values refer to an oxygen content of 10 volume %. It is assumed that the provided data have been calculated with relation to this reference oxygen content.
2. Brief description of the plant
The available information is very limited. The plant consists of two rotary kilns with cyclone preheaters. The NOx emissions are abated by means of a SNCR plant.
3. Evaluation of the daily mean values 3.1 Preliminary observations
The operator determines mean values for a percentage of waste-derived fuels of the rated thermal input of less than and more than 60 %. Only some of the mean values are daily mean values. This can be concluded from the fact that for certain days values are given for < 60 % and > 60 % fractions. For most of the values, it remains unclear for which time period they have been determined. The emission values have to be determined for a certain time period such as for a day. Thereby, it is required to define which mean values can still be considered as a daily main value and which not. A mean value for a time period of one hour certainly cannot be considered as a daily mean value whereas a value for a time period of 23 hours can be considered as a daily mean value.

Annexes
450 State of the art of the co-incineration of waste-derived fuels and raw materials in clinker/cement plants
Against this background, the following proposal can be made:
Usually, signals from emission monitors are summarised as half-hourly or hourly mean values. Such mean values can be considered to be valid where the measurement signal was available for at least 2/3 of the time and the kiln was in operation.
Example: A half-hourly mean value is valid if the measurement signal was available for at least 20 minutes.
From the half-hourly or hourly mean values, the daily mean values are derived. The 2/3-rule also applies; this means that the daily mean value is valid if there are at least 16 valid hourly and at least 32 valid half-hourly mean values respectively.
„Split emission limit values“ It seems that the operator has the understanding that there are split emission limit values (for certain percentages of waste-derived fuels of the rated thermal input); this is not stipulated in the operating permit issued on 08.10.2008. The German 17th Ordinance of the Federal Clean Air Act (version issued in 2003(33) regulates that different emission limit values shall apply for a percentage of waste-derived fuels of the rated thermal input of more than 60 %. It appears that the operator considered this regulation when dividing the monitoring results into the two aforementioned groups.
3.2 Annual mean values
The annual mean values are compiled in following Table 1 and Table 2. Table 1: Annual mean values of rotary kiln 2
Waste-derived Dust NOx Hg
fuel [percentage of the rated thermal
input] mg/Nm3 mg/Nm3 µg/Nm3
2008 < 60 5.0 464.1 15.9
> 60 5.1 313.9 18.1
2009 < 60 4.0 425.2 21.7
> 60 3.7 305.9 24.8
2010 < 60 4.7 419.4 22.4
> 60 4.8 319.9 23.0
(33) German 17th Ordinance of the Federal Clean Air Act on Plants for the Incineration of Wastes and Similar Combustible Materials, dated 14.08.2003, Federal Gazette I (2003), no 41, pp 1614

Annexes
State of the art of the co-incineration of waste-derived fuels and raw materials in clinker/cement plants 451
Table 2: Annual mean values of rotary kiln 3
Waste-derived Dust NOx Hg
fuel [percentage of the rated thermal
input] mg/Nm3 mg/Nm3 µg/Nm3
2008 < 60 0.3 446.0 10.0
> 60 0.4 319.7 8.8
2009 < 60 1.3 442.0 14.4
> 60 1.5 313.2 13.3
2010 < 60 0.3 439.8 16.8
> 60 0.4 322.7 15.7
3.3 Dust
Tables 1 and 2 indicate the expected results that the percentage of waste-derived fuels do not have an impact on dust emissions. The annual mean values are specifically low for kiln 3 and the question arises whether it is possible at all to measure such low concentrations with the dust monitor installed(34) and whether it can be calibrated at this low level. The European Standard for dust measurement (EN 13284-1)(35) refers to the following characteristics for the extractive measurement of dust concentrations in the range 2.6 – 6.4 mg/Nm3:
Detection limit: 0.3 mg/Nm3 (only filter)
Uncertainty: in the range of 1.8 - 4.0 mg/Nm3
Repeatability: in the range of 1.7 - 2.1 mg/Nm3
Reproducibility: in the range of 2.6 - 5.7 mg/Nm3
3.4 Nitrogen oxides (NOx) At first sight, there is the impression that the NOx emissions are lower at percentages above
60 % of waste-derived fuels of the rated thermal input. However, the NOx emissions are abated by means of a SNCR plant which can be clearly seen from the emission curve (curtailed curve in Figure 1). Thus, the different values are the consequence of different set points but not of the percentage of waste-derived fuels.
(34) A scattered light dust monitor is needed as a transmission dust monitor does only allow to reliably measure dust concentrations below 10 mg/Nm3.
(35) Stationary source emissions - Determination of low range mass concentration of dust - Part 1:
Manual gravimetric method (EN 13284-1:2001)

Annexes
452 State of the art of the co-incineration of waste-derived fuels and raw materials in clinker/cement plants
Figure 1: Daily mean values for NOx emissions in 2010 at a percentage of waste-derived fuels of the
rated thermal input of more than 60 % (daily mean values)
3.5 Mercury (Hg) The annual daily mean values in Tables 1 and 2 clearly show that, in the given case, the Hg
emissions are not influenced by the percentage of waste-derived fuels. 3 lower compared to kiln 2. This cannot be
explained with the available data and information. One reason could be that more mercury was discarded with the filter dust of kiln 3 due to lower waste gas temperatures in the direct operation mode.
0
100
200
300
400
500
600
01.01.2010 02.05.2010 31.08.2010 30.12.2010
NO
x[m
g/N
m3]

Annexes
State of the art of the co-incineration of waste-derived fuels and raw materials in clinker/cement plants 453
12. Cement works of Portland Zementwerke GmbH & Co. KG in Solnhofen/Germany
Cement works of Portland Zementwerke GmbH & Co. KG
in Solnhofen/Germany
Evaluation of the daily mean values derived from continuous self-monitoring (2008 – 2010)
1. Introduction
The results from continuous self-monitoring of emissions to air for the period 01.01.2008 - 31.12.2010 have been evaluated for the following parameters:
Dust [mg/Nm3]
Nitrogen oxides NOx [mg/Nm3]
Sulphur dioxide SO2 [mg/Nm3]
Carbon monoxide [mg/Nm3]
Mercury Hg [µg/Nm3]
Volatile organic compounds VOC [mg C/Nm3]
Oxygen O2 [volume %]
Temperature [°C]
Moisture [volume %]
Waste gas flow [Nm3/h]
Temperature [°C] Reference conditions:
The waste gas flow is related to norm conditions (0 °C, 1013 mbar) and to dry waste gas.
The reference oxygen content is not mentioned. According to German provisions, all values shall refer to an oxygen content of 10 volume %. It is assumed that the provided data have been calculated in relation to this reference oxygen content.

Annexes
454 State of the art of the co-incineration of waste-derived fuels and raw materials in clinker/cement plants
2. Brief description of the plant The available information is limited. The plant consists of a rotary kiln with a 4-stage cyclone preheater, a precalciner, and a chorine bypass. The permitted capacity is 1500 tonnes per day. For NOx abatement, the operator installed one of the world’s first Selective Catalytic Reduction (SCR) plants which went into operation in 2001 (Figure 1). In addition, there is also a SNCR plant. According to available information, the SCR has not been operated since 2005/2006. Figure 1: SCR plant of the cement works in Solnhofen(36)
3. Evaluation of the daily mean values 3.1 Reported daily mean values
The operator reports the daily mean values for the direct and compound operation mode. This does not seem to be in accordance with German and European regulations but may be a result of local agreements or stipulations. For instance, from 10.03. to 17.03.2010, the plant was in the direct and compound operating mode. The determined values for dust and NOx are compiled in Table 1. As there are values for both of the two operating modes, no daily mean values were determined to check the compliance with the emission limit value. Example: On 13.03.2010, the NOx value for the direct operating mode was 756 mg/Nm3 - significantly above the emission limit value of 500 mg/Nm3. In contrast, the determined value for the compound operating mode (432 mg/Nm3) was below the emission limit value. If the direct operating mode lasted 4 hours, the daily mean value would have met the emission limit value (486 mg/Nm3), if it lasted 6 hours, it would not have done so (513 mg/Nm3).
(36) http://www.dep.state.pa.us/dep/deputate/airwaste/aq/transport/comments/Lehigh_Attachment_Solnhofen.pdf and Kline, J., Is SCR Technology coming (back) to cement?, April 2013, http://www.slideshare.net/jporterkline/is-scr-technology-coming-back-to-cement

Annexes
State of the art of the co-incineration of waste-derived fuels and raw materials in clinker/cement plants 455
Table 1: Example for dust and NOx values for the compound and direct operating mode from March 2010
Dust NOx
[mg/Nm3] [mg/Nm3]
10.03.2010 Direct 11.3 214
Compound 3.9 385
11.03.2010 Direct 7.4 651
Compound 3.9 396
12.03.2010 Direct 6.2 552
Compound 4.8 433
13.03.2010 Direct 9.3 756
Compound 4.4 432
14.03.2010 Direct 11.5 496
Compound 4.3 428
15.03.2010 Direct 10.1 743
Compound 5.3 440
16.03.2010 Direct 12.5 418
Compound 6.6 432
17.03.2010 Direct 10.8 365
Compound 12.9 416
3.2 Annual mean values The annual mean values are compiled in the following Tables 2-5 for the direct and compound operating modes. Table 2: Annual mean values for dust, NOx, SO2, HCl, NH3 and Hg for the compound operating mode
Dust
[mg/Nm3] NOx
[mg/Nm3] SO2
[mg/Nm3] HCl
[mg/Nm3] NH3
[mg/Nm3] Hg
3]
2008 6.8 454.7 14.9 0.3 6.4 5.6
2009 2.1 448.3 21.0 0.5 5.6 7.8
2010 4.0 447.9 17.7 2.4 1.8 8.3
Table 3: Annual mean values for dust, NOx, SO2, HCl, NH3 and Hg for the direct operating mode
Dust [mg/Nm3]
NOx [mg/Nm3]
SO2
[mg/Nm3] HCl
[mg/Nm3] NH3
[mg/Nm3] Hg
3]
2008 16.1 666.4 18.3 0.3 104.8 5.6
2009 7.6 669.9 21.0 0.5 62.8 9.5
2010 11.2 658.0 18.5 2.1 41.5 11.5

Annexes
456 State of the art of the co-incineration of waste-derived fuels and raw materials in clinker/cement plants
Table 4: Annual mean values for VOC, CO, O2, moisture, waste gas flow and temperature for the compound operating mode
VOC [mg C/Nm3]
CO [mg/Nm3]
O2
[vol. %] Moisture [vol. %]
Waste gas flow [Nm3/h]
Temper. [°C]
2008 22.3 304.7 12.0 15.1 233229 99
2009 26.2 161.5 12.5 15.3 226786 100
2010 24.0 155.8 12.6 14.7 149582 111
Table 5: Annual mean values for VOC, CO, O2, moisture, waste gas flow and temperature for the direct
operating mode
VOC [mg C/Nm3]
CO [mg/Nm3]
O2
[vol. %] Moisture [vol. %]
Waste gas flow
[Nm3/h]
Temper. [°C]
2008 23.0 343.5 14.8 8.8 336100 105
2009 24.1 162.1 15.1 9.2 332016 109
2010 31.6 163.9 15.3 8.8 222360 112
3.3 Waste gas flow
The reported waste gas flow (Tables 4 and 5) do not refer to the reference oxygen content of 10 volume %. The use of these numbers for the calculation of emitted loads would result in incorrect figures. The reported waste gas flows and the ones referring to 10 volume % O2 are compiled in Table 6. Table 6: Waste gas flow
O2
Waste gas flow
Waste gas flow referred to 10 volume % O2
[volume %] [m3/h] [Nm3/h]
2008 Compound 12.0 233229 191485
Direct 14.8 336100 188279
2009 Compound 12.5 226786 175945
Direct 15.1 332016 177640
2010 Compound 12.6 149582 114624
Direct 15.3 222360 115574
For 2008 und 2009, the conversion provides a mean waste gas flow of about 183‘000 [Nm3/h]. However, with the permitted capacity of 1500 tonnes per day, the clinker-specific waste gas flow is around 3 Nm3/kg clinker which is still too high. For 2010, significantly lower waste gas flows are reported (Figure 2). The average value is about 115‘000 Nm3/h which corresponds with a specific value of 1.84 Nm3/kg clinker which is slightly too low. Consequently, there remain doubts concerning the accuracy of the reported waste gas flows.

Annexes
State of the art of the co-incineration of waste-derived fuels and raw materials in clinker/cement plants 457
Figure 2: Hourly mean values for the waste gas flow from 2008 – 2010
3.4 Dust The measured values vary strongly (Figure 3). The type of filter (bag filter or electrostatic precipitator) is not known. Consequently, the measured values cannot be interpreted.
Figure 3: Daily mean values for dust emissions from 2008 – 2010
3.5 Nitrogen oxides (NOx) The averages of the three available annual mean values (Tables 2 and 3) are 450 mg/Nm3
(compound operating mode) and 665 mg/Nm3 (direct operating mode). With the assumption that the compound operating mode occurs for about 75 % of the time, the emission limit value of 500 mg/Nm3 is presumably just met. This can be also concluded from the emission curve for the compound operating mode (Figure 4). It appears that the operator’s target is just to comply with the requirements but not to minimise the NOx emission as it could be possible by means of the aforementioned SCR plant (at least less than 200 mg/Nm3). However, this would be associated with higher operating costs.
0
50000
100000
150000
200000
250000
300000
01/01/2008 31/12/2008 31/12/2009 31/12/2010
Wa
ste
ga
s f
low
[N
m3/h
]
0
5
10
15
20
25
30
01/01/2008 31/12/2008 31/12/2009 31/12/2010
Du
st
[m
g/N
m3]

Annexes
458 State of the art of the co-incineration of waste-derived fuels and raw materials in clinker/cement plants
Figure 4: Daily mean values for NOx emissions from 2008 – 2010 for the compound
operating mode
3.6 Sulphur dioxide (SO2)
The annual mean values (Tables 2 and 3) are around or below 20 mg/Nm3. Consequently, the raw materials contain virtually no volatile sulphur.
3.7 Hydrogen chloride (HCl) The HCl emissions are very low. The annual mean value for 2010 (Tables 2 and 3) is slightly higher but still at a low level (about 2 mg/Nm3 compared to about 0.5 mg/Nm3 in 2008 and 2009). This increase could be caused by the chlorine bypass but could also be the result of a monitor drift.
3.8 Ammonia (NH3) It is notable that the ammonia emissions are very high in the direct operating mode (Table 7). Table 7: NH3 emissions (also mentioned in the Tables 2 and 3)
NH3 [mg/Nm3]
Compound Direct
2008 6.4 104.8
2009 5.6 62.8
2010 1.8 41.5
There are two input routes for ammonia: 1.) With the raw material 2.) As an agent for NOx abatement There are large quantities of ammonia in the system. During the compound operating mode, ammonia is absorbed by the raw meal to a large extent. Then, it is evaporated in the upper cyclones of the preheater and thus enriches between the preheater and the waste gas filter
0
100
200
300
400
500
600
700
01
.01
.20
08
01
.03
.20
08
01
.05
.20
08
01
.07
.20
08
01
.09
.20
08
01
.11
.20
08
01
.01
.20
09
01
.03
.20
09
01
.05
.20
09
01
.07
.20
09
01
.09
.20
09
01
.11
.20
09
01
.01
.20
10
01
.03
.20
10
01
.05
.20
10
01
.07
.20
10
01
.09
.20
10
01
.11
.20
10
NO
xin
[m
g/N
m3]

Annexes
State of the art of the co-incineration of waste-derived fuels and raw materials in clinker/cement plants 459
system. During the direct operating mode, the absence of adsorption results in high ammonia emissions. The SCR plant is positioned after the preheater (Figure 1) and could use the enriched ammonia for NOx abatement. But this does not seem to be case as the SNCR plant is used. It is of importance to determine the ammonia slip of this plant. In case its contribution is significant, the ammonia slip should be minimised. The elevated level of ammonia will lead to the formation ammonium chloride (NH4Cl) that forms an aerosol which, most probably, will be noticeable as a “(visible) plume” (opacity) from time to time.
3.9 Volatile organic compounds (VOC) About 90 % of the VOC values are between 20 and 30 mg C/Nm3. This indicates that the dominant source of VOC is the raw material.
3.10 Mercury (Hg) The annual mean values for mercury emissions are at a low level (< 10 mg/Nm3). The known dependency of the mercury emissions on the waste gas temperature is illustrated in Figure 5.
Figure 5: Correlation between the Hg emission and the waste gas temperature (classified daily
mean values)
0
2
4
6
8
10
12
60 80 100 120 140Temperature [°C]
Hg
[u
g/N
m3]
Compound
Direct

Annexes
460 State of the art of the co-incineration of waste-derived fuels and raw materials in clinker/cement plants
13. Cement works CEMEX-OST in Rüdersdorf/Germany
Cement works CEMEX-OST
in Rüdersdorf/Germany
Evaluation of the daily mean values derived from continuous self-monitoring (2008 – 2010)
1. Introduction
The results from continuous self-monitoring of emissions to air for the period 01.01.2008 - 31.12.2010 have been evaluated for the following parameters:
Dust [mg/Nm3]
Nitrogen oxides NOx [mg NO2/Nm3]
Sulphur dioxide SO2 [mg/Nm3]
Volatile organic compounds VOC [mg C/Nm3]
Mercury Hg [µg/Nm3]
Oxygen O2 [volume %]
Temperature T [°C] Reference conditions:
The waste gas flow is related to norm conditions (0 °C, 1013 mbar) and to dry waste gas.
According to German provisions, all values refer to an oxygen content of 10 vol.-%. It is assumed that the provided data have been calculated in relation to this reference oxygen content.
2. Brief description of the plant
The clinker is produced in a dry kiln with a 5-stage preheater and a fluidised bed pre-combustion chamber for the use of waste-derived fuels. Nitrogen oxides present in the waste gas are reduced by means of SNCR. Sulphur dioxide is abated by injection of lime (Ca(OH)2).

Annexes
State of the art of the co-incineration of waste-derived fuels and raw materials in clinker/cement plants 461
3. Evaluation of the daily mean values 3.1 Annual mean values
The annual mean values are compiled in following table. Table 1: Annual mean values
Dust SO2 NOx VOC Hg mg/Nm³ mg/Nm³ mg/Nm³ mg C/Nm³ µg/Nm³
2008 0.4 163.8 257.1 10.2 2.7
2009 0.4 218.0 316.4 12.0 4.2
2010 1.1 299.2 371.2 9.2 3.9
3.2 Dust
Only a limited number of daily mean values are available. From about 300 values per year, only 79 values are available for 2008, 144 values for 2009 and 245 values for 2010. The measured values are very low. Practically, it is not possible to reliably measure dust contents (values of around or below 1 mg/Nm3). For such low values, carefully calibrated light scatter dust measurement devices should be used with a limit of quantification of about 3 mg/Nm3.
3.3 Nitrogen oxides (NOx) The company operates a SNCR plant. Consequently, the NOx emission can be controlled, i.e.
the NOx emission-meet a certain target value (Figure 1). Compared to 2008 and 2009, the values are significantly higher in 2010. In 2009, the use of oxygen was initiated in order to improve the combustion efficiency. This could explain the higher values in 2010.
Figure 1: Daily mean values for NOx emissions from 2008 – 2010
0
100
200
300
400
500
600
700
800
900
1000
01.01.2008 31.12.2008 31.12.2009 31.12.2010
NO
x[m
g/N
m3]

Annexes
462 State of the art of the co-incineration of waste-derived fuels and raw materials in clinker/cement plants
3.4 Sulphur dioxide (SO2) In the cement works, dry lime is injected to the waste gas stream in order to abate sulphur dioxide emissions. The emissions are comparatively high. In 2010, it can be seen that the maximum emission is kept below 350 mg/Nm3 (Figure 2). It can be assumed that volatile sulphur compounds are present in the raw material, most probably in the form of pyrite/marcasite. These compounds are partly oxidised in the upper part of the preheater and thus sulphur dioxide is formed. From 2008 to 2010, the annual mean values increase significantly (see Table 1). The reason why is not known.
Figure 2: Daily mean values for SO2 emissions from 2008 – 2010
3.5 Volatile organic compounds (VOC) The VOC values are in the order of 10 mg C/Nm3 with a relative standard deviation of 27 % (Figure 3). Such VOC emissions predominantly results from the release of organic compounds from the raw meal in the preheater. It can be expected that the percentage from the co-incineration of waste-derived fuels is very low and can be neglected.
Figure 3: Daily mean values for VOC emissions from 2008 – 2010
0
50
100
150
200
250
300
350
400
450
500
01.01.2008 31.12.2008 31.12.2009 31.12.2010
SO
2[m
g/N
m3]
0
5
10
15
20
25
30
01.01.2008 31.12.2008 31.12.2009 31.12.2010
VO
C [
mg
C/N
m3]

Annexes
State of the art of the co-incineration of waste-derived fuels and raw materials in clinker/cement plants 463
3.6 Mercury (Hg) The relatively low values for mercury are in the range of 3 – 4 mg/Nm3. It is reported that the emission of mercury is minimised by absorption and bypass techniques. This means that the minimization of mercury emissions is also achieved by discarding filter dust. This is an efficient measure. Additional measures are to minimise the waste gas temperature and to apply adsorption or absorption (scrubber) techniques.
Figure 4: Daily mean values for Hg emissions from 2008 – 2010
0
5
10
15
20
25
30
35
01.01.2008 31.12.2008 31.12.2009 31.12.2010
Hg
[u
g/N
m3]

Annexes
464 State of the art of the co-incineration of waste-derived fuels and raw materials in clinker/cement plants
14. Cement works of the Dyckerhoff AG in Amöneburg/Germany
Cement works of the Dyckerhoff AG
in Amöneburg/Germany
Evaluation of the daily mean values derived from continuous self-monitoring (2008 – 2010)
1. Introduction
The results from continuous self-monitoring of emissions to air for the period 01.01.2008 - 31.12.2010 have been evaluated for the following parameters:
Dust [mg/Nm3]
Nitrogen oxides NOx [mg/Nm3]
Sulphur dioxide SO2 [mg/Nm3]
Carbon monoxide CO [mg/Nm3]
Oxygen O2 [volume %]
Temperature [°C]
Kiln feeding [t/h] Reference conditions:
The waste gas flow is related to norm conditions (0 °C, 1013 mbar) and to dry waste gas.
According to German provisions, all values refer to an oxygen content of 10 volume %. It is assumed that the provided data have been calculated in relation to this reference oxygen content.
2. Brief description of the plant
The available information is limited. White cement is produced in a rotary kiln with a cyclone preheater. White cement is Portland cement with a very low iron content. It is produced from raw materials with an iron oxide (Fe2O3) content of less than 0.1 weight-%. The production of white cement is much more laborious than grey cement. A major step to produce white cement and to avoid discolouration is the rapid cooling of the clinker leaving the kiln.

Annexes
State of the art of the co-incineration of waste-derived fuels and raw materials in clinker/cement plants 465
3. Evaluation of the daily mean values 3.1 Annual mean values
The annual mean values are compiled in Table 1 and Table 2. Table 1: Annual mean values for dust, SO2, NOx and CO
Dust SO2 NOx CO
[mg/m3] [mg/m3] [mg/m3] [mg/m3]
2008 10.6 14.4 355.1 897.2
2009 5.9 13.9 346.1 1233.6
2010 8.3 9.2 323.6 1316.9
Table 2: Annual mean values for the waste gas temperature, oxygen content and kiln feeding
Temperature O2 Kiln feeding
[°C] [Volume %] [t/h]
2008 151.1 12.0 45.3
2009 149.4 12.3 48.6
2010 149.1 12.7 48.0
3.2 Dust
Most of the daily mean values are below 10 mg/Nm3 but there are consistent malfunctions of the dust filter. From mid-2010, the dust values increased steadily which is also an indication of problems with the dust filter. These problems were solved at the end of 2010.
Figure 1: Daily mean values for dust emissions from 2008 – 2010
0
5
10
15
20
25
30
01.01.2008 31.12.2008 31.12.2009 31.12.2010
Du
st [m
g/N
m3]

Annexes
466 State of the art of the co-incineration of waste-derived fuels and raw materials in clinker/cement plants
3.3 Nitrogen oxides (NOx) The annual mean values for NOx emissions were between 320 and 360 mg/Nm3 (Table 1). The
emission curved is not curtailed which is an indication that the adjustment control was non-optimum (Figure 2).
Figure 2: Daily mean values for NOx emissions from 2008 – 2010 3.4 Sulphur dioxide (SO2) The SO2 emissions are usually below 30 mg/Nm3 (Figure 3). Cessation of the kiln feeding, due
start-ups and shut-downs, may be the reason for the few SO2 peaks.
Figure 3: Daily mean values for SO2 emissions from 2008 – 2010
There are also very low values. In these cases, most probably, the SO2 monitor did not work or
did not work properly. For instance, in the middle of August, October and November 2010, the measured values were around zero; at some times, no values were reported, perhaps because they were negative (Figure 4). From mid-December onwards, the monitor again indicated values around 10 mg/Nm3.
0
100
200
300
400
500
600
700
800
01.01.2008 31.12.2008 31.12.2009 31.12.2010
NO
x[m
g/N
m3]
0
10
20
30
40
50
60
01.01.2008 31.12.2008 31.12.2009 31.12.2010
SO
2[m
g/N
m3]

Annexes
State of the art of the co-incineration of waste-derived fuels and raw materials in clinker/cement plants 467
Figure 4: Daily mean values for SO2 emissions in the second half of 2010
0
10
20
30
40
50
60
01.06.2010 31.07.2010 29.09.2010 28.11.2010
SO
2[m
g/N
m3]

Annexes
468 State of the art of the co-incineration of waste-derived fuels and raw materials in clinker/cement plants
15. Cement works of the Zement- und Kalkwerke Otterbein GmbH & Co. KG in Großenlüders-Müs/Germany
Cement works of the Zement- und Kalkwerke
Otterbein GmbH & Co. KG in Großenlüders-Müs/Germany
Evaluation of the daily mean values derived from continuous self-
monitoring (2008 – 2010)
1. Introduction
The results from continuous self-monitoring of emissions to air for the period 01.01.2008 - 31.12.2010 have been evaluated for the following parameters:
Dust [mg/Nm3]
Nitrogen oxides NOx [mg/Nm3]
Sulphur dioxide SO2 [mg/Nm3]
Carbon monoxide CO [mg/Nm3]
Mercury Hg [µg/Nm3]
Oxygen O2 [volume %]
Temperature [°C]
Waste gas flow [Nm3/h] Reference conditions:
The waste gas flow is related to norm conditions (0 °C, 1013 mbar) and to dry waste gas.
According to German provisions, all values refer to an oxygen content of 10 volume %. It is assumed that the provided data have been calculated in relation to this reference oxygen content.
2. Brief description of the plant
The available information is very limited. The plant consists of a rotary kiln with a cyclone preheater.
3. Evaluation of the daily mean values 3.1 Analysis of the waste gas flow data
The annual mean values for the reported waste gas flows are around 80000 m3/h (Table 1). The waste gas flow does not relate to 10 volume % oxygen but is given for the actual oxygen content. Relating to 10 volume % oxygen results in smaller values. The specific waste gas flows, calculated with the smaller values, are in the correct order of magnitude.

Annexes
State of the art of the co-incineration of waste-derived fuels and raw materials in clinker/cement plants 469
Table 1: Annual mean values for the absolute waste gas flow (actual values and values related to 10 volume % O2) and the specific waste gas flow
Waste gas flow
O2
Waste gas flow at 10 volume %
O2
Specific waste gas flow
[m³/h] [volume %] [Nm³/h] [Nm³/kg clinker]
2008 79245 13.2 56330 2.09
2009 78617 13.6 52587 1.95
2010 81131 14.0 51485 1.91
Note:
In practice, it often happens that the actual waste gas flow is used to calculate the emission load. However, the flow related to 10 volume % O2 should be taken in order to obtain correct values. Example (annual mean values for 2008):
Wrong: Waste gas flow not related to 10 vol. % O2: 79245 [m3/h] NOx emission (Table 2): 419[mg/m3] Emission load (79245 x 416 / 1000000): 33.0 [kg/h]
Correct: Waste gas flow not related to 10 vol. % O2: 56330 [m3/h] NOx emission (Table 2): 419 [mg/m3] Emission load (56330 x 416 / 1000000): 23.4 [kg/h]
3.2 Annual mean values The annual mean values are compiled in Table 2. Table 2: Annual mean values for dust, SO2, NOx and CO
Dust SO2 NOx Hg CO mg/Nm³ mg/Nm³ mg/Nm³ µg/Nm³ mg/Nm³
2008 3.3 4.5 416 11.0 2352
2009 2.9 6.8 428 11.4 1454
2010 2.7 1.4 396 14.3 1572
3.3 Dust
In 2007, the electrostatic precipitator was replaced by a bag filter. Thus, the annual mean values are below 10 mg/Nm3.
3.4 Nitrogen oxides (NOx) The NOx emissions are abated by means of a SNCR plant which enables the reduction of the
annual mean NOx values to a level of about 400 mg/Nm3 (Table 2). The curtailed emission curve shows that the daily mean values of the NOx emissions are well maintained well below 500 mg/Nm3 (Figure 1).

Annexes
470 State of the art of the co-incineration of waste-derived fuels and raw materials in clinker/cement plants
Figure 1: Daily mean values for NOx emissions from 2008 – 2010
3.5 Sulphur dioxide (SO2)
It is noticeable that, especially for 2009 and 2010, the number of available values is very low (Table 3). Table 3: Number of available daily mean values
Dust SO2 NOx Hg CO
2008 315 233 316 315 316
2009 312 114 310 308 312
2010 333 165 333 331 333
It appears that the SO2 monitor often did not work or did not work properly. The measured values are very low (Table 2).
3.6 Carbon monoxide (CO) The annual mean values are 2352, 1454 und 1572 mg/m3 and thus comparatively high. It is concluded that this is the result of the use of waste-derived fuels, especially of fluff. According to the emission curve, the emission level was reduced in 2009 and 2010 (Figure 3).
0
100
200
300
400
500
600
NO
xin
[mg
/Nm
3]

Annexes
State of the art of the co-incineration of waste-derived fuels and raw materials in clinker/cement plants 471
Figure 3: Daily mean values for CO emissions from 2008 – 2010 The VOC emissions are not measured. As they correlate with the CO emissions, it can be expected that the VOC emissions, as for the CO emissions, are elevated due to the co-incineration of waste-derived fuels.
3.7 Mercury (Hg)
The annual mean values are between 10 and 15 µg/Nm3. The emission curve shows that the emissions fluctuate within a small range (Figure 2). This means that the Hg input with the raw materials and fuels is rather stable.
Figure 2: Daily mean values for Hg emissions from 2008 – 2010
0
500
1000
1500
2000
2500
3000
3500
4000
4500
CO
in [m
g/N
m3]
0
5
10
15
20
25
30
01
.01
.20
08
01
.03
.20
08
01
.05
.20
08
01
.07
.20
08
01
.09
.20
08
01
.11
.20
08
01
.01
.20
09
01
.03
.20
09
01
.05
.20
09
01
.07
.20
09
01
.09
.20
09
01
.11
.20
09
01
.01
.20
10
01
.03
.20
10
01
.05
.20
10
01
.07
.20
10
01
.09
.20
10
01
.11
.20
10
Hg
in [
µg
/Nm
3]

Annexes
472 State of the art of the co-incineration of waste-derived fuels and raw materials in clinker/cement plants
16. Cement works of Holcim(Deutschland) AG in Höver/Germany
Cement works of Holcim(Deutschland) AG
in Höver/Germany
Evaluation of the daily mean values derived from continuous self-monitoring (2008 – 2010)
1. Introduction
The results from continuous self-monitoring of emissions to air for the period 01.01.2008 - 31.12.2010 have been evaluated for the following parameters:
Dust [mg/Nm3]
Nitrogen oxides NOx [mg/Nm3]
Sulphur dioxide SO2 [mg/Nm3]
Carbon monoxide CO [mg/Nm3]
Volatile organic compounds VOC [mg C/Nm3]
Mercury Hg [µg/Nm3]
Hydrogen chloride HCl [mg/Nm3]
Temperature T [°C]
Oxygen O2 [volume %] Reference conditions:
The waste gas flow is related to norm conditions (0 °C, 1013 mbar) and to dry waste gas.
The reference oxygen content is not mentioned. According to German provisions, all values shall refer to an oxygen content of 10 volume %. It is assumed that the provided data have been calculated in relation to this reference oxygen content.

Annexes
State of the art of the co-incineration of waste-derived fuels and raw materials in clinker/cement plants 473
2. Brief description of the plant The available information is limited. The plant consists of a rotary plant with a 5-stage preheater and a chlorine bypass. The raw material for the works contains volatile sulphur compounds (presumably pyrite, marcasite). The resulting sulphur dioxide is reduced by addition of calcium hydroxide. The NOx emissions are abated by means of a SNCR plant.
3. Evaluation of the daily mean values 3.1 Annual mean values
The annual mean values are compiled in the following table. Table 1: Annual mean values
Dust NOx SO2 CO VOC Hg HCl
mg/Nm³ mg/Nm³ mg/Nm³ mg/Nm³ mg/Nm³ µg/Nm³ mg/Nm³
2008 0.7 361.0 359.5 701.2 20.1 15.0 9.9
2009 1.2 273.7 294.4 846.0 19.3 8.4 10.9
2010 0.7 251.3 243.3 1010.7 22.2 5.7 7.3
3.2 Dust
The number of dust values is surprisingly low. For 2008, there are only 57, for 2009 118 values and for 2010 258 values; for one year, there should be at least 300 values. This means that the availability of the dust monitor is significantly lower than the 90 % which should be achieved. The measured values are very low (see Table 1). In principle, dust values below about 10 mg/Nm3 can only be measured with scattered light dust monitors. Depending on the type and supplier, they have a detection limit of about 0.1 mg/Nm3. These monitors have to be calibrated with an extractive analytical method. The detection limit of such methods is significantly above 1 mg/Nm3. This means that the reported values do not provide exact values but indicate that the dust emissions are very low, probably below 3 – 5 mg/Nm3.
3.3 Nitrogen oxides (NOx) The NOx emissions are abated by means of a SNCR plant. An emission abatement threshold
level can be determined for the NOx emissions can be determined. This is the case as it can be seen from the curtailed emission curve (Figure 1). Except a few outliers, the NOx concentration is kept well below 400 mg/Nm3. In 2009 and 2010, the emission level is significantly lower. It seems that the set point has been reduced. This can be also seen from the annual mean values in Table 1.

Annexes
474 State of the art of the co-incineration of waste-derived fuels and raw materials in clinker/cement plants
Figure 1: Daily mean values for NOx emissions from 2008 – 2010
3.4 Sulphur dioxide (SO2) In Höver, the raw material contains volatile sulphur compounds, presumably pyrite and/or marcasite. These compounds are oxidised in the upper part of the preheater. Already in the early eighties, the emission of sulphur dioxide was abated to a certain level by dosing with calcium hydroxide. This technique is still applied. The emission curve shows that the adjustment to a specified emission level is more difficult compared with the abatement of NOx emissions as the curve is less curtailed (Figure 2). As for NOx, it seems that the specified threshold for SO2 emission abatement was also reduced in 2009 and 2010.
Figure 2: Daily mean values for SO2 emissions from 2008 – 2010
0
200
400
600
800
1000
1200
1400
1600
NO
xin
[mg
/Nm
3]
0
100
200
300
400
500
600
700
800
900
1000
01
.01
.20
08
01
.03
.20
08
01
.05
.20
08
01
.07
.20
08
01
.09
.20
08
01
.11
.20
08
01
.01
.20
09
01
.03
.20
09
01
.05
.20
09
01
.07
.20
09
01
.09
.20
09
01
.11
.20
09
01
.01
.20
10
01
.03
.20
10
01
.05
.20
10
01
.07
.20
10
01
.09
.20
10
01
.11
.20
10
SO2
in [
mg
/Nm
3]

Annexes
State of the art of the co-incineration of waste-derived fuels and raw materials in clinker/cement plants 475
3.5 Carbon monoxide (CO) and volatile organic compounds (VOC) The CO emissions strongly vary and the annual mean values significantly increased from 2008 to 2010 (Table 2). Table 2: Annual mean values for CO and VOC emissions, and the standard deviation and the maximum
values for CO
CO [mg/Nm3]
VOC [mg C/Nm3]
Mean value Standard dev. Maximum Mean value
2008 701.2 608.8 4093.0 20.1
2009 846.0 580.3 3397.0 19.3
2010 1010.7 611.1 3643.0 22.2
The emission curve indicates changing operating conditions. In 2008 and 2009, there were two long periods (several months) where the emission level was at a stable and low level (Figure 3). From the middle of 2009 onwards, the emissions varied much more at a significantly higher level. This cannot be fully explained with the available information and data. In Höver, waste tyres are co-incinerated in the secondary firing and it seems that there is certain overfeeding as the CO emissions are at a relatively high level and vary considerably. The co-incineration of waste tyres is associated with reducing conditions and the formation of CO which cannot be completely oxidised in the preheater.
Figure 3: Daily mean values for CO emissions from 2008 – 2010
As expected, the emission curve for VOC looks similar (Figure 4) as there is a correlation between CO and VOC.
0
500
1000
1500
2000
2500
3000
3500
4000
4500
01
.01
.20
08
01
.03
.20
08
01
.05
.20
08
01
.07
.20
08
01
.09
.20
08
01
.11
.20
08
01
.01
.20
09
01
.03
.20
09
01
.05
.20
09
01
.07
.20
09
01
.09
.20
09
01
.11
.20
09
01
.01
.20
10
01
.03
.20
10
01
.05
.20
10
01
.07
.20
10
01
.09
.20
10
01
.11
.20
10
CO
in [m
g/N
m3]

Annexes
476 State of the art of the co-incineration of waste-derived fuels and raw materials in clinker/cement plants
Figure 4: Daily mean values for VOC emissions from 2008 – 2010
The explanation could be that the incomplete combustion during secondary firing is associated with an increase in CO and VOC emissions. Figure 5 shows the correlation by means of classified daily mean values.
Figure 5: Correlation between CO and VOC (classified daily mean values from 2010)
When feeding adequate quantities of waste tyres, the CO concentration is below about 1000 mg/Nm3 and the VOC emission around 20 mg C/Nm3. These emissions primarily originate from the raw materials. The organic compounds which are released from the waste tyres are mainly oxidised in the lower part of the preheater. So, the percentage of VOC stemming from the tyres is low being in the range of about 1 – 2 mg C/Nm3. At elevated CO concentrations (higher than 1000 mg/Nm3), the oxidation of CO as well as of organic compounds is incomplete and their concentrations increase (Figure 5). It can be expected that the additional organic compounds also contain a considerable percentage of benzene.
0
5
10
15
20
25
30
35
40
45
50
01
.01
.20
08
01
.03
.20
08
01
.05
.20
08
01
.07
.20
08
01
.09
.20
08
01
.11
.20
08
01
.01
.20
09
01
.03
.20
09
01
.05
.20
09
01
.07
.20
09
01
.09
.20
09
01
.11
.20
09
01
.01
.20
10
01
.03
.20
10
01
.05
.20
10
01
.07
.20
10
01
.09
.20
10
01
.11
.20
10
VO
C in
[mg
C/N
m3]
0,0
10,0
20,0
30,0
40,0
0 500 1000 1500 2000 2500
VO
C [m
g C
/Nm
3]
CO [mg/Nm3]

Annexes
State of the art of the co-incineration of waste-derived fuels and raw materials in clinker/cement plants 477
3.6 Hydrogen chloride (HCl) In Höver, the raw material contains high chloride contents. Therefore, the cement works had to install a chlorine bypass from the very beginning. The dust removed from this bypass cannot be added to the cement as the chloride limit would be exceeded. So, the filter dust is transported to another cement works with a different raw material quality and is added to the clinker for cement formulation. The gas from the chlorine bypass (after removal of the dust in a bag filter) is discharged via the main chimney which is used for the emission of the kiln waste gas. Thus, the HCl concentration is significantly higher compared to most other cement works. The annual mean values are between 7 and 11 mg/Nm3 (Table 1).
3.7 Mercury (Hg)
The annual mean values are between 5.7 and 15 µg/Nm3 (Tables 1 and 3). However, the high outliers are striking, particularly in 2008 (Figure 6). Table 3: Hg values in [µg/Nm3]
Hg 2008 2009 2010
Number of values 300 296 273
Mean value 15.0 8.4 5.7
Standard deviation 29.7 5.6 3.8
Maximum 339.0 54.0 51.0
Minimum 1.0 1.0 0.0
A typical case for such an outlier can be seen in Figure 6. On 22 April 2008, a daily mean value of 339 mg/Nm3 and a daily average temperature of 124 °C are reported. With a waste gas flow of 400000 Nm3/h, a load of about 135 g/h and about 3.3 kg/d, respectively, can be calculated. It appears that such loads are simply impossible as at such a relatively low temperature, most of the mercury is removed (estimation: approximately, three quarters) in the filter and only a small fraction is emitted. On that day (or on previous days), a huge input of mercury (more than 10 kg) must have occurred. Such a huge input should also be noticeable on the days after 22.04.2008. But the daily mean value on 23.04.2008 is normal (14 µg/Nm3). The reported average temperature for this day is 140 °C. As a consequence, it is assumed that the measurement was not correct. It is known that the continuous monitors indicate (permanently or for a period) inaccurate or wrong values. In Höver, there were difficulties with calibration of the Hg monitor in the direct operating mode and big differences between the reference method and the monitor installed were noticed.

Annexes
478 State of the art of the co-incineration of waste-derived fuels and raw materials in clinker/cement plants
Figure 6: Daily mean values for Hg emissions in 2010
0
50
100
150
200
250
300
350
400
01.04.2008 01.05.2008 31.05.2008 30.06.2008
Hg
[u
g/N
m3]

Annexes
State of the art of the co-incineration of waste-derived fuels and raw materials in clinker/cement plants 479
17. Cement works of HeidelbergCement AG in Hannover/Germany
Cement works of HeidelbergCement AG
in Hannover/Germany
Evaluation of the daily mean values derived from continuous self-monitoring (2008 – 2010)
1. Introduction
The results from continuous self-monitoring of emissions to air for the period 01.01.2008 - 31.12.2010 have been evaluated for the following parameters:
Dust [mg/Nm3]
Nitrogen oxides NOx [mg/Nm3]
Sulphur dioxide SO2 [mg/Nm3]
Carbon monoxide CO [mg/Nm3]
Mercury Hg [µg/Nm3]
Oxygen O2 [volume %] Reference conditions:
The waste gas flow is related to norm conditions (0 °C, 1013 mbar) and to dry waste gas.
According to German provisions, all values refer to an oxygen content of 10 volume %. It is assumed that the provided data have been calculated in relation to this reference oxygen content.
2. Brief description of the plant
The available information is limited. The plant consists of a rotary kiln with a 4-stage cyclone preheater and a precalciner (Figure 1).
Figure 1: Scheme of the cement works of HeidelbergCement AG in Hannover The dust emissions are abated by means of an electrostatic precipitator, the NOx emissions by means of a SNCR plant and the SO2 emissions by addition of calcium hydroxide.
limestone
blending bed
sand/ore
drying andgrinding
Rawmealsilo
dedusting
cyclone preheater
precalciner
rotary kiln
clinker
coal coal grinding

Annexes
480 State of the art of the co-incineration of waste-derived fuels and raw materials in clinker/cement plants
3. Evaluation of the daily mean values 3.1 Annual mean values
The annual mean values are compiled in Table 1. Table 1: Annual mean values for dust, SO2, NOx, Hg and CO
Dust NOx SO2 Hg CO O2
[mg/Nm3] [mg/Nm3] [mg/Nm3] [µg/Nm3] [mg/Nm3] [volume %]
2008 13.9 426.7 368.3 11.6 240.5 12.1
2009 11.2 453.3 367.3 13.1 284.4 12.6
2010 15.2 424.9 361.7 8.9 256.4 13.1
3.2 Dust
The annual mean values for dust emissions are 13.9 (2008), 11.2 (2009) und 15.2 mg/Nm3 (2010). They are abated by means of an electrostatic precipitator. The achieved level is low but, compared with levels achievable with bag filters, an order of magnitude higher. In the first half of 2009, the emissions were much lower (Figure 2). This cannot be explained with the available information and data.
Figure 2: Daily mean values for dust emissions from 2008 to 2010
0
5
10
15
20
25
30
35
40
01.01.2008 31.12.2008 31.12.2009 31.12.2010
Du
st [m
g/N
m3]

Annexes
State of the art of the co-incineration of waste-derived fuels and raw materials in clinker/cement plants 481
3.3 Nitrogen oxides (NOx) The NOx emissions are abated by means of a SNCR plant. They are well adjusted to a level
below 500 mg/Nm3 as the curtailed emission curves clearly indicates (Figure 3). However, in 2009, there were some peaks up to 800 and 1000 mg/Nm3 which may indicate a problem with the SNCR plant.
Figure 3: Daily mean values for NOx emissions from 2008 to 2010
3.4 Sulphur dioxide (SO2) The environmental report for 2010 points out the following:
Cement clinker is produced from marl which is sourced from an open cast mine. Usually, the major part of sulphur contained in the marl is incorporated into the product and forms an important component with respect to the cement properties. However, if the sulphur in the marl occurs in the form of pyrite, the process is associated with SO2 emissions. During the installed dry additive process, calcium hydroxide is added to enable the meeting of the prescribed emission limit value.
Figure 4 shows the results of this abatement technique. Most of the time, the emission limit value of 400 mg/Nm3 is met. However, until April 2010, the limit was exceeded repeatedly.
Figure 4: Daily mean values for SO2 emissions from 2008 to 2010
0
200
400
600
800
1000
1200
01.01.2008 31.12.2008 31.12.2009 31.12.2010
NO
x[m
g/N
m3]
0
100
200
300
400
500
600
700
01.01.2008 31.12.2008 31.12.2009 31.12.2010
SO
2[m
g/N
m3]

Annexes
482 State of the art of the co-incineration of waste-derived fuels and raw materials in clinker/cement plants
In Table 2, the weekdays on which the limit was significantly exceeded (values higher than 420 mg/Nm3) are compiled. Table 2: Number of values higher than 420 mg/Nm3 for the different weekdays from 2008 - 2010
Sunday 12
Monday 12
Tuesday 4
Wednesday 3
Thursday 5
Friday 2
Saturday 2
. Noticeably many exceedenaces were detected on Sundays and Mondays. It is assumed that on certain weekends, the calcium hydroxide was short in supply and the added quantities were insufficient. Then, on Monday, addional calcium hydroxide was ordered and the limit could be met again. Whether this observation is due to insufficient silo capacity or inadequate management cannot be concluded.
3.5 Mercury (Hg) The annual mean values are 11.6 (2208), 13.8 (2009) und 8.9 µg/Nm3 (2010). The daily mean values vary strongly from very low values (< 5 – 10 µg/Nm3) up to about 40 µg/Nm3 and there are also peaks up to 90 µg/Nm3 (Figure 5). Very low values occur in the compound and high in the direct operating mode.
Figure 5: Daily mean values for Hg emissions from 2008 to 2010
Considering the number of daily mean values, it is striking that there are no values for more than 200 days (22.2 %) (Figure 6). Probably, negative values were determined and subsequently excluded.
0
10
20
30
40
50
60
70
80
90
100
01.01.2008 31.12.2008 31.12.2009 31.12.2010
Hg
[u
g/N
m3]

Annexes
State of the art of the co-incineration of waste-derived fuels and raw materials in clinker/cement plants 483
Figure 6: Percentage of the number of daily mean values for different classes concerning Hg
emissions from 2008 - 2010
It can be assumed that this problem is associated with the monitor which is not able to reliably measure low concentrations with sufficient accuracy. For such monitors, quality assurance checks could have detected for example an greater inaccuracy in the range of 3 – 4 µg/Nm3 as well as a drift at the zero point in the range of 0.5 – 1.0 µg/Nm3.
0 10 20 30 40
> 50
45 bis 50
40 bis 45
35 bis 40
30 bis 35
25 bis 30
20 bis 25
15 bis 20
10 bis 15
5 bis 10
< 5
no value
Percentage [%]

Annexes
484 State of the art of the co-incineration of waste-derived fuels and raw materials in clinker/cement plants
18. Cement works of Wittekind Hugo Miebach Söhne KG in Ewitte/Germany
Cement works of Wittekind Hugo Miebach Söhne KG
in Ewitte/Germany
Evaluation of the daily mean values derived from continuous self-monitoring (2008 – 2010)
1. Introduction
The results from continuous self-monitoring of emissions to air for the period 01.01.2008 - 31.12.2010 have been evaluated for following parameters:
Dust [mg/Nm3]
Nitrogen oxides NOx [mg NO2/Nm3]
Sulphur dioxide SO2 [mg/Nm3]
Mercury Hg [µg/Nm3] Reference conditions:
The waste gas flow is related to norm conditions (0 °C, 1013 mbar) and to dry waste gas.
According to German provisions, all values refer to an oxygen content of 10 vol.-%. It is assumed that the provided data have been calculated in relation to this reference oxygen content.
2. Brief description of the plant
The available information is very limited. The plant consists of a rotary kiln with a cyclone preheater and a precalciner.

Annexes
State of the art of the co-incineration of waste-derived fuels and raw materials in clinker/cement plants 485
3. Evaluation of the daily mean values 3.1 Annual mean values
The annual mean values are compiled in following table. Table 1: Annual mean values
Jahresmittel-wert
Dust SO2 NOx Hg
[mg/Nm3] [mg/Nm3] [mg/Nm3] [ug/Nm3]
2008 4.1 10.7 172.4 29.2
2009 3.7 9.7 164.3 20.5
2010 1.1 24.0 207.1 16.7
3.2 Dust
The dust emissions are at a low level. Whether the variations shown really did occur or whether there was a problem with the dust monitor cannot be concluded from the available data and information.
Figure 1: Daily mean values for dust emissions from 2008 - 2010
3.3 Nitrogen oxides (NOx) The NOx emissions are at a surprisingly very low level. The annual mean values were 172.4
(2008), 164.3 (2009) and 207.1 mg/Nm3 (2010). Such low levels can be only achieved with dedicated and carefully operated abatement techniques.
The emission curve does not indicate that a SNCR plant is operated as there is no curtailed curve indicating the control of the NOx emissions below a certain target value (Figure 2). However, it is possible that a constant quantity of ammonia is injected continuously, instead of controlling emissions to a certain level.
In principle, it is possible that stage combustion is practiced in the precalciner. Then, the very low values would be associated with elevated emissions of CO and VOC. This cannot be checked as no data for these parameters are available although they should be continuously monitored according to the permit.
0
1
2
3
4
5
6
7
8
9
10
01.01.2008 31.12.2008 31.12.2009 31.12.2010
Du
st [m
g/N
m3]

Annexes
486 State of the art of the co-incineration of waste-derived fuels and raw materials in clinker/cement plants
So, there are strong doubts concerning the very low NOx levels, especially in the second half of 2008 where values below 100 mg/Nm3 were determined. There is no technique available which can achieve such low concentrations. The available information and data does not allow a more detailed analysis.
Figure 2: Daily mean values for NOx emissions from 2008 – 2010
3.4 Sulphur dioxide (SO2)
The SO2 emissions are low, except two peaks in 2008 (Figure 3).
Figure 3: Daily mean values for SO2 emissions from 2008 – 2010
The increase in the SO2 emissions in 2010 cannot be explained by means of the available data and information. It is possible that the raw material has changed and that for instance a new component, such as an additive, contains more volatile sulphur compounds. However, it is also possible that there were problems with the SO2 monitor which, depending on the type and provider of the monitor, could have been operated close to its detection limit.
0
100
200
300
400
500
600
01.01.2008 31.12.2008 31.12.2009 31.12.2010
NO
x [m
g/N
m3]
0
10
20
30
40
50
60
70
80
90
100
01.01.2008 31.12.2008 31.12.2009 31.12.2010
SO
2[m
g/N
m3]

Annexes
State of the art of the co-incineration of waste-derived fuels and raw materials in clinker/cement plants 487
3.5 Mercury (Hg)
The mercury emissions show a decreasing trend over the three years. Whether the mercury input was reduced, the removal efficiency was increased (e.g. by reducing the waste gas temperature or by discarding more filter dust), or whether there was a problem with the mercury monitor cannot be concluded from the available information and data. There may be a link to the fact that from 01.01.2010 onwards, the emission limit value was reduced from 50 to 30 µg/Nm3.
Figure 4: Daily mean values for Hg emissions from 2008 – 2010
0
10
20
30
40
50
60
70
80
90
1000
1.0
1.2
00
8
01
.03
.20
08
01
.05
.20
08
01
.07
.20
08
01
.09
.20
08
01
.11
.20
08
01
.01
.20
09
01
.03
.20
09
01
.05
.20
09
01
.07
.20
09
01
.09
.20
09
01
.11
.20
09
01
.01
.20
10
01
.03
.20
10
01
.05
.20
10
01
.07
.20
10
01
.09
.20
10
01
.11
.20
10
Hg
in [
µg
/Nm
3]

Annexes
488 State of the art of the co-incineration of waste-derived fuels and raw materials in clinker/cement plants
19. Cement works of Seibel & Söhne GmbH & Co. KG in Ewitte/Germany
Cement works of Seibel & Söhne GmbH & Co. KG
in Ewitte/Germany
Evaluation of the daily mean values derived from continuous self-monitoring (2008 – 2010)
1. Introduction
The results from continuous self-monitoring of emissions to air for the period 01.01.2008 - 31.12.2010 have been evaluated for the following parameters:
Dust [mg/Nm3]
Nitrogen oxides NOx [mg NO2/Nm3]
Sulphur dioxide SO2 [mg/Nm3]
Mercury Hg [µg/Nm3] Reference conditions:
The waste gas flow is related to norm conditions (0 °C, 1013 mbar) and to dry waste gas.
According to German provisions, all values refer to an oxygen content of 10 vol.-%. It is assumed that the provided data have been calculated in relation to this reference oxygen content.
2. Brief description of the plant
The available information is very limited. The plant consists of three Lepol kilns.

Annexes
State of the art of the co-incineration of waste-derived fuels and raw materials in clinker/cement plants 489
3. Evaluation of the daily mean values 3.1 Annual mean values
The annual mean values are compiled in following table. Table 1: Annual mean values
Annual mean values
Dust SO2 NOx Hg
[mg/Nm3] [mg/Nm3] [mg/Nm3] [ug/Nm3]
2008 11.8 69.5 381.5 2009 11.5 76.8 357.5 3.8
2010 3.7 133.4 310.1 4.3
3.2 Dust
From 2008 – 2009, there were strong variations of the dust content (Figure 1). The level of the emissions indicates that an electrostatic precipitator was applied. Obviously, there were problems with its stable operation, assuming that the reported dust monitor values are accurate. From 2010 onwards, the dust emissions were significantly lower (below 5 mg/Nm3) and stable (Figure 1). Probably, the electrostatic precipitator had been replaced by a bag filter.
Figure 1: Daily mean values for dust emissions from 2008 - 2010
3.3 Nitrogen oxides (NOx) The annual mean values decreased over the years from 382 (2008) to 310 mg/Nm3 (2010). It
seems that additional measures were applied. From 2010 onwards, the emission curve looks more curtailed (Figure 2). The relation between NOx and SO2 emissions is explained below (see 3.4.2).
0
5
10
15
20
25
30
35
40
01.01.2008 31.12.2008 31.12.2009 31.12.2010
Du
st [m
g/N
m3]

Annexes
490 State of the art of the co-incineration of waste-derived fuels and raw materials in clinker/cement plants
Figure 2: Daily mean values for NOx emissions from 2008 - 2010
3.4 Sulphur dioxide (SO2)
3.4.1 Development of SO2 emissions
While the NOx emissions were reduced from 2010 onwards, the SO2 emissions significantly increased over this period (Figure 3). The relation of this observation is explained below.
Figure 3: Daily mean values for SO2 emissions from 2008 - 2010
0
100
200
300
400
500
600
700
800
900
01.01.2008 31.12.2008 31.12.2009 31.12.2010
NO
x[m
g/N
m3]
0
50
100
150
200
250
300
350
400
01.01.2008 31.12.2008 31.12.2009 31.12.2010
SO
2[m
g/N
m3]

Annexes
State of the art of the co-incineration of waste-derived fuels and raw materials in clinker/cement plants 491
3.4.2 Relation between SO2 and NOx emissions According to Figure 4, there is an inverse relationship between SO2 and NOx emissions.
However, this does not mean that the SO2 directly influenced the NOx emissions. Presumably, NOx is reduced by means of reducing conditions. At stronger reducing conditions, the CO concentration is higher and the NOx emissions lower. However, under these conditions, the incorporation of SO2 is reduced corresponding with higher SO2 emissions. Consequently, at higher NOx concentrations, corresponding with lower CO concentrations, the sulphur incorporation is higher and the SO2 emission concentrations lower, respectively. Conversely, at low NOx concentrations, corresponding with higher CO concentrations, the incorporation of sulphur is lower and the SO2 concentrations are higher. However, for very high SO2 concentrations, this relationship is absent (Figure 4).
Figure 4: Relation between SO2 and NOx (by means of classified daily mean values)
0
50
100
150
200
250
300
350
400
450
500
0 50 100 150 200 250 300 350 400
NO
x[m
g/N
m3]
SO2 [mg/Nm3]

Annexes
492 State of the art of the co-incineration of waste-derived fuels and raw materials in clinker/cement plants
3.5 Mercury (Hg) The measured mercury emissions are very low (below 6 µg/Nm3) (Figure 5). However, many values are not reported (Figure 5), probably due to problems with the mercury monitor. For 2008 and the first nine months of 2009, no Hg values were reported at all.
Figure 5: Daily mean values for Hg emissions from the second half of 2009 to 2010
0
1
2
3
4
5
6
7
01.06.2009 20.11.2009 11.05.2010 30.10.2010
Hg
[u
g/N
m3]

Annexes
State of the art of the co-incineration of waste-derived fuels and raw materials in clinker/cement plants 493
20. Cement works of Gebr. Seibel GmbH & Co. KG in Ewitte/Germany
Cement works of Gebr. Seibel GmbH & Co. KG
in Ewitte/Germany
Evaluation of the daily mean values derived from continuous self-monitoring (2008 – 2010)
1. Introduction
The results from continuous self-monitoring of emissions to air for the period 01.01.2008 - 31.12.2010 have been evaluated for the following parameters:
Nitrogen oxides NOx [mg NO2/Nm3]
Sulphur dioxide SO2 [mg/Nm3]
Mercury Hg [µg/Nm3] Reference conditions:
The waste gas flow is related to norm conditions (0 °C, 1013 mbar) and to dry waste gas.
According to German provisions, all values refer to an oxygen content of 10 volume %. It is assumed that the provided data have been calculated in relation to this reference oxygen content.
2. Brief description of the plant
The available information is very limited. The plant consists of a rotary kiln with a preheater and a precalciner.
The NOx emissions are abated by means of a SNCR plant.

Annexes
494 State of the art of the co-incineration of waste-derived fuels and raw materials in clinker/cement plants
3. Evaluation of the daily mean values Only three parameters were continuously monitored which does not comply with the requirements of the permit. 3.1 Annual mean values
The annual mean values are compiled in following table. Table 1: Annual mean values
Annual mean values
SO2 NOx Hg
[mg/Nm3] [mg/Nm3] [ug/Nm3]
2008 1.5 416.5 1.6
2009 1.8 381.7 5.4
2010 2.5 378.4 6.7
3.2 Dust
No results from dust monitoring are available for the time period 2008 – 2010.
3.3 Nitrogen oxides (NOx) The NOx emissions are abated by means of a SNCR plant which can be seen from the curtailed
emission curve (Figure 1). Thus, the NOx concentrations can be kept well below 500 mg/Nm3 except for a very few values.
Figure 1: Daily mean values for NOx emissions from 2008 - 2010
0
100
200
300
400
500
600
700
800
01.01.2008 31.12.2008 31.12.2009 31.12.2010
NO
x[m
g/N
m3]

Annexes
State of the art of the co-incineration of waste-derived fuels and raw materials in clinker/cement plants 495
3.4 Sulphur dioxide (SO2) The SO2 emissions are very low and are always below 10 mg/Nm3 (Figure 2).
Figure 2: Daily mean values for SO2 emissions from 2008 - 2010
3.5 Mercury (Hg)
The mercury emissions are very low. The annual value for 2008 is 1.6 µg/Nm3 and increased in 2009 (5.4 µg/Nm3) and 2010 (6.7 µg/Nm3) (Table 1 and Figure 4). Whether this increase really occurred or whether there was a problem with the Hg monitor cannot be evaluated with the available data and information.
Figure 4: Daily mean values for Hg emissions from 2008 - 2010
0
1
2
3
4
5
6
7
8
9
01.01.2008 31.12.2008 31.12.2009 31.12.2010
SO
2[m
g/N
m3]
0
5
10
15
20
25
30
35
40
01.01.2008 31.12.2008 31.12.2009 31.12.2010
Hg
[u
g/N
m3]

Annexes
496 State of the art of the co-incineration of waste-derived fuels and raw materials in clinker/cement plants
21. Cement works of Zement GmbH & Co. KG in Ewitte/Germany
Spenner Zement GmbH & Co. KG
In Ewitte/Germany
Evaluation of the daily mean values derived from continuous self-monitoring (2008 – 2010)
1. Introduction
The results from continuous self-monitoring of emissions to air for the period 01.01.2008 - 31.12.2010 have been evaluated for following parameters:
Dust [mg/Nm3]
Nitrogen oxides NOx [mg NO2/Nm3]
Sulphur dioxide SO2 [mg/Nm3]
Volatile organic compounds VOC [mg C/Nm3]
Carbon monoxide CO [mg/Nm3]
Mercury Hg [µg/Nm3]
Oxygen O2 [volume %]
Temperature T [°C] Reference conditions:
The waste gas flow is related to norm conditions (0 °C, 1013 mbar) and to dry waste gas.
According to German provisions, all values refer to an oxygen content of 10 vol.-%. It is assumed that the provided data have been calculated in relation to this reference oxygen content.
2. Brief description of the plant
There is a preheater kiln with a precalciner. The daily capacity is 3200 t/d. Since 2010, the NOx emissions are reduced by means of a SNCR plant.

Annexes
State of the art of the co-incineration of waste-derived fuels and raw materials in clinker/cement plants 497
3. Evaluation of the daily mean values 3.1 Annual mean values
The annual mean values are compiled in following table. Table 1: Annual mean values
Jahr Dust
[mg/Nm3] SO2
[mg/Nm3] NOx
[mg/Nm3] VOC
[mg C/Nm3] CO
[mg/Nm3] Hg
[ g/Nm3]
2008 12.6 22.9 6.5
2009 8.4 25.3 490.3 11.1 437.0 8.1
2010 6.5 6.3 445.6 12.7 841.6 4.7
Remark: For 2008 there are no values for NOx, VOC and CO 3.2 Dust
In 2008, the dust emissions are slightly higher (12.6 mg/Nm3) compared with 2009 and 2010. Probably, the dust filter had been improved.
Figure 1: Daily mean values for dust emissions from 2008 – 2010
0
5
10
15
20
25
30
35
40
01.01.2008 31.12.2008 31.12.2009 31.12.2010
Du
st [m
g/N
m3]

Annexes
498 State of the art of the co-incineration of waste-derived fuels and raw materials in clinker/cement plants
3.3 Nitrogen oxides (NOx) 3.3.1 Development of NOx emissions
There are no values for nitrogen oxides for 2008. It is not known whether the continuous monitoring was in operation or not. The emission curve clearly shows two different phases:
Until autumn 2009, the emissions vary considerably and are also slightly higher compared with the second phase. The emission curve is typical for a kiln which does not have a dedicated NOx abatement technique such as a SNCR plant
Since autumn 2009, the NOx emission has been abated by a SNCR plant. Consequently, the emission has been reduced by a certain level, down to about 450 mg/Nm3.This is demonstrated by a significantly less variable emission curve.
Figure 3: Daily mean values for NOx emissions from 2009 – 2010
3.3.2 Correlation between NOx and carbon monoxide (CO) Until autumn 2009 (without operating the SNCR plant), there is a correlation between the NOx and CO emission. At that time, the NOx emission was reduced by so-called „staged combustion“. This means that there were reducing conditions in the kiln inlet or in the lower part of the calciner respectively. As a consequence, nitrogen monoxide (NO) is reduced and NOx formation is reduced. So, there is a correlation of NOx with CO which can be seen in Figure 4.
0
100
200
300
400
500
600
700
800
01.01.2009 02.07.2009 31.12.2009 01.07.2010 30.12.2010
NO
x[m
g/m
3]

Annexes
State of the art of the co-incineration of waste-derived fuels and raw materials in clinker/cement plants 499
Figure 4: Correlation between NOx and CO in 2009
3.4 Sulphur dioxide (SO2)
The emissions vary considerably and in 2009, there are even negative values. i.e. there are values around the detection limit of the measurement device. According to the curve for NOx (see 3.3 above), it seems that in 2009, a SNCR plant went into operation. This could have influenced the SO2 emissions as it could be assumed that the extracted sampling waste gas is dried in a gas cooler where a condensation effect can occur. As a consequence, a surplus of ammonia (because of its addition for NOx reduction in the SNCR plant) can react with SO2 to form ammonium sulphate and thus significantly less SO2 is reaching the SO2 monitor. This could be an explanation for the lower SO2 concentrations since the middle of 2009. However, in the middle of 2008, there was already a period with low SO2values. Other effects such as problems with the SO2 monitor and measurement system could also be the reason for the lower values since middle of 2009.
Figure 2: Daily mean values for SO2 emissions from 2008 – 2010
0
100
200
300
400
500
600
700
0 200 400 600 800 1000
NO
x[m
g/N
m3]
CO [mg/Nm3]
0
20
40
60
80
100
120
140
01.01.2008 31.12.2008 31.12.2009 31.12.2010
SO
2[m
g/N
m3]

Annexes
500 State of the art of the co-incineration of waste-derived fuels and raw materials in clinker/cement plants
3.5 Volatile organic compounds (VOC) There are only values available for 2009 and 2010. It seems that the continuous self-monitoring was not carried out in 2008. Plotting the CO versus the VOC values, it is obvious that the VOC values do not exceed the value of 15 mg C/Nm3. Most probably, this is due to a too small measurement range; thus, signals higher than 15 mg C/Nm3 have been all taken as 15 mg C/Nm3-values. VOC is usually measured with a flame ionisation detector. The measurement range can be easily changed and thus adjusted. If the aforementioned assumption that the selected measurement range was too small is true, it is difficult to understand why this mistake was not detected.
Figure 5: Correlation between VOC and CO
3.6 Mercury (Hg)
The average emission of mercury is below 10 µg/Nm3. In addition to the normal variation, there were some peak values up to 50 µg/Nm3 observed.
Figure 6: Daily mean values for Hg emissions from 2008 – 2010
0
2
4
6
8
10
12
14
16
0 500 1000 1500 2000
VO
C [
mg
C/N
m3]
CO [mg/Nm3]
0
5
10
15
20
25
30
35
40
45
50
01.01.2008 31.12.2008 31.12.2009 31.12.2010
Hg
[m
g/N
m3]

Annexes
State of the art of the co-incineration of waste-derived fuels and raw materials in clinker/cement plants 501
22. Cement works of the Dyckerhoff AG in Geseke/Germany
Cement works of the Dyckerhoff AG
in Geseke/Germany
Evaluation of the daily mean values derived from continuous self-monitoring (2008 – 2010)
1. Introduction
The results from continuous self-monitoring of emissions to air for the period 01.01.2008 - 31.12.2010 have been evaluated for the following parameters:
Dust [mg/Nm3]
Nitrogen oxides NOx [mg/Nm3]
Sulphur dioxide SO2 [mg/Nm3]
Mercury Hg [µg/Nm3]
Carbon monoxide CO [mg/Nm3]
Volatile organic compounds VOC [mg C/Nm3] Reference conditions:
The waste gas flow is related to norm conditions (0 °C, 1013 mbar) and to dry waste gas.
According to German provisions, all values refer to an oxygen content of 10 volume %. It is assumed that the provided data have been calculated in relation to this reference oxygen content.
2. Brief description of the plant
The available information is very limited. The plant consists of a rotary kiln with a preheater and a precalciner. The NOx emissions are abated by means of a SNCR.

Annexes
502 State of the art of the co-incineration of waste-derived fuels and raw materials in clinker/cement plants
3. Evaluation of the daily mean values 3.1 Annual mean values
The annual mean values are compiled in following table. Table 1: Annual mean values
Dust SO2 NOx VOC CO Hg
[mg/Nm3] [mg/Nm3] [mg/Nm3] [mg C/Nm3] [mg/Nm3] [µg/Nm³]
2008 0.30 47.1 369.8 30.2 1566 15.8
2009 0.48 60.6 365.3 41.8 1066 16.3
2010 0.69 75.8 372.0 42.7 1200 13.4
3.2 Dust
The results of the validation test of an extractive dust measurement according to EN 3284-1 are as follows:
Detection limit: 0.3 mg/Nm3
Measurement at a mean dust concentration of 4.7 mg/Nm3
Repeatability: 1.7 mg/Nm3 (Maximum difference of the measurements carried out by the same team; confidence interval: 95 %)
The detection limit for scattered light dust monitors may be in the order of 0.1 mg/Nm3 and for transmission monitors, the detection limit is significantly higher. However, the problem with scattered light monitors is their calibration which cannot be carried out for dust concentrations below 3 mg/Nm3. The reported dust values are below 1 mg/Nm3 and are given with two decimal places. So, the question emerges whether the emissions are really very low or whether the dust monitor was correctly adjusted throughout the monitoring period. In case the emissions are really low, it is more accurate to report the dust values as ‘below 3 mg/Nm3’.
3.3 Nitrogen oxides (NOx) The annual mean values are 369.8 (2008), 365.3 (2009) und 372.0 mg/Nm3 (2010) (Table 1).
The emission curve is clearly curtailed which indicates that the abatement of the NOx emissions is carried out by means of a SNCR plant (Figure 1). With the exception of very few cases, the daily mean values are below 400 mg/Nm3 (Figure 1).

Annexes
State of the art of the co-incineration of waste-derived fuels and raw materials in clinker/cement plants 503
Figure 1: Daily mean values for NOx emissions from 2008 - 2010
3.4 Sulphur dioxide (SO2)
The annual mean values for the SO2 emissions are 47.1 (2008), 60.6 (2009) and 75.8 mg/Nm3 (2010) (Table 1). It appears that the raw material contains volatile sulphur compounds. Whether the fluctuations are only due to this content of volatile sulphur compounds or whether SO2 emissions also result from reactions in the area of the kiln inlet cannot be concluded from the available data and information.
Figure 2: Daily mean values for SO2 emissions from 2008 - 2010
0
100
200
300
400
500
600
700
01.01.2008 31.12.2008 31.12.2009 31.12.2010
NO
x[m
g/N
m3]
0
20
40
60
80
100
120
140
160
01.01.2008 31.12.2008 31.12.2009 31.12.2010
SO
2[m
g/N
m3]

Annexes
504 State of the art of the co-incineration of waste-derived fuels and raw materials in clinker/cement plants
3.5 Carbon monoxide (CO) In the time period 26 May 2009 and 12 September 2010, the reported CO emissions are relatively stable around 1000 mg/Nm3. Before and after this period, the measured concentrations are much higher up to 4000 mg/Nm3. From the available data and information, it was not possible to identify the reason for this observation. However, a reasonable explanation is that the co-incinerated wastes are not completely combusted leading to elevated CO concentrations in the waste gas.
Figure 3: Daily mean values for CO emissions from 2008 - 2010
3.6 Volatile organic compounds (VOC) The measurement of VOC started in autumn 2008. The annual mean value for 2009 is 41.8 and for 2010 42.2 mg C/Nm3 (Table 1). In the time period when the CO emissions were stable, the VOC concentrations varied strongly.
Figure 4: Daily mean values for VOC emissions from 2008 - 2010
0
500
1000
1500
2000
2500
3000
3500
4000
4500
01.01.2008 31.12.2008 31.12.2009 31.12.2010
CO
[m
g/N
m3]
0
10
20
30
40
50
60
70
80
90
100
01.01.2008 31.12.2008 31.12.2009 31.12.2010
VO
C [m
g C
/Nm
3]

Annexes
State of the art of the co-incineration of waste-derived fuels and raw materials in clinker/cement plants 505
3.7 Correlation between CO and VOC For the time period with stable CO emission concentrations, the correlation between CO and VOC is linear (Figure 5). There are two ways to explain this observation:
The VOC emissions from the raw material is in the range of 20 – 30 mg C/Nm3 and the release of CO from it is below 1000 mg/Nm3. Due to additional VOC and CO emissions during secondary firing (here from the precalciner), the values exceed the aforementioned range and level.
The content of organic compounds in the raw material varies and consequently, the release of VOC and CO from it also fluctuates. However, the variations appear to be too big. So, the first explanation seems to be more likely.
After a shutdown of the kiln from 23 October 2010 onwards, the correlation between CO and VOC is no longer visible. The VOC emissions remain at a constant level in the range of 40 – 50 mg C/Nm3, except for one outlier, whereas the weekly mean values for the CO emissions vary between 1000 and 2500 mg/Nm3. It can be assumed that there was a change of the raw material mix. For instance, fly ash could have been added; VOC is not emitted from fly ash but contains elementary carbon from which CO can be formed due to the Boudouard reaction.
Figure 5: Correlation between CO and VOC
3.8 Mercury (Hg)
The annual mean values for the Hg emissions are 15.8 (2008), 16.3 (2009) und 13.4 µg/Nm3 (2010) (Table 1). It appears that Hg mainly enters the system with the raw material as the variations of the Hg emissions are within a relatively small range (Figure 6).
0
10
20
30
40
50
60
70
80
0 500 1000 1500 2000 2500
VO
C [m
g C
/Nm
3]
CO [mg/Nm3]
26.05.2009 - 12.09.2010
23.10.2010 - 31.12.2010

Annexes
506 State of the art of the co-incineration of waste-derived fuels and raw materials in clinker/cement plants
Figure 6: Daily mean values for Hg emissions from 2008 – 2010
0
5
10
15
20
25
30
35
40
01.01.2008 31.12.2008 31.12.2009 31.12.2010
Hg
[u
g/N
m3]

Annexes
State of the art of the co-incineration of waste-derived fuels and raw materials in clinker/cement plants 507
23. Cement works of HeidelbergCement AG in Geseke/Germany
Cement works of HeidelbergCement AG
in Geseke/Germany
Evaluation of the daily mean values derived from continuous self-monitoring (2008 – 2010)
1. Introduction
The results from continuous self-monitoring of emissions to air for the period 01.01.2008 - 31.12.2010 have been evaluated for the following parameters:
Dust [mg/Nm3]
Nitrogen oxides NOx [mg/Nm3]
Sulphur dioxide SO2 [mg/Nm3] Reference conditions:
The waste gas flow is related to norm conditions (0 °C, 1013 mbar) and to dry waste gas.
According to German provisions, all values refer to an oxygen content of 10 volume %. It is assumed that the provided data have been calculated in relation to this reference oxygen content.
2. Brief description of the plant
The available information is very limited. The plant consists of a rotary kiln with a cyclone preheater. The NOx emissions are abated my means of a SNCR plant.

Annexes
508 State of the art of the co-incineration of waste-derived fuels and raw materials in clinker/cement plants
3. Evaluation of the daily mean values Only three parameters were continuously monitored which is not sufficient. 3.1 Annual mean values
The annual mean values are compiled in Table 1. Table 1: Annual mean values for dust, SO2 and NOx
Dust SO2 NOx [mg/Nm3] [mg/Nm3] [mg/Nm3]
2008 12.7 77.6 458.1
2009 11.7 17.1 424.1
2010 10.4 12.3 428.8
3.2 Dust
The annual mean values are 12.7 (2008), 11.7 (2009) and 10.4 mg/Nm3 (2010) (Table 1). The emissions curve shows that values do not vary strongly (Figure 1).
Figure 1: Daily mean values for dust emissions from 2008 - 2010
0,0
2,0
4,0
6,0
8,0
10,0
12,0
14,0
16,0
18,0
20,0
08
.01
.20
08
08
.03
.20
08
08
.05
.20
08
08
.07
.20
08
08
.09
.20
08
08
.11
.20
08
08
.01
.20
09
08
.03
.20
09
08
.05
.20
09
08
.07
.20
09
08
.09
.20
09
08
.11
.20
09
08
.01
.20
10
08
.03
.20
10
08
.05
.20
10
08
.07
.20
10
08
.09
.20
10
08
.11
.20
10
Du
st in
[mg
/Nm
3 ]

Annexes
State of the art of the co-incineration of waste-derived fuels and raw materials in clinker/cement plants 509
In the environmental report for 2010, the following is stated with respect to dust emissions: In 1994, a modern electrostatic precipitator was installed for the common abatement of dust emissions resulting from the kiln and the clinker cooler. Consequently, we comply with the current emissions limit value and a retrofit of the filter was not required when the emission limit value became more stringent in 2004.
Figure 2 shows that the emission limit value for dust was reduced from 50 to 20 mg/Nm3 and that it is complied with. It also indicates that there is a slight increase in the dust emissions from 2006 to 2010. This increase cannot be explained with the available data and information. The values again confirm that bag filters achieve significantly lower dust values than electrostatic precipitators.
.
Figure 2: Annual mean values for dust from 2001 – 2010 according to the environmental report 2010
3.3 Nitrogen oxides (NOx) The annual mean values are 458.1 (2008), 424.1 (2009) und 428.8 mg/Nm3 (2010) (Table 1).
The emission curve is curtailed and indicates that the NOx emissions are abated my means of SNCR (Figure 3). So, the NOx emissions are well kept below 500 mg/Nm3.
3.4 Sulphur dioxide (SO2)
The annual mean values are 77.6 (2008), 17.1 (2009) und 12.3 mg/Nm3 (2010) (Table 1). In 2008, the values were significantly higher compared to 2009 and 2010 (Figure 3). The company explained the variations as follows:
The SO2 emissions of rotary kilns for cement production are largely associated with the raw materials. These emissions can be minimised by means of an optimised operation of the kiln. However, variations occur depending on the sourced raw material.
It is possible that the content of volatile sulphur compounds sourced from a quarry is not constant and may vary, for instance, layer by layer. So, the explanation provided is by all means plausible.

Annexes
510 State of the art of the co-incineration of waste-derived fuels and raw materials in clinker/cement plants
Figure 3: Daily mean values for NOx and SO2 emissions from 2008 - 2010
0
50
100
150
200
250
300
0
100
200
300
400
500
600
01.01.2008 31.12.2008 31.12.2009 31.12.2010
SO
2[m
g/N
m3]
NO
x[m
g/N
m3]
NOx
SO2

Annexes
State of the art of the co-incineration of waste-derived fuels and raw materials in clinker/cement plants 511
24. Cement works of HeidelbergCement AG in Paderborn/Germany
Cement works of HeidelbergCement AG
in Paderborn/Germany
Evaluation of the daily mean values derived from continuous self-monitoring (2008 – 2010)
1. Introduction
The results from continuous self-monitoring of emissions to air for the period 01.01.2008 - 31.12.2010 have been evaluated for the following parameters:
Dust [mg/Nm3]
Nitrogen oxides NOx [mg/Nm3]
Sulphur dioxide SO2 [mg/Nm3]
Volatile organic compounds VOC [mg C/Nm3]
Mercury Hg [µg/Nm3] Reference conditions:
The waste gas flow is related to norm conditions (0 °C, 1013 mbar) and to dry waste gas.
According to German provisions, all values refer to an oxygen content of 10 volume %. It is assumed that the provided data have been calculated in relation to this reference oxygen content.
2. Brief description of the plant
The available information is very limited. The plant consists of a rotary kiln with a cyclone preheater. The NOx emissions are abated my means of a SNCR plant.

Annexes
512 State of the art of the co-incineration of waste-derived fuels and raw materials in clinker/cement plants
3. Evaluation of the daily mean values 3.1 Annual mean values
The annual mean values are compiled in Table 1. Table 1: Annual mean values
Dust NOx SO2 VOC Hg
[mg/Nm3] [mg/Nm3] [mg/Nm3] [mg C/Nm3] 3]
2008 (4.5) 335.7 30.5 13.5 24.0
2009 3.5 302.8 13.5 8.0 15.0
2010 3.8 306.5 5.6 13.5 11.7
3.2 Dust
The annual mean values are 4.5 (2008), 3.5 (2009) und 3.8 mg/Nm3 (2010) (Table 1). With the exception of a short period in 2008, the continuous dust monitoring started at the beginning of 2009.
Figure 1: Daily mean values for dust emissions from 2008 - 2010
The dust emissions in 2008 and at the beginning of 2009 were slightly higher compared with the other time periods. Either the monitor was calibrated in March 2009 or changes were made to the dust filter. From 2009 until about the middle of 2010, the dust emissions remained constant but then there was a drift towards slightly higher values. This increase cannot be explained with the available data and information.
0,0
1,0
2,0
3,0
4,0
5,0
6,0
7,0
01.01.2008 31.12.2008 31.12.2009 31.12.2010
Du
st [m
g/N
m3]

Annexes
State of the art of the co-incineration of waste-derived fuels and raw materials in clinker/cement plants 513
3.3 Nitrogen oxides (NOx) The NOx emissions are abated by means of a SNCR plant, as indicated by the curtailed emission
curve (Figure 2). With the exception of two values, all the daily mean values are below 500 mg/Nm3, most of them even below 400 mg/Nm3 (Figure 2)..
Figure 2: Daily mean values for NOx emissions from 2008 - 2010
3.4 Sulphur dioxide (SO2)
From spring 2009 onwards, the SO2 emissions were significantly lower compared with the period before (Figure 3). The environmental report 2010 states the following:
The SO2 emissions of rotary kilns for cement production are largely associated with the raw materials. These emissions can be minimised by means of an optimised operation of the kiln.
Figure 3: Daily mean values for SO2 emissions from 2008 - 2010
0
100
200
300
400
500
600
700
800
01.01.2008 31.12.2008 31.12.2009 31.12.2010
NO
x [m
g/N
m3]
0,0
10,0
20,0
30,0
40,0
50,0
60,0
70,0
80,0
01.01.2008 31.12.2008 31.12.2009 31.12.2010
SO
2[m
g/N
m3]

Annexes
514 State of the art of the co-incineration of waste-derived fuels and raw materials in clinker/cement plants
The raw material of this cement works contains very little or no volatile sulphur compounds. Consequently, the SO2 emissions are very low. Particularly noticeable is the change of the emission level at the end of 2009. From one day to another, the emission level decreased from a mean value of 35 mg/Nm3 down to about 5 mg/Nm3. This could have two reasons:
The already low content of volatile sulphur (about 0.01 weight-% as SO3) in the raw material suddenly decreased further as a consequence of exploring other layers in the quarry or because of the change of an addditive. However, this reason is rather unlikely.
The measured values declined as a consequence of the calibration of the SO2 monitor or a problem with the monitor.
3.5 Volatile organic compounds (VOC)
The VOC emissions are mainly in the range of about 10 – 20 mg C/Nm3. It is noticeable that there is a sudden decrease in the values between the end of April 2009 and the end of 2009 (Figure 4). At the same time, the SO2 values sharply decreased (Figure 3). In contrast to SO2, at the beginning of 2010, the measured values increased again to the “old” level. However, onother short slump happened in the middle of 2010. Most probably, these slumps were recorded due to problems with the monitor rather than due to changes of the raw materials.
Figure 4: Daily mean values for VOC emissions from 2008 - 2010
0,0
10,0
20,0
30,0
40,0
50,0
60,0
01.01.2008 31.12.2008 31.12.2009 31.12.2010
VO
C [m
g C
/Nm
3]

Annexes
State of the art of the co-incineration of waste-derived fuels and raw materials in clinker/cement plants 515
3.6 Mercury (Hg) 3 (2010) (Table 1). The
emissions continuously decreased from 2008 to 2010, except a couple of peak values in 2010 (Figure 5).
Figure 5: Daily mean values for Hg emissions from 2008 - 2010
The decrease in Hg emissions could be explained as follows:
There was a continuous decrease in the mercury input over time.
An increase in discarding of filter dust was practiced and thus, more mercury was removed from the system (e.g. discarding of filter dust during the direct operating mode). However, such changes are usually carried out at a certain date or a certain short time period and not over such a long time period.
There is a drift of the measurement results. It is not know which type of Hg monitor was used. However, the experience reveals that monitors equipped with a converter, which converts ionic mercury species into elementary mercury, show a loss of activity over time. As a consequence, they indicate declining values over time until they fianlly only measure and indicate the content of elementary mercury but not of ionic mercury species.
0,0
5,0
10,0
15,0
20,0
25,0
30,0
35,0
40,0
45,0
50,0
01.01.2008 31.12.2008 31.12.2009 31.12.2010
Hg
[u
g/N
m3]

Annexes
516 State of the art of the co-incineration of waste-derived fuels and raw materials in clinker/cement plants
25. Cement works of HeidelbergCement AG in Ennigerloh/Germany
Cement works of HeidelbergCement AG
in Ennigerloh/Germany
Evaluation of the daily mean values derived from continuous self-monitoring (2008 – 2010)
1. Introduction
The results from continuous self-monitoring of emissions to air for the period 01.01.2008 - 31.12.2010 have been evaluated for the following parameters:
Dust [mg/Nm3]
Nitrogen oxides NOx [mg/Nm3]
Sulphur dioxide SO2 [mg/Nm3]
Volatile organic compounds VOC [mg C/Nm3]
Mercury Hg [µg/Nm3]
Oxygen O2 [volume %]
Waste gas temperature [°C] Reference conditions:
The waste gas flow is related to norm conditions (0 °C, 1013 mbar) and to dry waste gas.
According to German provisions, all values refer to an oxygen content of 10 volume %. It is assumed that the provided data have been calculated in relation to this reference oxygen content.
2. Brief description of the plant
The available information is very limited. The plant consists of a rotary kiln with a cyclone preheater.

Annexes
State of the art of the co-incineration of waste-derived fuels and raw materials in clinker/cement plants 517
3. Evaluation of the daily mean values 3.1 Annual mean values
The annual mean values are compiled in Table 1. Table 1: Annual mean values
Dust NOx SO2 VOC Hg [mg/Nm3] [mg/Nm3] [mg/Nm3] [mg C/Nm3] [µg/Nm3]
2008 4.7 269.8 182.9 35.8 11.5
2009 7.0 227.6 156.4 11.4
2010 4.7 197.1 120.8 12.2
3.2 Dust
The annual mean values are 4.7 (2008), 7.0 (2009) and 4.7 mg/Nm3 (2010) (Table 1).
3.3 Nitrogen oxides (NOx) The annual mean values are 269.8 (2008), 227.6 (2009) und 197.1 mg/Nm3 (2010) (Table 1).
With the exception of a few values, the daily mean values are below 400 mg/Nm3, and in the second half of 2010 even below 300 mg/Nm3 (Figure 1). This is a relatively low level which can only be achieved by means of an abatement technique. Presumably, a SNCR plant is used. However, the control of the set emission concentration does not seem to be precise as the emission curve is not clearly curtailed (Figure 1).
Figure 1: Daily mean values for NOx emissions from 2008 - 2010
0
100
200
300
400
500
600
700
800
01
.01
.20
08
01
.03
.20
08
01
.05
.20
08
01
.07
.20
08
01
.09
.20
08
01
.11
.20
08
01
.01
.20
09
01
.03
.20
09
01
.05
.20
09
01
.07
.20
09
01
.09
.20
09
01
.11
.20
09
01
.01
.20
10
01
.03
.20
10
01
.05
.20
10
01
.07
.20
10
01
.09
.20
10
01
.11
.20
10
NO
xin
[mg
/Nm
3]

Annexes
518 State of the art of the co-incineration of waste-derived fuels and raw materials in clinker/cement plants
3.4 Sulphur dioxide (SO2) The annual mean values are 182.9 (2008), 156.4 (2009) and 120.8 mg/Nm3 (2010) (Table 1). This indicates a decreasing trend which can also be seen from the emission curve (Figure 2). Presumably, more calcium hydroxide has been added, or its addition has been optimised to achieve a higher reduction rate.
Figure 2: Daily mean values for SO2 emissions from 2008 - 2010
3.5 Volatile organic compounds (VOC) There are only values reported the first five months of 2008 reported. The decreasing values at the end of May 2008 may already be a consequence of problems with the VOC monitor.
Figure 3: Daily mean values for VOC emissions from January to June 2008
0
100
200
300
400
500
600
01.01.2008 31.12.2008 31.12.2009 31.12.2010
SO
2[m
g/N
m3]
0
10
20
30
40
50
60
01.01.2008 01.03.2008 30.04.2008
VO
C [m
g C
/Nm
3]

Annexes
State of the art of the co-incineration of waste-derived fuels and raw materials in clinker/cement plants 519
The mean value of the short available measurement period is 35.8 mg C/Nm3. The major part, or practically all, can be released from the raw meal. The impact of the secondary firing or the precalciner, if there is one, on VOC emissions cannot be evaluated with the available data and information.
3.6 Mercury (Hg) The annual mean values are around 12 µg/Nm3. With the exception of high temperatures (> 155°C), the mercury emissions do not depend on the waste gas temperature as it is usually the case (Figure 4). This cannot be explained with the available data and information. It is conceivable that all the filter dust is discarded in the direct operating mode (raw mill not in operation). Then, the mercury emissions are significantly lower in the direct operating mode and do not significantly depend on the waste gas temperature anymore.
Figure 4: Waste gas temperature versus Hg emissions (by means of classified daily mean
values)
0
5
10
15
20
25
110 120 130 140 150 160 170
Hg
[u
g/N
m3]
Waste gas temperature [ C]

Annexes
520 State of the art of the co-incineration of waste-derived fuels and raw materials in clinker/cement plants
26. Cement works of the Dyckerhoff AG in Lengerich/Germany
Cement works of the Dyckerhoff AG
in Lengerich/Germany
Evaluation of the daily mean values derived from continuous self-monitoring (2008 – 2010)
1. Introduction
The results from continuous self-monitoring of emissions to air for the period 01.01.2008 - 31.12.2010 have been evaluated for the following parameters:
Dust [mg/Nm3]
Nitrogen oxides NOx [mg/Nm3]
Sulphur dioxide SO2 [mg/Nm3]
Carbon monoxide CO [mg/Nm3]
Volatile organic compounds VOC [mg C/Nm3]
Mercury Hg [µg/Nm3]
Moisture [volume %]
Oxygen O2 [volume %]
Waste gas temperature [°C] Reference conditions:
The waste gas flow is related to norm conditions (0 °C, 1013 mbar) and to dry waste gas.
According to German provisions, all values refer to an oxygen content of 10 volume %. It is assumed that the provided data have been calculated in relation to this reference oxygen content.
2. Brief description of the plant
The available information is very limited. The plant consists of two rotary kilns with preheaters. They are called rotary kiln 8 and rotary kiln 4. Kiln 8 is bigger and also has a precalciner. It is not known whether the smaller kiln 4 is also equipped with a precalciner. The NOx emissions are abated by means of a SNCR.

Annexes
State of the art of the co-incineration of waste-derived fuels and raw materials in clinker/cement plants 521
3. Evaluation of the daily mean values of rotary kiln 8 3.1 Annual mean values
The annual mean values are compiled in the following tables. Table 1: Annual mean values for dust, SO2, NOx, VOC and CO
Dust SO2 NOx VOC CO [mg/Nm3] [mg/Nm3] [mg/Nm3] [mg C/Nm3] [mg/Nm3]
2008 1.4 131.6 265.8 12.5 693
2009 0.7 86.6 238.9 8.7 523
2010 1.2 20.3 216.4 3.6
Table 2: Annual mean values for Hg, moisture, oxygen, waste gas temperature and waste gas flow
Hg Moisture O2 T Waste gas flow 3] [vol. %] [vol. %] [°C] [Nm3/h]
2008 10.8 12.0 126 371859
2009 4.4 12.4 125 376462
2010 10.0 12.8 125 405249
3.2 Moisture
For 2008 and 2009, there are no values for moisture. For 2010, a constant value of 10 volume % is given.
3.3 Dust The measured values are very low (see Table 1). In principle, dust values below about 10 mg/Nm3 can only be measured with scattered light dust monitors. Depending on the type and supplier, they have a detection limit of about 0.1 mg/Nm3. These monitors have to be calibrated with an extractive analytical method. The detection limit of such methods is significantly above 1 mg/Nm3. This means that the reported values do not provide exact values but indicate that the dust emissions are very low, probably below 3 – 5 mg/Nm3.
3.4 Nitrogen oxides (NOx) The NOx emissions are abated by means of a SNCR plant. From 2009 to 2010, most of the daily
mean values are below 300 mg/Nm3 (Figure 1). Thus, the emission level is very low.

Annexes
522 State of the art of the co-incineration of waste-derived fuels and raw materials in clinker/cement plants
Figure 1: Daily mean values for NOx emissions from 2008 – 2010
3.5 Sulphur dioxide (SO2) From 2008 to 2010, the SO2 emissions decreased (Figure 2). At the end of 2008, the values are
suddenly lower. This cannot be explained with the available information and data. It is also possible that there was a problem with the SO2 monitor.
Between the end of 2009 and the beginning of 2010, the SO2 emissions decreased by about 90 mg/Nm3 down to a mean value of about 10 mg/Nm3. Provided the measurements are correct, this decrease must have been initiated by certain measures such as:
Change in the raw material, e.g. exchange of a certain component
Technical measures to reduce the SO2 emissions
The chlorine bypass was not used in 2010, in case the cement works has one.
Figure 2: Daily mean values for SO2 emissions from 2008 – 2010
0
100
200
300
400
500
600
01
.01
.20
08
01
.03
.20
08
01
.05
.20
08
01
.07
.20
08
01
.09
.20
08
01
.11
.20
08
01
.01
.20
09
01
.03
.20
09
01
.05
.20
09
01
.07
.20
09
01
.09
.20
09
01
.11
.20
09
01
.01
.20
10
01
.03
.20
10
01
.05
.20
10
01
.07
.20
10
01
.09
.20
10
01
.11
.20
10
NO
xin
[mg
/Nm
3]
0
50
100
150
200
250
300
01.01.2008 31.12.2008 31.12.2009 31.12.2010
SO
2[m
g/N
m3]

Annexes
State of the art of the co-incineration of waste-derived fuels and raw materials in clinker/cement plants 523
3.6 Volatile organic compounds (VOC) Values for carbon monoxide (CO) are only available for 2008 and 2009. The annual mean values are 693 (2008) and 523 mg/m3 (2009) (Table 1). It can be expected that these CO emissions result from the raw meal, released from natural organic compounds in the preheater. The level indicates that only a small part stems from the precalciner. This means that the precalciner was not operated or low reducing conditions or the formed CO is largely oxidised in the precalciner. The situation is very similar for the VOC emissions. It can be assumed that practically all the organic compounds were released from the raw meal. The emission curve indicates that from October 2009 onwards the mean values decreased from a level of about 12 down to a level of about 4 mg C/Nm3. Provided the measurements are correct, such a strong decrease could be explained by a significant change of the raw meal composition.
Figure 3: Daily mean values for VOC emissions from 2008 – 2010
3.7 Mercury (Hg)
The emission curve from 2008 to the middle of 2009 looks plausible but then it decreased sharply. The very low level and the curve profile indicate a problem with the Hg monitor.
Figure 4: Daily mean values for Hg emissions from 2008 – 2010
0
5
10
15
20
25
30
35
40
01.01.2008 31.12.2008 31.12.2009 31.12.2010
VO
C [m
g C
/Nm
3]
0
5
10
15
20
25
30
35
40
45
50
01.01.2008 31.12.2008 31.12.2009
Hg
[u
g/N
m3]

Annexes
524 State of the art of the co-incineration of waste-derived fuels and raw materials in clinker/cement plants
With the assumption that the values for 2008 were correctly measured, the following observations can be made. Every daily mean value depends on the ratio of the compound and direct operating mode. The emissions at these two operating modes are influenced by the waste gas temperature and the dust quantity in the filter. As a consequence, the daily mean values vary within a certain range. When classifying all daily mean values according to the waste gas temperature classes (> 150 °C, 145 – 150°C, 140 – 145 °C etc.) and calculating the average of the daily mean values of the class concerned, a figure results which shows the dependence of mercury emissions on the waste gas temperature (Figure 5). It shows a clear correlation between the two parameters.
Figure 5: Correlation between mercury emissions and waste gas temperature by means of
classified daily mean values
4. Evaluation of the daily mean values of rotary kiln 4 4.1 Annual mean values
The annual mean values are compiled in the following tables. Table 3: Annual mean values for dust, SO2, NOx, VOC and CO
Dust SO2 NOx VOC CO [mg/Nm3] [mg/Nm3] [mg/Nm3] [mg C/Nm3] [mg/Nm3]
2008 12.4 12.3 317.6 6.3
2009 7.3 12.4 301.0 6.8
2010 6.7 13.1 275.1 9.7 800
Table 4: Annual mean values for Hg, moisture, oxygen, waste gas temperature and waste gas flow
Hg Moisture O2 T Waste gas flow [µg/Nm3] [vol. %] [vol. %] [°C] [m3/h]
2008 11.2 13.2 131 187491
2009 8.0 13.1 124 175803
2010 9.0 13.7 108 170861
0
2
4
6
8
10
12
14
16
18
20
115 120 125 130 135 140
Hg
em
issio
n c
on
cen
trati
on
[u
g/N
m3]
Waste gas temperature [ C]

Annexes
State of the art of the co-incineration of waste-derived fuels and raw materials in clinker/cement plants 525
4.2 Moisture For 2008 and 2009, there are no values for moisture. For 2010, a constant value of 9 volume % is given.
4.3 Dust The reported values are significantly higher than for rotary kiln 8. Until April 2009, the daily mean values for dust vary between 10 and 20 mg/Nm3. Then, they decrease to an average level of about 7 mg/Nm3 with little variation. This change cannot be explained with the available data and information. Provided the measurement is correct, there must have been an improvement in the operation of the dust filter.
Figure 6: Daily mean values for dust emissions from 2008 – 2010
4.4 Nitrogen oxides (NOx) The annual mean values are between 275 and 318 mg/Nm3 and thus on a low level (Table 3).
Most probably, the NOx emissions are abated by means of a SNCR plant. However, the control of the set emission concentration does not seem to be precise as the emission curve is not clearly curtailed (Figure 7).
0
5
10
15
20
25
30
35
40
01.01.2008 31.12.2008 31.12.2009 31.12.2010
Du
st [m
g/N
m3]

Annexes
526 State of the art of the co-incineration of waste-derived fuels and raw materials in clinker/cement plants
Figure 7: Daily mean values for NOx emissions from 2008 – 2010
4.5 Sulphur dioxide (SO2)
The SO2 emissions are low. The annual mean values are between 12 and 13 mg/Nm3.
4.6 Volatile organic compounds (VOC) Values for carbon monoxide (CO) are only available for 2010. The mean value for that year is 800 mg/Nm3. It can be expected that these CO emissions mainly result from the raw meal in the preheater. This is confirmed by the low VOC level (if the measurement is correct) (Figure 8). The annual mean values are 6.3 (2008), 6.8 (2009) und 9.7 mg C/Nm3 (2010). So, it can be assumed that the organic compounds are also released from the raw material.
Figure 8: Daily mean values for VOC emissions from 2008 – 2010
0
100
200
300
400
500
600
01.01.2008 31.12.2008 31.12.2009 31.12.2010
NO
x[m
g/N
m3]
0
5
10
15
20
25
30
35
40
01.01.2008 31.12.2008 31.12.2009 31.12.2010
VO
C [m
g C
/Nm
3]

Annexes
State of the art of the co-incineration of waste-derived fuels and raw materials in clinker/cement plants 527
4.7 Mercury (Hg) For 2010, only values of 10 or 20 µg/Nm3 are reported. Either the Hg monitor was not properly working or the values were not correctly transferred or processed. Like for rotary kiln 8, the correlation between the mercury emission and the waste gas temperature was evaluated by means of classified daily mean values (Figure 9).
Figure 9: Correlation between mercury emissions and waste gas temperature by means of
classified daily mean values
0
2
4
6
8
10
12
14
16
18
100 110 120 130 140 150 160
Hg
em
issio
n c
on
cen
trati
on
[u
g/N
m3]
Waste gas temperature [ C]

Annexes
528 State of the art of the co-incineration of waste-derived fuels and raw materials in clinker/cement plants
27. Cement works CEMEX-WEST in Beckum/Germany
Cement works CEMEX-WEST in Beckum/Germany
Evaluation of the daily mean values derived from continuous self-
monitoring (2008 – 2010)
1. Introduction
The results from continuous self-monitoring of emissions to air for the period 01.01.2008 - 31.12.2010 have been evaluated for the following parameters:
Dust [mg/Nm3]
Nitrogen oxides NOx [mg NO2/Nm3]
Sulphur dioxide SO2 [mg/Nm3]
Volatile organic compounds VOC [mg C/Nm3]
Carbon monoxide CO [mg/Nm3]
Mercury Hg [µg/Nm3]
Oxygen O2 [volume %]
Temperature T [°C]
Waste gas flow [Nm3/h] Remark The data for SO2 were provided with the unit [g/m3] and for mercury with the unit [mg/m3], both to two decimal places. Particularly for mercury, this is insufficient and may derive from the point of view that the measurement results may be reported with the same level of precision that the emission limit value is defined to within the Waste Incineration Directive37 (0.05 mg/Nm3) or in the 17th Ordinance of the German Federal Clean Air Act (0.03 mg/Nm3). This inadequate as for mercury there are only four different values (0.00, 0.01, 0.02, 0.03 mg/Nm3). Reference conditions:
The waste gas flow is related to norm conditions (0 °C, 1013 mbar) and to dry waste gas.
According to German provisions, all values refer to an oxygen content of 10 volume %. It is assumed that the provided data have been calculated in relation to this reference oxygen content.
2. Brief description of the plant
The available information is very limited. The clinker is produced in a dry kiln with a cyclone preheater. Nitrogen oxides present in the waste gas are reduced by means of SNCR. Sulphur dioxide is abated by injection of lime (Ca(OH)2).
37 The Waste Incineration Directive has been incorporated into the Industrial Emissions Directive

Annexes
State of the art of the co-incineration of waste-derived fuels and raw materials in clinker/cement plants 529
3. Evaluation of the daily mean values 3.1 Annual mean values
The annual mean values are compiled in following tables. Table 1: Annual mean values for dust, NOx, SO2, VOC and CO
Dust NOx SO2 VOC CO [mg/Nm3] [mg/Nm3] [mg/Nm3] [mg C/Nm3] [mg/m3]
2008 4.2 337.3 280.6 25.3 304.9
2009 2.3 319.0 261.6 24.5 278.2
2010 5.0 322.9 205.2 30.4 385.3
Table 2: Annual mean values for Hg, O2, waste gas flow and waste gas temperature
Hg O2
Waste gas temperature Waste gas flow
[µg/Nm3] [vol. %] [°C] [Nm3/h]
2008 17.4 9.2 151.2 261038
2009 12.7 9.5 152.2 261428
2010 14.4 9.6 145.6 269892
3.2 Dust
The measured values are low (Table 2). In the range of 2 - 5 mg/Nm3, the dust monitor determines the dust concentrations with a high uncertainty.
3.3 Nitrogen oxide (NOx) The annual mean values are 337.3 (2008), 319.0 (2009) and 322.9 mg/Nm3 (2010) (Table 2).
Such values can only be achieved by means of an abatement technique such as a SNCR plant.
3.4 Sulphur dioxide (SO2) The emissions are curtailed at about 325 mg/Nm3 (Figure 1) to meet the emission limit value of 350 mg/Nm3. For this purpose, lime is added, probably to the raw meal.

Annexes
530 State of the art of the co-incineration of waste-derived fuels and raw materials in clinker/cement plants
Figure 1: Daily mean values for SO2 emissions from 2008 - 2010
3.5 Carbon monoxide (CO) and volatile organic compounds (VOC) The CO emissions are in the range of 280 - 400 mg/Nm3. In this range, CO mainly originates from the organic compounds present in the raw meal. The impact of the secondary firing or precalciner, if present, is negligible. The VOC emissions are in the range of 25 – 30 mg C/Nm3 and also mainly stem from the organic compounds of the raw meal. No or very little organic compounds result from the secondary firing or precalciner, if present.
3.6 Mercury (Hg) In the remark above, it is already expressed that the mercury emissions are reported in an inadequate and imprecise way. The annual mean values are 17.4 (2008), 12.7 (2009) und 14.4 µg/Nm3 (2010) (Table 2). The daily mean values depend on the ratio of the direct and compound operating mode. At these operating modes, the mercury emissions are influenced by the waste gas temperature and the dust quantity in the filter. The relationship between of classified waste gas temperatures and emission concentrations is shown in Figure 2.
0
50
100
150
200
250
300
350
400
01.01.2008 01.05.2008 31.08.2008 30.12.2008
SO
2[m
g/N
m3]

Annexes
State of the art of the co-incineration of waste-derived fuels and raw materials in clinker/cement plants 531
Figure 2: Correlation between the waste gas temperature and classified daily mean values of
classified mercury concentration in the waste gas
0
5
10
15
20
25
30
35
40
135 140 145 150 155 160 165 170
Hg
em
iss
ion
co
nc
en
tra
tio
n [
ug
/Nm
3]
Waste gas temperature [ C]

Annexes
532 State of the art of the co-incineration of waste-derived fuels and raw materials in clinker/cement plants
28. Cement works of Phoenix Zementwerke Krogbeumker GmbH & Co. KG in Beckum/Germany
Cement works of Phoenix Zementwerke Krogbeumker GmbH & Co. KG
in Beckum/Germany
Evaluation of the daily mean values derived from continuous self-monitoring (2008 – 2010)
1. Introduction
The results from continuous self-monitoring of emissions to air for the period 01.01.2008 - 31.12.2010 have been evaluated for the following parameters:
Dust [mg/Nm3]
Nitrogen oxides NOx [mg NO2/Nm3]
Sulphur dioxide SO2 [mg/Nm3]
Volatile organic compounds VOC [mg C/Nm3]
Carbon monoxide CO [mg/Nm3]
Mercury Hg [µg/Nm3]
Oxygen O2 [volume %]
Temperature T [°C]
Waste gas flow [Nm3/h] Reference conditions:
The waste gas flow is related to norm conditions (0 °C, 1013 mbar) and to dry waste gas.
According to German provisions, all values refer to an oxygen content of 10 volume %. It is assumed that the provided data have been calculated in relation to this reference oxygen content.

Annexes
State of the art of the co-incineration of waste-derived fuels and raw materials in clinker/cement plants 533
2. Brief description of the plant The basic layout of the plant is shown in Figure 1. The plant consists of a rotary kiln and a 4-stage cyclone preheater without precalciner. The NOx emissions are abated my means of a SNCR plant.
Figure 1: Basic layout of the cement works of Phoenix Zementwerke Krogbeumker GmbH &
Co. KG in Beckum
3. Evaluation of the daily mean values 3.1 Annual mean values
The annual mean values are compiled in following tables. Table 1: Annual mean values for dust, NOx, SO2, VOC and CO
Dust NOx SO2 VOC CO [mg/Nm3] [mg/Nm3] [mg/Nm3] [mg/Nm3] [mg/Nm3]
2008 3.2 459.2 166.8 13.1 273.2
2009 2.7 496.8 195.3 19.9 344.3
2010 2.0 480.1 204.4 12.9 342.4
Exploitation and crushing
quarry crusher
storage
limestoneiron-cont. mater.
drying andgrinding
homogenisationand removal
Classi-fier
E-Filter
raw mill
sulphateagents
other maincomponents
clinker
cements CEM I – CEM III
clinkerClassi-fier
cement mill
clinker silo bagged cement
bulk cement
cyclone preheater
clinker burningprocess

Annexes
534 State of the art of the co-incineration of waste-derived fuels and raw materials in clinker/cement plants
Table 2: Annual mean values for Hg, O2, waste gas flow and waste gas temperature
Hg O2 Waste gas
temperature Waste gas
flow [µg/Nm3] [vol. %] [°C] [Nm3/h]
2008 9.4 9.6 133.2 117682
2009 7.4 9.3 136.3 116038
2010 6.2 9.3 142.3 116067
3.2 Dust
The measured values are low. The annual mean values are between 2 and 3.2 mg/Nm3 (Table 1). In this range, the dust monitor determines the dust concentrations with a high uncertainty.
3.3 Nitrogen oxides (NOx) The annual mean values are 459.2 (2008), 496.8 (2009) und 480.1 mg/Nm3 (2010) (Table 1).
The NOx emissions are abated by means of a SNCR plant. However, the emission curve is not clearly curtailed indicating that the regulation of the NOx emissions is not very efficient (Figure 2).
Figure 2: Daily mean values for NOx emissions from 2008 - 2010
0
100
200
300
400
500
600
700
800
900
01
.02
.20
08
01
.04
.20
08
01
.06
.20
08
01
.08
.20
08
01
.10
.20
08
01
.12
.20
08
01
.02
.20
09
01
.04
.20
09
01
.06
.20
09
01
.08
.20
09
01
.10
.20
09
01
.12
.20
09
01
.02
.20
10
01
.04
.20
10
01
.06
.20
10
01
.08
.20
10
01
.10
.20
10
01
.12
.20
10
NO
xin
[mg
/Nm
3]

Annexes
State of the art of the co-incineration of waste-derived fuels and raw materials in clinker/cement plants 535
3.4 Sulphur dioxide (SO2) The annual mean values slightly increase from 166.8 (2008) to 195.3 (2009) and 204.4 mg/Nm3 in 2010 (Table 1). This increase could be caused by a slight increase in the content of volatile sulphur compounds in the raw material.
Figure 3: Daily mean values for SO2 emissions from 2008 - 2010
3.5 Carbon monoxide (CO) and volatile organic compounds (VOC) The CO emissions are below about 350 mg/Nm3. On this level, CO mainly originates from the organic compounds present in the raw meal. The impact of the secondary firing or precalciner, if present, is negligible. The VOC emissions are in the range of 13 - 20 mg C/Nm3 and also mainly stem from the organic compounds in the raw meal. No or very little organic compounds result from the secondary firing or precalciner, if present.
3.6 Mercury (Hg) The annual mean values are 9.4 (2008), 7.4 (2009) 3 (2010) (Table 2). The daily mean values depend on the ratio of the direct and compound operating mode. At these operating modes, the mercury emissions are influenced by the waste gas temperature and the dust quantity in the filter. As shown in Figure 4, there is a clear relationship between classified waste gas temperatures and emission concentrations. The mercury emissions increase with increasing waste gas temperatures. The non-linear curve in Figure 4 cannot be explained with the available information and data.
0
50
100
150
200
250
300
350
400
01.01.2008 31.12.2008 31.12.2009 31.12.2010
SO
2[m
g/N
m3]

Annexes
536 State of the art of the co-incineration of waste-derived fuels and raw materials in clinker/cement plants
Figure 4: Correlation between the waste gas temperature and the mercury concentration in
the waste gas
0
2
4
6
8
10
12
14
120 130 140 150 160
Hg
em
issio
n c
on
cen
trati
on
[u
g/N
m3]
Waste gas temperature [ C]

Annexes
State of the art of the co-incineration of waste-derived fuels and raw materials in clinker/cement plants 537
29. Cement works of Wotan H. Schneider KG in Üxheim-Ahütte/Germany
Cement works of Wotan H. Schneider KG
in Üxheim-Ahütte/Germany
Evaluation of the daily mean values derived from continuous self-monitoring (2008 – 2010)
1. Introduction
The results from continuous self-monitoring of emissions to air for the period 01.01.2008 - 31.12.2010 have been evaluated for the following parameters:
Dust [mg/Nm3]
Nitrogen oxides NOx [mg NO2/Nm3]
Sulphur dioxide SO2 [mg/Nm3]
Volatile organic compounds VOC [mg C/Nm3]
Carbon monoxide CO [mg/Nm3]
Moisture [volume %]
Oxygen O2 [volume %]
Temperature T [°C] Reference conditions:
The waste gas flow is related to norm conditions (0 °C, 1013 mbar) and to dry waste gas.
According to German provisions, all values refer to an oxygen content of 10 volume %. It is assumed that the provided data have been calculated in relation to this reference oxygen content.
2. Brief description of the plant
The available information is limited. The plant consists of a rotary kiln with 4-stage preheater. There is no precalciner. Waste-derived fuels are fed to the riser duct.

Annexes
538 State of the art of the co-incineration of waste-derived fuels and raw materials in clinker/cement plants
3. Evaluation of the daily mean values 3.1 Annual mean values
The annual mean values are compiled in following Tables 1 and 2. Table 1: Annual mean values for dust, NOx, SO2, VOC and CO
Dust NOx SO2 VOC CO [mg/Nm3] [mg/Nm3] [mg/Nm3] [mg C/Nm3] [mg/Nm3]
2008 0.87 320.5 148.7 50.6 3341
2009 0.56 459.3 88.9 16.5 2256
2010 0.39 437.1 111.6 23.6 2162
Table 2: Annual mean values for moisture, O2 and waste gas temperature
Moisture O2 Temperature [volume %] [volume %] [°C]
2008 8.0 15.8 174.6
2009 8.0 14.3 163.4
2010 5.3 13.8 164.7
3.2 Moisture
It seems that the moisture is not continuously measured but a constant moisture level in the waste gas is assumed. In 2008 and 2009, a level of 8 volume % was assumed. In February 2010, this value was changed to 5.1 volume %. Such a low value is only possible where, after the preheater, the waste gas is cooled by air and not by water injection. This seems to be the case as indicated by the high oxygen contents between 14 and 16 volume % and the comparatively high waste gas temperatures. The change from 8 to 5.1 volume % cannot be explained.
3.3 Dust The measured values are very low (see Table 1). In principle, dust values below about 10 mg/Nm3 can only be measured with scattered light dust monitors. Depending on the type and supplier, they have a detection limit of about 0.1 mg/Nm3. These monitors have to be calibrated with an extractive analytical method. The detection limit of such methods is significantly above 1 mg/Nm3. This means that the reported values do not provide exact values but indicate that the dust emissions are very low, probably below 3 – 5 mg/Nm3. Such low values are only achievable by means of bag filters and not with electrostatic precipitators.

Annexes
State of the art of the co-incineration of waste-derived fuels and raw materials in clinker/cement plants 539
3.4 Nitrogen oxides (NOx) The emission curve for NOx is shown in Figure 1. It is not curtailed. Therefore, most probably,
the NOx emissions are not abated by means of a SNCR plant.
Figure 1: Daily mean values for NOx emissions from 2008 - 2010
The very high CO concentrations have a reducing effect on NOx emissions. Figure 2 shows the correlation between the NOx and CO emissions. Here, the classified mean values are presented.
Figure 2: Correlation between CO and NOx with classified daily mean values from 2008 - 2010
The production of clinker requires an excess of oxygen in the kiln atmosphere within the sintering zone. In case of reducing conditions, the clinker quality would not be sufficient. As a consequence, the very high CO emissions do not result from the main firing (main burner) but can be assumed to originate from the secondary firing, i.e. fuel is fed to the kiln inlet, most
0
100
200
300
400
500
600
700
800
900
NO
Xin
[mg
/Nm
3]
0
100
200
300
400
500
600
0 1000 2000 3000 4000 5000
NO
x[m
g/N
m3]
CO [mgN/m3]

Annexes
540 State of the art of the co-incineration of waste-derived fuels and raw materials in clinker/cement plants
probably waste-derived fuel. This fuel does not completely incinerate and thus the high CO emissions result. However, the high CO emissions do reduce the NOx emissions, formed in the main burner, according to the following reaction.
3.5 Sulphur dioxide (SO2)
In preheater kilns with a carbon monoxide emission below about 1000 mg/Nm3, SO2 emissions mainly result from volatile sulphur compounds present in the raw materials, in case they are present in relevant amounts. Under these conditions, the sulphur emissions from the kiln are negligible. In the given kiln, the situation is different as most of the carbon monoxide is formed in the area of the kiln inlet which has an adverse impact on the incorporation of sulphur (sulphates present in the raw material and sulphur in the fuels) into the clinker. As a consequence, SO2 is emitted from the kiln inlet via the waste gas path (preheater, conditioning tower, raw mill, dust filter). This observation is confirmed by the correlation between the CO and SO2 emission. Figure 3 shows this correlation by means of the classified daily mean values, e.g. the SO2 emission for the class of CO values between 3500 and 4000 mg/Nm3.
Figure 3: Correlation between CO and SO2 with classified daily mean values from 2008 - 2010
3.6 Volatile organic compounds (VOC)
Figure 4 shows the emission curve for VOC for all available daily mean values from 2008 - 2010. From May 2008 to May 2009, the values were at a high level and significantly decreased in the second half of 2009 but increased again in 2010 though remained below levels seen in 2008. There is no information available to explain this distinct pattern.
2NO + 2CO N2 + 2CO2
0
50
100
150
200
250
0 1000 2000 3000 4000 5000
SO
2[m
g/N
m3]
CO [mg/Nm3]

Annexes
State of the art of the co-incineration of waste-derived fuels and raw materials in clinker/cement plants 541
Figure 4: Daily mean values for VOC emissions from 2008 - 2010
The correlation between the CO and VOC emission shows a typical dependency (Figure 5). Emissions from the raw material Below a certain CO level, in this case below about 2200 mg/Nm3, the VOC emissions are constant and do not depend on the CO emissions. Here, the emission level of organic compounds is slightly below 20 mg C/Nm3. They mainly consist of aliphatic compounds with up to three carbon atoms and of benzene; the benzene percentage of the total VOC emissions is about between 2 and 6 %. The CO level with constant VOC emissions of 2200 mg/Nm3 depends on the one hand on the feeding point of the fuels and on the other hand on the type of fuels used. Specifically coarse fuels, such as waste tyres, tend to create locally reducing combustion conditions resulting in elevated carbon monoxide emissions. The combustion of the same amount of fuels with a small size distribution is usually associated with much lower CO and VOC emissions.
0,0
10,0
20,0
30,0
40,0
50,0
60,0
70,0
80,0
90,0
VO
C in
[mg
C/N
m3 ]

Annexes
542 State of the art of the co-incineration of waste-derived fuels and raw materials in clinker/cement plants
Figure 5: Correlation between CO and VOC with classified daily mean values from 2008 - 2010
Additional emissions from secondary firing At CO emissions which are above the aforementioned CO level of 2200 mg/Nm3, the VOC emissions significantly increase due to the incomplete combustion of fuels during the secondary firing. The composition of the additional VOC emissions significantly differs from the emissions from the raw material and depends on the characteristics of the fuel. For instance, in case of the common combustion/co-incineration of waste tyres, the additional VOC emissions mainly consist of methane (about 50 to 60 %) and benzene (about 10 to 20 %).
4. Emission limit values Assuming that the additional SO2 and VOC emissions are a consequence of the co-incineration of waste-derived fuels, which is very likely, the emissions significantly exceed the emission limit values of the Waste Incineration Directive (which became part the Industrial Emissions Directive). In Annex II of the Directive, following emission limit values are defined:
Sulphur dioxide: 50 mg/m3
Total organic compounds (VOC): 10 mg/m3 Specifically for these two parameters, the Directive contains the following condition: “Exemptions may be authorised by the competent authority in cases where TOC and SO2 do not result from the incineration of waste”. In the given case, the elevated emissions of SO2 and VOC (TOC respectively) are clearly associated with the co-incineration of waste-derived fuels.
5. Final remarks
The kiln of the cement works of Wotan H. Schneider KG is a typical example of preheater kilns with high CO emissions. On the one hand, the high CO emissions are associated with lower NOx emissions (see Figure 2) but on the other hand with higher SO2 and VOC emissions (Figures 3 and 5). The VOC can comprise toxic organic compounds. The energy consumption of the kiln increases by 20 kJ/kg clinker per 1000 mg/Nm3 of CO emission. At average CO emissions of 2500 mg/Nm3 over the period 2008 – 2010, the increase in the energy demand is about 50 kJ/kg clinker.
0
10
20
30
40
50
60
0 1000 2000 3000 4000 5000
VO
C [m
g C
/Nm
3]
CO [mg/Nm3]
secondaryfiring

Annexes
State of the art of the co-incineration of waste-derived fuels and raw materials in clinker/cement plants 543
There are two important reasons to operate a kiln at such conditions: 1.) „Overfeeding of the secondary firing“
In Germany, many cement works receive a gate fee for many types of waste-derived fuels. As a consequence, it is economically attractive to co-incinerate high amounts of waste-derived fuels. This may lead to the “overfeeding” of the secondary firing which does not have an adverse impact on the clinker quality.
2.) NOx reduction The reduction of NOx by means of reducing conditions in the kiln inlet area or in the precalciner, if present, is an approach which is promoted by some operators of cement plants, equipment suppliers and consultants. Reducing conditions can be specifically obtained by means of coarse fossil or waste-derived fuels. In the given cement works, the achieved NOx reduction is significant. However, in contrast to well-designed precalciners, the formed carbon monoxide and organic compounds cannot be sufficiently reduced after the secondary firing resulting in elevated emissions. Consequently, this approach to reducing NOx emissions is associated with a significant increase in CO, VOC and SO2 emissions.

Annexes
544 State of the art of the co-incineration of waste-derived fuels and raw materials in clinker/cement plants
30. Cement works of the Dyckerhoff AG in Göllheim/Germany
Cement works of the Dyckerhoff AG
in Göllheim/Germany
Evaluation of the daily mean values derived from continuous self-monitoring (2008 – 2010)
1. Introduction
The results from continuous self-monitoring of emissions to air for the period 01.01.2008 - 31.12.2010 have been evaluated for the following parameters:
Dust [mg/Nm3]
Nitrogen oxides NOx [mg/Nm3]
Sulphur dioxide SO2 [mg/Nm3]
Mercury Hg [µg/Nm3] Reference conditions:
The waste gas flow is related to norm conditions (0 °C, 1013 mbar) and to dry waste gas.
According to German provisions, all values refer to an oxygen content of 10 volume %. It is assumed that the provided data have been calculated in relation to this reference oxygen content.
2. Brief description of the plant
The available information is very limited. The plant consists of two rotary kilns with cyclone preheaters. The NOx emissions are abated by means of SNCR plant.

Annexes
State of the art of the co-incineration of waste-derived fuels and raw materials in clinker/cement plants 545
3. Evaluation of the daily mean values 3.1 Annual mean values
The annual mean values for the two kilns are compiled in the following tables. Table 1: Annual mean values for rotary kiln 1
Kiln 1 Dust NOx SO2 Hg
[mg/Nm3] [mg/Nm3] [mg/Nm3] 3]
2008 8.7 428.2 3.9
2009 8.3 415.9 3.6
2010 9.8 469.6 2.9 11.1
Table 2: Annual mean values for rotary kiln 2
Kiln 2 Dust NOx SO2 Hg
[mg/Nm3] [mg/Nm3] [mg/Nm3] [ g/Nm3]
2008 8.7 457.3 7.7
2009 9.1 463.4 7.3
2010 8.2 472.3 5.2 16.5
3.2 Dust
The determined annual mean values for the two kilns are just below 10 mg/Nm3 (Table 1 and Table 2). The variation is indicated in Figure 1 for kiln 1 showing values between about 1 and 40 mg/Nm3. Most probably, the dust is abated by means of an electrostatic precipitator with a bag filter, significantly lower values with a smaller variation could be achieved.
Figure 1: Daily mean values for dust emissions from 2008 – 2010 for kiln 1
0
5
10
15
20
25
30
35
40
45
01.01.2008 31.12.2008 31.12.2009 31.12.2010
Du
st [m
g/N
m3]

Annexes
546 State of the art of the co-incineration of waste-derived fuels and raw materials in clinker/cement plants
3.3 Nitrogen oxides (NOx) For both kilns, the annual mean values are below 500 mg/Nm3 (Table 1 and Table 2). Due to
the curtailed emission curves (Figure 2 and Figure 3), it can be assumed that the NOx emissions are abated, e.g. by means of a SNCR plant.
Figure 2: Daily mean values for NOx emissions from 2008 – 2010 for kiln 1
Figure 3: Daily mean values for NOx emissions from 2008 – 2010 for kiln 2
0
100
200
300
400
500
600
700
01.01.2008 31.12.2008 31.12.2009 31.12.2010
NO
x[m
g/N
m3]
0
100
200
300
400
500
600
700
01.01.2008 31.12.2008 31.12.2009 31.12.2010
NO
x[m
g/N
m3]

Annexes
State of the art of the co-incineration of waste-derived fuels and raw materials in clinker/cement plants 547
3.4 Sulphur dioxide (SO2) For both kilns, the annual mean values are below 10 mg/Nm3 and thus at a very low level. It seems that the SO2 emissions of kiln 2 are slightly higher compared to kiln 1. However, it may be that the two continuous monitors are not calibrated in the same way. This could be possible at the given low emission levels.
3.5 Mercury (Hg) For 2008 and 2009, no mercury emission values are available. There is not information available as to why the continuous monitors were not in operation or why eventually measured values were not reported. For both kilns, the mercury emissions correlate with the waste gas temperature which is understandable due to the volatility of mercury. In general, the waste gas temperature and the mercury emissions of kiln 1 are lower than for kiln 2 (Figure 4).
Figure 4: Correlation between Hg and waste gas temperature for kiln 1 and kiln 2
0
5
10
15
20
25
30
35
40
45
50
100 110 120 130 140 150
Hg
em
issio
n c
on
ce
ntr
ati
on
[u
g/N
m3]
Waste gas temperature [ C]
Kiln 1
Kiln 2

Annexes
548 State of the art of the co-incineration of waste-derived fuels and raw materials in clinker/cement plants
31. Cement works of Lafarge Zement in Karlsdorf/Germany
Cement works of Lafarge Zement
in Karlsdorf/Germany
Evaluation of the daily mean values derived from continuous self-monitoring (2008 – 2010)
1. Introduction
The results from continuous self-monitoring of emissions to air for the period 01.01.2008 - 31.12.2010 have been evaluated for the following parameters:
Dust [mg/Nm3]
Nitrogen oxides NOx [mg NO2/Nm3]
Sulphur dioxide SO2 [mg/Nm3]
Mercury Hg [µg/Nm3]
Carbon monoxide CO [mg/Nm3]
Waste gas temperature T [°C]
Oxygen O2 (volume %) Reference conditions:
The waste gas flow is related to norm conditions (0 °C, 1013 mbar) and to dry waste gas.
According to German provisions, all values refer to an oxygen content of 10 volume %. It is assumed that the provided data have been calculated in relation to this reference oxygen content.
2. Brief description of the plant
The available information is very limited. The plant consists of three rotary kilns with cyclone preheaters of which only two seem to be in operation.

Annexes
State of the art of the co-incineration of waste-derived fuels and raw materials in clinker/cement plants 549
3. Flow and moisture of the waste gas The waste gas flow and the moisture of the waste gas are not continuously measured but constant values are assumed for the different years which are shown in Table 1. Table 1: Waste gas flow and moisture
Kiln 3 Kiln 4
year Waste gas flow [Nm3/h]
Moisture [volume %]
Waste gas flow [Nm3/h]
Moisture [volume %]
2008 181600 16.1 187700 14.4
2009 181700 14.9 197900 14.1
2010 224150 13.2 216600 14.8
The two kilns have the same waste gas flow. Consequently, it can be assumed that they also have the same production quantity of about 1800 t/d.
4. Evaluation of the daily mean values for kiln 3 4.1 Annual mean values
The annual mean values are compiled in following tables. Table 2: Annual mean values for dust, NOx, SO2, Hg and CO
Dust NOx SO2 Hg CO [mg/Nm3] [mg/Nm3] [mg/Nm3] 3] [mg/Nm3]
2008 13.1 433.2 260.6 6.8 386.2
2009 9.8 311.7 217.9 12.6 375.1
2010 12.6 372.6 179.4 13.7 260.8
Table 3: Annual mean values for waste gas temperature and O2
Temperature O2 [°C] [volume %]
2008 154.5 8.5
2009 156.5 8.4
2010 149.6 9.6

Annexes
550 State of the art of the co-incineration of waste-derived fuels and raw materials in clinker/cement plants
4.2 Dust The measured annual mean values are 13.1 (2008), 9.8 (2009) and 12.6 mg/Nm3 (2010) (Table 2). The emission curve shows some irregularities, e.g. the fluctuation in 2008 was much smaller than in 2009, and the dust content decreased at the end of 2008. A similar change is visible in the middle of 2010. There is no information explaining the reasons for these results. So, only assumptions can be made, such as:
Changes occurred in the filter which caused the different emission profiles.
The dust monitor was re-calibrated several times.
Figure 1: Daily mean values for dust emissions from 2008 – 2010 for kiln 3
4.3 Nitrogen oxides (NOx) The annual means values are 433.2 (2008), 311.7 (2009) and 372.6 mg/Nm3(2010) (Table 2).
The emission curve is curtailed indicating the abatement of the NOx emissions by means of a specific technique such as SNCR (Figure 2).
Figure 2 as well as the calculated annual mean values indicate that the „set points“ had been changed for the different years. In addition, in 2010, there were high fluctuations inNOx emissions which may be explained by problems with the SNCR plant.
0
5
10
15
20
25
30
01.01.2008 31.12.2008 31.12.2009 31.12.2010
Du
st [m
g/N
m3]

Annexes
State of the art of the co-incineration of waste-derived fuels and raw materials in clinker/cement plants 551
Figure 1: Daily mean values for NOx emissions from 2008 – 2010 for kiln 3
4.4 Sulphur dioxide (SO2)
The annual mean values are 260.6 (2008), 217.9 (2009) und 179.4 mg/Nm3 (2010) (Table 2). Considering the emission curve, the high fluctuations are noticeable (Figure 4). They are unusual and cannot be explained by fluctuations of the percentage of volatile sulphur compounds in the raw material or by shifts between the direct or compound operating modes. In fact, there may be a monitoring problem. As the moisture of the waste gas is not continuously monitored, most probably, there is a monitoring system with a sample gas cooler. In this case, ammonia from the raw material or from the SNCR plant can influence the monitoring results. As a consequence, the SO2 monitoring system should be evaluated against the background of the assumed problem.
Figure 4: Daily mean values for SO2 emissions from 2008 – 2010 for kiln 3
0
100
200
300
400
500
600
700
800
01.01.2008 31.12.2008 31.12.2009 31.12.2010
NO
x[m
g/N
m3]
0
100
200
300
400
500
600
01.01.2008 31.12.2008 31.12.2009 31.12.2010
SO
2[m
g/N
m3]

Annexes
552 State of the art of the co-incineration of waste-derived fuels and raw materials in clinker/cement plants
The correlation of CO and SO2 emissions shows a clear relation between these two parameters (Figure 5). Probably, due to reducing conditions in the kiln inlet, sulphur compounds are volatilised and emitted.
Figure 5: Correlation between CO and SO2 emissions for kiln 3
4.5 Carbon monoxide (CO)
The CO emissions were at a relatively low level (around 300 - 600 mg/Nm3 - Figure 3). It can be assumed that a major part of these emissions result from the raw material. However, the CO level decreased in 2010 which could have happened due to improvements of the secondary firing or of the precalciner, if available (see 4.5). So, CO emissions may also result from there.
Figure 3: Daily mean values for CO emissions from 2008 – 2010 for kiln 3
0
50
100
150
200
250
300
350
400
0 200 400 600 800 1000 1200
SO
2[m
g/N
m3]
CO [mg/Nm3]
0
200
400
600
800
1000
1200
1400
1600
01.01.2008 31.12.2008 31.12.2009 31.12.2010
CO
[m
g/N
m3]

Annexes
State of the art of the co-incineration of waste-derived fuels and raw materials in clinker/cement plants 553
4.6 Mercury (Hg) Inn 2008, Hg emissions are significantly lower compared to 2009 and 2010 (Figure 6). This cannot be explained with the available information. The change could have been caused by a change of the raw meal composition or by a calibration of the Hg monitor.
Figure 6: Daily mean values for Hg emissions from 2008 – 2010 for kiln 3
As expected, the Hg emission depends on the waste gas temperature (Figure 7). However, the constant values for the temperatures above 180 °C cannot be explained with the available information.
Figure 7: Correlation between the waste gas temperature and Hg emissions for kiln 3
0
10
20
30
40
50
60
01.01.2008 31.12.2008 31.12.2009 31.12.2010
Hg
[u
g/N
m3]
0
5
10
15
20
25
100 120 140 160 180 200 220 240
Hg
em
iss
ion
co
nc
en
tra
tio
n [
ug
/Nm
3]
Waste gas temperature [ C]

Annexes
554 State of the art of the co-incineration of waste-derived fuels and raw materials in clinker/cement plants
5. Evaluation of the daily mean values for kiln 4 5.1 Annual mean values
The annual mean values are compiled in following tables. Table 4: Annual mean values for dust, NOx, SO2, Hg and CO
Dust NOx SO2 Hg CO [mg/Nm3] [mg/Nm3] [mg/Nm3] 3] [mg/Nm3]
2008 14.0 356.0 251.1 6.6 659.6
2009 11.0 328.3 230.9 4.2 481.0
2010 15.8 407.1 244.2 4.9 489.9
Table 5: Annual mean values for waste gas temperature and O2
Temperature O2 [°C] [volume %]
2008 155.4 8.7
2009 145.4 9.9
2010 150.0 10.3
5.2 Dust
The annual mean values are 14.0 (2008), 11.0 (2009) und 15.8 mg/Nm3 (2010) (Table 4). The emission curve shows several fluctuations which cannot be explained with the available information.
Figure 8: Daily mean values for dust emissions from 2008 – 2010 for kiln 4
0
5
10
15
20
25
30
35
01.01.2008 31.12.2008 31.12.2009 31.12.2010
Du
st [m
g/N
m3]

Annexes
State of the art of the co-incineration of waste-derived fuels and raw materials in clinker/cement plants 555
5.3 Nitrogen oxides (NOx) The annual mean values are 356.0 (2008), 328.3 (2009) und 407.1 mg/Nm3 (2010) (Table 4).
The emission curve is curtailed indicating that an abatement technique, such as SNCR, is applied. It seems that the set points had been changed in the different years.
Figure 8: Daily mean values for NOx emissions from 2008 – 2010 for kiln 4
5.4 Sulphur dioxide (SO2)
The annual mean values are 251.1 (2008), 230.9 (2009) und 244.2 mg/m3 (2010) (Table 4). The emission curve indicates high fluctuations (Figure 10). They are unusual and cannot be explained with fluctuations of the percentage of volatile sulphur compounds in the raw material or with the direct or compound operating mode. In fact, there may be a monitoring problem. As the moisture of the waste gas is not continuously monitored, most probably, there is a monitoring system with a sample gas cooler. In this case, ammonia from the raw material or from the SNCR plant can influence the monitoring results. As a consequence, the SO2 monitoring system should be evaluated against the background of the assumed problem.
0
100
200
300
400
500
600
700
800
900
1000
01.01.2008 31.12.2008 31.12.2009 31.12.2010
NO
x[m
g/N
m3]

Annexes
556 State of the art of the co-incineration of waste-derived fuels and raw materials in clinker/cement plants
Figure 10: Daily mean values for SO2 emissions from 2008 – 2010 for kiln 4
The correlation of CO and SO2 emissions shows a clear relation between these two parameters (Figure 11). Probably, due to reducing conditions in the kiln inlet, sulphur compounds are volatilised and emitted.
Figure 11: Correlation between CO and SO2 emissions for kiln 4
0
100
200
300
400
500
600
700
01.01.2008 31.12.2008 31.12.2009 31.12.2010
SO
2[m
g/N
m3]
0
50
100
150
200
250
300
350
400
0 500 1000 1500 2000
SO
2[m
g/N
m3]
CO [mg/Nm3]

Annexes
State of the art of the co-incineration of waste-derived fuels and raw materials in clinker/cement plants 557
5.5 Carbon monoxide (CO) The CO emissions are at a relatively low level, most of the time below 1000 mg/Nm3 (Figure 9). They result from the raw material but could also originate from the secondary firing or the precalciner, if available (see 5.5).
Figure 9: Daily mean values for CO emissions from 2008 – 2010 for kiln 4
5.6 Mercury (Hg) Apart from few outliers, the emission values vary within a small range and probably originate from the raw material and the fuel.
Figure 12: Daily mean values for Hg emissions from 2008 – 2010 for kiln 4
As expected, there is a clear correlation between Hg emissions and the waste gas temperature (Figure 13).
0
500
1000
1500
2000
2500
01.01.2008 31.12.2008 31.12.2009 31.12.2010
CO
[m
g/N
m3]
0
5
10
15
20
25
30
35
01.01.2008 31.12.2008 31.12.2009 31.12.2010
Hg
[u
g/N
m3]

Annexes
558 State of the art of the co-incineration of waste-derived fuels and raw materials in clinker/cement plants
Figure 13: Correlation between the waste gas temperature and Hg emissions for kiln 4
6. Comparison of the CO and Hg emissions of the two kilns Most probably, the raw material is the same for the two kilns. However, different additives (iron-containing additives, bauxite etc.) and fuels could be used. The two kilns have different CO and Hg emissions.
6.1 Carbon dioxide (CO) emissions The CO emissions from kiln 4 are higher than from kiln 3 (Table 3). Table 3: Comparison of CO emissions
Year Kiln 3 Kiln 4
CO [mg/Nm3] CO [mg/Nm3]
2008 386.2 659.6
2009 375.1 481.0
2010 260.8 489.9
Raw materials According to the correlation between CO and SO2 emissions (Figures 5 and 11), in principle, it could be possible that both CO and SO2 emissions originate from the raw material but the probability for that is low. The possible influence of the secondary firing A good clinker quality requires an excess of air in the sintering zone. At optimal process conditions, the oxygen content in the kiln inlet is between 1.5 and 2 volume % whereby CO concentrations up to about 500 mg/Nm3 can occur. Up to a temperature of about 650 °C, the CO can be partly oxidised in the preheater. However, a residual part will remain. It seems to be possible that the difference occurred as a consequence of the different aforementioned process conditions. Due to the secondary firing, elevated CO concentrations can be observed in the kiln inlet which do not have an impact on the clinker quality. This could be the case here.
0
2
4
6
8
10
12
14
100 120 140 160 180 200 220
Hg
em
iss
ion
co
nc
en
tra
tio
n [
ug
/Nm
3]
Waste gas temperature [ C]

Annexes
State of the art of the co-incineration of waste-derived fuels and raw materials in clinker/cement plants 559
The CO concentrations in the kiln inlet (Figure 14) have an influence on the incorporation of sulphur. Due to reducing conditions, sulphur dioxide can reach the preheater and will be finally emitted to air.
Figure 14: Comparison of the correlation between CO and SO2 emissions for kiln 3 and kiln 4
6.2 Mercury emissions The Hg emissions of kiln 3 are higher than of kiln 4 (Table 4 and Figure 15). Table 4: Comparison of Hg emissions
Year Kiln 3 Kiln 4
Hg [µg/Nm3] Hg [µg/Nm3]
2008 6.8 6.6
2009 12.6 4.2
2010 13.7 4.9
Figure 15 shows that the Hg emission depends on the waste gas temperature. This correlation is expected as the volatility of mercury increases with increasing waste gas temperatures. The difference between the two kilns may depend on the outer cycle (cycle between the preheater and the raw mill). Against this background, it is possible that more mercury is discarded via the valve. However, with the available information, the differences cannot be definitively explained.
0
50
100
150
200
250
300
350
400
0 500 1000 1500 2000
SO
2[m
g/N
m3]
CO [mg/Nm3]
Kiln 4
Kiln 3

Annexes
560 State of the art of the co-incineration of waste-derived fuels and raw materials in clinker/cement plants
Figure 15: Comparison of the correlation between the waste gas temperature and Hg emissions
for kiln 3 and kiln 4
0
5
10
15
20
25
100 125 150 175 200 225 250
Hg
em
iss
ion
co
nc
en
tra
tio
n [
ug
/Nm
3]
Waste gas temperature [ C]
Kiln 3
Kiln 4

Annexes
State of the art of the co-incineration of waste-derived fuels and raw materials in clinker/cement plants 561
32. Cement works of Schwenk Zement KG in Bernburg/Germany
Cement works of SchwenkZementKG
in Bernburg/Germany
Evaluation of the daily mean values derived from continuous self-monitoring (2008 – 2011)
1. Introduction
The results from continuous self-monitoring of emissions to air for the period 01.01.2008 - 31.12.2010 have been evaluated for the following parameters:
Dust [mg/Nm3]
Nitrogen oxides NOx [mg/Nm3]
Sulphur dioxide SO2 [mg/Nm3]
Volatile organic compounds VOC [mg C/Nm3]
Mercury Hg [mg/Nm3] Remark: The mercury emissions were reported in [mg/Nm3] to two decimal places. This is inadequate. Some years ago, there was the idea to present the measurement results in the same units and to the same number of decimal places as the emission limit values are defined in the regulation concerned, such as
the Waste Incineration Directive (now part of the Industrial Emissions Directive); there, the emission limit value for mercury is 0.05 mg/Nm3 (daily mean value – for the co-incineration of waste in cement plants), or
the 17th Ordinance of the German Federal Clean Air Act; there, the emission limit value for mercury is 0.03 mg/Nm3 (daily mean value).
Especially with regards to mercury, this format is inadequate as, according to this approach, the emission values are reported as 0.00, 0.01, 0.02, 0.03 mg/Nm3 etc. This is not sufficiently precise. Consequently, mercury emissions should be reported with the unit [µg/Nm3] and one decimal.
Reference conditions:
The waste gas flow is related to norm conditions (0 °C, 1013 mbar) and to dry waste gas.
According to German provisions, all values refer to an oxygen content of 10 volume %. It is assumed that the provided data have been calculated in relation to this reference oxygen content.

Annexes
562 State of the art of the co-incineration of waste-derived fuels and raw materials in clinker/cement plants
2. Brief description of the plant The available information is limited. The plant consists of a rotary kiln with a precalciner and a two-strings6-stage cyclone preheater.
3. Evaluation of the daily mean values 3.1 Annual mean values
The annual mean values are compiled in following Table 1. Table 1: Annual mean values
Dust NOx SO2 Hg VOC [mg/Nm3] [mg/Nm3] [mg/Nm3] [mg/Nm3] [mg C/Nm3]
2008 6.2 317.4 72.8 0.016 13.1
2009 6.7 316.1 112.4 0.015 11.1
2010 9.2 319.3 103.1 0.017 9.9
3.2 Dust
The annual mean values are 6.2 (2008), 6.7 (2009) and 9.2 mg/Nm3 (2010) (Table 1). The daily mean values vary between almost zero and 15 mg/Nm3 (Figure 1). In case of a well-designed fabric filter, the values are slightly too high, and in case of an electrostatic precipitator, they appear very low. For the evaluation, it is required to know the type of dust monitor and the calibration method. This information is not available.
Figure 1: Daily mean values for dust emissions from 2008 – 2010
0
2
4
6
8
10
12
14
16
18
01.01.2008 31.12.2008 31.12.2009 31.12.2010
Du
st
[mg
/Nm
3]

Annexes
State of the art of the co-incineration of waste-derived fuels and raw materials in clinker/cement plants 563
3.3 Nitrogen oxides (NOx) The annual mean values are 317.4 (2008), 316.1 (2009) und 319.3 mg/Nm3(2010) (Table 1).
The emission curve is curtailed indicating that the NOx emissions are reduced by means of an abatement technique, probably with a SNCR plant. Thus, the emission values were permanently at a low level of below 350 mg/Nm3 (Figure 2).
Figure 2: Daily mean values for NOx emissions from 2008 – 2010
3.4 Sulphur dioxide (SO2)
The annual mean values are 72.8 (2008), 112.4 (2009) und 103.1 mg/m3(2010) (Table 1). Considering the emission curve, the high fluctuations are noticeable (Figure 3). They are unusual and cannot be explained by fluctuations of the percentage of volatile sulphur compounds in the raw material or shifts between the direct or compound operating modes. In fact, there may be a monitoring problem. As the moisture of the waste gas is not continuously monitored, most probably, there is a monitoring system with a sample gas cooler. In this case, ammonia from the raw material or from the SNCR plant can influence the monitoring results. As a consequence, the SO2 monitoring system should be evaluated against the background of the assumed problem.
0,0
50,0
100,0
150,0
200,0
250,0
300,0
350,0
400,0
01.01.2008 31.12.2008 31.12.2009 31.12.2010
NO
x[m
g/N
m3]

Annexes
564 State of the art of the co-incineration of waste-derived fuels and raw materials in clinker/cement plants
Figure 3: Daily mean values for SO2 emissions from 2008 - 2010
3.5 Volatile organic compounds (VOC) The emission of volatile organic compounds is relatively stable. The emission curve shows a slight drift towards lower values (Figure 4). This drift may have been caused by decreasing contents of organic compounds in the raw material or by a drift in the VOC monitor. This cannot be clarified with the available information.
Figure 4: Daily mean values for VOC emissions from 2008 – 2010
0
50
100
150
200
250
300
350
400
01.01.2008 31.12.2008 31.12.2009 31.12.2010
SO
2[m
g/N
m3]
0
5
10
15
20
25
30
01.01.2008 31.12.2008 31.12.2009 31.12.2010
VO
C [
mg
C/N
m3]

Annexes
State of the art of the co-incineration of waste-derived fuels and raw materials in clinker/cement plants 565
3.6 Mercury (Hg) As aforementioned, the mercury emissions are not reported adequately. Thus, the emission curve is inappropriate (Figure 5). If reported to three decimal places, the annual mean values may be around 15 µg/Nm3. It has to be noted that, compared with other parameters, about 15 – 20 % of the daily mean values are missing; probably, many negative values were deleted.
Figure 5: Daily mean values for mercury emissions from 2008 – 2010
0,00
0,01
0,02
0,03
0,04
0,05
01.01.2008 31.12.2008 31.12.2009 31.12.2010
Hg
[m
g/N
m3]

Annexes
566 State of the art of the co-incineration of waste-derived fuels and raw materials in clinker/cement plants
33. Cement works of Holcim (Deutschland) AG in Lägerdorf/Germany
Cement works of Holcim (Deutschland) AG
in Lägerdorf/Germany
Evaluation of the daily mean values derived from continuous self-monitoring (2008 – 2010)
1. Introduction
The results from continuous self-monitoring of emissions to air for the period 01.01.2008 - 31.12.2010 have been evaluated for following parameters:
Dust [mg/Nm3]
Nitrogen oxides NOx [mg/Nm3]
Sulphur dioxide SO2 [mg/Nm3]
Carbon monoxide CO [mg/Nm3]
Mercury Hg [µg/Nm3]
Volatile organic compounds VOC [mg C/Nm3]
Oxygen O2[volume %]
Temperature [°C]
Moisture [volume %]
Waste gas flow [Nm3/h]
Hg load [g/d]
Reference conditions:
The waste gas flow is related to norm conditions (0 °C, 1013 mbar) and to dry waste gas.
The reference oxygen content is not mentioned. According to German provisions, all values shall refer to an oxygen content of 10 volume %. It is assumed that the provided data have been calculated in relation to this reference oxygen content.

Annexes
State of the art of the co-incineration of waste-derived fuels and raw materials in clinker/cement plants 567
2. Description of the plant The production process in Lägerdorf is unique as the chalk quarrying is a wet process. As a consequence, the process is significantly different from the conventional dry process. Figure 1 shows the basic scheme of the cement works.
1 Chalk quarry 13 Rotary kiln 2 Slurry preparation facility 14 Coal mill and silo 3 Stirrer 15 Waste oil plant 4 Sand input 16 Electrost. precipitator and stack 5 Input of waste-derived raw materi. 17 Clinker hall 6 Sludge conditioning 18 Sulphate-containing raw material 7 Filtration unit 19 Granulated blast furnace slag 8 Beater mill / Flash dryer 20 Cement grinding plant 1 9 Cyclone preheater 21 Cement grinding plant 2 10 Calciner 22 Cement silos/Packaging facility 11 Hall for waste-derived fuels 23 Special binder mixing plant 12 Dome silo for fly ash
Figure 1: Scheme of the cement works of Holcim AG in Lägerdorf/Germany, based on
http://www.holcim.de/fileadmin/templates/DE/doc/Holcim_Laegerdorf_Flyer_2012.pdf

Annexes
568 State of the art of the co-incineration of waste-derived fuels and raw materials in clinker/cement plants
Process description (the indicated numbers refer to Figure 1) (according to http://www.holcim.de/fileadmin/templates/DE/doc/Holcim_Laegerdorf_Flyer_2012.pdf)
Mining of raw materials The chalk is extracted from a mine (1) by means of bucket wheel excavators. The excavators cut up to 10,000 tonnes of chalk from the mine walls per day. This process is only applied in cases of soft and wet material, such as in Lägerdorf. The high moisture content of the material of about 23 % requires wet processing of the chalk. Raw material processing The extracted chalk is transported by belt conveyors to the slurry preparation facility (2). Here, water is added and a suspension is formed. Via a pipeline, the slurry reaches the stirrer (3) for homogenisation. In addition, sand (4) and iron-containing raw materials (5) are added. Further, to improve the processing of the slurry, bypass dust (6) is added. In order to reduce the energy consumption of the kiln, the slurry is mechanically dewatered in chamber filter presses (7) from 42 to about 20 % water content. The dewatered mass is then conveyed to the kiln. Clinker production The dewatered mass is dried in the beater mill and in the flash drier (8) with hot gas from the kiln and the clinker cooler. Subsequently, the material is fed to the cyclone preheater (9). The rotary kiln and the 4-stage preheater are typical of conventional systems. Impacts on emissions to air In contrast to a conventional 4-stage cyclone preheater kiln, the waste gas permanently passes a dryer and not a raw mill. Consequently, there is only one operating mode and not two (direct and compound operating mode) as is the case for the conventional process. So, the operating mode does not contribute to the fluctuation of emissions to air of some parameters (e.g. Hg and NH3). For mercury, this is mentioned under 3.8.

Annexes
State of the art of the co-incineration of waste-derived fuels and raw materials in clinker/cement plants 569
3. Evaluation of the daily mean values 3.1 Preliminary observations
As indicated in the aforementioned reference conditions, it is not mentioned whether the reported emission values relate to 10 volume % oxygen. For the calculation of the mercury loads, the reported Hg concentrations and the waste gas flow were used. This is correct if:
The assumption is right that both parameters had not been already converted to an oxygen content of 10 volume %
Both, the concentration and the flow are converted to the reference oxygen content of 10 volume %. Often, only the concentration is converted and multiplied with non-converted values for the waste gas flow which represents a mistake.
In addition, it was assumed that the values for the waste gas flow do not include moisture, i.e. the moisture was already subtracted.
From all the values, five values were excluded due to very high dust contents (> 50 mg/m3), 9 values due to low waste gas flows (< 450000 m3/h), and 15 values due to implausible Hg concentrations. Where the values for the waste gas flow or dust content were excluded, the corresponding values for NOx, SO2 etc. were also not considered. Stable kiln operation For the whole period (2008 – 2010), the kiln was operated in the same way. This can be concluded from the small fluctuations in the moisture and oxygen content of the waste gas, the waste gas flow and the waste gas temperature.
3.2 Annual mean values
The annual mean values are compiled in following Tables 1 and 2. Table 1: Annual mean values for dust, NOx, SO2, VOC and CO
Dust NOx SO2 VOC CO [mg/Nm3] [mg/Nm3] [mg/Nm3] [mg C/Nm3] [mg/Nm3]
2008 9.3 492.4 6.3 5.6 580.3
2009 6.1 433.6 2.1 6.2 423.0
2010 7.3 456.3 5.7 5.2 438.7
Table 2: Annual mean values for Hg, waste gas temperature, moisture, oxygen and waste gas flow
Hg Temperature Moisture O2 Flow 3] [°C] [volume %] [volume %] [Nm3/h]
2008 19.4 164.5 17.8 10.6 617269
2009 23.0 168.5 20.3 11.0 575467
2010 17.6 168.3 21.8 10.9 581160

Annexes
570 State of the art of the co-incineration of waste-derived fuels and raw materials in clinker/cement plants
3.3 Dust The annual mean values are 9.3 (2008), 6.1 (2009) and 7.3 mg/Nm3 (2010) (Table 1). The dust is abated by means of an electrostatic precipitator. The aforementioned annual mean values are low. However, the emission curve shows many peaks (Figure 2). Probably, there were problems with the beater mill and/or the flash dryer that caused the relatively high peaks.
Figure 2: Daily mean values for dust emissions from 2008 – 2010
3.4 Nitrogen oxides (NOx)
The annual mean values are 492.4 (2008), 433.6 (2009) and 456.3 mg/Nm3 (2010) (Table 1). The curtailed emission curve indicates that the NOx emissions are reduced by means of an abatement technique, presumably by a SNCR plant (Figure 3). Only a few peaks indicate emissions higher than 500 mg/Nm3.
Figure 3: Daily mean values for NOx emissions from 2008- 2010
0
5
10
15
20
25
30
35
40
01.01.2008 31.12.2008 31.12.2009 31.12.2010
Du
st
[mg
/Nm
3]
0
100
200
300
400
500
600
700
800
900
01.01.2008 31.12.2008 31.12.2009 31.12.2010
NO
x[m
g/N
m3]

Annexes
State of the art of the co-incineration of waste-derived fuels and raw materials in clinker/cement plants 571
3.5 Sulphur dioxide (SO2) The annual mean values are 6.3 (2008), 2.1 (2009) and 5.7 mg/Nm3 (2010) (Table 1). The SO2 emissions were permanently very low (Figure 4). Obviously, the raw material does not contain volatile sulphur compounds. Continuous monitoring at a level below 10 mg/Nm3 is relatively imprecise. In this case, it may be more appropriate to indicate the results as “< 10 mg/Nm3”.
Figure 4: Daily mean values for SO2 emissions from 2008 - 2010
3.6 Emission of volatile organic compounds (VOC) The annual mean values are 5.6 (2008), 6.2 (2009) and 5.2 mg/Nm3 (2010) (Table 1). The emission level of organic compounds was very low. Considering the emission curve, fluctuations can be seen but there is no observable trend towards lower or higher values (Figure 5).
Figure 5: Daily mean values for VOC emissions from 2008 - 2010
0
2
4
6
8
10
12
14
16
18
01.01.2008 31.12.2008 31.12.2009 31.12.2010
SO
2[m
g/N
m3]
0
2
4
6
8
10
12
14
01.01.2008 31.12.2008 31.12.2009 31.12.2010
VO
C [
mg
C/N
m3]

Annexes
572 State of the art of the co-incineration of waste-derived fuels and raw materials in clinker/cement plants
3.7 Carbon monoxide (CO) The annual mean values are 580.3 (2008), 423.0 (2009) and 438.7 mg/Nm3 (2010) (Table 1). So, the emission level is low. The emission curve indicates that the CO emissions vary between 200 and 1000 mg/Nm3 (Figure 6), only very few values are above 1000 mg/Nm3. Most probably, the major part of the emitted CO was released from the raw material.
Figure 6: Daily mean values for CO emissions from 2008 - 2010
3.8 Mercury (Hg) The annual mean values are 19.4 (2008), 23.0 (2009) and 17.6 µg/Nm3 (2010) (Table 2). The emission curve shows that the vales usually vary within the range 5 – 35 µg/Nm3 (Figure 7). Mercury monitors are quite complex devices and errors of measurement can occur. A number of values were not reported and it is assumed that they have been deleted as they were unreasonably low or even zero. However, even more implausible values were detected and subsequently excluded. Thus, 914 values remained which were used for the evaluation. Considering the emission curve, fluctuations can be seen but there is no observable trend towards lower or higher values (Figure 7). Conventional rotary kilns with a cyclone preheater show relative standard deviations between 25 and 30 % for the two operating modes (direct and compound operation), if the mercury input with the fuels and raw materials is constant and the kiln is permanently operated in the same way (e.g. constant oxygen content). The content of moisture and oxygen in the waste gas, the waste flow and temperature indicate stable operating conditions. The same is true for the mercury emissions. The mean value over the period 2008 – 2010 is 20.7µg/Nm3 and the standard deviation 5.7 µg/Nm3; this also indicates stable conditions.
0
200
400
600
800
1000
1200
1400
01.01.2008 31.12.2008 31.12.2009 31.12.2010
CO
[m
g/N
m3]

Annexes
State of the art of the co-incineration of waste-derived fuels and raw materials in clinker/cement plants 573
Figure 7: Daily mean values for mercury emissions from 2008 - 2010
Consequently, it can be assumed that the mercury input with the fuels and raw materials was relatively constant. The fluctuations are within a normal range and could be the result of the variation of a couple of parameters, such as the raw meal input, the grain size, the temperature etc.. However, compared to other cement works, there is no correlation between the waste gas temperature and mercury emissions (Figure 8). This can be explained with two major considerations. Firstly, as mentioned above under “Impacts on emissions to air” (see 2.), there is only one operating mode and the waste gas does not pass a raw mill. Thus, the mercury cannot be adsorbed to the raw meal. Secondly, the waste gas temperatures are very high which prevents high adsorption rates of mercury to dust present in the waste gas. As a consequence, there may be practically no cycle (or to a very low extent) between the preheater and the dust filter and the mercury is emitted with the waste gas as it enters the kiln system. This means that the output directly depends on the input. In this case, the discarding of dust from the system will be not an efficient approach to remove mercury, i.e. practically all the mercury in the input will be emitted with the waste gas.
Figure 8: Waste gas temperature versus mercury emissions
0
5
10
15
20
25
30
35
40
45
01.01.2008 31.12.2008 31.12.2009 31.12.2010
Hg
[u
g/N
m3]
0
5
10
15
20
25
30
35
40
45
140 150 160 170 180 190 200
Hg
em
issi
on
co
nce
ntr
atio
n [
µg/
Nm
3]
Waste gas temperature [°C]

Annexes
574 State of the art of the co-incineration of waste-derived fuels and raw materials in clinker/cement plants
The mean value of the daily emitted mercury load over the period 2008 – 2010 is 291 g/d with a standard deviation of 80 g/d. The maximum value is 622 and the minimum value 68 g/d. The emission curve for the daily mercury load is shown in Figure 9.
Figure 9: Daily emitted mercury loads from 2008 - 2010
0
100
200
300
400
500
600
700
Hg
load
[g
/d]

Annexes
State of the art of the co-incineration of waste-derived fuels and raw materials in clinker/cement plants 575
34. Cement works of the Dyckerhoff AG in Deuna/Germany
Cement works of the Dyckerhoff AG
in Deuna/Germany
Evaluation of the daily mean values derived from continuous self-monitoring (2008 – 2010)
1. Introduction
The results from continuous self-monitoring of emissions to air for the period 01.01.2008 - 31.12.2010 have been evaluated for the following parameters:
Dust [mg/Nm3]
Nitrogen oxides NOx [mg/Nm3]
Sulphur dioxide SO2 [mg/Nm3]
Mercury Hg [µg/Nm3] Reference conditions:
The waste gas flow is related to norm conditions (0 °C, 1013 mbar) and to dry waste gas.
According to German provisions, all values refer to an oxygen content of 10 volume %. It is assumed that the provided data have been calculated in relation to this reference oxygen content.
2. Brief description of the plant
The available information is very limited. The plant consists of two rotary kilns with cyclone preheaters.

Annexes
576 State of the art of the co-incineration of waste-derived fuels and raw materials in clinker/cement plants
3. Evaluation of the daily mean values 3.1 Annual mean values
The annual mean values for the two kilns are compiled in the following Tables 1 and 2. Table 1: Annual mean values for rotary kiln A
Kiln A Dust NOx SO2 Hg Temperature
[mg/Nm3] [mg/Nm3] [mg/Nm3] 3] C]
2008 8.3 368.5 2.1 4.8 140.6
2009 375.9 1.8 4.7 149.6
2010 1.1 364.3 2.1 10.5 149.0
Table 2: Annual mean values for rotary kiln D
Kiln D Dust NOx SO2
[mg/Nm3] [mg/Nm3] [mg/Nm3]
2008 14.2 365.9 2.2
2009 9.1 366.2 4.4
2010 11.1 374.9 2.2
There are no mercury values available for kiln D.

Annexes
State of the art of the co-incineration of waste-derived fuels and raw materials in clinker/cement plants 577
3.2 Dust
3.2.1 Kiln A In 2008, only 28 daily mean values are reported. In 2009, no dust emission concentrations are available but in 2010; 262 daily mean values are available. It seems that the dust monitor was replaced, or, more probably, a new filter was installed. The annual mean value for 2010 is very low (1.1 mg/Nm3 – see Table 1 and Figure 1). This can only be achieved with a fabric filter. However, in principle, dust values below about 10 mg/Nm3 can only be measured with scattered light dust monitors. Depending on the type and supplier, they have a detection limit of about 0.1 mg/Nm3. These monitors have to be calibrated with an extractive analytical method. The detection limit of such methods is significantly above 1 mg/Nm3. This means that the reported values do not provide exact values but indicate that the dust emissions are very low, probably below 3 – 5 mg/Nm3.
Figure 1: Daily mean values for dust emissions from 2008 – 2010 for kiln A
3.2.2 Kiln D
The measured annual mean values are 14.2 (2008), 9.1 (2009) and 11.1 mg/Nm3 (2010) (Table 2). The emission curve shows that the values vary within the range 4 -20 mg/Nm3 (Figure 2). Such values can be achieved with an electrostatic precipitator. A well-designed fabric filter would achieve much lower values.
0,0
2,0
4,0
6,0
8,0
10,0
12,0
14,0
16,0
18,0
20,0
01.01.2008 31.12.2008 31.12.2009 31.12.2010
Sta
ub
[m
g/N
m3]

Annexes
578 State of the art of the co-incineration of waste-derived fuels and raw materials in clinker/cement plants
Figure 2: Daily mean values for dust emissions from 2008 – 2010 for kiln D
3.3 Nitrogen oxides (NOx) 3.3.2 Kiln A
The annual mean values are 368.5 (2008), 375.9 (2009) and 364.3 mg/Nm3(2010) (Table 1). The emission curve is strongly curtailed indicating that the NOx emissions are reduced by an abatement technique, probably by a SNCR plant. Thus, except for a few values, the NOx emission is below 400 mg/Nm3.
Figure 3: Daily mean values for NOx emissions from 2008 – 2010 for kiln A
0,0
2,0
4,0
6,0
8,0
10,0
12,0
14,0
16,0
18,0
20,0
01.01.2008 31.12.2008 31.12.2009 31.12.2010
Du
st
[mg
/Nm
3]
0
100
200
300
400
500
600
700
01.01.2008 31.12.2008 31.12.2009 31.12.2010
NO
x[m
g/N
m3]

Annexes
State of the art of the co-incineration of waste-derived fuels and raw materials in clinker/cement plants 579
3.3.2 Kiln D The annual mean values are 365.9 (2008), 366.2 (2009) and 374.9 mg/Nm3 (2010) (Table 2). As for kiln A, the emission curve is much curtailed indicating that the NOx emissions are reduced by an abatement technique, probably by a SNCR plant. Thus, except for a few values, the NOx emission is below 400 mg/Nm3.
Figure 4: Daily mean values for NOx emissions from 2008 – 2010 for kiln D
3.4 Sulphur dioxide (SO2)
For both kilns, the annual mean values are below 5 mg/Nm3 (Tables 1 and 2). So, the SO2 emission is very low and the raw materials do not contain volatile sulphur compounds. At this low level, a precise continuous measurement of the SO2 emission concentrations is not possible and it would be more accurate to report them as “< 5 mg/Nm3”.
0
100
200
300
400
500
600
01.01.2008 31.12.2008 31.12.2009 31.12.2010
NO
x[m
g/N
m3]

Annexes
580 State of the art of the co-incineration of waste-derived fuels and raw materials in clinker/cement plants
3.5 Mercury (Hg) There are no values available for kiln D. For kiln A, the annual mean values are 4.8 (2008), 4.7 (2009) and 10.5 µg/Nm3 (2010) (Table 1). In 2008 and 2009, the Hg emissions were mainly within the range 1 – 10 µg/Nm3 but in 2010, they increased significantly. The annual mean value is double that of 2009 and the peak value is 35.7 µg/Nm3. In the period with higher mercury emissions, the waste gas temperature is also higher (the mean value for this period is 158 °C compared to the annual mean value in 2010 of 149.0 °C). This may be one reason for the increase in mercury emissions. The correlation between the waste gas temperature and mercury emissions is shown in Figure 6. For temperatures below 130 °C, the curve does not indicate the expected linear correlation. This atypical part of the curve cannot be explained with the available information.
Figure 5: Daily mean values for mercury emissions from 2008 – 2010 for kiln A
Figure 6: Correlation between mercury emissions and waste gas temperature for kiln A
0
5
10
15
20
25
30
01.01.2008 31.12.2008 31.12.2009 31.12.2010
Hg
[u
g/N
m3]
0
2
4
6
8
10
12
100 120 140 160 180
Hg
em
iss
ion
co
nce
ntr
ati
on
[u
g/N
m3]
Waste gas temperature [ C]

Annexes
State of the art of the co-incineration of waste-derived fuels and raw materials in clinker/cement plants 581
ANNEX V – Publication “Lignite coke moving bed adsorber for cement plants – BAT or beyond BAT?”

Annexes
582 State of the art of the co-incineration of waste-derived fuels and raw materials in clinker/cement plants

Annexes
State of the art of the co-incineration of waste-derived fuels and raw materials in clinker/cement plants 583

Annexes
584 State of the art of the co-incineration of waste-derived fuels and raw materials in clinker/cement plants

Annexes
State of the art of the co-incineration of waste-derived fuels and raw materials in clinker/cement plants 585

Annexes
586 State of the art of the co-incineration of waste-derived fuels and raw materials in clinker/cement plants

Annexes
State of the art of the co-incineration of waste-derived fuels and raw materials in clinker/cement plants 587
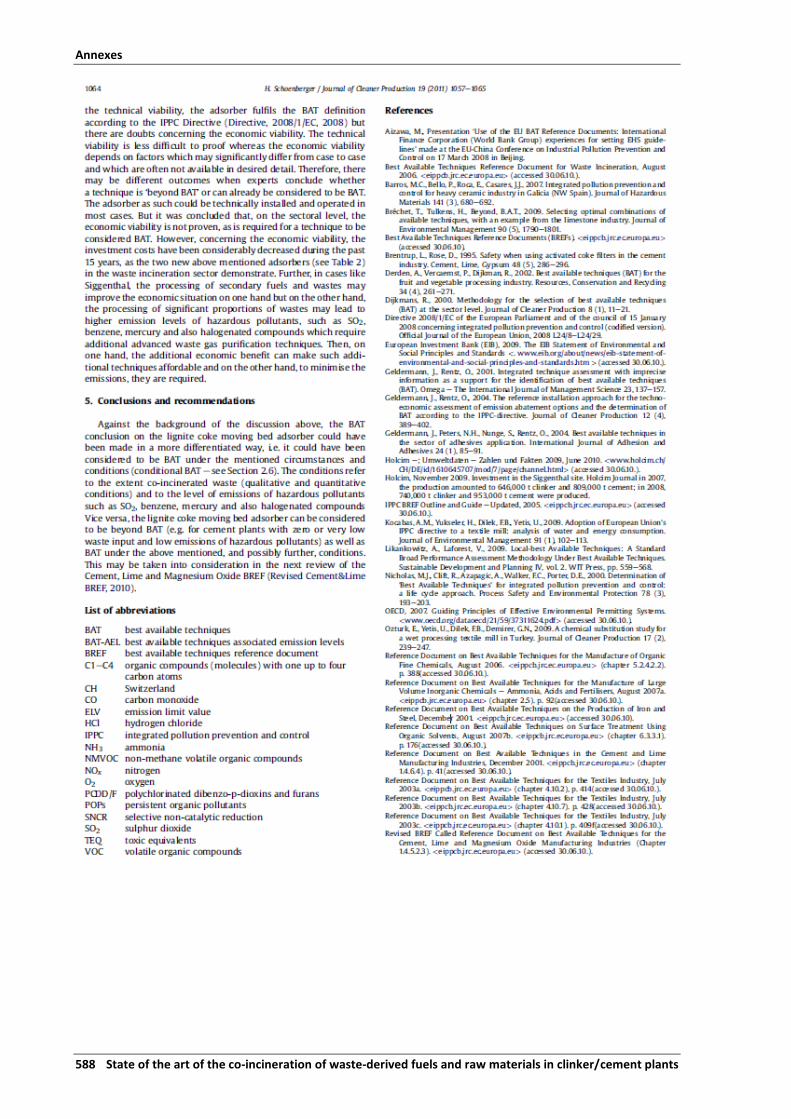
Annexes
588 State of the art of the co-incineration of waste-derived fuels and raw materials in clinker/cement plants

Annexes
State of the art of the co-incineration of waste-derived fuels and raw materials in clinker/cement plants 589

Annexes
590 State of the art of the co-incineration of waste-derived fuels and raw materials in clinker/cement plants
ANNEX VI - Synopsis of the clinker/cement-specific parts of the text of the 17th Ordinance on the implementation the Federal Clean Air Act concerning the incineration and co-incineration of wastes
Explanation In the synopsis of a legal text, any word, comma, full stop etc counts and thus, it cannot be translated to another language. As a consequence, the following synopsis of the cement/clinker-specific parts of the 17th BImSchV is not translated to English except main headings. The following synopsis consists of two parts: the one for the main text of the ordinance and the second one for the annex concerned.
1. Zementrelevante Passagen aus dem Verordnungstext der Siebzehnten Verordnung zur
Durchführung des Bundes-Immissionsschutzgesetzes (Verordnung über die Verbrennung und
Mitverbrennung von Abfällen – 17. BImSchV); clinker/cement-specific parts of the main text
of the 17th Ordinance on the Implementation the Federal Clean Air Act concerning the
Incineration and Co-incineration of Wastes).
The last amendment occurred in 2013.
Die Farben sind entsprechend der Fassungen von 1990 / 1999 / 2003 / 2009 / 2013 gewählt. The colours relate to the versions of 1990 / 1999 / 2003 / 2009 / 2013.
§1 Abs. 1 Satz 2: Die Verordnung ist auch anwendbar, wenn die Anlage überwiegend einem anderen Zweck als der Verbtrennung der in Satz 1 bezeichneten Stoffe dient oder wenn die Anlage lediglich als Teil oder Nebeneinrichtung einer anderen Anlage betrieben wird. § 1 Abs. 2: dieser Absatz wird in den neuen § 9 integriert (Für genehmigungsbedürftige Anlagen nach Absatz 1, in denen neben Stoffen nach Nummer 1.2 des Anhangs der Verordnung über genehmigungsbedürftige Anlagen auch feste oder flüssige Abfälle oder andere in Absatz 3 nicht aufgeführte ähnliche feste oder flüssige brennbare Stoffe eingesetzt werden dürfen, gilt lediglich § 4 Abs. 1, 5 Nr. 3 und Abs. 6 und die §§ 5 bis 21, in Verbindung mit den jeweils zugehörigen Vorschriften über die Messung und Überwachung der Emissionsgrenzwerte im dritten Teil, Beträgt bei Mitverbrennungsanlagen wenn der zulässige Anteil der Abfälle oder der anderen brennbaren Stoffe gemäß § 1 Abs. 1 an der jeweils gefahrenen Feuerungswärmeleistung einer Verbrennungseinheit einschließlich des für die Verbrennung benötigten zusätzlichen Brennstoffs 25 vom Hundert nicht übersteigt und werden nur im Sinne von § 5a Abs. 7 aufbereitete gemischte Siedlungsabfälle eingesetzt, so gelten für Mitverbrennungsanlagen die Anforderungen für Verbrennungsanlagen gemäß § 4 Abs. 4 nicht. Die Emissionsgrenzwerte sind gemäß § 5a festzulegen. Sonstige Anforderungen, die sich aus der Verordnung über Großfeuerungsanlagen oder aus § 5 Abs. 1 Nr. 2 des Bundes-Immissionsschutzgesetzes unter Beachtung der Technischen Anleitung zur Reinhaltung der Luft – TA Luft – in der jeweils geltenden Fassung ergeben, bleiben unberührt.) 2003 wurden nachstehende § 4 Abs. 6 und § 5 Abs. 3 gestrichen § 4 Abs. 6: Die Anlagen sind so zu errichten und zu betreiben, daß ein Tagesmittelwert von 50 Milligramm Kohlenmonoxid je Kubikmeter Abgas und ein HalbsStundenmittelwert von 100 Milligramm Kohlenmonoxid je Kubikmeter Abgas nicht überschritten wird. ….. Die Emissionsgrenzwerte nach Satz 1 und 2 beziehen sich auf einen Volumengehalt an Sauerstoff von 11 vom Hundert (Bezugssauerstoffgehalt). Soweit ausschließlich Altöle im Sinne von § 5a Abs. 1 des Abfallgesetzes eingesetzt werden, beträgt der Bezugssauerstoffgehalt 3 vom Hundert. § 5 Abs. 3: Soweit §1 Abs. 2 Satz 1 Anwendung findet (siehe oben), gelten die Emissionsgrenzwerte des Absatzes 1 in Verbindung mit Absatz 2 und die Begrenzung der Emissionen an Kohlenmonoxid nach § 4 Abs. 6 nur für den Teil des Abgasstromes, der bei der Verbrennung des höchstzulässigen Anteils der festen oder flüssigen von Abfällen zusätzlich benötigten Brennstoff oder oder ähnlichenr festenr oder

Annexes
State of the art of the co-incineration of waste-derived fuels and raw materials in clinker/cement plants 591
flüssigenr brennbarenr Stoffe einschließlich des für die Verbrennung dieser Einsatzstoffe zusätzlich benötigten Brennstoffs entsteht. Beträgt der zulässige Anteil der Abfälle oder der ähnlichen festen oder flüssigen brennbaren Stoffe einschließlich des für die Verbrennung dieser Einsatzstoffe zusätzlich benötigten Brennstoffs an der Feuerungswärmeleistung weniger als 10 vom Hundert, so ist der zugehörige Abgasstrom anhand einer angenommenen Menge von 10 vom Hundert dieser Einsatzstoffe zu berechnen. Für den übrigen Teil des Abgasstromes gelten die hierfür verbindlichen Emissionsgrenzwerte und Emissionsbegrenzungen. Fehlen derartige Festlegungen, sind die tatsächlichen Emissionen beim Betrieb ohne Einsatz von Abfällen oder ähnlichen festen oder flüssigen brennbaren Stoffen zugrunde zu legen. Die zuständige Behörde hat die Gesamtbegrenzung der Emissionen unter Berücksichtigung des § 19 (Zulassung von Ausnahmen) nach Maßgabe der Sätze 1 bis 34 im Genehmigungsbescheid oder in einer nachträglichen Anordnung festzusetzen. Die Sätze 1 bis 45 finden für andere als die in den Nummern 1.1 bis 1.3 und 8.1 des Anhangs der Verordnung über genehmigungsbedürftige Anlagen genannten Anlagen sowie für die Emissionsgrenzwerte nach Absatz 1 Nr. 3 und 4 in Verbindung mit Absatz 2 und die Begrenzung der Emissionen an Kohlenmonoxid nach § 4 Abs. 6 auch Anwendung, soweit der zulässige Anteil oder anderen brennbaren Stoffe an der Feuerungswärmeleistung 25 vom Hundert übersteigt und der Anteil der besonders überwachungsbedürftigen Abfälle, ausgenommen Abfälle nach Artikel 2 Nr. 1, erster Anstrich der Richtlinie 94/67/EG des Rates vom Dezember 1994 über die Verbrennung gefährlicher Abfälle (ABl. EG Nr. L 365 S. 34), an der Feuerungswärmeleistung nicht mehr als 40 vom Hundert beträgt. § 5a (Neu): wurde weitgehend in den neuen § 9 integriert § 5a, Abs. 1, jetzt § 9 Abs. 1: AbfallmMitverbrennungsanlagen sind so zu errichten und zu betreiben, dass folgende Emissionsgrenzwerte in den Abgasen eingehalten werden:
1. Die Emissionsgrenzwerte nach Anlage 3, sofern
a) die Anlage die nicht mehr als 25 Prozent vom Hundert der jeweils gefahrenen
Feuerungswärmeleistung einer AbfallmitvVerbrennungslinie aus Mitverbrennungsstoffen
erzeugten, und
b) bei Einsatz gemischter Siedlungsabfälle nur aufbereitete gemischte Siedlungsabfälle
eingesetzt werden, sowie
2. die Emissionsgrenzwerte nach § 8 Absatz 1 und § 10 Absatz 1, sofern
a) die Anlage sind so zu errichten und zu betreiben, dass die Emissionsgrenzwerte gemäß
Anhang II in den Abgasen nicht überschritten werden. Mitverbrennungsstoffe sind dabei
die eingesetzten Abfälle und Stoffe nach § 1 Abs. 1 sowie die für ihre Mitverbrennung
zusätzlich benötigten Brennstoffe. Werden in einer Mitverbrennungsanlage mehr als 25
Prozent vom Hundert der jeweils gefahrenen Feuerungswärmeleistung einer
Abfallmitverbrennungslinie aus Mitverbrennungsstoffen erzeugt oder
b) bei Einsatz gemischter Siedlungsabfälle keine aufbereiteten gemischten Siedlungsabfälle
eingesetzt werden., so gelten die in § 5 Abs. 1 festgelegten Emissionsgrenzwerte für
Verbrennungsanlagen.
Mitverbrennungsstoffe sind dabei die eingesetzten Abfälle und Stoffe nach § 1 Absatz 1 sowie die für ihre Mitverbrennung zusätzlich benötigten Brennstoffe. § 5a, Abs. 2, jetzt § 9 Abs. 2: Für Anlagen zur Herstellung von Zementklinker oder Zementen oder für Anlagen zum Brennen von Kalkstein gemäß (Nummer 2.3 oder 2.4 Spalte 1, Spalte 2 Buchstabe a des Anhangs 1 der Verordnung über genehmigungsbedürftige Anlagen) gelten die Regelungen in der Anlage 3 Nummer 2 Nummer II.1 des Anhangs II auch dann, wenn abweichend von Absatz 1 Satz 1 Nummer 1 Buchstabe a der Anteil der Mitverbrennungsstoffe an der jeweils gefahrenen Feuerungswärmeleistung 25 Prozent vom Hundert übersteigt. § 5a, Abs. 3: Werden in einer Anlage nach Absatz 2 mehr als 60 vom Hundert der jeweils gefahrenen Feuerungswärmeleistung aus Mitverbrennungsstoffen erzeugt, so gelten die in § 5 Abs. 1 festgelegten Emissionsgrenzwerte sowie die Ausnahmeregelungen in Anhang II Nr. II.1 entsprechend. § 5a, Abs. 4: Für Stickstoffmonoxid und Stickstoffdioxid, angegeben als Stickstoffdioxid, sowie für Gesamtstaub soll die zuständige Behörde anstelle der Anforderungen nach Absatz 3 auf Antrag des Betreibers einen anteilig berechneten Emissionsgrenzwert (Mischgrenzwert) festlegen. Der Rechnung

Annexes
592 State of the art of the co-incineration of waste-derived fuels and raw materials in clinker/cement plants
sind zu Grunde zu legen der jeweilige Emissionsgrenzwert nach § 5 Abs. 1 und der jeweilige Emissionsgrenzwert nach Anhang II Nr. II.1. Als Emissionsgrenzwert ergibt sich dann der für den Anteil von 60 bis 100 vom Hundert aus der Berechnungsformel in Anhang II zu errechnende Wert. § 5a, Abs. 5, jetzt § 9 Abs. 3: Werden Wird in Anlagen nach Absatz 2 mehr als 40 Prozent vom Hundert der jeweils gefahrenen Feuerungswärmeleistung aus gefährlichen besonders überwachungsbedürftigen Abfällen einschließlich des für deren Verbrennung zusätzlich benötigten Brennstoffs erzeugt, gelten abweichend von Absatz 2 die Grenzwerte nach § 58 Absatz 1 und § 10 Absatz 1. Für die Ermittlung des prozentualen Anteils nach Satz 1 unberücksichtigt bleiben Zu den besonders überwachungsbedürftigen Abfällen nach Satz 1 gehören nicht die flüssigen brennbaren Abfälle und nicht die Stoffe nach § 1 Absatz. 1, wenn
1. deren Massengehalt an polychlorierten aromatischen Kohlenwasserstoffen, wie zum Beispiel
polychlorierte Biphenyle (PCB) oder Pentachlorphenol (PCP), weniger als bis 10 Milligramm je
Kilogramm und deren unterer Heizwert des brennbaren Abfalls mindestens 30 Megajoule je
Kilogramm beträgt, oder
2. wenn auf Grund ihrer Zusammensetzung keine anderen oder keine höheren Emissionen als
bei der Verbrennung von leichtem Heizöl EL auftreten können.
§ 5a, Abs. 6, jetzt § 9 Abs. 4: Die Emissionsgrenzwerte beziehen sich auf einen Volumengehalt an Sauerstoff im Abgas, wie er in Anlagehang 3 II festgelegt oder nach dem in Anlage hang 3 II vorgegebenen Verfahren ermittelt wurde. Soweit in Anlage 3 nicht anders festgelegt ist, dürfen die Halbstundenmittelwerte das Zweifache der jeweils festgelegten Tagesmittelwerte nicht überschreiten. Soweit Emissionsgrenzwerte nach Anlage 3 Nummer 3 von der Feuerungswärmeleistung abhängig sind, ist für abfallmitverbrennende Großfeuerungsanlagen die Feuerungswärmeleistung gemäß § 3 der Verordnung über Großfeuerungs-, Gasturbinen- und Verbrennungsmotoranlagen maßgeblich. § 5a, Abs. 8, jetzt § 9 Abs. 5: Die zuständige Behörde hat die jeweiligen Emissionsgrenzwerte, insbesondere soweit sie nach Anlage 3 rechnerisch zu ermitteln sind oder abweichend festgelegt werden können, im Genehmigungsbescheid oder in einer nachträglichen Anordnung festzusetzen.
2. Zementrelevante Passagen aus dem Anhang der Siebzehnten Verordnung zur Durchführung
des Bundes-Immissionsschutzgesetzes (Verordnung über die Verbrennung und
Mitverbrennung von Abfällen – 17. BImSchV); clinker/cement-specific parts of the annex of
the 17th Ordinance on the Implementation the Federal Clean Air Act concerning the
Incineration and Co-incineration of Wastes).
The last amendment occurred in 2013.
Die Farben sind entsprechend der Fassungen von 2003 / 2009 / 2013 gewählt. The colours relate to the versions of 2003 / 2009 / 2013.
Anhang II Anlage 3 II.1 Besondere Vorschriften für 2. Anlagen zur Herstellung von Zementklinker oder Zementen sowie für Anlagen zum Brennen von Kalk, in denen Abfälle oder Stoffe nach § 1 Abs. 1 mitverbrannt werden (Plants for the production of clinker or cements as well as plants for burning limestone where wastes or substances according to paragraph 1 (1) are co-incinerated) Die Emissionen sind zur Überprüfung der Einhaltung der, ob die Emissionsgrenzwerte eingehalten werden, auf einen festen Bezugssauerstoffgehalt von 10 Prozent vom Hundert zu beziehen. Die in § 5 8 Abs.atz 1 Nummer. 3 und 4 festgelegten Emissionsgrenzwerte für die zu Gruppen zusammengefassten Schadstoffe (Schwermetalle, Benzo(a)pyren, polychlorierte Dibenzodioxine und Dibenzofurane) gelten unter Berücksichtigung des in Satz 1 festgelegten Bezugssauerstoffgehalts.

Annexes
State of the art of the co-incineration of waste-derived fuels and raw materials in clinker/cement plants 593
Soweit in Nummer II.1.2 nicht anders festgelegt ist, dürfen die Halbstundenmittelwerte das Zweifache der unter Nummer II.1.1 festgelegten Tagesmittelwerte nicht überschreiten. Für die Dauer der Probenahme und die sonstigen Messanforderungen gelten die in den §§ 9 bis 15 festgelegten Anforderungen. Weitergehende Regelungen, die sich aus anderen Rechtsvorschriften oder aus diese Rechtsvorschriften konkretisierenden Verwaltungsvorschriften ergeben, bleiben unberührt. II.1.1 2.1 Feste Emissionsgrenzwerte (Tagesmittelwerte in mg/m3)
Emissionsparameter 2003/2009 2013
Gesamtstaub 10 10
Gasförmige anorganische Chlorverbindungen, angegeben als Chlorwasserstoff
10 10
Gasförmige anorganische Fluorverbindungen, angegeben als Fluorwasserstoff
1 1
Stickstoffmonoxid und Stickstoffdioxid, angegeben als Stickstoffdioxid 500 200
Schwefeldioxid und Schwefeltrioxid, angegeben als Schwefeldioxid 50 50
Organische Stoffe, angegeben als Gesamtkohlenstoff 10 10
Quecksilber und seine Verbindungen, angegeben als Quecksilber 0,03 0,03
Ammoniak, sofern zur Minderung der Emissionen von Stickstoffoxiden ein Verfahren zur selektiven katalytischen oder nichtkatalytischen Reduktion eingesetzt wird
30
2.1.1 Bei wesentlichen Änderungen dieser Anlagen bis zum 31. Dezember 2018 ist zu prüfen,
ob die Anforderungen zur Begrenzung von Stickstoffmonoxid und Stickstoffdioxid für Neuanlagen unter verhältnismäßigem Aufwand eingehalten werden können. Die Möglichkeiten, die Emissionen an Stickstoffmonoxid und Stickstoffdioxid aus dem Abgas in Anlagen durch feuerungstechnische oder andere dem Stand der Technik entsprechende Maßnahmen weiter zu vermindern, sind auszuschöpfen.
2.1.2 Die zuständigen Behörden kann können auf Antrag des Betreibers Ausnahmen für Schwefeldioxid und Gesamtkohlenstoff genehmigen, sofern diese Ausnahmen aufgrund der Zusammensetzung der natürlichen Rohstoffe erforderlich sind und ausgeschlossen werden kann, dass durch den Einsatz die Verbrennung von Abfällen oder Stoffen nach § 1 Abs.atz 1 zusätzliche Emissionen an Gesamtkohlenstoff und Schwefeldioxid entstehen.
2.1.3 Die zuständigen Behörden kann können auf Antrag des Betreibers Ausnahmen für Quecksilber und seine Verbindungen einen Tagesmittelwert von bis zu 0,05 mg/m3 genehmigen, wenn eine Überschreitung des sofern diese Ausnahmen auf Grund der Zusammensetzung der natürlichen Rohstoffe erforderlich sind und ausgeschlossen werden kann, dass durch den Einsatz von Abfällen und Stoffen nach § 1 Absatz 1 zusätzliche Emissionen an Quecksilber entstehen und ein Tagesmittelwertes von bis zu 0,03 0,05 mg/m3 nicht überschritten wird. auf den Quecksilbergehalt der Rohstoffe zurückzuführen ist. Die Möglichkeiten, die Emissionen an Quecksilber und seinen Verbindungen, angegeben als Quecksilber, aus dem Abgas durch feuerungstechnische Maßnahmen oder andere dem Stand der Technik entsprechende Maßnahmen weiter zu vermindern, sind auszuschöpfen.
2.1.4 Die zuständige Behörde kann auf Antrag des Betreibers Ausnahmen für Ammoniak genehmigen, sofern diese Ausnahmen auf Grund der Zusammensetzung der natürlichen Rohstoffe erforderlich sind und ausgeschlossen werden kann, dass durch den Einsatz von Abfällen oder Stoffen nach § 1 Absatz 1 zusätzliche Emissionen an Ammoniak entstehen. In diesem Fall sind dem Ammoniakgrenzwert die durch Vergleichsmessungen zu ermittelnden rohstoffbedingten Ammoniakemissionen hinzuzurechnen; die aus Abfällen resultierenden Emissionen bleiben dabei unberücksichtigt.

Annexes
594 State of the art of the co-incineration of waste-derived fuels and raw materials in clinker/cement plants
II.1.2 2.2 Feste Emissionsgrenzwerte (Halbstundenmittelwerte in mg/m3) Emissionsparameter 2003/2009 2013
Gesamtstaub 30
Organische Stoffe, angegeben als Gesamtkohlenstoff
Gasförmige anorganische Chlorverbindungen, angegeben als Chlorwasserstoff
60 60
Gasförmige anorganische Fluorverbindungen, angegeben als Fluorwasserstoff
4 4
Schwefeldioxid und Schwefeltrioxid, angegeben als Schwefeldioxid 200 200
Stickstoffmonoxid und Stickstoffdioxid, angegeben als Stickstoffdioxid
Quecksilber und seine Verbindungen, angegeben als Quecksilber 0,05 0,05
2.2.1 Die zuständigen Behörden kann können auf Antrag des Betreibers Ausnahmen für Schwefeldioxid
und Gesamtkohlenstoff genehmigen, sofern diese Ausnahmen auf Grund der Zusammensetzung der natürlichen Rohstoffe erforderlich sind und ausgeschlossen werden kann, dass durch die Verbrennung von Abfällen oder Stoffen nach § 1 Abs.atz 1 zusätzliche Emissionen an Gesamtkohlenstoff und Schwefeldioxid entstehen.
2.2.2 Die zuständigen Behörden kann können auf Antrag des Betreibers Ausnahmen für Quecksilber und seine Verbindungen einen Halbstundenmittelwert von bis zu 0,1 mg/m3 genehmigen, wenn eine Überschreitung des sofern diese Ausnahmen auf Grund der Zusammensetzung der natürlichen Rohstoffe erforderlich sind und ausgeschlossen werden kann, dass durch den Einsatz von Abfällen und Stoffen nach § 1 Absatz 1 zusätzliche Emissionen an Quecksilber entstehen und ein Halbstundenmittelwertes von bis zu 0,05 0,1 mg/m3 auf den Quecksilbergehalt der Rohstoffe zurückzuführen ist nicht überschritten wird. Die Möglichkeiten, die Emissionen an Quecksilber und seinen Verbindungen, angegeben als Quecksilber, aus dem Abgas durch feuerungstechnische oder andere dem Stand der Technik entsprechende Maßnahmen weiter zu vermindern, sind auszuschöpfen.
II.1.2a 2.3 Feste Emissionsgrenzwerte (Jahresmittelwerte in mg/m3)
Emissionsparameter
Stickstoffmonoxid und Stickstoffdioxid, angegeben als Stickstoffdioxid 200
Abweichend von dem Emissionsgrenzwert für Stickstoffmonoxid und Stickstoffdioxid, angegeben als Stickstoffdioxid, gilt für Anlagen zum Brennen von Kalk in Drehrohröfen mit Rostvorwärmer ein Emissionsgrenzwert von 350 mg/m3. II.1.3 2.4 Emissionsgrenzwert für Kohlenmonoxid
2.4.1 Die zuständige Behörde hat einen Emissionsgrenzwert für Kohlenmonoxid unter Berücksichtigung der Anforderungen nach § 5 8 Abs.atz 1 festzulegen.
2.4.2 Die zuständige Behörde kann auf Antrag des Betreibers von dem in § 5 8 Abs.atz 1 für Kohlenmonoxid festgelegten Emissionsgrenzwert abweichen, sofern diese Ausnahmen auf Grund der Zusammensetzung der natürlichen Rohstoffe erforderlich sind und ausgeschlossen werden kann, dass durch den Einsatz die Verbrennung von Abfällen oder sonstigen Stoffen nach § 1 Abs.atz 1 zusätzliche Emissionen an Kohlenmonoxid entstehen.
II.1.4 Festlegung der Grenzwerte für NOx Abweichend von der in § 5a Abs. 4 Satz 1 geregelten Festlegung eines Mischgrenzwertes für NOx kann bis zum 30. Oktober 2007 von den zuständigen Behörden für Altanlagen ein Tagesmittelwert für Stickstoffmonoxid und Stickstoffdioxid, angegeben als Stickstoffdioxid, von 500 mg/m3 zugelassen werden. Die Möglichkeiten, die Emissionen durch feuerungstechnische und andere dem Stand der Technik entsprechende Maßnahmen weiter zu vermindern, sind auszuschöpfen.
Copyright © 2022 FDOKUMEN