Evolvability of designed protein scaffolds for binding affinity ...
147
ETH Library Evolvability of designed protein scaffolds for binding affinity and catalytic activity Doctoral Thesis Author(s): Butz, Maren Publication date: 2011 Permanent link: https://doi.org/10.3929/ethz-a-006835729 Rights / license: In Copyright - Non-Commercial Use Permitted This page was generated automatically upon download from the ETH Zurich Research Collection . For more information, please consult the Terms of use .
-
Upload
khangminh22 -
Category
Documents
-
view
4 -
download
0
Transcript of Evolvability of designed protein scaffolds for binding affinity ...

ETH Library
Evolvability of designed proteinscaffolds for binding affinity andcatalytic activity
Doctoral Thesis
Author(s):Butz, Maren
Publication date:2011
Permanent link:https://doi.org/10.3929/ethz-a-006835729
Rights / license:In Copyright - Non-Commercial Use Permitted
This page was generated automatically upon download from the ETH Zurich Research Collection.For more information, please consult the Terms of use.

DISS. ETH Nr. 19735
Evolvability of Designed Protein Sca�olds
for Binding A�nity and Catalytic Activity
for the degree of
Doctor of Sciences
A dissertation submitted to the
ETH ZÜRICH
presented by
MAREN BUTZ
Dipl. Natw. ETHZ
born on January 14, 1980
citizen of Teufen AR
Accepted on the recommendation of
Prof. Dr. D. Hilvert, examiner
Prof. Dr. R. Glockshuber, co-examinerProf. Dr. K. Johnsson, co-examiner
Zürich, 2011


1
Table of Contents
Acknowledgment 3
Abbreviations 3
Abstract 9
Zusammenfassung 13
1 Introduction: Protein Design 17
1.1 Functional Redesign of Antibody Receptors 18
1.2 Functional Redesign of Protein Scaffolds by Computational Design 24
1.3 Redesign of Proteins by Directed Evolution 30
1.4 Selection and Screening Systems 34
1.5 Perspective on Protein Design 40
1.6 Goal of this Thesis 41
2 Directed Evolution of a Diels-Alderase Catalytic Antibody 43
2.1 Introduction 43
2.2 Results 49
2.3 Conclusions 62
2.4 Methods 65
3 Directed Evolution of a Computationally Designed Binding Protein 73
3.1 Introduction 73
3.2 Results 74
3.3 Conclusion 80
3.4 Materials and Methods 84
4 Adjusting Selection Stringency of Directed Evolution Experiments with N-
terminal Degradation Tag 91
4.1 Introduction 91
4.2 Results 93
4.3 Conclusion 101
4.4 Materials and Methods 103

2
5 Alternative Strategies for Increasing Selection Stringency in Directed Evolution
Experiments 109
5.1 Introduction 109
5.2 Results 109
5.3 Conclusion 117
5.4 Materials and Methods 119
6 Perspective 125
7 Appendix 129
7.1 Media for E. coli 129
7.2 Media for Yeast 133
8 References 136

3
Acknowledgment I would like to thank my PhD supervisor, Prof. Donald Hilvert, for the opportunity to work in his
laboratory on the very interesting projects. The combination of guidance and freedom I enjoyed and
appreciated a lot.
I acknowledge Prof. Rudolf Glockshuber and Prof. Kai Johnsson for accepting to be part of the MLS
committee and my thesis co-examining.
I also want to thank Dr. Peter Kast. He always had an open ear for experimental problems. The
discussions taught me how to set up experiments with proper controls from the start. I also enjoyed
the not so scientific discussion at lunch. It was a nice environment to discuss things in an unofficial
way.
Two projects involved several FACSortings, which were done in the flow cytometry laboratory of
the university and ETH of Zurich. Especially, I want to thank Dr. Malgorzata Kisielow and Anette
Schütz for their support.
In the last year the project results suggested that NMR studies could be interesting. I would like to
thank Dr. Marc-Olivier Ebert and his team for measuring the spectra.
I also would like to acknowledge Stefan Schauer from the Functional Genomic Center for helping
me with the Biacore experiments.
During the time I spent in this lab several people came and left, nevertheless, the group managed
to stay a nice bunch of people that I appreciate as scientists and as friends. The diversity in this group
helped to approach problems differently and allowed me to learn new techniques.
As a biologist I want to thank the chemists for their help and patience, especially Dr. Thorsten
Stafforst who contributed to the antibody project. He synthetized and purified several compounds
and developed new activity screening methods. Together we developed the HPLC based assay to
screen for activity on yeast.
For the nice working environment I want a acknowledge all people of F338, Kathrin Roderer,
Narupat Hongdilokkul, Xiaowei Yu, Dan Pinkas, Alisa Davis, Roger Müller, Severin Sasso, and
Marianne Gamper.
On several projects I got help from students. I want to acknowledge Caroline Heintz, Christian
Winiger and Kathrin Székely for their contributions.
I also want to acknowledge Amanda Stouffer, who put in a lot of effort to revise my thesis. I thank
Richard Obexer, An Vandemeulebroucke, Nathalie Preiswerk, Cindy Schulenburg, and Dan Pinkas for
the final corrections.
Finally, I thank my family, who is always supporting me.

4

5
Abbreviations
10E9 mouse anti-c-myc antibody
12CA5 mouse anti-HA antibody
Å angstrom (10-10 meters)
aa amino acids
Aga agglutinin
Amp ampicillin
ANS 8-anilinonaphthalene-1-sulfonate
BSA bovine serum albumin
bp base pairs
bZIP basic-region leucin zipper
°C degree Celcius
Cam chloramphenicol
CD circular dichroism
CH constant region of an antibody heavy chain
CL constant region of an antibody light chain
cm centimeter
CM chorismate mutase
DNA deoxyribonucleic acid
DTT dithiothreitol
ε extinction coefficient
E. coli Escherichia coli
EDTA ethylenediaminetetraacetic acid
ELISA enzyme-linked immunosorbent assay
epPCR error-prone polymerase chain reaction
Fab antigen binding fragment
FACS fluorescence activated cell sorting
FITC fluorescein isothiocyanate
fM femtomolar
FPLC fast protein liquid chromatography
6
h hours
HEPES N-(hydroxyethyl)piperazine-N’-ethanesulfonic acid
HIV human immunodeficiency virus
HPLC high-performance liquid chromatography
HRP horseradish peroxidase
IgG immunoglobulin G
IPTG isopropylthio-β-galactopyranoside
kp kilo base pairs
kcat catalytic rate constant
KD dissociation constant
kDa kilo Dalton
KM Michaelis constant
koff dissociation rate constant
kon association rate constant
KTS dissociation constant for TS
l liter
λ wavelength
LB Luria-Bertani medium
LMW low molecular weight marker
M molar
MeCN acetonitrile
MES 2-(N-morpholino)ethanesulfonic acid
mg milligram
µg microgram
min minutes
ml milliliter
µl microliter
mm millimeter
mM millimolar
µM micromolar
mMjCM monomeric chorismate mutase from Methanocaldococcus jananschii

7
MOPS 3-(N-morpholino)propanesulfonic acid
MS mass spectrometry
mRNA messenger RNA
NEM N-ethylmaleimide
NETCdHP N-ethyltetrachlorodihydrophthalimide
NETCP N-ethyltetrachlorophthalimide
Ni-NTA nickel nitrilotriacetic acid
nm nanometer
nM nanomolar
NMR nuclear magnetic resonance
o/n overnight
OD600 optical density at 600 nm
PAGE polyacrylamide gel electrophoresis
PAK1 p21-activated kinase 1
PBS phosphate buffered saline
PCR polymerase chain reaction
PDB protein data bank
PE phycoerythrin
PEG polyethylene glycol
PMSF phenylmethylsulfonylfluoride
PS phosphatidylserine
RBS ribosome binding site
RepA 16 aa long protein sequence fragment (MNQSFISDILYADIES) of the RepA
protein (replication A protein). The fragment was used as an N-terminal
degradation tag
RNA ribonucleic acid
PPI protein-protein interaction
rpm rounds per minute
RT room temperature
s seconds
scFv single-chain antibody fragment

8
SDS sodium dodecyl sulfate
SR Spider Roll
SsrA 11 aa long protein sequence (AANDENYALAA) of the SsrA protein degradation
system. The sequence was used as a C-terminal degradation tag
T temperature
tc tetracyclin
TCTD tetrachlorothiophene dioxide
tetR tetracycline repressor
TEV tobacco etch virus
TFA trifluoroacetic acid
Tris Tris(hydroxymethyl)aminomethane
TSA transition state analog
TSA-fl fluorescently labeled TSA
UV ultraviolet light
VH variable region of an antibody heavy chain
VL variable region of an antibody light chain
w/v weight per volume
wt wild type
XGal 5-bromo-4-chloro-3-indoxyl-β-D-galactopyroside
YSD yeast cell-surface display

9
Abstract
Proteins are natural macromolecules that exhibit versatile functions as catalysts,
receptors, and structural elements in cells. Darwinian evolution has optimized the functions
of these molecules over millions of years by repetitive cycles of mutagenesis, selection and
amplification. As a consequence of this optimization process, protein catalysts, also called
enzymes, are remarkably efficient, accelerating chemical reactions up to 17 orders of
magnitude over background with exacting chemo-, regio- and stereoselectively. Protein
receptors have been similarly tailored to bind their partners with high affinity and selectivity.
Although proteins perform an enormous number of different functions, natural
biocatalysts may not be suitable for specific applications outside their biological context, for
example in research, medicine, or industry. They may not even exist at all. Thus, (re)design
of specialized proteins for novel functions is desirable, and much modern research has been
devoted to the development of techniques to tailor proteins in the laboratory for new tasks.
One seemingly promising approach to the creation of new biocatalysts involves
generating antibodies against transition state analogs. Although many catalysts have been
generated by this strategy, the activities of all catalytic antibodies reported to date are
modest. Thus, further improvements are required. In Chapter 2 a potentially general
strategy for improving catalytic antibodies was investigated with a catalyst for a Diels-Alder
reaction. Antibody 1E9 was raised against a hexachloronorbornene derivative and
accelerates the Diels-Alder reaction between tetrachlorothiophendioxide and
N-ethylmaleimide. A single-chain fragment of this antibody was successfully displayed on the
surface of yeast cells in functional form, providing a simple link between genotype and
phenotype and thus enabling directed evolution. The genes encoding the antibody were
mutagenized and 1E9 variants that bound the norbornene transition state analog with
higher affinity were identified using fluorescence activated cell sorting (FACS). It was hoped
that increased affinity for the transition state analog should translate into improved catalytic
activity. After multiple rounds of mutagenesis and screening, 1E9 variants were identified
that exhibited extremely slow dissociation rates for the labeled transition state analog when
displayed on yeast, even in the presence of a large excess of unlabeled ligand. Nevertheless,
these dramatic improvements were not recapitulated when the antibodies were produced in
soluble form, and the largest increases in catalytic activity of 1E9 that were achieved were
only about 3-fold. A more active mutant of the wild-type 1E9 catalyst, which harbors a single
point mutation at the active site, was not a better starting point for the evolution of
improved catalysts. Additional cycles of directed evolution, ideally with a high-throughput

10
assay for catalytic activity, will presumably be necessary to further increase the activity of
this catalytic antibody further.
Another approach to create tailor-made proteins is computational design. A number of
novel enzymes and protein interaction partners have already been successfully designed.
However, as for catalytic antibodies, only moderate activities and affinities have been
achieved. In the laboratory of Prof. Brian Kuhlman (University of North Carolina) an artificial
binding protein called “spider roll” was designed to bind the human p21-activated kinase 1;
the KD value for the resulting complex was reported to be 100 µM. In Chapter 3, yeast cell-
surface display was used in combination with FACS to increase the affinity of this design for
the target kinase, drawing on experience gained from the experiments described in Chapter
2 to optimize catalytic antibody 1E9. Over three rounds of random mutagenesis and
screening, the affinity of the displayed protein for the kinase increased roughly 280-fold.
Again, however, when the spider roll variants were produced in soluble form, much weaker
binding was observed. The KD for the best binder was only 7-fold lower than that of the
original computational design. While the evolution of spider roll illustrates the potential of
improving computational designs by directed evolution, the gain in in vitro affinity is still
much too small for possible medical applications and further improvements will be needed if
this protein is to be used as an agonist or antagonist of kinases. Moreover, detailed
biochemical characterization of the selected protein revealed that it is partially disordered.
The selection of a partially disordered protein as an improved binding partner for the kinase
was unexpected and shows how directed evolution can sometimes provide surprising
solutions for specific tasks. Given the difficulty to fulfill all the simultaneous requirements for
protein folding, high affinity, and selectivity, directed evolution is likely to remain an
important aid to computational design of tight and selective protein-protein interactions for
the foreseeable future.
Directed evolution experiments to improve catalytic activity and affinity depend on the
availability of powerful screening or selection systems. In contrast to screening, selection
systems directly link the selection and amplification steps of the evolution process.
Consequently, much larger libraries of mutagenized proteins can be analyzed, increasing the
chances of identifying improved variants. For example, the selection system for chorismate
mutase (CM) takes advantage of a CM knock-out strain. This enzyme is essential in the
shikimate pathway for phenylalanine and tyrosine production. Elimination of the encoding
gene causes auxotrophy. As a consequence, cells can only grow if provided with the gene for
a functional enzyme. This complementation system has enabled basic research on natural
and unnatural CMs. It has been used, for instance, to study catalytic mechanism, elucidate

11
the sequence constraints on secondary structural elements, generate topologically novel
oligomerization states, and even create an active enzyme composed from only 9 amino acid
building blocks. Although powerful, the CM selection system nevertheless has difficulty
distinguishing between highly active enzymes, since such catalysts already fully satisfy the
metabolic needs of the cell. In Chapter 4, a new strategy for increasing selection stringency
by limiting intracellular catalyst concentration is presented. Intracellular protein
concentration can be tightly regulated over a very wide range by simultaneously controlling
protein production through gene expression from the inducible tetracycline promoter and
controlling its lifetime in the cell by appending a suitable peptide tag that directs it to
housekeeping proteases. Here, the N-terminal RepA degradation tag (MNQSFISDILYADIES)
was investigated and compared to the C-terminal SsrA tag (AANDENYALAA). The RepA tag
successfully decreases CM concentrations, although it is less efficient than the SsrA tag.
Nevertheless, the RepA tag has a fundamental advantage over the SsrA tag for selection
experiments. Specifically, it is not subject to artifacts arising from C-terminal deletions or
stop codon mutations that lead to premature truncation and elimination of the tag,
restoring high enzyme concentrations and causing loss of selection stringency. This system
was then used to evolve a molten globular CM (mMjCM) that could not be evolved before.
Three rounds of mutagenesis and selection allowed complementing clones to grow under
the most stringent condition (no transcription induction). The best selected variant catalyzed
the chorismate-to-prephenate reaction 4-times faster than the starting enzyme.
Additionally, it was less molten globular than the template mMjCM as judged by more
cooperative thermal denaturation, less ANS binding, and greater peak dispersion in its 1H-
NMR spectrum. It should be possible to extend this approach, which couples a tunable
promoter with targeted protein degradation, to adjust selection stringency of many genetic
selection systems.
In Chapter 5 alternative strategies for increasing selection stringency by decreasing the
intracellular CM concentration were evaluated. These include cytosolic production of anti-
sense mRNA to inhibit gene transcription and utilization of impaired ribosome binding sites
to slow down protein translation. The anti-sense mRNA strategy took advantage of a T7
promoter site located downstream of the CM gene. In a CM knock-out strain that produces
T7 polymerase, basal level transcription of the anti-sense sequence from the T7 promoter
resulted in drastic reduction in CM levels in the cell. Although not yet applied in a directed
evolution experiment, this approach has the potential to afford extremely high selection
stringency. To modulate translation, novel ribosome binding sites (RBSs) were identified. The
extensively mutagenized T7 RBS was cloned upstream of the gene for HIV protease, which is

12
cytotoxic, and variants were selected that enable cell growth even when transcription of the
HIV protease is induced. The impaired RBSs were tested for their ability to reduce
intracellular CM levels. Although one of the modified RBSs did indeed reduce protein
concentration, directed evolution experiments with it did not yield variants of the molten
globular CM that were better than those already isolated in the RepA experiments.
Many studies have established the utility of directed evolution for improving the activities
of catalysts and the affinities of receptors. By combining this approach with catalytic
antibody technology and/or computational design as described in this thesis, it may be
possible to create tailored proteins for many interesting applications. Since new selection
and screening systems are being continually developed, including systems whose
stringencies can be adjusted and fine-tuned, it is probably just a question of time until
artificial proteins can be created that perform their functions with the same efficiencies and
specificities as their natural counterparts.

13
Zusammenfassung
Proteine sind natürliche Makromoleküle, die verschiedenste Aufgaben in der Zelle
erfüllen. Sie können als Katalysatoren, Rezeptoren und strukturgebende Elemente fungieren.
Über Millionen von Jahren hat die darwinistische Evolution mit ihren repetitiven Zyklen,
bestehend aus Mutagenese, Selektion und Vervielfältigung, die Funktion dieser Moleküle
optimiert. Dieser Optimierungsprozess liefert bemerkenswert effiziente Protein-
katalysatoren, so genannte Enzyme. Sie sind fähig chemische Reaktionen bis zu 1017-fach
relativ zur unkatalysierten Hintergrundsreaktion zu beschleunigen und das mit einer exakten
Chemo-, Regio- und Stereoselektivität. Ähnlich wurden Proteinrezeptoren massgeschneidert,
damit sie ihre Bindungspartner mit hoher Affinität und Selektivität binden.
Trotz der ernormen Anzahl verschiedenster Funktionen können natürliche
Biokatalysatoren für spezifische Anwendungen ausserhalb ihres natürlichen Kontextes
ungeeignet sein, zum Beispiel in Forschung, Medizin oder Industrie. Für manche
Anwendungen existieren zudem keine Biokatalysatoren. Es wäre daher wünschenswert,
spezialisierte Proteine für neue Aufgaben zu designen oder umzugestalten. Ein Grossteil der
modernen Forschung hat sich damit befasst, Techniken zu entwickeln, um im Labor Proteine
für neue Aufgaben und Funktionen herzustellen.
Ein scheinbar vielversprechender Ansatz, um neue Enzyme zu gestalten, beruht auf der
Generierung von Antikörpern gegen Übergangszustandsanaloga. Obwohl diese Strategie
viele Katalysatoren hervorbrachte, ist deren Aktivität bis jetzt moderat. Es ist daher nötig
diese Proteine weiter zu verbessern. In Kapitel 2 wurde eine potentiel allgemeingültige
Strategie zur Verbesserung von katalytischen Antikörpern an dem Beispiel eines
Immunoglobulins, der eine Diels-Alder Reaktion katalysiert, untersucht. Als Antigen für den
Antikörper 1E9 wurde ein Hexachloronorbornenderivat verwendet. Dies ermöglichte dem
Immunoglobulin die Reaktion zwischen Tetrachlorothiophendioxid und N-Ethylmaleimid zu
katalysieren. Für die gerichtete Evolution dieses Katalysators, wurde der Antikörper im
Einzelstrangformat auf der Zelloberfläche von Hefe erfolgreich präsentiert, was die nötige
Verknüpfung zwischen Genotyp und Phenotyp lieferte. Das Gen des Antikörpers wurde
daraufhin mutagenisiert. Varianten von 1E9, die das Norbornen-Übergangszustandsanalog
mit hoher Affinität binden konnten, wurden mittels Fluoreszenz-aktivierter-
Durchflusszytometrie (FACS) identifiziert. Das Prinzip beruht darauf, dass eine höhere
Affinität für das Übergangszustandsanalog zu einer verbesserten katalytischen Aktivität
führen sollte. Nach einigen Runden der Mutagenese und Selektion wurden 1E9-Varianten
angereichert, die eine stark verlangsamte Dissoziationsrate auf der Zelloberfläche aufwiesen
auch in Gegenwart von einem Überschuss an nicht-markierten Liganden. Die aufgereinigten
Antikörper konnten diese drastische Verbesserung jedoch nicht reproduzieren. Daher war
eine dreifach höhere Aktivität die maximal erreichte Aktivitätssteigerung. Eine Mutante des
Wildtypkatalysators mit einer Einfachmutation in der aktiven Tasche wurde als weiterer
Startpunkt für ein gerichtetes Evolutionexperiment verwendet, erzielte aber auch keine

14
besseren Resultate. Weitere Evolutionszyklen, idealer Weise mit einem auf Aktivität
basierenden Test mit hohem Durchsatz, könnten die nötige Aktivitätsverbesserung für
diesen katalytischen Antikörper liefern.
Ein anderer Ansatz, um Proteine mit neuen Funktionen auszustatten, beruht auf rechner-
gestütztem Design. Wie für katalytische Antikörper wurden bisher nur mässige Aktivitäten
und Affinitäten erreicht. In dem Labor von Prof. Brian Kuhlman (University of North Carolina)
wurde ein künstliches Bindungsprotein entworfen, das „Spider Roll“, das die menschliche
p21-aktivierte Kinase1 bindet. Ein KD Wert für den resultierenden Komplex wurde mit
100 µM angegeben. In Kapitel 3 wurde die gewonnene Erfahrung aus Kapitel 2 genutzt, um
die Affinität des künstlichen Bindungsproteins für die Kinase zu erhöhen, indem das
mutagenisierte Proteindesign auf der Zelloberfläche präsentiert wurde. Die besten Varianten
wurden mit FACS selektioniert. Nach drei Mutageneserunden und den dazugehörenden
Selektionen wurde eine Variante mit einer 280-fach erhöhten Affinität identifiziert. Aber
auch bei diesem Experiment hatte das Protein in Lösung eine geringere Affinität als auf der
Zelloberfläche, was die 280-fache Verbesserung relativ zum rechengestützten Originaldesign
auf das Siebenfache reduzierte. Auch wenn die erreichte in vitro Affinität noch weitere
Verbesserungen benötigt, um mögliche medizinische Anwendungen als Kinaseagonisten
oder –antagonisten zu finden, zeigt das Experiment trotzdem, dass mit Hilfe von gerichteter
Evolution Affinitäten von rechengestützten Designs erhöht werden können. Zusätzlich
offenbarte die biochemische Untersuchung der selektionierten Variante, dass dieses Protein
teilweise unstrukturiert war. Die Selektion eines partiell unstrukturierten Proteins als
verbesserter Kinasebindungspartner war unerwartet und zeigt, mit was für erstaunlichen
Lösungen gerichtete Evolution aufwarten kann, wenn sie mit speziellen Problemen
konfrontiert wird. Angesichts der gleichzeitig gestellten Ansprüche von Proteinfaltung,
Affinität und Selektivität, liegt es Nahe das gerichtete Evolution eine wichtige Stütze der
rechengestützen Designs sein wird, um starke, selektive Protein-Protein-Interaktionen zu
erhalten.
Experimente, die gerichtete Evolution verwenden, um katalytische Aktivitäten und
Affinitäten zu verbessern, hängen von der Verfügbarkeit von leistungsfähigen Screening-
oder Selektionssystemen ab. Im Gegensatz zu Screeningsystemen verknüpfen
Selektionssysteme den Selektions- und Vervielfältigungsschritt des Evolutionsprozesses.
Hieraus resultiert, dass grössere Bibliotheken von mutagenisierten Proteinen analysiert
werden können, was die Wahrscheinlichkeit erhöht eine verbesserte Variante zu
identifizieren. Das Selektionssystem für die Chorismat-Mutase (CM) ist ein typisches Beispiel.
CM ist essenziell für die Produktion von Phenylalanin und Tyrosin im Shikimat-
biosyntheseweg. In dem Knockout-Stamm, auf welchem das Selektionssystem beruht, wurde
das CM-Gen beseitigt, was zu einer Auxothrophie führt. Zellen, die kein Gen für ein
funktionelles Enzyme enthalten, können daher nicht wachsen. Dieses
Komplementationssystem ermöglichte Grundlagenforschung an natürlichen und

15
unnatürlichen CM. Zum Beispiel wurde es verwendet, um den katalytischen Mechanismus zu
studieren, Sequenzeinschränkungen für sekundäre Strukturelemente zu erforschen,
topologisch neue Oligomerisationszustände zu erhalten und sogar um ein aktives Enzyme zu
bauen bestehend aus nur neun Aminosäurebausteinen. Auch wenn dieses Selektionssystem
sehr leistungsfähig ist, hat es doch Schwierigkeiten Enzyme mit hohen Aktivitäten zu
unterscheiden, da diese die metabolischen Bedürfnisse der Zelle hinreichend erfüllen. In
Kapitel 4 wird daher ein neue Strategie vorgestellt, um die Selektionsstringenz des Systems
zu erhöhen, indem die intrazelluläre Enzymekonzentration reduziert wird und somit für die
Zelle limitierend wird. Die intrazelluläre Proteinkonzentration ist über einen grossen Bereich
streng regulierbar mittels einer gleichzeitigen Kontrolle der Protein-produktion sowie des
Proteinabbaus. Die Proteinproduktion wird gesteuert über die Genexpression, die mit dem
Tetracyclinpromotor reguliert werden kann. Der Proteinabbau wird erreicht, indem das
Protein mit einem Abbaumarker versehen wird, die es zu speziellen zellulären Proteasen
lenkt. Dies reduziert die Halbwertzeit des Proteins in der Zelle. In dem Projekt wurde der
N-terminale Abbaumarker RepA (MNQSFISDILYADIES) erforscht und verglichen mit dem
C-terminalen SsrA-Abbaumarker (AANDENYALAA). Der RepA-Marker reduzierte die
intrazelluläre Enzymkonzentration erfolgreich, erreichte aber nicht die Effizienz des SsrA-
Markers. Trotzdem hat der RepA-Marker verglichen mit dem SsrA-Marker einen
fundamentalen Vorteil für Evolutionsexperimente. Mit dem RepA-Marker wurden keine
Selektionsartefakte gefunden, die aber mit dem SsrA-Marker auftauchen. Die C-terminale
Position SsrA-Markers erlaubt, dass Deletions- und Stopp-Kodonmutationen den
Abbaumarker eliminieren. Dies führt zu erhöhten Enzymkonzentrationen, was wiederum
eine Reduktion der Selektionsstringenz zur Folge hat. Da der RepA-Marker keine solchen
Artefakte hervorbringt, wurde er verwendet, um eine CM mit Eigenschaften eines „molten
globules“ (mMjCM) zu verbessern, was mit dem vorherigen Selektionsystem nicht möglich
war. Drei Mutagenese- und Selektionsrunden brachten komplementierende Klone hervor,
die unter den stringentesten Bedingungen wachsen konnten (keine Transkriptionsinduktion).
Die beste, selektierte Variante katalysierte die Umwandlung von Chorismat zu Prephenat
viermal schneller als das Ausgangsenzym. Gleichzeitig besass sie weniger ausgeprägte
Eigenschaften eines „molten globules“. Dies wurde begründet mit der grösseren
Kooperativität bei der Temperatur induzierten Proteinentfaltung, der geringeren ANS-
Bindung und der stärkeren Peakdispersion in dem 1H-NMR-Spektrum dieser Variante
verglichen mit mMjCM. Es sollte daher möglich sein, diesen Ansatz, bestehend aus
regulierbaren Promoter und einem gezielten Proteinabbau, auf andere Selektionssysteme
auszuweiten, die eine erhöhte Selektionsstringenz benötigen.
In Kapitel 5 wurden weitere alternative Strategien getestet, um die Stringenz durch eine
gezielte Reduktion der intrazellulären CM-Konzentration zu erhöhen. Dies beinhaltete die
zytosolische Produktion einer Antisense-mRNA, um die Gentranskription zu behindern, und
der Gebrauch einer beeinträchtigten Ribosomenbindungsstelle, die die Translation
verlangsamen sollte. Die Strategie der Antisense-mRNA nutzte den T7 Promoter der

16
stromabwärts des CM-Gens lokalisiert ist. In einem CM-Knockout-Zellstamm der T7
Polymerase produziert, reichte die basale Transkription aus, um genügend Antisense-mRNA
zu generieren, dass die CM-Konzentration in der Zelle stark verringert werden konnte. Dieser
Ansatz ist vermutlich in der Lage, die Selektionsstringenz stark zu erhöhen. Bisher wurde er
aber noch an keinem gerichteten Evolutionsexperiment getestet. Für den zweiten Ansatz
wurden neue Ribosomenbindungsstellen (RBS) selektioniert, die die Translationseffizienz
beeinflussen. Stromaufwärts eines HIV-Protease-Gens wurde eine stark mutagenisierte T7
RBS eingefügt. Da die HIV-Protease für die Zelle toxisch ist, können bei induzierter
Proteintranskription nur Varianten mit schlechter Tranlation überleben. Die dadurch
selektionierten beeinträchtigten RBS wurden daraufhin gestestet, ob sie auch die CM-
Konzentration verringern können. Obwohl eine der veränderte RBS die Proteinkonzentration
tatsächlich verringerte, konnte ein Evolutionsexperiment der besten selektionierten CM der
RepA-Selektion keine verbesserte Variante hervorbringen.
Viele Studien haben den Nutzen der gerichteten Evolution zur Verbesserung der
Aktivitäten von Enzymen und der Affinitäten von Rezeptoren bestätigt. Wie in dieser Arbeit
gezeigt wird, ist die Kombination von gerichteter Evolution mit katalytischen Antikörpern
und/oder rechnergestütze Designs vielleicht in der Lage, massgeschneiderte Proteine für
vielerlei interessante Anwendungen zu generieren. Da immer neue Screening- und
Selektionssysteme entwickelt werden, Systeme eingeschlossen, deren Stringenz verändert
und kontrolliert werden können, ist es wohl nur noch eine Frage der Zeit, bis künstliche
Proteine erschaffen werden, die ihre Funktion mit gleicher Effizienz wie auch Spezifität
ausführen wie ihre natürlichen Vorbilder.
17
1 Introduction: Protein Design
Proteins are important natural molecules that perform diverse functions within the cell.
They can function as catalysts, binding proteins, and structural elements. The amino acid
sequence of a protein determines how the protein folds by specifying secondary structural
elements (α-helices, β-strands, and turn elements) that interact with each other to form
domains as well as the overall tertiary structure. Similar sequences have similar structures.
However, proteins with similar folds may also exhibit very little sequence similarity. The
structure of the protein defines function, particularly catalysis and binding. Thus, changes in
the primary sequence can affect structure and consequently protein activity.
The goal of protein engineers is to understand sequence-structure-function relationships
sufficiently to be able to design proteins with modified or new functions. Such molecules
could be useful in many areas, including research, medicine, and industry. The power of
proteins lies in the specificity and selectivity with which they perform their functions. Protein
catalysts, namely enzymes, often accept only one substrate, which they convert selectively
to a specific product. The conversion can be accelerated by as much as 17 orders of
magnitude over the background reaction (12). Like enzymes, binding proteins are often
highly specific for their intended binding partner forming high affinity complexes with it.
All proteins in nature have been fine-tuned over millions of years by Darwinian evolution.
Although Nature has evolved myriads of biomacromolecules to perform countless tasks,
natural proteins may not be optimal for specific applications outside the cell. They might not
even exist at all. For this reason, several techniques have been developed to design proteins
with novel function.
Three methods – antibody technology, computational design, and directed evolution –
are particularly notable. They can be used alone or combined to generate novel proteins for
many applications. Such approaches can also provide valuable insights into sequence-
structure-function relationships.
Antibodies can be raised against many target molecules to create novel protein binders
and catalysts (13). This approach is discussed in Section 1.1. As computer power has
increased and new data on protein structures have become available, the possibility of
computationally designing proteins has become a serious option (14). In Section 1.2 several
examples of computationally designed catalysts and receptors are described. In vitro
evolution is another tool for modifying protein properties (3). This approach mimics
Darwinian evolution in a directed way. The gene of the protein of interest is mutated to give
a library of variants. These variants are then screened for a desired function and the best
18
variants serve as input for the next round of evolution. In this way, the desired function can
be continuously optimized. Additionally, several computer algorithms have been devised to
help identify interesting positions for focused libraries (15-17). Representative directed
evolution experiments are presented in Section 1.3, and various screening and selection
systems that are used for directed evolution are discussed in Chapter 1.4.
1.1 Functional Redesign of Antibody Receptors
Immunoglobulins are attractive protein scaffolds for the functional design of selective
binders and catalysts. The immune system is able to generate antibodies against virtually
any kind of invader, be it a small molecule or a protein, binding the target molecule
specifically with affinities in the nanomolar range (18, 19). The ability to generate binding
proteins with such high affinities over a period of weeks or months has been exploited to
generate antibodies against well-defined antigens. The immunogen is injected into animals,
usually mice or rabbits, triggering an immune response. The antibodies elicited in response
to the bait are harvested and screened for ligand-specific binding. It is even possible to
generate monoclonal antibodies. The technique for achieving this has been optimized over
the years and has become a standard procedure for generating high affinity binding proteins.
This powerful method has even been extended to the design of new catalysts.
In the paper “Molecular Architecture and Biological Reactions” Linus Pauling pointed out
how important structure is to the understanding of function (20). He also noted that the
surface of an enzyme, now known as the binding site, should be complementary, not to the
substrate, but to the transition state of the catalyzed transformation in order to decrease
the activation energy and thereby accelerate the reaction. Twenty-five years later Jencks
postulated: “If complementarity between the active site and transition state contributes
significantly to enzymatic catalysis, it should be possible to synthesize an enzyme by
constructing such an active site. One way to do this is to prepare an antibody to a haptenic
group which resembles the transition state of a given reaction” (21). Nearly two decades
after the formulation of this idea, appropriate technologies were developed to prove his
hypothesis. Antibodies were raised against stable transition state mimics and these proteins
were indeed able to catalyze the corresponding reactions as shown in the next sections.
Over 100 different reactions have been catalyzed in this way to date (22, 23).
1.1.1 Electrostatic Catalysis: Hydrolases
The reaction mechanism of hydrolases is well understood. The high energy tetrahedral
and anionic intermediate that is transiently formed during ester or amide hydrolysis can be
effectively mimicked by phosphonates or phosphoamidates (24). Such transition state

19
analogs (TSA) are very successful due to their tetrahedral geometry, negative charge, and
the increased phosphorous-oxygen bond length (Figure 1-1). In fact, these TSAs are potent
inhibitors of natural hydrolase enzymes. They have also yielded a large number of antibody
catalysts with reprogrammed activities and selectivities.
One of the most efficient hydrolytic antibodies is 43C9, which cleaves p-nitroanilide 1
with a rate acceleration of 2.5 × 10⁵ over the background reaction (25). Mechanistic studies
of the antibody were performed to elucidate its mechanism of action. Active site mutants
revealed that two amino acids are mainly responsible for the observed catalytic activity (26).
The side chain of HisL91 attacks the amide/ester as a nucleophile, forming a covalent acyl-
antibody intermediate. In a second step, water attacks the substrate carbonyl, releasing
HisL91. The second crucial amino acid, ArgL96, positions the substrate in the active site by
forming hydrogen-bonds between its guanidinium group and the carbonyl group of the
amide/ester. Another important task of this charged residue is to stabilize the transiently
formed negative charge that arises during reaction, much like the oxyanion hole of natural
lipases and proteases (Figure 1-1) (27). This antibody is a special hydrolase, since it exploits
an amino acid as a nucleophile, which leads to much higher rate accelerations. For example,
antibody 43C9 also hydrolyses the structurally analogous p-nitrophenyl ester with a rate
acceleration of 2.7 × 10³, whereas antibody 48G7, which was specially generated for this
reaction, only achieved a rate acceleration of 1.6 × 10³. Antibody 48G7 provides an oxyanion
hole but has no amino acid that can serve as a nucleophile (24, 28). The oxyanion hole is
specifically induced in response to the hapten structure, which contains a negatively charged
phosphonate group.
Figure 1-1: Hydrolysis reaction catalyzed by the catalytic antibody 43C9 (1). The phosphonamidate that was
used to elicit the immune response mimicks the high energy tetrahedral intermediate and is shown in
brackets below the hapten.

20
1.1.2 Introduction of Functional Groups: a Kemp Eliminase
Many reactions require more than simple electrostatic interactions with the antibody to
be catalyzed. For example, acids, bases, or nucleophiles that are well positioned in the active
site may be needed to provide a low energy reaction pathway to products. In order to raise
antibodies with catalytic acids or bases, charges are often introduced into the hapten to
elicit a function group in the active site via charge complementarity (29). For example,
catalytic antibody 34E4 was raised against the positively charged 2-aminobenzimidazolium
hapten 4 and catalyzes the Kemp elimination reaction of 2 to salicylonitrile 3 (Figure 1-2 A).
The active site of 34E4 contains an anionic carboxylate group, GluH50, that was elicited in
response to the cationic hapten. For catalysis, the carboxylate group serves as the catalytic
base that deprotonates the benzisoxazole substrate to give salicylonitrile 3 as a product
(Figure 1-2 A) (30). This antibody achieves a rate acceleration over background of 106 at
pH 6. The crystal structure with bound TSA shows π–stacking with the protonated
benzimidazole ring explaining the high affinity for the TSA (2). The surrounding apolar side
chains further stabilize the complex by van der Waals interactions (Figure 1-2 B). This apolar
environment presumably activates GluH50 relative to acetate making it a stronger base. The
importance of this carboxylate was confirmed mutagenesis studies. The EH50D mutation
reduces kcat by over 10-fold, while the KM stays constant (31). The affinity of the antibody for
the hapten also decreases by two orders of magnitude. Removing the carboxylate, for
example by an EH50A mutation, completely abolishes catalytic activity and TSA binding. These
A B
Figure 1-2: A) Kemp elimination reaction catalyzed by antibody 34E4 (2). The antibody was raised against
hapten 4. B) Crystal structure of antibody 34E4 showing a close up of the active site with hapten bound.
TrpL91 π-stacks with the benzimidazole ring of the hapten. GluH50, which functions as the catalytic general
base during reaction, forms hydrogen bonds with the ligand to stabilize the complex.

21
studies establish a functional role for the glutamate in catalysis, highlighting the utility of
charge complementarity as a means of generating antibodies with a catalytic base at their
active site. Nevertheless, natural enzymes generally have much more elaborate active sites
in which multiple functional groups working together synergistically to achieve high reaction
rates.
1.1.3 Proximity Effects: Diels-Alderases
Another successful model reaction promoted by catalytic antibodies is the Diels-Alder
cycloaddition. In organic chemistry, Diels-Alder reactions are useful for forming carbon-
carbon bonds with high selectivity (32). In contrast to the previously described reactions, this
bimolecular reaction is bond-forming instead of bond-breaking. The *4π + 2π+ cycloaddition
of a diene and a dienophile is an attractive target for catalytic antibodies, because the
transition state of the reaction is structurally very different from that of the product as
shown in Figure 1-3 (33). In order to accelerate this bimolecular reaction, preorganization of
the substrates in a structurally defined binding pocket should lead to large catalytic effects.
Transition state analogs can be designed that favor either the exo or endo reaction pathways
(9). For example, catalytic antibodies 22C8 (exo) and 7D4 (endo) each catalyze a Diels-Alder
reaction, specifically forming only one of four possible products (>98% enantioselectivity).
A
B
Figure 1-3: Diels-Alder reactions of monosubstituted dienes and dienophiles can lead to four different final
products, a pair of enantiomeric endo products and a pair of enantiomeric exo products. A) Schematic
reaction pathways with endo or exo transition states and is the corresponding haptens used to raise the
catalytic antibodies. B) The Diels-Alder reactions catalyzed by antibodies 7D4 and 22C8 yield the exo and
endo products, respectively (9).

22
Although the exo pathway is intrinsically disfavored energetically, both antibodies have
similar kcat and KM values. This impressive result shows the ability of well-designed TSAs to
yield catalytic antibodies with beneficial properties.
Another example of a Diels-Alderase is the antibody 1E9, which catalyzes the
cycloaddition of tetrachlorothiophene dioxide (TCTD) and N-ethylmaleimide (NEM) via a
short-lived high-energy intermediate (34). After spontaneous SO2 elimination,
A
B
Figure 1-4: The catalytic antibody 1E9, a Diels-Alderase. A) Catalyzed Diels-Alder reaction between
tetrachlorothiophene dioxide (TCTD, 5) and N-ethylmaleimide (NEM, 6). The reaction is a 2-step process,
which involves formation of a high energy intermediate 7. After release of sulfur dioxide,
N-ethyltetrachloro(1,2)dihydrophthalimide (NETCdHP, 8) is oxidized to the aromatic product
N-ethyltetrachlorophthalimide (NETCP, 9). This reaction is catalyzed by antibody 1E9, which was raised
against the hexachloronorbornene hapten 10. B) Crystal structure of Diels-Alderase 1E9 showing the active
site with bound TSA 11. TrpH50 stabilizes the complex by π-stacking interactions, while AsnH35 forms a
hydrogen bond with the succinimide of the TSA. These interactions are important for preorganizing and
activating the substrates for reaction (11).

23
N-ethyltetrachloro(1,2)dihydrophthalimide (NETCdHP) is obtained which air-oxidizes to the
final product, N-ethyltetrachlorophthalimide (NETCP). The high-energy intermediate
resembles the transition state of the reaction, which was mimicked by an endo
N-ethylhexachloronorbornene hapten (Figure 1-4). The success of antibody 1E9 is rooted in
its exellent shape complementarity with the hapten (35, 36). The antibody utilizes extensive
van der Waals interactions and π-stacking of TrpH50 to stabilize the transition state
enthalpically. The carbonyl group of the succinimide moiety of the hapten is also hydrogen-
bonded with AsnH35. This interaction is believed to be important for the preorganization of
the substrates (Figure 1-4).
Despite the remarkable and near-perfect structural complementarity between 1E9 and its
TSA, it was possible to increase activity of this catalyst by a single point mutation at the
active site (MH100bF) indicating that the designed enzyme can be further optimized (36). Thus,
the immune system does not necessarily provide the best catalytic antibody directly,
probably because of the indirect nature of the selection. Antibodies are chosen for tight
binding to an imperfect TSA rather than on the basis of their catalytic activity (13).
1.1.4 Perspective
Using TSAs to generate catalytic antibodies for a variety of unnatural reactions has been
very successful. However, rate accelerations over background for natural enzymes are
typically in the range of 106 - 1014, and in certain cases up to 1017 (12), whereas antibodies
usually accelerate reaction only between 103 and 105-fold over background (13). The low
activities of antibody catalysts provided by the immune system are not surprising. According
to Wolfenden, kcat/kuncat equals KM/KTS (12, 37). To the extent that a TSA is a mimic of the
transition state, the rate acceleration should also correlate to KM/KTSA. Such a correlation was
indeed found by Stewart et al (38). However, the correlation was weak, indicating that TSAs
mimic true transition states with variable success. Independent of the TSA design, a mature
antibody typically binds its hapten with an affinity in the range of 106 to 1010 M-1. These
values are much lower than the affinity of enzymes for true transition states. Assuming that
the TSA is very similar to the transition state and that the KM value is around 10-4 M, the
maximal rate acceleration that would be expected for a catalytic antibody would be 106-fold.
This is not far from the actual observed values (13). Thus, catalytic antibodies will need
further optimization if they are to find practical application.

24
1.2 Functional Redesign of Protein Scaffolds by Computational Design
The rational design of proteins with novel functions, such as catalysis of unnatural
reactions or binding to specific partners, represents a major challenge. In the last decade,
however, new tools have made the computational design of proteins an attractive option
(17, 39, 40). This approach has benefited from increasing computer capacity and the large
number of newly solved protein crystal structures. Although de novo design of a catalytically
active protein from scratch has not yet been achieved, computational design has successfully
addressed several aspects of the sequence-structure-function conundrum.
For the design of new enzymes, an active site is normally molded around a calculated
transition state to provide the essential functional groups for catalysis. The calculated TS
plus catalytic groups is called a theozyme and is used to screen the PDB database for a
suitable host protein scaffold (41, 42). A set of protein scaffolds is selected and amino acids
from the artificial active site are computationally introduced into the cavity of these
scaffolds. After several optimization steps, the designs are ranked and the best candidates
are produced and screened for catalytic activity.
A major advantage of computational design over the catalytic antibody strategy is that
the calculations are based on realistic transition state models rather than on an imperfect
TSA. The initial breakthrough for this approach came in 2008 when two designed proteins
were reported. One was a retro-aldolase (43), the other catalyzes the Kemp elimination
reaction discussed above (44). More recently, a Diels-Alderase has also been described (45).
Computational design has also been successful in designing protein receptors (46, 47).
1.2.1 Computational Enzyme Design: a Kemp Eliminase
In the case of the Kemp elimination reaction, the protein engineers took advantage of the
well characterized catalytic antibody 34E4 which was described above (2, 44). The crystal
structure of the antibody was used to position the catalytic residues of the theoretical active
site. After the design process, 59 proteins in 17 different scaffolds were selected for
experimental characterization. Eight out of these had measurable activities for the
deprotonation of 5-nitrobenzisoxasole, accelerating the reaction by a factor of 102 – 105 over
background. The best variant KE59 is based on indole-3-glycerolphosphate synthase from
Sulfolobus solfataricus (PDB: 1a53, (7)), which has a TIM-barrel scaffold (Figure 1-5). The
starting catalyst utilizes a carboxylate base, as in 34E4, and exhibits a kcat/KM value of
12.2 M-1 s-1. It was possible to increase this level of activity by two orders of magnitude using
directed evolution. The final variant obtained after seven rounds of random mutagenesis
and screening had eight additional mutations and performed the reaction with a kcat/KM of

25
2.6 × 10³ M-1 s-1, which is comparable to that of the catalytic antibody 34E4
(5.0 × 10³ M-1 s-1). The rate acceleration achieved by the evolved design is approximatly 106
over background.
1.2.2 Computational Enzyme Design: a Diels-Alderase
In 2010, computational design yielded a catalyst for the more challenging Diels-Alder
reaction between diene 19 and dienophile 20 (Figure 1-6) (45). After filtering the designs on
the basis of shape complementarity and calculated transition state binding energy, 84
proteins were selected for in vitro characterization. Fifty of the selected proteins were
soluble, but only two of these showed low Diels-Alderase activity. DA_20_00 is based on the
six-bladed β-propeller scaffold of a diisopropylfluorophosphatase from Loligo vulgaris
(PDB: 1E1A, (5)). The other protein, DA_42_00, was created from the Δ-ketosteroid
isomerase from Pseudomonas putida (PDB: 1OHO). Further computational studies predicted
that active site mutations should increase activity. Accordingly, mutants of the two Diels-
Alderases were prepared. Four mutations in DA_42_00 and six mutations in DA_20_00 were
able to improve both designs. Nevertheless, their overall activity (kcat/(KM-diene × KM-dienophile))
is still slightly below the activity of the corresponding catalytic antibodies 7D4 and 22D8
(Section 1.2.2). This is due to the >10-fold higher KM value for the dienophile, since the kcat of
DA_20_10 is actually 10-fold larger than the kcat for the antibodies. Since four products are
possible, the stereo- and enantioselectivity of DA_20_10 was analyzed. Like the catalytic
antibodies, the enzyme shows high enantioselectivity, producing only the 3R,4S product
A B
Figure 1-5: Computational design of a Kemp eliminase. A) Crystal structure of the indole-3-
glycerolphosphate synthase (IGPS) of Sulfolobus solfataricus (PDB: 1a53, (7)), which was chosen as protein
scaffold for creation of an active site for the Kemp-elimination reaction. B) Natural reaction catalyzed by
indole-3-glycerolphosphate synthase. C) Kemp elimination reaction catalyzed by the computationally
designed KE59 variant of IGPS.
C

26
(> 97%), which corresponds to an endo transition state as designed. Although the designed
catalysts have similar activities as the Diels-Alderase antibodies, this result can still be
considered a significant step forward for rational enzyme design. For the creation of
antibodies, it is necessary to understand the reaction in order to design a reasonable TSA. In
the case of computational design, the demands on the active site have to be fulfilled as well,
without greatly disturbing the overall protein fold. In the future, as algorithms continue to
B
Figure 1-6: Computational design of a Diels-Alderase. A) Crystal structure of the
diisopropylfluorophosphatase of Loligo vulgaris (PDB: 1E1A, (5)). In yellow are two calcium ions.
B) Scheme of the reaction catalyzed by wt diisopropyl fluorophosphatase. C) Crystal structure of the
Δ5-3-ketosteroid isomerase of Pseudomonas putida (PDB: 1OHO). The inhibitor equilenin (17) is shown in
yellow at the enzyme active site. D) Isomerization reaction catalyzed by wt Δ5-3-ketosteroid isomerase.
E) The Diels-Alder reaction between diene 19 and dienophile 20 catalyzed by the computationally designed
proteins DA_20_00 and DA_42_00, which were derived from the diisopropylfluorophosphatase and from
Δ5-3-ketosteroid isomerase scaffolds, respectively.
C
A
D
E

27
improve, we can expect to see the computational design of catalysts with higher activities
and for more difficult reactivities.
1.2.3 Computational Receptor Design: Basic-Region Leucine Zipper
The computational design of new protein-protein interfaces faces different challenges
than the field of enzyme design. The computational design of enzymes has the disadvantage
that introduction of charged and hydrophilic amino acids into the active site of a globular
protein often decreases the stability of the protein. On the other hand, the computational
design of protein-protein interfaces has to confront an affinity versus selectivity trade-off
(46, 48, 49). For instance, a very specific interaction does not necessarily reflect the highest
affinity. Specificity is difficult to quantify. Therefore, simultaneous optimization of the
affinity and specificity of computational designs is not yet possible, and most designs just
optimize affinity and neglect specificity. However, using negative design to exclude proteins
that bind unwanted ligands can help to generate selective and high affinity binders.
This strategy is illustrated by the design of selective basic-region leucin zipper (bZIP)
binding peptides (46). Researchers designed a peptide with reasonable affinity (maximized
complex stability), and subsequently optimized selectivity via several rounds of negative
design. Forty-eight peptides were designed to bind twenty bZIP targets. Their specificity was
tested in a microarray, measuring the affinity of the peptides for 33 representative human
bZIPs containing the twenty target proteins and for self-association. Forty of the peptides
bound the intended target. For ten, the highest affinity was measured for the intended
target. Moreover, 40% of the designs showed detectable self-assembly. Interestingly, the
anti-FOS peptide identified in this screen was able to disrupt the c-Jun-c-Fos interaction, but
not the c-Jun homodimer or the c-Jun-ATF-2 heterodimer, even though anti-FOS exhibited
affinity for members of the FOS and JUN family. This study has medical relevance, since
several of the bZIPs are oncoproteins (e.g. c-Jun and c-Fos), highlighting the potential impact
that engineering interacting protein-protein partners might have.
Part of the success of designing the bZIP peptide can be ascribed to the large
experimental data set that was available to generate the computational model. Thus, the
interaction that was redesigned was already well understood and documented. The
generation of a novel binding partner is much more challenging, since the interactions have
to be designed from scratch. One approach to this problem is described in the next chapter,
although the selectivity issue is neglected.

28
1.2.4 Computational Receptor Design: Kinase Binding Protein
Like transcription factors, kinases are interesting targets for computational design.
Kinases are often involved in cell signaling, which is critical for controlling the behavior of a
cell. For example, the human p21-activated kinase 1 (PAK1, (50)) was chosen as a target for a
small computationally designed peptide (47). The latter was designed to bind at the
interaction interface of the kinase domain and the auto-inhibitory region. The design was
based on the hyperplastic disc protein (HYD, PBD: 1I2T (51)), which is a small helical bundle.
The HYD protein and the kinase domain of PAK1 were first docked together as rigid bodies,
preserving the original sequence. Though it is unlikely that native HYD would bind the kinase
domain, this initial step helps to identify the best positioning of the proteins relative to each
other. Subsequent iterative rounds of sequence and structure optimization were then used
to find the lowest energy complexes. Compared with natural protein-protein interfaces, the
preliminary designs that resulted from this process had a large number of unsatisfied
hydrogen bonds and less dense packing. As a consequence, the selection filter was adjusted
so that only designs with properties similar to natural protein-protein interactions were
kept. Only 1% of the preliminary designs fulfilled the new demands. Of these, six designs
were selected for experimental validation. Of these, two formed aggregates, one had affinity
that was too low to determine accurately, and three had affinities in the 100 – 300 µM
range.
Knockout mutations at the proposed interaction interface of the best variant and of the
kinase domain confirmed the proposed binding conformation. The model of the complex
suggested that the amino acids of helix 4 of the design interact with the kinase domain. Five
single mutations (Y52A, A55E, G56E, I58A, and F59A) all located in helix 4, decreased the affinity
of the design. A double mutant combining the F59A and G56E mutations had a strong effect
on the binding, almost abolishing the interaction. Additionally, analogous mutation of the
kinase domain verified a specific interaction. Again, five single mutants were prepared
(R438A, L470E, R471A, L473A, and Y474A,) with mutations all located at the proposed interaction
interface. With the exeption of R438A, all mutants show lower affinity for the design. The
strongest effect was seen for the single mutants L473A and L470E, which completely inhibited
complex formation. Since PAK1 has an open and a closed conformation, the affinity of the
variant for both structures was determined. It was found that the best design only binds the
open form of the kinase. If the affinities could be further increased, then these designs might
be useful as biosensors. Alternatively, they could function as agonists or antagonists in the
signaling pathway of the cell.

29
1.2.5 Computational Design of a Novel Protein Fold: TOP7
Like the computational design of catalysts, the design of receptors starts with a natural
protein scaffold which is modified for its new function. The de novo design of artificial
proteins from scratch that can perform novel functions has not been achieved yet. However,
an artificial protein without function has been generated.
The creation of an unnatural peptide fold represents an especially significant success for
computational design (52). A model of the new fold was created and the PDB database was
screened for secondary structure elements that fulfill its structural constraints. These
segments were connected to give preliminary designs. These were then optimized over
many iterations by scanning defined side chain rotamers and relaxing the peptide backbone
to find the best design. The optimization process of the best design altered 31% of its
residues without changing the backbone (RMSD of 1.1 Å). The resulting protein, TOP7, not
only has the intended α/β fold, but it is also extremely stable (52), demonstrating the power
of computational design to create novel proteins. Nevertheless, TOP7 does not perform any
function other than fold. Conferring activity to such scaffolds will require additional
advances in methodology.
1.2.6 The Future of Computational Design
Computational protein design represents an important step on the way to understanding
the sequence-structure-function relationships. Introduction of function into scaffolds is non-
trivial, because, as pointed out by Kuhlman et al., binding/catalytic sites are locally
suboptimal regions, and particularly challenging for structure prediction. Since the Rosetta
algorithm used to generate TOP7 optimizes packing of a protein, it is unsuited for the
introduction of a cavity with charged and hydrophilic amino acids, which are necessary
components of most active sites. Additionally, most programs overrate van der Waals
interactions compared to H-bonds or electrostatic interactions. Thus, globular proteins with
tight packing due to a lot of van der Waals interactions tend to be overrepresented in the
automated design process.
These problems are not limited to the TOP7 scaffold but are also reasons why
computational design has problems creating catalysts and receptors. Thus, computational
design still requires much trial and error. In computationally designed catalysts, activities
approaching those of catalytic antibodies have been achieved; for ligand binding,
computationally designed receptors are still far from attaining the affinities and specificity of
antibodies. That said, computation does afford useful starting points, and proteins that

30
exhibit a specific function can usually be improved by laboratory evolution. Moreover, even
failed experiments can help to improve the design algorithms.
The results obtained to date show that computational design has enormous potential.
Nevertheless, there are still many obstacles that need to be overcome in order to be able to
mimic natural biopolymers and their range of structures and functions.
1.3 Redesign of Proteins by Directed Evolution
Darwinian evolution is the oldest approach to design new catalysts and binding proteins.
This is the approach that was used to create all natural biomolecules. Since it is random, one
advantage is that no knowledge about protein structure is needed per se, although such
knowledge can be used to guide experiments in the laboratory. Evolutionary optimization
involves iterative cycles of mutagenesis, selection of the “fittest”, and amplification of these
variants. When only one protein is being optimized, only the gene of interest requires
randomization. The fittest variants are identified with appropriate screening or selection
systems and enriched by an amplification step. This type of cycle can be used to
continuously evolve proteins toward new functions. Different in vitro or in vivo methods may
be used in combination to evolve a protein (Figure 1-7) (3). Because the number of possible
protein variants is astronomically large, knowledge of the protein or its function can be used
to focus the randomization events to the most relevant regions. This semi-rational approach
can significantly decrease sampling requirements (53, 54).
1.3.1 Active Site Redesign: Sesquiterpene Synthase
Most enzymes catalyze one major reaction, although minor side reactions are often
observed. This promiscuity toward other substrates or reactions can be used to change the
reactivity scope of natural enzymes. For example, it is often easy to enhance one of the side
reactions, while impairing the original function. Interestingly, only a small number of
mutations may suffice to change reactivity completely. Saturation mutagenesis of the active
site of γ-humulene synthase is illustrative. As depicted in Figure 1-8, variants containing one
to five mutations completely altered the product distribution (10). This example shows that
only minor changes mostly in the active site can sometimes have large effects on enzyme
performance. Thus, many directed evolution experiments focus mutagenesis at active site
residues in order to reduce the library size. However, this is only possible if the active site
residues are known. Without this knowledge the gene of the protein must be randomly
mutagenized over its entire length.

31
Figure 1-7: Schematic overview of the different steps involved in directed evolution. Iterative cycles of
mutagenesis, selection, and amplification can be implemented in vitro or in vivo to evolve proteins in the
laboratory. The arrows indicate routes connecting the different options. (Scheme taken with permission
from (3))

32
1.3.2 Random Mutagenesis: Cytochrome P450
In nature, cytochrome P450 enzymes hydroxylate diverse metabolites. Arnold and
coworkers sought to convert an enzyme that hydroxylates a long chain fatty acid into an
enzyme that hydroxylates ethane to give ethanol. The enzyme was not understood well
enough to allow semi-rational modification, so random mutagenesis was employed on the
whole protein (55, 56). Since the natural substrate, the fatty acid, and the intended
substrate, ethane, differ in size evolution required many steps. Octane was first screened as
an alternative substrate, and once activity was detected, then the alkane length was further
decreased to propane, and finally to ethane. After random mutagenesis, the best clone was
subjected to saturation mutagenesis of single residues in the active site guided by a high-
resolution structure of another P450. Beneficial mutations were randomly combined and
screened for activity towards the surrogate substrate dimethyl ether. The best variant
Figure 1-8: Redesign of a promiscuous enzyme γ-humulene synthase, which changes its product scope
when one to five residues are mutated. γ-Humulene synthase binds E-E-farnesyl diphosphate and converts
it either to trans- or cis-farnesyl cation and diphosphate with the help of a divalent magnesium ion in its
active site. The cation can undergo multiple fates producing several terpenes, although the most
prominent is γ-humulene. Deprotonation of trans-farnesyl cation produces Z,E-α-farnesene or
Z-β-farnesene, whereas 10,1 cyclization gives sibirene. Cis-Farnesyl cation can lead to γ-humulene,
longifolene, and α-longipinene upon 11,1 cyclization. The 6,1 cyclization of cis-farnesyation yields
β-bisabolene. Only a small set of active site mutations is needed to shift the product distribution in favor of
one or the other of these various products (10).

33
contained 17 mutations, three of them at the active site, and was able to convert octane to
octanol, propane to propanol, and also – to a minor extent – ethane to ethanol. In contrast,
the parent P450 enzyme only accepted long chain fatty acids as substrates. This research
was highly application driven. The conversion of gaseous ethane into the more easily
transportable ethanol would open up exciting prospects for new energy and chemistry
resources, which is still virtually untapped. Although the activities are still too low for
practical purposes, these preliminary experiments establish the feasibility of evolving P450s
toward new functions and further improvements can be foreseen.
1.3.3 Redesign of Enzyme Topology: Monomeric Chorismate Mutase
Directed evolution is not restricted to changing the function of biomolecules. It can also
be used to alter the structure or the topology of a protein, keeping the natural activity intact.
For example, a chorismate mutase, which folds as a domain-swapped homodimer, was
successfully converted into a monomer by insertion of a 6 residue loop (57). The placement
of the loop was chosen by structural inspection. The readout for a successful fold was the
natural mutase activity, which depends on proper orientation of the helices to form a
functional active site. Less than 0.05% of the 206 possible sequences were able to position
the helices correctly, indicating the importance of loop sequences for protein structure and
function. Although these experiments successfully altered the topology of the enzyme,
subsequent characterization of the monomer showed that, while essentially as active as the
parent dimer, it possesses all the properties of a molten globule (58). This result highlights
the surprises that often arise in directed evolution experiments, since it was previously
assumed that only native-like proteins are able to catalyze reactions with high efficiency.
1.3.4 Directed Evolution is a Promising Aid to Design
Directed evolution is one of the most successful approaches for generating active
enzymes with efficiencies as good as their natural counterparts. In fact, activities of natural
enzymes can even be improved by directed evolution. However, a major challenge for such
endeavors is to find the optimized proteins in the random sequence populations and enrich
them relative to less successful variants. The success rate therefore rises or falls with the
selection or screening method used to identify favorable clones. If viable solutions are rare,
reducing the number of the possible variants in the screen (or selection) by semi-rational
approaches is often crucial for success (53). Such semi-rational approaches normally focus
on residues close to or in the active site. Further insights gained by computational analysis of
interaction networks can help to understand and control the effect of long-range
interactions in a protein (59). Iterative optimization in which directed evolution and

34
computational analysis and design are alternated is an attractive approach for the future.
This combination has the potential to increase the chances of finding interesting new protein
functions. As outlined in the next sections, a variety of powerful selection and screening
systems have been developed to be able to detect improved function.
1.4 Selection and Screening Systems
A powerful selection or screening system has a readout proportional to the efficiency of
the function of interest. The readout signal can be fluorescence, a color or mass change, or
cell growth (60). A method that links the amplification and the selection steps is called a
“selection system”. In contrast, a “screening system” requires analysis of the signal of
individual variants to decide which clones should be amplified for further rounds of
evolution (61). Since screening systems need no specific linkage to amplification, they are
very versatile and a variety of formats have been invented and optimized.
1.4.1 Screening Formats
1.4.1.1 Agar Plates
One of the oldest and most established screening systems relies on the hydrolysis of
5-bromo-4-chloro-3-indoxyl-β-D-galactopyranoside (XGal) catalyzed by β-galactosidase,
which hydrolyzes galactose from polysaccharides in Nature. For this assay, XGal is used as an
unnatural chromogenic substrate. Cells that express a functional β-galactosidase hydrolyze
the substrate, releasing 5-bromo-4-chloro-3-indoxyl, which oxidizes in air to indigo
(Figure 1-9) and forms a dark blue precipitate around cells producing active enzyme. Since
the indigo molecule does not diffuse away from the colony it is a great indicator for enzyme
activity. As long as the clones are well separated in space, it is easy to assign activity to a
specific cell. This assay allows detection and analysis of various β-galactosidases directly; the
reaction can also be used as a reporter if β-galactosidase activity can be coupled to other
processes. There are many other colorimetric reactions that are useful for monitoring
catalytic activity.
However, if the substrate and product are diffusible molecules, the clones to be assayed
have to be separated in space, for example in the individual wells of a microtiter plate.

35
1.4.1.2 Microtiter Plates
Screening with microtiter plates is among the most versatile screening techniques,
because it has the fewest assay limitations and is compatible with many signal read-outs.
However, it also has a relatively low throughput (103 -104 clones per assay). For facile signal
detection and acceptable signal-to-noise ratios, assays that are coupled to fluorogenic or
colorimetric indicators are particularly useful. Mass spectrometry (62), chromatography (63)
and even NMR spectrometry (64) can also be used to screen enzyme activities. However,
these techniques are generally more labor intensive, reducing the throughput. Such assays
are ideal if the desired activities are abundant in the randomized populations, but if active
clones are rare, low throughput can be a problem since only a subpopulation of the libraries
can be analyzed. Typically, microtiter plates contain 96 or 384 samples, and even if multiple
plates are screened the number of samples is far below typical library sizes. To address the
problem of low throughput silica gel plates have been developed (65). A robot dispenses 1 µl
reaction solutions onto the plate reducing the overall reaction volume and the space needed
for the screen. This approach is powerful, particularly if several substrates are screened
simultaneously, since the plates can be used more than once.
1.4.1.3 In vitro Compartmentalization
In vitro compartmentalization takes advantage of the versatility of microtiter plate assays
but greatly increases throughput. Samples are miniaturized by trapping enzyme and
substrates in individual water-in-oil droplets, which can be screened directly for activity
(66-68). The enzyme can be produced directly from its compartmentalized gene or in
encapsulated cells. Substrate is either introduced at the same time or by droplet fusion.
Most of the macroscopic laboratory steps are possible with lab-on-a-chip technologies (68).
The utility of this ultrahigh-throughput screening method for directed evolution was
demonstrated in proof of principle experiments on the evolution of a horseradish peroxidase
(4). A limitation of this technique is that not all of the methods are fully standardized, so
Figure 1-9: A colorimetric assay for β-galactosidase relies on the hydrolysis of 5-bromo-4-chloro-3-indoxyl-
β-D-galactopyranoside (X-Gal, 20) to galactose and 5-bromo-4-chloro-indoxyl 21, which air-oxidizes to form
the blue indigo derivative 22.

36
each experiment must be individually optimized. The substrates, in particular, have to be
tested for their compatibility because the lack of a physical barrier enables ready diffusion of
the substrate or product out of the droplet and into the oil phase or neighboring droplets.
Although lab-on-a-chip is still a rather new field, many of the procedures are already
becoming routine and more methods are being developed and improved every day.
1.4.1.4 Protein Display Methods
Several protein display methods have been developed to screen for ligand binding and
catalysis (69). All display methods differ from the previously mentioned methods in that they
do not link phenotype and genotype in space but through a tight interaction or a covalent
bond between the molecule to be detected (product or ligand) and the receptor molecule
which is, in turn, physically associated with its encoding gene. Screening is typically based on
capturing the best variants by tight binding interactions, consequently precluding catalytic
turnover. Catalyst improvement can be achieved – at least in principle – by increasing the
affinity for a transition state analog of the reaction, which should lead to a parallel increase
in catalysis (as discussed for catalytic antibodies). Alternatively, the product of the target
reaction has to become linked to the cell expressing the catalyst gene.
1.4.1.5 Ribosome Display and mRNA Display
Ribosome and mRNA display are two very similar display technologies using an in vitro
translation approach. Both methods allow large libraries to be screened (70, 71). The
difference between these two methods is how the protein is linked to its gene. For ribosome
display, an mRNA without a stop codon is translated, but translation stalls because
translated protein cannot be released from the ribosome in the absence of the stop signal.
The resulting ribosome-mRNA-protein complex can then be screened for interesting
properties. For mRNA display, a linker containing puromycin is attached to the 3’-end of the
mRNA. Puromycin is a translation inhibitor, and when the translation machinery reaches the
linker, the nascent polypeptide chain is transferred to the puromycin, covalently linking the
gene product to the message. Selection is the same for both methods. Variants with the
highest affinities for an immobilized ligand, a protein or a small molecule, are enriched and
their genes amplified by PCR. This in vitro approach offers the opportunity to screen very
large libraries (up to 1015 members), but it is rather sensitive and prone to artifacts caused
by the PCR amplification step, which may be biased toward some sequences.

37
1.4.1.6 Phage Display
Filamentous bacteriophages are stable at a range of pHs and temperatures and can be
amplified by infection of bacteria, which makes them attractive as workhorses for protein
display (72). Their DNA is packaged by coat proteins, which can be fused to the protein of
interest. Depending on which coat protein is used, the number of copies of the displayed
protein can be varied over a very wide range. In the case of phage M13, as few as five copies
(pIII, pVII, pVI, and pIX) or many thousands (pVIII) of particles per phage are possible. Phage
that bind best to ligand-coated beads are then enriched and allowed to infect bacteria for
gene amplification. This approach has been successfully applied to select and improve many
proteins, including antibodies as single-chain and Fab fragments (73, 74) .
Phage display has been used to identify C-terminal sequences of proteins, which are
recognized by PDZ domains in nature (75). Several consensus sequences were already
known, but Fuh et al. wanted to find new recognition pattern. They therefore synthesized a
heptapeptide library and fused it to the C-terminus of pIII coat protein of M13 phages. This
library was screened for binding to PDZ-2 domains. Peptides corresponding to the C-terminal
sequence of a natural binding partner bound PDZ-2 less tightly than the selected peptides.
One of these selected peptides differed by just one amino acid, which was responsible for
the increased binding affinity.
Another study used open-reading-frame phage display to identify novel cellular binding
partners that specifically interact with phosphatidylserine (PS). The RNA was extracted and a
cDNA repertoire was generated and ligated in the T7 phage vector. ELISA plates were coated
with PS for selection. After three rounds, the selectants were sequenced. Seventeen
selected sequences coded for 13 different proteins. Three of them were proteins of
unknown function, but the remainders were already known to bind PS. This strategy could
be used to identify important new biological networks (76).
1.4.1.7 Escherichia coli Display
Phage, ribosome and RNA display all use similar selection techniques that typically involve
recognition of immobilized ligands. Proteins can also be displayed on the surface of cells. In
this case, fluorescence activated cell sorting (FACS) can be used to screen for functional
variants, allowing analysis of individual clones and greatly increasing throughput.
Escherichia coli (E. coli) is probably the most prominent microorganism utilized by
scientists. It is therefore not surprising that this organism has been used as a display vehicle.
As a gram-negative bacterium, E. coli is not an optimal candidate for display experiments,
however, since the protein of interest has to pass through two membranes to be presented

38
on the cell surface. Despite this limitation several ways of displaying peptides (7 to 15 aa) on
E. coli have been published (77, 78). The most often used E. coli display method is called
“FliTrx”, where the peptide of interest is displayed as a fusion with flagellin and thioredoxin
(79). However, this type of fusion limits the display targets to peptides; proteins are not
displayable in this format. Other E. coli display techniques enable the display of scFv
fragments (80), but no method has been described that accommodates a large variety of
different protein scaffolds. Protein export and folding might be an issue.
1.4.1.8 Yeast-Surface Display
In contrast to E. coli display, yeast cell-surface display is a well-established method that
has been applied to several protein scaffolds (81, 82). In this method, the protein of interest
is produced as a C-terminal fusion protein with the Aga2 protein, which is exported and
forms two disulfide bonds with the periplasmic Aga1 protein. For quantification of display
efficiency, two tags flanking the protein of interest are typically used. The HA tag (a short
sequence from hemagglutinin), which can be detected via a mouse anti-HA antibody, is
inserted just after the Aga2 sequence; the c-myc-tag (a short sequence from the c-Myc
protein), which can be detected via a mouse anti-c-myc antibody, is placed after the protein
of interest (Figure 1-10 A). These interactions, like the binding of the receptor to target
molecules, can be easily assayed by FACS.
One of the most impressive demonstrations of the power of this technique involved
yeast cell-surface display and evolution of an anti-fluorescein scFv antibody to bind its ligand
with 50 fM affinity (83). Horseradish peroxidase (HRP) variants with enhanced
enantioselectivity have been evolved, as well. In order to select for active, enantioselective
HRPs, a radical reaction was exploited to trap the fluorescently labeled reaction product on
surface exposed tyrosines (Figure 1-10 B) (4). For a general catalytic activity screening
method, yeast cell-surface display combined with in vitro compartmentalization is
potentially much more versatile. This approach has been already used to select highly active
HRP variants in another evolution experiment (84).
1.4.2 Selection Formats
In contrast to screening systems, selection systems link protein function directly with the
amplification step. Such linkage allows routine analysis of 106 to 108 clones (3, 61). In vivo
selection systems can be based on auxotrophic strains that are unable to produce an
essential metabolite; provision of a catalyst that generates this compound then restores
prototrophy.

39
Such an approach has been used to analyze and redesign chorismate mutases (6, 57, 85,
86). This enzyme is essential for the biosynthesis of the amino acids phenylalanine and
tyrosine (87). Only cells coding for functional chorismate mutases can survive and
proliferate. Deletion of the gene encoding the natural mutase generates strains that are
auxotrophic for both phenylalanine and tyrosine. This selection system has been applied to
the design of chorismate mutases with simplified sequences and altered topologies as
described in the section 1.3.3.
A
B
Figure 1-10: Yeast cell-surface display based on enzyme activity. A) Horseradish peroxidase (HRP) is
displayed on yeast by fusion with the mating factor Aga2, which forms disulfide bonds to the periplasmic
Aga1 protein (4). The display of HRP can be visualized by the mouse anti-c-myc antibody, which is detected
with a fluorescently labeled anti-mouse antibody. The catalytic activity of HRP can be quantified by trapping
the fluorescently labeled product on the cell membrane. B) Mechanism of product trapping.
Tyrosylfluorescein is oxidized with hydrogen peroxide to give the tyrosylfluorescein radical, which reacts
with surface exposed tyrosines forming a covalent bond, and thereby being fixed to the cell membrane.

40
Another way to link selection to survival is to expose cells to toxic molecules. Only cells
coding for functional proteins able to degrade or otherwise neutralize the toxic molecule are
able to grow. The evolution of a protein container exploited this strategy. Lumazine synthase
from Aquifex aeolicus forms icosahedral capsids (88). A variant was rationally engineered to
specifically encapsulate a protein of choice via favorable electrostatic interactions. Co-
production of the modified negatively charged capsid protein and the toxic HIV protease,
which contained a large number of positive charges in the form of an arginine tag, led to
encapsulation and thus neutralization of the toxic protease. Evolution of the capsid by
random mutagenesis and selection increased its loading capacity by five to ten-fold for HIV
protease protecting the cells better from the toxic HIV protease.
While a working selection system is very powerful due to the coupling of selection and
amplification, the design of a selection system is more difficult than a screening system for
the same reason. When no selection system is available, screening methods have to be used.
Although screening methods generally have lower throughput, the use of FACS techniques
and advances in in vitro compartmentalization are pushing the boundaries of screening. For
example, fluorescence-activated droplet sorters have been described that have the same
throughput as a bacterial selection system (66).
1.5 Perspective on Protein Design
Several approaches have been developed to generate tailor-made proteins, including
antibody receptors, which are indispensible in pharmaceutical diagnostics nowadays. First
steps have also been taken toward the development of novel enzymes. Such molecules are
potentially of broad applicability. Natural enzymes including proteases, lipases, amylases and
cellulases, are important ingredients in detergents. Additionally, proteases, glycosidases and
lipases are used for leather production. Enzymes also play important roles in the production
of beer and fruit juice, for baking and other aspects of the food industry. Several such
proteins have been successfully optimized by directed evolution to improve their
performance, and many more should be amenable to improvement.
The long-term goal of protein engineers is the de novo design of proteins for a desired,
specific function. Thus, sequence-structure-function relationships need to be better
understood. Although our understanding of these systems has advanced over the last few
decades, many questions remain. Successes in structure prediction, for example, illustrate
the progress that has been made in better understanding the sequence-structure
relationship (52). Even so, the observation that roughly 25 to 40% of the proteome of
eukaryotes is structurally disordered complicates interpretations (89). While it has been

41
possible to (re)design proteins semi-rationally, successes in the design of new functional
proteins are still rare. Thus, more study is needed. The resulting insights into the specific
requirements need to generate catalytically active enzymes and specific, high affinity binding
proteins can be expected to help researchers ultimately reach the goal of being able to
design tailored catalyst and receptors on demand.
1.6 Goal of this Thesis
The goal of this thesis was to develop potentially general strategies for optimizing protein
function. Specifically, I was set the task of utilizing directed evolution to tailor the properties
of a catalytic antibody, a computationally designed protein receptor, and a topologically
redesigned enzyme with the properties of a molten globule.
In the first project, yeast cell-surface display and fluorescence activated cell sorting were
used to optimize a catalytic antibody with Diels-Alderase activity. These methods had
previously been successfully used to increase the affinity of a fluorescein-binding antibody
from the nanomolar to the femtomolar range. We wanted to investigate whether analogous
affinity maturation of the catalytic antibody 1E9 for its hapten could be accomplished, and if
so, whether the increase in hapten affinity translates into greater chemical efficiency. This
study is described in Chapter 2.
Building on the expertise gained in optimizing the catalytic antibody, we next wanted to
exploit yeast-surface display and fluorescence activated cell sorting to optimize a
computationally designed protein. Computational design has made impressive gains in the
past decade generating proteins with unnatural topologies and even catalysts for abiological
reactions. Nevertheless, the properties of these molecules are far from optimal and directed
evolution is a potentially useful tool for improving them. As described in Chapter 3, yeast
cell-surface display and fluorescence activated cell sorting are indeed a powerful
combination for increasing the affinity of a small, computationally designed protein that
binds a human p21-activated kinase1.
The final project of this thesis, outlined in Chapters 4 and 5, strategies for increasing the
stringency of genetic selection systems were investigated. Specifically, various methods for
regulating intracellular catalyst concentration were evaluated as a means to evolve highly
active enzymes. The most promising approach combined regulated gene expression and
protein degradation achieved by the N-terminal RepA tag. It was applied to the evolution of
a highly active molten globular chorismate mutase that had resisted previous optimization
efforts with the objective of elucidating how catalytic efficiency correlates with
conformational diversity.

42
Over the past few years directed evolution has proven to be a powerful strategy for
optimizing the properties of proteins. The work carried out in this thesis has examined
different ways of linking genotype and phenotype, which is essential to any directed
evolution experiment, with the aim of assessing their utility for the optimization of artificial
protein catalysts and receptors. The insights gained may benefit other researchers
interested in evolving biomacromolecules toward new functions.

43
2 Directed Evolution of a Diels-Alderase Catalytic Antibody
2.1 Introduction
2.1.1 Diels-Alderase Catalytic Antibody 1E9
Catalytic antibody technology has been very successful in designing novel catalysts for
unnatural reactions. Nevertheless, the activities of these catalysts are typically modest and
need further optimization. The catalytic antibody 1E9, a Diels-Alderase, is one such catalyst
(34). It promotes the pericyclic cycloaddition of a diene, tetrachlorothiophene dioxide
(TCTD, 5), and a dienophile, N-ethylmaleimide (NEM, 6) (Figure 2-1 A). Upon cyclization, a
high energy intermediate is transiently formed, which subsequently releases SO2 to generate
N-ethyltetrachloro(1,2)dihydrophthalimide (NETCdHP, 7). Under standard reaction
conditions, the dihydrophthalimide spontaneously oxidizes to form the aromatic
N-ethyltetrachlorophthalimide (NETCP, 9) as the final product. N-Ethylhexachloro-
norbornene derivative 10 was used as a hapten for antibody generation because it mimics
both the shape and the electrostatics of the high energy intermediate and flanking transition
states. Indeed, it is an excellent transition state analog (TSA) of the reaction (11, 35). The
crystal structure of 1E9 shows that the antibody provides excellent shape complementarity
to the TSA 11. Stabilization of the complex is achieved by extensive van der Waals
interactions, π-stacking between TrpH50 and the succinimide moiety, and a specific hydrogen-
bond between AsnH35 and a carbonyl group of succinimide (Figure 2-1 B). These same
interactions are believed to be important for preorganization of the diene and dienophile for
reaction and hence for the catalytic efficiency of the antibody. The effective molarity or this
system has been estimated to be 103 M, which is significantly higher than effective
molarities reported for other artificial Diels-Alderases (11). Nevertheless, a true enzyme
would presumably be much more efficient in catalyzing this reaction.
1E9 has been previously compared with two other antibodies, DB3 and 39A-11, which are
derived from the same germ-line family (11, 36). Antibodies from this family (VFM11 for
heavy chain and Vκ1A for light chain) typically bind small hydrophobic molecules. For
example, antibody DB3 binds progesterone (90, 91) and antibody 39-A11 was elicited with a
bicyclo[2.2.2]octane derivative and catalyzes another Diels-Alder reaction (92, 93)
(Figure 2-2). These three antibodies have many residues in common but there are some
crucial differences in their sequences. DB3 and 39-A11 both contain a tryptophan at position
H47, whereas this position is mutated to a leucine in 1E9. The leucine permits the adjacent
TrpH50 to rotate by 120° along the Cα-Cβ bond, which allowing for π-stacking with the
succinimide moiety of TSA. A second mutation SerL89Phe, which is also unique to 1E9, closes

44
a distinct cavity present in the other antibodies. Additionally, 1E9 has a methionine at
position H100b whereas this position is occupied by a phenylalanine in DB3 and 39-A11. The
effect of the WH47L, SL89F, and MH100bF mutations on the Diels-Alderase activity and TSA
affinity of 1E9 was analyzed to gain insight into structure-function relationships in this
system. The first two substitutions, WH47L and SL89F, abolish catalytic activity and decrease
hapten affinity by 3900-fold and 160-fold, respectively. Surprisingly, however the MH100bF
A
B
Figure 2-1: Catalytic Antibody 1E9. A) Antibody 1E9 catalyzed Diels-Alder reaction of tetrachlorothiophene
dioxide (TCTD, 5) and N-ethylmaleimide (NEM, 6) yields the high energy intermediate 7, which releases
sulfurdioxide, to give N-ethyltetrachloro(1,2)dihydrophthalimide (NETCdHP, 8). Subsequent oxidation
yields the aromatic product of N-ethyltetrachlorophthalimide (NETCP, 9). Antibody 1E9 was raised against
the hexachloronorbene hapten 10. For FACS experiments, the unlabeled TSA 11 was used as a competitive
inhibitor to displace the biotinylated derivative 24 from the active side of the surface-displayed antibody.
B) Crystal structure of antibody 1E9 (PDB:1c1e). The binding pocket exhibits high shape complementarity
to the bound TSA 11 (yellow). The active site residues are highlighted in purple.

45
mutation boosts Diels-Alderase activity by a factor of eight and increases the TSA affinity by
two-fold (36). The latter result suggests that this catalyst can still be optimized. To further
improve it, 1E9 has been subjected to multiple rounds of directed evolution using yeast cell-
surface display and fluorescence activated cell sorting. The goal of this project was to
continue this evolutionary optimization and to characterize the improved variants.
2.1.2 Yeast Cell Surface Display and Fluorescence Activated Cell Sorting for
the Evolution of 1E9
The correlation between TSA binding and catalytic efficiency underpins the catalytic
antibody approach. If the TSA is a good mimic of the transition state structure, then
increasing TSA affinity should lead to an increase in activity.
The method of choice for affinity maturation of an antibody is yeast cell-surface display
(YSD) in combination with fluorescence activated cell sorting (FACS), as described by
Boder et al. (94). In order to display an antibody on yeast, a single-chain antibody fragment,
the so called scFv (Figure 2-3 A), is produced as an Aga2 fusion protein and exported. Aga2
normally forms disulfide bonds with the periplasmic Aga1 protein, thus linking the scFv to
the surface of yeast (Figure 2-3 B). Since the receptor is physically associated with the cell
that produces it, genotype and phenotype are linked in a natural way. In order to quantify
the concentration of the displayed protein by FACS, tags were integrated into the protein
Figure 2-2: Antibody 31A11 catalyzes a Diels-Alder reaction between diene 25 and dienophile 26 (Top). The
bicyclooctane derivative 28 was used to elicit this catalyst. Antibody 39A11 derives from the same germ-
line family as the catalytic antibody 1E9, as does the antibody DB3, which binds progesterone 29. The active
sides of these two antibodies were compared with antibody 1E9.

46
Figure 2-3: Yeast cell-surface display of a single-chain antibody. A) Schematic structure of three antibody
formats. IgG is formed by two heavy chains (blue), and two light chains (cyan). They are connected by
disulfide bonds (yellow). The antibody binding site is formed by the variable regions of both chains (VL and
VH). The constant region (CL and CH) is not involved in ligand binding. The subunits CL1, VL, CH1, and VH are
called Fab. The single chain antibody fragment (scFv) is formed only by the VL and VH domains linked by
short peptide sequence. The linkage is important to provide a monomeric protein for yeast cell-surface
display. B) The scFv is fused to the mating factor Aga2, which forms disulfide bonds to the periplasmic
Aga1 protein. For FACS, the displayed scFv is visualized by a mouse anti-c-myc antibody that is detected
with a fluorescently labeled goat anti-mouse antibody. The affinity of the scFv for the TSA is quantified by
biotinylating the ligand and binding to fluorescently-labeled streptavidin.
A
B

47
fusion. The HA and c-myc tags, for example, can be detected via fluorescently labeled
antibodies. If the scFv 1E9 displayed on the cell surface is functional, it should bind a
biotinylated version of the hapten. Complex formation can then be detected with
fluorescently labeled streptavidin, which binds to the biotinylated hapten. The scFv variants
with highest affinities for the TSA should give the highest fluorescent signal, enabling FACS.
For the evolution of catalytic antibody 1E9, sorting was designed to capture variants with
increased binding affinities for the Diels-Alder TSA. High and low affinity variants can be
distinguished by two different strategies, “KD sorting” and “koff sorting” (Figure 2-4) (95).
Cells prepared for KD sorting are labeled with limiting hapten concentrations so that variants
with higher affinity are fully labeled whereas variants with lower affinity cannot bind the
hapten at this concentration. Stringency is increased by lowering hapten concentration in
Figure 2-4: Sorting strategies with FACS. Two approaches can be used to sort yeast cells displaying protein
with improved binding properties. If the expected KD value is above 10 nM the cells are incubated with the
labeled ligand at concentrations around the expected KD value (top), but if the affinity is higher, sorting for
slow koff rates are performed. The proteins are first saturated with labeled ligand, and a second non-
fluorescent competitor ligand is added (bottom). In both cases, the yeast cells exhibiting the highest
fluorescence are collected by FACS.

48
each selection round. Cells prepared for koff sorting are first fully labeled with hapten and
subsequently exposed to an excess of competitive ligand. Only cells with slow hapten release
stay labeled whereas the others lose their labeling. Selection stringency can be increased by
longer exposure times to the competitor. KD sorting can be applied for TSA affinities above
10 nM. For KD values below 10 nM, the strategy has to be changed to koff sorting. This limit
(KD < 10 nM) is dictated by the concentration of scFv molecules displayed on the cell surface.
For all labeling, the TSA concentration should be at least 10-times above the scFv
concentration. On a yeast cell, 10,000 to 40,000 proteins are displayed on average (94). In a
FACS experiment, 10-times more cells than the library size should be screened. This usually
corresponds to ca. 107 cells. In a 1 ml volume the scFv concentration is around 0.2 nM to
0.7 nM. The TSA concentration should therefore be at least 2 to 7 nM in order to be 10-times
above the scFv concentration. As a consequence, scFv molecules with KD values below 10 nM
are not easily distinguishable and cannot be enriched by FACS. In contrast, in a koff sorting
experiment it is possible to select binders with lower koff rate constants, which in turn
influences KD (KD = koff / kon). If kon does not change much, then a decrease in koff results in a
decrease in KD.
The affinity of the Fab and IgG forms of 1E9 are both around 0.1 nM for TSA.
Consequently, for directed evolution of the 1E9 scFv, a koff sorting strategy was chosen. For
this purpose, yeast cells were first saturated with biotinylated TSA. Addition of an excess of
un-biotinylated TSA allowed selection of scFv variants with low koff rates, since only such
receptors are resistant to exchange. After multiple rounds of enrichment, selected variants
with increased TSA binding could be obtained by Dr. A. Piatesi (96) and Dr. A. Hugenmatter
(97). They randomized the scFv 1E9 antibody by epPCR and sorted the population, steadily
increasing stringency by increasing the time the unlabeled TSA was allowed to compete and
by decreasing the size of sorting gates for FACS. The second round of evolution involved
further epPCR mutagenesis of the selected population, whereas the third and fourth rounds
exploited DNA shuffling to facilitate recombination of favorable mutations. After these four
rounds of mutagenesis and selection, clone 4.1 was isolated. Sequencing revealed six
mutations, AL19V, NL28T, FL94C, MH34L, EH72D, TH96D, four of which (NL28T, FL94C, MH34L, TH96D)
are located in the second shell outside the active site (Figure 2-5).
My task was to continue this evolutionary process until no further improvement could be
detected and then characterize the resulting clones to determine how well TSA affinity
maturation translates to higher catalytic efficiency. Such information could shed light on
how binding requirements differ from the requirements for catalytic activity. It would also
allow us to determine to what extent these artificial catalysts can be improved.

49
2.2 Results
2.2.1 Directed Evolution of scFv 1E9
2.2.1.1 Library Design and Sorting
To further improve TSA affinity of scFv 1E9, two new libraries were constructed. Library
LAA0 was created by back-shuffling the previously identified 4.1 clone with the scFv of 1E9
wt. For the second library, LBA0, the entire lib4-11 population (4th round of mutagenesis)
was back-shuffled with scFv 1E9 wt. The first library was generated because clone 4.1 was
the best variant selected up to that point (97). The second library provided a larger sequence
pool for evolution. This could be important, if evolution of clone 4.1 is at a dead end for
further evolution due to local optimum of this variant. The back-shuffling should eliminate
neutral and unfavorable mutations present in clone 4.1 or in the lib4-11 library. Library sizes
of 1 × 10⁶ and 2 × 10⁵ transformants were obtained for LAA0 and for LAB0, respectively.
Both libraries correspond to the fifth mutagenesis round of wt scFv 1E9 and each library
was sorted three times. The first sort was only based on TSA binding. Since the libraries were
freshly generated, a fraction of the library is produced as truncated or unfolded scFv
variants. These clones were removed from the population by only collecting cells that bind
Figure 2-5: Stereo view of the active site of Fab 1E9 with the hapten bound (yellow). Active site residues
are colored in magenta. The mutated residues in clone 4.1 that are close to the active side are shown in
green. The light chain is shown in cyan, the heavy chain in blue. In clone 4.1, four out of six mutations,
NL28T, FL98C, MH34L, and TH96D, are found in proximity of the active site.
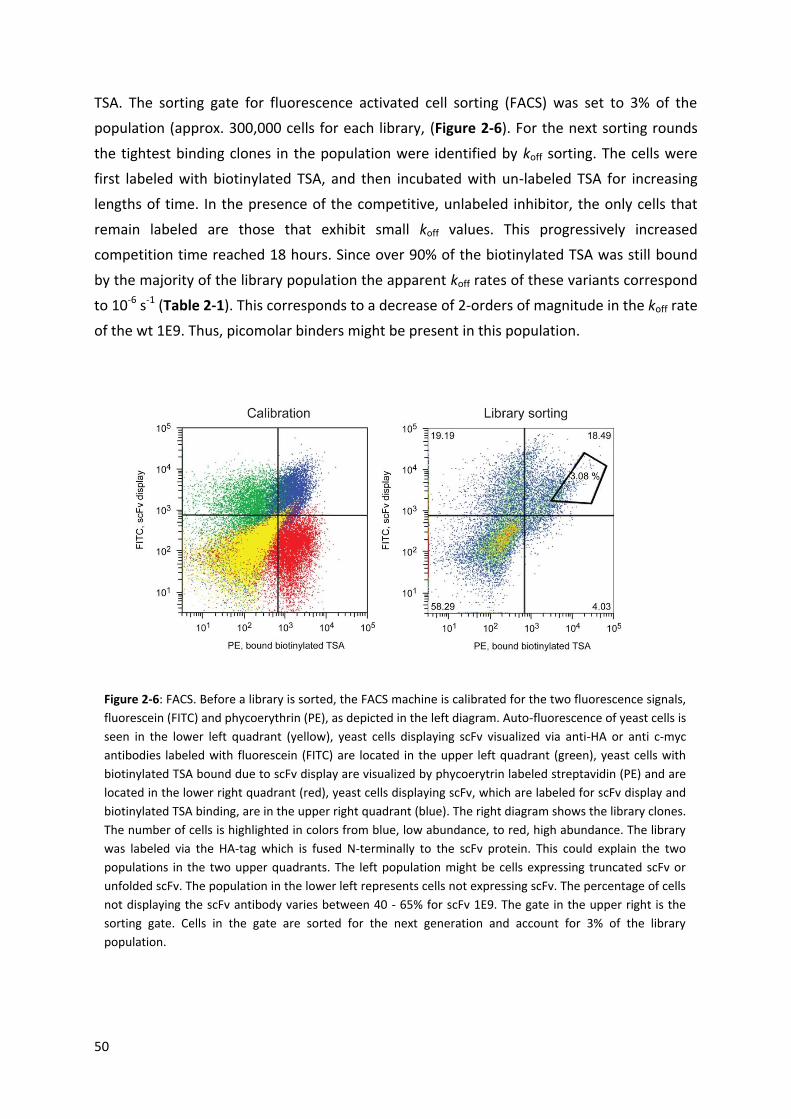
50
TSA. The sorting gate for fluorescence activated cell sorting (FACS) was set to 3% of the
population (approx. 300,000 cells for each library, (Figure 2-6). For the next sorting rounds
the tightest binding clones in the population were identified by koff sorting. The cells were
first labeled with biotinylated TSA, and then incubated with un-labeled TSA for increasing
lengths of time. In the presence of the competitive, unlabeled inhibitor, the only cells that
remain labeled are those that exhibit small koff values. This progressively increased
competition time reached 18 hours. Since over 90% of the biotinylated TSA was still bound
by the majority of the library population the apparent koff rates of these variants correspond
to 10-6 s-1 (Table 2-1). This corresponds to a decrease of 2-orders of magnitude in the koff rate
of the wt 1E9. Thus, picomolar binders might be present in this population.
Figure 2-6: FACS. Before a library is sorted, the FACS machine is calibrated for the two fluorescence signals,
fluorescein (FITC) and phycoerythrin (PE), as depicted in the left diagram. Auto-fluorescence of yeast cells is
seen in the lower left quadrant (yellow), yeast cells displaying scFv visualized via anti-HA or anti c-myc
antibodies labeled with fluorescein (FITC) are located in the upper left quadrant (green), yeast cells with
biotinylated TSA bound due to scFv display are visualized by phycoerytrin labeled streptavidin (PE) and are
located in the lower right quadrant (red), yeast cells displaying scFv, which are labeled for scFv display and
biotinylated TSA binding, are in the upper right quadrant (blue). The right diagram shows the library clones.
The number of cells is highlighted in colors from blue, low abundance, to red, high abundance. The library
was labeled via the HA-tag which is fused N-terminally to the scFv protein. This could explain the two
populations in the two upper quadrants. The left population might be cells expressing truncated scFv or
unfolded scFv. The population in the lower left represents cells not expressing scFv. The percentage of cells
not displaying the scFv antibody varies between 40 - 65% for scFv 1E9. The gate in the upper right is the
sorting gate. Cells in the gate are sorted for the next generation and account for 3% of the library
population.

51
At this point, several clones were sequenced from the final sorted LAA3d, LAA3e, LAB3d,
and LAB3e LAA3d libraries (Figure 2-7) (LAA3d: 3rd sort of LAA0, gate of 1%; LAA3e: 3rd sort
of LAA0, gate of 0.2%; LAB3d: 3rd sort of LAB0, gate of 1%; LAB3e: 3rd sort of LAB0, gate of
0.2%). Almost all variants contain the six mutations of clone 4.1 (97). Some exceptions were
found for library LAA3d and LAB3d sorted with a larger sorting gate. Another difference
between the two sorting conditions is the abundance of the NH52D mutation. Libraries sorted
with a 1% gate had an NH52D abundance up to 10%, whereas the NH52D abundance increased
to 40% in the libraries sorted with a 0.2% gate. Interestingly, this mutation is located in close
proximity to the active site (Figure 2-8) and could thus be relevant for binding. This site was
already examined in the Fab scaffold by Dr. A. Piatesi (36). For example, placing a positively
charged residue, either lysine or arginine, at this site does not alter the affinity for the TSA,
but it reduces activity somewhat: 25% for the NH52K variant and 35% for NH52R variant.
Introduction of a negatively charged residue at this site, as in the selected NH52D variant,
might similarly effect binding or catalysis to some extent.
2.2.1.2 Activity Screen on Yeast Surface and in vitro
To assess the success of the evolutionary optimization eight representative clones, K1, K8,
K10, L4, L5, M2, and M9 were chosen based on their protein sequence for further
characterization (Figure 2-7). All contain the six mutations of clone 4.1 in combination with
additional mutations often found more than once in the libraries. For example, K1 and M2
have additionally the interesting NH52D mutation.
Library FACS round Competition time Sorting gate
LAA0 0 LAB0 0 LAA1 1 - 3.0% LAB1 1 - 3.0% LAA2 2 30 min 1.0% LAB2 2 30 min 1.0% LAA3d 3 o/n 1.0% LAA3e 3 o/n 0.2% LAB3d 3 o/n 1.0% LAB3e 3 o/n 0.2%
Table 2-1: Sorting conditions of the scFv 1E9 libraries with FACS. LAA0 is the back-shuffling library of clone
4.1 and wt scFv 1E9. LAB0 is the back-shuffling library of lib4-11 and wt scFv 1E9.

52

53
Figure 2-7: Protein alignment of the libraries LAA3d, LAA3e, LAB3d, and LAB3e with the wt scFv 1E9
sequence and the sequence of clone 4.1. All three libraries come from the 3rd sort of library LAA0 or LAB0.
A 1% sorting gate was used for LAA3d and LAB3d. A 0.2% sorting gate was used for LAA3e and LAB3e. The
active site residues are highlighted in purple, the mutations found in clone 4.1 in green, and the linker
sequence between the light and the heavy chain of the antibody in yellow. The clones K1, K8, K10, L4, L5,
M2, M3, and M9 were chosen as representatives for the activity screen.
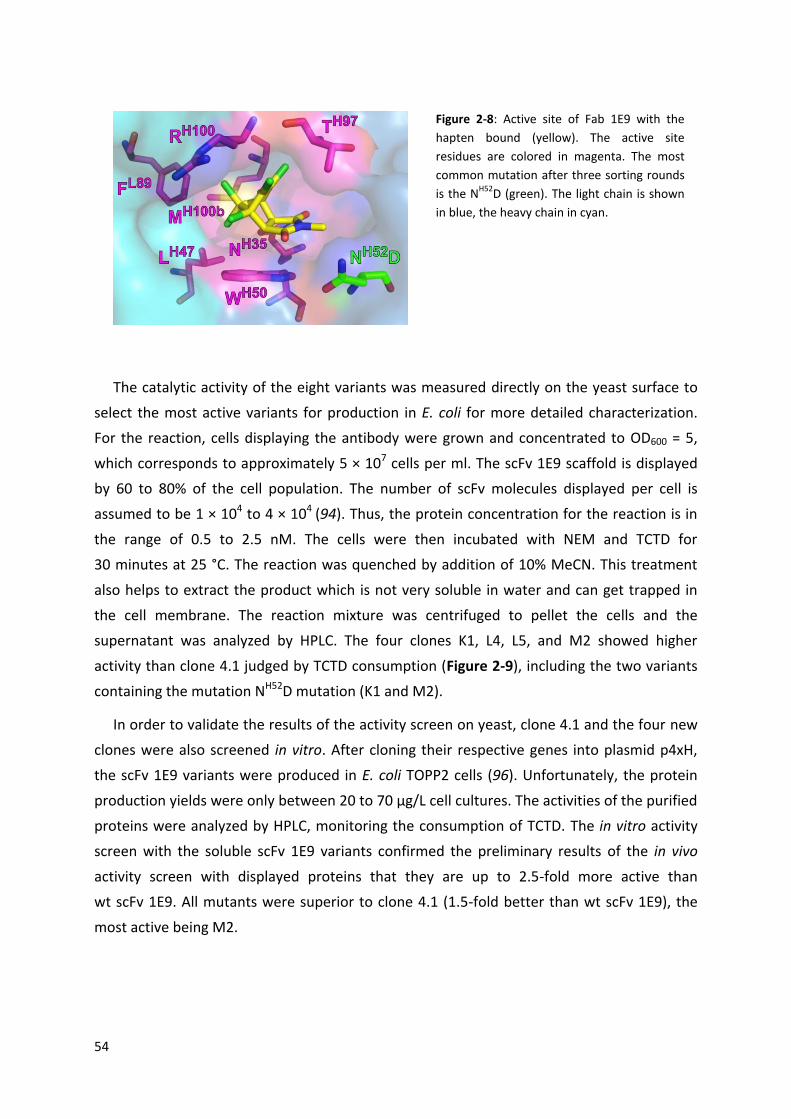
54
The catalytic activity of the eight variants was measured directly on the yeast surface to
select the most active variants for production in E. coli for more detailed characterization.
For the reaction, cells displaying the antibody were grown and concentrated to OD600 = 5,
which corresponds to approximately 5 × 10⁷ cells per ml. The scFv 1E9 scaffold is displayed
by 60 to 80% of the cell population. The number of scFv molecules displayed per cell is
assumed to be 1 × 10⁴ to 4 × 10⁴ (94). Thus, the protein concentration for the reaction is in
the range of 0.5 to 2.5 nM. The cells were then incubated with NEM and TCTD for
30 minutes at 25 °C. The reaction was quenched by addition of 10% MeCN. This treatment
also helps to extract the product which is not very soluble in water and can get trapped in
the cell membrane. The reaction mixture was centrifuged to pellet the cells and the
supernatant was analyzed by HPLC. The four clones K1, L4, L5, and M2 showed higher
activity than clone 4.1 judged by TCTD consumption (Figure 2-9), including the two variants
containing the mutation NH52D mutation (K1 and M2).
In order to validate the results of the activity screen on yeast, clone 4.1 and the four new
clones were also screened in vitro. After cloning their respective genes into plasmid p4xH,
the scFv 1E9 variants were produced in E. coli TOPP2 cells (96). Unfortunately, the protein
production yields were only between 20 to 70 µg/L cell cultures. The activities of the purified
proteins were analyzed by HPLC, monitoring the consumption of TCTD. The in vitro activity
screen with the soluble scFv 1E9 variants confirmed the preliminary results of the in vivo
activity screen with displayed proteins that they are up to 2.5-fold more active than
wt scFv 1E9. All mutants were superior to clone 4.1 (1.5-fold better than wt scFv 1E9), the
most active being M2.
Figure 2-8: Active site of Fab 1E9 with the
hapten bound (yellow). The active site
residues are colored in magenta. The most
common mutation after three sorting rounds
is the NH52D (green). The light chain is shown
in blue, the heavy chain in cyan.

55
2.2.1.3 Kinetics of 1E9 Variants
scFv M2, the most active clone, was further characterized. The protein sequence differs
from wt 1E9 by eight mutations (AL19V, SL27N, NL28T, FL94C, MH34L, NH52D, EH72D, TH96D). Two of
these mutations (SL27N and NH52D) were newly introduced by the last round of directed
evolution. The properties of M2 were compared to the wt 1E9 scFv and another 1E9 variant,
scFv MH100bF (36). The latter was generated when the Fab 1E9 protein sequence was
compared with the closely related steroid binding antibody DB3 (90, 91) and Diels-Alderase
39-A11 (92, 93) and is 8-times more active than the wt construct 1E9.
To generate sufficient amounts of protein for these studies, the scFv antibodies were
produced by high-density fermentation. This procedure yields 50-times more protein than
shaker flasks, over 0.8 - 2 mg/l cell culture. The molecular masses of the purified proteins
were confirmed by mass spectrometry. During the directed evolution experiments,
phenylalanine was mutated to cysteine in wt scFv M2, and this residue becomes modified
Figure 2-9: Screening of selected scFv variants (from libraries LAA3d, LAB3d, and LAB3e) displayed on
yeast with the HPLC based activity assay. Background activity was measured with uninduced cells
containing a plasmid for wt scFv 1E9 display. The decrease in TCTD and the increase in NETCP were
determined. The black line corresponds to the rate of product formation by clone 4.1, the grey line of TCTD
is consumption by clone 4.1. Although the decrease in TCTD and the increase in NETCP should be the
same, the formation of NETCP is often slower than expected. This is due to solubility problems with this
compound. The concentration of NEM is also shown. For all measurements the NEM concentration is in
the same range, except for L5 which explains the high rates for TCTD and NETCP. The conditions for the
reaction were: cell density OD600 = 5, [TCTD] = 150 µM, [NEM] = 3 mM, in 20 mM NaOAc pH5.5,
50 mM NaCl, reaction time = 30 min at RT.

56
with glutathione when the protein is produced in E. coli. In contrast, wt scFv 1E9 and
scFv M100bF retain the original phenylalanine and are not modified. As shown in Figure 2-8
the site of modification is quite close to the active site, and could influence affinity and/or
activity.
Steady-state kinetics were determined using an iodine-starch assay (Table 2-2), which is
continuous and more sensitive than the HPLC based assay. This indirect colorimetric method
relies on bleaching of the blue iodine-starch solution by SO2, a by-product of the catalyzed
reaction. 1E9 MH100bF is the most active variant. The evolved variant M2 is less active but
exhibits a 3-fold higher activity than wt 1E9 scFv. These relative activities mirror those
determined for the catalysts displayed on yeast. Activity was also determined in the
presence and absence of the reducing agent DTT using the HPLC assay to assess the effect of
glutathionylation on M2. Natural disulfide bonds of the scFv are deeply buried and should
therefore withstand this treatment. The experiment revealed no difference in activity
between modified and unmodified antibody, so the modification cannot be the cause of the
moderate increase in activity seen for this clone.
2.2.1.4 Affinity of 1E9 Variants
Although the selection conditions for the final sorting round utilized a TSA competition
time of 18 h at RT, ca. 90% labeling of the cells was observed. In theory, this should reflect a
koff value below 10-6 s-1. In order to determine how the koff improvement influences KD, the
affinity of scFv M2 for the hapten was determined and compared with analogous values
obtained with wt scFv 1E9 and the MH100bF variant.
Since the previous method used by Dr. A. Piatesi (96) is not sensitive enough for the
expected affinity, a new affinity determination method was established. The previous
Antibody kcat (min-1)
KM(NEM) (mM)
kcat/KM(NEM) (M-1min-1)
IgG 1E9 a) 4.0 ± 0.1 8.4 ± 0.5 480 Fab 1E9 a) 3.7 ± 0.1 9.0 ± 0.6 410 Fab M100bF a) 25 ± 1.0 7 ± 1 3500 scFv 1E9 3.3 ± 0.4 12.4 ± 3.0 270 scFv M100bF 11.3 ± 0.4 5.3 ± 0.5 2100 scFv M2 9.2 ± 0.2 11.9 ± 0.7 780 a) Published data (29)
Table 2-2: Steady-state kinetic parameters for 1E9 variants. Kinetics were determined using the iodine-
starch assay, described in chapter 2.2.1.2.

57
method relied on the fluorescence quenching of TrpH50 upon TSA binding. The new approach
takes advantage of the fluorescence change observed when a TSA-fluorescein derivative
(TSA-fl) binds to the protein. The extinction coefficient of fluorescein (ε (fluorescein, 490nm) :
68,000-73,000 M-1 cm-1, depending on solution conditions) is higher than that of
Trp (ε (Trp, 280nm) : 5,500 M-1 cm-1), which should increase the sensitivity of the assay. The new
method was tested with wt Fab 1E9 and afforded the published KD values (36) (Table 2-3)
and showed a much higher signal. Thus, the method based on TSA-fluorescein is suitable for
determination of KD in the pM range.
The KD value obtained for scFv M2 (0.37 ± 4 nM) is not significantly different from the KD
value for wt scFv 1E9 but is substantially higher than the value obtained for the M100bF
variant (40 pM) (Table 2-4). The binding interaction between M2 and TSA-fl took longer to
reach equilibrium than the wt 1E9 and TSA-fl interaction, which indicates a slower kon rate
constant for M2. Therefore, in order to determine kon and koff, the association of TSA-fl to M2
Fluorescence probe
Constant Concentration
(nM) Titration
KD (pM)
TrpH50 ex: 290 nm em: 340 nm
Antibody (Fab 1E9)
26 TSA 100 ± 10
Fluorescein ex: 490 nm em: 520 nm
TSA-fl
20 Antibody (Fab 1E9)
20 ± 10
5 40 ± 20
0.5 70 ± 20
Table 2-3: Comparison of two TSA binding affinity determination methods. One method relies on the change
in fluorescence of TrpH50 when TSA binds to the antibody. The second method monitors the fluorescence
change of fluorescein attached to TSA (TSA-fl) upon binding the antibody. Since fluorescein is a much better
fluorophore than Trp, this method is more sensitive. The fluorogenic probe is kept constant and the binding
partner is titrated.
Antibody KD
(pM) kcat/KM(NEM) (M-1min-1)
IgG 1E9 a) 570 ± 30 480 Fab 1E9 a) 30 ± 10 410 Fab M100bF a) 80 ± 70 3500 scFv 1E9 390 ± 40 270 scFv M100bF 40 ± 20 2100 scFv M2 370 ± 40 780 a) Published data (29)
Table 2-4: Binding affinity of 1E9 variants. TSA binding affinity was determined using antibody titration
monitoring the change in fluorescence of TSA-fl (constant), described in chapter 2.4.8.2 and chapter 2.4.8.3.

58
at different M2 concentrations was measured and analyzed. A kon value of 2.9 × 10⁶ M-1s-1
was found, which is almost 10-times lower than kon for wt Fab 1E9 (Table 2-5). Furthermore,
the koff is 6.9 × 10⁻⁴ s-1, similar to the koff value for wt Fab 1E9 and at least two orders of
magnitude higher than the rate constant estimated for the yeast-displayed catalyst. The
difference in the determined koff values for displayed protein and protein in solution is more
difficult to explain. One possibility is that the effective concentration of the competitive
ligand is perturbed in the in vivo sorting because of additional interactions with the cell
membrane. Since the competitor is small and hydrophobic, it may bind to the membrane,
reducing its effective concentration. Using higher TSA concentrations or repetitive additions
of the competitor could be a way to test this hypothesis. Another explanation is that post-
translational modification of CL94 with glutathione perturbs binding of the fluorescein
modified probe. However, the affinity of the un-modified antibody was never determined.
Nor is it certain that CysL94 is modified in both E. coli and yeast. A more common
modification for yeast would be glycosylation and we have observed glycosylations of other
antibodies produced in yeast. Depending on where it is introduced, a carbohydrate could
stabilize the complex of the displayed protein with the biotinylated TSA.
2.2.2 Directed Evolution of scFv MH100bF
After five rounds of mutagenesis and selection we were able to increase the catalytic
activity of scFv 1E9 3-fold. This increase is similar to that achieved by the single MH100bF point
mutation at the active site (36). Since the latter mutation is beneficial for the scFv scaffold,
we wondered whether scFv MH100bF would be a better starting point for directed evolution.
We therefore randomized scFv MH100bF by epPCR to generate a library containing
3 × 10⁶ clones (LBA0). The mutation rate at the genetic level was 0.5% (corresponding to
ca. 4 mutations/gene) and at the protein level 1.1% (2.9 mutations/protein). The library was
sorted three times by FACS with shorter labeling times for biotinylated TSA to prevent slow
binders (Table 2-6). Sequence alignment of selected clones from the final sort revealed
Antibody kon x 104 (M-1s-1) (TSA-fl)
koff x 10-4 (s-1)
(TSA-fl)
KD (pM)
[TSA-fl] = const.
KD (pM)
[Fab] = const.
wt Fab 1E9 2700 (calc.) 10.9 ± 0.3 40 ± 20 100 ± 10
scFv M2 370 ± 40
n.d. 290 ± 20 6.9 ± 0.4 240 (calc.)
Table 2-5: Comparison of the binding kinetics of wt 1E9 with the evolved variant M2.

59
Name FACS round
Labeling time
Competition time
[TSA] (µM)
Sorting gate
LBA0 0 LBA1 1 5 min RT 50 min 0.05 1.5 – 2.0% LBA2 2 5 min RT 2 h 0.05 1.0% LBA3 3 3 min RT 12 h 0.08 0.5% LBB0 0 LBB1 1 1 min on ice no 2.0% LBB2 2 1 min on ice 1.5 h 0.5 1.0% LBB3 3 1 min on ice 3x 1.5 h 3x 0.5 0.7%
Table 2-6: Sorting conditions of the scFv MH100bF libraries with FACS.
Figure 2-10: Sequence alignment of 10 selected clone of the LBA3 library compared with wt 1E9, MH100bF
and M2.

60
several mutations present in clone M2 (Figure 2-10). Nevertheless, none of the 60 selected
clones screened for activity had significantly higher catalytic turnover rates than the
scFv MH100bF template (Figure 2-11). Since the sequences contained several conserved
mutations, a new mutagenesis round was performed by DNA shuffling (98) to investigate
whether combining several of these substitutions might have a beneficial effect on binding
and catalysis.
The gene pool of LBA3 (3rd sort of LBA0) was subjected to DNA shuffling followed by
epPCR. The newly created library contained 2 × 10⁵ transformants (LBB0). The sorting
stringency was increased compared to the first round by shortening the labeling times from
5 minutes to 1 minute, using low temperature and higher concentrations of unlabeled TSA.
For the final sort, cells were incubated for 1.5 hours with three portions of unlabeled TSA at
10-fold higher concentration than used in the experiments with wt scFv 1E9. The tightest
binding variants were isolated and 15 representative clones were sequenced. Several
mutations from the previous round were successfully recombined (Figure 2-12).
Additionally, novel conserved mutations appeared during this round (Figure 2-13).
The impact of these new mutations on the catalytic efficiency was assessed on yeast using
the HPLC based activity screen. Unfortunately, none of the selected variants catalyzed the
reaction significantly faster than scFv MH100bF (Figure 2-14).
Figure 2-11: Screening of scFv variants (from LBA3 library) displayed on yeast with the HPLC based activity
assay. TCTD consumption after 20 min at 25 °C is shown. The scFv MH100bF is used as a control (black). The
first 12 scFv MH100bF samples analyzed come from different yeast culture batches and demonstrate the
reproducibility of the screening method. Each screen of 10 clones is prepared at the same time, starting
and ending with the control protein scFv MH100bF.

61
Figure 2-12: Sequence alignment of 15 selected clone of the LBB3 library compared with wt 1E9, MH100bF
and M2.

62
2.3 Conclusions
Antibodies can be raised against small molecules which they bind very specifically with
nanomolar affinities. Since enzymes catalyze reactions by stabilizing the rate-limiting
transition states, Jencks proposed that antibodies elicited by stable transition state analogs
(TSAs) would similarly catalyze the corresponding transformations (21). Since 1986 this
approach has been successfully applied to a large number of chemical reactions; however,
Figure 2-13: Analysis of sequence alignment reveals the frequency of mutations which are found more
than once in library LBB3 and how they enrich from library LAB3 to LBB3.
Figure 2-14: Screening of scFv variants (from LBB3 library) displayed on yeast with the HPLC based activity
assay. TCTD consumption after 15 min at 30 °C is shown. The control scFv MH100bF protein is indicated in
black.

63
the activities of the resulting catalysts are typically moderate. There are a number of
reasons. First, TSAs are inevitably imperfect mimics of true transition states, since they have
to be stable molecules. As a result, this strategy for catalyst design is indirect. Second,
antibody generation by the immune system is biased, favoring an overrepresentation of
tyrosine and tryptophan residues and a depletion of valines in the immunoglobulin binding
pocket (99, 100). As a consequence, antibodies generally lack catalytic residues and special
strategies are needed to induce them, as in the Kemp-eliminase described in Section 1.1.2
(2, 31, 101, 102). Finally, antibody-antigen affinities are typically in the nanomolar range,
whereas enzymes bind their transition states much tighter. Increasing the affinity of first
generation antibodies for the TSA might therefore lead to more effective catalysts.
Since the immune system cannot provide antibodies with TSA affinities much below 1 nM,
other methods for enhancing affinity are necessary. In one impressive example, the affinity
of a fluorescein-binding antibody was increased from the nanomolar to the femtomolar
range using YSD and FACS for the directed evolution experiment (83). In this study, we
applied the same method for the optimization of the Diels-Alderase 1E9 as a model catalytic
antibody. By increasing its binding affinity for the TSA to a similar extent, some fraction of
the enhanced binding energy might be used for more efficient catalysis.
Catalytic antibody 1E9 accelerates the cycloaddition reaction between tetrachloro-
thiophene dioxide and N-ethylmaleimide. We successfully displayed a single-chain version of
this antibody (scFv) on the surface of yeast cells, and subsequently subjected it to multiple
rounds of mutagenesis and FACS. Variants were obtained that seemingly exhibited much
tighter TSA binding. For example, during the optimization process the koff values apparently
decreased by two orders of magnitude to 10-6 s-1. The sequences of selected variants
revealed sequence conservation at distinct sites, consistent with successful evolution.
Unfortunately, when soluble 1E9 variants were characterized in vitro the improvements
were much smaller. The koff was only slightly lower than for the parent antibody. Because
the kon value decreased to a similar degree, directed evolution provided little net change in
affinity. As a consequence, the catalytic activity of the antibody only increased by a modest
3-fold compared to its progenitor. A similar increase in activity was previously obtained by a
single point mutation of MetH100b to a phenylalanine at the active site. Unfortunately,
directed evolution experiments using the MH100bF mutant as a template were no more
successful than with wt 1E9.
Although YSD and FACS have been successfully used to optimize many other proteins
(103, 104), our experiments with antibody 1E9 did not afford TSA binders in the femtomolar
range. Thus, big changes in catalytic activity were not observed. Inherent problems with the

64
immunoglobulin scaffold in general, or perhaps with the specific antibody used in this study,
may account for these results. Only few antibodies have been reported that bind small
molecules with sub-nanomolar affinity. Additionally, the selection strategy itself may have
been problematic. The observed differences between protein displayed on yeast and protein
in solution certainly raise concerns about the reliability of the sorting method for optimizing
tailor-made catalytic antibodies.
In the future, more effective strategies will have to be developed to identify the tightest
binding proteins in libraries of antibodies. Direct high-throughput screening for catalytic
activity would be even more helpful. Recent advances in computational design have been
used successfully to introduce catalytic activity into various protein scaffolds other than the
immunoglobulin fold. These other scaffolds may prove to be much easier to produce and
evolve than antibodies in microorganisms.

65
2.4 Methods
2.4.1 Cell Strains
For general cloning and plasmid amplification E. coli XL1Blue (endA1 gyrA96(nalR) thi-1
recA1 relA1 lac glnV44 F'[::Tn10 proAB+ lacIq Δ(lacZ)M15] hsdR17(rK-mK+)) (Stratagene)
(105) or XL10Gold (endA1 supE44 recA1 thi-1 gyrA96 relA1 lac Hte Δ(mcrA)183 Δ(mcrCB-
hsdSMR-mrr)173 tetR F'[proAB lacIq Δ(lacZ)M15 Tn10(TetR Amy CmR)] ) (U.S. Patent Nos.
6,706,525, 5,512,468 and 5,707,841 and patents pending and equivalent foreign patents)
were used. YSD was performed with the S. cerevisiae strain EBY100 (a, GAL1-AGA1:: URA3
ura3-52 trp1 leu2Δ1 his3D200 pep4:: HIS2 prb1Δ1.6R can1 GAL) (94). Proteins were
produced with the E. coli strain TOPP2 (Rifr *F’ proAB lacIqZΔM15 Tn 10 (TetR)]).
2.4.2 DNA Manipulation
Molecular cloning was performed according to standard procedures (106).
Oligonucleotides were synthesized and purified by Microsynth. Chain termination chemistry
(107) was applied for DNA sequencing using BigDye Terminator Cycle Sequencing Kit v3.1
and ABI prism 3100 Genetic Analyzer (PE Applied Biosystems).
2.4.3 Plasmid Constructions
The plasmid pCT-1E9 was obtained from Dr. A. Hugenmatter. The construction is
described in his PhD thesis (97). The plasmid was derived form pCT-CON (82), which is a
shuttle vector for YSD. pCT-1E9 codes for the single chain variant of the 1E9 antibody. The
pCT-VarA codes for VarA, which corresponds to clone 4.1 in the PhD thesis of
Dr. A. Hugenmatter. This variant was selected after four rounds of mutagenesis and
selection by YSD and FACS. For periplasmic protein production the plasmid p4xH-1E9Fab
was used and is a progenitor of the p4xH-M13 plasmid (108) and constructed by Dr. A.Piatesi
(96). Protein expression is under the control of the PhoA promoter allowing a cell growth
dependent transcription. The plasmid p4xH-1E9scFv codes for the wt scFv 1E9 gene. The
gene of scFv 1E9 was amplified with the primers MB070518sphI (5’-GAACA AAAGC TTATT
TCTGA AGAGG ACTTG CATCA CCATC ACCAT CACTA ATAGG CATGC ACCAT TC) and
MB070518sacI (5’-TGGTT CTGCT AGCGA GCTCG TGATG) from the pCT constructs. After
digestion with SphI and SacI the insert was cloned into the (SphI/SacI) p4xH backbone. In
analogy, the plasmid p4xH-M2 was constructed, however, instead of pCT-1E9scFv the gene
derives from pCT-M2. To generate the plasmid p4xH-MH100bF, the mutation MH100bF was
introduced into the scFv 1E9 gene by overlap extension PCR. The first two gene fragments
were amplified with the primers sets MB070518sphI/H100brv (5’-AGTAG TCGAA AGCCC

66
TCACT ATCGT) and MB070518sacI/H100bfw (5’-ACGAT AGTGA GGGCT TTCGA CTACT). The
whole gene was assembled with the outer primers MB070518sphI/MB070518sacI, digested
with SphI and SacI and ligated in the backbone of p4xH (SphI/SacI).
2.4.4 Library Construction of wt scFv 1E9
The library LAA0 is based on back-shuffling (98) of clone 4.1 and wt scFv 1E9. Clone 4.1 is
the best member of library lib4-11 (4th round of mutagenesis) generated by
Dr. A. Hugenmatter (97). LAB0 is also a back-shuffling library, but instead of clone 4.1 the
whole lib4-11 library was used for shuffling. For both libraries the templates and wt 1E9
were amplified by PCR with the outer primers YD-8 (5’-GTACT CTTTG TCAAC GACTA CTAT)
and YD-9 (5’-AAGTA TGTGT AAAGT TGGTA ACGG). Each PCR product was digested
individually until the gene fragments had an average size between 50 and 150 bp. The gene
fragments were first purified on a YM-100 spin column, collecting the flow though (cutoff
125 bp). The flow-through was then loaded on an YM-30 column (cut off 50 bp) to
concentrate the sample and to remove small gene fragments. The concentrated fragments
(50 - 125 bp) were reassembled by PCR. For LAA0 the fragments of scFv 1E9 and of clone 4.1
and for LAB0 the fragments of scFv 1E9 and of lib4-11 were mixed 1:1. The assembly PCR
was performed in the absence of primers [2 min at 95 °C, (0.5 min at 95 °C, 0.75 min at 42 °C,
3 min at 72 °C)×40, 10 min at 72 °C]. Subsequently, the inner primers YD-1 (5’-GGCAG CCCCA
TAAAC ACACA GTAT) and YD-12 (5’-GTACG AGCTA AAAGT ACAGT GGGA) were added to
amplify the reassembled genes [2 min at 95 °C, (0.5 min at 95 °C, 0.5 min at 55 °C, 1 min at
72 °C)×25, 10 min at 72 °C]. After electroporation into EBY100 (82), the library sizes were
1 × 10⁶ for LAA0 and 2 × 10⁵ for LAB0.
2.4.5 Library Construction for the MH100bF 1E9 scFv
The scFv gene of MH100bF 1E9 was mutagenized twice by epPCR (GeneMorph II Random
Mutagenesis Kit, Stratagene) with the primers YD-8 and YD-9 to generate library LBA0 to
obtain a final mutation frequency of 5 mutations/kb (approx. 5 mutations/gene). The library
size was 3 × 10⁶ for LBA0 with a mutation rate of 0.5% on the DNA level and 1.1% on the
protein level.
2.4.6 Flow Cytometry and Fluorescence Activated Cell Sorting
EBY 100 yeast cells containing the pCT plasmid were incubated in 5 ml SD-CAA (pH 6)
(20 g/l glucose, 6.7 g/l yeast nitrogen base, 5 g/l casamino acids, 10.19 g/l Na2HPO4∙7H2O,
8.56 g/l NaH2PO4∙H2O) for one or two days at 30 °C, 250 rpm. To induce protein expression
which is under the control of the GAL promoter the medium was changed to 5 ml SG-CAA
(pH 6) (20 g/l galactose replacing glucose) and diluted to OD600 = 1. The protein was

67
expressed for two days at 20 °C, 250 rpm. For flow cytometry 2.5 × 10⁶ cells (OD600 = 1
represents 107 cells/ml) were collected and washed with phosphate-buffered saline (PBS)
containing 0.1% bovine serum albumin (BSA) at pH 7.5. Afterwards, the cells were incubated
with 1 μM biotinylated TSA for 30 min at 25°C. However, the libraries LBB0 to LBB3 were
incubated with 1 μM biotinylated TSA for only 5 min on ice. After washing, the cells were
incubated with appropriate amounts of unbiotinylated TSA (0.05 µM to 0.5 µM). The cells
were washed with PBS/BSA and labeled in a volume of 20 μl with 1 μl 12CA5 (anti-HA
antibody, 0.4 mg/ml) or 1 μl 10E9 (anti c-myc antibody, 0.4 mg/ml) antibodies. After another
washing step, streptavidin-phycoerythrin (PE) and goat anti-mouse IgG fluorescein (FITC)
conjugate was added to a total volume of 20 μl and incubated for 10 min at RT or for 30 min
on ice. Thereafter, the cells were washed, resuspended in 1 ml PBS/BSA, and filtered with a
CellTrics device into a flow cytometry tube. The samples were stored on ice in the dark until
the measurement. The protocol for preparative FACS is basically the same, with the
exception that 2.5 × 10⁷ cells are used. For that reason the volume for the first and second
incubation with biotinylated TSA and with unbiotinylated TSA was 1000 μl and 100 μl,
respectively. Finally, the cells were resuspended in 3 ml PBS/BSA for sorting. For calibration
of the cytometer EBY100 pCT-1E9 was used. Unlabeled cells, cells monolabeled with PE or
FITC and cells doubly labeled with PE and FITC, were prepared and analyzed to adjust the
signal compensation between the two fluorophores.
2.4.7 Protein Production and Purification
2.4.7.1 Protein Production with MOPS-Medium
TOPP2 cells were always freshly transformed with p4xH-Plasmids of scFv 1E9 variants. A
single colony of the transformants was used to inoculate a 5 ml LB Amp150 overnight culture
(37 °C, 230 rpm). The overnight culture was centrifuged and resuspended in MOPS-medium
(see 7.1.4) for inoculation of the main cultures. The cells were harvested at an OD600 of
0.8 – 1 by centrifugation for 10 min at 5,000 rpm.
The pellet was resuspended in 30 ml 30 mM Tris-HCl (pH 8), 1 mM EDTA, 20% glucose.
Lysozyme (8 mg/ml lysozyme, 20 mM Tris-HCl (pH 8), 80 mM MgCl2) was added to a final
concentration of 1 mg/ml and phenylmethylsulfonylfluorid (PMSF, 100 mM in isopropanol)
to a final concentration of 10 μM. The solution was incubated for 30 min at RT while stirring.
11 ml H2O was added to induce osmotic shock. The suspension was stirred for 30 min at RT.
The solution was centrifuged for 2 h at 9,000 rpm at 4°C. Phosphate buffer (pH 8) and NaCl
was added up to a final concentration of 50 mM and 100 mM, respectively. The scFv variants

68
were further purified by affinity chromatography using Ni-NTA. The obtained yields were
between 20 and 70 μg/l cell culture.
2.4.7.2 Protein Production in a Bioreactor
TOPP2 cells were freshly transformed with the expression plasmid p4xH. 5 ml
2xYT Amp150 were inoculated with a single colony of the transformants and incubated
overnight at 37 °C, 230 rpm. The preculture was transferred into 15 ml 2xYT Amp150 and
incubated for 5 h at 37 °C, 230 rpm. The cells were centrifuged 5 min at 5,000 rpm and the
pellet was resuspended in 2 ml of supernatant to inoculate 2l of fermentation medium
(chapter 7.1.4.1). The cells were cultured in the BIOFLOW 3000 desktop bioreactor (New
Brunswick Scientific, Edison, NJ). The program for protein production is described in the PhD
thesis of Dr. A. Piatesi (96). The temperature was changed however to 20 °C instead of 30 °C.
After 20 to 25 h the cell density reached a maximum OD600 of 20 to 30 for scFv antibodies or
70 to 80 for Fab antibodies. The cells were harvested by centrifugation for 10 min at
5,000 rpm and the pellets were stored at -80 °C.
Cell pellets were thawed in a warm water bath and homogenized in 50 ml lysis buffer
(30mM Tris-HCl (pH 8), 1mM EDTA, 20% (w/v) sucrose). 50 ml lysis buffer with 5 ml DNaseI
(0.72 mg/ml DNaseI in 10 mM Tris-HCl (pH 8), 400 mM MgCl2) and 2 ml PMSF (100 mM in
isopropanol) was added. The suspension was stirred for 30 min at RT. 30 ml H2O is added
and stirred for 30 more min at RT to induce osmolysis. The mixture was centrifuged for 2 h at
9,000 rpm at 4°C. The supernatant was collected and the pellet lysed two more times. The
collected supernatant was centrifuged for 2 h at 14,000 rpm. MES (pH 5.5) and NaCl were
added to the clear supernatant give to a final concentration of 100 mM. The protein solution
was concentrated by Amicon filter (YM-10 membrane) at 4 °C to a final volume of 50 to
100 ml.
2.4.7.3 Affinity Purification of Fab or IgG Proteins
Fab and IgG antibodies were purified on a protein G column. Before use, the column was
washed with 60 ml H2O, then with 60 ml 6 M guanidinium HCl and again with 100 ml H2O.
Then the column was equilibrated with 60 ml loading buffer (50 mM Tris-HCl (pH 8), 100 mM
NaCl). The protein solution was loaded on the protein G column and afterward washed with
50 ml loading buffer (100 mM MES (pH 5.5), 100 mM NaCl). The antibody was eluted with
100 mM glycine solution (pH 2.8). MES (pH 5.5) as well as NaCl were added to a final
concentration of 55 mM and 33 mM, respectively. The pH was checked and if necessary
adjusted to pH 6. The elution was dialyzed into 50 mM MES (pH 6), 5 mM NaCl and stored at
4 °C.

69
2.4.8 Protein Characterization Methods
2.4.8.1 Affinity Purification of scFv
The scFv constructs have a His6 tag at their C-terminus, which allows purification on a
Ni-NTA column. As MES buffer is not compatible with Ni-NTA, the protein solution was
dialyzed into 10 mM NaH2PO4 (pH 7.5), 160 mM NaCl prior to affinity chromatography. The
column was equilibrated in 10 mM NaH2PO4 (pH 7.5), 160 mM NaCl, 10 mM imidazole.
Before loading the protein sample imidazole was added to a final concentration of 10 mM.
The protein solution was loaded onto the column, and the column was washed with 25 ml
phosphate buffer containing 20 mM, followed by 25 ml containing 40 mM imidazole. The
scFv was eluted with 250 mM imidazole. The eluted proteins were dialyzed against 20 mM
MOPS (pH 6.8), 0.5 mM EDTA, 100 mM NaCl and stored at 4 °C.
2.4.8.2 Affinity Determination by TSA Titration
To determine the binding affinity based on tryptophan fluorescence of the antibody, the
antibody concentration was kept constant and TSA was titrated. The fluorescence change of
the active site tryptophan upon variation of the TSA concentration was monitored. In a total
volume of 400 μl the antibody concentration was 5 to 200 times above the expected KD
value. The TSA was titrated and after binding equilibration (1 to 3 min) the fluorescence was
measured for 10 seconds at an excitation wavelength of 290 nm and an emission wavelength
of 340 nm. The fluorescence was plotted against TSA concentration and fitted to
Equation 2-1:
Equation 2-1
( ) ( ) √(( ) )
F: observed fluorescence.
FE: observed fluorescence of free antibody.
FEL: fluorescence of antibody-ligand complex at infinite ligand concentration.
ET: total antibody concentration
LT: total ligand concentration. This varies for every measurement.
KD: dissociation constant.
2.4.8.3 Affinity Determination by Antibody Titration
This method takes advantage of the fluorescence change of a fluorescein linked to the
TSA (TSA-fl) when bound to the antibody. The TSA was connected via a PEG linker to
fluorescein. During the experiment the TSA-fl concentration was kept constant and the
antibody was varied. The concentration of TSA-fl was 5 to 200 above the KD. The excitation

70
wavelength was set to 492 nm and the emission wavelength to 520 nm. The sample was
equilibrated for 1 to 3 min before the fluorescence was measured for 10 seconds and
averaged. The fluorescence was plotted against protein concentration and fitted to
Equation 2-2:
Equation 2-2
( ) ( ) √(( ) )
F: observed fluorescence.
FL: observed fluorescence of free antibody.
FEL: fluorescence of antibody-ligand complex at infinite ligand concentration.
ET: total antibody concentration. This varies for every measurement.
LT: total ligand concentration.
KD: dissociation constant.
2.4.8.4 Kinetic Assay, Iodine-Starch
The activity of the antibody was determined indirectly with an iodine-starch assay. This
colorimetric assay is sensitive to SO2 formation, which bleaches the blue iodine-starch
solution. For the assay the iodine starch solution was always freshly prepared. 340 mg
potato starch from Sigma was boiled in 60 ml H2O and filtered after cooling down to RT.
19 ml of 50 mM NaOAc pH 5.5, 20 mM NaCl were mixed with 1 ml starch solution and 28 μl
iodine standard solution from Fluka (0.05M). This reaction solution was incubated for 1 h at
RT before use. A 5 M NEM stock was prepared in MeCN and diluted to a final concentration
of 3 M, 2 M, 1 M, 0.5 M and 0.25 M. The TCTD stock was 15 mM in MeCN. The reaction was
monitored at 606 nm (ε (iodine-starch, 606nm) : 31,000M-1cm-1), 25 °C for 10 min at a constant
TCTD concentration of 150 μM and varying NEM concentrations from 2.5 mM to 30 mM. The
antibody concentration was between 0.1 to 1 μM, depending on the catalytic activity. For all
NEM concentrations the background reaction was measured and used to correct the initial
rates. The plot of vinit/[E] as a function of [NEM] was fitted in Kaleidagraph to the
Michaelis-Menten equation:
( )
v0: initial velocity.
kcat: catalytic rate constant.
[E]: enzyme concentration.
[S]: substrate concentration (NEM).
KM: Michaelis constant for NEM at 150 µM TCTD.

71
2.4.8.5 Active Site Concentration by TSA titration
The actual concentration of active sites for a given antibody solution was determined by
active site tritration. The activity was determined at fixed substrate concentrations of
150 μM TCTD and 30 mM NEM in the presence of different amounts of TSA. The enzyme
concentration was kept much higher than its KD to insure that the added TSA was bound. The
monitored activity decreases linearly till all active sites are blocked by TSA, at which point
further addition of TSA does not change the monitored activity. The intercept of the two
fitted lines before and after the activity kink corresponds to the active site concentration of
the protein solution.
2.4.8.6 Activity Assay by HPLC
The HPLC assay directly monitors changes in concentration of the substrates and product
during reaction. As a calibration standard 0.1 mM acetophenone in the reaction buffer
(50 mM NaOAc (pH 5.5), 100 mM NaCl) was used. The substrate concentrations for the
reaction were 2.5 mM to 30 mM NEM and 150 μM TCTD. The solubility of the product is very
low and it tends to precipitate, so quantification of activity based on the product formation
is not recommended. TCTD disappearance is a more reliable measure of activity. For this
reason, 5 mM 4-nitrophenyl acetic acid was included in the stock solution of 15 mM TCTD as
an internal standard. The absorption ratio of TCTD and 4-nitrophenyl acetic acid was used to
calculate the actual TCTD concentration at time zero of the reaction. The protein
concentration varied between 1 to 5 μM. The reaction mixture was injected after 10 to
30 min incubation at RT on a Waters Polarity dC18-4 4.6x100 mm2 column and eluted with a
flow rate of 1.2 ml min-1 and a linear gradient [from 5-80% (MeCN, 0.05% TFA)/
(H20, 0.1% TFA) over 20 min]. The absorption at 250 nm was monitored. (ε (acetophenone, 250nm) :
11,640 M-1 cm-1; ε (NEM, 250nm) : 102 M-1 cm-1 ; ε (TCTD, 250nm) : 2,620 M-1 cm-1). (Retention times:
NEM: 4.6 min; 4-nitrophenyl acetic acid: 7.7 min; acetophenone: 8.1 min; TCTD: 13.7 min;
NEdHTCP: 14.5 min; NETCP: 16.2 min).
2.4.8.7 Activity Screen of YSD Antibodies by HPLC
EBY100 cells transformed with the appropriate pCT plasmid were grown in SD-CAA (pH 6)
media at 30 °C, 250 rpm until they reached stationary phase (OD600 = 6-8). The medium was
changed to SG-CAA (pH 6) to induce gene expression and the cells were concomitantly
diluted to OD600 = 1. The incubation temperature was reduced to 20 °C, 250 rpm. Proteins
were produced for two days. For activity determinations, 1 × 10⁷ cells were transferred into
2 ml eppendorf tubes to reduce cell precipitation. The reaction solutions were similar to
those described in chapter 2.4.8.6. Since a different column that allows shorter runs was

72
used, different standards were chosen. The TCTD standard was changed to 10 mM
acetophenone in the TCTD stock of 15 mM. The injection standard in the reaction buffer was
0.1 mM 4-acetyl benzoic acid. The reaction buffer was kept on ice. In order to look at several
clones under the same conditions, a master mix of buffer and the two substrates was
prepared just before use and kept on ice. 1 × 10⁷ cells were resuspended in 200 μl master
mix and stored on ice. Normally, 10 to 12 clones were analyzed at the same time with at
least two additional aliquots of a standard protein. The set of clones was incubated on a
table shaker for 15 to 30 min at 25 or 30 °C, 600 rpm. They were then cooled on ice. 100 μl
ice cold MeCN was added to quench the reaction and extract the substrates/products from
the cell suspension. The cell suspension was centrifuged for 1 min at 14,000 rpm and 50 μl
aliquot was taken for the HPLC. 15 μl of the solution were injected onto a Phenomenex
Luna 3u C18(2) 2.0×50 mm2 column. The flow rate was 0.5 ml min-1 and a linear gradient was
applied [from 15-95% (MeCN, 0.05% TFA)/(H20, 0.1% TFA) over 7 min]. (retention times:
NEM: 4.6 min; 4-nitrophenyl acetic acid: 7.7 min; acetophenone: 8.1 min; TCTD: 13.7 min;
dHNETCP: 14.5 min; NETCP: 16.2 min)
73
3 Directed Evolution of a Computationally Designed Binding
Protein
3.1 Introduction
3.1.1 Design Strategies
Computational design is a powerful technique for generating proteins with novel
properties. For example, this approach has afforded a small, artificial protein with an
unnatural protein fold (52). Other proteins have been designed that bind small molecules,
including metals (109), an unnatural co-factor (110), other proteins (46), and DNA (111).
Moreover, designs are not limited to binding, and several novel enzymes have been created
(43-45).
The most common approach is to redesign natural protein scaffolds with a known
structure (112). The template proteins are mutated in silico and the variants with the best
scores are analyzed in vitro. In order to reduce the complexity of the sampling and scoring
process, the conformations of the backbone and the side chains that are permitted are
limited (113). Additionally, assumptions are made that simplify the energy calculations but
reduce accuracy as well. Typically, waters are not explicitly taken into account. Protein
conformational entropies are not considered either. As a consequence, although
computation is able to generate proteins with new functions, multiple designs must usually
be tested to find one with the desired artivity. In principle, however, computationally
designed proteins with suboptimal properties can be improved by directed evolution.
Directed evolution is a useful technique for optimizing biomacromolecules. It consists of
three major steps: protein diversification by mutagenesis, selection of the desired function,
and amplification of the selected variants. Since the protein sequence is randomly altered,
this approach does not require any knowledge about the protein or its structure. The
selection of a protein with a novel function from fully randomized libraries has a very low
probability, hence the combination of computational design and directed evolution can be
very fruitful. Analysis of antibodies evolved by directed evolution has helped evaluate and
optimize the computational design algorithms to allow predictions of affinities (114). Fromer
et al. used computational design to rationalize the ability of calmodulins to bind different
targets with high affinities, and found that different amino acid sites are responsible for
affinity and specificity in this promiscuous binding protein (115). More recently,
computational design has succeeded in introducing new unnatural functions into protein
scaffolds, including binding and catalysis (42, 112). Although the designed enzymes have not

74
yet reached the activities of natural enzymes, this is a very promising approach, especially
when coupled to directed evolution.
3.1.2 Spider Roll, Binding Partner for p21-Activated Kinase 1
Since many diseases are caused by disturbed signaling pathways that are controlled by
specific protein-protein interactions (PPI), the design of tight and specific binding proteins
that function as agonists or antagonists is an attractive line of research (116). For example,
Kuhlman et al. have successfully designed a small protein, called Spider Roll (SR), which binds
the kinase domain of human p21-activated kinase 1 (PAK1) with an affinity of 100 µM (47).
Here we have investigated the feasibility of optimizing SR by directed evolution. Yeast-
surface-display (YSD) in combination with fluorescence activated cell sorting (FACS) is a
particularly powerful tool for screening and selecting evolved designs. It has been used, for
example, to evolve an antibody with a KD value of 50 fM (83).
3.2 Results
3.2.1 Yeast Cell-Surface Display
The computationally designed SR protein was derived from a small helical bundle protein,
the hyperplasmic disc domain (HYD [Protein Data Bank (PDB) ID:1I2T] (51)). Its binding
partner is the kinase domain of human p21-activated kinase 1 (PAK1), which is composed of
a kinase domain and an auto-regulatory region (50). For the design the auto-regulatory
region was removed, exposing the interaction interface where the auto-regulatory region of
PAK1 normally binds. The designed SR protein utilizes helix four to bind at this interface, but
with a different helix orientation than the helix of the auto-regulatory region. To increase
the affinity of SR for its partner, we fused the SR gene to the Aga2 protein. The Aga2 protein
binds to the periplasmic Aga1 protein via two disulfide bonds, linking phenotype and
genotype for selection (Figure 3-1). To quantify SR display, two tags were integrated into the
protein sequence for labeling. The HA tag was inserted between Aga2 and SR and the c-myc
tag was appended to the C-terminus of the protein. For quantification of bound PAK1, the
surface exposed cysteines of the kinase were biotinylated. For FACS, the displayed SR was
immune-labeled via the HA or c-myc tag and PAK1 was detected with a fluorescently labeled
streptavidin which binds biotin (Figure 3.1). Cells with the best ratio of bound PAK1 to
surface-displayed SR were sorted by FACS.

75
3.2.2 Evolutionary Optimization
The first two rounds of mutagenesis involved error-prone PCR of the SR gene. In the third
round of evolution, DNA shuffling (98) was performed with the sorted population. The
selection stringency for each sort was increased by lowering the PAK1 concentration and
decreasing the sorting gate. In order to reduce nonspecific binding to PAK1 and increase
selection stringency, a PAK1 mutant, PAK1 L470E, was added as a competitor. This mutation
was previously shown to disrupt the interaction interface such that SR is unable to bind (47).
After three rounds of mutagenesis and selection the estimated dissociation constant of the
complex decreased from ca. 100 µM to below 1 µM in the presence of a 10-fold excess PAK1
L470E (Table 3-1, Figure 3-2).
Several selected clones from the third round of screening were sequenced and analyzed
(Figure 3-3). Analysis of the 24 variants shows that the 63 amino acid long protein
accumulated 4.7 ± 1.7 amino acid mutations on average. This mutation load is very high for
such a short polypeptide. The most frequent mutations are G8D (found in 62.5% of the
Figure 3-1: YSD of SR. The designed protein is produced as a fusion protein with Aga2, which is
covalently bound to the periplasmic protein Aga1 via disulfide bonds. For FACS, the number of SR
molecules displayed on the cell surface are quantified by immuno-labeling. Since PAK1, the target
protein, is biotinylated, it can be visualized by fluorescently labeled streptavidin. Cells exhibiting the
best ratio of bound PAK1 to displayed SR are sorted by FACS.

76
Figure 3-2: Flow cytometry analysis of the different SR mutagenesis rounds. wt SR incubated with 7.5 µM
biotinylated PAK1 and 75 µM PAK1 L470E (black); first SR library after three sorts in the presence of
7.5 µM biotinylated PAK1 and 75 µM PAK1 L470E (orange); second SR library after three sorts in the
presence of 1 µM biotinylated PAK1 and 10 µM PAK1 L470E (blue); and third SR library after two sorts in
the presence of 1 µM biotinylated PAK1 and 10 µM PAK1 L470E (green). The population in the lower left
quadrant belongs to cells that do not display SR on the cell surface. The cell population in the upper left
quadrant corresponds to displayed display SR that weakly binds PAK1. A shift of this population to the
upper right quadrant indicates enhanced PAK1 binding, and a larger shift corresponds to tighter binding
(green population). The lower right quadrant corresponds to cells that nonspecifically bind PAK1,
independent of SR production.
Mutagenesis
Round
FACS
Round [PAK1] (uM)a
Competition
[L470E] (uM)b
FACS
Sorting gate
1 (epPCR)
1 100 - 3.0%
2 40 - 1.5%
3 50 500 2.0%
2 (epPCR)
1 30 - 1.0%
2 10 - 1.0%
3 5 50 1.0%
3 (DNA shuffling)
1 5 - 1.5%
2 2 20 1.0%
3 0.2 2 0.7% abiotinylated PAK1 concentration. bconcentration of PAK1 L470E mutant (not biotinylated).
Table 3-1: Sorting conditions of the different SR libraries.

77
clones), followed by G58C/D (45.8%), L11P/R (42%), and R14C (42%). Only 16% of the
mutations were found only once. Moreover, most mutations are located in helix 1, the
farthest structural element from the designed interaction interface. These results indicate
that the computationally designed protein is evolvable and can accept multiple mutations at
different positions.
3.2.3 Biochemical Characterization
Two clones, MSR7 and MSR10, were selected for in vitro characterization. The proteins
were produced as fusion proteins with the hexahistidine-tagged maltose binding protein
(MBP), which can be proteolytically removed as previously described (47). Wild-type (wt) SR
and the mutants were labeled with boron-dipyrromethene (bodipy) by alkylation of Cys17. In
the case of MSR10, Cys14 also becomes labeled. The affinity for PAK1 and its negative
control PAK1 L470E was then measured by fluorescence anisotropy (Figure 3-4). The variants
have a lower anisotropy signal than wt SR in solution, indicating a faster relaxation time for
the appended chromophore. MSR10 has a lower anisotropy signal than the other protein
even when bound, perhaps indicating that its binding mode is different than that of SR or
MSR7. However, the fact that MSR10 has two cysteines in its sequence complicates the
interpretation. Fitting the anisotropy data to Equation 3-4 provides KD values of 40 µM and
Figure 3-3: Sequence trends in the optimized SR variants after three rounds of affinity maturation. The one
letter amino acid code height correlates with sequence conservation at that position. The colors
correspond to the biochemical properties of the amino acid: hydrophopic (black), polar (green), amid
(purple), negatively charged (red), and positively charged (blue). The sequences of wt SR and the selected
variants MSR7 and MSR10 are aligned below the sequence logos. Mutations relative to wt SR are
highlighted using the same color code as for the sequence logos. The proposed secondary structure of SR
is depicted under the alignment. SR was designed to interact with PAK1 via helix 4. (Sequence logos
created by weblogo.berkeley.ecu (8))
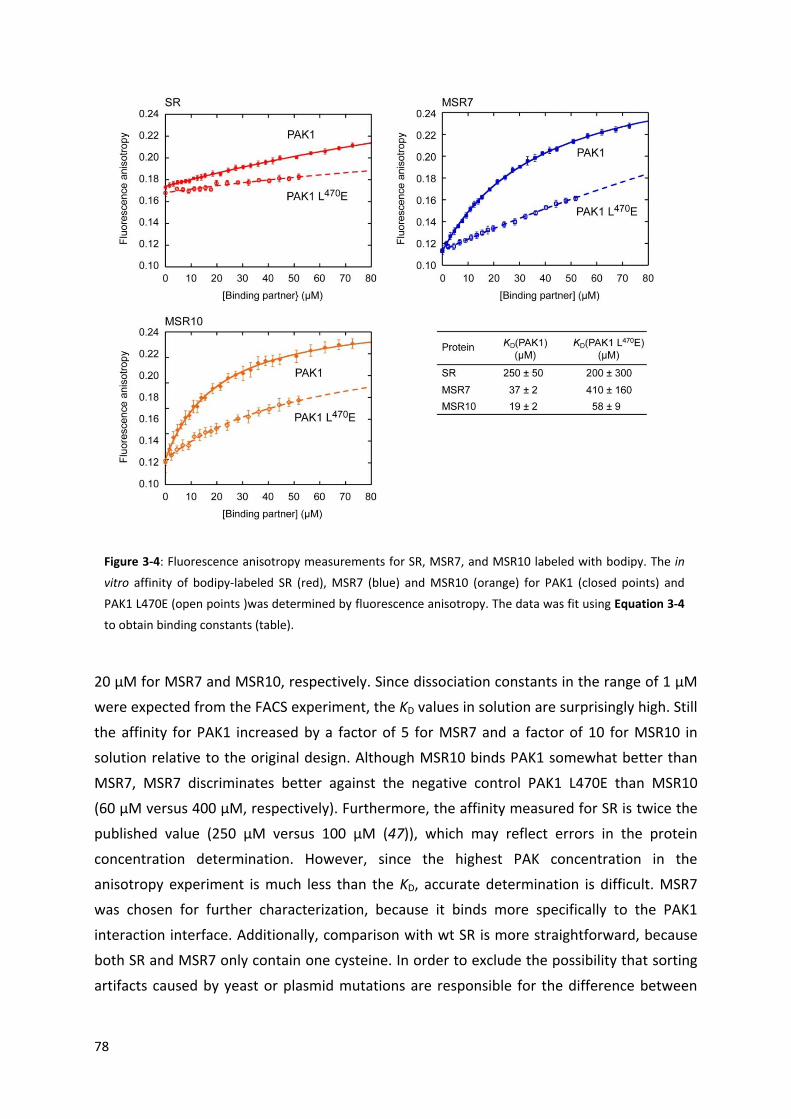
78
20 µM for MSR7 and MSR10, respectively. Since dissociation constants in the range of 1 µM
were expected from the FACS experiment, the KD values in solution are surprisingly high. Still
the affinity for PAK1 increased by a factor of 5 for MSR7 and a factor of 10 for MSR10 in
solution relative to the original design. Although MSR10 binds PAK1 somewhat better than
MSR7, MSR7 discriminates better against the negative control PAK1 L470E than MSR10
(60 µM versus 400 µM, respectively). Furthermore, the affinity measured for SR is twice the
published value (250 µM versus 100 µM (47)), which may reflect errors in the protein
concentration determination. However, since the highest PAK concentration in the
anisotropy experiment is much less than the KD, accurate determination is difficult. MSR7
was chosen for further characterization, because it binds more specifically to the PAK1
interaction interface. Additionally, comparison with wt SR is more straightforward, because
both SR and MSR7 only contain one cysteine. In order to exclude the possibility that sorting
artifacts caused by yeast or plasmid mutations are responsible for the difference between
Figure 3-4: Fluorescence anisotropy measurements for SR, MSR7, and MSR10 labeled with bodipy. The in
vitro affinity of bodipy-labeled SR (red), MSR7 (blue) and MSR10 (orange) for PAK1 (closed points) and
PAK1 L470E (open points )was determined by fluorescence anisotropy. The data was fit using Equation 3-4
to obtain binding constants (table).

79
Figure 3-5: Affinity of displayed MSR7 and SR for PAK1
was deterimend by flow cytometry. Yeast cells
displaying SR (red circles) or MSR7 (blue squares)
were incubated with different concentrations of
biotinylated PAK1. The data were fit using
Equation 3-4 to obtain the binding constants.
A B
Figure 3-6: Biophysical characterization of SR and MSR7. A) Far-UV CD spectroscopy of SR (red) and MSR7
(blue) exhibit the decreased α-helical content of MSR7. B) Thermal denaturation curves determined by CD
at 222 nm for SR (red) and MSR7 (blue) reveal non-cooperativity for MSR7.
Figure 3-7: 1H-NMR experiment of SR and
MSR7 at 20 µM concentration. SR has much
greater peak dispersion than MSR7. Thus
MSR7 is less structured. Consequently, the
collection time for MSR7 was increased from
10 h for SR to 15 h. In order to prevent
disulfide formation of the unlabeled cysteins,
the 1H-NMR spectra were collected in
degassed buffer containing 1 mM DTT.

80
in vivo and in vitro affinity (approximately 150-fold), MSR7 was recloned into a fresh display
vector, transformed into yeast, and its affinity for PAK1 was redetermined. The affinity of SR
on yeast was around 4-times higher than in vitro. Comparing the affinity of the two proteins
on yeast surface shows that MSR7 binds PAK1 ca. 280-times more tightly than wt SR. This
confirms that the evolution experiment of SR was successful (Figure 3-5). Nevertheless, the
affinity improvement achieved on yeast does not translate completely for the soluble
protein in solution.
The biophysical properties of MSR7 were further characterized in vitro. The secondary
structure was assessed by far-UV CD spectroscopy and showed that MSR7 has a significantly
lower secondary structure content, and thus a higher percentage of random coil, than the
α-helical SR (Figure 3-6 A). Thermal denaturation curves illustrate further differences
between the two proteins (Figure 3-6 B). SR exhibits typical cooperative unfolding behavior,
though successful refolding depends on the enzyme concentration. In contrast, MSR7
unfolds non-cooperatively much like a molten globular protein. Additionally, denatured
MSR7 can be quantitatively refolded. In order to investigate the extent of protein disorder, 1H-NMR spectra of the evolved mutant and wt SR were recorded (Figure 3-7). Consistent
with the lower anisotropy signal for MSR7 compared to SR in the absence of PAK1, its lower
α-helical content, and its non-cooperative thermal denaturation, peak dispersion in the
MSR7 sample is much less pronounced than for wt SR. This result strongly suggests the
notion that MSR7 is a partially disordered binding protein in vitro.
3.3 Conclusion
Affinity maturation using YSD and FACS succeeded in increasing the affinity for PAK1 by
280-fold. However, a much more modest 5-fold effect was found for the soluble SR protein
free in solution. The most obvious explanation for this discrepancy would be that the bodipy
labeling of MSR7 interferes with binding. If the measured KD value of unlabeled protein were
the same as for the yeast-displayed protein, then the unlabeled protein should be able to
displace bodipy labeled protein from PAK1. However, this was not the case (Figure 3-8). In
fact, the KD values for unlabeled protein were too high for KD determination with this
method. Additionally, labeling with fluorescein instead of bodipy as well as N-terminal
fluorescein labeling did not change the affinity significantly. N-Terminally labeled MSR7 has a
2-fold lower KD, while an N-terminal tag on MSR10 does not affect the KD for PAK1
(Figure 3-9). Thus, the difference between in vivo and in vitro affinity could not be ascribed
to protein perturbations due to the labeling.

81
Figure 3-8: Competition experiment for PAK1
binding of MSR7 against MSR7-bodipy. The
fluorescence anisotropy signal of 5 µM MSR7-
bodipy was determined in the absence and
presence of 50 µM PAK1 as a control. The
anisotropy signal was measured for 5 µM
MSR7-bodipy in the presence of 50 µM PAK1
and increasing amounts of unlabeled MSR7
(5-30 µM). At the highest MSR7
concentration, the change in fluorescence
anisotropy corresponds to a 2.6 µM decrease
in MSR7-bodipy binding. This change would
be expected for binding affinities of 37 µM for
both protein, MSR7-bodipy, and MSR7. Thus,
bodipy does not impair the binding affinity of
MSR7 for PAK1.
Figure 3-9: Fluorescence anisotropy measurement of N-terminally labeled MSR7 (blue) and MSR10
(orange) in vitro. Both proteins were titrated with PAK1 (closed points) and with PAK1 L470E (open points).
The data were fit to Equation 3-4. The results, which are summarized in the table, show that both proteins
have similar affinities for PAK1 (Figure 3-4).

82
Another explanation for the difference between the results in vivo and in vitro could
come from the different environments of the protein in these assays. For yeast display, the
protein is expressed as a fusion with Aga2. In addition, sugars, salts, metals and other
proteins are present on the cell membrane of yeast. This environment might potentially
stabilize the displayed protein in a folded state. Although this is difficult to test, a band-shift
experiment reveals that the maltose binding protein-SR fusion does not bind PAK1
(Figure 3-10). This particular fusion even seems to hinder formation of an SR-PAK1
interaction. However, a stabilizing effect due to the yeast surface environment cannot be
completely ruled out.
Protein displayed on yeast surface may also have another positive effect. The proteins are
attached to the cell surface, so that they cannot interact with each other, whereas
aggregation or oligomerization is possible in solution. An indication for oligomerization of
MSR7 was observed while purifying the protein. Separation of MBP (42 kDa) from MSR7
(7 kDa) by size-exclusion chromatography was difficult, since the elution peaks overlapped,
whereas SR (7 kDa) could be well separated. This observation supports the theory that
MSR7 oligomerizes in solution. Aggregation may easily interfere or compete with PAK1
binding.
Figure 3-10: Band-shift experiment of the MBP-SR variant fusions with PAK1 and PAK1 L470E. The fusion
proteins were incubated with 500 or 100 µM PAK1 or PAK1 L470E and loaded on a native PAGE gel. For all
three protein fusions, there was no band-shift observed.

83
Despite the discrepancy in binding affinity between protein displayed on yeast or in
solution, the evolved MSR7 binds PAK1 more tightly than SR and exhibits interesting
biophysical properties. MSR7 is a partially disordered protein in vitro. It undergoes reversible
unfolding, which is not the case for SR. SR precipitates during thermal denaturation,
especially at high concentrations. The fact that MSR7 contains intrinsic disorder is interesting
because in the last several years numerous publications have shown the importance of
disordered proteins in PPIs (117-119). It is estimated that 25% to 40% of the proteome in
eukaryotes contains long disordered regions (89, 120). Most of these proteins appear to be
involved in transcription (DNA binding). Binding proteins comprise another large fraction. In
contrast, catalytically active enzymes tend to be mostly structured (89). The fly-casting
mechanism may explain why disordered proteins are beneficial for binding (121). The
protein first binds the target unspecifically with low affinity, and as it folds, it forms more
specific interactions with the binding partner, thereby increasing affinity. Such a mechanism
may explain the increased binding affinity of MSR7.
Computational design is currently based on structured proteins to calculate and score
protein designs. Therefore, the diversity in the search for interesting binding partners is
limited. Here we have demonstrated that directed evolution may overcome this limitation.
Through this study, an understanding of PPIs was gained.
84
3.4 Materials and Methods
3.4.1 Cell Strains
For general cloning and plasmid amplification purposes the E. coli XL1Blue cell line (endA1
gyrA96(nalR) thi-1 recA1 relA1 lac glnV44 F'[::Tn10 proAB+ lacIq Δ(lacZ)M15] hsdR17(rK-mK
+))
(Stratagene) was used (105). YSD was performed with S. cerevisiae strain EBY100 (a, GAL1-
AGA1::URA3 ura3-52 trp1 leu2Δ1 his3Δ200 pep4::HIS2 prb1Δ1.6R can1 GAL), Trp- Leu- (94).
Spider Roll and PAK1 variants were overproduced in the E. coli strain BL21 (DE3) (F-, ompT,
gal, [dmc], [lon], hsdSB (rB-mB
-), λ (DE3) [(UV5 Plac expressed) T7 RNApol, imm21, Δnin5, Sam7
(int-)]) pLysS (cmR) (122).
3.4.2 DNA Manipulation.
Molecular cloning was performed according to standard procedures (106).
Oligonucleotides were synthesized and purified by Microsynth. Chain termination chemistry
(107) was applied for DNA sequencing using BigDye Terminator Cycle Sequencing Kit v3.1
and ABI prism 3100 Genetic Analyzer (PE Applied Biosystems).
3.4.3 Plasmid Constructions
The SR gene for the spider roll protein on plasmid pQE-MBP-SR was provided by Professor
Brian Kuhlman (47). In order to clone the gene into the pCT shuttle vector (94) new
restriction sites had to be introduced. The gene was therefore amplified by PCR with the
primers SRNdeInew (5’-TCTGC TAGCC GATCC CACCG CCAGG) and SRBamHI (5’-TTCGG ATCCG
CCGTG AAAGA TGATA CCAG). After digestion with NdeI and BamHI the fragment was ligated
into pCT vector that had been digested with the same restriction enzymes ot give pCT-SR. In
this construct, SR is fused to the C-terminus of the Aga2 protein. This fusion complex
covalently binds to the Aga1 protein located on the yeast cell-surface via disulfide bonds. For
protein detection the fusion construct also contains an HA tag (YPYDVPDYA) between Aga2
and SR as well as a C-terminal c-myc epitope tag (EQKLISEEDL).
For protein production the plasmid pQE-MBP-SR was used, which encodes a fusion of SR
with the maltose binding protein (MBP). A hexahistidine tag is located at the N-terminus of
MBP, which is linked to SR via a TEV cleavage site (ENLYFQ(G/S)). To generate this construct,
the SR gene was amplified by PCR using the primers BamHIfwSR (5’-TGCTA GCGGA TCCCA
CC) and SalIrvSR (5’-TTGGT CGACT TAGCC GTGAA AGATG ATACC). The PCR fragment was
digested with SalI and BamHI and ligated into the pQE-MBP (SalI/BamHI) acceptor. The
primer pQE-H6-MBP-3' (5’-GGCGG CAACC GAGCG TTCTG) was used for sequencing.

85
3.4.4 Library Construction
The SR gene was mutagenized by epPCR (GeneMorph II Random Mutagenesis Kit,
Stratagene) with the primers YD-1 (5’-GGCAG CCCCA TAAAC ACACA GTAT) and YD-12
(5’-GTACG AGCTA AAAGT ACAGT GGGA) for the first and second optimization rounds. For
high mutation frequency, 0.1 ng/µl pCT-SR or pCT-LSRA4 plasmid was used.
Electrocompetent EBY100 yeast cells were cotransformed with the mutagenized SR
fragment and the NdeI/BamHI pCT vector (insert:vector = 10:1) as described proviously (82).
The first library, LSRA0, contained 106 EBY100 transformants, whereas the second, LSRB0,
contained of 0.5 × 10⁶ clones. For the third library, LSRC0, the selected genes from the
previous selection round were diversified by DNA shuffling. Selected clones were amplified
by PCR with the YD-1 and YD-12 primers and digested with DNAseI. The digestion was
quenched by addition of EDTA and heat inactivation of DNAseI at 70 °C for 10 min. The DNA
was precipitated with ethanol, and the fragments were purified on a 3% agarose gel. The
fragments corresponding to 20-70 bp were extracted and purified using a NucleoSpin gel
extraction kit. The DNA was concentrated and reassembled by a PCR-like reaction, in the
absence of exogenous primers [2 min at 95 °C, (0.5 min at 95 °C, 0.75 min at 45 °C, 3 min at
72 °C)×40, 10 min at 72 °C]. Without further purification, the 6 µl reaction mixture was
directly subjected to a PCR reaction using primers YD-1 and YD-12 to amplify the
reassembled gene products [2 min at 95 °C, (0.5 min at 95 °C, 0.5 min at 50 °C, 1 min at
72 °C)×40, 5 min at 72 °C]. Transformation by electroporation was then performed as
described previously. The final library afforded 1.5 × 10⁵ EBY100 transformants.
3.4.5 Flow Cytometry and Fluorescence Activated Cell Sorting
Cells were incubated in 5 ml SD-CAA (pH 6) (20 g/l glucose, 6.7 g/L yeast nitrogen base,
5 g/l casamino acids, 10.19 g/l Na2HPO4∙7H2O, 8.56 g/l NaH2PO4∙H2O) for one or two days at
30 °C, 250 rpm. In this system gene expression is under the control of the GAL promoter, so
the medium was changed to 5 ml SG-CAA (pH 6) (20 g/l galactose replacing glucose) and
diluted to OD600 = 1 to induce protein production. Cells were grown for two days at 20 °C,
250 rpm. For flow cytometry, 2.5 × 10⁶ cells (OD600 = 1 represents 107 cells/ml) were
collected and washed with phosphate-buffered saline (PBS) containing 0.1% bovine serum
albumin (BSA) at pH 7.5. The cells were subsequently incubated with a mix of biotinylated
PAK1, unlabeled PAK1 L470E (1:10), and 9E10 (anti-myc) (1:25) in a total volume of 50 µl for
2 hours at room temperature (RT). After washing with PBS/BSA, the cells were incubated
with streptavidin-phycoerythrin (PE) and a goat anti-mouse IgG fluorescein (FITC) conjugate
for fluorescence labeling in a volume of 20 µl for 10 min at RT. The cells were washed again
with PBS/BSA and transferred through a CellTrics device into a flow cytometry tube. Before

86
the measurement, cells were stored on ice in the dark. For FACS, 2.5 × 10⁷ cells were
produced by the same protocol, increasing the volume for the first incubation to 200 µl and
for the second to 80 µl. Finally, the cells were resuspended in 3 ml PBS/BSA. In order to
calibrate the cytometer, EBY100 pCT-SR was used as a standard. Unlabeled EBY100 pCT-SR,
EBY100 pCT-SR cells labeled individually with PE or FITC, and doubly labeled are all used to
adjust the signal intensities and signal compensation of the two fluorophores.
3.4.6 Affinity Determination on Yeast Surface
EBY100 cells were prepared as described in chapter 3.4.5. The cells were incubated with
the appropriate concentration of biotinylated PAK1. EBY100 pCT-SR was again used as a
standard for the calibration of the FACS instrument. The data were extracted with FlowJo. In
order to exclude cells that did not display SR, only cells with a mimimal fluorescence of
0.8 × 10³ in the FITC channel (SR display) were extracted. The positions of maximal PE
fluorescence (PAK1 binding) were extracted and normalized. The maximal PE fluorescence of
unlabeled cells corresponded to 0% binding and the maximal PE fluorescence measured with
EBY100 pCT-MSR7 labeled with 30 µM PAK1 corresponded to 100% binding. The normalized
data were plotted against PAK1 concentration and fitted to Equation 3-1:
Equation 3-1
( )
(
)
KD: dissociation constant
[PAK1]: PAK1 concentration (x-axes)
Fitting the data gave x values for both proteins:
x(MSR7) = - 0.84
x(SR) = - 0.61
3.4.7 Protein Production Methods
3.4.7.1 SR Protein Production
A preculture of BL21 (DE3) pLysS pQE-MBP-SR was inoculated and incubated at 37°C,
230 rpm overnight. The main culture was inoculated with the overnight preculture (75-fold
dilution) and incubated again at 37 °C, 230 rpm until it reached an OD600 of 0.6 to 0.8. Next
protein production was induced with 330 µM IPTG. After 6 hours at 25 °C, 230 rpm, the cells
were harvested by centrifugation at 5,000 rpm for 10 min at 4°C, and the cell pellet was
stored at -80 °C. For protein purification, the cell pellet was thawed in SR lysis buffer (20 mM
Tris-HCl (pH 8), 100 mM NaCl, 25 mM imidazole, 10% glycerol). Following sonication

87
(5 x 1 min at an amplitude of 0.5, at 0.5 cycles), DNaseI (1 µg/ml) and MgCl2 (2.5 mM) were
added, and the protein was purified by Ni-NTA (Qiagen) affinity chromatography. The
equilibration and wash buffer were 20 mM Tris-HCl (pH 8), 100 mM NaCl, 25 mM imidazole,
whereas the elution buffer was 20 mM Tris-HCl (pH 8), 100 mM NaCl, 250 mM imidazole.
DTT (1 mM) and EDTA (0.5 mM) were added to the eluate. The protein concentration was
normally between 5 to 10 mg/ml. If the sample had a higher concentration it was diluted to
10 mg/ml to avoid precipitation during the TEV cleavage step. The His6-tagged TEV protease
(stored in 25 mM phosphate (pH 8), 200 mM NaCl, 10% glycerol, 2 mM EDTA, 10 mM DTT at
-80 °C, [TEV] = 3 mg/ml) was added 1:100 to the MBP-SR solution. After 12 hours at 4 °C the
sample was dialyzed against 20 mM Tris-HCl (pH 8), 50 mM NaCl. His6-tagged MBP and His6-
tagged TEV were separated from SR by a Ni-NTA (Qiagen) affinity chromatography. The
flowthrough contained SR, which was concentrated on an anion-exchange MonoQ HR10/10
column from PharmaciaBiotech. After anion-exchange, column fractions containing SR were
pooled and concentrated.
3.4.7.2 PAK1 Protein Production
PAK1 kinase was produced in BL21 (DE3) pLysS pQE-PAK1 cells and purified. Production
and purification was done as described previously for SR (section 3.4.7.1). However, the
buffer for the affinity chromatography slightly differs (lysis buffer: 20 mM Tris-HCl (pH 8),
100 mM NaCl; wash buffer: 20 mM Tris-HCl (pH 8), 100 mM NaCl, 10 mM imidazole). The
protein was further purified by size exclusion chromatography using 50 mM Tris-HCl (pH 8)
and 50 mM NaCl as the elution buffer on a HiLoad 26/60 Superdex column from
PharmaciaBiotech. The PAK1 containing fractions were pooled and concentrated up to
20 mg/ml. Aliquots of 0.5 to 1 ml were stored at -80 °C.
3.4.7.3 TEV Protease Production
TEV protease was produced in BL21 (DE3) pLysS cells. The gene for the TEV protease is
encoded by the pRK793-TEVS219P plasmid (123, 124), which was obtained from
Dr. D.S. Waugh (National Cancer Institute at Frederick, Maryland, USA). S219P TEV protease
was produced and purified as described for SR (section 3.4.7.1). However, for lysis and
affinity chromatography, phosphate buffers are used (lysis buffer: 50 mM phosphate (pH 8),
100 mM NaCl, 25 mM imidazole, 10% glycerol; wash buffer: 50 mM phosphate (pH 8),
100 mM NaCl, 25 mM imidazole; elution buffer: 50 mM phosphate (pH 8), 100 mM NaCl,
250 mM imidazole). The protein was dialyzed against 25 mM phosphate (pH 8), 200 mM
NaCl, 1 mM DTT, 1 mM EDTA) and concentrated to 3 mg/ml, and stored as 0.5 ml aliquots at
-80 °C.

88
3.4.8 Protein Labeling Methods
3.4.8.1 Biotinylation of PAK1
Protein PAK1 was diluted to 2 mg/ml in 20 mM Tris-HCl (pH 8), 100 mM NaCl. Biotin-
polyethyleneoxide-iodoacetamide (Sigma) was added to a final concentration of 0.5 mg/ml
and incubated with the protein for 4 to 5 hours at RT. The reaction was quenched by
dialyzing the sample against 20 mM Tris-HCl buffer (pH 8), 100 mM NaCl. Biotinylated PAK1
was stored at 4 °C.
3.4.8.2 Bodipy Labeling of SR
Cys17 of SR was labeled with bodipy for fluorescence anisotropy. Prior to labeling, DTT
was added to 150 μM to 300 μM protein stock to give a final concentration of 2 mM and
incubated for 2 h at RT. Bodipy-iodoacetamide (Molecular Probes) (10 mg/ml in DMSO) was
added and the mixture was incubated overnight at 4 °C. The reaction was quenched by
addition of β-mercaptoethanol, and the protein was purified over a NAP-25 column (GE
Healthcare), eluting with PBS buffer (pH 7.4). The protein sample was analyzed by LC-MS. In
order to calculate the amount of labeled protein ε(508 nm, bodipy) = 69,000 M-1 cm-1,
ε(280 nm, bodipy) = 4,400 M-1 cm-1, and ε(280 nm, SR) = 2,980 M-1 cm-1 was used resulting in an
approx. 30% labeling of SR with bodipy. The protein was stored at 4 °C in the dark.
3.4.8.3 Fluorescein Labeling of the N-terminus of SR
The N-terminus of SR was labeled with fluoresceinisothiocyanate (FITC) for fluorescence
anisotropy. Prior to labeling, the protein was dialyzed twice against 2 l of 100 mM Na2CO3
(pH 8.5), 100 NaCl to remove any amines of the buffer. The protein sample was
concentrated to 2.5 ml and the pH was adjusted to 9. 125 µl FITC (2 mg/ml against dialysis
buffer) was added and the mixture was incubated for several hours (ca.8-12 h) at RT. The
protein was dialyzed twice against 2 l PBS buffer (pH 7.4). The labeled protein was analyzed
by LC-MS. In order to calculate the percent of fluorescein labeled protein the absorption
ratio of FITC at 280 nm and 485 nm was determined (rFITC = Abs485 nm / Abs280 nm = 3.1).
Using ε(485nm, fluorescein) = 73,000 M-1 cm-1, ε(280nm, SR) = 2,980 M-1 cm-1 and rFITC resulted in an
approx. 20% fluorescein labeling of SR protein. The protein was stored at 4 °C in the dark.
3.4.9 Protein Characterization Methods
3.4.9.1 Fluorescence Anisotropy
Fluorescence anisotropy was performed at 20 °C using a fluorimeter from PTI Photon
Technology International. Spectra were obtained in 0.5 x 1 cm quartz cuvette by averaging

89
the signal over 10 seconds. The excitation and emission slits were set to 2 nm. The sample
was excited at 508 nm and the, which is a correction that must be made to obtain the
absolute polarization state of the molecule, anisotropy was monitored at an emission
wavelength of 545 nm. The G-factor (sensitivity correction factor) was determined according
to Equation 3-2.
Equation 3-2
G: G-factor
i⊥: polariser 0°, analyser 90°
i : polariser 0°, analyser 0°
All proteins have the same G-factor of 0.57. The PAK1 and PAK1 L470E stock solutions for
titrations were 790 µM and 570 µM, respectively. Fluorescence anisotropy was calculated as
shown in Equation 3-3. Fluorescence anisotropy was plotted against PAK1 protein and fitted
to Equation 3-4:
Equation 3-3
A: fluorescence anisotropy
I⊥: polariser 90°, analyser 90°
I : polariser 90°, analyser 0°
Equation 3-4
( ) ( ) √(( ) )
A: observed fluorescence anisotropy.
AF: observed fluorescence of free fluorescent-labeled SR.
AC: fluorescence of SR-PAK1 complex at infinite PAK1 concentration.
FT: total fluorescent-labeled SR concentration
PT: total PAK1 concentration. This varies for every measurement.
KD: dissociation constant.
3.4.9.2 Band-shift experiment
The SR proteins were produced as described in section 3.4.7.1, but the MBP protein was
not cleaved, since the MBP-SR fusions were used for this experiment. The proteins PAK1,

90
PAK1 L470E, MBP-SR, and MBP-MSR7, and MBP-MSR10 were concentrated to a final
concentration of 500 µM. A dilution of 100 µM for the MBP-SR fusions was prepared. The
proteins were mixed 1:1 with the corresponding binding partner or with buffer. A 1 µl
aliquot was loaded on a 20% native-PAGE (Amersham). The gel was run and developed with
a PhastSystem from PharmaciaBiotech.
3.4.9.3 Far-UV Circular Dichroism
The protein concentration was 20 µM in 20 mM Tris-HCl (pH 8), 100 mM NaCl. Spectra
were measured from 260 nm to 200 nm in 0.5 nm steps at 20 °C (bandwidth 1 nm) with two
seconds averaging time on a circular dichroism spectrometer Model 202 from AVIV
Instruments Inc spectropolarimeter. The pathlength was 0.2 cm. Each scan was performed
5 times.
3.4.9.4 Thermal Denaturation
The protein concentration was 20 µM in 20 mM Tris-HCl (pH 8), 100 mM NaCl. The signal
at 222 nm was measured on a circular dichroism spectrometer Model 202 from AVIV
Instruments Inc (bandwidth 1 nm). The initial temperature was 10 °C and was raised to
95 °C. After one minute at 95 °C the temperature was decreased again to 10 °C. Between
each measurement, the temperature was increased or decreased by 1 °C per min. The signal
was monitored every 0.5 °C after 1 min equilibration.
3.4.9.5 1H-NMR Spectroscopy.
NMR experiments were performed at 26 °C using an Avance II 600, a 600-MHz
spectrometer, in PBS buffer (20 mM sodium phosphate, 50 mM NaCl (pH 7.5), 1 mM DTT,
10% D2O). The protein concentration was 20 µM. The collection time was 10 h for SR and
15 h for MSR7.

91
4 Adjusting Selection Stringency of Directed Evolution
Experiments with N-terminal Degradation Tag
4.1 Introduction
4.1.1 Selection Systems
Directed evolution is a powerful tool to explore catalytic mechanisms and structure-
function relationships in enzymes. It consists of three major steps: mutagenesis, selection
and amplification. These three steps drive the improvement of enzymes, mimicking natural
evolution. Selection systems are particularly powerful tools for directed evolution because
they couple the selection and amplification steps, allowing larger libraries of mutants to be
analyzed than is possible with screening systems (61).
Selection systems often take advantage of auxotrophic strains that are not able to grow
unless they are supplied with a gene for an enzyme that can provide the missing metabolic
activity. Enzymatic production of an essential metabolite enables cellular growth, a
multifactorial property that depends both on specific activity and the concentration of the
introduced enzyme (Figure 4-1). In an ideal case, increases in enzyme efficiency lead to
proportional increases in growth rate. However, the metabolic needs of the cell can be met
by a poor enzyme if the catalyst is strongly overproduced. In the case of highly active
enzymes, even tiny amounts of catalyst can supply sufficient metabolite to enable wild-type
growth levels, making further evolution difficult or impossible. If the selection system cannot
distinguish between active and highly active enzymes, further evolution of enzymes
becomes impossible, and alternative strategies are needed to increase the stringency of the
selection system.
Figure 4-1: Dependence of growth rate on
the turnover of the growth-limiting
metabolic reaction catalyzed by the
enzyme of interest. Discrimination between
cells encoding enzymes of different
activities is only possible in a selection
window where enzymatic turnover is not
saturating for selection, but high enough to
support weak growth.

92
4.1.2 Controlling Selection Stringency
Increased stringency of an in vivo selection system can be achieved by various methods.
Since the turnover rate correlates with enzyme concentration, one way of increasing
selection stringency is to reduce the amount of catalyst produced in the cell (125).
Intracellular enzyme concentration may be controlled in several ways. These include:
(i) reducing plasmid copy number, (ii) regulating the effects of promoter strength (126-129),
(iii) using modified ribosome binding sites (126, 130), and (iv) using a degradation tag that
directs the tagged protein to cellular proteases (125).
Combining tunable transcription with an enzyme-degradation tag has been shown to be
an effective means of adjusting enzyme concentrations over a very broad range. For
example, this approach was successfully used to evolve highly active variants of a hexameric
chorismate mutase (125). Protein production was regulated by a tetracycline promoter
(131), while a C-Terminal SsrA tag, which directs the enzyme to the housekeeping Clp
protease (132), was used to control the lifetime of the protein. This combination provided
fine-tuned control over the intracellular chorismate mutase (CM) concentration (125).
Selection stringency in this system could be steadily increased by decreasing inducer
concentration allowing variants with near wild type (wt) activity to emerge.
The SsrA tag is an 11 amino acid long sequence (AANDENYALAA) that can be appended to
virtually any protein. Nevertheless, this strategy does have one major drawback. The
C-terminal location of the tag enables a simple escape mechanism. Stop codon mutations or
frameshifts that lead to deletion of the tag protects the enzyme from degradation, allowing
it to accumulate within the cell. The resulting higher catalyst concentrations allow
complementation of mutants with lower intrinsic activities. In the evolution of the
hexameric CM, such false positives severely outnumbered the truly improved variants under
the most stringent selection conditions (125). A potentially simple solution to this problem
would be to move the degradation tag from the C-terminus to the N-terminus. The first 16
amino acids of the replication protein A (133) have been reported to target proteins to the
ClpAP (134) protease complex. For example, when this sequence was attached to the
N-terminus of GFP 50% of the proteins were degraded within 30 min.
In this project we compared the N-terminal RepA and the C-terminal SsrA tag for their
ability to regulate intracellular concentration and thus control selection stringency in a
directed evolution experiment. We went on to use the RepA tag to evolve a highly active,
monomeric CM (mMjCM), derived from the dimeric Methanocaldococcus jannaschii
chorismate mutase (57). Although this enzyme has near wild-type activity, it unexpectedly
has all the properties of a molten globule, including ANS binding, non-cooperative unfolding,

93
fast H/D exchange, and low NMR peak dispersion (58, 135). Because the enzyme already
possesses near wt activity, a highly stringent selection system was needed for further
optimization.
4.2 Results
4.2.1 Selection System
The selection system for CM activity relies on the growth-limiting turnover of chorismate
to prephenate, the biosynthetic precursor of the essential amino acids phenylalanine (Phe)
and tyrosine (Tyr) (87). KA12/pKIMP-UAUC is a CM knock-out strain that cannot grow in the
absence of Tyr and Phe (6). Transcription of the CM gene is typically controlled by the
tunable tetracycline (tc) promoter where tc serves as a transcriptional inducer (125, 131). In
this system, mMjCM fully complements the metabolic defect, even in the absence of tc. To
increase the stringency, the ssrA or repA sequence was introduced either at the 3’ or 5’ end
of the chorismate mutase gene. The resulting plasmids pKTS and pKTR code for the SsrA-
tagged or RepA-tagged proteins (Figure 4-2).
4.2.2 Regulation of Protein Concentration with RepA and SsrA
The ability of the RepA and SsrA tags to reduce intracellular mMjCM concentration to
growth-limiting levels was examined at different inducer (tc) concentrations to regulate gene
expression. Since protein production within the cell is directly proportional to the amount of
A
B
Figure 4-2: Increasing the stringency of a
CM selection system. The CM knock-out
selection strain KA12/pKIMP-UAUC (6)
can be complemented with a the vector
coding for CM fused either to A) the
C-terminal SsrA tag or B) the N-terminal
RepA tag for degradation by ClpXP or
ClpAP, respectively.

94
tc added (125), higher amounts of tc are expected to reduce selection stringency
(Figure 4-3). Cells that produce SsrA-tagged mMjCM show significant reductions in growth at
300 ng/ml tc, whereas cells harboring the RepA-mMjCM are still viable at 100 ng/ml tc. At
concentrations lower than 100 ng/ml tc the RepA tag is also successful in reducing the rate
of cell growth. The SsrA tag is apparently a more efficient degradation tag than RepA since it
works at higher inducer concentrations. Nevertheless, RepA is capable of reducing mMjCM
to a growth-limiting concentration and should be useful for regulating selection stringency in
directed evolution experiments.
This control experiment also provided insight into the frequency with which spontaneous
background mutations inherent to selection systems that exploit the tet promoter arise. As
seen in Figure 4-3 a sub-fraction of 0.05% of the monoclonal RepA-tagged or SsrA-tagged
cultures grew under the most stringent conditions (10-50 of 105 clones at 0 ng/ml tc).
Analysis of these clones showed that such growth is enabled by spontaneous insertions and
deletions within the tetracycline repressor gene (tetR), which abolish transcriptional
regulation of the tet promoter. Unrepressed transcription leads to a boost in CM
concentration, providing the cells with enough phenylalanine and tyrosine to allow growth.
If the complementation rate for individual selection experiments is above 0.1%, such
artifacts are negligible, however.
4.2.3 Selection of Artifacts
The efficiency of selection strategies based on N- and C-terminal degradation tags was
compared in the context of population diversification. mMjCM was mutagenized by error-
prone PCR (epPCR) and cloned in parallel into RepA and into SsrA vectors. For the purpose of
comparison, selection stringency in both cases was set so that 0.2 to 10% of the library
members could complement the CM deficiency depending on the tc concentration. A 40-fold
lower tc concentration was needed for the RepA selection experiments than for the SsrA
system to afford a similar complementation frequency. At each complementation frequency,
Figure 4.3: Complementation ability of wt
mMjCM fused to the C-terminal SsrA tag
or the N-terminal RepA tag at different
inducer concentrations.

95
11 - 17 clones were sequenced from each library, and the fraction of genuine mutants versus
wt mMjCM and degradation tag artifacts was assessed. Under non-selective conditions,
some cells containing empty vectors were found. These were never observed under
selection conditions (Figure 4-4). Since the entire mMjCM gene was randomized, stop codon
mutations or frameshifts at the C-terminus could arise that lead to truncations of the protein
before the SsrA tag, circumventing the degradation pathway. DNA sequences of clones
obtained revealed that the number of artifacts derived from truncated mMjCM variants
increased with increasing selection stringency. At a complementation frequency of 10%, one
third of all sequenced clones were false positives, and the fraction increases to 100% at
higher stringencies. In contrast, such artifacts were never found for the RepA experiments.
At 10% complementation level wt mMjCM was not found in either library, enabling
separation of catalytically improved mutants from the template protein. Together, these
results illustrate the potential benefits of the N-terminal RepA degradation tag for
controlling intracellular protein concentration.
A B
Figure 4-4: Comparison of the SsrA and RepA selection strategies. A) Experiment with the SsrA tag.
B) Experiment with the RepA tag. Occurrence of genuine mutants (blue squares), parental mMjCM (black
circles), mutants without the degradation tag (red diamonds), and empty vector (grey crosses) are plotted
as a function of different complementation frequencies. The stringency of the selections increases with
decreasing complementation frequency. The asterisk denotes a parental mMjCM sequence, but this artifact
is not caused by loss of the degradation tag, but rather to a frameshift in the tetR gene.

96
4.2.4 Directed Evolution Using the RepA Tag Strategy
mMjCM equipped with the RepA tag was subjected to three rounds of mutagenesis and
selection. In the first selection round cells were plated on minimal media agar plates and
protein production was induced with 10 ng/ml tc. The 200 largest colonies (10% of the
complementing clones) were selected to inoculate a culture, the plasmid mixture of the
pooled colonies was isolated and serve as a template for DNA shuffling (98). The next
selection was performed at inducer concentrations of 2.5 and 5 ng/ml tc. Again,
approximately 200 colonies from each plate were used for a second round of DNA shuffling.
In the third and final selection, the tc concentration was further reduced to 0 and 2.5 ng/ml.
The complementation frequency at each selection step was between 1 and 10% of each
library. Finally, four clones were chosen based on their sequence (Figure 4-5). Clones KW42
and KW46 selected in the second selection round contain the double mutations A23fD/I76L
and A23fD/N47D, respectively. Clones KY22 and KY30 identified in the third selection round
combined three mutations (A23fD/N47D/ I76L). Additionally, KY22 and KY30 exibit Y54H and
Y54H/I76L mutations, respectively. The effect of each individual mutation could be deduced
by comparing the behavior of these different clones. After recloning the four variants into
Figure 4-5: Occurrence of different mutations identified over the whole mMjCM selection process.
Positions mutated in the selected clones KW42, KW46, KY22 and KY30 are labeled in blue. The legend in
which selection round and under which selection condition the mutation was found is on the left.
Interestingly some mutations were enriched in the second selection round but disappeared during further
selection (positions W23e and K23h).

97
fresh RepA vector, they were re-tested for their complementation ability under the most
stringent conditions (0 ng/ml tc). All variants grew quickly, forming single colonies of 0.5 –
1 mm diameter after 3 days at 30 °C. In contrast, wt mMjCM did not give rise to any colonies
under these conditions (Table 4-1).
4.2.5 Biochemical Characterization of Evolved mMjCM Variants
The genes of the variants that conferred enhanced growth were cloned into the
pET-pATCH vector (136) for protein production. The plasmid was transformed into the KA13
CM knock-out strain (137), which contains the T7 RNA polymerase for high-level expression.
Wt mMjCM was used as a control. The proteins were produced and purified by affinity
chromatography followed by size-exclusion chromatography. In contrast to the parent
mMjCM protein which forms dimers at high concentrations, all optimized variants remained
monomeric below 100 µM protein concentration. The protein yields for variants KW42 and
KW46 from the second selection round are similar to mMjCM, whereas KY22 and KY30 from
the third selection round have 4 – 8-fold higher yields. Thus the additional Y54H mutation
appears to be beneficial for protein production. The E66V mutation found in KY30 further
increased the yield.
Variant Mutations c Selection
round In vivo test a
Protein yield b
kcat
(s-1) KM
(µM) kcat/KM (M-1s-1)
mMjCMd (parental) 10 mg/L 4.5 ± 0.4 220 ± 10 20,000
KW42 A23fD, I76L 2nd + 20 mg/L 5.8 ± 0.3 160 ± 30 36,000
KW46 A23fD, N47D 2nd + 10 mg/L 5.5 ± 1.2 130 ± 30 42,000
KY22 A23fD, N47D, Y54H, I76L
3rd ++ 40 mg/L 7.1 ± 1.3 100 ± 20 70,000
KY30 A23fD, N47D, Y54H, E66V, I76L
3rd ++ 80 mg/L 6.9 ± 0.8 80 ± 20 84,000
aComplementation assay of selected clones after recloning and retransformation. Single colony streak outs were performed on M9c plates without tc. After three days at 30 °C the plates were evaluated for their colony size ( , no growth; + little growth; ++, good growth). bThe protein yield was determined after Ni-NTA and size-exclusion chromatography by UV280. The extinction coefficient was calculated for each variant by ProParam. cThe numbering relies on the previously defined nomenclature (85). dCompared with literature values: mMjCM: kcat: 3.2 s-1; KM: 170 µM; kcat/KM : 19,000 M-1s-1; MjCM: kcat: 3.2 s-1; KM: 50 µM; kcat/KM : 64,000 M-1s-1. (54)
Table 4-1: In vivo complementation test and protein production yield

98
Steady-state kinetic analysis revealed that all four variants were 2 – 4-fold more active
than mMjCM. KY30, which contains the most mutations, is also the most active catalyst
(Figure 4-6). The kcat for KY30 is 1.5-fold larger than that of mMjCM itself, while and KM
decreased 3-fold. As a consequence of these changes, the catalytic efficiency of KY30
(kcat/KM) is even greater than that of its natural counterpart, dimeric MjCM (kcat: 3.2 s-1 and
kcat/KM: 64,000 M-1 s-1).
The higher activity of KY30 undoubtedly contributes to the growth advantage. However,
the net increase in catalytic efficiency is modest. The accumulated mutations also
significantly increase the intracellular stability of the enzyme. The intracellular
concentrations of active enzyme were quantified for clone KY30 and the parental mMjCM,
which were both produced in the selection strain KA12/pKIMP-UAUC (6) at varying tc
concentrations from the RepA selection plasmid. CM activity in cell extracts was measured
after enriching the sample in CMs by affinity chromatography without any washing step to
avoid CM loss from the column. For each sample the buffer was exchanged and
concentrated to the same volume, 200 µM chorismate was added, and specific activity
determined. Using the steady state parameters of the purified enzyme (Table 4-1), the
concentration of enzyme present in the sample was calculated from the Michaelis-Menten
equation. On average, the concentration of KY30 was 7-fold higher than mMjCM at all tc
concentrations (Figure 4-7). These findings mirror the production yields in KA13 obtained
from constructs lacking the RepA Tag, which are also on average 4 – 8-fold higher for KY30
(40-80 mg/L) than for mMjCM (10 mg/ml) (Table 4-1). Thus the higher expression level for
KY30 appears to be an intrinsic property of this protein, independent of the RepA tag.
Figure 4-6: NMR structure of mMjCM with the
TSA bound (yellow) (PDB: 2gtv). The positions
in mMjCM that are mutated in the evolved
variant KY30 are highlighted in blue.

99
Figure 4-7: CM activity of cell extracts expressing
KY30 or mMjCM genes. The expression level is
dependent on the concentration of the inducer
tc. Cells were grown in LB medium
supplemented with different tc concentrations
as indicated. The crude cell extract was enriched
for CM by affinity chromatography. The eluate
was tested for chorismate to prephenate
conversion. The CM concentration was derived
from the individual specific activities. Calculated
concentration of KY30 (squares), mMjCM
(circles), and the ratio between these two CM’s
(diamonds).
Figure 4-8: Partial tryptic digestion of wt mMjCM, KY30, and an equimolar mixture of both to ensure
identical experimental conditions for the two proteins. Proteolysis was quenched after different incubation
times. A) SDS-PAGE gels of the quenched proteolysis reactions. M: peptide marker (16,900 Da; 14,400 Da;
10,700 Da; 8,200 Da; 6,200 Da; 2,500 Da) B) Quantification of the partial digestion of KY30 (blue squares),
mMjCM (red circles), and the mixture of the two CM’s (black diamonds) was assessed by comparing the
intensities of the highest protein band corresponding to the undigested protein. The band intensities were
normalized to the intensity of the protein band at zero min.
A B

100
Higher intracellular enzyme concentrations could conceivably result from faster protein
production (e.g., due to optimized codon usage) or from slower degradation by cellular
proteases. A more stable tertiary structure, resulting from a decrease in molten globular
character, for example, would be expected to confer greater resistance to proteases
(138, 139). A partial tryptic digest of the two proteins was performed on KY30 and mMjCM
to test their relative sensitivity towards proteases. As shown in Figure 4-8, trypsin digests wt
mMjCM roughly 10-times faster than KY30. Additionally, many digestion products are visible
for mMjCM, whereas only a small segment is removed from KY30. To determine whether the
increased proteolytic stability of KY30 derives from a more ordered fold,
8-anilinonaphthalene-1-sulfonate (ANS) binding was examined. When ANS binds to
disordered proteins, its fluorescence increases significantly. However, ANS shows a lower
fluorescence and a less pronounced blueshift with KY30 than with mMjCM (Figure 4-9 C),
suggesting a less exposed hydrophobic core and a more compact fold. Another property of
molten globules is their non-cooperative thermal denaturation, which is observed for
A B
C
Figure 4-9: Biophysical characterization of KY30
and mMjCM. All measurements were performed
in PBS (pH 6.5). A) CD spectra of wt mMjCM (red),
and KY30 (blue), at 20 °C. B) Thermal denaturation
measured by CD at 222 nm of wt mMjCM (red),
and KY30 (blue). C) Fluorescence measurement of
ANS binding to mMjCM and KY30 at 20 °C. Spectra
of free ANS (2 µM) without protein (orange), ANS
in the presence of wt mMjCM (2 µM) (red), and
ANS in the presence of KY30 (2 µM) (blue).

101
mMjCM. Thermal denaturation of KY30, however, shows a small but clear transition with a
melting tempereature (TM) of 50°C (Figure 4-9 B). Furthermore, the 1H-NMR spectrum of
KY30 shows greater peak dispersion than mMjCM, as expected for a more ordered protein
(Figure 4-10). Although clearly more ordered than wt mMjCM, the properties of KY30 are
not fully native-like. Thus, dimeric MjCM shows much stronger cooperativity upon thermal
denaturation and a TM of almost 90°C, lower fluorescence signal in presence of ANS, and
greater peak dispersion in the 1H-NMR spectrum (57, 58).
4.3 Conclusion
In vivo selection systems are powerful tools for the directed evolution of enzymes. Most
selection systems take advantage of auxotrophic strains, which are only able to grow if they
are provided with a functional enzyme that overcomes the auxotrophy. To monitor
improvements in enzyme function, the growth rate should be ideally proportional to the
catalytic efficiency of the enzyme. However, a strict correlation is seldom observed because
growth also depends on catalyst concentration. For example, selection systems often have
problems distinguishing highly active enzymes from less active enzymes. This can make
further evolution of these enzymes very difficult. In such cases, strategies for increasing
selection stringency are needed.
Since net catalytic activity correlates with catalyst concentration, the easiest way to
increase selection stringency is to decrease enzyme concentration. This can be accomplished
by combining regulatable promotors to control the rate of protein synthesis and selective
degradation tags to regulate the lifetime of the protein in the cell. In this chapter we show
that the RepA degradation tag is a viable alternative to the previously described SsrA tag for
Figure 4-10: 1H-NMR of mMjCM and KY30 at 280 µM in PBS’ (pH 6.5).

102
directed evolution experiments. Although it is less effective than SsrA at directing appended
proteins to housekeeping proteases, its N-terminal location dramatically reduces the
occurrence of truncation and frameshift artifacts. As a consequence, it can be readily used to
regulate selection stringency over a wide dynamic range.
The RepA tag selection strategy was successfully used to further evolve mMjCM, a highly
active, monomeric version of the CM from Methanocaldococcus jannaschii. After three
rounds of mutagenesis and selection, the best variant, KY30, showed an almost five-fold
increase in catalytic activity compared to the starting enzyme. In addition, KY30 is produced
at a seven-fold higher intracellular concentration than mMjCM (Figure 4-7). Thus, the new
selection strategy afforded a 30-fold increase in prephenate production at a chorismate
concentration of 200 µM. The biophysical characterization of KY30 suggests that it is
substantially better folded and more stable than its molten globular precursor. Its more rigid
fold protects against proteolytic degradation in the absence of the RepA tag (Figure 4-8 to
Figure 4-10).
Enhanced proteolytic resistance and catalytic activity are important properties for
biocatalysts in industrial applications. Since high product production at high substrate
concentration ([Substrate] >> KM) is desirable, methods that afford catalysts with the highest
possible kcat for a given kcat/KM are important. As shown here, combining a regulatable
promoter for protein production with a protein degradation tag is an effective strategy for
accomplishing this goal.
In conclusion, the introduction of degradation tags is able to increase selection
stringency. Compared to the C-terminal SsrA tag, the N-terminal tag RepA tag showed a
drastically lower artifact rate, making selection of catalysts with catalytic efficiency and
structural robustness more straightforward. This feature will be advantageous for adjusting
the stringency of other selection and screening systems, where discrimination between
highly active enzyme variants is required. Additionally, by reducing the protein
concentration, the selection pressure of the system forces the kcat or the catalyst
concentration to increase. This was also observed using the SsrA tag (125). Although any
degradation tag is potentially able to induce similar selection pressure on the system, the
position of the degradation tag at the N-terminus is crucial to reduce false positives.
Nevertheless, more efficient N-terminal degradation tags would be desirable to further
increase stringency. In the experiments with the mMjCM, for example, RepA tagged KY30
provides wt growth rates even under the most stringent conditions available. Further
improvement of this enzyme will therefore require a more efficient degradation tag or a
completely different strategy for reducing its concentration in the host cell.

103
4.4 Materials and Methods
4.4.1 Cell Strains
XL1-Blue (Stratagene) was used for general cloning and amplification purposes (105). The
CM-deficient E. coli strain KA12/pKIMP-UAUC was the selection strain for the genetic
complementation experiments (6). The genotype of KA12: Δ(srlR-recA)306: Tn10, Δ(pheA-
tyrA-aroF), thi-1, endA-1, hsdR17, Δ(argF-lac)U169, supE44. The plasmid pKIMP-UAUC
provides genes encoding monofuctional forms of prephenate dehydrogenase and
prephenate dehydratase from Erwinia herbicola and Pseudomonas aeruginosa, respectively,
and also confers chloramphenicol resistance. CMs were overproduced in E. coli strain KA13,
which carries a chromosomally integrated, IPTG-inducible T7 RNA polymerase gene
(136, 137).
4.4.2 DNA Manipulation
Molecular cloning was performed according to standard procedures (106).
Oligonucleotides were synthesized and purified by Microsynth. Chain termination chemistry
(107) was applied for DNA sequencing using BigDye Terminator Cycle Sequencing Kit v3.1
and ABI prism 3100 Genetic Analyzer (PE Applied Biosystems).
4.4.3 Plasmid Constructions
pKTR-R26 was constructed by ligating a DNA fragment (48 bp) coding for the RepA-
degradation tag into (NdeI/NcoI) pKTD-R26 (3644 bp). The primers used to form the DNA
fragment were: RepA1#136 (5’-TATGA ACCAG AGCTT TATTA GCGAT ATTCT GTATG CGGAT
ATTGA ATC) and Rep1#137 (5’-CATGG ATTCA ATATC CGCAT ACAGA ATATC GCTAA TAAAG
CTCTG GTTCA) forming overhangs on each site compatible with the NdeI and the NcoI
restriction site. The plasmid pKTD-R26 originates from pKT-R26 (125) in which an additional
restriction site, NcoI, was introduced as well as the degradation tag Dps (STAKLVKSKAT)
(140). Primers DpsR26 (5’-GGAAT TCCAT ATGAG CACCG CGAAG CTGGT GAAAT CCATG
GCGAC ATCGG AAAAC CCGT) and M13(-20) (5’-GTAAA ACGAC GGCCA GT) were used for the
insert following a digestion with NdeI and XhoI and ligated into (NdeI/XhoI) pKT-R26. For
pKTS-mMjCM a PstI restriction site was introduced as a silent mutation just before the last
catalytically essential amino acid of mMjCM. mMjCM was amplified by PCR with the primers
T7 (5’-TAATA CGACT CACTA TAGGG) and mMjCMXhoPstv (5’- GGTGC TCGAG TGTTT CCTCA
AGATA TTGCT TCTGC AGGGC CTTAT TATGC TCTAT) from pET-pATCH-mMjCM (136)
subsequently digested with NdeI/XhoI, and subcloned into the NdeI-XhoI fragment of
pKTS-W (125). For comparison, the same silent mutation was also introduced into pKTR-
mMjCM. Additionally, the NdeI restriction site was changed to NcoI. The primers

104
mMjCMNdeNco (AGATT TACAT ATGGC CATGG CCATC GAGAA ACTTG CTGAA ATTAG GA) and
mMjCMXhoPstv (see above) were used for the PCR fragment. The template was pET-pATCH-
mMjCM. After digestion with NcoI and XhoI the insert was cloned into (NcoI/XhoI) pKTR-R26.
pKTR-mMjCMneg was used as the acceptor vector for the library. pKTR-mMjCM was
digested with HindIII in the CM gene. The restriction sites were filled with Klenow fragment
to introduce a frameshift in the gene when the blunt ends were ligated. For production of
CM variants, PCR fragments were subcloned (NdeI/XhoI) into the T7-promoter vector pET-
pATCH (136). The primers used were NcoI_NdeI (5’-ATGCG GATAT TGAAC ATATG GCCA) and
M13(-20) (5’-GTAAA ACGAC GGCCA GT).
4.4.4 Library Construction
For the first library the gene was mutagenized by epPCR (GeneMorph II Random
Mutagenesis Kit, Stratagene) using 0.2 ng/µl pKTR-mMjCM. The PCR fragment was inserted
into the pKTR-mMjCMneg vector using the NcoI/XhoI restriction site. For the second and the
third library the gene was diversified by DNA shuffling (98). The library gene pool was
amplified by PCR and digested with DNAseI. 1 µl 0.3 mg/ml DNAseI was added to 50 µl PCR
product and incubated for 20 seconds to 3 min, depending on the desired fragment length.
The digestion was quenched by addition of EDTA and heat inactivation of the DNAseI at
70 °C for 10 min. The DNA was purified by phenol-chloroform extraction. Additionally the
fragments were purified on a 3% agarose gel. The 20-100 bp fragments were extracted and
purified using a NuecloSpin gel extraction kit. The DNA fragments were concentrated and
reassembled by a PCR-like reaction, without the addition of exogenous primers (0.5 min at
95 °C, [0.5 min at 95 °C, 0.75 min at 45 °C, 3 min at 72 °C)×40, 5 min at 72 °C]. Without
further purification, 8 µl reaction mixture was directly subjected to a PCR reaction using the
T7 primer (5’-TAATA CGACT CACTA TAGGG-3’) to amplify the reassembled gene products
[0.5 min at 95 °C, (0.5 min at 95 °C, 0.5 min at 50 °C, 1 min at 72 °C)×40, 5 min at 72 °C]. The
purified PCR fragment was inserted in the pKTR-mMjCMneg vector using the NcoI and XhoI
restriction sites. Afterwards the ligation product was used to transform KA12/pKIMP-UAUC
cells by electroporation. A portion of the electroporated cells was plated on LB Amp150 Cam30
to measure library sizes, the rest was used to inoculate 50 ml of LB Amp150 Cam30 for
preparation of frozen stocks, plasmid isolation, and selection experiments.
4.4.5 In vivo Assays
The complementation and selection experiments were performed using M9c medium
plates at pH 7. It contained Na2HPO4 (6 mg/ml), KH2PO4 (3 mg/ml), NH4Cl (1 mg/ml), NaCl
(0.5 mg/ml), 0.2% (wt/vol) D-(+) glucose, 1 mM MgSO4, 0.1 mM CaCl2, thiamin-HCl

105
(5 µg/ml), 4-hydroxybenzoic acid (5 µg/ml), 4-aminobenzoic acid (5 µg/ml),
2,3-dihydroxybenzoic acid (1.6 µg/ml), L-Trp (20 µg/ml), sodium ampicillin (150 µg/ml), and
chloramphenicol (30 µg/ml). 15 g of agar was added per liter medium. Where required, M9c
was supplemented with L-Phe and L-Tyr at a final concentration of 20 µg/ml. For the
complementation assay the appropriate amounts of tetracycline were added. Cell cultures
were washed with M9c salts (Na2HPO4 (6 mg/ml), KH2PO4 (3 mg/ml), NH4Cl (1 mg/ml), NaCl
(0.5 mg/ml)) before plating. Plates were incubated at 30 °C.
4.4.5.1 Dilution Plating
For the dilution plating, KA12/pKIMP-UAUC cells also containing pKTR-mMjCM or
pKTS-mMjCM were inoculated in LB Amp150 Cam30 at 30°C, 230 rpm until an OD600 of 1 was
reached. The cultures were diluted to OD600 = 0.1, 0.001 and 0.00001. A 50 µl aliquot at each
dilution was pipetted onto LB Amp150 Cam30 as well on the different minimal media plates
containing the appropriate tc concentration. These aliquots contained approximately 105,
103, and 10 cells per 50 µl.
4.4.5.2 Library Selection
For the selection experiments, the overnight cultures of freshly transformed cells were
used. The cultures were diluted to 1 ml of OD600 = 1 and washed in M9c buffer before further
dilution. In average 1 ml OD600 = 1 of a KA12/pKIMP-UAUC cell culture corresponded approx.
5 × 10⁷ cells. For the correct amount of cells in the culture, it was diluted 106 and 107-fold
and plated on M9c FY. The number of cells that is able to grow under these unselective
conditions corresponds to a 100% complementation frequency. For selection, the cell culture
was diluted 104 and 105-fold and plated on M9c supplemented with the appropriate amount
of tc. Since a complementation frequency between 0.1 – 10% is aimed for a
complementation frequency in this range under this conditions (104 and 105-fold dilution)
should allow 10 – 500 clones per plate to grow which is a countable number of clones. After
plating the plates were incubated for 3 days at 30 °C.
4.4.6 Protein Production and Purification
CM derivatives were produced with pET-pATCH plasmids in the host strain KA13. 500 ml
LB Amp150 was inoculated with an overnight preculture (5 ml LB Amp150). The culture was
incubated at 37 °C up to an OD600 of 1. Protein production was induced by adding isopropyl-
1-thio-β-D-galactopyranoside (IPTG) to a final concentration of 0.25 mM. After 20 h at 20 °C
the cells were harvested and resuspended in 10 ml sonication buffer (pH 8) supplemented
with 1 mg/ml lysozyme. The suspension was kept on ice for 30 min. The cells were sonicated,

106
and the insoluble material was removed by centrifugation. The soluble fraction was loaded
onto a column packed with 1 ml of Ni–NTA agarose (QIAGEN) that was pre-equilibrated with
PBS (pH 6.5). The column was washed with 8 ml PBS (pH 6.5) containing 10 mM imidazole
and eluted with 8 ml PBS (pH 6.5) containing 250 mM imidazole. The proteins were further
purified by preparative size exclusion chromatography using a Superdex 75 (26/60) FPLC
column (PharmaciaBiotech) with PBS (pH 6.5) as the running buffer. The monomer fraction
was pooled and concentrated to final concentration of 15-20 µM. The proteins were stored
at 4 °C.
4.4.7 Protein Characterization Methods
4.4.7.1 Kinetics
All kinetics were performed at 20 °C using final enzyme concentrations of 40 nM in PBS
(pH 6.5) supplemented with 0.1 mg/ml bovine serum albumin (BSA). Initial rates were
determined by monitoring the disappearance of chorismate sprectrophotometrically at
310 nm (ε 310 nm : 370 M-1 cm-1). The rates were corrected for the corresponding uncatalyzed
reaction. Kinetic parameters kcat and KM were calculated from the initial rates as described
(57).
4.4.7.2 Circular Dichroism Spectoscropy
Far-UV circular dichroism (CD) experiments were performed on a Circular Dichroism
Spectropolarimeter model 202 from AVIV instruments inc. CD spectra were recorded at
20 °C in PBS (pH 6.5) with 15-20 µM protein (d = 0.2 cm). Spectra were obtained by
averaging five wavelength scans taken in 0.5 nm steps, with a signal averaging time of 2 sec
and a bandwidth of 1 nm. Temperature denaturation curves were obtained by measuring at
222 nm as the samples were heated from 10 °C to 90 °C at 0.5 °C temperature steps and
equilibration times of 60 sec.
4.4.7.3 ANS Binding
All fluorescence experiments were performed at 20 °C with a fluorescence spectrometer
from PTI Photon Technology International, using a 1 x 1-cm quartz cuvette. Spectra were
obtained by averaging three wavelength-scans with a signal averaging time of 1 sec, 2 nm
steps, and an excitation and emission slit of 10 nm. ANS (2 µM) was excited at 370 nm, and
fluorescence was monitored at 400 nm to 600 nm in the presence and absence of 2 µM
protein.

107
4.4.7.4 Determination of Enzyme Concentration in the Selection Strain
Precultures of KA12/pKIMP-UAUC containing pKTR-mMjCM, pKTR-KY30 or
pKTR-mMjCMneg, respectively, were grown until OD600 = 1. Main cultures of 50 ml LB Amp150
Cam30 containing appropriate tc concentration were inoculated with precultures and
incubated at 30 °C, 250 rpm overnight. The cells were harvested and resuspended in 4 ml
PBS (pH 7.4). The cultures were diluted to 4 ml of OD600 = 50. Lysozyme was added to a final
concentration of 1 mg/ml and incubated for 30 min at RT. The cells were sonicated and the
insoluble material was removed by centrifugation. Supernatant was loaded onto a column
packed with 1 ml of Ni–NTA agarose (QIAGEN) that was pre-equilibrated with PBS (pH 7.4).
The column was washed with 3 ml PBS (pH 7.4) and eluted with 5 ml PBS (pH 7.4), 250 mM
imidazole although only the last 4 ml were collected. The collected samples were washed
and concentrated with YM-3 filters (Microcon). The final volume for all samples was 250 µl.
The kinetics were measured as described above, although no BSA was added. The
chorismate concentration was 200 µM and 20 µl of protein sample was added to a final
volume of 800 µl. The disappearance of chorismate was measured sprectrophotometrically
at 274 nm (ε 274 nm : 2630 M-1 cm-1).
4.4.7.5 1H-NMR Spectroscopy
NMR experiments were performed at 26 °C on Avance II 600, 600-MHz spectrometers, in
PBS’ buffer (20 mM sodium phosphate, 50 mM NaCl (pH 6.5), 10% D2O). The protein
concentration was 280 µM.
4.4.7.6 Trypsin Digestion
The CM sample (100 µM) was mixed one to one with trypsin (10 µg/ml) to start the
reaction. The mix was incubated at 25 °C. At different time points 30 µl aliquots were
removed and the reaction was quenched with 10 µl phenylmethylsulfonylfluoride (50 mM in
isopropanol). 2 µl 5x SDS (DTT) loading buffer was added to 6 µl quenched reaction mix and
heated for 5 min at 95 °C. 1 µl was loaded on a 20% SDS-PAGE (Amersham). The gel was run
and developed with a PhastSystem from PharmaciaBiotech. The developed SDS-PAGE was
analyzed and quantified with ImageJ. The intensities were normalized to the band of the
undigested sample.

108

109
5 Alternative Strategies for Increasing Selection Stringency
in Directed Evolution Experiments
5.1 Introduction
In Chapter 4 a simple strategy for increasing the selection stringency of a CM
complementation system was presented. The use of an N-terminal protein degradation tag
was shown to decrease the intracellular concentration of CM, enabling enzymes with
moderate activity to be distinguished from highly active enzymes (Figure 4-2). The increase
in selection stringency allowed the evolution of a highly active molten globular enzyme that
could not be achieved with the original selection system. The higher rate of protein turnover
increased selection pressure on the cell, so that only enzymes with improved catalytic
efficiency were able to complement the metabolic deficiency. The success in identifying the
highly active and more robust KY30 CM enzyme illustrates the utility of this approach.
Increasing selection stringency by decreasing catalyst concentration within the cell should be
a generally applicable strategy for selecting highly active enzymes.
While effective, the use of degradation tags and inducible promoters is not the only way
to regulate intracellular protein concentration. Other possibilities include: (i) reducing
plasmid copy number, (ii) reducing mRNA levels with anti-sense RNA (141), (iii) regulating
translation with altered ribosome binding sites (126, 130). In this chapter, several of these
approaches were tested for their potential to modulate selection stringency in the CM
selection system described in Chapter 4. In the first, translation levels were adjusted by
altering the ribosome binding site (RBS). In the second, influence of anti-sense RNA on the
selection stringency was investigated.
5.2 Results
5.2.1 Selection Stringency of the Original Tetracycline Operator Site
As depicted in Figure 5-1 A the selection plasmid used to evolve KY30 (Chapter 4)
contains a tunable tc promoter to control transcription. A T7 promoter is also located in
front of the CM gene and an additional one is on the other side of the gene on the opposite
DNA strand (125). The RBS for the T7 system is known to be very efficient for translation. In
order to achieve lower protein concentrations in the cell, the T7 promoter site was replaced
with the RBS for the tc antiporter gene (131, 142). Two plasmids, pKTAR and pKTA, were
constructed in which the genes encoding CM with and without the RepA tag are regulated by
this system (Figure 5-1 A). The gain in selection stringency provided by these constructs was
analyzed with KY12, the best complementing clone from the selection experiments

110
described in Chapter 4. KY12 (A23fD, I76L, K89N) has a three-fold higher KM than KY30 (A23fD,
N47D, Y54H, E66V, I76L) and a similar kcat value, but leads to slightly faster growth rates possibly
because it is more resistant to proteolysis than KY30. The complementation ability of vectors
pKTA and pKTAR was compared with that of KA12/pKIMP-UAUC (6), which encodes KY12 in
the original pKTR selection vector, (Figure 5-1 B). Different concentrations of cells (105, 103,
101 cells per drop) were plated on agar plates lacking tyrosine and phenylalanine, but
supplemented with varying tc concentrations (0, 5, 10, 20, 100 µg/ml tc). However, the new
constructs had no effect on the complementation ability of KY12-producing cells. Moreover,
the RepA tagged KY12 protein did not lead to reduced growth compared to untagged KY12 in
A
B
Figure 5-1: Modification of the pKTR operator. A) Design of vectors with the original tc operator site
without the T7 promoter present. When produced from the pKTA and pKTR plasmid, the chorismate
mutase KY12 is produced without and with the RepA tag. tetR: tetracycline repressor gene, O1 and O2:
operator sites of tetracycline, PT7: T7 promoter, T7: ribosome binding site (RBS) belonging to T7 promoter
system, repA: protein degradation tag, KY12: mMjCM variant gene B) Complementation ability of the
pKTR-KY12, pKTA-KY12, and pKTAR-KY12 plasmids in KA12/pKIMP-UAUC cells (6) at varying tc
concentrations. High concentrations of tc reduce selection stringency.

111
this context. Although these results are preliminary, it appears that changing the RBS does
not provide additional control over selection stringency in this system.
5.2.2 Utilization of an Impaired Ribosome Binding Site
Since the exchange of one functional RBS with another did not increase selection
stringency, a more severely impaired RBS was considered. In order to identify an inefficient
RBS, directed evolution was applied. Because HIV protease is a toxic protein for cells,
inefficient translation of the HIV protease should protect cells and allow them to grow (88).
The RBS in plasmid pKTR was mutated by saturation mutagenesis. At each position of the
10 bp long RBS, either all nucleotides were allowed for the first library (library RBS-N) or
because high pyrimidine content is known to reduce the translation rates only pyrimidines
for the second library (library RBS-Y), (Figure 5-2). The library was then cloned upstream of
the HIV protease gene in plasmid pKT-HIV.
The constructs were transformed into XL1blue cells. Since the freshly transformed cells
had difficulty growing due to the toxic effects of HIV protease, they were already pre-
selected. Thus, the apparent library sizes of RBS-N and RBS-Y contained 2 × 10⁵ members,
which is lower than normally seen for CM libraries. For RBS selection, the HIV protease gene
was induced at tc concentrations of 0, 0.5, 1, 2, 5 µg/ml tc. This time, the highest tc
concentration reflects the most stringent condition. The difference between the plates was
minimal. On plates at 5 ng/ml tc, only half as many clones grow (25% complementation
Figure 5-2: Selection of impaired RBS sequences. Libraries of altered RBS sequences were generated by
saturation mutagenesis. In library RBS-N all nucleotides were allowed at each position in the 10 bp long
RBS sequence. In library RBS-Y only pyrimidines were allowed. The toxic HIV protease is induced at high tc
concentrations, so that cells survive only if the translation of the HIV gene is inefficient because its RBS is
impaired. tetR: tetracycline repressor gene, O1 and O2: operator sites of tetracycline, PT7: T7 promoter,
N10: randomized ribosome binding site (RBS) allowing all nucleotides at each position, Y10: randomized
ribosome binding site (RBS) allowing only pyrimidines at each position, HIV-protease: HIV protease gene

112
frequency) compared to the least stringent condition at 0 ng/ml tc (50% complementation
frequency). The pre-selection most likely eliminated many clones. Additionally, there are
more sequences present with a weakly efficient RBS than those of highly efficient variant.
Ten clones from library RBS-Y and 12 clones from library RBS-N that grew under the most
stringent selection conditions were randomly picked and sequenced (Figure 5-3). An
alignment of RBS-N clones showed no sequence trend. However, for the RBS-Y, nine out of
ten clones had a cytosine at position 5. The small number of sequenced clones precluded
identification of other statistically meaningful conservation patterns.
In order to verify the ability of the selected RBS sequences to reduce translation, three
modified RBSs were cloned into the pKTR-KY12 selection plasmid to give plasmids pKTY2R,
pKTY7R, and pKTY11R (Figure 5-4 A). Complementation was analyzed as described for the
pKTA and pKTAR plasmids. Different cell concentrations were analyzed on minimal plates
supplemented with varying inducer concentrations (Figure 5-4 B). All three RBSs increased
selection stringency. RBS Y2 (TTCCCTTCTCC) is the most efficient RBS of the three variants
tested and varies only by two bases from the least efficient RBS Y7 (TTTCCTTTTT). Variant
Y11 (CTCCCTTTC), differing by three bases, seems to have lost tunability by tc; perhaps
Figure 5-3: Sequence alignment of selected RBS sequences that cause inefficient translation. The bases of
the selected RBS are highlighted in color: thymidine, red; cytosine, black; adenine, bright blue; guanine,
dark blue.

113
interfering with the tc operator site. The pKTY7R plasmid may therefore be suitable for
increasing the stringency of selection experiments to further evolve KY30.
5.2.3 Application of Ribosome Binding Site RBS Y7
The utility of the inefficient RBS Y7 for increasing selection stringency was tested with the
mMjCM LM3 library (chapter 4). A set of 30 clones that complemented the KA12/pKIMP-
UAUC selection strain under stringent conditions without tc or in the presence of 2.5 ng/ml
tc were subjected to epPCR and cloned into the new pKTY7R vector to give the library LM4.
This library conatined 4 × 10⁶ clones and exhibited a mutation rate of 0.7% at the protein
level. The complementation frequency of library LM4 was around 10% on minimal plates
Figure 5-4: Plasmids for the selection of KY12 variants based on impaired RBS sequences. A) Design of
plasmids containing either the original T7 RBS (pKTR) or one of the inefficient RBS, RBS Y2, RBS Y7, or RBS
Y11 (pKTYxR). The RBS sequences are depicted below the vector. tetR: tetracycline repressor gene, O1 and
O2: operator sites of tetracycline, PT7: T7 promoter, T7: ribosome binding site (RBS) belonging to T7
promoter system, YX: selected ribosome binding sites (RBS) , RBS Y2, RBS Y7, and RBS Y11, of pyrimidine
library, repA: protein degradation tag, KY12: mMjCM variant gene B) Complementation ability of these
plasmids in KA12/pKIMP-UAUC cells (6) at varying tc concentrations. High concentrations of tc reduce
selection stringency.

114
supplemented with 100 ng/ml tc. Plasmids from the largest clones were isolated and
sequenced. The alignment revealed that only sequences from the epPCR template were
present. Clones with mutations introduced by epPCR had been removed by the selection
step. Thus, the selected variants from library LM3 and library LM4 were the same. To allow
new combinations of mutations to occur, the genes of the selectants were shuffled by DNA
shuffling (98). The resulting library, LM5, contained 9 × 10⁶ clones. A second selection was
performed under more stringent conditions by plating the library on minimal media plates
supplemented either with 20 ng/ml tc or 50 ng/ml tc. The complementation frequencies
were 1% and 10%, respectively. A range of colony sizes was observed, including some giant
colonies that are indicative of some kind of artifact.
Several selected clones were sequenced. Some of the clones selected under more
stringent conditions were indeed artifacts resulting, for example, from unwanted removal of
the RepA tag from the CM gene. Exonuclease activity presumably caused this sort of
deletion, since the digested vector that was used was from an older sample. As a result, the
cells are able to produce untagged CMs. The codon for methionine (M1) in the CM gene is
presumably used as an alternative start codon instead of the methionine of the RepA tag.
Additionally, the deletion may create a new RBS that is more efficient than RBS Y7
(Figure 5-5). These problems could be generally circumvented by deleting or mutating the
Figure 5-5: Analysis of the selected artifacts using the selection plasmid pKTY7R. The mRNA transcribed from
the pKTY7R selection plasmid is shown above. The mRNA of the selected artifact that contains a single base
deletion in front of the CM gene is shown below. This deletion allows cells to produce CM without RepA
degradation tag starting with the methionine of the CM gene instead of the methionine of the RepA tag. The
RNA sequence of the repA tag can serve as an alternative RBS site instead of the RBS of Y7.

115
methionine of the CM, which would answer that CM is only produced starting from the
methionine of the RepA tag.
In addition to the artifacts, true library variants were selected, although the sequence
diversity is small. The population is dominated by two variants, KB10 (I4N, A23fD, I76L, K89N,
E94G) and KB14 (I4T, K20E, R23bG, A23fD, N47D, Y54H, I76L, K89N, E94G). Both were cloned into the
pET-pATCH (136) protein production vector and produced in KA13 (137). Both show similar
folding properties as KY30, as judged by thermal denaturation and ANS binding experiments
(Figure 5-6). Both variants are more active than mMjCM, but less active than KY30. Their kcat
values are within experimental error of the kcat for KY30 but because KM is increased, the
A B
C
Figure 5-6: Biophysical characterization of
mMjCM (black), KB10 (grey) and KB14 (red)
A) Fluorescence measurement of ANS binding to
mMjCM and KY30 at 20 °C. Spectra of free ANS
(2 µM) without protein (orange) and ANS in the
presence of protein (2 µM). The left y-axis belong
to the solid lines belonging to one protein
production batch, whereas the right y-axis
belong to the dashed lines belonging to another
protein production batch. B) Thermal
denaturation measured by CD at 222 nm of wt
mMjCM (solid line and dashed line), KY30 (blue),
KB10, and KB14. C) CD spectra of the three
proteins at 20 °C.

116
apparent bimolecular rate constant kcat/KM is lower (Table 5-1). Given this, the slight growth
advantage provided by these two enzymes compared to KY30 is probably due to higher
intracellular catalyst concentrations or greater in vivo stability.
The last selection with plasmid pKTY7R in KA12/pKIMP-UAUC was performed with
20 ng/ml tc. Nevertheless, KB10 and KB14 could already complement under these conditions
without exhibiting higher activity. Thus, it would be worth exploring other approaches that
might modulate selection stringency better than the RBS approach.
5.2.4 Reduction of Transcript Levels with Anti-Sense RNA
The previously constructed plasmids pKTA and pKTAR are ideal to test the anti-sense RNA
approach to decrease protein translation levels in the cell. Both plasmids have a T7 promoter
site downstream of the CM gene: on the non-coding strand. Induction of this promoter leads
to reverse transcription of the anit-sense CM gene (Figure 5-1 A). If anti-sense mRNA were
to anneal to the normal mRNA (141), binding of the ribosome would be physically blocked.
Specialized RNAses that recognize dsRNA also rapidly degrade such complexes. Both effects
would reduce protein production.
The selection strain KA12/pKIMP-UAUC (6) does not contain a T7 polymerase gene, so the
T7 promoter is irrelevant for the selection process. However, the CM knockout strain KA23,
which produces the T7 polymerase (Kast, P. and Gamper, M. unpublished results), allows the
effect of the anti-sense mRNA to be tested. As in KA12, transcription of the coding
Variant Mutations b kcat
(s-1) KM
(µM) kcat/KM (M-1s-1)
MjCM c
(wt dimer) 3.2 50 64,000
mMjCM c
3.2 170 19,000
mMjCM d 4.5 ± 0.4 220 ± 10 20,000
KY30 d A23fDc, N47D, Y54H, E66V, I76L 6.9 ± 0.8 80 ± 20 84,000
mMjCM
3.4 ± 0.2 160 ± 10 21,000
KB10 I4N, A23fD, I76L, K89N, E94G 7.3 ± 0.8 170 ± 50 43,000
KB14
I4T, K20E,R23bG,A23fD, N47D, Y54H, I76L, K89N, E94G
7.0 ± 0.7 130 ± 20 54,000
aAssay for chorismate mutase activity were carried out in PBS buffer (pH 6.5) at 20°C by monitoring the change in absorbance at 310 nm over time. bThe numbering relies on the previously defined nomenclature (85). cValues published previously (54). dValues shown in Chapter 4.
Table 5-1: Kinetic parameter of mMjCM and its variantsa

117
mRNA is also controlled by the tc promoter in this system. Since the T7 promoter is leaky,
the ability of KY12 to complement the CM deficiency of KA23 was tested with and without
reduction of anti-sense mRNA transcription (Figure 5-7). Cell growth is greatly reduced
under both conditions. Leakage of the T7 promoter is apparently sufficient to reduce CM
concentrations significantly. When the T7 promoter is induced, almost no growth is
observed. Only some clones survived at the highest cell density, suggesting the accumulation
of spontaneous host mutations that allow the cells to adapt to these stringent conditions.
Such artifacts are undesirable for directed evolution experiments. Since the un-induced cells
do not show this behavior, it might be possible to apply a selection strategy to generate CM
variants with high catalytic activities.
5.3 Conclusion
In principle, the stringency of the CM selection system can be fine-tuned in various ways.
For example, replacement of the T7 RBS with the inefficient RBS Y7 should decrease
translation efficiency. Our experiments with the CM show that this approach can work, but
they also reveal a potential weakness if the gene to be translated has an additional
methionine codon that can serve as the initiator site and thus circumvent production of the
Figure 5-7: Growth ability of KY12 anti-sense RNA expressing cells. Complementation ability of the pKTR
plasmid in KA12/pKIMP-UAUC cells was compared to pKTA and pKTAR plasmids in KA23 cells with and
without IPTG induction and at varying tc concentrations. High concentrations of tc reduce selection
stringency.

118
RepA degradation tag. Even when the system was successful, the benefit compared to the
original system presented in Chapter 4 is not apparent. This is perhaps because the evolved
mMjCM variants have already reached a local minimum.
The use of anti-sense mRNA to reduce transcription levels appears to be very efficient in
reducing intracellular CM concentrations. However, the utility of this strategy for directed
evolution experiments still needs to be demonstrated. One possible obstacle is the selection
of secondary mRNA structures that block binding of the anti-sense mRNA. A change from the
KA23 strain to the well characterized KA12/pKIMP-UAUC strain would be desirable, but
would require another promoter for anti-sense RNA transcription than the T7 promoter.
Exchanging the T7 promoter site with the salicylate promoter would allow the use
KA12/pKIMP-UAUC. The latter swap would also allow the regulation of anti-sense synthesis.
Although the salicylate promoter does not have the regulation capability of the tc promoter,
it is substantially better than the T7 promoter.
These strategies for increasing selection stringency are not limited to the CM system.
They should be applicable to virtually any screening or selection system that has insufficient
dynamic range to distinguish between highly and medium active enzymes, and hence
invaluable for optimizing the turnover efficiency of natural and artificial catalysts.

119
5.4 Materials and Methods
5.4.1 Cell strains
XL1Blue (Stratagene) was used for general cloning and amplification purposes (105). The
CM-deficient E. coli strain KA12/pKIMP-UAUC was the selection strain for the genetic
complementation experiment (6). The genotype of KA12: F-, l-, Δ(srlR-recA)306:Tn10 (TetR),
Δ(pheA-tyrA-aroF), thi-1, endA1, hsdR17, Δ(argF-lac)205(U169), supE44. The plasmid pKIMP-
UAUC provides genes encoding monofuctional forms of prephenate dehydrogenase and
prephenate dehydratase from E. herbicola and P. aeruginosa, respectively and confers
chloramphenicol resistance. CMs were overproduced in E. coli strain KA13 (137). Its
genotype is: F-, λ-, Δ(srlR-recA)306:Tn10 (TetR), Δ (pheA-tyrA-aroF), thi-1, endA1, hsdR17,
Δ (argF-lac)205(U169), supE44, λ(DE3) [UV5 Plac expressed) T7-RNA-pol, imm21, Δnin5,
Sam7, (int-)], which carries a chromosomally integrated, IPTG-inducible T7 RNA polymerase
gene. KA23 is also a CM knockout strain, derived from BL21 (DE3) (122), that expresses the
T7 polymerase and is recA- (Kast, P. and Gamper, M. unpublished results). KA23: F-, P-, Δ(srlR-
recA)306:Tn10 (TetR), Δ(pheA-tyrA)::[tyrA*-pheC-cat(CamR)], ompT[lon], hsdSB (r-B,m-
B),
λ(DE3) *UV5 Plac expressed) T7-RNA-pol, imm21, Δnin5, Sam7, (int-)](Kast, P. and Gamper, M.
unpublished results).
5.4.2 DNA Manipulation
Molecular cloning was performed according to standard procedures (106).
Oligonucleotides were synthesized and purified by Microsynth. Chain termination chemistry
(107) was applied for DNA sequencing using BigDye Terminator Cycle Sequencing Kit v3.1
and ABI prism 3100 Genetic Analyzer (PE Applied Biosystems).
5.4.3 Plasmid Construction
The pKTA-KY12 plasmid exchanged the T7 RBS of the pKT-KY12 vector for the original RBS
of the tetOperator. An NdeI restriction site was introduced just after the RBS site of the
tetOperator with the primer tetRfw (5’-TGGCC TTTTG CTGGC CT) and pKTANdeIrv (AATTT
CGCGG GATCC ATATG ACTTT TCTCT ATCAC). The PCR fragment was digested with NdeI and
NsiI and ligated with the backbone of pKT-KY12 cut with the same restriction enzymes. The
plasmid pKTAR-KY12 was cloned like pKTA-KY12 but the backbone derives from pKTR-KY12.
The plasmid pKTYxR-KY12 was constructed from selected clones from the RBS library (see
below). The KY12 gene insert was obtained from pKTR-KY12 by digesting the plasmid with
NdeI and XhoI. The backbone of pKTYxR-KY12 vector derives from digested pKTYx-HIV
plasmid with the same restriction enzymes. The acceptor plasmid for the mMjCM library was
the pKTY7-KY12neg, which has a frameshift insertion in the KY12 gene. pKTY7-KY12 was

120
digested with HindIII, the overhangs were filled in with Klenow fragment, and the resulting
blunt ends were ligated.
5.4.4 Ribosome Binding Site Libraries
The RBS of the T7 promoter was randomized by cassette mutagenesis. For the RBS-Y
library, the randomized cassette provides only pyrimidines (Y) at the RBS whereas for the
RBS-N library all nucleotides (N) are allowed for randomization. The mutations were
introduced in the pKT-HIV vector using primers Y-RBS-tox (5’-CCCTC TAGAA ATAAT TTTGT
TTAAC TTTAY YYYYY YYYYA TACAT ATGCC TC) or N-RBS-tox (5’-CCCTC TAGAA ATAAT TTTGT
TTAAC TTTAN NNNNN NNNNA TACAT ATGCC TC) in combination with M13(-20) (5’-GTAAA
ACGAC GGCCA GT). The PCR fragment and pKT-HIV were digested with XbaI and XhoI and
ligated. The pKT-N-RBS-HIV or pKT-Y-RBS-HIV library plasmids were transformed into SEM
competent XL1blue cells. One portion of the cells was plated for library size determination
on LB Amp150 (library sizes around 2*105 cells). The remainder was used to inoculate an
overnight culture. The culture did not grow very well, probably because a pre-selection had
taken place. The culture was freshly inoculated to have a fresh culture for selection.
5.4.5 Selection of RBS Libraries
30 ml LB Amp plates were supplemented with tc by plating 100 µl tc solutions at the
appropriate concentration to obtain final tc concentrations of 0.5 µg/ml, 1 µg/ml, 2 µg/ml
and 5 µg/ml. The plates were incubated for 1 hour at RT before plating. 104 cells were plated
and incubated at 30 °C for 20 h. Several clones were picked and sequenced. At each position
the abundance of each nucleotide was counted to provide a rough score number for
evaluation of the sequences. The best four clones from the Y-RBS library were further
analyzed in selection experiments with mMjCM. The four clones RBSY2, RBSY7, and RBSY11
were combined with this KY12. The KY12 variant was identified under the most stringent
condition when LM3 library was selected (section 4.2.4). It was chosen for this experiment
because after recloning KY12 in fresh vector it grew fastes on M9c plates without tc,
although in vitro characterization showed lower catalytic activity (kcat/KM) than KY30. pKTYx
were digested with XhoI/NdeI and ligated with KY12 from pKTR-KY12 (XhoI/NdeI).
5.4.6 Dilution plating
For the dilution plating the KA12/pKIMP-UAUC containing the appropriate mMjCM coding
plasmid were inoculated in LB Amp150 Cam30 at 30°C, 230 rpm until an OD600 of 1 was
reached. The cultures were diluted to OD600 = 0.1, 0.001 and 0.00001. 50 µl of each dilution
was pipetted onto LB Amp150 Cam30 and onto different minimal media plates containing the

121
appropriate tc concentration and in the case of pKTA and pKTAR, with and without IPTG
(100 µM). The aliquots contained approximately 105, 103, and 10 cells per 50 µl solution.
5.4.7 mMjCM Libraries
A gene pool of 30 clones from library LM3a selected on M9c plates supplemented with
0 or 2.5 ng/ml tc (Chapter 4) was mutagenized by epPCR (GeneMorph II Random
Mutagenesis Kit, Stratagene) with the primers M13(-20) (5’-GTAAA ACGAC GGCCA GT) and
PtetT7seq (5’-ACCAC TCCCT ATCAG TGATA). The PCR fragment was inserted into the pKTY7R-
KY12neg vector at the NcoI/XhoI restriction site. The library size after transformation was
3.6 × 10⁶ and the mutation rate at the protein level was 0.7% (LM4). For the second
mutagenesis round DNA shuffling was applied. The library gene pool was amplified by PCR
with the T7 primer (5’-TAATA CGACT CACTA TAGGG) and digested with DNAseI. The
digestion was quenched with EDTA and the DNAseI was at 70 °C for 10 min heat inactivated.
The DNA was purified by phenol-chloroform extraction. Additionally, the fragments were
purified on a 3% agarose gel. The 20-100 bp fragments were extracted and purified using a
NuecloSpin gel extraction kit. The DNA fragments were concentrated and reassembled by a
PCR-like reaction, without the addition of exogenous primers [0.5 min at 95 °C, (0.5 min at
95 °C, 0.75 min at 45 °C, 3 min at 72 °C)×40, 5 min at 72 °C]. Without further purification, 8 µl
of the reaction mixture was directly subjected to a PCR reaction using the T7 primer to
amplify the reassembled gene products [0.5 min at 95 °C, (0.5 min at 95 °C, 0.5 min at 50 °C,
1 min at 72 °C)×40, 5 min at 72 °C]. The purified PCR fragment was inserted into the pKTY7R-
KY12neg vector using the NcoI and XhoI restriction sites. Afterwards, the ligation mixture
was transformed into KA12/pKIMP-UAUC cells by electroporation. A portion of the
electroporated cells was plated on LB Amp150 Cam30 to determine the library sizes, the
remainder was used to inoculate 50 ml of LB Amp150 Cam30 for preparation of frozen stocks,
plasmid isolation, and the selection experiments. DNA shuffling afforded libraries containing
9.3 × 10⁶ clones (LM5).
5.4.8 Selection with mMjCM Libraries
The complementation and selection experiments were performed using M9c medium
plates at pH 7. The medium contained Na2HPO4 (6 mg/ml), KH2PO4 (3 mg/ml), NH4Cl
(1 mg/ml), NaCl (0.5 mg/ml), 0.2% (wt/vol) D-(+) glucose, 1 mM MgSO4, 0.1 mM CaCl2,
thiamin-HCl (5 µg/ml), 4-hydroxybenzoic acid (5 µg/ml), 4-aminobenzoic acid (5 µg/ml),
2,3-dihydroxybenzioc acid (1.6 µg/ml), L-Trp (20 µg/ml), sodium ampicillin (150 µg/ml), and
chloramphenicol (30 µg/ml). 15 g of agar was added per liter medium. Where required, M9c
was supplemented with L-Phe and L-Tyr at a final concentration of 20 µg/ml. For the

122
complementation assay the appropriate amounts of tetracycline was added. Cell cultures
were washed with M9c salt (Na2HPO4 (6 mg/ml), KH2PO4 (3 mg/ml), NH4Cl (1 mg/ml), NaCl
(0.5 mg/ml)) before plating. Plates were incubated at 30 °C.
For the selection experiments, the overnight cultures of freshly transformed cells were
used. The cultures were diluted to 1 ml of OD600 = 1 and washed in M9c buffer before further
dilution. In average 1 ml OD600 = 1 of a KA12/pKIMP-UAUC cell culture corresponded approx.
5 × 10⁷ cells. For the correct amount of cells in the culture, it was diluted 106 and 107-fold
and plated on M9c FY. The number of cells that is able to grow under these unselective
conditions corresponds to a 100% complementation frequency. For selection, the cell culture
was diluted 104 and 105-fold and plated on M9c supplemented with the appropriate amount
of tc. Since a complementation frequency between 0.1 – 10% is aimed for a
complementation frequency in this range under this conditions (104 and 105-fold dilution)
should allow 10 – 500 clones per plate to grow which is a countable number of clones. After
plating the plates were incubated for 3 days at 30 °C.
5.4.9 Protein Production and Purification.
CM derivatives were produced with pET-pATCH plasmids in the host strain KA13. 500 ml
LB Amp150 was inoculated with an overnight preculture (5 ml LB Amp150). The culture was
incubated at 37 °C up to an OD600 of 1. Protein production was induced by adding IPTG to a
final concentration of 0.25 mM. After 20 h at 20 °C the cells were harvested and
resuspended in 10 ml sonication buffer (pH 8) supplemented with 1 mg/ml lysozyme. The
suspension was kept on ice for 30 min. The cells were sonicated, and the insoluble material
was removed by centrifugation. The soluble fraction was loaded onto a column packed with
1 ml of Ni–NTA agarose (QIAGEN) that had been pre-equilibrated with PBS (pH 6.5). The
column was washed with 8 ml PBS (pH 6.5) containing 10 mM imidazole and eluted with 8 ml
PBS (pH 6.5) containing 250 mM imidazole. The proteins were further purified by
preparative size exclusion chromatography using a Superdex 75 (26/60) FPLC column
(PharmaciaBiotech) with PBS (pH 6.5) as the running buffer. The monomer fraction was
pooled and concentrated to a final concentration of 15-20 µM. The proteins were stored at
4 °C.
5.4.10 Protein Characterization
5.4.10.1 Kinetics
All kinetics were performed at 20 °C and final enzyme concentrations of 40 nM in PBS (pH 6.5)
supplemented with 0.1 mg/ml bovine serum albumin (BSA). Initial rates were determined by
monitoring the disappearance of chorismate sprectrophotometrically at 310 nm (ε 310 nm :

123
370 M-1 cm-1). The rates were corrected for the corresponding uncatalyzed reaction. Kinetic
parameters kcat and KM were calculated from the initial rates as described (57).
5.4.10.2 Circular Dichroism Spectoscropy
Far-UV CD experiments were performed on a cicular dichroism spectropolarimeter model
202 of AVIV instruments inc. CD spectra were recorded at 20 °C in PBS (pH 6.5) with
15-20 µM protein (d = 0.2 cm). Spectra were obtained by averaging five wavelength scans
taken in 0.5 nm steps, with a signal averaging time of 2 sec and a bandwidth of 1 nm.
Temperature denaturation curves were obtained by measuring at 222 nm as the samples
were heated from 10 °C to 90 °C in 0.5 °C temperature steps and equilibration times of
60 sec.
5.4.10.3 ANS Binding
All fluorescence experiments were performed at 20 °C with a fluorimeter from PTI Photon
Technology International, using a 1 cm x 1 cm quartz cuvette. Spectra were obtained by
averaging three wavelength scans with a signal averaging time of 1 sec, 2 nm steps, and an
excitation and emission slit of 10 nm. ANS (2 µM) was excited at 370 nm, and fluorescence
was monitored at 400 nm to 600 nm in the presence and absence of 2 µM protein.

124

125
6 Perspective
Nowadays protein engineers are capable of designing artificial enzymes. Although it is
possible, success is not guaranteed and the road to success is often rocky. Initial designs
normally possess only minimal to moderate designed activities or affinities. Thus, for any
kind of application, subsequent improvement is essential. In many cases the method of
choice for improving initial designs is directed evolution, with a selection or screening
system that must be adapted to the protein of interest. Consequently, the creation of
functional proteins is an individual process and in many cases only an individual success.
Knowledge of the reaction mechanism, the demands of the design of the protein (required
interactions for binding or catalysis), and the demands of the protein itself (stability,
flexibility and folding) is required. Generally applicable approaches would both ease up and
speed up the protein design process.
The knowledge that enzymes catalyze reactions by stabilizing the transition states of
reactions was used to generate catalytic antibodies (13, 21). Generation of catalytic
antibodies has already been largely optimized. Intrinsic limitations caused by the necessity of
stable transition state analogs as antigens, and by modest binding affinities in the nanomolar
range of extracted antibodies are inevitable. Thus, this approach can only be improved by
optimizing antibody evolution. The combination of yeast cell-surface display and
fluorescence activated cell sorting seems to be very promising, since antibodies with
femtomolar affinities have already been identified in this manner (83). In our case described
in chapter 2, the improvement observed in the evolution of catalytic antibody 1E9 was
minor. Not only the slight increase in activity but also the discrepancies of protein properties
between the protein in solution and those observed on the cell surface raised concerns
about the reliability of this method (yeast cell-surface display and fluorescence activated cell
sorting). The low activity increase of the antibody over five rounds of directed evolution also
causes one to question whether immunoglobulin scaffolds are suitable starting points for
catalysts. Other protein scaffolds seem to be more suitable and are more readily produced in
microorganisms.
Computational design is not limited to immunoglobulins. Basically any protein scaffold can
be considered as a template for functional redesign. In contrast to catalytic antibodies,
which cannot yield better initial designs, computational approaches still have a lot of
optimization potential for their first designs. Today, the initial designs generated by
computation are similarly efficient (or inefficient) as catalytic antibodies. A reason for these
moderate affinities and activities is due to the fact that important parameters, such as

126
backbone flexibility or the influence of water, are generally neglected in the design
algorithms. Important for catalyst design, electrostatic interactions are also not adequately
integrated in the applied programs. If these problems and simplifications can be overcome,
the approach of computational design should yield initial designs that should not require any
further optimization. Therefore not only is better knowledge about the structure-function
relationship of proteins needed but we also need new technologies in the field of
computation that can cope with these extended calculations in a reasonable amount of time
and with reasonable cost.
Directed evolution has been applied very successfully in the optimization of protein
functions and properties as shown in chapter 2 and 3. The success of directed evolution
experiments is however strongly dependent on the applied screening or selection strategy.
The development and implementation of a suitable assay is often more time-consuming
than the actual direct evolution experiment. Thus, having a single assay for both, high and
low protein affinity or activity would be advantageous. A controllable adaptation of the
selection stringency to the selection requirements would be a solution. Upregulation of
protein concentration to decrease stringency for minimally active proteins has often been
applied. The possibility of increasing selection stringency was however thus far disregarded.
Possible approaches to downregulating protein concentration to increase stringency are
presented in this thesis in chapter 4 and 5. They are potentially transferable between
screening or selection methods. Consequently directed evolution experiments could be
applied to minimally as well as highly functional proteins.
The different projects presented and discussed in this thesis show the promise when a
catalytic antibody approach or a computational design approach is combined with directed
evolution. However, it also shows some of the limitations. Using yeast cell-surface display
and fluorescence activated cell sorting reveals discrepancies between protein properties
when protein is displayed on yeast or purified in solution. This was observed for the
antibody and for the spider roll as well. Additionally this result shows how much a reliable
screening and selection system can influence the success of a directed evolution experiment.
A promising new method is the “lab-on-a-chip” technology which is an enhancement of the
fluorescence activated cell sorting approach (66, 68). There tiny droplets serve as micro
reaction vessels enclosing molecules, proteins, cells, and even multicellular organisms as
C.elecans. Proteins produced in monoclonal droplets can be analyzed and sorted in which
the detected signal for selection is normally fluorescence. Most macroscopic experimental
steps are also feasible in this microscopic format (except washing). Although the technology
is still in its fledgling stages it was successfully employed to evolving an horseradish

127
peroxidase (84). The identified variant exhibited a catalytic activity of 2.5 × 10⁷ M-1s-1, which
is not far from the diffusion limit. An expansion of applicable methods for this technology
especially of analysis methods like fluorescence anisotropy, UV, CD, and MS would improve
the “lab-on-a-chip” technology. Some methods like fluorescence anisotropy and MS are
already in development (143, 144). Particularly MS could allow analysis of a multitude of
reaction, which would make this technique especially valuable for directed evolution
experiments. The development of the “lab-on-a-chip” technology is very fast which leads to
the conclusion that in the near future this technology will play a major role in directed
evolution experiments.
In the future, the combination of computationally derived, functional initial designs and of
directed evolution that relies on generally applicable high-throughput screening methods
(e.g. “lab-on-a-chip” with MS analysis) could be the method of choice to design tailor made
proteins that my reach efficiencies at diffusion limit.

128

129
7 Appendix
7.1 Media for E. coli
7.1.1 LB medium (1 l):
LB-medium (25 g/l) 25 g
The sample was dissolved in 1 l H2O and autoclaved for sterilization.
7.1.2 2xYT medium (1 l):
Yeast extract 10 g
tryptone 16 g
NaCl 5 g
The mixture was dissolved in 1 l H2O and autoclaved for sterilization.
7.1.3 SOC medium (0.1 l)
Yeast extract 0.5 g
Tryptone 2 g
NaCl 5 M (10 mM) 0.2 ml
KCl 1 M (2.5 mM) 0.25 ml
NaOH 1 M (pH adjustment) ~ 0.1 ml
The mixture was dissolved H2O and autoclaved. The 1 ml MgCl2 (1
M, sterile) and 2 ml glucose (1 M, sterile) were added.

130
7.1.4 MOPS medium (1 l, pH 7.4)
NaCl (70 mM) 4.1 g
KCl (10 mM) 0.75 g
MOPS (30 mM) 6.3 g
MgSO4∙7H2O (1.6 mM) 0.4 g
NH4Cl (20 mM) 1.1 g
Glucose (0.15% w/v) 1.5 g
NaOH (pH adjustment) ~0.8 g
CAS amino acids 0.55 g
yeast extract 0.15 g
The mixture was dissolved in 1 l H2O and autoclaved.
The appropriate amount of ampicillin was added.

131
7.1.4.1 Fermentation medium (2 l)
solution 1:
(NH4)2SO4 (47 mM) 12.4 g
NaH2PO4∙H2O (3.3 mM) 0.9 g
K2HPO4 (6 mM) 2.1 g
The mixture was dissolved in 1.5 l H2O and autoclaved in
bioreactor vessel.
solution 2:
MgSO4∙7H2O (12 mM) 5.9 g
NZ-Amine AS (12 g/l) 4 g
Na3-citrate∙2H2O (4.1 mM) 2.4 g
Glucose (17 mM) 6.1 g
The mixture was dissolved in 490 ml H2O, filter sterilized and
added to the autoclaved solution 1 in bioreactor vessel.
solution 3:
Na2MoO4∙2H2O (20 μM) 0.5 g
The sample was dissolved in 10 ml H2O, filter sterilized and 200
μl added to the autoclaved vessel.
solution 4:
ZnSO4∙2H2O (20 μM) 0.4 g
MnSO4∙H2O (20 μM) 0.35 g
CoCl2 (20 μM) 0.3 g
H3BO3 (20 μM) 0.1 g
CuSO4∙5H2O (20 μM) 0.5 g
The mixture was dissolved in 10 ml of 1 M HCl and added to the
autoclaved in bioreactor vessel.

132
solution 5:
isoleucine (2.4 mM) 0.65 g
The sample was dissolved in 5 ml 1 M HCl and added to the
autoclaved bioreactor vessel.
solution 6:
FeCl3 (125 μM) 0.2 g
The sample was dissolved in 10 ml H2O, filter sterilized and 2 ml
added to the autoclaved bioreactor vessel.
solution 7:
ampicillin (100 mg/L) 0.4 g
The sample was dissolved in 2 ml H2O, filter sterilized and 1 ml
added to the autoclaved bioreactor vessel and an additional 1
ml after 10 hours.
feeding reagents
to prepare:
- 500 ml of 12.5% ammonium hydroxide
solution
- 500 ml of 50% (w/v) glucose solution
- 500 ml of 1 M (NH4)2SO4

133
7.2 Media for Yeast
7.2.1 YPD medium (1 l):
Yeast extract 10 g
peptone 20 g
glucose 20 g
The mixture was dissolved in 1 l H2O and autoclaved for
sterilization.
In the case of agar plates 15 g bacto-agar was added prior to
autoclaving.
7.2.2 SD-CAA minimal medium (pH 6, 1 l)
Na2HPO4∙7H2O (38 mM) 10.2 g
NaH2PO4∙H2O (62.2 mM) 8.6 g
glucose (20 g/l) 20 g
yeast N2 base 6.7 g
bacto casamino acids (5 g/l) 5 g
The mixture was dissolved in H2O. If necessary pH was adjusted
with 1 M NaOH or 1 M HCl. The solution was filled up to 1 l with
H2O and filter sterilized.

134
7.2.3 SD-CAA minimal medium (pH 4.5, 1 l)
Na3-citrate∙2H2O (57 mM) 16.75 g
citric acid (20.4 mM) 3.9 g
glucose (20 g/l) 20 g
yeast N2 base 6.7 g
bacto casamino acids (5 g/l) 5 g
The mixture was dissolved in H2O. If necessary pH was adjusted
with 1 M NaOH or 1 M HCl. The solution was filled up to 1 l with
H2O and filter sterilized.
7.2.4 SG-CAA minimal medium (pH 6, 1 l)
Na2HPO4∙7H2O (38 mM) 10.2 g
NaH2PO4∙H2O (62.2 mM) 8.6 g
galactose (20 g/l) 20 g
yeast N2 base 6.7 g
bacto casamino acids (5 g/l) 5 g
The mixture was dissolved in H2O. If necessary pH was adjusted
with 1 M NaOH or 1 M HCl. The solution was filled up to 1 l with
H2O and filter sterilized.

135
7.2.5 SD-CAA minimal medium plates (1 l):
Na2HPO4∙7H2O (38 mM) 10.2 g
NaH2PO4∙H2O (62.2 mM) 8.6 g
agar (15 g/l) 15 g
sorbitol (1 M) 182 g
The mixture was dissolved in H2O. If necessary pH was adjusted
with 1 M NaOH or 1 M HCl. The solution was filled up to 900 ml
with H2O and autoclaved for sterilization.
glucose (20 g/l) 20 g
NaH2PO4∙H2O (62.2 mM) 8.6 g
yeast N2 base 6.7 g
bacto casamino acids (5 g/l) 5 g
The mixture was dissolved in 100 ml H2O, filter sterilized and
added to autoclaved solution.

136
8 References 1. L. C. James, P. Roversi, D. S. Tawfik, Antibody multispecificity mediated by conformational
diversity. Science 299, 1362-1367 (2003). 2. E. W. Debler, S. Ito, F. P. Seebeck, A. Heine, D. Hilvert, I. A. Wilson, Structural origins of
efficient proton abstraction from carbon by a catalytic antibody. Proc. Natl. Acad. Sci. USA 102, 4984-4989 (2005).
3. C. Jaeckel, P. Kast, D. Hilvert, Protein design by directed evolution. Annu. Rev. Biophys. 37, 153-173 (2008).
4. D. Lipovsek, E. Antipov, K. A. Armstrong, M. J. Olsen, A. M. Klibanov, B. Tidor, K. D. Wittrup, Selection of horseradish peroxidase variants with enhanced enantioselectivity by yeast surface display. Chem. Biol. 14, 1176-1185 (2007).
5. V. Katsemi, C. Lucke, J. Koepke, F. Lohr, S. Maurer, G. Fritzsch, H. Ruterjans, Mutational and structural studies of the diisopropylfluorophosphatase from Loligo vulgaris shed new light on the catalytic mechanism of the enzyme. Biochemistry 44, 9022-9033 (2005).
6. P. Kast, M. Asif-Ullah, N. Jiang, D. Hilvert, Exploring the active site of chorismate mutase by combinatorial mutagenesis and selection: the importance of electrostatic catalysis. Proc. Natl. Acad. Sci. USA 93, 5043-5048 (1996).
7. B. Schneider, T. Knochel, B. Darimont, M. Hennig, S. Dietrich, K. Babinger, K. Kirschner, R.
Sterner, Role of the N-terminal extension of the ()8-barrel enzyme indole-3-glycerol phosphate synthase for its fold, stability, and catalytic activity. Biochemistry 44, 16405-16412 (2005).
8. T. D. Schneider, R. M. Stephens, Sequence logos - a new way to display consensus sequences. Nucleic Acids Res. 18, 6097-6100 (1990).
9. V. E. Gouverneur, K. N. Houk, B. Depascualteresa, B. Beno, K. D. Janda, R. A. Lerner, Control of the exo-Pathway and endo-Pathway of the Diels-Alder Reaction by Antibody Catalysis. Science 262, 204-208 (1993).
10. Y. Yoshikuni, T. E. Ferrin, J. D. Keasling, Designed divergent evolution of enzyme function. Nature 440, 1078-1082 (2006).
11. J. A. Xu, Q. L. Deng, J. G. Chen, K. N. Houk, J. Bartek, D. Hilvert, I. A. Wilson, Evolution of shape complementarity and catalytic efficiency from a primordial antibody template. Science 286, 2345-2348 (1999).
12. A. Radzicka, R. Wolfenden, A proficient enzyme. Science 267, 90-93 (1995). 13. D. Hilvert, Critical analysis of antibody catalysis. Annu. Rev. Biochem. 69, 751-793 (2000). 14. B. A. Smith, M. H. Hecht, Novel proteins: from fold to function. Curr. Opin. Chem. Biol. 15, 1-6
(2011). 15. C. M. Topham, N. Srinivasan, T. L. Blundell, Prediction of the stability of protein mutants
based on structural environment-dependent amino acid substitution and propensity tables. Prot. Eng. 10, 7-21 (1997).
16. M. H. Hecht, S. Kamtekar, J. Schiffer, H. Xiong, J. Babik, A binary code for protein design: Novel proteins by the dozen. Biophys. J. 68, A231 (1995).
17. V. Nanda, R. L. Koder, Designing artificial enzymes by intuition and computation. Nat. Chem 2, 15-24 (2010).
18. T. Honjo, S. Habu, Origin of immune diversity - genetic-variation and selection. Annu. Rev. Biochem. 54, 803-830 (1985).
19. F. W. Alt, T. K. Blackwell, G. D. Yancopoulos, Development of the primary antibody repertoire. Science 238, 1079-1087 (1987).
20. L. Pauling, Molecular architecture and biological reactions. Biol. Sci. 24, 1375-1377 (1946). 21. W. P. Jencks, Ed., Catalysis in chemistry and enzymology, (New York: McGraw-Hill, 1969).
137
22. R. A. Lerner, S. J. Benkovic, P. G. Schultz, At the crossroad of chemistry and immunology - catalytic antibodies. Science 252, 659-667 (1991).
23. P. G. Schultz, R. A. Lerner, From molecular diversity to catalysis - lessons from the immune-system. Science 269, 1835-1842 (1995).
24. G. MacBeath, D. Hilvert, Hydrolytic antibodies: Variations on a theme. Chem. Biol. 3, 433-445 (1996).
25. K. D. Janda, D. Schloeder, S. J. Benkovic, R. A. Lerner, Induction of an antibody that catalyzes the hydrolysis of an amide bond. Science 241, 1188-1191 (1988).
26. J. D. Stewart, V. A. Roberts, N. R. Thomas, E. D. Getzoff, S. J. Benkovic, Site-directed mutagenesis of a catalytic antibody - an arginine and a histidine residue play key roles. Biochemistry 33, 1994-2003 (1994).
27. J. D. Stewart, J. F. Krebs, G. Siuzdak, A. J. Berdis, D. B. Smithrud, S. J. Benkovic, Dissection of an antibody-catalyzed reaction. Proc. Natl. Acad. Sci. USA 91, 7404-7409 (1994).
28. S. A. Lesley, P. A. Patten, P. G. Schultz, A generic approach to the generation of antibodies with enhanced catalytic activities. Proc. Natl. Acad. Sci. USA 90, 1160-1165 (1993).
29. A. J. Kirby, Efficiency of proton transfer catalysis in models and enzymes. Acc. Chem. Res 30, 290-296 (1997).
30. S. N. Thorn, R. G. Daniels, M. T. M. Auditor, D. Hilvert, Large rate accelerations in antibody catalysis by strategic use of haptenic charge. Nature 373, 228-230 (1995).
31. F. P. Seebeck, D. Hilvert, Positional ordering of reacting groups contributes significantly to the efficiency of proton transfer at an antibody active site. J. Am. Chem. Soc. 127, 1307-1312 (2005).
32. U. Pindur, G. Lutz, C. Otto, Acceleration and selectivity enhancement of Diels-Alder reactions by special and catalytic methods. Chem. Rev. 93, 741-761 (1993).
33. K. N. Houk, Y. Li, J. D. Evanseck, Transition structures of hydrocarbon pericyclic-reactions. Angew. Chem. Int. Ed. 31, 682-708 (1992).
34. D. Hilvert, K. W. Hill, K. D. Nared, M. T. M. Auditor, Antibody catalysis of a Diels-Alder reaction. J. Am. Chem. Soc. 111, 9261-9262 (1989).
35. J. G. Chen, Q. L. Deng, R. X. Wang, K. N. Houk, D. Hilvert, Shape complementarity, binding-site dynamics, and transition state stabilization: A theoretical study of Diels-Alder catalysis by antibody 1E9. ChemBioChem 1, 255-261 (2000).
36. A. Piatesi, D. Hilvert, Immunological optimization of a generic hydrophobic packet for high affinity hapten binding and Diels-Alder activity. ChemBioChem 5, 460-466 (2004).
37. R. Wolfenden, X. D. Lu, G. Young, Spontaneous hydrolysis of glycosides. J. Am. Chem. Soc. 120, 6814-6815 (1998).
38. J. D. Stewart, S. J. Benkovic, Transition-state stabilization as a measure of the efficiency of antibody catalysis. Nature 375, 388-391 (1995).
39. E. Yuriev, M. Agostino, P. A. Ramslang, Challenges and advances in computational docking: 2009 in review. J. Mol. Recognit. 24, 149-164 (2010).
40. J. Karanicolas, B. Kuhlman, Computational design of affinity and specificity at protein-protein interfaces. Curr. Opin. Struct. Biol 19, 458-463 (2009).
41. K. T. Simons, C. Kooperberg, E. Huang, D. Baker, Assembly of protein tertiary structures from fragments with similar local sequences using simulated annealing and Bayesian scoring functions. J. Mol. Biol. 268, 209-225 (1997).
42. J. Damborsky, J. Brezovsky, Computational tools for designing and engineering biocatalysts. Curr. Opin. Chem. Biol. 13, 26-34 (2009).
43. L. Jiang, E. A. Althoff, F. R. Clemente, L. Doyle, D. Rothlisberger, A. Zanghellini, J. L. Gallaher, J. L. Betker, F. Tanaka, C. F. Barbas, D. Hilvert, K. N. Houk, B. L. Stoddard, D. Baker, De novo computational design of retro-aldol enzymes. Science 319, 1387-1391 (2008).

138
44. D. Rothlisberger, O. Khersonsky, A. M. Wollacott, L. Jiang, J. DeChancie, J. Betker, J. L. Gallaher, E. A. Althoff, A. Zanghellini, O. Dym, S. Albeck, K. N. Houk, D. S. Tawfik, D. Baker, Kemp elimination catalysts by computational enzyme design. Nature 453, 190-U4 (2008).
45. J. B. Siegel, A. Zanghellini, H. M. Lovick, G. Kiss, A. R. Lambert, J. L. S. Clair, J. L. Gallaher, D. Hilvert, M. H. Gelb, B. L. Stoddard, K. N. Houk, F. E. Michael, D. Baker, Computational design of an enzyme catalyst for a stereoselective bimolecular Diels-Alder reaction. Science 329, 309-313 (2010).
46. G. Grigoryan, A. W. Reinke, A. E. Keating, Design of protein-interaction specificity gives selective bZIP-binding peptides. Nature 458, 859-865 (2009).
47. R. K. Jha, A. Leaver-Fay, S. Y. Yin, Y. B. Wu, G. L. Butterfoss, T. Szyperski, N. V. Dokholyan, B. Kuhlman, Computational design of a PAK1 binding protein. J. Mol. Biol. 400, 257-270 (2010).
48. J. J. Havranek, P. B. Harbury, Automated design of specificity in molecular recognition. Nat. Struct. Biol. 10, 45-52 (2003).
49. D. W. Sammond, Z. M. Eletr, C. Purbeck, B. Kuhlman, Computational design of second-site suppressor mutations at protein-protein interfaces. Proteins : Struct., Funct., Bioinf. 78, 1055-1065 (2010).
50. M. Lei, W. G. Lu, W. Y. Meng, M. C. Parrini, M. J. Eck, B. J. Mayer, S. C. Harrison, Structure of PAK1 in an autoinhibited conformation reveals a multistage activation switch. Cell 102, 387-397 (2000).
51. R. C. Deo, N. Sonenberg, S. K. Burley, X-ray structure of the human hyperplastic discs protein: An ortholog of the C-terminal domain of poly(A)-binding protein. Proc. Natl. Acad. Sci. USA 98, 4414-4419 (2001).
52. B. Kuhlman, G. Dantas, G. C. Ireton, G. Varani, B. L. Stoddard, D. Baker, Design of a novel globular protein fold with atomic-level accuracy. Science 302, 1364-1368 (2003).
53. S. Lutz, Beyond directed evolution-semi-rational protein engineering and design. Curr. Opin. Biotechnol. 21, 734-743 (2010).
54. C. Jaeckel, D. Hilvert, Biocatalysts by evolution. Curr. Opin. Biotechnol. 21, 753-759 (2010). 55. R. Fasan, M. M. Chen, N. C. Crook, F. H. Arnold, Engineered alkane-hydroxylating cytochrome
P450(BM3) exhibiting nativelike catalytic properties. Angew. Chem. Int. Ed. 46, 8414-8418 (2007).
56. P. Meinhold, M. W. Peters, M. M. Y. Chen, K. Takahashi, F. H. Arnold, Direct conversion of ethane to ethanol by engineered cytochrome P450BM3. ChemBioChem 6, 1765-1768 (2005).
57. G. MacBeath, P. Kast, D. Hilvert, Redesigning enzyme topology by directed evolution. Science 279, 1958-1961 (1998).
58. K. Vamvaca, B. Vögeli, P. Kast, K. Pervushin, D. Hilvert, An enzymatic molten globule: efficient coupling of folding and catalysis. Proc. Natl. Acad. Sci. USA 101, 12860-12864 (2004).
59. N. Halabi, O. Rivoire, S. Leibler, R. Ranganathan, Protein sectors: evolutionary units of three-dimensional structure. Cell 138, 774-786 (2009).
60. J. L. Reymond, P. Babiak, Screening systems. Adv. Biochem. Eng. Biotechnol. 105, 31-58 (2007).
61. S. V. Taylor, P. Kast, D. Hilvert, Investigating and engineering enzymes by genetic selection. Angew. Chem. Int. Ed. 40, 3310-3335 (2001).
62. M. T. Reetz, C. Torre, A. Eipper, R. Lohmer, M. Hermes, B. Brunner, A. Maichele, M. Bocola, M. Arand, A. Cronin, Y. Genzel, A. Archelas, R. Furstoss, Enhancing the enantioselectivity of an epoxide hydrolase by directed evolution. Org. Lett. 6, 177-180 (2004).
63. J. P. Goddard, J. L. Reymond, Enzyme activity fingerprinting with substrate cocktails. J. Am. Chem. Soc. 126, 11116-11117 (2004).
64. M. T. Reetz, P. Tielmann, A. Eipper, A. Ross, G. Schlotterbeck, A high-throughput NMR-based ee-assay using chemical shift imaging. Chem. Commun., 1366-1367 (2004).

139
65. P. Babiak, J. L. Reymond, A high-throughput, low-volume enzyme assay on solid support. Anal. Chem. 77, 373-377 (2005).
66. J. C. Baret, O. J. Miller, V. Taly, M. Ryckelynck, A. El-Harrak, L. Frenz, C. Rick, M. L. Samuels, J. B. Hutchison, J. J. Agresti, D. R. Link, D. A. Weitz, A. D. Griffiths, Fluorescence-activated droplet sorting (FADS): efficient microfluidic cell sorting based on enzymatic activity. Lab Chip 9, 1850-1858 (2009).
67. A. B. Theberge, F. Courtois, Y. Schaerli, M. Fischlechner, C. Abell, F. Hollfelder, W. T. S. Huck, Microdroplets in microfluidics: An evolving platform for discoveries in chemistry and biology. Angew. Chem. Int. Ed. 49, 5846-5868 (2010).
68. Y. Schaerli, F. Hollfelder, The potential of microfluidic water-in-oil droplets in experimental biology. Mol. BioSyst. 5, 1392-1404 (2009).
69. H. R. Hoogenboom, Selecting and screening recombinant antibody libraries. Nat. Biotechnol. 23, 1105-1116 (2005).
70. D. Lipovsek, A. Pluckthun, In-vitro protein evolution by ribosome display and mRNA display. J. Immunol. Methods 290, 51-67 (2004).
71. P. Amstutz, P. Forrer, C. Zahnd, A. Plueckthun, In vitro display technologies: Novel developments and applications. Curr. Opin. Biotechnol. 12, 400-405 (2001).
72. J. Pande, M. M. Szewczyk, A. K. Grover, Phage display: Concept, innovations, applications and future. Biotechnol. Adv. 28, 849-858 (2010).
73. W. J. J. Finlay, L. Bloom, O. Cunningham, in Protein chromatography: Methods and protocols. (New York, N.Y. : Humana Press, 2011, 2011), pp. 87-101.
74. M. Tornetta, S. Baker, B. Whitaker, J. Lu, Q. A. Chen, E. Pisors, L. Shi, J. Q. Luo, R. Sweet, P. Tsui, Antibody Fab display and selection through fusion to the pIX coat protein of filamentous phage. J. Immunol. Methods 360, 39-46 (2010).
75. G. Fuh, M. T. Pisabarro, Y. Li, C. Quan, L. A. Lasky, S. S. Sidhu, Analysis of PDZ domain-ligand interactions using carboxyl-terminal phage display. J. Biol. Chem. 275, 21486-21491 (2000).
76. N. B. Caberoy, Y. X. Zhou, G. Alvarado, X. Q. Fan, W. Li, Efficient identification of phosphatidylserine-binding proteins by ORF phage display. Biochem. Biophys. Res. Commun. 386, 197-201 (2009).
77. P. S. Daugherty, Protein engineering with bacterial display. Curr. Opin. Struct. Biol 17, 474-480 (2007).
78. E. van Bloois, R. T. Winter, H. Kolmar, M. W. Fraaije, Decorating microbes: surface display of proteins on Escherichia coli. Trends Biotechnol. 29, 79-86 (2011).
79. Z. J. Lu, K. S. Murray, V. Vancleave, E. R. Lavallie, M. L. Stahl, J. M. McCoy, Expression of thioredoxin random peptide libraries on the Escherichia coli cell surface as functional fusions to flagellin: A system designed for exploring protein-protein interactions. Biotechnology 13, 366-372 (1995).
80. P. S. Daugherty, G. Chen, M. J. Olsen, B. L. Iverson, G. Georgiou, Antibody affinity maturation using bacterial surface display. Prot. Eng. 11, 825-832 (1998).
81. S. A. Gai, K. D. Wittrup, Yeast surface display for protein engineering and characterization. Curr. Opin. Struct. Biol 17, 467-473 (2007).
82. D. W. Colby, B. A. Kellogg, C. P. Graff, Y. A. Yeung, J. S. Swers, K. D. Wittrup, Engineering antibody affinity by yeast surface display. Prot. Eng. 388, 348-358 (2004).
83. E. T. Boder, K. S. Midelfort, K. D. Wittrupt, Directed evolution of antibody fragments with monovalent femtomolar antigen-binding affinity. Proc. Natl. Acad. Sci. USA 97, 10701-10705 (2000).
84. J. J. Agresti, E. Antipov, A. R. Abate, K. Ahn, A. C. Rowat, J. C. Baret, M. Marquez, A. M. Klibanov, A. D. Griffiths, D. A. Weitz, Ultrahigh-throughput screening in drop-based microfluidics for directed evolution. Proc. Natl. Acad. Sci. USA 107, 6550-6550 (2010).

140
85. G. MacBeath, P. Kast, D. Hilvert, Probing enzyme quaternary structure by combinatorial mutagenesis and selection. Protein Sci. 7, 1757-1767 (1998).
86. K. Woycechowsky, A. Choutko, K. Vamvaca, D. Hilvert, Relative tolerance of an enzymatic molten globule and its thermostable counterpart to point mutation. Biochemistry 47, 13489-13496 (2008).
87. E. Haslam, Shikimic acid: Metabolism and metabolites. (Wiley, New York, 1993). 88. B. Woersdoerfer, K. J. Woycechowsky, D. Hilvert, Directed evolution of a protein container.
Science 331, 589-592 (2011). 89. J. T. Liu, J. R. Faeder, C. J. Camacho, Toward a quantitative theory of intrinsically disordered
proteins and their function. Proc. Natl. Acad. Sci. USA 106, 19819-19823 (2009). 90. J. H. Arevalo, M. J. Taussig, I. A. Wilson, Molecular-basis of cross-reactivity and the limits of
antibody-antigen complementarity. Nature 365, 859-863 (1993). 91. J. H. Arevalo, E. A. Stura, M. J. Taussig, I. A. Wilson, 3-Dimensional structure of an anti-steroid
Fab' and progesterone Fab' complex. J. Mol. Biol. 231, 103-118 (1993). 92. A. C. Braisted, P. G. Schultz, An antibody-catalyzed bimolecular Diels-Alder reaction. J. Am.
Chem. Soc. 112, 7430-7431 (1990). 93. F. E. Romesberg, B. Spiller, P. G. Schultz, R. C. Stevens, Immunological origins of binding and
catalysis in a Diels-Alderase antibody. Science 279, 1929-1933 (1998). 94. E. T. Boder, K. D. Wittrup, Yeast surface display for screening combinatorial polypeptide
libraries. Nat. Biotechnol. 15, 553-557 (1997). 95. E. T. Boder, K. D. Wittrup, Optimal screening of surface-displayed polypeptide libraries.
Biotechnol. Prog. 14, 55-62 (1998). 96. A. Piatesi, Binding properties and Diels-Alder activity of an efficient antibody catalyst. ETH
(2003). 97. A. T. Hugenmatter, Yeast surface display and RNA linkage as tools for in vitro evolutions of
catalytic antibodies. ETH (2006). 98. W. P. C. Stemmer, Rapid evolution of a protein in vitro by DNA shuffling. Nature 370, 389-391
(1994). 99. C. D. Rubistein, I. Mayrose, D. Halperin, D. Yekutieli, J. Gershoni, T. Pupko, Computational
characterization of B-cell epitopes. Mol. Immunol. 45, 3477-3489 (2007). 100. L. A. Clark, S. Ganesan, S. Papp, H. W. T. van Vlijmen, Trends in antibody sequence changes
during the somatic hypermutation process. J. Immunol. 177, 333-340 (2006). 101. C. E. Cannizzaro, J. A. Ashley, K. D. Janda, K. N. Houk, Experimental determination of the
absolute enantioselectivity of an anti body-catalyzed Diels-Alder reaction and theoretical explorations of the origins of stereoselectivity. J. Am. Chem. Soc. 125, 2489-2506 (2003).
102. E. W. Debler, R. Mueller, D. Hilvert, I. A. Wilson, An aspartate and a water molecule mediate efficient acid-base catalysis in a tailored antibody pocket. Proc. Natl. Acad. Sci. USA 106, 18545-18550 (2009).
103. K. D. Orcutt, A. L. Slusarczyk, M. Cieslewicz, B. Ruiz-Yi, K. R. Bhushan, J. V. Frangioni, K. D. Wittrup, Engineering an antibody with picomolar affinity to DOTA chelates of multiple radionuclides for pretargeted radioimmunotherapy and imaging. Nucl. Med. Biol. 38, 223-233 (2011).
104. S. Yeasmin, C. H. Kim, H. J. Park, M. I. Sheikh, J. Y. Lee, J. W. Kim, K. K. Back, S. H. Kim, Cell surface display of cellulase activity-free xylanase enzyme on Saccharomyces Cerevisiae EBY100. Appl. Biochem. Biotechnol. 164, 294-304 (2011).
105. W. O. Bullock, J. M. Fernandez, J. M. Short, XL1-Blue: a high-efficiency plasmid transformig
recA- Escherichia coli strain with -galactosidase selection. BioTechniques 5, 376-378 (1987). 106. J. Sambrook, D. W. Russell, Molecular cloning: A laboratory manual., (Cold Spring Harbor,
NY: Cold Spring Harbor Laboratory, 2001).

141
107. F. Sanger, S. Nicklen, A. R. Coulson, DNA sequencing with chain-terminating inhibitors. Proc. Natl. Acad. Sci. USA 74, 5463-5467 (1977).
108. H. D. Ulrich, P. A. Patten, P. L. Yang, F. E. Romesberg, P. G. Schultz, Expression studies of catalytic antibodies. Proc. Natl. Acad. Sci. USA 92, 11907-11911 (1995).
109. J. L. Cleland, C. S. Craik, Protein engineering: Principles and practice. Design of metalloproteins (1996), pp. 369-398.
110. A. Lehmann, J. G. Saven, Computational design of four-helix bundle proteins that bind nonbiological cofactors. Biotechnol. Prog. 24, 74-79 (2008).
111. J. Ashworth, J. J. Havranek, C. M. Duarte, D. Sussman, R. J. Monnat, B. L. Stoddard, D. Baker, Computational redesign of endonuclease DNA binding and cleavage specificity. Nature 441, 656-659 (2006).
112. D. J. Mandell, T. Kortemme, Computer-aided design of functional protein interactions. Nat. Chem. Biol. 5, 797-807 (2009).
113. T. Kortemme, D. Baker, Computational design of protein-protein interactions. Curr. Opin. Chem. Biol. 8, 91-97 (2004).
114. S. M. Lippow, K. D. Wittrup, B. Tidor, Computational design of antibody-affinity improvement beyond in vivo maturation. Nat. Biotechnol. 25, 1171-1176 (2007).
115. M. Fromer, J. M. Shifman, Tradeoff between stability and multispecificity in the design of promiscuous proteins. PLoS Comput. Biol. 5, e1000627 (2009).
116. A. Morin, J. Meiler, L. S. Mizoue, Computational design of protein-ligand interfaces: potential in therapeutic development. Trends Biotechnol. 29, 159-166 (2011).
117. P. E. Wright, H. J. Dyson, Intrinsically unstructured proteins: Re-assessing the protein structure-function paradigm. J. Mol. Biol. 293, 321-331 (1999).
118. H. J. Dyson, P. E. Wright, Intrinsically unstructured proteins and their functions. Nat. Rev. Mol. Cell Biol. 6, 197-208 (2005).
119. V. N. Uversky, The mysterious unfoldome: Structureless, underappreciated, yet vital part of any given proteome. J. Biomed. Biotechnol., 568068 (2010).
120. K. Shimizu, H. Toh, Interaction between intrinsically disordered proteins frequently occurs in a human protein-protein interaction network. J. Mol. Biol. 392, 1253-1265 (2009).
121. B. A. Shoemaker, J. J. Portman, P. G. Wolynes, Speeding molecular recognition by using the folding funnel: The fly-casting mechanism. Proc. Natl. Acad. Sci. USA 97, 8868-8873 (2000).
122. F. W. Studier, A. H. Rosenberg, J. J. Dunn, J. W. Dubendorff, Use of T7 RNA-polymerase to direct expression of cloned genes. Methods Enzymol. 185, 60-89 (1990).
123. G. Casi, Peptide bond forming reactions: From methodology to the construction of a semisynthetiic enzyme. ETH (2007).
124. R. B. Kapust, J. Tozser, J. D. Fox, D. E. Anderson, S. Cherry, T. D. Copeland, D. S. Waugh, Tobacco etch virus protease: mechanism of autolysis and rational design of stable mutants with wild-type catalytic proficiency. Prot. Eng. 14, 993-1000 (2001).
125. M. Neuenschwander, M. Butz, C. Heintz, P. Kast, D. Hilvert, A simple selection strategy for evolving highly efficient enzymes. Nat. Biotechnol. 25, 1145-1147 (2007).
126. X. Huang, X.-E. Zhang, Y.-F. Zhou, Z.-P. Zhang, A. E. G. Cass, Directed evolution of the 5 '-untranslated region of the phoA gene in Escherichia coli simultaneously yields a stronger promoter and a stronger Shine-Dalgarno sequence. Biotechnol. J. 1, 1275-1282 (2006).
127. A. Khlebnikov, O. Risa, T. Skaug, T. A. Carrier, J. D. Keasling, Regulatable arabinose-inducible gene expression system with consistent control in all cells of a culture. J. Bacteriol. 182, 7029-7034 (2000).
128. A. Khlebnikov, T. Skaug, J. D. Keasling, Modulation of gene expression from the arabinose-inducible araBAD promoter. J. Ind. Microbiol. Biotechnol. 29, 34-37 (2002).

142
129. R. Lutz, H. Bujard, Independent and tight regulation of transcriptional units in Escherichia coli via the LacR/O, the TetR/O and AraC/I1-I2 regulatory elements. Nucleic Acids Res. 25, 1203-1210 (1997).
130. H. Y. Chen, M. Bjerknes, R. Kumar, E. Jay, Determination of the optimal aligned spacing between the Shine-Dalgarno sequence and the translation initiation codon of Escherichia coli mRNAs. Nucleic Acids Res. 22, 4953-4957 (1994).
131. W. Saenger, P. Orth, C. Kisker, W. Hillen, W. Hinrichs, The tetracycline repressor - A paradigm for a biological switch. Angew. Chem. Int. Ed. 39, 2042-2052 (2000).
132. A. W. Karzai, E. D. Roche, R. T. Sauer, The SsrA-SmpB system for protein tagging, directed degradation and ribosome rescue. Nat. Struct. Biol. 7, 449-455 (2000).
133. T. Diaz-Lopez, M. Lages-Gonzalo, A. Serrano-Lopez, C. Alfonso, G. Rivas, R. Diaz-Orejas, R. Giraldo, Structural changes in RepA, a plasmid replication initiator, upon binding to origin DNA. J. Biol. Chem. 278, 18606-18616 (2003).
134. J. R. Hoskins, S. Wickner, Two peptide sequences can function cooperatively to facilitate binding and unfolding by ClpA and degradation by ClpAP. Proc. Natl. Acad. Sci. USA 103, 909-914 (2006).
135. K. Vamvaca, I. Jelesarov, D. Hilvert, Kinetics and thermodynamics of ligand binding to a molten globular enzyme and its native counterpart. J. Mol. Biol. 382, 971-977 (2008).
136. G. MacBeath, P. Kast, UGA read-through artifacts - When popular gene expression systems need a pATCH. BioTechniques 24, 789-794 (1998).
137. G. MacBeath, P. Kast, D. Hilvert, A small, thermostable, and monofunctional chorismate mutase from the archaeon Methanococcus jannaschii. Biochemistry 37, 10062-10073 (1998).
138. M. S. Kumar, T. Mrudula, N. Mitra, G. B. Reddy, Enhanced degradation and decreased
stability of eye lens -crystallin upon methylglyoxal modification. Exp. Eye Res. 79, 577-583 (2004).
139. L. S. Ehrlich, B. E. Agresta, C. A. Gelfand, J. Jentoft, C. A. Carter, Spectral-analysis and tryptic susceptibility as probes of HIV-1 capsid protein-structure. Virology 204, 515-525 (1994).
140. J. M. Flynn, S. B. Neher, Y. I. Kim, R. T. Sauer, T. A. Baker, Proteomic discovery of cellular substrates of the ClpXP protease reveals five classes of ClpX-recognition signals. Mol. Cell 11, 671-683 (2003).
141. S. Brantl, Antisense-RNA regulation and RNA interference. Biochim. Biophys. Acta: Gene Struct. Expression 1575, 15-25 (2002).
142. W. Hillen, C. Berens, Mechanism underlying expression of Tn10 encoded tetracycline resistance. Annu. Rev. Microbiol. 48, 345-369 (1994).
143. Y. X. Wang, Y. Zhou, B. M. Balgley, J. W. Cooper, C. S. Lee, D. L. DeVoe, Electrospray interfacing of polymer microfluidics to MALDI-MS. Electrophoresis 26, 3631-3640 (2005).
144. D. L. Devoe, C. S. Lee, Microfluidic technologies for MALDI-MS in proteomics. Electrophoresis 27, 3559-3568 (2006).

143
Curriculum vitae
Personal Data Name: Maren Butz
Date of birth 14 January, 1980 in St. Gallen, Switzerland
Citizenship Switzerland
Education
2005-2011 Ph.D. in Chemistry and Applied Bioscience, ETH Zurich „Evolvability of Protein Scaffolds for Binding Affinity and Catalytic
Activity” Supervisor: Prof. Donald Hilvert, ETH Zurich
2005 Work experience Institute of Molecular Systems Biology, ETH Zurich Supervisor: Dr. Matthias Gstaiger, ETH Zurich
2002-2000 Diploma studies in Biology (with focus on biochemistry) Biochemistry and Molecular Biology, ETH Zurich
2004 Diploma thesis “Combined Low Level Expression and Degradation of Proteins
Improves the Selectivity in Directed Evolution Experiments” Supervisor: Prof. Donald Hilvert, ETH Zurich
2004 Semester thesis “Structural Studies of Topologically Redesigned Chorismate Mutases” Supervisor: Prof. Donald Hilvert, ETH Zurich
2003 SIROP program (for half a year one day per week) “Synthesis of an Active Enzyme with a Minimal Set of Amino Acids”, Supervisor: Prof. Donald Hilvert, ETH Zurich
Teaching Experience 2010 Teaching Assistant Supervision of the tutorial “Biological Chemistry”
2006-2009 Undergraduate Research Mentor Supervision of undergraduate bachelor and masters level research projects in biological chemistry
2006-2009 Teaching Assistant Supervision of the advanced practical class “Biological Chemistry”

144
Publications A Simple Selection Strategy for Evolving Highly Efficient Enzymes
Neuenschwander, M., Butz, M., Heintz, C., Kast, P., Hilvert, D., Nat Biotechnol. 2007, 25, (10), 1145-7
Simultaneous Optimization of Enzyme Activity and Quaternary Structure by Directed Evolution Vamvaca, K., Butz, M., Walter, K. U., Taylor, S., Hilvert, D., Protein Science 2005, 14, (8), 2103-14.
An N-terminal Protein Degradation Tag Enables Robust Selection of Highly Active Enzymes Butz, M., Neuenschwander, M., Kast, P., Hilvert, D., Manuscript in preperation