
TECHNISCHE UNIVERSITÄT MÜNCHEN
137
TECHNISCHE UNIVERSITÄT MÜNCHEN Lehrstuhl für Biomolekulare NMR Spektroskopie Department Chemie Computational and NMR Studies of Thymidylate Synthase and its Regulation Divita Garg München, 2011
-
Upload
khangminh22 -
Category
Documents
-
view
0 -
download
0
Transcript of TECHNISCHE UNIVERSITÄT MÜNCHEN
TECHNISCHE UNIVERSITÄT MÜNCHEN
Lehrstuhl für Biomolekulare NMR Spektroskopie Department Chemie
Computational and NMR Studies of Thymidylate Synthase and its Regulation
Divita Garg München, 2011

TECHNISCHE UNIVERSITÄT MÜNCHEN
Lehrstuhl für Biomolekulare NMR Spektroskopie
Computational and NMR Studies of Thymidylate Synthase and its Regulation
Divita Garg
Vollständiger Abdruck der von der Fakultät für Chemie der Technische Universität München zur Erlangung des akademischen Grades eines Doktors der Naturwissenschaften genehmigten Dissertation.
Vorsitzender: Univ.-Prof. Dr. St. Sieber
Prüfer der Dissertation: 1. Univ.-Prof. Dr. M. Sattler
2. Univ.-Prof. Dr. I. Antes
Die Dissertation wurde am 02.03.2011 bei der Technische Universität München eingereicht und durch die Fakultät für Chemie am 07.04.2011 angenommen.

Contents Summary ................................................................................................................................................ 1 Zusammenfassung ................................................................................................................................. 3 Chapter 1. Novel Approaches for Targeting Thymidylate Synthase to Overcome the Resistance and Toxicity of Anticancer Drugs ........................................................................................................ 5
Thymidylate Synthase ......................................................................................................................... 7 Resistance and toxicity: the need for new approaches .................................................................... 8
New Chemical Strategies for Targeting the Enzyme Thymidylate Synthase ................................... 10 a) 5FU prodrugs ............................................................................................................................ 10 b) Enzyme catalysed therapeutic activation .................................................................................. 13 c) Multi-target inhibitors ............................................................................................................... 13 d) Stabilising the inactive conformer and allosteric inhibitors ..................................................... 16 e) Exploiting the overexpressed transporters ................................................................................ 18 f) Peptidic inhibitors of the TS protein ......................................................................................... 19
Targeting the Step Before: the mRNA .............................................................................................. 19 a) Antisense oligodeoxynucleotides (ODNs) ................................................................................ 20 b) Small interfering RNA (siRNA) ............................................................................................... 21 c) Peptides ..................................................................................................................................... 21
Indirect Thymidylate Synthase Expression Regulators .................................................................... 23 a) Histone deacetylase inhibitors (HDACi) .................................................................................. 23 b) E2F-1 modulators ..................................................................................................................... 24
Conclusions and Perspectives ........................................................................................................... 25 Acknowledgement ............................................................................................................................ 26 Biographies ....................................................................................................................................... 26 References ......................................................................................................................................... 28
Chapter 2. Methodological Introduction: Combining NMR and Computational Techniques for Knowledge-Based Modeling of Biomolecule-Ligand Complexes.................................................... 37
Introduction ....................................................................................................................................... 37 NMR spectroscopy ............................................................................................................................ 37
Spectra of RNA ............................................................................................................................. 38 Interaction of two molecules: chemical exchange ........................................................................ 40 Mapping the binding interface ...................................................................................................... 42
Molecular Modeling .......................................................................................................................... 44 Modeling molecular interactions .................................................................................................. 44 Simulating molecular interactions: Molecular Dynamics ............................................................. 48
References ......................................................................................................................................... 50

Chapter 3. Interactions of Thymidylate Synthase mRNA Like Constructs with HOECHST 33258 .................................................................................................................................................... 53
Introduction ....................................................................................................................................... 53 Materials and methods ...................................................................................................................... 55
Computational modeling ............................................................................................................... 55 Sample preparation ....................................................................................................................... 56 NMR data acquisition ................................................................................................................... 57
Results and Discussion ..................................................................................................................... 57 Selection of the RNA construct .................................................................................................... 58 Identification of the binding site ................................................................................................... 61 Binding mode prediction ............................................................................................................... 61 Design of a shorter RNA construct ............................................................................................... 65 An optimised RNA construct: TSMC ........................................................................................... 67
Conclusions ....................................................................................................................................... 67 References ......................................................................................................................................... 67
Chapter 4. Translation Repression of Thymidylate Synthase: Targeting the mRNA .................. 71 Introduction ....................................................................................................................................... 71 Materials and Methods ...................................................................................................................... 72
RNA construct .............................................................................................................................. 72 NMR spectroscopy ........................................................................................................................ 72 Computational Modeling .............................................................................................................. 75 Biological assays ........................................................................................................................... 77
Results ............................................................................................................................................... 78 Determining the binding site on RNA .......................................................................................... 78 Titrations with TSGC .................................................................................................................... 83 Partial intercalation of HT............................................................................................................. 83 Stabilisation of the mismatch ........................................................................................................ 85 Second binding site at the loop ..................................................................................................... 86 HT induced reduction of cellular TS protein levels ...................................................................... 87
Discussion ......................................................................................................................................... 87 Mismatch facilitates intercalation ................................................................................................. 87 1H chemical shifts in intercalation ................................................................................................ 88 HT as an intercalator ..................................................................................................................... 89 Orientation of HT .......................................................................................................................... 89 HT as a TS mRNA translation inhibitor ....................................................................................... 90
Conclusions ....................................................................................................................................... 91 References ......................................................................................................................................... 91

Chapter 5. Structural Studies on Thymidylate Synthase - Ligand Interactions ........................... 95 Introduction ....................................................................................................................................... 95 Materials and Methods ...................................................................................................................... 96
Preparation of NMR samples ........................................................................................................ 96 NMR data collection ..................................................................................................................... 98
Results and Discussion ..................................................................................................................... 99 Conclusions and Perspectives ......................................................................................................... 104 References ....................................................................................................................................... 104
Chapter 6. Importance of Thymidylate Synthase in Sustaining Thymidine Rich Genome of Minimal Organism Wigglesworthia glossinidia brevipalpis ........................................................... 105
Introduction ..................................................................................................................................... 105 Methods .......................................................................................................................................... 106
Sequence collection and homology modelling ........................................................................... 106 Electrostatic calculations ............................................................................................................ 106 Similarity indices calculations .................................................................................................... 107
Results and Discussion ................................................................................................................... 107 Electrostatic analysis ................................................................................................................... 107 Essentiality of TS in minimal organisms .................................................................................... 109 Pyrimidine synthesis pathway ..................................................................................................... 110 Structural comparison: identification of four lysines .................................................................. 111 Sequence comparison .................................................................................................................. 111 Lysines in the W.g.b proteome .................................................................................................... 112
Conclusions ..................................................................................................................................... 113 References ....................................................................................................................................... 113
Appendix 1 ......................................................................................................................................... 115 Appendix 2 ......................................................................................................................................... 117 Abbreviations .................................................................................................................................... 121 List of Figures .................................................................................................................................... 123 List of Tables ..................................................................................................................................... 127 Acknowledgements ........................................................................................................................... 129 Curriculum Vitae .............................................................................................................................. 131

1
Summary
Thymidylate Synthase (TS), being the key enzyme in the sole pathway available
for de-novo synthesis of thymidine in living organisms, is an important drug target. Indeed
many drugs such as anti-cancer, anti-bacterial and anti-parasitic agents, are TS inhibitors.
However, after long-term exposure cells develop resistance, rendering these drugs
ineffective. Therefore, there is a need to identify new strategies for TS inhibition, which
can bypass the resistance problem. Different aspects of the structure and cellular
regulation of TS that may contribute to such strategies were investigated in this thesis.
Over-expression of TS, induced by the disruption of autoregulatory feedback
repression of TS-mRNA translation, has been implicated to be one of the main causes
leading to resistance. One proposition for developing new drugs is to directly target the
TS-mRNA, so that the translation initiation can be prevented. With this aim, the
interaction of the small molecule ligand HOECHST 33258 (HT) with TS-mRNA like
constructs was characterised by computational modeling and NMR techniques. Various
oligonucleotides derived from TS-mRNA were tested experimentally culminating in the
selection of a 20-nucleotide long RNA molecule, which could be used for further studies.
The binding site of HT to the RNA was mapped by NMR chemical shifts and
paramagnetic relaxation enhancements. These data were then used to dock HT to the RNA
and prepare a model of the complex. The final model was validated with the NMR results
and data reported in the literature. Functional experiments confirm that translation rather
than transcription is affected by HT. The results suggest that HT inhibits translation of TS-
mRNA by recognizing and stabilizing an internal C-C bulge in the TS-mRNA.
Two structural forms of the human TS protein, the active and the inactive form, are
known to exist in equilibrium. Only the former is responsible for the catalytic activity of
the protein. Therefore, preventing the conversion from inactive to active form can serve as
an alternate means of inhibiting TS. In order to structurally characterise the transition
between the two forms of the protein, an NMR analysis was performed. Deoxyuridine
monophosphate (dUMP) was used as the activating agent while a peptide inhibitor was
used as a stabiliser of the inactive protein. The two ligands were observed to bind at two
different sites in the protein. Interestingly, in contrast to thermodynamic analyses, dUMP
was found to bind to the protein irrespective of the presence of the peptidic ligand.

2
The natural ligands of TS - its substrate deoxyuridine monophosphate, the cofactor
methylene tetrahydrofolate, and RNAs - carry a net charge and a characteristic charge
distribution. Thus electrostatics should play an important role in the functioning of TS.
Since TS is an essential and functionally well conserved protein in nature, the
electrostatics of the protein are also expected to be well conserved. A comparison of
electrostatics in the binding site of TS of various organisms was initiated with the aim of
understanding the role electrostatics play in TS activity. A class of minimal organisms was
found to differ significantly from the general trend. An analysis of lifestyle of these
organisms and their genetic composition suggested that inspite of altered electrostatics the
TS in Wigglesworthia glossinidia brevipalpis (W.g.b) should be functionally active. A
deeper probe into structure, sequence and electrostatics of W.g.b led to the identification of
key residues which are responsible for the deviant electrostatics.
The results presented in this thesis contribute to a mechanistic understanding of
different aspects of the expression and activity of TS and will help in developing novel
inhibitors of the TS protein or the TS-mRNA, to overcome the problem of resistance faced
by the currently available drugs.

3
Zusammenfassung
Thymidylat Synthase (TS), ist das Schlüsselenzym in dem einzigen vorhandenen
de-novo Syntheseweg von Thymidin in lebenden Organismen, und daher ein wichtiges
Ziel für pharmakologische Interferenz. In der Tat sind eine Reihe von Medikamenten
gegen Krebs, bakteriellen oder parasitische Infektionen TS-Inhibitoren. Allerdings
entwickeln Zellen nach einer langen Expositionszeit Resistenzen, die diese Medikamente
ineffektiv machen. Deshalb besteht ein Bedarf, neue Strategien für die TS-Inhibition zu
entwickeln, die das Resistenz-Problem ungehen können. Verschiedene Aspekte der
Struktur und Regulatin von TS, die zu solchen Strategien beitragen können, wurden in der
vorliegenden Arbeit untersucht.
Es wurde gezeigt, dass die Überexpression von TS, die durch Ausschaltung der
autoregulatorischen Repression der Translation von TS-mRNA, einer der Hauptgründe für
die Resistenzentwicklung ist. Eine Möglichkeit für die Entwicklung neuer Wirkstoffe ist
es daher direkt die TS mRNA zu inhibieren, um die Translationinitiation zu unterbinden.
Mit diesem Ziel wurde die Interaktion des kleinen organischen Moleküls HOECHST
33258 (HT) mit verschiedenen von der TS-mRNA abgeleiteten Konstrukten mittels
Computer gestützter Verfahren und durch NMR Experimente charakterisiert. Es wurden
verschiedene von der TS-mRNA abgeleitete Oligonucleotide experimentell untersucht.
Dies führte zur Auswahl eines 20 Nukleotid RNA Moleküls, das für weitere Studien
verwendet wurde. Die Bindungsregion von HT mit dieser RNA wurde anhand von NMR
chemischen Verschiebungen und paramagnetischen Relaxationsverstärkungen bestimmt.
Diese Daten wurden benutzt, um HT an die RNA zu docken und ein Model des
Komplexes abzuleiten. Das endgültige Model wurde mit den NMR Daten und in der
Literatur beschriebenen Ergebnissen validiert. Funktionelle Experimente bestätigen, dass
HT die Translation und nicht die Transkription der TS-RNA beeinflusst. Die Ergebnisse
deuten darauf hin, dass HT die Translation der TS-mRNA inhibiert durch Erkennung und
Stabilisierung eine interne C-C–Schleife in der TS-mRNA.
Es ist bekannt, dass beim menschlichen TS Protein zwei Konformationen im
Gleichgewicht existieren, eine aktive und eine inaktive Form. Nur erstere ist für die
katalytische Aktivität des Proteins zuständig. Somit, stellt die Inhibition dieses
Gleichgewichtes, d.h. der Umwandlung der inaktiven in die aktive Form, eine alternative

4
Methode zur Inhibition des TS Proteins dienen. Um den Übergang zwischen zwei Formen
des Proteins strukturell zu charakterisieren, wurden NMR Untersuchungen durchgeführt.
Deoxyuridinmonophosphat (dUMP) wurde als Aktivator benutzt, während ein
peptidischer Inhibitor zur Stabilisierung des inaktiven Proteins verwendet wurde. Es zeigte
sich, dass diese beiden Liganden an unterschiedlichen Stellen des Proteins binden.
Interessanterweise, und im Gegensatz zu thermodynamischen Untersuchungen, wurde
beobachtet, dass dUMP das Protein unabhängig von der Gegenwart des peptidischen
Liganden bindet.
Die natürlichen Liganden des TS Protein, das Substrat Deoxyuridinmonophosphat
(dUMP), der Kofaktor Methylentetrahydrofolat und RNA, besitzen eine Nettoladung und
eine charakteristische Ladungsverteilung. Daher sollten elektrostatische Effekte eine
wichtige Rolle für die Funktion des TS Proteins spielen. Da TS ein essentielles und in der
Natur funktionell konserviertes Protein ist, sollten die elektrostatischen Eigenschaften des
Proteins ebensfalls gut konserviert ist. Die elektrostatischen Eigenschaften der
Bindungstasche des TS-Proteins aus unterschiedlichen Organismen wurde durchgeführt
um die Rolle der elektrostatischen Eigenschaften für die Aktivität von TS zu verstehen.
Ich konnte eine Klasse von niederen Organismen identifizieren, die sich deutlich von der
allgemeinen Tendenz unterscheiden. Die Analyse des Lebensweise und des genetischen
Aufbaus dieser Organismen deutet darauf hin, dass das TS Protein aus Wigglesworthia
glossinidia brevipalpis (W.g.b) trotz der geänderten elektrostatischen Eigenschaften
funktionell aktiv sein sollte. Weiterführende Analysen der Struktur, Sequenz und
Elektrostatik von W.g.b führten zur Identifizierung von Schlüssel-Aminosäuren, die für
abweichenden Ladungseigenschaften zuständig sind.
Die in dieser Arbeit vorgestellten Ergebnisse tragen zum mechanistischen
Verständnis unterschiedlicher Aspekte der Expression und Aktivität der Thymidylat
Synthase bei und werden helfen neue Inhibitoren des TS-Proteins oder der TS-mRNA zu
entwickeln, um das Resistenzproblem der zurzeit bekannten Wirkstoffe zu überwinden.

5
Chapter 1. Novel Approaches for Targeting Thymidylate Synthase to Overcome the Resistance and Toxicity of Anticancer Drugs
This chapter (published in Garg et. al. J. Med. Chem. 2010, 53, 6539–6549)
describes the structure and function of thymidylate synthase (TS), the current status of TS
targeting anticancer drugs and the scope for improvement. The various strategies which
have been or can be employed to overcome the problem of resistance faced by the known
drugs are discussed. Realising the various possibilities for improving the TS targeting
scenario, studies were performed on some of these aspects and form the basis of this
dissertation, 1) targeting the TS-mRNA 2) structural characterisation of active-inactive
transition of the TS protein and 3) understanding the electrostatics of TS protein relevant
to its activity.
6
Novel Approaches for Targeting Thymidylate
Synthase to Overcome the Resistance and
Toxicity of Anticancer Drugs
Divita Garg,*1,2 Stefan Henrich,1 Outi M. H. Salo-Ahen,1,3 Hannu Myllykallio,4 Maria P.
Costi,5 and Rebecca C. Wade*1
1 Heidelberg Institute of Theoretical Studies gGmbH, Heidelberg, Germany, 2 Institute of
Structural Biology, Helmholtz Zentrum München, Neuherberg, Germany, 3 Åbo Akademi
University, Department of Biosiences, Biochemistry, Turku, Finland, 4 Laboratoire
d'Optique et Biosciences, Ecole Polytechnique, CNRS UMR7645 - INSERM U696,
Palaiseau, France, 5 Dipartimento di Scienze Farmaceutiche, Università degli Studi di
Modena e Reggio Emilia, Modena, Italy.
* To whom the correspondence should be addressed. HITS gGmbH, Schloß-
Wolfsbrunnenweg 35, D-69118 Heidelberg, Germany. Phone: +49-6221-533247. Fax:
+41-6221-533298. E. mail: [email protected] and [email protected].
Abbreviations: Alpha Folate Receptor (αFR), Carboxylesterase (CE), Cyclin Dependent Kinase
(CDK), Cytidine Deaminase (CD), Cytochrome P450 (Cyp 450), Dihydrofolate Reductase
(DHFR), Dihydropyrimidine Dehydrogenase (DPD), Enzyme Catalysed Therapeutic Activation
(ECTA), Epidermal Growth Factor Receptor (EGFR), Folylpolyglutamate Synthetase (FPGS),
Gastrointestinal (GI), Glycinamide Ribonucleotide Formyl Transferase (GARFT), Histone
Deacetylase Inhibitors (HDACi), Oligodeoxynucleotide (ODN), Orotate
Phosphoribosyltransferase (OPRT), Protein Kinase C (PKC), Reduced Folate Carrier (RFC), small
inhibitory RNAs (siRNA), Thymidine Kinase (TK), Thymidine Phosphorylase (TP), Thymidylate
Synthase (TS), Uridine Kinase (UK), Uridine Phosphorylase (UP).

7
Thymidylate Synthase The antifolate drug, methotrexate, was introduced to the clinic as an anticancer
agent in the early 1950s.1 Subsequently, its mechanism of action was elucidated and it was
found to bind in mono- and poly-glutamated forms to dihydrofolate reductase (DHFR),2,3
thymidylate synthase (TS)4 and amino-imidazolecarboxamide-ribonucleotide
transformylase (AICARTF).5 A fluoropyrimidine, 5-fluorouracil (5FU), was conceived in
19576 following the observation that uracil was utilised preferentially in malignant over
non-malignant cells,7 and has since been a first line drug in cancer chemotherapy.
Subsequently, 5-fluoro-2'-deoxyuridine-5'-monophosphate (5FdUMP), an active
metabolite of 5FU, was found to inhibit TS by forming a covalent ternary complex with
the enzyme and 5,10-methylenetetrahydrofolate (mTHF).8 These discoveries marked the
dawn of exploiting TS as an anticancer target.
TS (EC 2.1.1.45), which is encoded by the TYMS gene in humans, catalyses the
conversion of 2'-deoxyuridine-5'-monophosphate (dUMP) to 2'-deoxythymidine-5'-
monophosphate (dTMP) by using mTHF as a cosubstrate. dTMP is then phosphorylated
by thymidylate kinase to 2'-deoxythymidine diphosphate (dTDP) and then to 2'-
deoxythymidine triphosphate (dTTP) by nucleoside-diphosphate kinase for use in the
synthesis of new DNA. Thus, in human cells, TS plays a key role in the biosynthetic
pathway that provides the sole de novo source of thymidylate, an essential precursor
required for DNA replication and repair.9 In addition to its catalytic function, TS acts as a
regulator of translation for some mRNAs. One of these is its own mRNA,10 and others
include p53,11 which is a tumour suppressor, and c-myc,12 which is oncogenic. Binding of
the TS protein to its own mRNA leads to the formation of an autoregulatory feedback loop
for repression of the translation of TS mRNA (Fig 1). A 36 nucleotide sequence (75-110,
Site I),13 encompassing the start codon, and a 70 nucleotide sequence (480-550, Site II)14
within the coding region have been identified as the most essential regions in the TS
mRNA for binding to the TS protein. On the p53 mRNA, the nucleotide sequence from
531-1020 in the protein coding region,15 and for the c-myc mRNA, the C terminal coding
region covering nucleotide positions 1625-1790,12 have been identified to be important for
binding to the TS protein. Based on the observation that overexpression of TS sets the
cells into a neoplastic phenotype, oncogenic behaviour is a novel role that has been
attributed to TS recently.16

8
Resistance and toxicity: the need for new approaches TS has two substrates, dUMP and mTHF, both of which bind in the catalytic site to
enable the synthesis of dTMP. Known inhibitors of TS, e.g., fluoropyrimidines or the
antifolates such as raltitrexed1 (Figure 2c), act as analogues of one of these substrates and
compete for the catalytic pocket to inhibit the enzyme. However, soon after exposure, the
cells develop resistance to these chemotherapeutic agents. Multiple mechanisms have been
proposed to explain this effect.
Figure 1. Mechanisms of inhibition of hTS by drugs (green) and of drug resistance (red). From left to right: The TYMS gene is transcribed to TS mRNA which is translated to hTS protein which catalyses the conversion of dUMP and mTHF to dTMP and dihydrofolate (DHF). The TS protein is shown in its monomeric and dimeric forms as it has been suggested to exist in a monomer-homodimer equilibrium (black arrows) in nature (Voeller et al., Biochem Biophys Res Commun 2002, 297, 24-31). The dimeric form is obligatory for its catalytic activity; which of the two forms binds to the TS mRNA is however debatable. Drug resistance by gene amplification and by interruption of the protein-mRNA binding can occur independently of each other.
One proposed mechanism is disruption of the autoregulatory repression of
translation (Fig 1). Only apo-TS can bind the mRNA,10 whereas TS bound to ligands, such
as TS inhibitory drugs, cannot interact with the mRNA.17 Ligand binding thereby
alleviates the translational repression by TS protein, inducing overexpression of TS
protein. Increased levels of cellular TS thereby negate the therapeutic effect of TS

9
inhibitory drugs, leading to resistance. In contradiction, though, is the observation that,
after treating human colon tumour cell lines with 5-fluoro-deoxyuridine (5FdUrd), there is
no increase of the ribosome/TS mRNA ratio that could be responsible for higher TS
expression but instead the half-life of the TS protein is increased.18 Gene amplification is
another TS-inducing mechanism employed by cells for developing resistance to TS
inhibitors.19
Moreover, some individuals are inherently more resistant to TS targeted therapy
than others. In some cases, this can be attributed to the polymorphism of the TS gene.
TYMS is a polymorphic gene having two (2R) or three (3R) repeats of a 28 base sequence
in the 3' untranslated region (UTR). Humans can be homozygous for either one of these
forms, i.e. 2R/2R or 3R/3R, or heterozygous: 2R/3R. The individuals with 3R tandem
repeats express higher levels of TS and could be intrinsically more resistant to TS
inhibitory drugs than those of the 2R type.20-22
Like other chemotherapeutic drugs, the TS inhibitory anticancer agents also have
toxic effects on healthy tissue. Myelotoxicity, thrombocytopenia, neutropenia, mucositis
and diarrhoea caused by damage to bone marrow cells, blood cells or the intestinal lining,
respectively,23-25 are a few examples of the various toxicities observed upon administration
of TS inhibitors. Most of these toxic effects can be avoided by specific delivery of the
drugs to the tumours, thereby sparing the remaining tissues. Advances in this direction
have led to the design of drugs such as capecitabine26 (Scheme 1) and pemetrexed1
(Scheme 2) which show superior toxicity profiles. However, there is still a vast scope for
improvement before the severe side effects are completely abrogated.
A Pubmed search carried out on 31st March 2010, using “thymidylate synthase”
and “cancer” as keywords retrieved 373 papers published in the last three years,
illustrating the fact that despite the challenges presented, the status of TS as an anticancer
target remains undiminished and it continues to be a focus for cancer therapy research.
This mini-perspective aims to give a brief overview of various strategies that are being
employed to overcome the hurdles of resistance and toxicity while targeting TS.
10
New Chemical Strategies for Targeting the Enzyme Thymidylate Synthase
The first structure of TS to be solved was that from Lactobacillus casei in 1987.27
Since then, many structures for human (hTS) and other TS proteins in free and liganded
forms have been determined, giving insights into the structural and dynamic features of
the protein. The understanding of the molecular mechanisms involved in the catalytic
action of TS and its role in pyrimidine synthesis, folate and related pathways has also
improved immensely over the years since it was recognised as an anticancer target. This
improved knowledge is now being applied to identify new compounds which could inhibit
the enzyme while bypassing the toxicity and resistance problems. This section will deal
with some of the strategies being used, some of which have already shown success in the
clinic while others are still at an early experimental level.
a) 5FU prodrugs The concept of a prodrug is widely employed as a means to improve the
pharmacology and pharmacokinetics of an active drug molecule. 5FU, which is one of the
first choice anticancer drugs, particularly against colorectal cancer, is itself a prodrug
(Scheme 1), see review by Longley et al.28 5FU is bioactivated to active metabolites, e.g.
5FdUMP (a TS inhibitor), 5-fluorouridine triphosphate (5FUTP, which gets incorporated
into the RNA). However, since the enzymes for activating 5FU are not tumour selective,
toxicity is a major issue with this drug, e.g. activation in the intestines leads to diarrhoea.
Moreover, it is rapidly degraded by dihydropyrimidine dehydrogenase (DPD), which is
abundantly found in liver, thereby limiting its oral bioavailability. Despite this, 5FU is, in
part due to its low therapeutic cost, still being used in a clinical setting. A prodrug for
5FU, capecitabine (N4-pentyloxycarbonyl-5'-deoxy-5-fluorocytidine), was designed by
Miwa et al.26 and was approved by the FDA in 1998, with a recommended dose of
2500 mg/m2/day (www.accessdata.fda.gov/Scripts/cder/DrugsatFDA/). Capecitabine is
selectively converted to 5FU in tumour cells by a cascade of three enzymes, hepatic
carboxylesterase (CE), cytidine deaminase (CD) mainly localised in liver and tumour
tissues, and thymidine phosphorylase (TP) which is more highly active in tumorous than
in normal tissues (Scheme 1), thereby making its action tumour-specific. Improved oral
bioavailability and reduced incidence of diarrhoea are other major advantages of
capecitabine over 5FU,29 but incidences of a dose-limiting side effect hand-and-foot
syndrome have been reported.30 Tegafur (5-fluoro-1-(tetrahydro-2-furanyl)-2,4(1H,3H)-

11
pyrimidinedione)31 is another prodrug of 5FU (Scheme 1), bioactivated in the liver by
cytochromes P-450 (Cyp 450).32 It is administered in combination with modulators such as
uracil33 or 5-chloro-2,4-dihydroxypyridine,34,35 which compete for DPD, consequently
improving the bioavailability of the released 5FU. Combination with potassium oxonate,
which inhibits orotate phosphoribosyltransferase (OPRT) in the gastrointestinal (GI) tract
helps in reducing the GI toxicities.34,35
Another experimental approach to designing prodrugs for specific delivery
employs the antibody directed prodrug therapy (ADEPT) or gene directed prodrug therapy
(GDEPT) methodology. The first step is to specifically deliver enzymes to the surface of
tumour tissues. Next the prodrugs which are metabolised by the enzymes are administered,
thereby leading to activation of the drug molecule only at the tumour mass.36 Application
of cephem conjugation and release of the active molecule by β-lactamase is a well
established strategy in the literature for tumour specific delivery of chemotherapeutic
agents such as mitomycin and platinum derived drugs. Recently, an experimental 5FU-
cephem conjugate that remains stable until activated by β-lactamase has been reported by
Phelan et al.37 Another type of compounds with potential as a prodrug are the FdUMP[N]
oligodeoxynucleotides which can be simply cleaved by enzymes with 3'-O-exonucleolytic
activity such as p53 to release FdUMP.38

12
Scheme 1. Mechanism of activation of capecitabine and tegafur to TS inhibitors. CDHP: 5-chloro-2,4-dihydroxypyridine. The enzymes involved are CE, CD, TP, Cyp 450, UP, UK , OPRT and TK.
13
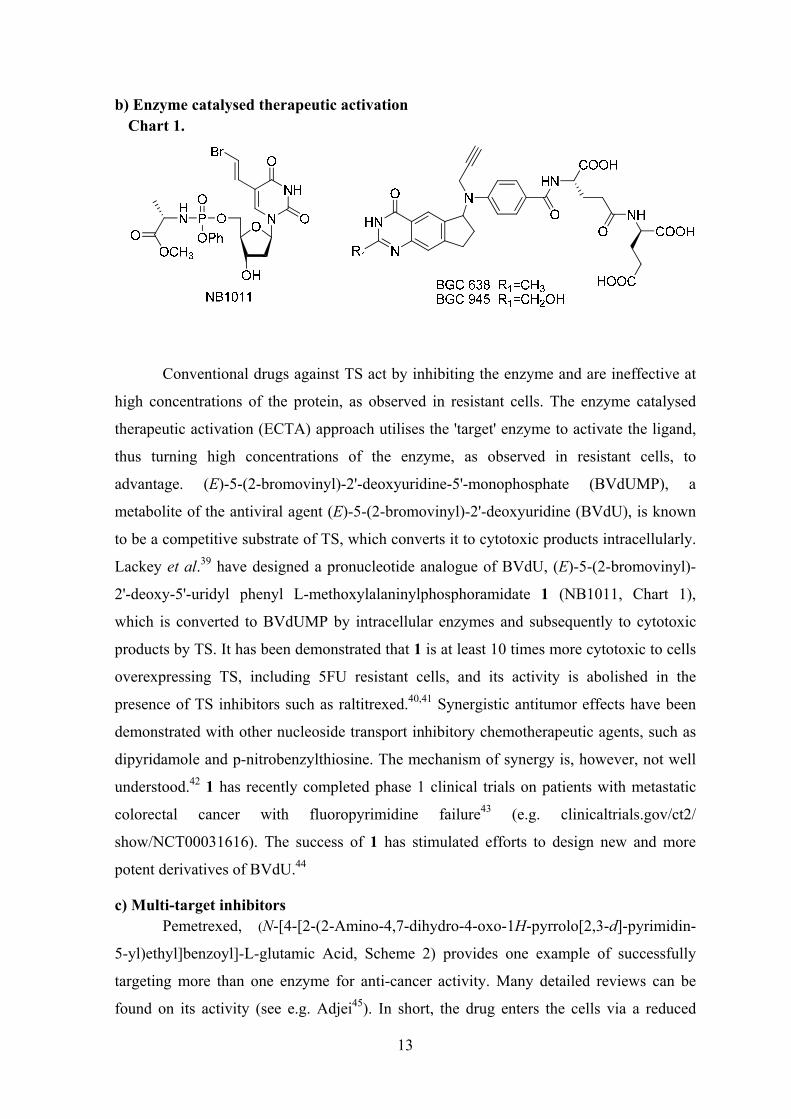
b) Enzyme catalysed therapeutic activation Chart 1.
Conventional drugs against TS act by inhibiting the enzyme and are ineffective at
high concentrations of the protein, as observed in resistant cells. The enzyme catalysed
therapeutic activation (ECTA) approach utilises the 'target' enzyme to activate the ligand,
thus turning high concentrations of the enzyme, as observed in resistant cells, to
advantage. (E)-5-(2-bromovinyl)-2'-deoxyuridine-5'-monophosphate (BVdUMP), a
metabolite of the antiviral agent (E)-5-(2-bromovinyl)-2'-deoxyuridine (BVdU), is known
to be a competitive substrate of TS, which converts it to cytotoxic products intracellularly.
Lackey et al.39 have designed a pronucleotide analogue of BVdU, (E)-5-(2-bromovinyl)-
2'-deoxy-5'-uridyl phenyl L-methoxylalaninylphosphoramidate 1 (NB1011, Chart 1),
which is converted to BVdUMP by intracellular enzymes and subsequently to cytotoxic
products by TS. It has been demonstrated that 1 is at least 10 times more cytotoxic to cells
overexpressing TS, including 5FU resistant cells, and its activity is abolished in the
presence of TS inhibitors such as raltitrexed.40,41 Synergistic antitumor effects have been
demonstrated with other nucleoside transport inhibitory chemotherapeutic agents, such as
dipyridamole and p-nitrobenzylthiosine. The mechanism of synergy is, however, not well
understood.42 1 has recently completed phase 1 clinical trials on patients with metastatic
colorectal cancer with fluoropyrimidine failure43 (e.g. clinicaltrials.gov/ct2/
show/NCT00031616). The success of 1 has stimulated efforts to design new and more
potent derivatives of BVdU.44
c) Multi-target inhibitors Pemetrexed, (N-[4-[2-(2-Amino-4,7-dihydro-4-oxo-1H-pyrrolo[2,3-d]-pyrimidin-
5-yl)ethyl]benzoyl]-L-glutamic Acid, Scheme 2) provides one example of successfully
targeting more than one enzyme for anti-cancer activity. Many detailed reviews can be
found on its activity (see e.g. Adjei45). In short, the drug enters the cells via a reduced

14
folate carrier and is polyglutamated by folylpolyglutamate synthetase (FPGS) to the
pentaglutamate form which is 60 times more potent than the parent compound and has
enhanced intracellular retention. It then additively inhibits at least three enzymes in the
purine and pyrimidine synthesis pathway, namely, TS (Ki 1.3 nM), DHFR (Ki 7.2 nM) and
glycinamide ribonucleotide formyl transferase (GARFT) (Ki 380 nM),46 all of which have
folate derivatives as their natural substrates.
The enzymes TS and DHFR are coupled on the folate pathway such that the
product of TS is the substrate for DHFR. Folate analogue inhibitors of TS and DHFR have
independently found utility in the clinic as anticancer agents. The substitution on the
pyrimidine ring seems to determine whether the molecule will be a TS or DHFR inhibitor;
TS inhibitors generally contain a 2-amino-4-oxo or 2-methyl-4-oxo substitution on the
pyrimidine ring whereas the inhibitors of DHFR generally carry a 2,4-diamino
substitution.47 A common inhibitor for both TS and DHFR could show additive effects
while circumventing the pharmaceutical disadvantages of the simultaneous application of
two drugs. In view of this idea, Gangjee et al. have been working on the structure-based
design and synthesis of potent dual inhibitors of TS and DHFR (Scheme 2, Chart 2), such
as pyrrolo[2,3-d]pyrimidines 2, 3,48 thieno[2,3-d]pyrimidines 447 and pyrrolo[3,2-
d]pyrimidines 5,49 some of which do not require polyglutamylation for activity e.g. the 2-
[(benzoylamino)-4'-yl]-L-glutamic acid derivative of 5 (5.i).49 This latter aspect is
important for avoiding one route to developing resistance, that via reduced FPGS
activity.50 Some of these molecules e.g. N-{4-[(2-Amino-6-methyl-4-oxo-3,4-
dihydrothieno[2,3-d]pyrimidin-5-yl)sulfanyl]benzoyl}-L-glutamic acid (4.b.i)47 have
shown potent dual inhibitory activity, not only against human enzymes (IC50 of 40 nM and
20 nM, respectively, for hTS and DHFR), but also against Escherichia coli and
Toxoplasma gondii enzymes, with IC50 values nearly in the same range, and they could
thus be possible leads for antiparasitic as well as anticancer agents. A further step could be
to design molecules that would additionally inhibit other folate enzymes, but not be
dependent upon polyglutamation by FPGS for activity.

15
Scheme 2. Mechanism of activation and targeting pathway of multi-target folate-analogue inhibitors. The known inhibitor pemetrexed is pentaglutamated by FPGS for potent inhibitory activity whereas some of the experimental dual TS-DHFR inhibitors do not need glutamation. THF: tetrahydrofolate, fTHF: formyltetrahydrofolate

16
Chart 2. Examples of dual TS-DHFR inhibitors.
1
Ar = 4-C6H4-CO-L-Glu
3
Ar = 4-C6H4-CO-L-Glu
4
a) X = NH and
Ar = 4-C6H4-CO-L-Glu
b) X = S and
i) Ar = 4-C6H4-CO-L-Glu
ii) Ar = Ph
iii) Ar = 4-Cl-Ph
iv) Ar = 4-NO2-Ph
v) Ar = 4-F-Ph
5
i) Ar = 4-CO-L-Glu-Ph
ii) Ar = 4-NO2-Ph
iii) Ar = 3,4-dl-Cl-Ph
d) Stabilising the inactive conformer and allosteric inhibitors When Schiffer and coworkers51 first crystallized the unliganded form of hTS, they
found that the active site loop (residues 181-197) containing the catalytic cysteine
(Cys195) was twisted about 180 degrees compared to the corresponding loop
conformation in the liganded hTS. Since in unliganded hTS, Cys195 is outside the active
site, the enzyme must be inactive (Figure 2). The authors suggested that the inactive
conformation might serve to protect the catalytic cysteine from cellular modification.
Three phosphate/sulphate ions were observed to be bound near the active site, suggesting
that inactive hTS could bind to TS mRNA, thereby repressing TS protein synthesis. In
addition, the disordered small domain (residues 107-128) of the inactive hTS likely
increases its proneness to cellular degradation, further reducing the cellular TS levels.
They demonstrated through fluorescence studies that there is an equilibrium between the

17
active and inactive states; phosphate ions were shown to shift the equilibrium toward the
inactive state and binding of dUMP toward the active state.52 The R163K mutant which
stabilises the active conformer is at least 33 % more active than WT hTS suggesting that at
least 1/3 of hTS populates the inactive state.53 In another crystal of the inactive conformer
obtained under low salt conditions,54 a clear density was observed in a hydrophobic pocket
unique to the inactive conformation (formed by residues Phe137, Gln138, Phe142,
Gly143, Trp182 and Leu187). It was interpreted as a valine or leucine residue, either from
the flexible N-terminus or from the neighbouring molecule in the crystal. As this allosteric
pocket is located about 16-18 Å from the phosphate/sulphate ions binding site, ligands
binding to it could possibly stabilise the inactive conformation.
Based on structural considerations, Lovelace et al.55 designed an anionic inhibitor
of hTS, 1,3-propanediphosphonic acid (PDPA) which binds partially to the previously
detected phosphate/sulphate sites (Figure 2). Since this position is distinct from the dUMP
or folate binding sites, PDPA is an allosteric inhibitor. It shows a complex inhibition
profile for the WT hTS; uncompetitive inhibition at low concentrations (Ki = 0.26 μM)
and mixed (noncompetitive) inhibition at higher concentrations (Ki = 2.7 µM). On the
other hand, the R163K mutant and mouse TS are only weakly but competitively inhibited
by PDPA (most likely by binding to the site of the dUMP phosphate moiety). Since these
proteins probably do not populate the inactive state, the complex inhibition profile of
PDPA for the WT hTS is proposed to be related to the presence of the inactive conformer.
Further, PDPA also demonstrated positive cooperativity with an antifolate inhibitor, (S)-2-
[4-[N-[(3,4-dihydro-2,7-dimethyl-4-oxo-6-quinazolinyl)methyl]-N-prop-2-ynylamino]-2-
fluorobenzamido]-4-(1H-1,2,3,4-tetrazol-5-yl)butyric acid (ZD9331).53 Unfortunately, this
small ligand is very polar in nature and is not an ideal lead structure for drug development.
The structural and kinetic features involved in the active-inactive transition and
stabilisation of either state are still not well understood. Experimental studies, such as
design of the fully active R163K variant and the recently reported fully inactive M190K
variant,56 can aid in designing inhibitors to stabilise the inactive state. Thus ligands
designed to prevent the conformational change from the catalytically inactive to the active
form might provide a novel approach to inhibiting the enzyme, and may also help to avoid
the development of cellular resistance associated with higher TS protein levels. The
allosteric sites mentioned above may be too small to be targeted by drug-like molecules.
However, it might be possible to usefully exploit them by additionally targeting

18
neighbouring pockets. There may also be other, as yet undiscovered, binding sites in hTS
that can be targeted to affect the amount of active enzyme.
Figure 2. a) Cartoon representation of the superimposed monomeric subunits (from the crystallised dimers) of human thymidylate synthase in active (PDB 1HVY) (yellow) and inactive (PDB 2ONB) (grey) conformations. The active conformation of the active site loop is shown in green and the inactive conformation in red. The catalytic cysteine, C195, is highlighted with stick representation on the loops. The small domain visible in the active crystal structure is shown in brown. dUMP (cyan sticks) and a folate analogue raltitrexed (dark blue sticks) are present in the active site, whereas PDPA (ball-and-stick representation) is located in an allosteric position. b) Interactions of dUMP with the protein. Dashed lines represent direct hydrogen bonds between amino acid residues and the ligand, solid line between Cys195 and dUMP represents a covalent bond. c) Interactions of folate analogue raltirexed with the protein.
e) Exploiting the overexpressed transporters The reduced folate carrier (RFC) is ubiquitously expressed in cells for the transport
of folate into the cells and is also used by a large number of antifolate drugs. These drugs
also show high affinity for the alpha folate receptor (αFR), which is a low capacity folate
transporter, highly overexpressed in some cancerous tissues. The β isoform of the folate
receptor is instead overexpressed in activated macrophages and some tumours. The high
overexpression of the specific isoform of the FR can be utilised for specific delivery of
antifolate drugs into the cancerous cells, thereby sparing the remaining tissue. For detailed
19
accounts of folate receptor based targeting, see reviews from Low et al.57 and Salazar and
Ratnam.58 This approach has been realised for TS inhibition with cyclopenta[g]
quinazoline derivatives such as 2(R)-(4(S)-Carboxy-4-{4-[N-(2-methyl-4-oxo-4,6,7,8-
tetrahydro-3H-cyclopenta[g]quinazolin-6-yl)-N-(2-propynyl)-amino]-benzamido}-
butyramido)-pentanedioic acid (BGC 638) and 2(R)-[4(S)-Carboxy-4-[4-[N-(2-
hydroxymethyl-4-oxo-4,6,7,8-tetrahydro-3H-cyclopenta[g]quinazolin-6-yl)-N-(2-
propynyl)amino]benzamido]butyramido]pentanedioic acid 6 (BGC 945, Chart 1) which
have unexpectedly high affinity for αFR and low affinity for RFC.59 The Ki value of 6 for
isolated TS is 1.2 nM and the IC50 for αFR overexpressing human tumour cells is ~ 1-300
nM; in contrast, the IC50 for α FR negative mouse L1210 or human A431 cells is 7 µM.
Following its success in mice models, 6 has been taken up for clinical development.60
Since the underlying mechanism for the selective uptake by αFR is not understood, this
approach can as yet not be rationally exploited for drug development.
f) Peptidic inhibitors of the TS protein Based on an analysis of a L. casei TS crystal structure and counting the number of
contacts between residues of both subunits, three peptides, N22, M17 and C20, were
selected corresponding to the L. casei TS sequences 17-38, 174-190 and 201-220,
respectively.61 After incubation of L. casei TS with the C20 peptide, inhibition of enzyme
activity and aggregation were observed. This effect was not detected for the N22 and M17
peptides, or after incubating the ternary complex of TS, FdUMP and mTHF, with C20.
The ability to use peptides to inhibit TS may be a good starting point for developing
peptide-like or peptidomimetic inhibitors.
Targeting the Step Before: the mRNA Various techniques using antisense oligodeoxynucleotides (ODNs),
oligoribonucleotides, small inhibitory RNAs (siRNA) and microRNAs are known to be
useful for modulating gene expression at the post transcriptional level. In 1998, the first
antisense ODN drug, Fomivirsen was approved for treatment of cytomegalovirus
retinitis;62 many others are now in clinical trials for an array of diseases63 including cancer
(e.g. clinicaltrials.gov/ct2/show/NCT00689065). Since interruption of the autoregulatory
mechanism for inhibiting the translation of mRNA is proposed to play a role in
development of resistance against TS targeting drugs, therapies targeted at silencing the
TS mRNA could be of importance in tackling this resistance problem. Even though the
delivery and specificity of RNA inhibitory molecules to the tumour cells remain an issue,
20
targeting the TS mRNA is a possible strategy for development as standalone or, more
likely, as adjuvant therapy together with conventional TS inhibitory chemotherapeutic
agents.
a) Antisense oligodeoxynucleotides (ODNs) ODNs are designed to anneal against the target mRNA, forming an RNA-DNA
duplex leading to abolition of protein synthesis by either direct inhibition of translation or
stimulating the degradation of mRNA. From the TS protein-mRNA binding studies, it
would be expected that since regions of the mRNA important for protein binding, Sites I
and II, should be important for regulating the translation of TS mRNA in cells, these
would be effective antisense targets as well. Surprisingly, this does not seem to be the
case.
Several regions throughout the length of the TS mRNA have been investigated for
targeting by the antisense technology, both in vitro and in vivo. Application of ODNs to
target TS has been extensively reviewed by Berg et al.64 Interestingly, the ODN found to
be most effective in cell proliferation assays is the one targeting nucleotides 1184-1203 in
the 3' UTR of hTS mRNA.64,65 Contrary to expectations, the ODNs targeting the
translational start site encompassed in Site I led to upregulation of the TS gene
transcription and were ineffective in decreasing the TS protein levels.66 Whether the
ODNs bound specifically to the intended target or made any additional interactions
affecting this discrepancy remains to be investigated.
It is commonly accepted that use of an ODN leads to insufficient decrease in
cellular protein levels to present any significant translation repression effect on cell
proliferation. Thus ODNs are generally considered as an option for adjuvant therapy.
However, the effectiveness of using a standalone combination of ODNs targeting different
mRNAs was first demonstrated by Normanno et al.67 for the epidermal growth factor
family. Subsequently, the effectiveness of combinations of ODNs targeting the same
mRNA has been demonstrated by Berg et al., by using the example of TS mRNA.
Combining the ODN targeting nucleotides 1184-1203 with ODNs targeting either 1081-
1100 or 1436-1455 showed an additive anti-proliferative action whereas the combination
of the latter two failed to show any additivity.65 Whether ODNs can eventually be
developed into an independent treatment for cancer is still questionable. However, they are
surely candidates to be considered for combination chemotherapy.
21
b) Small interfering RNA (siRNA) Small double stranded RNA sequences called siRNA are widely used for selective
post transcriptional silencing of gene expression in functional genomics experiments.63,68
The siRNAs are about 21 nucleotides long and are reported to be 100-1000 fold more
efficient than the corresponding ODNs. The specificity of gene silencing by siRNA
depends on the length and the concentration of the RNA. Longer siRNAs tend to induce
interferon response and the probability of off-target effects is high at higher
concentrations.
Not much literature on identification of effective siRNA targets for TS is available
but, as for the ODNs, the general trend seems to be that targeting the sequences towards
the 3' end, i.e., beyond the putative protein binding sites, is more effective. Transfection of
cells with siRNA targeting nucleotides 978-996 (R1), 991-1109 (R2) or 1058-1077 (R3)
has been reported to cause 90-95 % decrease in TS levels,69-71 whereas targeting the
sequences 95-122 and 208-226 had negligible effects on TS expression.71 Although the
observed reduction in TS levels is insufficient to have any significant effect on cell
proliferation of HeLa and RKO cell lines, it is enough to resensitise the resistant cells to
TS inhibitors.69 In another study carried out on ACC3 cells from salivary adenoid
carcinoma, targeting nucleotides 978-996 effectively inhibited the cell growth and also
induced apoptosis in a xenograft model in nude mice.70
Direct transfection of cells with siRNA leads to a temporary reduction in gene
expression, which resumes after the degradation of the inserted siRNA. A retroviral
infection that encodes for the siRNA can lead to stable introduction of the gene and a
'permanent' or longer lived effect, but the choice of the plasmid could be a crucial
determinant of the effectiveness of the cloned siRNA.71
Site 1 is not only implicated in the protein-mRNA binding for translational
repression, it also contains the start codon, which is responsible for initiation of
translation, so the ineffectiveness of the ODN and siRNA sequences targeting Site 1
comes as a surprise. This observation brings into question the significance of Site 1 in
translational repression, and additionally, the role it plays in translation initiation and
mRNA stability.
c) Peptides Though sites I and II sequences of the TS mRNA have been found to be important
for the protein-mRNA binding, the mRNA binding regions of the TS protein are still
unknown. Identification of these sites would be useful for developing new inhibitors of TS

22
translation, for example, by mimicking the structural features of the RNA binding moieties
of the protein. Chu et al. showed that enzymatically active exogenous human recombinant
TS protein but not that synthesised directly in vitro in a rabbit reticulocyte lysate system is
sufficient for binding to the full-length TS mRNA.10 The presence of oxidising agents
blocked mRNA binding whereas reducing agents increased the binding.72 Mutating each
cysteine residue in TS to alanine, led to partial and drastic reduction in mRNA binding
respectively for the C199A and C180A mutants, suggesting the impact of residue C180 on
translation control.73
By screening a series of overlapping 17-mer peptides spanning the complete
sequence of hTS, Voeller and co-workers identified five peptides capable of binding the
full-length as well as the Site I sequence from hTS mRNA.74 All of the five peptides
correspond to sequences located in the interface region between the two monomers of the
homodimeric protein and four of them contain at least one arginine that is conserved in
several TS species. One of the peptides corresponds to the sequence of the C20 peptide
(see section f above) whose binding resulted in TS protein aggregation. From the location
of the peptides at the interface region, Voeller et al. concluded that a monomeric form of
TS must exist to make those regions accessible to mRNA. They confirmed the existence of
the monomeric form by equilibrium dialysis in which only the monomeric form was able
to pass the membrane due to its smaller size. Afterwards, it still showed enzymatic
activity, presumably in the reformed dimeric form.
In a more recent paper, peptides binding to the Site I sequence from TS mRNA
were selected from a large peptide library using mRNA display.75 After 12 rounds of
amplification, an analysis of the amino acid composition of 18 totally random sequence
positions within the yielded peptides suggested that mainly basic side chains took part in
mRNA binding. Specific sequences were not found and it was suggested that nonspecific
interactions were involved in mRNA-peptide binding.
So far, no clearly defined sequence and structural characterisation of the TS
mRNA- protein/peptide binding complex has been achieved, therefore, further
investigations are important for the rational design of peptides or peptidomimetics to
specifically inhibit TS translation.

23
Indirect Thymidylate Synthase Expression Regulators The techniques discussed so far deal with direct targeting of the TS protein or
mRNA. However, targeting other proteins which act as TS expression regulators could
also affect the in vivo levels of the TS protein or mRNA, and consequently synergise with
the TS inhibitors. We shall here discuss histone deacetylase inhibitors and E2F-1
inhibitors as examples from this category.
Chart 3.
a) Histone deacetylase inhibitors (HDACi) HDACi have recently emerged as potent and selective anticancer agents and are
undergoing clinical trials. These agents inhibit histone deacetylases, leading to altered
acetylation of histone and non-histone proteins. Through microarrays, HDACi have been

24
shown to modulate transcription of about 5 % of the genome.76,77 Potent transcriptional
repression of the TYMS gene encoding TS has been demonstrated making TYMS one of
the most prominently down regulated genes following HDACi treatment.78 Mechanisms of
TS mRNA down regulation by the HDACi, trichostatin A (Chart 3), have been elucidated
by Lee et al.79 They observed that trichostatin A induced TS mRNA down regulation was
abrogated by cycloheximide, which inhibits the synthesis of new proteins, suggesting that
trichostatin A induced the expression of a transcriptional repressor of TS mRNA.
Additionally, proteasomal degradation of the TS protein, mediated by acetylation of
chaperonic Hsp90, was also induced by trichostatin A. HDACi have been shown to
synergise the anti-proliferative effects of TS inhibitors in in vitro and in vivo mice models
and to aid in resensitising the resistant cells.80,81
The synergism of HDACi to TS inhibitors, however, is not universal, as there is at
least one report in which the HDACis, valproic acid82 and N-(2-aminophenyl)-4-[N-
(pyridin-3-ylmethoxycarbonyl) aminomethyl]benzamide (MS275,83 Chart 3), antagonise
the antiproliferative effects of the folate analogue methotrexate, at least in part by
upregulating TS expression.84 It should however be noted that this study was carried out
on choroid plexus cells, which, in order to maintain the folate levels in cerebrospinal fluid,
have a highly differentiated folate metabolism and transport system, unlike in other cells
where the folate pathway is involved in proliferation and dedifferentiation. Further studies
to detail the mechanism in play and to study the cell line specificity of the observed effect
need to be carried out.
b) E2F-1 modulators By regulating the transcription of genes that encode for proteins required for DNA
synthesis, the E2F family, consisting of six transcription factors, plays a key role in
progression of cells from late G1 into S phase of the cell cycle.85 However, only the E2F1
factor has been noted for its role in apoptosis. It has also been suggested to be one of the
regulators of TS levels in the cell. Though this regulation has not been demonstrated
directly, TS expression has been found to be inversely correlated with E2F1 expression in
various cell lines.85,86 Thus, the importance of E2F1 for TS gene expression has been
generally accepted. To our knowledge, no specific inhibitors of E2F1 are known, however,
many known and potential anti-tumour compounds have been shown to induce E2F1
mediated down regulation of TS; protein kinase C/cyclin dependent kinase (PKC/CDK)

25
inhibitors and epidermal growth factor receptor (EGFR) inhibitors are two such classes of
molecules.
Protein kinase C/cyclin dependent kinase inhibitors
7-hydroxystaurosporine 7 (UCN-01, Chart 3)87 is a selective PKC/CDK inhibitor
undergoing clinical trials as a standalone drug or in various combination chemotherapies
(clinicaltrials.gov). Significant synergism with 5FU has been reported and attempts at
deciphering the mechanism of its action been made. Though the activity of TS remains
unaffected, a decrease in normal and 5FU-induced TS mRNA and consequent protein
levels has been observed on administration of 7.87 This decrease is preceded by a decrease
in E2F1 protein level, while the E2F1 mRNA level remains unaltered.88 This phenomenon
can be explained by a cascade of events triggered by the CDK inhibition caused by 7.
Members of the CDK family are responsible for the phosphorylation of the retinoblastoma
protein (pRb); pRb inhibits E2F1 by forming a pRB-E2F1 complex. Phosphorylation of
pRb dissociates the E2F1-pRb complex, releasing functional E2F1.89 CDK inhibitors such
as 7, prevent the release of E2F1 by preventing phosphorylation of pRb. The decrease in
the free and functional transcription factor E2F1 results in a decrease in TS gene
expression, and thus the down regulation of TS mRNA and protein levels.88
Epidermal growth factor receptor inhibitors
The EGFR inhibitors, gefitinib and lapatinib (Chart 3), have also been reported to
cause down regulation of TS. EGFR belongs to a family of receptor tyrosine kinases and is
being established as an anti-cancer target.90,91 Since EGFR signal transduction is involved
in the activity of E2F1, inhibitors of EGFR could mediate interference of TS expression.
Okabe et al.91 have shown that gefitinib synergises with 5FU by specifically down
regulating TS, and does not affect the expression of other 5FU modulators like DPD or
OPRT.
Conclusions and Perspectives Even 37 years after the discovery of TS as an anticancer target, resistance and
toxicity continue to pose a challenge to the development of a foolproof TS inhibitory drug.
The various approaches being employed to address these problems from the three levels,
the protein, the mRNA and the gene, have been summarised in this mini-perspective.
While approaches aimed at tumour-specific concentration or activation of TS protein
active-site inhibitors have considerably reduced toxicity to normal tissues, these do not
overcome the development of resistance. Effective inhibition of the TS mRNA or the

26
TYMS gene could play a crucial role in tackling the problem of resistance. Allosteric
inhibitors of the TS protein might also be useful in preventing the development of
resistance, but this hypothesis remains to be validated. The ECTA approach on the other
hand, requires TS overexpression, as observed in resistant cells, for activating a cytotoxic
agent. Improved understanding of cancer biology has highlighted the involvement of TS in
a complicated network of different pathways. Identification of TS expression regulators
produced by such TS-interconnected pathways opens new possibilities for TS function
repression. The strategies for targeting TS for treating cancer should not focus exclusively
on protein inhibition but also consider the concept of protein down-regulation to have a
more effective and forceful impact in the clinical setting. Consequently, TS continues to
present ample opportunities for drug discovery scientists.
Acknowledgement.
We gratefully acknowledge the support of the Klaus Tschira Foundation and the European
Union (FP6 STREP project LIGHTS LSH-2005-2.2.0-8).
Biographies Divita Garg is a PhD student with Dr. Rebecca Wade at HITS Heidelberg (Germany).
After completing her Bachelor of Pharmacy degree from Guru Nanak Dev University
(India) and Master's degree in Pharmacoinformatics from National Institute of
Pharmaceutical Education and Research (India), she moved to Germany to pursue doctoral
studies. She is currently working at the Institute of Structural Biology, Helmholtz Zentrum
and Munich Center for Integrated Protein Science at the Department of Chemistry,
Technical University of Munich, Germany.
Stefan Henrich studied biology at the University of Karlsruhe, Germany. After finishing
his diploma thesis in 1999, he worked for one year at the University of Münster, Germany.
He did his doctoral research under the supervision of Prof. Robert Huber and Prof.
Wolfram Bode, at the Department for Structure Research, Max Planck Institute of
Biochemistry, Martinsried, Germany, and was awarded a PhD in 2004 from the Technical
University of Munich, Germany. He then joined the research group of Dr. Rebecca Wade
at HITS in Heidelberg, Germany where he has worked on techniques for docking and
scoring protein-ligand and protein-peptide interactions, with one of the applications being
to thymidylate synthase.

27
Outi M. H. Salo Ahen is a postdoctoral researcher, currently at Åbo Akademi University,
Turku (Finland) and HITS, Heidelberg (Germany). She obtained her PhD (Pharm.) degree
at the University of Kuopio in 2006. Her doctoral thesis was about molecular modelling of
the endogenous cannabinoid system and the usability of the modelling results in drug
design. She spent the following three years as a postdoctoral fellow in Dr. Rebecca Wade's
group at HITS, where she has applied biomolecular simulation techniques to studying the
structure and function of human thymidylate synthase.
Hannu Myllykallio is research director (Centre National de la Recherche Scientifique)
and professor of biology in the leading French engineering school, Ecole Polytechnique,
located in Palaiseau, close to Paris. He performed his doctoral studies at the University of
Pennsylvania (Philadelphia, USA). His research focuses on understanding how
thymidylate metabolism influences DNA replication and repair in bacterial and human
cells. He is a recipient of the Coups d'élan pour la Recherche Française (Fondation
Bettencourt-Schueller) and the CNRS bronze medal.
Maria P. Costi is a professor of Medicinal Chemistry at the faculty of Bioscience and
Biotechnology and leads the “Laboratory of drug discovery of enzyme inhibitors” at the
Department of Pharmaceutical Science at the University of Modena and Reggio Emilia, Italy. She
performed her doctoral research at the same university and was a visiting scientist at the University
of California, San Francisco. She works in the areas of anticancer agents and antinfectives,
focusing on the discovery of new drug candidates capable of modulating the folate pathways in
different organisms in order to overcome drug resistance. She has expertise in folate pathway
modulation and biomolecular studies. She is the coordinator of the 6FP European Union project
LIGHTS (www.lights-eu.org) aimed at discovering anticancer drugs targeting thymidylate
synthase.
Rebecca Wade leads the Molecular and Cellular Modeling Group at HITS, a private non-
profit research institute in Heidelberg, Germany. The group works on the development and
application of computer-aided methods to model and simulate biomolecular interactions.
She did her doctoral research in structure-based drug design at Oxford University, and
postdoctoral research in biomolecular simulation at the universities of Houston and
Illinois. She was a group leader at the European Molecular Biology Laboratory (EMBL) in
Heidelberg before taking up her present position. She is an associate editor of the Journal
of Molecular Recognition, and a member of the editorial boards of several journals,

28
including the Journal of Medicinal Chemistry. She is the recipient of the 2004 Hansch
Award of the QSAR and Modelling Society.
References 1. McGuire, J. J. Anticancer antifolates: current status and future directions. Curr
Pharm Des 2003, 9, 2593-2613.
2. Werkheiser, W. C. Specific binding of 4-amino folic acid analogues by folic acid
reductase. J Biol Chem 1961, 236, 888-893.
3. Kumar, P.; Kisliuk, R. L.; Gaumont, Y.; Nair, M. G.; Baugh, C. M.; Kaufman, B.
T. Interaction of polyglutamyl derivatives of methotrexate, 10-deazaaminopterin, and
dihydrofolate with dihydrofolate reductase. Cancer Res 1986, 46, 5020-5023.
4. Allegra, C. J.; Chabner, B. A.; Drake, J. C.; Lutz, R.; Rodbard, D.; Jolivet, J.
Enhanced inhibition of thymidylate synthase by methotrexate polyglutamates. J Biol Chem
1985, 260, 9720-9726.
5. Allegra, C. J.; Drake, J. C.; Jolivet, J.; Chabner, B. A. Inhibition of
phosphoribosylaminoimidazolecarboxamide transformylase by methotrexate and
dihydrofolic acid polyglutamates. Proc Natl Acad Sci U S A 1985, 82, 4881-4885.
6. Heidelberger, C.; Chaudhuri, N. K.; Danneberg, P.; Mooren, D.; Griesbach, L.;
Duschinsky, R.; Schnitzer, R. J.; Pleven, E.; Scheiner, J. Fluorinated pyrimidines, a new
class of tumour-inhibitory compounds. Nature 1957, 179, 663-666.
7. Rutman, R. J.; Cantarow, A.; Paschkis, K. E. Studies in 2-acetylaminofluorene
carcinogenesis. III. The utilization of uracil-2-C14 by preneoplastic rat liver and rat
hepatoma. Cancer Res 1954, 14, 119-123.
8. Santi, D. V.; McHenry, C. S.; Sommer, H. Mechanism of interaction of
thymidylate synthetase with 5-fluorodeoxyuridylate. Biochemistry 1974, 13, 471-481.
9. Chu, E.; Allegra, C. J. The role of thymidylate synthase in cellular regulation. Adv
Enzyme Regul 1996, 36, 143-163.
10. Chu, E.; Koeller, D. M.; Casey, J. L.; Drake, J. C.; Chabner, B. A.; Elwood, P. C.;
Zinn, S.; Allegra, C. J. Autoregulation of human thymidylate synthase messenger RNA
translation by thymidylate synthase. Proc Natl Acad Sci U S A 1991, 88, 8977-8981.
11. Ju, J.; Pedersen-Lane, J.; Maley, F.; Chu, E. Regulation of p53 expression by
thymidylate synthase. Proc Natl Acad Sci U S A 1999, 96, 3769-3774.

29
12. Chu, E.; Takechi, T.; Jones, K. L.; Voeller, D. M.; Copur, S. M.; Maley, G. F.;
Maley, F.; Segal, S.; Allegra, C. J. Thymidylate synthase binds to c-myc RNA in human
colon cancer cells and in vitro. Mol Cell Biol 1995, 15, 179-185.
13. Chu, E.; Voeller, D.; Koeller, D. M.; Drake, J. C.; Takimoto, C. H.; Maley, G. F.;
Maley, F.; Allegra, C. J. Identification of an RNA binding site for human thymidylate
synthase. Proc Natl Acad Sci U S A 1993, 90, 517-521.
14. Lin, X.; Parsels, L. A.; Voeller, D. M.; Allegra, C. J.; Maley, G. F.; Maley, F.;
Chu, E. Characterization of a cis-acting regulatory element in the protein coding region of
thymidylate synthase mRNA. Nucleic Acids Res 2000, 28, 1381-1389.
15. Chu, E.; Copur, S. M.; Ju, J.; Chen, T. M.; Khleif, S.; Voeller, D. M.; Mizunuma,
N.; Patel, M.; Maley, G. F.; Maley, F.; Allegra, C. J. Thymidylate synthase protein and
p53 mRNA form an in vivo ribonucleoprotein complex. Mol Cell Biol 1999, 19, 1582-
1594.
16. Rahman, L.; Voeller, D.; Rahman, M.; Lipkowitz, S.; Allegra, C.; Barrett, J. C.;
Kaye, F. J.; Zajac-Kaye, M. Thymidylate synthase as an oncogene: a novel role for an
essential DNA synthesis enzyme. Cancer Cell 2004, 5, 341-351.
17. Hasnat, A.; Bichenkova, E.; Yu, X.; Arnold, J. R.; Fisher, J.; Fedorova, O.;
Andrews, J. Fluorescence spectroscopic and (19)f NMR studies of human thymidylate
synthase with its cognate RNA. J Biomol Struct Dyn 2007, 25, 253-270.
18. Kitchens, M. E.; Forsthoefel, A. M.; Rafique, Z.; Spencer, H. T.; Berger, F. G.
Ligand-mediated Induction of Thymidylate Synthase Occurs by Enzyme Stabilization.
Implications for autoregulation of translation. J Biol Chem 1999, 274, 12544-12547.
19. Berger, S. H.; Jenh, C. H.; Johnson, L. F.; Berger, F. G. Thymidylate synthase
overproduction and gene amplification in fluorodeoxyuridine-resistant human cells. Mol
Pharmacol 1985, 28, 461-467.
20. Iacopetta, B.; Grieu, F.; Joseph, D.; Elsaleh, H. A polymorphism in the enhancer
region of the thymidylate synthase promoter influences the survival of colorectal cancer
patients treated with 5-fluorouracil. Br J Cancer 2001, 85, 827-830.
21. Kawakami, K.; Salonga, D.; Park, J. M.; Danenberg, K. D.; Uetake, H.; Brabender,
J.; Omura, K.; Watanabe, G.; Danenberg, P. V. Different lengths of a polymorphic repeat
sequence in the thymidylate synthase gene affect translational efficiency but not its gene
expression. Clin Cancer Res 2001, 7, 4096-4101.

30
22. Marsh, S.; McKay, J. A.; Cassidy, J.; McLeod, H. L. Polymorphism in the
thymidylate synthase promoter enhancer region in colorectal cancer. Int J Oncol 2001, 19,
383-386.
23. Lorenz, M.; Slaughter, H. S.; Wescott, D. M.; Carter, S. I.; Schnyder, B.; Dinchuk,
J. E.; Car, B. D. Cyclooxygenase-2 is essential for normal recovery from 5-fluorouracil-
induced myelotoxicity in mice. Exp Hematol 1999, 27, 1494-1502.
24. Jackman, A. L.; Farrugia, D. C.; Gibson, W.; Kimbell, R.; Harrap, K. R.; Stephens,
T. C.; Azab, M.; Boyle, F. T. ZD1694 (Tomudex): a new thymidylate synthase inhibitor
with activity in colorectal cancer. Eur J Cancer 1995, 31A, 1277-1282.
25. Rafi, I.; Boddy, A. V.; Calvete, J. A.; Taylor, G. A.; Newell, D. R.; Bailey, N. P.;
Lind, M. J.; Green, M.; Hines, J.; Johnstone, A.; Clendeninn, N.; Calvert, A. H. Preclinical
and phase I clinical studies with the nonclassical antifolate thymidylate synthase inhibitor
nolatrexed dihydrochloride given by prolonged administration in patients with solid
tumors. J Clin Oncol 1998, 16, 1131-1141.
26. Miwa, M.; Ura, M.; Nishida, M.; Sawada, N.; Ishikawa, T.; Mori, K.; Shimma, N.;
Umeda, I.; Ishitsuka, H. Design of a novel oral fluoropyrimidine carbamate, capecitabine,
which generates 5-fluorouracil selectively in tumours by enzymes concentrated in human
liver and cancer tissue. Eur J Cancer 1998, 34, 1274-1281.
27. Hardy, L. W.; Finer-Moore, J. S.; Montfort, W. R.; Jones, M. O.; Santi, D. V.;
Stroud, R. M. Atomic structure of thymidylate synthase: target for rational drug design.
Science 1987, 235, 448-455.
28. Longley, D. B.; Harkin, D. P.; Johnston, P. G. 5-fluorouracil: mechanisms of
action and clinical strategies. Nat Rev Cancer 2003, 3, 330-338.
29. Reigner, B.; Blesch, K.; Weidekamm, E. Clinical pharmacokinetics of
capecitabine. Clin Pharmacokinet 2001, 40, 85-104.
30. Gressett, S. M.; Stanford, B. L.; Hardwicke, F. Management of hand-foot
syndrome induced by capecitabine. J Oncol Pharm Pract 2006, 12, 131-141.
31. Hiller, S. A.; Zhuk, R. A.; Lidak, M. Y. Analogs of pyrimidine nucleosides. I. N1-
(a-furanidyl) derivatives of natural pyrimidine bases and their antimetabolites. Dokl Akad
Nauk Uzb USSR 1967, 176, 332-335.
32. Ikeda, K.; Yoshisue, K.; Matsushima, E.; Nagayama, S.; Kobayashi, K.; Tyson, C.
A.; Chiba, K.; Kawaguchi, Y. Bioactivation of tegafur to 5-fluorouracil is catalyzed by
cytochrome P-450 2A6 in human liver microsomes in vitro. Clin Cancer Res 2000, 6,
4409-4415.

31
33. Fujii, S.; Kitano, S.; Ikenaka, K.; Shirasaka, T. Effect of coadministration of uracil
or cytosine on the anti-tumor activity of clinical doses of 1-(2-tetrahydrofuryl)-5-
fluorouracil and level of 5-fluorouracil in rodents. Gann 1979, 70, 209-214.
34. Shirasaka, T.; Shimamato, Y.; Ohshimo, H.; Yamaguchi, M.; Kato, T.; Yonekura,
K.; Fukushima, M. Development history and concept of an oral anticancer agent S-1 (TS-
1): its clinical usefulness and future vistas. Jpn J Clin Oncol 2009, 39, 2-15.
35. Shirasaka, T.; Shimamato, Y.; Ohshimo, H.; Yamaguchi, M.; Kato, T.; Yonekura,
K.; K, Y.; Fukushima, M. Development of a novel form of an oral 5-fluorouracil
derivative (S-1) directed to the potentiation of the tumor selective cytotoxicity of 5-
fluorouracil by two biochemical modulators. Anti-cancer drugs 1996, 7, 548-557.
36. Senter, P. D.; Springer, C. J. Selective activation of anticancer prodrugs by
monoclonal antibody-enzyme conjugates. Advanced Drug Delivery Reviews 2001, 53,
247-264.
37. Phelan, R. M.; Ostermeier, M.; Townsend, C. A. Design and synthesis of a beta-
lactamase activated 5-fluorouracil prodrug. Bioorg Med Chem Lett 2009, 19, 1261-1263.
38. Gmeiner, W. H. Novel chemical strategies for thymidylate synthase inhibition.
Curr Med Chem 2005, 12, 191-202.
39. Lackey, D. B.; Groziak, M. P.; Sergeeva, M.; Beryt, M.; Boyer, C.; Stroud, R. M.;
Sayre, P.; Park, J. W.; Johnston, P.; Slamon, D.; Shepard, H. M.; Pegram, M. Enzyme-
catalyzed therapeutic agent (ECTA) design: activation of the antitumor ECTA compound
NB1011 by thymidylate synthase. Biochem Pharmacol 2001, 61, 179-189.
40. Li, Q.; Boyer, C.; Lee, J. Y.; Shepard, H. M. A novel approach to thymidylate
synthase as a target for cancer chemotherapy. Mol Pharmacol 2001, 59, 446-452.
41. Neuteboom, S. T.; Karjian, P. L.; Boyer, C. R.; Beryt, M.; Pegram, M.; Wahl, G.
M.; Shepard, H. M. Inhibition of cell growth by NB1011 requires high thymidylate
synthase levels and correlates with p53, p21, bax, and GADD45 induction. Mol Cancer
Ther 2002, 1, 377-384.
42. Boyer, C. R.; Karjian, P. L.; Wahl, G. M.; Pegram, M.; Neuteboom, S. T.
Nucleoside transport inhibitors, dipyridamole and p-nitrobenzylthioinosine, selectively
potentiate the antitumor activity of NB1011. Anticancer Drugs 2002, 13, 29-36.
43. Pegram, M.; Yeon, C. H.; Ku, N.; Gottlieb, C.; Shepard, M.; Cossum, P.; John, E.;
Iqbal, S.; Garcia, A.; Lenz, H. J. Enzyme catalyzed therapeutic activation of NB1011 (N)
selectively targets thymidylate synthase (TS)-overexpressing tumor cells: Phase I results. J
Clin Oncol (Meeting Abstracts) 2004, 22, 3144.
32
44. Congiatu, C.; McGuigan, C.; Jiang, W. G.; Davies, G.; Mason, M. D. Naphthyl
phosphoramidate derivatives of BVdU as potential anticancer agents: design, synthesis
and biological evaluation. Nucleosides Nucleotides Nucleic Acids 2005, 24, 485-489.
45. Adjei, A. A. Pemetrexed (ALIMTA), a novel multitargeted antineoplastic agent.
Clin Cancer Res 2004, 10, 4276s-4280s.
46. Shih, C.; Habeck, L. L.; Mendelsohn, L. G.; Chen, V. J.; Schultz, R. M. Multiple
folate enzyme inhibition: mechanism of a novel pyrrolopyrimidine-based antifolate
LY231514 (MTA). Adv Enzyme Regul 1998, 38, 135-152.
47. Gangjee, A.; Qiu, Y.; Li, W.; Kisliuk, R. L. Potent dual thymidylate synthase and
dihydrofolate reductase inhibitors: classical and nonclassical 2-amino-4-oxo-5-arylthio-
substituted-6-methylthieno[2,3-d]pyrimidine antifolates. J Med Chem 2008, 51, 5789-
5797.
48. Gangjee, A.; Lin, X.; Kisliuk, R. L.; McGuire, J. J. Synthesis of N-{4-[(2,4-
diamino-5-methyl-4,7-dihydro-3H-pyrrolo[2,3-d]pyrimidin-6-yl)thio]benz oyl}-L-
glutamic acid and N-{4-[(2-amino-4-oxo-5-methyl-4,7-dihydro-3H-pyrrolo[2,3-
d]pyrimidin-6-yl)thio]be nzoyl}-L-glutamic acid as dual inhibitors of dihydrofolate
reductase and thymidylate synthase and as potential antitumor agents. J Med Chem 2005,
48, 7215-7222.
49. Gangjee, A.; Li, W.; Yang, J.; Kisliuk, R. L. Design, synthesis, and biological
evaluation of classical and nonclassical 2-amino-4-oxo-5-substituted-6-methylpyrrolo[3,2-
d]pyrimidines as dual thymidylate synthase and dihydrofolate reductase inhibitors. J Med
Chem 2008, 51, 68-76.
50. Liani, E.; Rothem, L.; Bunni, M. A.; Smith, C. A.; Jansen, G.; Assaraf, Y. G. Loss
of folylpoly-gamma-glutamate synthetase activity is a dominant mechanism of resistance
to polyglutamylation-dependent novel antifolates in multiple human leukemia sublines. Int
J Cancer 2003, 103, 587-599.
51. Schiffer, C. A.; Clifton, I. J.; Davisson, V. J.; Santi, D. V.; Stroud, R. M. Crystal
structure of human thymidylate synthase: a structural mechanism for guiding substrates
into the active site. Biochemistry 1995, 34, 16279-16287.
52. Phan, J.; Steadman, D. J.; Koli, S.; Ding, W. C.; Minor, W.; Dunlap, R. B.; Berger,
S. H.; Lebioda, L. Structure of human thymidylate synthase suggests advantages of
chemotherapy with noncompetitive inhibitors. J Biol Chem 2001, 276, 14170-14177.

33
53. Gibson, L. M.; Lovelace, L. L.; Lebioda, L. The R163K mutant of human
thymidylate synthase is stabilized in an active conformation: structural asymmetry and
reactivity of cysteine 195. Biochemistry 2008, 47, 4636-4643.
54. Lovelace, L. L.; Minor, W.; Lebioda, L. Structure of human thymidylate synthase
under low-salt conditions. Acta Crystallogr D Biol Crystallogr 2005, 61, 622-627.
55. Lovelace, L. L.; Gibson, L. M.; Lebioda, L. Cooperative inhibition of human
thymidylate synthase by mixtures of active site binding and allosteric inhibitors.
Biochemistry 2007, 46, 2823-2830.
56. Lovelace, L. L.; Johnson, S. R.; Gibson, L. M.; Bell, B. J.; Berger, S. H.; Lebioda,
L. Variants of human thymidylate synthase with loop 181-197 stabilized in the inactive
conformation. Protein Sci 2009, 18, 1628-1636.
57. Low, P. S.; Henne, W. A.; Doorneweerd, D. D. Discovery and development of
folic-acid-based receptor targeting for imaging and therapy of cancer and inflammatory
diseases. Acc Chem Res 2008, 41, 120-129.
58. Salazar, M. D.; Ratnam, M. The folate receptor: what does it promise in tissue-
targeted therapeutics? Cancer Metastasis Rev 2007, 26, 141-152.
59. Bavetsias, V.; Jackman, A. L. Use of cyclopenta[g]quinazoline derivatives for
treating cancer. WO patent 03/020300 A1, 2003.
60. Gibbs, D. D.; Theti, D. S.; Wood, N.; Green, M.; Raynaud, F.; Valenti, M.; Forster,
M. D.; Mitchell, F.; Bavetsias, V.; Henderson, E.; Jackman, A. L. BGC 945, a novel
tumor-selective thymidylate synthase inhibitor targeted to alpha-folate receptor-
overexpressing tumors. Cancer Res 2005, 65, 11721-11728.
61. Prasanna, V.; Bhattacharjya, S.; Balaram, P. Synthetic interface peptides as
inactivators of multimeric enzymes: inhibitory and conformational properties of three
fragments from Lactobacillus casei thymidylate synthase. Biochemistry 1998, 37, 6883-
6893.
62. Roehr, B. Fomivirsen approved for CMV retinitis. J Int Assoc Physicians AIDS
Care 1998, 4, 14-16.
63. Kurreck, J. RNA interference: from basic research to therapeutic applications.
Angew Chem Int Ed Engl 2009, 48, 1378-1398.
64. Berg, R. W.; Ferguso, P. J.; DeMoor, J. M.; Vincen, M. D.; Koropatnick, J. The
means to an end of tumor cell resistance to chemotherapeutic drugs targeting thymidylate
synthase: shoot the messenger. Curr Drug Targets 2002, 3, 297-309.
34
65. Berg, R. W.; Ferguson, P. J.; Vincent, M. D.; Koropatnick, D. J. A "combination
oligonucleotide" antisense strategy to downregulate thymidylate synthase and decrease
tumor cell growth and drug resistance. Cancer Gene Ther 2003, 10, 278-286.
66. DeMoor, J. M.; Vincent, M. D.; Collins, O. M.; Koropatnick, J. Antisense nucleic
acids targeted to the thymidylate synthase (TS) mRNA translation start site stimulate TS
gene transcription. Exp Cell Res 1998, 243, 11-21.
67. Normanno, N.; Bianco, C.; Damiano, V.; de Angelis, E.; Selvam, M. P.; Grassi,
M.; Magliulo, G.; Tortora, G.; Bianco, A. R.; Mendelsohn, J.; Salomon, D. S.; Ciardiello,
F. Growth inhibition of human colon carcinoma cells by combinations of anti-epidermal
growth factor-related growth factor antisense oligonucleotides. Clin Cancer Res 1996, 2,
601-609.
68. Dorsett, Y.; Tuschl, T. siRNAs: applications in functional genomics and potential
as therapeutics. Nat Rev Drug Discov 2004, 3, 318-329.
69. Schmitz, J. C.; Chen, T. M.; Chu, E. Small interfering double-stranded RNAs as
therapeutic molecules to restore chemosensitivity to thymidylate synthase inhibitor
compounds. Cancer Res 2004, 64, 1431-1435.
70. Shirasaki, T.; Maruya, S.; Mizukami, H.; Kakehata, S.; Kurotaki, H.; Yagihashi,
S.; Shinkawa, H. Effects of small interfering RNA targeting thymidylate synthase on
survival of ACC3 cells from salivary adenoid cystic carcinoma. BMC Cancer 2008, 8,
348.
71. Yang, Z.; Cloud, A.; Hughes, D.; Johnson, L. F. Stable inhibition of human
thymidylate synthase expression following retroviral introduction of an siRNA gene.
Cancer Gene Ther 2006, 13, 107-114.
72. Chu, E.; Voeller, D. M.; Morrison, P. F.; Jones, K. L.; Takechi, T.; Maley, G. F.;
Maley, F.; Allegra, C. J. The effect of reducing reagents on binding of thymidylate
synthase protein to thymidylate synthase messenger RNA. J Biol Chem 1994, 269, 20289-
20293.
73. Lin, X.; Liu, J.; Maley, F.; Chu, E. Role of cysteine amino acid residues on the
RNA binding activity of human thymidylate synthase. Nucleic Acids Res 2003, 31, 4882-
4887.
74. Voeller, D. M.; Zajac-Kaye, M.; Fisher, R. J.; Allegra, C. J. The identification of
thymidylate synthase peptide domains located in the interface region that bind thymidylate
synthase mRNA. Biochem Biophys Res Commun 2002, 297, 24-31.
35
75. Yan, S.; Niu, R.; Wang, Z.; Lin, X. In vitro selected peptides bind with
thymidylate synthase mRNA and inhibit its translation. Sci China C Life Sci 2007, 50,
630-636.
76. Chiba, T.; Yokosuka, O.; Fukai, K.; Kojima, H.; Tada, M.; Arai, M.; Imazeki, F.;
Saisho, H. Cell growth inhibition and gene expression induced by the histone deacetylase
inhibitor, trichostatin A, on human hepatoma cells. Oncology 2004, 66, 481-491.
77. Joseph, J.; Mudduluru, G.; Antony, S.; Vashistha, S.; Ajitkumar, P.;
Somasundaram, K. Expression profiling of sodium butyrate (NaB)-treated cells:
identification of regulation of genes related to cytokine signaling and cancer metastasis by
NaB. Oncogene 2004, 23, 6304-6315.
78. Glaser, K. B.; Staver, M. J.; Waring, J. F.; Stender, J.; Ulrich, R. G.; Davidsen, S.
K. Gene expression profiling of multiple histone deacetylase (HDAC) inhibitors: defining
a common gene set produced by HDAC inhibition in T24 and MDA carcinoma cell lines.
Mol Cancer Ther 2003, 2, 151-163.
79. Lee, J. H.; Park, J. H.; Jung, Y.; Kim, J. H.; Jong, H. S.; Kim, T. Y.; Bang, Y. J.
Histone deacetylase inhibitor enhances 5-fluorouracil cytotoxicity by down-regulating
thymidylate synthase in human cancer cells. Mol Cancer Ther 2006, 5, 3085-3095.
80. Fazzone, W.; Wilson, P. M.; Labonte, M. J.; Lenz, H. J.; Ladner, R. D. Histone
deacetylase inhibitors suppress thymidylate synthase gene expression and synergize with
the fluoropyrimidines in colon cancer cells. Int J Cancer 2009, 125, 463-473.
81. Tumber, A.; Collins, L. S.; Petersen, K. D.; Thougaard, A.; Christiansen, S. J.;
Dejligbjerg, M.; Jensen, P. B.; Sehested, M.; Ritchie, J. W. The histone deacetylase
inhibitor PXD101 synergises with 5-fluorouracil to inhibit colon cancer cell growth in
vitro and in vivo. Cancer Chemother Pharmacol 2007, 60, 275-283.
82. Phiel, C. J.; Zhang, F.; Huang, E. Y.; Guenther, M. G.; Lazar, M. A.; Klein, P. S.
Histone deacetylase is a direct target of valproic acid, a potent anticonvulsant, mood
stabilizer, and teratogen. J Biol Chem 2001, 276, 36734-36741.
83. Saito, A.; Yamashita, T.; Mariko, Y.; Nosaka, Y.; Tsuchiya, K.; Ando, T.; Suzuki,
T.; Tsuruo, T.; Nakanishi, O. A synthetic inhibitor of histone deacetylase, MS-27-275,
with marked in vivo antitumor activity against human tumors. Proc Natl Acad Sci U S A
1999, 96, 4592-4597.
84. Prasad, P.; Vasquez, H.; Das, C. M.; Gopalakrishnan, V.; Wolff, J. E. Histone
acetylation resulting in resistance to methotrexate in choroid plexus cells. J Neurooncol
2009, 91, 279-286.
36
85. Banerjee, D.; Schnieders, B.; Fu, J. Z.; Adhikari, D.; Zhao, S. C.; Bertino, J. R.
Role of E2F-1 in chemosensitivity. Cancer Res 1998, 58, 4292-4296.
86. Kasahara, M.; Takahashi, Y.; Nagata, T.; Asai, S.; Eguchi, T.; Ishii, Y.; Fujii, M.;
Ishikawa, K. Thymidylate synthase expression correlates closely with E2F1 expression in
colon cancer. Clin Cancer Res 2000, 6, 2707-2711.
87. Abe, S.; Kubota, T.; Otani, Y.; Furukawa, T.; Watanabe, M.; Kumai, K.; Kitajima,
M. UCN-01 (7-hydroxystaurosporine) enhances 5-fluorouracil cytotoxicity through down-
regulation of thymidylate synthetase messenger RNA. Jpn J Cancer Res 2000, 91, 1192-
1198.
88. Hsueh, C. T.; Kelsen, D.; Schwartz, G. K. UCN-01 suppresses thymidylate
synthase gene expression and enhances 5-fluorouracil-induced apoptosis in a sequence-
dependent manner. Clin Cancer Res 1998, 4, 2201-2206.
89. Giacinti, C.; Giordano, A. RB and cell cycle progression. Oncogene 2006, 25,
5220-5227.
90. Kim, H. P.; Yoon, Y. K.; Kim, J. W.; Han, S. W.; Hur, H. S.; Park, J.; Lee, J. H.;
Oh, D. Y.; Im, S. A.; Bang, Y. J.; Kim, T. Y. Lapatinib, a dual EGFR and HER2 tyrosine
kinase inhibitor, downregulates thymidylate synthase by inhibiting the nuclear
translocation of EGFR and HER2. PLoS One 2009, 4, e5933.
91. Okabe, T.; Okamoto, I.; Tsukioka, S.; Uchida, J.; Iwasa, T.; Yoshida, T.; Hatashita,
E.; Yamada, Y.; Satoh, T.; Tamura, K.; Fukuoka, M.; Nakagawa, K. Synergistic antitumor
effect of S-1 and the epidermal growth factor receptor inhibitor gefitinib in non-small cell
lung cancer cell lines: role of gefitinib-induced down-regulation of thymidylate synthase.
Mol Cancer Ther 2008, 7, 599-606.

37
Chapter 2. Methodological Introduction: Combining NMR and Computational Techniques for Knowledge-Based Modeling of Biomolecule-Ligand Complexes
Introduction In the work presented in this thesis, NMR spectroscopy and molecular modeling
were combined to characterise the interactions of biomolecules with small molecular
ligands. NMR is a powerful tool for assessing interactions between biomolecules and
various ligands. Depending on the experiments performed, information can be used at
various levels: 1) to test if the ligand binds or not 2) for chemical shift mapping to identify
the binding site 3) to determine a complete three dimensional structure of the complex.
Observation of intermolecular nuclear Overhauser effects (NOEs), is essential to
determine the structure of the complex. However, depending on the rate of exchange
between the bound and the free species, the signals from the interacting partners may or
may not be observable. In case of absence of intermolecular NOEs, it is nevertheless
possible to identify the binding site, estimate the docking mode and then use molecular
modeling methods to obtain a model of the complex. Such an approach was used to obtain
a model of the RNA-ligand complex described in chapters 3 and 4. NMR was also used to
follow the transition between active and inactive forms of TS protein, reported in chapter
5. In another project described in chapter 6, the effect of sequence and electrostatics on the
activity of thymidylate synthase was studied by in silico methods. In the current chapter, a
brief introduction to the various aspects of NMR spectroscopy and molecular modeling,
relevant to the reported work will be described.
NMR spectroscopy Nuclear magnetic resonance (NMR) is a phenomenon which occurs when the
nuclei with non zero spin are immersed in a static magnetic field and exposed to a second
oscillating magnetic field such as radiofrequency pulses.1 Let us consider the case of the
simplest nucleus- a proton. Since a proton has a charge as well as a spin, it behaves like a
small magnet. When protons are placed in an external magnetic field B0, their magnetic

38
moment vector aligns with the external field in parallel or anti-parallel fashion,
corresponding to low and high energy states respectively. The ratio of the spins in the
lower energy level, N-, to those in the upper level, N+ is given by Boltzmann statistics:
N+/N- = e-E/kT
where E is the energy difference between the spin states; k is Boltzmann's constant,
1.3805x10⁻²³ J/Kelvin; and T is the temperature in Kelvin. At equilibrium the net
magnetisation vector is aligned parallel to B0. Additionally the spins precess about the
direction of B0 with a frequency called Larmor precession frequency ω0 such that
ω0 = -γB0
where γ is the intrinsic property of the nuclei called the magnetogyric ratio.2
The system can be perturbed by applying radiofrequency pulses whose frequency
match the Larmor frequency of the nuclei. Such perturbations induce transverse
magnetisation which can be recorded leading to the NMR signal.
NMR spectroscopy not only enables the determination of the 3D structures of large
biomolecules such as proteins or nucleic acids, but also offers insights into the
conformational dynamics that are in many cases of primary functional relevance.
Furthermore, NMR spectroscopy can be used to study molecular interactions, both
macromolecular and with small ligands. These features make it a method of choice for
many structural biology and drug discovery projects. In the early days of structure
determination by NMR spectroscopy, experimental restraints were essentially limited to
NOEs and scalar coupling values, which respectively provide distances and dihedral
angles. During the years, new restraints have been introduced into structure calculations
(angles obtained from cross-correlation rates), residual dipolar coupling (RDC) values,
paramagnetic relaxation enhancements (PRE) etc. NMR spectroscopy was used in this
thesis for the characterisation of RNA-ligand interactions. Therefore the following
discussion will be limited to the experiments relevant to work reported here.
Spectra of RNA Identity and quantification of base pairs
The imino protons in U (H3) and G (H1) are attached to nitrogens flanked by two
electronegative atoms (Fig 2.1), and are therefore highly de-shielded. This effect makes
them resonate at a distinctly higher frequency (10-15 ppm) as compared to all other
protons found in the RNA. In single stranded oligonucleotides, the imino protons are in
exchange with the solvent and are thus not observed. However, in a base-paired double

39
helix, these protons are involved in hydrogen bonding and are therefore protected from the
solvent. This permits the observation of their resonance signals for the base paired regions.
By counting the number of imino resonances, it is essentially possible to count the number
of base pairs. Imino protons in Watson-Crick base pairs (Fig 2.1a, b) are generally
observed between 12-15 ppm, the U in AU being comparatively downfield shifted than G
in GC pair. Instead, the non-Watson-Crick pairs (e.g Fig 2.1c) have upfield chemical shifts
between 10-12 ppm.3 The hydrogen bonding pattern and thus the base pairing in RNA can
be determined by sequentially assigning the imino-imino and imino-amino contacts in 2D
NOESY experiments.
G U
N
N
NO
OHHO
O
O
N
H
HH
NN
O
O
H
1
3
1
3
OOHO
HO
Fig 2.1. The Watson-Crick base pairs AU and GC and the wobble base pair GU. The hydrogen bonds are represented as dashed lines between the bases.
Assignment of aromatic-anomeric and H5-H6 correlations in A form RNA helix
In A-form helical geometry, the anomeric sugar proton H1' can typically make
NOE contacts with the aromatic H6/H8 of its own residue and to that of the succeeding 3'
residue (Fig 2.2a). Therefore in a 2D homonuclear NOESY, these correlations can be used
to conduct the so called sequential aromatic-anomeric walk for chemical shift
assignments. The walk is generally disrupted in the non A-form helical regions such as
mismatches, bulges, loops etc, and can thus be used as an indicator of geometry and
stacking in RNA. H5-H6 correlations (Fig 2.2b) for pyrimidines are another set of strong
NOE contacts that can be observed in the same region of the spectra. However, these can
N
N
N
O
N
O H
HHOH
HO
O N
O
N
OHO
HO
O
HH
1 1 3
G C

40
be easily identified by recording experiments such as TOCSY to identify the scalar
couplings.
a b
Fig 2.2. a) Aromatic anomeric NOE contacts observed for an A form helix. b) H5-H6 correlations observable for pyirmidines.
Interaction of two molecules: chemical exchange Chemical shifts are sensitive to both the chemistry and the environment of the
nucleus. The environment of the nucleus in free state differs from that in the bound state
and is generally reflected as changes in chemical shifts. Additionally, the NMR parameters
for the two states are strongly influenced by the rate of exchange between the two states.
Such a process in which a nucleus exchanges between two or more environments in which
its NMR parameters, e.g. chemical shift, differ is referred to as chemical exchange.4
In solution, the free and the bound states exist in equilibrium:
where M represents the biomolecule, L the ligand, kon and koff are respectively the rates of
association and dissociation of the complex. The rate of exchange of the system,5 kex is
defined as:
kex = kon [L] + koff
Depending on the interconversion rates, the exchange is classified into fast,
intermediate and slow on the chemical shift timescale (Fig 2.3).
M+L ML
kon
koff
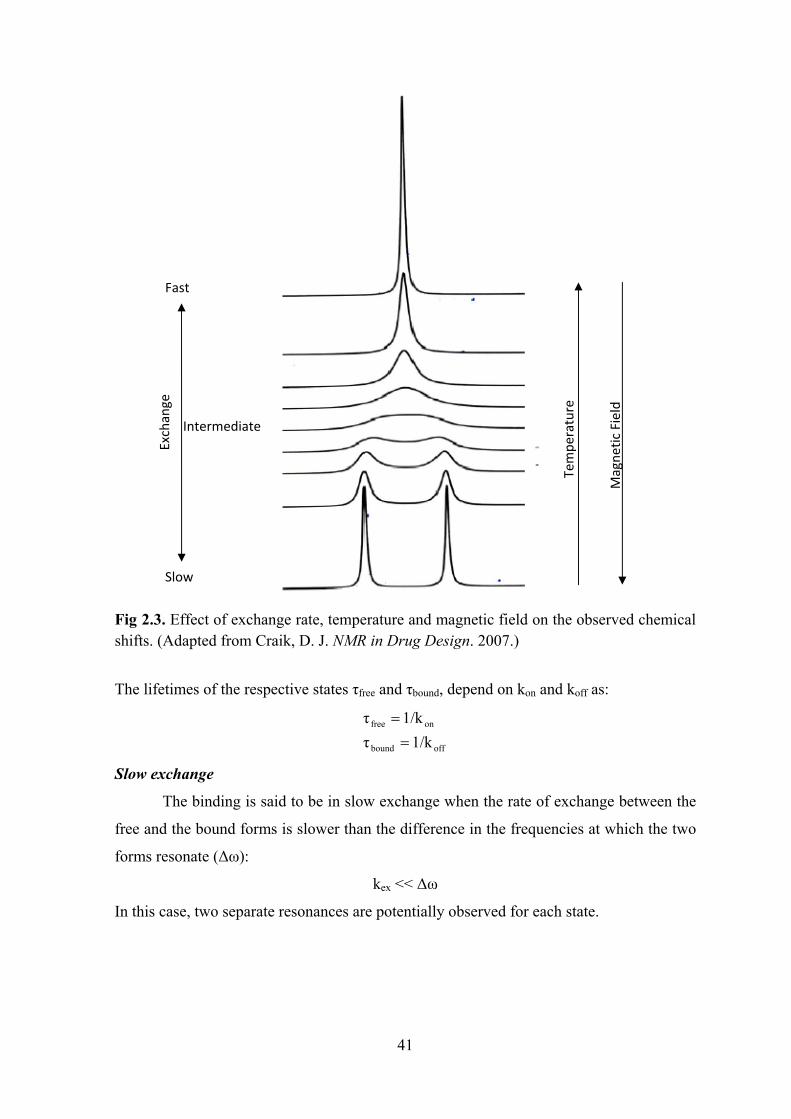
41
Fig 2.3. Effect of exchange rate, temperature and magnetic field on the observed chemical shifts. (Adapted from Craik, D. J. NMR in Drug Design. 2007.)
The lifetimes of the respective states τfree and τbound, depend on kon and koff as:
Slow exchange
The binding is said to be in slow exchange when the rate of exchange between the
free and the bound forms is slower than the difference in the frequencies at which the two
forms resonate (Δω):
kex << Δω
In this case, two separate resonances are potentially observed for each state.
offbound
onfree
1/kτ1/kτ=
=
Exchange
Intermediate
Fast
Slow
Magne
tic Field
Tempe
rature
42
Fast Exchange
The binding is said to be in fast exchange when the rate of exchange between the
free and the bound forms is faster than the difference in frequencies at which they
resonate:
kex >> Δω
In this case a single signal whose chemical shift (Δδobs) is a weighted sum of the chemical
shifts of the two individual states is observed.
Δδobs = ffδf+fbδb
ff+fb=1
where ff, fb are the free and the bound mole fractions and δf, δb are the respective
resonance frequencies.
Intermediate exchange
As the name suggests the exchange rate in between fast and slow exchange is
referred to as intermediate exchange. It could lead to more complicated lineshapes which
can be expressed as sums of two phase- and frequency-shifted Lorentzians. The linewidths
in intermediate exchange regime might get broadened beyond observation. One of the
parameters that affect the rate of exchange between the two states is the temperature;
higher temperature makes exchange faster whereas lower temperatures induce slower
exchange. The temperature at which slow and fast exchange meet is called the coalescence
temperature. Thus the temperature at which the spectra is recorded can be modulated to
shift the exchange regime away from the intermediate exchange and thereby hopefully
enabling the signals to be observed.
The frequency at which the signals from the two states merge is called the
coalescence rate kc and is given by:
kc = 2.22 Δω
Since the difference in the resonance frequencies Δω depends on the magnetic field, this
parameter can also be modulated to change the observed line shape
Mapping the binding interface One way for determining the binding interface on the ligand and receptor interface
is based on intermolecular NOEs. NOEs between the ligand and the receptor are generally
observed when the complexes are relatively tight (Kd 10 μM or tighter).4 However, ligands
in the initial stages of drug design and development are generally weak binders, which

43
may not show any intermolecular NOEs. In such cases, various alternative techniques such
as chemical shift perturbation mapping or mapping with paramagnetics can be employed.
Chemical shift perturbation mapping
The ligand-receptor interaction causes environmental changes at the interface,
resulting in chemical shift perturbations in this area.6 In absence of other effects such as
conformational change, the magnitude of the perturbation depends on the vicinity of the
observed nuclei to the interface. In cases where the interaction leads to conformational
change in the entire receptor, all signals are perturbed and mapping of the binding site is
not feasible. Shift perturbation measurements yield only the locations of the interfaces on
the individual binding partners, whereas the mode of interaction remains undeciphered. To
resolve the binding mode, the results from NMR shift mapping may be combined with
distance constraints obtained from other NMR experiments, FRET, or cross-linking.
Another possibility is to use the NMR defined interface areas to direct computational
modeling e.g. ‘soft docking’ which allow a certain degree of overlap of atoms at the
interface thereby accounting the flexibility of the protein side chains.7,8
Mapping with paramagnetic effects
Inert and water soluble paramagnetic compounds such as the Gadolinium complex
or nitroxyl radicals can be added to the sample of biomolecule to estimate the solvent
exposed surface. The overall relaxation enhancement of a specific nucleus is the combined
effect of the entire paramagnetic environment.4 The interaction between an NMR-active
nucleus and an inert paramagnetic nucleus is described by the ‘second sphere interaction
model’. Accordingly, the relaxation enhancement (PRE) by a single paramagnetic probe is
given by 1/r6 dependence, where r is the distance between the paramagnetic centre and the
observed nucleus.9 For a given surface, integration over a paramagnetic environment
yields a 1/r3 dependency of the PRE, where r is the distance from the surface. However, if
only one paramagnetic molecule can get close to the nucleus of interest, e.g. in a cavity,
the relaxation enhancement decays with 1/r6. Thus the PRE vs insertion depth dependence
is proportional to r-3 to r-6. This potential of paramagnetic compounds to relax the nuclear
spins in a distance dependent manner has been used to explore the receptor surfaces and to
determine the buried or exposed surfaces in the receptor-ligand complex. Fig 2.4 indicates
the physical basis for these experiments.

44
Fig 2.4. Physical representation for use of solvent PREs to identify the receptor-ligand interface.
Molecular Modeling Modeling molecular interactions Molecular interactions are driven by the cumulative effect of contributions from
various favourable and unfavourable interactions, each of which need to be suitably
represented while modeling the receptor-ligand complexes. Some of the forces which
contribute to the stablity of the complex will be discussed below:
van der Waals interactions
Shape complementarity between the ligand and receptor is known to play a crucial
role in the ligand-receptor interaction. The apo structures of the interacting molecules may
already be complementary to each other or the complementarities might be induced upon
interaction or by conformational selection. van der Waals interactions are of key
importance in defining shape complementarity. These interactions have an attractive
component called the London dispersion forces, arising from instantaneous fluctuations
caused in the electron clouds as two atoms approach each other. The second contributor to
the van der Waals interactions are the repulsive forces between the nuclei and the electron
clouds.10
The best known empirical function to model van der Waals potential is the
Lennard-Jones function:
612)(rB
rArE LJ −=

45
where E(r)LJ is the Lennard-Jones energy when the two atoms are separated by a distance
r (Fig 2.5). The parameters A and C depend on the type of atoms; A= 4dσ12 and B= 4dσ6,
where d is the depth of the Lennard-Jones curve and σ is the value of r where E(r)LJ=0.
The attractive part of the Lennard-Jones potential varies as r-6 (representing induced
dipole-dipole interactions) and the repulsive part varies as r-12. For computational
convenience, Lennard-Jones energies and forces are often computed only for pairs of
atoms within a defined “cutoff” radius of about 10Å.11
Fig 2.5. Plot of Lennard-Jones energy (E) vs distance r. (Adapted from www.chemie.uni-kl.de)
Electrostatics
Electrostatic complementarity is another crucial parameter for molecular
interactions and also for molecular recognition. Electrostatic interactions are long range
interactions, varying with distance as r-1. In addition to the net charges, molecules are
characterised by their charge distribution. A common way to represent charge distribution
is by assigning partial charges to every atom of the molecule. The electrostatic interaction
can then be calculated using Coulomb’s law:
where qi, qj are the partial atomic charges on atoms i and j separated by a distance rij in a
medium of dielectric constant ε (ε = ε0εr, where ε0 is the dielectric constant in free space
and εr is the relative dielectric constant). The dielectric constant describes the permittivity
of the medium to electric flux and thus determines strength of the electrostatic
interactions.10
If the solvent molecules and ions are modelled explicitly, then ε is usually set to 1.
However, when the solvent is treated implicitly, an appropriate value for the solvent
∑=ij ij
jiel r
qqE
πε4

46
dielectric can be calculated (ε = ε0εr, where ε0 is the dielectric constant in free space) to
reproduce the damping effect that the solvent has on the interaction. In an external
electrostatic field, dipolar water molecules can reorient freely, resulting in a high εr of
around 80. On the other hand, dipolar groups in biomolecules such as proteins can be
considered frozen into a hydrogen-bonded lattice and therefore unable to reorient,
resulting in lower relative dielectric constant than water.11 Typical assignments of the εr
for proteins range from 2 to 20. An alternative approach is the so called distance
dependent dielectric model, whereby, the value for dielectric is made dependent upon the
separation of the charged species. Many models have an approximately sigmoidal shape in
which the relative permittivity is low at short distances (ε = 1 when r = 0) and then
gradually increases towards the bulk value at long distances.
Poisson-Boltzmann equation is frequently applied to model the electrostatic
properties of macromolecules such as proteins and DNA. The Poisson equation by itself
relates the potential within a medium of uniform dielectric constant ε to charge density
ρ, and can be adapted to a heterogeneous dielectric environment as in the case of protein
immersed in water.
Mobile ions e.g. Na+ are frequently added to simulated system to compensate for
the net charge of the solute. These ions can redistribute in the solution in response to the
electric potential, however their congregation at locations of extreme electrostatic
potentials is prevented by repulsive interactions with other ions and inherent thermal
nature.10 The ion distribution can be described by the Boltzmann equation:
where, n(r) is the density of ions at a particular location r, N is the bulk density, and V(r) is
the energy change to bring the ion from infinity to position r. On incorporating the
Boltzmann equation for ions into the Poisson equation and taking only the first term of the
subsequent Taylor series expansion, the linearised Poisson-Boltzmann equation can be
obtained.
where к’ is derived from the Debye-Hückel length. Poisson-Boltzmann equation is usually
solved using finite difference, finite element or multigrid methods by mapping the
solventsoluter
rrr
ρρρ
πρφε
+=
−=∇⋅∇
)(
),(4)()(
)/)(exp()( TkrVNrn B−=
)(4)(')()( rrrr πρφκφε −=−∇⋅∇

47
molecules onto a three dimensional cubic grid. To perform the finite difference Poisson-
Boltzmann calculation, it is important to assign values for electrostatic potential, charge
density, ionic strength and dielectric constant at the grid points. The choice grid size is
crucial: the finer the lattice, the more accurate the results, although more computer time is
required. A balance of accuracy and efficiency can be achieved by using electrostatic
focusing, i.e. by embedding a small grid with a fine grid spacing encompassing the region
of interest in a larger grid with a larger grid spacing; the potential at the boundary of the
small grid is computed with the large grid. An alternative approach to estimate the
electrostatic contribution is the Generalised Born method.12
The electrostatic interactions in explicit solvent simulations are usually modelled
using the particle-mesh Ewald (PME) procedure. Ewald summation is a method to
efficiently calculate the infinite range Coulomb interactions under periodic boundary
conditions and PME is a modification to accelerate the Ewald reciprocal sum to near linear
scaling, using the three dimensional fast Fourier transform.13
Hydrophobic interactions
Water forms ordered cage like structures around the exposed non-polar
hydrophobic surfaces. The hydrophobic interactions between non-polar surfaces minimise
the exposure to the solvent, thereby reducing the local restructuring of water and thus
increasing entropy. The favourable interactions among non-polar hydrophobic groups in
an aqueous environment are referred to as hydrophobic interactions. Such interactions are
considered to be a driving force for protein and nucleic acid folding,, and to make major
contributions in their structural stability. While usually hydrogen bonds offer selectivity,
hydrophobic interactions are the key contributors to the affinity in ligand receptor binding.
Hydrophobic binding is worth a minimum of 28 cal-Å2 mol-1, which is equivalent to 0.68
kcal mol-1 per methyl group.14 Failure to match key hydrophobic areas with appropriate
ligand moieties can have a severe impact on binding affinity.15 In simulations with explicit
water molecules, the hydrophobic interactions are not explicitly incorporated, rather these
must result from a complicated interplay of Lennard-Jones and electrostatic interactions
between the atoms of the biomolecules and the surrounding water molecules.11 On the
other hand, in the implicit solvent simulations, empirical functions based on the buried
solvent accessible surface in the complex are used to estimate the extent of these
interactions.

48
Hydrogen bonding
Hydrogen bonds are specific, short-range, non-bonded interactions occurring
between the hydrogen of a polar group (hydrogen bond donor) e.g. OH, NH, SH, and a
strongly electronegative atom (hydrogen bond acceptor) e.g. O, N, F. Weak hydrogen
bonds may also be formed by CH groups. Owing to their sufficiently strong and
directional character, hydrogen bonds offer selectivity to the receptor-ligand interactions.
Energetically, they are stronger than the van der Waals interactions but weaker than the
covalent bonds. This intermediate range (-1 to -40 kcal/mol) allows hydrogen bonds to
both associate and dissociate quickly permitting specificity of recognition within short
time spans, an essential feature in biological reactions and in drug-receptor interactions.16
It has ben noticed that hydrogen bonds are rarely observed as isolated interactions;
rather they are strongly influenced by additional polar atoms in the vicinity. Hydrogen
bonds can mutually reinforce each other in networks.15 Geometric analyses have revealed
that the median bond length of hydrogen bonds is shorter than the sum of van der Waals
radii of the donor and the acceptor heavy atoms. The angular preferences of hydrogen
bonds are also quite pronounced. The angle donor-hydrogen--acceptor is generally above
150°.
Simulating molecular interactions: Molecular Dynamics Molecular dynamics simulations have been widely used to study the structure,
dynamics and thermodynamics of biological macromolecules and their complexes.
Newton’s equations of motions are integrated to generate a trajectory specifying the
positions and velocities of simulated particles with respect to time. One of the most widely
used algorithms for integration of the equations is the Verlet algorithm, whereby, the
positions and accelerations at time t and the positions at the previous step t-δt, are used to
calculate the positions at the next step t+δt. As can be noticed, velocities are not explicitly
included in this calculation. The variations of the algorithm such as leap-frog, velocity-
Verlet or the Beeman’s algorithms on the other hand explicitly calculate the velocity terms
during the integrations.10 The program used for the simulations reported in this thesis,
Sander uses the velocity-Verlet algorithm which can be described as:
]()([21)()(
)(21)()()( 2
ttatattvttv
tatttvtrttr
δδδ
δδδ
+++=+
++=+

49
where r(t) and r(t+δt), are the positions at time t and t+ δt respectively. Similarly, v(t),
v(t+δt) represent velocities and a(t) and a(t+δt) represent acceleration at respective time
points.
The frequency at which the equations are integrated is referred to as the time-step
and should be chosen such that problems leading to destabilising the system can be
avoided. Typically, the time step should be smaller than the fastest frequency motions in
the system. Usually these are the vibrational motions of the bonds involving hydrogens,
and so the typical timestep would be 1 femtosecond. However, algorithms such as SHAKE
are regularly employed to constrain the bonds involving hydrogens, consequently
permitting larger timesteps of upto 2 femtoseconds.
The forces on the atoms are calculated according to molecular mechanics energy
function called the force field. The forces on the simulated system are obtained from the
defined parameters for the bond lengths, angles, dihedrals and atom types in the system
and calculating the energy by summing the various components. An example of the basic
structure of the AMBER force field energy is given in the following set of equations:
∑
∑
∑
∑
∑
∑
<
<
=
−=
−=
−+=
−=
−=
+++++=
atoms
jiijjiticelectrosta
atoms
jiijijijijLJ
impropersimproper
torsionsntorsion
anglesbend
bondsbstretch
ticelectrostaLJimpropertorsionbendstretchFF
rqqE
rBrAE
KE
nKE
KE
bbKE
EEEEEEE
ε
ωω
φφ
θθ
ω
θ
/
)/()/(
)(
]cos[1)(2/(
)(
)(
612
20
0
20
20
where K terms represent the respective force constants, b, b0 are the current and reference
bond lengths respectively, θ, θ0 are the current and reference bond angles respectively; n is
the multiplicity representing the number of energy minimas when the torsion angle is
rotated by 360°, , 0 are the current and the reference torsion angles respectively, ω, ω0
are the current and reference improper torsion angles. The bonded terms i.e. Estretch, Ebend,
Etorsion and Eimproper scale according to the total number of atoms N, whereas the non-
bonded terms ELJ and Eelectrostatic scale according to N2.
50
The thermodynamic parameters during a molecular dynamics simulation are
usually modelled using one of the following three ensemble systems: microcanonical
ensemble also called the NVE ensemble where the number of particles N, total volume V
and the total energy E of the system are maintained constant, canonical ensemble also
called the NVT ensemble where N, V and temperature T are held constant, or the
isothermal-isobaric ensemble also called the NPT ensemble where N, pressure P and T are
maintained constant.
References
1. Hornak, J. P. The Basics of NMR. In 1997.
2. Dybowski, C.; Lichter, R. L. NMR spectroscopy techniques. 1987.
3. Fürtig, B.; Richter, C.; Wöhnert, J.; Schwalbe, H. NMR Spectroscopy of RNA.
ChemBioChem 2003, 4, 936-962.
4. Craik, D. J. NMR in Drug Design. 2007.
5. Corsini, L. On the role of UHM Domains in pre-mRNA splicing. Jonann Wolfgang
Goethe University, 2008.
6. Clarkson, J.; Campbell, I. D. Studies of protein-ligand interactions by NMR.
Biochem Soc Trans 2003, 31, 1006-1009.
7. Cherfils, J.; Janin, J. Protein docking algorithms: simulating molecular recognition.
Current Opinion in Structural Biology 1993, 3, 265-269.
8. Morelli, X. J.; Palma, P. N.; Guerlesquin, F.; Rigby, A. C. A novel approach for
assesing macromolecular complexes combining soft-docking calculations with NMR data.
Protein Science 2001, 10, 2131-2137.
9. Madl, T.; Bermel, W.; Zangger, K. Use of relaxation enhancements in a
paramagnetic environment for the structure determination of proteins using NMR
spectroscopy. Angew Chem Int Ed Engl 2009, 48, 8259-8262.
10. Leach, A. R. Molecular Modelling principles and applications. In Pearson
Education Limited: 2001.
11. Feldman-Salit, A. Computation and Moldeilng of Molecular Recognition: The
Cysteine Synthase Complex. Ruperto Carola University, Heidelberg, 2010.
12. Still, W. C.; Tempczyk, A.; Hawley, R. C.; Hendrickson, T. Semianalytical
treatment of solvation for molecular mechanics and dynamics. Journal of the American
Chemical Society 1990, 112, 6127-6129.

51
13. Case, D. A.; Cheatham, T. E., 3rd; Darden, T.; Gohlke, H.; Luo, R.; Merz, K. M.,
Jr.; Onufriev, A.; Simmerling, C.; Wang, B.; Woods, R. J. The Amber biomolecular
simulation programs. J Comput Chem 2005, 26, 1668-1688.
14. Davis, A. M.; Teague, S. J. Hydrogen Bonding, Hydrophobic Interactions, and
Failure of the Rigid Receptor Hypothesis. Angewandte Chemie International Edition
1999, 38, 736-749.
15. Bissantz, C.; Kuhn, B.; Stahl, M. A medicinal chemist's guide to molecular
interactions. J Med Chem 2010, 53, 5061-5084.
16. Desiraju, G. R.; Steiner, T. The weak hydrogen bond:in structural chemistry and
biology. In Clarendon Press: 1999.

52

53
Chapter 3. Interactions of Thymidylate Synthase mRNA Like Constructs with HOECHST 33258
Introduction As introduced in chapter 1, a 36 nucleotide sequence (75-110, Site-I) from the TS-
mRNA has been identified as one of the important regions for binding to the TS protein.
The sequence is predicted to adopt a stem-heptaloop structure,1 such that the stem contains
a CC mismatch motif. This predicted structure for Site-1 RNA has triggered studies to find
molecules that could interact with the RNA selectively and inhibit its translation. The first
of these studies were performed by the group of Robert R. Rando.2,3 Based on the
predicted structure of Site 1 (Fig 3.1a) they designed new RNA constructs, by deleting the
unpaired bases, and instead adding two additional GC base pairs at the base of the stem to
stabilize the structure (Fig 3.1b). The 14 sequences used varied at the base pairs in the
stem (Table 3.1). They found by fluorescence and RNase CL3 footprinting assays that the
tested aminoglycosides2 and another fluorescent dye HOECHST 33258 (HT)3 (Fig 3.2a)
bound close to the CC mismatch in the structure; probably the presence of the mismatch
was an essential requirement for the binding. However, further structural details were not
elucidated in the published data. Many structures of the aminoglycoside- RNA complexes
have been solved.4,5 However, not much is known about the RNA-HT binding.
Fig 3.1. The secondary structure predictions for RNA. a) Site-1, b&c) The two alternative motifs predicted for the 14 sequences reported in (Cho, J.; Rando, R. R. Specific binding of Hoechst 33258 to site 1 thymidylate synthase mRNA. Nucleic Acids Res 2000, 28, 2158-2163.) The sequence of TS1 has been used as a representative for this figure.

54
TS1 r(GGG CCC GCC GCG CCA UGC CUG UGG CCG GCC C)
TS2 r(GGG CCU GCC GCG CCA UGC CUG UGG CUG GCC C)
TS3 r(GGG CCA GCC GCG CCA UGC CUG UGG CAG GCC C)
TS4 r(GGG CCG GCC GCG CCA UGC CUG UGG CGG GCC C)
TS5 r(GGG CCC GCC GCG CCA UGC CUG UGG CGG GCC C)
TS6 r(GGG CCC ACC GCG CCA UGC CUG UGG UCG GCC C)
TS7 r(GGG CCC CCC GCG CCA UGC CUG UGG GCG GCC C)
TS8 r(GGG CCC CCC GCG CCA UGC CUG UGG CCG GCC C)
TS9 r(GGG CCC GAC GCG CCA UGC CUG UGU CCG GCC C)
TS10 r(GGG CCC GCC GCG CCA UGC CUG UGC CCG GCC C)
TS11 r(GGG CCC GCA GCG CCA UGC CUG UUG CCG GCC C)
TS12 r(GGG CCC GCC ACG CCA UGC CUG UGG CCG GCC C)
TS13 r(GGG CCC GCC GCG CCA UGC CUG CGG CCG GCC C)
TS14 r(GGG CCC GCC GCG CCA UGC CCG UGG CCG GCC C)
Table 3.1. Sequences of the 14 RNA constructs used in the reported study by Cho and Rando, TS1 resembles the orginal Site1 sequence in the stem-loop region, except for the two additional base pairs at the base of the stem. The other sequences are mutants of TS1, with the mutated nucleotide highlighted in red.
a b
Fig 3.2. a) The structure of Hoechst 33258. b) Crystal structure of HOECHST 33258 (sticks) complexed in the minor groove of DNA (surface representation) (PDB ID 264D, Vega, M.C.; Three-dimensional crystal structure of the A-tract DNA dodecamer d(CGCAAATTTGCG) complexed with the minor-groove-binding drug Hoechst 33258. Eur J Biochem 1994, 222, 721-726.)

55
HT is a B-DNA minor groove binder (Fig 3.2b), regularly used in cell biology to
quantify the DNA. However, since the structure of the grooves in the A-helical RNA is
very different from the B-helical DNA, it is expected that the HT-RNA binding would be
dissimilar to HT-DNA interaction. Moreover the reason behind the requirement of the
mismatch is not elucidated. Thus we used combination of the modeling and NMR studies
to analyse the RNA-HT binding.
Materials and Methods Computational modeling 2D Structure Prediction: Mfold6 was used to predict the secondary structure of the
RNAs. Based on dynamic programming algorithm, Mfold exhaustively evaluates all the
feasible structures for the given RNA and calculates the one with the minimum free
energy.
3D Structure Prediction: Fragment assembly of RNA (FARNA),7 was used for
predicting 3D structures of the RNA. FARNA works on a principle similar to ROSETTA8
for proteins, whereby suitable fragments of small stretches of RNA are identified from a
fragment library and iteratively combined based on an energy function to identify a low
energy model for the RNA. The method is reported to work well for oligomers upto 40
nucleotides long.
Docking: Autodock 49 was used for docking HT to RNA. Autodock uses
Lamarckian genetic algorithm for global search and a local search algorithm to identify the
docking poses. The semi-empirical energy function comprises of van der Waals, hydrogen
bonding, electrostatic interactions and torsional terms and a solvation term based on
distance dependent dielectric.10 Published studies to identify the most suitable program for
docking ligands to RNA reveal that Autodock reproduces the crystallographic binding
mode much more often than Dock, but comparable to Autodock-Vina. Autodock-Vina is a
relatively new program and has recently been reported to outperform Autodock in terms of
speed and accuracy.11,12
The RNA and the ligand were assigned Gasteiger charges. A grid of size
107x83x127, with a default spacing of 0.375Å, was defined to use the complete RNA as
possible binding region, using the autogrid facility in Autodock package. The Lamarckian
genetic algorithm was run with population size of 15,000 individuals for a maximum of
27,000 generations. A total of 256 runs with maximum of 25,000,000 energy evaluations
were performed.

56
Molecular dynamics: All MD simulations were performed under periodic
boundary conditions using the SANDER module of AMBER813 with the AMBER ff99
force field. Water molecules were modeled with the TIP3P14 potential, and the system was
neutralized with Na+ ions. Electrostatic interactions were computed using the particle
mesh Ewald method for which the direct sum cutoff was set to 9 Å. Non-bonded
interactions were also cutoff at 9 Å. Bond lengths involving hydrogens were constrained
to their equilibrium values using the SHAKE algorithm.15 Newton’s equations of motion
were integrated every 2 femtoseconds. Variant of the 10 step protocol16,17 (Appendix1-I)
was used to minimize, heat and equilibrate the system. throughout the production run. All
simulations were performed with the NPT ensemble. A constant temperature of 300K was
maintained by weak coupling to an external bath18 with a time constant of 5 ps. The
pressure was maintained at 1 atm by isoptropic position scaling.
HT is a relatively small organic molecule, and unlike proteins, nucleic acids and
carbohydrates, the pre-calculated force field parameters for HT are not present in the
AMBER forcefield. Thus appropriate parameters need to be calculated. The module called
Antechamber in AMBER package was used for this purpose. Antechamber is a set of
auxiliary programs for molecular mechanic (MM) studies that performs the following
tasks, (1) recognizing the atom type, (2) recognizing bond type, (3) judging the atomic
equivalence, (4) generating residue topology file, (5) finding missing force field
parameters and supplying reasonable and similar substitutes (http://ambermd.org). The
am1bcc19 charges which are designed to reproduce the quantum mechanical electrostatic
potential at the HF/6-31G* level of theory were assigned to the atoms.
Sample preparation HT was bought from Sigma-Aldrich, under the compound ID B1155 with 98%
purity. Solubility of HT in various buffers – 10 mM Sodium phospate pH 6.4, 10 mM
Citrate pH 6.4, 10 mM Succinate pH 6.4, 10 mM Carbonate pH 6.4, 10 mM MES pH 6.4,
10 mM Triethanolamine (TEA) at pH 7.3 – was tested to identify the best buffer for
titrations. It was observed that carbonate, MES and TEA buffers were suitable to dissolve
HT, but, carbonate was the only buffer in which the RNA-ligand complex was stable at
higher concentrations required for NMR. To get maximum information from NMR of
RNA, it is required that in addition to recording the NMR data with 90% H2O as the
solvent, experiments should also be recorded with 100% 2H2O as the solvent. To our
surprise, the carbonate buffer prepared in 2H2O led to the formation of yellow deposits in

57
the 1.5 ml tube. Additionally the dispersion of the RNA signals in the NMR spectra
recorded in 2H2O based carbonate buffer was adversely affected. Thus it was decided to
not use any buffers, and instead prepare the samples in H2O or 2H2O and maintain the pH
by titrating with dilute HCl or NaOH.
The RNAs used for experiments i.e. TS1, TS6, TS14 (Table 3.1) and 11mer
(r(GUG GCC GCC GC)), were bought from Biospring GmbH, Frankfurt. To remove salt
and other impurities from the synthesis, all samples were dialysed against 1M NaCl, 500
mM NaCl and twice without NaCl. To prepare NMR samples the RNAs were dissolved to
the desired concentration in water and adjusted to pH 6.4. The sample was then heated to
95 °C for 4 min and immediately transferred to ice for 15 min. This procedure disfavours
the formation of dimers or aggregates and ensures the preferable formation of monomeric
hairpin RNA.
NMR data acquisition For titration experiments, 500 µM of the desired RNA sample was dissolved in
water and its pH was adjusted to 6.4. The HT to be added was dissolved in water as well
and its pH was adjusted to the same value. RNA chemical shift perturbations upon HT
addition were monitored using a 1D 1H experiments were recorded at increasing HT/RNA
ratios. The 1D 1H experiments were performed on 750 MHz Bruker spectrometer, while
the 2D 1H-1H COSY and 1H-1H NOESY experiments were performed at 600 MHz Bruker
spectrometer with a cryogenically cooled probe.
Results and Discussion There are four known ways in which a molecule can bind to helical regions of
nucleic acids, 1) major groove binding, 2) minor groove binding, 3) intercalation and 4)
mixed binding. Intercalators are generally flat aromatic molecules, smaller in size than HT,
or with two distinct small aromatic moieties linked by a flexible linker. The structure of
HT does not seem favourable for the intercalative binding mode; however, it is reported to
adopt partially intercalative mode especially in GC rich regions in DNA20-22 and at the
UUU bulge in the HIV RNA,23,24 though no structures are available for either. For the TS
like RNA-HT complex structural elucidation, it was already known that the binding site is
close to the CC mismatch,3 but, selection between preferences for major or minor groove
binding versus intercalation required further data.
58
Selection of the RNA construct Structure predictions
The reported 14 RNA sequences used to study HT binding3 (Table 3.1) were
subjected to Mfold6 for secondary structure predictions. For the sequences TS1-TS13, two
structural motifs differing in the loop size and pairing were predicted (Fig 3.1b, c); the
prediction of the second motif (Fig 3.1b) can be explained by the fact that GC pairs are
thermodynamically more stable than GU pairs. TS14 was the only sequence for which
only a single motif, as in (Fig 3.1 b) was predicted.
It was almost clear from these predictions that all the 14 RNA sequences formed
stable helical stems, however, the structure of the loop might show some dynamics. In
order to reliably predict and model the interactions of HT with the RNA, it would be
desirable to have as high confidence in the model of the RNA. Though for HT-RNA
interactions, the structure of the stem surrounding the CC mismatch would be more
relevant than the structure of the loop, the loop is in close proximity to the binding region
for HT. So the size and stability of the loop could affect the helicity of the HT binding
region. Thus before proceeding further, it was important to know if the sequences formed
a heptaloop (Fig 3.1b) or other predicted variations (Fig 3.1c). It would be expected that
the helical stem region of the RNA would be in a regular A-form geometry, however the
orientation of the cytosines in the CC mismatch and the structure of the loop could adopt
various conformations; in absence of experimental information, it would not be possible to
select the best option among these. Thus as a next step, the 3D structures of all 14 RNAs
were predicted by FARNA. This step served two purposes: 1) structure prediction with yet
another program which utilizes a different method for structure prediction. Concordant
results with Mfold would increase our confidence in the predictions. 2) Building a 3D
model which could be used for further docking and simulation studies. The results of
FARNA are given in Fig 3.3.
TS14 was the only sequence for which the exact stem-heptaloop structure was
predicted. In order to confirm the true length of the stem, NMR spectroscopy was used.
Since the hydrogen bonded imino protons are observed at a frequency downfield of the
other signals, NMR spectroscopy provides a very quick and easy method for estimating
the secondary structure of RNA and the binding site of ligands if in the base paired region.

59
Fig 3.3. Results of structure prediction by FARNA. Since a proper stem-heptaloop structure was observed only for TS14, it has been used as the reference structure to depict the results in this figure. The arrows mark the predicted loop closing base-pair for the predicted stem-loop structures of the corresponding RNA sequences. For TS11, helical structure was predicted upto C13, thus even though C13-C19 pair would be non existent and G12-C20 would be the loop closing base pair, C13 has been marked with the arrow in this figure. For TS4, TS8 and TS10 no stem loop like structure was predicted.
NMR
Among the 14 RNA sequences (Table 3.1), TS1 is closest to the original biological
sequence. TS6 on the other hand has an AU base pair instead of GC (Fig 3.4a), in close
proximity to the expected HT binding site. TS14 has a GC loop closing base pair and was
consistently predicted to form a stem-heptaloop structure. Thus if stable stem-heptaloop
structures are indeed formed in solution for these sequences, the imino signals in the 1D
spectra should correspond to 2 signals for the GU base pairs for TS1 and TS6, and only
one for TS14. TS6 should additionally demonstrate a signal further downfield
corresponding to the AU base pair. However, if the bulged stem – triloop structure as in
Fig 3.1c is formed then only 1 GU signal would be observed for TS1 and TS6, which
should be easily identified based the TS14 spectra. Additionally, the spread of AU and
GUs in the stem would permit the reconfirmation of the binding region in NMR based HT
titrations. Thus, TS1, TS6 and TS14 were bought from Biospring GmbH, Frankfurt for
NMR studies.

60
Secondary structure of the RNAs
1D proton spectra were recorded and analysed for all the three RNA samples (Fig
3.4b). Based on the above discussion and analyses of the spectra, it could be concluded
that all the three RNAs formed a stable stem. It could however, not be confirmed if the
second GU base pair (G12-U20) which should have been the loop closing pair in TS1 and
TS6 (Fig 3.4a) was formed. Nevertheless it could be confirmed that the stem was formed
at least until the first (GU G10-U22) pair.
a
b
Fig 3.4. a) Secondary structure representations for TS14, TS6 and TS1. The GU and AU base pairs are highlighted in red alphabets. b) 1D 1H spectra of imino region for TS6, TS1 and TS14 constructs
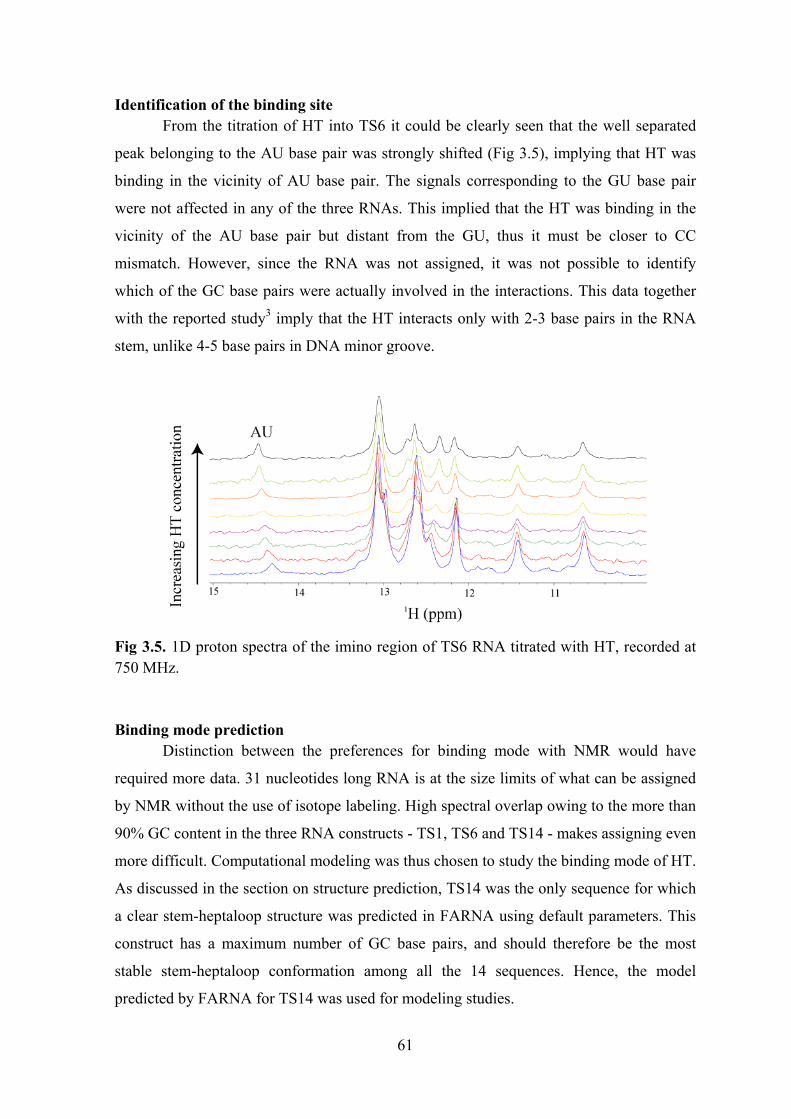
61
Identification of the binding site From the titration of HT into TS6 it could be clearly seen that the well separated
peak belonging to the AU base pair was strongly shifted (Fig 3.5), implying that HT was
binding in the vicinity of AU base pair. The signals corresponding to the GU base pair
were not affected in any of the three RNAs. This implied that the HT was binding in the
vicinity of the AU base pair but distant from the GU, thus it must be closer to CC
mismatch. However, since the RNA was not assigned, it was not possible to identify
which of the GC base pairs were actually involved in the interactions. This data together
with the reported study3 imply that the HT interacts only with 2-3 base pairs in the RNA
stem, unlike 4-5 base pairs in DNA minor groove.
Fig 3.5. 1D proton spectra of the imino region of TS6 RNA titrated with HT, recorded at 750 MHz.
Binding mode prediction Distinction between the preferences for binding mode with NMR would have
required more data. 31 nucleotides long RNA is at the size limits of what can be assigned
by NMR without the use of isotope labeling. High spectral overlap owing to the more than
90% GC content in the three RNA constructs - TS1, TS6 and TS14 - makes assigning even
more difficult. Computational modeling was thus chosen to study the binding mode of HT.
As discussed in the section on structure prediction, TS14 was the only sequence for which
a clear stem-heptaloop structure was predicted in FARNA using default parameters. This
construct has a maximum number of GC base pairs, and should therefore be the most
stable stem-heptaloop conformation among all the 14 sequences. Hence, the model
predicted by FARNA for TS14 was used for modeling studies.
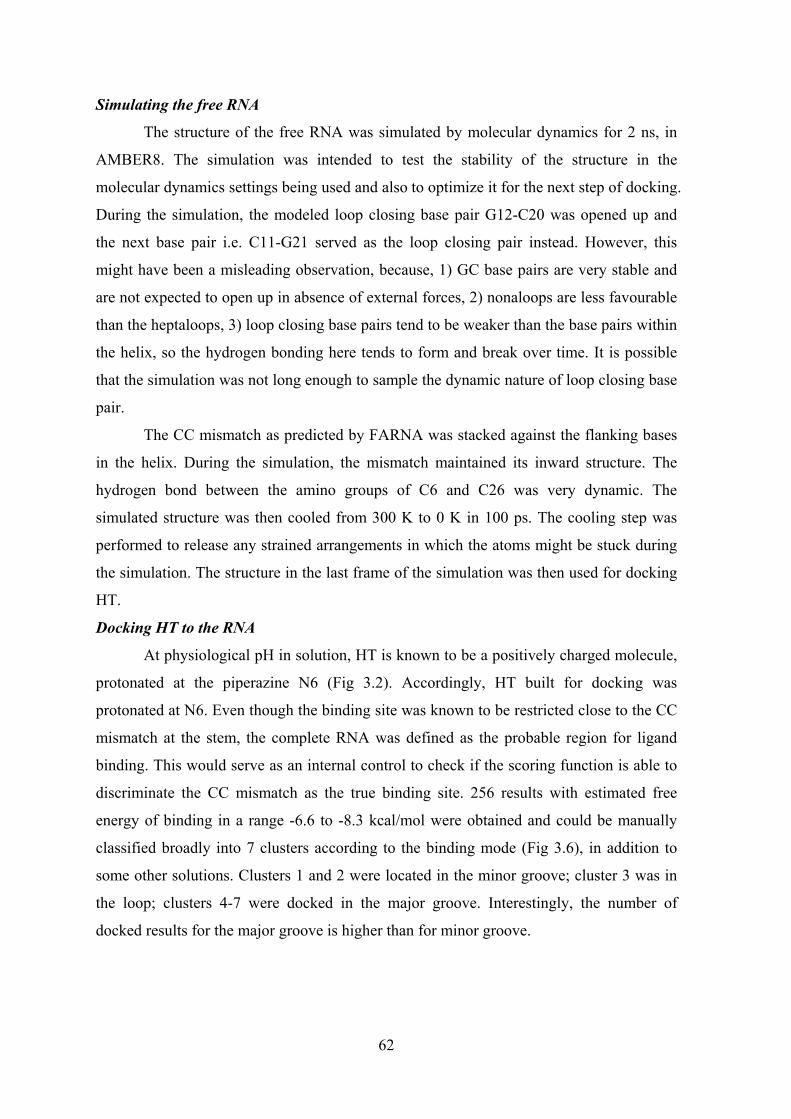
62
Simulating the free RNA
The structure of the free RNA was simulated by molecular dynamics for 2 ns, in
AMBER8. The simulation was intended to test the stability of the structure in the
molecular dynamics settings being used and also to optimize it for the next step of docking.
During the simulation, the modeled loop closing base pair G12-C20 was opened up and
the next base pair i.e. C11-G21 served as the loop closing pair instead. However, this
might have been a misleading observation, because, 1) GC base pairs are very stable and
are not expected to open up in absence of external forces, 2) nonaloops are less favourable
than the heptaloops, 3) loop closing base pairs tend to be weaker than the base pairs within
the helix, so the hydrogen bonding here tends to form and break over time. It is possible
that the simulation was not long enough to sample the dynamic nature of loop closing base
pair.
The CC mismatch as predicted by FARNA was stacked against the flanking bases
in the helix. During the simulation, the mismatch maintained its inward structure. The
hydrogen bond between the amino groups of C6 and C26 was very dynamic. The
simulated structure was then cooled from 300 K to 0 K in 100 ps. The cooling step was
performed to release any strained arrangements in which the atoms might be stuck during
the simulation. The structure in the last frame of the simulation was then used for docking
HT.
Docking HT to the RNA
At physiological pH in solution, HT is known to be a positively charged molecule,
protonated at the piperazine N6 (Fig 3.2). Accordingly, HT built for docking was
protonated at N6. Even though the binding site was known to be restricted close to the CC
mismatch at the stem, the complete RNA was defined as the probable region for ligand
binding. This would serve as an internal control to check if the scoring function is able to
discriminate the CC mismatch as the true binding site. 256 results with estimated free
energy of binding in a range -6.6 to -8.3 kcal/mol were obtained and could be manually
classified broadly into 7 clusters according to the binding mode (Fig 3.6), in addition to
some other solutions. Clusters 1 and 2 were located in the minor groove; cluster 3 was in
the loop; clusters 4-7 were docked in the major groove. Interestingly, the number of
docked results for the major groove is higher than for minor groove.
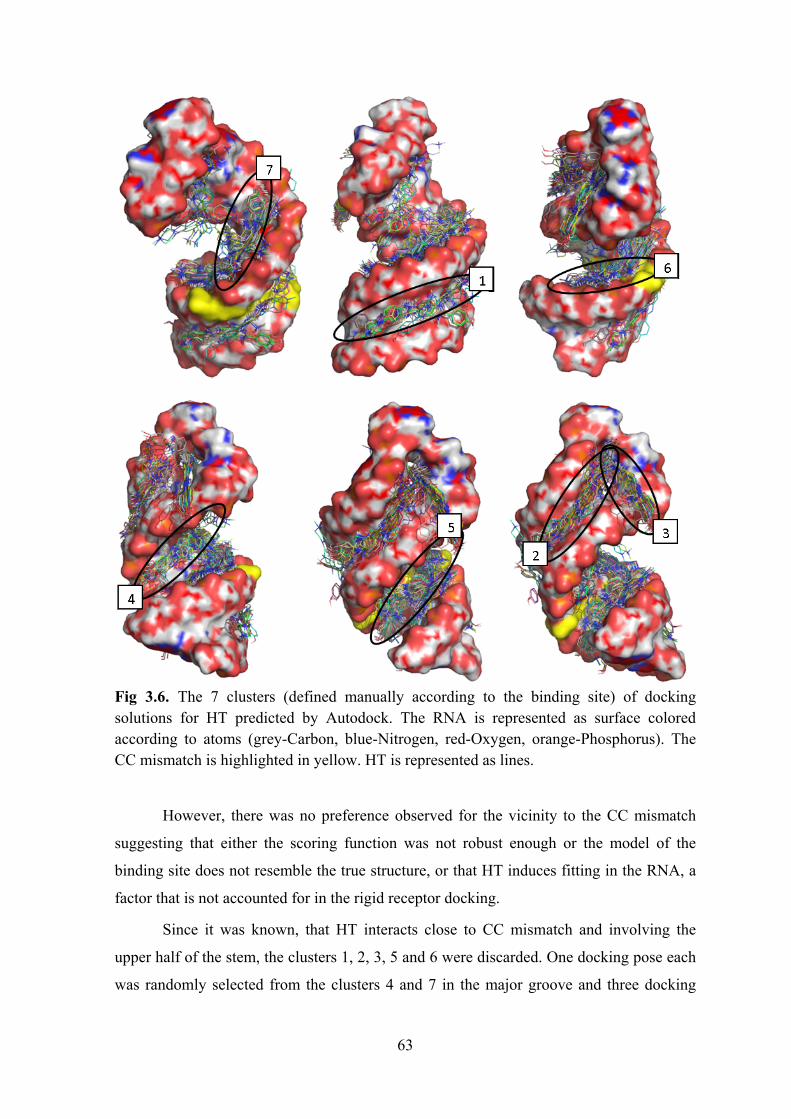
63
Fig 3.6. The 7 clusters (defined manually according to the binding site) of docking solutions for HT predicted by Autodock. The RNA is represented as surface colored according to atoms (grey-Carbon, blue-Nitrogen, red-Oxygen, orange-Phosphorus). The CC mismatch is highlighted in yellow. HT is represented as lines.
However, there was no preference observed for the vicinity to the CC mismatch
suggesting that either the scoring function was not robust enough or the model of the
binding site does not resemble the true structure, or that HT induces fitting in the RNA, a
factor that is not accounted for in the rigid receptor docking.
Since it was known, that HT interacts close to CC mismatch and involving the
upper half of the stem, the clusters 1, 2, 3, 5 and 6 were discarded. One docking pose each
was randomly selected from the clusters 4 and 7 in the major groove and three docking

64
poses (singletons, not belonging to any cluster) were selected from the minor groove (Fig
3.7).
Fig 3.7. The 5 docked structures used for molecular dynamics simulations. The RNA is represented as surface colored according to atoms (grey-Carbon, blue-Nitrogen, red-Oxygen, orange-Phosphorus). The CC mismatch is highlighted in yellow. HT is represented with sticks.
Simulations of the RNA-HT complex
To test the stability of the docked poses, the RNA-HT complexes were simulated
in AMBER8 for 1-2 ns. During the simulation, HT poses docked in the minor groove and
in cluster 7 in the major groove, shifted to align against and interact with the phosphate
backbone and the sugar moieties. Such interaction mode is independent of the existence of
the mismatch or the nature of base pairing. Therefore, it does not correlate with the
reported literature, whereby binding occurs specifically at the mismatch or bulges in RNA.
Unlike the other poses selected for simulation, docked HT representing cluster 4
was aligned perpendicular to the helical axis of the RNA. This pose was maintained
throughout the simulation and HT did not show movement to align parallel to the axis or
the helical backbone. Instead in the RNA structure, distortion and partial unwinding of the
helix was initiated. This could be interpreted as destabilisation of the helix on interaction
with the RNA. However according to the NMR titration experiments, this is not the case.
So, the observation in simulations could also be indicative of the beginning of an induced
65
fit. Considering the latter, the simulation was extended upto 6 ns, however, the RNA did
not recover the A-form helical geometry. This might also be a failure of the simulation
protocol or of the force-field for simulating the complex.
Binding to the major groove
From these simulations and comparison against the reported literature, the
predicted binding modes for the minor groove, which ended up interacting solely with the
backbone and sugars, without any interaction with the nucleic bases could be discarded.
The binding mode from cluster 4 instead interacted with the base moieties of the nucleic
acids and could be sensitive to the presence of mismatch and other modifications in the
residues. These data were considered as first clues that HT binds in the major groove,
perpendicular to the helical axis; however, the unexpected structural distortions in the
helix resulting from the molecular dynamics simulations were unacceptable and thus the
model was not taken up for detailed analysis.
Design of a shorter RNA construct It was confirmed that HT binds in close proximity to the CC mismatch possibly
perpendicular to the helical axis in the major groove. In order to enable solving the
structure by NMR spectroscopy, a shorter construct was designed. The new construct was
11 nucleotides long, self complementary double stranded RNA helix (Fig 3.8). Since the
helix sequence above and below the CC mismatch is symmetrical, the number of signals
observed in the spectra was expected to be halved and consequently, easier to assign.
COSY and NOESY spectra were recorded for the RNA sample prepared in 2H2O.
COSY is designed to detect the correlations between scalar coupled protons, particularly
useful for identifying H5-H6 correlations in pyrimidines. For the designed 11mer
construct, as a symmetric double helix, six H5-H6 COSY correlations were expected.
Instead, the recorded spectra had ten peaks (Fig 3.9). Moreover, in the NOESY spectra,
there was not one unique way of conducting the sequential aromatic-anomeric walk,
instead, it was possible to deviate into more than one route and then merge back into the
main walk. This suggested that the RNA was forming more than one conformation in
solution. On a native polyacrylamide gel, the RNA ran as a single band corresponding to a
22 mer, thus all the RNA was double stranded, but probably base paired in more than one
way. Changing the heating protocol and/or increasing the NaCl or MgCl2 levels are the
general methods employed to modulate the conformational equilibrium of RNA, but these
did not prove useful. It was then hypothesized that, since HT preferentially binds to the

66
CC mismatch, addition of HT to the RNA would induce the formation a single helical
form, the one with the CC mismatch (Fig 3.8). However, instant precipitation of the RNA-
HT complex was observed at the first titration point, and precluded any further
experimentation with this construct.
Fig 3.8. The design of the self complementary 11 mer. The binding site of HT in the stem of Site 1 was used as a template to design this construct.
Fig 3.9. The COSY spectrum for 11mer RNA construct, recorded at 600 MHz. Ten signals were observed instead of the expected six.
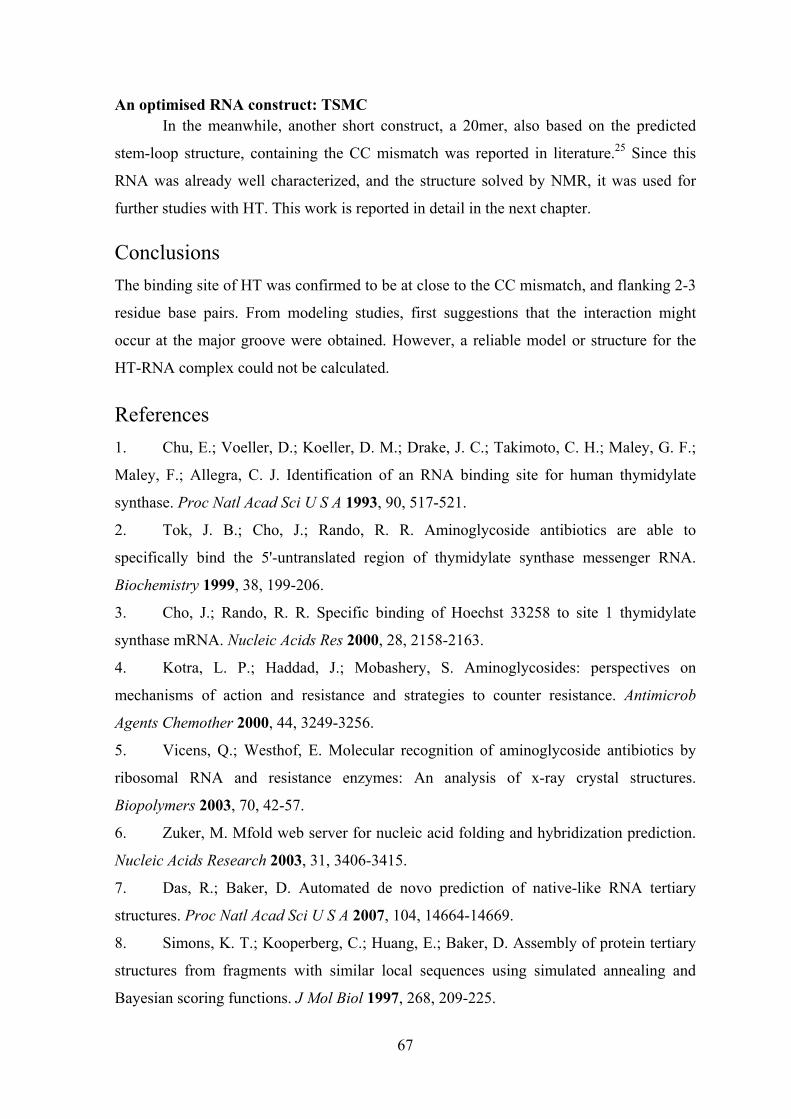
67
An optimised RNA construct: TSMC In the meanwhile, another short construct, a 20mer, also based on the predicted
stem-loop structure, containing the CC mismatch was reported in literature.25 Since this
RNA was already well characterized, and the structure solved by NMR, it was used for
further studies with HT. This work is reported in detail in the next chapter.
Conclusions The binding site of HT was confirmed to be at close to the CC mismatch, and flanking 2-3
residue base pairs. From modeling studies, first suggestions that the interaction might
occur at the major groove were obtained. However, a reliable model or structure for the
HT-RNA complex could not be calculated.
References 1. Chu, E.; Voeller, D.; Koeller, D. M.; Drake, J. C.; Takimoto, C. H.; Maley, G. F.;
Maley, F.; Allegra, C. J. Identification of an RNA binding site for human thymidylate
synthase. Proc Natl Acad Sci U S A 1993, 90, 517-521.
2. Tok, J. B.; Cho, J.; Rando, R. R. Aminoglycoside antibiotics are able to
specifically bind the 5'-untranslated region of thymidylate synthase messenger RNA.
Biochemistry 1999, 38, 199-206.
3. Cho, J.; Rando, R. R. Specific binding of Hoechst 33258 to site 1 thymidylate
synthase mRNA. Nucleic Acids Res 2000, 28, 2158-2163.
4. Kotra, L. P.; Haddad, J.; Mobashery, S. Aminoglycosides: perspectives on
mechanisms of action and resistance and strategies to counter resistance. Antimicrob
Agents Chemother 2000, 44, 3249-3256.
5. Vicens, Q.; Westhof, E. Molecular recognition of aminoglycoside antibiotics by
ribosomal RNA and resistance enzymes: An analysis of x-ray crystal structures.
Biopolymers 2003, 70, 42-57.
6. Zuker, M. Mfold web server for nucleic acid folding and hybridization prediction.
Nucleic Acids Research 2003, 31, 3406-3415.
7. Das, R.; Baker, D. Automated de novo prediction of native-like RNA tertiary
structures. Proc Natl Acad Sci U S A 2007, 104, 14664-14669.
8. Simons, K. T.; Kooperberg, C.; Huang, E.; Baker, D. Assembly of protein tertiary
structures from fragments with similar local sequences using simulated annealing and
Bayesian scoring functions. J Mol Biol 1997, 268, 209-225.

68
9. Morris, G. M.; Goodsell, D. S.; Halliday, R. S.; Huey, R.; Hart, W. E.; Belew, R.
K.; Olson, A. J. Automated docking using a Lamarckian genetic algorithm and an
empirical binding free energy function. Journal of Computational Chemistry 1998, 19,
1639-1662.
10. Detering, C.; Varani, G. Validation of automated docking programs for docking
and database screening against RNA drug targets. J Med Chem 2004, 47, 4188-4201.
11. Trott, O.; Olson, A. J. AutoDock Vina: Improving the speed and accuracy of
docking with a new scoring function, efficient optimization, and multithreading. Journal
of Computational Chemistry 2010, 31, 455-461.
12. Chang, M. W.; Ayeni, C.; Breuer, S.; Torbett, B. E. Virtual screening for HIV
protease inhibitors: a comparison of AutoDock 4 and Vina. PLoS One 2010, 5, e11955.
13. Case, D. A.; Cheatham, T. E., 3rd; Darden, T.; Gohlke, H.; Luo, R.; Merz, K. M.,
Jr.; Onufriev, A.; Simmerling, C.; Wang, B.; Woods, R. J. The Amber biomolecular
simulation programs. J Comput Chem 2005, 26, 1668-1688.
14. Jorgensen, W. L. Revised TIPS for simulations of liquid water and aqueous
solutions. J Chem Phys 1982, 77, 4156-4163.
15. Ryckaert, J.-P.; Ciccotti, G.; Berendsen, H. J. C. Numerical intergration of the
cartesian equations of motion of a system with constraints: Molecular dynamics of n-
alkanes. J Comp Phys 1977, 23, 327-341.
16. Shields, G. C.; Laughton, C. A.; Orozco, M. Molecular Dynamics Simulations of
the d(T·A·T) Triple Helix. Journal of the American Chemical Society 1997, 119, 7463-
7469.
17. Shields, G. C.; Laughton, C. A.; Orozco, M. Molecular Dynamics Simulation of a
PNA·DNA·PNA Triple Helix in Aqueous Solution. Journal of the American Chemical
Society 1998, 120, 5895-5904.
18. Berendsen, H. J. C.; Postma, J. P. M.; van Gunsteren, W. F.; DiNola, A. H., J.R.
Molecular dynamics with coupling to an external bath. J Chem Phys 1984, 81, 3684-3690.
19. Jakalian, A.; Jack, D. B.; Bayly, C. I. Fast, efficient generation of high-quality
atomic charges. AM1-BCC model: II. Parameterization and validation. Journal of
Computational Chemistry 2002, 23, 1623-1641.
20. Adhikary, A.; Buschmann, V.; Muller, C.; Sauer, M. Ensemble and single-
molecule fluorescence spectroscopic study of the binding modes of the bis-benzimidazole
derivative Hoechst 33258 with DNA. Nucleic Acids Res 2003, 31, 2178-2186.

69
21. Bailly, C.; Colson, P.; Henichart, J. P.; Houssier, C. The different binding modes
of Hoechst 33258 to DNA studied by electric linear dichroism. Nucleic Acids Res 1993, 21,
3705-3709.
22. Colson, P.; Houssier, C.; Bailly, C. Use of electric linear dichroism and
competition experiments with intercalating drugs to investigate the mode of binding of
Hoechst 33258, berenil and DAPI to GC sequences. J Biomol Struct Dyn 1995, 13, 351-
366.
23. Bailly, C.; Colson, P.; Houssier, C.; Hamy, F. The binding mode of drugs to the
TAR RNA of HIV-1 studied by electric linear dichroism. Nucleic Acids Res 1996, 24,
1460-1464.
24. Dassonneville, L.; Hamy, F.; Colson, P.; Houssier, C.; Bailly, C. Binding of
Hoechst 33258 to the TAR RNA of HIV-1. Recognition of a pyrimidine bulge-dependent
structure. Nucleic Acids Res 1997, 25, 4487-4492.
25. Tavares, T. J.; Beribisky, A. V.; Johnson, P. E. Structure of the cytosine-cytosine
mismatch in the thymidylate synthase mRNA binding site and analysis of its interaction
with the aminoglycoside paromomycin. RNA 2009, 15, 911-922.

70
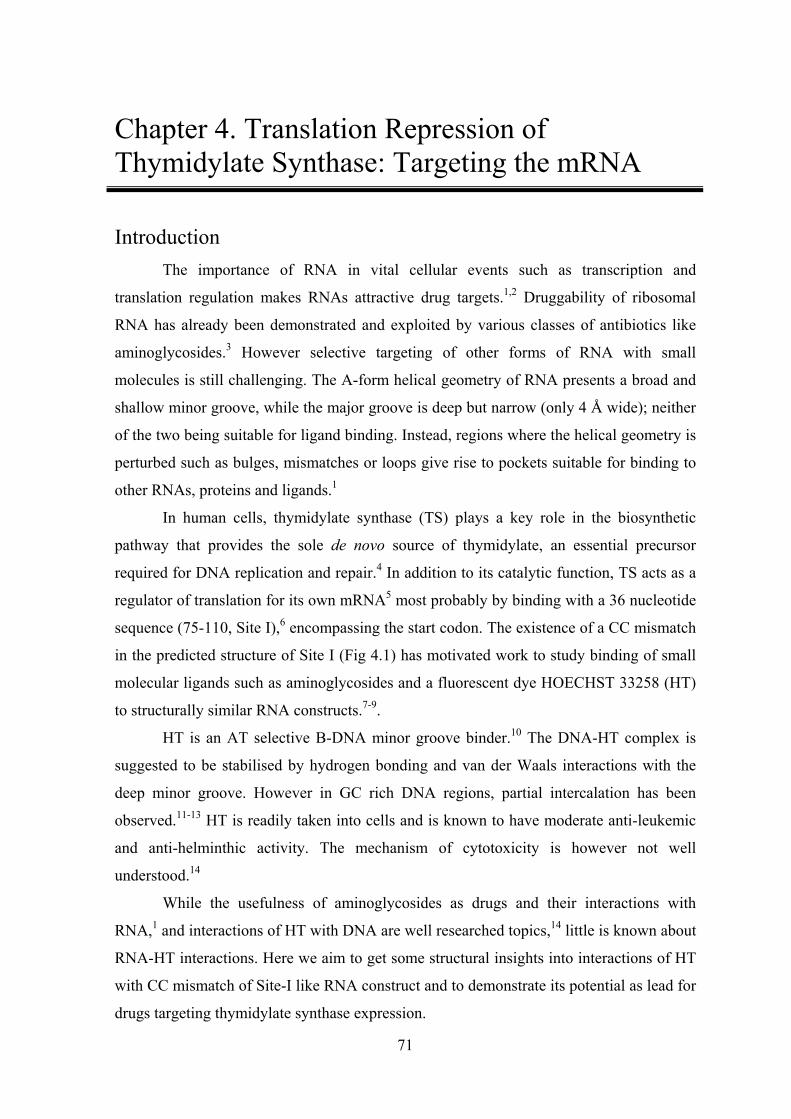
71
Chapter 4. Translation Repression of Thymidylate Synthase: Targeting the mRNA
Introduction The importance of RNA in vital cellular events such as transcription and
translation regulation makes RNAs attractive drug targets.1,2 Druggability of ribosomal
RNA has already been demonstrated and exploited by various classes of antibiotics like
aminoglycosides.3 However selective targeting of other forms of RNA with small
molecules is still challenging. The A-form helical geometry of RNA presents a broad and
shallow minor groove, while the major groove is deep but narrow (only 4 Å wide); neither
of the two being suitable for ligand binding. Instead, regions where the helical geometry is
perturbed such as bulges, mismatches or loops give rise to pockets suitable for binding to
other RNAs, proteins and ligands.1
In human cells, thymidylate synthase (TS) plays a key role in the biosynthetic
pathway that provides the sole de novo source of thymidylate, an essential precursor
required for DNA replication and repair.4 In addition to its catalytic function, TS acts as a
regulator of translation for its own mRNA5 most probably by binding with a 36 nucleotide
sequence (75-110, Site I),6 encompassing the start codon. The existence of a CC mismatch
in the predicted structure of Site I (Fig 4.1) has motivated work to study binding of small
molecular ligands such as aminoglycosides and a fluorescent dye HOECHST 33258 (HT)
to structurally similar RNA constructs.7-9.
HT is an AT selective B-DNA minor groove binder.10 The DNA-HT complex is
suggested to be stabilised by hydrogen bonding and van der Waals interactions with the
deep minor groove. However in GC rich DNA regions, partial intercalation has been
observed.11-13 HT is readily taken into cells and is known to have moderate anti-leukemic
and anti-helminthic activity. The mechanism of cytotoxicity is however not well
understood.14
While the usefulness of aminoglycosides as drugs and their interactions with
RNA,1 and interactions of HT with DNA are well researched topics,14 little is known about
RNA-HT interactions. Here we aim to get some structural insights into interactions of HT
with CC mismatch of Site-I like RNA construct and to demonstrate its potential as lead for
drugs targeting thymidylate synthase expression.
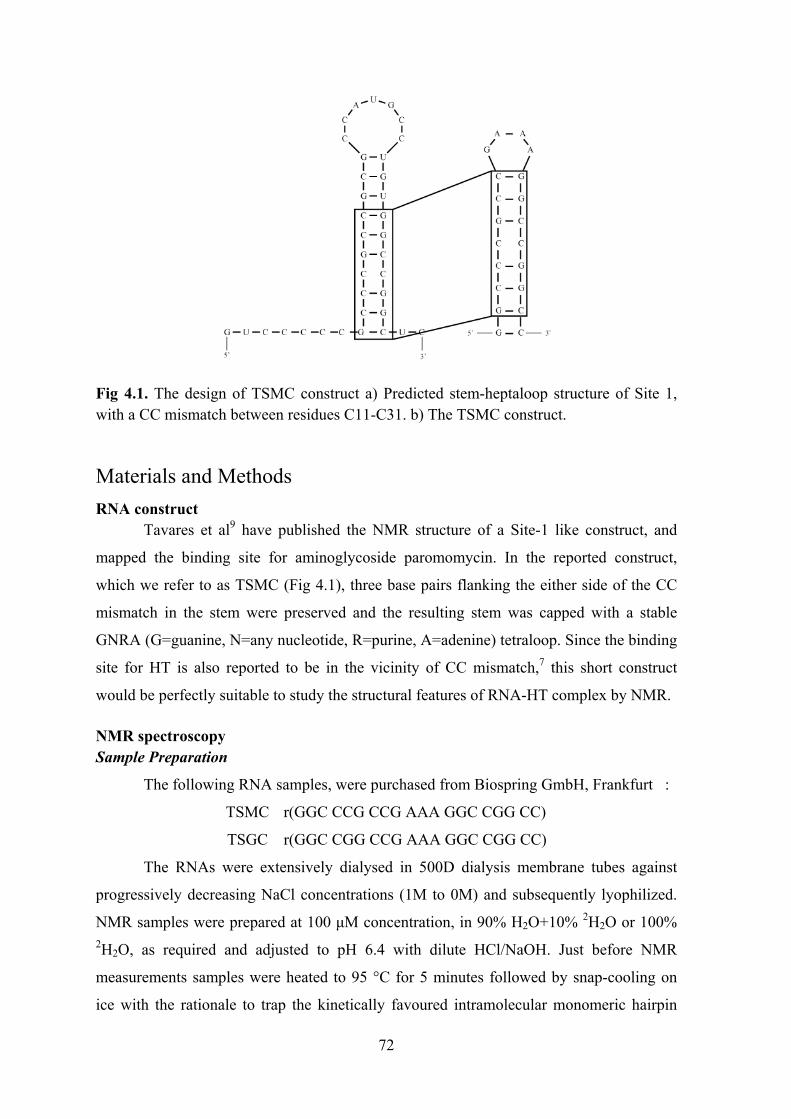
72
Fig 4.1. The design of TSMC construct a) Predicted stem-heptaloop structure of Site 1, with a CC mismatch between residues C11-C31. b) The TSMC construct.
Materials and Methods RNA construct
Tavares et al9 have published the NMR structure of a Site-1 like construct, and
mapped the binding site for aminoglycoside paromomycin. In the reported construct,
which we refer to as TSMC (Fig 4.1), three base pairs flanking the either side of the CC
mismatch in the stem were preserved and the resulting stem was capped with a stable
GNRA (G=guanine, N=any nucleotide, R=purine, A=adenine) tetraloop. Since the binding
site for HT is also reported to be in the vicinity of CC mismatch,7 this short construct
would be perfectly suitable to study the structural features of RNA-HT complex by NMR.
NMR spectroscopy Sample Preparation
The following RNA samples, were purchased from Biospring GmbH, Frankfurt :
TSMC r(GGC CCG CCG AAA GGC CGG CC)
TSGC r(GGC CGG CCG AAA GGC CGG CC)
The RNAs were extensively dialysed in 500D dialysis membrane tubes against
progressively decreasing NaCl concentrations (1M to 0M) and subsequently lyophilized.
NMR samples were prepared at 100 μM concentration, in 90% H2O+10% 2H2O or 100% 2H2O, as required and adjusted to pH 6.4 with dilute HCl/NaOH. Just before NMR
measurements samples were heated to 95 °C for 5 minutes followed by snap-cooling on
ice with the rationale to trap the kinetically favoured intramolecular monomeric hairpin

73
conformation over possible intermolecular dimer. The stoichiometry of NMR samples was
initially checked with native PAGE.
HT for titrations was purchased from Sigma Aldrich under the ID B1155 and
dissolved at 10 mM concentration in same solvent as RNA and adjusted to pH 6.4.
Data collection
For titration experiments in water, the RNA and HT samples prepared in water
were used. TSMC chemical shift perturbations upon HT addition, were monitored using a
2D 1H-1H NOESY (τm = 300 ms and 80 ms) experiment which was recorded at HT/TSMC
ratios of 0:1, 0.5:1, 1:1 and 1.5:1. Significant precipitation at this point precluded further
titrations.
For titrations in 2H2O, the RNA and HT samples prepared in 2H2O were used.
Changes in TSMC were monitored using a 2D 1H-1H TOCSY (τm = 80 ms) and 2D 1H-1H
NOESY (τm = 300 ms and 80 ms) experiments which were recorded at HT/TSMC ratios of
0:1, 0.5:1, 1:1 and 1.5:1. Significant precipitation at this point has precluded further
titrations.
All experiments were performed on 900 MHz Bruker spectrometer with a
cryogenically cooled probe at 293 K, which was found to be the optimal temperature for
both water and 2H2O measurements.
Assignment of the NMR spectra
The assignments for the free RNA were transferred to our spectra from the published work
of Tavares et al.9 Consequently the assignments were limited to 1H-1H correlations for the
imino-amino and aromatic-anomeric protons in the NOESY spectra and the H6-H5
correlations for the cytosines recorded by TOCSY.
At this point it may also be mentioned that, the RNA was purchased in two batches
from Biospring GmbH. The recorded spectra of the two batches were not similar to each
other. While batch I gave a spectra identical to the published data (Fig 4.2),9 the spectra
for batch II had to be reassigned because of chemical shifts of signals (Fig 4.3). Since the
mass spectroscopy results provided by Biospring GmbH and the assignments of the NMR
spectra correlated well with the sequence of TSMC, the second batch was also believed to
possess the correct sequence and structure. All but one the experiments were performed on
batch II of the RNA. However, since the sample was exhausted, RNA from batch I had to
be used for the paramagnetic relaxation enhancement measurements for the TSMC-HT
complex.
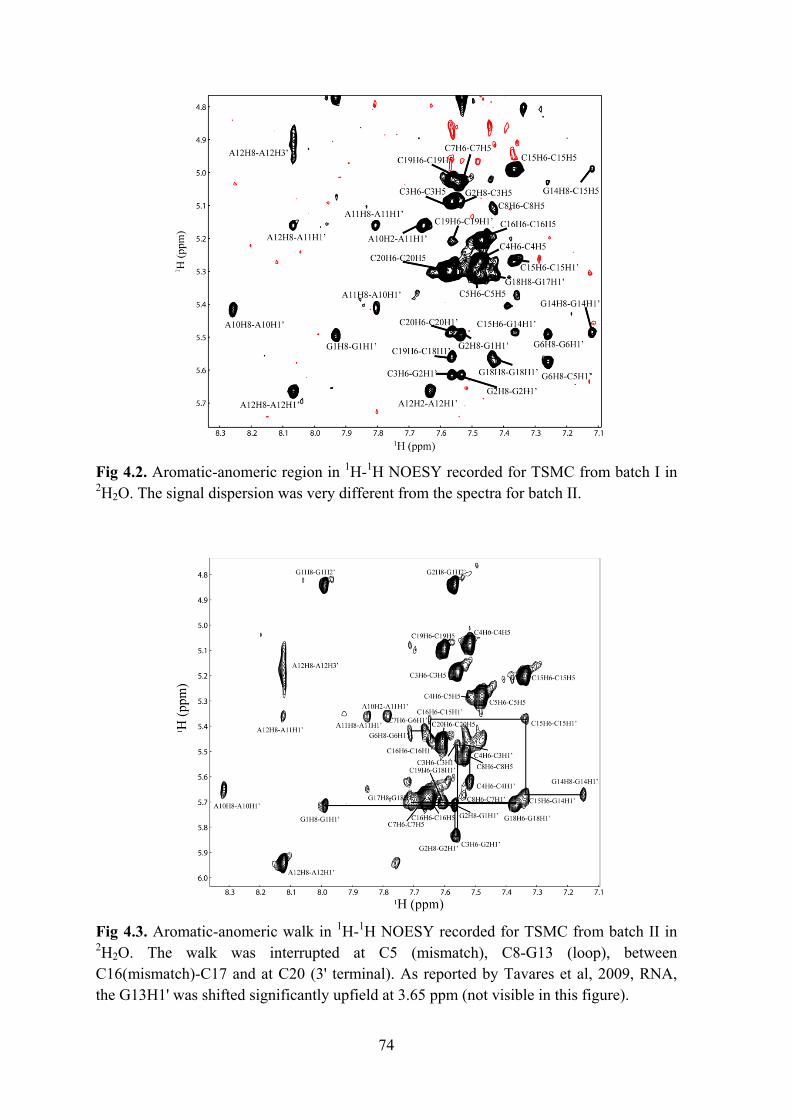
74
Fig 4.2. Aromatic-anomeric region in 1H-1H NOESY recorded for TSMC from batch I in 2H2O. The signal dispersion was very different from the spectra for batch II.
Fig 4.3. Aromatic-anomeric walk in 1H-1H NOESY recorded for TSMC from batch II in 2H2O. The walk was interrupted at C5 (mismatch), C8-G13 (loop), between C16(mismatch)-C17 and at C20 (3' terminal). As reported by Tavares et al, 2009, RNA, the G13H1' was shifted significantly upfield at 3.65 ppm (not visible in this figure).

75
Paramagnetic relaxation enhancement measurement
Two independent sets of titrations with the paramagnetic agent gadolinium-
diethylenetriamine pentaacetic acid-bismethylamide [Gd(DTPA-BMA)] (Fig 4.4) were
performed for free TSMC and in complex with equimolar HT in 2H2O. Gd(DTPA-BMA)
was titrated into the samples in steps to final concentrations of 0.5 mM, 1 mM, 1.4 mM,
2.4 mM, 3.2 and 4.5mM. T1 (1H) relaxation measurements for NOESY, were recorded for
each step.
Fig 4.4. The structure of the paramagnetic agent gadolinium-diethylenetriamine pentaacetic acid-bismethylamide [Gd(DTPA-BMA)].
Computational Modeling Preparation and parameterization of starting structures
The model 6 from the solution structure ensemble of TSMC (PDB ID 2RPT),9 had
the best A-form helical geometry and was thus chosen for modeling the complex with HT.
HT was manually docked (visualization was done in Pymol 1.2r2) at the crevice formed
by the CC mismatch in the major groove. Since the orientation of HT with respect to RNA
was not known, two docking poses (A & B) rotated 180° to each other were generated (Fig
4.3). The parmbsc0 force field15 was used to parameterize the RNA while the published
parameters16 were used for HT.
NN
O O
HN
O
NHN
OOO
O O
Gd
OH H
Gd(DTPA-BMA)
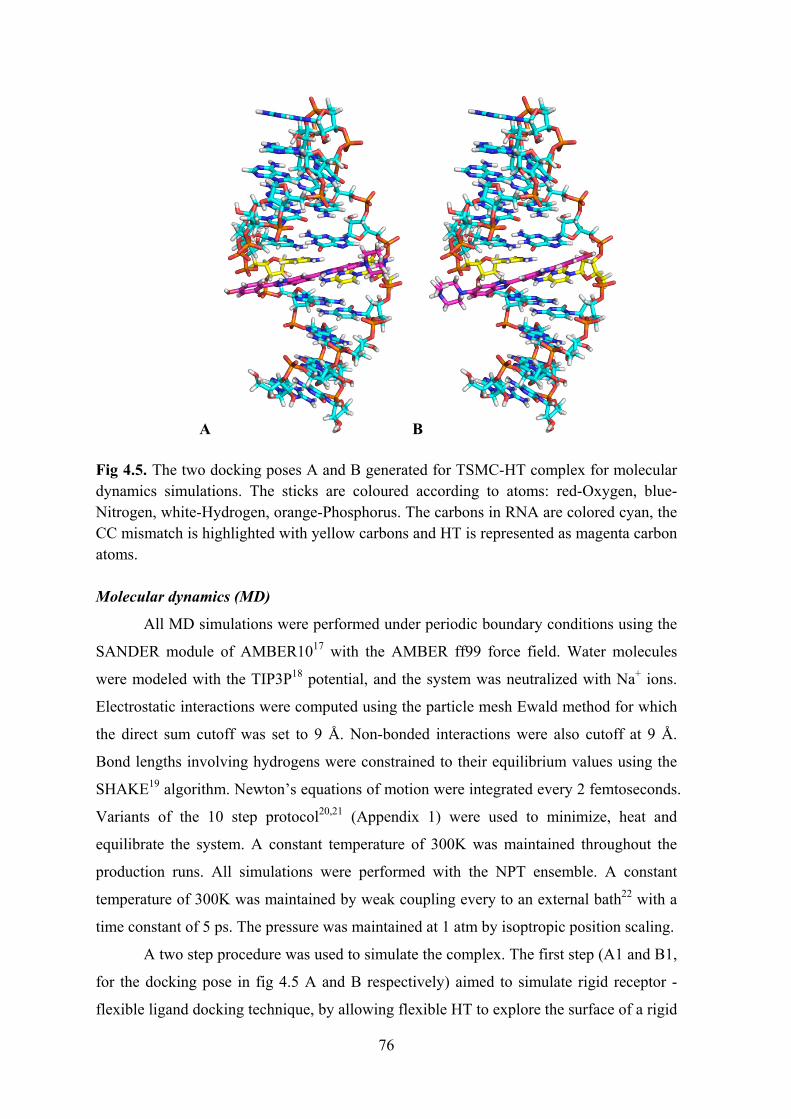
76
A B
Fig 4.5. The two docking poses A and B generated for TSMC-HT complex for molecular dynamics simulations. The sticks are coloured according to atoms: red-Oxygen, blue-Nitrogen, white-Hydrogen, orange-Phosphorus. The carbons in RNA are colored cyan, the CC mismatch is highlighted with yellow carbons and HT is represented as magenta carbon atoms. Molecular dynamics (MD)
All MD simulations were performed under periodic boundary conditions using the
SANDER module of AMBER1017 with the AMBER ff99 force field. Water molecules
were modeled with the TIP3P18 potential, and the system was neutralized with Na+ ions.
Electrostatic interactions were computed using the particle mesh Ewald method for which
the direct sum cutoff was set to 9 Å. Non-bonded interactions were also cutoff at 9 Å.
Bond lengths involving hydrogens were constrained to their equilibrium values using the
SHAKE19 algorithm. Newton’s equations of motion were integrated every 2 femtoseconds.
Variants of the 10 step protocol20,21 (Appendix 1) were used to minimize, heat and
equilibrate the system. A constant temperature of 300K was maintained throughout the
production runs. All simulations were performed with the NPT ensemble. A constant
temperature of 300K was maintained by weak coupling every to an external bath22 with a
time constant of 5 ps. The pressure was maintained at 1 atm by isoptropic position scaling.
A two step procedure was used to simulate the complex. The first step (A1 and B1,
for the docking pose in fig 4.5 A and B respectively) aimed to simulate rigid receptor -
flexible ligand docking technique, by allowing flexible HT to explore the surface of a rigid

77
RNA and find an optimal docking pose. This was accomplished by restraining the RNA
with a restraint force constant of 25 kcal/mol-Å2, while HT was free to move during the
production run of 10 ns. The aim of the second step (A2) was to explore any induced fit at
the CC mismatch caused by interaction with HT. This was accomplished by allowing
unrestrained movement to residues 4-6, 16-18 and HT, while the rest of the RNA was
restrained with a force constant 10 kcal/mol-Å2, during the production run of 24 ns. The
conformations sampled during the last 500 ps of the run were averaged, followed by
minimization using steepest descent and conjugate gradient methods to obtain a
representative model of TSMC-HT complex.
The free RNA was simulated for 9 ns using the same settings as for A2.
Biological assays (The biological assays were conducted by Alessio Ligabue in the laboratory of Prof. Gaetano Marverti in the University of Modena, Italy) Cell line
The 2008 cell line was established from a patient with serous cystadenocarcinoma
of the ovary. The cells were grown as monolayers in RPMI 1640 medium containing 10%
heat-inactivated fetal bovine serum and 50 µg/ml gentamycin sulfate. All cell media and
serum were purchased from (Lonza, Verviers, Belgium). Cultures were equilibrated with
humidified 5% CO2 in air at 37°C. All studies were performed in Mycoplasma negative
cells, as routinely determined with the MycoAlert Mycoplasma detection kit (Lonza,
Walkersville, MD, USA).
HT treatment
The cells were administered increasing concentrations of HT (0 µM, 0.1 µM, 1 µM
and 10 µM) and incubated for 72 hours.
Western blotting
Cells were harvested, washed twice in ice-cold 1x PBS, and resuspended in 20 mM
Tris-HCl (pH 7.4), 150 mM NaCl, 1 mM EDTA (pH 8.0), 1% Triton X-100, and 0.1%
SDS. Cells were lysed by freeze-thawing three times followed by sonication using three 2
to 3 sec bursts. The insoluble debris was removed by centrifugation at 15,000 x g for 30
min. Protein concentrations were determined using the method of Lowry.23 Twenty-five
µg of each protein sample were resolved by SDS-PAGE (12%). The gels were
electroblotted onto hydrophobic polyvinylidene difluoride membranes (HybondTM-P
PVDF, GE Healthcare Bio-Science, Uppsala, Sweden). Antibody staining was performed
with a chemiluminescence detection system (ECL Plus Western Blotting Detection
78
Reagent, GE Healthcare Bio-Science, Uppsala, Sweden), using a 1:500 dilution of the
anti-human TS mouse TS106 monoclonal primary antibody (Invitrogen S.r.L., Milan, Italy)
and 1:1000 of anti-human ß-tubulin mouse antibody (Sigma-Aldrich S.r.L., Milan, Italy)
in conjunction with a 1:3000 dilution of a horseradish peroxidase-conjugated sheep anti-
mouse secondary antibody (GE Healthcare Bio-Science, Uppsala, Sweden). Quantitation
of signal intensity was performed by densitometry on a GS-800 calibrated densitometer
(Bio-Rad) and analyzed by using Quantity One software (Bio-Rad, CA, U.S.A.).
Real-time reverse transcription-PCR analysis
Total RNA was extracted from the cultured cells using TRI reagent (Sigma-
Aldrich S.r.L., Milan, Italy). Reverse transcription was performed with 2 µg of total RNA
using random primers (Promega, Milan, Italy) and M-MLV reverse transcriptase
(Promega, Milan, Italy). Real time RT-PCR was performed with 10 ng of cDNA using
Power SYBR® Green PCR Master Mix (Applied Biosystems, Monza (MI), Italy) and an
ABI PRISM 7900 HT Sequence Detection System (Applied Biosystems, Monza (MI),
Italy), followed by a dissociation curve analysis and subsequent agarose gel
electrophoresis to confirm amplification. The TS primer [PubMed, CoreNucleotide:
NM_001071.1] was used, forward: 5'-CAG ATT ATT CAG GAC AGG GAG TT -3',
reverse: 5′-CAT CAG AGG AAG ATC TCT TGG ATT -3'. The amount of target,
normalized to an endogenous reference (glyceraldehydes-3-phosphate dehydrogenase,
GAPDH) and relative to a calibrator (2008 cell line or untreated sample), was given by 2-
ΔΔCt calculation.24 All experiments were carried out three times in triplicate; amplification
plots were analyzed using the ABI Prism 7900 HT SDS version 2.1 software (Applied
Biosystems, Monza (MI), Italy).
Results Determining the binding site on RNA Mapping chemical shift perturbations
As reported by Cho et al,7 HT was expected to bind close to or at the CC mismatch.
The stem of TSMC consists of a CC mismatch flanked by three and four GC base-pairs
above and below respectively, capped by a GAAA (GNRA) tetraloop (Fig 4.1). Thus, a
2D 1H-1H TOCSY experiment in 2H2O which gives rise to an H6/H5 cross-peak for every
pyrimidine (in the case of TSMC, exclusively cytosines), would be ideal to monitor
changes that occur in the CC mismatch as well in every base-pair of the GC stem. An
overlay of the TOCSY spectra recorded with increasing concentrations of HT is shown in

79
Fig 4.6. The H6/H5 correlations for C19 and C20 experienced negligible change in
chemical shifts as compared to the remaining cytosines, suggesting that the binding event
occurs at a position distant to the base of the stem. Significant broadening was observed
for the H6/H5 correlations of C15, followed by C5 and joint signal of C16 and C7.
Presumably, these residues experience exchange-broadening motions when TSMC is
bound to HT. C8 experiences a cumulative effect from two HT binding sites, 1) the CC
mismatch and 2) minor binding site at the loop, leading to a similar degree of chemical
shift change as C15 but without extensive line broadening.
Fig 4.6. A 2D 1H-1H 2H2O TOCSY overlay of TSMC chemical shift changes upon addition of HT with HT/RNA ratios of 0:1, 0.5:1, 1:1, 1.5:1 marked in black, blue, red and green respectively. C15 experienced the largest degree of chemical shift change and broadening (marked by a large arrow in the TSMC secondary structure inset). C8 experienced similar degree of chemical shift exchange as C15, but without the line broadening (marked by a small arrow in the TSMC secondary structure inset). C4 and C5 also experience a significant change of chemical shift upon HT binding. The residues C16 and C7 (marked by asterisk in the TSMC secondary structure inset) have overlapping chemical shifts, so the degree of perturbation could not be quantified. To monitor changes in base-pair stability upon HT addition, 2D 1H-1H H2O
NOESY experiment was recorded, where changes in the imino-amino region (Fig 4.7)
were examined with increasing HT concentration. The change in the chemical shifts was
quantified using the formula , where Δδ is the overall change in the 22 21 FF Δ+Δ=Δδ

80
chemical shift, ΔF1 and ΔF2 represent the change in shift in the F1 and F2 dimensions
respectively. A plot of change in chemical shift vs time for the imino-amino cross peaks
(Fig 4.8) clearly demonstrated that HT was interacting close to the C4-G17 base pair,
which is adjacent to the mismatch. C3-G18 base pair also experienced significant chemical
shift perturbation, probably because of vicinity to the C4-G17 pair. The base pairs G2-C19
and C7-G14 and C8-G13 did not experience any significant perturbations. Consistent with
the TOCSY monitored titrations, these experiments confirmed that HT did not occupy the
base of the TSMC stem, which was observed to be the second minor binding site for
paromomycin.9
Fig 4.7. A 2D 1H-1H H2O NOESY overlay of TSMC chemical shift changes in the imino-amino region, upon addition of HT with HT/RNA ratios of 0:1, 0.5:1, 1:1, 1.5:1
A better resolved picture of binding site can be obtained by mapping the chemical
shift perturbations to the atoms instead of mapping correlation peaks to atom pairs.
Unfortunately, high signal overlap on the diagonal does not permit to follow the direct
chemical shift changes. However, the shift of individual proton signal is directly reflected
in the shift of the corresponding correlation peaks, and can be used to estimate the effect
on individual contributing protons. These criteria were used to map the most strongly
perturbed protons on interaction with HT (Fig 4.9). Even after titrations with HT, all cross-
peaks, that were observed for the free RNA, could be observed both for imino-amino
contacts in H2O NOESY spectra (Fig 4.7) and for H1’-H6/H8 correlations in 2H2O

81
NOESY, therefore, it could be concluded that HT binding does not compromise base-pair
integrity or helicity in the base paired region. However, broadening and overlap in the
signals of interest prevented extraction of reliable constraints and structure calculation.
Fig 4.8. Change in chemical shifts for imino-amino cross peaks, with increasing concentration of HT.
Fig 4.9. Most strongly perturbed protons (magenta spheres) in HT-TSMC NMR titrations. TSMC (cyan sticks) a) The major groove facing the reader b) minor groove facing the reader.
00.010.020.030.040.050.060.070.080.090.1
0 0.5 1 1.5 2
Δδ(p
pm)
HT/RNA ratio
G2NH1-C19H41G2NH1-C19H42G13NH1-C8H41G13NH1-C8H42G14NH1-C7H41G14NH1-C7H42G17NH1-C4H41G17NH1-C4H42G18NH1-C3H42G18NH1-C3H41

82
Mapping Paramagnetic Relaxation Enhancements (PRE)
Gd(DTPA-BMA) is an uncharged and highly water soluble molecule with a low
propensity to bind biomolecules. The paramagnetic agent enhances the relaxation rates of
the biomolecular protons as a function of their surface exposure and distance from the
surface.25 Upon binding of a ligand (usually a macromolecule), the nuclei at the binding
interface are protected from the relaxation agents. Thus a comparison of line broadening
with and without the ligand provides information regarding the binding interface.
In absence of HT, the H6-H5 NOE correlation for C7 and C16 experienced most
significant relaxation enhancement on addition of the paramagnetic agent, such that the
signal completely broadened out at the first titration point (Fig 4.10a). However, in the
HT-TSMC complex, the C16 was highly shielded such that the corresponding signal could
be observed even at the last titration point (Fig 4.10b). Unfortunately, overlap with the C7
correlation in the spectra of the batch II TSMC (see section on NMR assignments in
materials and methods), prevented quantification of the relaxation enhancement for this
residue. Additionally, the adenines in the tetraloop experienced slight shielding effects,
suggesting there might be some weak interaction occurring at the loop as well.
Fig 4.10. Paramagnetic relaxation enhancement for a) free TSMC (Black: reference spectra before addition of Gd(DTPA-BMA), Red: spectra after addition of 0.5 mM Gd(DTPA-BMA)) and b) TSMC-HT (1:1) complex (Black: reference, Red, Blue, Green: with 0.5 mM, 1.5 mM and 3.5 mM of Gd(DTPA-BMA) respectively) recorded as 1H-1H NOESY in 2H2O. The H6-H5 correlation for C16 bleached out completely in free TSMC whereas the corresponding correlations in TSMC-HT complex was shielded. Note: The experiments for the free TSMC and TSMC-HT complex were performed using the TSMC obtained in two separate batches from Biospring GmbH. The two batches presented different signal dispersions. Therefore the chemical shifts for the same peak in the a and b are very different. See the section on NMR assignments in Materials and Methods for details.
a b

83
Titrations with TSGC It is known from literature that HT can bind fully double stranded RNAs, but the
affinity is lower as compared to that in presence of mismatch or bulged regions.7,26 TSGC,
the fully base paired mutant of TSMC was used as a control to test the necessity of CC
mismatch in TSMC-HT interaction. TOCSY and NOESY spectra were recorded for TSGC,
but due to very high overlap in the NOESY spectrum, the signals could unfortunately not
be assigned. On titrations with HT, only one signal shifted considerably in the recorded
TOCSY (Fig 4.11). However if HT was interacting with TSGC in a similar manner as with
TSMC, then, strong perturbations for more than one signals, as was observed during the
TSMC-HT titrations (Fig 4.6) should have been observed. Since it was not the case, the
binding mode of HT with TSGC should be different than with TSMC.
Fig 4.11. A 2D 1H-1H 2H2O TOCSY overlay of TSGC chemical shift changes upon addition of HT with HT/RNA ratios of 0:1, 1:1 marked in black and red respectively.
Partial intercalation of HT During first step of the two step simulation protocol, i.e. A1 and B1 (see Methods
for details), the ligand HT docked as pose B was released into solvent within the first
nanosecond of the simulation, whereas, the docking pose A was maintained throughout the
simulation and the interactions between the RNA and ligand were optimized. Hereafter
pose B was discarded, and the final structure from A1 was taken further to the next step –
A2. To our surprise, during A2, HT penetrated across the helix thus adopting a partial
intercalative and partial groove binding mode (Fig 4.12). An interesting chain of events
led to the induced fit binding model. HT slid over the furrow in the surface formed by the
CC mismatch such that HT-H6 of the piperazine moiety could H-bond with the backbone
C5-O2P. While piperazine ring was so anchored, a rotation, driven by the possibility of H-
bonding between HN3 and G17-O6 occurred at the γ bond (Fig 4.13) (7-9 ns). This was
followed by formation of H-bond between HT-H1 and backbone G17-O2P (9.2 ns).

84
Simultaneously the C16 base began to flip out to stack against the ring R2 of HT. Stacking
against C16 and H-bonding between HT-N3 and G17-N7 were the key interactions that
permitted HT to reorient and penetrate across the helix, methylpiperazine first, at 11.2 ns.
To facilitate stacking of the aromatic base against HT, the sugar pucker of C5 ribose
changed from 3’ endo to 2’ endo. Such a conformational switch or selection (in case of
flexible sugars) is not unusual in RNA-ligand interactions.27,28 Infact, except for a few
cases, alternating C3’ endo/C2’ endo sugar puckers were observed at the site of
intercalation. It has been proposed that alternating sugar pucker provides an energetic
barrier that restricts intercalation to one ligand binding between every other base pair.29
Computational studies by Kollman et. al. suggest that alternating C3′ endo/C2′ endo sugar
pucker conformations around an intercalation site are energetically more favorable,
although ligand interactions with the phosphate backbone could cause intercalation sites
with nonalternating sugar puckers to exist.30
These results were obtained from a single simulation. In all other simulations,
using slightly different starting structures or modifying the time of equilibration, HT
floated away from the RNA at different time points ranging from 5-15 ns.
Fig 4.12. Partial intercalation of HT (pink carbons) in the C5-C16 mismatch of TSMC (cyan carbons), (blue: Nitrogen, red: Oxygen, orange: Phosphorus, white: Hydrogen).
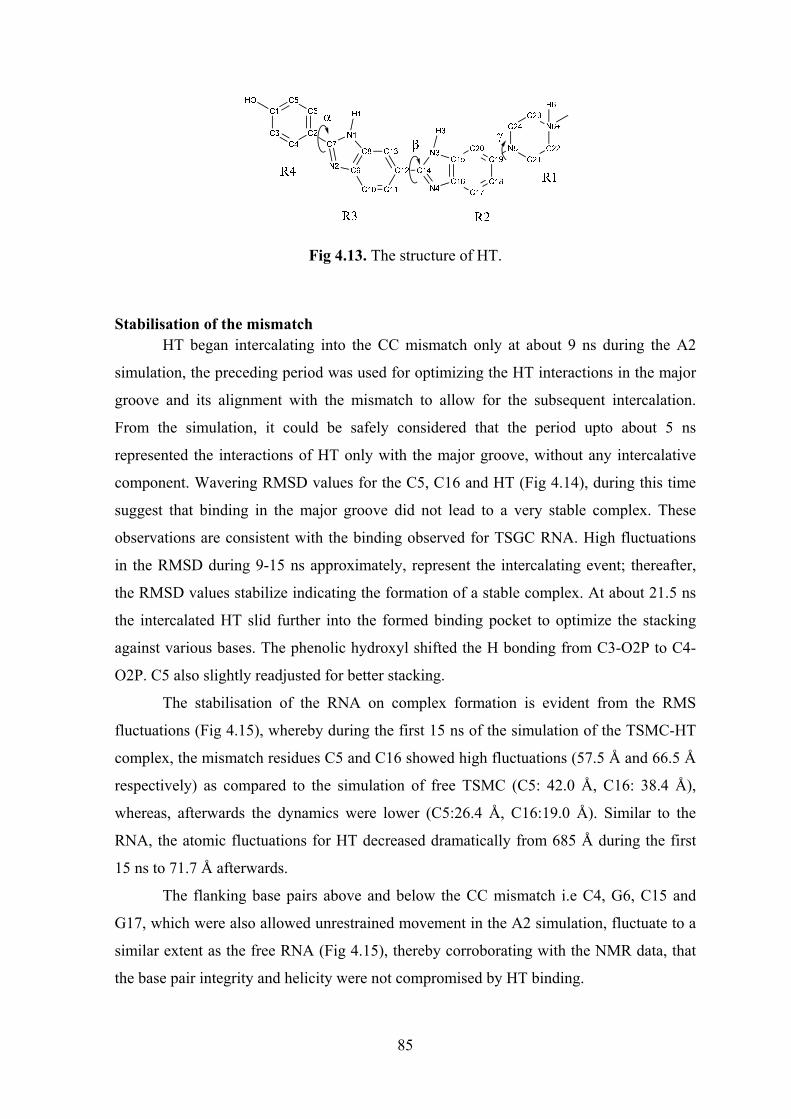
85
Fig 4.13. The structure of HT.
Stabilisation of the mismatch HT began intercalating into the CC mismatch only at about 9 ns during the A2
simulation, the preceding period was used for optimizing the HT interactions in the major
groove and its alignment with the mismatch to allow for the subsequent intercalation.
From the simulation, it could be safely considered that the period upto about 5 ns
represented the interactions of HT only with the major groove, without any intercalative
component. Wavering RMSD values for the C5, C16 and HT (Fig 4.14), during this time
suggest that binding in the major groove did not lead to a very stable complex. These
observations are consistent with the binding observed for TSGC RNA. High fluctuations
in the RMSD during 9-15 ns approximately, represent the intercalating event; thereafter,
the RMSD values stabilize indicating the formation of a stable complex. At about 21.5 ns
the intercalated HT slid further into the formed binding pocket to optimize the stacking
against various bases. The phenolic hydroxyl shifted the H bonding from C3-O2P to C4-
O2P. C5 also slightly readjusted for better stacking.
The stabilisation of the RNA on complex formation is evident from the RMS
fluctuations (Fig 4.15), whereby during the first 15 ns of the simulation of the TSMC-HT
complex, the mismatch residues C5 and C16 showed high fluctuations (57.5 Å and 66.5 Å
respectively) as compared to the simulation of free TSMC (C5: 42.0 Å, C16: 38.4 Å),
whereas, afterwards the dynamics were lower (C5:26.4 Å, C16:19.0 Å). Similar to the
RNA, the atomic fluctuations for HT decreased dramatically from 685 Å during the first
15 ns to 71.7 Å afterwards.
The flanking base pairs above and below the CC mismatch i.e C4, G6, C15 and
G17, which were also allowed unrestrained movement in the A2 simulation, fluctuate to a
similar extent as the free RNA (Fig 4.15), thereby corroborating with the NMR data, that
the base pair integrity and helicity were not compromised by HT binding.

86
Fig 4.14. RMSD vs time plot for various residues during the simulation A2. C5 and C16 are the residues in the mismatch. Flanking residues refers to the residues directly above and below the mismatch i.e C4, G6, C15 and G17 in the stem. Restrained residues refer to the remaining residues of the RNA, which were restrained throughout the simulation.
Fig 4.15. All atom root-mean-square fluctuations of TSMC in uncomplexed (green) and in complex with HT. The fluctuations during 0-15 ns of the simulation of the TSMC-HT complex, i.e. before formation of a stable complex are in blue, whereas for 15-24 ns i.e. after the complex had stabilised are in red.
Second binding site at the loop In the simulation B1, after the HT was released into the solvent, it floated back to
make stable van der Waals contacts with the sugar moieties in the GNRA tetraloop. Such
surface contacts were probably driven by the favorable desolvation of aromatic rings of
0
10
20
30
40
50
60
70
1 6 11 16
All
atom
fluc
tuat
ion
(Å)
Residue Index
0‐15 ns
15‐24 ns
Free TSMC
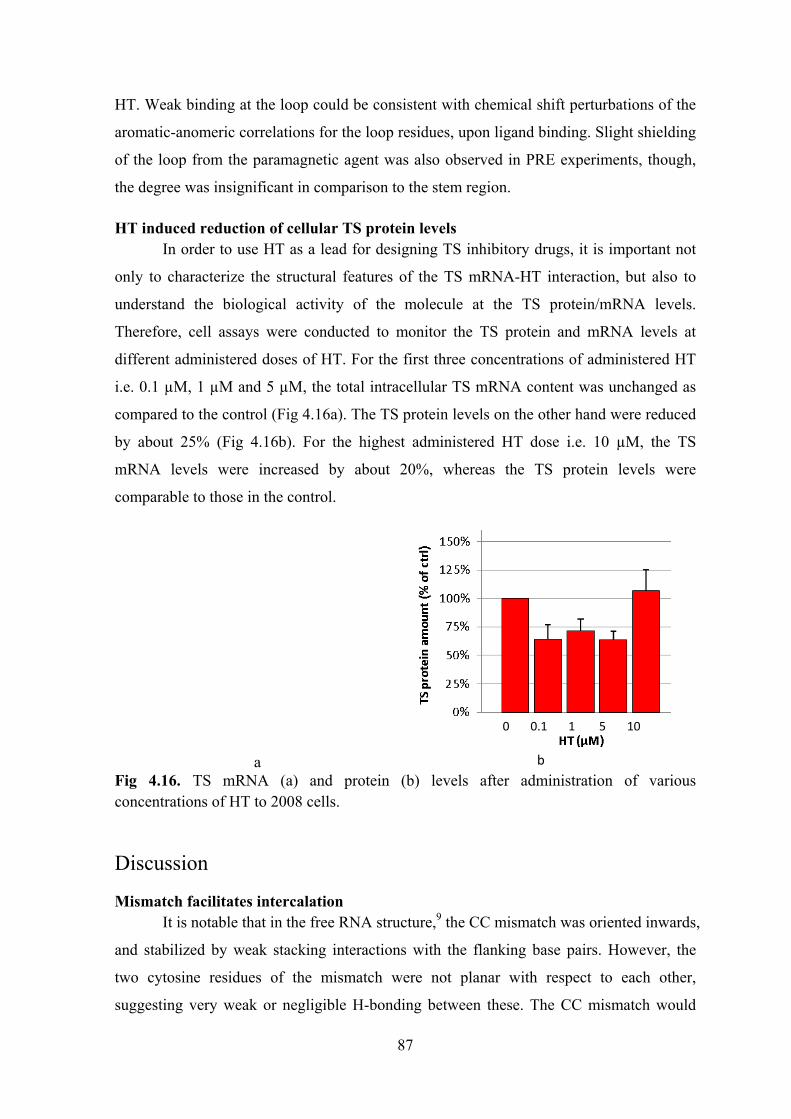
87
HT. Weak binding at the loop could be consistent with chemical shift perturbations of the
aromatic-anomeric correlations for the loop residues, upon ligand binding. Slight shielding
of the loop from the paramagnetic agent was also observed in PRE experiments, though,
the degree was insignificant in comparison to the stem region.
HT induced reduction of cellular TS protein levels In order to use HT as a lead for designing TS inhibitory drugs, it is important not
only to characterize the structural features of the TS mRNA-HT interaction, but also to
understand the biological activity of the molecule at the TS protein/mRNA levels.
Therefore, cell assays were conducted to monitor the TS protein and mRNA levels at
different administered doses of HT. For the first three concentrations of administered HT
i.e. 0.1 µM, 1 µM and 5 µM, the total intracellular TS mRNA content was unchanged as
compared to the control (Fig 4.16a). The TS protein levels on the other hand were reduced
by about 25% (Fig 4.16b). For the highest administered HT dose i.e. 10 µM, the TS
mRNA levels were increased by about 20%, whereas the TS protein levels were
comparable to those in the control.
a
b
Fig 4.16. TS mRNA (a) and protein (b) levels after administration of various concentrations of HT to 2008 cells.
Discussion
Mismatch facilitates intercalation It is notable that in the free RNA structure,9 the CC mismatch was oriented inwards,
and stabilized by weak stacking interactions with the flanking base pairs. However, the
two cytosine residues of the mismatch were not planar with respect to each other,
suggesting very weak or negligible H-bonding between these. The CC mismatch would
0 0.1 1 5 10

88
consequently be flexible and easily modulated in the presence of an external agent.
However, after intercalation of HT in the final segment of the molecular dynamics
simulation, the C5 was stacked against R2 (Fig 4.12) of HT while C16 was stacked against
R3 from the other side, forming a stable base-ligand-base sandwich. The ring system of
HT consisting of rings R2 and R3 also stacked against the base of C4, which was
otherwise solvent exposed in the free RNA. The phenolic hydroxyl of HT was H-bonded
to C4-O2P, whereas the methylpiperazine moiety protruded into the minor groove, and did
not make any interactions with the RNA. The amino group of C16 and C5 could H-bond
with amino groups of G6 and G17 respectively, forming sort of a base triplet. Thus overall,
the bound structure was stabilized mostly by new stacking interactions, ameliorated by
stabilization of existing intra-molecular H-bonds and formation of new ones. These
interactions would be missing if HT interacted with the RNA as a pure major or minor
groove binder, implying that such a complex would be much less stable. A non-
intercalative model would also not justify the essentiality of existence of a mismatch for
binding, but insensitivity to its nature.7 The observation that HT could stay in the major
groove of the RNA during the first step of the simulation - A1, is confirmed by the binding
observed for the TSGC and has been reported previously for other perfectly base paired
RNA helices.7,26
1H chemical shifts in intercalation When an aromatic molecule intercalates into a nucleic acid base paired system, the
ring-current shifts exerted on each base pair at the intercalation site by the other base pair,
are replaced by the generally larger ring-current shift from the ligand. This generally
results in an upfield shift of about 1 ppm, for the 1H signals in the imino spectra of DNA31
and RNA.28 Groove binders on the other hand cause downfield shifts. These observations
however, cannot be used as a confirmation of the binding mode. In principle, an aromatic
molecule can bind in the major groove with a geometry that would produce upfield shifts
of the imino proton resonances. The kinetics of binding also influence the change in
chemical shifts, as has been observed for tilorone and its derivatives. These molecules
intercalate specifically into the AT rich DNA and show intermediate exchange kinetics.
However, significant broadening and relatively small upfield shifts of about 0.1 ppm were
observed in the imino 1H spectra.31
Binding HT to TSMC resulted in upfield shift of upto 0.1 ppm for the imino
protons of G17 and G18, the H5 protons of C7/C16, C8 and C15 and the H6 protons of
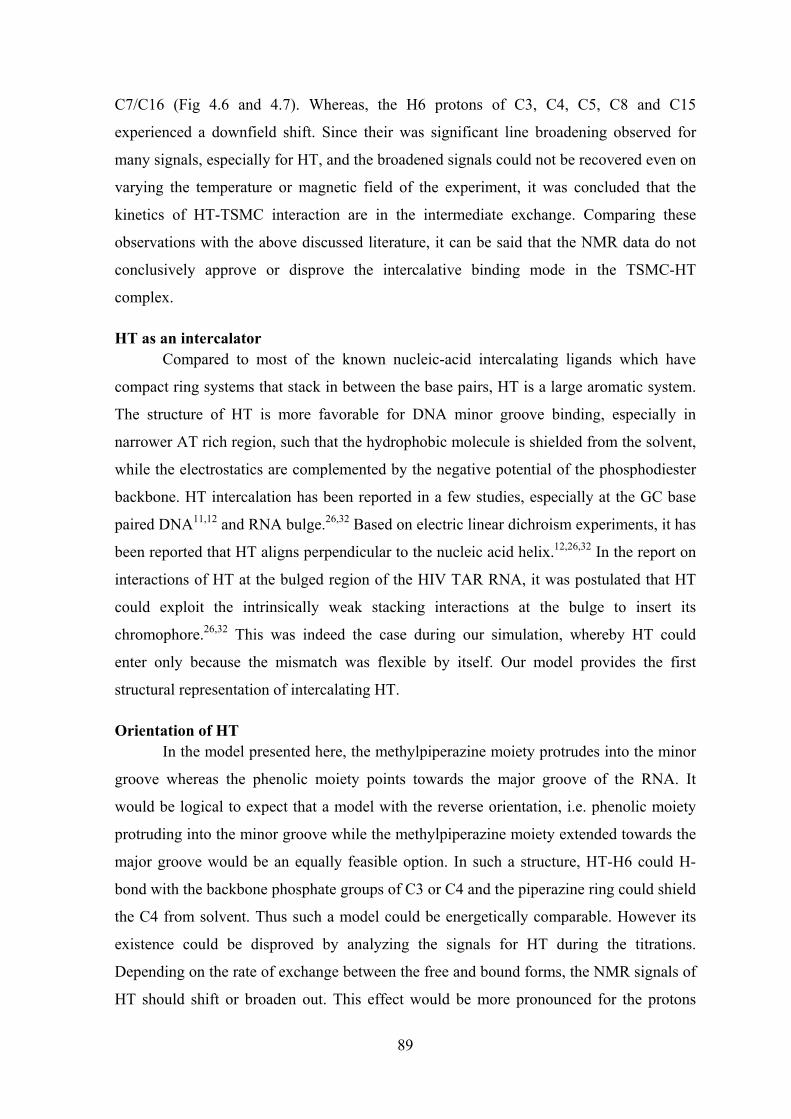
89
C7/C16 (Fig 4.6 and 4.7). Whereas, the H6 protons of C3, C4, C5, C8 and C15
experienced a downfield shift. Since their was significant line broadening observed for
many signals, especially for HT, and the broadened signals could not be recovered even on
varying the temperature or magnetic field of the experiment, it was concluded that the
kinetics of HT-TSMC interaction are in the intermediate exchange. Comparing these
observations with the above discussed literature, it can be said that the NMR data do not
conclusively approve or disprove the intercalative binding mode in the TSMC-HT
complex.
HT as an intercalator Compared to most of the known nucleic-acid intercalating ligands which have
compact ring systems that stack in between the base pairs, HT is a large aromatic system.
The structure of HT is more favorable for DNA minor groove binding, especially in
narrower AT rich region, such that the hydrophobic molecule is shielded from the solvent,
while the electrostatics are complemented by the negative potential of the phosphodiester
backbone. HT intercalation has been reported in a few studies, especially at the GC base
paired DNA11,12 and RNA bulge.26,32 Based on electric linear dichroism experiments, it has
been reported that HT aligns perpendicular to the nucleic acid helix.12,26,32 In the report on
interactions of HT at the bulged region of the HIV TAR RNA, it was postulated that HT
could exploit the intrinsically weak stacking interactions at the bulge to insert its
chromophore.26,32 This was indeed the case during our simulation, whereby HT could
enter only because the mismatch was flexible by itself. Our model provides the first
structural representation of intercalating HT.
Orientation of HT In the model presented here, the methylpiperazine moiety protrudes into the minor
groove whereas the phenolic moiety points towards the major groove of the RNA. It
would be logical to expect that a model with the reverse orientation, i.e. phenolic moiety
protruding into the minor groove while the methylpiperazine moiety extended towards the
major groove would be an equally feasible option. In such a structure, HT-H6 could H-
bond with the backbone phosphate groups of C3 or C4 and the piperazine ring could shield
the C4 from solvent. Thus such a model could be energetically comparable. However its
existence could be disproved by analyzing the signals for HT during the titrations.
Depending on the rate of exchange between the free and bound forms, the NMR signals of
HT should shift or broaden out. This effect would be more pronounced for the protons
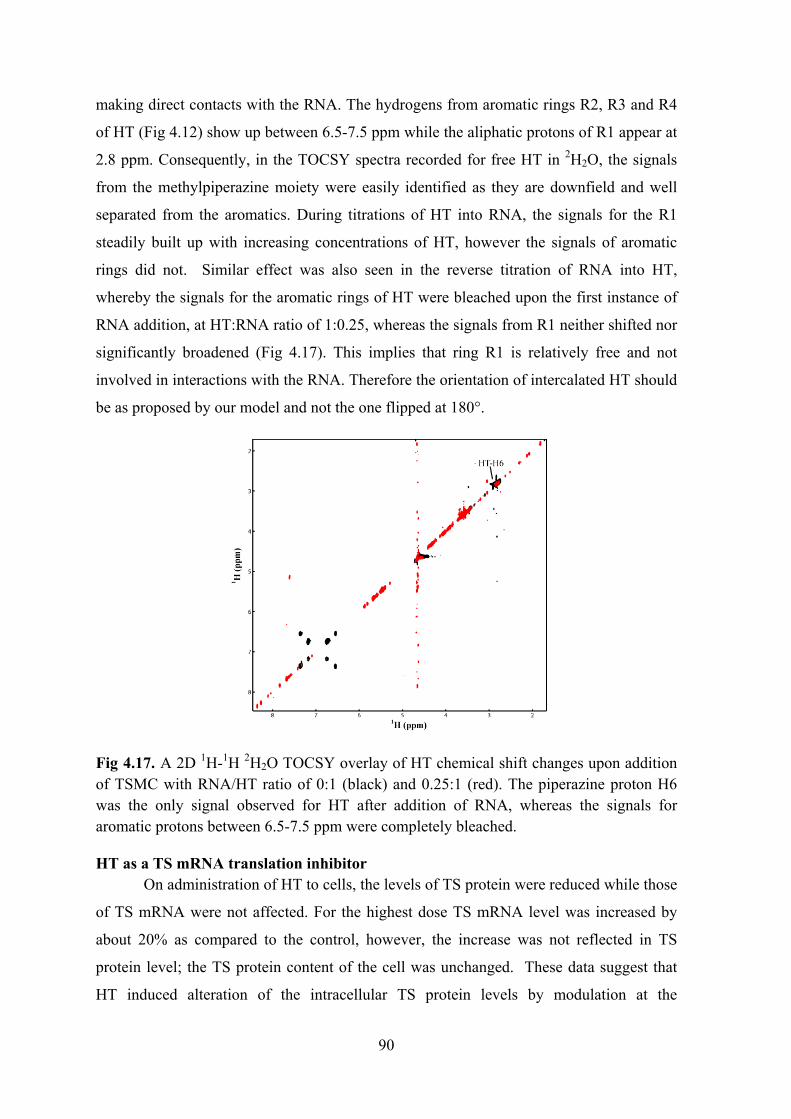
90
making direct contacts with the RNA. The hydrogens from aromatic rings R2, R3 and R4
of HT (Fig 4.12) show up between 6.5-7.5 ppm while the aliphatic protons of R1 appear at
2.8 ppm. Consequently, in the TOCSY spectra recorded for free HT in 2H2O, the signals
from the methylpiperazine moiety were easily identified as they are downfield and well
separated from the aromatics. During titrations of HT into RNA, the signals for the R1
steadily built up with increasing concentrations of HT, however the signals of aromatic
rings did not. Similar effect was also seen in the reverse titration of RNA into HT,
whereby the signals for the aromatic rings of HT were bleached upon the first instance of
RNA addition, at HT:RNA ratio of 1:0.25, whereas the signals from R1 neither shifted nor
significantly broadened (Fig 4.17). This implies that ring R1 is relatively free and not
involved in interactions with the RNA. Therefore the orientation of intercalated HT should
be as proposed by our model and not the one flipped at 180°.
Fig 4.17. A 2D 1H-1H 2H2O TOCSY overlay of HT chemical shift changes upon addition of TSMC with RNA/HT ratio of 0:1 (black) and 0.25:1 (red). The piperazine proton H6 was the only signal observed for HT after addition of RNA, whereas the signals for aromatic protons between 6.5-7.5 ppm were completely bleached.
HT as a TS mRNA translation inhibitor On administration of HT to cells, the levels of TS protein were reduced while those
of TS mRNA were not affected. For the highest dose TS mRNA level was increased by
about 20% as compared to the control, however, the increase was not reflected in TS
protein level; the TS protein content of the cell was unchanged. These data suggest that
HT induced alteration of the intracellular TS protein levels by modulation at the

91
translational level. This comes as a surprise, because HT being a strong DNA binder was
expected to preferentially modulate transcription and thereby the mRNA content of the
cells.
Though based on structural studies and in vivo experiments presented in this report,
it cannot be claimed that HT inhibits translation of TS by direct interaction with the TS-
mRNA, it is however a plausible option that interaction of HT with the distorted A-helical
motifs in the TS mRNA, including the site I, result in translational suppression.
Conclusions A structural model of the TSMC RNA construct in complex with HT was
developed using NMR and computational modeling techniques. HT presented a partial
intercalation and partial groove binding mode. The model complies well with our and
other reported experimental data, though additional experiments such as time resolved
fluorescence spectroscopy or electric linear dichroism should be done in order to verify the
intercalative mode of binding. Calculation of an experimental structure of the complex
either by X-ray crystallography, or calculation of the structure of HT bound RNA by
heteronuclear NMR experiments and using that for modeling the HT-TSMC complex
would be the only means of doubtlessly establishing the true binding mode. The biological
relevance of the work was confirmed by cell assays, whereby HT could reduce the TS
protein levels without perturbing the TS mRNA levels. This might be due to inhibition of
translation effected by HT binding to the Site1 like motifs in TS mRNA. However, further
experiments controlling for other factors such as the effect on intra-cellular translation
modulators of TS mRNA will have to be done in order to validate the true mechanism of
action. Though HT, being a cytotoxic molecule, cannot serve as a drug, its role as a small
molecule inhibitor of TS translation nevertheless makes it a potentially interesting lead for
drugs which modulate the translation of TS similarly.
References 1. Thomas, J. R.; Hergenrother, P. J. Targeting RNA with small molecules. Chem Rev 2008,
108, 1171-1224.
2. Wilson, W. D.; Li, K. Targeting RNA with small molecules. Curr Med Chem 2000, 7, 73-
98.

92
3. Kotra, L. P.; Haddad, J.; Mobashery, S. Aminoglycosides: perspectives on mechanisms of
action and resistance and strategies to counter resistance. Antimicrob Agents Chemother 2000, 44,
3249-3256.
4. Garg, D.; Henrich, S.; Salo-Ahen, O. M.; Myllykallio, H.; Costi, M. P.; Wade, R. C. Novel
approaches for targeting thymidylate synthase to overcome the resistance and toxicity of
anticancer drugs. J Med Chem 2010, 53, 6539-6549.
5. Chu, E.; Koeller, D. M.; Casey, J. L.; Drake, J. C.; Chabner, B. A.; Elwood, P. C.; Zinn, S.;
Allegra, C. J. Autoregulation of human thymidylate synthase messenger RNA translation by
thymidylate synthase. Proc Natl Acad Sci U S A 1991, 88, 8977-8981.
6. Chu, E.; Voeller, D.; Koeller, D. M.; Drake, J. C.; Takimoto, C. H.; Maley, G. F.; Maley,
F.; Allegra, C. J. Identification of an RNA binding site for human thymidylate synthase. Proc Natl
Acad Sci U S A 1993, 90, 517-521.
7. Cho, J.; Rando, R. R. Specific binding of Hoechst 33258 to site 1 thymidylate synthase
mRNA. Nucleic Acids Res 2000, 28, 2158-2163.
8. Tok, J. B.; Cho, J.; Rando, R. R. Aminoglycoside antibiotics are able to specifically bind
the 5'-untranslated region of thymidylate synthase messenger RNA. Biochemistry 1999, 38, 199-
206.
9. Tavares, T. J.; Beribisky, A. V.; Johnson, P. E. Structure of the cytosine-cytosine
mismatch in the thymidylate synthase mRNA binding site and analysis of its interaction with the
aminoglycoside paromomycin. RNA 2009, 15, 911-922.
10. Vega, M. C.; Garcia Saez, I.; Aymami, J.; Eritja, R.; Van der Marel, G. A.; Van Boom, J.
H.; Rich, A.; Coll, M. Three-dimensional crystal structure of the A-tract DNA dodecamer
d(CGCAAATTTGCG) complexed with the minor-groove-binding drug Hoechst 33258. Eur J
Biochem 1994, 222, 721-726.
11. Adhikary, A.; Buschmann, V.; Muller, C.; Sauer, M. Ensemble and single-molecule
fluorescence spectroscopic study of the binding modes of the bis-benzimidazole derivative
Hoechst 33258 with DNA. Nucleic Acids Res 2003, 31, 2178-2186.
12. Bailly, C.; Colson, P.; Henichart, J. P.; Houssier, C. The different binding modes of
Hoechst 33258 to DNA studied by electric linear dichroism. Nucleic Acids Res 1993, 21, 3705-
3709.
13. Colson, P.; Houssier, C.; Bailly, C. Use of electric linear dichroism and competition
experiments with intercalating drugs to investigate the mode of binding of Hoechst 33258, berenil
and DAPI to GC sequences. J Biomol Struct Dyn 1995, 13, 351-366.
14. Baraldi, P. G.; Bovero, A.; Fruttarolo, F.; Preti, D.; Tabrizi, M. A.; Pavani, M. G.;
Romagnoli, R. DNA minor groove binders as potential antitumor and antimicrobial agents. Med
Res Rev 2004, 24, 475-528.

93
15. Perez, A.; Marchan, I.; Svozil, D.; Sponer, J.; Cheatham, T. E., 3rd; Laughton, C. A.;
Orozco, M. Refinement of the AMBER force field for nucleic acids: improving the description of
alpha/gamma conformers. Biophys J 2007, 92, 3817-3829.
16. Furse, K. E.; Corcelli, S. A. The dynamics of water at DNA interfaces: computational
studies of Hoechst 33258 bound to DNA. J Am Chem Soc 2008, 130, 13103-13109.
17. Case, D. A.; Cheatham, T. E., 3rd; Darden, T.; Gohlke, H.; Luo, R.; Merz, K. M., Jr.;
Onufriev, A.; Simmerling, C.; Wang, B.; Woods, R. J. The Amber biomolecular simulation
programs. J Comput Chem 2005, 26, 1668-1688.
18. Jorgensen, W. L. Revised TIPS for simulations of liquid water and aqueous solutions. J
Chem Phys 1982, 77, 4156-4163.
19. Ryckaert, J.-P.; Ciccotti, G.; Berendsen, H. J. C. Numerical intergration of the cartesian
equations of motion of a system with constraints: Molecular dynamics of n-alkanes. J Comp Phys
1977, 23, 327-341.
20. Shields, G. C.; Laughton, C. A.; Orozco, M. Molecular Dynamics Simulations of the
d(T·A·T) Triple Helix. Journal of the American Chemical Society 1997, 119, 7463-7469.
21. Shields, G. C.; Laughton, C. A.; Orozco, M. Molecular Dynamics Simulation of a
PNA·DNA·PNA Triple Helix in Aqueous Solution. Journal of the American Chemical Society
1998, 120, 5895-5904.
22. Berendsen, H. J. C.; Postma, J. P. M.; van Gunsteren, W. F.; DiNola, A. H., J.R.
Molecular dynamics with coupling to an external bath. J Chem Phys 1984, 81, 3684-3690.
23. Lowry, O. H.; Rosebrough, N. J.; Farr, A. L.; Randall, R. J. Protein measurement with the
Folin phenol reagent. J Biol Chem 1951, 193, 265-275.
24. Arocho, A.; Chen, B.; Ladanyi, M.; Pan, Q. Validation of the 2-DeltaDeltaCt calculation
as an alternate method of data analysis for quantitative PCR of BCR-ABL P210 transcripts. Diagn
Mol Pathol 2006, 15, 56-61.
25. Pintacuda, G.; Otting, G. Identification of protein surfaces by NMR measurements with a
pramagnetic Gd(III) chelate. J Am Chem Soc 2002, 124, 372-373.
26. Dassonneville, L.; Hamy, F.; Colson, P.; Houssier, C.; Bailly, C. Binding of Hoechst
33258 to the TAR RNA of HIV-1. Recognition of a pyrimidine bulge-dependent structure. Nucleic
Acids Res 1997, 25, 4487-4492.
27. Fourmy, D.; Yoshizawa, S.; Puglisi, J. D. Paromomycin binding induces a local
conformational change in the A-site of 16 S rRNA. J Mol Biol 1998, 277, 333-345.
28. Horowitz, E. D.; Lilavivat, S.; Holladay, B. W.; Germann, M. W.; Hud, N. V. Solution
structure and thermodynamics of 2',5' RNA intercalation. J Am Chem Soc 2009, 131, 5831-5838.
29. Voet, D. Intercalation complexes of DNA. Nature 1977, 269, 285-286.
30. Dearing, A.; Weiner, P.; Kollman, P. A. Molecular mechanical studies of proflavine and
acridine orange intercalation. Nucleic Acids Res 1981, 9, 1483-1497.

94
31. Feigon, J.; Denny, W. A.; Leupin, W.; Kearns, D. R. Interactions of antitumor drugs with
natural DNA: proton NMR study of binding mode and kinetics. Journal of Medicinal Chemistry
1984, 27, 450-465.
32. Bailly, C.; Colson, P.; Houssier, C.; Hamy, F. The binding mode of drugs to the TAR
RNA of HIV-1 studied by electric linear dichroism. Nucleic Acids Res 1996, 24, 1460-1464.

95
Chapter 5. Structural Studies on Thymidylate Synthase - Ligand Interactions
Introduction As described in the first chapter, human thymidylate synthase (TS) exists in two
structural forms, active and inactive, differing in the orientation of active site loop. In the
active form, the catalytic cysteine C195 points towards the ligand binding site, thereby
permitting the catalytic function of the protein, whereas in the inactive form, the active site
loop is rotated by 180° and C195 points away from the binding site resulting in
catalytically inactive protein. Interaction with substrate dUMP promotes the transition
towards the active form. In view of inhibiting TS by trapping the protein in its inactive
form, a peptide called LR was identified by our collaborators in University of Modena,
Italy. From ITC data (from our collaborators) it has been possible to determine that in
solution TS presents two different populations and that LR binds only to the lesser one,
representing 1/3 of the total, without influencing the equilibrium between the populations.
dUMP on the other hand interacts with all the protein present in the sample. From nDSC
(data from our collaborators), it has emerged that the two protein populations present
different thermal stabilities and that LR indeed binds and stabilizes only one of them,
whereas dUMP interacts and stabilizes both populations, though stabilisation of the
smaller population takes about 6-9 hrs. Together, kinetic and thermodynamic studies
showed that about one third of the protein exists in inactive form, whereas the remaining
two thirds is in the active isoform. LR binds to the inactive isoform, stabilizing it and
preventing the subsequent conformational change to the active form, even in presence of
the substrate dUMP. By X-ray crystallography (data from our collaborators), it was shown
that LR interacts with the inactive TS at an allosteric binding site, located at the interface
of the two monomers of the TS homodimer and interfering with the movements of the
catalytic loop (Fig 5.1). The aim of this work was to follow with NMR, the transition
between the active and the inactive forms of TS, using the ligands dUMP and LR to
modulate the equilibrium.
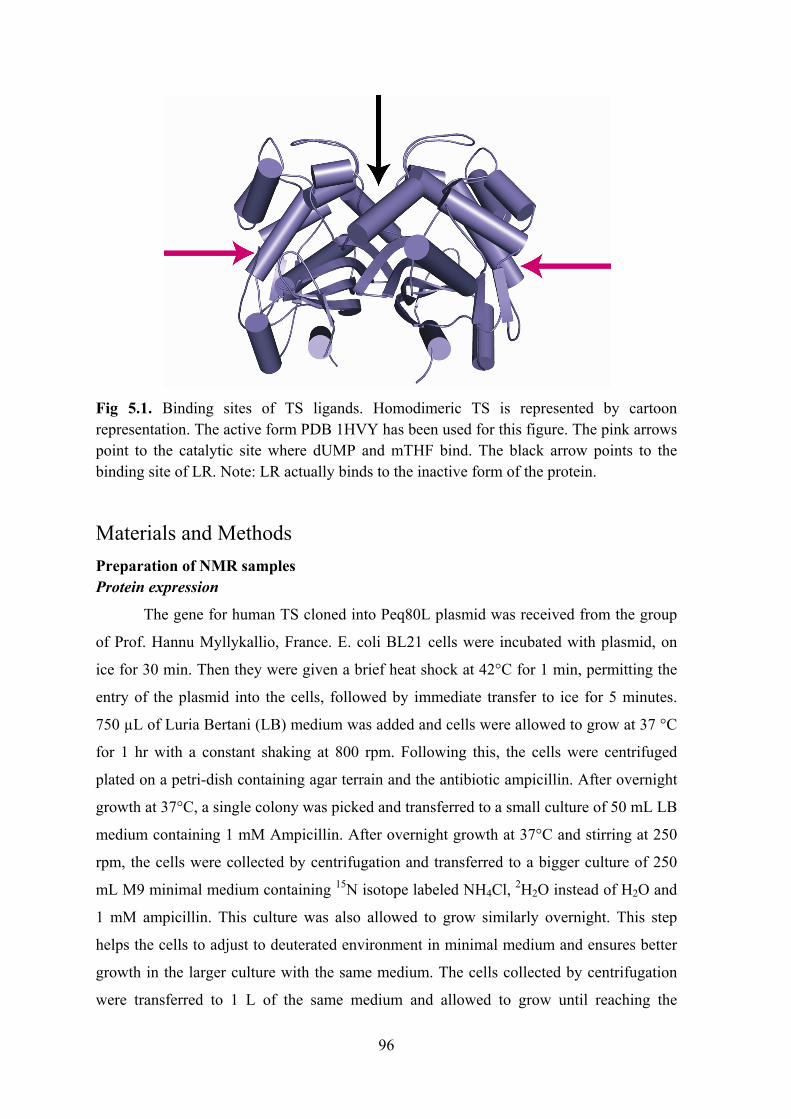
96
Fig 5.1. Binding sites of TS ligands. Homodimeric TS is represented by cartoon representation. The active form PDB 1HVY has been used for this figure. The pink arrows point to the catalytic site where dUMP and mTHF bind. The black arrow points to the binding site of LR. Note: LR actually binds to the inactive form of the protein.
Materials and Methods Preparation of NMR samples Protein expression
The gene for human TS cloned into Peq80L plasmid was received from the group
of Prof. Hannu Myllykallio, France. E. coli BL21 cells were incubated with plasmid, on
ice for 30 min. Then they were given a brief heat shock at 42°C for 1 min, permitting the
entry of the plasmid into the cells, followed by immediate transfer to ice for 5 minutes.
750 µL of Luria Bertani (LB) medium was added and cells were allowed to grow at 37 °C
for 1 hr with a constant shaking at 800 rpm. Following this, the cells were centrifuged
plated on a petri-dish containing agar terrain and the antibiotic ampicillin. After overnight
growth at 37°C, a single colony was picked and transferred to a small culture of 50 mL LB
medium containing 1 mM Ampicillin. After overnight growth at 37°C and stirring at 250
rpm, the cells were collected by centrifugation and transferred to a bigger culture of 250
mL M9 minimal medium containing 15N isotope labeled NH4Cl, 2H2O instead of H2O and
1 mM ampicillin. This culture was also allowed to grow similarly overnight. This step
helps the cells to adjust to deuterated environment in minimal medium and ensures better
growth in the larger culture with the same medium. The cells collected by centrifugation
were transferred to 1 L of the same medium and allowed to grow until reaching the

97
logarithmic growth phase (0.5 < OD600 < 0.7). Induction of recombinant protein
expression was then performed by addition of the non-metabolisable lac-inducer IPTG at 1
mM final concentration. Although the process is simple in theory, the BL21 cells tend to
form inclusion bodies very easily. This dramatically reduces the amount of recovered
soluble protein. Several induction conditions have been tested in order to reduce formation
of inclusion bodies and generally expression at 37 °C for 3 to 4 hours or at 20 °C
overnight seems to be suitable for most cases. Human TS does not tend to form inclusion
bodies in either case, however overnight induction at 20 °C yields higher amounts of
protein, and was thus used. The cells were harvested by centrifugation at 6000 g for 20
min.
Protein purification
Purification of human TS consists of following three steps
1) Breaking the cells: The harvested cells were broken in french press to obtain a
clear lysate with soluble protein.
2) Ni-Affinity Chromatography: The resin used in Ni-Affinity Chromatography
contained nickel bound to agarose beads by chelation using nitroloacetic acid (NTA)
beads. When the cell lysate was passed over the Ni-NTA resin, the 6X His tag at the N
terminus of the recombinant TS protein mediated the binding of the protein to the resin.
The unspecifically bound proteins were removed by washing the column with low
concentrations of upto 20 mM imidazole, in tris buffer at pH 8. Higher concentration (500
mM) of imidazole was used to elute the protein from the Ni-NTA beads. The eluted
protein was examined by SDS-PAGE for presence and purity of TS (Fig 5.2).
3) Size exclusion chromatography: Since the protein obtained from Ni-Affinity
Chromatography contained some impurities, size exclusion chromatography was used to
purify it further. In addition to purifying the protein, this step also allowed exchanging the
buffer to remove the high concentration of imidazole from the last step. HiLoad 16/60
Superdex S200 column was used at the ÄKTA – Purifier instrument. Before loading the
protein, the column was equilibrated using 1 column volume (130 mL) of double distilled
water followed by 1 column volume (130 mL) of final NMR buffer (50 mM NaPi, pH 8,
150 mM NaCl, 1 mM DTT). Fractions of 1.5 mL each were collected and examined for
the presence of TS and purity on SDS-PAGE (Fig. 5.3).
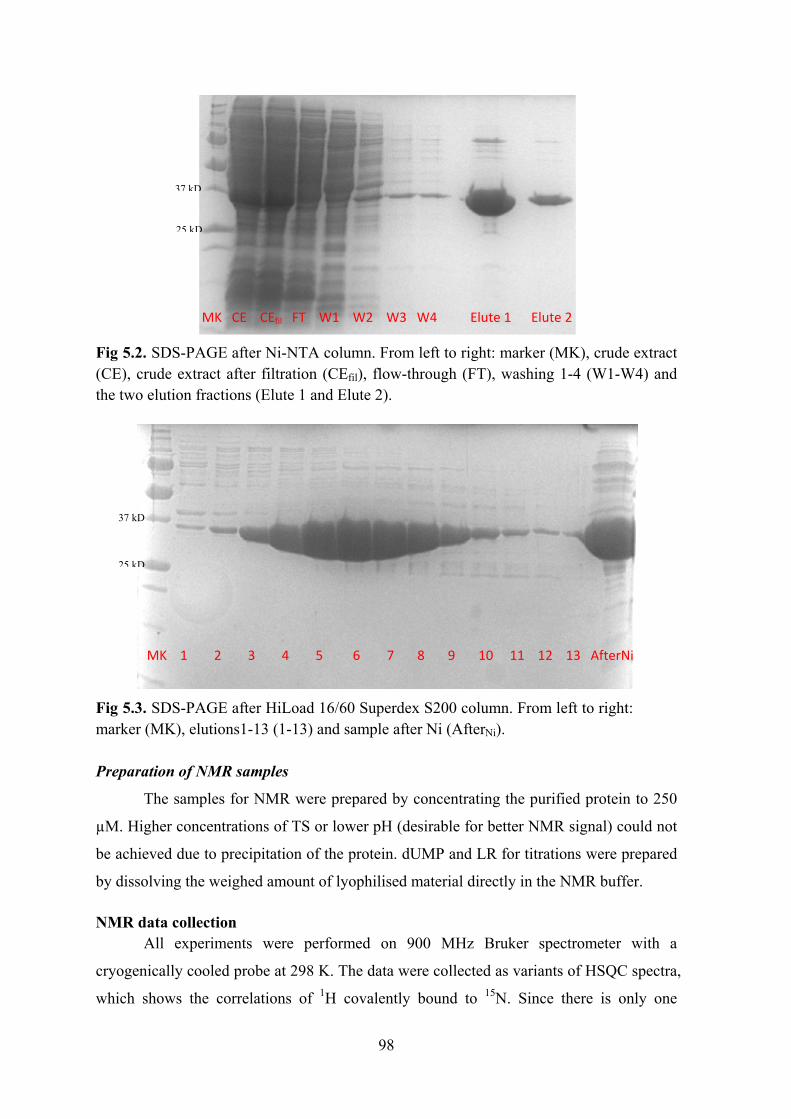
98
Fig 5.2. SDS-PAGE after Ni-NTA column. From left to right: marker (MK), crude extract (CE), crude extract after filtration (CEfil), flow-through (FT), washing 1-4 (W1-W4) and the two elution fractions (Elute 1 and Elute 2).
Fig 5.3. SDS-PAGE after HiLoad 16/60 Superdex S200 column. From left to right: marker (MK), elutions1-13 (1-13) and sample after Ni (AfterNi). Preparation of NMR samples
The samples for NMR were prepared by concentrating the purified protein to 250
µM. Higher concentrations of TS or lower pH (desirable for better NMR signal) could not
be achieved due to precipitation of the protein. dUMP and LR for titrations were prepared
by dissolving the weighed amount of lyophilised material directly in the NMR buffer.
NMR data collection All experiments were performed on 900 MHz Bruker spectrometer with a
cryogenically cooled probe at 298 K. The data were collected as variants of HSQC spectra,
which shows the correlations of 1H covalently bound to 15N. Since there is only one
MK CE CEfil FT W1 W2 W3 W4 Elute 1 Elute 2
37 kD
25 kD
MK 1 2 3 4 5 6 7 8 9 10 11 12 13 AfterNi
37 kD
25 kD
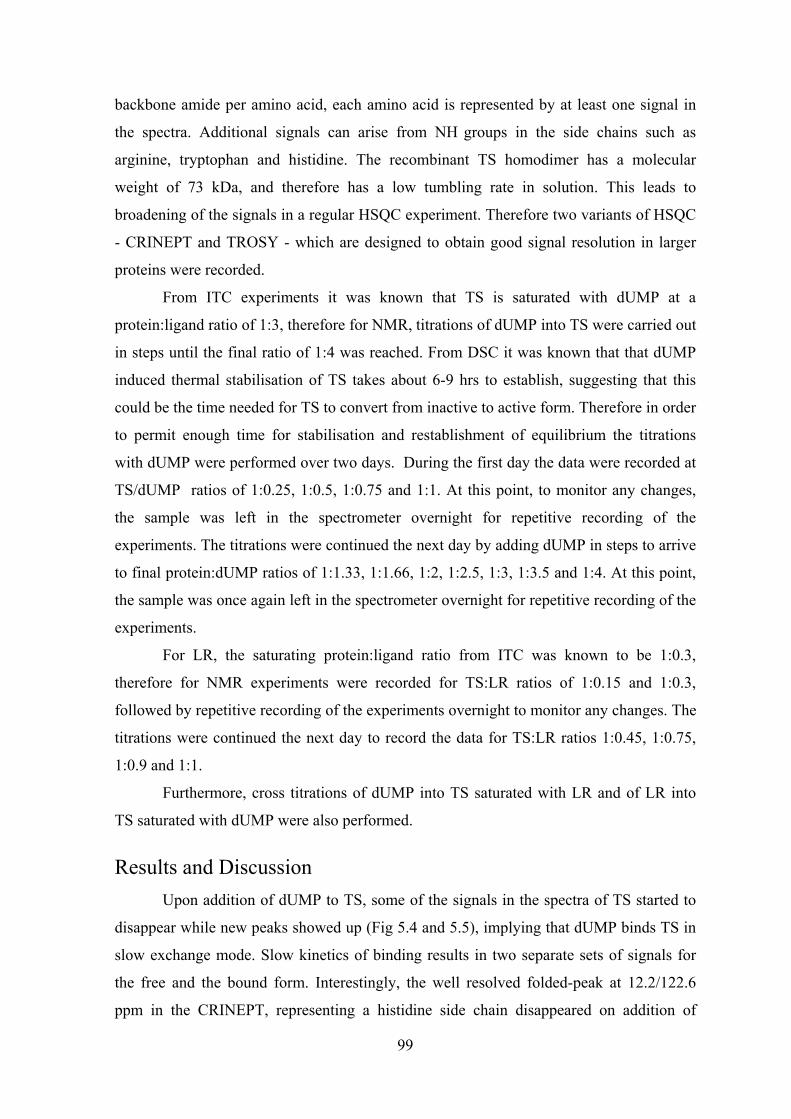
99
backbone amide per amino acid, each amino acid is represented by at least one signal in
the spectra. Additional signals can arise from NH groups in the side chains such as
arginine, tryptophan and histidine. The recombinant TS homodimer has a molecular
weight of 73 kDa, and therefore has a low tumbling rate in solution. This leads to
broadening of the signals in a regular HSQC experiment. Therefore two variants of HSQC
- CRINEPT and TROSY - which are designed to obtain good signal resolution in larger
proteins were recorded.
From ITC experiments it was known that TS is saturated with dUMP at a
protein:ligand ratio of 1:3, therefore for NMR, titrations of dUMP into TS were carried out
in steps until the final ratio of 1:4 was reached. From DSC it was known that that dUMP
induced thermal stabilisation of TS takes about 6-9 hrs to establish, suggesting that this
could be the time needed for TS to convert from inactive to active form. Therefore in order
to permit enough time for stabilisation and restablishment of equilibrium the titrations
with dUMP were performed over two days. During the first day the data were recorded at
TS/dUMP ratios of 1:0.25, 1:0.5, 1:0.75 and 1:1. At this point, to monitor any changes,
the sample was left in the spectrometer overnight for repetitive recording of the
experiments. The titrations were continued the next day by adding dUMP in steps to arrive
to final protein:dUMP ratios of 1:1.33, 1:1.66, 1:2, 1:2.5, 1:3, 1:3.5 and 1:4. At this point,
the sample was once again left in the spectrometer overnight for repetitive recording of the
experiments.
For LR, the saturating protein:ligand ratio from ITC was known to be 1:0.3,
therefore for NMR experiments were recorded for TS:LR ratios of 1:0.15 and 1:0.3,
followed by repetitive recording of the experiments overnight to monitor any changes. The
titrations were continued the next day to record the data for TS:LR ratios 1:0.45, 1:0.75,
1:0.9 and 1:1.
Furthermore, cross titrations of dUMP into TS saturated with LR and of LR into
TS saturated with dUMP were also performed.
Results and Discussion Upon addition of dUMP to TS, some of the signals in the spectra of TS started to
disappear while new peaks showed up (Fig 5.4 and 5.5), implying that dUMP binds TS in
slow exchange mode. Slow kinetics of binding results in two separate sets of signals for
the free and the bound form. Interestingly, the well resolved folded-peak at 12.2/122.6
ppm in the CRINEPT, representing a histidine side chain disappeared on addition of

100
dUMP, instead two new peaks at 12/121.2 ppm and 11.96/122.3 ppm appeared. This
suggests that either the correlation observed at 12.2/122.6 ppm in apo protein actually
contained overlapping signals from two residues, or that it represented a single residue
which is exposed to two alternative environments in the TS-dUMP complex.
Fig 5.4. CRINEPT spectrum overlay of apo TS (black/cyan) and TS-dUMP complex at 1:4 ratio (red/mustard). Inset: Starting from active (blue) /inactive (purple) mixture of apo TS populations, dUMP binds with and converts all the available protein to active form.
Fig 5.5. Overlay of TROSY spectra of apo TS (black/cyan) and TS-dUMP complex at 1:4 ratio (red/mustard). Inset: Starting from active (blue) /inactive (purple) mixture of apo-TS populations, dUMP binds with and converts all the available protein to active form.
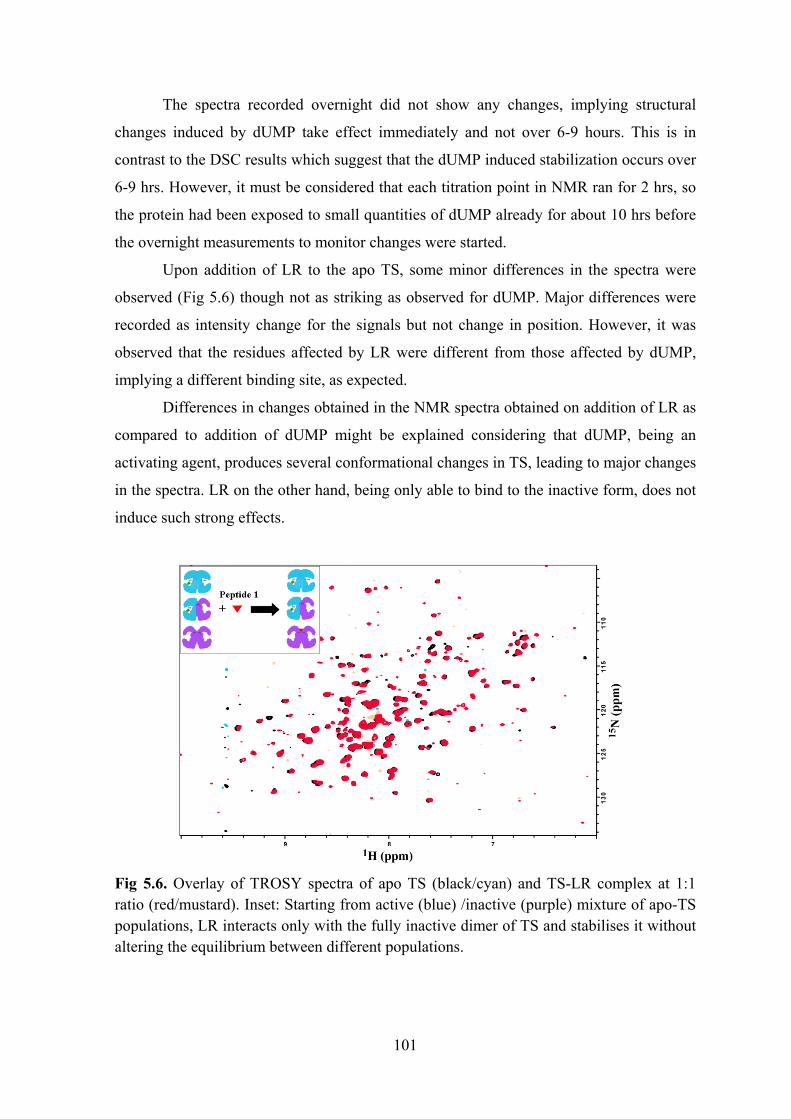
101
The spectra recorded overnight did not show any changes, implying structural
changes induced by dUMP take effect immediately and not over 6-9 hours. This is in
contrast to the DSC results which suggest that the dUMP induced stabilization occurs over
6-9 hrs. However, it must be considered that each titration point in NMR ran for 2 hrs, so
the protein had been exposed to small quantities of dUMP already for about 10 hrs before
the overnight measurements to monitor changes were started.
Upon addition of LR to the apo TS, some minor differences in the spectra were
observed (Fig 5.6) though not as striking as observed for dUMP. Major differences were
recorded as intensity change for the signals but not change in position. However, it was
observed that the residues affected by LR were different from those affected by dUMP,
implying a different binding site, as expected.
Differences in changes obtained in the NMR spectra obtained on addition of LR as
compared to addition of dUMP might be explained considering that dUMP, being an
activating agent, produces several conformational changes in TS, leading to major changes
in the spectra. LR on the other hand, being only able to bind to the inactive form, does not
induce such strong effects.
Fig 5.6. Overlay of TROSY spectra of apo TS (black/cyan) and TS-LR complex at 1:1 ratio (red/mustard). Inset: Starting from active (blue) /inactive (purple) mixture of apo-TS populations, LR interacts only with the fully inactive dimer of TS and stabilises it without altering the equilibrium between different populations.

102
Another spectra had been recorded to observe the arginine side chains. It was
observed that the signal at 8.7/87 ppm in the apo protein disappeared while a new one
appeared at 6.9/84 ppm on addition of LR (Fig 5.7), suggesting that at least one arginine
experienced a change in environment when TS formed a complex with LR. Notably, in the
crystal structure of the TS-LR complex, R163 of one monomer of TS H-bonds with the
backbone and the side chain of two residues of the peptidic inhibitor LR (Fig 5.8). As a
result the arginine is stabilised and looses its conformational flexibility. Since, R163 is the
only arginine in the binding pocket of LR and is involved in the complex formation, it was
hypothesised that the signal observed to change in the arginine specific spectrum is R163.
Fig 5.7. Overlay of spectra acquired in the region specific for arginines. Apo TS (black/cyan) and TS-LR complex at 1:1 ratio (red/mustard).
R163 in known to play an important role in active-inactive transformation of TS.1
In the inactive conformation of apo TS, R163 of one monomer H-bonds with the backbone
carbonyls of A191' and L192' from the other monomer, thereby stabilising the structure.
However, R163K mutant is incapable of forming equally strong H-bonds, resulting in
destabilisation of the inactive conformation. The mutant was 33% more active than
wildtype TS and crystallised in the active form, even under conditions where wild type TS
demonstrated the inactive conformation. These data suggested that non hydrogen bonded
R163, which is free to move, would permit conversion of TS to the active conformer,
whereas, R163 stabilised by hydrogen bonds in the inactive conformer has the potential to
trap the protein in this state.

103
When put together, the data suggest that interaction of LR with R163 could be
playing a key role in trapping the protein in the inactive form.
Fig 5.8. Crystal structure of TS-LR complex. Purple cartoon: TS protein, Sticks with carbons colored in pink: Arg 163, Sticks with carbons colored green: co-crystallised LR. The black beaded lines represent intramolucular hydrogen bonds. Cross-titrations were performed in order to study the effect of the dUMP and LR
on the pre-formed TS-LR and TS-dUMP complexes respectively. The spectra obtained
from the titration of dUMP into TS-LR complex matched perfectly well with the one
obtained from addition of dUMP to free TS (Fig 5.9). These results demonstrated that
dUMP could interact with TS, irrespective of the presence of LR, resulting in formation of
TS-dUMP complex. The LR is probably set free in presence of dUMP. Indeed, filtered
TOCSY experiment did confirm the presence free peptide after dUMP was added to the
TS-LR complex. However, since corresponding reference spectra for the TS-LR complex
before the addition of dUMP had not been recorded, it was not possible to confirm that
interaction with dUMP resulted in removal of LR from the TS-LR complex and that some
free LR was not already present in the sample. Addition of LR to pre-formed TS-dUMP
complex however failed to produce any changes in the spectra implying that LR could not
interact with TS bound to dUMP. These observations were in contrast to the expectations
based on the ITC data, which showed that LR has 10 times higher affinity for TS as
compared to dUMP and that dUMP is not able to interact with the population of TS bound
to LR.

104
Fig 5.9. Overlay of CRINEPT spectra of TS-dUMP complex at 1:4 ratio (red/mustard) and after addition of dUMP to TS-LR complex (black/cyan). Inset: Starting from active (blue) /inactive (purple) mixture of TS populations and inactive TS stabilised by LR (red), dUMP interacts with and converts all the available protein to the active form.
Conclusions and Perspectives In absence of complete peak assignment for the protein, it can only be assumed
that R163 in TS could be recognised as the key residue responsible for interaction with LR
and consequent stabilisation of the inactive form. The contrasting results obtained from
ITC and NMR demand further investigations before an explanation can be proposed. In
order to clearly identify residues involved in interactions with dUMP or LR, complete
assignment of the TS spectra should be done. Experiments with R163K mutant could
highlight the importance of this residue for interaction with LR and the role it plays in
stabilising the complex.
References 1. Gibson, L. M.; Lovelace, L. L.; Lebioda, L. The R163K mutant of human thymidylate
synthase is stabilized in an active conformation: structural asymmetry and reactivity of cysteine
195. Biochemistry 2008, 47, 4636-4643.

105
Chapter 6. Importance of Thymidylate Synthase in Sustaining Thymidine Rich Genome of Minimal Organism Wigglesworthia glossinidia brevipalpis Divita Garg, Rebecca C. Wade (Manuscript in preparation)
Introduction During the course of evolution of life, establishment of intimate contacts between
two living cells resulted in stable integration of one cell into the other, which ultimately
culminated in development of endosymbionts. Endosymbionts may be facultative or
obligate. Some species of obligate endosymbionts are transferred maternally from one
generation of the host animal to the next and thereby do not live outside of the host cells
during the entire course of their life. These bacteria reside in specialised cells, called
bacteriocytes, inside insect hosts and are a part of the developmental program of these
insects during embryogenesis and larval development.1 Cellular domestication over
millions of years has resulted in elimination of 70-75% of the ancestral genome in these
bacteria. Such bacteria which possess nearly minimal gene sets, 450-800 kbp, are called
minimal organisms. Attempts to cultivate these bacteria outside the host cells, in petri-
dishes, has yielded little success, demonstrating the adaptation and dependence they have
developed towards the endocellular environment provided by the host.
Unlike higher organisms, which tend to be GC rich,2 a peculiar feature of the
genetic content of minimal organisms is their high AT content (about 70%). In cells, the
base adenine and its conjugates can be synthesised from multiple pathways, such as by
modification of hypoxanthine or inosine bases or their conjugates. Thymidine on the other
hand has a single pathway for de novo synthesis, that involving conversion of 2'-
deoxyuridine-5'-monophosphate (dUMP) to 2'-deoxythymidine-5'-monophosphate
(dTMP). This reaction is catalysed by TS using 5,10-methylenetetrahydrofolate (mTHF)
as a cosubstrate. The other means employed by cells for obtaining dTMP is the so called
salvage pathway, where thymidine may be procured from extra-cellular sources and
converted to dTMP by thymidine kinase.

106
There are many published reports attempting to rationalize the increased AT
content of minimal organisms,3,4 however, none has characterised the enzymes which
would be necessary to supply the excess of these nucleotides. In this chapter, we report the
sequence and structural characterisation of thymidylate synthase of minimal organisms
with special emphasis on Wigglesworthia glossinidia brevipalpis (W.g.b).
Methods Sequence collection and homology modelling
163 sequences of TS and dihyfrofolate reductase (DHFR)-TS were collected from
swissprot (http://expasy.org/sprot). For the sequences where the DHFR and TS occur on
the same polypeptide, the sequence corresponding to DHFR and hinge sequence was
removed leaving only the sequence for TS. A multiple sequence alignment was made,
using default parameters in ClustalW, against the sequence extracted from the crystal
structure of human TS (hTS), PDB ID 1HVY.5 Sequences with less than 35% pairwise
identity to hTS, or insertions of more than 8 residues were removed, leaving 108
sequences. Homology models for the homodimeric protein were prepared by
Modeller9v16 using the automodel class. The dimer defined by chains A and B in protein
structure 1HVY was used as the template structure. Generated models were not refined by
molecular dynamics, instead rapid optimisation with conjugate gradients the 'very_fast'
method available in automodel was used.
Electrostatic calculations The electrostatic potentials were calculated using the APBS package.7 Prior to the
electrostatic calculation, the coordinates of the models were superimposed by sequence
alignment based matching of Cα atoms using the sup2pdb software (in house software),
hydrogen atoms were added and the models were minimised in pdb2pqr8 using the
debump option to remove any unfavourable steric contacts. The partial atomic charges and
the radii were assigned using the AMBER99 force-field. The relative dielectric constants
of the solute and the solvent were set at 1 and 78 respectively. The boundaries were
defined by Single Debye-Hückel method. The ionic strength of the solvent was set to 50
mM and the temperature was set to 298.15 K. The electrostatic potentials of the models
were computed by solving the linearised Poisson-Boltzmann equation on a 65x65x65 grid
with a spacing of 1.5 Å centred at the same point for all the proteins.

107
Similarity indices calculations The precomputed potentials were used to calculate the Hodgkin similarity indices
for each pair of proteins from equations 1 and 2, using the program Protein Interaction
Property Similarity Analysis (PIPSA).9 The conical region of 30 degrees was used to
define binding site in chain A of the homodimeric protein (Fig 6.1a). The two monomers
in the homodimer have a very low all-atom RMSD of 0.2 Å, therefore the two sites were
considered to be very similar.
Eq. 1
Eq. 2
where (p1,p2), (p1,p1) and (p2,p2) are the scalar products of the electrostatic
potentials over the region where the potentials are compared, is the electrostatic
potential and (i, j, k) are the grid points that are within the region of interest. Thus SI12 = 1
if the two potentials are identical; SI12 = 0 if they are uncorrelated; SI12 = -1 if they are anti
correlated.
Results and Discussion
Electrostatic analysis A heatmap of calculated pairwise similarity indices, ordered by the annotated
taxonomy of the organism from which the TS sequence was taken (Appendix 2), was
plotted (Fig 6.2). The dissimilar potentials of the minimal organisms Buchnera aphidicola
subsp. Baizongia pistaciae (B.b.p), Buchnera aphidicola subsp. Schizaphis graminum
(B.s.g) and W.g.b. were easily spotted as a blue strip in contrast against the otherwise
mostly red-yellow plot. The SIs for these minimal organisms to other TSs were in the
order of 0 or less, however, curiously, they were positively correlated to each other (Table
6.1). For the purpose of comparison, human and E. coli were chosen as representatives for
eukaryota and prokaryota respectively. Visualisation of the isopotential surfaces, revealed
that minimal organisms had large positive contours as compared to other TSs (Fig 6.1); the
positive potential was not limited only to the binding pocket but was spread all over the
protein. To probe a bit deeper into this unusual observation, a detailed analysis of TS in
minimal organisms was commenced.
),,(),,(),(
),(),(),(2
2,,
121
2211
2112
kjikjipp
ppppppSI
kjiφφ∑=
+=

108
a Human TS
b Human
c E. coli
d Buchnera SG
e Buchnera BP
f Wigglesworthia
Fig 6.1. a) The conical region (red) defined in TS binding pocket for PIPSA comparison. This figure also represents the orientation of the protein used for b-f. b-f) represent the isocontours of the electrostatic potential (blue 1 kT/e , red -1 kT/e).
P04818 (human)
P0A886 (E. coli)
Q8D2N4 (W.g.b)
P59427 (B.b.p)
Q8K9C3 (B.s.g)
W.g.b mutant
P04818 1 0.849 -0.080 -0.088 -0.002 0.635 P0A886 0.849 1 -0.466 -0.320 -0.254 0.389 Q8D2N4 -0.080 -0.466 1 0.794 0.851 0.363 P59427 -0.088 -0.320 0.794 1 0.930 0.552
Q8K9C3 -0.002 -0.254 0.851 0.930 1 0.593 W.g.b mutant 0.635 0.389 0.363 0.552 0.593 1
Table 6.1. Hodgkin similarity index values for electrostatic potential at the active site of TS of deviant minimal organisms. Human and E. coli have been used as representatives from the eukaryotes and prokaryotes respectively. W.g.b mut = W.g.b TS with K23, K82, K86, K257 mutated to corresponding E. coli residues G23, E82, E86, G257.

109
Fig 6.2. Heatmap of similarity index values for all the TS sequences analysed. The sequences are referred to by their Uniprot accession code. The names of the organisms to which the TS codes belong are given in appendix 2.
Essentiality of TS in minimal organisms Electrostatic potential of protein plays role in steering the ligands to the active site,
correct orientation and binding. A change in electrostatics of the active site could change
the kinetic profile of proteins. Since TS is a highly conserved and essential enzyme, it is
expected that any deleterious mutations adversely affecting the kinetics, unsuitable for the
organism would not be tolerated. However, minimal organisms are a special class of
organisms, which are on the downhill path for reducing the genome size. In absence of
robust DNA repair and recombination mechanisms, they tend to accumulate deleterious
mutations. Moreover they can depend on the host cell for a number of metabolic
P048
18P4
5352
P076
07O
9665
0O
7651
1O
6258
4P1
3100
Q9P
4T7
P453
51P0
6785
O81
395
Q2Q
RX6
P518
20P4
5350
Q05
762
Q27
828
O02
604
P139
22Q
2771
3P2
0712
Q07
422
Q27
793
Q27
783
P073
82P1
6126
Q23
695
Q6M
ID2
Q8P
CE7
Q8P
P46
Q5G
WB5
Q9I
6F1
Q83
BG2
Q60
3S2
Q5X
119
Q5W
SU5
Q5Z
RL3
Q8E
H94
Q87
BT4
Q9P
B13
P0A8
86Q
8ZH
V1Q
667F
9Q
6REU
8Q
7N8U
4P4
8464
Q5P
EN6
Q8Z
MA9
Q8Z
412
Q6D
8I6
P575
15P5
9427
Q8K
9C3
Q8D
2N4
P444
20Q
5R06
4Q
6FER
7Q
2NR
H3
O33
380
Q9J
T57
Q82
WU
3Q
9RAM
7Q
5P23
3Q
8Y0U
6Q
7NZ9
5P6
7042
P670
43Q
89G
35Q
98KH
9Q
6N44
7Q
92N
Q5
Q8U
DS3
Q9A
6H0
Q6F
Z91
Q6G
2S8
Q5Y
PL7
Q6A
761
Q6A
FI0
Q8G
3T9
Q73
VZ2
Q9C
BW0
P670
44P6
7045
Q6N
IF2
Q8F
R47
Q8N
S38
Q7M
TB5
Q8A
639
Q64
PV5
Q7U
ID0
Q5W
DS1
Q59
212
Q65
J44
Q9A
NR
7P4
2326
Q5D
189
Q9K
7B5
P540
81Q
67JQ
1Q
5KZ2
5Q
97EV
3P0
7606
P004
71P9
0463
P068
54P1
2462
Q89
940
P092
49P1
2462
2
-1250-1000-750-500-250
0250500750
10001250
Cell Plot
human E. coli Minimal Organisms
Fungi
Plantae
Euglenozoa
Alveolata

110
requirements. Thus one could be prompted to believe that TS could be one of such
enzymes which were unfavourably mutated, and that the thymidine synthesis pathway
might be on the route of deletion in these organisms. However the following two factors
should be considered before taking a decision. Firstly, the mutations in minimal organisms
generally tend to favour thymidine and adenine rich codons. Thus the cellular demand for
thymidine precursors for DNA should be reasonably high for sustenance of the organism.
Therefore if TS, the key enzyme for dTMP synthesis is dysfunctional or less active, the
organism will depend heavily on salvage pathway for the base, and the host cell should be
able to supply enough. Secondly, since minimal organisms are transferred maternally from
one generation of host to the next, they live in completely isolated environments. Unless
the environment inside the bacteriocytes of aphids and tsetse fly are similar, and the
mutations help the protein to adapt and function optimally in it, it would be unusual that
the mutations effecting the change in the electrostatics would be convergent, leading to
proteins similar to each other but dissimilar to the others.
Pyrimidine synthesis pathway The genomes of Buchnera and W.g.b have been sequenced and annotated. Based
on the genetics it has been possible to draw charts of the metabolic pathways possibly
existing in these organisms. Analysis of the pyrimidine biosynthesis pathway (Fig 6.3) of
Buchnera suggests that these organisms are able to synthesize UMP but the enzymes to
synthesize UTP, dUTP, dCTP and dTTP are missing.1 They should be able to convert
dUMP to dTMP and further to dTDP, but not dTTP. It has been suggested that while the
host aphid lacks the genes to code for the salvage pathway, Buchnera obtains the
nucleotides from the host aphid.10 Thus it might be expected that Buchnera has little use of
TS. W.g.b on the other hand has a complete pathway for pyrimidine biosynthesis,1 while
the gene for thymidine kinase, an important enzyme in the thymidine salvage pathway
catalysing the conversion of thymidine to dTMP is absent. So either W.g.b should be self
sufficient, or if it depends on the salvage pathway, the minimum it should uptake is dTMP.
Whereas aphids depend on Buchnera for certain amino acids, W.g.b provides tsetse
fly with vitamins including the folate. Thus it would be expected that W.g.b should possess
a functional folate pathway, TS being one of the enzymes in it. From these data it was not
evident if the TS in minimal organisms is active or not. However, the probability that the
TS in W.g.b would be functional is higher, thus, it was pursued further.
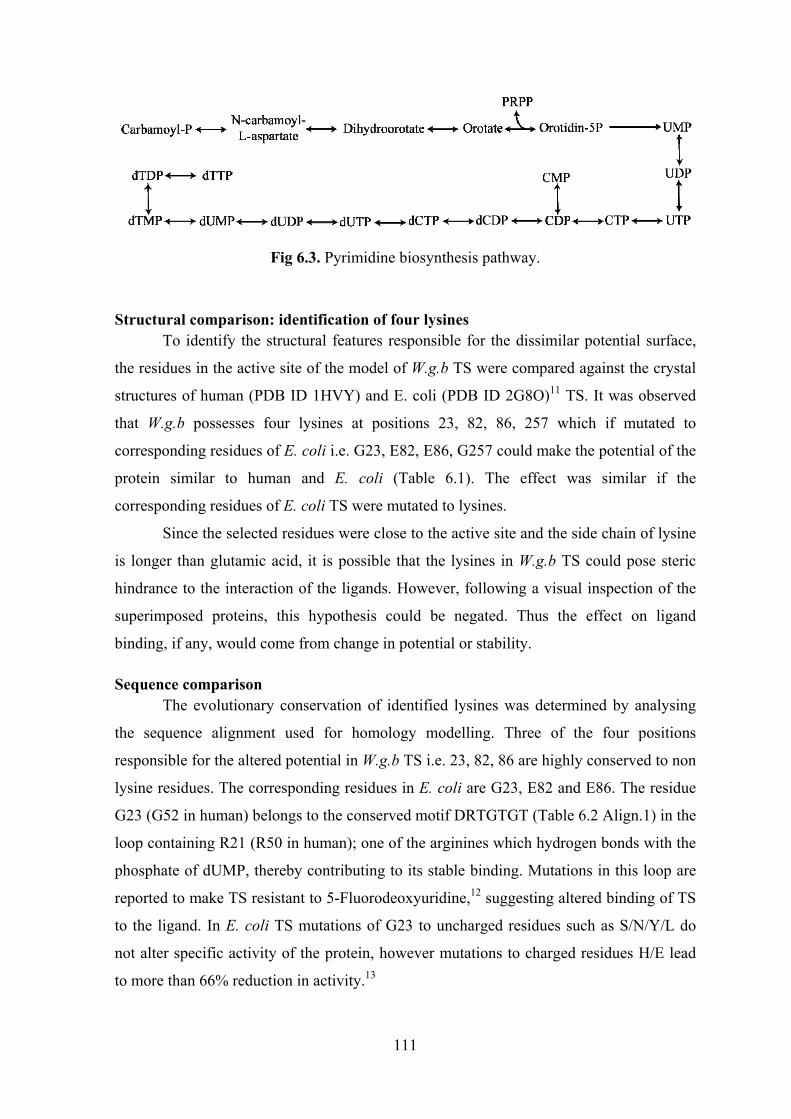
111
Fig 6.3. Pyrimidine biosynthesis pathway.
Structural comparison: identification of four lysines To identify the structural features responsible for the dissimilar potential surface,
the residues in the active site of the model of W.g.b TS were compared against the crystal
structures of human (PDB ID 1HVY) and E. coli (PDB ID 2G8O)11 TS. It was observed
that W.g.b possesses four lysines at positions 23, 82, 86, 257 which if mutated to
corresponding residues of E. coli i.e. G23, E82, E86, G257 could make the potential of the
protein similar to human and E. coli (Table 6.1). The effect was similar if the
corresponding residues of E. coli TS were mutated to lysines.
Since the selected residues were close to the active site and the side chain of lysine
is longer than glutamic acid, it is possible that the lysines in W.g.b TS could pose steric
hindrance to the interaction of the ligands. However, following a visual inspection of the
superimposed proteins, this hypothesis could be negated. Thus the effect on ligand
binding, if any, would come from change in potential or stability.
Sequence comparison The evolutionary conservation of identified lysines was determined by analysing
the sequence alignment used for homology modelling. Three of the four positions
responsible for the altered potential in W.g.b TS i.e. 23, 82, 86 are highly conserved to non
lysine residues. The corresponding residues in E. coli are G23, E82 and E86. The residue
G23 (G52 in human) belongs to the conserved motif DRTGTGT (Table 6.2 Align.1) in the
loop containing R21 (R50 in human); one of the arginines which hydrogen bonds with the
phosphate of dUMP, thereby contributing to its stable binding. Mutations in this loop are
reported to make TS resistant to 5-Fluorodeoxyuridine,12 suggesting altered binding of TS
to the ligand. In E. coli TS mutations of G23 to uncharged residues such as S/N/Y/L do
not alter specific activity of the protein, however mutations to charged residues H/E lead
to more than 66% reduction in activity.13

112
The residue E82 (N112 in human) is a part of the conserved motif IWD(*/-)
(E/N)(W/hydrophobic) (Table 6.2, Align.2) in the small domain of the protein. The small
domain is a flexible loop region which is stabilized on interaction with the ligands. Not
much literature on mutation tolerance of this loop could be found. In E. coli TS, W80
seems to be intolerant to mutations whereas D81 can accommodate most mutations. In our
dataset the residue at position 82 is mostly either glutamic acid or asparagine, W.g.b TS is
the only sequence with a positively charged residue at this position.
The residue E86 (D116 in human) is conserved in over 50% organisms and is also
located in the small domain. Only 9 out of 163 sequences had the positively charged
residue at this position. The fourth identified residue position 257 (K257 in W.g.b, G257 in
E. coli, T306 in human) on the C-terminus random coil of the protein is not a conserved
residue. Based on the homology models, as opposed to G257 or T306 of E. coli or human,
K257 in W.g.b TS can potentially hydrogen bond with the carboxyl group of the substrate
folate.
From these data, it is evident that the identified positions are important for the TS
activity, and that presence of lysines in the positions 23, 82 and 86 is unusual. However, it
was not possible to predict the effect these might have on the activity of the protein.
Human
E. coli
W.g.b.
Align. 1
49 DRTGTGT 55
20 DRTGTGT 26
20 DRTKTGT 26
Align. 2
108 IWDANG 113
79 IWD - EW 83
79 IWN - KW 83
Table 6.2. Sequence alignment of the two conserved motifs identified to contain an unusual lysine in W.g.b. K23 and K82 are two of the four lysines responsible for divergent electrostatics of W.g.b.
Lysines in the W.g.b proteome Since minimal organisms tend to accumulate mutations favouring AT rich codons,
their proteins tend to be abundant in isoleucines (coded by ATT, ATA, ATC) and lysines
(coded by AAA and AAG). The codon usage statistics for W.g.b and E. coli, were
obtained from Microbial Genome Usage Codon Database (MGCUD)
(http://bioinformatics.forsyth.org/mgcud). Codes for isoleucine (12%) and lysine (12%)
account for about a quarter of the total codon usage in W.g.b, as opposed to one tenth
(6%+4% respectively) in E. coli. An analysis of the complete proteome of the organisms,

113
downloaded from HAMAP,14 revealed that, 92.6% of the proteins in W.g.b, whereas only
37% proteins in E. coli, are positively charged. A comparison of frequency of arginine vs
lysine showed that in 98% of the proteins of W.g.b, the number of lysines exceeds the
number of arginines, whereas in E. coli arginines are more frequently observed (66%) than
lysines. The net charge at pH 7 and standard protonation states on TS in W.g.b is +13e as
opposed to negatively charged human (-2e) and E. coli (-9e) TSs. The overall lysine
content in W.g.b. TS (10%) is also double that of E. coli or human (5%).
These observations imply that the increased number of lysines and consequent
positive potential are not a specific feature of TS in W.g.b but merely confirm the general
trend of all proteins in the organism. It is therefore reasonable to expect that the TS in
W.g.b would be active, however in absence of further experiments, an estimation of its
specific activity cannot be made.
Conclusions Minimal organisms have particularly AT rich genomes. Since, TS is the sole
enzyme catalysisng de novo synthesis of thymidylate, and the pyrimidine synthesis
pathway of W.g.b is complete, an analysis of W.g.b TS was done. Like most of the other
proteins in W.g.b, TS is also positively charged and has high lysine content. Four lysines,
three of which are evolutionarily conserved to non lysine residues, were identified close to
the active site and to be responsible for the unique electrostatic potential observed for this
region. Even though predicting the activity of the protein is not possible, it can be
hypothesised that W.g.b TS would be active. Further experiments are needed to make a
confirmatory remark.
References 1. Zientz, E.; Dandekar, T.; Gross, R. Metabolic interdependence of obligate intracellular
bacteria and their insect hosts. Microbiol Mol Biol Rev 2004, 68, 745-770.
2. Bentley, S. D.; Parkhill, J. Comparative genomic structure of prokaryotes. Annu Rev Genet
2004, 38, 771-792.
3. Foerstner, K. U.; von Mering, C.; Hooper, S. D.; Bork, P. Environments shape the
nucleotide composition of genomes. EMBO Rep 2005, 6, 1208-1213.
4. Pal, C.; Papp, B.; Lercher, M. J.; Csermely, P.; Oliver, S. G.; Hurst, L. D. Chance and
necessity in the evolution of minimal metabolic networks. Nature 2006, 440, 667-670.

114
5. Phan, J.; Steadman, D. J.; Koli, S.; Ding, W. C.; Minor, W.; Dunlap, R. B.; Berger, S. H.;
Lebioda, L. Structure of human thymidylate synthase suggests advantages of chemotherapy with
noncompetitive inhibitors. J Biol Chem 2001, 276, 14170-14177.
6. Eswar, N.; Webb, B.; Marti-Renom, M. A.; Madhusudhan, M. S.; Eramian, D.; Shen, M.
Y.; Pieper, U.; Sali, A. Comparative protein structure modeling using MODELLER. Curr Protoc
Protein Sci 2007, Chapter 2, Unit 2 9.
7. Baker, N. A. Poisson-Boltzmann methods for biomolecular electrostatics. Methods
Enzymol 2004, 383, 94-118.
8. Dolinsky, T. J.; Nielsen, J. E.; McCammon, J. A.; Baker, N. A. PDB2PQR: an automated
pipeline for the setup of Poisson-Boltzmann electrostatics calculations. Nucleic Acids Res 2004,
32, W665-667.
9. Blomberg, N.; Gabdoulline, R. R.; Nilges, M.; Wade, R. C. Classification of protein
sequences by homology modeling and quantitative analysis of electrostatic similarity. Proteins
1999, 37, 379-387.
10. Ramsey, J. S.; MacDonald, S. J.; Jander, G.; Nakabachi, A.; Thomas, G. H.; Douglas, A.
E. Genomic evidence for complementary purine metabolism in the pea aphid, Acyrthosiphon
pisum, and its symbiotic bacterium Buchnera aphidicola. Insect Molecular Biology 2010, 19, 241-
248.
11. Newby, Z.; Lee, T. T.; Morse, R. J.; Liu, Y.; Liu, L.; Venkatraman, P.; Santi, D. V.; Finer-
Moore, J. S.; Stroud, R. M. The role of protein dynamics in thymidylate synthase catalysis:
variants of conserved 2'-deoxyuridine 5'-monophosphate (dUMP)-binding Tyr-261. Biochemistry
2006, 45, 7415-7428.
12. Landis, D. M.; Heindel, C. C.; Loeb, L. A. Creation and Characterization of 5-
Fluorodeoxyuridine-resistant Arg50 Loop Mutants of Human Thymidylate Synthase. Cancer
Research 2001, 61, 666-672.
13. Kim, C. W.; Michaels, M. L.; Miller, J. H. Amino acid substitution analysis of E. coli
thymidylate synthase: the study of a highly conserved region at the N-terminus. Proteins 1992, 13,
352-363.
14. Lima, T.; Auchincloss, A. H.; Coudert, E.; Keller, G.; Michoud, K.; Rivoire, C.; Bulliard,
V.; de Castro, E.; Lachaize, C.; Baratin, D.; Phan, I.; Bougueleret, L.; Bairoch, A. HAMAP: a
database of completely sequenced microbial proteome sets and manually curated microbial protein
families in UniProtKB/Swiss-Prot. Nucleic Acids Res 2009, 37, D471-478.

115
Appendix 1
Protocols used to minimize, heat and equilibrate the system in molecular dynamics
simulations
I.
II.
80 ps MD (solvent) T=100K
Minimise all system 1000 steepest descent
1500 conj. grad. converg. criter. 1.0E-4
kcal/mole-Å
40 ps MD, T=300K Solute restrained
(250 kcal/mol-Å2)
40 ps MD, T=300K Solute restrained
(100 kcal/mol-Å2)
20 ps MD, T=300K Solute restrained
(50 kcal/mol-Å2)
20 ps MD, T=300K Solute restrained
(25 kcal/mol-Å2)
20 ps MD, T=300K Solute restrained
(10 kcal/mol-Å2)
40 ps MD (solvent) T=100K
Minimise all system 1000 steepest descent
1500 conj. grad. converg. criter. 1.0E-4
kcal/mole-Å
20 ps MD, T=300K Solute restrained
(100 kcal/mol-Å2)
10 ps MD, T=300K Solute restrained
(50 kcal/mol-Å2)
10 ps MD, T=300K Solute restrained
(25 kcal/mol-Å2)
10 ps MD, T=300K Solute restrained
(10 kcal/mol-Å2)
10 ps MD, T=300K Solute restrained0 (5 kcal/mol-Å2)

116
117
Appendix 2
The list of Uniprot codes and corresponding organism and taxonomy, arranged according to the order in heatmap (Fig 6.2 in chapter 6). P04818, Human Chordata P45352, Rat Chordata P07607, Mouse Chordata O96650, Ascaris suum Nematoda O76511, Drosophila Arthropoda Glossina, Tsetse fly Arthropoda O62584, Encephalitozoon cuniculi Fungi Microsporidia P13100, Pneumocystis carinii Fungi Dikarya Q9P4T7, Agaricus bisporus Fungi Dikarya P45351, Cryptococcus neoformans Fungi Dikarya P06785, Saccharomyces cerevisiae Fungi Dikarya O81395, Zea mays Viridiplantae Streptophyta Q2QRX6, Oryza sativa Viridiplantae Streptophyta P51820, Glycine max Viridiplantae Streptophyta P45350, Daucus carota Viridiplantae Streptophyta Q05762, Arabidopsis thaliana Viridiplantae Streptophyta Q27828, Paramecium tetraurelia Alveolata Ciliophora O02604, Plasmodium vivax Alveolata Apicomplexa P13922, Plasmodium falciparum Alveolata Apicomplexa Q27713, Plasmodium berghei Alveolata Apicomplexa P20712, Plasmodium chabaudi Alveolata Apicomplexa Q07422, Toxoplasma gondii Alveolata Apicomplexa Q27793, Trypanosoma cruzi Euglenozoa Kinetoplastida Q27783, Trypanosoma brucei Euglenozoa Kinetoplastida P07382, Leishmania major Euglenozoa Kinetoplastida P16126, Leishmania amazonensis Euglenozoa Kinetoplastida Q23695, Crithidia fasciculata Euglenozoa Kinetoplastida Q6MID2, Bdellovibrio bacteriovorus Proteobacteria Deltaproteobacteria Q8PCE7, Xanthomonas campestris Proteobacteria Gammaproteobacteria Q8PP46, Xanthomonas axonopodi Proteobacteria Gammaproteobacteria Q5GWB5, Xanthomonas oryzae Proteobacteria Gammaproteobacteria Q9I6F1, Pseudomonas aeruginosa Proteobacteria Gammaproteobacteria Q83BG2, Coxiella burnetii Proteobacteria Gammaproteobacteria Q603S2, Methylococcus capsulatus Proteobacteria Gammaproteobacteria Q5X119, Legionella pneumophila Proteobacteria Gammaproteobacteria Q5WSU5, Legionella pneumophila Proteobacteria Gammaproteobacteria Q5ZRL3, Legionella pneumophila Proteobacteria Gammaproteobacteria Q8EH94, Shewanella oneidensis Proteobacteria Gammaproteobacteria Q87BT4, Xylella fastidiosa Proteobacteria Gammaproteobacteria Q9PB13, Xylella fastidiosa Proteobacteria Gammaproteobacteria

118
P0A886, Escherichia coli Proteobacteria Gammaproteobacteria Q8ZHV1, Yersinia pestis Proteobacteria Gammaproteobacteria Q667F9, Yersinia pseudotuberculosi Proteobacteria Gammaproteobacteria Q6REU8, Xenorhabdus nematophilus Proteobacteria Gammaproteobacteria Q7N8U4, Photorhabdus luminescens Proteobacteria Gammaproteobacteria P48464, Shigella flexneri Proteobacteria Gammaproteobacteria Q5PEN6, Salmonella paratyphi-a Proteobacteria Gammaproteobacteria Q8ZMA9, Salmonella typhimurium Proteobacteria Gammaproteobacteria Q8Z412, Salmonella typhi Proteobacteria Gammaproteobacteria Q6D8I6, Erwinia carotovora Proteobacteria Gammaproteobacteria; P57515, Buchnera aphidicola Proteobacteria Gammaproteobacteria P59427, Buchnera aphidicola Proteobacteria Gammaproteobacteria Q8K9C3, Buchnera aphidicola Proteobacteria Gammaproteobacteria Q8D2N4, Wigglesworthia glossinidia brevipalpis Proteobacteria Gammaproteobacteria P44420, Haemophilus influenzae Proteobacteria Gammaproteobacteria Q5R064, Idiomarina loihiensis Proteobacteria Gammaproteobacteria Q6FER7, Acinetobacter sp Proteobacteria Gammaproteobacteria Q2NRH3, Sodalis glossinidius Proteobacteria Gammaproteobacteria O33380, Neisseria gonorrhoeae Proteobacteria Betaproteobacteria Q9JT57, Neisseria meningitidis Proteobacteria Betaproteobacteria Q82WU3, Nitrosomonas europaea Proteobacteria Betaproteobacteria Q9RAM7, Methylobacillus flagellatus Proteobacteria Betaproteobacteria Q5P233, Azoarcus sp. Proteobacteria Betaproteobacteria Q8Y0U6, Ralstonia solanacearum Proteobacteria Betaproteobacteria Q7NZ95, Chromobacterium violaceum Proteobacteria Betaproteobacteria P67042, Brucella melitensis Proteobacteria Alphaproteobacteria P67043, Brucella suis Proteobacteria Alphaproteobacteria Q89G35, Bradyrhizobium japonicum Proteobacteria Alphaproteobacteria Q98KH9, Rhizobium loti Proteobacteria Alphaproteobacteria Q6N447, Rhodopseudomonas palustris Proteobacteria Alphaproteobacteria Q92NQ5, Rhizobium meliloti Proteobacteria Alphaproteobacteria Q8UDS3, Agrobacterium tumefaciens Proteobacteria Alphaproteobacteria Q9A6H0, Caulobacter crescentus Proteobacteria Alphaproteobacteria Q6FZ91, Bartonella quintana Proteobacteria Alphaproteobacteria Q6G2S8, Bartonella henselae Proteobacteria Alphaproteobacteria Q5YPL7, Nocardia farcinica Actinobacteria Actinobacteridae Q6A761, Propionibacterium acnes Actinobacteria Actinobacteridae Q6AFI0, Leifsonia xyli subsp. xyli Actinobacteria Actinobacteridae Q8G3T9, Bifidobacterium longum Actinobacteria Actinobacteridae Q73VZ2, Mycobacterium paratuberculosis Actinobacteria Actinobacteridae Q9CBW0, Mycobacterium leprae Actinobacteria Actinobacteridae P67044, Mycobacterium tuberculosis Actinobacteria Actinobacteridae P67045, Mycobacterium bovis Actinobacteria Actinobacteridae Q6NIF2, Corynebacterium diphtheriae Actinobacteria Actinobacteridae Q8FR47, Corynebacterium efficiens Actinobacteria Actinobacteridae Q8NS38, Corynebacterium glutamicum Actinobacteria Actinobacteridae

119
Q7MTB5, Porphyromonas gingivalis Bacteroidetes Bacteroidetes Q8A639, Bacteroides thetaiotaomicron Bacteroidetes Bacteroidetes Q64PV5, Bacteroides fragilis Bacteroidetes Bacteroidetes D0JBG7 Blattabacterium sp. subsp. Blattella germanica Bacteroidetes Flavobacteria D0J8U9 Blattabacterium sp. subsp. Periplaneta americana Bacteroidetes Flavobacteria Q7UID0, Rhodopirellula baltica Planctomycetes Planctomycetacia Q5WDS1, Bacillus clausii Firmicutes Bacillales Q59212, Bacillus licheniformis Firmicutes Bacillales Q65J44, Bacillus licheniformis Firmicutes Bacillales Q9ANR7, Bacillus mojavensis Firmicutes Bacillales P42326, Bacillus subtilis Firmicutes Bacillales Q5D189, Bacillus subtilis Firmicutes Bacillales Q9K7B5, Bacillus halodurans Firmicutes Bacillales P54081, Bacillus amyloliquefaciens Firmicutes Bacillales Q67JQ1, Symbiobacterium thermophilum Firmicutes Lactobacillales Q5KZ25, Geobacillus kaustophilus Firmicutes Bacillales Q97EV3, Clostridium acetobutylicum Firmicutes Clostridia P07606, Bacteriophage phi-3T P00471, Bacteriophage T4 P90463, Human herpesvirus 8 P06854, Saimiriine herpesvirus 2 P12462, Herpesvirus ateles Q89940, Equine herpesvirus P09249, Varicella-zoster P12462, Herpesvirus ateles

120
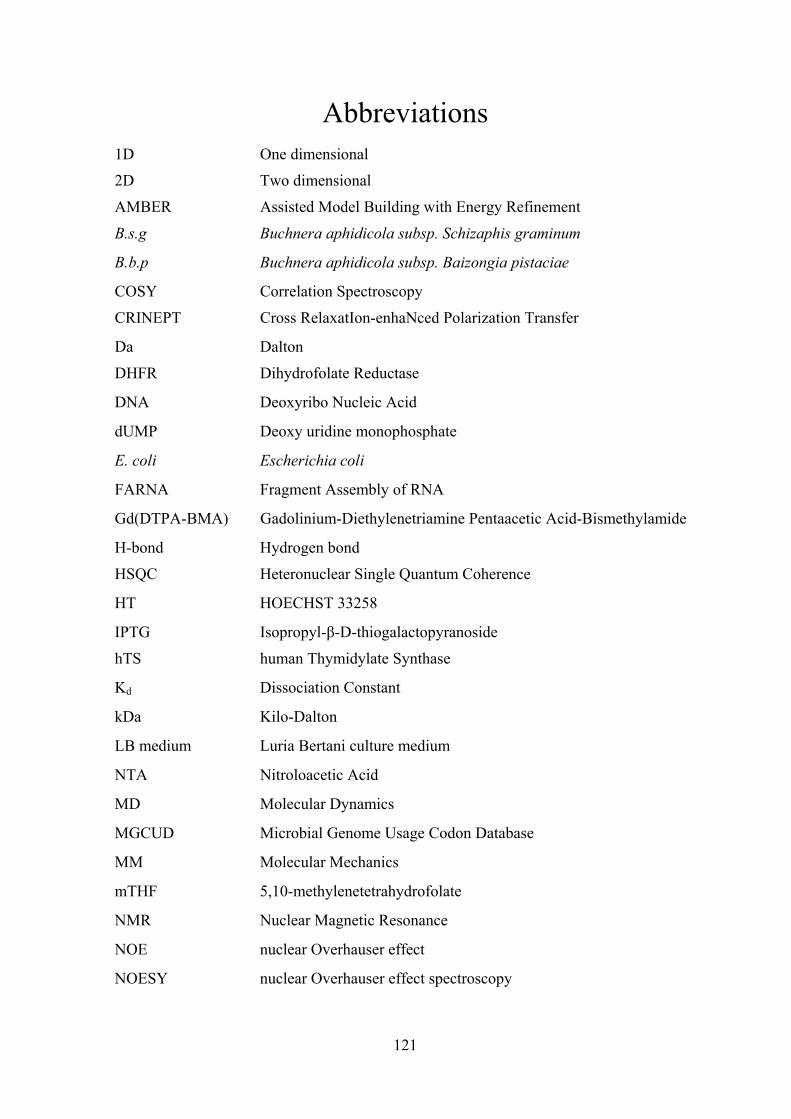
121
Abbreviations 1D One dimensional
2D Two dimensional
AMBER Assisted Model Building with Energy Refinement
B.s.g Buchnera aphidicola subsp. Schizaphis graminum
B.b.p Buchnera aphidicola subsp. Baizongia pistaciae
COSY Correlation Spectroscopy
CRINEPT Cross RelaxatIon-enhaNced Polarization Transfer
Da Dalton
DHFR Dihydrofolate Reductase
DNA Deoxyribo Nucleic Acid
dUMP Deoxy uridine monophosphate
E. coli Escherichia coli
FARNA Fragment Assembly of RNA
Gd(DTPA-BMA) Gadolinium-Diethylenetriamine Pentaacetic Acid-Bismethylamide
H-bond Hydrogen bond
HSQC Heteronuclear Single Quantum Coherence
HT HOECHST 33258
IPTG Isopropyl-β-D-thiogalactopyranoside
hTS human Thymidylate Synthase
Kd Dissociation Constant
kDa Kilo-Dalton
LB medium Luria Bertani culture medium
NTA Nitroloacetic Acid
MD Molecular Dynamics
MGCUD Microbial Genome Usage Codon Database
MM Molecular Mechanics
mTHF 5,10-methylenetetrahydrofolate
NMR Nuclear Magnetic Resonance
NOE nuclear Overhauser effect
NOESY nuclear Overhauser effect spectroscopy
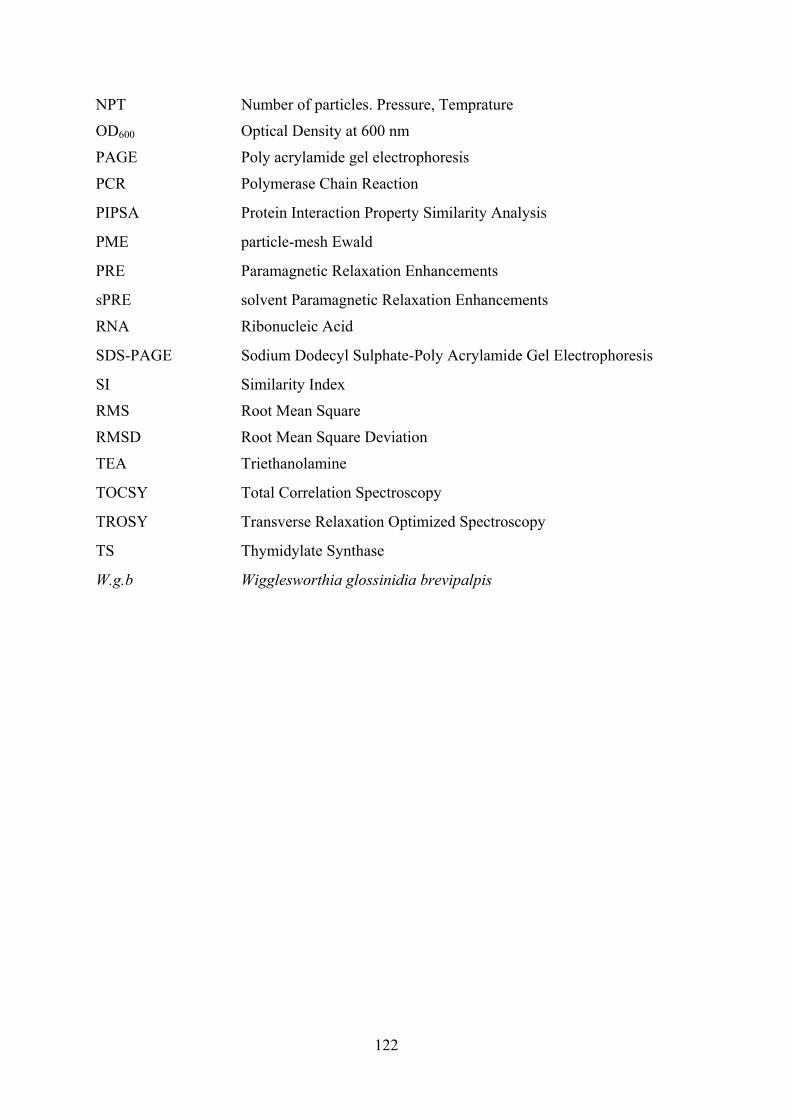
122
NPT Number of particles. Pressure, Temprature
OD600 Optical Density at 600 nm
PAGE Poly acrylamide gel electrophoresis
PCR Polymerase Chain Reaction
PIPSA Protein Interaction Property Similarity Analysis
PME particle-mesh Ewald
PRE Paramagnetic Relaxation Enhancements
sPRE solvent Paramagnetic Relaxation Enhancements
RNA Ribonucleic Acid
SDS-PAGE Sodium Dodecyl Sulphate-Poly Acrylamide Gel Electrophoresis
SI Similarity Index
RMS Root Mean Square
RMSD Root Mean Square Deviation
TEA Triethanolamine
TOCSY Total Correlation Spectroscopy
TROSY Transverse Relaxation Optimized Spectroscopy
TS Thymidylate Synthase
W.g.b Wigglesworthia glossinidia brevipalpis

123
List of Figures Fig 2.1. The Watson-Crick base pairs AU and GC and the wobble base pair GU.
Fig 2.2. a) Aromatic anomeric NOE contacts observed for an A form helix. b) H5-H6 correlations observable for pyirmidines.
Fig 2.3. Effect of exchange rate, temperature and magnetic field on the observed chemical shifts.
Fig 2.4. Physical representation for use of solvent PREs to identify the receptor-ligand interface.
Fig 2.5. Plot of Lennard-Jones energy (E) vs distance r.
Fig 3.1. The secondary structure predictions for RNA. a) Site-1 b & c) The two alternative motifs predicted for the 14 sequences reported by Cho and Rando, Nuc. Acid Res., 2000.
Fig 3.2. a) The structure of Hoechst 33258 b) Crystal structure of HOECHST 33258 complexed in the minor groove of DNA.
Fig 3.3. Results of structure prediction by FARNA.
Fig 3.4. a) Secondary structure representations for TS14, TS6 and TS1. The GU and AU base pairs are highlighted in red alphabets. b) 1D 1H spectra of imino region for TS6, TS1 and TS14 constructs.
Fig 3.5. 1D proton spectra of the imino region of TS6 RNA titrated with HT.
Fig 3.6. The 7 clusters (defined manually according to the binding site) of docking solutions for HT predicted by Autodock.
Fig 3.7. The 5 docked structures used for molecular dynamics simulations.
Fig 3.8. The design of the self complementary 11 mer. The binding site of HT in the stem of Site 1 was used as a template to design this construct.
Fig 3.9. The COSY spectrum recorded for 11mer RNA construct, recorded at 600 MHz.
Fig 4.1. The design of TSMC construct a) Predicted stem-heptaloop structure of Site 1, with a CC mismatch between residues C11-C31. b) The TSMC construct.
Fig 4.2. Aromatic-anomeric region in 1H-1H NOESY recorded for TSMC from batch I in 2H2O. The signal dispersion was very different from the spectra for batch II.
Fig 4.3. Aromatic-anomeric walk in 1H-1H NOESY recorded for TSMC from batch II in 2H2O.
Fig 4.4. The structure of the paramagnetic agent gadolinium-diethylenetriamine pentaacetic acid-bismethylamide [Gd(DTPA-BMA)].

124
Fig 4.5. The two docking poses A and B generated for TSMC-HT complex for molecular dynamics simulations.
Fig 4.6. A 2D 1H-1H 2H2O TOCSY overlay of TSMC chemical shift changes upon addition of HT with HT/RNA ratios of 0:1, 0.5:1, 1:1, 1.5:1.
Fig 4.7. Overlay of NOESYs imino-amino region, with increasing concentrations of HT.
Fig 4.8. Change in chemical shifts for imino-amino cross peaks, with increasing concentrations of HT.
Fig 4.9. Most strongly perturbed protons (magenta spheres) in HT-TSMC NMR titrations.
Fig 4.10. Paramagnetic relaxation enhancement for a) free TSMC b) TSMC-HT (1:1) complex.
Fig 4.11. A 2D 1H-1H 2H2O TOCSY overlay of TSGC chemical shift changes upon addition of HT with HT/RNA ratios of 0:1, 1:1.
Fig 4.12. Partial Intercalation of HT in the C5-C16 mismatch of TSMC.
Fig 4.13. The structure of HT.
Fig 4.14. RMSD vs time plot for various residues during the simulation A2.
Fig 4.15. All atom root-mean-square fluctuations of TSMC in uncomplexed (green) and in complex with HT.
Fig 4.16. TS mRNA (a) and protein (b) levels after administration of various concentrations of HT to 2008 cells.
Fig 4.17. A 2D 1H-1H 2H2O TOCSY overlay of HT chemical shift changes upon addition of TSMC with RNA/HT ratio of 0:1 (black) and 0.25:1 (red).
Fig 5.1. Binding sites of TS ligands.
Fig 5.2. SDS-PAGE after Ni-NTA column.
Fig 5.3. SDS-PAGE after HiLoad 16/60 Superdex S200 column.
Fig 5.4. CRINEPT spectrum overlay of apo TS and TS-dUMP complex at 1:4 ratio.
Fig 5.5. Overlay of TROSY spectra of apo TS and TS-dUMP complex at 1:4 ratio.
Fig 5.6. Overlay of TROSY spectra of apo TS and TS-LR complex at 1:1 ratio.
Fig 5.7. Overlay of spectra acquired in the region specific for Arginines.
Fig 5.8. Crystal structure of TS-LR complex.
Fig 5.9. Overlay of CRINEPT spectra of TS-dUMP complex at 1:4 ratio and after addition of dUMP to TS-LR complex

125
Fig 6.1. a) The conical region defined in TS binding pocket for PIPSA comparison. b-f) represent the isocontours of the electrostatic potential (blue 1 kT/e , red -1 kT/e).
Fig 6.2. Heatmap of similarity index values for all the TS sequences analysed.
Fig 6.3. Pyrimidine biosynthesis pathway.

126
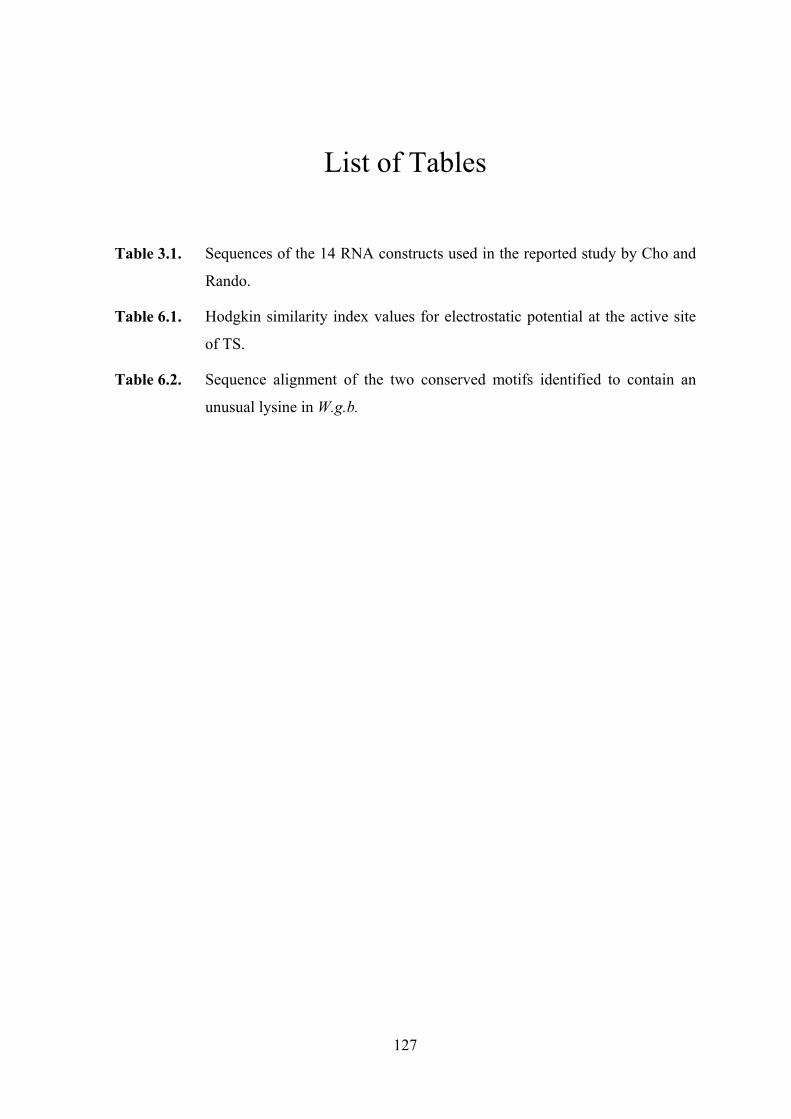
127
List of Tables
Table 3.1. Sequences of the 14 RNA constructs used in the reported study by Cho and
Rando.
Table 6.1. Hodgkin similarity index values for electrostatic potential at the active site
of TS.
Table 6.2. Sequence alignment of the two conserved motifs identified to contain an
unusual lysine in W.g.b.

128

129
Acknowledgements
I'd like to begin by thanking my supervisors Rebecca Wade and Michael Sattler, whose
encouragement, guidance and support made this work possible. I consider myself lucky to
have met such great scientific and social atmosphere in both the groups.
Stefan, Outi, Alex and Giambattista, it was great to work together, sharing ideas and
emotions throughout the LIGHTS project.
Fatiha, Malgosia, Tobias, Koen and Manoj, thanks for teaching me the concepts of NMR,
and for helping in running the experiments from time to time.
Hamed and Diana, thanks for all of our dinners together. They were so much fun and
useful!
Iren, Anders your constant support and encouraging chats have always been very helpful.
Irina, it was perfect to have a fluent German speaker in the office. How many times have
you translated stuff for me!
I thank Michael for all the discussions we have had on our bike trips from EML to
Dossenheim.
I thank our collaborators in the LIGHTS project, in particular Maria Paola Costi, Gaetano
Marverti, Allesio Ligabue and Hannu Myllykalio.
I gratefully acknowledge the kind and sincere support of the administration staff of H-ITS
and TUM.
I owe a special thanks to my family, without whose support so many things, including this
degree would not have been possible.
I offer my regards to all my colleagues and friends who have supported me in various
ways during the project.

130
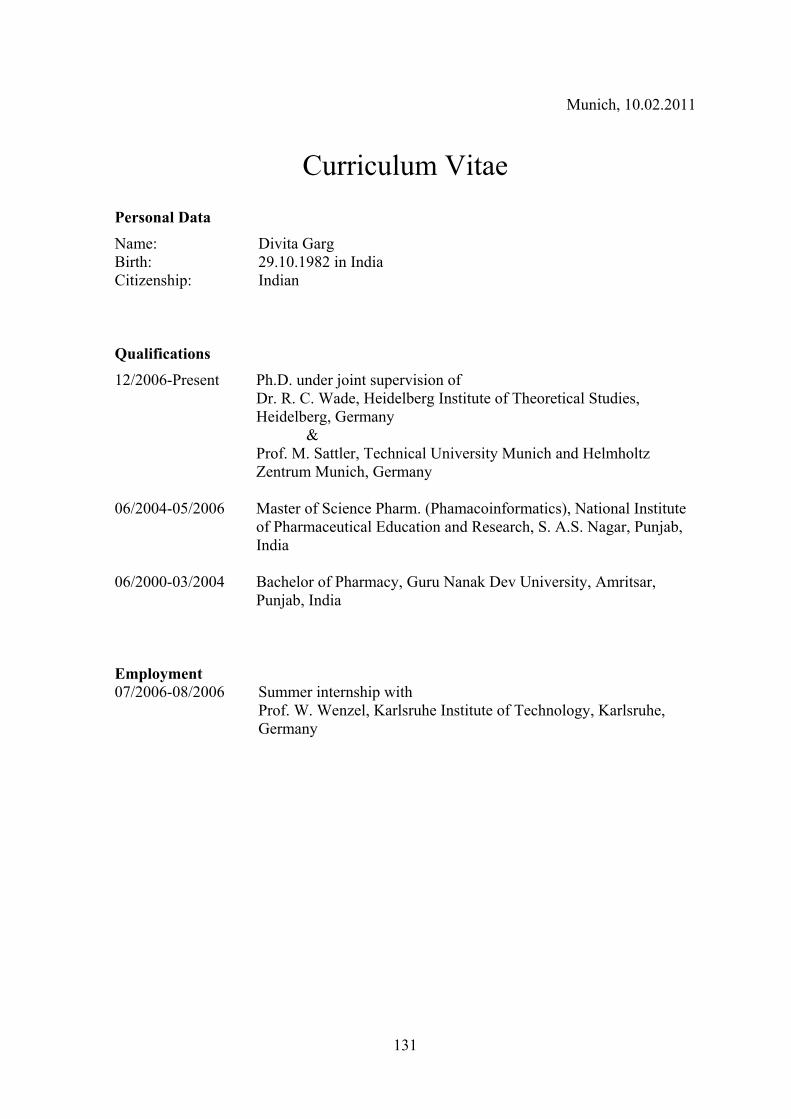
131
Munich, 10.02.2011
Curriculum Vitae Personal Data Name: Divita Garg Birth: 29.10.1982 in India Citizenship: Indian Qualifications 12/2006-Present Ph.D. under joint supervision of Dr. R. C. Wade, Heidelberg Institute of Theoretical Studies,
Heidelberg, Germany & Prof. M. Sattler, Technical University Munich and Helmholtz
Zentrum Munich, Germany 06/2004-05/2006 Master of Science Pharm. (Phamacoinformatics), National Institute
of Pharmaceutical Education and Research, S. A.S. Nagar, Punjab, India
06/2000-03/2004 Bachelor of Pharmacy, Guru Nanak Dev University, Amritsar,
Punjab, India Employment 07/2006-08/2006 Summer internship with Prof. W. Wenzel, Karlsruhe Institute of Technology, Karlsruhe, Germany