TECHNISCHE UNIVERSITÄT MÜNCHEN - mediaTUM
149
TECHNISCHE UNIVERSITÄT MÜNCHEN Lehrstuhl für Biomolekulare NMR-Spektroskopie, Department Chemie Structure and molecular recognition of proteins linked to pre-mRNA splicing and transcriptional regulation Anders R. Friberg München 2010
-
Upload
khangminh22 -
Category
Documents
-
view
0 -
download
0
Transcript of TECHNISCHE UNIVERSITÄT MÜNCHEN - mediaTUM

TECHNISCHE UNIVERSITÄT MÜNCHEN
Lehrstuhl für Biomolekulare NMR-Spektroskopie, Department Chemie
Structure and molecular recognition of proteins linked to
pre-mRNA splicing and transcriptional regulation
Anders R. Friberg
München 2010

TECHNISCHE UNIVERSITÄT MÜNCHEN
Lehrstuhl für Biomolekulare NMR-Spektroskopie, Department Chemie
Structure and molecular recognition of proteins linked to
pre-mRNA splicing and transcriptional regulation
Anders R. Friberg
Vollständiger Abdruck der von der Fakultät für Chemie der Technischen Universität München zur Erlangung des akademischen Grades eines Doktors der Naturwissenschaften genehmigten Dissertation. Vorsitzender: Univ.-Prof. Dr. Chr. F. W. Becker Prüfer der Dissertation: 1. Univ.-Prof. Dr. M. Sattler 2. Univ.-Prof. Dr. M. Groll Die Dissertation wurde am 27.08.2010 bei der Technischen Universität München eingereicht und durch die Fakultät für Chemie am 25.10.2010 angenommen.

"The future doesn't exist yet. Fate is for losers."
Girlfriend in a Coma by Douglas Coupland

1
Table of contents
Abstract 3
Zusammenfassung 4
Chapter 1 5
Regulation of gene expression
1.1. Central dogma of molecular biology 5
1.2. Regulation of gene expression 6
1.2.1. Regulation at the level of chromatin 8
1.2.2. Transcription: Pol II - a key coordinator 9
1.2.3. Post-transcriptional modifications: Generating mRNA stability 11
1.2.4. Splicing of pre-mRNA: Maturation causing diversity 12
1.2.5. RNA editing: Fine tuning of gene expression 14
1.2.6. mRNA export and localization 15
1.2.7. Gene silencing by RNA interference 18
Chapter 2 21
Methods in structural biology
2.1. Two siblings: Molecular and structural biology 21
2.1.1. Cloning of a target protein 22
2.2. NMR: Solving structures in solution 24
2.2.1. Basic physical and mathematical description of NMR 25
2.2.2. NMR hardware and experiment setup 27
2.2.3. Fourier transform and NMR 28
2.2.4. The chemical shift and J-coupling 29
2.2.5. The protein fingerprint spectrum, 2D 1H,
15N HSQC 31
2.2.6. Assignments strategies 32
2.2.7. Ligand binding studies by NMR 34
2.2.8. Relaxation studies in NMR 35
2.2.9. The Nuclear Overhauser Effect 37
2.2.10. Residual dipolar couplings 37
2.2.11. Structure calculations and quality control 38
2.2.12. Literature 39
2.3. X-ray crystallography 40
Chapter 3 43
Structure and ligand binding of Tudor-SN
3.1. Summary 43
3.2. Published manuscript 45
3.3. Supplementary material 59

2
Chapter 4 63
NMR structure of an atypical Tudor domain
4.1. Summary 63
4.2. Published manuscript 65
4.3. Supplementary material 81
Chapter 5 85
Structural characterization of the RES complex
5.1. Summary 85
5.2. Introduction 86
5.3. Results 89
5.4. Discussion 104
5.5. Conclusions 110
5.6. Materials and Methods 111
Chapter 6 115
Additional collaborations
6.1. Induction of apoptosis: Evaluation of a potential inhibitor 115
6.2. Proposed interaction between viral LMP1 and human TRADD 116
6.3. Elucidation of a novel structural domain in EBNA-2 118
6.4. Confirming inhibitors of Bcl-xl 119
6.5. STD NMR: Interaction of STAT5b with a putative ligand 120
6.6. Protein chemistry: Ligation of a modified peptide to SMN 121
Acknowledgements 123
References 125
Appendices 135
A.1 Product operator analysis of the HSQC pulse sequence 135
A.2 Sequence and mass spectra of RES expression constructs 137
Abbreviations 141
List of Figures 143
Curriculum Vitae 145

3
Abstract
Gene expression is a highly regulated process in our eukaryotic cells. To accomplish tight and
dynamic control, regulatory functions affect protein production at various stages. The structural
and biochemical work presented in this doctoral thesis, focuses on proteins involved in pre-
mRNA splicing, one of the key steps in mRNA maturation, as well as on proteins engaged in
chromatin remodeling. Notably, post-translational modifications, such methylation of arginine or
lysine residues, have been shown to play critical roles for these processes.
Chapter 1 and 2 serves as an introduction to regulation of gene expression and to structural
biology, respectively. The aim is to give an overview of the current knowledge of the
fundamental regulatory processes on the way from genes to proteins. The intention is to stress
molecular aspects, and to point out how different pathways are intricately interconnected.
Structural biology consists of rather different and complementary techniques. Here, mainly
basic aspects of nuclear magnetic resonance (NMR), and its use to study the structure,
dynamics and interactions of biomolecules, are covered.
Chapter 3 describes the three-dimensional structure of the so-called TSN domain of Tudor-SN,
comprising an extended Tudor domain fold. The structure was determined by X-ray
crystallography. NMR 15N relaxation data and residual dipolar coupling measurements show
that TSN adopts a compact fold, and that the two subdomains tumble together in solution,
consistent with the crystal structure. Using NMR titrations, the TSN domain was found to bind
peptides containing symmetrically dimethylated arginines (sDMA). The interaction involves an
aromatic cage of the Tudor domain. Dimethylarginine-modified proteins have important
functions in various cellular pathways, including the spliceosome. My results suggest how
Tudor-SN might interact with the spliceosome, where it has been reported to enhance
assembly and splicing efficiency.
Chapter 4 reports the NMR-derived solution structure of the Tudor domain of Drosophila
Polycomblike (Pcl), which is involved in transcriptional regulation at the level of chromatin
remodeling. It was hypothesized that Pcl may act as a targeting factor of a repressive complex
by recognition of methylated histone tails through its Tudor domain. Our data, however, show
that the Pcl Tudor domain has an atypical aromatic cage, which does not bind to any of the
predicted putative Tudor ligands, rendering a role in targeting rather unlikely. A structural
comparison to Tudor-SN highlights a hydrophobic surface patch as a potential interaction site,
where binding of other domains or proteins in the repressive complex could occur.
In Chapter 5, data on the recently discovered trimeric RES (retention and splicing) complex are
presented. RES is involved in splicing and nuclear export of messenger mRNAs. I present a
preliminary biophysical characterization, and provide evidence that the interaction of two of the
components involves a novel, extended variation of a so-called UHM-ULM (U2AF Homology
Motif- UHM Ligand Motif) protein-protein interaction. 15N relaxation experiments indicate that
approximately 25 amino acids in the ULM peptide tightly interact with the UHM domain.
Chemical shift analysis suggests that a helix is formed in the ULM peptide upon binding. NMR
data has been acquired for a structural elucidation of this protein-peptide complex.
Finally, Chapter 6 briefly covers additional short projects I was involved in during my PhD.
Many of them included validation of small-molecule ligands that had been found to interact with
their targets in different kinds of primary screens.

4
Zusammenfassung
Die Expression des genetischen Codes ist ein hoch regulierter Prozess in eukaryontischen Zellen. Die entsprechenden Aspekte der Proteinexpression in der Zelle unterliegen einer strengen und dynamischen Regulation. Die vorliegende Dissertation beschreibt strukturelle und biochemische Untersuchungen von Proteinen, die eine Rolle spielen für das RNA Spleißen, einem Schlüsselschritt der Reifung der Boten RNA, sowie für die Remodellierung des Chromatins spielen.
Kapitel 1 und 2 geben eine Einführung in die verschiedenen Aspekte der Regulation der Genexpression sowie die strukturbiologische Verfahren. Ziel ist es, einen Überblick über grundlegende regulatorische Prozesse vom Gen zum Protein zu geben. Dabei liegt die Betonung darauf, molekulare Aspekte zu skizzieren und aufzuzeigen, wie die verschiedenen Signalwege eng miteinander verflochten sind. Strukturbiologie umfasst recht unterschiedliche aber komplementäre Methoden. Hier werden vor allem grundlegende Aspekte der Kernspinresonanz („nuclear magnetic resonance“, NMR) Spektroskopie besprochen, sowie ihr Potential für die Untersuchung der Struktur, Dynamik und Wechselwirkungen von biologischen Makromolekülen aufgezeigt.
Kapitel 3 beschreibt die drei-dimensional Struktur der sogenannten TSN Domäne des Tudor-SN
Proteins, die ein erweitertes Tudor Domänen Faltungsmotiv darstellt. Die Struktur wurde mittels
Röntgenstrukturanalyse bestimmt. NMR 15
N Relaxationsmessungen und dipolare Restkopplungen
(„residual dipolar couplings“, RDCs) zeigen, das TSN eine kompakte Struktur einnimmt und dass
die beiden Untereinheiten sich in Lösung gemeinsam reorientieren, konsistent mit der
Kristallstruktur. Mittels NMR Titrationen konnte gezeigt werden, dass die TSN Domäne Peptide mit
symmetrisch dimethylierten Argininen (sDMA) bindet. Die Erkennung wird durch einen
aromatischen Käfig der Tudor Domäne vermittelt. Dimethylarginin-modifizierte Proteine sind von
großer Bedeutung für verschiedene zelluläre Prozesse, einschließlich des Spleißosoms. Meine
Ergebnisse liefern Hinweise dafür, wie Tudor-SN mit dem Spleißosom wechselwirken und seine
Assemblierung und Effizienz verstärken kann.
Kapitel 4 stellt die NMR Struktur der Tudor Domäne des Drosophila „Polycomblike“ (Pcl) Proteins
vor, das in die Regulation von Transkription auf der Ebene der Remodellierung des Chromatins
impliziert ist. Es wurde vorhergesagt, dass Pcl eine Rolle für die Lokalisierung einen repressiven
Komplexes einnimmt, durch Erkennung methylierter Histonendungen mittels seiner Tudor Domäne.
Unsere Daten zeigen allerdings, dass die Pcl Tudor Domäne einen atypischen aromatischen Käfig
aufweist, der an keinen der vorhergesagten, möglichen Tudor Liganden bindet. Eine Funktion der
Tudordomäne für die Lokalisierung erscheint daher nicht wahrscheinlich. Ein Strukturvergleich mit
Tudor-SN zeigt, dass eine hydrophobe Oberfläche existiert, die mögliche Wechselwirkungen mit
anderen Domänen oder Proteinen des repressiven Komplexes vermitteln könnte.
In Kapitel 5 werden Untersuchungen zum kürzlich entdeckten ternären RES („retention and
splicing“) Komplex vorgestellt. RES spielt eine Rolle im Spleißen und Kernexport von Boten RNAs.
Ich stelle meine Ergebnisse hinsichtlich der biophysikalischen Charakterisierung vor und liefere
Hinweise dafür, dass die Bindung von zwei Komponenten des RES Komplexes durch eine neue,
erweiterte Variante von sogenannten UHM-ULM („U2AF Homology Motif- UHM Ligand Motif“)
Protein-Protein Wechselwirkungen vermittelt wird. 15
N Relaxationsexperimente zeigen, dass etwa
25 Aminosäurereste des ULM Peptids an der UHM Bindung beteiligt sind. Eine Analyse von
chemischen Verschiebungsänderungen zeigt, dass durch die Bindung eine Helix innerhalb des
ULM Peptids induziert wird. Zahlreiche NMR Daten wurden aufgenommen, die eine
Strukturbestimmung des Protein-Peptidkomplexes ermöglichen.
Im abschließenden Kapitel 6 werden einige kurze Projekte beschrieben, an denen ich im Laufe
meiner Promotion beteiligt war. Viele dieser Projekte betreffen die Validierung der Bindung von
kleinen organischen Molekülen an verschiedene Zielproteine, die aufgrund verschiedener primärer
Assays beschrieben war.

5
1. Chapter 1
Regulation of gene expression
At no single instance of cellular life, gene expression is left out of regulation.
Regulation of our genes is inherently dynamic which allows it to respond to new stimuli
and stress of different kinds. Loss of regulation, in contrast, is directly linked to various
diseases and, perhaps most notably, to development of cancer. Regulation of gene
expression controls the amount of gene products, proteins or functional RNAs in the
cell, and is an intense field of research. In recent years, not only has the saying: "one
gene, one protein" become obsolete, but also entirely new layers of regulation have
been discovered, such as RNA interference (RNAi) and within chromatin remodeling.
This biological introduction will focus on the control of gene expression in the
eukaryotic cell rather than the prokaryotic. Some process are, of course, similar in both
types of cells, but the differences are many. One aim is to point out the massive
regulation going on in the cells at any given moment, also when obvious external
demands are not present. Another intention is to illustrate how a molecular
understanding of these regulatory processes is required, and has paved the road for
many discoveries. Finally, the intriguing interconnectivity between specific concepts will
be highlighted.
1.1. Central dogma of molecular biology
How traits are inherited and articulated had been a well-disputed subject for a long
time, until the flow of genetic information in the cell was laid out during the middle of
the last century. Taking this knowledge into account, Francis Crick then formulated the
famous Central dogma of Molecular Biology.1 In the nucleus the messenger-RNA
(mRNA) is transcribed from DNA, and using the mRNA as a blueprint, a protein is
synthesized in the cytoplasm (Figure 1.1.1). Over the years, the original hypothesis
has been modified and extended, and now also comes in many flavors depending on
which organism is studied. Starting from the early discoveries, numerous levels of
regulation of gene expression were discovered. In the next sections the main topics
and themes will be introduced, adding complexity to the original oversimplified
hypothesis on a straightforward cellular protein production. Various regulatory
processes will be addressed, starting with chromatin remodeling, going through
transcriptional control and RNA maturation, until just prior translation at the ribosome.

6
Figure 1.1.1 Central dogma of molecular biology. DNA contains our genetic information and is replicated during each round of the cell cycle. Proteins, carrying out most of the functions in the cell, are produced using mRNA as a blueprint of the gene. The genetic material (DNA) stays in the cell nucleus, while the mRNA is transported out into the cytoplasm, where the protein is synthesized. All of these processes are intricately influenced, activated or repressed, by various internal and external factors.
1.2. Regulation of gene expression
Simpler organisms, such as bacteria, have to be able to respond to changes in the
surroundings and adapt to their new environment.2 This is in part done by regulation on
the level of gene expression. However, the importance of a tight and dynamic
regulation of genes becomes even more evident in the development of multicellular
organisms. Here, all cells have the same set of genes in their chromosomes, but serve
very diverse purposes: Bone cells provide structure, nerve cells pass on electro-
chemical signals, gut cells produce acid, immune cells fight infections. In higher
eukaryotes, the maintenance of cellular identity is based on control over long-term
gene expression. The whole field of stem cell research relies on the understanding of
such processes and on working out how to manipulate them.3
Light, nutrition and toxic compounds are obvious external stimuli, that cells have to be
able to respond. Stress on cells and organisms is a topic that has been studied
thoroughly, here one can include for example heat shock, starvation, DNA damage by
UV light, as well as infection of viruses or other organisms. Another main theme is
gene expression regulated by the cell cycle, or other rhythmic processes (circadian
clocks). Especially in multicellular organisms, signaling between individual cells by
hormones, peptides and metabolites, or through direct contact, plays a key role in
gene regulation.
In the eukaryotic cell, the importance of compartmentalization must be stressed. The
untangling of transcription and translation, taking place in the nucleus and in the
cytoplasm respectively, facilitates regulation and opens up for steps of quality control.
The overview figure on the next page introduces topics later discussed, and place
them according to their apparent sequential order (Figure 1.2.1).

7
Figure 1.2.1 Overview of regulation in gene expression: From transcription to translation. Each step of gene expression, starting at transcription, through mRNA maturation, until export and translation, is tightly regulated. The topics of the three main projects of this thesis are highlighted (black boxes) and put into their context. Page numbers refer to the biological introduction found in Chapter 1.
8
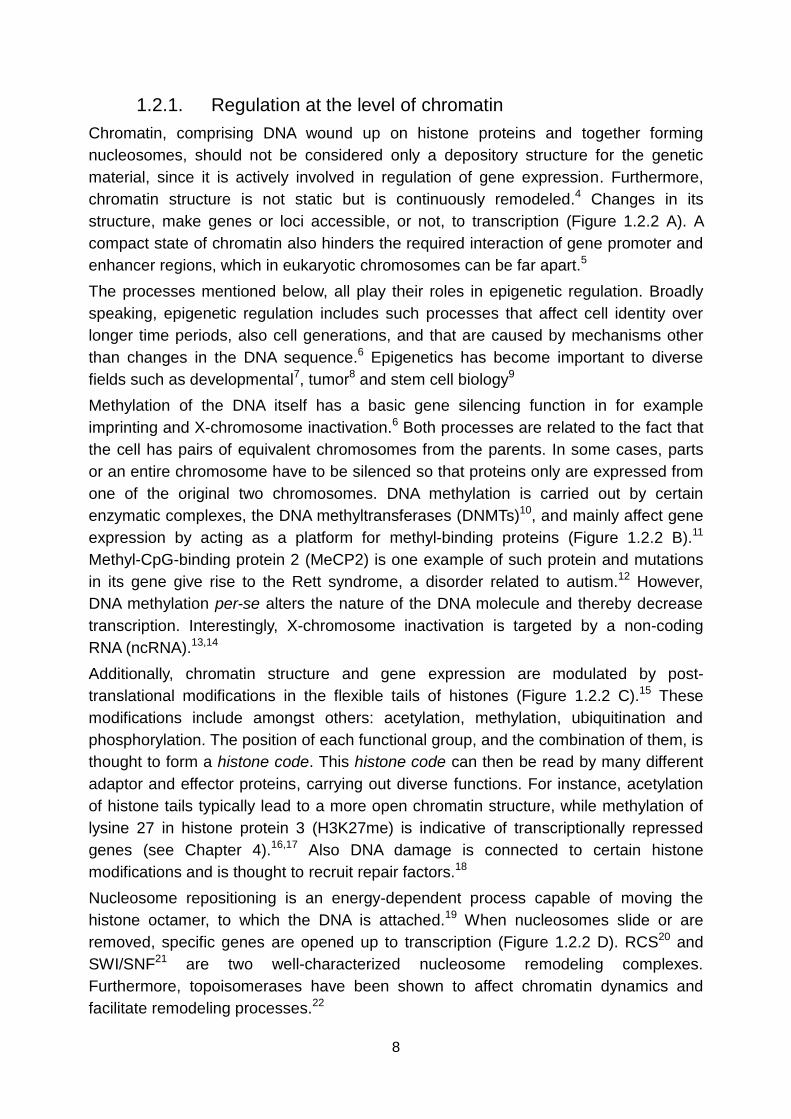
1.2.1. Regulation at the level of chromatin
Chromatin, comprising DNA wound up on histone proteins and together forming
nucleosomes, should not be considered only a depository structure for the genetic
material, since it is actively involved in regulation of gene expression. Furthermore,
chromatin structure is not static but is continuously remodeled.4 Changes in its
structure, make genes or loci accessible, or not, to transcription (Figure 1.2.2 A). A
compact state of chromatin also hinders the required interaction of gene promoter and
enhancer regions, which in eukaryotic chromosomes can be far apart.5
The processes mentioned below, all play their roles in epigenetic regulation. Broadly
speaking, epigenetic regulation includes such processes that affect cell identity over
longer time periods, also cell generations, and that are caused by mechanisms other
than changes in the DNA sequence.6 Epigenetics has become important to diverse
fields such as developmental7, tumor8 and stem cell biology9
Methylation of the DNA itself has a basic gene silencing function in for example
imprinting and X-chromosome inactivation.6 Both processes are related to the fact that
the cell has pairs of equivalent chromosomes from the parents. In some cases, parts
or an entire chromosome have to be silenced so that proteins only are expressed from
one of the original two chromosomes. DNA methylation is carried out by certain
enzymatic complexes, the DNA methyltransferases (DNMTs)10, and mainly affect gene
expression by acting as a platform for methyl-binding proteins (Figure 1.2.2 B).11
Methyl-CpG-binding protein 2 (MeCP2) is one example of such protein and mutations
in its gene give rise to the Rett syndrome, a disorder related to autism.12 However,
DNA methylation per-se alters the nature of the DNA molecule and thereby decrease
transcription. Interestingly, X-chromosome inactivation is targeted by a non-coding
RNA (ncRNA).13,14
Additionally, chromatin structure and gene expression are modulated by post-
translational modifications in the flexible tails of histones (Figure 1.2.2 C).15 These
modifications include amongst others: acetylation, methylation, ubiquitination and
phosphorylation. The position of each functional group, and the combination of them, is
thought to form a histone code. This histone code can then be read by many different
adaptor and effector proteins, carrying out diverse functions. For instance, acetylation
of histone tails typically lead to a more open chromatin structure, while methylation of
lysine 27 in histone protein 3 (H3K27me) is indicative of transcriptionally repressed
genes (see Chapter 4).16,17 Also DNA damage is connected to certain histone
modifications and is thought to recruit repair factors.18
Nucleosome repositioning is an energy-dependent process capable of moving the
histone octamer, to which the DNA is attached.19 When nucleosomes slide or are
removed, specific genes are opened up to transcription (Figure 1.2.2 D). RCS20 and
SWI/SNF21 are two well-characterized nucleosome remodeling complexes.
Furthermore, topoisomerases have been shown to affect chromatin dynamics and
facilitate remodeling processes.22

9
Figure 1.2.2 Chromatin is a dynamic structure. (A) In a repressed state the nucleosomes are tightly packed against each other, but when activated the chromatin state is relaxed. (B) DNA methylation by DNMTs creates a possible interaction surface for adaptor proteins, such as MeCP2. (C) Post-translational modifications of the flexible histone tails regulates the transcription activity. Also, a combination of different epigenetic marks can be interpreted jointly. (D) Chromatin remodeling complexes can move and/or remove nucleosomes to guarantee polymerases access to promoters.
1.2.2. Transcription: Pol II - a key coordinator
The primary level of regulation of gene expression is taking place at transcription,
including the steps of initiation, elongation and termination.23 The actual production of
the correct amount of the specific RNA at the right moment is fundamental to proper
gene expression. Transcription of RNA, as such, is relatively well understood,
nonetheless the regulation of this process still remains to be elucidated further.24 There
are many different types of RNAs transcribed in eukaryotes, however, here the
regulation of messenger-RNA (mRNA) synthesis is briefly introduced (Figure 1.2.3).
In eukaryotes, transcription of mRNA is accomplished by RNA polymerase II (Pol II), a
multi-subunit enzyme.25 In brief, transcription initiation takes place at an accessible
promoter including a TATA-box, where a set of general transcription factors binds
together with Pol II.26 After formation of a pre-initiation complex, the DNA duplex is
melted and transcription can start. The C-terminal domain (CTD) of the largest subunit
of Pol II is an essential site for regulation. At this stage, the CTD is phosphorylated
which allows the polymerase to enter the elongation phase.27 Different Pol II subunits
and stages of the transcription process have been characterized by structural

10
biology.28 At a specific sequence the mRNA is polyadenylated (poly(A)) and this
causes transcription termination. The polymerase detaches from the DNA, and the
mRNA is cleaved just after the poly(A)-tail. Although, the exact termination mechanism
differs depending on the type of RNA, and is still not completely understood, it has
been shown to be required for optimal protein expression.29-31
The CTD of Pol II is essential for efficient transcription and coordinates many
processing steps described in later sections. These include 5' capping, synthesis of the
poly(A)-tail, splicing and RNA editing.32,33 It seems evident that it is correct to consider
these processes as highly interconnected and not sequential or separate. Thus, their
regulation is expected to depend on the transcription process as well.
In addition to the TATA-box, many genes have important regulatory DNA sequences
slightly upstream of the start site. These sequences bind transcription factors (TFs),
which in eukaryotes most often are activators of transcription. The TFs generally
contain a DNA binding module, a response domain, which responds to a particular
signal, as well as a activation module, which interacts with the transcription machinery.
Two examples of families of TFs are C/EBPs and CREBs. Both families are binding to
certain DNA sequences and are themselves regulated by plethora of signal
pathways.34,35 See also Section 5.5 for another example.
In addition, eukaryotic genes have enhancer regions much further away from the
transcription initiation site. The TFs and the enhancer regions are linked to Pol II by a
large multi-protein and essential co-activating complex known as the Mediator.36
However, structures and functions of the individual domains are not as well
characterized as for Pol II.37 All the regulatory molecules described have to come
together at the same time to allow transcription to take place, like a lock where several
keys are needed simultaneously to unlock it.
Figure 1.2.3 Transcription initiation. Regulation of transcription is a crucial step in protein production. In addition to general transcription factors, the transcription initiation of Pol II needs Mediator, which is thought to combine the co-activating effect of specific transcription factors and distant enhancer regions. The CTD is phosphorylated prior to elongation, and is responsible for linking many of the downstream RNA-processing steps to transcription. The 5' cap is acquired early on to stabilize the nascent chain.

11
1.2.3. Post-transcriptional modifications: Generating mRNA stability
Transcribed mRNAs need to be stable, but not too stable, to allow fluctuations in the
amount of protein produced. The dynamic equilibrium between those two states are
closely linked to post-transcriptional modifications. However, as commented on
previously, processing of the transcribed and immature precursor mRNA (pre-mRNA)
is coordinated with transcription itself. Hence, the term 'post-transcriptional' is
misleading, since processing takes place during transcription, and not strictly in a
sequential fashion. Interestingly, mRNA decay has been suggested to be profoundly
involved the regulation of gene expression.38
5' capping is the first step in pre-mRNA processing. Just after transcription elongation
has started, three enzymatic activities come together to modify the 5' end of the
nascent transcript: a triphosphatase, a guanyltransferase and a methyltransferase. The
modifiers reside at the CTD, awaiting CTD phosphorylation, a signal which activates
elongation, as well as these capping enzymes.33
The 3' poly(A) tail is generated at a specific sequence, present at the very end of the
gene. This sequence recruits another enzymatic complex to the pre-mRNA. It
comprises a polyadenylase, which synthesizes the poly(A)-tail, and subsequently an
endonuclease, that cleaves the transcript. The poly(A)-tail is initially approximately 250
nucleotides long.
Both the 5' cap and the poly(A)-tail are key modifications which are required to produce
a stable mRNA, and have been shown to promote efficient nuclear export. Before
degradation, generally, either decapping at the 5' end or shortening of the poly(A)-tail
has to occur. Thus, such enzymatic activities are tightly regulated.39,40 The main actor
in the subsequent degradation of mRNA is the exosome, which has a 3' → 5' RNase
activity and is found in both the nucleus and the cytoplasm.41 The exosome core
contains RNase and structural subunits, but specificity and regulation are coupled to
other associated proteins.41,42 In addition to its basic function, the exosome is also
partially responsible for degradation of RNA fragments coming from aberrant
transcripts, miRNA pathways, splicing or even viral infections. Such molecules could
cause problems if translated, or through interference with other processes.
Quality control of transcribed mRNAs is essential, and one particular pathway, the so-
called nonsense mediated decay (NMD), is connected with both the exosome and the
topic of the next section, splicing. Correct splicing of introns will result in deposition of a
exon-junction complex (EJC) at the reaction site. This signal is identified by the NMD
pathway, and if a premature and erroneous stop-codon exist upstream, the exosome
will degrade the mRNA.43
In conclusion, starting at transcription, the mRNA obtains various modifications, which
affects its stability and downstream processing steps (Figure 1.2.4).

12
Figure 1.2.4 mRNA stability depends on the 5' cap and on a intact Poly(A)-tail. Upon a sequence signal in the gene a Poly(A)-tail is synthesized into the mRNA. Endonucleolytic cleavage releases the mRNA, which is thought to circularize via adaptor proteins (green). As soon as decapping or deadenylation occurs the mRNA is receptive to nucleases, such as the 3'→5' degrading exosome (red).
1.2.4. Splicing of pre-mRNA: Maturation causing diversity
In lower eukaryotes, e.g. baker's yeast, the separation of genes into protein-coding
exons and non-protein-coding introns is rare, however, in higher eukaryotes it is
virtually standard. The process of removal of introns and of joining exons is known as
splicing, and is carried out by a dynamic and highly regulated machinery, the
spliceosome.44 The spliceosome is of megadalton size, only including the ~50 core
proteins and RNAs, and assembles for every round of splicing in an ordered and
sequential fashion. Mass spectrometry data estimates a coupled of hundred proteins to
be additionally associated with the spliceosome.44,45 It can be expected that many of
those proteins are involved in splicing regulation.
The three subunits of the RES complex are examples of such spliceosome-associated
proteins.46 See Chapter 5 for details on our work with this recently discovered complex.
Additionally, Chapter 3 presents structural and ligand binding data on Tudor-SN, a
splicing enhancer.47 Tudor-SN contains a domain with the ability to interact with
methylated arginines. Such modifications have been found in the spliceosome.
The five small nuclear ribonucleoprotein particles (snRNPs) are central spliceosomal
multimeric complexes, and are named according to the small nuclear RNA (snRNA)
contained in them (U1, U2, U4, U5 and U6).48 In brief, spliceosome assembly and
reaction cycle starts with the definition of 5' and 3' splice site by U1 snRNP and U2
associated factors, respectively (Figure 1.2.5). Second, the U2 snRNP binds at the so-
called branch point. A catalytic complex is then formed by addition of the last three
snRNPs. Together, they are known as the tri-snRNP. The catalytic splicing reaction
cycle includes major structural rearrangements leading to two transesterification
reactions, and results in the excision of a intron lariat.49 What is an intron, or an exon,
is defined by the mRNA sequence itself, together with the involved spliceosomal

13
complexes. The strength of the splice site varies with the nucleotide composition, but
might also be affected by the rate of transcription elongation50.
A majority of the human genes exhibits alternative splicing, through which different
combinations of exons are joined. This allows the production of diverse protein
isoforms, from a minimal set of genes.51 For instance, the Titin gene consists of 363
exons, which theoretically could give rise to over a million different protein isoforms.52
Alternative splicing has important implications in processes ranging from
development53 to apoptosis54, and affects tissue specific gene expression55. Not
surprisingly, alternative splicing is therefore closely connected to disease56.
It is believed that alternative splicing depends on additional factors, that are capable of
competing with the constitutive splice factors and thereby affect splice site definition.
For example, FOX2 inhibits the inclusion of exons by blocking branch point
identification.57 RBM5 influences splicing at a later stage by promoting binding of the
tri-snRNP to two non-sequential exons.51 Interestingly, some proteins involved in
constitutive splicing are known to induce alternative splicing upon post-translational
modifications, such as phosphorylation.58 Furthermore, alternative splicing can also be
introduced by the identification of additional weak splice sites.
As described previously, splicing is connected to mRNA degradation via the NMD
pathway59, however, splicing is also coupled to transcription.33 During transcription
splicing factors are recruited to the nascent chain and can perform the first reactions
before cleavage and poly(A)-tail synthesis.60 In addition, splicing is linked to mRNA
export from the nucleus to the cytoplasm where translation into protein occurs. In this
regard - How far is it possible to study splicing regulation as an isolated event, outside
the context of transcription and pre-mRNA processing?
Figure 1.2.5 Basics of pre-mRNA splicing. The spliceosome assembles anew for every round of splicing. The snRNPs join in a specific order but each step is dynamically regulated. The asterisk highlights the possibility of alternative splicing regulation taking place at the 3' splice site. ATP is required to overcome conformational barriers. In the first catalytic step (I), the 2'-OH of the branch point adenosine attacks the 5' splice site. Subsequently, the two exons are joined (II) and the intron lariat is
spliced out. The individual snRNPs are then recycled to be re-used for another round of splicing.

14
1.2.5. RNA editing: Fine tuning of gene expression
Editing of RNA includes deletion, insertion and, perhaps most well-known, modification
of single nucleotides in the RNA. These reactions are carried out by different families
of editing enzymes, located in the nucleus as well as in the cytoplasm. Editing
influences not only the protein amino acid sequence, but also splice site selection, as
well as structure and function of non-coding RNAs. Until recently, RNA editing was a
rather exotic research field, but has lately gained momentum. It has become especially
influential in neuron function and RNA interference (RNAi).61-63
Since RNA editing is a relatively rare event, it can be considered as fine tuning of gene
expression. RNA editing leads to subtle, although essential, changes on the nucleotide.
Here, adenosine-to-inosine (A-to-I) editing will be presented as an example of RNA
editing. Also A-to-I editing has been suggested to be coupled to transcription.32 See
Chapter 3 for details on our work with Tudor-SN, a protein suggested to be involved in
the metabolism of A-to-I edited RNA.64,65
A-to-I editing is carried out by enzymes named ADARs (adenosine deaminases that
act on RNAs). The substrate is a dsRNA molecule (>20bp), in which the exocyclic
purine amine group of an adenosine nucleotide is deaminated to a carbonyl.
Importantly, inosines are decoded as guanosines by the ribosome. A direct link
between editing and modulation of protein function by differential amino acid
incorporation, has been shown for two neuronal receptors, GABA and voltage-
activated potassium channels.66,67 Additionally, alternative splicing of the glutamate
receptor is regulated by RNA editing.68
Several reports have been published on the interference between A-to-I editing and
RNAi pathways.69 The main theme is how the dsRNA molecule can be directed into
either RNA editing, or into RNAi.70 Competition over the dsRNA has been shown to
affect biogenesis of miRNAs and their silencing profile71,72
Interestingly, hyper-editing of transcripts from Alu repeats have been discovered.73 Alu
repeats account for at least 10% of the human genome, and are expected to play a
role in gene silencing and genomic diversity.74,75 RNA editing has also been suggested
to be linked to development of a certain prostate cancer.76
Figure 1.2.6 RNA editing by ADARs. Double stranded RNAs can be modified by editing enzymes, such as the ADARs (adenosine deaminases that act on RNAs), which deaminate adenosines to inosines. The editing have effects on many downstream pathways, for instance, on translation and splicing. The appearance of inosines alters the primary sequence and modulate the possible interactions of the RNA. Additionally, editing has been shown to regulate RNAi, and the degradation of RNAs.

15
1.2.6. mRNA export and localization
Because transcription and subsequent translation takes place in the nucleus and in the
cytoplasm, respectively, the mature mRNA has to be transported across the nuclear
envelope (Figure 1.2.7). Smaller molecules, i.e. metabolites, peptides etc, can diffuse
through non-specific channels in the membrane, however, larger molecules depend on
active transport through the nuclear pores. These pores are created by vast
assemblies of approximately thirty core proteins (nucleoporins) and are called nuclear
pore complexes (NPCs; ~125 nm Ø; ~125 MDa).77 Here, we focus on the export of
mature mRNA into the cytoplasm destined for translation, and leave out import/export
of proteins. Notably, the by now very diverse group of functional RNAs (tRNA, rRNA,
snRNA, miRNA etc.) utilizes quite different export pathways.78
In brief, to facilitate the bidirectional transport of very diverse macromolecules, the
NPC utilizes various adaptor proteins. These are mobile export receptors (exportins)
that identify a specific cargo and cycle between the nucleus and the cytoplasm. For the
larger mRNA molecule the most important exportins are TAP and p15, which together
form a stable heterodimer. The TAP-p15 complex interacts with the 5' UTR of the
mRNA where it replaces the TREX complex, which was placed on the mRNA during
elongation in a cap-dependent manner. In comparison to export of many other
macromolecules, including other RNAs, mRNA export is generally not driven by the
Ran-GTP/GDP gradient. One hypothesis, is that export relies on ATP-dependent
rearrangements occurring at the 5' cap in the cytoplasm. Although, for some mRNA
Crm1 is involved in nucleocytoplasmic export and is thus driven by GTP-hydrolysis.78
Once the mRNA is transported through the pore, it is prepared for translation. The 5'
cap is bound by eIF4E, a translation initiation factor, and at the 3' end, several proteins
associate with the poly(A)-tail. It is not unusual, that the mRNA directly associates with
the ribosome after passage through the NPC.
In addition to physically transporting the mRNA over the nuclear envelope, the NPC is
closely coupled to quality control and to gene regulation. The mRNA is exported
together with many proteins attached to it. This composite particle is called messenger
ribonucleoprotein particle (mRNP). The SR (Ser/Arg-rich) proteins bind early to the
mRNA and have a key role in many steps of the mRNA lifecycle.79 This includes
nucleocytoplasmic export where it functions as a adaptor protein to the TAP-p15
complex after hypophosphorylation. After export, the SR proteins dissociate from the
mRNA and are recycled back into the nucleus.

16
The exon-junction complex (EJC) is another member of the mRNP which affects export
efficiency. Export is known to be coupled to splicing, and is one major quality control
pathway. The presence or lack of EJCs, creates a checkpoint for selection between
spliced or unspliced mRNA, respectively. Other proteins at the NPC are involved in
similar tasks, for example the Mlp1-Mlp2 system.80 Pre-mRNA leakage into the
cytoplasm is a quite common result due to decreased splicing capabilities, just
because the nucleus is full of newly synthesized unspliced transcripts. See Chapter 5
for a structural characterization of the RES complex, which is important to efficient
splicing, and in retention of unspliced pre-mRNA in the nucleus.
Figure 1.2.7 The nuclear pore complex (NPC) controls mRNA export from the nucleus. As a gatekeeper the NPC decides which biomolecules to import from the nucleus, and which to export to the cytoplasm. Non-processed pre-mRNAs contain introns and are not ready to be exported. However, the exon-junction complex (EJC; red) is deposited onto the mRNA after splicing and acts as an export signal. The EJC creates, together with SR proteins (green) and 5' cap-associated TAP-p15 (yellow), affinity for the NPC and enhance export efficiency. These proteins are recycled to be used for new rounds of export. The exported mRNA is now ready to be translated by ribosomes available in the cytoplasm.

17
Human immunodeficiency virus (HIV) is a retrovirus, and therefore requires unspliced
RNA for the assembly of new virus particles. To circumvent the suppressed export of
unspliced RNAs in the host cell, the virus encodes a protein that specifically binds to
unspliced viral RNA. This protein, named Rev, includes a export signal and hijacks the
endogenous protein export system, which allows the unspliced RNA to escape through
the NPC without being detected as aberrant.81
Interestingly, there is some evidence that transcription, in yeast, sometimes is directly
taking place at the NPC.82 This model of gene-looping is the source of interesting ideas
about transcription termination and gene surveillance, and explains observations on
transcriptional memory.33,83
In addition to the reallocation of mature mRNA from the nucleus to the cytoplasm,
subcellular localization of mRNA within the cytoplasm can further affect protein
expression. Instead of being translated straight away, mRNA can be targeted to special
cytoplasmic RNA granules, which are actually visible by light microscopy.84 Those
granules have been shown to be used for storage, transport and decay of mRNA, and
are associated with particular cellular events. Some classical examples of cytoplasmic
targeted mRNAs are found in cells with rather asymmetric shapes, for instance
oocytes and budding yeast cells, where mRNA accumulation generate cell polarity. In
case of the Drosophila oocyte, oscar, bicoid and nanos regulates the establishment of
spatial patterning of the embryo.85 A special case of translationally repressed mRNPs
is found in neurons. Here, mRNAs are transported far distances through the axons,
before being released and translated in the synaptic region.84 Recent studies, however,
suggest that the subcellular localization of mRNA is far more widespread than
previously thought, and not only linked to specific cell types or proteins.86
Stress granules and Processing bodies (P-bodies) are two examples of more general
RNA granules. The assembly of either granule can be induced by stress on the cell.
Furthermore, both of the granules share overlapping groups of proteins, however,
while the stress granules contain members of the translation initiation machinery, the
P-bodies contain proteins involved in RNA decay. Interestingly, the assembly is
reversible and the granules can, upon changes in the environment be disentangled.
This property is expected to make RNA granules key post-transcriptional and
epigenetic modulators of gene expression.87

18
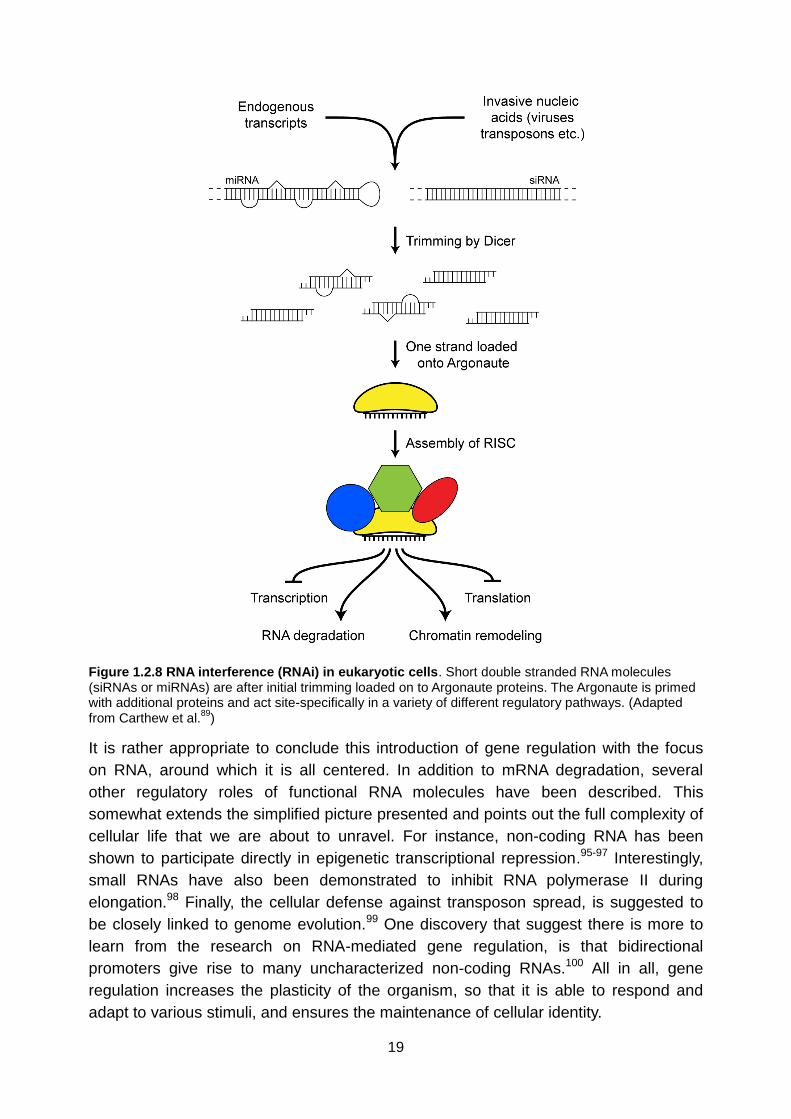
1.2.7. Gene silencing by RNA interference
RNA molecules have been discovered to play a more central role in gene regulation
than ever anticipated a couple of decades ago. One major breakthrough, was the
observation that short transcripts are actively used in sequence specific degradation of
other RNA molecules, which results in silencing of that particular protein.88 This
silencing process is known as the RNA interference (RNAi) pathway, and involves
molecules known as microRNAs (miRNAs) and small interfering RNAs (siRNAs).
miRNAs are mostly endogenously encoded and consist of a single strand folded into a
non-perfect double stranded RNA hairpin. In contrast, the siRNA usually comprises two
separate strands with perfect complementarity which normally, but not always,
originate from an exogenous source, for example a virus genome or transposons.89
These two types of RNA molecules, both ~20-30 nucleotides long in their final form,
are nevertheless closely related, especially in that they share many associated
processing and effector proteins (Figure 1.2.8). Briefly, non-processed duplex
precursors are cut by a ribonuclease enzyme called Dicer, creating a two nucleotide
overhangs at the 3' ends. miRNAs are initially also processed by Drosha. In the
cytoplasm, one of the strands from the processed duplex is loaded onto the so-called
Argonaute protein. Which strand is selected, depends on the thermodynamic stability
of the duplex.90 The RNA-loaded Argonaute protein is then assembled with other
effector proteins into a RNA-induced silencing complex (RISC). The mature RISC is
now ready to perform its effector functions.91
The short RNA molecule from RISC acts as a sequence specific targeting factor, that
binds to the corresponding mRNA. In general, RISC cleaves the identified mRNA if
there is complete base-pairing (mainly siRNAs), whereas if the base-pairing is not
perfect (normally miRNAs), gene expression is decreased by inhibition of translation.
The latter case involves mRNA binding and localization to so-called P-bodies92, in
which translation is impeded. RISC can also repress translation initiation.89 The
function of RISC differs between organisms, and depends on the proteins and RNA
involved. For instance, humans have eight Argonaute paralogs which allows for
specialization. RNAi affects many biological processes, ranging from development to
tumor growth.93,94
The RNAi research field changes rapidly and many important discoveries probably lie
ahead. The functional boundaries between miRNAs and siRNAs are constantly being
blurred. To summarize however, siRNA mostly silences the expression of its own gene
product, whereas miRNA normally targets another gene or group of genes. In part, this
can be explained by the absence of mature miRNA-containing RISC in the nucleus.
19
Figure 1.2.8 RNA interference (RNAi) in eukaryotic cells. Short double stranded RNA molecules (siRNAs or miRNAs) are after initial trimming loaded on to Argonaute proteins. The Argonaute is primed with additional proteins and act site-specifically in a variety of different regulatory pathways. (Adapted from Carthew et al.
89)
It is rather appropriate to conclude this introduction of gene regulation with the focus
on RNA, around which it is all centered. In addition to mRNA degradation, several
other regulatory roles of functional RNA molecules have been described. This
somewhat extends the simplified picture presented and points out the full complexity of
cellular life that we are about to unravel. For instance, non-coding RNA has been
shown to participate directly in epigenetic transcriptional repression.95-97 Interestingly,
small RNAs have also been demonstrated to inhibit RNA polymerase II during
elongation.98 Finally, the cellular defense against transposon spread, is suggested to
be closely linked to genome evolution.99 One discovery that suggest there is more to
learn from the research on RNA-mediated gene regulation, is that bidirectional
promoters give rise to many uncharacterized non-coding RNAs.100 All in all, gene
regulation increases the plasticity of the organism, so that it is able to respond and
adapt to various stimuli, and ensures the maintenance of cellular identity.

20

21
2. Chapter 2
Methods in structural biology
2.1. Two siblings: Molecular and structural biology
Structural biology is interested in explaining biological processes by characterizing the
three-dimensional structure of the involved biomolecules, typically on an atomic level,
and in connecting that knowledge to functional data. Its big brother, molecular biology,
became a flourishing research field towards the middle of the last century when
specific biological functions was starting to be attributed to certain biomolecules.
Molecular biology can be described as the coming together of biology and chemistry,
and is more of an approach or perception than a specific technique.101
Without the development of modern molecular biology the field of structural biology
would be an obscure small research interest of a few. One has to remember, that early
on all proteins were purified from their natural source, which limited biological
experiments and especially structural studies. This limitation was overcome by the
possibility to produce any protein, or protein fragment, in high amounts using
recombinant techniques and bacterial expression strains. Recombinant DNA cloning is
one main reason structural biology had the chance to become one of the major players
in life science, as it is today.
Several reason can be given to why a molecular understanding of biology is important:
It is the basic organization of biology. Biological pathways relies on single
molecules to perform their function. How all the various processes functions
together, is rather studied in the field of systems biology.
Seeing is understanding. Only when the fine details of a process are laid out, it
is possible to grasp its full mechanism and how it actually works.
New hypotheses. Understanding a process at its fundamental level opens up for
novel scientific questions, that otherwise would have been overlooked.
Drug discovery. In modern pharmaceutical research it is essential to have a
molecular perspective. This enables efficient development of synthetic
compounds modulating a specific biological pathway.
Maybe the most well-known example of structural biology, which not only changed
biology, is the elucidation of the DNA helix in the 1950s.102 For the first time it was now
possible to see the molecule which carried the inherited traits of our parents.

22
2.1.1. Cloning of a target protein
Once a target molecule has been selected, samples need to be prepared for the
experiments planned. In structural biology, the sample in the majority of cases is a pure
and highly concentrated solution of protein. Generally, recombinant protein is produced
in Escherichia coli (E. coli), into which foreign DNA has been transfected using a
bacterial plasmid as a vector (Figure 2.1.1). Such plasmids normally contain the T7
promoter and can nowadays be prepared by using standardized protocols.103 The first
step of classic ligation-based cloning is the design of primers for the polymerase chain
reaction (PCR). The primers facilitate the amplification of a specific gene fragment. The
next step is to cleave the PCR product at the ends with restriction enzymes. These
enzymes are highly specific and usually leave an overhang at each DNA end, also
known as "sticky ends". The vector is then digested using the same enzymes, so that
the PCR fragment can be inserted into it by the help of a DNA ligase. The sticky ends
helps directing the fragment and enhances the efficiency of the insertion. Finally, the
plasmid containing the gene of interest, and additional functional sequences for
selection and expression, can be transferred into the host bacterial cell.
Figure 2.1.1 Basic workflow of molecular cloning for protein expression.

23
Many important considerations have to be taken into account at this early stage of
sample preparations.104 The construct design will often determine how successful the
project will be, and/or which quality the data will have.105 First, it is usually important to
clone a fragment of the full-length protein that is likely to give rise to a stable and
mono-disperse protein solution. This can be facilitated by bioinformatics tools available
online.106 These can tell you about conservation, compared to other homologous
proteins, as well as where you can expect secondary structures or unfolded regions.
Second, if the target is exhibiting low purification yields, the incorporation of solubility
or expression tags should be considered. Usually a His-tag or a GST-tag is available in
the plasmid, to simplify protein purification. Importantly, the tags are typically cleavable
upon the addition of a sequence specific protease, such as the Tobacco etch virus
(TEV) protease. Third, if human genes are to be expressed in E. coli, problems with
codon usage can arise due to differences in tRNA levels.107 This can be avoided by
changing specific rare codons through site-specific mutations, or by transfecting the
plasmid into special E. coli expression strains, carrying an extra plasmid for production
of rare tRNAs.
Additionally, it is now possible to buy codon-optimized constructs from companies
specialized in gene synthesis. Finally, it is important to realize the importance of trial
and error in cloning. It is usually suggested to make several constructs of the same
protein, and check the expression quality of them all. Subtle differences in at N- or C-
terminus can affect the sample quality drastically, as can residue specific mutations, or
shortening of internal loops.108 Varying the incorporated solubility-tag, so-called parallel
cloning, is also to be considered. Constructs of difficult targets must be extensively
optimized and is often pursued in a high-throughput setting.109,110
In addition to ligation-dependent cloning, alternatives exist that might simplify
laboratory work drastically. Homologous recombination (e.g. Gateway® from
Invitrogen), Ligase Independent Cloning (LIC)111 and Sequence and Ligase
Independent Cloning (SLIC)112, are all established options with their respective pros
and cons.
For protocols and vector maps: http://www.helmholtz-muenchen.de/en/pepf/
For practical details regarding expression and purification of cloned proteins, see the
Materials and methods section of the published papers, or in Chapter 5.

24
2.2. NMR: Solving structures in solution
Nuclear magnetic resonance (NMR) is a basic physical phenomenon of certain atomic
nuclei. Such spin-½ nuclei orient in an applied magnetic field, either in an parallel or in
anti-parallel way, and will therefore populate two different energy states. The system
can be perturbed using radiofrequencies, meaning that the difference between the
energy states can be measured, hence the name NMR spectroscopy. The difference in
energy corresponds to a resonance frequency. The NMR spectroscopist tries to
measure as many of these frequencies as possible, and then assigns from which atom
they arise. A closer analysis of the acquired NMR data can later give specific
information on the structure and dynamics of the molecule studied.
In the coming sections, the physical background of NMR and its applications in
structural biology will be introduced. However, this is a formidable task and the reader
is encouraged to follow references and to check the suggested literature (page 39) for
additional information. It should be pointed out that this text is largely dealing with
solution NMR, i.e. the sample molecule is dissolved in a liquid. Solid state NMR, using
crystalline or amorphous samples, has increased in popularity due to technological and
methodological improvements.113 It should also be kept in mind, that the medically
important field of magnetic resonance imaging (MRI) is based on the same physical
phenomenon as NMR.
The history of NMR really starts in the middle of the 1940s when American physicists
first recorded an NMR signal with the purpose of measuring the magnetic dipole
moments of different elements.114 What Purcell, Bloch and colleagues overlooked was
that those values are affected by the electrochemical environment of the nuclei. In fact,
the discrepancies gave rise to the understanding of the chemical shift, which led to a
lot of interest among chemists. In chemical molecules the hydrogen nuclei, which
frequencies normally are recorded, will sense those differences and give rise to
specific and separate signals. One important breakthrough then came in the early 50s
when the nuclear Overhauser effect (NOE) was described.115 The NOE would later be
used for structure elucidation of molecules. The progress of NMR is closely linked to
advancement of technology, in particular the construction of very strong and stable
magnets, increasing resolution and signal intensity. A crucial development was also the
use of Fourier transform NMR (FT NMR)116 (page 28), and its use in combination with
multi-dimensional techniques117 (page 31). This paved the road for detection of
heteronuclei (e.g. 15N and 13C) which are inherently insensitive. Today, with state of the
art equipment, NMR is a integral part of biological and pharmaceutical research, with
continuous improvements regarding limitations of molecular size118,119 and of sample
amounts120,121.
Throughout the years several Nobel prizes have been awarded for discoveries
connected to the development of NMR and to its applications. To mention two; Richard
Ernst (1991) for the development of two-dimensional FT NMR. Kurt Wüthrich (2002) for
the determination of the first protein structure by NMR.

25
2.2.1. Basic physical and mathematical description of NMR
One intrinsic property of atomic nuclei is that they frequently, depending on the
composition of protons and neutrons, posses a magnetic angular moment,
,
where γ is a nucleus dependent value called the gyromagnetic ratio, ħ the Planck
constant divided by 2π, and m the magnetic quantum number. This feature cause the
nuclei to behave like a small magnet and is sometimes referred to as nuclear spin,
since a rotating charged body is known to create a magnetic field. However, there is no
evidence that the proton is actually spinning. 1H, 13C and 15N are the most common
NMR active nuclei studied, but also other isotopes, for example, 19F or and 31P can be
utilized. When for an example a hydrogen nuclei, which only includes one proton, is
put in an external magnetic there is only two possible values of the μz, because m is
quantized and only can be +½ or -½.
If B0 is the applied magnetic field then the energy of each state and the difference
between them is,
.
As we can see that the energy difference is increasing with higher magnetic fields
(Figure 2.2.1). In a sample, including billions of spins, the population of these energy
states will follow the Boltzmann distribution,
, where N is the number of protons in each respective state, k the Boltzmann constant
and T the temperature. Together the spins will create a net bulk magnetization along B0,
which allow manipulation of the system during an NMR experiment. Unfortunately, the
bulk magnetization is small and cause the inherently low sensitivity of NMR.
Figure 2.2.1 In a magnetic field the proton can only populate two energy states, between which the difference increases with the strength of the B0 field. The population distribution follows the Boltzmann equation and will create a favorable bulk magnetization in the sample along B0. This bulk magnetization is manipulated during NMR experiments.

26
Now the question comes how we manipulate the spin system, and what the readout
actually is. The resonance condition of the system is fulfilled using electromagnetic
radiation of the correct frequency: , where is the frequency in Hertz. In the
case of NMR this is typically in the range 100-1000 MHz, corresponding to the normal
FM radio frequency band.
Put into a Cartesian coordinate system, the bulk magnetization can be represented by
a vector, M. Initially, M is pointing along the z-axis and B0 (Figure 2.2.2 A). If a radio
pulse, B1, is applied along y-axis the magnetization will turn towards the x-axis. The
angle α will increase depending on how long the radio pulse is (Figure 2.2.2 B). The
direction of the vector rotation is determined by the right-hand rule known from basic
physics of electromagnetism. The vector and the system is now out of equilibrium but
will try to return to the low energy state. As a gyroscope (a rotating mass), in a gravity
field, the magnetization vector will not go straight back to the original position, but will
precess around the magnetic field (Figure 2.2.2 C). This precession frequency, also
known as the Larmor frequency, ω, is the actual readout of each NMR experiment,
since it induces an electric current in the receiver coils. The NMR signal is, however,
affected by relaxation, and the M returns to the ground state (Figure 2.2.2 D).
Importantly, this basic vector model can only explain simple NMR experiments on
isolated spins. Furthermore, most pulse programs normally only include pulses where
α = 90° or 180° degree, which make the analysis and setup less complicated.
Figure 2.2.2 Basic explanation of the NMR phenomenon using the vector model. See text for details.

27
2.2.2. NMR hardware and experiment setup
Figure 2.2.3 outlines the hardware setup and how a spectrum is acquired. Most
modern NMR experiments utilize rather complex sequences of radio pulses and delays,
which together manipulate the spins in a desired way. The commands are sent to a
radio frequency (RF) synthesizer which executes the pulseprogram. The electric
pulses are converted to radio pulses in the probe coils and transferred to the sample.
Directly after execution of the pulse program, the same probe coils are used to detect
whatever NMR signal is returned back. An amplifier is needed due to the very low
signal intensity. The oscillating output signal, called free induction decay (FID), is then
digitized so that it can be recorded and processed by a normal desktop computer.
Figure 2.2.3 Outline of NMR hardware setup and acquisition. See text for further details.
There a many important practical considerations to be aware of when acquiring NMR
spectra, because of the low signal-to-noise ratio. Depending on the type of experiment,
the sample has to be concentrated enough, and stable over the acquisition time.
Additionally, the NMR instrumentation has to be carefully set up. First, the hardware
should be checked and adjusted. Matching and tuning of the resonance circuit in the
probe head, will optimize the transfer of the radio pulse from the coil to the sample,

28
and is affected by salt concentration etc. A proper shimming process will create a
homogenous magnetic field over the whole sample. Remember, that the B0 directly
affects the resonance frequency, and if it is not constant this will result in broad lines in
the final spectrum. Shimming is accomplished by adjusting the current in a set of
additional electromagnets in the probe. Secondly, the pulses (length, power and
sometimes the phase) included in the pulseprogram have to be calibrated, so that
manipulation of the spins are optimal. Finally, the user should control that the water
suppression is good enough. If not, the protein signals of typical NMR samples, ~100
μM, would be obscured by a huge water signal, ~110 M (proton concentration). Instead
of always buffer exchanging the protein into a D2O-based buffer, which would also
eliminate any exchangeable protons, several techniques have been developed. In
addition to pre-saturation, where the water signal is specifically saturated before each
experiment, the most common procedures include water-flip-back, or the WATERGATE
sequence.122 With optimized water-suppression hardly any signal from the water are
visible in the NMR spectrum. Inappropriate shimming usually leads to diminished water
suppression.
2.2.3. Fourier transform and NMR
Old NMR instruments used to sweep the frequency (continuous wave, CW NMR), and
when a resonance condition was fulfilled this would result in a spike in the spectrum.
With this technique there would be a direct correlation between the frequency recorded
and the signal, but it was indeed very time-consuming. In the 1970s it was realized that
one could excite all frequencies at the same time, record the response and then
deconvolute the output signal, which now retained all signals in an overlapped
fashion.117 The problem was of course how to reconstruct the frequency spectrum from
a time-domain signal (Figure 2.2.3). The answer came from an old known
mathematical trick, the Fourier transform (FT), and because FT was used for the
deconvolution process this was called FT NMR. FT appreciate the possibility to
express any periodic, and continuous function, as a sum of sine and cosine functions.
The oscillating FID fulfills these criteria and can be evaluated, allowing extraction of the
unknown frequencies contained in the signal.
Formally, the frequency spectrum, , is found by integrating the time domain
function, f(t),
.
FT NMR opened up for the development of modern NMR, because the output of rapid
consecutive scans could be added together. Importantly, while the NMR signal of N
scans directly adds up, the noise only adds up with . Hence, four times as many
scans are needed, to double the signal-to-noise ratio. The FT technique increased the
relative sensitivity and made it possible to record more insensitive nuclei, such as 13C
and 15N, by coherence transfer. Additionally, FT NMR was essential to the

29
implementation of complex pulseprograms, comprising multiple pulses on different
nuclei. For instance, multi-dimensional experiments and studies of relaxation would
otherwise have been difficult to realize.
Practically, experiments on Bruker NMR instruments are setup using their Topspin®
software, however, the final processing of the FID is often done in NMRPipe123. Here,
the user has the opportunity to include several additional processing steps prior and
after the FT step. Amongst those, choosing the appropriate window function, that make
sure the FID reaches zero at last time point, and applying zero-filling, which enhances
the digital resolution of the spectrum, as well as adding a phase correction in the
dimensions at hand, are the most important. In addition, linear prediction of further
data points can be implemented, which might increase the resolution of the spectrum,
but sometimes introduces artifacts.
2.2.4. The chemical shift and J-coupling
As previously touched on, depending on the electrochemical environment of the NMR
active nucleus, it will acquire slightly different resonance frequencies. This feature is
known as the chemical shift. The resonance frequency of NMR signals are rarely given
in Hertz, but rather by their chemical shift (in parts per million, ppm). The latter unit is
also independent of the field strength,
, where is the frequency of the signal and is the frequency of the reference
compound decided upon.
Another basic aspect of NMR, is that nuclei connected by electron pairs, i.e. chemical
bonds, are known to communicate with each other. For example, if one hydrogen
nuclei has been excited, the behavior of this magnetization can be influenced by a
neighboring coupled 13C nuclei. This coupling, named scalar or J-coupling, can be
measured (usually in Hz), and is stronger with increasing values. J-couplings reaching
over up to three chemical bonds are often utilized in NMR experiments. The J-coupling
make it possible to transfer magnetization between coupled nuclei. This means, not
only the NMR frequency of the initial nucleus can be measure, but also additional
resonances in the vicinity.
The product operator nomenclature has been very successfully introduced in NMR. It
is used to analyze the NMR properties mentioned above, especially in the context of
more complex pulseprograms.124 Product operators are based on quantum mechanics
of the populated energy states and can handle multiple coupled nuclei. The product
operators do not include the treatment of relaxation, or strongly coupled nuclei. In brief,
the initial bulk magnetization is described by a basic operator, Iz, and depending on the
pulseprogram this initial state is transformed during the experiment. The final state, i.e.
the outcome of the experiment, can be calculated by the sequential application of easy
30
rules, and by simple computations. To start with, the effect of 90° and 180° pulses is
introduced:
Please notice that a pulse along the axis of the initial operator leaves it untouched, and
that a 180° pulse along the x- or y-axis inverts the operator. The chemical shift is
treated in more complicated since it evolves with the offset during the time t of free
precession:
Free precession always takes place around the applied magnetic field, which by
definition is along . The offset ( ) is the difference between a signal and a reference
value, i.e. .
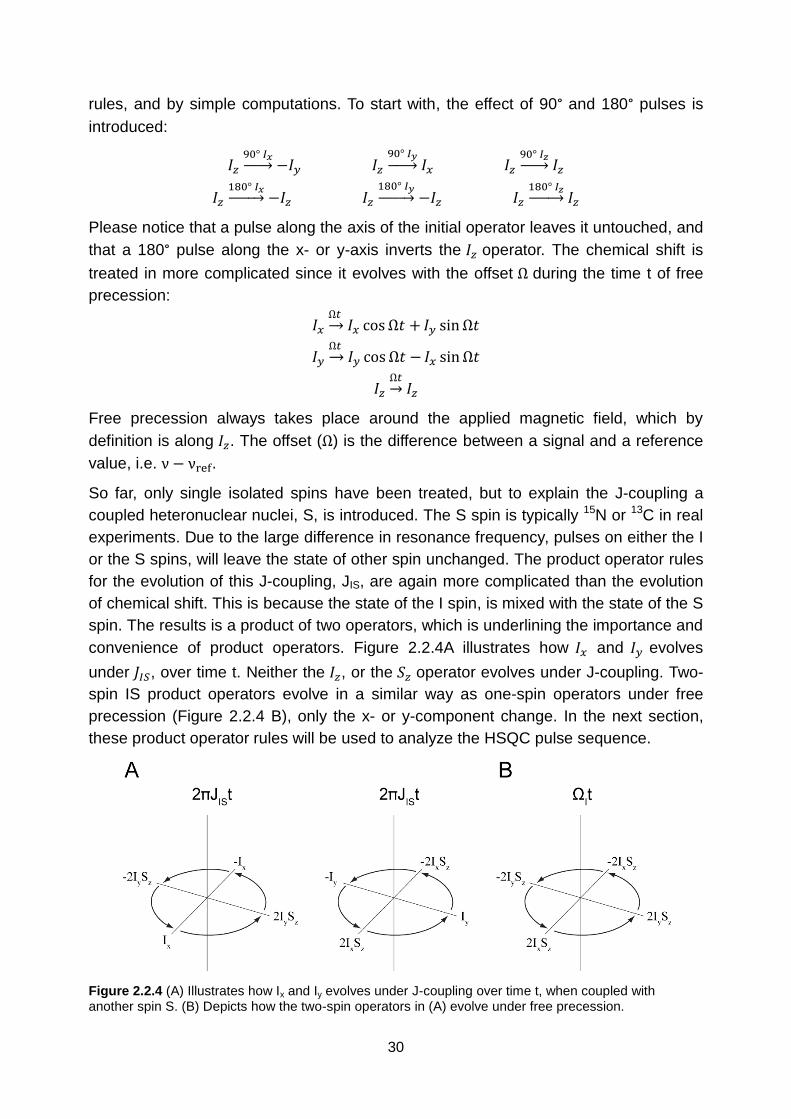
So far, only single isolated spins have been treated, but to explain the J-coupling a
coupled heteronuclear nuclei, S, is introduced. The S spin is typically 15N or 13C in real
experiments. Due to the large difference in resonance frequency, pulses on either the I
or the S spins, will leave the state of other spin unchanged. The product operator rules
for the evolution of this J-coupling, JIS, are again more complicated than the evolution
of chemical shift. This is because the state of the I spin, is mixed with the state of the S
spin. The results is a product of two operators, which is underlining the importance and
convenience of product operators. Figure 2.2.4A illustrates how and evolves
under , over time t. Neither the , or the operator evolves under J-coupling. Two-
spin IS product operators evolve in a similar way as one-spin operators under free
precession (Figure 2.2.4 B), only the x- or y-component change. In the next section,
these product operator rules will be used to analyze the HSQC pulse sequence.
Figure 2.2.4 (A) Illustrates how Ix and Iy evolves under J-coupling over time t, when coupled with another spin S. (B) Depicts how the two-spin operators in (A) evolve under free precession.

31
2.2.5. The protein fingerprint spectrum, 2D 1H,15N HSQC
Signal overlap in the NMR spectrum will occur with increasing molecular size, and will
soon be so severe that separation is impossible. The solution to this problem is to
apply selection criteria. In the two-dimensional 1H,15N heteronuclear single-quantum
correlation (HSQC) spectrum only the frequencies of amide nitrogens, and their paired
hydrogen, will be recorded (Figure 2.2.5). Another selection criteria could be to record
proton resonances correlated to 13C atoms. For a 10 kDa protein this results in a
reduction from ~700 hydrogen signals in a normal 1D spectrum, to ~100 signals in a
2D 1H,15N HSQC. Recording the nitrogen frequency also enables the separation of the
100 signals in two dimensions instead of one. This is accomplished by the stepwise
increase of the t1 delay, and the subsequent FT processing of both time domains. The
HSQC is sometimes considered to give a "fingerprint spectrum" of a protein, since
each signal correspond to one residue and together produce a unique spectrum.
To be able to acquire heteronuclear spectra, the protein needs to be isotopically
enriched with the required NMR active nuclei. In general, this is accomplished by
growing protein producing bacteria on minimal media, supplied with 15N NH4Cl and/or 13C-glucose as the sole nitrogen and carbon source, respectively.
Figure 2.2.5 The basic version of the HSQC pulse sequence. See Appendix A.1 for details.
In summary, the outcome of the HSQC pulseprogram just prior to acquisition,
, indicate that , which was created by the initial 90° pulse, has acquired the chemical
shift (or frequency) of the S spin ( ) during t1. During acquisition (t2) will then evolve
the chemical shift of the I spin. For the full product operator analysis of the HSQC
pulse sequence see Appendix A.1.
If additional signal dispersion is needed, the dimensionality of a NMR spectrum can be
increased to three or more, of course at the cost of lower sensitivity which leads to long
acquisition times (Figure 2.2.6).

32
Figure 2.2.6 The application of selection criteria and the acquisition of correlated NMR resonances, will enhance the dispersion of the NMR signals by introducing additional dimensions.
2.2.6. Assignments strategies
The 1H,15N HSQC spectrum is often used for ligand binding studies. However, the
possibility to map the binding site onto a model of the protein, requires knowledge
about the resonance assignment. This means that each NMR signal has to be
correlated to the atom from which it arises. For this purpose several multidimensional
heteronuclear NMR experiments based on J-couplings has been developed (Figure
2.2.7). To assign the protein backbone amides, i.e. the HSQC spectrum, triple
resonance experiments, which correlate the amide to the Cα and Cβ chemical shift,
are acquired. The experiments are named according to the atoms involved in
magnetization transfer. For instance, a HNCACB gives the frequency of Cα and Cβ of
the current residue, while HN(CO)CACB gives the frequency of Cα and Cβ of the
previous residue.125 Using the data of each spin system, they can be now be
connected, put together like pieces of a jigsaw puzzle. Stretches of combined spin
systems are then assigned to the primary sequence of the protein (Figure 2.2.8). This
is feasible, because the Cα/Cβ chemical shift is dependent on the type of residue. The
backbone assignment is often guided by computer programs.126,127
The side-chain atoms of a protein are assign using a slightly different strategy.
Normally, starting from the Cα/Cβ chemical shifts and the backbone assignment, the
correlation to additional carbon atoms, e.g. Cγ and Cδ, are found by TOCSY-based
(total correlation spectroscopy) experiments. In the next step, all carbons are
correlated to their attached hydrogens.125
Assigned chemical shifts can be used as such for characterizing a protein. The
chemical shift index (CSI) method exploit the fact that Cα/Cβ chemical shifts is
influenced by the secondary structure.128 A simple comparison to average values from
disordered peptides, can give the propensity of alpha-helices, beta-strands and loops
along the protein sequence. The TALOS program includes a database of high-
resolution crystal structures with assigned chemical shifts, and is used to predict φ and
ψ torsion angles.129 In general, torsion angles will also give information on secondary
structures. A more recent and intriguing development, is the direct calculation of
structures using only chemical shift data, or in combination with additional but sparse
NMR data. CS-Rosetta is the most known procedure, but other labs have developed
similar algorithms.130-132

33
Figure 2.2.7 J-couplings utilized in backbone assignment experiments (left). Together the experiments give the chemical shift of the Cα/Cβ atoms of the current as well as of the previous residue (right). The spin system can be compared to a piece of a jigsaw puzzle with its characteristic edges.
Figure 2.2.8 Cartoon illustrating the backbone assignment strategy. All Cα and Cβ chemical shifts have been measured for four different spin systems, but the initial order is incorrect (top). The values [ppm] do not correspond very well with each other. After rearrangement the chemical shifts match perfectly (bottom). The complete fragment is now used to search the protein sequence for a match. In this example the serine and the alanine have very characteristic chemical shifts, which facilitates final assignment. The result is that resonances 1-4 corresponds to the residues of S-F-A-L. This information can now be used for ligand binding studies. It is also the first step in structure determination.

34
2.2.7. Ligand binding studies by NMR
NMR is not restricted only to the study of structural or dynamic properties, but can also
be used to examine the interactions of biomolecules. The 2D 1H,15N HSQC spectrum,
is maybe the simplest and the most widely used experiment to monitor ligand binding.
A ligand that interacts with a protein will affect the chemical environment of the amides
in the binding site. As a consequence the resonance frequency of those particular
proton and nitrogen nuclei will change. This can be observed as a shift of the signal
position, and is called a chemical shift perturbation (CSP) (Figure 2.2.9).
Figure 2.2.9 Ligand binding monitored by consecutive acquisition of 1H,
15N HSQC spectra. To the left an
example of CSPs induced by a ligand interacting in the fast-exchange regime, and to the right a spectrum after addition of a ligand with no, or very weak affinity for the protein. The black reference spectrum is recorded on a sample without any ligand.
Using this technique, libraries of compounds can be screened for binding, or hits from
other experimental methods can be validated.133 Moreover, if the two molecules are in
fast exchange, the affinity between them can be estimated, (see Chapter 3). Fast,
intermediate or slow exchange ( ) refer to the NMR timescale as,
Fast exchange:
Intermediate exchange:
Slow exchange:
, where is the resonance frequency difference (in Hz), between the free and bound
(saturated) state. The behaviour influences the appearance of the spectra during
titration of a ligand and is illustrated in Figure 2.2.10. To push the equilibrium into
another exchange regime, one can change the temperature or field strength.
Due to the high sensitivity of CSPs, and their correlation to structural information, NMR
has been successfully established as a powerful technique in drug discovery and
development. "SAR by NMR" is based on the possibility to map the interaction of small
and weakly interacting fragments, which are then joined together by linkers to form
high-affinity drug-like lead compounds.134 Many NMR experiments that detect the
ligand have also been developed. In contrast to the protein detecting experiments, the
ligand-detected experiments do not suffer from the slow tumbling of a large receptor,
which results in broad NMR signals. STD-NMR135 (saturation transfer difference NMR)
and INPHARMA136 are good examples of such experiments useful in drug design.

35
Figure 2.2.10 The exchange rate of the ligand influence the appearance of a signal during titration. A ligand is titrated to the free form of the protein (A) until the fully saturated or bound state (B) is reached. I-V denote the amount of ligand added. For a fast exchanging ligand the peak position is an average chemical shift, weighted by the relative amounts of free and bound protein. In the intermediate case the peak is broadened until coalescence, but recover upon saturation. Finally, for slow exchanging ligands, the population of free and bound state, can be observed simultaneously. The area under the peaks correspond to their relative amounts.
2.2.8. Relaxation studies in NMR
The function of a protein is determined by its structure and, importantly, by the motions
present in the molecule. The dynamic properties of a protein, or any other biomolecule,
can be studied by following the relaxation of NMR signals. Two constants are usually
used to characterize NMR relaxation in biomolecules, T1 and T2, and these are
typically studied separately. T1 describes the longitudinal relaxation, which is the return
from the symmetrically populated excited state to the low-energy equilibrium state. T2
on the other hand, known as transverse relaxation, is related to the loss of coherence
between the individual precessing spins in the sample. The bulk magnetization, which
is manipulated and detected during the NMR experiment, is indeed produced by the
individual spins, and disappears once those vectors are not precessing in a
synchronized and organized way. Both longitudinal and transverse relaxation follow an
exponential decay function, where T1 and T2 are the single time constants.
The physical understanding and mathematical description of relaxation is very
demanding. In short, relaxation comes from the interaction of the individual spin with its
environment. The molecule is tumbling and diffusing, additionally there might be
internal motion. This creates several relaxation pathways, through which energy and
entropy is lost, and causes the return of the polarization, from an excited state, back to
equilibrium. A major relaxation contribution comes from the dipole-dipole interactions of
a spin. Relaxation increases with molecular size, and can create severe problems
regarding acquisition, thereby creating a upper limit for structural studies by NMR
(~30kDa). The "positive" thing with relaxation is that consecutive scans can be
executed with relatively short intervals. Additionally, T1 and T2 can give information on
the relative flexibility of a amino acid residue.

36
Generally, T1 of macromolecules increases with the molecular weight, as well as with
high rigidity of a residue. T2, on the contrary, is normally decreasing in such cases. The
flexibility of the protein backbone can be estimated by measuring those two constants
using HSQC based NMR experiments.137 In such pulseprograms a relaxation delay
has been incorporated, and the intensity of each signal is then followed over a range of
delay values. Extending the relaxation delay results in a decrease of the signal
intensity. The data is then fitted to a exponential decay function and the time constants
are calculated (Figure 2.2.11). The error is normally based on a Monte Carlo simulation,
which adds the noise of the experiment onto the signal intensity of the data.
In Chapter 4, T1 and T2 measurements could be correlated to the precision of structure
calculations. The {1H}-15N heteronuclear NOE is a complementary experiment, which
quickly provides data on which protein stretches are flexible. This is practical for
optimization of protein constructs.138
Figure 2.2.11 T2 measurements using the rate analysis module of NMRViewJ v8. The intensity of each peak is plotted and fitted to a exponential decay function. The calculated (per-residue) T2 value gives information on which residues are rigid (structured domain) and which are flexible (termini and loops), as well as information on motions on a slower timescale undergone by the system under study.
Certain labeling techniques can be used to study the relaxation, and therefore the
dynamics, of methyl groups in large macromolecular complexes.119 This helps in
delineating the molecular function of such cellular machines.139 Non-linear sampling is
another recent development that might facilitate such studies.140 Here, not all time-
points of the Nyqvist-grid are recorded but rather only a randomly distributed subset.
This opens up for increased sensitivity with maintained resolution, but need
alternatives to the classical FT processing approach.
Structure determination by NMR is heavily dependent on measuring distances
between nuclei. This is possible due to an important feature of relaxation called the
nuclear Overhauser effect (NOE), which will be described in the following section.

37
2.2.9. The Nuclear Overhauser Effect
The nuclear Overhauser effect (NOE) make it possible to measure inter-atomic
distances by NMR, usually between hydrogen atoms. The NOE is arising from the
cross relaxation of two dipole-coupled spins.115 The dipolar coupling enables the
transfer of spin polarization (magnetization along the z-axis), from one nuclei to
another, while remembering its previous resonance frequency. This transfer opens up
for the design NMR experiments, where a hydrogen resonance frequency is correlated
to all other hydrogen signals in the vicinity (< 5 Å). In contrast to J-coupled systems,
where the coherence transfer is via the molecular bonds, the NOE polarization transfer
is through space. The distance dependence is strong, and the transfer efficiency
decreases with r-6, where r is the atomic distance.
Many NOE spectroscopy (NOESY) pulse sequence have been developed to measure
the NOE between certain nuclei. Apart from applying different selection criteria (see
Section 2.2.5) they all share the incorporation of a crucial mixing period. During this
period (~100 ms) the spins have to be along the magnetic field. In addition to the
homonuclear 1H-1H NOESY, the key experiments for structural biology include 13C and 15N editing.125 This means that only protons connected to carbons or nitrogens are
recorded, i.e. 13C-1H … 1H or 15N-1H … 1H correlations. In combination with editing,
insertion of filtering steps are important to the characterization of macromolecular
complexes. Such pulse sequences are used for instance for protein-peptide complexes
where the protein is 13C/15N labeled and the peptide not. The resulting spectrum would
give the correlations of the following kind, 13C-1H … 1H-12C/14N.
Automated techniques have been implemented to assign the usually very complex
NOESY spectra. The most popular algorithms to derive distance restraints are CYANA
and ARIA.141,142 Both are based on iterative rounds of assignment and re-assignment,
and include ambiguous restraints, network anchoring and simplified torsion angle
molecular dynamics to obtain initial structural models.
2.2.10. Residual dipolar couplings
The dipolar interaction between two nuclei (two dipoles) is dependent on the
orientation and distance,
, where is the frequency contribution to the chemical shift from the dipolar coupling,
whereas is the maximum dipolar coupling, which occurs when the vector is along
the external magnetic field ( = 0° or 180°). is the angle between the inter-nuclei
vector and the applied magnetic field, is gyromagnetic ratio of the involved nuclei, h
the Plank constant, and r the inter-nuclei distance. The dipolar interaction is averaged
out in solution because of the dependence. This simplifies the NMR spectra

38
significantly, since the coupling is very strong, e.g. between two protons it is in the
kilohertz range.
The dipolar coupling has to be scaled down if the geometric information, hidden in the
dipolar coupling is to be used. A residual dipolar coupling (RDC) is revealed if the
molecules are slightly aligned in the sample and, thus, to the magnetic field.143 Several
media have been established to allow RDC measurements. The most common are
bacteriophages144, liquid crystalline media145,146, and stretched or compressed gels147.
The RDC is commonly measured as the difference of the J-coupling in two
non-decoupled spectra, one of the non-aligned sample, and the other of an aligned
sample. Then, the RDCs are analyzed by the computer programs and connected to the
molecular frame.148-150 The best data come from measurements of different RDCs, in
combination with multiple types of alignment media.
RDC data can be used for structure refinement by incorporating them as restraints into
the calculations. RDCs are particularly important for large complexes, due to their
inherent global character.151 Here, they give important information on the relative
domain orientations. If not used in the structure calculation, RDCs can be used in for
structure validation. A quality factor (Q-factor) can be calculated as,
and gives the agreement between experimental (RDCexp) and back-calculated (RDCcalc)
RDC values. Q values ranging between 0.2-0.3 can be considered reasonable.152
In relation to X-ray crystallography, RDCs can be used to compare a crystal structure
to its solution conformation, without completing a structural determination by NMR.
Also dynamics can be studied by RDC measurements. Examples include studies of
inter-domain motions153 (and Chapter 3), as well as the investigation of the solution
dynamics of whole proteins.154,155 This is possible since the RDC, due to averaging,
contains conformational data up the microsecond timescale.
2.2.11. Structure calculations and quality control
Compared to X-ray crystallography, where a structural model is built into the electron
density, NMR relies on the simulated folding of a macromolecule. The folding is caused
by the application of structural restraints (e.g. NOEs, RDCs and torsion angles).
Importantly, the restrained simulation is rather a simulated annealing procedure, since
the goal is only to minimize the target function, and does not try give a physically
realistic trajectory of the molecular dynamics. In brief, after an initial high-temperature
phase the energy of the system is slowly lowered. The cooling allow the efficient
minimization of the penalties that arise from violated restraints. When, which and how

39
strongly a specific type of restraint is applied, are important features to modify for a
successful result.
The two most used programs for structural determination by NMR are CNS156 and
XPLOR-NIH157. Both packages can also be used for a final refinement in explicit
solvents, which is important to improve the surface electrostatics. Furthermore,
additional restraints to the ones mentioned above can be incorporated in the
calculations. These include paramagnetic relaxation enhancement (PRE) data151,158,
hydrogen bonds (characterized by H/D-exchange) and predicted torsion angles129.
After completed calculations the structure quality has to be assessed. The parameters
to examine can be divided into two categories, one is how well the final structure fulfills
the given restraints, and the other is how the structure compares to other previously
determined structures (often high-resolution crystal structures). Two terms useful to
quality analysis, are precision and accuracy, as is the understanding that something
that is precise do not have to be accurate.159 The actual analysis is facilitated by
readily available programs and online services. One recommendation is iCING160,
which includes PROCHECK161 and WHATCHECK162, as well as detailed per-residue
reports on violations, and a calculation on completeness. The recommendation is to
perform iterative rounds of quality checks and setting up of new structure calculations.
This will increase the chances of discovering and relieving problems early in the
process. Suggestions have been made to introduce R-factors as in X-ray
crystallography.163
2.2.12. Literature
As a complement to the article references given, I suggest the following books for
further reading. They span from introductory texts on basic NMR concepts, to detailed
descriptions on more exotic topics.
Introductory:
NMR: The Toolkit, P.J. Hore; Concise introduction to NMR in general
Structural Biology - Practical NMR Applications, Q. Teng; NMR focused on structural biology
Understanding NMR Spectroscopy, J. Keeler; A great introduction to the mathematics of NMR
More advanced:
Fundamentals of Protein NMR Spectroscopy, G.S. Rule; Protein NMR, quite mathematical.
Spin Dynamics, M.H. Levitt; Comprehensive book explaining the physics behind NMR.
Protein NMR Spectroscopy: Principles and Practice, J. Cavanagh et al.; The standard
reference for a protein NMR spectroscopist. Covers most of the relevant topics.
Practical advice on setup and acquisition:
200 and more NMR Experiments, S. Berger et al.; Good when setting up new experiments.

40
2.3. X-ray crystallography
X-ray crystallography is the method of choice to solve large structures or complexes of
biomolecules (>25 kDa).164-166 The technique is dependent on the strong X-ray
diffraction of a well-ordered crystal. The photons of the X-ray beam are scattered by
the electrons of the molecules in the crystal lattice. However, due to the crystal
periodicity, there is a constructive interference at certain distances and angles. All
these signals, known as reflections, can be recorded by rotating the crystal in the
beam. Through back-calculation the underlying electron density can be reconstructed.
Here, one hurdle is solving the phase problem. The phases are lost during the
acquisition but can be recovered by computational or experimental procedures.167 The
back-calculation is performed by Fourier-transform algorithms similar to those used in
NMR. Once the electron density is available, the crystallographer tries to build a model
of the macromolecule that fits the data the best. Refinement of the model is a iterative
process of building and re-building (Figure 2.3.1).
Figure 2.3.1 Basic workflow of X-ray crystallography. Today, the major bottleneck is the production of
high-quality crystals. The refinement cycle ends when no further improvements are possible.
Because of the short wavelength of X-ray radiation, it is possible to resolve the atom
coordinates with high accuracy. The precision, on the other hand, depends on the
crystal and the equipment used. Conditions for growing protein crystals, or similar, are
screened by automated procedures at sub-microliter scale. The difficulty of growing
usable crystals makes this the major bottleneck in the field.168 For instance, the EBNA-
2 protein (page 118) yields huge and good-looking crystals, however, those do not
diffract at all. Due to the seemingly complete lack of correlation, between a proteins
properties and its crystallization condition, one can only outline some basic principles
for what will increase the chances to obtain diffracting crystals; First, use an optimized
protein construct, without long flexible termini. A complementary practice is the use of
proteolysis.169 Second, make sure the sample is as pure as possible (> 95%) and is in
a defined and non-aggregated state. Third, consider making site-specific mutations of
exposed residues to lower the surface entropy.168 Finally, the addition of a ligand might
improve the conformational stability of the protein, and could change the outcome of
the crystal screen.

41
As been touch on previously, the strength of X-ray crystallography is the apparent
absence of a size-limitation. It is also a direct method of modeling the structure, and
most often yield highly accurate atom coordinates. Additionally, no expensive isotope
labeling is needed and once crystals are available it is normally a very fast procedure.
One important feature is the possibility of structural quality assessment. The R-factor
defined as,
, where Fobs and Fcalc are the observed and calculated structure factors, respectively,
gives an easy measure on how well the model corresponds to the data. In contrast to
NMR, an R-factor can also be calculated for a subset of reflections not used in the
refinement. Such an Rfree factor is a cross-validation test, used not to over-interpret the
crystallographic data.170 This type of validation is possible due to the nature of the
crystallographic data. Single reflections are not alone responsible for the
electrondensity in a certain position. However, such removal of specific restraints in the
NMR structure calculation can be harmful to the output.
As described, the weakness of X-ray crystallography lies in the difficulty to obtain
crystals, as well as in the time invested in solving the phase problem. One inherent
difference to NMR is that the information on dynamic motions is limited, as the crystal
is consisting of an ordered solid phase array of molecules. Additionally, the crystals are
usually cooled down to approximately 100K during data acquisition to minimize
radiation damage. Another reason why to use NMR, when possible, is the
straightforward implementation of ligand binding studies.
In conclusion, the two major techniques of structural biology, X-ray crystallography and
solution NMR spectroscopy, have their own strengths and weaknesses. Depending on
the specific research question at hand, one technique can be selected, or, a
combination of the two can be used. There are several examples of when the synergy
of combining the two methods, lead to increased understanding of biology at a very
molecular level. For instance, Sprangers et al. have studied the function of the
proteasome, and Christodoulou et al. have described motions in the E. coli
ribosome.139,171 An additional example, on a somewhat different scale, is given in the
next chapter. Here, we present the crystal structure of a double-domain construct of
Tudor-SN, and give NMR evidence that those two domains tumble together in solution.

42

43
3. Chapter 3
Structure and ligand binding of Tudor-SN
3.1. Summary
Splicing is one out of many levels at which cellular gene expression is regulated. The
exclusion of introns is an essential step in the maturation of mRNA, before its export
into the cytoplasm, and translation into protein by the ribosome (see also Chapter 5).
Tudor-SN, first described to act a as transcriptional co-activator important to the
Epstein-Barr virus, was recently shown to posses the ability to enhance early steps of
splicing. To better understand the molecular mechanism we determined the structure of
an extended Tudor domain in Drosophila Tudor-SN using X-ray crystallography, and
analyzed the ligand binding preferences of this domain by NMR.
The extended Tudor domain of Tudor-SN (TSN) exhibits an interesting structure, in
which a Tudor domain is intertwined with a staphylococcal nuclease domain. During
the evolution of the protein, the Tudor domain has been inserted with additional linker
residues into a loop of the nuclease domain. Solution NMR data show that the two
domains tumble together. A comparison to known nuclease domains and their active-
sites, strongly implies that the TSN domain has no remaining nuclease activity.
However, its binding site for methylated amino acids, located in the Tudor domain, is
intact. We decided to probe the ligand binding of the TSN domain by NMR. By adding
ligands in increasing amounts and recording consecutive 2D 1H,15N HSQC spectra, we
were able to deduce that Tudor-SN has affinity for methylated arginines, as well as
peptides comprising such residues. In particular, the strongest interaction was
observed between Tudor-SN and symmetrically dimethylated arginines (sDMA).
sDMA can be found in proteins important to splicing, for instance in the C-terminal tails
of various Sm-proteins. Sm-proteins are an integral part of most small nuclear
ribonucleoproteins (snRNPs), which build up the core of the spliceosome. Our data
shows that Tudor-SN is capable of interacting with sDMA-modified proteins, and
suggest how the protein can affect the spliceosome assembly. Further studies will be
needed to establish the interaction partners of Tudor-SN in vivo.

44

45
3.2. Published manuscript
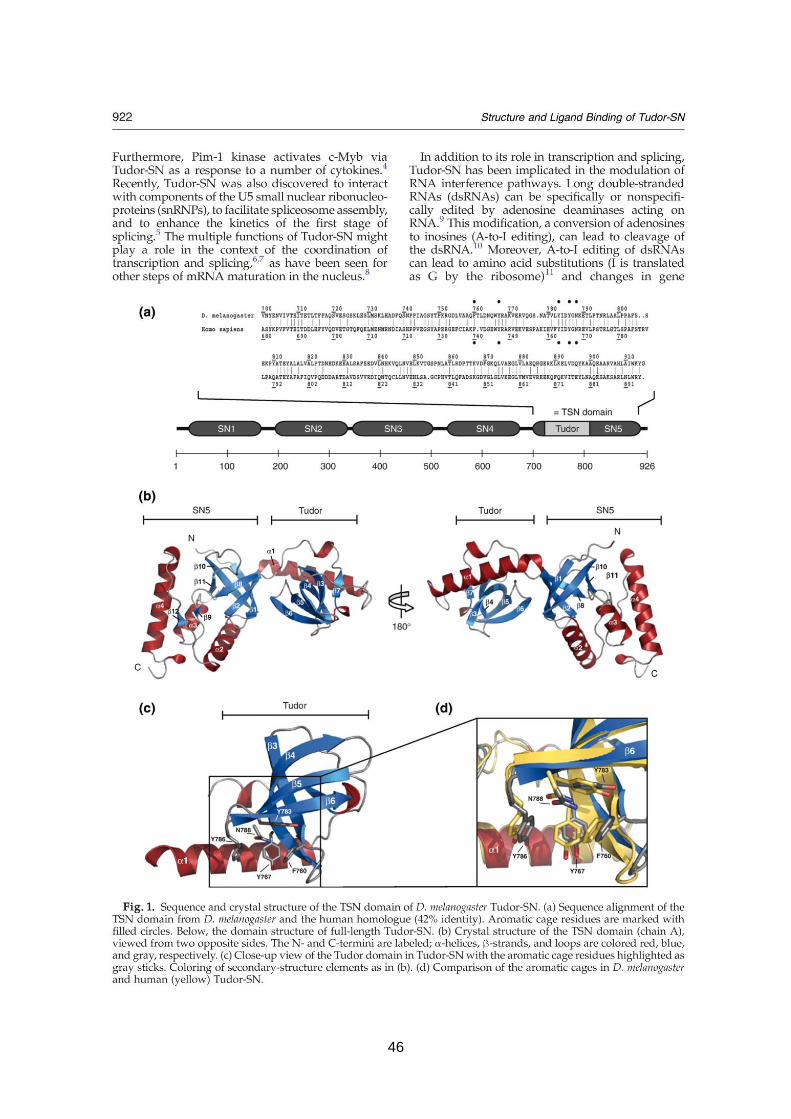
46

47

48

49

50
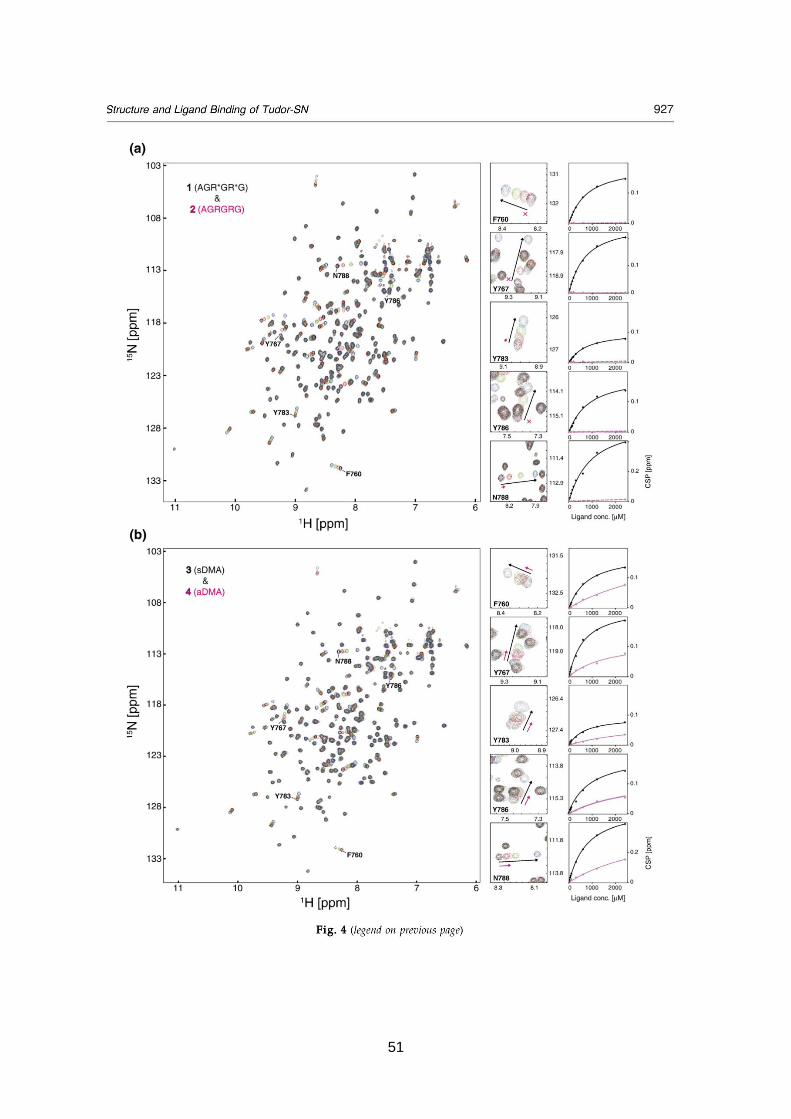
51

52

53

54

55

56

57

58

59
3.3. Supplementary material
Supplementary Table 1
Protein domains and their affinity to different methylated ligands.
Protein Domain Ligand KD Reference
SMN Tudor (R*G)4
low μM 1
SMN Tudor R*
high μM 1
JMJD2A Tudor H3K4me3
0.50 ± 0.03 μM, 10.4 μM 2, 3
JMJD2A Tudor H4K20me3
0.4 ± 0.03 μM 2
53BP1 Tudor H4K20me1
52.9 ± 2.2 μM 4
53BP1 Tudor H4K20me2
19.7 ± 0.7 μM 4
HP1 Chromodomain H3K9me2
2.1 μM 5
HP1 Chromodomain H3K9me3
1.9 μM 5
dSfmbt MBT repeat H3K9me1
7 ± 2 μM 6
dSfmbt MBT repeat H3K9me2
9 ± 2 μM 6
dSfmbt MBT repeat H3K9me3
110 ± 2 μM 6
dSfmbt MBT repeat H4K20me1
8 ± 1 μM 6
dSfmbt MBT repeat H4K20me2
12 ± 3 μM 6
dSfmbt MBT repeat H4K20me3
130 ± 15 μM 6
BPTF PHD Finger H3K4me1
ND 7
BPTF PHD Finger H3K4me2
5.0 μM 7
BPTF PHD Finger H3K4me3
2.7 μM 7
RAG2 PHD Finger H3K4me0
499 ± 55 μM 8
RAG2 PHD Finger H3K4me1
118 ± 36 μM 8
RAG2 PHD Finger H3K4me2
60 ± 20 μM 8
RAG2 PHD Finger H3K4me3 4.15 ± 0.21 μM 8
R* - symmetrically dimethylated arginine (sDMA); ND - not detectable
1 Sprangers et al. (2008). High-resolution X-ray and NMR structures of the SMN Tudor domain: conformational
variation in the binding site for symmetrically dimethylated arginine residues. J Mol Biol 327, 507-20 2
Lee et al. (2008). Distinct binding modes specify the recognition of methylated histones H3K4 and H4K20 by JMJD2A-tudor. Nat Struct Mol Biol 15, 109-11 3
Huang, et al. (2006). Recognition of histone H3 lysine-4 methylation by the double tudor domain of JMJD2A. Science 312, 748-51 4 Botuyan et al. (2006). Structural basis for the methylation state-specific recognition of histone H4-K20 by 53BP1 and
Crb2 in DNA repair. Cell 127, 1361-73 5
Nielsen et al. (2002) Structure of the HP1 chromodomain bound to histone H3 methylated at lysine 9. Nature 416, 103-107
6 Klymenko et al. (2006) A Polycomb group protein complex with sequence-specific DNA-binding and selective
methyl-lysine-binding activities. Genes Dev. 20, 1110-22 7
Li et al. (2006) Molecular basis for site-specific read-out of histone H3K4me3 by the BPTF PHD finger of NURF. Nature 442, 91-95
8 Adam et al. (2007) RAG2 PHD finger couples histone H3 lysine 4 trimethylation with V(D)J recombination. Nature
450, 1106-10

60
Supplementary Figure 1. Hydrophobic and electrostatic interactions in the interface between SN5 (green), α1 (grey) and the Tudor domain (magenta). (a) Residues with side-chains or backbone atoms taking part in electrostatic interactions (dotted lines). (b, c) Side-chains of residues making hydrophobic interactions.

61
Supplementary Figure 2. NMR titrations of methylated lysines. Residues in the aromatic cage of TSN are labeled (a) Titration of 5 (monomethyllysine) to TSN. Reference spectrum in black [0.1 mM], and in red at protein:ligand ratio of 1:12. (b) Titration of 6 (dimethyllysine) to TSN. Reference spectrum in black [0.1 mM], and in red at protein:ligand ratio of 1:12. (c) Titration of 7 (trimethyllysine) to TSN. Reference spectrum in black [0.1 mM], and in red at protein:ligand ratio of 1:12. All three titrations were performed at 500 MHz.
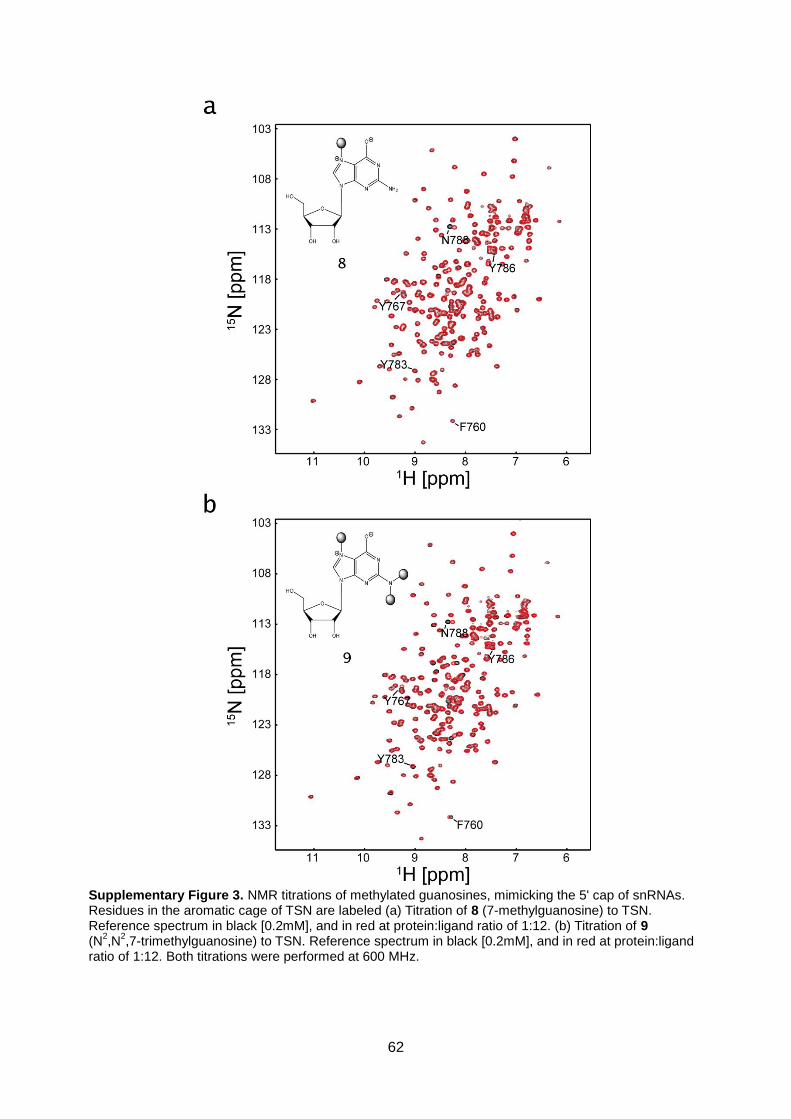
62
Supplementary Figure 3. NMR titrations of methylated guanosines, mimicking the 5' cap of snRNAs. Residues in the aromatic cage of TSN are labeled (a) Titration of 8 (7-methylguanosine) to TSN. Reference spectrum in black [0.2mM], and in red at protein:ligand ratio of 1:12. (b) Titration of 9 (N
2,N
2,7-trimethylguanosine) to TSN. Reference spectrum in black [0.2mM], and in red at protein:ligand
ratio of 1:12. Both titrations were performed at 600 MHz.

63
4. Chapter 4
NMR structure of an atypical Tudor domain
4.1. Summary
Epigenetic regulation of transcription is an increasingly appreciated area of research*,
which has deepened our understanding of gene expression greatly. We are now in a
better position to understand, not only how cells "remember" which cell type they
belong to, but also how regulatory information is passed along during cell divisions.
This is not only important in developmental biology, but also in the fields of stem cell
and tumor biology.
The Polycomblike (Pcl) protein is a subunit of a larger complex, involved in methylation
of histone tails.17 Through changes in chromatin structure, and not of the DNA itself,
these complexes regulated the access of the transcriptional machinery to the genes.172
Thus, Pcl is thought to be involved in epigenetic regulation of gene expression, at the
level of chromatin remodeling. However, the molecular mechanism for its function is
not understood, and we set out to characterize one particular structural domain of Pcl.
This paper presents the three-dimensional structure, as well as a ligand binding study,
of the Tudor domain of Drosophila Polycomblike. The Tudor domain of Pcl (Pcl-Tudor)
was of special interest, since members of this family of domains previously has been
shown to bind methylated arginines and lysines (see Chapter 3). Such modified
residues are present in the histone tails. Therefore Pcl-Tudor could be suggested, to
target the chromatin remodeling complex to the histones.
In contrast to the hypothesis, our data show that Pcl-Tudor has no affinity for any
known Tudor ligand. This observation can be explained by analyzing the NMR
structure. Pcl-Tudor has a classical overall Tudor-fold, but exhibits an untypical
composition of residues in its putative binding site. By structural comparisons to other
Tudor domains, we suggest these differences make Pcl-Tudor incapable of binding our
tested ligands. In the article, we further suggest divergent functions of Drosophila and
human Pcl proteins, as well as an possible hydrophobic interaction site on Pcl-Tudor.
This work was a collaboration with the group of Dr. Jürg Müller at EMBL Heidelberg.
* A search on ISI Web of Knowledge shows a steady increase of publications since the mid-nineties.

64

65
4.2 Published manuscript
Structure of an atypical Tudor domain in the Drosophila Polycomblike protein
Published in Protein Science
Received 19 May 2010; Revised 12 July 2010; Accepted 14 July 2010
DOI: 10.1002/pro.476
Anders Friberg1,2,†, Anna Oddone3,4,†, Tetyana Klymenko3, Jürg Müller3
& Michael Sattler1,2*
† These authors contributed equally to this work 1 Institute of Structural Biology, Helmholtz Zentrum München, Ingolstädter Landstr. 1, 85764 Neuherberg, Germany 2 Munich Center for Integrated Protein Science at Chair of Biomolecular NMR, Department Chemie, Technische Universität München, Lichtenbergstr. 4, 85747 Garching 3 European Molecular Biology Laboratory (EMBL), Meyerhofstr. 1, 69117 Heidelberg, Germany 4 Centre for Genomic Regulation (CRG), Doctor Aiguader 88, 08003 Barcelona, Spain
* Correspondence: [email protected]
Tel: +49(0)89-28913418; Fax: +49(0)89-28913869
Keywords
NMR, Polycomblike, Pcl, PRC2, Tudor, aromatic cage, methyllysine, sDMA, posttranslational modification, transcriptional regulation
Abbreviations
Pcl, Drosophila Polycomblike; Pcl-Tudor, the Tudor domain of Pcl, PRC2, Polycomb repressive complex 2; PcG, Polycomb group; NMR , nuclear magnetic resonance; HSQC, heteronuclear single quantum correlation; NOE, nuclear Overhauser effect; sDMA, symmetrically dimethylated arginine; aDMA, asymmetrically dimethylated arginine.

66
Abstract
Posttranslational modifications of histone tails are among the most prominent epigenetic marks and play a critical role in transcriptional control at the level of chromatin. The Polycomblike (Pcl) protein is part of a histone methyltransferase complex (Pcl-PRC2) responsible for high levels of histone H3 K27 trimethylation. Studies in Drosophila larvae suggest that Pcl is required for anchoring Pcl-PRC2 at target genes, but how this is achieved is unknown. Pcl comprises a Tudor domain and two PHD fingers. These domains are known to recognize methylated lysine or arginine residues and could contribute to targeting of Pcl-PRC2.
Here, we report an NMR structure of the Tudor domain from Drosophila Pcl (Pcl-Tudor) and binding studies with putative ligands. Pcl-Tudor contains an atypical, incomplete aromatic cage that does not interact with known Tudor domain ligands, such as methylated lysines or arginines. Interestingly, human Pcl orthologs exhibit a complete aromatic cage, suggesting that they may recognize methylated lysines. Structural comparison with other Tudor domains suggests that Pcl-Tudor may engage in intra- or intermolecular interactions through an exposed hydrophobic surface patch.
Introduction
Epigenetic regulation of gene expression has emerged as one of the key determinants of cell fate and of maintenance of cell identity. Linked to this, many transcriptional regulators have been found to act at the level of chromatin. Among those chromatin modifiers, the Polycomb/Trithorax system is a highly conserved machinery that is essential for controlling expression of developmental regulator genes in both animals and plants. It is implicated in transcriptional control of genes during development,1 in stem cells,2 in X-inactivation3 and tumor biology4 of mammals, as well as in flowering time in plants5.
The Polycomb group (PcG) of proteins are known developmental regulators. PcG proteins are conserved from plants to humans and are considered as general factors engaged in transcriptional repression.6 Polycomb proteins exist in four distinct multiprotein complexes: Pleiohomeotic repressive complex (PHO-RC), the Polycomb repressive complexes 1 and 2 (PRC1 and PRC2)7 and the recently described Polycomb repressive deubiquitinase (PR-DUB)8. Among those, PRC2 is a histone methyltransferase for lysine 27 of histone 3 (H3K27). Studies in Drosophila suggest that mono- and dimethylation of H3K27 (H3K27me1/me2) is widespread,9 whereas trimethylation (H3K27me3) is confined to genes regulated by the PcG machinery. Biochemical purifications isolated two different forms of the complex: PRC2 and Pcl-PRC2.10-12 In Drosophila, genome-wide H3K27me1/me2 is generated by PRC2 whereas Pcl-PRC2 is responsible for the high levels of H3K27me3 at target genes to allow PcG repression.10

67
At present the specific role of Pcl in H3K27 trimethylation by PRC2-Pcl is not clear. In vitro, Drosophila PRC2 and Pcl-PRC2 have largely similar enzymatic activities for generating H3K27me1, me2 and me3.10 However, in vitro histone methylation by reconstituted human PRC2 is enhanced when supplemented by Pcl1.12 Studies in Drosophila larvae suggest that Pcl is required for anchoring PRC2 at PcG target genes.13 The human homologs of Pcl are known as PHF1 (Pcl1), MTF2 (Pcl2) and PHF19 (Pcl3).
Full-length Drosophila Pcl comprises 1043 amino acids (115 kDa; Figure 1A) and is expressed in all cell nuclei during embryonic development, as well as in larval salivary glands where it co-localizes with other PcG proteins on polytene chromosomes.14 Pcl contains two plant homeodomains (PHDs), which mediate binding to E(z),15 and a Tudor domain (Pcl-Tudor; Figure 1A,B). PHD fingers and Tudor domains from several proteins are known to recognize methylated amino acids in histones or other proteins. Specifically, Tudor domains have previously been shown to bind methylated lysines in histone tails16,17, and methylated arginines in Sm proteins18-21. Recently, Tudor domains have been implicated in the selection of piRNAs by interacting with symmetrically dimethylated arginines (sDMAs) in Piwi proteins.22 The binding of methylated ligands involves a so-called “aromatic cage”. The aromatic cage of Tudor domains comprises five residues, i.e. usually three to four aromatic side chains supplemented by small polar or charged residues.21 Together these residues create a hydrophobic binding pocket with affinity for a methylated ligand.
Figure 1. Domain architecture of Polycomblike (Pcl) and sequence comparison of Pcl-Tudor homologs. (A) Domain architecture of full-length Pcl from D. melanogaster and secondary structure topology of Pcl-Tudor: β-sheets are colored blue. Filled black boxes indicate aromatic cage residues that form the ligand binding site in canonical Tudor domains. (B) Multiple sequence alignment of Pcl Tudor domains from different organisms. Arrows indicate the β-strands in the Tudor domain. The numbering on top corresponds to Drosophila Pcl. Important residues in Pcl-Tudor are highlighted. Key: ■ Putative binding site residues; ● Hydrophobic core residues; │ Residues in an additional hydrophobic surface patch.

68
A possible function of Pcl could be to target the Pcl-PRC2 complex via its Tudor or PHD domains by binding methylated residues in the histone tails. To address the role of the Tudor domain of Drosophila Pcl, we determined its three-dimensional structure by NMR spectroscopy and studied its ligand binding properties. Testing several typical Tudor domain ligands no high-affinity interaction was found. This result is rationalized based on the domain structure, which reveals that Drosophila Pcl-Tudor contains an atypical, incomplete aromatic cage. Differences in the aromatic cages of Drosophila and human Pcl Tudor domains suggest divergent molecular functions. A hydrophobic surface patch on Pcl-Tudor suggests that it may engage in additional intra- or intermolecular interactions.
Results and discussion
Solution structure of Pcl-Tudor from D. melanogaster
Recombinant Pcl-Tudor (residues 339-404) was expressed in Escherichia coli at high yields. This construct resulted in a well dispersed 2D 1H,15N HSQC spectrum, indicating the protein was amenable for structural studies by NMR. A stable protein sample for further analysis required the use of a strong reducing agent to keep cysteine residues in a reduced state. The three-dimensional structure of Pcl-Tudor (Figure 2A-C) was determined by NMR, using standard experiments for assignments and derivation of distance restraints.23 Out of the 69 residues in the expression construct, 52 residues (349 to 400) define the tertiary fold with high precision (RMSD < 1 Å; Figure 2C,3D) and good structural statistics (Table 1).
Pcl-Tudor comprises five anti-parallel β-sheets, which together form a characteristic β-barrel (Figure 2A). The β-barrel is closed by an interaction of β5 with β1, and is stabilized by a hydrophobic core including Y351, V357, I359, I371, Y379, I381, P393 and L396 (Supp. Fig. 1A). Similar to other Tudor domains, the second β-strand is slightly bent around I372, thereby making a hydrogen bond possible between both of the backbone amides of I372 and D373 to the backbone oxygen of Y379. Secondary chemical shift values confirm the secondary structure seen in the structure (Figure 3A).
The side chains forming the putative binding pocket — the “aromatic cage” — are found in or close to the β1-β2 and β3-β4 loops (Figure 2B). The residues in Pcl-Tudor corresponding to the aromatic cage are: C361, Y367, F383, D385 and S387. Notably, the expected binding pocket of Pcl-Tudor is wider than other Tudor domains known to bind methylated ligands (Supp. Fig 2A). This might be a result of the absence of large aromatic residues in Pcl-Tudor, which are present in other Tudor domains. Particularly, the cysteine residue in position 361 is atypical for this type of domain. In addition, Pcl-Tudor exhibits a hydrophobic patch on the surface of the β-barrel, consisting of F358, F366, L368 and L399 (Figure 6B).
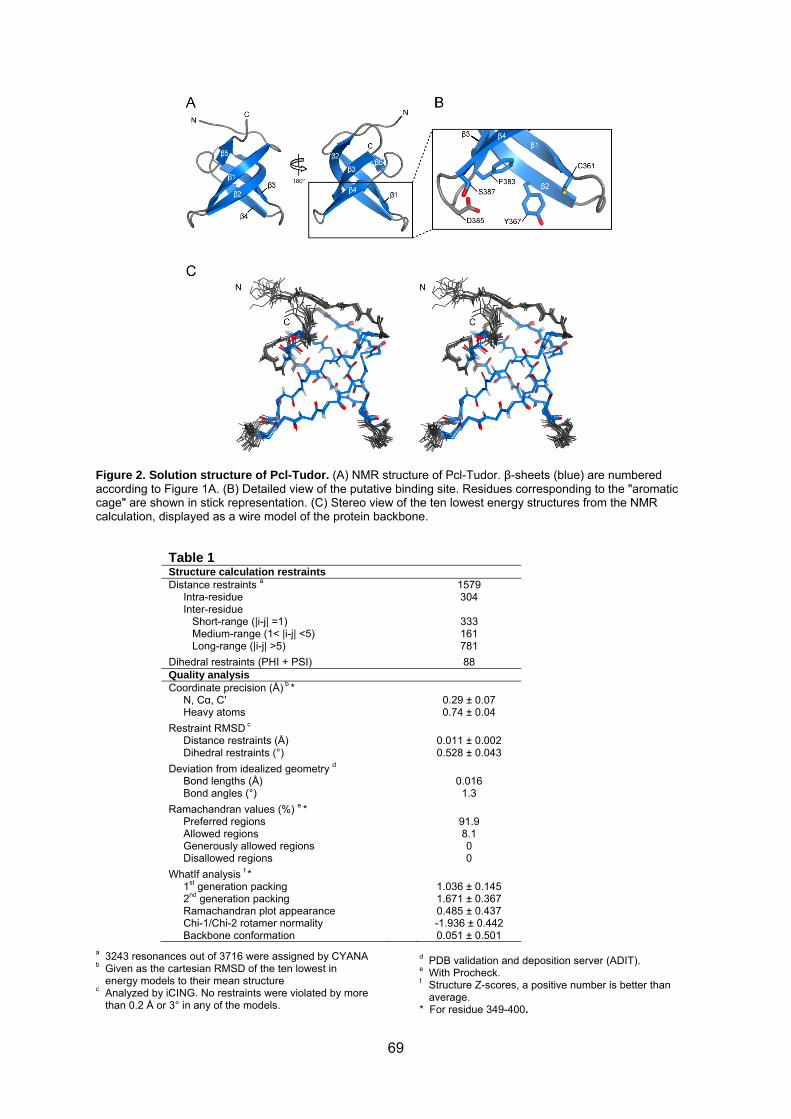
69
Figure 2. Solution structure of Pcl-Tudor. (A) NMR structure of Pcl-Tudor. β-sheets (blue) are numbered according to Figure 1A. (B) Detailed view of the putative binding site. Residues corresponding to the "aromatic cage" are shown in stick representation. (C) Stereo view of the ten lowest energy structures from the NMR calculation, displayed as a wire model of the protein backbone.
a 3243 resonances out of 3716 were assigned by CYANA b Given as the cartesian RMSD of the ten lowest in
energy models to their mean structure c Analyzed by iCING. No restraints were violated by more
than 0.2 Å or 3° in any of the models.
d PDB validation and deposition server (ADIT). e With Procheck. f Structure Z-scores, a positive number is better than
average. * For residue 349-400.
Table 1 Structure calculation restraints Distance restraints a 1579 Intra-residue 304 Inter-residue Short-range (|i-j| =1) 333 Medium-range (1< |i-j| <5) 161 Long-range (|i-j| >5) 781 Dihedral restraints (PHI + PSI) 88 Quality analysis Coordinate precision (Å) b * N, Cα, C' 0.29 ± 0.07 Heavy atoms 0.74 ± 0.04 Restraint RMSD c Distance restraints (Å) 0.011 ± 0.002 Dihedral restraints (°) 0.528 ± 0.043 Deviation from idealized geometry d Bond lengths (Å) 0.016 Bond angles (°) 1.3 Ramachandran values (%) e * Preferred regions 91.9 Allowed regions 8.1 Generously allowed regions 0 Disallowed regions 0 WhatIf analysis f * 1st generation packing 1.036 ± 0.145 2nd generation packing 1.671 ± 0.367 Ramachandran plot appearance 0.485 ± 0.437 Chi-1/Chi-2 rotamer normality -1.936 ± 0.442 Backbone conformation 0.051 ± 0.501

70
Protein backbone dynamics
NMR 15N relaxation data (T1, T2 and heteronuclear {1H}-15N NOE) agree well with the calculated ensemble of structural models (Figure 3B,C). Our data show that the boundaries between less defined and well-defined protein backbone, at the N- and C-termini, correlate with the presence and absence, respectively, of fast motions (Figure 3B-D). No increased flexibility on fast (sub nanosecond) timescales is observed for the loops flanking the putative binding site. The reduced structural precision of these two loops probably results from paucity of distance restraints for these residues, but could also reflect slow motions in the millisecond timescale. The average 15N T1 and T2 values were determined to be 621±26 ms and 90±6.0 ms, respectively. The ratio of T1/T2 (6.9) corresponds to a correlation time of τc
exp ≈ 7.7 ns.
An estimation of the correlation time by HYDRONMR,24 using our calculated structural model, gives approximately τc
calc ≈ 5.2 ns. Taken together, this indicates
that Pcl-Tudor is a monomer in solution, consistent with size exclusion chromatography data (Supp. Fig. 1B).
Figure 3. Secondary chemical shifts and 15N relaxation data. (A) Secondary chemical shifts, ∆δ(13Cα-13Cβ). Positive (red) and negative (blue) values indicate α-helical and β-strand conformation, respectively. (B) 15N NMR relaxation data. The average ratio of T1/T2 (6.9) is indicated by a gray line. The error bars are derived by Monte Carlo simulations in NMRviewJ32 (v8.0). (C) {1H-}-15N heteronuclear NOE indicates flexible N- and C-termini of Pcl-Tudor. (D) Backbone RMSD. The RMSD of the backbone atoms (N, Cα and C') in the calculated ensemble of ten lowest energy structures.

71
Ligand binding studies
The role of Pcl in trimethylation of H3K27 or in recruitment of PRC2 to target genes is still unknown. To obtain insight into the molecular interactions of Pcl, we performed binding studies using our Pcl-Tudor construct with putative ligands. In a series of NMR titrations and isothermal titration calorimetry (ITC) experiments, we primarily tested known Tudor ligands and their derivatives, i.e. molecules containing arginines and lysines in different methylation states. In addition, we included compounds that were suggested to bind to Tudor domains, e.g. acetyl-lysine (a different epigenetic modification), Xist RNA (a proposed targeting factor for PRC23) and methylated guanosines (another molecule found in different methylation states). Table 2 lists all the ligands tested.
Despite our efforts, no ligand showing strong affinity for Pcl-Tudor could be identified. Figure 4 shows typical results of NMR titration experiments, here using a mixture of methylated lysines and methylated arginines (a), as well as unmodified histone tails (b). No chemical shift changes could be observed, hence indicating that Pcl-Tudor does not bind any of the Tudor ligands characterized to date, nor any of the additional ligands tested here. Similarly, ITC measurements failed to provide evidence that Pcl-Tudor interacts with various histone tail peptides containing methylated lysine residues (Maxim Nekrasov and J.M., unpublished data).
We found that the three-dimensional structure of the Tudor domain of Drosophila Pcl (Pcl-Tudor) comprises the typical β-barrel fold of Tudor domains, but lacks an intact aromatic cage. This particular structural feature of Pcl-Tudor provides an explanation for the lack of binding to known ligands of Tudor domains: without a complete aromatic cage, the methylated residue cannot be properly coordinated. Methylated amino acids can exist in different methylation states, which demands a specific and well-tuned recognition. Slight differences in the aromatic cage of Tudor domains provide selectivity for certain ligands.21 To date, only structures of methylated lysines in complex with Tudor domains have been reported. A structural comparison of Pcl-Tudor with available structures of Tudor domain-ligand complexes as well as to its human homologs provides a rationale for the distinct binding properties and highlights the diversity of Tudor domains, as described in the following.
Figure 4. Ligand titrations followed by NMR. A reference 1H,15N HSQC spectrum (black) was measured on a 15N-labeled 100 μM Pcl-Tudor sample. (A) Red spectrum, 1:5 protein:ligand ratio using a mixture of various modified amino acids (sDMA, aDMA, mono-, di- and trimethylated lysine). (B) Red spectrum, 1:5 protein:ligand ratio with unmodified H3 peptide. Green spectrum, 1:5 protein:ligand ratio of unmodified H4 peptide.

72
Table 2 Ligands tested by NMR Final protein to ligand ratio
sDMA, aDMA, Kme1, Kme2, Kme3 (mixture) 1:5 R (unmodified) 1:20 AGRGRG 1:5 AGR*GR*G (R* = sDMA) 1:5 H3 (2-29) 1:5 H3K27me3 1:5 H3R2 sDMA 1:5 H3R17 sDMA 1:5 H3R26 sDMA 1:5 H4 (2-21) 1:5 H4R3 sDMA 1:5 Acetyllysine 1:5 Xist RNA 14mer 1:2 7-methylguanosine 1:5 N2,N2,7-trimethylguanosine 1:5 sDMA - symmetrically dimethylated arginine aDMA - asymmetrically dimethylated arginine Kme1 - monomethylated lysine Kme2 - dimethylated lysine Kme3 - trimethylated lysine
Structural comparison with methyllysine recognition by 53BP1 Tudor
The first Tudor domain of 53BP1 has been proposed to be required for targeting the protein to DNA double-strand breaks by recognition of H3K20me2.16 The interaction with dimethyllysine (KD = 20 μM) is mediated by an intact aromatic cage, comprising W1495, Y1502, F1519, D1521 and Y1523. The aspartate is thought to be critical for high affinity and selectivity, due to its capability of forming a hydrogen bond to the side-chain amino group of the ligand. Pcl-Tudor contains an aspartate in the equivalent position. However, Pcl-Tudor only has two aromatic side-chains in the binding pocket, Y367 and F383. W1495 of 53BP1, shown by mutational analysis to be essential for ligand binding, is replaced by a cysteine in Pcl-Tudor (Figure 5A). Also Y1523 of 53BP1 is substituted in Pcl-Tudor by a small non-aromatic residue, namely S387. The overall sequence identity between Pcl-Tudor and 53BP1 is 23% (Figure 5F).
Structural comparison of Drosophila and human Pcl Tudor domains
Structures of the Tudor domains of Pcl1, Pcl2 and Pcl3, the human homologs of Drosophila Pcl, have been deposited in the PDB (Accession codes: 2E5P, 2EQJ and 2E5Q). The sequence identity between the Drosophila Pcl-Tudor and its human homologs is 28%, 32% and 24% for Pcl1, Pcl2 and Pcl3, respectively (Figure 1B). The structures of human and Drosophila Pcl Tudor domains are similar and all contain a rather wide putative binding pocket (Supp. Fig. 2D). However, an interesting difference is that the aromatic cage of all three human homologs comprises a conserved and characteristic tryptophan, which in Drosophila Pcl is replaced by a cysteine (C361) (Figure 5B,F and Supp. Fig. 2B,C). By structural

73
comparisons we find that the aromatic cage residues of the homologous Pcl1-3 proteins are identical to the tandem hybrid Tudor domain of JMJD2A (Figure 5C).17 The JMJD2A Tudor domain binds trimethylated lysines in histone tails, both H3K4me3 and H4K20me325, and it was shown that a mutation of the tryptophan to histidine abolishes binding of JMJD2A to H3K4me3.17 These results are in line with our data since we do not observe any binding of H3K4me3 by ITC or of Kme3 by NMR to Pcl-Tudor, which lacks the conserved tryptophan. On the other hand, it is tempting to hypothesize that Pcl1-3 would interact with trimethylated lysines, considering the striking similarity of the putative binding sites in Pcl1-3 and JMJD2A (Figure 5C).
Figure 5. Comparison of Pcl-Tudor with other Tudor domains. (A, B) Side chains corresponding to the aromatic cage are highlighted as sticks in Pcl-Tudor and other Tudor domains, only substitutions are labeled with residue numbers. Superposition of Pcl-Tudor (lightgray) with (A) the first 53BP1 tandem Tudor domain in complex with H4K20me2 (brown; 2IGO.pdb; ligand in magenta) and (B) Pcl1 (cyan; 2E5P.pdb). (C) Superposition of the human homolog Pcl1 (cyan; 2E5P.pdb) and the hybrid Tudor domain of JMJD2A in complex with H3K4me3 (yellow; 2GFA.pdb). Note the identical composition of residues in the binding site. The peptide ligand is shown in magenta. (D, E) Similar to (A, B), superposition of Pcl-Tudor (gray) and, (D) Tudor-SN (green; 2WAC.pdb), (E) SMN (orange; 1MHN.pdb). (F) Multiple sequence alignment of Drosophila Pcl-Tudor and Tudor domains known to bind methylated lysines or methylated arginines. Symbols and numbering as in Figure 1B.

74
Structural comparison to methylarginine-binding Tudor domains
The multifunctional Tudor-SN protein contains a methylarginine-binding Tudor domain also comprising an intact aromatic cage (Figure 5D). The binding site is composed of F760, Y767, Y783, Y786 and N788, providing the protein with selectivity for sDMA over aDMA (KD = 720 μM and ~5 mM, respectively).21 The major difference compared to the methyllysine-binding 53BP1, is a spatial rearrangement of a small polar residue, D1521 and N788 in 53BP1 and Tudor-SN, respectively. Again, as in the case of 53BP1, compared to Tudor-SN Pcl-Tudor displays substitutions making an interaction with methylated arginines unlikely. F760, Y783, Y786 and N788 of Tudor-SN are replaced by C361, F383, D385 and S387 in Pcl-Tudor, respectively, and the overall sequence identity between Pcl-Tudor and the Tudor domain of Tudor-SN is only 13% (Figure 5F).
Similarly to Tudor-SN, also the Survival of Motor Neuron (SMN) protein interacts with methylated arginines.18,19,26,27 Apart from one substitution their aromatic cages are identical in composition.21 Compared to SMN, Pcl-Tudor exhibits major differences in the aromatic cage (Figure 5E). C361, F383, D385 and S387 in Pcl-Tudor are replaced by W102, Y127, Y130 and N132 in SMN, respectively, and the overall sequence identity between these two Tudor domains is 13% (Figure 5F).
A putative interaction surface in Pcl-Tudor
Taken together, Pcl-Tudor adopts the characteristic overall fold of other Tudor domains, but exhibits major differences in the putative binding site that most likely renders it incapable of binding any of the established Tudor ligands. We cannot exclude the possibility that the atypical aromatic cage of Pcl-Tudor could recognize a ligand distinct from the ones included tested in this study. Also, additional domains in Pcl or in other binding partners might be needed for ligand recognition. These could, for example, associate with Pcl-Tudor to complete the aromatic cage, thus recreating the canonical binding pocket of Tudor domains, or they could recognize additional parts of the histone tails, leading to efficient substrate recognition. Methyllysine-binding modules such as PHD fingers are often found associated in proteins that play an important role in epigenetic regulation, and are likely to function cooperatively. Recently, PHF8, a human histone demethylase was reported to function in such modular fashion.28 The demethylase activity of PHF8 resides in a Jumonji domain, with H3K9me2 and H3K27me2 as substrates. It was shown that the demethylase activity is enhanced and more specific if a H3K4me3 mark is present that interacts with a neighboring PHD domain.
We note that a distinct hydrophobic patch at the surface of Pcl-Tudor, remote from the aromatic cage, could be used as an interaction site for other domains or proteins (Figure 6; Supp. Fig. 3). Hydrophobic residues in this region are found in other Tudor domains, e.g. in SMN, 53BP1 and in the human homologs of Pcl (Figure 1B,5F). In some structures of Tudor-containing proteins, for example in Tudor-SN

75
(2WAC.pdb)21 and TDRD2 (3FDR.pdb)29, the hydrophobic patch is covered by secondary structure elements extending from the Tudor domain, thereby forming an intramolecular hydrophobic interface (Figure 6). In the case of Tudor-SN, this arrangement stabilizes the inter-domain interaction to a neighboring nuclease domain, making the two domains tumble together as one unit in solution.21 Moreover, in the structure of the human histone methyltransferase SETD1B (3DLM.pdb) such additional hydrophobic interaction surfaces are found between three consecutive Tudor domains (Supp. Fig. 3). Hence, it could be suggested that other domains or proteins interact with Pcl-Tudor using this structural feature. An additional factor interacting with Pcl-Tudor might increase ligand affinity and affect its binding specificity, possibly by complementing the incomplete aromatic cage of the Tudor domain.
Figure 6. Potential interaction site on Drosophila Pcl-Tudor. (A) Hydrophobic patch residues in Tudor-SN (green). (B) A corresponding hydrophobic patch can be found in Pcl-Tudor (gray). (C) The Tudor domain of Tudor-SN forms a hydrophobic interaction with residues from neighboring secondary structures.
Conclusion
In this study, we reported the structure of the Tudor-domain of Pcl from Drosophila melanogaster and, based on its structural features, rationalized our ligand binding results. While the overall structure represents a canonical Tudor fold it harbors an atypical incomplete aromatic cage. Pcl-Tudor shows no affinity for any of the typical known Tudor domain ligands, i.e. methylated lysines, methylated arginines, or other putative ligands tested. The Tudor domain of Drosophila Pcl may thus not directly participate in the recognition of post-translational modifications on histone proteins. However, it cannot be excluded that full-length Pcl contains such a function. Future studies, including the analysis of the Tudor domain in the context of larger portions of the Pcl protein should help to establish the role of Pcl in transcriptional repression and perhaps identify other, currently uncharacterized Tudor ligands.
76
Materials and Methods Cloning, protein expression and purification
Residues 339-404 of Polycomblike (Pcl) from Drosophila melanogaster (Uniprot: Q24459) were cloned into a modified pET-24d vector using standard protocols. The fusion protein comprises a GFP (Green Fluorescence Protein) tag to facilitate purification. This protein construct was expressed in Escherichia coli BL21 (DE3) pLysS (Novagen) using kanamycin for selection. A 10mL lysogeny broth (LB) pre-culture was inoculated with a single colony from a transformation plate. The pre-culture was used to start larger 1L cultures, containing LB or M9 minimal medium for labeling with 15N or 15N/13C. Upon reaching optical density (OD) of 0.6 cultures were put at 20°C and, after 30min of cooling, induced over night with 0.2 mM IPTG (Isopropyl β-D-1-thiogalactopyranoside).
Recombinant protein was purified by sonicating the harvested cell pellet in 25mL Lysis buffer (20 mM TRIS pH 7.5, 300 mM NaCl, 10 mM imidazole, 1 mM DTT and 0.02% NaN3), also including protease inhibitors, RNase, lysozyme and 0.2% IGEPAL. After high-speed centrifugation (20000rpm, 30min) and filtering, the supernatant was applied three times to Ni-NTA Agarose resin (Qiagen). Several rounds of washing were performed, with: Lysis buffer including 0.2% IGEPAL, Lysis buffer, Lysis buffer with high salt concentration (1M NaCl), Lysis buffer with high imidazole concentration (30 mM imidazole). Finally, the protein was eluted by applying 10mL of a buffer containing 20 mM TRIS pH 7.5, 300 mM NaCl, 330 mM imidazole, 1 mM DTT and 0.02% NaN3. TEV (tobacco etch virus) protease was added to the sample and incubated overnight at 4°C. To remove the cleaved GFP tag the sample was passed three times over a second Ni-NTA column. A last purification step included size exclusion chromatography (HiLoad, Superdex 75 16/60, GE Healthcare). In this step, the protein was buffer-exchanged into the NMR buffer (20 mM sodium phosphate pH 6.3, 25 mM NaCl and 2 mM fresh DTT or TCEP, 0.02% NaN3).
NMR spectroscopy and structure determination Protein backbone and amino acid side chain assignments were done by using 15N/13C labeled samples at a concentration of 0.25 mM. For this purpose, several multidimensional heteronuclear experiments were acquired: 1H,15N HSQC, 1H,13C HSQC, HNCA, HNCACB, CBCA(CO)NH, (H)CC(CO)NH-TOCSY, H(CC)(CO)NH-TOCSY, H(C)CH-TOCSY.23 To obtain distance restraints for structure calculation a series of NOE-based experiments were recorded: 2D 1H homonuclear NOESY, 1H,15N HSQC-NOESY, 1H,13C HMQC-NOESY (aliphatic and aromatic versions). Assignment of the aromatic ring systems was enabled by another two experiments, (HB)CB(CG,CD)HD and (HB)CB(CG,CD,CE)HE.30 All experiments were performed at 298.5 K on Bruker 900, 750, 600 and 500 MHz spectrometers equipped with pulsed field gradients. The data were processed with NMRPipe31 for NMRView 32.
Automatic assignment of the NOESY spectra and derivation of distance restraints were accomplished using CYANA v2.1.33 TALOS+ was used to predict dihedral angle restraints.34 Hundred structures were calculated and further water-refined35 by use of RECOORD scripts36 with CNS37. The ten lowest energy structures were selected as a representative ensemble. Structure validation was performed using Molprobity38 and iCing39 (including PROCHECK40 and WHATCHECK41). Secondary structure definition were based on DSSP algorithms42 as implemented in Procheck and Pymol, together with manual inspection.
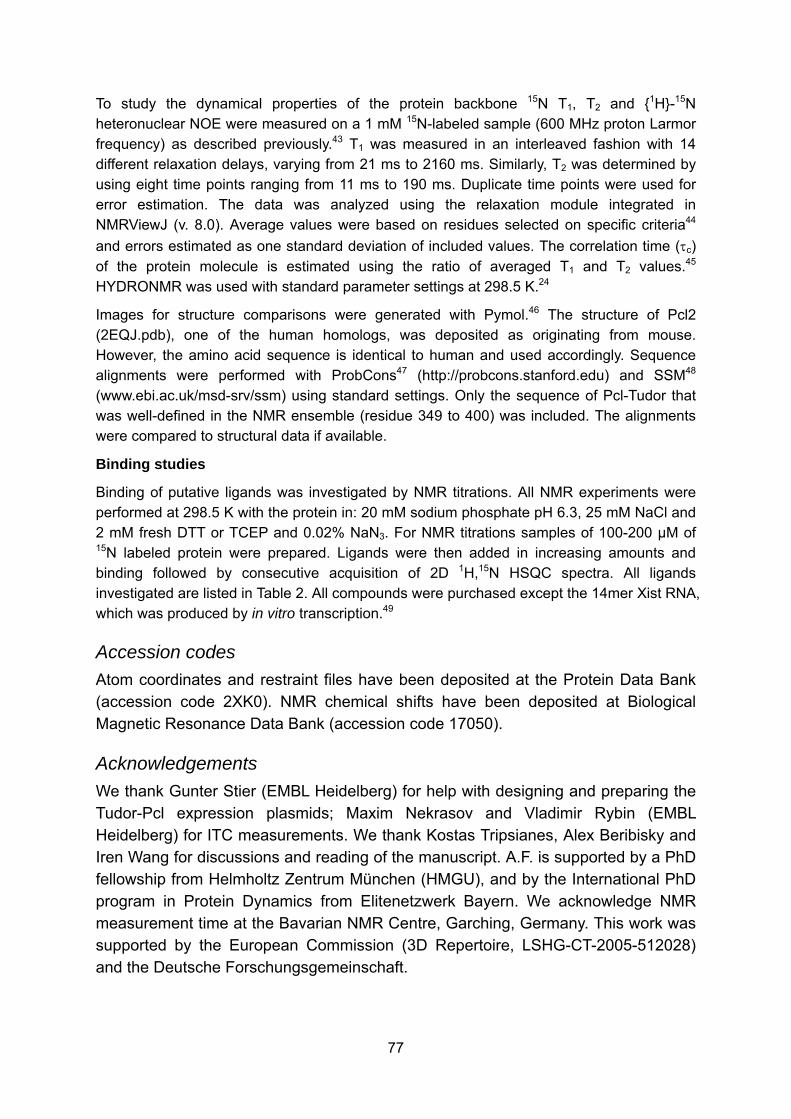
77
To study the dynamical properties of the protein backbone 15N T1, T2 and {1H}-15N heteronuclear NOE were measured on a 1 mM 15N-labeled sample (600 MHz proton Larmor frequency) as described previously.43 T1 was measured in an interleaved fashion with 14 different relaxation delays, varying from 21 ms to 2160 ms. Similarly, T2 was determined by using eight time points ranging from 11 ms to 190 ms. Duplicate time points were used for error estimation. The data was analyzed using the relaxation module integrated in NMRViewJ (v. 8.0). Average values were based on residues selected on specific criteria44 and errors estimated as one standard deviation of included values. The correlation time (τc) of the protein molecule is estimated using the ratio of averaged T1 and T2 values.45 HYDRONMR was used with standard parameter settings at 298.5 K.24
Images for structure comparisons were generated with Pymol.46 The structure of Pcl2 (2EQJ.pdb), one of the human homologs, was deposited as originating from mouse. However, the amino acid sequence is identical to human and used accordingly. Sequence alignments were performed with ProbCons47 (http://probcons.stanford.edu) and SSM48 (www.ebi.ac.uk/msd-srv/ssm) using standard settings. Only the sequence of Pcl-Tudor that was well-defined in the NMR ensemble (residue 349 to 400) was included. The alignments were compared to structural data if available.
Binding studies
Binding of putative ligands was investigated by NMR titrations. All NMR experiments were performed at 298.5 K with the protein in: 20 mM sodium phosphate pH 6.3, 25 mM NaCl and 2 mM fresh DTT or TCEP and 0.02% NaN3. For NMR titrations samples of 100-200 μM of 15N labeled protein were prepared. Ligands were then added in increasing amounts and binding followed by consecutive acquisition of 2D 1H,15N HSQC spectra. All ligands investigated are listed in Table 2. All compounds were purchased except the 14mer Xist RNA, which was produced by in vitro transcription.49
Accession codes Atom coordinates and restraint files have been deposited at the Protein Data Bank (accession code 2XK0). NMR chemical shifts have been deposited at Biological Magnetic Resonance Data Bank (accession code 17050).
Acknowledgements We thank Gunter Stier (EMBL Heidelberg) for help with designing and preparing the Tudor-Pcl expression plasmids; Maxim Nekrasov and Vladimir Rybin (EMBL Heidelberg) for ITC measurements. We thank Kostas Tripsianes, Alex Beribisky and Iren Wang for discussions and reading of the manuscript. A.F. is supported by a PhD fellowship from Helmholtz Zentrum München (HMGU), and by the International PhD program in Protein Dynamics from Elitenetzwerk Bayern. We acknowledge NMR measurement time at the Bavarian NMR Centre, Garching, Germany. This work was supported by the European Commission (3D Repertoire, LSHG-CT-2005-512028) and the Deutsche Forschungsgemeinschaft.

78
References
1. Breiling A, Sessa L, Orlando V (2007) Biology of polycomb and trithorax group proteins. Int Rev Cytol 258:83-136.
2. Pietersen AM, van Lohuizen M (2008) Stem cell regulation by polycomb repressors: postponing commitment. Curr Opin Cell Biol 20:201-207.
3. Zhao J, Sun BK, Erwin JA, Song JJ, Lee JT (2008) Polycomb proteins targeted by a short repeat RNA to the mouse X chromosome. Science 322:750-756.
4. Bracken AP, Helin K (2009) Polycomb group proteins: navigators of lineage pathways led astray in cancer. Nat Rev Cancer 9:773-784.
5. Henderson IR, Dean C (2004) Control of Arabidopsis flowering: the chill before the bloom. Development 131:3829-3838.
6. Schwartz YB, Kahn TG, Nix DA, Li XY, Bourgon R, Biggin M, Pirrotta V (2006) Genome-wide analysis of Polycomb targets in Drosophila melanogaster. Nat Genet 38:700-705.
7. Simon JA, Kingston RE (2009) Mechanisms of polycomb gene silencing: knowns and unknowns. Nat Rev Mol Cell Biol 10:697-708.
8. Scheuermann JC, de Ayala Alonso AG, Oktaba K, Ly-Hartig N, McGinty RK, Fraterman S, Wilm M, Muir TW, Muller J (2010) Histone H2A deubiquitinase activity of the Polycomb repressive complex PR-DUB. Nature advance online publication.
9. Ebert A, Schotta G, Lein S, Kubicek S, Krauss V, Jenuwein T, Reuter G (2004) Su(var) genes regulate the balance between euchromatin and heterochromatin in Drosophila. Genes Dev 18:2973-2983.
10. Nekrasov M, Klymenko T, Fraterman S, Papp B, Oktaba K, Kocher T, Cohen A, Stunnenberg HG, Wilm M, Muller J (2007) Pcl-PRC2 is needed to generate high levels of H3-K27 trimethylation at Polycomb target genes. EMBO J 26:4078-4088.
11. Sarma K, Margueron R, Ivanov A, Pirrotta V, Reinberg D (2008) Ezh2 requires PHF1 to efficiently catalyze H3 lysine 27 trimethylation in vivo. Mol Cell Biol 28:2718-2731.
12. Cao R, Wang H, He J, Erdjument-Bromage H, Tempst P, Zhang Y (2008) Role of hPHF1 in H3K27 methylation and Hox gene silencing. Mol Cell Biol 28:1862-1872.
13. Savla U, Benes J, Zhang J, Jones RS (2008) Recruitment of Drosophila Polycomb-group proteins by Polycomblike, a component of a novel protein complex in larvae. Development 135:813-817.
14. Lonie A, D'Andrea R, Paro R, Saint R (1994) Molecular characterisation of the Polycomblike gene of Drosophila melanogaster, a trans-acting negative regulator of homeotic gene expression. Development 120:2629-2636.
15. O'Connell S, Wang L, Robert S, Jones CA, Saint R, Jones RS (2001) Polycomblike PHD fingers mediate conserved interaction with enhancer of zeste protein. J Biol Chem 276:43065-43073.
16. Botuyan MV, Lee J, Ward IM, Kim JE, Thompson JR, Chen J, Mer G (2006) Structural basis for the methylation state-specific recognition of histone H4-K20 by 53BP1 and Crb2 in DNA repair. Cell 127:1361-1373.
17. Huang Y, Fang J, Bedford MT, Zhang Y, Xu RM (2006) Recognition of histone H3 lysine-4 methylation by the double tudor domain of JMJD2A. Science 312:748-751.
18. Sprangers R, Groves MR, Sinning I, Sattler M (2003) High-resolution X-ray and NMR structures of the SMN Tudor domain: conformational variation in the binding site for symmetrically dimethylated arginine residues. J Mol Biol 327:507-520.

79
19. Selenko P, Sprangers R, Stier G, Buhler D, Fischer U, Sattler M (2001) SMN tudor domain structure and its interaction with the Sm proteins. Nat Struct Biol 8:27-31.
20. Shaw N, Zhao M, Cheng C, Xu H, Saarikettu J, Li Y, Da Y, Yao Z, Silvennoinen O, Yang J, Liu ZJ, Wang BC, Rao Z (2007) The multifunctional human p100 protein 'hooks' methylated ligands. Nat Struct Mol Biol 14:779-784.
21. Friberg A, Corsini L, Mourao A, Sattler M (2009) Structure and ligand binding of the extended Tudor domain of D. melanogaster Tudor-SN. J Mol Biol 387:921-934.
22. Reuter M, Chuma S, Tanaka T, Franz T, Stark A, Pillai RS (2009) Loss of the Mili-interacting Tudor domain-containing protein-1 activates transposons and alters the Mili-associated small RNA profile. Nat Struct Mol Biol 16:639-646.
23. Sattler M, Schleucher J, Griesinger C (1999) Heteronuclear multidimensional NMR experiments for the structure determination of proteins in solution employing pulsed. Progress in Nuclear Magnetic Resonance Spectroscopy 34:93-158.
24. Garcia de la Torre J, Huertas ML, Carrasco B (2000) HYDRONMR: prediction of NMR relaxation of globular proteins from atomic-level structures and hydrodynamic calculations. J Magn Reson 147:138-146.
25. Lee J, Thompson JR, Botuyan MV, Mer G (2008) Distinct binding modes specify the recognition of methylated histones H3K4 and H4K20 by JMJD2A-tudor. Nat Struct Mol Biol 15:109-111.
26. Brahms H, Raymackers J, Union A, de Keyser F, Meheus L, Luhrmann R (2000) The C-terminal RG dipeptide repeats of the spliceosomal Sm proteins D1 and D3 contain symmetrical dimethylarginines, which form a major B-cell epitope for anti-Sm autoantibodies. J Biol Chem 275:17122-17129.
27. Friesen WJ, Massenet S, Paushkin S, Wyce A, Dreyfuss G (2001) SMN, the product of the spinal muscular atrophy gene, binds preferentially to dimethylarginine-containing protein targets. Mol Cell 7:1111-1117.
28. Horton JR, Upadhyay AK, Qi HH, Zhang X, Shi Y, Cheng X (2010) Enzymatic and structural insights for substrate specificity of a family of jumonji histone lysine demethylases. Nat Struct Mol Biol 17:38-43.
29. Chen C, Jin J, James DA, Adams-Cioaba MA, Park JG, Guo Y, Tenaglia E, Xu C, Gish G, Min J, Pawson T (2009) Mouse Piwi interactome identifies binding mechanism of Tdrkh Tudor domain to arginine methylated Miwi. Proc Natl Acad Sci U S A 106:20336-20341.
30. Yamazaki T, Forman-Kay JD, Kay LE (1993) Two-dimensional NMR experiments for correlating carbon-13.beta. and proton.delta./.epsilon. chemical shifts of aromatic residues in 13C-labeled proteins via scalar couplings. Journal of the American Chemical Society 115:11054-11055.
31. Delaglio F, Grzesiek S, Vuister GW, Zhu G, Pfeifer J, Bax A (1995) NMRPipe: a multidimensional spectral processing system based on UNIX pipes. J Biomol NMR 6:277-293.
32. Johnson BA, Blevins RA (1994) NMR View: A computer program for the visualization and analysis of NMR data. Journal of Biomolecular NMR 4:603-614.
33. Guntert P (2004) Automated NMR structure calculation with CYANA. Methods Mol Biol 278:353-378.
34. Shen Y, Delaglio F, Cornilescu G, Bax A (2009) TALOS+: a hybrid method for predicting protein backbone torsion angles from NMR chemical shifts. J Biomol NMR 44:213-223.
35. Linge JP, Williams MA, Spronk CA, Bonvin AM, Nilges M (2003) Refinement of protein structures in explicit solvent. Proteins 50:496-506.

80
36. Nederveen AJ, Doreleijers JF, Vranken W, Miller Z, Spronk CA, Nabuurs SB, Guntert P, Livny M, Markley JL, Nilges M, Ulrich EL, Kaptein R, Bonvin AM (2005) RECOORD: a recalculated coordinate database of 500+ proteins from the PDB using restraints from the BioMagResBank. Proteins 59:662-672.
37. Brunger AT, Adams PD, Clore GM, DeLano WL, Gros P, Grosse-Kunstleve RW, Jiang JS, Kuszewski J, Nilges M, Pannu NS, Read RJ, Rice LM, Simonson T, Warren GL (1998) Crystallography & NMR system: A new software suite for macromolecular structure determination. Acta Crystallogr D Biol Crystallogr 54:905-921.
38. Davis IW, Leaver-Fay A, Chen VB, Block JN, Kapral GJ, Wang X, Murray LW, Arendall WB, 3rd, Snoeyink J, Richardson JS, Richardson DC (2007) MolProbity: all-atom contacts and structure validation for proteins and nucleic acids. Nucleic Acids Res 35:W375-383.
39. Geerten W. Vuister JFD, Alan W.S. da Silva. iCing v2.0, http://nmr.cmbi.ru.nl/icing/iCing.html.
40. Laskowski RA, Rullmannn JA, MacArthur MW, Kaptein R, Thornton JM (1996) AQUA and PROCHECK-NMR: programs for checking the quality of protein structures solved by NMR. J Biomol NMR 8:477-486.
41. Vriend G, Sander C (1993) Quality control of protein models: directional atomic contact analysis. Journal of Applied Crystallography 26:47-60.
42. Kabsch W, Sander C (1983) Dictionary of protein secondary structure: pattern recognition of hydrogen-bonded and geometrical features. Biopolymers 22:2577-2637.
43. Farrow NA, Muhandiram R, Singer AU, Pascal SM, Kay CM, Gish G, Shoelson SE, Pawson T, Forman-Kay JD, Kay LE (1994) Backbone dynamics of a free and phosphopeptide-complexed Src homology 2 domain studied by 15N NMR relaxation. Biochemistry 33:5984-6003.
44. Tjandra N, Kuboniwa H, Ren H, Bax A (1995) Rotational dynamics of calcium-free calmodulin studied by 15N-NMR relaxation measurements. Eur J Biochem 230:1014-1024.
45. Daragan VA, Mayo KH (1997) Motional model analyses of protein and peptide dynamics using and NMR relaxation. Progress in Nuclear Magnetic Resonance Spectroscopy 31:63-105.
46. DeLano WL. (2002). The PyMOL Molecular Graphics System. DeLano Scientific, San Carlos, CA, USA.
47. Do CB, Mahabhashyam MS, Brudno M, Batzoglou S (2005) ProbCons: Probabilistic consistency-based multiple sequence alignment. Genome Res 15:330-340.
48. Krissinel E, Henrick K (2004) Secondary-structure matching (SSM), a new tool for fast protein structure alignment in three dimensions. Acta Crystallogr D Biol Crystallogr 60:2256-2268.
49. Duszczyk MM, Zanier K, Sattler M (2008) A NMR strategy to unambiguously distinguish nucleic acid hairpin and duplex conformations applied to a Xist RNA A-repeat. Nucleic Acids Res 36:7068-7077.

81
4.3. Supplementary material

82

83

84

85
5. Chapter 5
Structural characterization of the RES complex
5.1. Summary
The RES complex is required for efficient splicing, but is also involved in the retention
of unspliced pre-mRNA in the nucleus. RES is composed of three proteins: Snu17,
Bud13, and Pml1, and is found in yeast as well as humans. Snu17 acts as the central
binding platform onto which the other two proteins bind. Pml1 contains a FHA domain
for which the structure has been solved, however, the complex as such has resisted
structural elucidation and has so far only been studied biochemically. Here, we address
the assembly of the complex from a structural point of view. The efforts were mainly
focused on the binary interaction of Snu17:Bud13, and to a minor extent on
Snu17:Pml1.
Our data shows that Bud13 interacts with Snu17 via a linear peptide motif. In summary,
the results suggest a strong and specific interaction between Snu17 and Bud13. The
affinity was determined to be in the low nanomolar range by ITC (KD ~6 nM). The
binding is suggested to be similar to protein-peptide complexes known as UHM-ULM
complexes, although, including a few novel features. The peptide motif in Bud13 was
analyzed using a combination of NMR and ITC measurements. Approximately 25
residues of a Bud13 peptide interact with Snu17 and include, in addition to the
characteristic tryptophan, a C-terminal helix which forms upon binding. NMR data
collection was made possible by construct optimization, as well as extensive screening
of sample and experimental conditions.
The observations are in agreement with mutational analysis of Snu17, which suggest a
rather large interaction surface, which is slightly different to that described previously
for other UHM-ULM complexes. Future work includes full structural elucidation of a
Snu17:Bud13 complex and additional mutational studies. These studies are anticipated
to shed light on how the subunits of RES fulfill their functions. No structural details
regarding the interaction of Snu17 and Pml1 could be established up to this point.
This work was done in close collaboration with the groups of Dr. Bertrand Séraphin,
(CGM, Gif-Sur-Yvette, France) and Dr. Herman van Tilbeurgh (IBBMC, Orsay, France).

86
5.2. Introduction
Removal of non-coding introns from the pre-mRNA is a key step in the maturation of
mRNA before it is exported into the cytoplasm for translation.48 Regulation of splicing is
closely connected to the assembly of the spliceosome, as this dynamic cellular
machine of megadalton size is assembled in a stepwise manner at every new round of
splicing.44 The RES complex comprises three proteins, Snu17, Bud13 and Pml1, and
is required for efficient splicing and nuclear retention of the unspliced pre-mRNA. The
trimeric complex was discovered in 2004 during an effort to confirm the composition of
Splicing Factor 3b (SF3b) in yeast.46 The SF3b complex is associated with the U2
small nuclear ribonucleoprotein (snRNP) and had previously been described in
humans. Snu17 was thought to be the yeast homolog of human p14, a protein
responsible for branch point recognition during the spliceosome assembly. However,
tandem-affinity purification (TAP) of Snu17 did not pull out partners of SF3b but the two
other proteins of the RES complex as we now know it. The RES complex has also
been shown to be conserved in humans and Drosophila melanogaster. 45,173,174
The subunits of the RES complex are not essential for viability, but high-temperature
growth of either Snu17 or Bud13 deletion strains is significantly reduced.46 Snu17 was
initially known as IST3 for 'increased sodium tolerance'175, while Bud13 had been
correlated to 'bud selection site'.176 Pml1 was discovered along with the
characterization of the RES complex and named 'pre-mRNA leakage protein 1'.46 RES
is an acronym for retention and splicing.
The knowledge on how and when the RES complex interacts with the spliceosome is
limited. Based on biochemical evidence it is known that the RES complex fulfills its
function prior to the first splicing reaction. Deletion of either Snu17 or Bud13 in yeast
limits the first splicing reaction, leading to the formation of the lariat, both in vitro and in
vivo.46,177 Although, this effect is the strongest for weak 5' splice sites at high-
temperature growth.46 Data from mass spectrometry indicates that components of the
RES complex are present in affinity-purified B and C complexes of the spliceosome45,
as well as in the yeast penta-snRNP178. This is in line with findings suggesting that the
RES complex interacts with the U2 snRNP,177 since the U2 snRNP only leaves the
spliceosome after the second splicing reaction. Furthermore, a yeast-two-hybrid
screen has suggested that Bud13 interacts with SF3b, a U2 snRNP-associated
complex.179 Bud13 has also been reported to co-purify with Cef1180, a protein related to
splicing and which is part of the penta-snRNP of yeast178 as well as in complex with
Prp1945. However, being somewhat disputed it now seems to be evident that the RES
complex is not stably associated with the U2 snRNA, or any other snRNA.46,177
Together with the dispensable nature of RES complex for viability, this suggest a
relatively dynamic and weak interaction with the spliceosome during splicing.
Nuclear retention of unspliced pre-mRNA can be attributed to the direct effect of
preventing pre-mRNA from being exported, or the indirect effect of a factor targeting an

87
unspliced pre-mRNA to the spliceosome.181 Hence, pre-mRNA leakage to the
cytoplasm is often observed if the splicing function of the cell is diminished. One
example, Mlp1 is localized to the nuclear pore and hinder export of pre-mRNA, which
makes it an example of a protein with a direct effect on nuclear retention.80 A similar
function has been described for Pml39.182 On the other hand, deletion of Mer1 in yeast
leads to the leakage of specific pre-mRNAs, but its function is not uncoupled from
splicing and Mer1 is therefore an example of indirect nuclear retention.183 Interestingly,
both Snu17 and Bud13 are suggested to be necessary to the function of Mer1.183,184
In the case of the RES complex, Pml1 is likely involved in direct nuclear retention of
pre-mRNAs. In contrast, Snu17 and Bud13 deletions only exhibit indirect pre-mRNA
leakage, since they are connected to a decrease of splicing efficiency.46 Moreover,
purine-rich exonic sequences have been suggested to play an important role for direct
nuclear retention of pre-mRNA.185 Modulation of nuclear retention and splicing by small
molecules has been shown possible, and could be considered for future development
of antitumor drugs.186
Extensive biochemical analysis of the RES complex provided evidence that Snu17
acts as a central binding platform for Bud13 and Pml1.187,188 No direct binary
interaction has been detected between Bud13 and Pml1. Snu17 was first described as
containing a classical RNA recognition motif (RRM), since it contains the characteristic
RNP1 and RNP2 sequences.177 RRMs are among the most abundant protein domains
and are common in splicing proteins and have been extensively characterized.189
Nonetheless, new and compelling data show that the RRM of Snu17 is responsible for
binding a peptide motif in the C-terminus of Bud13 (KD ~2-7 nM).187,188 Thus, the RRM
of Snu17 belongs to a small sub-family known as U2AF homology motifs (UHMs),
which contain degenerated RRMs that evolved to interact with tryptophan-containing
peptides instead (Figure 4.2.1 A,C).190 The UHM of Snu17 is well conserved in higher
eukaryotes (Figure 4.2.1 B). The peptidic interaction motifs are called UHM linear
motifs (ULMs). W232 of Bud13 has been suggested to be essential for the interaction
by both ITC (isothermal titration calorimetry) and SEC (size-exclusion chromatography)
experiments187. Intriguingly, this is contradicted by in vivo co-expression and
purification data of a W232A mutated His6:Snu17-Bud13 operon.188 The molecular
understanding of the interaction of Snu17 and Bud13 indicates that the Snu17-Bud13
interaction may differ from the canonical UHM-ULM type of interaction.
In addition, the C-terminal region of Snu17 is suggested to be necessary for binding of
Pml1 (KD ~1 μM).187,188 However, biochemical or structural details regarding the nature
of the interaction are missing. It is not clear whether the C-terminus of Snu17 functions
as a linear motif interacting with a structural domain in Pml1188, or, if it together with the
UHM domain forms an additional binding site for residues protruding from Pml1187. The
full RES complex (71 kDa) has resisted structural characterization due to widespread
structural flexibility within the individual proteins.187 However, the structure of the
forkhead-associated (FHA) domain in Pml1 was recently solved by two groups

88
independently.188,191 It contains an 11-stranded β-sandwich and three short helical
regions. Both reported structures start at around residue 50, indicating a flexible N-
terminus. Additionally, it was shown that residues 52-61 are important for stability of the
domain as they act as a clamp stabilizing β3 and β6.191 FHA domains are known to
interact with peptides comprising phosphorylated threonines.192,193 Such
phosphopeptides bind to the loops at one edge of the β-sandwich of the FHA domain.
Nevertheless, a link between phosphorylation and splicing regulation by the RES
complex has yet to be established. Up to now, no phospholigand has been established
(library screening; Mark Brooks, personal communication), and an in vivo reporter
assay suggest that splicing is not affected by mutations in the putative binding cleft of
Pml1.188 A direct interaction between RNA and the RES complex has so far not been
observed.
In summary, the functions of the RES complex are poorly understood and are so far
not assigned to specific subunits or domains. Biochemically the organization of the
RES complex has been laid out, but molecular details of the intramolecular interactions
and the functions are yet to be ascertained. Here, we report an initial structural
analysis of the assembly of the RES complex. The focus lies on the interaction
between Bud13 and Snu17, which is believed to act as a central binding platform in the
complex. These two proteins interact through a novel UHM/ULM-type of interaction,
comprising an approximately 25 residue long peptide motif in Bud13. A full structural
elucidation of this protein-peptide complex is ongoing.
Figure 5.2.1 Multiple sequence alignment of Snu17 UHM to other UHMs and to homologs in eukaryotic species. (A) Snu17 UHM aligned to known human UHMs. Red and blue columns in the conservation graph indicate α-helices and β-strands, respectively. Uniprot accession codes in brackets. Numbering above the alignment is according to the expression construct of Snu17
1-113, while the original residue
numbering is indicated on the right side. The sequence identity to Snu17 is given at the far right. (B) Alignment of Snu17 UHM to the homolog of higher eukaryotic species. Similar features as in (A). (C) Homology model of Snu17 UHM
based on free SPF45 (2PE8.pdb). β-strands (blue) and
α-helices (red) are numbered as in (A).

89
5.3. Results
Initial analysis of full-length proteins
Characterization of full-length constructs of individual proteins indicated that all three
contain flexible regions (Figure 5.3.1 A-C). 1H,15N HSQC spectra of Snu17FL, Bud13FL
and Pml1FL show overlapping and intense signals around 8 ppm, indicative of unfolded
or partially unfolded regions. Dispersed resonances, belonging to the folded FHA and
UHM domain of Pml1FL and Snu17FL, respectively, were visible. In solution, unbound
Bud13FL can be suggested not to contain any elements of secondary structure.187
A spectrum was also recorded of 15N labeled Snu17FL in a reconstituted RES complex
(Figure 5.3.1 D). This spectrum was of such poor quality that it suggested partial
aggregation in the sample. No further NMR experiments were done on the full complex.
These results confirmed what was known and expected from the proteins187, however,
it was now clear why earlier crystal screens had failed; this was either due to flexibility
in the complex, especially in Bud13, or due to aggregation of the protein samples. To
extend our structural understanding of the complex, we decided to only study isolated
domains and their binary interactions (Figure 5.3.1).
Figure 5.3.1
1H,
15N HSQC spectra of individual proteins and of the full RES complex. (A) Pml1
FL (B)
Bud13FL
(C) Snu17FL
(D) Reconstituted RES complex with 15
N labeled Snu17FL
. All measurements were done at 300K. Additionally, common constructs referred to in the text, are illustrated. In the case of Pml1 and Snu17, the green and blue area indicates the folded FHA and UHM/RRM domains, respectively.

90
The interaction between Snu17 and Bud13.
It was not obvious how to obtain sufficient amounts of stable Snu17 protein for
structural studies. Many different problems were solved before the actual analysis of
the complexes started. Firstly, it was decided upon to use a shorter construct, Snu171-
113, as the C-terminus was flexible. A 1H,15N HSQC spectrum of Snu171-113 showed that
the UHM domain was still intact in the shorter construct (Figure 5.3.2 A). Removing the
N-terminus as well diminishes the purification yield in our hands. Secondly, Snu171-113
was very unstable as shown by H/D-exchange experiments (Figure 5.3.3 A-B) and it
precipitated heavily over time. However, at low concentrations Snu171-113 could be
used for ligand titrations. It was discovered that 10% DMSO stabilized the protein
sufficiently that backbone experiments to be recorded and analyzed. The UHM
structure was not heavily perturbed upon addition of DMSO as indicated by a 1H,15N
HSQC spectrum (Figure 5.3.7 A). General shifts, and not specific or isolated ones, are
expected since the buffer has different properties. Third, to increase expression yields
Snu171-113 was produced as inclusion bodies and refolded (see 5.6 Materials and
Methods). Comparing spectra from either procedure shows that the UHM structure is
identical (Figure 5.3.2 B). Finally, it was noticed that binding of Bud13 to Snu171-113
increased stability and improved behavior of the sample. The increased stability was
for example shown by a thermofluor assay and hydrogen/deuterium-exchange
(H/D-exchange; Figure 5.3.3 C-E). Binding of a Bud13 peptide increased the melting
point of Snu17 by ~5°C. The hydrogen exchange experiment indicates the presence of
stable elements of secondary structure that agree well with a homology model (Figure
5.3.3 F). Because of this, we ended our efforts to solve the structure of Snu171-113
alone, and focused on a structure of ligand-complex with a section of Bud13.
Figure 5.3.2 Optimization of Snu17 construct and expression procedures. (A) Comparison of Snu17
FL and Snu17
1-113 by NMR. The UHM domain is still intact in the shorter construct. (B) Comparison
of Snu171-113
purified under native and denaturing conditions. Identical spectra indicate that the refolding procedure worked. All
1H,
15N HSQC spectra recorded at 300K on 100 μM samples.
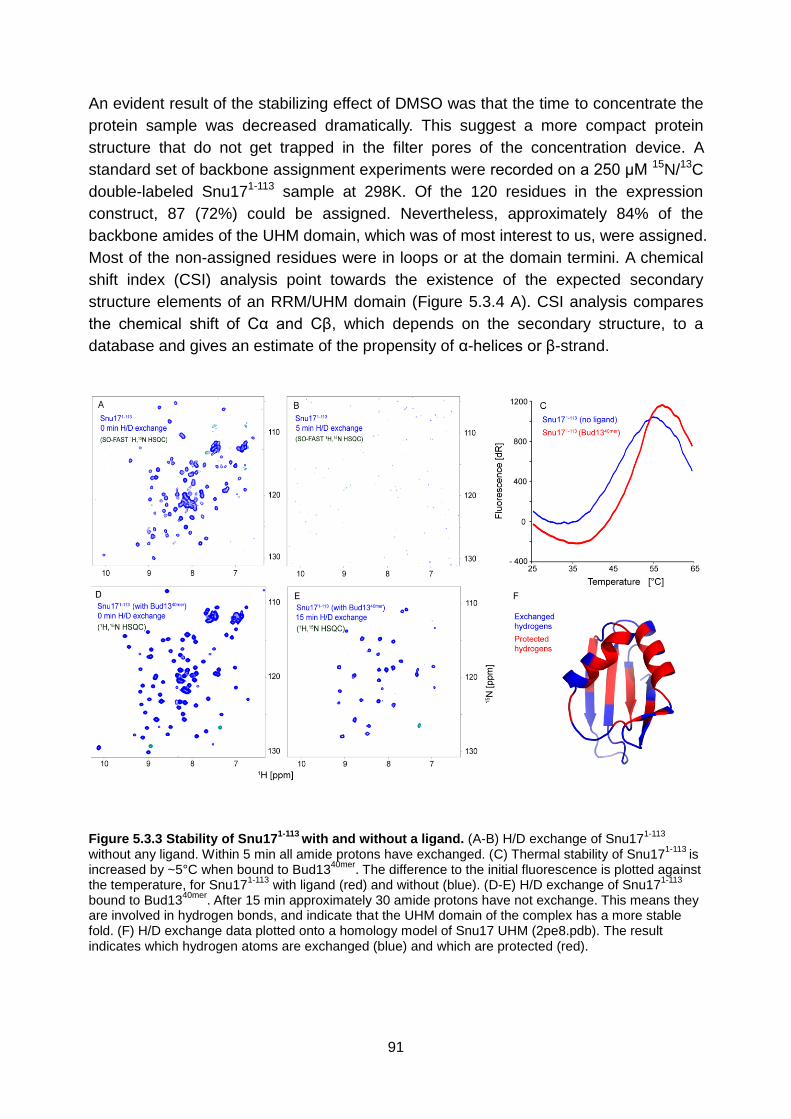
91
An evident result of the stabilizing effect of DMSO was that the time to concentrate the
protein sample was decreased dramatically. This suggest a more compact protein
structure that do not get trapped in the filter pores of the concentration device. A
standard set of backbone assignment experiments were recorded on a 250 μM 15N/13C
double-labeled Snu171-113 sample at 298K. Of the 120 residues in the expression
construct, 87 (72%) could be assigned. Nevertheless, approximately 84% of the
backbone amides of the UHM domain, which was of most interest to us, were assigned.
Most of the non-assigned residues were in loops or at the domain termini. A chemical
shift index (CSI) analysis point towards the existence of the expected secondary
structure elements of an RRM/UHM domain (Figure 5.3.4 A). CSI analysis compares
the chemical shift of Cα and Cβ, which depends on the secondary structure, to a
database and gives an estimate of the propensity of α-helices or β-strand.
Figure 5.3.3 Stability of Snu171-113
with and without a ligand. (A-B) H/D exchange of Snu171-113
without any ligand. Within 5 min all amide protons have exchanged. (C) Thermal stability of Snu17
1-113 is
increased by ~5°C when bound to Bud1340mer
. The difference to the initial fluorescence is plotted against the temperature, for Snu17
1-113 with ligand (red) and without (blue). (D-E) H/D exchange of Snu17
1-113
bound to Bud1340mer
. After 15 min approximately 30 amide protons have not exchange. This means they are involved in hydrogen bonds, and indicate that the UHM domain of the complex has a more stable fold. (F) H/D exchange data plotted onto a homology model of Snu17 UHM (2pe8.pdb). The result indicates which hydrogen atoms are exchanged (blue) and which are protected (red).

92
Figure 5.3.4 Analysis of secondary structure and residue flexibility in Snu171-113
by NMR. Residue numbering in the plot is from the expression construct. β-strands (blue arrows) and α-helices (red) found in a homology model are indicated above the plots (Figure 4.2.1 C). (A) CSI analysis of free Snu17
1-113
(B) CSI analysis of Snu171-113
bound to Bud1340mer
. Both plots show that the expected secondary structure elements are present in Snu17
1-113 in solution. (C) {
1H}-
15N heteronuclear NOE measurements
confirm a folded UHM domain, with flexible termini and two slightly flexible loops (grey bars).
Figure 5.3.5 Size exclusion chromatography of a complex containing Snu17
1-113 and
Bud1340mer
. The analysis of a sample containing an excess of Bud13 shows that fractions of the major peak contains the complex. The 10kDa difference between the fragments could be well resolved using Tricine-containing SDS-PAGE gels. Next to the UV curve (blue) is the conductance (brown), showing a separate buffer peak.
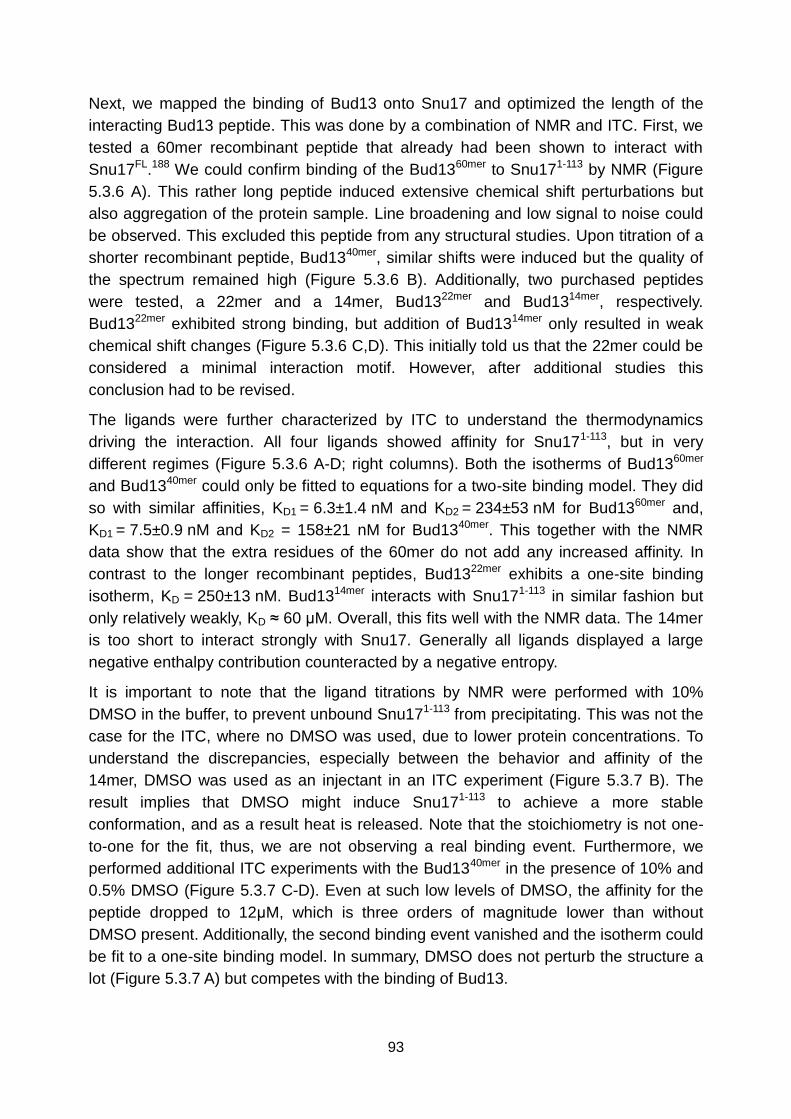
93
Next, we mapped the binding of Bud13 onto Snu17 and optimized the length of the
interacting Bud13 peptide. This was done by a combination of NMR and ITC. First, we
tested a 60mer recombinant peptide that already had been shown to interact with
Snu17FL.188 We could confirm binding of the Bud1360mer to Snu171-113 by NMR (Figure
5.3.6 A). This rather long peptide induced extensive chemical shift perturbations but
also aggregation of the protein sample. Line broadening and low signal to noise could
be observed. This excluded this peptide from any structural studies. Upon titration of a
shorter recombinant peptide, Bud1340mer, similar shifts were induced but the quality of
the spectrum remained high (Figure 5.3.6 B). Additionally, two purchased peptides
were tested, a 22mer and a 14mer, Bud1322mer and Bud1314mer, respectively.
Bud1322mer exhibited strong binding, but addition of Bud1314mer only resulted in weak
chemical shift changes (Figure 5.3.6 C,D). This initially told us that the 22mer could be
considered a minimal interaction motif. However, after additional studies this
conclusion had to be revised.
The ligands were further characterized by ITC to understand the thermodynamics
driving the interaction. All four ligands showed affinity for Snu171-113, but in very
different regimes (Figure 5.3.6 A-D; right columns). Both the isotherms of Bud1360mer
and Bud1340mer could only be fitted to equations for a two-site binding model. They did
so with similar affinities, KD1 = 6.3±1.4 nM and KD2 = 234±53 nM for Bud1360mer and,
KD1 = 7.5±0.9 nM and KD2 = 158±21 nM for Bud1340mer. This together with the NMR
data show that the extra residues of the 60mer do not add any increased affinity. In
contrast to the longer recombinant peptides, Bud1322mer exhibits a one-site binding
isotherm, KD = 250±13 nM. Bud1314mer interacts with Snu171-113 in similar fashion but
only relatively weakly, KD ≈ 60 μM. Overall, this fits well with the NMR data. The 14mer
is too short to interact strongly with Snu17. Generally all ligands displayed a large
negative enthalpy contribution counteracted by a negative entropy.
It is important to note that the ligand titrations by NMR were performed with 10%
DMSO in the buffer, to prevent unbound Snu171-113 from precipitating. This was not the
case for the ITC, where no DMSO was used, due to lower protein concentrations. To
understand the discrepancies, especially between the behavior and affinity of the
14mer, DMSO was used as an injectant in an ITC experiment (Figure 5.3.7 B). The
result implies that DMSO might induce Snu171-113 to achieve a more stable
conformation, and as a result heat is released. Note that the stoichiometry is not one-
to-one for the fit, thus, we are not observing a real binding event. Furthermore, we
performed additional ITC experiments with the Bud1340mer in the presence of 10% and
0.5% DMSO (Figure 5.3.7 C-D). Even at such low levels of DMSO, the affinity for the
peptide dropped to 12μM, which is three orders of magnitude lower than without
DMSO present. Additionally, the second binding event vanished and the isotherm could
be fit to a one-site binding model. In summary, DMSO does not perturb the structure a
lot (Figure 5.3.7 A) but competes with the binding of Bud13.

94
See next page for figure legend.
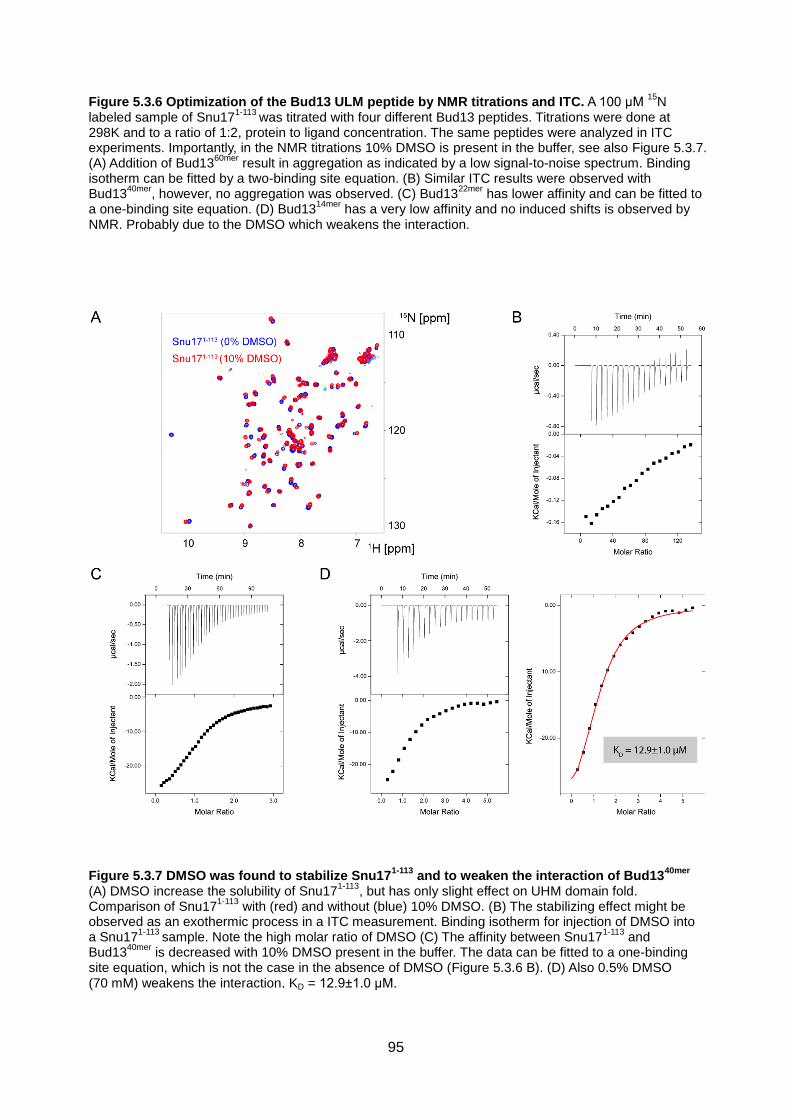
95
Figure 5.3.6 Optimization of the Bud13 ULM peptide by NMR titrations and ITC. A 100 μM 15
N labeled sample of Snu17
1-113 was titrated with four different Bud13 peptides. Titrations were done at
298K and to a ratio of 1:2, protein to ligand concentration. The same peptides were analyzed in ITC experiments. Importantly, in the NMR titrations 10% DMSO is present in the buffer, see also Figure 5.3.7. (A) Addition of Bud13
60mer result in aggregation as indicated by a low signal-to-noise spectrum. Binding
isotherm can be fitted by a two-binding site equation. (B) Similar ITC results were observed with Bud13
40mer, however, no aggregation was observed. (C) Bud13
22mer has lower affinity and can be fitted to
a one-binding site equation. (D) Bud1314mer
has a very low affinity and no induced shifts is observed by NMR. Probably due to the DMSO which weakens the interaction.
Figure 5.3.7 DMSO was found to stabilize Snu171-113
and to weaken the interaction of Bud1340mer
(A) DMSO increase the solubility of Snu17
1-113, but has only slight effect on UHM domain fold.
Comparison of Snu171-113
with (red) and without (blue) 10% DMSO. (B) The stabilizing effect might be observed as an exothermic process in a ITC measurement. Binding isotherm for injection of DMSO into a Snu17
1-113 sample. Note the high molar ratio of DMSO (C) The affinity between Snu17
1-113 and
Bud1340mer
is decreased with 10% DMSO present in the buffer. The data can be fitted to a one-binding site equation, which is not the case in the absence of DMSO (Figure 5.3.6 B). (D) Also 0.5% DMSO (70 mM) weakens the interaction. KD = 12.9±1.0 μM.

96
Chemical shift perturbations (CSPs) induced by Bud1360mer, Bud1340mer and Bud1322mer
were compared (Figure 5.3.8 A-B). Interestingly, there is hardly no difference between
the recombinant 60mer and 40mer peptides. Bud1322mer, on the contrary, induce
different CSPs than Bud1340mer. The CSPs of Bud1340mer and Bud1322mer on Snu171-113
were quantified and plotted for each residue. Despite the fact that the shifts are
different, both peptides mostly affect the same residues (Figure 5.3.8 D-E). The
highlighted region of perturbed backbone amide resonances coincide well with the
expected binding site, as known from other UHM-ULM complexes (Figure 5.3.8 C; see
5.4 Discussion).
Figure 5.3.8 Analysis of the Bud13 interaction site on Snu17, a comparison of peptides. (A) Bud13
40mer (blue) and Bud13
60mer (red) induce similar chemical shift perturbations (CSPs) upon titration
to Snu171-113
. Only slight differences can be observed (marked with black arrows). This indicate almost identical binding sites and binding modes, and is supported by the ITC data (see Figure 5.3.6 A-B). (B) In contrast, Bud13
22mer (red) induce different shifts than Bud13
40mer (blue). This suggest differences in the
size of the interaction site, in binding mode, or in both. (C) The induced CSPs of Bud1340mer
plotted onto a homology model of Snu17
1-113 (2pe8.pdb). The CSPs overlap well with the expected binding site of
other known UHM-ULM complexes. Blue to red, through white, indicate increasing perturbations and are calculated as: 22
][1.0][ ppmNppmHCSP . N- and C-terminus as well as α-helix 1 and 2 are labeled.
(D) As (C) but the CSPs plotted per residue in a column chart. Secondary structure definitions are taken from the homology model. β-strands are depicted as blue arrows and α-helices in red. Numbering corresponds to our expression construct. (E) Same as (D) but with CSPs of Bud13
22mer.

97
To gain knowledge about how many residues in Bud13 are involved in the interaction
with Snu17, we next acquired several spectra of 15N labeled Bud1360mer and
Bud1340mer in the presence of unlabeled Snu171-113 (Figure 5.3.9). In line with earlier
findings, the 60mer peptide exhibited problems of aggregation. Both peptides show
similar chemical shift changes upon binding to Snu171-113. In total, approximately 25
shifting resonance were observed and expected to be involved in the interaction
between Bud1340mer and Snu171-113.
Evaluating all the available data, we decided to continue our work with the complex of
Bud1340mer and Snu171-113. Bud1360mer did not behave well, as also observed by
SDS-PAGE where it gave fuzzy and jagged bands, indicating dimerization or
oligomerization (data not shown). Bud1322mer behaved well and had strong affinity for
Snu17, but was not available recombinantly. All efforts to express and purify shorter
constructs of Bud13 (15-22 residues long) had failed. Furthermore, as clearly
demonstrated Bud1314mer had only a very weak affinity for the UHM domain. On the
other hand, Bud1340mer fulfilled the basic requirements by not inducing aggregation,
having strong affinity and being obtainable in sufficient amount with 15N/13C labeling.
Additionally, the amount of chemical shift changes (Figure 5.3.8 B) and the rather
different binding isotherm (Figure 5.3.6 B), convinced us this was the most interesting
alternative.
Figure 5.3.9 15
N labeled recombinant Bud13 peptides titrated with unlabeled Snu171-113
. (A) Unbound Bud13
60mer (blue) as well as in complex with Snu17
1-113 (Red). Decreased signal-to-noise
suggest aggregation in the sample. (B) Same as (A) but with 15
N labeled Bud1340mer
. As relatively many resonances appear in new positions, a large interaction surface might be expected. Spectra were recorded at 298K with Snu17
1-113 in two times excess.

98
Both Bud1340mer and Snu171-113 were doubly-labeled and complexed to unlabeled
counterparts. However, when prepared at high concentration, we realized that once
more we had a problem of aggregation as indicated by a low quality HSQC spectrum.
First, we tried to solve it by buffer optimization guided by a thermofluor assay (data not
shown), as well as by re-constituting the complex using gelfiltration. The results were
inconclusive and did not improve the quality of the sample. Even though
counterintuitive, we also acquired NMR spectra at increased temperatures (Figure
5.3.10). This in fact solved our problems by increasing thermal energy and decreasing
the correlation time of the complex. Faster tumbling of the protein complex leads to
slower relaxation and sharper NMR signals. At high temperature the exchange of the
peptide posed a problem to us. Due to the instability of free Snu171-113 an excess of
Bud1340mer had to be used. A stable complex, yielding a high-quality NMR spectrum at
318K (45°C), required a 1:2.5 ratio of protein to peptide concentration.
Figure 5.3.10 High temperature is needed for recording high quality NMR data. 1H,
15N HSQC
spectra of a Snu171-113
: Bud1340mer
complex at increasing temperatures. The quality of the spectra suggest aggregation at low temperature and monomeric behavior at high temperatures. At 320K the signals are sharp and the sample is stable. Increasing to 325K led to precipitation of protein.

99
The backbone amides of Bud1340mer could be assigned to an high extent (90%) and
were analyzed by CSI (Figure 5.3.11 A-B). Intriguingly, the analysis suggests the
formation of a helix in Bud1340mer upon binding to Snu171-113. The helix is C-terminal to
the tryptophan, which is characteristic and essential in all UHM-ULM interactions, and
could be a reason to the differences observed in previous ITC measurements.
Heteronuclear {1H}-15N NOE was recorded for Bud1340mer in complex and shows that
almost all of the residues are rigid (Figure 5.3.11 C). Only a few residues at each
terminus are designated flexible. The relaxation data is in agreement with the
observation that numerous residues in the peptide are perturbed upon titration of
Snu171-113 (Figure 5.3.9). Together with the CSI analysis, this data suggest that the
interaction between Bud13 and Snu17 is not of the classical UHM-ULM type. A T2
estimation by 1D jump-return spin-echo experiments with different relaxation delays,
suggest that the complex tumbles as a monomer in solution (data not shown).194
The protein backbone amides of Snu171-113 in complex with Bud1340mer were assigned
using a triple labeled sample (15N/13C/2H). As for Bud1340mer most flexible amides
exchange to fast at high temperatures and are broadened out beyond detection. One
positive thing about this is that the spectra get less crowded. 96% of the backbone
amides of the UHM domain could be assigned. CSI analysis of the Snu171-113 complex
suggests similar secondary structure elements as for the free protein (Figure 5.3.4 B).
On the same sample also heteronuclear {1H}-15N NOE was recorded. This data show
an almost rigid UHM domain flanked by flexible termini (Figure 5.3.4 C). Two slightly
flexible regions might be expected around residue 46 and 74 in the Snu171-113
construct, which in a homology model of Snu171-113 correspond to two loops.
At the moment, we are at the stage of collecting and analyzing data for side-chain
assignment and derivation of distance restraints. It appears promising, but difficulties
may arise from the relatively intense CH signals coming from unfolded parts of
Snu171-113. These tend to disturb the baseline and to obscure less intense resonances.
The protons and carbons of Bud1340mer are to be assigned using TOCSY-based
experiments starting at the backbone amide. To be able to introduce correct distance
restraints between Snu171-113 and Bud1340mer, 13C-edited and 13C,15N filtered
experiments have been recorded. Initial analyses of such spectra have identified
several intermolecular NOEs (Figure 5.3.12). These intermolecular restraints will be of
crucial importance during the structure calculation of the protein peptide complex.
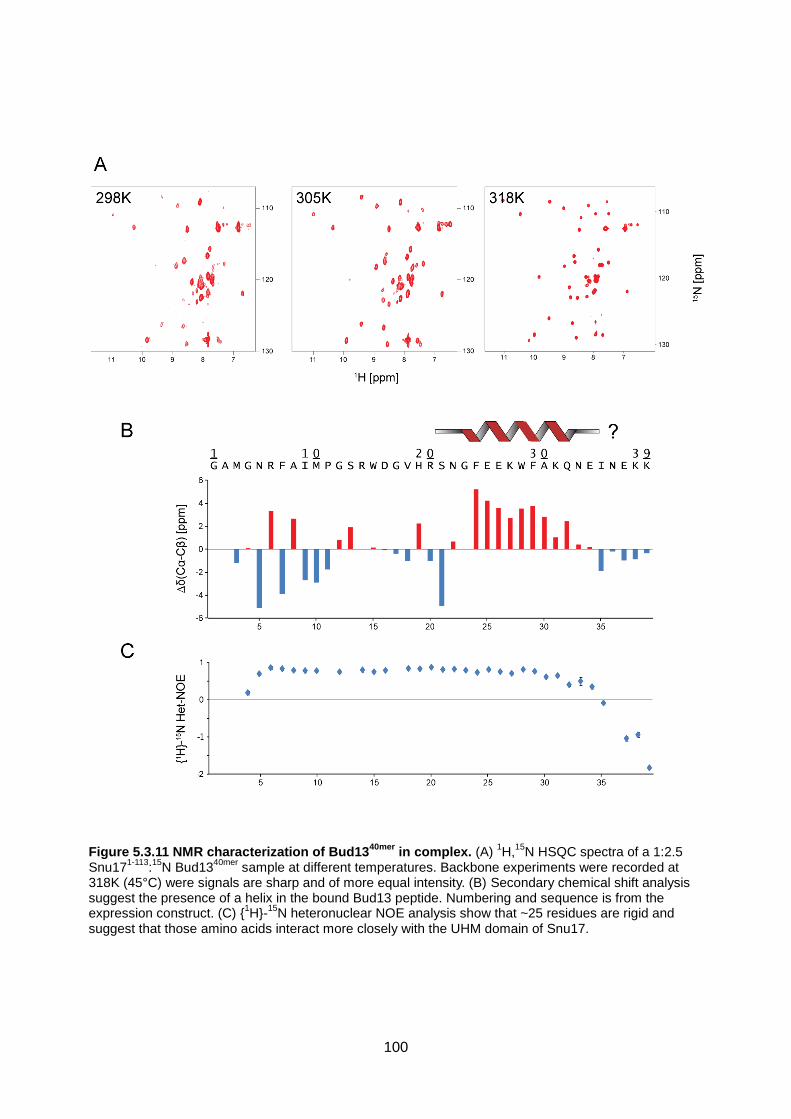
100
Figure 5.3.11 NMR characterization of Bud1340mer
in complex. (A) 1H,
15N HSQC spectra of a 1:2.5
Snu171-113
:15
N Bud1340mer
sample at different temperatures. Backbone experiments were recorded at 318K (45°C) were signals are sharp and of more equal intensity. (B) Secondary chemical shift analysis suggest the presence of a helix in the bound Bud13 peptide. Numbering and sequence is from the expression construct. (C) {
1H}-
15N heteronuclear NOE analysis show that ~25 residues are rigid and
suggest that those amino acids interact more closely with the UHM domain of Snu17.

101
In collaboration, mutational data probing the in vivo interaction between Snu17 and
Bud13 has been collected. In short, their studies show that a double mutant of Bud13FL
(R231D, W232A) is not co-purified with Snu17FL when co-expressed in E. coli.
Mutations in Snu17FL on the other hand are not as conclusive. A battery of single to
quadruple mutations has been performed without abrogating the interaction completely.
Although, one combination of mutations (F95A, K96D, I97A, V50W) exhibit a low-
growth phenotype at high-temperature. This may be a sign of decreased affinity for
Snu17 binding partners and/or indicate a non-intact structural domain. To clarify the
results a combination of NMR and ITC experiments could be set up. Further mutations
will have to be guided by structural data and therefore need to await our structure
calculations.
To conclude, our findings so far provide us with a rich and interesting basis for further
structural and biochemical work on the binary complex of Snu171-113 and Bud1340mer.
The next stage is to make a thorough analysis of the NMR data and set up structural
calculations. We then aim to extend our mutational analysis, to finally be able to fully
characterize the molecular details of the Snu17:Bud13 interaction.
Figure 5.3.12 Intermolecular NOEs for 15
N/13
C labeled Snu171-113
in complex with Bud1340mer
. This
13C-edited and double-filtered experiment shows that it is possible to record and define distance
restraints between the UHM domain and the ULM peptide. The resonance frequency of the connected carbon atom was evolved, and the displayed carbon plane is indicated above each spectrum.

102
Initial analysis of Snu17: Pml1
The interaction between Snu17 and Pml1 was to some extent studied by NMR. The
initial work did not lead to any conclusive results, unfortunately, and is the reason why
this part of the project was not pursued. Based on biochemical analysis and screening
by NMR, a shorter construct of Pml1 was selected for backbone assignment (Figure
5.3.13 C). 78% of Pml146-204 could be assigned using a triple-labeled sample and
standard three-dimensional heteronuclear experiments. CSI analysis gives a
comparable result to the secondary structures that are present in the crystal structure
(Figure 5.3.13 A-B). Many of the assignments (64%) could be transferred to the full-
length construct because of the intact FHA domain of Pml146-204.
Figure 5.3.13 Crystal structure of the FHA domain from Pml1 and the NMR backbone assignment. (A) The structure of the FHA domain from Pml1 was solved by X-ray crystallography (2JKD.pdb).
188 A
flexible loop is indicated with a dashed line. β-strands are depicted in blue and α-helices in red. (B) CSI analysis of Pml1
46-204. Above is the secondary structure topology, as in the crystal structure, and the
sequence with numbering from the full-length protein. Below is the numbering as in the expression construct. (C)
1H,
15N HSQC spectra of Pml1
FL (left) and Pml
46-204 (right). Pml1
46-204 exhibits less overlap
and an intact FHA domain. Pml146-204
was also the construct used for crystallization.

103
Upon titration of unlabeled Snu17FL to 15N labeled Pml1FL no specific chemical shift
perturbations could be observed (Figure 5.3.14 A). However, the signal intensities of
resonances from residues in the folded FHA domain decreased in a general fashion.
The reverse titration of unlabeled Pml1FL to 15N labeled Snu17FL gave a similar but
more unambiguous result (Figure 5.3.14 B). In both cases, our attempts to analyze the
decrease in signal intensity quantitatively did not lead to any conclusions regarding the
location of a binding site. Binding was evident but details were not.
Figure 5.3.14 Analysis of the Snu17FL
:Pml1FL
complex by NMR titrations. (A) 15
N Pml1FL
was titrated to a 1:0.75 ratio of Pml1
FL to Snu17
FL. Compared to free Pml1 (left), the intensity of signals from
the FHA domain decrease in the presence of Snu17 (right). Further titration was not possible due to instability of Snu17
FL. (B) The result was more evident when unlabeled Pml1
FL was titrated against
15N
labeled Snu17FL
. At 1:1 ratio of Snu17FL
to Pml1FL
(middle spectrum) most signals from the UHM domain are broadened out. The decrease in signal intensity of the sample continued when titrated to 1:1.6 (right spectrum). The titrations were followed by acquisition of
1H,
15N HSQC spectra with equal number of
scans and at the same receiver gain. Experiments were recorded at 300K with samples ranging from 100-300 μM in buffers in the absence of DMSO. Spectra are scaled using the strong intensity of the flexible side chain amides.

104
5.4. Discussion
The presented work describes how we used mainly biophysical techniques to analyze
a stable sample of the UHM domain of Snu17 in complex with a peptide from Bud13;
both NMR and ITC confirmed the interaction. We optimized the length of the Bud13
peptide and show that ~25 residues of Bud1340mer interact rigidly with Snu17. The
interaction is expected to be of a similar type to those reported previously UHM-ULM
complexes. The linear interaction motif in the peptide includes the characteristic
tryptophan and, interestingly, a C-terminal helix, which is formed upon binding. ITC
showed that inclusion of this helix increases affinity significantly. The predisposition for
forming a helix at the C-terminus was appreciated early on in this work through
bioinformatic analysis (JPRED195, PSIPRED196; data not shown). TALOS+, which
compares Cα/Cβ chemical shifts to known structures, also predicts a helix at this
position (data not shown).129 The sequence of Bud1340mer is highly conserved in higher
eukaryotes, although the sequence conservation is considerably lower at the
C-terminus (Figure 5.4.1 A).
Figure 5.4.1 Sequence alignment of Bud1340mer
to eukaryotic homologs and to ULM sequences. Red columns in the conservation plot indicate residues suggested to form a helix upon binding to Snu17. Uniprot accession codes are given in brackets. Numbering above the alignment is according to the expression construct of Bud13
40mer, while the original residue numbering is indicated on the right side. (A)
Bud1340mer
aligned to homologs from higher eukaryotic species. Sequence identity compared to Bud13 is shown on the far right of the alignment. (B) Bud13
40mer aligned to characterized ULM sequences.
Sequence identity to Bud13 is so low that no numbers were calculated.

105
In parallel to our structural biology effort by NMR, additional protein crystallization
screens were performed, although, with a disappointing outcome. This can in part be
explained by the aggregated appearance of the Bud1340mer:Snu171-113 complex at high
concentrations and room temperature (Figure 5.3.10). High temperature NMR
measurements make data acquisition possible and structure elucidation is now within
reach.
Linear peptide motifs are being observed ever more increasingly in biology.197,198 Such
motifs act, for example, as interaction sites or modification sites and are important in
cell compartment targeting and signaling cascades, as well as in other types of
regulation. Several complexes of UHMs interacting with ULM peptides have been
structurally characterized, both by NMR and X-ray crystallography. We performed a
structural comparison to learn about similarities and differences of these structures to
what is known about the Bud1340mer:Snu171-113 complex.
The first UHM-ULM interaction to be discovered was between U2AF35 and U2AF65,
which also gave rise to the name: U2AF homology motif (UHM).190,199 These two
auxiliary factors are, together with the U2 snRNP, involved in the 3' splice site selection.
The interaction between the two proteins of the heterodimer was shown to comprise
the degenerated RRM domain of U2AF35 and a N-terminal peptide motif in U2AF65
(Figure 5.4.2 A).199 At a first sight, this complex might be rather tempting to use as a
template for Snu17 and Bud13. The ULM peptide modeled into the electron density is
rather long (23 residues) and a C-terminal helix is also present. However, other
important features include two tryptophan residues which dovetails the two subunits.
One of the tryptophan residue originates from the UHM and the other from the peptide
(Figure 5.4.2 A), as well as a polyproline stretch in the ULM, strongly kinking its
backbone. This distinguishes the interactions since these attributes are not present in
Snu17 or Bud13. A sequence alignment of the ULM peptide of U2AF65 and Bud13
clearly show the differences (Figure 5.4.1 B). The residues mentioned were all shown
to be essential for low nanomolar affinity.199 It could be argued that the C-terminal helix
is induced by crystal contacts since it participates heavily in a helix bundle created by
the arrangement of the asymmetric units into the crystallographic unit cell (data not
shown). Additionally, the chemical shift perturbations induced by Bud1340mer do not
overlap well with the position of the helix in the U2AF35 and U2AF65 complex (Figure
5.3.8 C).
U2AF65 not only contains a ULM, but also three RRM domains. One of these, the third
RRM, turned out to be a UHM and bind a peptide from Splicing Factor 1 (SF1).200 SF1
recognizes the branch point sequence of introns, and needs to be replaced by
SF3b-155 during spliceosome assembly and the splicing reaction cycle.201 A
requirement for this is to break the interaction between the UHM of U2AF65 and the
N-terminal ULM of SF1, which contribute a major part of SF1 affinity.202 The molecular
details of this interaction were previously demonstrated by structural studies using
NMR in our laboratory (Figure 5.4.2 B).200 The ULM of SF1 is shorter than that of

106
U2AF65, and has, in addition to the characteristic tryptophan, several positively-
charged residues in the N-terminus (Figure 5.4.1 A). These residues contribute actively
to binding due to corresponding negatively-charged residues on the α1 helix of
U2AF65.200 Charge-reversing mutations abolishes the interaction, as does a
tryptophan-to-alanine mutation. The ULM Bud13 contains no positively-charged
residues at the N-terminus and, hence, not expected to be cross-reactive with U2AF65
(Figure 5.4.1 B).
Figure 5.4.2 Structures of UHM domains in complex with ULM peptides. β-strands are depicted in blue and α-helices in red. Termini of the ligand peptide are labeled. Note that the classical RNA binding site is on the back, across the β-sheet.(A) U2AF35 with the ULM peptide of U2AF65 (green; 1JMT.pdb). (B) U2AF65 with the ULM peptide of SF1 (magenta; 1OIP.pdb). (C) SPF45 with the ULM peptide of SF3b-155 (orange; 2PEH.pdb). (D) The UHM domain of PUF60 (3DXB.pdb). Characterized by ITC and NMR to bind several different ULMs, from SF3b-155, SF1 and U2AF65.
107
The proteins described thus far are involved in constitutive splicing, but unsurprisingly
proteins in alternative splicing also utilize the UHM-ULM architecture. One possibility is
that such proteins could compete with the constitutive splicing factors for exclusion or
inclusion of certain exons.51 Splicing factor SPF45 is a positive regulator for the
exclusion of exon 6 in the FAS (CD95) gene, a splicing event known to regulate
apoptosis.54 SPF45 was shown to bind several ULMs, up to now those present in
SF3b-155, U2AF65 and SF1. All three proteins are involved in 3' splice site definition
together with the U2 snRNP. A crystal structure of SPF45 UHM bound to the fifth ULM
of SF3b-155 has been solved (Figure 5.4.2 C).54 The details of the interaction is
relatively similar to the U2AF65:SF1 complex (Figure 5.3.1). Binding of a central
tryptophan is enhanced by neighboring positively-charged residues. Furthermore,
based on the structural data the authors designed numerous mutations to deconvolute
the function of SPF45. The results suggest an interesting model for how networks of
UHM-ULM interactions are required for alternative splicing.54 Generally, there seem to
be cross-reactivity between sets of UHMs and ULMs.
Also the UHM of PUF60 has been structurally and biochemically characterized (Figure
5.4.2 D).203 PUF60 is a splicing factor closely related to U2AF65, but interacts, in
contrast to U2AF65, specifically with the N-terminal ULMs of SF3b-155. Various
interactions of PUF60 have been studied by both ITC and NMR, but up to now, only
the free form of the protein has been crystallized. However, these interactions most
likely have similar features as the U2AF65:SF1 and SPF45:SF3b-155 complexes
(Figure 5.4.1 B-C). Surprisingly, a distinctive and flexible loop of the PUF60 UHM
mediates homo-dimerization upon addition of SDS.203
In conclusion, we expect structural differences in the Snu17:Bud13 complex compared
to the UHM-ULM structures presented above. The ULM of Bud13 is relatively long, as
indicated by NMR relaxation data, and comprises no positively-charged residues. A
ULM helix, evidently formed in Bud1340mer, has only been observed in the
U2AF35:U2AF65 complex before, but is there preceded by a poly-proline stretch. Also,
that type of helix-UHM interaction does not fit with our titration data. However, one
explanation for this could be that the helix is not making any close contacts to the
folded domain of Snu17, but is instead sticking out into the solution. Concerning the
ITC data, the formation of a helix in Bud1340/60mer might be correlated to the two
binding-event isotherm observed, since the helix residues are not present in the
shorter Bud1322mer. Mutational data on Snu17 also suggest a relatively large interaction
surface, since no combination of mutations so far abolished the interaction in the co-
expression analysis of full-length construct. The mutations done were based on
structural knowledge from the previously described UHM-ULM complexes (Figure
5.4.2).

108
To date, all UHMs characterized originate from proteins related to splice site
recognition. It would be interesting to test the ULM-specificity of Snu17, since
cross-reactivity has been shown between the other UHMs and their ULMs.54 One
question to be answered is if RES function might arise from and/or affect these
functions by competition in a similar way alternative splicing proteins do. Data
challenging such a hypothesis is the exceptionally strong affinity between Bud13 and
Snu17 (KD ≈ 5 nM). Purifications also propose that the RES complex is a stable
heterotrimer.
There is one more related protein-peptide complex of interest to us, even though the
binding mode of the peptide is completely different to previously described UHM-ULM
structures. The complex of p14:SF3b155 exhibits what could be called a pseudo-RRM
peptide complex (Figure 5.4.3 A).204 It has been suggested that the binding mode of
p14:SF3b-155 is similar to the Snu17:Pml1 interaction.191 The hypothesis is that the
C-terminal extension of Snu17 creates a binding pocket for the flexible N-terminal of
Pml1. The RRM domain of p14 interacts with the branch point adenosine of intronic
mRNA, but can simultaneously bind a SF3b-155 peptide. Interestingly, this is not
occurring at the ULM site but at the classical RNA site. The SF3b-155 peptide occludes
most of the classical RNA interaction site but does not abrogate RNA binding.204 The
three-dimensional structure of p14 with RNA has not been solved, but RNA binding by
the classical RRM domain of U1A can be used as a model and for comparison (Figure
5.4.3 B-C).205,206 We have only briefly addressed direct RNA binding by the RES
complex, in particular by free Snu17. However, band shift analysis did not reveal any
interaction with an oligonucleotide (5'-AAUUUGUGG-3') (data not shown).
In this respect, it would be of great interest to characterize how Snu17 binds Pml1
further. Our studies of the Snu17:Pml1 interaction are not conclusive, and are not fully
in agreement with biochemical data187 but suggest that the two proteins rather tumble
together in solution. This would require a large interaction surface between the UHM of
Snu17 and the FHA domain in Pml1. If only shorter peptide motifs from either protein
make up the interaction, creating a so-called pearls-on-a-string arrangement, the
HSQC spectra of the complex should be of better quality than they were (Figure
5.3.14). We observe a drastic decrease of most signals from residues in folded
domains. Still, somehow Snu17 is able to bind two proteins at the same time, and it will
most likely be yet another example of a degenerated RRM, which acquired new
structural and functional features.

109
Figure 5.4.3 A peptide motif of SF3b-155 interacts with p14 at the site where RNA binding occurs. β-strands are depicted in blue and α-helices in red. Termini of ligands are labeled. (A) SF3b-155 does not interact with p14 at the ULM binding site (left; 2F9D.pdb), but rather at the RNA binding site which lies across the β-sheet (right). Peptide ligand in cyan. (B) The U1A RRM without any ligand (1OIA.pdb). A C-terminal extension (green) occludes the RNA binding site. (C) Complex structure of U1A RRM with RNA (yellow; 1URN.pdb). The C-terminal extension (green) is flipped out and forms a helix.

110
5.5. Conclusions
RES function is required for splicing of a subfamily of introns, namely those with weak
5' splice sites, as well as for the retention of unspliced pre-mRNA.46 We have reported
ITC and NMR data that confirm binding of Snu17 to Bud13, which are two out of the
three RES subunits. Closer analysis of the binary complex was made possible through
optimization of constructs, buffers and measurements conditions. We suggest that the
interaction is similar but different to known UHM-ULM interactions. In addition to the
central and characteristic tryptophan of the ULM, Bud13 also includes an N-terminal
helix, which increases the affinity. Moreover, sequence analysis and structural
comparison of known complexes highlight features which are particular to the Snu17
UHM and Bud13 ULM. Such differences include electrostatic interactions not expected
in the Snu17:Bud13 complex.
Future work includes spectral analysis and structure calculations of a complex
containing Snu171-113 and Bud1340mer. Based on the three-dimensional structure we
hope to suggest specific mutations confirming the structural model, and which finally
abrogate the interaction in vivo. Hopefully such experiments can support the ongoing
efforts to elucidate the function of the RES complex further, and resolve interaction
details at the molecular level. One important task will be to understand how RES
actually interacts with the pre-mRNA and affects splicing. Biochemical characterization
of the proposed flexible C-terminal of Bud13 may answer these questions.

111
5.6. Materials and Methods
Sample preparation
Several constructs of each protein in the RES complex from Saccharomyces
cerevisiae were expressed, purified and analyzed in this study (Table 5.6.1). Cloning of
all constructs into T7 based expression vectors was done in the laboratory of Herman
van Tilbeurgh. They performed extensive crystallographic trials using these constructs.
For the most important constructs, namely those two used for structural studies, the
sample preparations procedures will be described in detail. Generally, standard
techniques similar to the ones below were used to obtain pure protein samples of all
other constructs. Rich lysogeny broth (LB) medium was used to prepare unlabeled
samples. For NMR samples, 15N or 15N/13C labeled, minimal M9 medium with 15NH4Cl
and 13C-glucose, as its sole nitrogen and carbon source, was utilized. Cultures were
grown in 2H2O in case 2H-labeling was needed.
For protocols see www.helmholtz-muenchen.de/pepf.
Plasmids were sequenced and purified proteins were checked by mass spectrometry
(see Appendix A.2).
Table 5.6.1
Name of Construct Gene Residues a Vector
b Tag
c Cleavable? Comment
Snu17FL
(full-length) Snu17 1-148 pET9 C-His no
Snu171-113
Snu17 1-113 pBS-3256 N-His no Used for structural studies
Snu1725-113
Snu17 25-113 pET28 N-His no Low yield
Snu1725-138
Snu17 25-138 pET28 N-His no Low yield
Bud13FL
(full-length) Bud13 1-266 pET9 C-His no
Bud1360mer
Bud13 201-266 pET9 C-His no
Bud1340mer
Bud13 222-256 pETM30 N-GST yes Used for structural studies
Bud1340mer-His
Bud13 222-256 pETM30 C-His no
Bud13221-242
Bud13 221-242 pETM30 N-GST yes Low yield
Bud13221-239
Bud13 221-239 pETM30 N-GST yes Low yield
Bud13225-242
Bud13 225-242 pETM30 N-GST yes Low yield
Bud13225-239
Bud13 225-239 pETM30 N-GST yes Low yield
Pml1FL
(full-length) Pml1 1-204 pET9 C-His no
Pml124-204
Pml1 24-204 pET9 C-His no
Pml146-204
Pml1 46-204 pET21 C-His no Backbone assigned
a For certain important plasmids the protein sequence and mass spectrometry data are reported in Appendix A.2
b All vectors used kanamycin as their selection marker, except for pET21 which give ampicilin resistance.
c N/C designates a N-terminal or C-terminal tag. The GST tag also include a 6×Histidine-tag for purification.

112
Snu171-113 is poorly expressed at 20°C, but the soluble fraction of the protein could be
used for initial experiments. However, it was recognized that at 37°C a large amount of
protein was available as inclusion bodies. After transformation of the expression
plasmid into E. coli Rosetta (DE3) (Novagen), a single colony was picked from the
kanamycin selection plate for inoculation of a 10 mL overnight pre-culture. 2 mL of the
pre-culture was added to 1 L of pre-heated medium and grown at 37°C (170 rpm) until
OD 0.7 was reached. The culture was induced with 0.5mM IPTG for 4h at constant
temperature. The culture was cooled down and harvested by centrifugation. The pellet
was dissolved in 20 mL of buffer (20 mM TRIS pH 7.5, 300 mM NaCl, 10 mM imidazole,
1 mM DTT 0.02% NaN3, protease inhibitors, RNase, lysozyme and 0.2% IGEPAL) and
sonicated for 5 min while cooling with ice-water (80% power, 50% cycle; UP200s, Dr
Hielscher GmbH). Next, the sample was centrifuged using a two step procedure, 5 min
at 5000 rpm and then 30 min at 20000 rpm. This allow efficient sedimentation of the
high-density inclusion bodies and should give a sample of higher purity. The
supernatant was discarded together with the viscous cell debris, and the whitish pellet
was dissolved in 25 mL 8M urea (pH 7.5). The solution of dissolved inclusion bodies
was applied three times to a gravity column filled with 4 mL of Ni2+-NTA resin (Qiagen)
pre-equilibrated in 8M urea. The protein was then washed using 20 mL 8M urea, 20 mL
4M urea, 20 mL 4M urea + 1M NaCl and, finally, 20 mL 2M urea. The protein was then
eluted using 10 mL Elution buffer (20 mM TRIS pH 7.5, 300 mM NaCl, 300 mM
imidazole, 1 mM DTT and 0.02% NaN3) including 2M urea. To remove the remaining
urea and to refold Snu171-113 the sample was diluted to approximately 150 μM and
dialyzed against the NMR buffer (20 mM sodium phosphate pH 6.9, 150 mM NaCl and
1 mM DTT, 0.02% NaN3). The final sample was exceptionally clean and could be used
without any further purification steps. The yield was usually around 50 mg/L medium.
Due to its instability at high concentrations Snu171-113, the protein could not be kept at
higher concentration than 100μM. If a highly concentrated sample was needed
Snu171-113 had to be complexed to Bud13 before a final concentration step. 10%
DMSO also increased the stability of Snu171-113, up to ~ 250 μM.
In comparison, Bud1340mer was expressed and purified using standard procedures. A 1
L culture was cooled for 20 min before induction with 0.5 mM IPTG over night at 20°C.
This limits the stress on the cells and should increase the amount of soluble protein.
The soluble fraction of Bud1340mer was purified by sonicating the harvested cell pellet in
25mL Lysis buffer (20 mM TRIS pH 7.5, 300 mM NaCl, 10 mM imidazole, 1 mM DTT
and 0.02% NaN3), also including protease inhibitors, RNase, lysozyme and 0.2%
IGEPAL. After high-speed centrifugation and filtering, the supernatant was applied
three times to 3 mL Ni2+-NTA resin. Several rounds of washing (20 mL) were performed,
with: Lysis buffer including 0.2% IGEPAL, Lysis buffer, Lysis buffer with high salt
concentration (1M NaCl), Lysis buffer with high imidazole concentration (30 mM
imidazole). Finally, the protein was eluted by applying 10mL of Elution Buffer. TEV
(tobacco etch virus) protease was added to the sample and incubated overnight at

113
room temperature. A second nickel-column was not used, because most of the cleaved
GST precipitated. The peptide sample was concentrated and further purified by size
exclusion chromatography (HiLoad, Superdex 75 16/60 or 26/60, GE Healthcare). In
this step, the protein was buffer-exchanged into NMR buffer. The final
Snu171-113:Bud1340mer sample was made as follows. Using the theoretical extinction
coefficients the concentrations of the individual proteins were calculated (EXPASY:
Protparam207). To avoid precipitation during high-temperature measurements, the
amounts corresponding to a 1:2.5 ratio of Snu171-113 to Bud1340mer molarity was pooled,
and subsequently concentrated in a 3 kDa MWCO concentrator.
Two shorter peptides of Bud13, Bud1322mer (221-242; ENRFAIMPGSRWDGVHRSNGFE)
and Bud1314mer (225-238; AIMPGSRWDGVHRS), were purchased from Peptide
Specialty Laboratories (Heidelberg, Germany), and extensively dialyzed before usage.
NMR
Many different experiments were recorded to characterize our protein samples,
constructs boundaries, buffer conditions, interaction sites, protein dynamics as well as
the behavior of complexes. All NMR spectra were recorded on Bruker instruments (900,
750 , 600 and 500 MHz) equipped with pulse field gradients, most of them also had
cryo-cooled probe heads. For backbone assignments generally the following
experiments were recorded: 1H,15N HSQC, 1H,13C HSQC, HNCA, HNCACB,
CBCA(CO)NH, (H)CC(CO)NH-TOCSY and 1H,15N HSQC-NOESY.125 Regarding
temperature settings and sample concentrations see each individual spectra. The
recorded data was processed with NMRPipe/ NMRDraw123 and visualized as well as
analyzed in NMRView126 (v5.0.4) and NMRViewJ (v8.0). Most spectra for figures were
exported directly from Topspin v2.1 (Bruker). Secondary chemical shifts were used to
validate assignments.128 Protein backbone dynamics were studied by {1H}-15N
heteronuclear NOE experiments, as described previously.137 Errors were estimated as
the standard deviation of the noise and propagated accordingly for each resonance.
Hydrogen/Deuterium-exchange were recorded after lyophilization of the protein sample
and the subsequent addition of 2H2O. The measurements were carried out at 293K and
308K for ligand-free Snu171-113 and the complex, respectively.
ITC
Isothermal titration calorimetry (ITC) was used to measure the affinity between
Snu171-113 and different Bud13 constructs. Most of the measurements were performed
with a VP-ITC (MicroCal Inc.) at 25°C using proteins samples in NMR buffer (see the
purification protocols). The concentration of Snu171-113 in the cell (1440 μL) varied
between 30-70 μM, while the syringe (300 μL) contained the ligands at concentrations
ranging from 0.6 to 1.1 mM. Normally 40-80 injections were done over a period of 3-4
hours. To estimate the heat of dilution, the ligands were also injected into buffer. The
result was then subtracted from the original measurement. The analysis of the ITC
114
data was done in Origin v7, according to the recommendations of the manufacturer.
The experimental values are given ± fitting error.
Thermoflour assay
A thermoflour assay was used to characterize the stability of Snu171-113 with and
without a ligand, as well as in different buffer conditions.208 In brief, a fluorophore that
change emission spectra upon interaction with hydrophobic residues is added to the
sample. Upon thermal unfolding the hydrophobic core of the protein will be exposed
and this process can be follow with a real-time PCR machine (Stratagene Mx3005P,
Agilent Technologies Inc.). 50 μL reactions of a wide range of buffers (varying salt and
pH) were setup, including: 10 or 20 μM protein, 5x of SYPRO-orange (5000x stock;
Sigma-Aldrich). The assays were started at 25°C and heated with 3°C/min. Ligand
induced stability were tested by adding a four-fold amount of peptide.
Homology modeling and sequence alignments
A homology model of the UHM domain of Snu17 was built for mapping of chemical
shift perturbations induced by titrations of ligands. The model was created using the
free form of SPF45 (2pe8.pdb; 22.5% sequence identity) as a template and the web-
based server of HHpred.209 The backbone of the homology model was colored, for
example to display chemical shift changes, by modifying the B-factor column of the
pdb-file. The color bins were modified manually to give a reasonable appearance,
meaning that very strong perturbations often were scaled down. Superposition of
proteins structures were done in Pymol210, which also was used for rendering pictures.
Secondary structure definitions were taken from the pdb-files or calculated by the
DSSP-based211 algorithm implemented in Pymol.
Multiple sequence alignments were done in ClustalX v2.0.212 Sequences used were
downloaded from Uniprot. Accession codes are given in the alignments. Homologs for
Snu17 and Bud13 in higher eukaryotes were found in the literature and using PSI-
BLAST at EMBL-EBI (www.ebi.ac.uk).45,174
Mutational studies
Mutational studies of Snu17 and Bud13 were performed in the laboratory of Bertrand
Séraphin (IGBMC, Paris). Mutants were suggested together with Mark Brooks, and
were analyzed regarding their ability to form the complex when proteins were
co-expressed, as well as in a growth phenotype assays. A number of single to
quadruple mutants were designed to abrogate the interaction between Snu17 and
Bud13. In short, for the co-expression assay site directed mutagenesis was directly
performed on a available His-Snu17-Bud13-Pml1 operon. After expression in E. coli
purification of the complex was done using the His-tag. A complementation assay of
certain TAP-tagged mutants was performed in ∆Snu17 and ∆Bud13 yeast deletion
strains to study growth at various temperatures (25, 30 and 37°C). The TAP-tag was
used to control expression levels of mutant protein.

115
6. Chapter 6
Additional collaborations
During my thesis I had the opportunity to join and develop many collaborations. These
projects, ranging from drug development to basic biochemical research, are briefly
presented and discussed. The projects have been completed if not stated otherwise.
6.1. Induction of apoptosis: Evaluation of a potential inhibitor
A collaboration with: Prof. Dr. Angelika Vollmar, Pharmaceutical Biology, LMU, Munich.
X-linked inhibitor of apoptosis protein (XIAP) is an important regulator of controlled cell
death, and includes amongst others three Baculovirus IAP Repeat (BIR) domains.213
XIAP inhibits apoptosis by binding caspases via its BIR domains. In particular,
caspase-9 has been shown to interact with, and to be regulated by, BIR-3.214 The
rationale to develop molecules that bind BIR-3 is, that an induced release and
activation of caspase 9 could result in apoptosis. Such compounds could therefore be
used as an antitumor treatment. A drug candidate (T8) to modify the BIR-3/caspase-9
interaction had been developed using in silico methods, and provided the anticipated
effect in in vivo experiments. In such experiments cultured cells were sensitized to
etoposide, a known chemotherapeutic.
However, evidence on the molecular mechanism, whether the molecules actually
interacted with BIR-3 or not, was missing. To resolve this question, we expressed and
purified 15N labeled samples of the BIR-2 and BIR-3 domains of human XIAP. Ligand
binding was then analyzed by ligand titrations followed by consecutive acquisition of
2D 1H,15N HSQC spectra. Based on the results, it was clear that T8 did not specifically
interact with either BIR domain (Figure 6.1.1). A known ligand of BIR3 was used as a
positive control, and induced the expected chemical shift perturbations, indicating
binding. Thus, the sensitizing effect observed in the in vivo experiments, must have
been caused by another process in the cells, modulated by the compound.

116
Figure 6.1.1 Ligand titrations of a putative binder to XIAP (BIR-3 domain). The reference spectrum (green) was recorded on a 100μM
15N labeled sample. At a ratio of 1:3 protein to ligand concentration
with T8 (left, red spectrum), no chemical shift perturbations could be observed. In contrast, this was the case for a positive control at 1:1 (right, red spectrum ; ABT-11
215 from Abbott Laboratories). 5% DMSO
was used in both experiments to increase ligand solubility.
6.2. Proposed interaction between viral LMP1 and human TRADD
A collaboration with: PD Dr. Arnd Kieser, Department of Gene Vectors, HMGU, Munich.
To hide from the human immune system, the Epstein-Barr virus (EBV) infects and
transforms B-cells. This process makes the B-cells immortal, which in some patients
can lead to development of certain types of tumors. The viral Latent Membrane Protein
1 (LMP1) is one of the key players orchestrating the manipulation of gene expression
in the host cell, and is therefore interesting from a therapeutic point of view.216 In
particular, LMP1 had been proposed to interact with the human Tumor Necrosis Factor
α Receptor Associated Death Domain (TRADD) protein. In uninfected cells, TRADD is
important for signaling during proliferation, as well as in progression of cell death. The
interaction had been suggested to take place between the flexible and intracellular
C-terminal domain of LMP1, and the N-terminal domain of TRADD.217
We expressed and purified several different constructs of LMP1 and TRADD, and
studied the suggested interaction by NMR, ITC and analytical size exclusion
chromatography (SEC) (Figure 6.2.1). In summary, our in vitro data show that, at best
there is a very weak and unspecific interaction between those proteins. One possibility
is that the interaction might be mediated by additional factors in vivo.
This project was the Bachelor's thesis of Christoph Hartlmüller (TUM Biochemistry,
2009).

117
Figure 6.2.1 Interaction studies of viral LMP1 and human TRADD. (A) Ligand titration of a C-terminal LMP1 peptide (20mer) to
15N labeled TRADD
1-194. Blue spectrum is a
1H,
15N HSQC reference spectrum
of 100μM TRADD1-194
. Red spectrum is recorded at a ratio of 1:3, protein to ligand concentration. There are no chemical shift changes observed, indicating that there is no interaction between the LMP1 peptide and TRADD (B) Analytical size exclusion chromatography of individual proteins and of the putative complex. The red chromatogram shows that if mixed, the proteins still elute at volumes expected for them individually, again, indicating at best a very weak interaction.
B
A

118
6.3. Elucidation of a novel structural domain in EBNA-2
A collaboration with: Dr. Bettina Kempkes, Institute of Clinical and Molecular Biology,
HMGU, Munich.
Epstein-Barr virus nuclear antigen 2 (EBNA-2) is a transcriptional co-activator essential
for induction and maintenance of an EBV infection.218 We have cloned, expressed and
purified a domain from EBNA-2 which shows no sequence homology to any known
protein. Previously, this part of the EBNA-2 protein has been described to be involved
in the initial transformation of B-cells, as shown by functional assays.
Preliminary characterization indicates a folded domain with short flexible termini. The 1H,15N HSQC spectrum is well dispersed, and a complete set of triple resonance
spectra for backbone/sidechain assignment have been recorded, as well as several
NOESY spectra (Figure 6.3.1). The data is to be analyzed in the near future and used
for structure determination. The structure will then be validated by mutational analysis.
Furthermore, to extend the knowledge on the function of this domain, we will use the
obtained information in in vivo assays.
Figure 6.3.1 Initial NMR analysis of an EBNA-2 fragment. (A) 1H,
15N HSQC and (B)
1H homonuclear
2D NOESY of a novel structural domain in EBNA-2. Both spectra indicate a folded domain and were recorded on a 300 μM
15N labeled sample.
B
A

119
6.4. Confirming inhibitors of Bcl-xl
A collaboration with: Dr. Thorsten Berg, Chemical Biology, MPI Biochemistry, Munich.
The aim of the project was to investigate the binding of small-molecule inhibitors to
Bcl-xl. Bcl-xl is involved in regulation of apoptosis, programmed cell-death.108
Apoptosis-related pathways, and modulation thereof, are highly attractive targets in
oncology research. Several compounds had previously been identified in a peptide
displacement assay using fluorescence polarization.
The binding of three compounds to Bcl-xl was confirmed by NMR, and their interaction
sites were mapped onto the known structure of Bcl-xl (Figure 6.4.1). The molecules are
expected to bind in the same site as known endogenous binders, i.e. peptides.219
Furthermore, the strength of the interactions were estimated by ligand titrations. See
Chapter 3 for details on such an analysis.
Figure 6.4.1 Example of an inhibitor interacting with Bcl-xl. (A) Overlay of 1H,
15N HSQC spectra
recorded at increasing amounts of the ligand. The endpoint was at a 1:4 ratio of protein to ligand concentration. (B) The observed chemical shift changes of several residues were fitted to a one-binding site equation, giving an approximation of the KD to 50μM. (C) Chemical shift changes at a fourfold excess of the ligand mapped onto the structure of Bcl-xl (1LXL.pdb) using available backbone assignments. Red - major perturbations (> 0.1 ppm); Orange - minor perturbations (0.02-0.1 ppm); Green - no (< 0.02 ppm), or inconclusive perturbations. (D) The closest distance between a ligand (ABT-737
219; 2YXJ.pdb) and the backbone amides of the apoprotein (1MAZ.pdb) is plotted onto the structure
of the latter. Red < 3 Å; Orange 3-5 Å; Yellow 5-7 Å; Light purple > 7 Å. Peptide is shown in cyan. Please note, how our inhibitor induces chemical shift changes in equivalent areas, as where ABT-737 would be expected to. This analysis suggest that the ligand binds in the same site as ABT-737
219.
B A
D C

120
6.5. STD NMR: Interaction of STAT5b with a putative ligand
A collaboration with: Dr. Thorsten Berg, Chemical Biology, MPI Biochemistry, Munich.
NMR analysis of high molecular weight targets is challenging, since the slow tumbling
of a large molecule leads to fast relaxation of the NMR signal. This makes
characterization of large complexes difficult. However, for a small exchanging ligand, it
is possible to observe the slow decaying NMR signal of its unbound form. This is one
of the ideas behind saturation transfer difference NMR (STD NMR).135 STD NMR is a
fast and reliable technique that only needs small amounts of non-labeled material.
In STD NMR, the protein, for example a receptor, is saturated using a series of pulses
directed at a region of the chemical shift range, where the ligand has no resonances.
This saturation spreads through the protein by spin diffusion and also to any ligand that
might interact with the protein. The technique basically measures the difference
between two consecutive measurements, with and without saturation. Importantly, this
results in a spectrum similar to a normal 1D, only if there was an interaction taking
place between the protein and the ligand.
STAT5b is a 90 kDa transcription factor that can be phosphorylated by receptor
tyrosine kinases, and therefore important in transforming molecular signals into
changes in gene expression.220 A ligand to STAT5b had been identified in the
laboratory of our collaborator, using a peptide displacement screen and fluorescence
polarization. To confirm binding we performed STD NMR, in a D2O-based buffer to
enhance signal to noise. The sample contained 20μM STAT5b and 1mM ligand (1:50).
Our NMR data confirms binding, and suggest that the ligand is interacting with STAT5b
in a hydrophobic manner via its aromatic system (Figure 6.5.1).
Figure 6.5.1 STD NMR of STAT5b with different compounds. (A) Red - Standard 1D of STAT5b and the of ligand of interest. Blue - STD spectrum of the same sample, showing STD signals for the compound (~8 ppm), but not for the buffer molecule (TRIS; ~4 ppm). The tested ligand binds. (B) STD spectra of STAT5b with other compounds. Magenta - Glucose (no interaction); Green - Tryptophan (interacts mostly with its aromatic protons, and less with Hα/Hβ; by comparison of the intensities); Red - Molecule with a similar structure as the tested ligand (binding observed); Blue - Same as (A). Protein signals are observable in the background, since the protein always is saturated. (a.i. - arbitrary intensity)

121
6.6. Protein chemistry: Ligation of a modified peptide to SMN
A collaboration with: Prof. Dr. Christian Becker, Protein Chemistry, TUM, Munich.
The Tudor domain of human Survival of motor neuron (SMN) was one of the first
domains of its kind to be characterized to bind methylated arginines (see Chapter
3).221,222 However, the interaction of SMN to a single sDMA is relatively weak, with a KD
in the high micromolar range. This has hampered the structural determination of such a
complex. To overcome this, we teamed up with Prof. Becker to ligate a short peptide
comprising one sDMA to the C-terminus of SMN. The idea was to improve the
apparent affinity of sDMA and, thereby facilitating structural characterization of the
complex. The peptide was synthesized in-house and ligated to SMN prepared from a
special intein-containing vector.223
Initial analysis of the ligated product by NMR has shown that the expected amide
resonances of the SMN Tudor domain are perturbed (Figure 6.6.1). When plotted onto
the structure of SMN Tudor, it is clear that the chemical shift changes localize to the
described binding site, known as the aromatic cage. Furthermore, we have shown that
the perturbations are highly similar to those observed when SMN is titrated with free
sDMA.222 This project is still ongoing, however, before continuing structural
characterization of the ligated SMN Tudor, we need to improve the yield of the ligation
reaction, as well as sample purity.
Figure 6.6.1 Mapping of induced chemical shifts changes upon ligation of a sDMA-containing peptide to SMN. (A)
1H,
15N-HSQC spectra of non-ligated (red) and ligated SMN Tudor (green). (B) The
chemical shift changes mapped onto the structure of SMN Tudor (1MHN.pdb). The characterized binding site, the so-called "aromatic cage" is highlighted as sticks. Red - major perturbations (> 0.1 ppm); Orange - minor perturbations (0.02-0.1 ppm); Green - no (< 0.02 ppm), or inconclusive perturbations.
B A

122

123
1. Acknowledgements
Where to start?! The last four years has truly been an exciting period of my life, of course with
a lot of ups and downs, but in the end very, very rewarding. I've have learnt and experienced
things I wouldn't have dreamt about during my studies, and you might know that I never
planned to do a PhD, or to move abroad. My PhD studies has definitely been a lucky draw for
me.
First and foremost my thanks and gratefulness goes to Michael Sattler. Thanks for the
opportunity you gave me, and the for interesting projects to take part of. As usual in science (I
know by now), many things that we tried and put our hopes to didn't succeed, but all in all I'm
really satisfied with what we accomplished. And the struggle is part of the learning process, I
hope...
Additionally, I want to mention all the collaborators who have contributed with their knowledge
and data to our joint projects. I’m very grateful to the following people and their dedicated co-
workers: Deirdre Scadden (University of Cambridge, Great Britain), Bertrand Séraphin (CGM,
Gif-Sur-Yvette, France), Herman van Tilbeurgh (IBBMC, Orsay, France), Jürg Müller (EMBL,
Heidelberg), Bettina Kempkes (HMGU, Munich), Arnd Kieser (HMGU, Munich), Angelika
Vollmar (LMU Munich), Thorsten Berg (MPI Munich), Michael Groll (TUM, Munich) and
Christian Becker (TUM, Munich).
What would the days in the lab have been without my dear colleagues? Just darn boring! Often
feels like you by now belong to my extended family. I guess it comes from sharing so many
tough days, and then having the contrast in the moments when things actually work out. Still, it
might also be due to all nice (late) parties, dinners, trips and all the fun stuff going outside of
the institute… Isn’t it so, that the best thing sometimes, is to close the door to the lab, go for a
beer, and then come back and try again? Well, ok maybe not the same day...
Thanks to all the guys at EMBL Heidelberg, where it all started in 2006. Gunther and Alex for
giving me a kick-start in protein expression and purification. Fabi, Cameron, Lorenzo, Malgosia,
Fred, Johanna for introducing me to the nightlife of HD! Bernd being there when the NMR
instruments didn’t understand me… or was it vice versa? Anna, thanks for sharing your Tudor
project with me and, let's see when they find the real ligand? What haven't we tried,
methylated DNA? Or, why not a combination of acetylated, phosphorylated and ubiquitinated
H2A tails? Too expensive?!
Additionally, the rest of the HD people; Predocs of 2006 (and any other year!), Ivonne,
Aga/Sebastian, WG-people – thanks to you all for making it such a great year!
Once in Munich it took some time to get settled, but luckily I, through fantastic coincidences
came across my superb flat – Herzlichen Dank an Tanja, und die Familie Werner! I’m not sure
if I’ll ever live in a flat with a pool on the roof ever again…
Also, I want to express my gratitude to the people that made me feel so at home in this great
city: Tamara and Miriam, for teaching me some Bavarian expressions. The Church crew (Alex,
Feli, Nena, Sebastian, Florian, Til and the rest in Christkönig) for enjoying good food in
Ristorante Italy. The Taizè people (Barbara, Berna, Rita, Anke – just so great that we by
chance (?) ended up in that same cinema, my very first evening in Munich). Choir members of
The Changing Voices, in particular Iris, Anke, Vanessa and Maren, one more concert to go!
Lars-Anders – how big is the chance to meet an old classmate under such circumstances?
Vera, for enjoying intense, and late, clubbing events, as much as me.

124
The graduate programs of ENB and HMGU have been very valuable to me. All people of ENB,
thanks for arranging interesting workshops and retreats, but particularly for the great interest in
the combination of science and friendship.
I’m very much in dept to the people of the Sattler lab, thanks for always helping out, and all the
social behavior ;) Would probably be a dream (?) come true of any sociologist, to study this
(international) group and its dynamics. My deepest gratefulness to all of you, hope to invite you
soon to Sweden, or whatever country I may end up in. Just send me an e-mail a couple of
days beforehand.
Postdocs: Fatiha, Kostas, Thomas, Toby, Iren (and Andre!) thanks for helping out when things
got more tricky than expected. Toby, especially, for keeping track of the pulse programs.
Kostas, for sharing the interest in Tudors. Fatiha - I'll call from anywhere if I have questions on
relaxation, or for a good cake recipe! Thomas, for bringing a great party mood and fast-
pulsing :) Iren, is there more Asian cakes and snacks to try, or have we had them all?
Gerd and Rainer, for hardware/software - it wouldn't work with out you! (and for every now and
then bringing stories about strange far-away countries into our coffee room) Waltraud, when is
my contract finishing again!? :) Sorry for knocking your door so often, asking all those small
annoying questions.
Predocs (I like that word) of the Sattler lab: It was always fun sharing the agony of protein
purifications, and the setting-up of probably-not-successful NMR-experiments with you. Irina
and Alex, my Russian is still not that good, but maybe some day I'll understand what Alex is
talking about on the phone. Divita, how many times didn't that smile help me out. Don't stop -
bring it on! Uli - thanks for enjoying electronica clubs and bringing me along, and that you
choose to join the ENB as well... Sports was sort of missing in our (work) schedule, Hamed,
thanks for never turning down the football/volleyball/ping pong opportunities. Elke, thanks for
the exchange of ideas on job and outside-of-lab issues. Yun - I will never for get the day you
first joined the lab, and just after a couple of hours, sat with a Maß on Octoberfest. A great
start in Germany!? Helge - this bittersweet wit you possess, fantastic! Will we see you in
Lederhosen this year? Or, maybe it is rather for the Karneval? ;) The dames of the Dames' lab:
Diana and Lisa, thanks for all the fun of internationality. Giambattista - associated Predoc? - an
Italian wanting to leave Italy, it's not every day you meet one... Thanks for your never-ending
interest in history (and Vikings!!), and the personal delivery of Mozzarella di Bufala. Johannes
(and Miriam), I really liked our relaxed Sundays, with walks in the Englischer Garten and
extended café sessions.
My appreciation also goes to the gate-keepers of the Garching lab, Gülden, Peijian and Steffi,
as well as to our alumnus Serge. For your efforts to run the lab smoothly despite, our (not
mine!!) forgotten flasks and falcons. Similarly, Arie, Ana and Heike, in the HMGU site,
however, will you manage to steam that cappuccino milk without me...
A special thanks goes to André, for sharing many great moments in pubs, streets, labs and so
on. Dr Wittek- Mourão, all the best with family life - and I hope to meet up with you, Mariola and
David in Portugal in the near future!
To all of my friends in Sweden, I remember all your visits with warmth, as well as the intense
weeks of holiday spent with you back home. My brothers in arms, David and Erik, when was
the last time we spent a boring weekend somewhere? Kram på er!
And finally, above all, my deepest gratitude to mamma och pappa and Staffan, back in
Stockholm. No words are enough. Thanks for love, your support and all encouragements.

125
2. References
1. Crick F (1970) Central dogma of molecular biology. Nature 227:561-563. 2. Sourjik V, Armitage JP (2010) Spatial organization in bacterial chemotaxis. EMBO J 29:2724-2733. 3. Pera MF, Tam PP (2010) Extrinsic regulation of pluripotent stem cells. Nature 465:713-720. 4. Clapier CR, Cairns BR (2009) The biology of chromatin remodeling complexes. Annu Rev
Biochem 78:273-304. 5. Fullwood MJ, Liu MH, Pan YF, Liu J, Xu H, Mohamed YB, Orlov YL, Velkov S, Ho A, Mei PH,
Chew EG, Huang PY, Welboren WJ, Han Y, Ooi HS, Ariyaratne PN, Vega VB, Luo Y, Tan PY, Choy PY, Wansa KD, Zhao B, Lim KS, Leow SC, Yow JS, Joseph R, Li H, Desai KV, Thomsen JS, Lee YK, Karuturi RK, Herve T, Bourque G, Stunnenberg HG, Ruan X, Cacheux-Rataboul V, Sung WK, Liu ET, Wei CL, Cheung E, Ruan Y (2009) An oestrogen-receptor-alpha-bound human chromatin interactome. Nature 462:58-64.
6. Probst AV, Dunleavy E, Almouzni G (2009) Epigenetic inheritance during the cell cycle. Nat Rev Mol Cell Biol 10:192-206.
7. Breiling A, Sessa L, Orlando V (2007) Biology of polycomb and trithorax group proteins. Int Rev Cytol 258:83-136.
8. Bracken AP, Helin K (2009) Polycomb group proteins: navigators of lineage pathways led astray in cancer. Nat Rev Cancer 9:773-784.
9. Pietersen AM, van Lohuizen M (2008) Stem cell regulation by polycomb repressors: postponing commitment. Curr Opin Cell Biol 20:201-207.
10. Cheng X, Blumenthal RM (2008) Mammalian DNA methyltransferases: a structural perspective. Structure 16:341-350.
11. Klose RJ, Bird AP (2006) Genomic DNA methylation: the mark and its mediators. Trends Biochem Sci 31:89-97.
12. Amir RE, Van den Veyver IB, Wan M, Tran CQ, Francke U, Zoghbi HY (1999) Rett syndrome is caused by mutations in X-linked MECP2, encoding methyl-CpG-binding protein 2. Nat Genet 23:185-188.
13. Duszczyk MM, Zanier K, Sattler M (2008) A NMR strategy to unambiguously distinguish nucleic acid hairpin and duplex conformations applied to a Xist RNA A-repeat. Nucleic Acids Res 36:7068-7077.
14. Zhao J, Sun BK, Erwin JA, Song JJ, Lee JT (2008) Polycomb proteins targeted by a short repeat RNA to the mouse X chromosome. Science 322:750-756.
15. Campos EI, Reinberg D (2009) Histones: annotating chromatin. Annu Rev Genet 43:559-599. 16. Clayton AL, Hazzalin CA, Mahadevan LC (2006) Enhanced histone acetylation and transcription:
a dynamic perspective. Mol Cell 23:289-296. 17. Nekrasov M, Klymenko T, Fraterman S, Papp B, Oktaba K, Kocher T, Cohen A, Stunnenberg HG,
Wilm M, Muller J (2007) Pcl-PRC2 is needed to generate high levels of H3-K27 trimethylation at Polycomb target genes. EMBO J 26:4078-4088.
18. Sanders SL, Portoso M, Mata J, Bahler J, Allshire RC, Kouzarides T (2004) Methylation of histone H4 lysine 20 controls recruitment of Crb2 to sites of DNA damage. Cell 119:603-614.
19. Choi JK, Kim YJ (2009) Implications of the nucleosome code in regulatory variation, adaptation and evolution. Epigenetics 4:291-295.
20. Cairns BR, Lorch Y, Li Y, Zhang M, Lacomis L, Erdjument-Bromage H, Tempst P, Du J, Laurent B, Kornberg RD (1996) RSC, an essential, abundant chromatin-remodeling complex. Cell 87:1249-1260.
21. Whitehouse I, Flaus A, Cairns BR, White MF, Workman JL, Owen-Hughes T (1999) Nucleosome mobilization catalysed by the yeast SWI/SNF complex. Nature 400:784-787.
22. Durand-Dubief M, Persson J, Norman U, Hartsuiker E, Ekwall K (2010) Topoisomerase I regulates open chromatin and controls gene expression in vivo. EMBO J.
23. Lodish H, Berk A, Kaiser C, Krieger M, Scott M, Bretscher A, Ploegh H, Matsudaira P. (2007). Molecular Cell Biology. Chp. 11, 447-454. 5th edit, W. H. Freeman.
24. Cramer P (2010) Towards molecular systems biology of gene transcription and regulation. Biol Chem.

126
25. Cramer P, Bushnell DA, Fu J, Gnatt AL, Maier-Davis B, Thompson NE, Burgess RR, Edwards AM, David PR, Kornberg RD (2000) Architecture of RNA polymerase II and implications for the transcription mechanism. Science 288:640-649.
26. Roeder RG (1996) The role of general initiation factors in transcription by RNA polymerase II. Trends Biochem Sci 21:327-335.
27. Phatnani HP, Greenleaf AL (2006) Phosphorylation and functions of the RNA polymerase II CTD. Genes Dev 20:2922-2936.
28. Cramer P, Armache KJ, Baumli S, Benkert S, Brueckner F, Buchen C, Damsma GE, Dengl S, Geiger SR, Jasiak AJ, Jawhari A, Jennebach S, Kamenski T, Kettenberger H, Kuhn CD, Lehmann E, Leike K, Sydow JF, Vannini A (2008) Structure of eukaryotic RNA polymerases. Annu Rev Biophys 37:337-352.
29. Dengl S, Cramer P (2009) Torpedo nuclease Rat1 is insufficient to terminate RNA polymerase II in vitro. J Biol Chem 284:21270-21279.
30. Rondon AG, Mischo HE, Kawauchi J, Proudfoot NJ (2009) Fail-safe transcriptional termination for protein-coding genes in S. cerevisiae. Mol Cell 36:88-98.
31. West S, Proudfoot NJ (2009) Transcriptional termination enhances protein expression in human cells. Mol Cell 33:354-364.
32. Laurencikiene J, Kallman AM, Fong N, Bentley DL, Ohman M (2006) RNA editing and alternative splicing: the importance of co-transcriptional coordination. EMBO Rep 7:303-307.
33. Moore MJ, Proudfoot NJ (2009) Pre-mRNA processing reaches back to transcription and ahead to translation. Cell 136:688-700.
34. Mayr B, Montminy M (2001) Transcriptional regulation by the phosphorylation-dependent factor CREB. Nat Rev Mol Cell Biol 2:599-609.
35. Ramji DP, Foka P (2002) CCAAT/enhancer-binding proteins: structure, function and regulation. Biochem J 365:561-575.
36. Bjorklund S, Gustafsson CM (2005) The yeast Mediator complex and its regulation. Trends Biochem Sci 30:240-244.
37. Koschubs T, Lorenzen K, Baumli S, Sandstrom S, Heck AJ, Cramer P (2010) Preparation and topology of the Mediator middle module. Nucleic Acids Res 38:3186-3195.
38. Garneau NL, Wilusz J, Wilusz CJ (2007) The highways and byways of mRNA decay. Nat Rev Mol Cell Biol 8:113-126.
39. Coller J, Parker R (2004) Eukaryotic mRNA decapping. Annu Rev Biochem 73:861-890. 40. Goldstrohm AC, Wickens M (2008) Multifunctional deadenylase complexes diversify mRNA
control. Nat Rev Mol Cell Biol 9:337-344. 41. Houseley J, LaCava J, Tollervey D (2006) RNA-quality control by the exosome. Nat Rev Mol Cell
Biol 7:529-539. 42. Lorentzen E, Conti E (2005) Structural basis of 3' end RNA recognition and exoribonucleolytic
cleavage by an exosome RNase PH core. Mol Cell 20:473-481. 43. Conti E, Izaurralde E (2005) Nonsense-mediated mRNA decay: molecular insights and
mechanistic variations across species. Curr Opin Cell Biol 17:316-325. 44. Wahl MC, Will CL, Luhrmann R (2009) The spliceosome: design principles of a dynamic RNP
machine. Cell 136:701-718. 45. Bessonov S, Anokhina M, Will CL, Urlaub H, Luhrmann R (2008) Isolation of an active step I
spliceosome and composition of its RNP core. Nature 452:846-850. 46. Dziembowski A, Ventura AP, Rutz B, Caspary F, Faux C, Halgand F, Laprevote O, Seraphin B
(2004) Proteomic analysis identifies a new complex required for nuclear pre-mRNA retention and splicing. EMBO J 23:4847-4856.
47. Yang J, Valineva T, Hong J, Bu T, Yao Z, Jensen ON, Frilander MJ, Silvennoinen O (2007) Transcriptional co-activator protein p100 interacts with snRNP proteins and facilitates the assembly of the spliceosome. Nucleic Acids Res 35:4485-4494.
48. Kramer A (1996) The structure and function of proteins involved in mammalian pre-mRNA splicing. Annu Rev Biochem 65:367-409.
49. Smith DJ, Query CC, Konarska MM (2008) "Nought may endure but mutability": spliceosome dynamics and the regulation of splicing. Mol Cell 30:657-666.
50. Lin S, Coutinho-Mansfield G, Wang D, Pandit S, Fu XD (2008) The splicing factor SC35 has an active role in transcriptional elongation. Nat Struct Mol Biol 15:819-826.
51. Chen M, Manley JL (2009) Mechanisms of alternative splicing regulation: insights from molecular and genomics approaches. Nat Rev Mol Cell Biol 10:741-754.
52. Guo W, Bharmal SJ, Esbona K, Greaser ML (2010) Titin diversity--alternative splicing gone wild. J Biomed Biotechnol 2010:753675.

127
53. Kishore S, Stamm S (2006) The snoRNA HBII-52 regulates alternative splicing of the serotonin receptor 2C. Science 311:230-232.
54. Corsini L, Bonnal S, Basquin J, Hothorn M, Scheffzek K, Valcarcel J, Sattler M (2007) U2AF-homology motif interactions are required for alternative splicing regulation by SPF45. Nat Struct Mol Biol 14:620-629.
55. Wang ET, Sandberg R, Luo S, Khrebtukova I, Zhang L, Mayr C, Kingsmore SF, Schroth GP, Burge CB (2008) Alternative isoform regulation in human tissue transcriptomes. Nature 456:470-476.
56. Zhang Z, Lotti F, Dittmar K, Younis I, Wan L, Kasim M, Dreyfuss G (2008) SMN deficiency causes tissue-specific perturbations in the repertoire of snRNAs and widespread defects in splicing. Cell 133:585-600.
57. Mauger DM, Lin C, Garcia-Blanco MA (2008) hnRNP H and hnRNP F complex with Fox2 to silence fibroblast growth factor receptor 2 exon IIIc. Mol Cell Biol 28:5403-5419.
58. Feng Y, Chen M, Manley JL (2008) Phosphorylation switches the general splicing repressor SRp38 to a sequence-specific activator. Nat Struct Mol Biol 15:1040-1048.
59. Le Hir H, Seraphin B (2008) EJCs at the heart of translational control. Cell 133:213-216. 60. Proudfoot N (2000) Connecting transcription to messenger RNA processing. Trends Biochem Sci
25:290-293. 61. Jepson JE, Reenan RA (2008) RNA editing in regulating gene expression in the brain. Biochim
Biophys Acta 1779:459-470. 62. Ohman M (2007) A-to-I editing challenger or ally to the microRNA process. Biochimie 89:1171-
1176. 63. Iizasa H, Wulff B-E, Alla NR, Maragkakis M, Megraw M, Hatzigeorgiou A, Iwakiri D, Takada K,
Wiedmer A, Showe L, Lieberman P, Nishikura K Editing of EBV-encoded BART6 microRNAs controls their dicer targeting and consequently affects viral latency. Journal of Biological Chemistry.
64. Li CL, Yang WZ, Chen YP, Yuan HS (2008) Structural and functional insights into human Tudor-SN, a key component linking RNA interference and editing. Nucleic Acids Res 36:3579-3589.
65. Scadden AD (2005) The RISC subunit Tudor-SN binds to hyper-edited double-stranded RNA and promotes its cleavage. Nat Struct Mol Biol 12:489-496.
66. Decher N, Streit AK, Rapedius M, Netter MF, Marzian S, Ehling P, Schlichthorl G, Craan T, Renigunta V, Kohler A, Dodel RC, Navarro-Polanco RA, Preisig-Muller R, Klebe G, Budde T, Baukrowitz T, Daut J (2010) RNA editing modulates the binding of drugs and highly unsaturated fatty acids to the open pore of Kv potassium channels. EMBO J 29:2101-2113.
67. Ohlson J, Pedersen JS, Haussler D, Ohman M (2007) Editing modifies the GABA(A) receptor subunit alpha3. RNA 13:698-703.
68. Schoft VK, Schopoff S, Jantsch MF (2007) Regulation of glutamate receptor B pre-mRNA splicing by RNA editing. Nucleic Acids Res 35:3723-3732.
69. Scadden AD, Smith CW (2001) RNAi is antagonized by A-->I hyper-editing. EMBO Rep 2:1107-1111.
70. Nishikura K (2006) Editor meets silencer: crosstalk between RNA editing and RNA interference. Nat Rev Mol Cell Biol 7:919-931.
71. Yang W, Chendrimada TP, Wang Q, Higuchi M, Seeburg PH, Shiekhattar R, Nishikura K (2006) Modulation of microRNA processing and expression through RNA editing by ADAR deaminases. Nat Struct Mol Biol 13:13-21.
72. Kawahara Y, Zinshteyn B, Sethupathy P, Iizasa H, Hatzigeorgiou AG, Nishikura K (2007) Redirection of silencing targets by adenosine-to-inosine editing of miRNAs. Science 315:1137-1140.
73. Athanasiadis A, Rich A, Maas S (2004) Widespread A-to-I RNA editing of Alu-containing mRNAs in the human transcriptome. PLoS Biol 2:e391.
74. Chen LL, DeCerbo JN, Carmichael GG (2008) Alu element-mediated gene silencing. EMBO J 27:1694-1705.
75. Batzer MA, Deininger PL (2002) Alu repeats and human genomic diversity. Nat Rev Genet 3:370-379.
76. Martinez HD, Jasavala RJ, Hinkson I, Fitzgerald LD, Trimmer JS, Kung HJ, Wright ME (2008) RNA editing of androgen receptor gene transcripts in prostate cancer cells. J Biol Chem 283:29938-29949.
77. Strambio-De-Castillia C, Niepel M, Rout MP (2010) The nuclear pore complex: bridging nuclear transport and gene regulation. Nat Rev Mol Cell Biol 11:490-501.
78. Kohler A, Hurt E (2007) Exporting RNA from the nucleus to the cytoplasm. Nat Rev Mol Cell Biol 8:761-773.

128
79. Huang Y, Steitz JA (2005) SRprises along a messenger's journey. Mol Cell 17:613-615. 80. Galy V, Gadal O, Fromont-Racine M, Romano A, Jacquier A, Nehrbass U (2004) Nuclear retention
of unspliced mRNAs in yeast is mediated by perinuclear Mlp1. Cell 116:63-73. 81. Bolinger C, Boris-Lawrie K (2009) Mechanisms employed by retroviruses to exploit host factors for
translational control of a complicated proteome. Retrovirology 6:8. 82. Akhtar A, Gasser SM (2007) The nuclear envelope and transcriptional control. Nat Rev Genet
8:507-517. 83. Ahmed S, Brickner JH (2007) Regulation and epigenetic control of transcription at the nuclear
periphery. Trends Genet 23:396-402. 84. Besse F, Ephrussi A (2008) Translational control of localized mRNAs: restricting protein synthesis
in space and time. Nat Rev Mol Cell Biol 9:971-980. 85. Martin KC, Ephrussi A (2009) mRNA localization: gene expression in the spatial dimension. Cell
136:719-730. 86. Lecuyer E, Yoshida H, Parthasarathy N, Alm C, Babak T, Cerovina T, Hughes TR, Tomancak P,
Krause HM (2007) Global analysis of mRNA localization reveals a prominent role in organizing cellular architecture and function. Cell 131:174-187.
87. Anderson P, Kedersha N (2009) RNA granules: post-transcriptional and epigenetic modulators of gene expression. Nat Rev Mol Cell Biol 10:430-436.
88. Fire A, Xu S, Montgomery MK, Kostas SA, Driver SE, Mello CC (1998) Potent and specific genetic interference by double-stranded RNA in Caenorhabditis elegans. Nature 391:806-811.
89. Carthew RW, Sontheimer EJ (2009) Origins and Mechanisms of miRNAs and siRNAs. Cell 136:642-655.
90. Khvorova A, Reynolds A, Jayasena SD (2003) Functional siRNAs and miRNAs exhibit strand bias. Cell 115:209-216.
91. Liu Q, Paroo Z (2010) Biochemical principles of small RNA pathways. Annu Rev Biochem 79:295-319.
92. Liu J, Valencia-Sanchez MA, Hannon GJ, Parker R (2005) MicroRNA-dependent localization of targeted mRNAs to mammalian P-bodies. Nat Cell Biol 7:719-723.
93. Lu J, Getz G, Miska EA, Alvarez-Saavedra E, Lamb J, Peck D, Sweet-Cordero A, Ebert BL, Mak RH, Ferrando AA, Downing JR, Jacks T, Horvitz HR, Golub TR (2005) MicroRNA expression profiles classify human cancers. Nature 435:834-838.
94. Svoboda P, Flemr M (2010) The role of miRNAs and endogenous siRNAs in maternal-to-zygotic reprogramming and the establishment of pluripotency. EMBO Rep 11:590-597.
95. Tsai MC, Manor O, Wan Y, Mosammaparast N, Wang JK, Lan F, Shi Y, Segal E, Chang HY (2010) Long noncoding RNA as modular scaffold of histone modification complexes. Science 329:689-693.
96. Yap KL, Li S, Munoz-Cabello AM, Raguz S, Zeng L, Mujtaba S, Gil J, Walsh MJ, Zhou MM (2010) Molecular interplay of the noncoding RNA ANRIL and methylated histone H3 lysine 27 by polycomb CBX7 in transcriptional silencing of INK4a. Mol Cell 38:662-674.
97. Kanhere A, Viiri K, Araujo CC, Rasaiyaah J, Bouwman RD, Whyte WA, Pereira CF, Brookes E, Walker K, Bell GW, Pombo A, Fisher AG, Young RA, Jenner RG (2010) Short RNAs are transcribed from repressed polycomb target genes and interact with polycomb repressive complex-2. Mol Cell 38:675-688.
98. Guang S, Bochner AF, Burkhart KB, Burton N, Pavelec DM, Kennedy S (2010) Small regulatory RNAs inhibit RNA polymerase II during the elongation phase of transcription. Nature 465:1097-1101.
99. Malone CD, Hannon GJ (2009) Small RNAs as guardians of the genome. Cell 136:656-668. 100. Xu Z, Wei W, Gagneur J, Perocchi F, Clauder-Munster S, Camblong J, Guffanti E, Stutz F, Huber
W, Steinmetz LM (2009) Bidirectional promoters generate pervasive transcription in yeast. Nature 457:1033-1037.
101. Astbury WT (1961) Molecular biology or ultrastructural biology? Nature 190:1124. 102. Watson JD, Crick FH (1953) Molecular structure of nucleic acids; a structure for deoxyribose
nucleic acid. Nature 171:737-738. 103. Studier FW, Rosenberg AH, Dunn JJ, Dubendorff JW (1990) Use of T7 RNA polymerase to direct
expression of cloned genes. Methods Enzymol 185:60-89. 104. Peti W, Page R (2007) Strategies to maximize heterologous protein expression in Escherichia coli
with minimal cost. Protein Expr Purif 51:1-10. 105. Edwards AM, Arrowsmith CH, Christendat D, Dharamsi A, Friesen JD, Greenblatt JF, Vedadi M
(2000) Protein production: feeding the crystallographers and NMR spectroscopists. Nat Struct Biol 7 Suppl:970-972.

129
106. Biegert A, Mayer C, Remmert M, Soding J, Lupas AN (2006) The MPI Bioinformatics Toolkit for protein sequence analysis. Nucleic Acids Res 34:W335-339.
107. Fuhrmann M, Hausherr A, Ferbitz L, Schodl T, Heitzer M, Hegemann P (2004) Monitoring dynamic expression of nuclear genes in Chlamydomonas reinhardtii by using a synthetic luciferase reporter gene. Plant Mol Biol 55:869-881.
108. Sattler M, Liang H, Nettesheim D, Meadows RP, Harlan JE, Eberstadt M, Yoon HS, Shuker SB, Chang BS, Minn AJ, Thompson CB, Fesik SW (1997) Structure of Bcl-xL-Bak peptide complex: recognition between regulators of apoptosis. Science 275:983-986.
109. Bonneau F, Lenherr ED, Pena V, Hart DJ, Scheffzek K (2009) Solubility survey of fragments of the neurofibromatosis type 1 protein neurofibromin. Protein Expr Purif 65:30-37.
110. Hart DJ, Tarendeau F (2006) Combinatorial library approaches for improving soluble protein expression in Escherichia coli. Acta Crystallogr D Biol Crystallogr 62:19-26.
111. Aslanidis C, de Jong PJ (1990) Ligation-independent cloning of PCR products (LIC-PCR). Nucleic Acids Res 18:6069-6074.
112. Li MZ, Elledge SJ (2007) Harnessing homologous recombination in vitro to generate recombinant DNA via SLIC. Nat Methods 4:251-256.
113. Lesage A (2009) Recent advances in solid-state NMR spectroscopy of spin I=1/2 nuclei. Phys Chem Chem Phys 11:6876-6891.
114. Freeman R (1995) A short history of NMR. Chemistry of Heterocyclic Compounds 31:1004-1005. 115. Overhauser AW (1953) Polarization of Nuclei in Metals. Physical Review 92:411. 116. Ernst RR, Anderson WA (1966) Application of Fourier Transform Spectroscopy to Magnetic
Resonance. Review of Scientific Instruments 37:93-102. 117. Aue WP, Bartholdi E, Ernst RR (1976) Two-dimensional spectroscopy. Application to nuclear
magnetic resonance. The Journal of Chemical Physics 64:2229-2246. 118. Foster MP, McElroy CA, Amero CD (2007) Solution NMR of large molecules and assemblies.
Biochemistry 46:331-340. 119. Sprangers R, Velyvis A, Kay LE (2007) Solution NMR of supramolecular complexes: providing
new insights into function. Nat Methods 4:697-703. 120. Kovacs H, Moskau D, Spraul M (2005) Cryogenically cooled probes--a leap in NMR technology.
Progress in Nuclear Magnetic Resonance Spectroscopy 46:131-155. 121. Rossi P, Swapna GV, Huang YJ, Aramini JM, Anklin C, Conover K, Hamilton K, Xiao R, Acton TB,
Ertekin A, Everett JK, Montelione GT (2010) A microscale protein NMR sample screening pipeline. J Biomol NMR 46:11-22.
122. Piotto M, Saudek V, Sklenar V (1992) Gradient-tailored excitation for single-quantum NMR spectroscopy of aqueous solutions. J Biomol NMR 2:661-665.
123. Delaglio F, Grzesiek S, Vuister GW, Zhu G, Pfeifer J, Bax A (1995) NMRPipe: a multidimensional spectral processing system based on UNIX pipes. J Biomol NMR 6:277-293.
124. Sørensen OW, Eich GW, Levitt MH, Bodenhausen G, Ernst RR (1984) Product operator formalism for the description of NMR pulse experiments. Progress in Nuclear Magnetic Resonance Spectroscopy 16:163-192.
125. Sattler M, Schleucher J, Griesinger C (1999) Heteronuclear multidimensional NMR experiments for the structure determination of proteins in solution employing pulsed. Progress in Nuclear Magnetic Resonance Spectroscopy 34:93-158.
126. Johnson BA, Blevins RA (1994) NMR View: A computer program for the visualization and analysis of NMR data. Journal of Biomolecular NMR 4:603-614.
127. Volk J, Herrmann T, Wuthrich K (2008) Automated sequence-specific protein NMR assignment using the memetic algorithm MATCH. J Biomol NMR 41:127-138.
128. Wishart DS, Sykes BD (1994) The 13C chemical-shift index: a simple method for the identification of protein secondary structure using 13C chemical-shift data. J Biomol NMR 4:171-180.
129. Shen Y, Delaglio F, Cornilescu G, Bax A (2009) TALOS+: a hybrid method for predicting protein backbone torsion angles from NMR chemical shifts. J Biomol NMR 44:213-223.
130. Cavalli A, Salvatella X, Dobson CM, Vendruscolo M (2007) Protein structure determination from NMR chemical shifts. Proc Natl Acad Sci U S A 104:9615-9620.
131. Shen Y, Vernon R, Baker D, Bax A (2009) De novo protein structure generation from incomplete chemical shift assignments. J Biomol NMR 43:63-78.
132. Robustelli P, Kohlhoff K, Cavalli A, Vendruscolo M (2010) Using NMR Chemical Shifts as Structural Restraints in Molecular Dynamics Simulations of Proteins. 18:923-933.
133. Stockman BJ, Dalvit C (2002) NMR screening techniques in drug discovery and drug design. Progress in Nuclear Magnetic Resonance Spectroscopy 41:187-231.

130
134. Shuker SB, Hajduk PJ, Meadows RP, Fesik SW (1996) Discovering high-affinity ligands for proteins: SAR by NMR. Science 274:1531-1534.
135. Mayer M, Meyer B (2001) Group Epitope Mapping by Saturation Transfer Difference NMR To Identify Segments of a Ligand in Direct Contact with a Protein Receptor. Journal of the American Chemical Society 123:6108-6117.
136. Sanchez-Pedregal VM, Reese M, Meiler J, Blommers MJ, Griesinger C, Carlomagno T (2005) The INPHARMA method: protein-mediated interligand NOEs for pharmacophore mapping. Angew Chem Int Ed Engl 44:4172-4175.
137. Farrow NA, Muhandiram R, Singer AU, Pascal SM, Kay CM, Gish G, Shoelson SE, Pawson T, Forman-Kay JD, Kay LE (1994) Backbone dynamics of a free and phosphopeptide-complexed Src homology 2 domain studied by 15N NMR relaxation. Biochemistry 33:5984-6003.
138. Sprangers R, Selenko P, Sattler M, Sinning I, Groves MR (2003) Definition of domain boundaries and crystallization of the SMN Tudor domain. Acta Crystallogr D Biol Crystallogr 59:366-368.
139. Sprangers R, Kay LE (2007) Quantitative dynamics and binding studies of the 20S proteasome by NMR. Nature 445:618-622.
140. Jaravine VA, Zhuravleva AV, Permi P, Ibraghimov I, Orekhov VY (2008) Hyperdimensional NMR Spectroscopy with Nonlinear Sampling. Journal of the American Chemical Society 130:13182-13182.
141. Guntert P (2004) Automated NMR structure calculation with CYANA. Methods Mol Biol 278:353-378.
142. Linge JP, O'Donoghue SI, Nilges M (2001) Automated assignment of ambiguous nuclear overhauser effects with ARIA. Methods Enzymol 339:71-90.
143. Tjandra N, Bax A (1997) Direct measurement of distances and angles in biomolecules by NMR in a dilute liquid crystalline medium. Science 278:1111-1114.
144. Zweckstetter M, Bax A (2001) Characterization of molecular alignment in aqueous suspensions of Pf1 bacteriophage. J Biomol NMR 20:365-377.
145. Ruckert M, Otting G (2000) Alignment of Biological Macromolecules in Novel Nonionic Liquid Crystalline Media for NMR Experiments. Journal of the American Chemical Society 122:7793-7797.
146. Lorieau J, Yao L, Bax A (2008) Liquid Crystalline Phase of G-Tetrad DNA for NMR Study of Detergent-Solubilized Proteins. Journal of the American Chemical Society 130:7536-7537.
147. Kummerlöwe G, Auernheimer J, Lendlein A, Luy B (2007) Stretched Poly(acrylonitrile) as a Scalable Alignment Medium for DMSO. Journal of the American Chemical Society 129:6080-6081.
148. Zweckstetter M (2008) NMR: prediction of molecular alignment from structure using the PALES software. Nat Protoc 3:679-690.
149. Kontaxis G, Delaglio F, Bax A (2005) Molecular fragment replacement approach to protein structure determination by chemical shift and dipolar homology database mining. Methods Enzymol 394:42-78.
150. Dosset P, Hus JC, Marion D, Blackledge M (2001) A novel interactive tool for rigid-body modeling of multi-domain macromolecules using residual dipolar couplings. J Biomol NMR 20:223-231.
151. Simon B, Madl T, Mackereth CD, Nilges M, Sattler M (2010) An efficient protocol for NMR-spectroscopy-based structure determination of protein complexes in solution. Angew Chem Int Ed Engl 49:1967-1970.
152. Bax A, Kontaxis G, Tjandra N (2001) Dipolar couplings in macromolecular structure determination. Methods Enzymol 339:127-174.
153. Zhang Q, Stelzer AC, Fisher CK, Al-Hashimi HM (2007) Visualizing spatially correlated dynamics that directs RNA conformational transitions. Nature 450:1263-1267.
154. Tolman JR, Flanagan JM, Kennedy MA, Prestegard JH (1997) NMR evidence for slow collective motions in cyanometmyoglobin. Nat Struct Biol 4:292-297.
155. Lange OF, Lakomek NA, Fares C, Schroder GF, Walter KF, Becker S, Meiler J, Grubmuller H, Griesinger C, de Groot BL (2008) Recognition dynamics up to microseconds revealed from an RDC-derived ubiquitin ensemble in solution. Science 320:1471-1475.
156. Brunger AT, Adams PD, Clore GM, DeLano WL, Gros P, Grosse-Kunstleve RW, Jiang JS, Kuszewski J, Nilges M, Pannu NS, Read RJ, Rice LM, Simonson T, Warren GL (1998) Crystallography & NMR system: A new software suite for macromolecular structure determination. Acta Crystallogr D Biol Crystallogr 54:905-921.
157. Schwieters CD, Kuszewski JJ, Tjandra N, Clore GM (2003) The Xplor-NIH NMR molecular structure determination package. J Magn Reson 160:65-73.
131
158. Madl T, Bermel W, Zangger K (2009) Use of relaxation enhancements in a paramagnetic environment for the structure determination of proteins using NMR spectroscopy. Angew Chem Int Ed Engl 48:8259-8262.
159. Spronk CAEM, Nabuurs SB, Krieger E, Vriend G, Vuister GW (2004) Validation of protein structures derived by NMR spectroscopy. Progress in Nuclear Magnetic Resonance Spectroscopy 45:315-337.
160. Geerten W. Vuister JFD, Alan W.S. da Silva. iCing v2.0, http://nmr.cmbi.ru.nl/icing/iCing.html. 161. Laskowski RA, Rullmannn JA, MacArthur MW, Kaptein R, Thornton JM (1996) AQUA and
PROCHECK-NMR: programs for checking the quality of protein structures solved by NMR. J Biomol NMR 8:477-486.
162. Vriend G, Sander C (1993) Quality control of protein models: directional atomic contact analysis. Journal of Applied Crystallography 26:47-60.
163. Clore GM, Garrett DS (1999) R-factor, Free R, and Complete Cross-Validation for Dipolar Coupling Refinement of NMR Structures. Journal of the American Chemical Society 121:9008-9012.
164. Deisenhofer J, Epp O, Miki K, Huber R, Michel H (1985) Structure of the protein subunits in the photosynthetic reaction centre of Rhodopseudomonas viridis at 3[angst] resolution. Nature 318:618-624.
165. Cramer P, Bushnell DA, Kornberg RD (2001) Structural basis of transcription: RNA polymerase II at 2.8 angstrom resolution. Science 292:1863-1876.
166. Ban N, Nissen P, Hansen J, Moore PB, Steitz TA (2000) The complete atomic structure of the large ribosomal subunit at 2.4 A resolution. Science 289:905-920.
167. Sayre D (2002) X-Ray Crystallography: The Past and Present of the Phase Problem. Structural Chemistry 13:81-96.
168. Price WN, 2nd, Chen Y, Handelman SK, Neely H, Manor P, Karlin R, Nair R, Liu J, Baran M, Everett J, Tong SN, Forouhar F, Swaminathan SS, Acton T, Xiao R, Luft JR, Lauricella A, DeTitta GT, Rost B, Montelione GT, Hunt JF (2009) Understanding the physical properties that control protein crystallization by analysis of large-scale experimental data. Nat Biotechnol 27:51-57.
169. Dong A, Xu X, Edwards AM, Chang C, Chruszcz M, Cuff M, Cymborowski M, Di Leo R, Egorova O, Evdokimova E, Filippova E, Gu J, Guthrie J, Ignatchenko A, Joachimiak A, Klostermann N, Kim Y, Korniyenko Y, Minor W, Que Q, Savchenko A, Skarina T, Tan K, Yakunin A, Yee A, Yim V, Zhang R, Zheng H, Akutsu M, Arrowsmith C, Avvakumov GV, Bochkarev A, Dahlgren LG, Dhe-Paganon S, Dimov S, Dombrovski L, Finerty P, Jr., Flodin S, Flores A, Graslund S, Hammerstrom M, Herman MD, Hong BS, Hui R, Johansson I, Liu Y, Nilsson M, Nedyalkova L, Nordlund P, Nyman T, Min J, Ouyang H, Park HW, Qi C, Rabeh W, Shen L, Shen Y, Sukumard D, Tempel W, Tong Y, Tresagues L, Vedadi M, Walker JR, Weigelt J, Welin M, Wu H, Xiao T, Zeng H, Zhu H (2007) In situ proteolysis for protein crystallization and structure determination. Nat Methods 4:1019-1021.
170. Brunger AT (1992) Free R value: a novel statistical quantity for assessing the accuracy of crystal structures. Nature 355:472-475.
171. Christodoulou J, Larsson G, Fucini P, Connell SR, Pertinhez TA, Hanson CL, Redfield C, Nierhaus KH, Robinson CV, Schleucher J, Dobson CM (2004) Heteronuclear NMR investigations of dynamic regions of intact Escherichia coli ribosomes. Proceedings of the National Academy of Sciences of the United States of America 101:10949-10954.
172. Simon JA, Kingston RE (2009) Mechanisms of polycomb gene silencing: knowns and unknowns. Nat Rev Mol Cell Biol 10:697-708.
173. Deckert J, Hartmuth K, Boehringer D, Behzadnia N, Will CL, Kastner B, Stark H, Urlaub H, Luhrmann R (2006) Protein composition and electron microscopy structure of affinity-purified human spliceosomal B complexes isolated under physiological conditions. Mol Cell Biol 26:5528-5543.
174. Herold N, Will CL, Wolf E, Kastner B, Urlaub H, Luhrmann R (2009) Conservation of the protein composition and electron microscopy structure of Drosophila melanogaster and human spliceosomal complexes. Mol Cell Biol 29:281-301.
175. Entian KD, Schuster T, Hegemann JH, Becher D, Feldmann H, Guldener U, Gotz R, Hansen M, Hollenberg CP, Jansen G, Kramer W, Klein S, Kotter P, Kricke J, Launhardt H, Mannhaupt G, Maierl A, Meyer P, Mewes W, Munder T, Niedenthal RK, Ramezani Rad M, Rohmer A, Romer A, Hinnen A, et al. (1999) Functional analysis of 150 deletion mutants in Saccharomyces cerevisiae by a systematic approach. Mol Gen Genet 262:683-702.
176. Ni L, Snyder M (2001) A genomic study of the bipolar bud site selection pattern in Saccharomyces cerevisiae. Mol Biol Cell 12:2147-2170.

132
177. Gottschalk A, Bartels C, Neubauer G, Luhrmann R, Fabrizio P (2001) A novel yeast U2 snRNP protein, Snu17p, is required for the first catalytic step of splicing and for progression of spliceosome assembly. Mol Cell Biol 21:3037-3046.
178. Stevens SW, Ryan DE, Ge HY, Moore RE, Young MK, Lee TD, Abelson J (2002) Composition and functional characterization of the yeast spliceosomal penta-snRNP. Mol Cell 9:31-44.
179. Wang Q, He J, Lynn B, Rymond BC (2005) Interactions of the yeast SF3b splicing factor. Mol Cell Biol 25:10745-10754.
180. Ohi MD, Link AJ, Ren L, Jennings JL, McDonald WH, Gould KL (2002) Proteomics analysis reveals stable multiprotein complexes in both fission and budding yeasts containing Myb-related Cdc5p/Cef1p, novel pre-mRNA splicing factors, and snRNAs. Mol Cell Biol 22:2011-2024.
181. Fasken MB, Corbett AH (2009) Mechanisms of nuclear mRNA quality control. RNA Biol 6:237-241. 182. Palancade B, Zuccolo M, Loeillet S, Nicolas A, Doye V (2005) Pml39, a novel protein of the
nuclear periphery required for nuclear retention of improper messenger ribonucleoparticles. Mol Biol Cell 16:5258-5268.
183. Spingola M, Armisen J, Ares M, Jr. (2004) Mer1p is a modular splicing factor whose function depends on the conserved U2 snRNP protein Snu17p. Nucleic Acids Res 32:1242-1250.
184. Scherrer FW, Jr., Spingola M (2006) A subset of Mer1p-dependent introns requires Bud13p for splicing activation and nuclear retention. RNA 12:1361-1372.
185. Taniguchi I, Masuyama K, Ohno M (2007) Role of purine-rich exonic splicing enhancers in nuclear retention of pre-mRNAs. Proc Natl Acad Sci U S A 104:13684-13689.
186. Kaida D, Motoyoshi H, Tashiro E, Nojima T, Hagiwara M, Ishigami K, Watanabe H, Kitahara T, Yoshida T, Nakajima H, Tani T, Horinouchi S, Yoshida M (2007) Spliceostatin A targets SF3b and inhibits both splicing and nuclear retention of pre-mRNA. Nat Chem Biol 3:576-583.
187. Trowitzsch S, Weber G, Luhrmann R, Wahl MC (2008) An unusual RNA recognition motif acts as a scaffold for multiple proteins in the pre-mRNA retention and splicing complex. J Biol Chem 283:32317-32327.
188. Brooks MA, Dziembowski A, Quevillon-Cheruel S, Henriot V, Faux C, van Tilbeurgh H, Seraphin B (2009) Structure of the yeast Pml1 splicing factor and its integration into the RES complex. Nucleic Acids Res 37:129-143.
189. Clery A, Blatter M, Allain FH (2008) RNA recognition motifs: boring? Not quite. Curr Opin Struct Biol 18:290-298.
190. Kielkopf CL, Lucke S, Green MR (2004) U2AF homology motifs: protein recognition in the RRM world. Genes Dev 18:1513-1526.
191. Trowitzsch S, Weber G, Luhrmann R, Wahl MC (2009) Crystal structure of the Pml1p subunit of the yeast precursor mRNA retention and splicing complex. J Mol Biol 385:531-541.
192. Durocher D, Henckel J, Fersht AR, Jackson SP (1999) The FHA domain is a modular phosphopeptide recognition motif. Mol Cell 4:387-394.
193. Byeon IJ, Li H, Song H, Gronenborn AM, Tsai MD (2005) Sequential phosphorylation and multisite interactions characterize specific target recognition by the FHA domain of Ki67. Nat Struct Mol Biol 12:987-993.
194. Plateau P, Gueron M (1982) Exchangeable proton NMR without base-line distorsion, using new strong-pulse sequences. Journal of the American Chemical Society 104:7310-7311.
195. Cole C, Barber JD, Barton GJ (2008) The Jpred 3 secondary structure prediction server. Nucleic Acids Res 36:W197-201.
196. McGuffin LJ, Bryson K, Jones DT (2000) The PSIPRED protein structure prediction server. Bioinformatics 16:404-405.
197. Puntervoll P, Linding R, Gemund C, Chabanis-Davidson S, Mattingsdal M, Cameron S, Martin DM, Ausiello G, Brannetti B, Costantini A, Ferre F, Maselli V, Via A, Cesareni G, Diella F, Superti-Furga G, Wyrwicz L, Ramu C, McGuigan C, Gudavalli R, Letunic I, Bork P, Rychlewski L, Kuster B, Helmer-Citterich M, Hunter WN, Aasland R, Gibson TJ (2003) ELM server: A new resource for investigating short functional sites in modular eukaryotic proteins. Nucleic Acids Res 31:3625-3630.
198. Gould CM, Diella F, Via A, Puntervoll P, Gemund C, Chabanis-Davidson S, Michael S, Sayadi A, Bryne JC, Chica C, Seiler M, Davey NE, Haslam N, Weatheritt RJ, Budd A, Hughes T, Pas J, Rychlewski L, Trave G, Aasland R, Helmer-Citterich M, Linding R, Gibson TJ (2010) ELM: the status of the 2010 eukaryotic linear motif resource. Nucleic Acids Res 38:D167-180.
199. Kielkopf CL, Rodionova NA, Green MR, Burley SK (2001) A novel peptide recognition mode revealed by the X-ray structure of a core U2AF35/U2AF65 heterodimer. Cell 106:595-605.

133
200. Selenko P, Gregorovic G, Sprangers R, Stier G, Rhani Z, Kramer A, Sattler M (2003) Structural basis for the molecular recognition between human splicing factors U2AF65 and SF1/mBBP. Mol Cell 11:965-976.
201. Das R, Zhou Z, Reed R (2000) Functional association of U2 snRNP with the ATP-independent spliceosomal complex E. Mol Cell 5:779-787.
202. Berglund JA, Abovich N, Rosbash M (1998) A cooperative interaction between U2AF65 and mBBP/SF1 facilitates branchpoint region recognition. Genes Dev 12:858-867.
203. Corsini L, Hothorn M, Stier G, Rybin V, Scheffzek K, Gibson TJ, Sattler M (2009) Dimerization and protein binding specificity of the U2AF homology motif of the splicing factor Puf60. J Biol Chem 284:630-639.
204. Schellenberg MJ, Edwards RA, Ritchie DB, Kent OA, Golas MM, Stark H, Luhrmann R, Glover JN, MacMillan AM (2006) Crystal structure of a core spliceosomal protein interface. Proc Natl Acad Sci U S A 103:1266-1271.
205. Nagai K, Oubridge C, Jessen TH, Li J, Evans PR (1990) Crystal structure of the RNA-binding domain of the U1 small nuclear ribonucleoprotein A. Nature 348:515-520.
206. Oubridge C, Ito N, Evans PR, Teo CH, Nagai K (1994) Crystal structure at 1.92 A resolution of the RNA-binding domain of the U1A spliceosomal protein complexed with an RNA hairpin. Nature 372:432-438.
207. Wilkins MR, Gasteiger E, Bairoch A, Sanchez JC, Williams KL, Appel RD, Hochstrasser DF (1999) Protein identification and analysis tools in the ExPASy server. Methods Mol Biol 112:531-552.
208. Ericsson UB, Hallberg BM, Detitta GT, Dekker N, Nordlund P (2006) Thermofluor-based high-throughput stability optimization of proteins for structural studies. Anal Biochem 357:289-298.
209. Soding J, Biegert A, Lupas AN (2005) The HHpred interactive server for protein homology detection and structure prediction. Nucleic Acids Res 33:W244-248.
210. DeLano WL. (2002). The PyMOL Molecular Graphics System. DeLano Scientific, San Carlos, CA, USA.
211. Kabsch W, Sander C (1983) Dictionary of protein secondary structure: pattern recognition of hydrogen-bonded and geometrical features. Biopolymers 22:2577-2637.
212. Larkin MA, Blackshields G, Brown NP, Chenna R, McGettigan PA, McWilliam H, Valentin F, Wallace IM, Wilm A, Lopez R, Thompson JD, Gibson TJ, Higgins DG (2007) Clustal W and Clustal X version 2.0. Bioinformatics 23:2947-2948.
213. Liu Z, Sun C, Olejniczak ET, Meadows RP, Betz SF, Oost T, Herrmann J, Wu JC, Fesik SW (2000) Structural basis for binding of Smac/DIABLO to the XIAP BIR3 domain. Nature 408:1004-1008.
214. Holcik M, Korneluk RG (2001) XIAP, the guardian angel. Nat Rev Mol Cell Biol 2:550-556. 215. Oost TK, Sun C, Armstrong RC, Al-Assaad AS, Betz SF, Deckwerth TL, Ding H, Elmore SW,
Meadows RP, Olejniczak ET, Oleksijew A, Oltersdorf T, Rosenberg SH, Shoemaker AR, Tomaselli KJ, Zou H, Fesik SW (2004) Discovery of potent antagonists of the antiapoptotic protein XIAP for the treatment of cancer. J Med Chem 47:4417-4426.
216. Kieser A (2008) Pursuing different 'TRADDes': TRADD signaling induced by TNF-receptor 1 and the Epstein-Barr virus oncoprotein LMP1. Biol Chem 389:1261-1271.
217. Kieser A, Kaiser C, Hammerschmidt W (1999) LMP1 signal transduction differs substantially from TNF receptor 1 signaling in the molecular functions of TRADD and TRAF2. EMBO J 18:2511-2521.
218. Maier S, Staffler G, Hartmann A, Hock J, Henning K, Grabusic K, Mailhammer R, Hoffmann R, Wilmanns M, Lang R, Mages J, Kempkes B (2006) Cellular target genes of Epstein-Barr virus nuclear antigen 2. J Virol 80:9761-9771.
219. Lee EF, Czabotar PE, Smith BJ, Deshayes K, Zobel K, Colman PM, Fairlie WD (2007) Crystal structure of ABT-737 complexed with Bcl-xL: implications for selectivity of antagonists of the Bcl-2 family. Cell Death Differ 14:1711-1713.
220. Muller J, Sperl B, Reindl W, Kiessling A, Berg T (2008) Discovery of chromone-based inhibitors of the transcription factor STAT5. Chembiochem 9:723-727.
221. Buhler D, Raker V, Luhrmann R, Fischer U (1999) Essential role for the tudor domain of SMN in spliceosomal U snRNP assembly: implications for spinal muscular atrophy. Hum Mol Genet 8:2351-2357.
222. Sprangers R, Groves MR, Sinning I, Sattler M (2003) High-resolution X-ray and NMR structures of the SMN Tudor domain: conformational variation in the binding site for symmetrically dimethylated arginine residues. J Mol Biol 327:507-520.
223. Durek T, Becker CF (2005) Protein semi-synthesis: new proteins for functional and structural studies. Biomol Eng 22:153-172.

134
3.

135
Appendices
A.1 Product operator analysis of the HSQC pulse sequence
The initial magnetization is depending on the population of the energy states according to the Boltzmann distribution,
, where a and b are coefficients describing the individual amounts of polarization. These numbers will be omitted in
the analysis. For a proton and nitrogen pair, .
In the analysis the following rules have been applied to simplify calculations: 1) During spin-echoes there is no chemical evolution 2) τ is set to 1/4J, to accomplish complete coherence transfer. In the
1H-
15N amide pair, the J-coupling is ~90Hz.
3) During decoupling there is no coupling active between the I and S spin
Part A: (No chemical shift evolution; a spin-echo for spin I and spin S is always along the z-axis)
Part B: (No chemical shift evolution for the I spin, because of the 180° degree pulse. However, also the J-coupling
is refocused due to this arrangement,)
/2

136
Part C: Similar to A, but reversed and lacks the last 90° pulse, since we want to leave the magnetization
precessing in the plane, where it can induce a signal in the probe coils.
* * Double quantum operators do not evolve under J-coupling.
Only the blue (Iy) operator is observable, the other operators are not: - multiple quantum operator; - along z-
axis, not detectable; arises from initial S excitation which is, in the case of 15
N nucleus, ten times less intense than
the one arising from excitation of proton spin (can also be removed by phase cycling of the initial 90° pulse.); -
antiphase magnetization on spin S, and do not evolve to magnetization on I due to the decoupling during acquisition.
Part D: During acquisition, no J-coupling is active because of the decoupling pulse on spin S. Chemical shift of
spin I is evolved, and relaxation will also clearly affect the FID.
Comments: To "save" both anti-phase magnetization terms on spin S at the end of B part, a so-called sensitivity
enhanced HSQC (SE-HSQC) sequence have been developed.125
In order to achieve quadrature detection, the
direction of the initial 90° pulse is changed sequentially. In addition, pulsed-field gradients can be incorporated to
remove artifacts, and accomplish water-suppression as well as coherence selection.

137
A.2 Sequence and mass spectra of selected RES expression constructs
Snu171-113
Uniprot: P40565
Residues: 1-113
Number of amino acids: 120
Molecular weight: 13979 Da
Extinction coefficient: 15930 M-1 cm-1 at 280 nm
Theoretical pI: 6.3
10 20 30 40 50 60
MHHHHHHMNK IQQINDKELQ SGILSPHQSW HNEYKDNAYI YIGNLNRELT EGDILTVFSE
70 80 90 100 110 120
YGVPVDVILS RDENTGESQG FAYLKYEDQR STILAVDNLN GFKIGGRALK IDHTFYRPKR
(Cloning artifacts in red)

138
Bud1340mer
Uniprot: P46947
Residues: 221-256
Number of amino acids: 39
Molecular weight: 4524.0 Da
Extinction coefficient: 11000 M-1 cm-1 at 280 nm
Theoretical pI: 9.5
10 20 30 39
GAMGNRFAIM PGSRWDGVHR SNGFEEKWFA KQNEINEKK
(Cloning artifacts in red)

139
Pml146-204
Uniprot: Q07930
Residues: 46-204
Number of amino acids: 166
Molecular weight: 19150 Da
Extinction coefficient: 17420 M-1 cm-1 at 280 nm
Theoretical pI: 5.1
10 20 30 40 50 60
MEGIALKHVE PQDAISPDNY MDMLGLEARD RTMYELVIYR KNDKDKGPWK RYDLNGRSCY
70 80 90 100 110 120
LVGRELGHSL DTDLDDRTEI VVADIGIPEE TSSKQHCVIQ FRNVRGILKC YVMDLDSSNG
130 140 150 160
TCLNNVVIPG ARYIELRSGD VLTLSEFEED NDYELIFMNV HHHHHH
(Cloning artifacts in red)
no mass spectrometry data available for Pml146-204

140

141
4. Abbreviations
1D, 2D, 3D one-, two-, three-dimensional
ADAR adenosine deaminases that act on RNAs
aDMA asymmetric dimethylated arginine
A-to-I adenosine to inosine (RNA editing)
ATP adenosine triphosphate
Bcl-xl B-cell lymphoma-extra large
BIR baculovirus IAP repeat
BIR-3 Baculoviral inhibition of apoptosis protein repeat (#3)
BMRB Biological Magnetic Resonance Bank
Bud13 bud site selection protein 13
C/EBP ccaat-enhancer-binding protein
CREB cAMP response element-binding
CSI chemical shift index
CSP chemical shift perturbation
CTD C-terminal domain (usually of Pol II)
DMSO dimethyl sulfoxide
DNA deoxyribonucleic acid
DNMT DNA methyltransferase
dsRNA double stranded RNA
E. coli Escherichia coli
EBNA-2 Epstein-Barr virus nuclear antigen 2
EBV Epstein-Barr virus
eIF4E eukaryotic translation initiation factor 4E
EJC exon-junction complex
FHA forkhead-associated
FID free induction decay
FM frequency modulated
FT Fourier transform
GABA γ-Aminobutyric acid
H/D-exchange Hydrogen/Deuterium exchange
H3K27me3 tri-methylated lysine 27 of histone H3
HIV human immunodeficiency virus
HMQC heteronuclear multiple quantum coherence
HSQC heteronuclear single quantum coherence
KD dissociation constant
kDa kilo Dalton
LMP1 latent membrane protein 1
MeCP2 methyl CpG binding protein 2
miRNA microRNA
MRI magnetic resonance imaging
mRNA messenger RNA
mRNP ribonucleoprotein particle
MWCO molecular weight cut-off
NMD nonsense mediated decay
NMR nuclear magnetic resonance
NOE nuclear Overhauser effect
NOESY nuclear Overhauser effect spectroscopy
NPC nuclear pore complex
P-bodies processing bodies RISC RNA-induced silencing complex
Pcl Polycomblike protein
Pcl-Tudor Tudor domain of Pcl
PCR polymerase chain reaction
Pml1 pre-mRNA leakage protein 1
Pol II RNA polymerase II
poly(A) polyadenosine
ppm parts per million
PRE paramagnetic relaxation enhancement
pre-mRNA precursor messenger RNA
RCS remodel the structure of chromatin
RDC residual dipolar coupling
RES retention and splicing
RF radio frequency
RNA ribonucleic acid
RNAi RNA interference
RNase ribonuclease
RRM RNA recognition motif
rRNA ribosomal RNA
SAR-by-NMR structure-activity relationships by NMR
sDMA symmetric dimethylated arginine
SDS-PAGE sodium dodecyl sulfate polyacrylamide gel electrophoresis
SEC size-exclusion chromatography
siRNA mmall interfering RNA
SMN survival of motor neuron
snRNAs small nuclear RNA
snRNP small nuclear ribonucleoproteins
Snu17 small nuclear ribonucleoprotein associated protein 17
STAT5b signal transducer and activator of transcription 5B
STD-NMR saturation transfer difference NMR
SWI/SNF SWItch/Sucrose NonFermentable
TEV tobacco etch virus
TF transcription factor
TOCSY total correlation spectroscopy
TRADD TNF receptor-associated death domain
TREX transcription/export (complex)
tRNA transfer RNA
TROSY transverse relaxation optimized spectroscopy
TSN the extended Tudor domain of Tudor-SN
Tudor-SN Tudor staphylococcal nuclease
UHM U2AF homology motif
ULM UHM ligand motif
UV ultraviolet
XIAP x-linked inhibitor of apoptosis protein

142

143
5. List of Figures
Figure 1.1.1 Central dogma of molecular biology .............................................................................................. 6 Figure 1.2.1 Overview of regulation in gene expression: From transcription to translation. ............................. 7 Figure 1.2.2 Chromatin is a dynamic structure. ................................................................................................. 9 Figure 1.2.3 Transcription initiation. ................................................................................................................ 10 Figure 1.2.4 mRNA stability depends on the 5' cap and on a intact Poly(A)-tail. ............................................. 12 Figure 1.2.5 Basics of pre-mRNA splicing. ........................................................................................................ 13 Figure 1.2.6 RNA editing by ADARs. ................................................................................................................. 14 Figure 1.2.7 The nuclear pore complex (NPC) controls mRNA export from the nucleus. ................................. 16 Figure 1.2.8 RNA interference (RNAi) in eukaryotic cells .................................................................................. 19
Figure 2.1.1 Basic workflow of molecular cloning for protein expression. ....................................................... 22 Figure 2.2.1 The Larmor frequency depends on the external magnetic field ................................................... 25 Figure 2.2.2 Basic explanation of the NMR phenomenon using the vector model .......................................... 26 Figure 2.2.3 Outline of NMR hardware setup and acquisition. ........................................................................ 27 Figure 2.2.4 Evolution under J-coupling ........................................................................................................... 30 Figure 2.2.5 The basic version of the HSQC pulse sequence ............................................................................. 31 Figure 2.2.6 Multidimensional NMR. ............................................................................................................... 32 Figure 2.2.7 J-couplings utilized in backbone assignment experiments. .......................................................... 33 Figure 2.2.8 Cartoon illustrating the backbone assignment strategy. ............................................................. 33 Figure 2.2.9 Ligand binding monitored by consecutive acquisition of
1H,
15N HSQC spectra. ........................... 34
Figure 2.2.10 The exchange rate of the ligand influence the appearance of a signal during titration. ........... 35 Figure 2.2.11 T2 measurements using the rate analysis module of NMRViewJ v8 ........................................... 36 Figure 2.3.1 Basic workflow of X-ray crystallography ...................................................................................... 40
Figure 5.2.1 Multiple sequence alignment of Snu17 UHM to other UHMs ...................................................... 88 Figure 5.3.1
1H,
15N HSQC spectra of individual proteins and of the full RES complex. ..................................... 89
Figure 5.3.2 Optimization of Snu17 constructs, and expression procedures. ................................................... 90 Figure 5.3.3 Stability of Snu17
1-113 with and without a ligand. ........................................................................ 91
Figure 5.3.4 Analysis of secondary structure and residue flexibility in Snu171-113
by NMR. ............................. 92 Figure 5.3.5 Size exclusion chromatography of a complex containing Snu17
1-113 and Bud13
40mer.................... 92
Figure 5.3.6 Optimization of the Bud13 ULM peptide by NMR titrations and ITC ........................................... 95 Figure 5.3.7 DMSO stabilizes Snu17
1-113 and to weakens the interaction of Bud13
40mer. ................................. 95
Figure 5.3.8 Analysis of the Bud13 interaction site on Snu17, a comparison of peptides ................................ 96 Figure 5.3.9
15N labeled recombinant Bud13 peptides titrated with unlabeled Snu17
1-113. ............................. 97
Figure 5.3.10 High temperature is needed for recording high quality NMR data ............................................ 98 Figure 5.3.11 NMR characterization of Bud13
40mer in complex. ..................................................................... 100
Figure 5.3.12 Intermolecular NOEs for 15
N/13
C labeled Snu171-113
in complex with Bud1340mer
. .................... 101 Figure 5.3.13 Crystal structure of the FHA domain from Pml1 and the NMR backbone assignment ............ 102 Figure 5.3.14 Analysis of the Snu17
FL:Pml1
FL complex by NMR titrations ...................................................... 103
Figure 5.4.1 Sequence alignment of Bud1340mer
to eukaryotic homologs and to ULM sequences. ................ 104 Figure 5.4.2 Structures of UHM domains in complex with ULM peptides. ..................................................... 106 Figure 5.4.3 A peptide motif of SF3b-155 interacts with p14 at the site where RNA binding occurs. ............ 109
Figure 6.1.1 Ligand titrations of a putative binder to XIAP (BIR-3 domain) ................................................... 116 Figure 6.2.1 Interaction studies of viral LMP1 and human TRADD. ............................................................... 117 Figure 6.3.1 Initial NMR analysis of an EBNA-2 fragment. ............................................................................ 118 Figure 6.4.1 Example of an inhibitor interacting with Bcl-xl .......................................................................... 119 Figure 6.5.1 STD NMR of STAT5b with different compounds. ......................................................................... 120 Figure 6.6.1 Induced chemical shifts changes upon ligation of a sDMA-containing peptide to SMN. ........... 121

144

145
6. Curriculum Vitae
München, October 2010
Anders Friberg
Born 15th of June 1980
Swedish citizen
E-mail: [email protected]
Languages: Swedish, English and German
Education
2006-2010
PhD thesis with Prof. Dr. Michael Sattler at EMBL (European Molecular Biology Laboratory, Heidelberg) and at
Helmholtz Zentrum München / Technische Universität München. The title of my thesis was:
Structure and molecular recognition of proteins linked to pre-mRNA splicing and transcriptional regulation.
I was enrolled in the International PhD program 'Protein Dynamics in Health and Disease' of Elitenetzwerk Bayern.
2000 - 2005
M.Sc. in Biotechnology at the Royal Institute of Technology (KTH) in Stockholm. My studies were focused at
biomolecular and organic chemistry. Study break during 2003. The Final Degree Project was carried out at Medivir
AB in the autumn of 2005, and entitled: Computational Mapping of Active Sites
Spring 2000
Attended a bible study program of Johannelunds Theological University College in Uppsala.
1996 - 1999
Attended the natural sciences program at Rudbeckskolan, Sollentuna (Upper secondary school).
My studies were focused on organic chemistry.
Prior employments
Winter 2006
Full-time position at Medivir AB. Applying the methods developed during my M.Sc. Final Degree project on a drug
development project.
Spring 2003
Full-time work at Apoteket AB, a pharmacy. Cashier and management of goods.
2002, 2003 & 2005
Manager at summer camps for ~40 teenagers, I was responsible for planning and implementation. This also
included heading a team of 8-12 youth leaders.
Autumn 1999
Research internship with Prof. Dr. Magnus Ingelman-Sundberg at the Unit of Molecular Toxicology of Karolinska
Institutet. The work included molecular biology techniques for cloning, expression and purification of membrane
proteins in yeast.
Other merits
Elected for a local council in Sollentuna Församling
During 2005-2006 I was elected board chairman for a district of Sollentuna Församling, a parish within Church of
Sweden. The work included setting and controlling the budget, as well as developing the direction of activities in the
congregation.
Scholarship holder of Church of Sweden
Thanks to a scholarship from Church of Sweden I spent the autumn of 2003 in Malaysia. During this exchange
program I visited projects connected to a partner church and worked at schools for handicapped, homes for
neglected children etc.
Youth Leader
Worked as a youth leader at summer confirmation camps in 1997-2001 and 2004.
Responsible for activities and discussion groups.
References and certificates will be provided at your request.

"Quality... you know what it is, yet you don't know what it is. But that's self-contradictory. But some things are better than others, that is, they have more quality. But when you try to say what the quality is, apart from the things that have it, it all goes poof! There's nothing to talk about. But if you can't say what Quality is, how do you know what it is, or how do you know that it even exists? If no one knows what it is, then for all practical purposes it doesn't exists at all. But for all practical purposes it really does exists. What else are the grades based on?
Why else would people pay fortunes some things and throw others in the trash pile? Obviously some things are better than others.. but what's the "betterness"?... So round and round you go, spinning mental wheels and nowhere finding anyplace to get traction. What
the hell is Quality? What is it?"
Zen and the Art of Motorcycle Maintenance,
by Robert M. Pirsig
"Du bist frei. Nun lebe aus der Weisheit, die auch Gott dir geschenkt hab."
Das Buch der Lebenskunst,
by Benedictine Brother Anselm Grün, Münsterschwarzach