Oil and Gas Fields DB+~ - OSTI.GOV
225
ResearchReport) APEC-GEMEED Mherals and Energy Exploration and Development Expert Group Oil and Gas Fields DB+~ (http: /Japec.kigam.re.kr) t@liEi?HBim%F!Ji Korea Institute of Geology, Mining & Materials
-
Upload
khangminh22 -
Category
Documents
-
view
1 -
download
0
Transcript of Oil and Gas Fields DB+~ - OSTI.GOV

ResearchReport)
APEC-GEMEEDMherals and Energy Exploration and Development Expert Group
Oil and Gas Fields DB+~(http: /Japec.kigam.re.kr)
t@liEi?HBim%F!JiKorea Institute of Geology, Mining & Materials

1 DISCLAIMER
Portions of this document may be illegiblein electronic image products. Images areproduced from the best available originaldocument.

APEC-GEMEEDMkerals and Energy Exploration and Development Expert Group
Oil and Gas Fields DBY+(http: /{apec.kigam.re.kr)
Australia
Brunei Darussalam
Canada
Chile
the People’s Republic
Hong Kong
Indonesia
Japan
of China
the Republic of Korea
Malaysia
Mexico
New Zealand
Papua New Guinea
the Philippines
Singapore
Chinese Taipai
Thailand
the United State of America
ZuElin!iiiKorea IInstkute of Geology,
m%%Mining & Materisls

APEC-GEMEEDMinerals and Energy Exploration and Development Expert Group
Oil and Gas Fields Database(httpY/apec.kigam.re.kr)
*Young–In Kim, ** Jung-Kuy Ha.rJ
Abstract
As agreed by the Second Meeting of the Expert Group of
Minerals and Energy Exploration and Development in Seoul, Korea
“The Construction of Database on the Oil and Gas Fields in the
APEC Region” is now under way as a GEMEED database project for
1998. This project is supported by Korean government funds and the
cooperation of GEMEED colleagues and experts.
During this “year, we have constructed the home page menu
(topics) and added the data items on the oil and gas field, These
items include name of field, discovery year, depth, the number of
wells, average production(b/d), cumulative production, and API
gravity.
The web site shows the
APEC region is 47,201. The
economies are shown in the
total number of oil and gas fields in the
number
table.
World oil and gas statistics
consumption, and trade information
the users convenience.
of oil and gas fields by member
inch-ding reserves, production,
were added to the database for
i

The number of oil and gas fields in the APEC region
RMember Total
Economy Fields
Austmlia 115
Brunei7
Darussalem
Hchina
I23
Member
EconomyHong Kong
china
Indonesia
Japan
Korea
+
Total Member
Fields Economy
- Mexico
New195
Zealand
8 I PhilippinesI
=7==
Total
Fields
106
6
4
Malaysia
ii
1=Member Total
Economy FieldsChinese
5Taipei
Thailand 5
,
46,607USA
DOE pdf
T%rl

Aj ~ .....................................................................................................................
1-1
1-2
1-3
1-4
1-5
X123
2-1
2-2
2-3
2-4
2-5
2-6
GEMEED ...........................................................................................
7] S- ......................................................................................................
..................................................................................................................
APEC 7]% ........................................................................................................
APECQl
APECQl
APEC+
+4%%’?5 -wq..,,,,,,,...,....................................................................+341%4 a% .................................................................................Z&% ...................................................................................................
GEMEED ...........................................................................................................
7] Q .,,,...............................................................................................................
GEMEED +% Q% ........................................................................................
g2~ qq ............................................................................................................
DB +=& .......................................................................................................
$?% + =L-&lECOW) .......................................................................................
lz~q ~ +xD ...................................................................................................
Xl 3 % GEMEED L+lo] ~ MlO]& ..................................................................................
X11147]Q. ..................................,,,............................................................................
%] 2 %! ~q=~ Y=lOil and gas Fields DB ...<.,.,..,.,...,......................................
71 3 ~ ANMED q %?%%% DB ............................0..,.,.,,...,.................................
Al 4 % Oil and Gas Fields DB .....................................................................................
1
3
3
3
4
6
8
9
10
10
11
15
16
20
21
23
23
23
26
29
...111

%] 1 ~ +4 q 71-&@ DB ...................................................................................... 29
l-l 7] Q. ..................................................................................................................... 29
● Australia ...................................4..........................................................................
● Brunei Darussalem .............................................................................................
● Canada ....................................................................................................................
● Chile ........................................................................................................................
c the People’s Republic of China ......................................................................
● Indonesia ................................................................................................................
● Japan .......................................................................................................................
● the Republic of Korea .......................0...............................................................
c Malaysia .................................................................................................................
● Mexico ....................................................................................................................
● New Zealand .........................................................................................................
● Papua New Guinea ...........................................................................................
● Peru ........................#.........................................................................................!......
● the Philippines ......................................................................................................
“ Russia .....................................................................................................................
“ Chinese Taipei .................................................................................................!,,.
9 Thailand .................................................................................................................
s the United State of America ..........................................................................
● Vietnam ..................................................................................................................
29
31
33
35
36
37
39
40
42
44
46
48
49
51
52
53
54
55
57
1-2 95% 3%! ...................................................................................................... 58
31 2 ?4 q+ q 7} A%-7zll DB .....!.!..0..,.................................................................. 153
2-1 4 -i+ ...................................................................................................4................. 153
iv
................................................................................................................
...................................................................,...,.., .,.,$,.., . . . . . . . . . . . . . . . . . . . . . . . . . . . .
. . . . . . . . . . . . . . . . . . . . . . . . . . . . . . . . . . . . . . . . . . . . . . . . . . . . . . . . . . . . . . . . . . . . . . . . . . . . . . . . . . . . . . . . . . . . . . . . . . . . . . . . . . . . . . . .
. . . . . . . . . . . . . . . . . . . . . . . . . . . . . . . . . . . . . . . . . . . . . . . . . . . . . . . . . . . . . . . . . . . . . . . . . . . . . . . . . . . . . . . . . . . . . . . . . . . . . . . . . . . . . . . .
................................................................................................................
7}, u~x$=~ ................................................................................................................
+, ‘Jti* ................................................................................................................
q. +ljl~ ................................................................................................................
X15’ JZ2% .................................................................................................................
● The Maintenance and Update of GEMEED’s WWW Database in Korea,
3rd Meeting APEC-GEMEED (8-12 May, 1998, Ottawa, Canada)
● APEC-GEMEED X13~} q Ql(8-12 May, 1998, Ottawa, Canada) Summary
Report
153
157
161
169
170
170
174
178
182


5

1-3-1 APEC %+ 7] #+!+ (1989)
1-3-2 Al& 4! ?i+H1992)
6


9

‘2-1 71 JL
10

2–2 GEMEED %% SL%lTerms of Reference)
11


15
16

APEC GEMEED Database Workshop
SUMMARY RECORD
Canberra, Australia, 9-11 September 1996
L At its inaugural meeting in Santiago, ChiIe in March 1996, the Group
of Experts on Minerals and Energy Exploration and Development (GEMEED)
accepted proposals from Australia and Chile to stage a Workshop to design
a comprehensive database to facilitate investment in minerals and energy
throughout the APEC region.
2. The Workshop was held in Canberra, Australia from 9-11 September
1996, hosted by the Bureau of Resource Sciences. It was attended by
representatives of Australia, Chile, Japan, Korea, Mexico, Papua New Guinea
and Chinese Taipei. Participants also attended from the Australian State of
Queensland and from Australian industry. A list of delegates is at
Attachment A.
3. Presentations were made on a variety of matters, including (in general
terms):
subjects which should be covered in the database
how to use the Internet to disseminate information
existing relevant databases in several member economies
the policy and legal framework for petroleum and minerals exploration
and development in two individual member economies technical issues in
data management.
4. Three proposals for future work were foreshadowed:
a cooperative study by GEMEED of mine safety measures and
pollution controI in the region(proposed by Japan)
a database on mining related experts and organizations in the APEC
region (offered to be undertaken by Korea), and possible joint feasibility
studies by GEMEED for mining investment in the APEC region (proposed
by Korea).
5. The agenda for the meeting and copies of the papers presented are
17

attached (Attachments B and C), together
Canadian Government listing information it
Database (Attachment b).
6, The Workshop accepted that:
it was important to ensure that data
with a copy of a letter fi-om the
could make available now for the
and documents were stored in a
format that would remain readable for a worthwhile time;
GEMEED would be constructing a database cataloging and linking
individual national databases and metadatabases,
responsible for managing its own data, GEMEED
providing a good ability to access information in these
with each economy
could add value by
databases;
because member economies differ widely in their telecommunications
capacities, it would be useful for those providing maps to offer ‘quick look’
maps as well as more detailed maps;
as GEMEED would need to construct the database over a prolonged
period, it should focus its early efforts on capturing basic exploration data
and information on the investment framework;
as an alternative to linking detailed hard data (such as gravity surveys
on particular areas) into the GEMEED database, member economies could at
least provide a contact to be approached for such information.
7. Japan informed the Workshop that the MN.fAJ (Metal Mining Agency
of Japan) has
occurrences and
database already
to other areas.
been developing a database of international rnineraI
would offer access to this to GEMEED at no cost, This
covered part of the APEC region and it wouId be expanded
8, The Workshop adopted the following
of the Database:
a. Lhdcages
Recommendation on development
The Database wdl consist of a series of linked fieIds, presented in
groups of reIated topics. The subjects wilI be the topics listed in Annex 1.
Content should not dupIicate but, through appropriate linkages, integrate
relevant parts of the existing database of the Energy Working Group.
18
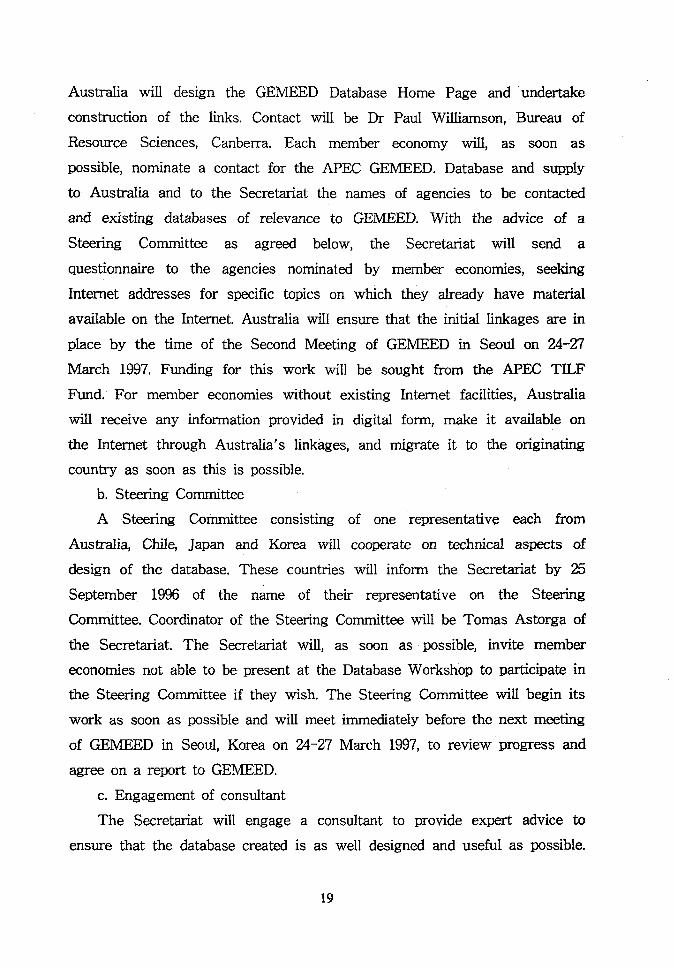
Australia will design the GEMEED Database Home Page and “undertake
construction of the links. Contact will be Dr Paul Williamson, Bureau of
Resource Sciences, Canberra. Each member economy will, as soon as
possible, nominate a contact for the APEC GEMEED. Database and supply
to Austdia and to the Secretariat the names of agencies to be contacted
and existing databases of relevance to GEMEED. With the advice of a
Steering Committee as agreed below, the Secretariat wilI send a
questionnaire to the agencies nominated by member economies, seeking
Internet addresses for specific topics on which they already have material
available on the Internet. Australia will ensure that the initial linkages are in
place by the time of the Second Meeting of GEMEED in Seoul on 24-27
March 1997, Funding for this work will be sought from the APEC TILF
Fund. For member economies without existing Internet facilities, Australia
will receive any information provided in digital form, make it available on
the Internet through Australia’s linkages, and migrate it to the originating
country as soon as this is possible.
b. Steering Corn@&e
A Steering Committee consisting of one representative each from
Australia, Chile, Japan and Korea will cooperate on technical aspects of
design of the database. These countries will inform the Secretariat by 25
September 1996 of the name of their representative on the Steering
committee. Coordinator of the Steering Committee will be Tomas Astorga of
the Secretariat. The Secretariat will, as soon as possible, invite member
economies not able to be present at the Database Workshop to participate in
the Steering Committee if they wish. The Steering Committee will begin its
work as soon as possible and will meet immediately before the next meeting
of GEMEED in Seoul, Korea on 24-27 March 1997, to review progress and
agree on a report to GEMEED.
c. Engagement of consultant
The Secretariat will engage a consultant to provide expert advice to
ensure that the database created is as well designed and useful as possible.
19

The consultant should be abIe to begin work by December 1996 and have it
completed by March 1997, in time for the Second Meeting of GEMEED in
Smul. Funds for the consultancy will be sought from the APEC TJLF Fund.
The consukant wiIl design an Internet tempIate for member economies and
submit this with hk draft report to the Steering Committee by February
1997.
d, Timing for construction of the database
The GEMEED Database should grow over time, but an initial content
should be in place by March 1997. Content to be included should reflect
what member economies already have available, but as a minimum, all
member economies should aim, as a target, to make available the foIlowing
information within these time frames:
energy reserves and production, by field - by September 1997
metal reserves, supply and demand - by September 1998
studies on the supply and demand outIook, by commodities – by Sep.
1999. The Scheckde for development of the Database is at Annex 2,
e. Ongoing funding and monitoring of progress
Each meeting of GEMEED will review progress in construction and
filling of the database, and consider requirements for its continuing
development. Each member economy should review and, where possible,
update its data on the database every six months. Each member economy
should report briefly to each meeting of GEMEED on what it has achieved
since the last meeting. GEMEED will seek renewed funding from APEC
each year to support continuing development of the Database.
12 September 1996
20


!u~.
22
23
.<=7 . . .. ..-. $ ...,.-. . . . d.? ,,: . .. .,,,, ..”.,.,..,.,:,,.. ,., ,,, .,,.
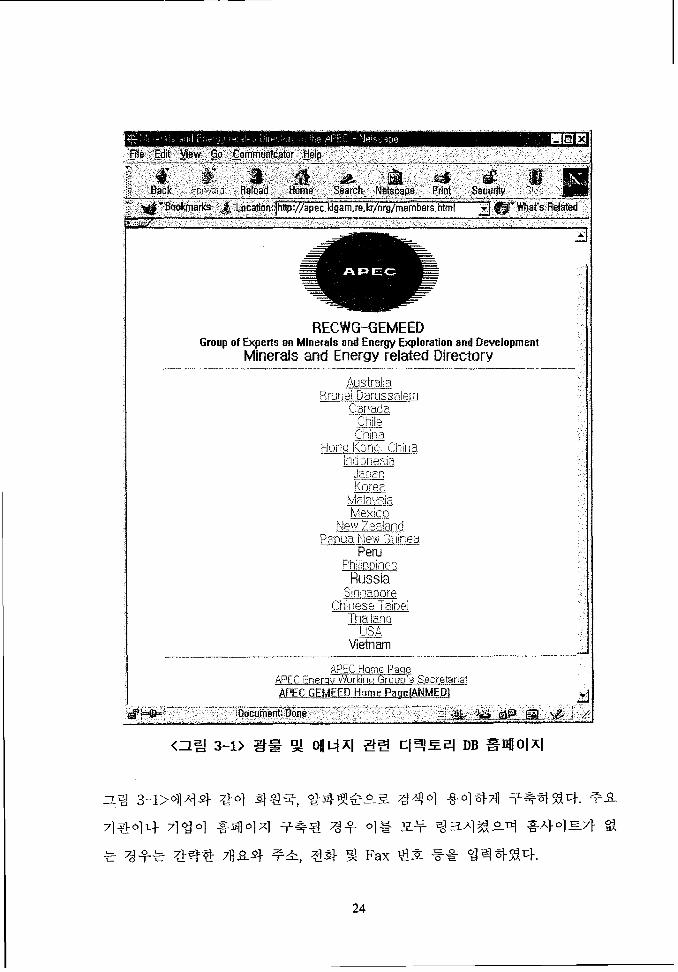
“illm.-RECWG-GEMEED
GroupofExpertsonMineralsandIhergy ExplorationzmdDevelopmentMinerals and Energy related Directory

<Z= 3-2> APEC ~ ~ Oil and Gas Fields DB =m 01xl>
25

=1%%- ++3+= Zq$* ++3+= q$gq *ZJ+ Zq+lq -R++=
Hong Kong, ChineseAustralia 115 Mexico 106 5
china TaipeiBrunei
7 Indonesia 195 New Zealand 6 Thailand 5Darussalem
Papua NewCanada 55
46,607Japan 14 USA
Guinea - DOE pdf
Chile 21 Korea 8 Philippines 4
TotalChim 23 Malaysia 30 SingapoE -
47,201
3-1 ANMED

● ~ % % ‘d ‘~~%~ : Key contacts in government. industry and research.
. ~~ % +% XdY. : Bauxite. Black coal. Brown coal. Chromium. Cobalt. Copper.
Dkunonds, Gold. Flydro. Iron ore. Manganese ore. Mineral sands. Molybdenum.
Nickel, Platinum-group metals. Oil/gas/condensate. Oil shale. Tantalum, Tin.
Tungsten. Vanadium. Zinc. Lead. SiIver. Thermal. Uranium.
.q~ AJq~$3_ : Industry activity. Industry expenditure, Exploration,
Development. Development proposals. Production. Supply. Demand. Investment.
Service Industries and Consukants. Other reIated databases.
● % ?l +2?? WXl% E : Mining and petroleum law. Mineral and petroleum property
lz-eatment, Environment protection laws, Labour laws and regulations-
occupationaI health and safety. Immigration n.des for ski&d professionals. Land
access arrangements. Banking and currency transfer arrangements. Import and
export rules.
● %+$ 2J?SXl% Y : Fiscal treatment-Taxes and Royalties, Foreign investment
rules. Banking and currency transfer arrangements. Government programs or
incentives. Key contacts in government, industry and research. Venture capital
arrangements.
● =X] %Y_ : Environment protection laws. Land access arrangements. Banking
and currency transfer arrangements. Key contacts in government, industry and
research. Rehabilitation. Landowner benefits and compensation,
● xl+%%} +1E : Geoscientific and survey data. Metadatabases. Key contacts
in government, industry and research. Research and development.
27

.fle .,jidit,?t%f” .:@.’~@mrnw@it&“HahP.~ ‘“ ., “,’. ‘: . “ : “ ~ ~~ . ‘”...— ...- .-.”,... ”+_._. ,-. —.. ..%.- .. ..*..———.—..-.. .—.”-.=-.”4-----.4+..-.7, ,/
~:, ,Bg “:; .z#;:::.s:’”;*’;:,. ..Ai f ‘%ilt<; ““ %%?ii7%iF7i$iii~@:GmivStd~.Rkbad :“borne. %$itch. NetecaPe” FWt!:’ SEWNd“.-+ :.......F_- .....d.-.. ...<.-.-....-.-A---.----..-.-+-- .,--.---—.-..-—-—-”---- -—---—----— --+—--.-=7-----
‘wottmadjt$!:;~:wqil?yltql ://www.bre.gov,au/gemeed/anmedhni 31U!W~at a~ata~..
I APECNei3wrkof Minards andEmaq2gDatabases A(ANluED) I
‘II
28

*] 4 ‘i Oil and Gas Fields DB
1-1 7] XL
Oil
Proved amount in place (crude oil and NGL’s, million tonnes) I I
Proved recoverable reserves (crude oil and NGL’s, million tonnes) I 345
Production (crude oil and NGL’s, million tonnes, 1996) 27.0
R/P ratio (years) 13.4
Year of first commercial production 1964
Crude oil chamctenstics
Average gravity 46.0 “API
Proportion with less than 1% sulfur I ‘4100°
Light oil 98%
Medium oil o%Heavy oil 2%
Although drilling for oil took place as long ago as 1892, it was not ntil
well after World
then, numerous
War II that Australia
oil fields have been
achieved oil-producer
discovered, notably in
are as: Gippsland Basin(Bass strait), off Victoria: Cooper
status. Since
the following
Basin, South

Australia; Eromanga and Surat Elasins, Queensland: Carnarvon Basin
(North-west Shelf) off Western Australia: Bonaparte Basin in the Timor
Sea. Production of oil (including condensate and other NGL’s ) has
flu-ctuated in recent years: in 1996 it averaged 617,000 b/d, of which
crude oil accounted for 70%, condensate for 18% and LPG/ethane for
12%. just over 30% of Australia’s total oil output in 1996 was exported,
mostly to Japan and other Asian
Gas
destinations, the USA and New Zealand.
rProved amount in place (billion cubic meters) 1\Proved recoverable reserves (billion cubic meters) I 13601
Production (net, billion cubic meters, 1996) I 30.0
R/P ratio (years) I 41.1
lYear of first commercial production \ 19691
Natural Gas Characteristics
Heat value (MJ/ms)
H
Average
(gross calorific value, after, extraction of NGL’s) 37.2I
Non-hydrocarbon constituents(%) -3
Hydrogen sulfide(%) -o
Helium(%) -o
lCarbon dioxide(%) /-21
1-Nitrogen(%) -0.5
Exploration for hydrocarbons has discovered more natural gas than oil:
Australian proved reserves of gas as reported for the present Survey are in the
same bracket as those of China, Kuwait and Libya. Gross production grew by
over 60% between 1990 and 1996, reflecting in part agrowth in domestic demand
30

but more especially a substantial increase in
from the North West Shelf fields. The main
exports of LNG(principally to Japan)
gas-consuming sectors in Australia
are public electricity generation, thenon-ferrous metals industry and the
residential sector. The level of proved recoverable reserves reported in the present
Survey has been provided by the Bureau of Resource Sciences and corresponds
with their category “Economic Demonstrated Resources”: these are defined as
“resources judged to be economically extractable and for which the quantity and
quality are computed partly from specific measurement, and partly from
extrapolation for a reasonable distance on geological evidence. ”
Brunei Da.russalem
I Oil
Proved amount in place (crude oil and NGL’s, million tonnes)
Proved recoverable reserves (crude oil and NGL’s, million tonnes) 184
Production (crude oil and NGL’s, million tonnes, 1996) 8.0
R/P ratio (years) 22.4
Year of first commercial production 1929
Although the earliest discoveries (Seria and Rasau fields) were made
on land, all subsequent oil fields were found in offshore waters. With
proved reserves of 1 350 million barrels, Brunei has the third highest
level in south-east Asia. There were 7 offshore fields in production in
1996, to-gether with the two original onshore fields: total output
(including about 16 000 b/d of natural gasoline) was 165 000 b/d,
somewhat lower than in recent years, About 95% of Brunei’s oil output is
exported, mostly to Japan, Thailand, South
31
Korea and Singapore,

Gas
Proved amount in place (billion cubic meters) I IProved recoverable reserves (billion cubic meters) I 399
Production (net, billion cubic meters, 1996) 9.4
R/P ratio (years) 41.6
Year of first commercial production .-
Natural gas was found in association with oil at Seria and other fields
in Brunei. For many years this resource was virtually unutilized, but in the
1960s a realization of the resource potential, coupled with the availability
of new technology for producing and transporting liquefied natural gas,
enabled a major gas export scheme to be devised. Since 1972 Brunei
has been exporting LNG to Japan, and more recently to the Korean
Re-public.
Despite annual exports
steady at just under 400
of 7–8 bcm, proved
bcm since 1990.
reserves have remained
Over 90% of Brunei’s marketed production is exported, the balance being
mostly used in the liquefaction plant, local power stations and offshore
oil and gas installations. Small quantities are used for residential
purposes in Seria and Kuala Belait.
32

Canada
Oil
I Proved amount in place (crude oil and NGL’s, million tonnes) I 11724
I Proved recoverable reserves (crude oil and NGL’s, million t onne.s) I 844
Production (crude oil and NGL’s, million tonnes, 1996) 90.3
R/P ratio (years) 9.2
I Year of first commercial Production I 186d
Crudeoil characteristics
Average gravity I 33 “API
Proportion with less than 1Y. sulfur I 100+
Light oil I 60~
Medium oil I 7?4
IHeavy oil I 33q
There is a very substantial oil resource base, albeit not on the scale of
the USA and Mexico. Resources and reserves have been reported by the
Energy Council of Canada in terms of the established amount in place
and established recoverable reserves. After many years as a comparatively
minor producer, Canada’s oil output became of real significance only
after major discoveries such as the Leduc field in 1947. Output advanced
rapidly from around 1950; crude oil production passed the million b/d
mark in 1968. In 1996 output of crude was 1.4 million b/d, that of NGL’s
(including
production
bitumen.
pentanes) 624 000 b/d. Canada is the world leader in the
of oil from deposits of oil sands–see the chapter on natural
33

Gas
Proved amount in place (billion cubic meters) I 7779
Proved recoverable reserves (billion cubic meters) I 2093
Production (net, billion cubic meters, 1996) 158.9
R/P ratio (years) 11.3
Year of first commercial production
Natural Gas Characteristics
Average RangeHeat value (MJ/I’If)
(9ross calorific value, after extration of NGL’s)37.4 30-55
Non-hydrocarbon constituents(%) 7 0-60
Hydrogen sulfide(%) 5 0-55
Helium(%) 0.4 0-0.5
Carbon dioxide(%) 2 0-20
Nitrogen(%) 1.7 0.1-15
Canada’s proved reserves are the third largest in the Western
Hemisphere, At end-1 996, 86% of “remaining established reserves” of
marketable natural gas consisted of non-associated deposits: the
provinces with the largest gas resources were Alberta (with 80,6% of
remaining established reserves), British Colombia
Saskatchewan (4.4%).
Grass production of Canadian natural gas was the third
world in 1996. Of the net output remaining after
(13.8%) and
highest in the
allowance for
re–injection, flaring and shrinkage, approximately half was exported to the
United States,
34

The largest users of gas within Canada are the industrial, residential and
commercial sectors.
Chile
Oil
Proved amount in place (crude oil and NGL’s, million tonnes) 1I Proved recoverable reserves (crude oil and NGL’s, million tonnes) I 34
Production (crude oil and NGL’s, million tonnes, 1996) 0.6
R/P ratio (years) 58.5
Year of first commercial production 1950
Oil resources are on a fairly modest scale, and are located in the
Ma-gallanes Basin in the far south of the country, on or near the island
of Tierra del fuego: several oil and gas fields straddle the border with
Argentina, Chile’s portion of Magallanes has reached maturity, after
producing some 400 million barrels: oil output has fallen every year since
1982. In 1995, 60% of national production came from offshore wells,
23% from onshore wells on Tierra del Fuego and 17% from the
continental mainland: all is refined domestically. Proved recoverable
reserves, as published by Oil & Gas Journal, had remained virtually
unchanged for about ten years, but their latest assessment (reserves as
of January 1, 1998) indicates a reduction from 300 to 150 million barrels.
35
China
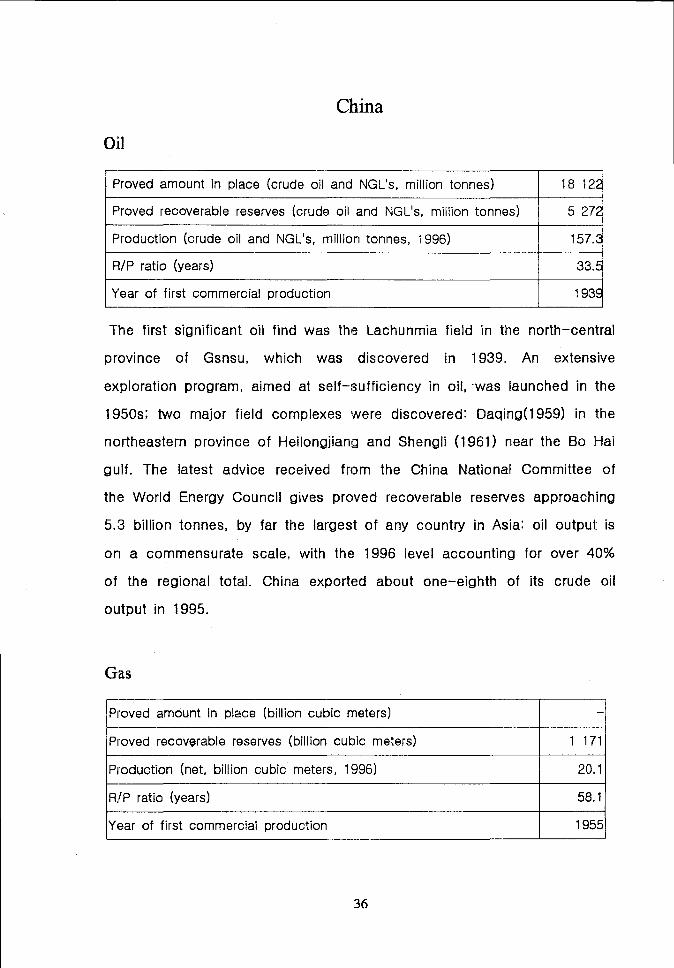
oil
Proved amount in place (crude oil and NGL’s, million tonnes) 18 122
Proved recoverable reserves (crude oil and NGL’s, million tonnes) 5272
Production (crude oil and NGL’s, million tonnes, 1996) 157.3—
R/P ratio (years) 33.5
Year of first commercial production 1939
The first significant oil find was the Lachunmia field in the north-central
province of Gsnsu, which was discovered in 1939. An extensive
exploration program, aimed at self–sufficiency in oil, was launched in
1950s; two major field complexes were discovered: Daqing(l 959) in
northeastern province of Heilongjiang and Shengli (1 961) near the Bo
the
the
Eiai
gulf. The latest advice received from the China National Committee of
the World Energy Council gives proved recoverable reserves approaching
5.3 billion tonnes, by far the largest of any country in Asia: oil output is
on a commensurate scale, with the 1996 level accounting for over 40°A
of the regional total. China exported about one–eighth of its crude oil
output in 1995.
GM
lProved amount in place (billion cubic meters) I -1Proved recoverable reserves (billion cubic meters) 1 171
Production (net, billion cubic meters, 1996) 20.1
R/P ratio (years) 58.1
Year of first commercial production 1955
36

Past gas discoveries have been much fewer than those of crude oil, which is reflected in
the fairly moderate level of proved reserves. Gas resemoim have been identi]ed in many
parts of China, including in particular the Sichuan Basin in the central region, the Tarim
Basin in the north-west and the Yinggehai (South China Sea).
In Janumy 1996, China began delivering natural gas to the Castle Peak power station in
Hong Kong via a pipeline from the offshore Yacheng field, deliveries in 1996 totaled
0.22bcrn.
Indonesia
Oil
Proved amount in place (crude oil and NGI-’s, million tonnes)
Proved recoverable reserves (crude oil and NGL’s, million tonnes] 677
Production (crude oil and NGL’s, million tonnes, 1996) 75.5
R/P ratio (years) I 8.6
Year of first commercial production I 1885
Crude oil characteristics
Light oil 85.0%
Medium oil 9.9%
Heavy oil
The first commercial discovery of oil was made in north Sumatra in
1885: subsequent exploration led to the finding of oil fields in southern
Sumatra, java and Kalimantan. Although assessments of proved
recoverable reserves vary quite widely from one source to another, a
37

volume of at least 5 billion barrels can be observed, placing Indonesia in
the same bracket as India and Kazakhstan-all three falling well short of
China in this respect. In the context of its current production levels for
crude oil and condensate, Indonesia’s proved reserves appear to require
enhancement, if the R/P ratio is not to fall dangerously low. In 1995
Indonesia exported some 55% of its output of crude oil and
condensates,
LPG’s. It has
Gas
as well as a large part of its production of gas–plant
been a member of OPEC since 1962.
l------aPrcwed amount in place (billion cubic meters)
Proved recoverable reserves (billion cubic meters)
Production (net, billion cubic meters, 1996)
R/P ratio (years) I 27.7
lYear of first commercial production I -1
Natural Gas Characteristics
I!
Heat value (MJ/m”) (gross calorific value, after extraction of NGL’s) I 31.7 -43.6
lHydrogen sulfide(%) [ 0-0.55 \
lCarbon dioxide(%) I 0-71.21 I
Nitrogen(%)~
The level of proved recoverable reserves shown above corresponds
with that quoted by Oil & Gas Journal; the figure of 3 590 billion m3
quoted by C6digaz and OPEC includes both proved and probable
reserves.
38

Indonesia’s
are as are in
Exports of
Japan began
gas production is the highest in Asia. The main
northern Sumatra, Java and eastern Kalimantan.
producing
LNG from Arun (Sumatra) and Bontang (Kalimantan) to
in 1977–1 978. Indonesia has for many years been the
world’s leading exporter of LNG, Shipments in 1996 were chiefly to
Japan (70%) but also to the Korean Republic(24%) and Taiwan,
China(6%). Indonesia exports well over half of its marketed production.
The principal domestic consumers of natural gas are power stations,
fertilizer plants and the steel industry; the residential and commercial
sectors have relatively small shares.
Japan
Oil
I Proved amount in place (crude oil and NGL’s, million tonnes.) I -I
Proved recoverable reserves (crude oil and NGL’s, million tonnes) 7
Production (crude oil and NGL’s, million tonnes, 1996) 0.9
R/P ratio (years) I 7.3
I ‘fear of first commercial production I 18751
Indigenous oil resources are modest: a number of small fields have
been discovered on the islands of Honshu and Hokkaido, including two
in Honshu’s offshore waters. Approximately 50% of Japan’s 1995 crude
output of 14 000
small amounts of
b/d was produced offshore.
NGL’s) has drifted downward
39
Total oil output (including
in recent years.

Korea
In the 1970s, oil and gas exploration
international oil companies with the
offshore Korea was made by
concession from the Korean
government. They drilled 12 exploratory wells.
In 1979, PEDCO took over the exploration business in Korea and has
substantially expanded its business. Since 1983, PEDCO’S ambitious
exploration teams have conducted 63,355 I_-km of seismic survey and
drilled 18 exploratory wells. In 1987 and 1993, they found gas layers, but
the amount of confirmed gas reserves is not enough to develop
40

economically. PEDCO is now evaluating the total domestic continental
shelf, including Block VI-I to get additional gas reserves.
Korea has a vast continental shelf with an acreage of 300,000knf. Only a
limited area was explored. PEDCO will continue its exploration effort
until it becomes an oil and gas producer. In order to share benefits from
oil development on the Korean shelf, PEDCO is seeking honored partners
in the oil business.
Exploration Activities in Offshore Korea
Block Area(w) Seismic(L-km) Exploratory wells
I 36,460 6,477 1
II 39,433 13,301 4
Ill 41,427 8,193
Iv 42,449 11,314 1
v 42,390 11,995 4
VI-I 12,918 33,490 11
VI-2 11,668 10,998 2
JDZ 82,557 19,571 7
East Sea - 2,115
West Sea – 470
Total 309,302 117,924 30
Source : PEDCO(1998)
41

Malaysia
Oil
Proved amount in place (crude oil and NGL’s, million tonnes) I I
\ Proved recoverable reserves (crude oil arid NGL’s, million tonnes) I 526 \
r I
Production (crude oil and NGL’s, million tonnes, 1996) 34.1
LR/P ratio (years) 15.1I
I Year of first commercial production I 191OI
Oil was discovered at Miri in northern Sarawak in 1910, thus beginning
Malaysia’s long history as an oil producer. However, it was not until after
successful exploration in offshore areas of Sarawak, Sabah and
peninsular Malaysia in the 1960s and 1970s that the republic really
emerged as a major producer. Generally speaking, proved reserves have
more than kept pace with production: at end-1 996, they stood at 4
billion barrels, compared with less than 3 billion at end-1 990. After
following a rising trend for many years, oil production has leveled off
since 1995, in line with the government’s National Depletion policy. in
1995, 60% of Malaysian crude oil production was exported, chiefly to
Thailand, Japan, Singapore and the Republic of Korea.
42

Gas
Proved amount in place (billion cubic meters)
Proved recoverable reserves (billion cubic meters) 2271
Production (net, billion cubic meters, 1996) 36.7
R/P ratio (years) 60.9.,
Year of first commercial production 1983
Natural Gas Characteristics
Average Range
Heat value (MJ/m”) 42.0 41-71(gross calorific value, after extraction of NGL’s)
Non-hydrocarbon constituents(%) 3.5 1.3-9.3
Hydrogen sulfide(%) N N
Helium(%) o 0Carbon dioxide(%) 2.8 0.9-8.7
Nitrogen(%) 0.7 0.0-0.8
Exploration of Malaysia’s offshore waters has located numerous fields
yielding natural gas or gas/condensates, mainly in the areas east of
thepeninsula and north of the Sarawak coast, Proved reserves have risen
to over 80 tcf and now rank as the second highest in Asia, after
Turkmenistan.
Malaysia became a major gas producer in 1983, when it
exporting LNG to Japan, This trade has continued
supplemented in recent years by LNG sales to South Korea
China. In 1996, Malaysia was the world’s fourth largest
offshore natural gas.
commenced
ever since,
and Taiwan,
producer of
43
Domestic consumption of gas has also been expanding rapidly in recent
years, the major market being power generation. The other principal
outlet for natural gas, apart from own use within the oil/gas industry, is
as feed stock/fuel for industrial users, Small amounts of CNG are used
in transport, following the launching of a government program to promote
its use.
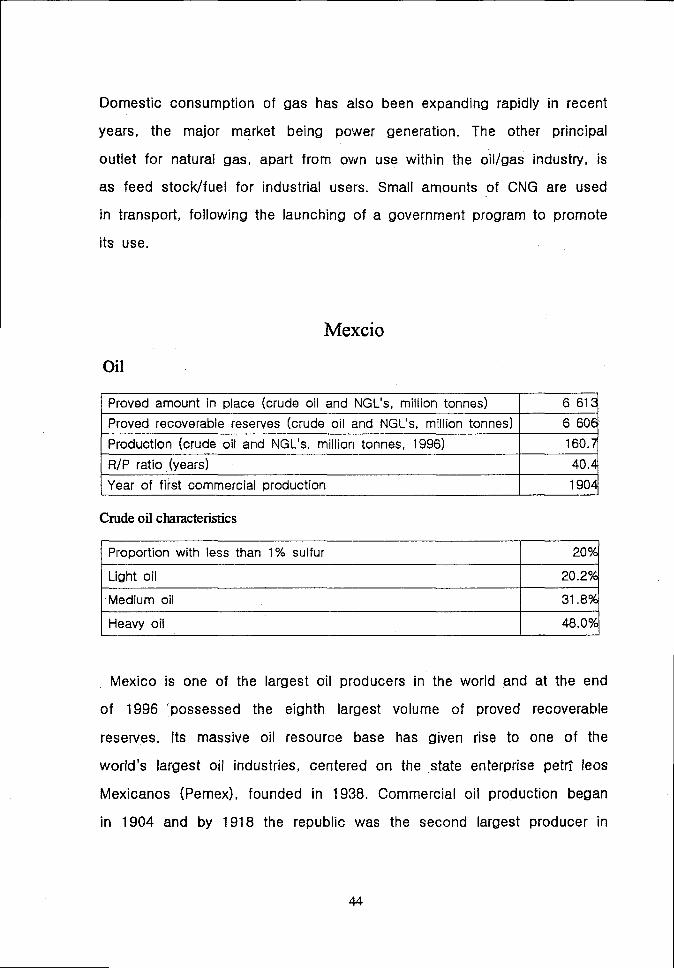
Mexcio
Oil
Proved amount in place (crude oil and NGL’s, million tonnes) 6613
Proved recoverable reserves (crude oil and NGL’s, million tonnes) 6606
Production (crude oil and NGL’s, million tonnes, 1996) 160.7
R/P ratio (years) 40.4
LYear of first commercial production 1904
Crude oil ckmcteristics
Proportion with less than 1% sulfur
\ Light oil I 20.24
] Medium oil I 31.894
IHeavy oi! I 48.0%4
Mexico is one of the largest oil producers in the world and at the end
of 1996 ‘possessed the eighth largest volume of proved recoverable
reserves, Its massive oil resource base has given rise to one of the
world’s largest oil industries, centered on the state enterprise petri Ieos
Mexicanos (Pemex), founded in 1938. Commercial oil production began
in 1904 and by 1918 the republic was the second largest producer in
44

the world. The discovery and development of oil fields along the eastern
side of the country-in particular, offshore fields in the Gulf of Campeche
have brought annual production up to its present level. Output of crude
oil, condensate and NGL’s in 1996 was 3 227 000 b/d; exports of crude
totaled 1,544,000 b/d, of which some 78% were consigned to the USA.
Gas
Proved amount in place (billion cubic meters) 1 916
Proved recoverable reserves (billion cubic meters) 1 810
Production (net, billion cubic meters, 1996) 31.2
R/P ratio (years) 41.7
Year of first commercial production
Natural Gas Characteristics
I IAverage
Heat value (MJ/m”) (gross calorific value, after extraction of NG1.’s) 35.4
Although
they were
largest in
proved reserves have fallen each year since end-1 984, when
assessed as 2 172 billion cubic meters, they remain the third
North America, W}thin the 1996 total of 1 810 bcm, 57.1%
were located in the northern region, 25.4% in the southern region and
17.5% in the marine regions.
Production of natural gas was on a plateau during the early 1990s but
rose sharply in 1996, owing to the availability of associated gas from
new offshore fields. This rise in output was not, however, reflected in a
commensurate increase in marketed production, owing to a major
incident at the Cactus gas–processing plant, which restricted supplies of
45
dry gas (and led to increased flaring in the Gulf of Campeche fields).
By far the greater part-around 80-85%-of Mexico’s gas production is
associated with crude oil output, mostly in the southern producing areas,
both onshore and offshore.
The largest outlet for gas is as industrial fuel/feedstock (61% of total
disposals in 1996): the energy industry consumed about 21%, power
stations 15% and households about 3Y0, Mexico habitually exports
relatively small amounts of gas to the USA and imports somewhat larger
quantities.
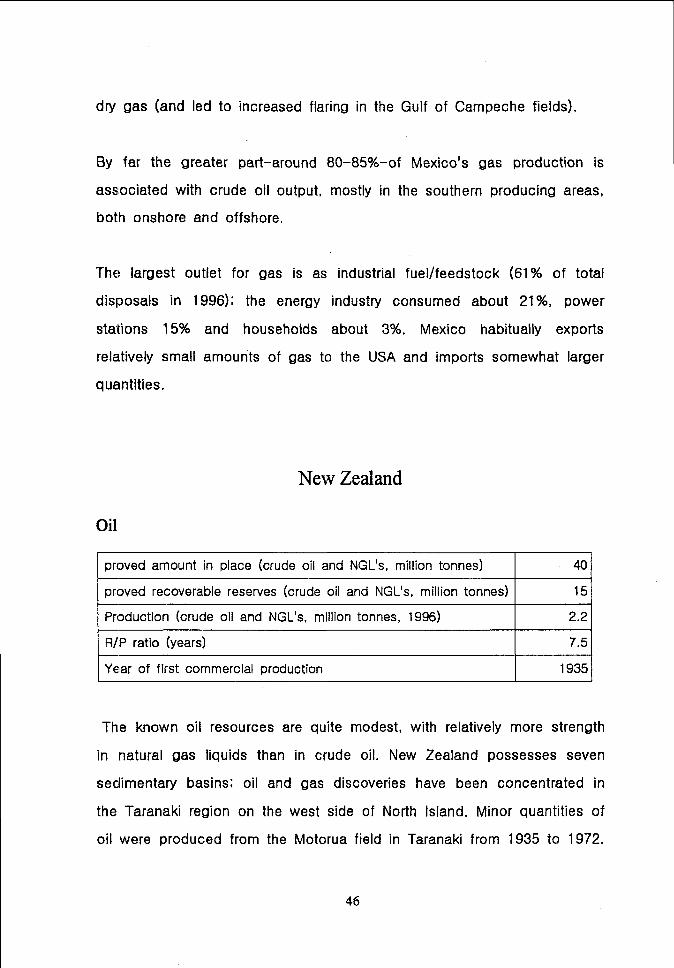
New Zealand
Oil
proved amount in place (crude oil and NGL’s, million tonnes) 40
proved recoverable reserves (crude oil and NGL’s, million tonnes) 15
Production (crude oil and NGL’s, million tonnes, 1996) 2.2
R/P ratio (years) 7.5
Year of first commercial production 1935
The known oil resources are quite modest, with relatively more strength
in natural gas liquids than in crude oil. New Zealand possesses seven
sedimentary basins: oil and gas discoveries have been concentrated in
the Taranaki region on the west side of North Island. Minor quantities of
oil were produced from the Motorua field in Taranaki from 1935 to 1972.
46

Other fields subsequently brought into production include the (onshore)
Kapuni and (offshore) Maui gas/condensate fields and the onshore
Mckee oil field. Estimates of resources and reserves reported by the
Ministry of Commerce are in terms of “proven plus possible” values. Oil
output in 1996 comprised nearly 2 million tonnes of crude/condensate
and 0.2 million tonnes of gas–plant NGL’s. About two-thirds of the
crude/condensate was exported, very largely to Australia and the USA.
Gas
lPmved amount in place (billion cubic meters) I 146/
lProved recoverable reserves (billion cubic meters) I 681
Production (net, billion cubic meters, 1996) I 4.5
R/P ratio (years) 13.3
Year of first commercial production 1970
Natural Gas Characteristics
Average
Heat value (MJ/m=) (gross calorific value, after extraction of NGL’s) 39.7
Non-hydrocarbon constituents(%)I
5.3
Hydrogen sulfide(%) o
Helium(%) o
1
Carbon dioxide(%) 2.6
Nitrogen(%) 2.7
The Maui offshore
hydrocarbon deposit so
about two-thirds of the
gas/condensate field is by far
far discovered in New Zealand; it
countty’s economically recoverable
the largest
accounts for
gas reserves.
47
Effective utilization of its gas resources has been a key factor in New
Zealand’s energy policy since the early 1980s.
The Maui field came into commercial production in 1979 when a pipeline
to the mainland was completed. Three plants were commissioned in the
1980s to use indigenous gas, producing (respectively) methanol,
ammonia/urea and synthetic gasoline.
An extensive transmission and distribution network serves industrial,
commercial and residential consumers in the North Island. Small (and
declining) amounts of CNG are used in motor vehicles.
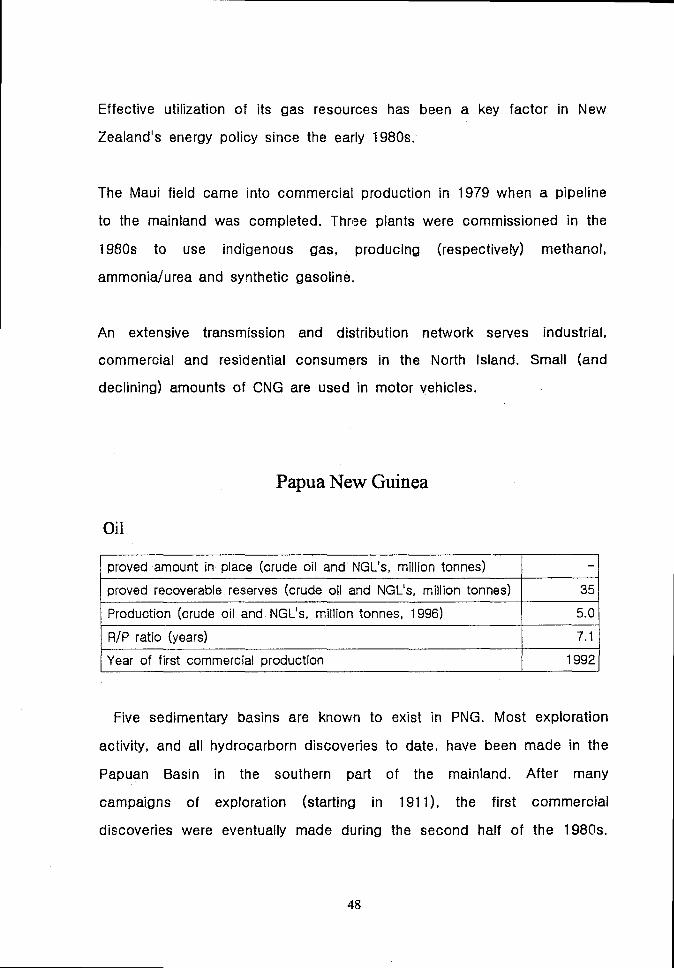
Papua New Guinea
Oil
\ proved amount in place (crude oil and NGL’s, million tonnes) I -\
proved recoverable reserves (crude oil and NGL’s, million tonnes) 35
Production (crude oil and NGL’s, million tonnes, 1996) 5.0
I R/P ratio (years) I 7.11
I Year of first commercial moduction I 1992 I
Five sedimentary basins are known to exist in PNG. Most exploration
activity, and all hydrocarbon discoveries to date, have been made in the
Papuan Basin in the southern part of the mainland. After many
campaigns of exploration (starting in 191 1), the first commercial
discoveries were eventually made during the second half of the 1980s.
48

I
Commercial production began in 1992 after an export pipeline had been
built, The oil exported is a blend called Kutubu Light(45 ‘API). Output
and exports in 1996 averaged just over 100 000 b/d.
Oil
Peru
lProved amount inplace (crude oiland NGL's, million tonnes) I -1
Proved recoverable reserves (crude oil and NGL’s, million tonnes) 109
Production (crude oil and NGL’s, million tonnes, 1996) 5.9
R/P ratio (years) 18.2
Year of first commercial production 1883
probably the oldest oil producer on the South American
Peru’s remaining recoverable reserves are comparatively
not much more than 100 million tonnes, one tenth those of
Although
continent,
slender, at
Brazil, Formany years oil production was centered on the fields in the
Costa (coastal) area in the north-west: from about 1960 onward the
Zocalo (continental shelf) off the north-west coast and the Oriente area
east of the Andes came into the picture. In 1995 the Oriente fields
accounted for about 65% of total oil output, the Costa fields for 19%
and the Zocalo 160A. Production overall has fluctuated within a narrow
band of 120,000-130,000 b/d in recent years,
49

Gas
rProved amount in place (billion cubic meters)
lProved recoverable reserves (biilion cubic meters) I 1991
lProdudion (net, billion cubic meters, 1996) I 1.01
R/P ratio (years) I >100
Year of first commercial production
Proved reserves have been virtually stable at about 200 billion m3 since
1990. Gas output is mostly associated with oil production and its
historical development profile is similar to that of oil-a decline in the
1980s followed by a Ievelling–off in the present decade. An appreciable
prapotilon of production (18% in 1996) is flared .Marketed production of
gas has fluctuated around 1 bcm/year in recent times. Small quantities
are consumed in power stations and as an industrial and household fuel,
but by far the greater part of current output is used in the upstream
operations of the oil and gas industry,
A major step forward for Peruvian gas will be initiated if Shell and Mobil
decide to go ahead with the development of the Camisea gas field in
the south-east of the country.
50

Philippine
Oil
Proved amount in place (crude oil and NGL’s, million tonnes) 40
Proved recoverable reserves (crude oil and NGL’s, million tonnes) 28
Production (crude oil and NGL’s, million tonnes, 1996) 0.05
\ R/P ratio (years) I >100/
I Year of first commercial production I 1979/
Crude oil charectefitics
Average gravity 34.0 “API
Proportion with less than 1% sulfur 33.4%
Light oil 35.0%
Medium oil 65.0%
Heavy oil o
This is one of the more recent arrivals on the Asian
the first discoveries being made in 1976-1977.Except
fields on the islands of Cebu and Leyte, all oil finds
made offshore, in the South China Sea west of the
oil scene,
for a few
have been
islands of
Mindoro and Palawan. Proved reserves of crude oil and NGL’s at
end–1996 were some 225 million barrels, within a stated range of
189 to 261 million barrels. Output from the offshore Nido field
began in 1979, reaching a peak of 42 000 b/d by the end of the
year: a rapid decline soon set in, and national production has
never regained its 1979 level. In recent years, production has

come mostly from another offshore field (West Linapacan), but
water intrusion has cut output back drastically.
Russia Fedration
Oil
I Proved amount in place (crude oil and NGL’s, million tonnes) I -I
I Proved recoverable reserves (crude oil and NGL’s, million tonnes) I 6654 I
I Production (crude oil and NGL’s, million tonnes, 1996) I 301.11
kR/P ratio (years) 21.8
Year of first commercial production
The Russian oil industry has been developing for well over a century,
much of that time under the soviet centrally planned and state-owned
system. In which the achievement of physical production targets was of
prime importance. After World War II, hydrocarbons exploration and
production development shifted to the east, with the opening-up of the
Volga-Urals and West Siberia regions. Production levels advanced
strongly from the mid–1 950s to around 1980 when output leveled off for
.a decade, A decline set in from 1990, bringing total output of crude oil
ancl NGL’s to just over 300 million tonnes (6.1 million b/d) in 1996.
About 40% of oil production is exported.
52

Gas
Proved amount in place (billion cubic meters) 47700
Proved recoverable reserves (billion cubic meters) 47700
Production (net, billion cubic meters, 1996) 601.5
R/P ratio (years) 77.0
lYear of first commercial production I -1
The gas resource
estimates of Russia’s
base is by far the largest in the
proved reserves are twice those of
world: current
Iran and about
ten times those of the USA or Saudi Arabia. The greater part of the
Federation’s reserves are located in West Siberia, where the existence of
many giant and a number of super-giant gas fields has been proved,
The 1996 output of the Russian gas company Gazprom accounted for
94% of the Federation’s output and nearly a quarter of world gas
production. Russia is easily the largest exporter of natural gas in the
world: in 1996, 74 bcm went to Western Europe, 49 bcm to Central
Europe and 73 bcm to members of the CIS,
Chinese Taipei
Oil
I Proved amount in place (crude oil and NGL’s, million tonnes) I -I
Proved recoverable reserves (crude oil and NGL’s, million tonnes) 1
Production (crude oil and NGL’s, million tonnes, 1996) 0.1
I R/P ratio (years) I 5.51
I Year of first commercial production I 19041
53

Crude oil characteristics
I 70%/
Medium oil 30%
Heavy oil o%
The first commercial oil field in what is now Taiwan, China was
discovered in 1904. Other small fields have been located over the years,
but the island’s overall oil resources are insignificant. Proved reserves are
only 4 million barrels and oil output has been static at 1 000 b/d of
crude (plus even smaller amounts of NGL’s) for the past five years.
Thailand
Oil
Proved amount in place (crude oil and NGL’s, million tonnes) 52
I Proved recoverable reserves (crude oil and NGL’s, million tonnes)] 28 I
Production (crude oil and NGL’s, million tonnes, 1996) 3.8
R/P ratio (years) 6.9
Year of first commercial production 1959
Crude oil characteristics
I Average gravity I 39 “APII
I Proportion with less than 1% sulfur
i
Light oil 99.6%
Medium oil 0.4%1
LHeavy oil
54

Resources of crude oil and condensate are not very large in
comparison with other countries in the region. Official data show proved
reserves of oil as 115 million barrels, plus 126
condensate, while additional “probable & possible”
242 and 208 million barrels, respectively. About 35%
million barrels of
eserves are put at
of proved reserves
of oil, together with 100% of those of condensate, are located in
offshore areas in the Gulf of Thailand. Total output of oil (crude oil,
condensate and other NGL’s) has been on a gradually rising trend
throughout the present decade. Exports of condensate and natural
gasoline amounted to nearly 25,000 b/d in 1996.
the United State of America
oil
Proved amount in place (crude oil and NGL’s, million tonnes)
Proved recoverable reserves (crude oil and NGL’s, million tonnes) I 3768
Production (crude oil and NGL’s, million tonnes, 1996) 383.4
R/P ratio (years) 9.8
] Year of first commercial production I 1859I
characteristics
Light oil 39%
Medium oil 35%
Heavy oil 26%
The United States has one of the largest and oldest oil industries in

the world. Although its remaining recoverable reserves are dwarfed by
some of the Middle ,East producers, it is second only to Saudi Arabia in
terms of oil production. Proved reserves of crude oil have been on a
declining trend for many years, whereas those of natural
registered increases since 1994. Crude oil production in
000 b/d and that of NGL’s (including “pentanes plus”)
gas liquids have
1996 was 6 465
was 1 830 000
b/d. The USA exported 110 000 b/d of crude oil in 1996, principally to
the US Virgin Islands (for offshore processing), the Republic of Korea,
Canada, Taiwan, China and Japan.
Gas
Proved amount in place (billion cubic meters)
Proved recoverable reserves (billion cubic meters) I 4714
Production (net, billion cubic meters, 1996) I 532.2
]R/P ratio (years) / 8.1]
LYear of first commercial production
Natural Gas Characteristics
t
Average
Heat value (MJ/m”) (gross calorific value, after extraction of NGL’s) 38.27
For the third successive year, US proved reserves increased in 1996,
‘with additions to reserves being equivalent to 107!X0 of 1996 natural gas
production.
The increase in reserves was partly due to revisions and adjustments to
estimates for old fields and partly to discoveries (field extensions, new
field discoveries and new reservoir discoveries in old field). Total
56

discoveries equaled the highest level in the past decade; they were
predominantly made in Texas and the Gulf of Mexico Federal Offshore,
Offshore development is likely to continue to be spurred by technological
advances in exploration and deepwater production.
About 82% of proved reserves consist of non-associated gas. The states
with the largest gas reserves at end–1 996 were Texas (23.OYO of total
US), New Mexico
Reserves in Federal
16,7% of the total.
(9.9%), Oklahoma (7,9%) and Wyoming (7.4%).
Offshore areas in the Gulf of Mexico represented
Vietnam
Oil
I Proved amount in place (crude oil and NGL’s, million tonnes) I -1
I Proved recoverable reserves (crude oil and NGL’s, million tonnes)\ 82 I
Production (crude oil and NGL’s, million tonnes, 1996) 8.7
R/P ratio (years) 9.4
Year of first commercial production 1986
During the first half of the 1980s oil was discovered offshore in three
fields (Bach Ho, Rong and Dai Hung), and further discoveries have since
been made: proved reserves are assessed at 600 million barrels.
Production of crude oil (averaging 34 API)” began in 1986 and has risen
steadily: at present all output is exported.
Source : Survey o Energy Resources 998 ,WEC (World Energy Council)
57

Australia
Well Cum.Name of fie Id ;:a’”
Depth Prod. API(ft) ~; Total Avg(t)/d)
(19~7;?8bl)Gravity
Mount Homer 19653,800
-5,8002 7 26 20,240 38.0
IEUabiru 1983 4,786 2 2 14,352 7,565,029 42.3
lIIiHarriet 1983 6,230 10 10 10,760 6,668,000 38.2
Anabranch 1965 4,188 . .. 1 4 13,701 44.0
Duarran 1964 4,105 . .. 1 . .. 14,036 37.0
Maffra 1965 4,251 1 2 17 28,086 48.0
Richmond 1963 3,643 . .. 1 2 16,345 43.0
Snake Creek 1964 4,990 . .. 1 4 12,658 67.0
Sunny Bank 1962 6,139 . .. 1 . .. 706 40.0
Trinidad 1965 4,599 ... 2 3 63,446 46.0
!@lBarracouta 1965 4,550 2 2 3,690 33,277,000 62.8
Hbfarlin 1966 5,100 1 4 11,410 54,629,500 50.0
EIKingfish 1967 7,500 26 37 43,440 934,636,400 46.9
Ell+alibut 1967 7,700 10 17 64,290 689,006,000 43.3
l@Mackerel 1969 7,700 18 18 80,790 347,077,800 45.6
HTuna 1968 6,500 20 22 6,780 32,786,700 40.5
❑ lSnapper 1968 4,350 16 21 4,710 11,906,400 47.0
❑ lCobia 1972 7,700 10 12 49,620 65,075,900 44.6
EIWest Kingfish 1968 7,500 15 18 41,800 46,622,780 46.9
58

Discov
Name of field ery
year
lEIFortescue 1978
EIFlounder 1968
Kooroopa 1985
Talgeberry 1985
Washpool 1985
Toobunyah 1985
E- 1985
1986
IBorah Creek I 1982
IKincora I 1980
ISandy CreekI
1982
IWaratah
IITintaburra
I
IMonlor
}
E--Cranstoun
Blina
ISundown
1982
1984
1987
1987
1981
1983
IWest Terrace I 1985
LloydI
1987
Well3epth ‘prod Prod.
CumAPI
(ft) ~el,” Total Avg. (b/d) (I ~:;&bl) Gravity
7,7001 2:
8,2001 t
3,3001 11
3,9001 :II
5,2501 1
3,5001 5,I
3,8001 2
25 91,930 142,895,000 43.0
10 16,960 13,271,900 46.7
1 9 12,312 42.0
3 356 217,882 46.0
1 4 715 35.0
5 300 198,683 43.0
2 11
2,700 1 1 77 44,129 43.0
4,900 1 3 36 11,584 34.0
II4,700 2 2 33 I 296,342 I 34.0 I
4,900 1 1 4 8,685 34.0
5,350 4 4 71 262,047 34.0
3,500 6 6 449 424,864 43.0
4,150 1 1 68 5,875 49.0
4,250 1 1 140 4,071 48.0
4,300 6 6 438 1,058,202 37.0
3,600 4 4 65 165,626 39.0
3,800 1 1 55 105,686 33.0
4,806 1 1 94 14,419 37.0
59

Well Cum
Name of field Di;:;rery D~f:;h ProdProd. API
~el,” Total Avg.(b/d) (I ~~7;:Bb,) Gravity
Bodalla South 19844,800 ~ ~
2,425 2,758,48147..2
-5,230 -48.7
Kenmore 19854,600 48.2
-4,980 9 92,639 1,959,951
-45.8
Black Stump 1986 5,360 1 1 126 118,373 45.2
Glenvale 1985 3,800 1 1 37 17,834 49.3
Jackson 1981 4,750 32 32400
16,354 18,834,000 _48”o
Jackson South 1982 4,800 6 6 1,144 1,884,000 40.8
Chookoo 1985 6,000 3 3 306 245,000 45.0
Wilson 1983 5,000 5 5 458 526,000 40.0
Naccowlah1983 6,000 7 7
40.0
South914 2,069,000 _46 o
Gunna 1983 6,000 1 1 37 71,000 40.0
Tinpilla 1983 6,000 1 1 38 66,000 .40.0
Naccowlah
West1983 5,700 8 8 1,195 1,546,000 40.0
Bogala 1984 6,900 2 2 159 244,000 40.0
Yanda 1984 8,000 1 1 92 41,000 40.0
Mooliampah 1985 6,000 1 1 76 64,000 40.0
Watson South 1985 5,500 1 1 825 511,000 40.0
Sigma 1983 5,700 2 2 132 71,000 40.0
Tickalara 1984 5,600 4 4 291 149,000 40.0
Big Lake 1984 6,600 2 2 29845.0
280,000 _48 o
60

Name of fieldDiscovery Depth
WellProd.
CumAPI
year (ft) P:e; ‘ Total Avg,(b/d) ~19~7;;Bb11 Gravity
Gidgealpa 1984 6,150 10 11 1,809 2,004,00045.0
-50.0
McKinlay 1985 5,100 1 1 36 26,000 41.0
Strzelecki 1978 5,800 16 16 4,518 11,305,00043.0
-49.0
Dullingari 1979 5,200 16 17 3,787 6,587,000 54.0
Narcoonowie 1983 6,000 2 2 134 118,00052.0
-53.0LimestoneCreelyBiala
1984 5,100 9 9 1,454 992,000 41.0
Wancoocha 1984 6,000 5 5 818 1,060,00044.0
-54.0
Muteroo 1985 6,000 3 3 1,785 1,512,000 45.0
Spencer 1986 6,500 4 5 1,038 468,000 47.0
Jena 1985 5,200 1 1 83 56,000 41.0
Alwyn 1985 5,200 1 1 127 77,000 41.0
Merrimelia 1983 . .. 9 9 1,252 2,507,000 .. .
Meranji 1985 . .. 3 3 401 317,000 .. .
Bookabourdie 1985 ... 2 2 116 48,000 .. .
Dirkala 1986 7,000 1 1 697 474,000 56.0
Nungaroo 1985 4,150 1 1 74 39,000 40.0
Ulandi 1985 5,200 1 1 63 62,000 40.4
Watson 1985 . .. 2 2 206 64,000 .. .
Cooroo/CoorooNorth
1986 ... 3 3 1,438 473,000 .. .
61

WellDiscovery Depth prod Prod.
CumName of field
APIyear. (ft) ~e,l’ Total Avg. (b/d) {I &7;&) Gravity
Challum 1983 ... 1 1 19 13,000 ...
Kerinna 1984 4,300 1 1 29 15,000 41.0
Kercummura 1985 ... ... ... ... 1,000 50.8
Cook 1985 ... . .. ... 25 23,000 ...
Toby 1987 ... 1 1 5 1,000 .. .
Dingera 1987 ... 1 1 NA ... .. .
Pitchery 1988 . .. 1 1 NA . .. .. .
Munro 1988 ... 1 1 NA .. . .. .
NaccowalahEast
1988 . .. ‘1 1 NA . .. .. .
Mawson 1987 . .. 1 1 173 51,000 .. .
Pintari North 1988 . .. 1 1 NA . .. .. .
Taloola 1988 . .. 2 2 NA . .. .. .
Sturt 1988 . .. 1 1 NA . .. .. .
Tantanna 1988 . .. 3 3 NA . .. .. .
Tirrawarra 1970 9,500 28 35 4,770 7,685,227 52.0
6151 1,163,6191 46.91
\
Moorari 19717,705 ~
-9,400
Fly Lake 1971 9,300 1 3 94 469,454 53.0
E3rolga 1983 9,547 1 1 39 45,211 53.0
Woolkina 1982 9,700 1 1 26 98,546 51.5
62

Moonie 1961
Alton 1964
H
R%=-l-=
h-iWellDepth prod, Prod.
(ft) ~e~l Total Avg.(b/d)
w4,000 24 36 2,581
1,200-6.7(KI
407 516 17,447
5,250 s ~–5.577
111
%4-++-=1 I I 1
Narrows I 19865,740 1 1
a*
++
3,209,269 48.9
224,561,262 37.7
927,370 35.5
NockatunQa 1983 5,420 4 5
Winna 1985 4,526 1 1\
Koora 1985 4,822 1 2
Thungo 1986 4,670 1 1
Kihee 1986 3,200 1 1
Woodada’c’ 1980 7,400 ,.. . .., #
North Herald 1982 3,937 1 1 ... 15,914 44.0
South Pepper 1982 4,036 1 1 ... 345 44.0
Total 926 1,148 550,000 2,737,768,713
Source: Oil & Gas Journal
+=Ha52.0
59.0
59.0
49.6
46.3
41.7
45.7
44.7
54.0
El OfFsho~, (c)Condenstate, (c)Estimated
63

Brunei Darissalem—
Name ofWell Cum
Di;e’”rery ‘epth Prod.Prod.
Prod.API
field (ft) Total Avg. (b/d)(1987 )(Bbl)well
Gravity
•l Fairley 1969 10,740 37 54 13,157 107,200,000 40.0
~ Amps1963
7,06898 219 43,694
515,500,00041.0
Sw -8,155
❑ Magpie 1975 .. . 16 23 17,718 66,900,000 31.0—
IEk2hampion 1970 4,300 106 210 39,846 285,800,000 34.0
Seria 1929 ... 346 585 20,277—
Rasau 1929 .. . 5 9 4,508
Other . .. .. . 13,000,000 .. ... . .. .
Total 81 119 2,613 22,025,548—
Source: Oil & GasJournal El Offshore, (c)Condenstate, (c)Estimated

Canada
FFName of Discoverfield year
Acheson 1950
IBantry I 1940
Bellshill Lake 1955
Bonnie Glen 1952
HCarson CreekN.
1958
Cessford 1950
Clive 1951
ICountessI
1951
Gilby I 1962
HarmattanEikton I 1955
wIJoffre I 1953
HJudy Creek 1951
Kaybob 1957
Kaybob S. 1958
WellDepth prod Prod.
CumAPI
(ft) ~e,l” Total Avg. (b/d) (I ~:7;:Bbl) Gravity
3,390 62 118 12,986 120,066,226 38.0
2,574-3,300
150 184 6,647 46,537,461 .. .
f2,950 419 432 12,980 58,646,234 ...
3,959144 170 23,229 496,104,770
34.0-6,779 -44.0
8,787-8,935 4’
74 9,967 136,947,486 44.0
2,800-3,028
196 272 3,523 29,739,639 .. .
6,704-6,208
120 169 5,436 49,182,090 ...
2,858-4,272
116 148 7,258 61,650,607 .. .
3,900-5,400
145 318 18,300 312,219,206 32.0
4,201-7,000
85 155 3,116 46,423,510 .. .
3,570 69 84-5,961
2,371 180,961,066 36.0
.. . 87 149 4,131 70,926,216 . ..
8,796-10,75 62 76
4,581 60,444,189 .. .
6,730 33 74
-8,4405,752 73,761,997 .. .
3,179 204 288 5,382 100,259,782 .. .
4,983-6,779
88 167 3,892 81,882,361 .. .
8,307-8,701
190 266 18,915 388,265,226 43.0
4,870 56 88-9,577
5,856 100,629,149 .. .
5,600-0.042
711 100 9,5921 76,445,9821.. .
I

Name of “Well Cum
D’s;::rery Dg;h Prod.Prod. API
field ~el, Total Avg. (b/d) ~,~y;;6b,) Gravity
Leduc-Woodbend
1947 .:’:; 348 737 4,604 375,198,288 40.0
Lloydminster 19331,690
-1,945500 836 5,863 47,200,642 .. .
Medicine1954
5,435River -7,600
246 347 10,220 67,323,063 .. .
Mitsue 1964 5,908 250 386 25,401 271,263,665 43.0
Nipisi 19655,648
-5,726244 340 31,912 263,581,751 41.0
Pembina 1953 _;’;;: 3,315 4,055 93,541 “204’’56”: 32,0 -37.0
Provost 19462,760
-2,898949 1,308 17,938 70,388,031 . ..
Rainbow 19654,994
-6,160261 339 48,992 497,656,724 38.0 -42.0
Rainbow1965
6,102 so 81South -6,400
7,029 62,063,923 .. .
Red Earth 19564,184
-4,878174 259 4,942 36,024,951 .. .
Redwater 1948 _;’::: 587 848 15,145 784,068,674 35.0
Simonette 1958 10,500 33 46 2,460 37,367,554 ...
Snipe Lake 1962 8,500 48 95 3,785 52,574,155 . ..
Sturgeon1953
4,912
Lake S. -8,47192 146 15,992 137,010,616 37.0
Sundre 19548,700
-9,00054 69 3,182 35,791,800 ..4
Swan Hills 1957 8,100 589 !320 40,545 667,109,678 40,0
Swan Hills S. 1959 8,400 178 198 18,009 338,479,554 .. .
Turner Valley 19133,100
-9,150101 158 2,655 138,926,474 39.0
Utikuma Lake 1963 5,624 104 138 4,461 43,380,838 .. .
66

Name of Discovery Depth prodWell
Prod.CumProd.
APIfield year (ft) “ Total Avg.(b/d)
well (1987) (Bbl) ‘raviw
Virginia Hills 1957 9,210 126 183 16,958 141,966,553 34.0
Wainwright 19251,903
-2,200617 760 9,684 65,562,771 ...
Westerose 1952 6,818 28 35 15,048 125,517,746 ...
WillisdenGreen
1956 5,157 572 797 9,416 114,056,076 .. .
Wizard Lake 19514,044 38 48
14,372 318,444,912 .. .5.973
Zama 3,702 136 242 5,914 73,391,28433.0
-37.0
Other .. . 8,770 13,103 358,948 1,501,088,846 ...
Boundary1957
3,418Lake -4,575
287 348 11,171 167,805,481 40.0
Other .. . 391 829 24,749 253,385,577 .. .
All Fields .. . 1,434 1,624 13,479 161,286,112 ...
Steelman 1950 4,600 660 721 9,188 251,994,739 .. .
Weyburn 1955 4,600 809 878 17,793 280,897,407 .. .
Other .. . 12,378 16,144 180,528 1,647,494,821 .. .
All Fields .. . 1,175 1,494 2,293 61,049,607 .. .
Ail Fields .,. .. . ... 9 802,951 .. .
All Fields .. . ... .. . 26,413 54,571,770
Total 37,882 51,744 1,236,553 12,839,976,429
Source:Oil & Gas Journal I@offshore, (c)Condenstate, (e)l%timated
67

Chile
Name of field Discovery Depth Well Prod. Cum APIyear (ft) Prod. Total Avg. (b/d) Prod. Gravity
well (1987)(Bbl)Canadon 1962 6,090 13 63 236 14,468,812 38.4
Daniel 1960 5,806 4 119 165 34,434,471 25.4
Daniel Este 1961 5,523 5 64 490 28,311,574 25.0
Dungeness 1962 5,251 3 19 107 3,915,136 28.6
Posesion 1960 5,622 33 75 838 21,176,251 63.6
Other ... 22 120 2,336 22,192,977 . ..
Calafate 1955 6,045 13 61 1,008 25,561,335 49.3
Catalina Sur 1961 5,779 4 43 25 6,360,443 44.0
Cullen 1954 5,730 16 107 382 40,980,042 41.8
Tres Lagos 1957 5,724 18 84 366 15,826,176 40.1
Catalina 1956 5,756 10 26 1,788 6,204,654 38.7
Gorrion 1986 6,025 6 6 947 375,381 39.0
San Sebastian Norte 1986 6,870 4 4 227 87,726 37.0
Other . .. 33 255 1,538 57,773,725 . ..
Ostion 1977 7,156 15 18 1,468 7,724,254 33.0
Posesion 1977 6,727 12 39 1,102 5,169,663 34.5
Spiteful 1977 6,298 35 82 5,036 41,014,552 34.5
Spiteful Norte 1978 7,150 13 55 799 9,213,168 39.0
Daniel 1977 6,126 28 36 3,140 3,423,262 35.9
Este-DungenessPejerrey 1984 7,229 36 75 7;855 8,274,097 39.0
Jaiba 1978 6,650 2 2 871 25,251 46.5
Total 325 1,353 30,724 352,512,97n
Source: Oil & Gas Journal ❑ Offshore, (c)Condenstate, e)Estimated
68
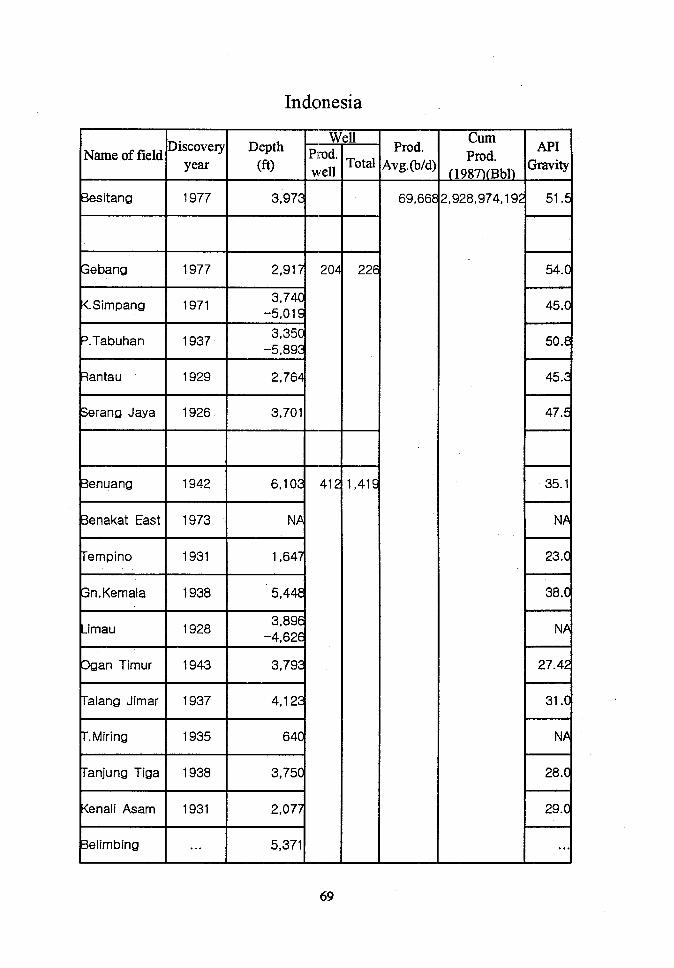
Indonesia
3,974
;ebang I 1977 I 2,91~ 20E
(. Simpang 19713,74
-5.01
‘. Tabuhan I 1937I 3,35-5.89 ~
<antau I 1929 I 2,764
;erang Jaya I 1926 I 3,701
lenuang
3enakat East
fempino
3n. Kemala+
1942 6,10
1973 N
1931 1,64
1938 ‘ 5,4
41
.imau I 1928 I 3,89-4,62 ~
)gan TimurI
1943I
ralang Jimar 1937I
r. MiringI
1935I
ranjung Tiga I 1938 I 3,75(4
(enali Asam I 1931I
II3elimbing . .. 5,37111 1 I
69
~
rotal
22(
1,41$
Prod.4vg.@l@
69,66[
cum ~1
Prod.[1987M3bl)
Gmvity
‘,928,974,192 51.5
54.0
45.0
50.8
45.3
47.5
35.1
NA
23.0
38.0
NA
27.42
31.0
NA
28.0
29.0
.. .

Namoffkld ‘iscove~ D;; :; ‘;oM’ *:g=&year
<uang 1940 5,24S
Cemara 1976-7.10
Jatibarang 1969 3,06
Tugu Barat 1979 3,01
3urlyu 1923 2,07 161 334
Sangatta 1939 1,84
Tanjung 1938 2,29
Tapian Timur 1967 4,39
Wa,rukin S., 1966 2,06
<Iamono 1936
_inda 1977 ‘ 3,281
Sele 1951 2,15
Sa{30 1940 1,80C 354 354
-irik 1939 1,60C
Plolek 1956 2,60C
N.pulai 1941 1,80C
S. F’ulai 1941 1,800
cumProd.
(1987M3bl~
APIGmvity
25.1
..
29.C
..
33.2
33.0
39.s
38.E
26.S
19.0
19.0
35.C
34.C
34.C
34.0
34.0
34.0
70

Nan. of field ‘iscove~ D;: ‘1%: ‘:oal *:g~;,d) ‘“ ‘1Prod.year(1987M13bl)
Gmvity
Talang Akar 1922 2,800 35.0
Benakat 1932 1,60C 35.C
Jirah 1930 2,300 35.0
~ajah 1940 6,000 38.0
Ahab 1951 6,000 36.0
Sembakung 1976 2,600 17 Is 36.C
Elangkudulis 1980 3,250 . .. 1 39.5
Salawati 1976 5,749 7 13 39.2
All Fields1893 2,15~ 71 41~
- 1909 -2,297..
Ardjuna 19692,380 26 33
- 7,25C37.C
Arimbi 1972 ‘2,943 10 12 33.C
3ula 1897280 61 7
- 1,3001,29S 14,632,00C 23.C
~atang 1975 690 12 20 31C 916,000 19.2
3uaya 1978 2,035 . .. 2 .. . 96,00C 28.C
-indai 1971 1,1OC 16 Ie 55C 3,022,000 30.7
Menggala S., 1968 3,765 1 1 480 7,669,00C 33.5
71

DepthWell cum
Name of field ‘lscOveProd. API
ry year . (ft) :; Toti Avg.(bfd) ~ Gravity
Tanjung Medan 1976 2,770 2 7 38C 890,000 37.6
Benua 1978 2,400 19 22 4,930 7,357,000 41.4
Beruk 1974 1,750 17 23 5,310 22,080,00C 38.0
Bungsu 1976 2,05C 7 8 75C 5,303,00C 38.4
3arnar 1974 4,65C 5 6 270 2,225,00C 33.5
3usun 1979 2,550 6 1,310 2,332,00C 42.3
Gatam 1977 2,385 3 .. . 314,000 33.5
<asikan 1972 660 18 2 470 2,894,000 27.3
Beruk NE 1976 1,800 3 9C 796,000 40.0
Osam 1978 900 4 150 384,000 31.8
Paitan 1978 2,315 1 1 Ilc 305,00C 31.6
‘eolada 1973 950 30 31 5,680 32,503,000 33.1
%saka 1977 2,25C 19 2 2,99C 5,101,OOC 34.6
Sabak 1974 ‘ 2,35C 14 1 88C 8,805,00C 35.8
Terantam 1973 90C 4 8C 335.00C 31. 7
Zamrud 1975 3,60 c 5?.5 11,46 c 28,945,00 c 40.QQ
Langgak 1976 1,38 c 1-?2 64 c 2,056,00 c 31. 7
Geudondong 1965 3,19 2 . .. . .. .. . .. 53.1
JUIU Rayeu 1968 2,83 2 9 6 22 1 12,284,05 6 53. 6
ee Tabeu 1971 2,72 1, 37 47 11,891,66 4 50, 3.
72

WellName of field
Discove~ [email protected] Prod Prod. APIyear (ft) ~ell Total Avg.(bid) & Gravity
Alur Cimon 1972 3,098 . .. 34 .. .. 50.8
Tualang 1973 2,631 13 75 2,602 29,601,774 49.9
‘eudawa 1980 3,083 . .. 30 .. . .. 48.1
<Iuang 1913 2,591 3C 88 595 33,674,78Ll 42.6
Mangunjaya 1934 2,700 8 110 138 22,980,07~ 32.0
Tanjung Laban 1982 3,590 16 24 5,609 4,567,078 38.1
qam ba 1982 3,150 60 65 28,360 35,936,98E 37.0
?awa 1985 4,038 . .. 18 1 57,28S 38.7
Tempino 1931 4,493 3 17 152 1,259,127 40.9
Bentayan 1932 4,446 6 13 825 672,555 22.0
Oanerokan 1976 4,915 3 8 3E 178,846 39.4
~Cinta 1970 3,500 36 46 13,158 171,187,861 34.0
ZIG ita 1972 5,000 6 9 1,036 6,452,24~ 34.5
g Kitty 1973 2,700 6 7 1,161 13,61 5,26~ 18.0
2!0 Nora 1973 3,200 3 5 391 8,667,165 29.C
Xl Roma 1974 3,200 44 75 7,381 88,607,804 31 .C
Xl Selatan 1971 4,000 8 19 1,277 20,402,184 19.5
~Zelda 1971 7,50C 27 43 6,303 34,764, 75~ 33.0
lIJKrisna 1979 4,50C 28 41 7,413 57,130,762 37.0
@Yvonne 1980 4,500 9 11 4,016 11 ,317,58t? 36.C
73
Well cum~qme of field D~cc’”cry Depfi Prod Prod.
Prod.API
year. (ft) ~eu” Total Avg.(bid)(1987M3bl)
Gravity
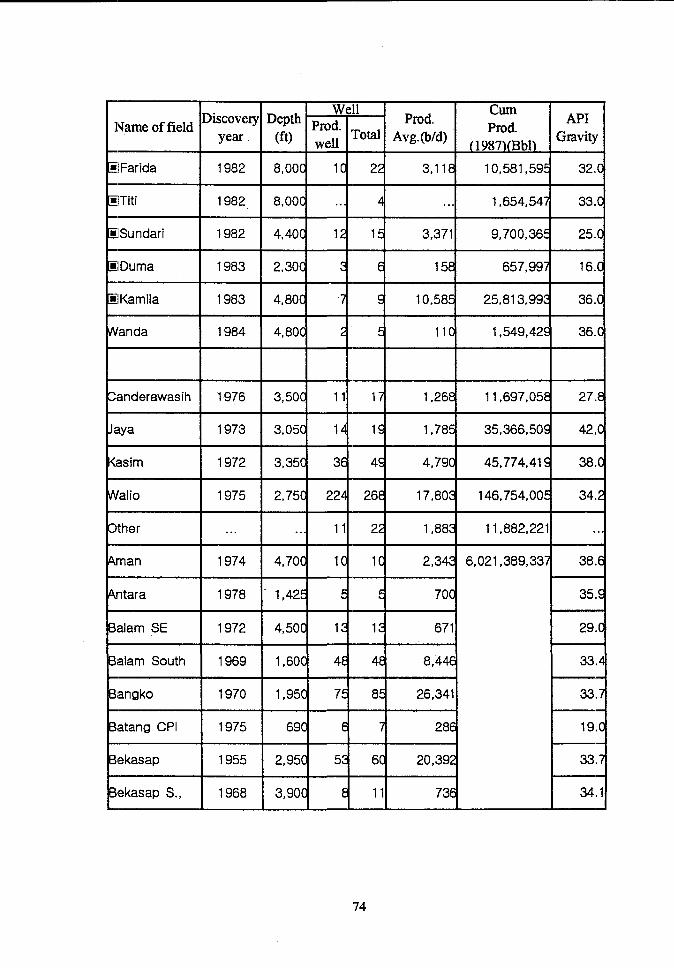
=lFarkja 1982 8,000 Ic 22 3,118 10,581,595 32.0
EITiti 1982 8,000 .. . 4 ... 1,654,547 33.0
ASundari 1982 4,40C 12 15 3,371 9,700,36!5 25.0
@Duma 1983 2,300 3 6 158 657,997 16.0
~Kamila 1983 4,80C 7 9 10,585 25,813,993 36.0
Wanda 1984 4,80C L c 110 1,549,42S 36.C
Canderawasih 1976 3,500 11 17 1,268 11 ,697,05~ 27.8
Jaya 1973 3,050 14 19 1,785 35,366,50S 42,0
<asim 1972 3,350 3E 4s 4,79C 45,774,41 s 38.C
Walio 1975 2,750 224 268 17,803 146,754,005 34.2
Other . .. .. 11 22 1,883 11,882,221 ...
Aman 1974 4,70C lC 10 2,343 6,021,389,337 38.6
Antara 1978 1,425 c K 700 35,9
Balam SE 1972 4,50C 12 12 671 29.0
i3alam South 1969 1,60C 4E 4E 8,446 33.4
Bangko 1970 1,950 75 85 26,341 33.7
9atang CPI 1975 690 6 7 286 19.0
9ekasap 1955 2,950 53 6C 20,392 33.7
Bekasap S., 1968 3,90C 8 11 736 34.1
WellDiscovery Depth ~mdNameof field Prod.
year (ft) well Toti Avg(bid)Prod.
987)(Bbl
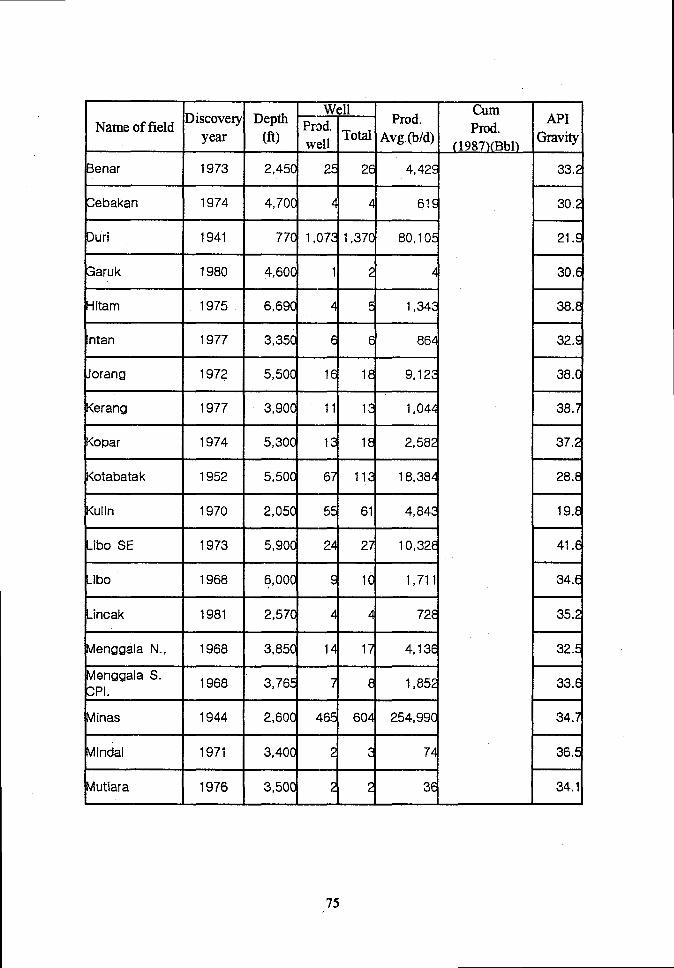
I 1973 I 2,4501 2+ 24 4,42$/
Cebakan 1974 4,700 4 4 61 S
II ri 1941 77C 1,073 1,370 80,105
Saruk 1980 4,600 1 2 4
Hitam 1975 6,69C 4 5 1,343
ntan 1977 3,35C 6 6 864
Jorang 1972 5,50C Id 18 9,123
Kerang 1977 3,900 11 13 1,044%
Kopar 1974 5,300 13 18 2,582
Kotabatak 1952 5,500 67 113 18,384
Kulin 1970 2,050 55 61 4,843
.ibo SE 1973 5,90C 24 27 10,32~
-ibo 1968 6,00C 9 10 1,711
-incak 1981 2,570 4 4 72~
Nlenggala N., 1968 3,850 14 17 4,136
Menggala S.CPI.
1968 3,765 7 8 1,852
Minas 1944 2,60C 465 604 254,99C
Mindal 1971 3,400 2 3 74
Ylutiara 1976 3,500 2 2 3E
75

—I i
Name of fieldDiscove~ Depl
year (ft) well -..
YeHa 1977 5,000 3 3 47
Obor 1978 7,370 1 1 149
‘ager 1974 4,30C 23 25 6,544
‘e!ita 1977 6,600 G 5 621
aernatang 1959 3,750 37 43 8,682
‘ernatang Bow 1969 5,300 5 9 851
Pemburu 1981 2,30C 8 9 3,70s
Perkebunan 1977 2,300 . .. 1 .. .
Petani 1964 4,750 33 34 14,478
‘etapahan 1971 4,500 23 28 5,736
‘inang 1971 3,950 19 2C 2,355
‘inggir 1972 3,300 5 6 373
Pinggir S., 1973 3,300 2 2 56
Qudu 1972 5,950 8 12 1,614
‘uncak 1979 2,400 14 14 3,769
Pungut 1951 3,40C 27 27 4,850
?angau 1968 6,1OC 3 10 104
Rantaubais 1972 1,07C 14 16 543
~ckiri 1979 6,100 . .. 2 ..
Seruni 1972 3,00C 22 23 4,821
(l Y3’7)(kJt)J)
7’6

~me offieldDiscoveV Depthyear (ft) ,,w*,
\ lYO/ )IDUL}
Sikladi 1975 4,340 18 18 2,593 39.8
Singa 1977 3,200 1 1 55 31.0
Sintong 1971 3,400 1s 20 2,005 32.3
Sinton SE 1973 4,50C .. . 1 .. 36.1
Suram 1971 1,750 4 6 252 27.7
Tandun 1969 3,000 9 9 740 33.2
Telinga 1975 4,205 7 8 925 33.3
Topaz 1977 5,200 7 7 1,992 33.2
Yopi 1979 3,63C 1 1 62 36.7
Tunas 1983 4,819 2 2 370 35.0
Jbi 1976 4,35C 20 21 1,584 35.1
Waduk 1982 6,100 Ic 11 324 37.e
Binio 1972 1;600 2C 21 454 11,677,943 34.0
‘ekan 1976 3,700 22 22 795 7,573,274 35.0
Llerbau 1979 2,70C 2E 26 1,299 6,334,383 36.0
<erum utan 1980 3,000 22 23 1,162 4,711 ,49d 35.0
Y Merbau 1980 2,60C 8 9 272 2,750,090 36.0
?anduk 1981 2,500 6 6 228 1,401,271 46.0
77

DiscoveryWell
Depth ‘ ~d Prod.Name of field
yeq (ft) ‘- ToMAvg.(b/d) ~well
Kayuara 1982 3,70G 9 lC 55s 1,878,81C 35.
1983 2,800 17 17 1,505 1,928J59 34.
3. Kayuara 1983 3,50C 45 49 5,698 5238.225 35.
Mutiara 1985 2,70C 2 2 79 97,163 34.
other 4,60C ... .. ... 9,175
;bul 1970 5,70C 12 14 76C 21,667,05C 36.
Rambutan 1972 4,500 5 7 29 3210,751 42.
glTabuan(PSC) 4,00C 10 lC 1J2C 1,178,193 34,
Jene 1985 6,50C a lC 93564 4,085,391 35.
Pian 1986 6,000 1 1 217 26,512 36.
~Kerang (PSC) 1984 2,90C 2 3 744 271,616 35.
[I.agan 1986 2,40C 4 4 290 111.815 56,
,other 4,50C 3 3 196 868,406 ...
5,19C3aqak 1972
-10,60c3[ 107 5,362 37,953,108 32.C
7,50C j ~ ~aYilam 1974
-1I,50C > 18,47023 S 32.
?amaguan 1974 900- 5,1OC 142 7 1,962 5,898,117 30.C
Mutiara 1984 900-5,80 cl 21 9 2,599 2,961,789 30,C
embed 19742,900
-10,10~ “““1 6 “’“7,054 35.0

WellName of field ‘iscovev D;: ~1 ~o,d *::;;d) ;:. ‘1
year(1987M3bl)
Gravity
~Tambora” 1980 8,000- 13,00 4,1 0s 5,667,498 33.C
@lHandil 1974 272 115,033 617,340,703 33.C
El Bekapai 1972 15,845 152,065,282 40.0
2Attaka 1970 47,116 433,197,460 39.0
#EIMelahin 1972 7,50 3 6 888 6,217,272 23.1
~Kerindingan 1972 8 2C 5,038,615 23.8
ELSepinggan 1973 5,855 41,580,242 34.0
@Yakin 1976 8,917 18,290,674 18.8
S Rajah 1981 5,50 3 3 1,672 3,596,380 33.8
@lUndang 1974 8,646 53,319,790 40.0
~Kepiting 1982 6,00 2 2 2,57C 1,094,050 37.C
Arun 1971 ‘ 10,05 57 110,815 293,625,359 55.0
Samboja 1909 360-4,38 28 126 487 64,387,468 21.0
Sanga Sanga 1897 275-6,00 107 24C 2,941 266,631,554 32.0
Tarakan 1906 200-6,54 130 1,165 1,73C 210,151,159 20.0
211Kakap KH 1980 16,150 9,343,000 45.0
L
79
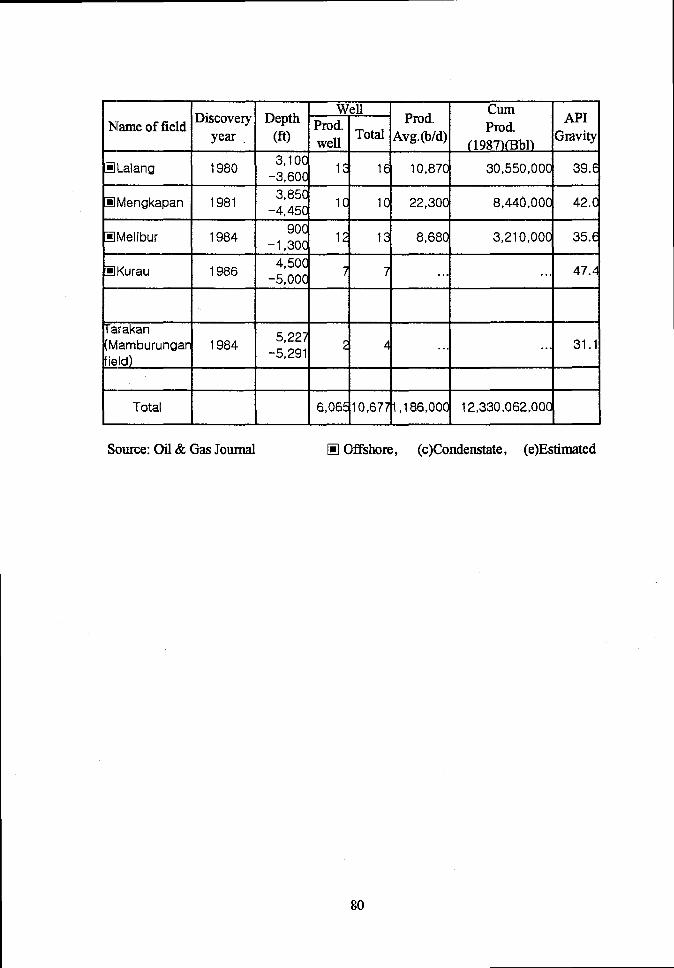
well cumDiscoveg Depth prod Prod. API
Name of field(ft)
Prodyear well” TOWIAvg.(bid)
[1987M13bl)Gravity
ZILalang 19803,1 Oc ,=
-3,600Ie 10,870 30,550,00C 39.E
~Mengkapan 19813,85
8,440,000 42.C
Iil Melibur 198490C ,
-1 ,30C13 8,680 3,21 0,00C 35.6
~ Kurau 19864,500
-5,00C7 7 . .. . .. 47.4
Tarakan(Mamburungar 1984
5,227-5,291
2 4 . .. . .. 31.1field)
Total 6,065 10,677 1,186,000 12,330,062,000
Source: Oil & Gas Journal El Offshore, (c)Condenstate, (c)Estimated
80

Japan
Discovery DepthWell
Prod.Cum
Name of fieldAPI
year (ft) p;e;” Total Avg. (b/d) (I ~~;fBb,) Gravity
I❑ lAga-Oki I 1972 I 7,590 7] 71 12,2001139,623,0001 24.8[
lEIHigashi-Niig1965
4,500 ,8 28ata -9,200
53.9
I@Sarukawa 19582,000
-3,20062 134 32.3
EdYoshii 1968 8,000 9 25 61.8
EIYurihara 19761,310 ~ ,4
-7,61043.5
EIKatakai 19603,310
-16,300 5 ‘650.0
❑ ilOther .. . . .. 56 77 .. .
El Agaoki-Kits 1982 4,950 10 10 33.0
EIYabase1933 1,100
-5,800 6’ 7333.0
EIMinami-Aga 19647,300
-9,600 ‘0 2638.5
lEIMinami 1984 13,200-Nagaoka -15,100 5 “
55.7
EdHagashi1970
6,000-Kashiwazaki -8,900 6 ‘3
62.0
lEIKubiki1959 1,100
-6,40094 125 29.7
❑ lOther 35 47 k .. .
Total387 606
12,200 139,623,000
Source: Oil & Gas Journal EdOffshore, (c)Condenstate, (e)Estirnated
81
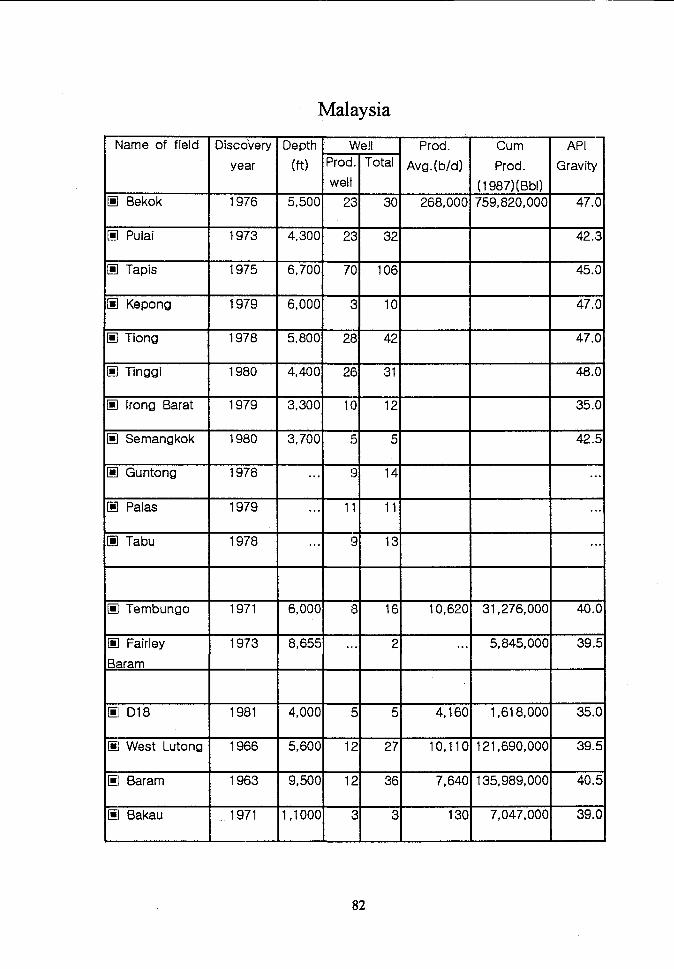
Malaysia
Name of field Discovery Depth Well Prod. Cum API
year (ft) prod. Total A“g-(b/d) Prod. Gravitywell (1987) (Bbl)
@ Bekok 1976 5,500 23 30 268,000 759,820,000 47.0
~ Pulai 1973 4,300 23 32 42.3
II Tapis 1975 6,700 70 106 45.0
iJ Kepong 1979 6,000 3 10 47.0
iJ ~ong 1978 5,800 28 42 47.0
El Tinggi 1980 4,400 26 31 48.0
~ IroflgBarat 1979 3,300 10 12 35.0
~ Semangkok 1980 3,700 5 5 42.5
iJ Guntong 1978 .. . 9 14 . ..
d Palas 1979 .. . 11 11 . ..
~ Tabu 1978 .. . 9 13 . ..
El Tembungo 1971 6,000 8 16 10,620 31,276,000 40.0
~ Fairley 1973 8,655 . .. 2 ... 5,845,000 39.5
laram
d D18 1981 4,000 5 5 4,160 1,618,000 35.0
@ West Lutong 1966 5,600 12 27 10,110121,690,000 39.5
El !3aram 1963 9,500 12 36 7,640 135,989,000 40.5
El Bakau 1971 1,1000 3 3 130 7,047,000 39.0
82

F==
l===
EE Baronia
I@ Betty
E Tukau
E Bokor
❑ Siwa
I
TDiscovery Depth
year (ft)
z1972 3,100
1976 4,200
$1967 7,900
1967 7,900
1966 5,000
1972 2,000
1973 4,100
z1975 2,200
1977 6,785
1972 5,700
1977 4,80C
— Well Prod. Cum API~d. Total Avg+(bfd) Prod. GravityNell (1987 )(Bbl)
18 31 9,070 36,211,000 35.0
6 7 13,750 21,719,000 35.0
B 1
19 40 15,260 148,770,000 42.0
13 17 14,320 62,327,000 38.0
26 48 22,600 91,749,000 29.2
18 19 24,140 34,011,000 35.0
4 4 1,360 1,496,000 25.0
I i 1 1
4 4 3,920 9,331,000 37.01 I t 1
7 15 3,010 13,499,000 30.0,
11 14 16,360 20,271,000 32.0’
15 19 6,630 21,620,000 30.0
49 70 53,370 235,380,000 37.0
1 6 550 901,000 33.0
Source:Oil & Gas Journal I@ Offshore, (c)Condenstate, (c)Estimated
83
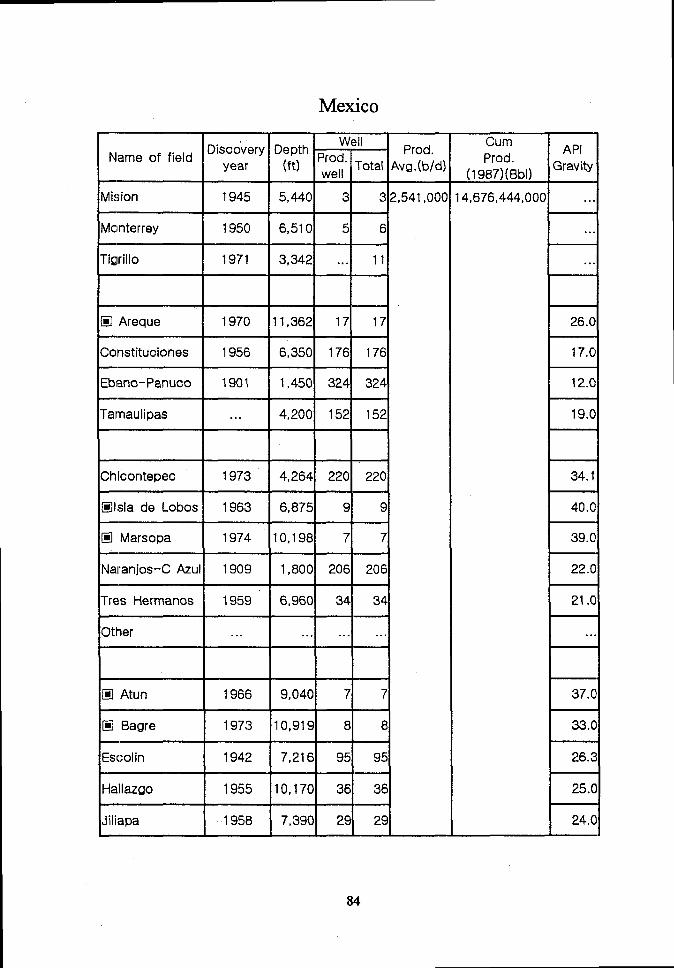
Mexico
LWell
Name of fieldDiscovery Depth ‘prod
year (ft) ~el, ” Total A
IMision I 1945 I 5,4401 31 312
Monterrey 1950 6,510 5 6
Tigrillo 1971 3,342 .. . 11
@l Areque 1970 11,362 17 17
Constituciones 1956 6,350 176 176
Ebano-Panuco 1901 1,450 324 324
Tamaulipas I ... I 4,2001 1521 1521
Chicontepec 1973 4,264 220 220
❑ llsla de Lobos 1963 6,875 9 9
❑ Marsopa 1974 10,198 7 7
Naranjos-C Azul 1909 1,800 206 206
Tres Hermanos 1959 6,960 34 34
Other . .. . .. .. . .. .
El Atun 1966 9,040 7 7
❑ Bagre 1973 10,919 8 8
Escolin 1942 7,216 95 95
Hallazgo 1955 10,170 36 36
Jiliapa 1958 7,390 29 29
84

WellDiscovery Depth prod Prod.
CumName of field
APIyear (ft) ~ell” Total Avg.(b/d) ~,~~7;:ab,) Gravity
Mecatepec 1941 7,544 32 32 29.8
Miquetla 1959 6,480 57 57 35.0
Poza Rica 1930 7,090 132 132 35.0
Pres Aleman 1949 8,036 86 86 26.0
Remolino 1962 10,745 36 36 29.5
San Andres 1956 10,410 123 123 29.0
Other . .. . .. 315 316 . ..
Matapionche 1974 11,129 29 45 35.6
Other .. . . .. 22 31 . ..
Ixhuatlan Ote 1965 1,960 20 34 22.6
Moloacan 1962 500 170 207 22.3
Santa Rosa 1952 1,312 6 9 25.4
Acuatempa 1955 .4,085 6 6 21.0
Muro 1965 3,966 11 19 17.0
Ordonez 1952 5,220 8 8 21.0
Ocotepec 1953 3,737 13 13 20.0
Santa Agueda 1953 4,780 3 3 16.0
Other . .. 57 57 . ..
Agata 1956 3,830 9 15 . ..
Bacal 1976 3,500 24 40 35.0

Well CumName of field Di=;::re~ D;:; Prod.
Prod. API~e,, Total Avg. (b/d) ~,~~;:gb,l Gravity
Conception 1974 1,600 3 15 31.0
Cuichapa 1935 2,200 63 123 30.0
El Plan 1931 1,700 67 86 30.0
Lacamango 1973 1,700 18 27 26.3
Los Soldados 1953 4,492 18 22 32.0
Other . .. 26 38 . ..
Blasillo 1967 7,216 31 58 40.0
CincoPresidentes
1960 6,862 73 134 35.0
BllrrO 1931 2,200 23 38 26.0
Vents 1954 4,730 20 83 41.0
Ogarrio 1957 5,790 57 194 38.0
Otates 1965 7,469 12 18 39.0
Rodador 1971 11,398 14 14 26.0
SanchezMagallanes
1957 4,240 73 345 27.0
San Ramon 1967 9,517 29 65 30.0
Tonala 1928 1,770 31 61 28.0
Other ... . .. 3 15 ., .
86

WellName of field
13iscovery Depth prod Prod.year (ft) ~el, ” Total Avg.(bid)
lAgave I 1977 I 13,4501 71 161
Arroyo Zanapa 1978 14,599 1 2
Arteza 1977 11,800 3 5
Ayapa 1972 8,200 3 5
Cacho Lopez 1977 14,250 1 1
Cactus 1972 14,100 14 30
Carrizo 1962 3,500 18 35
Castarrical 1967 10,080 38 59
Comoapa 1979 14,432 4 6
Copano 1977 11,890 9 10
Cunduacan 1974 13,775 12 42
El Golpe 1963 3,500 93 135
Giraldas 1977 15,225 21 22
Iride 1974 13,775 12 16
Muspac 1982 9,676 1 13
Mecoacan 1957 2,200 17 30\
Mora 1981 ... 61 63
Mundo Nuevo 1977 11,800 4 5
Nispero 1974 14,100 4 18
Paredon 1978 15,690 12 13
CumProd.
API
[1987) (Bbl) ‘raviw
41.7
38.9
26.4
7.2
29.0
31.5
23.3
29.3
44.5
43.9
28.9
25.7
37.0
28.5
57.0
8.6
38.1
46.0
34.4
39.8
87

Discovery DepthWell
Name of fieldyear (ft) F“e:” Total
Prod.Aver.(b/d)
10xiacacwe I .. . I 11,1501 51 211
lSamaria(Cret) I 1973 I 14,2091 261 491
ISantuario I 1966 ISitio Grande 1972 13,766 19 22
Sunualpa 1978 12,887 2 7
Tapijuapa 1982 15,613 1 12
Tintal 1968 5,904 4 6
lTopen I 1978 I 11,1721 21 31
ITupilco I 1959 I 9,685 671 101
Bellota 1982 17,056 9 12
Cardenas 1979 17,548 26 45
Chiapas 1979 12,136 5 7
1Fenix 1979 17,876 4 7
Iris 1979 14,432 8 8
Jujo 1980 17,548 18 19
Caparroso 1982 18,368 1 1
Tecominoacan 1983 19,519 1 5
}
Jolote 1983 18,119 1 1
Artesa Terc., 1984 .. . 2 3
88

Discovery DepthWell
Name of fieldProd.
year (ft) p’e;” Total Avg. (b/d)
;arm ito 1980 10,050 1 1
:den 1983 17,590 1 2
;amaria Terc., 1965 4,920 16 23
)ther ... ... 16 37
EICantarell 1976 8,528 63 75
EIAbkatun 1978 11,800 25 35
KIKu 1979 10,000 8 15
EIPOI 1979 12,600 8 8
ilChuc 1982 13,100 1 3
Ellxtoc 1984 . .. 1 2
Total 3,768 5,120 2,541 ,00(
Cum-i
Prod.API
(1987) (Bbl) ‘raviw
45.6
38.5
13.9
. ..
21.3
30.0
22.0
35.0
35.0
35.0
14,676,444,000
Source:Oil & Gas Journal g offsho~, (c)Condenstate, (c)Estimated
89

New Zealand
od.
~
Na”me of field Discovery Depth
tEl Maui 1969 11,000 12 14
Mckee 1980 7,848 17 19-8,251
Kaimiro 1982 11,900 1 1
Tariki 1986 ... 1 1
Ahuroa 1987 .. . 1 1
Total 40 45 2900C
Cum I API
-t-
prod. gravity(1987)(Bbl)78,539,000 54.(
F!j8.(
38.!
r 46.’
L.,+ ,
Souree:Oil & Gas Journal ❑ Offshore, (c)Condmstate, (c)Estimated
90
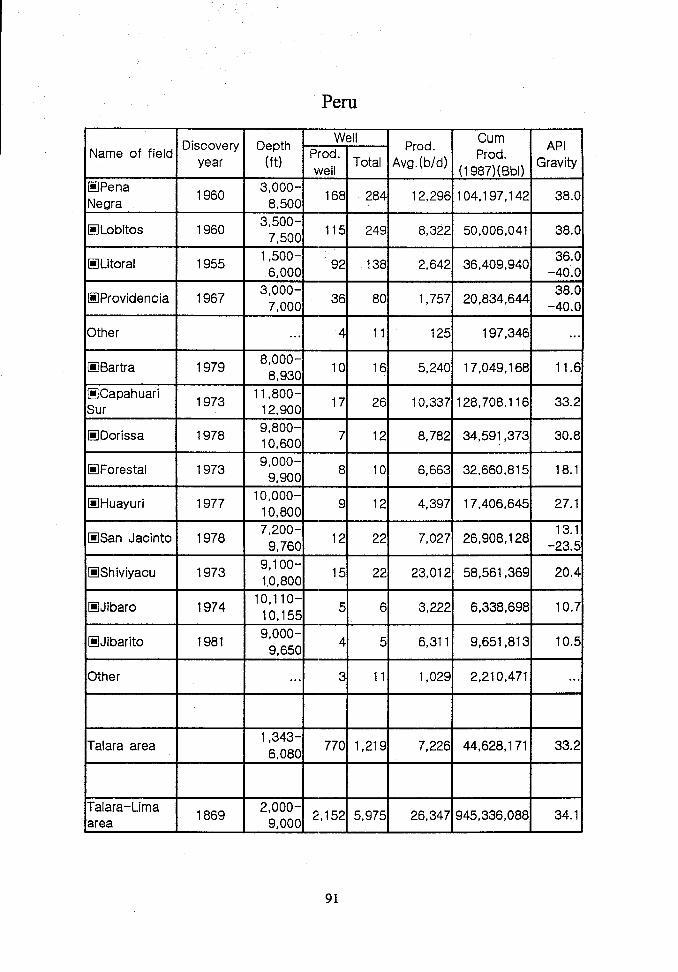
Peru
Discovery DepthWell
Prod.Cum
Name of fieldAPI
year (ft) p:e:” Total Avg. (b/d) (I ~~7.:6bl) Gravity
❑ lPena1960
3,000 -
Negra 8,500168 284 12,296 104,197,142 38.0
❑ lLobitos 19603,500-
7,500 115 249 8,322 50,006,041 38.0
❑ lLitoral 19551,500- 92 138 2,642 36,409,940
36.06,000 -40.0
❑ lProvidencia 19673,000- 36 80 38.0
7,0001,757 20,834,644 _40 o
Other .. . 4 11 125 197,346 .. .
❑ lBartra 19798,000- ,0 ,6
8,9305,240 17,049,168 11.6
HCapahuari1973
11,800- ,7 26
Sur 12,90010,337 128,708,116 33.2
EIDorissa 19789,800-10,600 7 ‘2
8,782 34,591,373 30.8
EIForestal 19739,000- 8 ,0
9,9006,663 32,660,815 18.1
lEIHuayuri 197710,000- ~ ,2
10,8004,397 17,406,645 27.1
lEISan Jacinto 19787,200- 13.1
9,760 ‘2 227,027 26,908,128 _23 s
❑ lShiviyacu 19739,100- ,5 22
1,0,80023,012 58,561,369 20.4
lEIJibaro 19741o,11o-
10,155 5 63,222 6,338,698 10.7
❑ lJibarito 19819,000- 4 s
9,6506,311 9,651,813 10.5
Other .. . 3 11 1,029 2,210,471 .. .
Talara area1,343-
6,080770 1,219 7,226 44,628,171 33.2
Talara-Limaarea
1869 2::; 2,152 5,975 26,347 945,336,088 34.1
91

Name of field
2orrientes
Pzwayacu
N. Esperanza
‘tanayacu
Oapirona
dalencia
%Wa Central
Total
)iscoveoyear
1971
1972
1980
1974
1972
1975
Well CumD;f;; Prod
Prod. API
~el,” Total Avg.(bid) (1 ~~7;:Bb,) Gravity
10,000-12,600 32 36
22,823 86,601,829 29.8
9,600-11,300 ‘0 ‘4 3,301 15,315,532 30.2
10,200 z a-10,700 1,149 4,549,394 44.0
.11,400 7 8
-13,600 1,295 3,771,578 19.1
. ..I 46 53 1,460
3,529 8,219
Some: Oil & Gas Journal E Offshore, (c)Condenstate, (c)Estimated
92

Name of field
!@South Nido
❑ Matinloc
❑Cadlao
South Tara
Total
Philippines
Discovery DepthWell
Prod.Cum
APIdate (ft) p;e;” Totoal Avg. (b/d) (I ~y;:eb,) gravity
19776,576
-6,885 3 5684 15,200,730 27.1
19786,656
-6,750 5 52,684 8,853,496 43.[
19775,734 z z
-5,8812,085 9,203,358 45.(
19874,335
-4,436 ‘ ‘52 19,078 40.1
11 13 5,505 33,276,662
Source: Oil & Gas journal El Offshore, (c)Condenstate, (c)Estimated
93

Chinese Taipei
WellDiscovery Depth prod Prod.
CumName of field
APIyear (ft) “ Total Avg. (bfd)
(19~7t?Bbl)wellGravity
‘iechengshan’c’ 1959 . .. 25 33 1,060 15,306,500 51.0
:hingtsohuic’ 1967 . .. 5 18 48 50.0
‘unghoshan’c’ 1971 . .. 23 33 270 6,301,067 45.0
;huhuangkeng’c’ 1960 . .. 24 26 146 50.0
iJ CBK~cJ 1986 . .. 4 9 1,089 417,981 47.0
Total 81 119 2,613 22,025,548
Source:Oil & Gas Journal El Offshore, (c)Condenstate, (c)Estimated
94

Thailand
WellDiscovery Depth prod Prod.
CumName of field
APIyear (ft) we,,” Total Avg. (b/d) (I ~:;;Bb,) Gravity
ElErawan ,i=’ 1973 7,000 88 119 6,356 14,446,200 54.6
EIBaanpot,’c’ 1980 7,000 20 21 438 1,180,400 54.6
BIPlatong, ~cJ 1976 8,500 29 43 3,647 4,084,700 59.1
ELSatun,’C) 1980 8,500 56 58 4,728 4,020,500 55.1
5,258 so 61~irikit 1981
-5,97616,180 27,865,000 41.0
lirikit West 1983 5,500 2 2 500 474,000 41.0
‘ru Krathiam 1984 . .. . .. 2 30 11,000 19.0
Total 245 306 31,879 52,081,800
Source: Oil & Gas JournallEloffshm, (c)Condenstate, (c)Estimated
95

Australia
Name of fieldDisc. Depth Prod. 1995 Prod. API
date ft oil well avg. , bld grav”@
AUSTRALIA lgWandoo 1991 2,000 5 13,190 19.5
APACHE HAlkimos 1994 6,207 1 39 39.0
❑ jlHarriet 1983 6,230 13 10,904 38.2
❑Tanarni 1991 6,010 1 683 43.0
BHP ❑Challis/Cassini 1984 5,000 7 8,400 39.5
‘ETROLEUM ❑ lGriffin area 1989 8,630 9 53,700 55.0
PN .LTD t@Jabiru 1983 4,786 5 12,300 42.3
l@3kua 1986 7,545 2 3,700 42.5
BORAL Beharra
ENERGY1990 10,827 3 57 62.0
springs(c)
7ESOURCESKatnook (c)
LTD.1989 9,394 2 41 52.0
CONSOLIDA
TED GAS Woodad(c) 1980 7,800 6 6 53.6
PTY. LTD.
DISCOVERYMount Honrer
‘ETROLEUM1965 4,987 7 380 35.5
—❑ Barracouta 1965 4,550 8 2,100 62,8
tEIBream 1969 6,200 16 17,800 45.4
❑ lCobia 1972 7,700 9 8,400 44.6
❑ Dolphin 1967 4,000 1 5,800 45.0
❑ Flounder 1968 8,200 13 22,600 46.7
ESSO–BHP ❑ Fortescue 1978 7,700 17 20,200 43.0
❑ lHalibut 1967 7,700 15 28,800 43.3
❑ Kingfish 1967 7,500 32 36,000 46.9
❑ Mackerel 1969 7,700 25 18,600 45.6
lEIMarlin 1966 5,100 18 10,000 50,0
❑ Perch 1968 3,700 1 3,700 41.0
96

Name of fieldDisc. Depth Prod. 1995 Prod. API
date ft oil well avg. , b/d 9rav-&
EiSeahorse 1978 4,700 1 500 5.0
iIdSnapper 1968 4,350 8 5,200 47.0
lEITarwhine 1981 4,500 1 4,900 65.0
ETuna 1968 6,500 15 13,300 40.5
lEIWest Kingfish 1968 7,500 20 29,400 46.9
EilWhiting 1983 4,800 4 1,500 52.9
MOSAIC OILFairymount 1985 6,700 4 96 50.3
N.L. ‘
Barrow Island 19641,200
438-6,700
13,393 37,7
WAPETDongara 1969
5,2501
GROUP56
-5,57735.5
Thevenard 4,600
Island1985 21
-5,75046,339 48.2
WESTERN l@Chervil 1983 3,450 2 520 44.0
MINING HNorth Herald 1983 4,000 1 170 42.0
CORP. ❑ iSouth Pepper 1982 4,000 7 3,000 42.0
WOODSIDE
OFFSHORE❑ lGoodwyn 1972 9,680 5 29,400 29.4
PETROLEUM❑ lNorth Rankin 1972 9,840 19 35,600 54.5
PTY. LTD.
AGL Mereenie 1964 4,000 24 45,443 48.9
+TROLEUM( Moonie 1961 58,000 19 44.5
e) Roma . ...
OIL Bargie 1994 5,682 1 45.6COMPANY
OFBlack Stump 1986 3,815 1 45.2
‘USTRAL’A Bodalla South 19844,789
6 47.8LTD. (e) -5,215
97

Name of fieldDisc. \ Depth
date ft
Prod. 1995 Prod. API
)il well avg. , b/d 9 rav-@I I
I 1
3ogoon River1990 4.660 11 I 47.8
YAllaSt
<enmore 1985
Fliverslea 1981
4,593
-A QRfI
4,950J--l l-----
2 I I 48.2
----/
1 1-37.05,350
5,250 ] 34.0
1 I I 35.04,884
BHP
‘PETROLEUM
Beechwood
(c)1981 5,692 1 I I 38.0
L....Boxleigh (c) 1970 5,300
Broadway (c) \ 1983 . ...
5,790
5,817
5,463
Il-ark (c) 1993 1 ....
1 ....
1 ....
1 ....
6 .. ..
2 . .. .
5 47.0
1 ....
North Boxleigh ,991
(cl
Roswin North
(c)1992 5,873
Roswin (c) 1984 5,756
5,300
5,430
Toylor (c) 1988 5,538
5,817
98

Disc.Name of field
Depth Prod.
date ft oil well
3ANTOS (e)
3ANTOS (e)
Blina 1981 4,300 6
I I 1
Dilkera 1986 3,446 1
Koora 1986 3,176 1
, I
Nockatunga 1983 3,318 3
Sundown 1983 3,800 3
ThungoI
1986I 3,998 I 5
West terrace 1983 I 3,800I
o
Winna I 1985 I 3,334 I 2
Bogala I 1984 I 6,900 I 346
Challum 1983 ....
I IChookoo 1985 6,000
Cook I 1985 .. .. ICooroo 1986 .. ..
1995 Prod.
avg. , b/d
API
g rav ‘ty
37.0
37.0
45.0
45.0
39.0
45.0
45.0
45.0
45.0
33.0
45.0
32.8
45.0
.. . .
.. . .
.. ..
. ..
45.0
.. ..

Disc.Name of field
Depth
date ftI I
:orella 1989 .. ..
=chuburraI I
....
1 I
Senoa ...
North II
Jackson I 1982 I 4,800
=+-t--=
+-
West
100
Prod.
oil well
1995 Prod.
avg. , b/d
API
g rav itY
.. ..
....
... .
.. ..
.. ..
40.0
40.0
-48.0
40.0
.. ..
.. ..
.. ..
.. ..
.. ..
.. ..
.. ..
.. ..
. ...
.. ..
.. ..

Name of fieldDisc. Depth Prod.
date ft oil well
Tinpilla1
1983I
6,000I
I I I I
Wandilp I I .... I
Waston I 1985 .. .. IWaston
South1985 5,500
Wilson I 1983I 5,000 I1 t
Yanda I 1984 I 8,000 II I I I I
~
❑ Offshore, (c)Condenstate, (c)Estimate
1995 Prod. API
avg. , b/d g rav”ti
.. ..
....
.. ..
40.0
.. ..
.. ..
42.0
506,217
101

Brunei darissalem
Name of field ‘ Discovery Depth , Producing 1995 Prod. APIdate ft oil well avg b/d grav”w
‘SHELL❑ lAmpa SW 1963
7,068-8.155
151 43,731 41.0
lEIChampion 1970 4,300 299 60,470 23.0
lEIEnggang 2 639 .. ..
❑ lFairley 1969 10,740 28 6,990 40.0
HFairley-B1973 9,500 3 2,630 40.0
aram
❑ llGannet .. .. .... 0 40.0
EIllron Duke 1973 ... 4 5,955 .. ..
EIMagpie 1975 . ... 20 9,651 31.0
Rasau 1929 . .. . 17 6,313 30.0
Seria-Tali 1929 ... .. 312 15,115 34.0
‘TotalBrunei
766 151,494
El Offshore, (c)Condenstate, (c)Estimated
102

Canada
‘Name of field Disc. Depth, I Producing I 1995 Prod. I APII date \ ft I oil well I avg. ,b/d I grav-ti
ALBERTA Acheson 1950 3,390 52 2,411 38.0
13antry 1940 2,574 221 9,219 ....--3,300
Bellshill 1955 2,950 463 11,575 34.0-44Lake .0
Bonnie Glen 1952 3,959 101 3,998 . .. .-6.779
Caroline .... 169 4,742 44.0
Carson 1958 8,787 44 5,099 ... .Creek N. -8,935
Cessford 1950 2,800 234 3,818 . .. .–3.r-l?r+
Clive 1951 6,074 112 4,841 .,..-6,028
Countess 1951 2,858 147 10,447 32.0-4?77
Fenn Big 1950 3,900 89 2,570 . .. .Valley -5,400
Gilby 1962 4,201 136 7,728 36.0-7,000
Golden 1949 3,570 55 1,572 ....spike -5,961
Grand Forks \ II .... 18,7591 . .. .
Harmattan
I1954 6,358 72 3,368 . .. .
East -8,766
Harmarron 1955 8,796 60 2,881 ....Flktrm –1(-).757
Hayter 1968 2,030 479 17,679 . .. .-2,815
Innisfail 1956 6,730 28 1,009 . .. .-8,400
Joarcam 1949 3,179 124 3,736 . .. .
Joffre 1953 4,983 86 3,577 . .. .-6,779
Judy Creek 1951 8,307 134 12,465 43.0-8,701
103
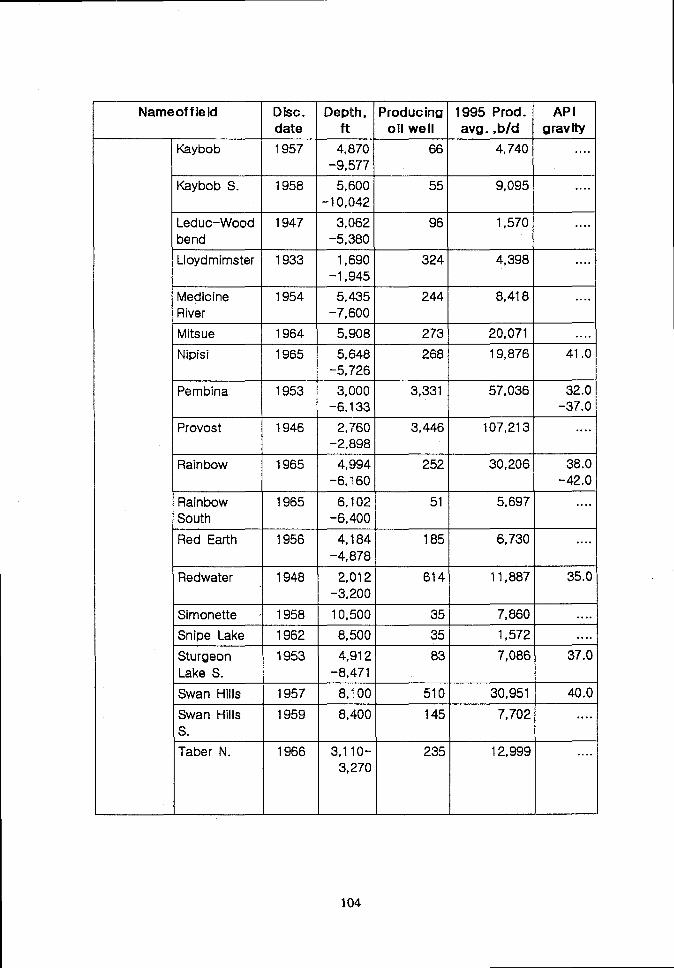
—Nameoffield Disc. W 1
grav-~avg. ,b/d
~ybobI
1957
i---
4,870 66-9,577
5,600 55-10,042
4,740 . ...
.. ..9,095
+
.educ-Wood 1947~end
Joydmimster 1933
-t-
3,062 96-5,380
1,690 324-1,945
1,570 .. ..
4,398 .. ..
+
bfedicine 19547iver
blitsue 1964
Nipisi 1965
+
5,435 244-7,600
5,908 273
5,648 268-5,726
8,418 .. ..
20,071
19,876
.. ..
41.0
‘embina I1953 3,000 3,331
-6,13357,036 32.0
-37.0
Provost 1946
*
2,760 3,446-2,898
4,994 252-6,160
6,102 51-6,400
107,213 .. ..
30,206 38.0-42.0
RainbowI
1965
5,697 .. ..
4,184 185-4,878
6,730 .. ..
35.0RedwaterI
1948
*
2,012 614-3,200
10,500 35
8,500 35
4,912 83-8,471
11,887
RiE-hR- 7,860 .. ..
1,572Snipe Lake \ 1962 .. ..
37.0Sturgeon I 1953 7,086
*
30,951
7,702
40.0
.. ..
s. ITaber N.
I1966 3,110- 235
3,27012,999 .. ..
104

Nameoffield Disc. Depth, Producing 1995 Prod. APIdate ft oil well avg. ,b/d grav-Ry
Turner Valley 1913 3,100 106 2,155 39.0-9,150
Utikuma Lake 1963 5,624 128 9,149 . .. .
Valhalla 1973 1,815 484 21,423 ... .-7,060
Virginia Hills 1957 9,210 110 12,637 34.0
Wainwright 1925 1,903 597 6,902 . ...
-2,200
Westerose 1952 6,818 33 3,065 . ...
Westemp .. .. 17 2,913 . .. .
Willisden 1956 5,157 480 5,757 . .. .Green
Wizard Lake 1951 4,044 47 2,766 . .. .-5,973
Zama 1966” 3,702 108 5,494 33.0-37.0
Other .... 10,464 396,145 . .. .
BRITISH Boundary 1957 3,418 254 7,663 40.0COLUMBIA Lake -4,575
Eagle West ,1976 2,170 44 2,283 ....-3,940
Other .. .. 498 24,726 . .. .
EAST El Cohasset .. .. 8 18,845 ... .COAST
E Panuke .... 2 2,553 ... .
MANITOBA Total for all . ... 1,354 11,080 . .. .fields
NEW Total for all .... . ... .. .. ... .BRUNSWICK fields
105

—Nameoffield Disc. \ Depth, I Producing
NC)RTHWESTTERRITORIES
8( ARCTICISLANDS
CINTARIO
SASKATCHEWAN
TotalCanada
@ Offshore,
Total for all .4.. 1,140fields
Steelman 1950 . .. . 591
Weyburn 1955 4,600 931
Other . .. . 14,512
45,554
(c) Condenstate, (c)Estimated
633 ....
29,272 ,...
4,921 I .. ..
6,881 ....
27,157 .. ..
287,930 .. ..
1,378,951
106

Chile
Nameoffield Disc. Depth, Producing 1995 Prod. APIdate ft oilwell avg. ,bld gravity
ENAP - Canadon 1962 6,090 4 34 38.420 NTINENTE
Daniel 1960 5,806 25 509 25.4
Daniel Este 1961 5,523 9 95 25.0
Delgada 1958 7,694 10 144 35.0
Dungeness 1962 5,251 8 141 28.6
Faro Este 1959 7,381 5 128 35.0
Posesion 1960 5,622 39 298 63.6
ENAP - Anguila AN-1 1989 5,758 9 404 32.0COSTA
AFUERA Atun AT-1 1992 5,722 6 104 33.0
Catalina Norte 1989 5,807 6 288 38.0
Daniel 1990 5,840 14 188 35.0
Daniel 1984 6,126 22 383 35.9
Este-Dunaeness
Ostion 1979 7,156 12 224 33.0
pejerrey 1984 7,229 16 315 39.0
Posesion 1980 6,727 15 243 34.5
Suka 1988 5,932 24 1,179 32.0
Spiteful 1979 6,288 13 393 34.5
Spiteful Norte 1980 7,150 5 128 39.0
Terrarmar 1991 6,211 8 946 33.0
107

—Nameoff ield Disc. Depth , Producing 1995 Prod. API
date ft oihvell avg. ,b/d gravity
=NAP–ISN Calafate 1956 6,045 7 150 49.3
Catalina 1956 5,756 4 94 38.7
~
Catalina Sur 1962 5,779 4 56 44.0
Cullen 1954 5,730 14 360 41.8
Cullen Este 1988 5,479 1 58 40.0
Flamenco 1954 6,545 5 208 40.2
Gaviota Norte 1990 “7,000 5 123 38.0
Golondria 1978 5,906 1 72 37.0
Gorrion 1986 6,025 3 75 39.0
Lago Mercedes 1992 12,468 1 65 . .. .
Punta Baja 1954 7,545 4 120 39.0
Sombrero Este 1992 6,506 2 301 36,0
Tres Lagos 1957 5,724 16 132 40.1
~otalChile 1,231 506,217
—
~E Offshore, (c)Condenstate, (e)EstixnatedSouroe :Intemational Petroleum Encyclopedia 1997 / PennWell
publishing CO.
108
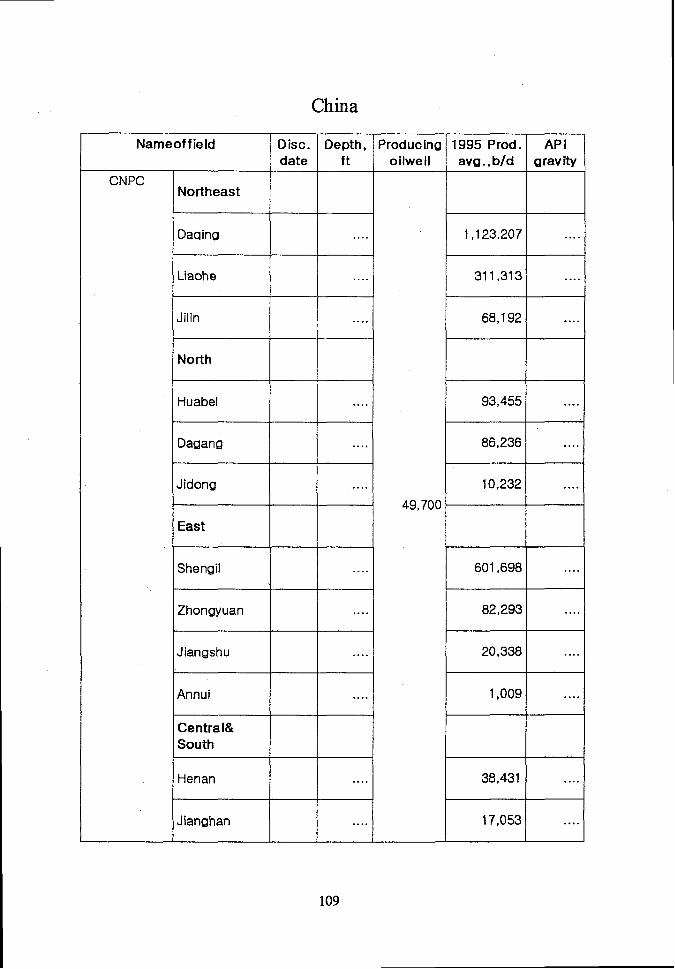
China
Name of f ield I Disc. I Depth,I date
CNPC
*
Northeast
Daqing
LiaoheI
IJilin
North
ft
....
....
.. ..
Huabel I ....Dagang .. ..
Jidong ....
East
Shengil ....
Zhongyuan .. ..
Jiangshu .. ..
Annui ....
Jianghan I ....
‘reducingoilwell
49.700
T1995 Prod. APIavg. ,b/d g rav’@
1,123,207 . .. .
311,313 . .. .
+
93,455 ... .
86,236 . ...
--1-601,698 .,..
82,293 . ...
20,338 ... .
1,009 . ...
17,053 ....
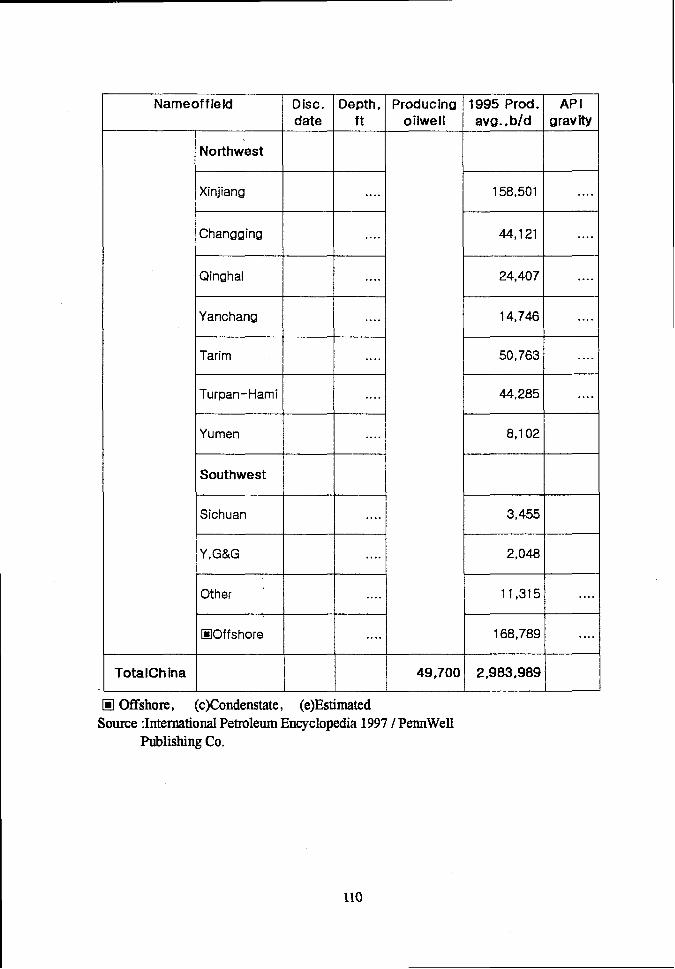
Name of f ield
IDisc.date
I TotalChina
Northwest IXinjiang IChangging I
+
Yanchang
Tarim
Turpan-Hami
Yumen ISouthwest I
=l---L-1
Y,G&GI
Other ‘1
❑ lOffshore II
Depth, Producingft oilweli
4.........+
....—
.. ..
----1....
4........
+
.. ..
....
.... I
.... II 49.700
1995 Prod. APIavg., b/d arav”~
1
II
158,501 . ...I
724,407 . .. .
14,746 . .. .
+
50,763 . .. .
44,285 . .. .
--t
8,102
----1-3,455
2,048
11,315 . .. .
X168,789 ....
2,983,989
❑ Offshore, (c)Condenstate, (c)EstimatedSource :International Petroleum Encyclopedia 1997/ PemWell
Publishing Co.
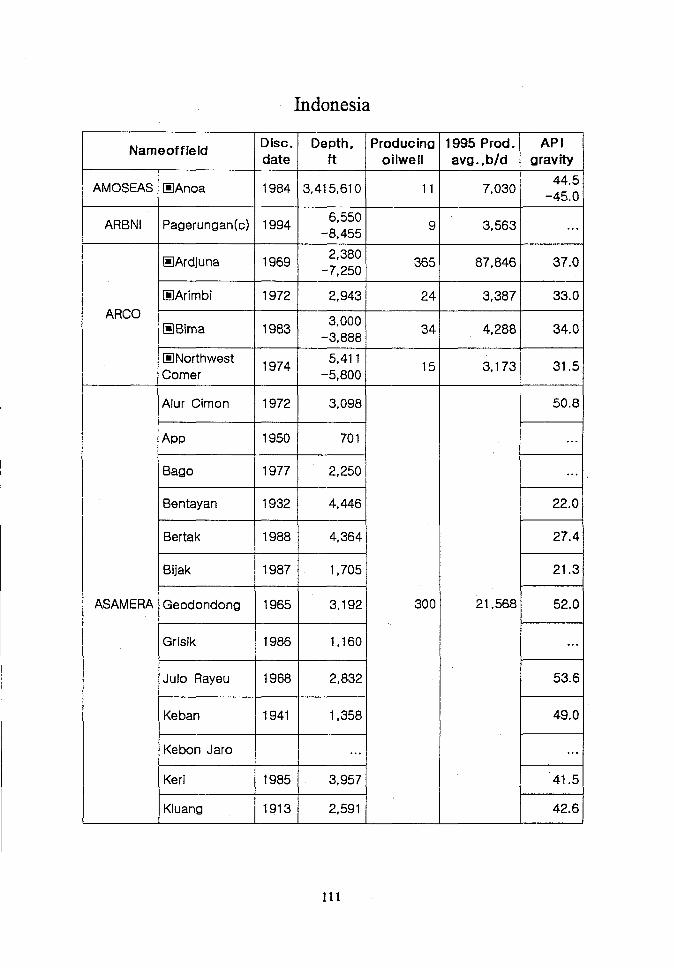
Indonesia
Name of f ieldDisc. Depth,date ft
%oducingoilwell
1995 Prod. [ APIavg. ,b/d gravity
❑Anoa 1984 3,415,610 7,03044.5
-45.0AMOSEAS
Pagerungan(c) 19946,550
-8,455
=?----+
ARBNI 9
365EIArdjuna 19692,380
-7,250
❑ lArimbi 1972 2,943
❑ Bima 19833,000
-3,888
24
34ARCO
EINorthwestComer
19745,411
-5,80015
Alur Cimon 1972 3,098
App 1950 701 I . . .
ASAMERA
Bago 1977 2,250
Bentayan 1932 4,446
Bertak 1988 4,364
Bijak 1987 1,705
Geodondong 1965 3,192
I
E,..
22.0
27.4
300 21,568
L
52.0
==+’+= I ...
1=53.6
I 49.0Keban 1941I
1,358I I
F...
41.5
42.6Kluang 1913 2,591

NameoffieldDisc. Depth. Producing 1995 Prod. AP 1date ft oilwell avg. ,bld grav”m
Le Tabue . .. .. .
Mangunjaya 1934 2,700
Merbau 1979 600 32.0
Meuranti 1978 750.. .
Panarukan 1976 4,915.. .
39.4Peudawa 1980 3,083
48.1Peureulaw . ..
.. .Ramba 1982 3,150
Rantau37.0
Paniianfl...
.. .
Rawa 1985 4,08637.0
SouthRawa
1985 4,08637.0
Supat 1984 4,62633.6
TanjungI ahan
1982 3,59038.1
Tempino 1931 1,647 40.9
Tengah 1984 3,245 34.7
Tuaiang 1973 2,631 49.9
BC~NHAM/ENlM/ENERGYE Harimau . .. 5 423 .. .
QUITY I
Air Serdang 198830.1
BOW 5,248-32.0
VALLEYITAU 79 12,397SMAN Guruh 1991 5,681 30.0
—
112
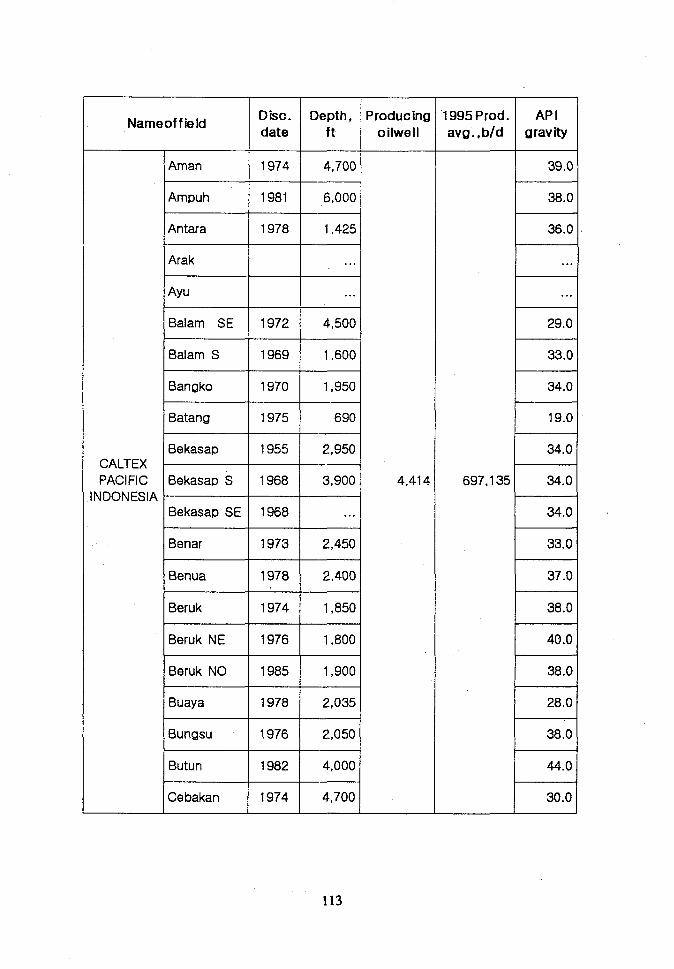
I I I
NameoffieldDisc. Depth, Producingdate ft oilwell
CALTEXPACIFIC
IN DON ESIA
I I I
AmanI
1974 I 4,700
Ampuh I 1981 I 6,000 I
Antara I 1978 I 1,425I I
*Balam SE I 1972 I 4,500 I
I I IBalam S I 1969 I 1,600
Bangko I 1970 I 1,950
Batang I 1975 I 690I 1
Bekasap I 1955i
2,950
Bekasap S I 1968 I 3,900 4,414
Bekasap SE 1968 . ..1 t
i
Benar I 1973 I 2,450
Benua I 1978 I 2,4001I I I
Beruk I 1974I 1,850Beruk NE I 1976 I 1,800
I I IBeruk NO I 1985 I 1,900
Buaya I 1978I 2,035
%ungsu I 1976 I 2,050
Butun I 1982I
4,000
Cebakan I 1974 I 4,700
1995 Prod. APIavg. ,b/d gravity
39.0
38.0
36.0
...
. ..
29.0
33.0
34.0
19.0
34.0
697,135 34.0
34.0
33.0
37.0
38.0
40.0
38.0
28.0
38.0
44.0
30.0
113

1
Name off ieldDisc. Depth, Producingdate ft oilwell
—
—
Cucut 1981 5,800
Duri 1941 770
Dusan 1979 2,550
Garuk I 1980 I 4,600
GatamI
1977I
2,385
+++
Genting . ..
Giti .. .
Hitam 1975 6,690
HiuI
1983I
5,900
1995 Prod. APIavg. ,b/d grav.Ry
I 34.0
L=...I 22.0
t==r 31.0I[
t--
34.0
I...
}
. ..
39.0
I 40.0
t-
39.0
33.0
I . . .
I45.0
F_38.0
28.0
39.0
I 37.0
114

NameoffieldDisc. Depth,date ft
EXSPANIETA
KSATRIA‘ETRASANGA
I I
Tarakan I 1906 I
Juata 19261,278
-3,600
Mengatal I 1938I
1,050-5,250
Pamusian 1906[
213-2,772
Sanga-sangaI
Anggana I 1903I230
-2,772
Kutai LamaI 1938
‘1426
N. -5.637
Kutai Lama
I 1902I1,640
s. -2,953
=--+=+5Louise S. 1897
82-2,379
Maura I 1902I869
-2,297
==-1-=kSamboja I 1909I
65-4,387
‘reducingoilwell
275
1995 Prod.avg. b/d
5,0
.
9
—
APIgrav-Ry
19.0-20.5
+
19.0-32.0
18.0-19.0
+
19.0-20.0
25.0-29.0
i
27.0-33.0
25.0-30.0
i
25.0-30.0
25.0-29.0
+
25.0-30.0
25.0-29.0
427.0
-31.0
27.0-29.0
26.0
118.0
-27.0
115

NameoffieldDisc. Depth, Prod.date ft oilwell
=H=--t--Lindai I 1971 I 1,100
ManggaI
1988I
7,800
Mengkapan I 1981 I 4,000
Minas 1944 2,600
Mindal 1971 3,400
Mutiara 1976 3,500
Nella 1977 5,000
%
Obor 1978 7,370
Osam 1978 900
Pager 1974 4,300
Paitan I 1978 I 2,315
1995 Prod.avg. ,b/d
APIgrav”m
29.0
20.9
32.0
35.0
42.0
35.0
32.0
.. .
33.0
34.0
44.0
35.0
37.0
34.0
35.0
40.0
32.0
38.0
32.0
116

NameoffieldDisc. Depth, Producingdate ft oilwell
Pak I 1988 I 3,667
Pedada I 1973 I 950
Pelita I 1977 I 6,600
PematangI
1959I
3,750
Pemburu I 1981 I 2,300\
Perkebunan I 1977 I 2,300
Petani I 1964 I 4,7501 1
PetapahanI
1971I
4,500
Pinang I 1971 \ 3,9501
Pinggir I 1972I 3,300
PuduI
1972I
5,950
=i-=-kdPungut
I1951
I3,400
Pusaka 1977 2,250
Rangau 1968 6,100
Rantau Bais 1972 1,070
117

—I 1 I
Nameof f ieldDisc. Depth, Producingdate ft oilwell
<intis I 1984I 6,450
Sabak I 1974 I 2,350
Sebanga . ..
Seruni 1972 3,000
Sidingin ...
3ikladi I 1975I 4,340
Singa I 1977I 3,200
SintongI
1971I
3,900
Sintong SE . 1973 I...
ISuram I 1971 I 1,750
Tandun I 1969I 3,000
Tanggul . ..
TanjungMedan I 1976I 2,770
Tegar I I ... I
995 Prod. API
avg.,bld grav-m
39.7
.. .
36.0
...
...
35.0
.. .
40.0
31.0
L
32.0
36.0
28.0
33.0
...
34.0
...
118

I
I
NameoffieldDisc. Depth, Producing 1995 Prod. APIdate ft oilwell avg. ,bld grav”w
Telinga 1975 4,205 33.0
Terantam 1973 900 32.0
Titian .. . .. .
Topas 1977 5,200 33.0
Topi 1979 3,630 37.0
Tunas 1983 4,819 35.0
Ubi 1976 4,350 35.0
Ujung Tanjung 1975 3,600 34.0
Waduk 1982 6,100 38.0
Zambrud 1975 3,600 40.0
Ahab 1951 600 36.0CITRA
PATENINDO Dews 1936 8,337 ... 1,393 ...N.P.
Raja 1950 600 38.0
Belida ~1989 5,000 28 113,233 47.0
Ikan Pari 19834,100-
CONOCO 4,500.. . 1,618 47.4
GROUPSembilang 1994 .. . 4 8,690 .. .
Udang 1974 5,595 .. . ... 39.0
EKSITAPATRANAGA Mamburungan 1989
5,020-5,131
2 125 . ..
RI
ENTERPRISE/GFB Camar 1970 4,350 2 1,736 ...
RESOURCES
119

—
NameoffieldDisc. Depth, Producing 1995 Prod. APIdate R oilwell avg. ,b/d g rav “N
GENINDO Sembakung 1976 7:,956 .. . 2,709 35.0
‘GOLDON TanjungSPIKE Kurung
... 3 1,116 .. .
Belimbing 1965 5,371 35.5
Karangan 1975 5,250 23.0
Limau Barat 19283,898
HUSKY -4,626 .. . 5,622 .. .
Limau Niru 1954 5,118 .. .
Limau Timur 19283,898
-4,626.. .
JAPEX Arbey Selo ... 9 2,332 .. .—
KE-3/Camar 19704,178 36.6
-4,260 -37.0
Maciura KE-2 19783,370 45.5
KODECO-4,080
8 987 r-47.2
Madura1987
6,700 35.1
KE-23 -8,350 -45.0
Madura KE-5 ... .. .
iIEIKurau 19864,500
-9,00047.4
llIILalang 19803,100
-3,60039.6
900MALAKAAIT/ ❑ Melibur JS 1984
-1,30035.6
LASMO/ROL 89 20,889
EUM lEIMengkapan 19813,850
-4.,45042.0
❑ lMSBV 19934,500
-9,000...
lEISelatan 19873,900 ...
-4,500
120
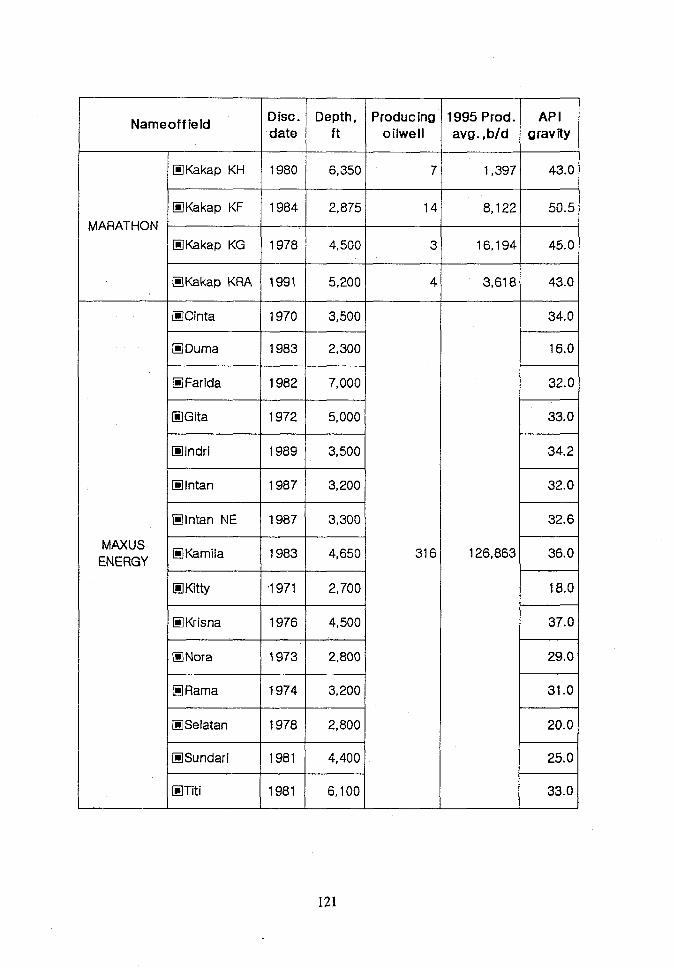
MARATHON
MAXUS
ENERGY
lEIKakap KH 1980 6,350 7
EKakap KRA 1991 5,200 4
lEICinta / 1970 I 3,5001
EIDuma 1983 2,300
E Farida 1982 7,000
❑ lGita 1972 5,000
❑ llndri 1989 3,500
Elntan 1987 3,200
❑ lntan NE 1987 3,300
EIKamila 1983 4,650 316
EIKitty ‘1971 2,700
=-F-t-a❑ lRama 1974 3,200
ELSelatan 1978 2,800
iEISundari 1981 4,400
I@Witi 1981 6,100
--1---11995 Prod. APIavg., b/d gravity
1,397 43.0
=
8,122 50.5
16,194 45.0
*
34.0
16.0
32.0
33.0
34.2
32.0
32.6
126,863 36.0
18.0
37.0
29.0
31.0
20.0
25.0
33.0
121

f
Disc. Depth, Producing1995
Nameoffield Prod.AP 1
date fft oilwellavg.. b/d
grav “N
❑ lWanda 1982 4,800 36.0
❑NViduri 1988 3,500 24.0
EIYvonne 1880 5,000 36.0
lEIZelda 1971 6,300 32.2—
M08LE Arun(c) 1971 9,367 64 87,839 55.0—
Andan 1950 1,969 29.0
Blimbing 1952 4,922 .. .
Link 1939 1,600 34.0P.LIRIK
... 1,470PETROLEUM N.pulai 1941 1,800 34.0
Sago 1940 1,800 34.0
S. Pulai 1941 1,800 34.0—
PT. SURYA7AYA TELADAN ‘enakat
1932 4,167 ... 1,573 35.0—
Binio 1952 1,600 14 132 34.0
Gemuruh 1983 2,800 17 496 34.0
KayuaraEast
1983 3,500 46 1,610 35.0
PT. EXSPANSUMATERA Kayuara 1982 3,700 5 128 35.0CENTRAL
SUMATERA Kerumutan 1980 3,000 10 317 35.0
MerbauNorth
1980 2,600 4 31 36.0
Merbau 1979 2,700 21 699 36.0
1
122

NameoffieldDisc. Depth, Producing 1995 Prod. APIdate ft oilweli avg., b/d grav”o
Mutiara 1985 2,700 1 5 34.0
Panduk 1981 2,500 6 109 46.0
,.Parum 1987 4,200 17 693 35.0
Pekan 1976 3,700 12 135 35.0
GunungKembang 1987 3,600 4 986 36.0
Ibul 1970 5,700 3 89 36.0
Jene 1985 6,500 28 5,372 35.0
Kerang 1984 2,900 2 76 35.0
Lagan 1986 2,400 5 134 56.8
PT. EXSPAN Langkap 1987 2,900 11 581 34.0
SUMATERASOUTH Pian 1986 6,000 1 74 36.0
SUMATERARambutan 1972 4,500 6 2 42.0
Rimbabat 1984 3,200 .. . . .. 34.0
South Tabuan 1981 2,200 ... . .. 34.0
Tabuan 1986 4,000 6 390 34.0
Teras 1976 4,500 3 24 42.0
Besitang 1977 3,973 51.5
PERTIMINA GebangUEP I
1977 2,917 188 5,319 54.0
Kuala Dalam 1983 3,872 50.8
123

Nameoffield
+
1995Prod. APIavg. ,b/d grav”m
45.0
45.0
Disc.date
1971
3epth,ft
3,740-5.019
Producingoilwell
K.SimpangRarat
K.SimpangTimur
P.TabuhanBarat
P.TabuhanTimur
1967 3,576
3,350-5.893
2,460 1=50.8
50.8
1937
1968
PulauPaniana
Rantau
1928
1929
3,300
2,764 1----...
45.3
t---
47.5
. ..
Serang Jaya
Securai
1926
1980
3,701
4,100-6.890——
3,701SungalBuluh
51.01984
Air SerdangI
.<1988 4,860 ,.
3,822–3.775——
4,167
I 25.7Bajubang 1930
1973BenakatEast I 35.0
8etung 1966 4,003 I . ..
379
BetangJamhi
1951 328
F...
7,997
. ..
.. .
UEP IICandi
Deras
1937
1937
8,012
6,618
Jirak
Kenali Asam
1930
1931
2,093
2,077t-
.. .
29.0
KetalingTimur
1985 1,837—. I ...

NameoffieldDisc. Depth,
date ft
Kruh N. I 1935 I 4,652
Molek I 1956 I 2,600
Musi I 1985 I 2,717
Setiti I 1960 \ 1,837I I
Sukaraja I 1934 I 7,379
Sungai Lilin I 1964I 2,690
Talang Akari
19226,562
–R.681
Talang Jimar I 1937 I 4,123
Tempino I 1931I
1,647
Ukui/PondokI
19501,378
-1,641
Banyubang I 1980I 1,312
Cemara 19763,964
-7.104
Kandang Haui ,979Tim) v
7,54E
Kawengan 19261,60C
PERTIMINA -7.675
UEP IllLedok 1893 1,38C
I,
I
I MB STR I 1985 I1O,4O(I I I
Pegaden I 1986 I 6,89(I I 1
Producingoilwell
18[
125

—
Nameoff ieldDisc. Depth, Producing 1995 Prod. APIdate ft oilwell avg. ,b/d grav-~
Randegan 1973 5,578 . ..
Tigu Barat 1979 3,014 . ..—
Bangkadulia 1960 3,250 39.5
Dahor1966 3,610
Selatan. ..
Kambilin 1981 3,491 . ..
Sangkinah4,265-4,539
...
PERTIMINASangatta 1939 2,600 33.0
UEP77 2,934
Tanjung 1938 .. . 39.9
Tanta 1975 6,660 ...
Tapa-Teritip 1975 4,396 . ..
Tapian Timur 1967 2,067 38.8
Warukin 1966 3,250 26.9
Kiamono 1936 574 19.0
I’ERTIMINALinda 1977 3,281 19.0
UEP V98 1,629
Sele 1951 2,156 35.0
Wiriagar 1984 3,500 39.7—
PETROMER Arar Gas (c) 1977 50.0
TFIEND/SANTAFE ENERGY
Cenderawasih 1976 281 11,191 26.7
‘EsOuRcEs Jaya 1973 39.6—

NameoffieldDisc. Depth, Producing 1995 Prod- AP 1
date ft oilwe II avg. ,b/d 9 rav ‘W
Kasim 1972 36.5
Kasim Barat 1975 34.5
Kasim Utara 1973 25.7
Kasuari ...
Klagagi ..
Klalin 1990 43.5
Klalin (c) 1986 55.0
Klaserai 1981 . ..
Lao-lao ...
Maniwar . ..
Moi 1979 16.2
Walio Kais 1973 2,337 34.3
Walio Text II 1973 2,268 34.3
Walio ‘U’ ‘ 1975 2,284 34.3
West Klagagi ... . ..
‘ETRONusA Selat Panjang 1994 . .. 1RI IMI RHAKTI
203 . ..
SANTA FE Salawati 1992 ... 18 7,377 34.0
SANTOSIAGL Bula,897 280-1,
30088 900 23.0
SIDHAKARYA Sabaku 1977 . ..
PILONA191 - ...
Salawati 1977 5,500 ... . ..
127

—
NameoffieldDisc.date
Depth,ft
——100
-800
Producingoilwell
1995 Prod. APIavg. ,b/d 9 rav ity
1---46.0
-52.0
46.0
Batu Keras 1903
Kampung
Minyak100
-500—.300
-800
300-1,000
—.4,600
-15,600
1896
1905
1904
1972
t----
-52.0858
46.0TRITON 74
Suban Jeriji
----l=-52.0
46.0-52.0
Sungai
Taham
lEIBekapai I 40.0
i
2,900-19,200
8,850-10,158
244
lEIHandil
Semanlu
1974
1990
I33.0
62,348r
30.8-32.7
TOTAL
INDONESIEt
48,000
-13.000
8,001-13,000
f@Tambora 1984I
33.0
I
I 55.0Tunu(c) 1985
1,.200-11,000 117
3,100-7,100
6
2,900-4,900
5
3,400-11,600
32
45,90832,0
-42.0❑ lAttaka 1970
1970lEIKerindinga
43320.0
-36.0n
1,84716.0
-29.0lEIMelahin ,
EISepinggan
1972
11,03125.0
-38.01972
UNOCAL n6,000
-10,00017
670-2,235
e
2,’180 ~-6,600
27,51740.0
-42.0lEISerang 1973
79013.0
-22.5EIYakin C.
❑ lYakin N.
1976
1977 1,97916.2
-28.9
2,050-2,530
60018.4
-21.1❑Yakin W. 1982
128

Nameoffield Disc. Depth, Producing 1995 Prod. AP 1date ft oilwe II avg. ,b/d grav”@
JSTRAINDO Benuang 1942 6,103 . .. 7,352 35.1
Beringin 1975 6,365 3%.8-6.925
Burrya Nibung 1926 5,315 33.2
Gunung Kemala 1938 5,548 38.0
Jatibarang 1969 7,136 29.0/Karana AmcIel
Kuang 1940 5,249 25.1
Ogan Timur 1943 3,898 .. .-4.626
Prabumulih 1953 5,315 .. .Barat
Tanjung Miring 1935 3,511 .. .
Tanjung Tiga 1938 3,750 28.0
VIRGINA Badak 1972 4,350 365 49,903 34.4INDONESIA -12.600
Lampake 1981 7,000 .. .
-9.000
Mutiara 1984 1,500 38.5
-8.500
Nilam 1974 7,300 33.4-14,700
Pamaguan 1974 5oo- 26.8
6.000
Semberah 1974 2,000- 30.08.500
Wailawi(c) 1974 2,600- 32.0
4,800
TOTALNDONESIA
8,504 1,521,469
El Offshore, (c)Condenstate, (c)Estimated
Source :International Petroleum Encyclopedia 1997 / PennWell Pblishing Co.
129

Japan—
Nameoff ieldDisc. Depth, Producing 1995 Prod. APIdate ft oilwell avg., bfd grav”m
EEIAga-Oki 1972 7,590 2 612 24.8
Higashi–Niigata,965 4,500-9
,2003 1,577 53.9
❑ llwafune-Oki,984 5,050-8 ~
,6606,734 .. .
Katakai ‘ ’60 3,310-1 0 496 50.0
JAPEX-----
Sarukawa,958 2,000-3 43
,200695 32.3
Yoshii 1968 8,000 0 687 61.8
Yurihara,976 1,310-7
,6105 331 43.5
Other .,,. 39 767 .. .
Higasaki-Kashiwazaki ‘ ’70 6,000-8 6 421 62.0
. . .
Kubiki,959 1,100-6 60
,400417 29.7
rEIKOKUCIIL Minami-Aga
,964 7,300-9 g
,600491 38.5
CO.LTD
Minami-Nagaoka,984 13,200-
15,1009 888 55.7
Yabase,933 1,100-5 48
,800316 33.0
—
Total Japan 229 14,432
—
El Offshore, (c)Condenstate, (c)EstimatedSource :International Petroleum Encyclopedia 1997/ PennWell publishing Co.

‘reducingoilwell
Disc. Depth,date ft
Nameoffield
1976 I 5,500lEIBekok I 47.0I r 44.0lEIGunton
1979 3,300
1979 6,000
I
!31ron barat I 35.0
r 47.0❑ Kepong
❑ lPalas 1979 6,300
1973 4,300
1971 4,300
1980 3,700
1978 5,600
1975 6,700
I 49.0
r 42.3❑ PulaiESSO
MALAYSIA r 50.0
780
lEISeligi
k42.5
44.0
❑ lSemangkok
❑ lTabu
❑ lTapis650,000
L
45.0
=
1980 4,400
1978 5,800
1971 6,000
ETinggi
❑ lTiong
❑EITembungo k48.0
47.0
40.0PETRONASCARIGALI
+
1971 6,785
1972 5,700
LEIErb WEST I 30.0SABAHSHELL
PETROLEUM
(SSPC)
SABAHSHELL
E3ERHAD(SSPC)
EISamarangI
37.0
1975 2,200
1976 4,200
1981 4,000
1972 3,100
i@lSt. Joseoh
❑ lBayan
I32.0
L-37,3
❑ ID-18
❑ lTemanaI
35.0
131

Name off ieldDisc. oepth, Producing 1995 Prod. AP 1date ft oilwell avg. .bld grav W.
@lBakau .,. .
@lBaram ....
lElE3aronia 1967 “7,900 42.0
I@Betty 1967 7,900 38.0SARAWAKSHELL /
R BokorPETRONAS
1972 2,000 35.0
CARl GALl ❑ lFairleyBaram
1973 8,655 39.5
❑ lSiwa 1973 4,100 25.0
❑ lTukau 1966 5,000 39.2
@iWest Iutong . .. . 39.5
Total Malaysia 780 650,000
—
El Offshore, (c)Condenstate, (c)EstimatedSource :Intemational Petroleum Encyclopedia 1997/ PennWell Publishing Co.
132

Mexico
NameoffieldDisc. Depth, Producing 1995 Prod. APIdate ft oilwell avg. ,b/d grav”w
Abkatun 1978 11,800 4,740 246,560 28.7
Bacab 1991 ... . 6,980 17.7’
Batab 1986 .... 5,565 33.6
Caan 1985 ... . 166,471 38.5
Cantarell 1976 8,528 905,568 19.9,
Chat 1994 55,510 18.0 ~~
Chuc 1982 13,100MARINE
112,452 12.6 ~
REGION Ek1991 . .. . 1,598 28.0
Ixtoc 1974 . .. . 9,038 29.3
Ku 1979 10,000 192,931 20.9
Pol 1979 12,600 120,497 32.4
Taratunich 1990 . ... 64,012 24.5
Other . .. . 50,261 26.2
Other (c) . .. . 87,825 ....
Acuatempa 1995 4,085 332 20.3
Agua Fria 1978 ... . 4,187 44.8
NORTHERN Angostura 1954 ... . 1,000 14.2
REGION
Arenque 1970 11,362 6,516 34.5
Atun 1966 9,040 587 37.6

Nameoffield IDisc. Depth,date ft
Producing 1995 Prod.oilwe II avg. ,b/d
APIgravity
I 1,407Bagre I 1973 I 10,919 33.3
=$=-l-= 1---1,662
7,463
20.9
17.3
Copite I1975 . ...
E303
3,482
2,011
215
34.3
Escolin 1942 I 7,216 26.6
+
1955 10,170
1963 6,8”75—
1958 7,390
Haliazgo
Isla de Lobos
29.0
39.8
I 1,305 35.8Jillapa
516Marsopa 1974 10,198
Matapionche 1974 11,129
Mecatepec 1941 7,544
20.0
t-----
534
1,557
35.9
30.2
30.1Miquetia 1959 6,480—
Muro 1965 3,966—
Ocotepec 1953 3,737
I 881
1-----377
333
16.6
21.2
E1,291
6,048
16.2
11.7
I 8,600Poza Rica I 1930 ! 17,090
+
24.0
29.8
30.7
R1,47s
624
6,70S 28.6San Andrez I 1956 I 10,4IC
134

Name of fieldDisc. Depth, Producing 1995 Prod. APIdate ft oilwell avg. ,b/d g rav ‘ity
Santa
Agueda1953 4,780
ETamaulipas I 1956 4,200
Tres
Hermanos I 19596,960
Other . ...I
19,551 27.4
E620
755
6,334
10ther I II .... .. ..
Agata I 1966 3,830 32.6
41.3
41.0
29.1
33.0
Agave I 1977 13,450
k1,524
137Ayapa
Bacal I 1976 I 3,500 I 2,176
r=Bellota I 1982 17,056 37.1
Blasillo I 1967 7,216 1------4,245
8,581
41.9
44.3SOUTHERN Cactus
I 1972 14,100
r= 38.5CaparrosoI
1982 ....
Cardenas I 1979 17,548 I 33,633 37.7
I 2,789Carmito 1980 10,050
Carrizo 1962 3,500
Chiapas 1979 12,136
46.3
E 18.1
45.4I
566
Cinco1960 6,862
presidents I 6,205 36.1
135

Name of f ieldDisc. Depth,date ft
—
Comoapa 1979 14,432
Conception 1974 1,600
Copano 1977 11,890
Cuichapa 1935 2,200
Cunduacan I 1974 13,775
*-
Eden 1983 17,590—
El Burro 1931 2,200
El Golpe 1963 3,500
El Plan 1931 1,“700
Fenix 1979 17,876
Fortuna
Nacionai1927 . ...
Gira!das 1977 15,225
=--+=+=
Ixhuatian
Oriente1965 . .. .
Jacinto 1987 ... .
Jolote 1983 18,119
Jose Colomo 1951 ... .
Jujo I 1980 17,548
136
Producing I 1995 Prod. I APIoiiwe[i I avg., b/d I arav-~ I
2,002 37.4
623 33.8
8,476 47.3
3,829 30.8
18,954 35.1
8,382 38.7
392 35.0
2.519 33.9
292 29.7
2.648 36.9
176 52.9
4<900 40.0
28.129 28.8
136 44.6
552 16.1
17.962 43.1
25.071 37.7
12 35.9
75.924 35.4

.
TDisc. Depth,Nameoffield date ft
La Venta 1954 ‘4,730
Lacamango 1973 1,700
Los Soldados 1953 4,492
Luna 1987 ... .
Moloacan 1962 ....
Mora 1981 . ...
Mundo Nuevo 1977 11,800
Oaxiacaque I 1977 11,150
Ogarrio I 1957 5,790
Otates I 1965 7,469
Rio Nuevo I 1975 I 14,950
Rodador I 1971 ....
Samaria
(Cret.)1973 ....
Samaria
(Terc.)1965 4,920
San Ramon I1967 9,515
Producinooilwe II
+-i-=
*
1.557 17.6
11.358 38.2
1.323 54.2
*
12.559 53.7
3.928 38.0
4.205 28.0
6.1841 33.3
*
713 37”.5
8.028 39.7
3.432 38.0
*
1.100 35.7
61.146 29.3
733 28.5
2.393 I 31.8

—
NameoffieldDisc. Depth, Producing 1995 Prod. API
date ft oilwell. avg. ,b/d gravity
Santa Rosa 1952 .... 118 23.0
Santurario 1966 9,617 2.249 42.1
Sen 1986 . ... 35.105 41.3
Sitio Grande 1972 13,766 7.616 33.5
Sunuapa 1976 12,877 252 30.3
S. Magallanes 1957 4,240 4.008 33.3
Tecominoacan 1982 19,519 45.332 40.6
Tintal 1968 5,C]04 326 26.9
Tonala 1928 1, ;770 747 33.4
Topen 1978 11,172 344 27.9
TuPilco 1959 9,685 929 38.5
Vernet 1954 .... 279 43.8
Other . ... 49.475 42.9
Other . ... 16.485 ....—
TotallMexico
4,740 2,722,129—
El Offshore, (c)Condenstate, (c)Estimated
Source :International Petroleum Encyclopedia 1997 /PennWell Publishing Co.
138

New Zealand
Nameoffield Disco. Depth,date ft
FLETCHER Ahuroa (c) 1987 8,688CHALLENGE Kaimiro 1982 11,900
Mckee 1980 7,848-8,251
Tariki 1986 9,065
Waihapa 1986 10,125-10,643
NEW ZEALAND Ngatoro!
1992 . .. .OIL & GAS
SHELLIBPITODD Kapuni (c) 1959 11,700
lEIMaui 1969 11,000
El Ofhhm , (c)Condenstate, (c)Estimated
10 815 42.0
25 6,150 38.5
0 0 52.7
6 3,165 36.6
2 627 35.0
121 3,390 I 54.0
15/ 18,866 I 51.0
0 0 ....
Source :Intemational Petroleum Encyclopedia 1997/ PennWellpublishing CO.
139
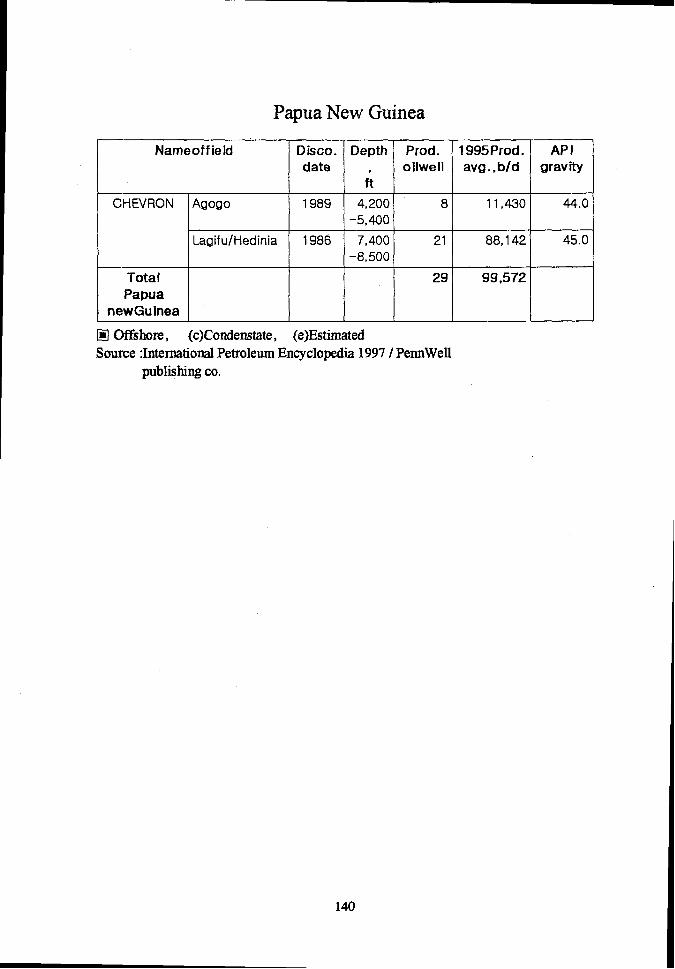
Papua New Guinea
Nameoffieid Disco. Depth Prod. 1995Prod. API
date oilwell avg., bld grav”@k
CHEVRON AQOQO 1989 4,200 8 11,430 44.0
-5,400
Lagifu/Hedinia 1986 7,400 21 88,142 45.0
-8,500
Total 29 99,572
PapuanewGuinea
El Offsllme, (c)Condenstate, (c)EstimatedSource :InternationalPetroleum Encyclopedia 1997/ PennWell
publishing co.
140

Peru
Name of field Disco. Depth, Prod. 1995 Prod. API
date ft oil well avg. , bfd grav-ky
GMP SA I Lote I 1869 2,000 69 756 33.0
(Block) -9,000
Lote V 1869 2,000 33 225 35.0
(Block) -9,000
MAPLE GAS [Agua [ 1939 I 1,000[ 171 161 I 40.0
Caliente -1,500
Maquia 1957 2,100 28 515 37.0
-2,400 [
OCCIDENTAL Bartra 1979 8,000 11 3,438 11.6
-8,930
Capahuarj 1988 12,000 6 5,443 31.0
Norte -13,500
Capahuarj 1973 11,800 16 4,677 33.7
Sur -12,900
Carmen 1986 10,680 1 374 18.4
Dorissa 1989 9,800 10 6,249 32.0
-10,600
Forestal 1973 9,000 8 3,650 18.5
-9,000
Huayuri Sur I 1977 I 10,000 11 2,529 28.5 I
-10,800
Jibarito 1981 9,000 7 8,765 10.5
-9,650
Jibario 1974 10,110 6 2,596 10.6
-10,155
San Jacinto 1978 7,200 19 7,326 14.9
-9,760
Shiviyacu 1973 9,100 21 9,314 20.3
I /-10,100/ I I I

—Name of field Disco.
fiCIDENTAL
/ BRIDAS
—
I
+
Cruz II 1978
Folche I 1978
Folche Norte 1978
Organos SurI
1978
Patriai
1978
Zapotal 1978
Depth, Prod. 1995 Prod.
ft oil well avg. , bld
1,343 111 517
-6,080
1,343 286 1,247
-6,080
1,343 6 26
-6,080
1,343 13 68
-6,080
1,343 14 54
-6,080
1,343 6 27
-6,080
1,34’3 64 I 208
-6,080
1,343 82 428
-6,080
1,343 48 93
-6.080
1,343 95 526
-6,080
1“,343 235 1,099
-6,080
API
grav-Ry
35.0
35.0
35.0
35.0
35.0
35.0
35.0
35.0
35.0
35. c
35.C
142

Name of field Disco. Depth, Prod. 1995 Prod. API
PETROPERU
- LOTE X
PETROPERU
- LOTE 8
date ft oil well avg. , b!d gravity
Ballena 1924 3,500 1,242 1,214 30.0-5,000
Carrizo 1953 4,000 963 31.0-5,500
Central ... . 273 ....
Coyonitas . .. . 79 ..,.
La Tuna . .. . 326 .. ..
Laguna .. .. 1,306 ....
Laguna 1953 7,000 992 29.0
Zapotal -8,000
Merina . .. . 823 .. ..
Organos 1947 6,000 227 30.0-7,000
Patria . ... 73 ....
Pena 1914 4,000 1,010 35.5Negra -5,000
Reventone . .. . 2,050 .. ..
s
Somatito .,. . 380 .. ..
Taiman 1922 3,000 2,739 30.0-6,500
Tunal . ... 61 .. ..
Verde . ... 550 ....
Capirona 1978 9,800 3 225 25.0-12,000
Chambira 1994 12,600 3 715 26.5-14,600
Corrientes 1974 10,000 31 10,024 24.9-12,600 ‘
PavayacuI
1978I
9,600 22 14,926 36.0-11.300
Yavayacu 1977 11,400 5 986 18.8-13,600
143

Name of field Disco. Depth,
ft
1,500
-6,000
Prod.
oil well
i-
1995 Prod. API
avg. , b/d grav”m
1,277 36.0
-40.0
PETRO -TECH 79
3,500
-7,500
193 10,099/ 38.0
I
lli10r9anos
t
.. .. 38.0
6,767 38.0
... .
3,000
-8,500
0
. .. .
214
53
❑ iPena Negra I 1960
lEIProvidencia 1967 3,000
-7,000
1,275 38.0
-40.0
PROVISA I
MERCANTILE
‘RIO BRAVO
Lote Ill 1869
(Block)
2,000
-9,000
60
72Lote IV 1869
(Block)
2,000-9,000
SAPET
DEVELOPMENT
Lote VII 265
260 --1-1,562 33.0
982 36.0
.. ..
3,000
(Block) ILJNIPETRO
ABC
Lote IX 1869
(Block)
2,000
-9,000
51 418 32.0
VEGSA Lote II I 1869 2,000
-9,000
107
3.883
t
Total Peru
(c)Condenstate, (c)Estimated
Source :Intemational Petroleum Encyclopedia 1997 / PennWell
publishing co.
144

Philippines (e)
Name of field \ Disco. I Depth, I Prod. I 1995 Prod. I API I
ALCORN
PALAWAN
ALCORN
‘HII-IPPINES
SHELL /
OXY
Total
Philippines
date ft oil well avg. . bld g rav-lty
Cadlao 1977 5,734 0 2,900 45.6
-5,881
South Tara 1977 4,335 0 40.4
-4,436
Galoc 1981 7,260 0 37.2
-7,280
Matinloc 1978 6,656 4 43.8
-6,750
Nido 1977 6,576 4 27.2
-6,885
North 1987 6,830 0 43.2
Matinloc -7,021
West 1990 7,025 3 32.3
Linapacan -8,140
lEICamago 1989 11,167 0 48.7
lEIMalampaya 1992 11,648 0 29.0
-12,343
11 2,900
El Offshore, (c)Condenstate, (c)Estimated
Source :Intemational Petroleum Encyclopedia 1997
publishing co.
/ PennWell
145

Chinese Taipei
Name of field ‘ Disc. Depth, Prod. 1995 Prod. API
date ft oil well avg. , bld 9ravity
CHINESE Chingtsohu & 1967 5,346 7 207 50.0
PETROLEUM CBK -’12,000
Chinshui & 1971 5,248 19 55 45.0
Yunghoshan -12,000
Chuhuangkeng 1904 6,560 29 174 50.0
-15,600
Tiechengshan 1962 9,840 16 597 51.0
Other 6,560 6 4 .,. .
-8,800
Total 77 1,037
Chinese
Taipei—
El Offshore, (c)Condenstate, (c)Estimated
Source :Intemational Petroleum Encyclopedia 1997 / PennWell
publishing co.
146

Thailand
Name of field Disco. Depth. Prod. 1995 Prod. API
date ft oil well avg. , bld grav”@
CAIRN Wichan Buri 1988 3,526 1 244 26.6
ENERGY FAR
EAST LTD.
PTTEP Kamphaeng 1986 3,780 1 80 25.2
INTERNATION Saen
AL U Thong 1987 3,550 5 1,200 33.2
SINO-U.S. Bung Ya 1984 7,800 1 59 34.5
PETROLEUM Bung Nang 1987 8,900 6 203 35.8
THAI SHELL Nang Nuan 1987 9,000 1 3,086 40.0Sirikit 1981 5,500 97 17,643 41.0
TOTAL l@Bongkot 1973 7,000 29 3,760 56.0UNOCAL ❑ lBaanpot 1974 7,000 5 160 54.6
EEIErawan 1972 7,000 93 8,298 54.6
lEIFunan 1981 6,100 60 4,425 45.0
❑ IGomin 1988 7,300 7 1,405 47.0
❑ llJakrawan 1976 6,500 9 547 45.1
❑ lKaphong 1973 8,000 4 320 55.0
❑ lPlatong 1976 8,500 11 2,144 59.1
HSatun 1980 8,500 32 6,913 55.1
l@Surat 1971 6,800 3 411 50.0
Total 365 50,898
Thailand
•l Offshore, (c)Condenstate, (c)Estimated
Source : International Petroleum Encyclopedia 1997 /
PennWell publishing co.
147

U.S. AFor your convenience the publication can be viewed or download by
section.
Oil and Gas Field Code
oil and gas field names
(1 Ok to 772k)
Master List 1996: Comprehensive listing of U.S.
as of October 1996. Presented in 37 PDF files.
SectionNameandFi\e Size
Chimers (266K, 31 pages)
Includes Cover Page, Preface, Contents, Chapters, and the Glossary.
M- (290K, 8 pages)
States and areas having subdivisions are shown with their subdivisions.
~ous States (30K, 2 pages)
Field code information for all fields located in the States of Alaska,
Arizona, Florida, Iowa, Maryland, Minnesota, Missouri, Nevada, Oregon,
South Dakota, Virginia, and
Alabama (39K, 2 pages)
Field code information for
Arkansas (47K, 3 pages)
Field code information for
~tiomia (46K, 3 pages)
Field code information for
coIorado (90K, 7 pages)
Field code information for
Ulinois (1 19K, 6 pages)
Field code information for
Washington.
all fields located in this State.
all fields !ocated in this State.
all fields located in this State.
all fields located in this State,
all fields located in this State.
148

Indiana (95K, 5 pages)
Field code information for
Kansas (645K, 38 pages)
Field code information for
Kentucky (238K, 12 pages)
Field code information for
Louisiana (180K, 11 pages)
Field code information for
Michkan (139K, 9 pages)
Field code information for
Mississiuui (61 K, 5 pages)
Field code information for
Montana (49K, 3 pages)
Field code information for
Nebraska (59K, 4 pages)
Field code information for
New Mexico (92K, 7 pages)
Field code information for
New York (42K, 2 pages)
Field code information for
al I
al I
all
all
all
all
al I
all
,all
all
North Dakota (37K, 3 pages)
Field code information
~ (162K, 8 pages)
Field code information
for all
for all
fields located in this State.
fields located in this State.
fields located in this State.
fields located in this State.
fields located in this State.
fields located in this State.
fields located in this State.
fields located in this State.
fields located in this State.
fields located in this State.
fields located in this State,
fields located in this State.
149

Oklahoma (772K, 35 pages)
Field code information for all fields located in this State.
PeJlnw lvania (79K, 5 pages)
Field code information for all fields located in this State.
Tennessee (24K, 2 pages)
Field code information for all fields located in this State.
Texas A-F (471 K, 33 pages)
Field code information for all
names beginning with A through
Texas G-M (459K, 32 pages)
Field code information for all
names beginning with G through
Texas N-Z (488K, 35 pages)
Field code information for all
names beginning with N through
~@ (34K, 2 pages)
fields located in this State with field
F.
fields located in this State with field
M.
fields located in this State with field
z.
Field code information for all fields located in this State.
WestVirginia (94K, 5 pages)
Field code information for all fields located in this State.
Wyoming (135K, 8 pages)
Field code information for all fields located in this State.
Federal Offshore - California and Other Gulf (16K, 1 page)
Field code information for all fields located in this area,
Federal Offshore - Louisiana (385K, 15 pages)
Field code information for all fields located in this area.
150

Federal Offshore - Texas (1 10K, 5 pages)
Field code information for all fields located in this area,
Index Partl (36K, 29 pages)
Field name and State or area for field code numbers 000100 through
012999.
Index Part 2 (36K, 31 pages)
Field name and State or area for field code numbers O
249985.
3000 through
kdex Part 3 (35K, 31 pages)
Field name and State or area for field code numbers 250016 through
559969.
Index Part 4 (34K, 30 pages)
Field name and State or area for field code numbers 560031 through
951068.
Invalid List (1 OK, 1 page)
Field code information by State for invalid field names plus reason
are invalid.
source : URL: http: //www.eia.doe.gov/oil_gas/natgas/fcml96.html
they
151

Vietnam
Name of field
PETROVIETN
AM P.I.C.
—Total
V-kNnam
❑ lWhire
Tiger
(Bach Ho)
❑ Rong
(Ora90n)
tEIDi Hung
Disc.
date
198
1983
1985
Depth,
ft
120
-160
T20
120 177,0004
-’160I
=a--4--28 177.000
(c)Condenstate, (c)Estimated
Source : International Petroleum
publishing CO.
Encyclopedia 1997 / PennWell
152
MI
grav”m
34.C
34.(
34.C

World Total
Country 1000 million barrel Rat io RIP
OECD 96.9 9.3% 13.1
OPEC 797.1 76.8% 75.2
NON-OPEC 175.2 16.9% 14.4
APEC (163.0) (15.7%) (60.0)
WorldTotal 141 “43 100.0% 62.2
SOUrCe: ~~~q 1998 (fJ~}&l~~~)
C.I.S.
Country 1000 million barrel Ratio RIP
Azerbaijan 7.0 0.7 ●
Kazakhstan 8.0 0.8 42.5
Russia 48.6 4.7 22.7
Uzbekistan 0.6 0.1 8.0
Etc. 1.2 0.1 15.4
Total 65.4 6.4% 24.7
Source : 4%9!Y 1998 (Ui24%~3iJ)
~ : under 0.05 * : over 100 years
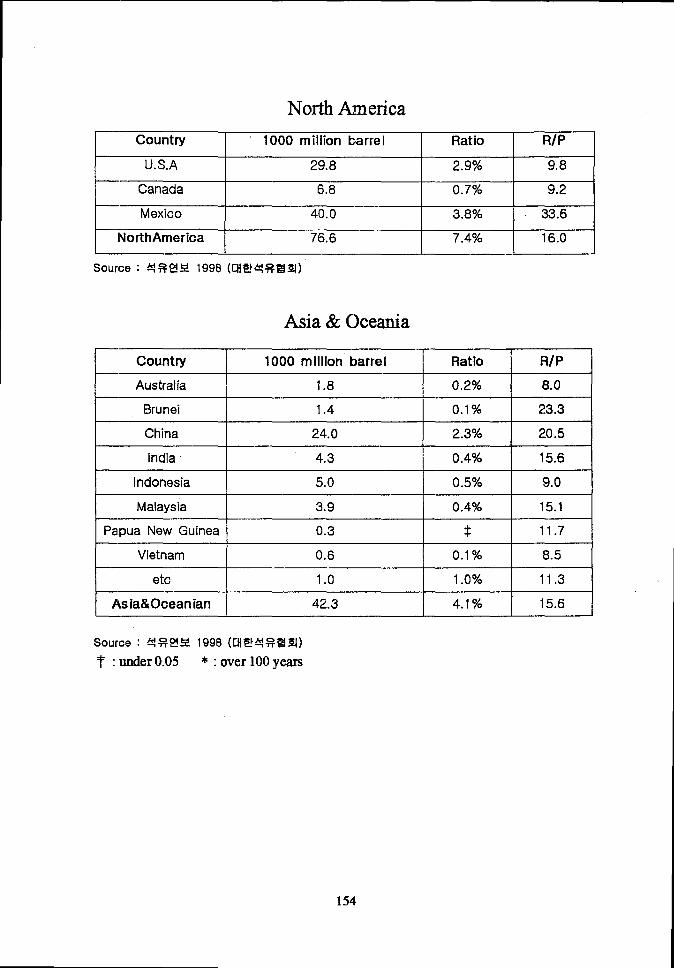
North America
Country 1000 million barrel Ratio R/P
U.S.A 29.8 2.9% 9.8
Canada 6.8 0.7% 9.2
Mexico 40.0 3.8% 33.6
!NofihAmerica 76,6 7.4% 16.0—
Asia & Oceania
Country 1000 million barrel Ratio RIP
Australia 1.8 0.2% 8.0
Brunei 1.4 0.1% 23.3
China 24.0 2.3% 20.5
India 4.3 0.4% 15.6
Indonesia 5.0 0.5% 9.0
Malaysia 3.9 0.4% 15.1
Papua New Guinea 0.3 * 11.7
Vietnam 0.6 0.1% 8.5
etc 1.0 1.0% 11.3
Asia&Ocean ian 42.3 4.1% 15.6
Source : 4%2!= 1996 (Ui#i}4$?El?!l)
T : under 0.05 * : over 100 years
154

Mica
Country I 1000 million barrel I Rat io I R/P
I Algeria I 9.2 I 0.9% I 18.8
I Angola I 5.4 \ 0.5% I 20.3
I Cameroon I 0.4 I 8.8% I 8.8
Congo 1.5 16.4% 16.4
Egypt 3.8 0.4% 12.2
Gabon 2.5 0.2% 18.5
Tunisia 0.3 T 9.4
I Libya I 29.5 I 2.8% I 55.6
I Nigeria I 16.8
I etc I 0.6 \ 0.1% I 12.3
I Africa I 70.0 I 6.7% ] 25.0
Europe
I Country I 1000 million barrel I Rat io I RIP I
I Denmark 0,9 0.1% 10.31
Italy 0.7 0.1% 17.5
Norway 10.4 1.0% 8.6
Rumania 1.6 0.1% 32.5
England 5.0 0.5% 5.2
Etc 1.6 0.1% 11.6
Europe 20.2 1.9% 8.2
Source : 4%$?Y 1998 (CH24%=31)
155

Central & South America
Country 1000 mill”mn barrel Rat io R/P
Argentina 2.6 0.2% 8.5
Brazil 4.8 0.5% 15.5
Colombia 2.8 0.3% 11.7
Ecuador 2.1 0.2% 14.8
Peru 0.8 0.1% 18.5
Trinidad and tobago 0.6 t 12.6
Venezuela 71.7 6,9% 59.5
Etc. 0.8 0.1% 21.7
Central& SouthAmerica 86.2 8.3% 37.3
Source : 4%$?Y 1998 (CHiZ~4%~El)
T : under 0.05 * : over 100year
Middle East
Country 1000 million barrel Rat io R/P
Iran 93.0 9.0% 69.0
Iraq 112.5 10.8% *
Kuwait 96.5 9.3% *
Oman 5.2 0.5% 15.8
Catarrh 3.7 0.4% 15.1
Saudi Arabia 261.5 25.2% 79.5
Syria 2.5 0. 2% 12.0
U.A. E 97.8 9.4% *
Yemen 4.0 0.4% 28.9
Etc 0.2 0.2% 12.2
M idd leEast 676.9 65.2% 87.7
Source : q%!?!~ 1998 (UIF24$%?43V)
T : underO.05 * : over 100yearn
156

Word Totalunit [lOWB/D)
Country 1992 1993 1994 1995 1996 Ratio ( 96)
OECD 19550 19660 20550 20745 21375 29.9%
OPEC 26070 26850 27190 27515 28225 40.5%
Non OPEC 30530 30985 32345 33120 34295 49.0%
WordTotal 65750 66010 66950 67850 69685 100%
“ &!%gY 1997 (f2ii2A!%Fm)Source .
C.I.S.unit(lWOS/D)
Country 1992 1993 1994 1995 1996 Ratio ( 96)
Azerbaijan 225 210 195 185 185 0.3%
Kazakhstan 550 490 435 440 480 0.7%
Russia 8035 7155 6420 6205 6075 9.0%
Uzbekistan 80 95 125 165 165 0.2%
Etc. 225 230 225 220 255 0.4%
C.1.s 9145 8180 7400 7215 7160 10.5%
Source : 4%E551 1997 (Eli~t4$?~l!l)
North Americaunit(1COcJwo)
Country 1992 1993 1994 1995 1996 Ratio ( 96)
U.S.A 8870 8585 8390 8320 8300 11.4%
Canada 2060 2185 2275 2400 2460 3.4%
Mexico 3120 3130 3140 3065 3280 4.9%
NorthAmerioa 14050 13900 13805 13785 14040 1g.i%o
Source : 4%9?Y 1997 (Uli24%~3J)
157
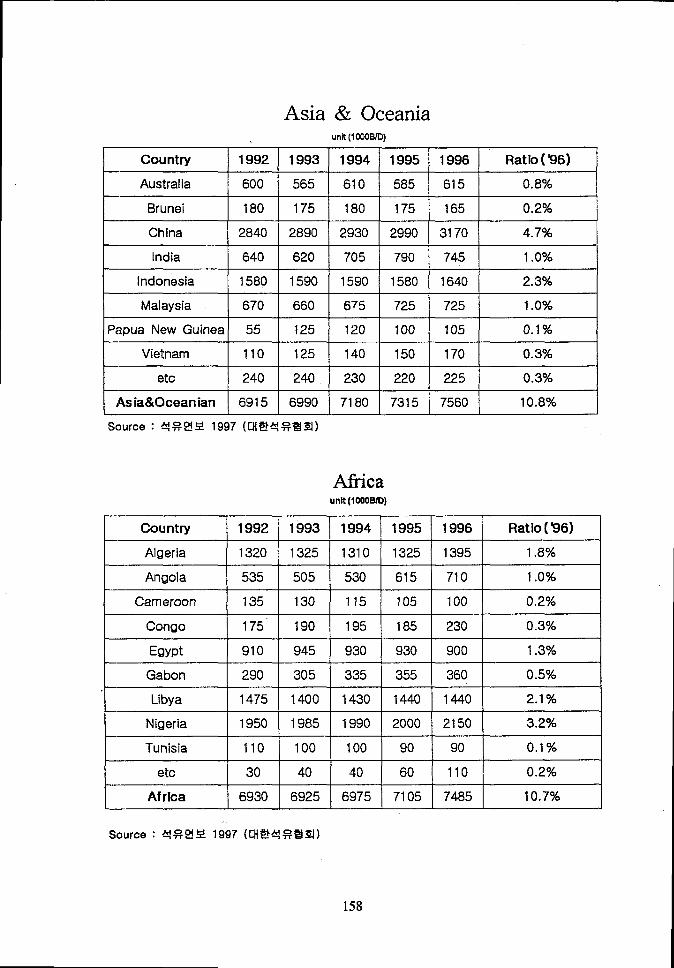
Asia & Oceaniaunit(IOOWD)
Country 1992 1993 1994 1995 \ 1996 Ratio ( 96)
Australia I 600 I 565 I 610 I 585 I 615 ] 0.8% IBrunei 0.2% IChina I 2840 I 2890 \ 2930 I 2990 I 3170 I 4.7% IIndia 1.0% I
Indonesia I 1580 I 1590 I 1590 I 1580 I 1640 I 2.3% IMalaysia I 670 I 660 I 675 I 725 I 725 I 1.0% I
Papua New Guineal 55 I 125 I 120 I 100 I 105 I 0.1% IVietnam I 110 I 125 I 140 I 150 I 170 I 0.3% I
etc I 240 \ 240 I 230 I 220 I 225 I 0.3% I
Asia&Oceanian I 6915 I 6990 I 7180 I 7315 I 7560 \ 10.8% ISource : 4%2!Y 1997 (CJlP!+%i21~)
Afkicaunit (IOOOEVO)
Country 1992 1993 1994 1995 1996 Ratio (96)
Algeria 1320 1325 1310 1325 1395 1.8%
Angola 535 505 530 615 710 1.0%
Cameroon 135 130 115 105 100 0.2%
Congo 175’ 190 195 185 230 0.3%
Egypt 910 945 930 930 900 1.3%
Gabon 290 305 335 355 360 0.5%
Libya 1475 1400 1430 1440 1440 2.1%
Nigeria 1950 1985 1990 2000 2150 3.2%
Tunisia 110 100 100 90 90 0,1%
etc 30 40 40 60 110 0.2%
Africa 6930 6925 6975 7105 7485 10.7%
158

Ehropeuni (1OXIWD)
7
Country 1992 1993 1994 1995 1996 Ratio (’96)
Denmark 160 170 190 190 215 0.3%
Italy 85 90 95 100 105 0.0%
Norway 2265 2430 2765 2965 3315 4.6%
Rumania 140 140 140 140 140 0.2%
England 1975 2115 2680 2755 2735 3.9%
Etc 490 460 480 440 415 0.6%
Europe 5115 5405 6350 6590 6925 9.8%
Central & South Americaunit(laxwo)
I Country I 1992 I 1993 \ 1994 I 1995 I 1996 I Ratio(!36)
I Argentina I 585 \ 630 \ 695 I 750 I 805 \ 1.2%
I Brazil I 645 I 655 I 680 I 705 I 800 I 1.2%
I Colombia 14401460146015901635/ 1.0%
I Ecuador I 330 I ’355 1 390 I 395 \ 395 I 0.6%
Peru 115 125 130 125 120 0.2%
Trinidad andtobago
145 135 140 140 140 0.2%
I Venezuela / 2500 I 2590 I 2750 I 2960 I 3145 I 4.8%
Etc. I 75 I 80 I 90 I 95 I 100 I 0.1%
ICentral&South
America I 4835I
5030I
5335 I 5760 I 6140 I 9.3%

Country
Iran
Iraq—
Kuwait—
Oman
Catarrh
Saudi Arabia
Syria
U.A.E
Yemen
Etc
M idd Ie East
Middle EastUnt (1mowo)
1992 I 1993 \ 1994 I 1995 I 1996
3525 3700 3710 3715 3715
525 465 515 590 590
1095 1930 2095 2155 2155
750 785 815 895 895
495 I 460 I 450 ] 460 I 475
2510 I 2445 I 2460 I 2505 ] 2600
185 I 210 345 I 350 I 370
55155150 ]50150
18760 I 19580 I 19905 I 20080 i 20375
Ratio ( 96) I
5.5% I
0.9% I
43.2%
1.3%
O.6%
12.8% I0.9% I
3.5% I
0.5% I
0.1% I29.3% I
Source : 4%E!!Y 1997 (CJIZ}4$?=3J)
160

q. +lqi#
Word Totalunit (1000B/D)
Country 1992 1993 1994 1995 1996 Ratio ( 96)
OECD 39605 39820 40830 40925 41775 59.6%
EU 12715 12630 12655 12800 13020 18.7’%
Developing Country 18250 19205 20325 21560 22550 32.6%
WordTotal 65975 65760 67065 68095 69545 100.0%
C.I.S.unit(lCQOBiD)
Country 1992 1993 1994 1995 1996 Ratio ( 96)
Azerbaijan 160 165 165 170 170 0.3%
Belarus 425 280 255 245 245 0.4%
Kazakhstan 405 315 245 240 225 0.3%
Russia 4495 3790 3265 2935 2565 3.9%
Turkmenistan 100 65 75 80 80 0.1%
Ukraine 855 500 400 380 345 0.5%
Uzbekistan 180 165 145 135 130 0.2%
Etc. 340 290 190 170 175 0.3%
c. 1.s 6960 5570 4740 4335 3935 6.0%
161

North Americaunk (1CDO@JO)
Countw 1992 1993 1994 1995 1996 Ratio (96)
U.S.A 16260 19470 16950 16950 17400 25.2%
Canada 1625 1680 1720 1665 1735 2.4%
Mexico 1545 1550 1685 1560 1605 2.2%
NorthAmerica 19430 19700 20355 20175 20740 29.8%
Asia & Oceaniaunit (mom)
Country 1992 1993 1994 1995 1996 Ratio ( ‘!36)
Australia 680 720 755 780 785 1.1%
Bangladesh 40 45 45 45 50 0.1%
China 2660 2915 3145 3380 3615 5.2%
India 1285 1300 1400 1515 1630 2.4%
Indonesia 730 785 755 825 900 1.3%
Japan 5540 5455 5760 5805 5830 8.1%
Malaysia 295 330 370 380 395 0.6%
New Zealand 110 110 ’115 120 125 0.2%
Pakistan 250 270 290 300 340 0.5%
Philippines 280 290 305 345 360 0.5%
Singapore -400 425 495 515 510 0.8%
Korea 1520 1675 1840 2010 2145 3.1%
Taiwan 585 625 665 725 725 1.1%
Chinese Taipei 490 555 615 715 785 1.1%
etc 390 410 430 450 480 0.7%
Asia& Oceanian 15255 15910 17005 17910 18675 26.8%
Source : 4%2!92 1997 (Cll#4%F43!J)
162
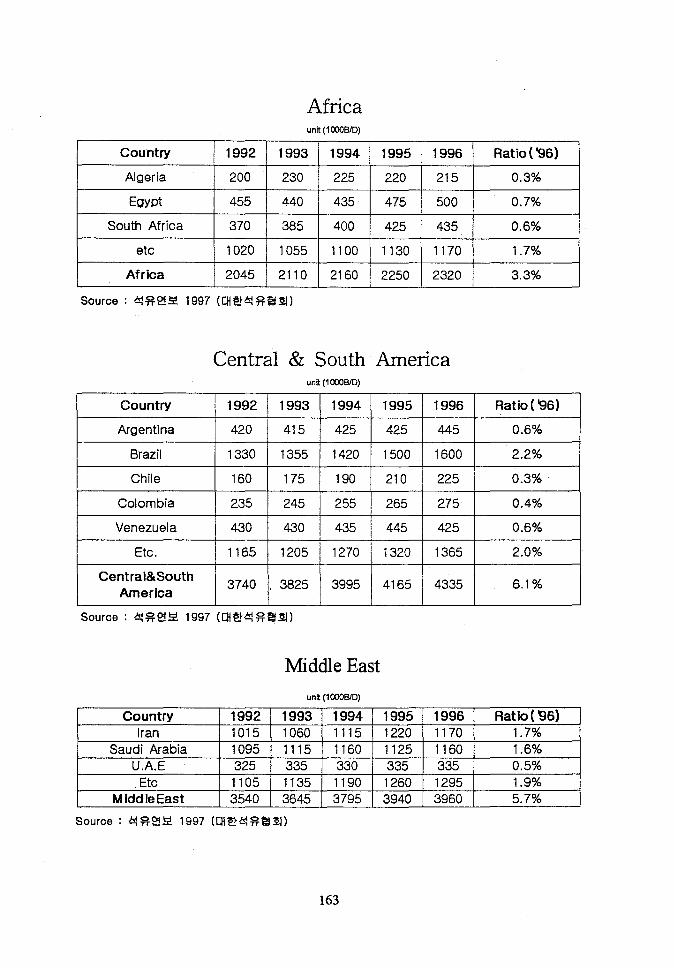
Africaunit(l CCOB/0)
Country 1992 1993 1994 1995 1996 Ratio (’96)
Algeria 200 230 225 220 215 0.3%
Egypt 455 440 435 475 500 0.7%
South Africa 370 385 400 425 435 0.6%
etc 1020 1055 1100 1130 1170 1.7%
Africa 2045 2110 2160 2250 2320 3.3%
Central & South Axnericaunit(1IXOBID)
Country 1992 1993 1994 1995 1996 Ratio ( !96)
Argentina 420 415 425 425 445 0.6%
Brazil 1330 1355 1420 1500 1600 2.2% i
Chile 160 175 190 210 225 0.3%
Colombia 235 245 255 265 275 0.4%
I Venezuela 143014301435/44514251 0.6%
I Etc. 1165 1205 1270 1320 1365 2.0%I b I 1 ,
Central&SouthAmerica
3740 , 3825 3995 4165 4335 6.1%
Source : 4%QIY 1997 (CliiX4%i2i31)
Middle East
unit(l COWD)
Country 1992 1993 1994 1995 1996 Ratio ( 96)
Iran 1015 1060 1115 1220 1170 1.7%
Saudi Arabia 1095 1115 1160 1125 1160 1.6%U.A.E 325 335 330 335 335 0.5%
Etc 1105 1135 1190 1260 1295 1.9%M idd leEast 3540 3645 3795 3940 3960 5.7%
163

Europeunit(1fXIOWD)
—Country 1992 1993 1994 1995 1996 Ratio ( ’96)
Austria 235 235 235 235 240 0.3%
Belgium/Luxembourg 560 545 555 545 595 0.9%
Bulgaria 110 115 120 125 135 0.2%
Czecho 140 140 140 155 155 0.2%
Denmark 185 195 210 215 235 0.3%
Finland 215 205 215 210 215 0.3%—
France 2010 1940 “1880 1895 1930 2.8%
Germany 2850 2905 2880 2880 2920 4.2%
Greece 330 340 345 360 375 0.6%
Hungary 170 160 170 160 145 0.2%.
Iceland 15 15 15 15 15 *
Ireland 105 105 115 120 120 0.2%
Italy 1925 1910 “1915 1975 1955 2.8%—
Holland 795 790 790 830 810 1.1%
Norway 195 210 210 210 230 0.3%
Poland 290 295 315 330 360 0.5%—
Portuggal 265 250 255 270 255 0.4%—
Rumania 26fl 240 225 275 280 0.4%
Slovakia 80 80 75 80 80 0.1%
Spain 1115 1080 1120 1175 1220 1.8%
Sweden 345 335 355 340 360 0.5%
Switzerland 280 265 270 255 260 0.4%—
Turkey 500 575 555 610 615 0.9%
England 1780 1795 1785 1750 1790 2.5%—
Etc 250 275 265 285 285 0.4%—
Europe 15005 15000 15015 15300 15580 22.3%
Source : 4%$!!5! 1997 (171EW%=3J)
f : underO.05 * : over 100years
164

1993E! unit(1OOOWD)
Ranking Contries Consumption Ratio (%)
1 U.S.A 16,470 25.1
2 C.1.s 5,470 8.3-1
3 Japan 5,455 8.3
4 China 2,915 4.4
5 Germany 2,905 4.4I , I
6 France 1,940 3.0
7 Italy 1,910 2,9
8 England 1,790 2.7
9 Canada 1,680 2.6
10 Korea 1,675 2.6
11 Mexico 1,555 2.4z
12 Brazil 1,355 2.1
Etc 20,520 31.3
Word Total 65,640 100.0
Source : 4%9!9 1997 (i31Z~4%F213!l)
165

1994E! unti(1OOOWD)
Ranking Contries Consumption Ratio(%)
1 U.S,A 16,950 25,3
2 Japan 5,765 8.6
3 C.1.s 4,670 7.0
4 China 3,145 4.7
5 Germany 2,880 4.3
6 Italy 1,915 2.9
7 France 1,880 2.8
8 Korea 1,840 2,7
9 England 1,785 2.7
10 Canada 1,720 2.6
11 Mexico 1,680 2.5
12 Brazil 1,420 2.1
Etc 21,355 31.9
WordTotal 67,005 100.0

1995E! unit (1COWO)
Ranking Contries Consumption Ratio (%)
1 U.S.A 17,400 24.9
2 Japan 5,830 8,5
3 C.1.s 3,935 6.3
4 China 3,615 4.9
5 Germany 2,920 4.2
6 Korea 2,145 3.0
7 Italy 1,955 2.9
8 France 1,930 2.8
9 England 1,790 2.6
10 Canada 1,735 2.6
11 Mexico 1,605 2.3
12 Brazil 1,600 2.2
Etc 23,085 32.8
WordTotal 67,930 100.0

unit(lOWB/D)
Ranking Contries Consumption Ratio (%)
1 U.S,A 17,400 25.0
2 Japan 5,830 8.4
3 C.1.s 3,935 5.7
4 China 3,615 5.2
5 Germany 2,920 4.2
6 Korea 2,145 3.1
7 Italy 1,955 2.8
8 France 1,930 2.8
9 England 1,790 2.6
10 Canada 1,735 2.5
11 Mexico 1,605 2.3
12 f3razil 1,600 2.3
Etc 23,085 33.2
WordTotal 69,545 100.0

Unt (1OOOWD
Import 1992 1993 1994 1995 1996 Ratio(’96)
US,A 7888 8620 8929 8831 9400 24.7%
West Europe 10139 10399 9840 9567 9539 25.1%
Japan 5.36 5307 5612 5581 5685 15.0%
Etc 9473 10255 11146 12261 13362 35.2%
Total 32986 34581 35527 36240 37986 100.0%
unit(1OOOWD
Export 1992 1993 1994 1995 1996 Ratio(’96)
U.S.A , 918 959 943 949 978 2<6%
Canada 1101 1215 1323 1402 1484 3.9%
Mexico 1469 1434 1421 1422 1656 4.4%
Central & South
America2374 2391 2695 2797 3011 7.9%
East Europe 1887 2072 2136 2312 2699 7.1%
Middle East 15453 ‘ 16456 16513 16651 17170 46.0%
North africa 2849 2685 2652 2696 2756 7.3%
West africa 2679 2676 2675 2723 2916 7.7%
Asia & Oceanian 2414 2420 2517 2576 2790 7.3%
Etc 1842 2273 2652 2712 2526 6.6%
Total 32986 34581 35527 36240 37986 100.0%
169
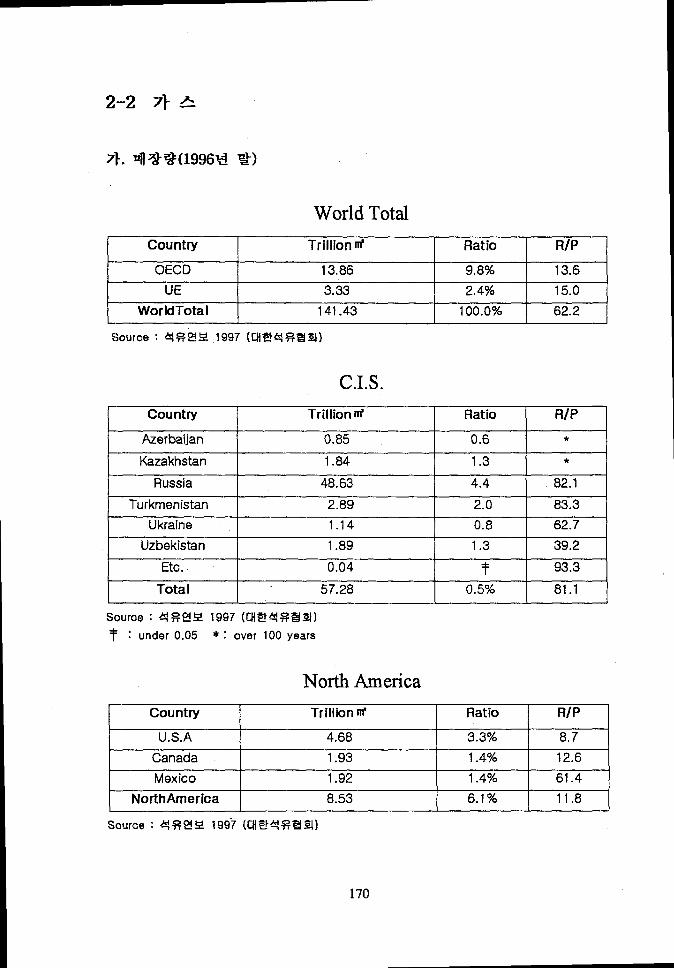
2-2 7} A
World Total
Country Trillion @ Ratio RIP
OECD 13.86 9.8% 13.6
UE 3.33 2.4% 15.0
WorldTotal 141.43 100.0% 62.2
C.I.S.Country Trillion N Ratio R/P
Azerbaijan 0.85 0.6 *
Kazakhstan 1.84 1.3 *
Russia 48.63 4.4 82.1
Turkmenistan 2.89 2.0 83.3
Ukraine 1.14 0.8 62.7
Uzbekistan 1.89 1.3 39.2
Etc. 0.04 T 93.3
Total 57.28 0.5% 81.1
Source : 4%E?Q 1997 (Ui15tq%?#l!4)
f : under 0.05 * : over 100 years
North kerica
Country Trillion m Ratio RIP
U.S.A 4.68 3.3% 8.7
Canada 1.93 1.4% 12.6
Mexico 1.92 1.4% 61.4
NorthAmerica 8.53 6.1% 11.8
Source : q%f?!g 199? (Ui Flq%?3311)
170

Asia & Oceania
Country Trillion M’ Ratio R/P
Australia 0.55 0.4% 18.5
Bangladesh 0.29 0.2% 38.2
Brunei 0.40 0.3% 34.5
China 1.17 0.8% 58.8
India 0.69 0.5% 33.5
Indonesia 2.05 1.5% 30.8
Malaysia 2.27 1.6% 64.2
Pakistan 0.62 0.4% 41.0
Papua New Guinea 0.04 * *
Thailand 0.20 0.1% 18.0
Vietnam 0.14 0.1% *
etc 0.69 0.5% 73.5
Asia&Ocean ian 9.11 6.4% 40.1
Source : %%$?S! 1997 (Ui S}4%?J431)
t : under 0.05 * : over 100years
lkfkica
Country Trillion w Ratio R/P
Algeria 3.69 2.6% 56.0
Egypt 0.58 0.4% 50.1
Libya 1.31 0.9% *
Nigeria 2.97 2.1% *
etc 0.76 0.5% *
Africa 9.31 6.5% *
Source : +%9!52 1997 (U12}4%=EI)
7: under 0.05 * : over 100years
171

Europe
Country Trillion W Ratio RIP
Denmark 0.11 0.1% 17.0
Germany 0.33 0.2% 18.9
Hungary 0.09 0.1% 22.3
Italy 0.30 0.2% 14.7
Netherlands 1.81 1.3% 20.8
Norway 1.35 1.0% 33.0
Rumania 0.40 0,3% 23.0
England 0.70 0.5% 8.3
Etc 0.33 0.2% 24.6
Europe 5.42 3.9% 18.6
Source : 4%Q9 1997 (CH’E~4%i211tl)
Central & South America
Country Trillion W Rat io RIP
Argentina 0.62 0.4% 21.4
Bolivia 0.13 0.1% 40.1
Brazil 0.15 0.1% 28.9
Colombia 0.23 0.2% 49.7
Ecuador ‘ 0.10 0.l% *
Trinidad and tobago 0.35 0.3% 49.6
Venezuela 4.01 2.8% *
Etc. 0.30 0.2% *
Central& South America 5.89 4.2% 70.2
Some : 4%!21SI 1997 (tHE~4%F3?il)
T : underO.05 * : over 100year
172

Middle East
Country Trillion ~ Ratio R/P
Bahrain 0.15 0.1% 20.4
Iran 21.00 14.9% *
Iraq 3.34 2.4% *
Kuwait 1.50 1.1% *
Oman 0.85 0.6% *
Catarrh 7.08 5.0% *
Saudi Arabia 5.35 3.8% *
U.A.E 5.80 4.1% *
Yemen 0.48 0.3% *
Etc 0.24 0.2% *
Midd Ie East 45.79 2.5% *
Source : q%$?= 1997 (CIIZ}4%=3J)
T : under 0.05 * : over 100years
173

Word Totalunit( milliin TOE )
Country 1992 1993 1994 1995 1996 Ratio( !)6)
OECD 795.6 820.2 856.8 869.0 917.9 45.7%
OPEC 148.8 159.2 161.7 168.1 189.7 9.4%
Non OPEC 352.6 374.2 395.5 427.7 464.5 23.1 %
WordTotal 1830.7 1860.8 1881.3 1915.3 2008.7 100.0%
Source : A%E?Q 1997 (llZ}4%PJ~)
C,,I.S.unit ( millbn TOE)
Country 1992 1993 1994 1995 1996 Ratio (’96)
Azerbaijan 6.6 5.7 5.4 5.5 5.3 0.3%
Kazakhstan 6.8 5.6 3.8 5.0 5.4 0.3%
Russia 537.6 518.8 509.8 499.9 505.0 25.1 %
Turkmenistan 50.5 54.8 29.9 27.1 29.6 1.5%
Ukraine 17.6 16.1 15.3 15.3 15.4 0.8%
Uzbekistan 35.9 37.8 39.6 40.8 41.1 2.0%
Etc. 0.5 0.4 0.3 0.3 0.3 *
C.1.s 655.5 639.2 604.1 593.9 602.1 30.0%
North Americaunit ( million TOE)
—
Country 1992 1993 1994 1995 1996 Ratio (96)
U.S.A 463.1 468.3 487.6 481.4 492.2 24.5 %
Canada 104.5 112.9 122.3 133.4 137.7 6.9%—
Mexico 25.0 25.0 25.8 25.3 28.1 1.4%
~NorthAmerica 592.6 606.2 635.7 640.1 658.0 3.6%
Source : ~%E5Q 1997 (41?J+%E33!I)
174

Asia & Oceaniaunit(milliinTOE)
Country 1992 1993 1994 1995 1996 Ratio (’96)
Australia 21.1 22.0 25.3 26.8 26.8 1.3%
Bangladesh 5.1 5.5 6.0 6.7 6.8 0.3%
Brunei 8.8 9.3 9.4 10.4 10.4 0.5%
China 13.6 14.6 14.9 15.8 17.9 O.gyo
India 14.3 14.5 15.6 16.9 18.4 0.9%
Indonesia 48.9 50.6 56.6 57.7 59.9 3.0%
Malaysia 20.5 22.4 23.5 26.0 31.8 1.6%
Pakistan 10.9 11.6 12.3 12.6 13.7 0.7%
Thailand 6.8 7.6 8.6 9.0 10.1 0.5%
etc 8.2 8.5 8.5 8.2 8.9 0.5%
Asia& Oceanian 158.2 166.6 180.7 190.1 204.7 10 .2%
Source : 4%P!R 1997 (UiZ~4%~El)
Africaunit( milliin TOE)
Country 1992 1993 1994 1995 1996 Ratio (’96)
Algeria 49,5 50.5 46.5 54.7 59.3 3.0%
Egypt 7.6 \ 9.0 9.5 9.9 10.4 0.5%
Libya 5.9 5.6 5.6 5.6 5.6 0.3%
Nigeria 3.8 3.8 4.0 4.1 4.2 0.2%
etc 0.6 2.2 2.3 2.4 2.7 0.1%
Africa 67.4 71.1 67.9 76.7 82.2 4.1%
Source : 4%$!!Y 1997 (CH~t4%=El)
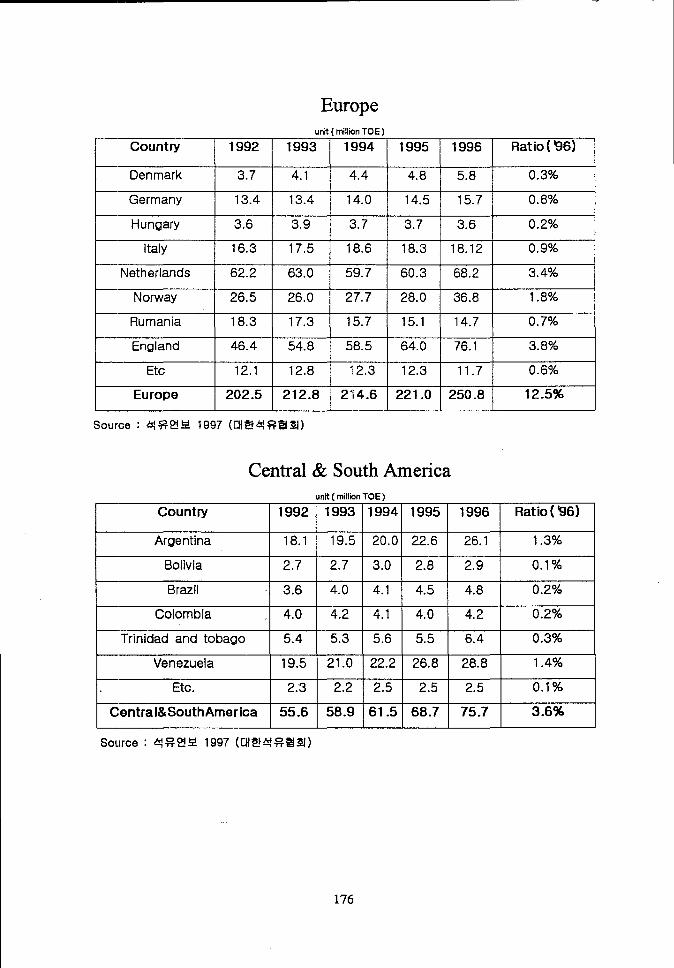
Europeunt ( milh TOE)
Country 1992 1993 1994 1995 1996 Ratio ( 96)
Denmark 3.7 4.1 4.4 4.8 5.8 0.3%
Germany 13.4 13.4 14.0 14.5 15.7 0.8%
Hungary 3.6 3.9 3.7 3.7 3.6 0.2%
Italy 16.3 17.5 18.6 18.3 18.12 0.9%
Netherlands 62.2 63.0 59.7 60.3 68.2 3.4%
Norway 26.5 26.0 27.7 28.0 36.8 1.8%
Rumania 18.3 17.3 15.7 15.1 14.7 0.7%
England 46.4 54.8 58.5 64.0 76.1 3.8%
Etc 12.1 12.8 12.3 12.3 11.7 0.6%
Europe 202.5 212.8 214.6 221.0 250.8 12.5%
Souroe : 4%9k2 1997 (UlZ~4%1331)
Central & South Americaunit(minim TOE )
Country 1992 1993 1994 1995 1996 Ratio ( ’96)
Argentina 18.1 19.5 20.0 22.6 26.1 1.3%
Bolivia 2.7 2.7 3.0 2.8 2.9 0.1%
Brazil 3.6 4.0 4.1 4.5 4.8 0.2%
Colombia 4.0 4.2 4.1 4.0 4.2 0.2%
Trinidad and tobago 5.4 5.3 5.6 5.5 6.4 0.3%
Venezuela 19.5 21.0 22.2 26.8 28.8 1.4%
Etc. 2.3 2.2 2.5 2.5 2.5 0.1%
Central& South America 55.6 58.g 61.5 68.7 75.7 3.6%
Source : q%f?!k! 1997 (Uli2}4%~34)
176

Middle Eastunit( miliiin TOE)
Country 1992 1993 1994 1995 1996 Ratio ( Q6)
Bahrain 5.8 6.2 6.4 6.5 6.5 0.3%
Iran 22.5 24.4 28.6 31.6 34.3 1.7%
Kuwait 2.4 4.0 5.4 5.4 5.4 0.3%
Oman 2.6 2.5 2.7 3.4 3.6 0.2%
Catarrh 11.4 12.2 12.2 12.2 12.2 0.6%
Saudi Arabia 30.6 32.3 33.9 34.4 37.2 1.9%
U.A. E 20.0 20.6 23.2 26.9 31.5 1.6%
Etc 3.6 3.8 4.4 4.4 4.5 0.2%
Middle East 98.9 106.0 116.8 124.8 135.2 6.8%
177

Word Total
unit( millionTOE)
Country 1992 1993 1994 1995 1996 Ratio( 96)
OECD 911.8 947.0 969.6 1013.6 1063.6 53.8%
EU 238.1 252.5 253.7 273.9 301.8 14.4%
Developing Country 275.6 295.8 321.3 348.0 377.0 19.1%
WordTotal 1803.6 1828.0 1834.9 1883.8 1971.6 100.0%
Souroe : 4%9!5! 1997 (13i~~4%E9g)
C.I.S.
unit( mkn TOE)
E Country 1992 1993 1994 1995 1996 Ratio( 96)
Azerbaijan 10.6 7.8 7.3 7.2 7.2 0.4%
I Belarus I 15.1 I 14.0 I 12.3 I 11.1 I 11.6 I 0.6% II I I I I
I Kazakhstan \ 12.2 I 11.7 I 9.2 I 9.7 I 9.5 I 0.5% I
I Russia I 375.5 I 360.7 I 335 I 317.9 I 317.0 I 16.1% I
t
Turkmenistan 8.4 8.4 9.2 7.2 7.6 0.4%
Ukraine 93.2 83.6 73.2 68.6 70.4 3.6%
I Uzbekistan I 33.6 I 36.6 I 37.2 I 38.1 I 40.0 I 2.0% I
I Etc. I 16.8 / 11.5 I 10.2 I 10.3 I 10.3 I 0.5% I
I c. 1.s I 565.4 I 534.3 I 493.6 I 470.1 I 473.6 I 24.0% I
North America
unit( millionTOE)
Country 1992 1993 1994 1995 1996 Ratio( 96)
U.S.A 507.3 524,9 536.5 558.5 569.2 28.9%
Canada 60.2 61.6 63.8 63.8 66.4 3.4%
Mexico 24.9 25.4 26.5 26.7 28.1 1.4%
NorthAmerica 592,4 611.9 626.8 649.0 663,7 33.7%
Source : q%~= 1997 (QiE}%%~EJ)
178

Asia & Oceania
unit( milliin TOE)I
Country 1992 1993 1994 1995 1996 Ratio(’96)
Australia 15.2 15.7 17.5 17.6 17.2 0.9%
Bangladesh 5.1 5.5 6.0 6.6 6.8 0.3%
China 13.6 14.6 14.9 15.9 15.9 0.8%
India 14.3 14.7 15.7 17.7 19.5 1.0%
Indonesia 20.3 21.5 24.6 27.5 27.1 1.4%
Japan 50.4 50.7 54.3 55.0 59,5 3.0%
Malaysia 9.5 11.7 12.3 13.0 14.5 0.7%
New Zealand 4.4 4.3 4.0 3.8 4.2 0.2%
Pakistan 10.9 11.6 12.3 12.6 13.7 0.7%
Philippines * $ * *
Singapore 1.0 1.4 1.4 1.4 1.4 0.1%
Korea 4.6 5.7 7.6 9.2 12.2 0.6%
Taiwan 2.8 2.7 3.6 3.9 4.0 0.2%
Chinese Taipei 6.8 7.6 8.6 9.0 10.1 0.5%
etc 2.4 2.8 2.9 3.1 4.9 0.2%
Asia&Ocean ian 161.3 170.5 185.7 196.3 211.0 10.7%
Source : q%S!Y 1997 (CtlPJ&%~El)
f : under 0.05 * : over 100years
Africaunit( milkm TOE )
1 , , I
I Country I 1992 I 1993 \ 1994 \ 1995 I 1996 \ Ratio(96) \
Algeria 16.0 16.7 17.6 20.6 22.1 1.1%
Egypt 7.5 8.7 9.4 9.9 10.3 0.5%
South Africa - - - - –
etc 9.5 9.5 10.2 10.2 10.7 0.5%
Africa 33.0 34.9 37.2 40.7 43.1 2.2%
Source : q%S!Y 1997 (Ui3_t4%~3!l)
179

Europeunit( milliin TOE)
Country 1992 1993 1994 1995 1996 Ratio( ’96)
Austria 5.4 5.7 5.8 6.1 6.6 0.3%
Belgium/Luxembourg 9.0 9.9 9.7 10.6 11.6 0.6%
Bulgaria 3.5 3.3 3.3 4.0 4.2 0.2%
Czecho 5.2 5.3 5,4 5.9 6.9 0.3%
Denmark 2.0 2.2 2.5 2.9 3.4 0.2%
Finland 2.5 2.6 2.8 2.9 3.0 0.2%
France 28.3 29.0 27.8 29.6 29.0 1.5%
Germany 56.7 59.8 61.1 67.0 75.2 3.8%
Greece 0.1 0.1 * * $ *
Hungary 7.4 8.1 8.2 8.9 9.9 0.5%
Iceland
Ireland 1.9 2.2 2.2 2.3 2.7 0.1%
Italy 41.2 42.3 40.8 44.9 46.9 2.4%
Holland 33.0 34.1 33.2 34.0 37.5 1.9%
Norway * * * *
Poland 7.8 8.1 8.2 8.9 9.5 0.5%
Portuggal
Rumania 22.8 22.7 21.8 21.6 22.3 1.1%
Slovakia 4.2 4.1 4.2 4.3 4.6 0.2%
Spain 5.9 5.8 6.5 7.5 8.4 0.4%
Sweden 0.7 0.7 0.7 0.7 0.8 *
Switzerland 1.9 2.0 2.0 2.2 2.2 0.1%
Turkey 4.1 4.5 5.9 6.2 8.1 0.4%
England 51.4 58.1 60.6 65.4 76.7 3.9%
Etc 5.2 4.7 4.7 4.4 6.9 0.3%
Europe 300.2 315.3 317.4 340.3 376.4 18.0%
Source : 4$?Q!Y 1997 (Ui Z4$?E2131)
T : under 0.05 * : over 100years
180

Central & South Americaunit( millionTOE)
1Country 1992 1993 1994 1995 1996 Ratio( ’96)
Argentina 20.1 21.2 21.9 24.4 27.9 1.4%
Brazil 3.6 4.0 4.1 4.5 4.7 0.2%
Chile 1.5 1.4 1.5 1.5 1.5 0.1%
Colombia 4.0 4.2 4.1 4.0 4.2 0.2%
Venezuela 19.5 21.0 22.2 27.0 28.8 1.5%
Etc. 6.9 6,8 7.5 7.5 8.4 0.4%
Central&SouthAmerica
55.6 58.6 61.3 68.9 75.5 3.6%
Source : 4%$!!Y 1997 (CJi~~4%~31)
Middle Eastunit( millkmTOE )
Country 1992 1993 1994 1995 1996 Ratio( 96)
lran 22.5 239 28.6 31.5 34.3 1.7%
Saudi Arabia 30.6 32.3 33.9 34.4 37.2 1.9%
U.A.E 16.9 17.6 19.5 21.0 25.0 1.3%
Etc 25.7 28.7 30.9 31.6 31.8 1.6%
Middle East 95.7 102.5 112.9 118.5 128.3 6.5%
Source : q%9!Y 1997 (lllFJ4f%~31)
181

~~+1% -%-?3+ q%%’ +++ xq~q ++~+=q%q- -lW+=Hong Kong, Chinese
Australia 115 . Mexico 106 5Chiua Taipei“Brunei
7 Indonesia 195Darussalem
New Zealand 6 Thailand 5
Papua New 46,607Canada 55 Japan 14 USAGuinea - DOE @f
Chile 21 Korea 8 Philippines 4
Totalchina 23 Malaysia 30 SingapoR -
47,201
182

183

1.
2.
3.
4,
5.
6.
7.
8,
9,
100
11.
12,
13.
APEC-GEMEED X11%},X12X},413x} q Q1 Proceeding.
APEC-GEMEED DB q ~% q =+$’ Proceeding.
ol~~, 1996.9, t+A]d} ~~o~ ~~1 ~+~, ~~A}
~~~~~, +x1+x] ~~ 1998
W?%%%lq, JFQl%xlw. 1997
q~~.++qjq, ++qy 1997
m%s~~ [=%QA%I 1997
INIP, International Financial Statistics 1998.9
The Central Bank of China, Financial Statistics 1998.7
International PetroIeum Encyclopedia 1997, PennWell publishing Co.
The Central Bank of China, Financial Statistics 1998,7
The World Bank, World Development Indicators 1998
Survey of Energy Resources 199$, WEC(WorId Energy CounciI)
184

3rd Meeting APEC-GEMEED
(May 8-12, 1998, Ottawa, Canada)
The Maintenance and Update of GEMEED’s
VVWW Database in Korea
KOREA
1. Introduction
We have accomplished a part of GEMEED DB goals by Korean
government funds in 1997 including GEMEED growth with the cooperation
of Colleagues and Experts, The APEC-GEMEED DB project for 1999 is
maintaining and updating the ready-made DB in 1997 and 1998. Korean DB
projects history by year is as follows:
- Project in 1997:
The minerals and energy resources related experts and dwectories in
the APEC region.
- Project in 1998:
The Construction of Database on the Oil and Gas Fields in the APEC
Region.
- Project for 1999:
APEC-GEMEED Directories and 011 and Gas Fields Database
Maintenance and Update
As a database project in 1997 “ The minerals and energy resources
related experts and directories in the APEC region” have been compIeted.
There are many who access this site, So we need to update this database,
This year’s project “The Construction of Database on the Oil and Gas
185
Fields in the APEC Region” is now under way. Next
“Maintenance and Update of APEC-GEMEED Directories
Fields Database”
2. Project Purpose
A Group of Experts on Minerals and Energy
year’s project is
and Oil and Gas
Exploration and
Development (GEMEED) is conducting the project on “APEC Network of
Minerals and Energy Database(ANMED)”. But the scope of ANMED is vast
for constructing a database for specific WWW homepages.
ANMED will be a source of general information for the time being. For
this reason, we think there are some problems in providing detailed data to
member economies for the investment promotion of minerals and energy
resources. We think that a specific and useful database should be
constructed as a part of ANMED.
The objective of this DB project is to provide more detailed information
and continuous access to an up-to–date assessment of the directmies and oil
and gas fields in member economies to facilitate strategic phming, definition
of new trends, and investment for minerals and energy exploration and
development within and between member economies,
3. Linkage
We have completed a homepage
minerals and energy resources, related
containing 265 pages which links
experts, and d~ectories in the APEC
fegion. We need member economies’ comments and review and will fiIl up
new additional organizations’ URL.
We already reviewed WWW Energy LLnks as well as publications about
oil and gas from DOE, WEC etc. to construct Oil and Gas fields DB. We
are constructing a unique and creative database without duplication with
other WWW databases.
4. Methodology
186

In gathering data, there are many sources as follows :
*
*
*
*
*
APEC - GEMEED Colleagues and Experts
Internet(http, gopher, ftp)
Publications
Meetings, Workshops
On-site visits and so on
The scope of this database project is limited to the directories and oil &
gas fields of the member economies, There are detailed methods in the
attached original proposals.
5. Budget
The estimated budget for this proposal is US$ 20,000 which will be used
for data search and input labor cost, maintenance cost. and publication cost.
We wilI consider buying another SOHO size PC server.
GEMEED colleagues or experts will be consulted for advice and
supplementation of data within the limit of this project budgetary
appropriation.
6. Others
We would appreciate it very much if GEMEED colleagues provide the
data for update on directories and the oil and gas fields in the APEC region
to Korea. There are many people who access this site. So, we published a
Korean version of GEMEED Directories for Korean companies. For member
economies, we think an English version of GEMEED Directories should be
pubfished after deliberating on this matter with GEMEED secretariat.
187

APEC FACE SHEET
Project No.Date receivedby Secretariat
kN.arne of Cornmitt.efiorking Group :
GEMEED DB Committee/Energy Working GroupTitle of Project : The Maintenance and Update of GEMEED’s
WWW Database in Korea
Proposing APEC Member : KOREA
[
Project Overseer :Name - Young-In KimTitle – Senior ResearcherOrganization - Korea Institute of Geology, Mining and
Materials(KIGAM)Postal Address : I Tel No : 82-42-868-329230, Kajung Dong, Yusungku, Fax No : 82-42–861-9720Taejon, Korea e-mail : [email protected]
Financial Total Cost ofAmount begin
Information Proposal(US$20,000) sought from APECCentral Fund($US-)I
] Project Start Date :1 Jan 1999 \ Project End Date :31 Dec 1999 I
Project Purpose :
A Group of Experts on Minerals and Energy Exploration andDevelopment(GEMEED) is conducting the project on “APEC Network ofMinerals and Energy Database(ANMED)”. But the scope of ANMED isvast for constructing a database for specific WWW homepages.
ANMED will be a source of general information for the time being. Forthis reason, we think there are some problems in providing detailed datato member economies for the investment promotion of minerals andenergy resources. We think that a specific and useful database should beconstructed as a part of ANMED.“ The objective of this DB project is to provide more detailed informationandl continuous access to an up-to-date assessment of the directories andoil and gas fields in member economies to facilitate strategic planning,definition of new trends, and investment for minerals and energyexploration and development within and between member economies,
I Signature of project Overseer I Data ISignature of Committee DataC1mir/WG Lead Shepherd
188

APEC-GEMEED, SECOND MEETING
Seoul, Korea, March 24-26, 1997
The Construction of Database on the Oil and Gas
Fields in the APEC region
KOREA
Introduction :
The first Workshop on GEMEED Database was held in Cannbera,
Australia in September 1996. At that time, Korea presented the database
proposal on “the mining related experts and organizations in the APEC
region”.
At present, we are planning the database on this project with our own
funds. The project result will be shown through the intemet, world wide
web, at the end of this year. Next year, consequently, we will maintain the
ready–made data which was constructed in 1996.
Along with this database, we have another plan to construct database on
the Oil and Gas Fields in the APEC region like the attached proposal in
1998, so we would like to contribute to GEMEED as to conducting this
project again.
Project Purpose :
A group of Experts on Minerals and Energy Exploration and
Development (GEMEED) is conducting the project on “comprehensive
database on mining and energy resource related opportunities and other
related data”. But the scope of GEMEED DB is vast for constructing a
database for specific intemet homepages (world wide web).
GEMEED DB will be a source of general information for the time beiig,
For this reason, we think there are some probIems in providing detaied data
189

to member economies for the investment promotion of oil and gas fields. We
think that a speciilc and usefuI database should be constructed as a part of
GEMEED DB.
The objective of this DB project is to provide more detailed information
and continuous access to an up–to-date assessment of the oil and gas fields
in member
trends, and
development
Linkage :
economies to facilitate strategic planning, definition of new
investment in the oil and gas fields for exploration and
within and between member economies,
At first, we will link all homepages within APEC energy working groups
as well as all the world like attached Energy Links and also review
W’blications about oiI and gas from DOE, WEC ect., and then we will
construct a unique and creative ckdtabase without duplication with other
expert groups database.
Our DB project will overlap a little bit with the energy database expert
group’s data in statistics like Table 1 but we will emphasize geoscience
based database, such as geIogical maps, drilling data and so on.
Methodology :
The our DB project for 1998 will be a part of GEMEED DB, In
gathering data, the member’s colleagues, inteme~ publications, meetings,
workshops, and site visits will be used. The detailed items of Oil and Gas
Fields are as follows :
APEC - GEMEED Colleagues and Experts :
Internet(http, gopher, ftp) : EIA - htt@//www.eia.doe.gov
Energy Information Links on the WWW - http://www.eia.doe. gov/
links.html(Attachment : 1)
Publications :
AAPG, Oil and Gas JournaI, Bulletin of Canadian Petroleum Geology,
190

Petromin, World Oil, International Petroleum Encyclopedia and so on,
. Meetings, Workshops
● on–site visits and so on
The scope of this database project is limited to the oil and gas fields of
the member economies. The main items are as follows:
. Name, size, date of discovery, and ownership of the oil and gas field.
. Location (offshore, onshore) and Infrastructure.
. Reserves and API gravity
. Depth, Production(B/d) and Cum. production(Bbl) or production
. Geoscience and survey data(map, drilling etc.)
● Metadata and other pertinent data,
We wiIl the construct database through such processes as data
analyzing, planning, design, and assessment for internet homepage.
planning.
gathering,
Budget :
The estimated
for data search
budget for this proposal is US$ 30,000 which will be used
and input labor cost, and maintenance cost, GEMEED
colleagues or experts will be consulted for advice and supplement of data
within the limit of this proje@ budgetary appropriation.
Others :
To facilitate the exploration and development of the oil and gas in the
APEC region, first of all, we need information about reserves, infrastructure,
related reports on mining rights and so on. There are many difficultities in
gathering these data, so it is necessary for the member economies cooperate.
We would appreciate it very much if GEMEED colleagues provide the
data on experts and organizations and the oil and gas fields in the APEC
region to Korea.
191

Oil
Table 1. International Oil and Natural Gas
Reserves as of December 31, 1995
(Million Barrels)
Rank a CountryOil & Gas
JournalWorld Oil
1 Saudi Arabls c d261,203 cE’61,2742 Former U.S.S.R. 57,000 189,681
3 Iraq c 100,OOO 99,1724 Kuwait c cN6,500 d94,9955 United Arab Emirates c 98,100 63,4846 Iranc 88,200 57,7007 Venezuela c 64,477 65,5658 Mexico 49,775 48,796
9 Libya c 29,500 34,74210 China 24,000 30,959
Top 10 Totzd 868,755 946,36611 United States e22,457 22,160
12 Nigeria c 20,828 21,26913 Norway 8,422 24,175
14 Algeria c 9,200 9,97915 Indonesia c 5,167 5,94516 India 5,814 5,28517 Canada 4)898 5,55018 Brazil 4,200 6,22319 Malaysia 4,300 5,2(N20 Colombia 3,500 5,50021 United Kingdom 4,293 4,538
22 Angola 5,412 3,12523 Oman 5,138 3,29824 Egypt 3,879 3,80425 Qatar c 3,700 3,922
Top 25 Total 979,964 1,076,339APEC Total 105,699 113,060OPEC Total 778,215 719,516World Total 1,007,475 1,107,111

Natural Gas (Billion Cubic Feet)
Rank b Country Oil & Gas.TOurnal
World Od
1 Former U.S.S.R, 1,977,000 1,936,586
2 Iran c 741,609 634,820
3 Qatar c 250,000 244,800
4 United Arab Emirates c 204,600 201,084
5 Saudi Arabia c d185,900 d194,100
6 United States e163,837 162,400! I
7 I Venezuela c 139,900 I 142,802
8 Algeria c 128,000 131,316
9 Nigeria c 109,710 124,423
10 Lraq c 109,500 108,000
Top 10 TotaI 4,010,056 3,880,330
11 Norway 47,498 121,925
12 Malaysia 68,000 80,200
13 Indonesia c 68,916 72,266
14 Mexico 68,413 67,668
15 Canada 67,027 65,750
16 Netherlands 65,156 64,096
1’7 I Australia I 20,082 I 94,7501
I 18 I Kuwait d56,725 1
19 China 59,000 46,300
20 Libya c 45,800 46,243
21 India 24,967 25,500
22 United Kingdom 23,308 24,710
23 Oman 25,200 20,057
24 Pakistan 27,000 17,461
25 Egypt 22,100 19,054
Top 25 Total 4,695,423 4,703,036
APEC Total 515,275 589,334
OPEC Total 2,037,335 1,957,004
World Total 4,933,572 4,951,888
193

a: Rank is based on an average of oiI reserves reported by Oil &Gas Journal and World Oil.
b: Rank is based on an average of natural gas reserves reportedby Oil & Gas Journal and World Oil,
c: Member of the Organization of Petroleum Exporting Countries(OPEC).
cl Includes one-half of the reserves in the Neutral Zone.e: Energy Information Administration proved reserves as of
December 31, 1994 were published by the Oil & Gas Journal asits estimates as of December 31, 1995.
Note: The Energy Information Administration does not certify theseinternational reserves data, but reproduces the information as amatter of convenience for the reader.
Sources: PennWell Publishing Company, Oil and Gas Journal, December25, 1995, pp. 44-45. Gulf Publishing Company, World Oil,August, 1996, p. 34.
194
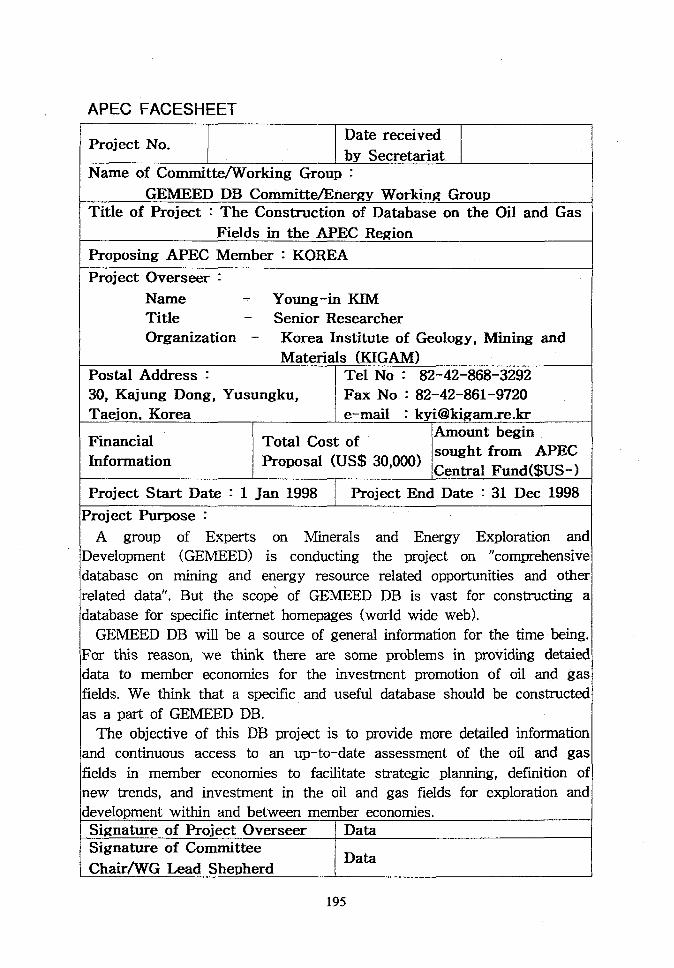
APEC FACESHEET
Date receivedProject No.
by SecretariatName of Cornmitte~orking Group :
GEMEED DB Committe/Energy Working GroupTitle of Project : The Construction of Database on the Oil and Gas
Fields in the APEC Region
Proposing APEC Member : KOREA
Project Overseer :Name – Young-in KIMTitle — Senior ResearcherOrganization – Korea Institute of Geology, Mining and
Materials (KIGAM)Postal Address : Tel No : 82-42-868-329230, Kajung Dong, Yusungku, Fax No :82-42-861-9720Taejon, Korea e–mail : [email protected]
Financial Total Cost ofAmount begin
Informationsought from APEC
PropOsaI (US$ 30,000) Cential Fund($Us_)I
I Project Start Date : 1 Jan 1998 / Project End Date :31 Dec 1998 I
Project Purpose :
A group of Experts on Minerals and Energy Exploration andDevelopment (GEMEED) is conducting the project on “comprehensivedatabase on mining and energy resource related opportunities and other
related data”. But the scope of GEMEED DB is vast for constructing a
database for specific intemet homepages (world wide web).
GEMEED DB will be a source of general information for the time being.\For this reason, we think there are some problems in providing detaiedldata to member economies for the investment promotion of oil and gasfields, We think that a spectilc and useful database shouId be constructed
as a part of GEMEED DB.
The objective of this DB project is to provide more detailed informationand continuous access to an up–to-date assessment of the oil and gas
]fieIds in member economies to facilitate strategic planning, definition oflnew trends, and investment in the oil and gas fields for exploration and
development within and between member economies.Signature of Project Overseer DataSignature of CommitteeChair/WG Lead Shepherd
Data
195

PROJECT TITLE
“The Construction of Database on the Oil and
Gas Fields in the APEC region”
1. Project Purpose :
A group of Experts on Minerals and Energy Exploration and
Development (GEMEED) is conducting the project on “comprehensive
data”base on mining and energy resource related opportunities and otherrelated data”. But the scope of GEMEED DB is vast for constructing a
database for specific intemet homepages (world wide web).GEMEED DB will be a source of general information for the time being.
For this reason, we think there are some problems in providing detaied data
to member economies for the investment promotion of oil and gas fieIds, Wethink that a specific and useful database should be constructed as a part of
GENJJ3ED DB.The objective of this DB project is to provide more detaikd information
and continuous access to an up–to-date assessment of the oil and gas fieldsin member economies to facilitate strategic plaming, definition of new
trends, and investment in the oil and gas fields for exploration and
development within and between member economies.The objective of this DB project is tn provide continuous access to an up
to date assessment of the oil and gas fields in member economies tofacilitate strategic planning, definition of new trends, and investment in the
oil and gas fields for the exact exploration and development within and
between member economies.
2. Linkage :
At first, we will link aIl homepages within APEC energy working groups
as well as all the world Iike attached Energy Links and also review
publications about oil and gas from DOE, WEC ect., and then we willconstruct a unique and creative database without duplication with other
expert groups database.Our DB project will overlap a little bit with the energy database expert
group’s data in statistics like Table 1 but we will emphasize geoscience
196

based database, such as gelogical maps, drilling data and so on.
3. Methodology :
The our DB project for 1998 will be a part of GEMEED DB. In
gathering data, the member’s colleagues, intemet, publications, meetings,workshops, and site visits wiIl be used. The detailed items of Oil and GasFields are as follows :
APEC - GEMEED Colleagues and Experts :Internet(http, gopher, ftp) :EIA - http://www.eia.doe.gov
Energy Information Links on the WWW - http://www,eia.doe.gov/links,htrnl(Attachment : 1)
Publications :
AAPG, Oil and Gas Journal, Bulletin of Canadian Petroleum Geology,Petromin, World Oil, International Petroleum Encyclopedia and so on.
Meetings, WorkshopsOn-site visits and so on
The scope of this database project is limited to the oil and gas fields of
the member economies. The main items are as follows:● Name, size, date of discovery, and ownership of the oil and gas field.● Lacation(offshore, onshore) and Infrastructure.
. Reserves and API gravity● Depth, Production(B/d) and Cum.production( Bbl) or productionplanning.
. Geoscience and survey data(map, driIling etc.)
. Metadata and other pertinent data.
We will the construct database through such processes as data gathering,analyzing, planning, design, and assessment for internet homepage.
4. Budget :
The estimated budget for this proposal is US$ 30,000 which will be used
for data search and input labor cost, and maintenance cost. GEMEEDcolleagues or experts will be consulted for advice and supplement of datawithin the limit of this project budgetary appropriation.
197
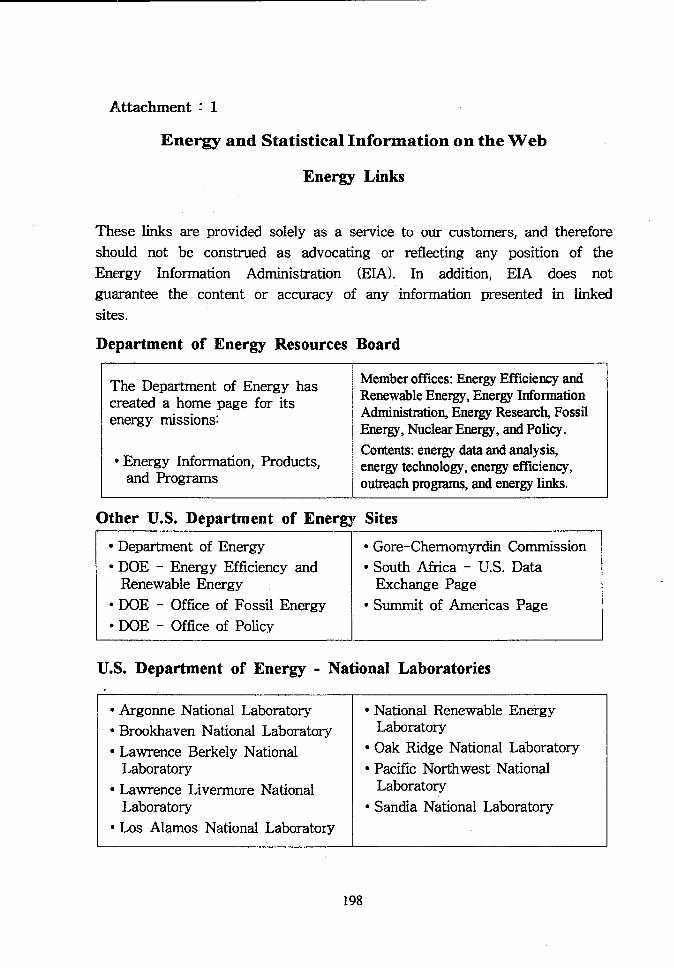
Attachment : 1
Energy and Statistical Information on the Web
Energy Links
These links are provided solely as a service to our customers, and therefore
should not be construed as advocating or reflecting any position of the
Energy Information Administration (EIA), In addition, EIA does not
guarantee the content or accuracy of any information presented in linked
sites.
Department of Energy Resources Board
The Department of Energy has Member ofilces: Energy Efilciency and
created a home page for its Renewable Energy, Energy Information
energy missions: AdministratioIAEnergy Resesrc~ FossilEnergy, Nuclear Energy, and Policy.
@Energy Information, Products,and Programs
Contents: energy data and analysis,energytechnology,energyefficiency,outreachprograms,andenergylinks.
Other U.S. Department of Energy Sites
● Department of Energy “ Gore-Chemomyrdin C2xnmission
“ DOE - Energy Efficiency and c South Africa - U.S. DataRenewable Energy Exchange Page
“ DOE - Office of Fossil Energy c Summit of Americas Page
L● DOE- Office of Policy
U.S. Department of Energy - National Laboratories
● Argonne NationaI Laboratcq ● National Renewable Energy
● Brookhaven National Laboratory Laboratory
“ Lawrence Berkely National ● Oak Ridge National Laboratory
Laboratory c Pacific Northwest National
“ Lawrence Livermore National Laboratory
Laboratory ● Sandia National Laboratory
● Los Alamos National Laboratory—

Federal Government
● Central Intelligence AgencyWorld Fact Book
s Business Information Service forthe NewIy Independent States
c Central and Eastern EuropeBusiness Information Center
c International TradeAdmirktration -Energy Division
● Minerals Management Service‘ National Science Foundation● U.S. Geological Survey (USGS)● USGS Minerals Page● U.S. Library of Congress -
Country Studiesc U.S. Dept. of State – Chile Visit
Local, State Governments, UniversitiesAcademic
9California Energy Commission“Colorado School of Mines - World
Energy“ Hawaii State Energy Office“ Idtio Dept. of Water Resources
Energy Div.“Michigan Energy Appraisal“Mmesota Dept. of Public Service● National Academy of Sciences● Nat. Assoc. of Regulatory Utiiity
Commissioners
International Energy Statistics
● New Mexico’s Go-Tech● PetroleumTech. Transfer Council● Texas Bureau of Economic
Geology=U, of Illinois Arterial Blockage in
Petroleum Pages University of Tulsa“Utah Office of Energy Services=Energy Data Page at U. of
Wisconsin
s African 0;1 Industry Statistics*APEC● Australian Department of Primary
Industries and Energy● British Petroleum Statistical Review=Canadian Energy Research Institute● Natural Resources Canada -
Energy Sectors Canadian Residential Energy Data
and =Analysis Center“East-West Center*European Energy Network● International Energy Agency
“ IEA Int. Centre for Gas TechnologyInformation
● Japm Petroleum Association of● Mexico - Energy Regulatory
CommissionQMexico - Ministry of Energy“Rand Afrikaans University, South
Africa (IES)● Swedew NUTEKj Dept. for Energy
Economic Studies“Embassy of Turkmenistan*United Nations Energy Statisticss Embassy of Saudi Arabia“World Bank
199
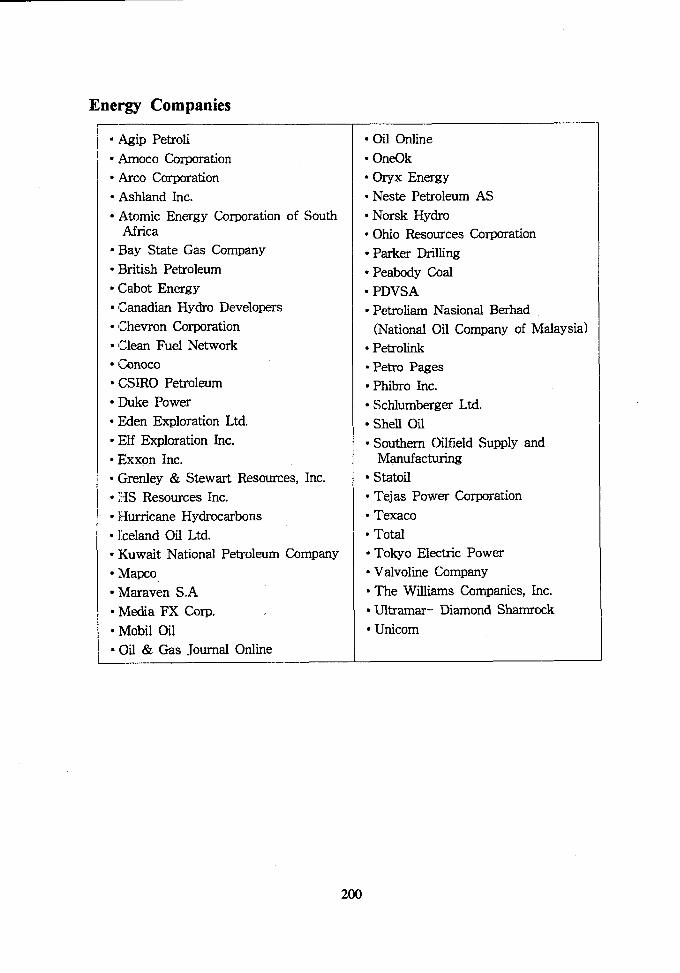
Energy Companies—
“ Agip Petroli ● 011Online
● Amoco Corporation ● OneOk
● tico Corpmation ● Oryx Energy
● Ashland Inc. ● Neste Petroleum AS
● Atomic Energy Corporation of South ● Norsk HydroAfrica
● Ohio Resources corporation● Bay State Gas Company “Parker Drilling● British Petroleum
● Peabody Coal. {CabotEnergy 9 PDVSA“Canadkn HYdro Developers “Petroliam Nasional B=had. (chevron Corporation (National Oil Company of Malaysia)● (CleanFuel Network
● Petrolink● Conoco *Petro Pages“CSIRO Petroleum I Phibro Inc.● Duke Power ● Schlumberger Ltd.“Eden Exploration Ltd. ● Shell Oil“Elf Exploration Inc. “Southern Oilfield Supply and“IExxon Inc. Manufactming
=Grenley & Stewart Resources, Inc. “Statoil
● I-IS Resources Inc. “Tejas Power Corporation
● Hurricane Hydrocarbons “Texaco
● Iceland Oil Ltd. ● Total
● Kuwait National Petroleum Company ● Tokyo Ek?ctric power
● Mapco ● Valvoline Company
● Maraven S,A “The Williams Companies, Inc.
=Media FX Corp. =Ultmmar- Diamond Shamrock
“Mobil Oil oUnicorn
“Oil & Gas .lournal Online
200

Trade Associations
“American Boiler ManufacturersAssociation
● kmrican Gas Association● herican Petroleum Institute● American Public Works Association*American Wind Energy Association● Biomass Energy Alliances Distribution Contractors Association● E&son Electric Institute● Electric Power Research Institute“EPRI: Industrial and Agricultural
Bus. Unit“Electric Vehicles for a Clean Future“Export Council for Energy Efficiency● Export Council for RenewableEnergy
Other Energy Links
*ARAL Energy News“American Association of Petroleum
Geologistss CMS Business Intelligence● CNN Commodities Prices“ Center for Renewable Energy and
Sustainable Technology● Common Purpose for Clean Energy● Dwights: Energy Data, Software and
Information Services“Electricity Net Online=Energy Institute of the i%neqcias=Energy Centrals Energy Modeling Forums Global Hubbert Peak at Ecosystems“John S. Herold, Inc.“ INO Global Marketss International Association for Energy
Economicsc International Energy Foundation● International Institute for Energy
Conservation
“Gas Research Institutes Independent Petroleum Association
of America“Interstate Natural Gas Association of
AmericaBMidwest Gas Association● National Association of Royalty
Owners● National Petroleum Council=National Petroleum Refiners
Association“North American Electric Reliabdity
Council10regon People’s Utility District
Association
● Instituteof Gas Technology“ InternationalBuilding Performance
SimulationAssociation
BInternationalSolar Energy Society‘ Kobe Steel, Energy & Chemical Plant
Group“LLoyd’s List● Moody’s World Energy Group
Lds● National Energy Foundation“Northeast-Midwest Institute
O&G
● Offshore 011 and Gas Technology* Oil Worldc PetroleumFinancial Network● Rocky Mountain Miieral Law
Foundation
● Rezachek’s Renewable Energy Page● Russian Financial and Other
Statistics“ Solar Energy IndustriesAssociationc SustainableMinnesota* The Utility Comection
201

Other Federal Information and Statistics Sources
“ Bureau of the Census “ EnvironmentalProtection Agency“ Bureau of Economic Analysis ● FedStat - One Stop Shopping for● Bureau of Labor Statistics Federal Statistics
● Bureau of Transportation ● Fed World
Statistics ● InternalRevenue Service
● Center for Disease Control ● InternationalTradekhninistration
● Departmentof Agriculture *NASA
=Departmentof Commerce *National Climatic Data Center
● Departmentof Defense ● National Institutesof Health
“ Departmentof Education “ National Library of Medicine
s Departmentof Health and Human =Social Security AdministrationServices “ U.S. House of Representatives
“ Departmentof Housing and Urban I U.S. Library of CongressDevelopment
● U.S. Library of Congress -“ Departmentof Interior THOMAS LegislativeInformation“ Departmentof Justice “ U.S. Senate● Departmentof Labor “ White House● Departmentof State “ White House - Economic Briefii=Departmentof the Treasury Room
wDepartmentof Tranqxxtation
● Department of Veteran’s Affairs—
File last motiled: March 17, 1997contact:MaIk [email protected]: (202) 586-1130Fax: (202) 586-9753
IjlW: http:lhvuw.eia.doe.govllinks.html
If you are having technical problems with this site, please contact the EMWebmaster at wrnaster@eia. doe.gov
202

EXPERT GROUP ON MINERALS AND ENERGYEXPLORATION AND DEVELOPMENT (GEMEED)
SUMMARY RECORD OF THE THIRD MEETING
8-12 May, 1998Ottawa,Canada
1. Introduction
The Third Meeting of GEMEED was held on 11-12 May 1998 at the Sheraton Hotel in0ttaw4 under the Chairmanship of Mr. Tomas Astorga, of the Ministry of Mines ofChile, and Ms. Bethany Armstrong of Natural Resources Canada. Representatives ofAustralia, Canada, Chile, Indonesia Japan, Korea, Mexico, the Philippines, ChineseTaipei, Thailand and the USA attended. Peru was present as observer.
Two meetings preceded the Annual Meeting:
““ Database Steering Committee““’ Environmental Cooperation Steering Committee (Preparatory meeting this
committee is expected to be ofilcially established at the next EWG meeting).
The following documents are annexed:
Annex 1:Annex 2:Annex 3:Annex 4:
Annex 5:Annex 6:Annex 7:Annex 8:
AgendaList of delegatesVoluntary reports by member economiesSummary record of the preparatory meeting of the proposedEnvironmental Cooperation Steering CommitteeSummary record of the Database Steering CommitteeSecretariat~ReportJapanese Project ProposalsAustralian Project Proposa{
2. Introductory Remarks:
Mr. Astorga and Ms. Armstrong, co-chairs of the meeting, welcomed the delegates. Ms.Armstrong introduced Ms. Linda J. Keen, Assistant Deputy Minister, Minerals andMetals Sector, Natural Resources Canada.
203

3. Opening address by Linda J. Keen, Assistant Deputy Minister
Ms. Keen welcomed the delegates to Ottawa, and stressed the relevance of a meeting ofthis nature, particularly as it addressed the issue of sustainable development of mineralsand metals.
4. Procedural issues
Mr. Astorga reviewed the conclusions of the forward planning meeting, which took placein Tokyo in conjunction with ECO~ 7. He explained the new directives on third tiergroups, issued by the EWG at its recent meeting in Mexico. GEMEED will proposecreating the Environmental Cooperation Steering Committee at the next EWG meeting inAugust 1998, in Cairns, Australia.
Australia asked for minor changes to the Summary Record of the Database SteeringCommittee. The Secretariat agreed to make the changes and will distribute the amendeddocument to all the member economies.
5. Voluntary reports by Economies
““ Australian presentation: Australia provided a brief description of its new resourcespolicy statement on minerals and petroleum and outlined some of the initiatives takenby the government.
““ Canadian presentation: Canada provided a brief review of its investment climate.
““ Chilean presentation: Chile gave a presentation on a general outlook of the Chileaneconomy from the minerals and metals point of view, underlying certain projectionson copper production and world-market share.
““ l[ndonesian presentation: Indonesia provided a review of mining and energydevelopment in the countiy.
““ Japanese presentation: Japan gave a summary of the current state of the Japanesemining industry, particular y on its overseas activities and the government= overseas
“ cooperation activities.
““ IKoreanpresentation: Korea provided an overview of its rehabilitation program forabandoned coal mines.
““ Thailand: Thailand gave a presentation on sustainable development of mineralresources in the economy, including its attempts to increase added value to its mineralresources and to improve its legislation and regulations.
204
““ US presentation: The US expressed its concerns about the misuse of theprecautionary principle and international regulatory initiatives such as the BaselConvention, and ‘~e bansll
6. Report by GEMEED Secretariat
The Secretariat explained its activities since the Second Meeting in Korea, and reportedthat Chile had commissioned a study on energy efficiency in mining to provide baselinedata for fiture work by GEMEED. The meeting accepted the Report by the Secretariat asan accurate summary of activities since the second meeting.
7. Programs of Cooperation
7.1. Comprehensive database
Dr. Williamsonreviewedthe statusof the databaseproject. AMSAT (the consultant)gave a presentationon implementationof the project to date and demonstratedthedatabaseon the Internet.Therewas discussionabout the cost of maintenanceof thedatabaseandoptionsfor findingthedatabase,includingadvertising.
7.2. Environmental cooperation
Mr. Kamei reviewed the conclusions of the preparatory meeting of the EnvironmentalCooperation Steering Committee on May 8ti. He recommended, and the meeting agreed,that the draft terms of reference be approved by GEMEED and ofllcially submitted to theEWG. Mr. Kamei asked all GEMEED delegates to contact their colleagues on the EWGand request support for the setting up the committee at the next EWG meeting.
Japandescribeditsthreeprojectproposals,whichwere supportedby all economies.Theprojectsare:
““ Information service center on internet for environmental issues in APECeconomies
““ Research project on the trends in international environmental law affecting themining industry
““ Research on life cycle assessment in metal mining
Japan proposed the creation of an informal group to discuss the environmental lawproject, and invited the participation of interested economies. Japan will contract anexpert on international law to give a presentation at ECOW(l S.
The Secretariat will write a position paper with Japan on procedural issues related toenvironmental law and regulations, which till be presented at ECOWU 8. The items shallbe procedural (such as legal information from the ANMED database, setting u an
Jinformal network to share information on new international regulations, Secretariat %key
205

note on environmental law from several member economies, Japanese proposal for apaper on general trends on international environmental law). This position paper will befinalized in consultation with the Environmental Cooperation Steering Committee andpresented at that committee during ECO~ 8.
Japan will distribute questionnaires to economies to elicit their views related to theresearch on life cycle assessment in metal mining. Japan expects each membereconomy% cooperation answering the questionnaire.
The Secretariat asked Mr. Campusano to provide liaison with the new EnvironmentalCooperation Steering Committee.
Australiaelaboratedon its proposalfor a projecton sustainableminingbased on bestpractices.After discussion,Mr. Astorga proposed that a small group of interestedeconomiesgatherafterthemeetingto attemptto reachconsensuson how thk shouldbestructured.Thk group met and agreed on project scope and objectives. Australiapresented a revised proposal, titled % orkshops for promotion of sustainabledevelopmentof mineralresource~ as a basisfor submissionof an applicationfor ~Ffunding.
8. Industry panel
James P. Cooney DSD: Applying the Concept
Mr Cooney spokeaboutPlacerDome%newSustainabilityPolicy. ForPlacerDome,sustainabilitymeanstheexploration,design,construction,operationandclosureof minesin a mannerthatrespectsandrespondsto thesocial,environmentalandeconomicneedsof presentgenerationsandanticipatesthoseof futuregenerationsin thecommunitiesandcountrieswhereitworks. Thisdefinitionis thefoundationfor five areasof specificobjectives:corporatecommitment;publicresponsibility;socialprogress;environmentalstewardship;and,economicbenefits.
Ian Thompson HCommunity Relations
Mr Thompson indicated that, as the indus~ has broadened its overseas activities,particularly in developing countries, community relations has become the ~ot button”issue for the mining industry in the 1990s. H[esuggested that industry must have thesupport of local communities to be successful, particularly in regard to how it managesthe exploration and development phase of mining projects. The current culture ofmineral exploration contains many sources of potential conflict with local communities<Sensitivity to the needs, aspirations, and fears of local communities, as well as bettercommunications skills, are key to ensuring that cooperation, rather than conflict,characterizes the industry-community relationship.
206

Rick Siwik n Environmental Protection: Tailings Management
Mr Siwik%presentation reviewed the historical background for tailings management inCanada. He then provided an overview of international activities and initiatives related totailings management. In this overview, he briefly mentioned the workshop of theInternational Council for Metals and the Environment in Stockholm in May 1997, andtwo UNEP-sponsored guidelines dealing with tailings management and large damconstruction. He concluded his presentation by summarizing the activities of the MiningAssociation of Canada in developing a guide to tailings management, and Norandapolicy on tailings management.
Dan Paszkowski DEnergy Efficiency Efforts in Mining
Mr Paszkowski spoke about the negotiations and outcome of the recently concludedKyoto Protocol on reducing greenhouse gas emissions. He then reviewed thecommitment made by Canada to reduce its emissions and the expected impact onCanada%!outlook for energy consumption into the 21* century.
Mr Paszkowski indicated that the metal mining industry in Canada has taken a pro-activeapproach in seeking to reduce its energy consumption, thereby reducing greenhouse gasemissions. Through a Task Force on Energy Initiatives, it is implementing a voluntarychallenge and registration program. He reported industry is already making progress inbecoming more efficient, but warned that there are a number of pitfalls that must beovercome.
In concluding, he opined that the Kyoto Protocol is only the beginning of the debate onclimate change; that the industry is demonstrating that voluntzuy approaches work, andthat increased energy efficiency is a ‘!?in-winlJ situation.
Juanita Galaz DEnvironmental Opportunities in Chile%Mining Sector
Ms Galaz provided an overview of Chile economic profile, indicating that there has beentremendous growth in foreign direct investment, particularly in mining, since 1990.Similarly, mineral production has increased significantly, with copper productiondoubling in that time span. Mining exports represent 46 percent of Chile% total exports.
As mining has grown in Chile over the last 10-15 years, so has concern overenvironmental issues. The National Commission for the Environment (CONAMA) wascreated in 1990, and in 1994, a general environmental law (Law No. 19.300) was passed.The law has three main characteristics: it adopts the polluter pays principle; it makesenvironmental impact assessment mandatory for large projects; and it establishes liabilityfor environmental damage.
207
At thestartof theafternoonsession,Mr. Gary Nash, International Council on Metalsand the Environment (ICME), outlined the membership and work program of the Counciland spoke briefly about some of the current issues related to metals and the environment.
9. Programs of cooperation: new themes and project proposals
Presentations on project proposals and project ideas by potential sponsors:
““ Safe Use of Minerals and Metals (Canada)““ Energy Efficiency (Chile)““ International Environmental Regulations (Chile)““ Maintenance and Update of GEMEED%VWW Database (Korea)““ Workshops for promotion of Sustainable Development of mineral resources
(Australia). The revised proposal was discussed and accepted by GEMEED.
The Secretariat will circulate these presentations and other information to GEMEEDdelegates.
10. Other business
At the request of the Co-chairs, the GEMEED delegates discussed the choice of acronymfor the Expert Group: either retaining ~ EM$3ED0or adopting 9 GMEEDD whichreflects the revised name of the Expert Group. The delegates unanimously expressedtheir preference to retain the acronym GEMEED.
11. Next meetings
The SecondEnvironmentalCooperationWorkshop(ECO~ 8) will be heldin Santiago,28,29 and30 of September1998.
Thailand offeredto hosttheFourthGEMEEDAnnualMeetinginPhuketin May 1999.Tks offer wasgratefidlyacceptedby GEMEED.
me lLJnitedStates will explore tie possibility OfhostingtheFifi GEMEEI)Meeting inautumn 2000.
12. Approval of summary record
The delegates approved the Summary record by unanimity.
208

13. Closing remarks
The Chairman of GEMEED expressed the appreciation of all GEMEED representativesto Natural Resources Canada for its hospitality and the excellent arrangements for themeeting. He also expressed appreciation for the assistance provided by the CanadianInternational Development Agency to support delegate participation at GEMEED 3.
He reaffkned the commitment of GEMEED members to advance the objectives ofGEMEED.
Ottawa, May 12, 1998
209
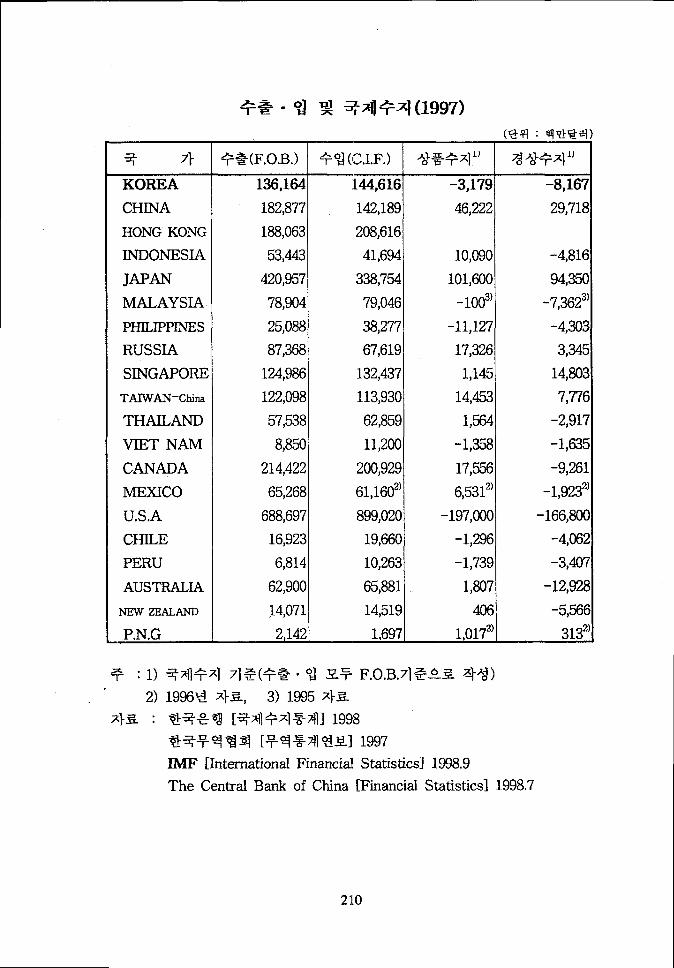
* 71
- KOREA
CHINA
HONGKONG
INDONESIA
JAPAN
MALAYSIA
PHILIPPINES
RUSSIA
SINGAPORE
TAMAN-Chim
THAILAND
VIET NAM
CANADA
MEXICO
U.S.A
CHILE
PERU
AUSTRALIA
NEWzEALAND
P.N.G
136,164 144,616
182,877 142,189
188,063 208,616
53,443 41,694
420,957 338,754
78,904 79,046
25,088 38,277
87,368 67,619
124,986 132,437
122,098 113,930
57,538 62,859
8,850 11,200
214,422 200,929
65,268 61,1602)
688,697 899,020
16,923 19,660
6,814 10,263
62,900 65,881
?
I10,090
101,600
-1003)
-11,127
17,326
1,145
14,453
1,564
-1,358
17,556
6,5312)
-197,000
-1,296
-1,739
1,807
14,071 14,519 406
2,142 1,697 1,0172)’
29,718
-4,816
94,350
-7,3623)
-4,303
3,345
14,803
7,776
-2,917
-1,635
-9,261
-1,9232)
-166,800
-4,062
-3,407
-12,928
-5,566
3132)
2) 19SW ~}s, 3) 1995 +=.
7:)s : ~~~~~ [~xl+xl ~~] 1998
a%’+%%=1 [J#@l%71@Yl 1997
IN-IF [International Financial Statistics] 1998.9
The Central Bank of China [Financial Statistics] 1998.7
210

=+ 7)
KOREA
BRUNEI
CHINA
HONG KONG
INDONESIA
JAPAN
MALAYSIA
PHILIPPINES
RUSSIA
SINGAPORE]
TAIWAN-China
THAILAND
VIET NAM
CANADA
MEXICO
U.S.A
CHILE
PERU
AUSTRALIA
NEWZEALAND
P.N.G
(@q : q~+,giq %)
=V-1*’W ~yl*4j& %xl‘%%’%19% GNP
(GDP) (GNP)(199W)
(4!3FIGDP71%)
4,426 4,374 10,543 5.5
551) 4~2) 4.61)
9,177 9,0811) 750 8.8
1,723 1,5301) 24,290 5,3
2,146 1,976 1,080 4.6
41,927 51,4921) 40,940 0.9
985 935 4,370 7.8
822 857 1,160 9.7
4,498 3,5601) 2,410 -4.23)
941 949 30,550 7.0
2,834 2,850 12,838 6.8
1,539 1,493 2,960 -0.4
257 2191) 290 8.8
6,176 5,978 19,020 3.8
4,028 3,417 3,670 7.0
80,799 80,601 28,020 3.8
771 741 4,860 7.1
652 5871) 2,420 7.2
3,947 3,824 20,090 2.9
659 606 15,720 2.9
512) 501) 1,150 13.32)
? : 1) 1996% ~}=, 2) 1993 ~}i=, 3) 1995 ~}=
X}s. : &f.&q [~g ~]~] 1997
IMF [International Financial Statistics] 1998.9
The
The
Central Bank of China [Financial
World Bank [World Development
Statistics] 1998.7
Indicators] 1998
211

4 q - APECQl H]=x1x(Comp~ative Indicators of World & APEC)
~g gs g$q “421 APECda q~l(%:
q q 1995 10,OOOM 13383 6238 46.6
0] ? 1998 loow%l 5930 2510 42.3
GDP 1996 10QIEH 28584 16648” 58.2
?QIQi 1996 lo’q%t+ 10658 4938 46.3
%?5 1996 1? 5290 2399 45.3
=Ftl 1996 1! 5368 2539 47.3
~++~~+q 1995 ~ooo~ 3065367 1 165443” 380
x}~Z}~.@~ 1996 1000Q 54657 32 971s) 60.3
37~4j&3 1996 looo~ 749977 444592 59.3 -
3~>aEq 1996 1000GT 24187 197404’ 81.6
212

&+~ APEC=#7}+q %?5 - q(Exports & Imports between Korea and APEC area)
=+3
KOREA
APEC
ASIA
BRUNEI
CHINA
HONGKONG
INDONESIA
JAPANMALAYSIA
PHILIPPINES
RUSSIA
SINGAPORETAIWAN-Chim
THAILAND
VIET NAM
JORTH-AMERICA
CANADA
MEXICO
U.S.A
;OUTH-AMERICA
CHILEPERU
OCEANIA
AUSTRALIA
NEw ZEALAND
P.N,G
+-a1993 I 1996 / 1997
82236
58379
10
5151
6431
2095
11564
1430
935
601
3109
2296
1761
728
1374
997
18138
373
58
1185
124
19
129715 136164
91392 94604
33 29
11377 13572
11131 11725
3198 3540
15767 14771
4333 4356
1906 2601
1968 1767
6439 5796
4005 4612
2664 2242
1599 1603
1203 1514
1191 1471
21670 21625
640 655
204 236
1808 2210
233 241
23 38
=-l-%=+83800 150339
59198 102679
273 475
3929 8539
935 1143
2588 4013
20016 31 4A9
1947 3007
318 581
975 1810
1540 2527
1407 2725
539 1219
91 232
1695 2724
158 408
17928 33305
53a 1103
86 181
3347 6272
571 816
317 150
144616
96498
48710117
903
4107
27907
3283
712
1535
2417
2421
1284~~
2604
344
30122
1162
104
589475C103
213
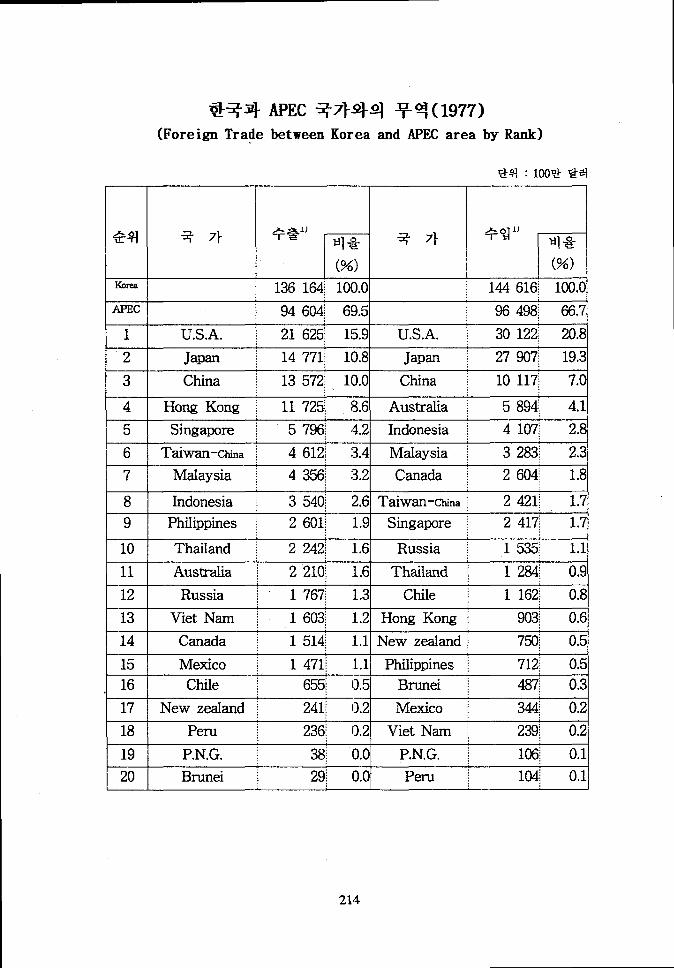
@qq-
(Foreign Trade
APEC~715+~ Y% ( 1977)
between Korea and APEC area by Rank)
>0;~ 4
Korea
.—
APEC.—
1
2
3-—
4
5.—
6
7
8——9
10
’11
’12-—
13
’14
15——16
17.—
18——
19——
20
_._.LY?144616! 100.(
96498~ 66.1
30122’: 20.[
27 907/ 19.:
: 946041 69.51
U.S.A. j 21 625! 15.9) U.S.A.
4107: 2.8
Japan \ 14 771! 10.8I Japan
China ~ 13 572; 10.0 China
Hong Kong \ 11 725; 8.6 Austrdla
Singapore ~ 5 7%; 4.2 Indonesia
Taiwan-ctin, ~ 4 612~ 3.4 Malaysia
10 l17\ 7.(
5 894! 4.1
+
=
2 421; 1,7
2 417j 1.7
1 535/ 1.1
1 w~ 0.9
1 162! 0.8
Thailand / 2 242/ 1.6 Russia
Austraha ~ 2 210; 1.6 Thailand
Russia 1 1 767~ L31 Chile
Viet Nam / 1 603\ 1.21 Hong Kong 903; 0.61
Canada \ 1514: l.l\ New zeakmd
Mexico \ 1471: 1.11 Philippines 712j 0.51
655: 0.51 Brunei
=+
344; 0,2
239; 0.2
l(xj 0.1
29j 0.01 Peru 104: 0.11.—
214

~q : lCKW ‘++
A(3 l-l =+ 7)1)
irizQlfiE
q & % 7f ~q+x]l)
(%)
Korea \ 280780 / 100.0 -8452
APEC j 191 102 ; 68.1 -1886
1 U.S.A. j 51747 j 18.4 Hong Kong ~ 10822
2 Japan ~ 42678 ; 15,2 China ~ 3456
3 China ~23689 ~ 8.4 Singapore ~ 3380
4 Hong Kong ; 12628 ~ 4.5 Taiw~-ctim \ 2191
5 Singapore ; 8213 ~ 2.9 Philippines / 1 889
6 Australia / 8104 / 2.9 Viet Nam / 1365
7 Indonesia ; 7648 ; 2.7 Mexico ~ 1 127
8 Malaysia \ 7639 ; 2.7 Malaysia ~ 1073
9 Taiwan-cfina j 7033 ~ 2,5 Thailand ; 959
10 Canada ~ 4118 ~ 1,5 Russia ~ 233
11 Thailand \ 3526 ; 1.3 Peru \ 132
12 Philippines : 3313 ~ 1.2 P.N.G ! -68
13 Russia : 3302 / 1.2 Brunei ~ -458
14 Viet Nam ;184; 0.6 New zeakmd \ -506
15 Chile ; 1817 : 0.6 Chile ~ -509
16 Mexico j 1 815 ~ 0.6 Indonesia \ -566
17 New zealand ~ 991 ; 0.4 Canada ~ -1090
18 Brunei ~ 516 j 0.2 Austxalia \ -3683
19 Peru ~ 340 ; 0.1 U.S.A. \ -8497
20 P.N.G : 144 j 0.1 Japan j -13136
215
I

[
.ag~ q+od~
q 7} ~ -~gq(1,Oooa) E!!+ (1995, % i!=w
&l~}+lg QjlKm2 (1996-2(1995,
Kmz) (1990-1 g})1990 1998
000, Al)2000
995,%)As 14
Kwea,Rep.of 99 268”! 42 869; 46 430; 472751 1.0! 454”! 73.52);
Brunei 5 765; 257; 313; 326; 2.41 49; 75.5;
China 9 596 961j 155 305~1 255 091;1 276 301! 1.1; 127~ 69.9~
HonQ Kong 1 075j 5 705~ 6298: 6 373; 1.6; 5 758~ 78.8:
Indonesia 1 904 569/ 182 812; 206 522/ 212 565~ 1 .5; 102: 65.1 ~
Japan 377801 ; 123 537; 125 920~ 126 428; 0.3; 331 j 80.0;
Wdaysia 329 758~ 17 891; 21 450! 22 299\ 2.5~ 61 ~ 72.0;
Phlli~ines 300 ooo~ 60 779; 72 164~ 75 037; 2.7~ 234; 68 .3;
Russia 17 075 400j 148 292~ 147 231! 146 196; -..~~~
64.4;
.$ingapore 6181 3 016; 3 491 i 3 587; 2.0/ 4 833; 77.3/
Taiwan-China 36 000: 20 353\ 21 804: 22 161; 0.9/ 592; 74.83’!
Thailand 513 115; 55 580i 59 612/ 60 495; 1.4~ ‘,117; 69.3;
Viet Nam 331 689: 66 689~ 77 896~ 80 549; 2.4j 225\ 664’;
NORTH AMERICA
Canada 9 970 610; 27 791 ~ 30 194! 30 679j 2.2! 3j 78.9:
Mexico 1 958 201/ ‘ 83 226: 95 831/ 98 881! 1.8; 46; 72.5;
U.S.A. 9363 520~ 254 106; 273 754; 277 625; 1.0: 76.7!,, 28; ,
SOUTH AMERICA
E
Chile 756 626! 13 099; 14 824! 15211: 1.6j 19/ 75.3
Peru 1 285 216~ 21 569~ 24 797; 25 662; 1.7; 18/ 68.3
. OCEANIA
A.@da 7 741 220: 16 888: 18 445! 18 838; 1.1! 21 78.3
New zealand 270 534/ 3 360j 3 680~ 3 760j 1.0: 13! 77.2
P.N.G 462 840; 3 839; 4 1602~ 4811j 1.9j ,~;
57.9
XIE. : s2qa [%l=F%Ea+j74Qa] n3-7,[&qa++q] 1~ [.4QE] Igw, q~+}+ [X1**X] 1~
UN hographic Yearbwkl 1997,R%rld PopulationRomectsl 1937.~ Y2[StatisticalYcartmkl 1997+ : 1)1%%7}2 ‘?34 99,313k$, 9=+35 4E8q 19%’% ~}?a. 94 99,373kd, +.!+%!s 46%
2) =MW(’%?4E)X}SL, 1995% ~}zi’a 3) 1995% +SL’?J
4) UN [Statistical Yeartwk for Mla and The Pscificl x}?%%
SOURCE : Main Statistkal Indicators in APEC - National Statistical Office Republic of KOREA
216

@B%$li&KR-98(C)-43
Oiland Gas Fields DBm
![3} tj- 7] - OSTI.GOV](https://static.fdokumen.com/doc/165x107/631c4c86b8a98572c10cd705/3-tj-7-ostigov.jpg)